February 2021 Board Meeting Book - TRS - Texas.gov
473
February 2 02 1 TRS B oard of Trustees Meeting Teacher Retirement Sy stem of Tex as 1000 Red River Street Austin, Texas 78701-2698
-
Upload
khangminh22 -
Category
Documents
-
view
0 -
download
0
Transcript of February 2021 Board Meeting Book - TRS - Texas.gov

February 2 02 1
TRS B oard of Trustees Meeting
Teacher Retirement Sy stem of Tex as 1000 Red River Street Austin, Texas 78701-2698

TEACHER RETIREMENT SYSTEM OF TEXAS MEETING BOARD OF TRUSTEES
AGENDA
February 26, 2021 – 8:00 a.m.
By Videoconference
All or part of the February 26, 2021 meeting of the TRS Board of Trustees may be held by telephone or video conference call as authorized under Sections 551.130 and 551.127 of the Texas Government Code. THIS MEETING WILL BE CONDUCTED BY VIDEOCONFERENCE IN ACCORDANCE WITH THE GOVERNOR’S AUTHORIZATION CONCERNING SUSPENSION OF CERTAIN OPEN MEETING LAW REQUIREMENTS IN RESPONSE TO THE COVID-19 (CORONAVIRUS) DISASTER. A quorum of members of the Board will participate in the meeting and will be audible to the public. Members of the public may access the meeting by clicking https://trs-texas.zoom.us/j/94441572854?pwd=SDFWcW5rdUZTaXNOZ0REcGhUSSthZz09
– Meeting ID: 944 4157 2854, please email the Board Secretary to obtain the meeting password at [email protected]. Members of the public may provide public comment by registering first with the Board Secretary by submitting an email to [email protected] identifying the name of the speaker and topic, no later than 5:00 pm on February 25, 2021. The open portions of the Board meeting are being broadcast over the Internet. Access to the Internet broadcast and agenda materials of the Board meeting is provided at www.trs.texas.gov. A recording of the meeting will be available at www.trs.texas.gov. NOTE: The Board will NOT take up the following agenda items: 5, 6, 12, 13, 15, 16, 20, 21 and 22. The Board may take up the remaining agenda items out of order during the meeting.
1. Call roll of Board members.
2. Consider the following administrative matters – Jarvis V. Hollingsworth:
A. Approval of the December 2020 proposed meeting minutes; and
B. Setting, rescheduling or canceling future Board meetings.
3. Chief Operations and Administration Officer (COAO) update – Andrew Roth.
4. Receive an update on TRS Core Values – Caasi Lamb and Keith Robinson, Focus Consulting.

2
5. Receive an update on the 2021-25 Strategic Plan – Caasi Lamb.
6. Receive an update on the Member Satisfaction Survey and Reporting Employer Satisfaction Survey results – Caasi Lamb; Dr. Rene Paulson Elite Research and Dr. Kirby Goidel, Texas A&M University.
7. Receive an update on the enhanced TRS Complaint Process – Andrew Roth and Heather Traeger.
8. Receive governance training on Teachable Moments of the Last Decade and Thoughts on the Risks of 2021 and Beyond – Amanda Jenami.
9. Review and discuss the Executive Director's report on the following matters – Brian Guthrie:
A. Administrative operational matters, including updates on financial, audit, legal, staff services, special projects, strategic planning, legislative, Sunset Update, Trustee Elections and personnel matters.
B. Update on COVID-19 and TRS operations. C. Board operational matters, including a review of draft agendas for
upcoming meetings. D. Event notices or reminders; holiday and other schedules of interest; board
member, employee or other individual recognitions; and expressions of thanks, congratulations, or condolences.
10. Receive the annual update on TRS Diversity, Equity and Inclusion – Kellie Sauls.
11. Receive an annual review of TRS health plans performance, including benchmark
comparisons, COVID and new plan year, new carrier installation and Retiree Advisory Council (RAC) update – Katrina Daniel, Grace Meuller, RAC Chair; Kirsten Schatten and Kenneth Vieira, Segal.
12. Receive an update on the TEAM Program – Andrew Roth, Billy Lowe, Jennifer Whitman and Adam Fambrough.
13. Receive an update from the TEAM Program Independent Program Assessment (IPA) Vendor – Doug Holt and Jonathan Scofield, EY.
14. Receive an update regarding Benefit Services – Brian Guthrie, Andrew Roth, Don Green, and Barbie Pearson.
15. Receive annual update on Cybersecurity – Frank Williams.
16. Review the report of the General Counsel on pending and contemplated litigation, including updates on litigation involving benefit-program contributions, retirement benefits, health-benefit programs, investment matters, open records – Heather Traeger.

3
17. Provide an opportunity for public comment – Jarvis V. Hollingsworth.
18. Receive an Investment Education Presentation including information on Interest
Rates and PE Ratio – Steve Voss and Mike McCormick, Aon.
19. Receive the CIO Update including Fleet Strategy; Talent Management; Accomplishments; Notices; Awards; Key Dates and Upcoming Events; and Market Update – Jase Auby.
20. Receive the Emerging Manager Annual Update - Kirk Sims.
21. Receive the Annual Update on IMD Operations & Talent Management Group - Sylvia Bell.
22. Review of IMD Legal & Compliance - Heather Traeger.
23. Receive an update on ESG Investing - Lauren Gellhaus, Steve Voss, Mike McCormick and Meredith Jones, Aon.
24. Receive an update and consider long term facilities planning on potential new building, including the potential final selection of a developer for the main campus and the associated costs, potential renovations or sale of the Red River campus, and leases at 816 Congress and Indeed Tower, including considering a finding that to deliberate or confer in open meeting would have a detrimental effect on the position of the retirement system in negotiations with a third person – Brian Guthrie, Andrew Roth, and Eric Lang.
The Board may convene in Executive Session under the following, but not limited to:
a. Texas Government Code, Section 551.071: Consultation with Attorney; b. Texas Government Code, Section 551.072: Deliberation Regarding Real
Property; c. Texas Government Code, Section 551.074: Personnel Matters Relating to
Appointment, Employment, Evaluation, Assignment, Duties, Discipline, or Dismissal of Officers or Employees including but not limited to the Executive Director, Chief Audit Executive, Chief Investment Officer.
d. Texas Government Code, Section 551.076: Deliberation Regarding Security Devices or Security Audits;
e. Texas Government Code, Section 551.089: Deliberation Regarding Security Devices or Security Audits; or
f. Texas Government Code, Section 825.115: Applicability of Certain Laws; g. Texas Government Code, Section 825.3011: Certain Consultations
Concerning Investments.

TAB 2

Minutes of the Board of Trustees
December 9, 2020
The Board of Trustees of the Teacher Retirement System of Texas met on December 9, 2020 via videoconference in accordance with the Governor’s authorization concerning suspension of certain Open Meeting law requirements in response to the COVID-19 (Coronavirus) disaster.
The following Board members were present:
Jarvis V. Hollingsworth, Chair Nanette Sissney, Vice Chair Michael Ball David Corpus John Elliott Christopher Moss James Dick Nance Robert H. Walls, Jr.
Others present:
Brian Guthrie, TRS Mr. David Hinds Andrew Roth, TRS Mr. Ron Hinds Don Green, TRS Heather Traeger, TRS Jase Auby, TRS Barbie Pearson, TRS Katrina Daniel, TRS Amanda Jenami, TRS Kevin Wakley, TRS Katherine Farrell, TRS Suzanne Dugan, Cohen Milstein Mr. Hollingsworth called the meeting to order at 8:00 a.m.
1. Call roll of Board members.
Ms. Farrell called the roll. A quorum was present.
Mr. Hollingsworth provided welcoming remarks noting the Board was convening by videoconference under the Governor’s Office’s authorization concerning suspension of certain Open Meetings law requirements in response to COVID-19. Mr. Hollingsworth reviewed the schedule for the next three days.
2. Consider the following administrative matters including:

a. Approval of the September 2020 proposed meeting minutes; and On a motion by Mr. Corpus, seconded by Mr. Nance, the board unanimously approved the minutes of the September 2020 Board Meeting, as presented.
b. Setting, rescheduling or canceling future Board meetings; and Mr. Hollingsworth stated the proposal on the table was to move the December 2021 meeting up a day to December 7 and 8th from December 9 and 10. He also noted the proposal included expanding the upcoming February board meeting to include February 24th in case there is a need to meet virtually. On a motion by Ms. Sissney, seconded by Mr. Elliott, the Board unanimously approved moving the December 2021 meeting dates to December 7 and8, 2021 and expanding the February meeting to include February 24th if held virtually.
c. Consider election of the Board Vice-Chair Mr. Hollingsworth stated each year the board elects the Board vice chair. He said the current vice chair of the Board is Ms. Sissney and she has indicated an interest to serve again for the upcoming calendar year 2021. He asked if there was any other interest from any other Board member. Not hearing nay, Mr. Hollingsworth moved that Ms Sissney be considered as the vice chairman of the Board of Trustees for the Teacher Retirement System of Texas. Mr. Hollingsworth asked if any opposition, hearing none, the motion passed by acclamation. At 8:08 am, Mr. Hollingsworth recessed the Board Meeting, noting the Board would reconvene after the scheduled committee meetings to take up the Hinds Appeal. At 11:58 am, Mr. Hollingsworth reconvened the Board Meeting.
3. Consider the administrative appeal of David L. Hinds. Mr. Hollingsworth announced the next item was to consider the administrative appeal of Mr. David L. Hinds in David L. Hinds v. Teacher Retirement System of Texas SOAH Docket NO. 323-19-1748, TRS Docket No. 19-01. He said Mr. Hinds appeals the decision of TRS executive Director Brian Guthrie denying Mr. Hind’s appeal and adopted without changes the findings of fact and conclusions of law from the proposal for decision issued by Sarah Starnes, administrative law judge for the State Office of Administrative Hearings. Mr. Hollingsworth noted the primary issue is whether Mr. Hinds exceeded the limits on employment after retirement in the month of February 2014, and therefore forfeited his annuity payment for that month. He said each party will have five minutes to make their presentation to the Board with a one minute rebuttal from Mr. Hinds. Mr. Hollingsworth stated Mr. Hinds was represented by Mr. Ronald D. Hinds, and TRS staff was represented by Assistant General Counsel Kevin Wakley.

Mr. Ron Hinds argued that after speaking with a TRS representative to receive assurance he agreed to work as a substitute teacher in 2014 to assist the Amarillo Independent School District when the orchestra teacher was out for chemotherapy. Mr. Ron Hinds referenced TRS’ own internal documents B43, 41 and 44 confirming that Mr. David Hinds made this call on January 17 and did speak to a TRS representative. Mr. Hinds further argued that Suzuki was a private entity, 100% funded by the parents of the children who are trying to learn to play the violin, could not count against Mr. David Hinds in terms of satisfying the provision of the Government Code and referenced pages 12, 13, 27, 28, 50-53 of TRS’ own exhibits. Mr. Kevin Wakley argued it was undisputed that Mr. David Hinds exceeded the number of days allowed under the half-time or less standard for the month at issue. He said Mr. Hinds during that month was combining both part-time work and substitute work and that under the statute he exceeded the allowed number of workdays in that month. Mr. Wakley argued that even if Mr. Hinds was provided incorrect information by the TRS counselor, the administrative law judge made clear in her proposal for decision, the concept of equitable estoppel does not apply against a state agency. Mr. Wakley argued the Suzuki music program at Amarillo Community College (ACC) was employment by ACC and must be counted for the employment-after-retirement purposes. He noted ACC pays the instructors, reports them to TRS both as active members and as retirees. Mr. Wakley argued the source of the funding is not determinative of whether employment existed. He stated it is very common for private grant money to fund teacher or professor positions and that does not determine whether or not those teachers or professors are working for the public university or public school. Mr. Wakley closed by thanking Mr. Hinds for his 40 years of service to the Texas public schools. He noted that retirees that inadvertently run afoul of the return to work limits present sympathetic cases, Mr. Hinds is no exception. However, in following the law the Board must uphold Mr. Guthrie’s position and deny the appeal. Mr. Ron Hinds in rebuttal argued that if Suzuki’s numbers were not included in the calculation, then there is no case. He reiterated Suzuki is a private entity, not one penny comes from public funds to support it. He stated at some point cannot a person rely on TRS and what they tell them in a conversation as to what they can and cannot do. He concluded by asking the Board to do the right thing here and rescind this decision and relieve David Hinds of any responsibility for payback. After a short question and answer period, at 12:22 pm, Mr. Hollingsworth announced the Board will go into executive session under Section 551.071 to discuss the administrative appeal of David L. Hinds and consult with legal counsel as needed. At 12:38 pm, Mr. Hollingsworth reconvened the Board in open meeting. On a motion by Mr. Moss, and seconded by Mr. Corpus, the board unanimously voted to deny the appeal and uphold the executive director’s decision. At 12:41 p.m., Mr. Hollingsworth recessed the meeting until 8:00 a.m. tomorrow morning.

December 10, 2020
The Board of Trustees of the Teacher Retirement System of Texas met on December 10, 2020 via videoconference in accordance with the Governor’s authorization concerning suspension of certain Open Meeting law requirements in response to the COVID-19 (Coronavirus) disaster.
The following Board members were present:
Jarvis V. Hollingsworth, Chair Nanette Sissney, Vice Chair Michael Ball David Corpus John Elliott Christopher Moss James Nance Robert H. Walls, Jr.
Others present:
Brian Guthrie, TRS Michael Johnson, Bridgepoint Consulting Andrew Roth, TRS Don Green, TRS Jase Auby, TRS Amanda Jenami, TRS Barbie Pearson, TRS Katrina Daniel, TRS Heather Traeger, TRS Eric Lang, TRS Katherine Farrell, TRS Billy Lowe, TRS Jennifer Whitman, TRS Adam Fambrough, TRS Eric Lang, TRS Suzanne Dugan, Cohen Millstein At 9:10 a.m. the Chair reconvened the board meeting.
4. Receive an update on the TEAM Program – Andrew Roth, Billy Lowe, Jennifer Whitman and Adam Fambrough.
Ms. Jennifer Whitman reviewed the TEAM dashboard updated for the month of November. She noted all releases currently are on schedule and in green status, including the Health Insurance Line of Business (HILOB) release. She said key status update for this month center around the

first major release. She said the quality assurance testing team had begun their final rounds of regression testing on schedule on November 2nd with the UAT entry quality gate scheduled for January 21, which is a quality milestone prior to beginning user testing. She reported after the quality gate there will be multiple rounds of user acceptance testing to ensure the system meets business needs and perform all business processes with no interruption in customer service when go live with the application. Ms. Whitman noted other items for this month were the posting of a solicitation to bring an external vendor in to create and run performance test against the Pension Line of Business web self-service release scheduled to go live in Spring of 2022. Mr. Adam Fambrough reported on the remaining Phase 2 functionality. He reported good progress is being made with continued work on feedbacks and enhancements to the production TRUST system. He reported 148 maintenance and enhancement releases since TRUST go-live in October of 2017; closing almost 1,200 RER defects since go live. He said because of the system enhancements, ongoing training and employer familiarization of the RE portal, there is a decrease in the number of days required to complete reports by the REs. Mr. Billy Lowe noted that Michael Johnson with Bridgepoint will be presenting the last IPA report. He thanked Michael and his team for all of their support for the TEAM program.
5. Receive an update from the TEAM Program Independent Program Assessment (IPA) Vendor – Michael Johnson, Bridgepoint Consulting.
Mr. Hollingsworth introduced the agenda item by noting Bridgepoint served as the Board’s independent oversight authority since December 2012. He extended appreciation on behalf of the Board of Trustees and staff for all of the work Bridgepoint has done over the years. Mr. Michael Johnson thanked TRS for the working relationship with the team and the Board. Mr. Johnson stated he would reflect on the control as that have been put in place through the shift of delivery from an external vendor to an internal vendor. He noted the internal team has started delivering on the Phase 2 items. He said a critical milestone for the Board to monitor is the first production release which is scheduled for Q-2 of calendar 2021. He said all indications are in the right direction. Mr. Johnson reviewed the dashboard outlining the key areas of focus, ensuring controls are in place for scope, cost, schedule and quality. He reported the controls have been established and are appropriately being monitored by the internal team. He concluded by saying the key is execution, focusing on the internal team and making sure they have the resources needed to accomplish the goals.
6. Receive an update and consider long-term facilities planning on potential new building, including the potential final selection of a developer for the main campus and the associated costs, potential renovations or sale of he Red River campus, and leases at 816 Congress and Indeed Tower, including considering a finding that to deliberate or confer in open meeting would have a detrimental effect on the position of the retirement system in negotiations with a third person – Brian Guthrie, Andrew Roth and Eric Lang.

Mr. Brian Guthrie provided an overview of where things stood regarding long-term facilities planning. He said the vision of the long-term facilities and why they are undertaking this effort is to decrease the leased space footprint and generate significant savings to the fund. He noted this effort in terms of trying to get out of lease space by 2025 is consistent with the Texas Facilities Commission efforts to consolidate agency facilities and minimize leased offices. He said a necessity for additional space is driving this initiative. He referenced the pandemic and currently how currently a majority of TRS staff are working from home while noting this will not always continue to be the case. He said the current work-from-home percentage, which is approximately 65 to 70 percent of the workforce is not sustainable in the long term. Mr. Guthrie reported the status quo, in other words doing the same or doing nothing, is the most expensive option in the long term. He also said normal operations will not return until probably the summer of 2021 with widespread distribution of the vaccine. He stated a return to what we know as “normal” not only impacts how we do business, but it also impacts what solution is selected and when we select it. Mr. Guthrie reviewed information covered and actions taken during the past board meetings. He also reviewed FTE growth that has been fairly constant and consistent with population growth since 2000. He stated compared to our equivalently sized peers who have significantly more FTEs, TRS also ranked eighth of thirteen regarding service provided to our members by CEM benchmarking service. Mr. Guthrie reported on the subleasing activity. He said Indeed Tower is expected to be completed in late first quarter of 2021 and Cushman & Wakefield is aggressively marketing the space to any suitors. Mr. Andrew Roth stated that in addition to the considerations listed of growing staff, growing membership and constrained space, there is a window of opportunity that will soon close to be considered. He said they identified through the current procurement a solution that will likely go away in six to twelve months, which would also avoid the cost of the current lease for IMD at 816 Congress. He stated a delay in the current long-term facilities effort means there will be fewer, less viable, or more expensive options in the future if the current procurement closes and the process must start all over again. He stated that if the decision is made not to move forward that instead of turning around immediately and initiating a new procurement, it would be wise to wait for a period of time to start the process over again. Mr. Roth reviewed the costs for remaining with the status quo and with a new headquarters. He reported for IMD to remain in 816 Congress and for headquarters to remain status quo for another five years the costs would be approximately $33 million and for 10 years would be $78 million. He noted costs for leasing adds up quickly as does maintenance on an aging building. He stated a new headquarters would be a generational solution, eliminating the need for leasing and certain expected maintenance expenses at Red River.

Mr. Guthrie concluded by reviewing a proposed timeline for the board to review options and making determinations. In response to Ms. Sissney’s inquiry, Mr. Guthrie stated the regional office in El Paso was included in the Legislative Appropriation Request and recommended by the Sunset Commission. However, he said the El Paso regional office would not have a significant impact on the volume of visits here in Austin for those members do not make the trip to Austin. On a motion by Mr. Ball, seconded by Mr. Moss, the board unanimously voted that deliberating or conferring on the 816 lease, Indeed Tower, developer selection or other facility related Board procurement in open meeting related to item 6 would have a detrimental effect on the position of the Retirement System in negotiations with third parties. At 10:34 a.m., Mr. Hollingsworth announced the Board would go into executive session under the following agenda items and sections of the Government Code: item 6 under Sections 825.115(e), 551.071 and 551.072, to discuss Board procurement matters, real property and consult with legal counsel as needed; and under item 7 under Section 551.071, to consult with legal counsel. At 12:26 p.m., Mr. Hollingsworth reconvened the Board Meeting.
7. Review the report of the General Counsel on pending and contemplated litigation, including updates on litigation involving benefit-program contributions, retirement benefits, health-benefit programs, investment matters, open records – Heather Traeger.
At 12:27 p.m., Mr. Hollingsworth recessed the meeting until 8:00 a.m. tomorrow morning.

Minutes of the Board of Trustees
December 11, 2020
The Board of Trustees of the Teacher Retirement System of Texas met on December 11, 2020 via videoconference in accordance with the Governor’s authorization concerning suspension of certain Open Meeting law requirements in response to the COVID-19 (Coronavirus) disaster.
The following Board members were present:
Jarvis V. Hollingsworth, Chair Nanette Sissney, Vice Chair Michael Ball David Corpus John Elliott Christopher Moss James Dick Nance Robert H. Walls, Jr.
Others present:
Brian Guthrie, TRS Veronica Sance Andrew Roth, TRS Craig Campbell Don Green, TRS Daniel Goodmon Heather Traeger, TRS Robert Farrell Jase Auby, TRS Jonathan Scofield, EY Barbie Pearson, TRS Doug Holt, EY Katrina Daniel, TRS Doug Doer, Grant Thornton Amanda Jenami, TRS Ivy Bela, Grant Thornton Katherine Farrell, TRS Joe Newton, GRS Suzanne Dugan, Cohen Millstein Dan Sibilik, GRS Mr. Hollingsworth called the meeting to order at 8:00 a.m. Ms. Farrell called the roll. A quorum was present.
8. Provide an opportunity for public comment.
Ms. Veronica Sance expressed concern over the impacts of the sale of the Baldwin Hills Crenshaw Mall to LIVWRK. She said she is a resident of the community and is one of the approximately 67,000 residents that will be highly displaced if the sale of the mall goes through to LIVWRK. Mr. Craig Campbell expressed concern over the long-term facilities planning focus on centralization. He supports regional offices for members to sit down with TRS counselors. He

noted building bridges not buildings should be the priority. He also provided a list of items to be included in the surveys referenced in the communication plan. He stated the investment managers bonuses of $13.1 million drew the ire of members. He concluded with request for a COLA.
9. Receive the report of the Benefits Committee on its December 9, 2020 meeting and consider approval of the Benefit Payments for September 1, 2020 to November 30, 2020– Committee Chair.
Mr. Ball, Committee Chair, provided the following report of the Benefits Committee: The Benefits Committee met on December 9, 2020. The committee approved the proposed minutes of the Benefits Committee for the September 16, 2020 meeting. Ms. Barbie Pearson provided an update on the benefit payments for September through November 2020. The committee recommends to the Board the approval of benefit payments for September through November 2020. The committee received an update from Ms. Pearson on Benefit Services operations for first quarter of fiscal year 2021. This report included increasing workload and trends in benefits for the first quarter of fiscal year 2021, and a short video related to the newly designed annual statements sent to members. Next the committee received an update from the chief health care officer, Ms. Katrina Daniel, on the quarterly performance of TRS-Care and TRS-ActiveCare, including the impact of COVID and the implementation of new plans and rates to begin January 1, 2021.
Mr. Ball concluded his report with the following motion: On a motion by Mr. Ball, the Board unanimously voted to approve benefit payments for September 1, 2020 through November 30, 2020, as recommended by the Benefits Committee.
10. Receive the report of the Policy Committee on its December 9, 2020 meeting and
consider adoption of the following: – Committee Chair A. Proposed amendments to TRS Rule 47.17 Calculation of Alternate Payee
Benefits Before a Member’s Benefit Begins, in Chapter 47 of Title 34, Part 3 of the Texas Administrative Code; and
B. Proposed Member Engagement Policy. Mr. Elliott, Committee Chair, provided the following report of the Policy Committee:
The Policy Committee met on December 9, 2020. The committee approved the proposed minutes of its September 2020 meeting.

The committee recommended to the Board adoption of the proposed amendments to TRS Rule 47.17 pertaining to the calculation of alternate payee benefits before a member’s benefit begins, as provided in Title 34, Part 3 of the Texas Administrative Code. The committee recommended to the Board adoption of the proposed Member Engagement Policy.
Mr. Elliott concluded his report with the following motions: On a motion by Mr. Elliott, the Board unanimously approved the adoption of the proposed amendments to TRS Rule 47.17 pertaining to the calculation of alternate payee benefits before a member’s benefit begins, as provided in Title 34, Part 3 of the Texas Administrative Code., as recommended by the Policy Committee. On a motion by Mr. Elliott, the Board unanimously approved the adoption of the Member Engagement Policy, as recommended by the Policy Committee. Mr. Hollingsworth announced agenda item 12 would be taken up next.
12. Receive the report of the Investment Management Committee on its December 9,
2020 meeting – Committee Chair. Mr. Corpus, Committee Chair, provided the following report of the Investment Management Committee:
The Investment Management Committee met on December 9, 2020. The committee adopted the minutes of its September 2020 meeting. Jase Auby began with his CIO update. The third quarter 2020 performance review was presented by Steve Voss and Mike McCormick with Aon. James Nield then provided an annual update of the risk and portfolio management. Following we received an annual update on the trading group presented by Bernie Bozelli and Demtrius Pope. Concluding the Investment Management Committee, Ashley Baum provided a review of the absolute return portfolio.
13. Receive the report of the Audit, Compliance, and Ethics Committee on its December 10, 2020 – Committee Chair.
Mr. Moss, Committee Chair, provided the following report of the Audit, Compliance and Ethics Committee:
The Audit, Compliance and Ethics Committee met on December 10, 2020 via videoconference. The committee approved the minutes of the September 17, 2020 Audit, Compliance and Ethics Committee.

State Auditor’s Office staff presented the results of the audit of the TRS’ Comprehensive Annual Financial Report, the CAFR, for fiscal year 2020. State Auditor’s Office staff presented the results of the incentive compensation at TRS for plan year ending September 30, 2019. Crowe, LLP auditors presented the results of the financial audit of TRS’ investment company, TRICOT, for fiscal year 2020. EY staff presented the results of its maturity assessment for the Unified Risk Management Program. The general counsel and chief compliance officer presented routine compliance reports. Internal Audit staff presented the results of audits from compliance with health care federal regulations, TRS use of leverage in asset allocation, and Investment Management Division’s data system. Internal Audit staff also presented the Internal Audit annual report, a follow up on outstanding audit and consulting recommendations and various administrative reports.
Mr. Hollingsworth announced agenda item 11 would be taken up next.
11. Receive the report of the Budget Committee on its December 9, 2020 meeting –
Committee Chair.
Ms. Sissney, Committee Chair, provided the following report of the Budget Committee:
The Budget Committee met on December 9, 2020. The first item of business was the approval of the minutes from the July 15, 2020 Budget Committee meeting. Ms. Duarte introduced the Comprehensive Annual Finance Report for fiscal year 2020 and provided an update on membership data. Ms. Duarte then passed the presentation to Ms. Zigmond, who provided a high-level overview of the 2020 CAFR, which showed a net position for the Pension Trust Fund of $165.4 billion, compared to $158 billion on last year’s CAFR. Overviews of the TRS-Care and TRS-ActiveCare funds were also presented. Mr. Leith concluded the presentation with an overview of the investment data as recommended by the Texas Sunset Commission. Mr. Don Green then presented a high-level overview of FY 2020 year-end budget. He explained the agency’s effort in responding to legislative directives to identify cost savings and managing the economic ramifications of COVID-19. In June 2020 estimated savings was about 11 percent, the year-end savings were 16 percent for FY20. In response to recommendations made by Internal Audit and the Texas Sunset Commission, cost benefit analysis of implementing a parallel investment accounting system was presented by Mr. Green, Mr. Leith, Ms. Bell, Ms. Jenami and Mr.
Subramanian with Cutter. Alternative solutions were discussed. An approach to enhance the current in-house solution by adding staff expertise and software was deemed to be the most prudent approach. Mr. Green will provide periodic updates to the Board on the progress of this implementation.
Mr. Hollingsworth announced agenda item 14 would be taken up next. 14. Review and Discuss the Executive Director’s report on the following matters – Brian
Guthrie: A. Administrative operational matters, including updates on financial, audit, legal,
staff services, special projects, strategic planning, legislative, Sunset Update, and personnel matters.
B. Update on COVID-19 and TRS operations. C. Board operational matters, including a review of draft agendas for upcoming
meetings. D. Event notices or reminders; holiday and other schedules of interest; board
member, employee or other individual recognitions; and expressions of thanks, congratulations, or condolences.
Mr. Guthrie provided an overview of general updates, past and upcoming conferences. He gave an update on Return to Office for TRS staff. He said staff since March continues to work from home but slowly the percentage of people onsite is increasing. He noted since the last Board Meeting they did reopen to the public with limited in-person counseling visits which began October 26. He said the number of visits a day are limited by the space. He said this was likely the new norm moving forward for the next several months and probably into early spring. Mr. Guthrie reported the in-person visits were closed the week after Thanksgiving in light of public health warnings and will do the same for after Christmas and New Year holidays. Mr. Guthrie said the Sunset Commission hearing was the past Monday. He said it went very smoothly and wanted to tank everyone here at TRS, including the trustees, who contributed to that report. He thanked Sunset staff who were a pleasure to work with and the entire commission. He said the final hearing will be January 13, 2021, where the final report will be adopted. Mr. Guthrie announced the nomination period for the Trustee Election was open until January 25th. He reported that Heather Traeger was named co-chair of the Regulatory Advisory Committee for the National Society of Compliance Professionals and that he is now immediate past president for NCTR and regional VP for NASRA. He was very pleased to announce that TRS was named a Top Workplace for 2020. Mr. Guthrie concluded by reviewing the proposed items for the February and April Board meetings.

Mr. Hollingsworth announced two speakers who previously signed up to provide public comment were now available and would allow them time to speak.
8. Provide an opportunity for public comment. Mr. Damien Goodmon, board member of Downtown Crenshaw Raising and member of the advisory committee for Capri Urban Investors, expressed concern regarding TRS’ investment in an iconic commercial center in the center of Los Angeles Black community. He stated Downtown Crenshaw Rising remains the most natural buyer and most capable manager of the asset and large scale redevelopment. Mr. Robert Farrell, retired member of the Los Angeles City Council, requested the Board to consider Mr. Goodmon’s request. Mr. Hollingsworth announced agenda item 15 would be taken up next. 15. Review the TRS Pension Trust Fund Actuarial valuation for the fiscal year ending
August 31, 2020 – Joe Newton and Dan Sibilik, GRS. Mr. Joe Newton began by stating this was probably the strongest actuarial valuation this system has had in a couple of decades as far as where we are and where we are expected to go and seeing things on the horizon. Mr. Dan Sibilik provided an overview of the valuation. He reported the estimated market return for the year was 7.24 percent, which is almost exactly what the assumption was at 7.25. Mr. Sibilik reviewed the contribution schedule for the base rate with projections up to 2025. He said that TRS with the ultimate rate of 9.51 is the lowest contribution rate among its peers. He discussed the impact of COVID up to August 31, 2020. Ms. Sibilik then reviewed the unfunded actuarial accrued liability. He noted this year’s valuation is slightly better than last years by being fully funded one year earlier than predicted last year. Mr. Newton stated the main reason the unfunded liability is expected to pay off one year sooner this year is because of the head count increases which led to payroll growing much faster than expected. He said fewer retirements occurred than was expected creating a $300 million gain. He noted there is still quite a few years away before the unfunded liability is starting to come down, noting it actually grows for the first few year prior to it starting to come down. Mr. Newton reviewed the Board’s funding policy adopted last year. He said policy provides TRS with the ability to communicate the support of contributions and benefit policies that will systematically decrease the unfunded over time in order to achieve a funded ration that is equal to or greater than 100 percent. He then reviewed modeling as to when TRS would need to ask for greater contributions. Mr. Newton concluded by TRS are on a better road, needing the policy process to continue to work. He said the Board’s funding policy provides a strong mechanism for protecting the system.

16. Review the TRS-Care Actuarial Valuation and Other Post-Employment Benefits
(OPEB) reports for the fiscal year ending August 31, 2020 and receive an overview and update on TRS-Care and TRS-ActiveCare – Katrina Daniel and Joe Newton, GRS.
Mr. Newton stated the OPEB is an accounting exercise. He said there is no requirement to pre-fund the benefits. He reported the net OPEB liability decreased from $47 billion in 2019 down to $38 billion in 2020. He noted one of the reasons for the change was the Medicare Advantage premiums that TRS negotiated with the vendor for five years had a significant impact to the liability. Mr. Newton reviewed what advanced funding of the benefits would look like. Ms. Katrina Daniel provided a review of the annual report on the performance of TRS health plans. She stated that these benefits will experience more than $150 million annual across the plans. She reported they are finishing the installment of new vendors in the TRS-Care Standard plan for non-Medicare retirees enrolled in care, and then the Medicare Advantage plan. She reviewed the impact COVID has had on the plans. She noted members have deferred care they normally would have sought but have had significant costs due to COVID. Ms. Daniel discussed the size of the health plans and how, as the largest commercial purchaser and second largest purchaser in Texas behind the Medicaid program, they are able to wield the purchasing power into savings. She said the reduction in the OPEB liability has also resulted in an improved fund balance. Ms. Daniel concluded by reviewing TRS-ActiveCare. She stated ActiveCare compared to what districts outside of ActiveCare are purchasing, is 12 percent below the median cost of those plans. She noted the significant value when compared with benefits and the cost of those benefits. 17. Consider the engagement of an Independent Program Assessment (IPA) vendor for
the TEAM Program, including considering a finding that to deliberate or confer in open meeting would have a detrimental effect on the position of the retirement system in negotiations with a third person – Amanda Jenami.
Ms. Amanda Jenami provided an overview of the process followed in selecting the finalists that will present today to select the vendor to provide independent assessment of the TEAM Program risks and progress to ensure successful completion of the project. Ms. Jenami stated the vendors will be presenting in alphabetical order. Mr. Doug Holt and Jonathan Scofield of EY provided a presentation on their experience, tools, and approach for serving as the Independent Program Assessment vendor. Mr. Doug Doerr and Ms. Ivy Bela of Grant Thornton provided a presentation on their experience, tools, and approach for serving as the Independent Program Assessment vendor. Mr. Hollingsworth announced taking up next agenda item 18 for the public presentation and then recessing into executive session for agenda items 17 and 18.

18. Consider personnel matters, including the appointment, employment, evaluation, compensation, performance, duties, discipline, or dismissal of the Executive Director, Chief Audit Executive, Chief Investment Officer, or General Counsel and Chief Compliance Officer – Jarvis V. Hollingsworth. a. Discuss and consider the evaluation, compensation, and duties of the Executive Director. b. Discuss and consider the compensation and duties of the Chief Investment Officer. c. Discuss and consider the compensation and duties of the Chief Audit Executive.
Mr. Keith Robinson provided a brief overview of the process for C-suite evaluations specific to the executive director, chief investment officer, and the chief audit executive. Ms. Janet Bray discussed the timing of next year’s evaluation process. She recommended the evaluation timeline for the executive director, chief investment officer and chief audit executive be shifted to the end of the calendar year, very much like how this year was handled. She said the current process kicks off in May and concludes with the July board meeting. She said the shift would have the process kick off in October after the end of the fiscal year and end with the December Board meeting. She stated this shift would allow the Board to evaluate performance data for the entire fiscal year. She noted the schedule does not affect the collection or calculation of either the IMD or executive director incentive plan. Ms. Bray provided the history of the agency use of unclassified positions for positions that do not fit within the parameters of the state system. She noted the current unclassified positions were created in 2014, 2015 and 2018. Mr. Guthrie stated since Ms. Heather Traeger became the general counsel, they would like to make changes to the classifications within the Legal and Compliance Division. In particular, he said they would like to update the current unclassified chief compliance officer position and change the title to reflect Ms. Traeger’s new role as general counsel, combining the classification into one as general counsel and CCO. He noted the CCO position will continue to be held by Ms. Traeger and the resulting full-time employee opening will then be used for the newly created deputy chief compliance officer position, which will also be an unclassified position. Mr. Hollingsworth then announced the Board would recess into executive session for agenda items 17 and 18. On a motion by Mr. Corpus, seconded by Mr. Elliott, the Board unanimously voted that deliberating or conferring on the engagement for the independent program assessment vendor for the TEAM Program in an open meeting would have a detrimental effect on the position of the Retirement System on negotiations with a third person.

At 11:01 am, Mr. Hollingsworth stated the Board will now go into executive session under the following agenda items and sections of the Government Code: item 17 under Section 825.11(b)(3) to discuss Board procurement matters related to the independent program assessment vendor, and item 18 under Section 551.074 to discuss and consider personnel matters related to the appointment, employment, evaluation, assignment of duties, discipline or dismissal of the executive director, the chief audit executive, the chief investment officer, or general counsel and chief compliance officer. At 2:17 pm, Mr. Hollingsworth reconvened the Board. On a motion by Mr. Moss, seconded by Mr. Ball, the Board unanimously voted to approve the following resolution authorizing the executive director to contract with EY to provide IPA services to the Board for the TEAM program:
RESOLUTION REGARDING SELECTION OF TEAM INDEPENDENT PROGRAM
ASSESSMENT SERVICES AND RELATED CONTRACT AUTHORITY WHEREAS, The Board of Trustees (“Board”) of the Teacher Retirement System of Texas (“TRS”) is engaged in an electronic pension administration system modernization effort, TRS Enterprise Application Modernization (“TEAM”);
WHEREAS, The Board has determined that it is in the best interest of TRS to engage independent assistance with program assessment for the TEAM program;
WHEREAS, Section 825.101 of the Texas Government Code states that the Board is responsible for the general administration and operation of the retirement system, and Section 825.103 of the Texas Government Code states that the Board has exclusive authority over the purchase of goods and services using trust funds and shall control all aspects of information technology and associated resources relating to the retirement system;
WHEREAS, TRS Bylaws subsection 1.8(j) provides that the Board is responsible for monitoring and evaluating the effectiveness of the retirement system;
WHEREAS, TRS Bylaws subsections 5.6(b) and 5.6(e) delegate authority to the Executive Director to contract for the purchase of services and the execution of vouchers for payments, in accordance with actions of the Board; WHEREAS, In 2012, TRS conducted a competitive procurement for Independent Program Assessment (IPA) services for the TEAM program and, at the December 2012 board meeting, the Board selected Bridgepoint Consulting;
WHEREAS, In 2020, TRS conducted a new competitive procurement for the TEAM program IPA services;

WHEREAS, The Board wishes to authorize the Executive Director to enter into a contract for IPA services for the TEAM program; now, therefore be it
Resolved, That the Board, pursuant to Sections 825.101 and 825.103 of the Texas Government Code, hereby authorizes the Executive Director of TRS or his designee to negotiate, with the assistance and advice of legal counsel, a contract with EY to provide IPA services to the Board for the TEAM program for a term to commence on January 1, 2021, or the date the contract is fully executed, and terminate on December 31, 2024; and, if negotiations are deemed in his or her discretion to be successful, then the Executive Director or his designee is hereby authorized to execute a contract on such terms and conditions as such officer may deem, in his or her discretion, to be in the best interest of TRS, and further to execute and deliver all such other documents, including all future extensions or amendments to the contract, that such officer may deem necessary or appropriate to effectuate this resolution, as conclusively evidenced by the taking of the action or the execution and delivery of the documents, and to incur, approve and pay any budgeted expenses or costs reasonably necessary or advisable with respect to such contract or amendments. Resolved, That if for any reason, the Executive Director concludes in his sole judgment that TRS is not reasonably likely to successfully negotiate a contract with _______EY______, then the Board hereby selects ________ Grant Thornton _____ to provide IPA services to the Board for the TEAM program, subject to the successful negotiation and execution of a final agreement, for a term to commence on January 1, 2021, or the date the contract is fully executed, and terminate on December 31, 2024. Resolved, That once the Executive Director concludes in his sole judgment that TRS is not reasonably likely to successfully negotiate a contract with _________EY________, then the Board hereby authorizes the Executive Director or his designees to expend funds and to take all actions deemed by him or a designee to be necessary or advisable to implement this resolution, including the negotiation and execution of all documents needed to finalize an acceptable contract with _________Grant Thornton________, the same or better financial terms presented to the Board and on such other terms and conditions deemed by the Executive Director or a designee to be in the best interest of TRS, and from time to time to amend or modify the contract as deemed by the Executive Director or a designee to be in the best interest of TRS.
Resolved, That nothing in this resolution may be construed as a contract, an offer to contract with a power of acceptance that would form a contract, or an acceptance of an offer to contract, and TRS is not and will not be legally bound to any agreement unless and until the Executive Director has executed and delivered definitive agreements relating to the subject matter, as applicable.

On a motion by Mr. Moss and seconded by Mr. Corpus, the Board voted unanimously to approve the following resolution authorizing a one-time merit payment in the amount of $20,000 to the chief audit executive, Amanda Jenami:
Resolution Awarding a One-Time Merit Payment to the Chief Audit Executive Whereas, Section 825.208 of the Texas Government Code provides that, notwithstanding any other law, the Board of Trustees (“Board”) of the Teacher Retirement System of Texas ("TRS") shall approve the rate of compensation of all persons it employs; Whereas, Subsection 1.7(u) of the Board’s bylaws provides that the Board shall be responsible for the selection, replacement, dismissal, performance evaluation, and compensation of the Chief Audit Executive in consultation with the Audit Committee and the Executive Director; Whereas, Subsection 1.7(l) of the Board's bylaws provides that the Board may consider or take any action otherwise specified to be taken or considered by a committee; and Whereas, The Board wishes to amend the compensation of the Chief Audit Executive; now, therefore be it Resolved, That the Board hereby authorizes a one-time merit payment as follows:
One-time merit payment to the Chief Audit Executive (the incumbent is Amanda Jenami): Award a one-time merit payment effective January 1, 2021 in the amount of $ _20,000___; and
Resolved, That nothing in the adoption of this resolution alters the at-will nature of employment that TRS has with any of its employees, creates a contract between TRS and any TRS employee, or confers on any TRS employee the right to continued employment with TRS, including the Chief Audit Executive or any other employee.
19. Chief Operations and Administration Officer (COAO) update – Andrew Roth. Mr. Roth reviewed highlights in terms of things that were accomplished in 2020. He noted they had migrated the mainframe to a cloud-based provider that will exist for system. He said TRS took the TEAM project over from the vendor. He stated 90 percent of the operations moved to remote work by end of March and implemented stringent safety measures for those who remained onsite. Mr. Roth concluded by stating the diversity, equity and inclusion division is reviewing its strategic plan that includes performance metrics, specific milestones and an implementation schedule and timeline. He stated a procurement for a diversity and inclusion assessment service was underway that will provide a number of analytics related to diversity and inclusion for TRS.

At 2:30 pm, Mr. Hollingsworth adjourned the meeting.
APPROVED BY THE BOARD OF TRUSTEES OF THE TEACHER RETIREMENT SYSTEM OF TEXAS ON THE ___ DAY OF FEBRUARY 2021.
ATTESTED BY: __________________________ _________________________ Katherine H. Farrell Date Secretary to the TRS Board of Trustees

Future Meetings for Calendar Year 2021
April 15 – 16, 2021April 14 – 16, 2021 (if virtual meeting)
July 15 – 16, 2021
September 16 – 17, 2021
December 7 – 8, 2021
Setting and Re-scheduling Future Board Meeting Dates
1

TAB 3
Andrew RothFebruary 26, 2021
CHIEF OPERATIONS AND ADMINISTRATION OFFICER REPORT
Teacher Retirement System of TexasTeacher Retirement System of Texas
CHIEF OPERATIONS AND ADMINISTRATION OFFICERREPORT

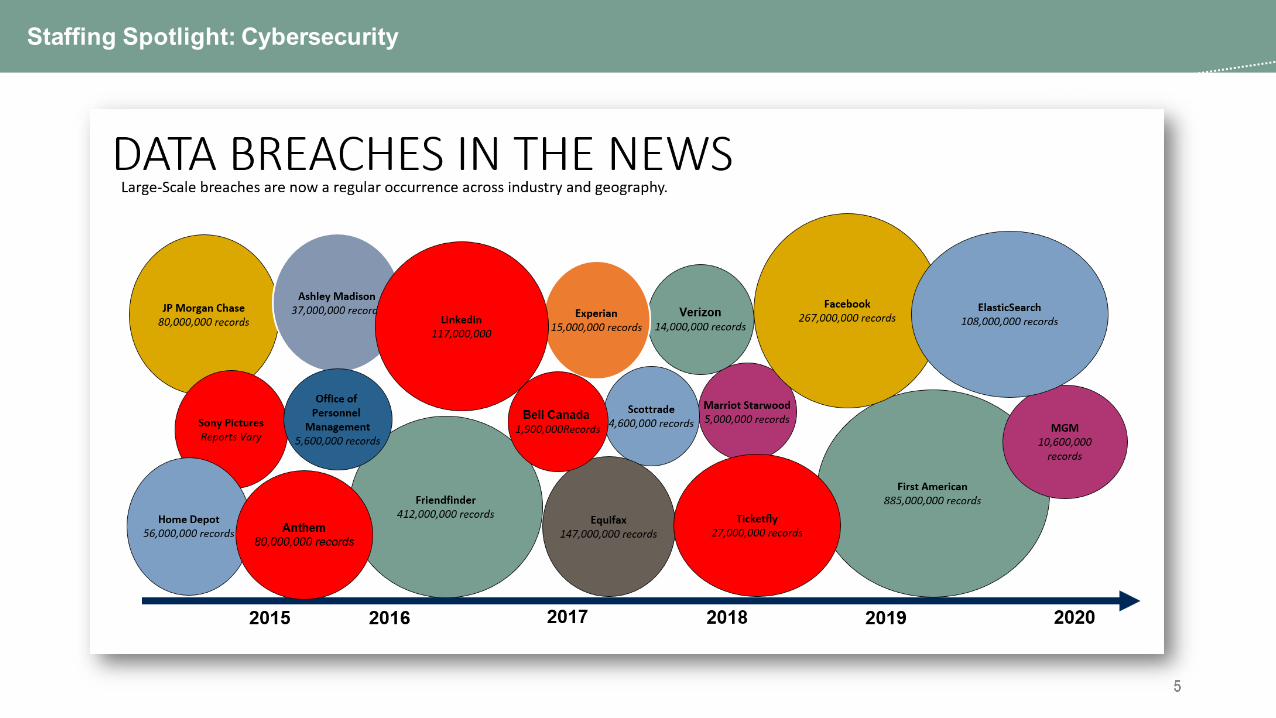
Staffing Investment Opportunities: Spotlight On Cybersecurity

3
Staffing Spotlight: Cybersecurity
Key Activities
✓ Provide assurance to TRS Leadership and the Board that the organization is appropriately managing information security risk.
✓ Create and maintain information security policies and help set implementation goals.✓ Monitor the threat and regulatory landscapes and identify the top risks facing the
organization.✓ Invest in and manage advanced capabilities to improve the protection against and
detection of cyber attacks on the organization.✓ Assist risk owners (in the first line of defense) to make risk management tradeoff
decisions and select appropriate security controls.✓ Facilitate and monitor the implementation and maintenance of security controls across
the organization.
3
Facilitate and monitor the implementation and maintenance of security controls across

4
Staffing Spotlight: Cybersecurity
Investment Management$177 Billion Under
Management
Health Insurance & BenefitsOver 690,000 Covered Lives
Pension Benefits1.7 Million Members
Cyber Attacks(Malware, Phishing, DOS, SQL injections,…)
Expanding Regulatory and Legal Requirements
Growing Threat Landscape
Move to Continuous Delivery (DevOps)
Increase in Internaland External Audit
Long term impacts of the COVID pandemic
Cloud Computing
Accelerated Digital Business Initiatives
Citizen Development
Information Information SecuritySecurity
Protecting
Health Insurance Portability and Accountability Act of 1996(HIPAA)
Confidential Transaction Information, Including Material Non-Public Information
(MNPI)
Confidential Member Information including Protected Health Information (PHI)
Move to Continuous
Legal Assessment and Analysis
5
Staffing Spotlight: Cybersecurity
5

6
Staffing Spotlight: Cybersecurity
GROWING REGULATORY BURDEN
• Regulations governing cybersecurity continue to proliferate
• Between 2000-2010, regulations grew at a slower pace
• Between 2010-2015, growth of regulations intensified
• From 2015-today, the trend has only accelerated
• TRS is subject to well over 20 different regulatory laws promulgated by the State of Texas, the US Federal Government, and international regulations due to the global reach of TRS operations and investment data
7
Staffing Spotlight: Cybersecurity
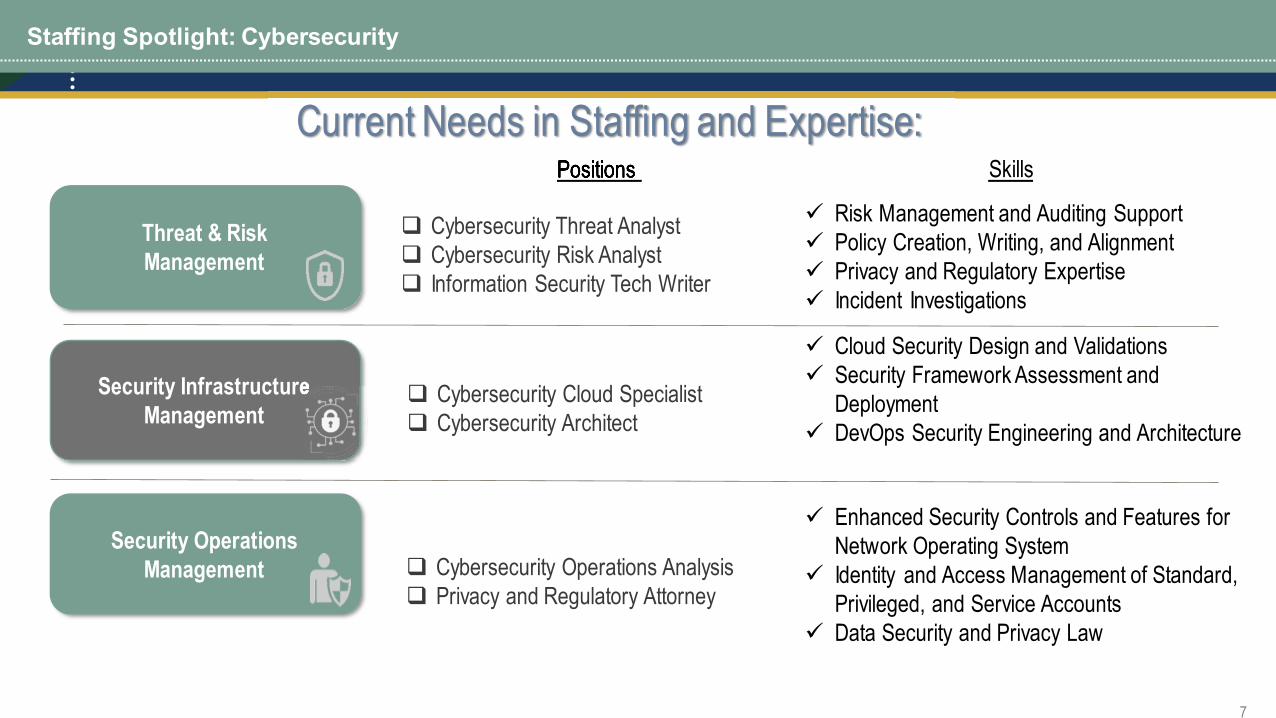
Threat & Risk Management
Security Operations Management
Security Infrastructure Management
Security Infrastructure
❑ Cybersecurity Threat Analyst❑ Cybersecurity Risk Analyst❑ Information Security Tech Writer
Positions Skills
❑ Cybersecurity Cloud Specialist❑ Cybersecurity Architect
❑ Cybersecurity Operations Analysis❑ Privacy and Regulatory Attorney
Positions Current Needs in Staffing and Expertise:
✓ Risk Management and Auditing Support✓ Policy Creation, Writing, and Alignment✓ Privacy and Regulatory Expertise✓ Incident Investigations
✓ Cloud Security Design and Validations✓ Security Framework Assessment and
Deployment ✓ DevOps Security Engineering and Architecture
✓ Enhanced Security Controls and Features for Network Operating System
✓ Identity and Access Management of Standard, Privileged, and Service Accounts
✓ Data Security and Privacy Law

Security Operations Management
4 – FTE’s
8
Staffing Spotlight: Cybersecurity Current Staffing
Information Security1 – Information Security Officer
Threat & Risk Management
1 - FTE
Security Infrastructure Management
3 - FTE’s
▪ Risk Assessments▪ Threat Analysis▪ Incident Response &
Reporting▪ Coordinate with Legal &
Compliance on Regulatoryand Policy Compliance
▪ Policy Creation/Revision▪ Coordinate with Legal &
Compliance on Legal Review▪ Privacy Analysis/Compliance▪ Reporting▪ Audit Response
▪ Security Guidelines and Control integration into Systems and Processes
▪ Patch Management▪ Application Validations▪ Cloud Security▪ Security Procedure
Design▪ Security Incidents and
Events Monitor Design▪ Configuration and
Management of security platforms
▪ Security Architecture
▪ Penetration Testing▪ Security Investigations▪ Alert Monitoring▪ Vulnerability Scanning▪ Phishing Campaigns▪ Static and Dynamic
Application Testing▪ Website Security
Validations▪ Onboarding / Offboarding

9
Staffing Spotlight: Cybersecurity
“Texas ranked third among
states in the number of cybercrime victims and second in the number of financial losses in 2017,”
Hegar said. “Unfortunately,
cybercriminals see Texas’
large, ever-growing population as a large and ever-growing pool of potential targets.”– Glenn Hegar, Texas Comptroller
TEXAS COMPTROLLER OF PUBLIC ACCOUNTS
Information Security Roles # of Reported FTE’s
Information Security Management 3Compliance Team 6Data Loss Prevention and Cyber Security Awareness Training 3
Digital Forensics 2Technical Risk Assessment Team 5Privacy Officer 1Identity & Access Management 9Operational/Infrastructure Security 7Total: 36
Since the pandemic began, the FBI reported a 300% increase in reported cybercrimes. – FBI: Internet Crime Complaint Center (IC3)

10
Staffing Spotlight: Cybersecurity
CALIFORNIA STATE TEACHERS’ RETIREMENT SYSTEM
CalSTRS TRS
Membership Size 975,000 1,682,798Health Insurance- Retirees N/A 220,213- Active Members N/A 472,988Investments Under Management $248B $177BTotal FTE’s 1,200+ 863FTE’s Dedicated to Information Security 20 9

11
Staffing Spotlight: Cybersecurity

TAB 4

Caasi Lamb, Director of Strategic Initiatives
Keith Robinson, Focus Consulting Group
February 24, 2021
CORE VALUES REFRESH PROJECTTeacher Retirement System of Texas
2
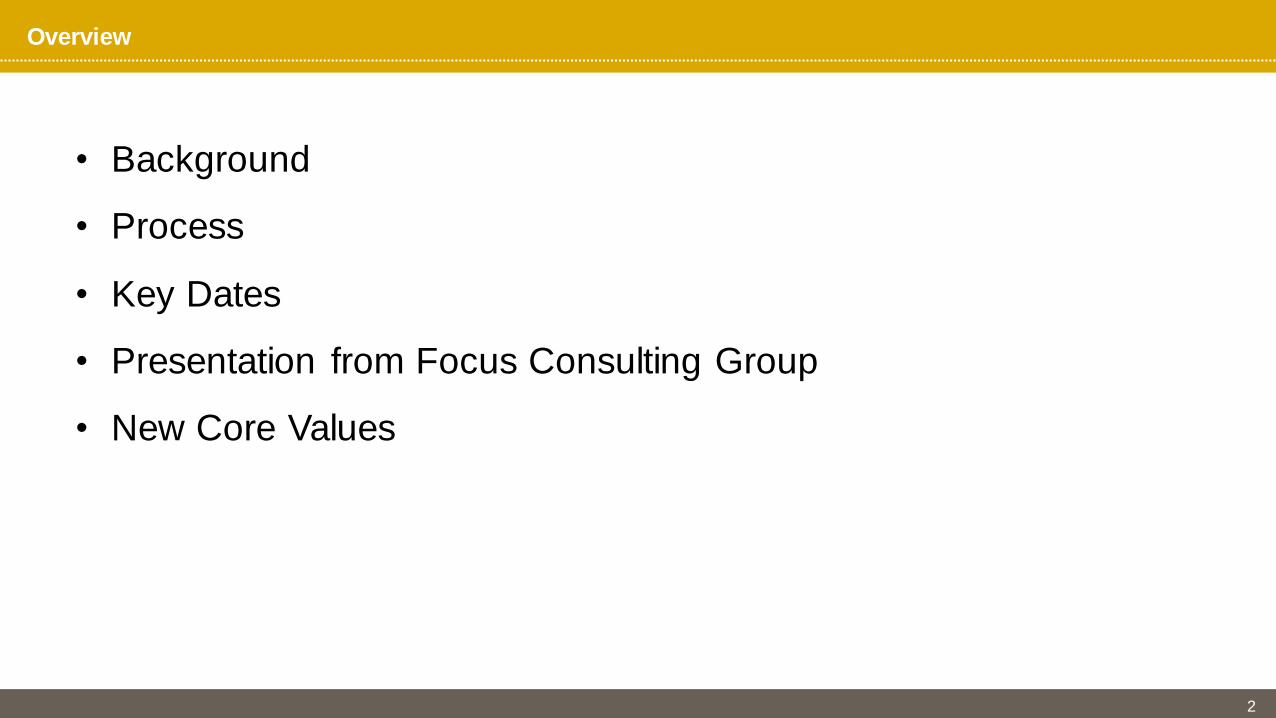
• Background
• Process
• Key Dates
• Presentation from Focus Consulting Group
• New Core Values
Overview

• Designed to create a culture at TRS that supports the agency’s mission
• Communicated regularly to TRS staff and external oversight entities
• Current values established in 2013Customer Satisfaction Collaboration/TeamworkAccountability RespectEthics ExcellenceEmployee Fulfillment
• Internal Audit • Review process• Communication plan • Performance measures
3
Background
Improving the retirement security of our members by prudently investing and managing the Trust assets and delivering benefits that make a positive difference in their lives.

4
Process
Focus Groups• Gain additional insight into survey
results• 12 groups consisting of six staff
groups, four manager groups, new hire group, and the DE&I Council
Introductory WebinarProvide information on the process
Culture Survey• All employees• 594 total responses (73% completion
rate)

5
Date Task
August – October 2020 Held introductory webinar; conducted survey and focus groups
January 2021 Reviewed Culture Survey Report with the Executive Council and determined new Core Values
February 2021 Review key findings and present new Core Values to Board of Trustees; identify performance measures
March 2021 Communicate new Core Values at All Hands Meeting
March – December 2021 Implement Core Values Communications Plan
Key Dates

Core Value Refresh Board Overview
Teacher Retirement System of Texas (TRS)
February 24, 2021
Copyright 2020 The Focus Consulting Group. Use only with permission.

TRS Values in Action
Green/Underlined = Match between top existing and aspirational values in given yearRed/Italicized = Sludge Factor
= TRS articulated value AND actual or aspirational value
7
ARTICULATED VALUES ACTUAL VALUES ASPIRATIONAL VALUES
Customer Satisfaction Balance (work/life) Balance (work/life)Collaboration/Teamwork Member Focused Collaboration/Teamwork
Accountability Collaboration/Teamwork Continuous ImprovementRespect Professional Employee EmpowermentEthics Ethical/Integrity Leadership Development/Mentoring
Excellence Customer Satisfaction Member FocusedEmployee Fulfillment Diversity Long-term Perspective/Vision
Strong Work Ethic RespectBureaucracy Growth Mindset (learning culture)Appreciation Efficiency

Culture Journey: Sludge
8
MARCH 2013: 14%N=362
% OF VOTES
SEPT 2020: 12%N=594
% OF VOTES
Bureaucracy 22% Bureaucracy 23%
Politics 20% Slow Moving/Reactive 20%
Territorial 19% Politics 16%
Slow Moving/Reactive 16% Siloed 16%
Defensive Behaviors 12% Defensive 8%
Gossip 11% Short-term Focus 8%
Short-Term Focus 10% Entitlement 7%
Entitlement 10% Blame 6%
Blame 6% Gossip 5%
Manipulation 6% Negative 5%
Negative 6% Disrespect 4%
Disrespect 6% Manipulation 4%

Building Blocks of Culture: Aspirational DNA (Maslow)
Purpose/Meaning
Mastery/Development
Belonging/Connection
Safety/Security
Control
Approval
Security
Purpose
Fear of losing any one of these leads to anxiety
Achieving this leads to happiness, contentment
9
Customer Satisfaction (A A)Ethics (A A)Employee Fulfillment (A)Member Focused (A A)Long-term Perspective/Vision (A)
Balance (work/life) (A A)Employee Empowerment (A)Respect (A A)
Excellence (A)Continuous Improvement (A)Leadership Development/Mentoring (A)Growth Mindset (learning culture) (A)Efficiency (A)
Collaboration/Teamwork (A A A)Accountability (A)
A = TRS Articulated Values (2013)A = TRS Actual ValuesA = TRS Aspirational Values

Conclusions• TRS has been deliberate in designing, executing, and reinforcing its culture.
• At TRS, the Maslow scores are strong, providing a solid foundation for culture resulting in workability.
• TRS is effective at both frequency and transparency of communication.
• There is a noted appreciation for the agency’s willingness to measure and improve its culture.
• TRS experiences both meta and subcultures; however, they are primarily complimentary, and the subcultures do not conflict with the current TRS metaculture.
• TRS is a purpose driven organization (Maslow’s highest level) where intrinsic surpasses extrinsic motivation.
• Key attraction features to the agency are: purpose (at both the agency and personal level), culture, and work/life balance afforded employees.
• Comments convey a strong, purpose driven organization, expressed on several levels:• Agency mission• Dedication to the teachers of Texas• Personal fulfillment in the work itself• Dedication to colleagues at TRS
10

Questions & Comments
11
Jim Ware847-373-8853
Liz Severyns847-636-7491
Keith Robinson312-560-7216
Bryan Kozlowski646-201-5243

12
Current Core Values (2013)
• Customer Satisfaction• Collaboration/Teamwork• Accountability• Respect• Ethics• Excellence• Employee Fulfillment
New Core Values (2021)
• Member Focused• Ethics• Accountability• Respect• Diversity• Efficiency• Collaboration• Excellence
Overlap between current and new core values
New Core Values

Appendix

TRS Culture Review - Appendix
14
1. Steps and Timeline
2. Culture: what is it and why is it important?
3. Additional data

Steps and Timeline
15
Culture Survey Introduction Webinar
Survey open for response
FCG Data Analysis and Report Generation
Initial Debrief with Brian Guthrie, Andrew Roth and CVR team
FCG Facilitated Focus Groups
August 25, 2020
September 29
September 12 – September 26
August 26 – September 11
October 5 – October 9
TRS Board Presentation
January 8, 2021EC Retreat
February 24

Culture: What is it and why is it important?
16

4. Excel lence
Purpose
4. Excel lence4. Excel lence
Excellence
ClientCollaboration
X
18
* Values chosen are examples and not TRS’ chosen values
Goal of Culture: Practicing the same beliefs, values and behaviors.

TRS Additional Data from the Culture Survey
19
a. Maslow and Culture
b. Strategy
c. Success Factors
d. Loyalty
e. Division Scorecard

Maslow Summary
20
Belonging / Connection: 4.63
Safety / Security: 4.81
Purpose / Meaning: 5.15
Mastery / Development: 4.49
Scale: Strongly Agree (6) to Strongly Disagree (1)
Belonging / Connection: 4.63 Purpose / Meaning: 5.15Belonging / Connection: 4.63

Strategy: TRS strategic goals are….
2020
Very clear to me and I know my role in executing them 62%
Very clear to me but I do not know my role in executing them 9%
Somewhat clear to me 25%
Not clear to me 3%
Have not been communicated to me 2%
21
N=589

Success Factors: 2013 v. 2020
Percent Agree Percent Disagree
2013* 2020 2013* 2020
As an agency, we have the ability to attract top talent. 74% 81% 15% 13%We have an ownership mentality; our employees think like leaders of the agency. 51% 66% 30% 28%
We are good at executing plans in a timely manner. 72% 72% 14% 26%
We have the resources to do our work well. 73% 85% 20% 15%
Our agency encourages open and transparent communication. 69% 86% 16% 14%
Decision making is timely and effective. 67% 74% 18% 25%
Executive leaders communicate well (clear and transparent). 65% 89% 23% 10%
Department managers communicate well (clear and transparent) N/A 82% N/A 15%
I feel like our agency is a leader among public retirement systems. N/A 84% N/A 5%
Agree=slightly agree, agree, strongly agree Disagree=slightly disagree, disagree, strongly disagree
* Questions in 2013 were worded slightly different than in 2020 and contained a “neutral” answer option
• N/A = data unavailable-question was not asked in 2013 22

Loyalty Factor: Financial Incentive
23
4%
19%
52%
25%
4%
20%
48%
29%
0%10%20%30%40%50%60%70%80%90%
100%
Unhappy Camper Neutral Happy Camper Raving Fan
TRS 2020TRS 2013
N=589N=350
Think about what level of financial incentive it would take for you to leave TRS. Which of the following statements most closely describes your current attitude:

Loyalty: Top Reasons to Join and Top Reasons to Leave
24
Reasons to JoinN=589 2020
Quality of Work/Life Balance 69%
Strong, Positive Culture 51%
Challenging, Meaningful Work 49%
Reasons to LeaveN=589 2020
Compensation and Benefits 25%
I have no plans to leave TRS 24%
Career Opportunity 24%
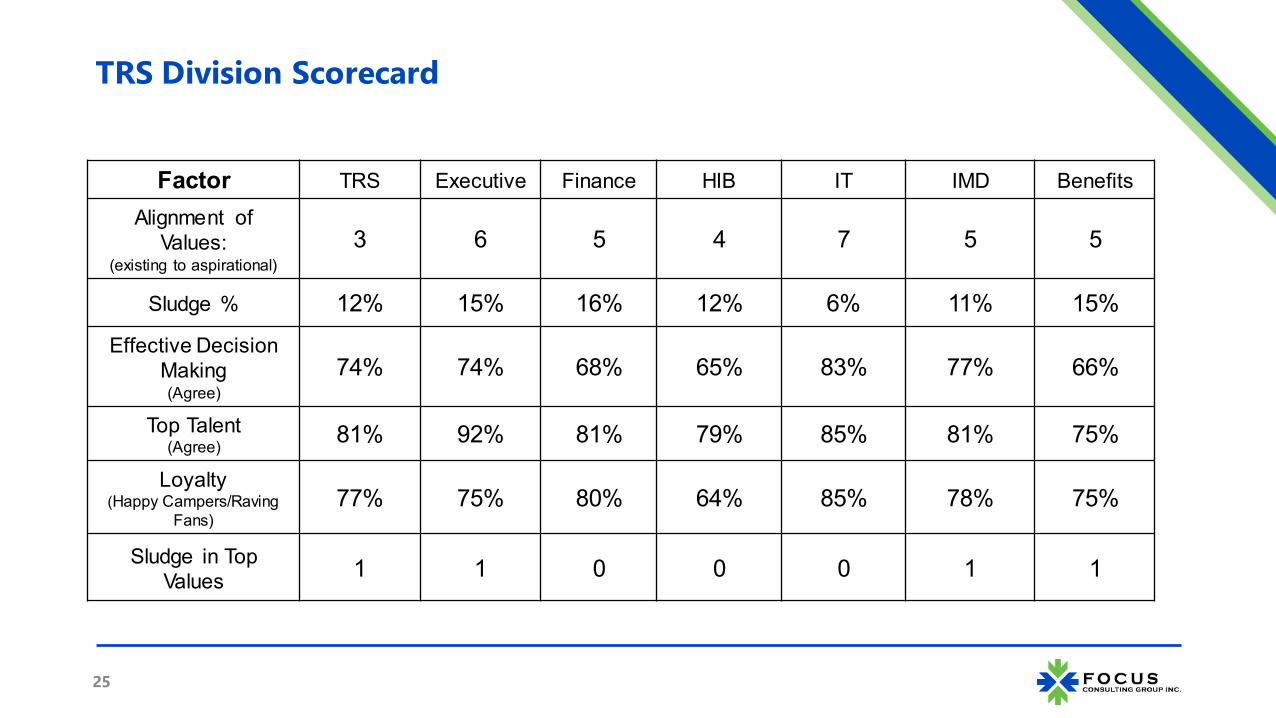
TRS Division Scorecard
Factor TRS Executive Finance HIB IT IMD Benefits
Alignment of Values:
(existing to aspirational)3 6 5 4 7 5 5
Sludge % 12% 15% 16% 12% 6% 11% 15%
Effective Decision Making (Agree)
74% 74% 68% 65% 83% 77% 66%
Top Talent (Agree) 81% 92% 81% 79% 85% 81% 75%
Loyalty (Happy Campers/Raving
Fans)77% 75% 80% 64% 85% 78% 75%
Sludge in Top Values 1 1 0 0 0 1 1
25

TAB 5

Caasi Lamb, Director of Strategic InitiativesFebruary 24, 2021
2021-25 STRATEGIC PLAN UPDATETeacher Retirement System of Texas

2
Overview
Agenda
• Background & Process
• Structure
• Potential Updates to Strategic Plan
• Year Ahead
• Appendix A: 2021-25 Strategic Plan

3
Background & Process
Strategic planning is a process of identifying an organization’s future direction and allocating resources in
pursuit of that future direction.
Political
Environmental
Legal
Technological
Social
Economic
Benefits
• Intentional • Aligned • Focused • Accountable
Improving the retirement security of our members by prudently investing and managing the Trust assets and delivering benefits that make a positive difference in their lives.

4
Present results forum report to Strategic Planning
Committee of the Board
Align Areas of Focus with the Strategic Plan
Develop a new 5 year plan every even-numbered year
Submit plan to LBB and Governor’s Office every other
year
Background & Process

5
PRESENTATION TITLE >>> NAME FEB-09-15PRESENTATION TITLE >>> NAME >>> DATE
Inform the process and plan regarding:
• Direction• Priorities• Clarity
Hold results forums and report out
Align resources and engage on the plan
Submit five-year plan to LBB and Governor's Office
Adopt new plan or amend existing plan
Develop new plan or identify updates to existing plan
Conduct environmental scanning
Review mission statement & core valuesID
ENTI
FYDE
VELO
PEX
ECUT
E
PeriodicallyEvery 4 years
Annually
New: Even YearsUpdate: Odd Years
Even Years
Ongoing
Quarterly
New: Even YearsUpdate: Odd Years
Background & Process

6
Background & Process
7
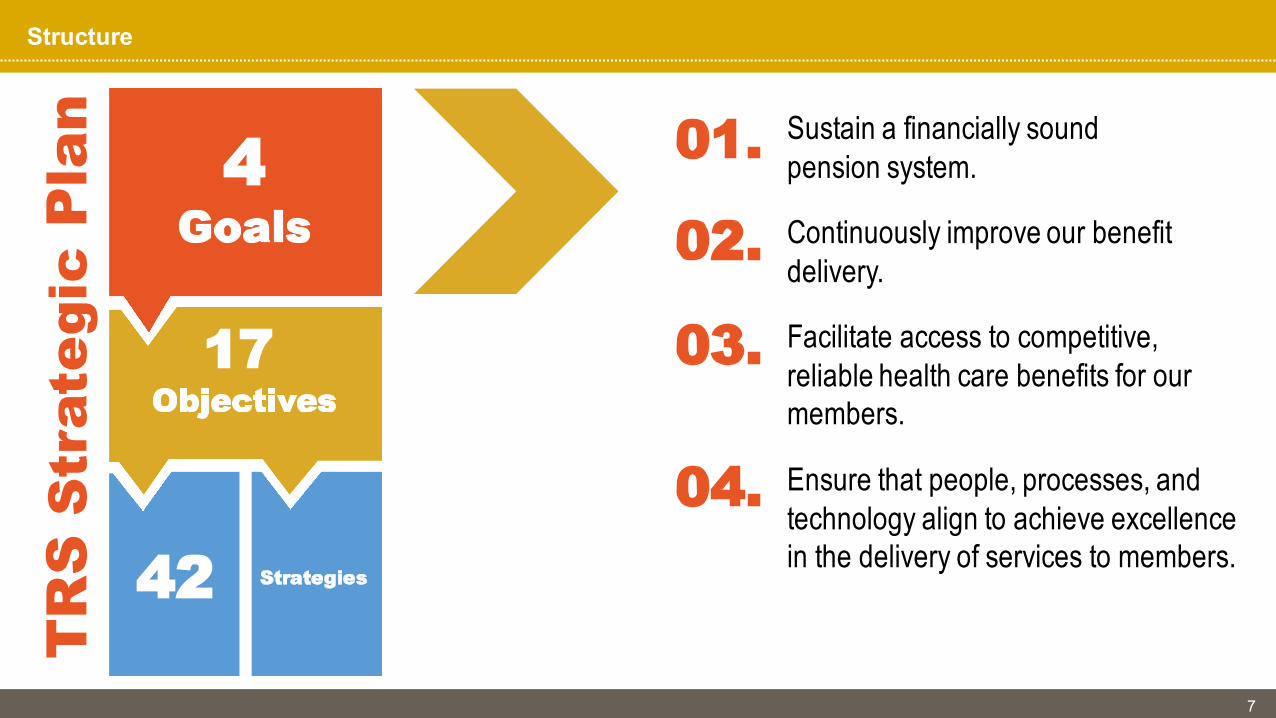
Structure
Goal
Objective Objective Objective
Strategy Strategy Strategy Strategy Strategy Strategy
4Goals
17Objectives
Strategies42
TR
S S
trat
egic
Pla
n
Facilitate access to competitive, reliable health care benefits for our members.
Ensure that people, processes, and technology align to achieve excellence in the delivery of services to members.
01. Sustain a financially sound pension system.
Continuously improve our benefit delivery.
02.
03.
04.

8
Potential Updates to Strategic Plan
Reconcile current plan to newly identified
opportunities and threats
Provide update to Board of Trustees
Conduct environmental scanning
Identify opportunities, threats, customer needs, and internal
operational needs

Opportunities1. Employment after retirement2. Data analytics3. Value proposition for investment in
staffing4. Cyber security5. Educate stakeholders6. Post-pandemic work environment
Customer Needs1. TRUST Phase II & HILOB2. Adequate staffing to meet service level
expectations and member needs3. Member self-service4. Ease of access to TRS (regional offices)5. Comprehensive health care coverage at
affordable rates
Threats1. Failure to meet rate of return 2. Recruit, retain, and develop talent3. Cyber security4. Destabilization of TRS-ActiveCare5. Procurement6. Failure to receive scheduled pension
contribution increases
Internal Operational Needs1. Long-term facilities2. Data management3. Process efficiencies4. Investment in shared services to support
core lines of business5. Recruit, retain, and develop talent6. Expanded remote work post-pandemic
9
How well does the Strategic Plan address the top opportunities, threats,
customer needs, and internal operational needs?
Potential Updates to Strategic Plan
Strategic Plan Fit & Alignment

10
Potential Updates to Strategic Plan
Consider updating the Strategic Plan to include the following: • Comprehensive workforce strategy• Post-pandemic work environment• Process efficiencies
Type of Change Strategic Plan Proposed Language
Add new strategy G4.O1 Strategy 5 Develop and implement a comprehensive workforce strategy that includes expanded remote work, onsite facility needs, appropriate staffing levels, and the technological tools necessary to support appropriate workforce strategies.
Amend existing strategy to include artificial intelligence
G4.O2. Strategy 3 Provide advanced data analytics tools, artificial intelligence, and data management practices to gain business intelligence and improve decision-making.
Amend existing strategy to make applicable to entire organization
G4.O8 Strategy 1 Investigate best practices and feasibility of incorporating artificial intelligence into business processes.
Add new strategy G4.O8 Strategy 2 Identify opportunities for improved productivity, process efficiencies, and performance monitoring.

Year Ahead
Results Forum Report Out (Q4)• Attract, retain and develop a
highly competent staff • Facilities and space
requirements • Improve strategic
communications
Adopt FY 2021 Areas of Focus
Fiscal Year 2020 Recap Results Forum Report Out (Q1)• Achieve the investment rate
of return• Improve the customer service
experience• Increase identification of
underpayments and collection of future contributions
• Improve timeliness and accuracy in employer-reported data
Update Strategic Plan(as applicable)
Results Forum Report Out (Q3) • Improve pension funding
communication• Improve communication
regarding the impact of changing plan design
• Improve health care funding needs communication
• Increase the value of health care benefits
• Improve the health of our members
Adopt FY 2022 Areas of Focus
Results Forum Report Out (Q2)• Advance and enhance IT
systems and services• Enhance the information
security program• Fiduciary responsibility and
ethical conduct• Improve and maintain
effective procurement and contract management
• Evaluate automation and technology solutions
Mid-Year KPI Data Provided
July 2021Strategic Planning Committee
September 2021Strategic Planning Committee
April 2021Strategic Planning Committee
December 2020Strategic Planning Committee
September 2020Strategic Planning Committee
11
February 2021 Board MeetingCore Values
Strategic Plan Fit & AlignmentSatisfaction Survey Results
FISCAL YEAR 2021 FISCAL YEAR 2022

APPENDIX A2021-25 STRATEGIC PLAN

Sustain a financially sound pension system.GOAL 1
13
2021-25 Strategic Plan
Objective 1: Improve communication regarding pension funding needs. Strategy 1: Serve as a trusted resource and engage with policymakers on pension funding.
Objective 2: Increase identification of underpayments and collection of future contributions to TRS.Strategy 1: Increase testing coverage of high-risk reporting employers.
Objective 3: Achieve the trust’s actuarial assumed rate of return as measured on rolling 20-year periods.*Strategy 1: Maintain an effective investment governance structure.Strategy 2: Enhance current competitive advantages and total returns.Strategy 3: Manage cost structures to increase net alpha generated.
Objective 4: Improve communication regarding the impact of changing pension plan design.Strategy 1: Serve as a trusted resource and engage with policymakers on pension plan design.
* Executive Director’s Areas of Focus

Objective 1: Improve the customer service experience for members and employers.*Strategy 1: Increase capacity to serve members.Strategy 2: Improve response time to reporting employers. Strategy 3: Provide additional online functionality.Strategy 4: Build and define operational support for Benefit Services.Strategy 5: Consolidate customer service inquiries regarding health care and pension benefits into one call center (One Team One Mission) .*
Objective 2: Improve timeliness and accuracy in employer reported data. Strategy 1: Stabilize the reporting employer portal.Strategy 2: Begin using data analytics tools to review employer-reported data.
14
2021-25 Strategic Plan
* Executive Director’s Areas of Focus
Continuously improve our benefit delivery.GOAL 2

Objective 1: Improve communication efforts regarding health care funding needs. Strategy 1: Serve as a trusted resource and engage with policymakers on health care funding.*
Objective 2: Increase the value of health care benefits.Strategy 1: Engage the best health care vendors through competitive procurement to ensure our members have the highest value health care.Strategy 2: Re-engineer TRS-ActiveCare to better meet district needs.*
Objective 3: Improve the health of our members.Strategy 1: Improve engagement of plan participants with an initial focus on population with high impact conditions, such as diabetes. Strategy 2: Optimize disease management for high-risk populations.
15
Facilitate access to competitive, reliable health care benefits for our members.GOAL 3
* Executive Director’s Areas of Focus
2021-25 Strategic Plan

Objective 1: Attract, retain, and develop a diverse and highly competent staff.*
Strategy 1: Position TRS as a destination employer to meet the needs of our current and future workforce.Strategy 2: Promote a strong workplace culture that is inclusive and fosters creativity and innovation.Strategy 3: Improve diversity representation at all levels of the organization.Strategy 4: Expand learning and development opportunities.
Objective 2: Advance and enhance IT systems and services.*
Strategy 1: Build, maintain and enhance a robust, highly available IT environment in support of applications and services.Strategy 2: Expand and ease the ability to perform TRS work from anywhere, at any time, and across most any device.Strategy 3: Provide advanced data analytics tools and data management practices to gain business intelligence and improve decision -making.Strategy 4: Implement modern information systems across all lines of business divisions with priority on modernization of legacy systems. *Strategy 5: Enhance the operating model for continuous business process improvement that enables transparent, data -driven decisions and
rapid delivery of high-quality IT capabilities.
16
Ensure that people, processes, and technology align to achieve excellence in the delivery of services to members. GOAL 4
2021-25 Strategic Plan
* Executive Director’s Areas of Focus

Objective 3: Enhance the information security program.*Strategy 1: Provide a secure computing environment that supports a data privacy and integrity framework.Strategy 2: Develop an information security framework based on adaptive security architecture best practices to
manage and mitigate cyber-security threats.
Objective 4: Identify appropriate solutions for TRS facilities and space requirements.*Strategy 1: Successful completion of generational solution for housing all of TRS.Strategy 2: Obtain legislative approval and funding for regional offices.
Objective 5: Foster a culture of fiduciary responsibility and ethical conduct.Strategy 1: Embed/Integrate culture of ethics and compliance within the business process.Strategy 2: Enhance visibility of, and accessibility to, Legal & Compliance throughout TRS.
17
Ensure that people, processes, and technology align to achieve excellence in the delivery of services to members. GOAL 4
2021-25 Strategic Plan
* Executive Director’s Areas of Focus

Objective 6: Improve and maintain effective procurement and contract management practices.*Strategy 1: Implement significant program recommendations related to the Purchasing and Contracts Enhancement Plan.Strategy 2: Implement source to pay software system.Strategy 3: Increase the number of utilized Historically Underutilized Businesses (HUBs).*Strategy 4: Promote purchasing selection practices that foster meaningful and substantive inclusion of historically
underutilized businesses (HUBs).Strategy 5: Improve outreach activities to foster and strengthen relationships among HUB vendors, prime contractors,
and purchasers.Strategy 6: Leverage Diversity, Equity, & Inclusion (DE&I) outreach and partnerships to identify and work with
HUB eligible businesses as a pipeline for HUB contracted services.
18
Ensure that people, processes, and technology align to achieve excellence in the delivery of services to members. GOAL 4
2021-25 Strategic Plan
* Executive Director’s Areas of Focus

Objective 7: Improve strategic communications.Strategy 1: Ensure that member-facing content is easily understandable and accessible to readers.Strategy 2: Develop a communication and outreach plan to better help members and employers plan for retirement.
Objective 8: Evaluate automation and technology solutions to enhance existing processes.Strategy 1: Investigate best practices and feasibility of incorporating artificial intelligence into Legal & Compliance processes.
19
Ensure that people, processes, and technology align to achieve excellence in the delivery of services to members. GOAL 4
2021-25 Strategic Plan

TAB 6

Caasi Lamb, Director of Strategic Initiatives
Dr. Kirby Goidel, Texas A&M University Public Policy Research InstituteDr. Rene Paulson, Elite Research
February 24, 2021
SATISFACTION SURVEY RESULTSTeacher Retirement System of Texas

2
OVERVIEW

3
OVERVIEW
Reporting Employer Satisfaction Survey• Purpose is to provide feedback to TRS management on the services provided
• Conducted annually
• Contracted with Texas A&M University Public Policy Research Institute
• Second time to conduct this survey
• Surveyed all public and higher education employers
Member Satisfaction Survey• Purpose is to gauge active and retired member satisfaction with TRS services
• Conducted annually
• Contracted with Elite Research
• Surveyed a sample of active members and retirees

REPORTING EMPLOYER SATISFACTION SURVEY
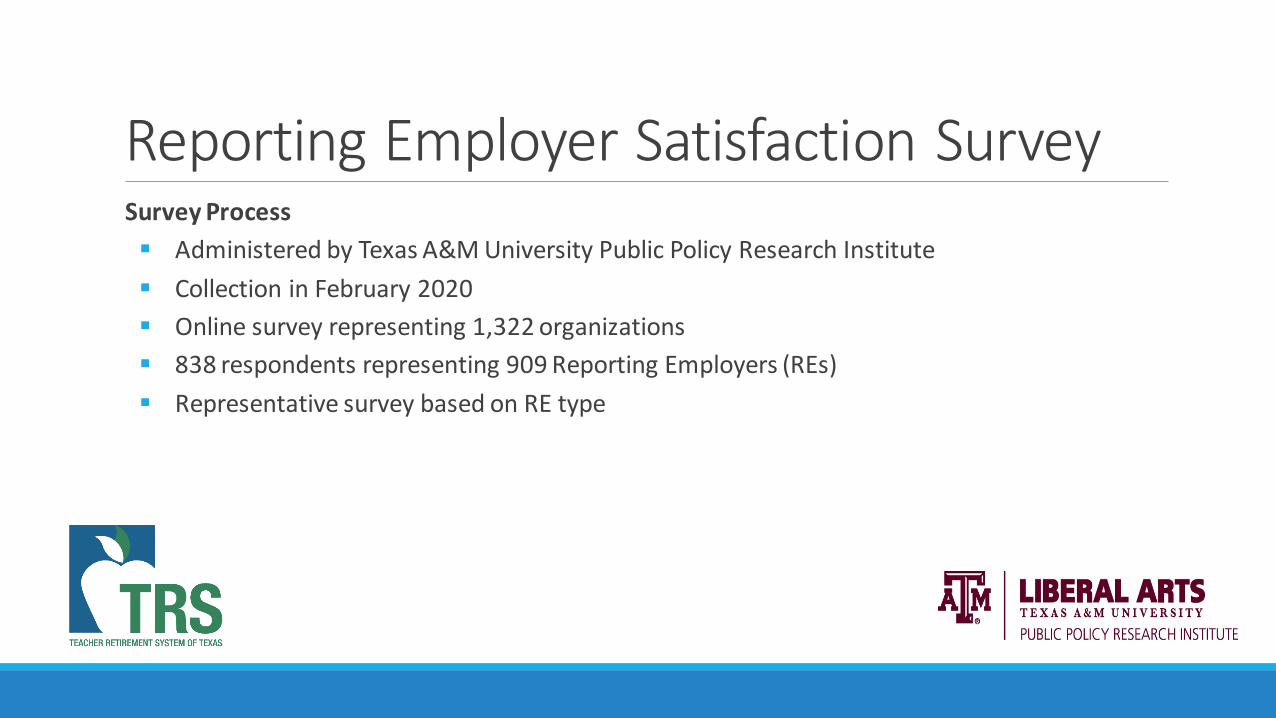
Reporting Employer Satisfaction SurveySurvey Process▪ Administered by Texas A&M University Public Policy Research Institute▪ Collection in February 2020▪ Online survey representing 1,322 organizations▪ 838 respondents representing 909 Reporting Employers (REs)▪ Representative survey based on RE type
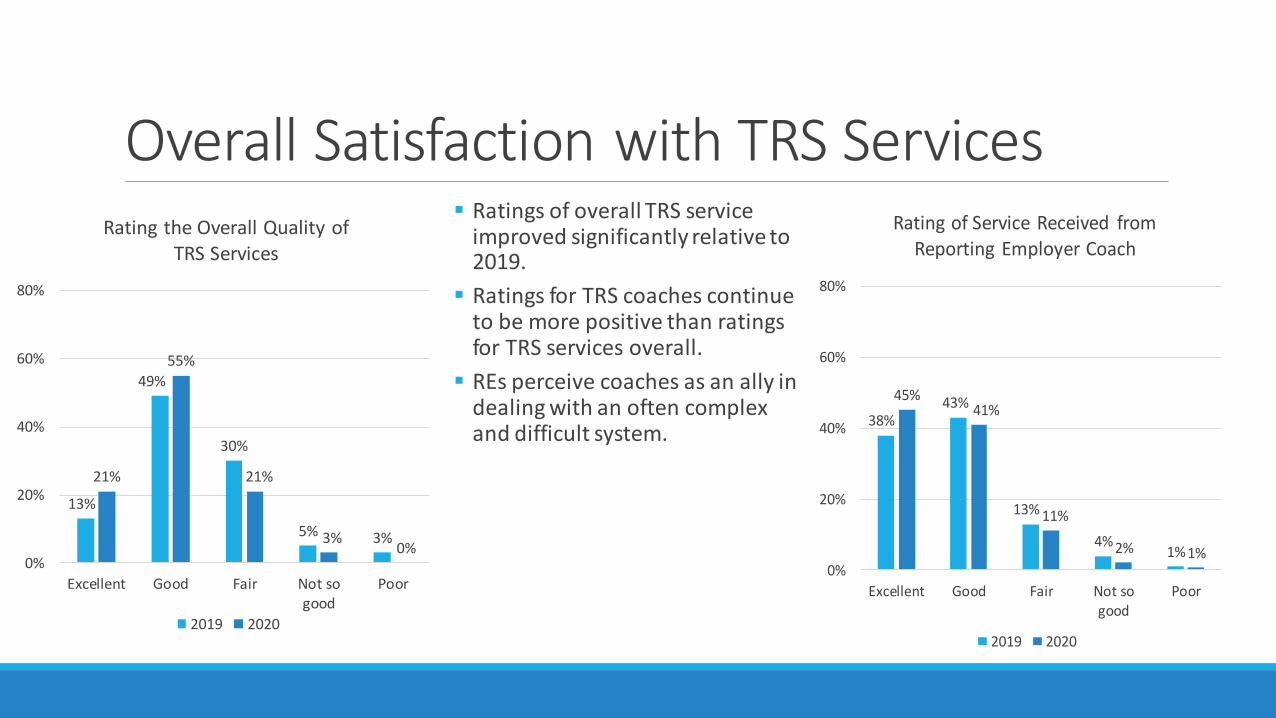
Overall Satisfaction with TRS Services▪ Ratings of overall TRS service
improved significantly relative to 2019.
▪ Ratings for TRS coaches continue to be more positive than ratings for TRS services overall.
▪ REs perceive coaches as an ally in dealing with an often complex and difficult system. 38%
43%
13%
4% 1%
45%41%
11%
2% 1%0%
20%
40%
60%
80%
Excellent Good Fair Not sogood
Poor
Rating of Service Received from Reporting Employer Coach
2019 2020
13%
49%
30%
5% 3%
21%
55%
21%
3% 0%0%
20%
40%
60%
80%
Excellent Good Fair Not sogood
Poor
Rating the Overall Quality of TRS Services
2019 2020

Frequency of Contact with TRS Coaches▪ REs report less contact with TRS coaches, possibly due to resolution of 444 defects and enhancements to the RE Portal in 2019.
▪ REs representing public schools contact TRS coaches less often than higher education.
66%
22%
11%0.7%
72%
19%9%
0.3%0%
20%
40%
60%
80%
100%
Rarely, nomore than
once or twice amonth
Occassionally,about onceevery week
Regularly,several times a
week
Daily
Frequency of Contact with TRS Reporting Employer Coach
2019 2020
75%
18%7%
0%
29% 29%38%
4%0%
20%
40%
60%
80%
100%
Rarely, nomore than
once or twicea month
Occassionally,about onceevery week
Regularly,several times
a week
Daily
Frequency of Contact with Coach by Institution Type
Public School Higher Ed

Evaluations of TRS Coaches by Dimension
▪ REs rate coaches well for everything but calling so you can speak to a person.▪ Relative to 2019, all the evaluations were similar, with improvements in directing REs to appropriate websites and
responding quickly. The difference on “responds quickly” may reflect a change in question wording.
69% 67% 67% 62%
44%
75%
26% 28% 26% 29% 29% 23%
4% 5% 5% 7%16%
2%1% 1% 1% 2%12%
0.4%0%
20%
40%
60%
80%
100%
Understandsquestions and
respondsappropriately
Directs you toresources onthe website
Explains stepsto correct
errors
Respondswithin service
standard(two-days)
Is available soyou can speak
to a person
Communicatesvia email
Rating of TRS Coach by Dimension of Performance
Very Well Somewhat Well Not Very Well Not Well at All
94% 88% 92%81%
95% 95% 93% 91%
0%
20%
40%
60%
80%
100%
Understands questionsand
respondsappropriately
Directs you toresources
on the website
Explains stepsneeded to correct
errors
Responds withinservice standard
(two-days)
Rating of TRS Rating Coaches "Very Well" or "Well" by Dimension
2019 2020

Importance of Dimensions of Evaluations ▪ REs rate understanding questions,
explaining steps to correct errors, and responding quickly as the most important qualities.
▪ Calling so you can talk to a person and being directed to appropriate resources on the web are least important.
▪ There has been a significant increase in the importance of communication via email and a decrease in the importance of being directed to appropriate resources on the web.
98%
81%
98% 96%
64%78%
97%
76%
97% 95%
68%
88%
0%
20%
40%
60%
80%
100%
Understandsquestions and
respondsappropiately
Directs you toresources on the
website
Explains thesteps to correct
errors
Responds withinservice standard
(two-days)
Is available soyou can speak toa person on the
phone
Communicatesvia email
Rating of Services Provided by TRS Coaches as "Very Important"
2019 2020
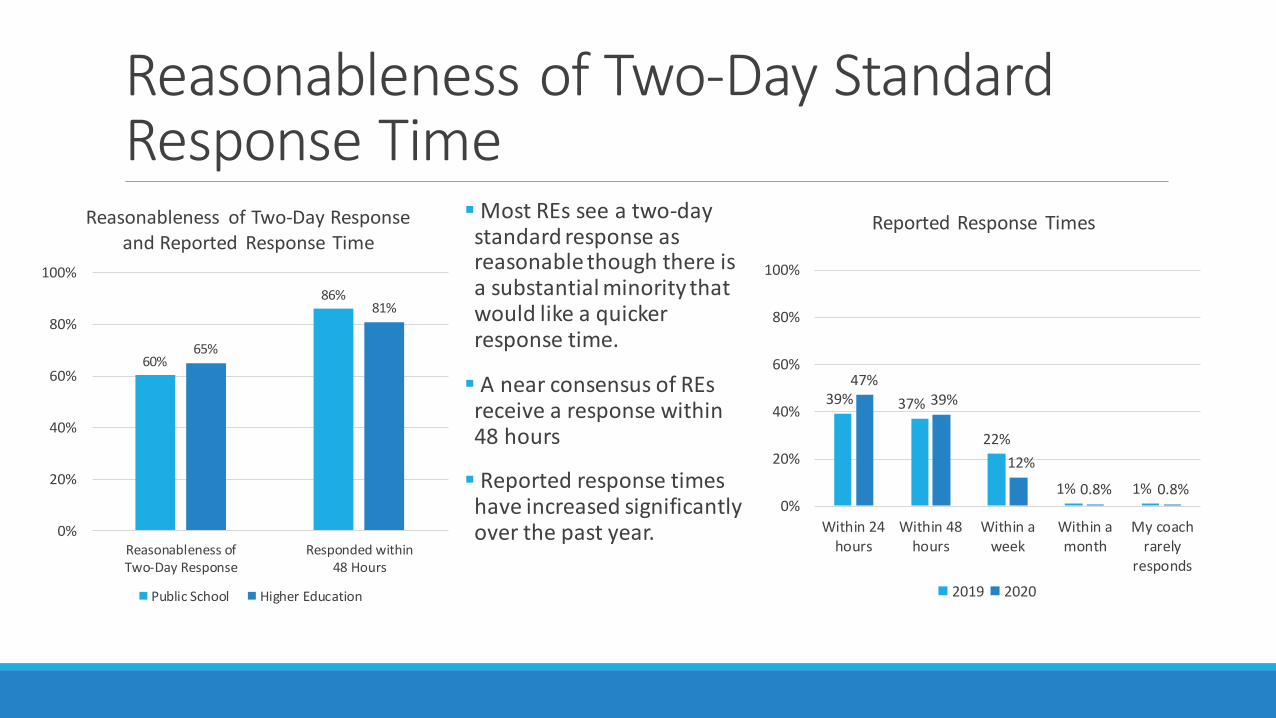
Reasonableness of Two-Day Standard Response Time
▪Most REs see a two-day standard response as reasonable though there is a substantial minority that would like a quicker response time.
▪ A near consensus of REs receive a response within 48 hours
▪ Reported response times have increased significantly over the past year.
60%
86%
65%
81%
0%
20%
40%
60%
80%
100%
Reasonableness ofTwo-Day Response
Responded within48 Hours
Reasonableness of Two-Day Response and Reported Response Time
Public School Higher Education
39% 37%
22%
1% 1%
47%39%
12%0.8% 0.8%
0%
20%
40%
60%
80%
100%
Within 24hours
Within 48hours
Within aweek
Within amonth
My coachrarely
responds
Reported Response Times
2019 2020

Rating of TRS Training and Training Resources
▪ 72 percent of REs reported attending training over the past year. Most rate the training and the resources provided during training positively.
▪ REs rate more individualized training most positively for greatly improving their understanding.
26% 28% 24% 22% 24%
52%64% 59% 61% 57%
17%
3%15% 15% 18%
2% 6% 3% 3% 1%2% 0% 0% 0% 0%0%
20%
40%
60%
80%
100%
Introduction to TRSReporting
(N=94)
1-on-1/IndividualTraining(N=40)
Spring 2019 REPortal Training
(N=369)
Fall 2019 LegislativeUpdate Training
(N=313)
Some OtherTraining(N=90)
Rating of Training for Resources/Information Provided
Excellent Good Fair Not so good Poor

Helpfulness of TRS Resources
▪ REs rate the newsletter and TRS emails as the most helpful resource followed by the payroll manual, and file formatting guide. The defects/workaround list was rated as least helpful. ▪ There is no consensus on how best to deliver training materials to REs. More than a third respondents prefer written or online but there are also preferences for webinars and in-person training materials.
56%
53%
52%
48%
45%
45%
44%
33%
0% 10% 20% 30% 40% 50% 60%
Update newsletter/TRS emails
Payroll manual
File formatting guide
Legislative change videos
Errors/warning list
RE portal training videos
RE portal web message
Defects/workaround list
Helpfulness of Resources (Percent Very Helpful)
36%
24%
8%
29%
2%
0% 20% 40% 60%
Written or online
Live interaction/Webinar
Recorded videos
In-person
Other
Preference for Receiving Training Materials

ConclusionsOverall Satisfaction
▪ Ratings of overall TRS service improved relative to 2019
Coaches▪ REs continue to evaluate their coaches more positively than TRS services
◦ Positive reviews for understanding questions and responding appropriately, directing REs to appropriate resources on the website, and explaining the steps to correct errors
◦ Less positive about ability to contact coaches by phone▪ Less reported contact with TRS coaches in 2020; this improvement is possibly due to the resolution of defects or
implementation of enhancements to the RE Portal in 2019▪ Assessed response times have improved after adopting a two-day standard response time goal; because REs are often
operating under an immediate deadline, some note the need for even quicker responses
Training▪ REs rate training sessions positively, however ratings indicate the trainings are “somewhat” rather than “very” valuable▪ Training resources are evaluated positively in terms of their usefulness by users, and evaluations have improved relative
to 2019

MEMBERSATISFACTION SURVEY

Teacher Retirement System of Texas
Member Satisfaction Survey
Rene Paulson, PhDFebruary 24, 2021

Survey Process
▪ Administered by Elite Research, LLC▪ Collection in September 2020▪ Online and phone survey▪ Segmented on gender, age, and prior TRS contact▪ Population:1 Million Active and 400,000 Retired▪ Sample: 34,775 Active and 7,650 Retired
16
Active Retired
E-mail 1,382 437Phone 299 213
SMS Text 107 9Total 1,788 659
Collection method

Overall Satisfaction
▪ Rating steady between 2020 and 2019 with greater percent of respondents Very Satisfied▪ Retirees more satisfied than active members with active members more likely to respond Neutral
17
12%
43%
26%15%
4% 0.5%
19%
56%
9% 12%4%
0.0%0%
20%
40%
60%
80%
Very Satisfied Satisfied Neutral Unsatisfied VeryUnsatisfied
No Response
Overall Satisfaction with TRS (2019)
Active (N = 828) Retiree (N = 439)
18%
35%29%
9% 7% 2%
37% 37%
10%5%
10%1%
0%
20%
40%
60%
80%
Very Satisfied Satisfied Neutral Unsatisfied VeryUnsatisfied
No Response
Overall Satisfaction with TRS (2020)
Active (N = 1,747) Retiree (N = 650)

Member Satisfaction
18
▪ Member Satisfaction❖ Retirees rate performance higher than Actives
▪ TRS Provides a Secure Retirement❖ Very important and actives rate performance lower❖ Possible need for retirement planning education
▪ Operates in My Best Interest ❖ Very important and actives rate performance lower❖ Possible need for greater communication on TRS
decisions
Acts Ethically
Provides a Secure Retirement
Operates in My Best Interest
Provides Needed Info
Easy to Understand InfoListens to Members
Provides a Secure Retirement
Operates in My Best Interest
Acts Ethically
Provides Needed Info
Easy to Understand Info
Listens to Members
0%
20%
40%
60%
80%
0% 20% 40% 60% 80% 100%
Impo
rtanc
e
Performance
TRS Active and Retiree Values
Active Retiree
Importance: Rate which items are the most important to you (Choose top 3): e.g., I know TRS operates in my best interest.Performance: Rate whether you agree or disagree with the following statements: e.g., I know TRS operates in my best interest.Note: Percent calculations exclude Neutral and No Response.

Age Group
19
▪ Younger members less likely to rate as satisfied; more likely to rate as neutral ▪ Younger members less likely to have financial confidence in their retirement; continues through 40-49 years
36%42%
49%
64% 62%
23% 20%14% 11% 15%
36% 37% 34%
23% 21%
0%
20%
40%
60%
80%
<30 years 30-39 years 40-49 years 50-59 years 60+ years
Overall Satisfaction with TRSFor Active Members by Age
Satisfied Unsatisfied Neutral
41% 45%39%
51%57%
46%51%
58%
43%37%
13%4% 3% 6% 6%
0%
20%
40%
60%
80%
<30 years 30-39 years 40-49 years 50-59 years 60+ years
Financial Confidence in Retirementfor Active Members by Age
Confident Not Confident No Response

Interactions Importance Rating
20
▪ Email▪ Calling and speaking to a counselor▪ Mail▪ Website▪ Visiting in-person▪ Participating in a group benefit presentation
Importance : Rate your preferred ways to obtain information about your TRS membership and benefits (Choose top 3): e.g., email.Note: Percent calculations exclude Neutral and No Response.
Results❖ Both Actives and Retirees have a strong preference for Email and Speaking to a Counselor❖ Retirees have a strong preference for Mail

Interactions Satisfaction Rating
21
▪ Increase in Very Satisfied and decline in Unsatisfied and Very Unsatisfied rating in 2020
21%
36%
22%
8% 4%10%
40% 38%
10%4% 2% 6%
0%
20%
40%
60%
80%
Very Satisfied Satisfied Neutral Unsatisfied VeryUnsatisfied
No Response
Satisfaction with TRS Interactions (2020)
Active Retiree
13%
52%
15% 14%6%
0%
18%
60%
12% 9%2% 0%
0%
20%
40%
60%
80%
Very Satisfied Satisfied Neutral Unsatisfied VeryUnsatisfied
No Response
Satisfaction with TRS Interactions (2019)
Active Retiree

Benefits Handbook
22
▪ Active members rate Estimating Benefits and Decision to Retire topics higher in importance▪ Retirees rate Health Benefits topics higher in importance▪ Performance ratings are consistently higher for Retirees
76%
62%
42%36%
25%
9%
30%
13%
46%51%
29%
7%
0%
20%
40%
60%
80%
100%
Estimate Benefits Decide when toRetire
Understand Benefits Health Benefits Employment AfterRetirement
Service Credit
Importance of Topics
Active Retiree
69% 69% 68% 66% 64% 63%
79% 76% 75% 76% 74% 73%
0%
20%
40%
60%
80%
100%
Estimate Benefits Decide when toRetire
Understand Benefits Health Benefits Employment AfterRetirement
Service Credit
Performance in Providing Information
Active Retiree
Importance : If you were to refer to the Handbook, what would be most important (Choose top 3): e.g., Estimate benefits.
Performance: How well does TRS provide information on the following topics (percent Very Well or Well): e.g., Estimate benefits.
Note: Percent calculations exclude Neutral and No Response.

MyTRS
23
▪ Percent of Retirees reporting having visited MyTRS increased in 2020 relative to 2019
63%
37%
1%
63%
31%
5%
0%
20%
40%
60%
80%
Yes No No Response
Ever Visited MyTRS - Active
2019 2020
51% 48%
1%
57%
39%
4%0%
20%
40%
60%
80%
Yes No No Response
Ever Visited MyTRS - Retiree
2019 2020
Note: MyTRS is the online access portion of the TRS website. It allows members to update contact information, estimate retirement benefits, request a bill for reinstatement of withdrawn service, and register for a group benefit presentation.

MyTRS
24
▪ Members have not registered with MyTRS because they either have no reason to register, are not aware of MyTRS, or are not sure how to register
50%
29%
45%
7%
47%
33%
20%
3%0%
20%
40%
60%
80%
No reason to register atthis time
Not Aware of MyTRS Not sure how toregister
Do not have internetaccess
Reasons for Not Visiting MyTRS (Active)
2019 2020
63%
27% 23% 23%34%
28% 25%
9%
0%
20%
40%
60%
80%
No reason to register atthis time
Not Aware of MyTRS Not sure how to register Do not have internetaccess
Reasons for Not Visiting MyTRS (Retiree)
2019 2020

Health Insurance Benefits
25
▪ More Active and Retired members rating as Very Satisfied 2020▪ Decline in Unsatisfied rating in 2020
4%
44%
18%27%
7%0.4%
11%
36% 32%
11%7% 4.1%
0%
20%
40%
60%
80%
Very Satisfied Satisfied Neutral Unsatisfed VeryUnsatisfied
No Response
Overall Satisfaction with TRS-ActiveCare Services
2019 2020
10%
62%
7%18%
3% 0.0%
26%
49%
15%6% 3% 1.1%
0%
20%
40%
60%
80%
Very Satisfied Satisfied Neutral Unsatisfed VeryUnsatisfied
No Response
Overall Satisfaction with TRS-Care Services
2019 2020

Vendor Change Communication
26
▪ TRS-ActiveCare transitioned from Aetna to Blue Cross Blue Shield of Texas (BCBSTX) on September 1, 2020
▪ TRS-Care Standard transitioned from Aetna to BCBSTX on January 1, 2021
▪ TRS-Care Medicare Advantage transitioned from Humana to UnitedHealthcare on January 1, 2021
Results❖ Active Members satisfied with vendor change communication❖ Retirees less satisfied with vendor change communication
24%
49%
18%
6%2.1% 1.2%
14%
38%
25%
15%
4.3% 3.2%
0%
20%
40%
60%
Very Satisfied Satisfied Neutral Unsatisfied Very Unsatisfied No Response
Satisfaction with Vendor Change Communications
TRS-ActiveCare TRS-Care
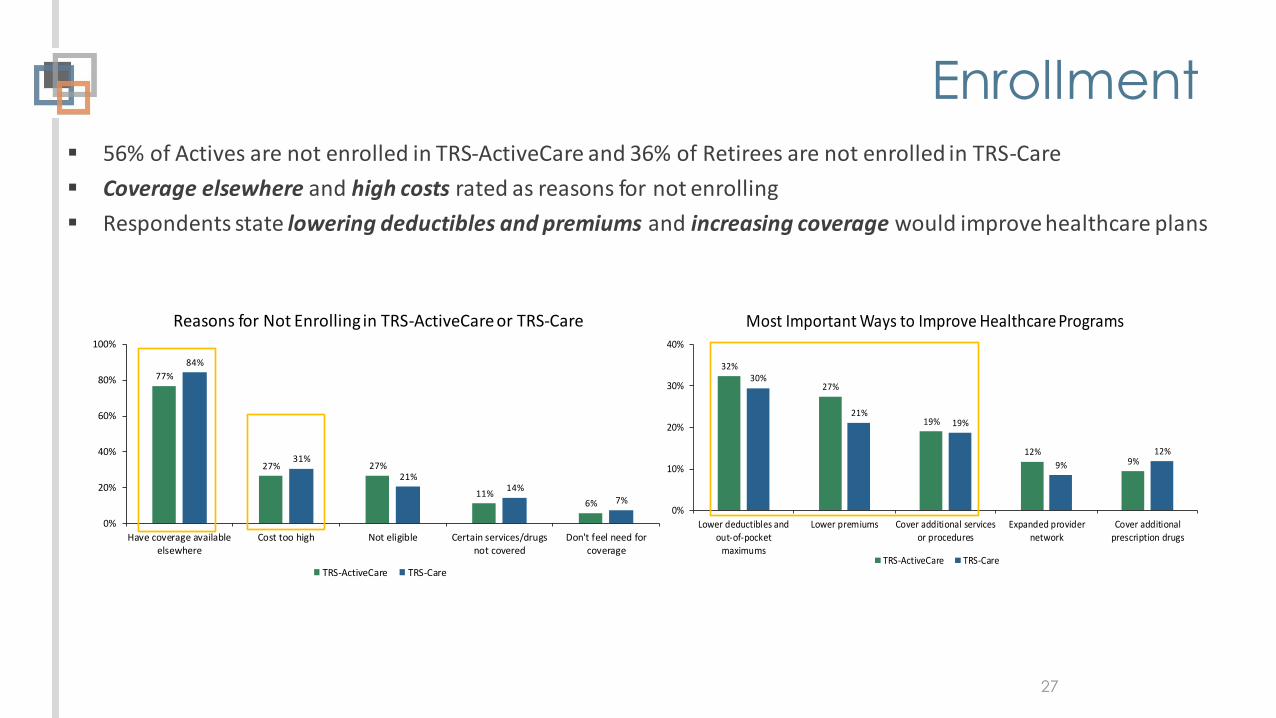
Enrollment
27
▪ 56% of Actives are not enrolled in TRS-ActiveCare and 36% of Retirees are not enrolled in TRS-Care▪ Coverage elsewhere and high costs rated as reasons for not enrolling▪ Respondents state lowering deductibles and premiums and increasing coverage would improve healthcare plans
77%
27% 27%
11%6%
84%
31%
21%14%
7%
0%
20%
40%
60%
80%
100%
Have coverage availableelsewhere
Cost too high Not eligible Certain services/drugsnot covered
Don't feel need forcoverage
Reasons for Not Enrolling in TRS-ActiveCare or TRS-Care
TRS-ActiveCare TRS-Care
32%
27%
19%
12%9%
30%
21%19%
9%12%
0%
10%
20%
30%
40%
Lower deductibles andout-of-pocket
maximums
Lower premiums Cover additional servicesor procedures
Expanded providernetwork
Cover additionalprescription drugs
Most Important Ways to Improve Healthcare Programs
TRS-ActiveCare TRS-Care

Retirement Estimates
28
▪ Retirement estimates do not currently include TRS-Care estimates
Results❖ 77% of Active Member respondents stated that it would be helpful to include the TRS-Care premium in
their retirement income estimate

Health Savings Accounts (HSAs)
29
▪ 32% of Active Members and 22% of Retirees stated they would participate in an HSA ▪ In 2019, 41% of Active Members and 32% of Retirees said they would participate
32%40%
28%
15%
71%
15%22%
49%
29%
10%
79%
12%
0%
20%
40%
60%
80%
100%
Yes No No Response Yes No No Response
If you could enroll in HSA as part of TRS healthcare, would you beinterested?
Would it change your decision if TRS provided assistance inchoosing an HSA and facilitated contributions to the HSA?
Health Savings Accounts
Active Retiree

Healthcare Resources
30
▪ All resources are highly rated for performance▪ Website is rated as the most important resource for obtaining information on healthcare programs
55%
38% 42% 42%
3%
20%
86% 88%78% 78% 79%
91%
0%
20%
40%
60%
80%
100%
Active Retired Active Retired Active Retired
Website Customer Service Line The Pulse
Rating of Healthcare Resources
Importance: Active Importance: Retiree Performance
Importance: Which of the following provides the greatest value to you: e.g., The Pulse
Performance: How satisfied are you with (percent Very Satisfied or Satisfied): TRS-ActiveCare/Care customer service line, website, The Pulse
Note: Percent calculations exclude Neutral and No Response.

Communications
31
▪ Active Member and Retiree 2020 Ratings for Information Relevance and Understandability declined between 2020 and 2019, with more respondents replying Neutral or No Answer
63%57%
62%56%
19% 16%22% 19%18%
26%15%
25%
1% 1% 0% 1%0%
20%
40%
60%
80%
100%
2019 2020 2019 2020
Information Provided is Relevant Information Provided is Easy to Understand
Active Member Rating of Information Provided by TRS
Agree Disagree Neutral No Response
80% 78%84%
76%
8% 8% 10% 9%11% 13%6%
15%
1% 1% 0% 1%0%
20%
40%
60%
80%
100%
2019 2020 2019 2020
Information Provided is Relevant Information Provided is Easy to Understand
Retiree Rating of Information Provided by TRS
Agree Disagree Neutral No Response

Publications
32
▪ Active Member Most Important Publications: Retirement Plans and Options, Retirement Planning, Actions that Impact my Retirement, Financial Health of the Pension Fund
▪ Retiree’s Most Important Publications: Healthcare Funds Financial Health, TRS Administrative Operations
Importance: How important is it for you to receive information on the following: e.g., Retirement Plans/Options
Note: Percent calculations exclude Neutral and No Response.
90% 87% 86%82% 83% 82%
78% 78%73%
67%
78% 81%
61%69%
63%
77%83%
79% 76%
85%
0%
20%
40%
60%
80%
100%
RetirementPlans/Options
RetirementPlanning
RetirementImpact
LegislativeUpdates
PensionFinancial Health
Health Plans HealthcareFunds Financial
Health
InvestmentPerformance
Board Actions Admin. Ops
Importance of TRS Publications
Active Retiree

Email Subscription
33
▪ Increase in subscribers in 2020▪ Majority of Active Members and Retirees that are not subscribed, not aware of email subscription service▪ Majority of members not subscribed to TRS emails stated that they were not aware of the service
40%
56%
4%
21%
78%
1%
46%37%
16% 15%
73%
11%
0%
20%
40%
60%
80%
100%
Yes No No Response Yes No No Response
Currently subscribed to the TRS email subscriptionservice
Aware that TRS offers an email subscription service
Email Subscription Service (Active)
2019 2020
43%55%
2%
37%
62%
0%
47%40%
13% 17%
73%
10%
0%
20%
40%
60%
80%
100%
Yes No No Response Yes No No Response
Currently subscribed to the TRS email subscriptionservice
Aware that TRS offers an email subscription service
Email Subscription Service (Retiree)
2019 2020
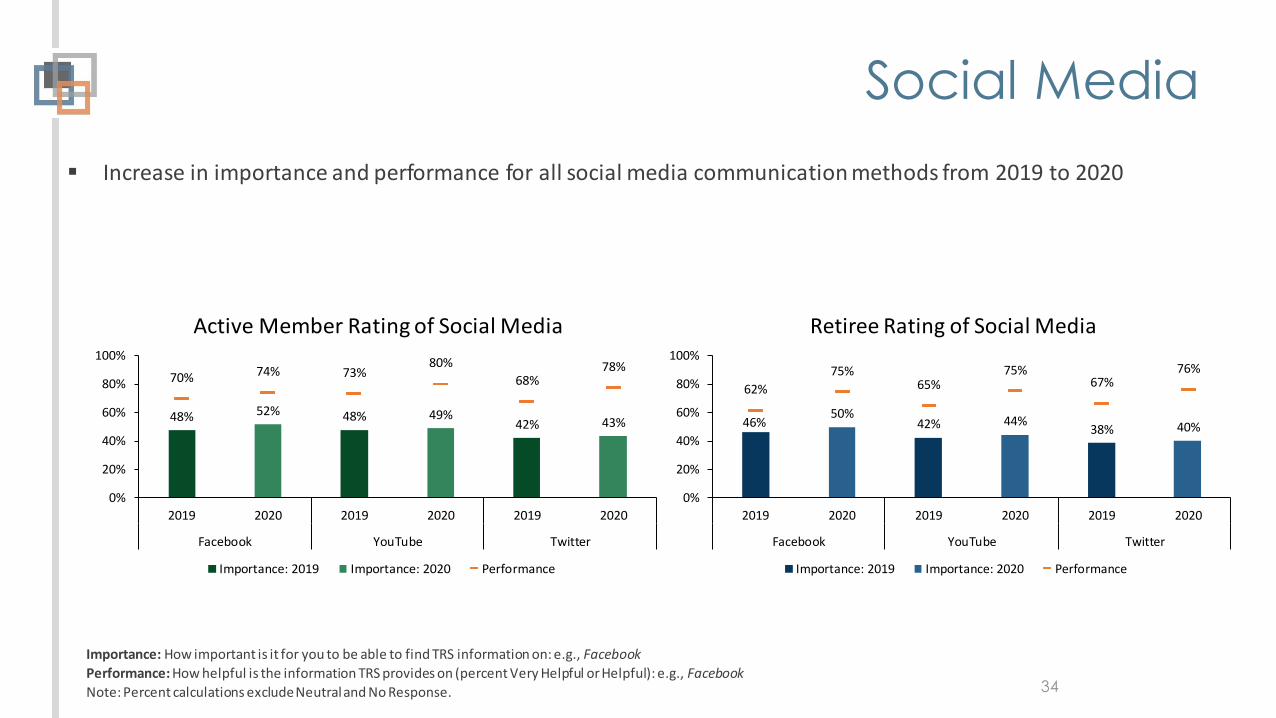
Social Media
34
▪ Increase in importance and performance for all social media communication methods from 2019 to 2020
Importance: How important is it for you to be able to find TRS information on: e.g., Facebook
Performance: How helpful is the information TRS provides on (percent Very Helpful or Helpful): e.g., Facebook
Note: Percent calculations exclude Neutral and No Response.
48% 48% 42%52% 49% 43%
70% 74% 73%80%
68%78%
0%
20%
40%
60%
80%
100%
2019 2020 2019 2020 2019 2020
Facebook YouTube Twitter
Active Member Rating of Social Media
Importance: 2019 Importance: 2020 Performance
46% 42% 38%50% 44% 40%
62%75%
65%75%
67%76%
0%
20%
40%
60%
80%
100%
2019 2020 2019 2020 2019 2020
Facebook YouTube Twitter
Retiree Rating of Social Media
Importance: 2019 Importance: 2020 Performance
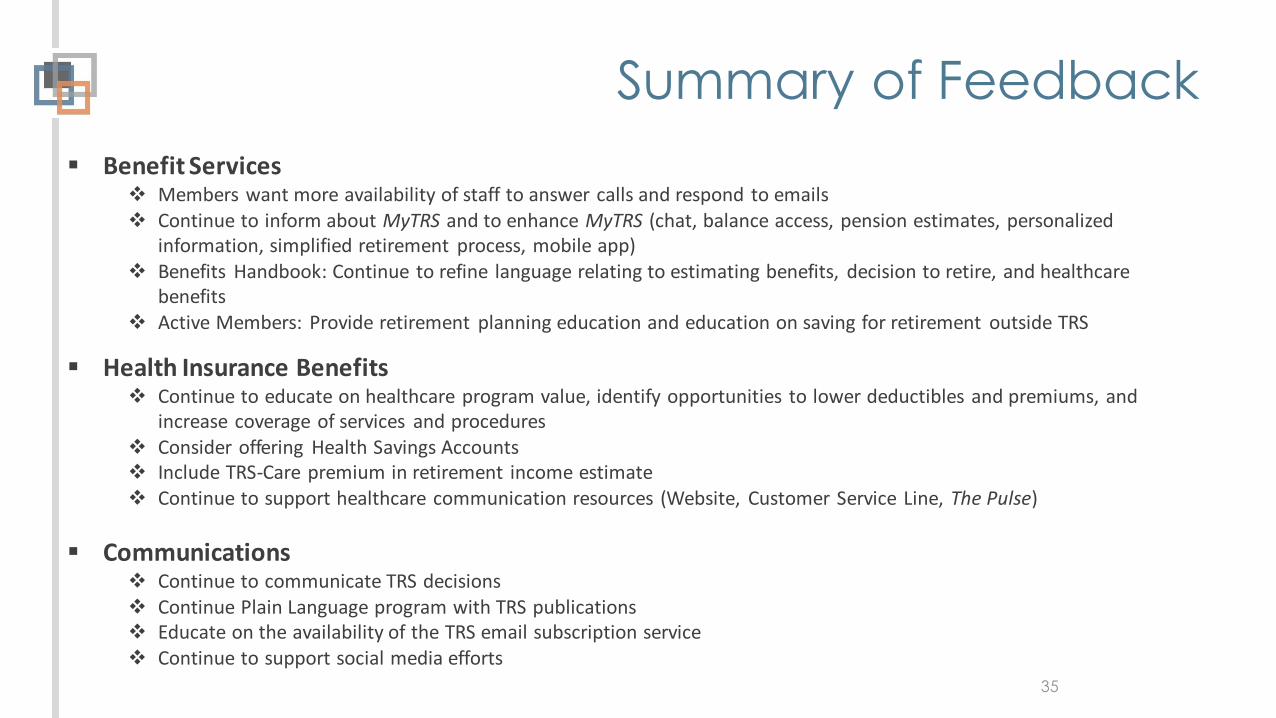
Summary of Feedback
35
▪ Benefit Services❖ Members want more availability of staff to answer calls and respond to emails❖ Continue to inform about MyTRS and to enhance MyTRS (chat, balance access, pension estimates, personalized
information, simplified retirement process, mobile app)❖ Benefits Handbook: Continue to refine language relating to estimating benefits, decision to retire, and healthcare
benefits❖ Active Members: Provide retirement planning education and education on saving for retirement outside TRS
▪ Health Insurance Benefits❖ Continue to educate on healthcare program value, identify opportunities to lower deductibles and premiums, and
increase coverage of services and procedures❖ Consider offering Health Savings Accounts❖ Include TRS-Care premium in retirement income estimate❖ Continue to support healthcare communication resources (Website, Customer Service Line, The Pulse)
▪ Communications❖ Continue to communicate TRS decisions❖ Continue Plain Language program with TRS publications❖ Educate on the availability of the TRS email subscription service❖ Continue to support social media efforts

Elite Research, LLC
Empowering researchers in nonprofit, academic, government, and business realms by educating and mentoring clients, providing research and editing expertise
1.800.806.5661 9901 E. Valley Ranch Pkwy, Suite 2035Irving, TX 75063
36

TAB 7

Presenter Name: Heather Traeger and Andrew RothFebruary 24, 2021
Complaints ProcessTeacher Retirement System of Texas

2
BACKGROUND
TRS is committed to achieving the highest levels of member satisfaction by delivering services consistent with our mission and in a manner that actively encourages honesty, integrity and ethical behavior among our employees.
Member communications, including routine questions, concerns, and complaints are received by knowledgeable TRS representatives who respond by telephone, letter, or email in a timely manner.

3
BACKGROUND
TRS Priority – Member Service, Member Communications, Member Satisfaction
Members, retirees, and employees may reach TRS through at least 10 pathways:
• Compact with Texans• Health and Insurance Benefits Member Ally Team• Member Services• TRS Comments (Contact Us weblink)• Governmental Relations• Appeals Processes• Hotline Process• SAO Process• Rule Revision Process• Calls and emails to TRS personnel (e.g., Privacy Officer,
CCO, CAE, Trustees, staff)
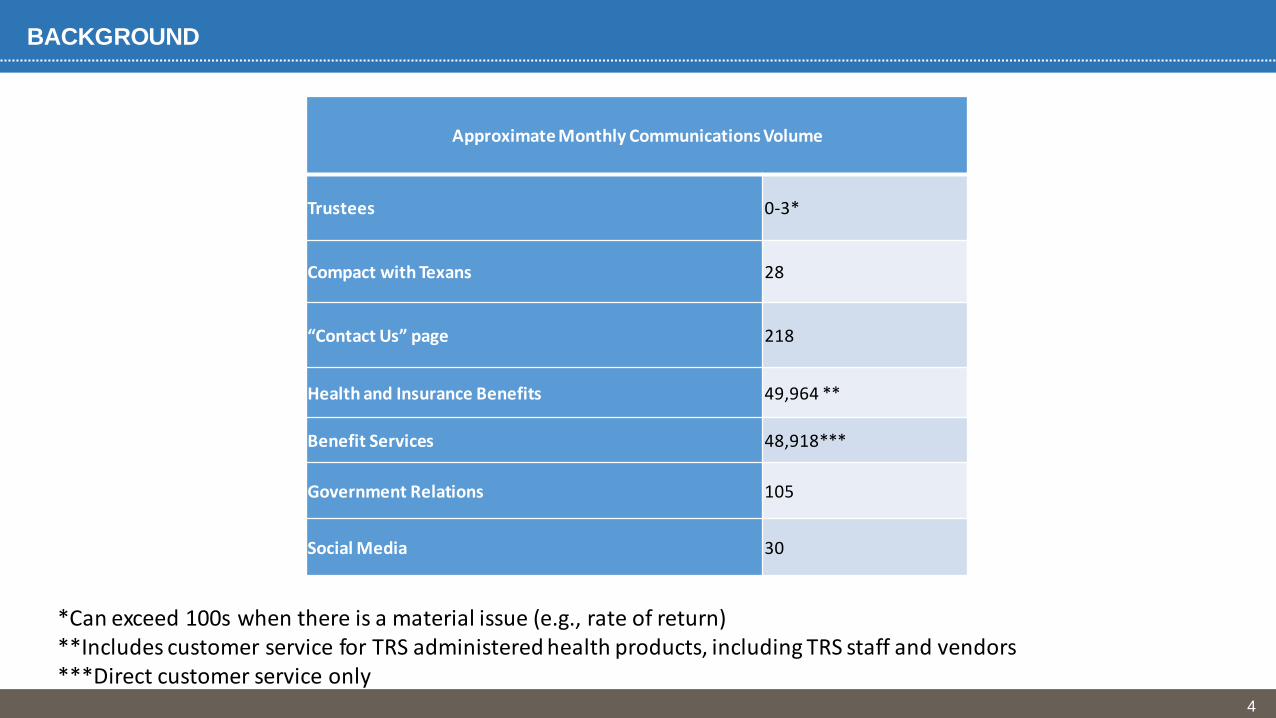
4
BACKGROUND
Approximate Monthly Communications Volume
Trustees 0-3*
Compact with Texans 28
“Contact Us” page 218
Health and Insurance Benefits 49,964 **
Benefit Services 48,918***
Government Relations 105
Social Media 30
*Can exceed 100s when there is a material issue (e.g., rate of return)**Includes customer service for TRS administered health products, including TRS staff and vendors***Direct customer service only

5
COMPLAINTS PROCESS
To streamline and refine its member responsiveness through existing communications channels, in 2020, TRS created a centralized Complaint Log.
Reports will be provided to TRS’ Executive Committee monthly; Reports will be provided to the Board quarterly in the Audit, Compliance and Ethics Committee
TRS member and retiree
communicationsComplaints Log
• Review interactions with members at executive and trustee levels
• Address trends in complaint categories
• Timeliness of responses• Escalation needs

6
DEFINITION OF “COMPLAINT”
Consistent with the Compact With Texans:
A complaint involves a dissatisfaction with TRS, a TRS employee, a TRS contractor, or actions (or inaction) in service that 1) TRS has authority to resolve and 2) requests or implies that TRS respond or take some action.
A complaint is distinguished from a general dissatisfaction with TRS regulations or events outside TRS’ purview or authority (e.g., the cost of Active Care premiums or statutory constraints for employment after retirement).

7
“COMPLAINTS” CATEGORIES
Quality of service provided (internal process failure)• Timeliness of response• Inappropriate responses from TRS employees:• Incorrect information provided/entered• Disclosure errors• Self-Service applicationsObservation/report of improper conduct (conduct inconsistent with TRS ethics policies) by TRS, TRS employee or TRS
contractor
• Inappropriate behavior in front of members• Inappropriate behavior in front of staff• Inappropriate behavior when employees are representing TRS at a function such as presentations, conferences, training
sessions, conventions any place where they are working in a TRS employee capacityReporting Employers Customer Service• Untimely Responses• Incorrect Information• Inappropriate behavior via phone or email of coach to employer• TRS implementation ChallengesReporting Employers• Penalty Interest (depends on situation)• Security measures such as encrypted emails with member information
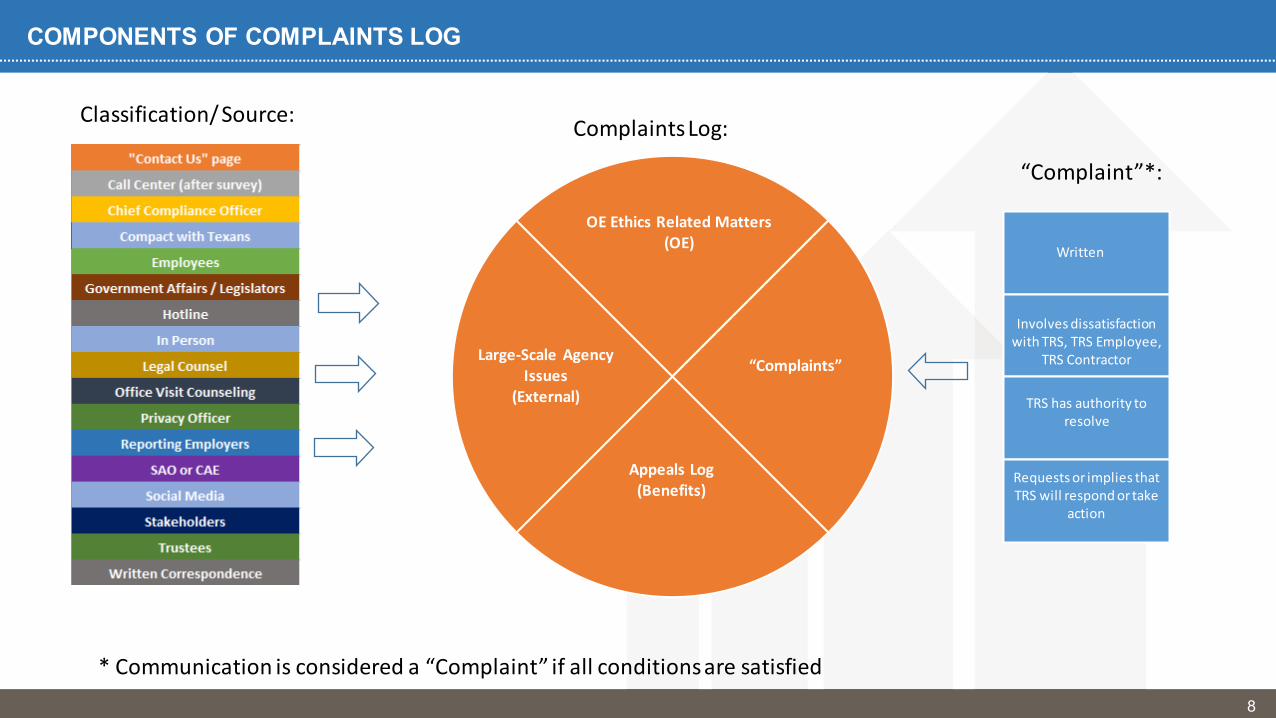
8
COMPONENTS OF COMPLAINTS LOG
* Communication is considered a “Complaint” if all conditions are satisfied
Appeals Log (Benefits)
Large-Scale Agency Issues
(External)
OE Ethics Related Matters (OE) Written
Involves dissatisfaction with TRS, TRS Employee,
TRS Contractor
TRS has authority to resolve
Requests or implies that TRS will respond or take
action
“Complaints”
“Complaint”*:
Complaints Log:Classification/ Source:

9
COMPLAINTS RESOLUTION
Communication Received by the Departments
Department Liaison
confirms that communication
qualifies as a Complaint
Complaint?
Response sent to the Complainant via secure email, phone
call or letter
Response sent to the Inquirer via secure email,
phone call or letter
Resolved
Yes
Follow up needed?
No
Follow up communication sent to the Complainant
NoResponse needed?
Yes No
Yes
REPORTING

10
“COMPLAINTS” REPORTING
Example of the Quarterly Complaints Report to BoardMonthly Complaints Received – 34
Category Oct-20 Nov-20 Dec-20 Outstanding – 2
Appeals Log 8 10 7
OE Ethics Related Matters N/A N/A N/A
Large-Scale Agency Issues N/A N/A N/A
Point-in-Time Complaints
# Date Received Department Source Complaint Category Complainant Brief Statement of ComplaintResponse Provided
Resolution Date
1 10/15/2020 Gov. Relations Written Correspondence (Trustees) Other: LTF Member Dissatisfaction with TRS LTF strategy. Yes 10/16/2020
2 10/27/2020 Benefit Services Compact with Texans Quality of Service Provided: Timeliness of response Beneficiary Delay in receiving claim information. Yes 10/28/2020
3 10/27/2020 Gov. Relations Government Affairs/Legislators Other: EAR surcharges Beneficiary Questions regarding surcharges. Yes 10/28/2020
4 10/27/2020 Benefit Services Written Correspondence Quality of Service Provided: Timeliness of response Beneficiary Delay in processing of death claim payment. Yes 10/28/2020
5 10/30/2020 Gov. Relations Government Affairs/Legislators Other: TRS-Care MA contract negotiations Member
Dissatisfaction with TRS healthcareYes 10/30/2020
6 12/1/2020 HIB Compact with Texans Quality of Service Provided: Incorrect information provided Member Dissatisfaction with the outcome of the call
and treatment. Yes 12/2/2020
7 12/12/2020 HIB Written Correspondence (Trustees)
Quality of Service Provided; Self-Service applications - lack of needed functionality Member Cancellation of the health insurance coverage
without notice; Direct deposit issue. Yes 1/8/2021
8 12/14/2020 L&C Hotline/Ethicspoint Report of improper conduct by TRS employee Employee Allegation of retaliation against TRS employee. TBD TBD
9 12/19/2020 L&C Hotline/Ethicspoint Other: Fraud Anonymous Allegation of fraud. TBD TBD

11
Appendix

12
COMPLAINT TYPES
Monthly Complaints
Monthly Complaints are classified by entire categories of communications, such as appeals. As with other Complaints, only those communications satisfying the definition will be reported. These Complaints are generally reported to TRS Compliance on a monthly basis, but could be more frequently, for inclusion in the Complaints Log.
Point-in-Time Complaints
Point-in-time Complaints are reported on a rolling basis at the time they are made to TRS; they are classified into a number of categories and subcategories.
Quality of Service Provided (internal process failure)Observation/Report of Improper Conduct (conduct inconsistent with TRS ethics policies) by TRS, TRS employee or TRS contractorReporting Employers Customer Service Reporting Employers (e.g., penalty interest, late report, security measures such as encrypted emails with member information)

TAB 8

Amanda Jenami, CPA, CIA, CIDA, CISA, CFSA, CFE, CRMA, CGAP, CCSA, MBAFebruary 2021
GOVERNANCE AND RISK MANAGEMENT TRAININGT each er Retirem ent System of T exas

Teachable Moments of the Last DecadeT h e Big g est C orporate Scandalsof th e 2010s
2

Reference Materials
G uiding P rinciples of C orporate G overnance

Reference Materials: The Guiding Principles of Corporate Governance
Core actions and responsibilities th at prom ote:• Successf ul• Eth ical• Sustainab le corporate g overnance
A few examples:# 4 M aintain sustainab le strateg y f ocused on long term perf orm ance and value.# 5 Ensure com pany culture is h ealth y.# 6 Receive tim ely, com plete, relevant, & accurate inf orm ation.
8 Principles:

Reference Materials: The Three Lines of Defense Model

The Three Lines of Defense: Illustrated
6
1st LOD: Texans’ Defensive Lineman JJ Watt 2nd LOD: Ravens’ Linebacker Ray Lewis 3rd LOD: Ravens’ Safety Earl Thomas

Background
Section 1. Case Studies
a) V olk sw ag en Em issions Scandal
b ) W ells F arg o A ccount F raud
c) Eq uif ax Data Breach
d) Boeing 737 M ax Back -to-Back C rash es
Section 2: Top Risks of 2021

The Biggest Corporate Scandals of the 2010s: Volkswagen Emissions Scandal
SCANDAL: VOLKSWAGEN EMISSIONSV W ordered to recall 482,000diesel cars sold in th e U S.V W m odels w ere em itting up to 40times m ore toxic f um es th anperm itted.• illegal em issions b ypassing
sof tw are.• 11 million vehicles
SEPTEMBER 18, 2015

The Biggest Corporate Scandals of the 2010s: Volkswagen’s “Dieselgate”
CAUSESCAUSES
Causes• A utocratic leadersh ip• W anted world #1 autom ak er• T h e “ C lean Diesel” strateg y did not w ork • Eth ics took a b ack seat • Eng ineers installed cheating software• I nappropriate ‘ T one at th e T op’ • C om pliance f unction f ailed • I nternal A udit late to th e party• Board of sh areh olders/w ork er
representatives
• V W adm itted to ch eating• C EO f orced to resig n; ch arg ed w ith f raud• 10 managers ch arg ed w ith fraud, false
certification, aiding and abetting, etc.• V W paid $47B in f ines and recall costs• Sh are price took a dive (37%)• 3-year prob ation• L ost w orld # 1 spot• V W b rand plum m eted
THE CONSEQUENCES
37%) STOCK DECLINE
-37%
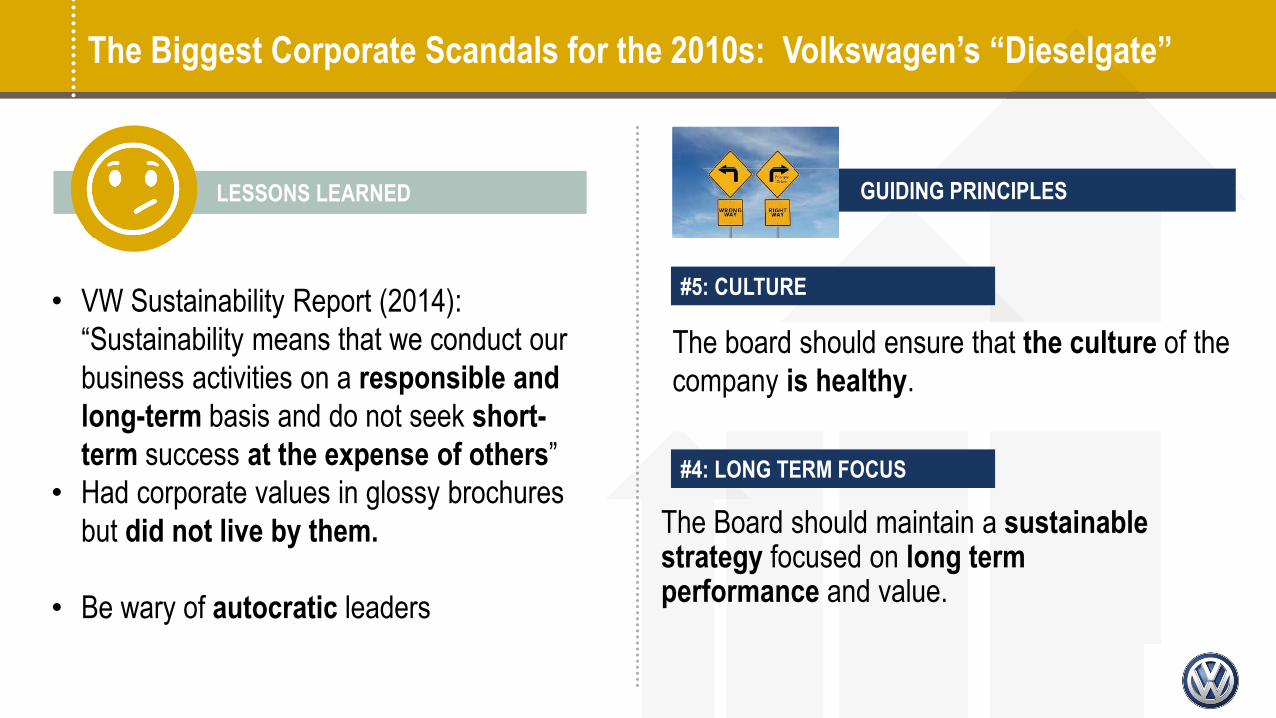
The Biggest Corporate Scandals for the 2010s: Volkswagen’s “Dieselgate”
LESSONS LEARNED
• V W Sustainab ility Report (2014): “ Sustainab ility m eans th at w e conduct our b usiness activities on a responsible and long-term b asis and do not seek short-term success at the expense of others”
• H ad corporate values in g lossy b roch ures b ut did not live by them.
• Be w ary of autocratic leaders
T h e b oard sh ould ensure th at the culture of th e com pany is healthy.
GUIDING PRINCIPLES
#5: CULTURE
#4: LONG TERM FOCUS
T h e Board sh ould m aintain a sustainable strategy f ocused on long term performance and value.

The Biggest Corporate Scandals of the 2010s: Wells Fargo Account Fraud
SCANDAL: WELLS FARGO ACCOUNT FRAUDW F em ployees opened m ore th an 2 million unauthorized deposit and credit card accounts
SEPTEMBER 8, 2016

The Biggest Corporate Scandals of the 2010s: Wells Fargo Account Fraud
CAUSES
• ‘T h e k ing of cross-sell’• Em ployees w ere ‘ G oing f or G r-8’• System ic issue• H otline com plaints w ere not addressed• W h istleb low er retaliation• I nternal A udit f ailed to respond to
num erous w arning sig ns• A ll th ree lines of def ense f ailed • I nef f ective Board oversig h t
THE CONSEQUENCES
• C EO retired, forfeited $ 41 m illion in eq uity aw ards; fined $17.5 million & b anned
• 8 other executives charged (including C h ief A uditor, A udit Director, G C , Risk O f f icer)
• O ver $3 billion in penalties • O ver 5,300 em ployees f ired• T h e BBB revok ed accreditation
STOCK DECLINE
-14%

Wells Fargo Account Fraud: Where was Internal Audit?
See nothing, hear nothing, say nothing?
Everybody knew there was fraud going on, and the people trying to flag it were the ones who got in trouble,” said a former branch manager in Scottsdale, Ariz .
PressureEm ployees w ere b erated and/or f ired f or not m eeting targ etsOpportunityEm ployees k new h ow to com m it th e f raudRationalizationJustif ication: Everyone else is doing it.
Red Flags:• 700 Eth ics H otline C om plaints• Security: ‘ Spik e in sales integ rity
m atters. ’ (July 2012)

The Biggest Corporate Scandals of the 2010s: Well Fargo Account Fraud
• W h at g ets measured, g ets done• F ocus on custom er service• A lig n K P I s, incentive com pensation plans w ith
L T g oals
LESSONS LEARNED PRINCIPLE #4: LONG TERM PERFORMANCE
T h e b oard sh ould ensure th at th e com panym aintains a sustainab le strateg y f ocused onlong-term performance and value. T h isincludes:• Evaluating risk s, including reputational
risks, and seeking to balance risk andreward af ter considering all relevantstakeholders .

The Biggest Corporate Scandals of the 2010s: Equifax Data Breach
SCANDAL: EQUIFAX DATA BREACHSEPTEMBER 7, 2017
Eq uif ax announced th at a h ack er h adg ained access to th e inf orm ation of up to143 million Americans including :• N am es, DO Bs• addresses • credit card num b ers• Social Security numbers

Equifax Breach Timeline
Date Event
3/8/2017 T h e U . S. C ERT sends Eq uif ax and oth ers a notice to patch a vulnerab ility in A pach e Struts3/9/2017 Eq uif ax dissem inates U . S. C ERT notif ication internally to I T personnel3/15/2017 Eq uif ax I nf orm ation Security departm ent scans system s f or th e vulnerab ility. F inds none.
5/13 – 7/30/17 T h e h ack ers g ain entry and access P I I inf orm ation. Security scans do not detect activity.
7/29 – 7/30/17 I nf orm ation Security ob serves suspicious activity. T ak es th e portal of f line
7/31/2017 C I O verb ally notif ies C EO of ‘ suspicious activity. ’8/1-8/2/2017 T h ree executives sell th eir Eq uif ax sh ares (total of $ 1. 8 m illion)8/15/2017 C EO is notif ied of b reach8/22/2017 T h e Board is notif ied of b reach9/7/2017 Eq uif ax announces b reach9/15/2017 C I O and C SO resig n9/26/2017 C EO Rich ard Sm ith retires af ter 12 years

The Biggest Corporate Scandals of the 2010s: Equifax Data Breach
• A $ 575 m illion settlem ent to h elp victim s• C onsum ers incensed b y th e ‘ b otch ed’
response• C EO retired• I nsider trading f ines • Sh are price plum m eted• I ndictm ents: 2/11/2020
THE CONSEQUENCES
STOCK DECLINE
-35%
CAUSES
P oor data g overnance:• K now n vulnerab ility th at w as unpatch ed. • Eq uif ax’ s unseg m ented netw ork .• A dm inistrative passw ords stored in plain text. • A ttack ers undetected due to an expired th ird-party
certif ication.I nadeq uate I T audit coverag eA ll th ree lines of def ense f ailedBoard: I nadeq uate oversig h t of inf orm ation security

The Biggest Corporate Scandals of the 2010s: Equifax Data Breach
GUIDING PRINCIPLE # 6 : BOARD INFORMATIONLESSONS LEARNED
• P ractice g ood data g overnance• Ensure netw ork is seg m ented• Ensure th ird party certif ication is current• M aintain adeq uate I T audit coverag e• Respond w ith speed, transparency, integ rity
& vig or• N otif y C EO and Board im m ediately; • Disclose to th e pub lic in a tim ely m anner
T h e b oard sh ould ensure th at structures and practices exist and are w ell-g overned so th at it receives timely, complete, relevant, accurate, and reliable information to perf orm its oversig h t ef f ectively.
B oards should have adeq uate access to cybersecurity ex p ertise, and discussions about cyber- risk m anagem ent should be given regular and adeq uate tim e on the board m eeting agenda.
THE CONSEQUENCES

The Biggest Corporate Scandals of the 2010s: Boeing 737 Max
SCANDAL: BOEING 737 MAX PLANE CRASHES• O n Oct. 29, 2018, a Lion Air
f lig h t crash ed just momentsafter takeoff, killing all 189people on b oard.
• O n March 10, 2019 , anEthiopian Airlines f lig h tcrash ed shortly after takeoff,killing all 157 people on b oard.
OCTOBER 2018-MARCH 2019

The Biggest Corporate Scandals of the 2010s: Boeing 737 Max
• 346 people lost th eir lives• C EO f orced to resig n • P lane g rounded: cost m ore th an $1B• $9 billion in custom er com pensation costs• $500M settlement w ith victim f am ilies• Boeing ch arg ed w ith fraud conspiracy• F ined $2.5 billion• F A A oversig h t leg islation
THE CONSEQUENCES
STOCK DECLINE
-22%
CAUSES
Control Breakdowns at Boeing• Saf ety culture
• A nti-stall sof tw are• P rioritiz ed prof its and speed of delivery over q uality &
saf ety• Bipartisan I nvestig ation
• F ailed desig n & developm ent • ‘ O perated w ith in a culture of concealm ent
• I nef f ective Board oversig h t (C EO & C h air)• Sh areh older law suit ag ainst th e Board (F eb 2021)
Oversight Control Breakdowns (@ FAA)• N o perm anent top F A A of f icial f or 14 m onth s• N ew F A A C h ief ack now ledg ed m istak es• C eded m aj or certif ication responsib ilities to Boeing• Bipartisan I nvestig ation: F A A f ailed in its oversig h t and
certif ication

The Biggest Corporate Scandals of the 2010s: Boeing 737 Max
LESSONS LEARNED
• W h en th e risk of f ailure is catastroph ic, no sh ortcuts.
• P ractice g ood crisis m anag em ent: tak e responsib ility
• T h ird party certif ication process is crucial
M aintain a sustainable strategy f ocused on long-term perf orm ance and value. T h is includes:Evaluating risk s, including reputational risk s, and seeking to balance risk and reward af ter considering all relevant stakeholders.
GUIDING PRINCIPLE #4: LONG TERM PERSPECTIVE

Top Risks for 2021

Top Risks of 2021: Introduction
Qualitative Interviews:• 30 Board m em b ers• 90 Dif f erent O rg aniz ations• 30 C -suite executives• 30 C h ief A udit Executives
A Quantitative Survey of CAEs• 384 responses
Risk:K now ledg eO rg aniz ational C apab ilityRelevance

1. Business Continuity/ Crisis Response2. Cybersecurity3. Talent Management4. Culture5. Organizational Governance6. Disruptive Innovation7. Data Governance8. Board Information9. Third Party Risks10. Economic and Political Volatility11. Sustainability
Top Risks of 2021

2021 Risk Ratings – All Respondents
T alent m anag em ent and disruptive innovation em erg e as clear areas f or im provem ent
100%
90% Capability
80%
70% Knowledge
60%
50% Relevance
40%
30%
20%
ONRISK 2021 RISK RATINGS – ALL RESPONDENTS
Source:O n R i s k 2 0 2 1 q u a l i t a t i v e s u r v e y . n = 9 0 .
10%
s u v e y . n 9 0 .

Average Ratings by Respondent Group
AV ERAGE RATIN GS B Y RESP O N D EN TGRO UP
Source:OnRisk 2021 q ualitativesurvey. n = 90.
(i) M anag em ent’ s perceptions on risk relevance are g enerally not alig ned w ith th ose of Boards and C A Es;(ii) P erceptions on capab ility to m anag e risk s are m ore alig ned

Business Continuity/Crisis Management - Survey Results & Proposed Actions
AV ERAGE RATIN GS B Y RESP O N D EN TGRO UP
Source:OnRisk 2021 q ualitativesurvey. n = 90.
87%50%60% 50% 60% 93% 43% 62%47%
C-SUITE
• L everag e experiences of th e g lob al pandem ic to identif y org aniz ational streng th s and opportunities f or im provem ent.
• W ork collab oratively to im plem ent im provem ents w h ere necessary.
CAE
• L everag e experiences of th e g lob al pandem ic to identif y org aniz ational streng th s and opportunities f or im provem ent.
• W ork collab oratively to im plem ent im provem ents w h ere necessary.
BOARD
• L everag e experiences of th e g lob al pandem ic to identif y org aniz ational streng th s and opportunities f or im provem ent.
• W ork collab oratively to im plem ent im provem ents w h ere necessary.

Cybersecurity Risk: Survey Results & Proposed Actions
C-SUITEBOARD
PROPOSED ACTIONS:• C onsistently evaluate em erg ing cyb er th reats • G et com plete perspectives on current status• H ave b oard/m anag em ent discussions of w h ich risk s to
avoid, accept, m itig ate or transf er. • Develop specif ic risk m anag em ent plans.
PROPOSED ACTIONS:• U nderstand leg al im plications of cyb er risk s• Ensure appropriate tim e is allocated f or m anag em ent, I A ,
and outside SM Es to b rief Board m em b ers on emerging cyber threats, organizational efforts, and existing vulnerabilities.
CAE
PROPOSED ACTIONS:• P erf orm routine evaluations of RM f unctions related to
cyb ersecurity• I dentif y opportunities to educate m anag em ent and th e Board on
emerging cyber risks
AV ERAGE RATIN GS B Y RESP O N D EN T GRO UP
Source:OnRisk 2021 q ualitative survey. n = 90.
79%23%40% 50% 43% 90% 47% 23% 72%

Talent Management: Survey Results & Proposed Actions
C-SUITEBOARD
PROPOSED ACTIONS:• Evolve th e com petencies th at are m ost in dem and• C onsider adaptab ility and f lexib ility sk ills• F ocus on succession planning , upsk illing strateg ies,
and recruitm ent.
PROPOSED ACTIONS:• C ontinue to ensure th at m anag em ent is com m itted
to m anag ing talent at all levels of th e org aniz ation • O b tain consistent b rief ing s on talent-related
processes and initiatives
PROPOSED ACTIONS:• P rovide assurance around talent m anag em ent• M aintain open lines of com m unication reg arding Board
perspectives of k ey areas of talent f ocus
CAEAV ERAGE RATIN GS B Y RESP O N D EN T GRO UP
Source:OnRisk 2021 q ualitative survey. n = 90.
82%53%27% 37% 30% 78% 27% 40% 67%

Culture: Survey Results and Proposed Actions
AV ERAGE RATIN GS B Y RESP O N D EN TGRO UP
Source:OnRisk 2021 q ualitativesurvey. n = 90.
83%73%50% 47% 67% 73% 37% 60% 67%
C-SUITE
PROPOSED ACTIONS:• A ct in a m anner th at prom otes an ef f ective culture.• Estab lish consistent processes to g aug e th e culture
and com m unicate th ose perceptions to th e b oard tim ely.
CAE
PROPOSED ACTIONS:• C onsider perf orm ing eng ag em ents th at provide an ob j ective
assessm ent of org aniz ational culture. • P rovide assurance th at m anag em ent’ s actions are alig ned w ith
leading practices related to org aniz ational culture.
BOARD
PROPOSED ACTIONS:• Review assessm ents of org aniz ational culture w ith
th e internal audit f unction and m anag em ent. • Ensure executive g oals and incentives are alig ned
w ith an ef f ective org aniz ational culture.

Top Risks: How does this apply to TRS?
Cybersecurity:• Ensure appropriate talent/ staf f ing levels• C onsider cyb ersecurity insurance• Board b rief ing s on cyb ersecurity • Enh ance audit coverag e: I nf orm ation Security;
V ulnerab ility A ssessm ent; T h ird P arty Risk s Talent Management• A ustin Job M ark et
• A pple; F aceb ook ;• G oog le; O racle; • T esla
• W ork to rem ain T op W ork place• P rom ote Em ployee V alue P roposition• L eg islature’ s f ocus on m em b er service
Culture:• I m plem entation of DEI prog ram• Diversity now one of th e core values• Board b rief ing s on DEI initiatives• C ulture A udit (2018)• P eriodic culture/ core values ref resh

Closing Statement & Questions

APPENDICES
APPENDICES

APPENDIX 1A: Third Party Risk: Survey Results & Proposed Actions
C-SUITEBOARD
PROPOSED ACTIONS:• M aintain a com preh ensive list of th ird-party arrang em ents• Develop risk -b ased approach f or procuring and m onitoring
relationsh ips
PROPOSED ACTIONS:• Evaluate internal audit plans to ensure th at adeq uate
resources are allocated to th ird-party risk s. • Req uest periodic status updates on k ey th ird-party
relationsh ips.
CAE
PROPOSED ACTIONS:• Reg ularly m onitor procurem ent and m onitoring processes• I nclude eng ag em ents to review th ird-party relationsh ips th at
are operationally or strateg ically im portant.
AV ERAGE RATIN GS B Y RESP O N D EN TGRO UP
Source:OnRisk 2021 q ualitativesurvey. n = 90.
78%67%53% 43% 50% 64% 61% 61% 50%

APPENDIX IB: Board Information - Survey Results & Proposed Actions
C-SUITEBO A RD
ACTIONS:• Ensure transparent, com plete, and tim ely inf orm ation is
provided to th e b oard, particularly reg arding k ey risk s
ACTIONS:• Set expectations w ith m anag em ent and C A Es ab out
th e level of inf orm ation to b e provided. • Be w illing to com m unicate if excessive am ounts of
inf orm ation overw h elm clear m essag ing . • Seek independent assurance related to th e q uality of
inf orm ation provided. CAE
ACTIONS:• Evaluate inf orm ation provided to th e b oard, noting
inconsistencies or om issions. • I nq uire w ith b oard m em b ers ab out th e q uality of inf orm ation b eing
provided and b e w illing to contrib ute an ob j ective.
AV ERAGE RATIN GS B Y RESP O N D EN TGRO UP
Source:OnRisk 2021 q ualitativesurvey. n = 90.
80%77%60% 59% 48% 67% 61% 61% 50%

APPENDIX 1C: Disruptive Innovation - Survey Results & Proposed Actions
C-SUITEBO A RD
ACTIONS:• L everag e th e k now ledg e of b oard m em b ers to identif y
w ays to innovate and identif y com petitors’ attem pts to disrupt b usiness as usual.
ACTIONS:• Sh are w ith th e org aniz ation any g uidance and w isdom
accum ulated th roug h outside and diverse experiences. • Set expectations f or m anag em ent to provide proactive
strateg ies th at leverag e innovation f or com petitive advantag e and to b e prepared to react tim ely to disruption.
CAE
ACTIONS:• Ensure a th oroug h understanding of strateg ic risk s and
opportunities to leverag e innovation to b e disruptive • I dentif y potential risk s th at could inh ib it org aniz ations’ strateg ies
to innovate and disrupt
AV ERAGE RATIN GS B Y RESP O N D EN TGRO UP
Source:OnRisk 2021 q ualitativesurvey. n = 90.
68%43%33% 37% 33% 74% 20% 33% 60%

APPENDIX 1D: Organizational Governance - Survey Results & Proposed Actions
C-SUITEBO A RD
ACTIONS:• A lig n w ith th e Board on th e relevance of org aniz ational
g overnance• M aintain h ealth y dialog ue around risk m anag em ent and ll
k ey g overnance roles
ACTIONS:• Ensure th at senior m anag em ent understands and ag rees
upon org aniz ational g overnance as a priority f or ach ieving org aniz ational ob j ectives.
CAE
ACTIONS:• M aintain a consistent line of com m unication w ith b oard m em b ers
to ensure th eir needs are b eing m et.
AV ERAGE RATIN GS B Y RESP O N D EN TGRO UP
Source:OnRisk 2021 q ualitativesurvey. n = 90.
80%67%57% 50% 67% 84% 60% 73% 53%

APPENDIX 1E: Data Governance - Survey Results & Proposed Actions
C-SUITEBOARD
ACTIONS:• Drive leading practices in data g overnance th at ensure
com pliance w ith law s and reg ulations as w ell as prog ress tow ard m eeting strateg ic ob j ectives.
ACTIONS:• Expect education on k ey aspects of data g overnance and
req uest b rief ing s f rom m anag em ent and internal audit on h ow th e org aniz ation strateg ically m anag es data.
CAE
ACTIONS:• P rovide training to b oard m em b ers on th e k ey aspects of data
g overnance and provide assurance th at m anag em ent practices are leading edg e.
AV ERAGE RATIN GS B Y RESP O N D EN TGRO UP
Source:OnRisk 2021 q ualitativesurvey. n = 90.
70%37%43% 47% 43% 73% 43% 50% 60%

APPENDIX 1F: Sustainability - Survey Results & Proposed Actions
C-SUITEBO A RD
ACTIONS:• Recog niz e sustainab ility’ s g row ing im portance to
org aniz ational stak eh olders, including custom ers, em ployees, and investors.
• I dentif y opportunities to enh ance long -term stak eh older value b y em b racing sustainab ility leadersh ip as a strateg ic opportunity.
ACTIONS:• Req uire m anag em ent to b uild sustainab ility into strateg ic
plans. • Set expectations of internal auditors to provide assurance
related to voluntary sustainab ility reporting .
CAE
ACTIONS:• Educate internal audit team s ab out em erg ing risk s related to
sustainab ility and h ow sustainab ility f its into org aniz ations’ operational and strateg ic priorities.
AV ERAGE RATIN GS B Y RESP O N D EN TGRO UP
Source:OnRisk 2021 q ualitativesurvey. n = 90.
50%33%37% 40% 10% 50% 30% 30% 43%

APPENDIX 1G: Economic and Political Volatility - Survey Results & Proposed Actions
C-SUITEBOARD
ACTIONS:• Build conting encies and scenario plans f or dealing w ith
potential outcom es. • C om m unicate w ith th e b oard ab out th e potential upsides
and dow nsides of political ch ang es and econom ic sw ing s
ACTIONS:• Eng ag e m anag em ent and internal auditors in
discussions reg arding potential econom ic and political outcom es and inq uire ab out th e readiness of org aniz ations to b e f lexib le.
CAE
ACTIONS:• Better educate internal auditors on h ow econom ic and political
uncertainities m ay af f ect th e lik elih ood of ach ieving org aniz ational ob j ectives.
AV ERAGE RATIN GS B Y RESP O N D EN T GRO UP
Source:OnRisk 2021 q ualitative survey. n = 90.
72%53%47% 40% 33% 72% 37% 40% 43%

Assurance Insights 2020 and 2021

APPENDIX 2: Top Risks 2021 – Definitions (I)
• CY B ERSECURITY : The growing sophistication and variety of cyberattacks continue to wreak havoc on organizations’ brands and reputations, often resulting in disastrous financial impacts. This risk examines whether organizations are sufficiently prepared to manage cyber threats that could cause disruption and reputational harm.
• TH IRD PARTY : For an organization to be successful, it has to maintain healthy and fruitful relationships with its external business partnerships and vendors. This risk examines organizations’ abilities to select and monitor third-party relationships.
• B OARD INFORMATION: As regulators, investors, and the public demand stronger board oversight, boards place greater reliance on the information they are provided for decision-making. This risk examines whether boards feel confident that they are receiving complete, timely, transparent, accurate, and relevant information.
• SUSTAINAB ILITY : The growth of environmental, social, and governance (ESG) awareness increasingly influences organizational decision-making. This risk examines organizations’ abilities to establish strategies to address long-term sustainability issues.
• DISRUPTIVE INNOVATION: We are in an era of innovative business models, fueled by disruptive technologies. This risk examines whether organizations are prepared to adapt to and/or capitalize on disruption.

APPENDIX 2: Top Risks 2021 – Definitions (II)
• ECONOMIC AND POLITICAL VOLATILITY : National elections, multinational trade agreements, new or extended protectionary tariffs, and uncertainty around timing of routine macroeconomic cycles all create volatility in the markets in which organizations operate. This risk examines the challenges and uncertainties organizations face in a dynamic and potentially volatile economic and political environment.
• ORGANIZ ATIONAL GOVERNANCE: Governance encompasses all aspects of how an organization is directed and managed: the system of rules, practices, processes, and controls by which it operates. This risk examines whether organizations’ governance assists or hinders achievement of objectives.
• DATA GOVERNANCE: Organizations’ reliance on data is expanding exponentially, complicated by advances in technology and changes in regulations. This risk examines organizations’ overall strategic management of data: its collection, use, storage, security, and disposition.
• TALENT MANAGEMENT: A growing gig economy, dynamic labor conditions, and the continuing impact of digitalization are redefining how work gets done. This risk examines challenges organizations face in identifying, acquiring, upskilling, and retaining the right talent to achieve their objectives.
• CULTURE: “The way things get done around here” has been at the core of a number of corporate scandals. This risk examines whether organizations understand, monitor, and manage the tone, incentives, and actions that drive the desired behavior.
• B USINESS CONTINUITY AND CRISIS MANAGEMENT: Organizations face significant existential challenges, from cyber breaches and pandemics to reputational scandals and succession planning. This risk examines organizations’ abilities to prepare, react, respond, and recover.

20
19
american corporategovernance index
Failure to Make the Grade

TABLEof CONTENTS
Introduction.......................................................................................3
Guiding Principles of Corporate Governance ............................ 4
Corporate Governance Roles ..........................................................7
The Board ........................................................................................7
Executive Management .................................................................7
Internal Audit ..................................................................................7
Corporate Governance in 2019 ..................................................... 8
Observations .................................................................................. 9
Key Findings ................................................................................. 10
Principle 1 ....................................................................................... 14
Principle 2 ....................................................................................... 15
Principle 3 ....................................................................................... 16
Principle 4 ........................................................................................17
Principle 5 ....................................................................................... 18
Principle 6 ....................................................................................... 19
Principle 7 ....................................................................................... 20
Principle 8 ....................................................................................... 21
Additional Findings ....................................................................... 23
Survey Participants ........................................................................ 27
Self-assessment of Corporate Governance Quality ................ 27
Index Methodology ....................................................................... 28
Guiding Principles of Corporate Governance References...... 29
Acknowledgments ......................................................................... 30

Introduction
Corporate governance encompasses all aspects of how an organization is directed and managed — the system of rules, practices, processes, and controls by which it operates. As a result, corporate governance is unique to each organization.
This distinctiveness is part of the reason why many companies may resist legislation and regulations that dictate how they should be run. Indeed, at the heart of the American success story is a free-market system that rewards hard work, ingenuity, innovation, and shrewd deci-sion-making. But that entrepreneurial story must continue to evolve if the United States expects to remain among the world’s preeminent economic powers.
Companies are under increasing pressure from investors, regulators, and special-interest groups to demonstrate value and sustainability, particularly in the context of environmental, social, and governance (ESG) metrics. Indeed, sustainable investment in the United States reached nearly $12 trillion in 2018, which accounted for 25.7% of the nation’s total assets under management, according to the Global Sustainable Investment Alliance.1 Investors are seeking assurance that companies are providing not only accurate and transparent accounting of their finances, but are acting ethically while meeting objectives that align with the needs and interests of stakeholders.
A number of well-established indices o�er short-term insight into economic performance, consumer confidence, and other aspects of business. Examination of financial reporting and accounting also are well understood. But what is lacking is a comprehensive measure — an index — of the state of American corporate governance, one that examines the e�ectiveness of interaction between key stakeholders, the board, executive management, internal audit, and others. An index that gauges whether the board and management are acting in the best interest of the company, whether there is a vision toward sustainability, a healthy culture, transparent and accurate disclosures, and e�ective policies and structures. The Institute of Internal Auditors (IIA) and the Neel Corporate Governance Center at the University of Tennessee, Knoxville’s Haslam College of Business have answered the call and are proud to present the inaugural American Corporate Governance Index (ACGI).
1 Global Sustainable Investment Alliance Global Sustainable Investment Review 2018.
3

Guiding Principles of Corporate Governance
The Guiding Principles of Corporate Governance define core actions and responsibilities that promote successful, ethical, and sustainable corporate governance. They go beyond the publicly observable measures of corporate governance, such as the number of board meetings, biographical information for directors, and executive compensation disclosures, which alone fail to capture the e�ectiveness of an organization’s corporate governance system. Prescriptive solutions have not been proposed because corporate governance does not allow for a one-size-fits-all approach and companies will need to find their own best practices based on the company’s age, size, complexity, extent of international operations, etc. The following Guiding Principles reflect a compendium of viewpoints from sources cited in the References section on page 29. 2
Companies should seek legal advice before implementing specific corporate governance policies and procedures to ensure compliance with applicable laws and regulations, including securities exchange listing requirements.
DEFINITIONCorporate governance is the overarching set of policies, procedures, and relationships that enables an organization to establish objectives, set ethical boundaries to the acceptable means with which those objectives will be met, monitor the achievement of objectives, reward successful achievements, and discipline unsuccessful or inappropriate attempts to meet objectives, in order to keep the organization aligned with the needs and interests of its primary stakeholders.
Principle 1E�ective corporate governance requires regular and constructive interaction among key stakeholders, the board, management, internal audit, legal counsel, and external audit and other advisors.
Principle 2The board should ensure that key stakeholders are identified and, where appropriate, stakeholder feedback is regularly solicited to evaluate whether corporate policies meet key stakeholders’ needs and expectations.
• Key stakeholders can change over time, and as such, boards should ensure processes are in place to regularly monitor the identification of key stakeholders.
• Key stakeholders are those who have a material impact on corporate operations, or on whom the corporate operations have a material impact.
• Stakeholders can be external or internal and include communities a�ected by the company’s operations, creditors, customers, employees, regulators, shareholders, suppliers, etc.
• When evaluating business success, the company should also evaluate its social and environmental impact and determine whether it aligns with corporate objectives and the interests of key stakeholders.
Principle 3Board members should act in the best interest of the company and the shareholders while balancing the interests of other key external and internal stakeholders.
• The board should exhibit su�cient independence and objectivity in fact and appearance. There should be a clear form of leadership for the board that is distinct from management. Each board member should employ healthy skepticism in meeting his or her responsibilities and be willing to challenge the CEO and other board members constructively.
• Board members should exhibit high integrity and competence, and provide diverse perspectives in terms of industry expertise, technical expertise, culture, and thought.
• Board members should exhibit a commitment of time and active involvement, including preparation for and direct participation in appropriate board, committee, and shareholder meetings. They should be informed on relevant issues, particularly those involving potential or existing crises, and be available to consult with management, as needed.
• Board members should receive ongoing education and training to perform their responsibilities, including areas of emerging risk to the company.
• Board members should be compensated in a way that encourages alignment with key stakeholder interests.
• Executive sessions should be held regularly and often, as they are critical in establishing an appropriate environment of objectivity and candor. These sessions should include independent directors and those outside directors who do not qualify as independent, but exclude members of management.
• The board should undergo regular, robust evaluations and, as needed, members should be rotated (including leadership positions within the board) to ensure a balance of company-specific knowledge and new perspectives. E�ective board evaluations should lead to improved governance and corporate outcomes.
• Shareholders should have fair opportunities to nominate and regularly vote on the retention of board members.
4

Principle 4The board should ensure that the company maintains a sustainable strategy focused on long-term performance and value. This includes:
• Defining corporate objectives and approving long-term strategic goals.
• Evaluating risks, including reputational risks, and seeking to balance risk and reward after considering all relevant stakeholders.
• Designing management compensation to align with long-term strategic goals, regularly evaluating performance of the CEO, and overseeing management succession planning.
• Ensuring that all employees receive adequate training and are compensated in a way that encourages achievement of corporate objectives.
Principle 5The board should ensure that the culture of the company is healthy, regularly monitor and evaluate the company’s core culture and values, assess the integrity and ethics of senior management, and, as needed, intervene to correct misaligned corporate objectives and culture.
Principle 6The board should ensure that structures and practices exist and are well-governed so that it receives timely, complete, relevant, accurate, and reliable information to perform its oversight e�ectively.
• Each board member should have unrestricted access to management, as needed, to fulfill their responsibilities.
• Board members have a responsibility to protect the confidentiality of non-public information.
Principle 7The board should ensure corporate disclosures are consistently transparent and accurate, and in compliance with legal requirements, regulatory expectations, and ethical norms.
• The board should ensure that an independent committee (an Audit Committee or equivalent) with appropriate expertise is responsible for oversight of both internal and external auditors. Internal audit should have direct and unfiltered access to this committee; it should be adequately resourced; and its purpose, authority, and responsibility should be formally defined and consistent with the International Standards for the Professional Practice of Internal Auditing.
• The board should oversee the company’s assessment of the risk of fraud specifically and ensure that adequate controls are in place to detect and deter fraud.
• The board should have in place processes for employees or other stakeholders to report suspected fraud or misconduct to independent members of the board without fear of retaliation.
Principle 8Companies should be purposeful and transparent in choosing and describing their key policies and procedures related to corporate governance to allow key stakeholders an opportunity to evaluate whether the chosen policies and procedures are optimal for the specific company.
• The board should ensure that the company regularly evaluates the full system of corporate governance to ensure that individual components are operating as expected, and that all components operate in a cohesive manner to achieve corporate objectives.
• The board should ensure that corporate governance evaluations encourage the reporting of potential deficiencies at all levels, including within the board, without fear of retaliation.
• The board should ensure that the company addresses any deficiencies in a timely manner.
2 Individual quotations and citations are not provided since the intention is to create a summarized set of viewpoints from multiple sources.
5

“Is the board getting the full spin on the issue? Or are they getting what management wants them to see?”
6

TAB 9

Brian GuthrieFebruary 26, 2021
EXECUTIVE DIRECTORS REPORT
Teacher Retirement Sy stem of Tex as

2
• General Updates• Review of TRS Employee Demographics• Trustee Election Update• Awards and Acknowledgements• Upcoming Agendas

3
General Updates
Week of Feb. 15th - special appreciation to Facilities and Security staff who were on site.

4
General Updates
Upcoming Conferences and Meetings:
March 8 - 10, 2021: Council of Institutional Investors Spring Conference, Virtual.
May 4-7, 2021: Pension Bridge Conference, Virtual.
TBD: NCPERS’ Annual Conference & Exhibition
Past Meetings and Updates:
January 12, 2021 First Day of Legislative Session
January 26, 2021 TRS/ERS Emerging Manager Conference, Virtual
February 16-18, 2021 PPI’s 2021 Winter Roundtable, Virtual
February 22 – 24, 2021: NASRA Winter Meeting and Joint Legislative Conference, Virtual
February 22, 2021 Senate Finance Committee, Austin, TX
February 23, 2021 House Appropriations Committee, Austin, TX
February 25, 2021 House Appropriations Sub-Committee on Article III, Austin, TX

5
General Updates
Return to Office Update:
To ensure the safety of our staff, TRS implemented a phased approach to return to office and member visits to the agency that can be modified as circumstances change.
• On December 23, 2020 City of Austin moved to Stage 5.
• On February 9, 2021 City of Austin moved back to Stage 4.
• TRS to open for limited in person office visit beginning March 1, 2021.
• TRS continues to operate in Phase 2 and will likely continue to do so into Spring 2021.

TRS Employee Demographics
6
Average Age Average TRS Tenure FY 2020 Turnover Rate
EthnicityGender Average State Tenure Employees Eligible to Retire*
* N ote: Based on rule of 80
56% Female44% Male 11.34 Years 9.4%
7.4%6.6 Years44.2 Years
White (54%)
Hispanic (24%)
Black (14%)
Asian/American Indian (8%)

TRS Employee Demographics
7
15.6%13.6%
15.7%13.6%
10.8%9.4%
14.6%
22.2%
FY 2016 FY 2017 FY 2018 FY 2019 FY 2020 FY 2021 FY 2023 FY 2026
Percent of TRS Employees Eligible for Retirement
*Estimates are based on active employees as of 12/31/2020. Estimates for FY 2023 and FY 2026 are made using the role of 80
14.2%
23.6%
34.6%
8.5%
13.0%
19.9%
2021
2023
2026
Management versus Non-Management Positions
Management
Non-Management
Benefits Executive Finance HIB IMD IT2021 6.9% 12.2% 18.0% 0.0% 2.9% 15.4%2023 12.6% 18.3% 29.0% 3.9% 4.6% 20.4%2026 18.2% 26.1% 44.0% 5.9% 11.4% 28.4%
Eligibility by Division
Retirement Eligibility Trends

Retirement Eligibility Projections*
8
Division
Percent of TRS Employees Eligible to Retire as of:
January 2021 January 2023 January 2026
Eligible Employees PercentEligible Eligible Employees Percent
Eligible Eligible Employees PercentEligible
Executive Division** 14 12.2% 21 18.3% 30 26.1%Investment Management 5 % 8 4.6% 20 11.4%Benefit Services 16 % 29 12.6% 42 18.2%Finance 18 % 29 29.0% 44 44.0%Information Technology 25 % 33 20.4% 46 28.4%Health and Insurance Benefits 20 1 2 5.9% 3 5.9%Total 78 9.4% 122 14.6% 185 22.2%
Executive Council Members 6 40.0% 8 53.3% 9 60.0%57
Notes: *Estimates are based on the rule of 80 using active employees as of 12/31/2020 and includes return-to-work retirees. **Executive Division includes Legal & Compliance, Internal Audit, Communications, Government Relations, Organizational Excellence, and Strategic Initiatives

9
Trustee Election Update
• January 25, 2021: Nominations closed with 6 candidates reaching 250 signatures. • February 3, 2021: Drawing held to determine the order of candidates’ names on the ballot• March 15, 2021: Ballots will be mailed separately this year. March TRS News will contain
candidates’ biographical information.• May 5, 2021: Deadline for receiving completed ballots.• Week of May 31, 2021: Send the names of the top three candidates to the Governor.
2021 Candidates for Public School District Employee Trustee Position
Cedric T. Menchion, Chief Financial Officer Dripping Springs ISD
Andrew Peters, Superintendent Caldwell ISD
K risti McAlexander Cross, Payroll Director K aty ISD
Elvis Williams, Chief Operations Officer Edgewood ISD
E. Arial Elliott, Superintendent Greenwood ISD
Scot Hafley, Director of Athletics Wichita Falls ISD

10
Awards and Acknowledgements
Heather Traeger - Committee MemberFINRA National Adjudicatory Council (NAC)
FINRA is authorized by Congress to protect America’s investors by making sure the broker-dealer industry operates fairly and honestly. Oversees more than 624,000 brokers across the country – and analyze billions of daily market events.
The NAC is a FINRA committee that reviews initial decisions rendered in FINRA disciplinary and membership proceedings.

11
Awards and Acknowledgements

12
Upcoming Agendas
April 15 -16 , 2 02 1 (Q uarterly Meeting)
April 15 , 2 02 1 April 16 , 2 02 1
Strategic P lanning Committee TEAM UpdateResults Forum Report OutProposed Update to Strategic Plan for 2021-2025 Committee Reports
B enefits Committee Long Term Space Planning Operational UpdatesApproval of Benefits Member and Employer Survey ResultsTRS-ActiveCare Plan design
ED Report – Midyear valuationB udget CommitteeFY2021 Mid year and FTE Report COAO ReportReview Proposed FY2022 Budget
Ethics/Fiduciary Training
P olicy Committee Cybersecurity ReportReview Litigation Policy
Investment Management CommitteeCIO Update4th Q uarter 2020 Performance ReviewSemi-annual Risk ReportAnnual Rvw of Public MktsAnnual Rvw of Public SPN
Audit Compliance and Ethics CommitteeInternal Audit and Compliance reports Red font denotes items moved from February meeting to April.

13
Upcoming Agendas
July 15 - 16 , 2021 ( Q uarterly Meeting)July 15 , 2021 July 16 , 2021
Strategic Planning Committee TEAM UpdateResults Forum Report Out
Committee Reports
B enefits Committee Long Term Space PlanningOperational UpdatesApproval of Benefits Select Actuary
B udget Committee Select Medical Board PositionPropose Adoption of FY2022 BudgetState Certifications Renew Fiduciary Counsel ContractHUB Goals
ED ReportPolicy CommitteeReview of Procurement Policy COAO ReportPossible proposed rules from new legislation
Investment Management CommitteeCIO Update1st Quarter 2021 Performance ReviewAnnual Review of External Private Market UpdateReview proposed modifications to IPS
Audit Compliance and Ethics CommitteeInternal Audit and Compliance reports

TAB 10

Kellie SaulsFebruary 2021
DIVERSITY, EQUITY AND INCLUSIONTeacher Retirement System of Texas
1

Overview
1. Review DE&I Vision, Charge and outline of work from February 2020
2. Current stage of DE&I work
3. DE&I Strategy, Performance Metrics and Measurement
4. DE&I Highlights from the year
5. Areas of Focus for 2021
2

Our Vision
Diversity, Equity and Inclusion for TRS
We strive toward a vision where:
All areas of the organization reflect the diversity of the state of Texas, promoting our culture of inclusion and belonging. All employees across the organization professionally thrive, grow and achieve a high level of professional satisfaction knowing they have been encouraged and supported in their contribution to the achievement of the organization’s mission.
3

Our DE&I Charge
• We want to effectively compete for talent in an increasingly diverse laborforce
• We want to maintain a high level of talent retention through inclusion, equity and belonging practices
• We want to continuously improve upon the services and investment returns delivered to our members
4

Approach
Ongoing DE&I Work
Strategic Plan
FY20 Q3Strategic Plan developed and submitted for review and input
FY20 Q4Strategic Plan revised, reviewed again, finalized and published
FY21 Q1Internal marketing of DEI Plan; develop Progress Report template
Quick AssessDevelop schedule to do quick assessments on/toward progress
Annual Re-AssessProgress will be determined, and adjustments made as necessary
ReportAnnual DE&I Report will be generated to provide overview and update
Vision
DiversityRepresentation; Demographic make-up of the agency
EquityAccess to and use of resources for success within the agency
InclusionSense of belonging, value, ownership in the agency and its achievements
Assessment
GDIBAssessment to determine level of progress and challenge areas
Inclusion IndexIdentify gaps, provide tools, target efforts to achieve goals
Add’l ResourcesTRS OE; PreviousTRS surveys; CQC; conversations; CFA; DBP Inclusion Index
PrioritizeDevelop a list of focus areas for each year; determine reasonable timeline
CollaborationWork across the organization to implement DE&I practices into work
Work the PlanDevelop working schedule to support, pivot and/or initiate
Implementation MeasureProgress
5

Approach
Ongoing DE&I Work
Vision
DiversityRepresentation; Demographic make-up of the agency
EquityAccess to and use of resources for success within the agency
InclusionSense of belonging, value, ownership in the agency and its achievements
Assessment
GDIB Assessment to determine level of progress and challenge areas
Inclusion IndexIdentify gaps, provide tools, target efforts to achieve goals
Add’l ResourcesTRS OE; PreviousTRS surveys; CQC; conversations; CFA; DBP Inclusion Index
6

Approach
Ongoing DE&I Work
Strategic Plan
FY20 Q3Strategic Plan developed and submitted for review and input
FY20 Q4Strategic Plan revised, reviewed again, finalized and published
FY21 Q1Internal marketing of DEI Plan; develop Progress Report template
Interim AssessDevelop schedule to do quick assessments on/toward progress
Annual Re-AssessProgress will be determined and adjustments made as necessary
ReportAnnual DE&I Report will be generated to provide overview and update
PrioritizeDevelop a list of focus areas for each year; determine reasonable timeline
CollaborationWork across the organization to implement DE&I practices into work
Work the PlanDevelop working schedule to support, pivot and/or initiate
Implementation MeasureProgress
7

DE&I Strategy
TRS Implementation StrategyPrioritized DE&I
Support development and recruitment
Address organizational systems and proactively challenge and train.
Build on the legacy of the TRS culture.
1
2
3
4
D. Assurance that TRS is equipped to meet the unique challenges of the 21st century with a thriving, high-performing, and diverse workforce that is conducive to innovative and enriching ideas, practices and delivery upon the TRS mission.
E. A diverse workplace that promotes fair treatment, access and opportunity for advancement, and a work culture where all employees feel welcome, respected, supported, and valued.
I. Pledge that TRS values and seeks out diverse partnerships and opportunities across all lines of business and endeavors to continuously strengthen and enhance these relationships.
Outcomes BeneficiariesMembers, Board of Trustees, and Citizens of Texas
TRS Employees
Partners/stakeholders (vendors, strategic partners, contractors, community partners and agencies)
Potential Pain Points• Sufficient DE&I staff to fully execute plan• Invest in DE&I budget to support full execution of plan 8

DE&I Performance Metrics
• What we are measuring
• Why we are measuring
• What the benefits entail
• A tool/service will help us measure in a meaningful way
9

DE&I Performance Metrics
Key Performance Metrics
• Gender• Division• Generation
• Race/Ethnicity• Veteran Status• Trend data for Gender and Race/Ethnicity
• Years of TRS Service• Level w/in the Agency
New Hire Demographics DFiscal year data broken out by the follow attributes: • Gender• Division
• Race/Ethnicity• Veteran Status
• Generation• Level w/in the Agency
Applicants Demographics D EFiscal year data broken out by the follow attributes: • Gender• Source of Application
• Race/Ethnicity
Employee Demographics DFiscal year data broken out by the follow attributes:
• Veteran Status
10

DE&I Performance Metrics
Key Performance Metrics
Termination Demographics EFiscal year data broken out by the follow attributes: • Gender• Division• Type of termination
• Race/Ethnicity• Generation
• Years of TRS Service• Level w/in the Agency
Recruiting D INumber of recruiting partnerships focused on increasing diversity applicants
Training D E INumber of attendees for each DE&I related training event broken out by the following attributes:• Division • Level within the Agency
Employee Resource Groups (ERGs) E Number/type of ERGs (active and in development) IMembership numbers for each ERG broken out by division.
Employee Survey Results EAggregate scores for specific questions asked as part of the Survey of Employee I Engagement
11

Implementation and Measurement Loop
Implementation
Measurement
Implementation
PrioritizeDevelop a list of focus areas for each year; determine reasonable timeline
CollaborationWork across the organization to implement DE&I practices into work
Work the PlanDevelop working schedule to support, pivot and/or initiate
Measure Progress
Quick AssessDevelop schedule to do quick assessments on/toward progress
Annual Re-AssessProgress will be determined and adjustments made as necessary
ReportAnnual DE&I Report will be generated to provide overview and update
12
AssessPlan

DE&I Measurement Tool
Determine movement on identified DE&I metrics, assess those movements and adjust if needed.
Determine progress on TRS Strategic Goals as it relates to talent and trust performance.
Maintain consistency and accountability around DE&I goals.
Employ a statistically rigorous methodology to ensure that data is accurate, valid and reliable.
Use industry best practice through 3rd party measurement to ensure standardization and realistic benchmarking.
Purpose of the DE&I Measurement Tool Status: Initiated the P&C process; completed the Scope of Work.
Next Steps: Complete P&C process with selection of vendor and initiate DE&I measurement.
1
2
3
4
5
13
Collaboration: L&CP&CIMDOE/OCMCommunicationsIT

Highlighted Activity - Diversity
Howard University Alliance
Status: Maintain contact; utilizing HU app to connect with students and alumniNext Steps: Assess year-long engagement
NABA – Austin Chapter:
Status: Solid relationship establishedNext Steps: Partner on Student Conferences; Fall 2021 Conference hosted in Austin
Outreach to:
Status: Contact made with local chapters across TexasNext Steps: Secure speaking engagements for TRS
14
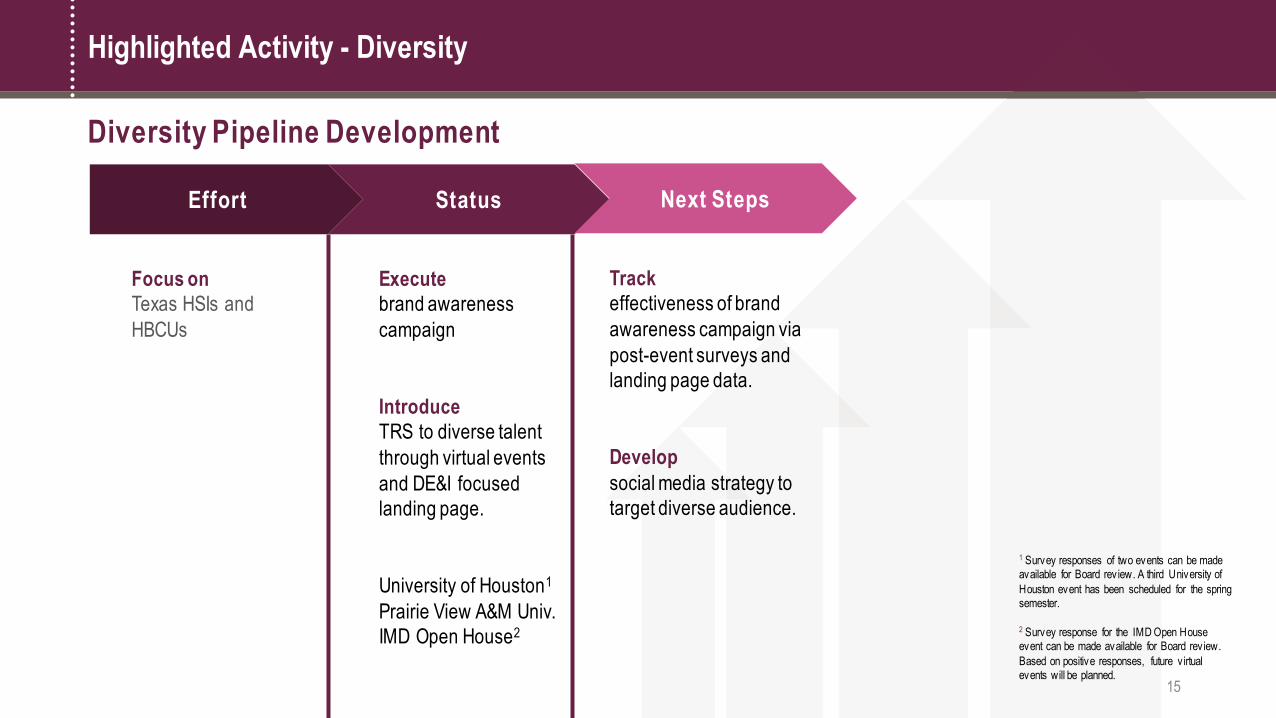
Highlighted Activity - Diversity
1 Survey responses of two events can be made available for Board rev iew. A third University of Houston event has been scheduled for the spring semester.
2 Survey response for the IMD Open House event can be made available for Board rev iew. Based on positive responses, future v irtual events will be planned.
Effort
Focus onTexas HSIs and HBCUs
Status
Executebrand awareness campaign
IntroduceTRS to diverse talent through virtual eventsand DE&I focused landing page.
University of Houston1
Prairie View A&M Univ.IMD Open House2
Diversity Pipeline Development
Next Steps
Trackeffectiveness of brand awareness campaign via post-event surveys and landing page data.
Developsocial media strategy to target diverse audience.
15

Highlighted Activity - Diversity
Brand Awareness
Talen
t Fun
nel Prospect
ApplicantInterviewee
New Hire
16
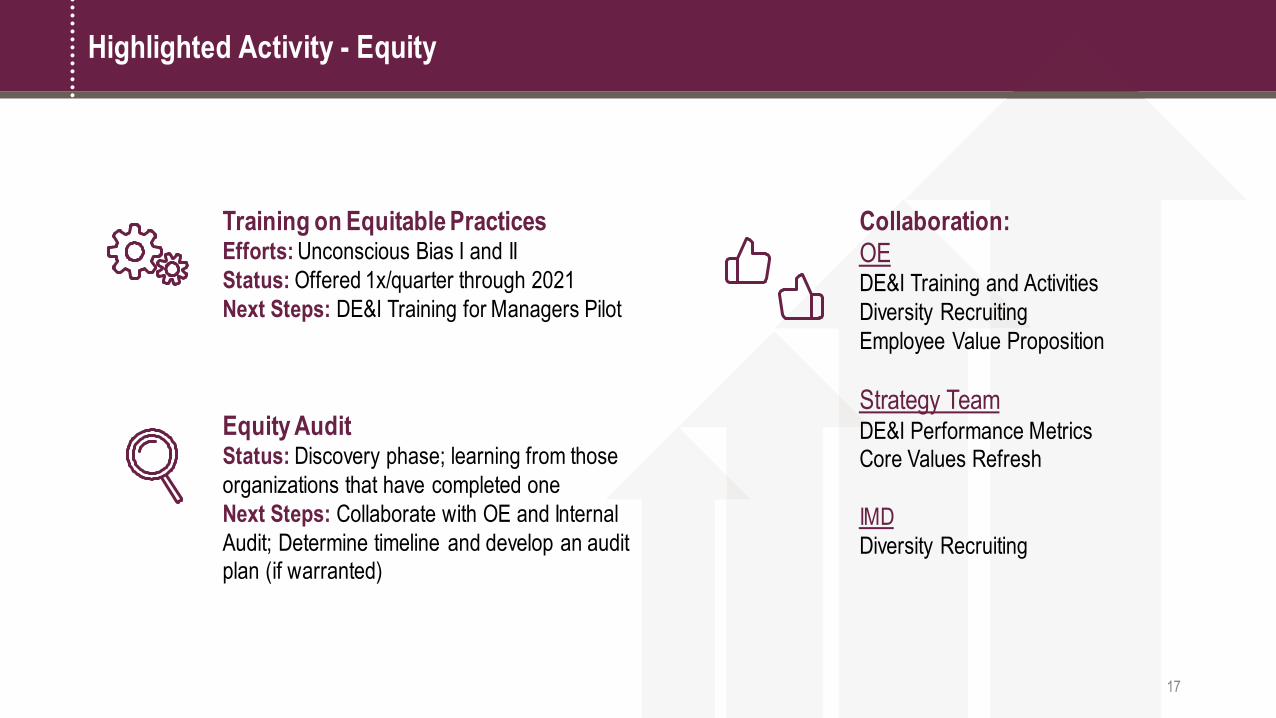
Highlighted Activity - Equity
Collaboration:OEDE&I Training and ActivitiesDiversity RecruitingEmployee Value Proposition
Strategy TeamDE&I Performance MetricsCore Values Refresh
IMDDiversity Recruiting
Training on Equitable PracticesEfforts: Unconscious Bias I and IIStatus: Offered 1x/quarter through 2021Next Steps: DE&I Training for Managers Pilot
Equity AuditStatus: Discovery phase; learning from those organizations that have completed oneNext Steps: Collaborate with OE and Internal Audit; Determine timeline and develop an audit plan (if warranted)
17

Lunch & Learn Survey Results
Survey Results From:• LGBTQ+ Allyship at Work• Lessons From the Life of Nelson Mandela• Multigenerational Diversity• IMD Women In Finance• “How to be an Antiracist” Book Discussion
85% Positive Feedback on Events
Appreciating:Education
Work & Life WisdomPositive Influence
Moving Forward:More Book Club Discussions
Application of Lessons LearnedBroader, more Global Information
Clearing up Communication on Event Formats
“Not only was this training
relevant, but it was incredibly insightful. I love
that TRS is on the front-lines of helping us become
more accepting of all individuals.”
“I thought this was a
very refreshing seminar and would
love more like this!”
18

Highlighted Activity - Inclusion
Training on Inclusive CultureStatus: Cultural Intelligence and Unconscious Bias has launchedNext Steps: Pre/Post-Assessments Analysis over time
DE&I CouncilStatus: Concluded Year 1; Survey ResultsNext Steps: Inclusion focused with emphasis on connections given remote work and physical work locations
ERGsStatus: Two ERGs fully launched; Four ERGs in progress with project leads/teamsNext Steps: Support launch of the other four ERGs; Bring together all the ERG leaders
19

Areas of Focus
IMD• External Investors DE&I measurement
and accountability• ERG support• Continued Diversity and Inclusion efforts
Benefit Services• Leadership team DE&I sessions monthly
Recruiting, Inclusion and Accountability
L&C• Multigenerational workshop collaboration
IT• Diversity Recruiting
20

21
Summary – Year
GDIB Benchmarks Categories Status Highlights
Foundation(Drive Strategy)
• DE&I Vision, Strategy and Business Case
• Leadership and Accountability
• DEI Structure and Implementation
1st draft complete
Complete; next stage ready
In-progress
DE&I strategic plan
EC DE&I Training; Managers Pilot
DE&I Director, Intern, Council, ERGs
Internal(Attract and Retain)
• Recruitment, Retention, Development, Advancement
• Benefits, Work-Life Integration, and Flexibility
• Job Design, Classification, and Compensation
• DE&I Learning and Education
Brand awareness launch; Metrics and measurement
CVR strat team lead; OE lead (EVP)
OE lead and collab; UB Train’g
DEI training integrated (OE)
Virtual events and landing page; Perf Metrics ID’d; procuring service/tool
Disabilities Awareness; Caregiver ERG
Perf Metrics ID’d; Manager Pilot
DE&I Training Portfolio (pos. marks)
Bridging(Align and Connect)
• Assessment, Measurement and Research
• DE&I Communications
• Connecting DE&I Sustainability
Measurement tool/serv P&C process
Ad Hoc comms (email, e.g. hx months)
Exploratory
Initial Assess period; Perf Metrics ID’d
Kaleidoscope; Leaders mtgs; DEI site
Initial discussions with IMD
External(Listen and Serve Society)
• Community, Government Relations, and Social Responsibility
• Products and Services Development
• Marketing and Customer Service
• Supplier Diversity
DEI landscape awareness
Exploring support of service delivery
Exploring support of service delivery
In-progress; P&C lead
ATX DE&I Leaders; Focus on Texas
Accessibility and Generational Training
Ext Comms (eg, brand); BenServ Mtgs
Regular HUB meetings; Implement’g plan

Next Steps
Next Steps
22

Questions
Thank YouAny Questions?
?
23

TAB 11

© 2021 by The Segal Group, Inc.
Board Meeting
Teacher Retirement System of Texas
February 2 6 , 2 02 1
Health Plan Program Review

2
With You Today
2
K enneth C. V ieira, FSA, FCA, MAAASenior V ice P residentEast Region P ublic Sector Market Leader
TRS Ex ecutive Sponsor
K irsten R. Schatten, ASA, FCA, MAAASenior V ice P residentN ational P ublic Sector H ealth P ractice Leader
TRS Account Manager

3
Segal’s Large Public Sector ClientsHealth & Retirement Consulting
Current clients include 2 1 State H ealth P lansP roud partner with Tex as TRS since N ovember 2 019

4
Suite of health and benefit plan management services operates on a continuum in which each service supports and compliments other essential services
Plan ManagementRequires Unique “Team” Expertise
Benefits Planning
Budget Activities
Vendor Management
Communications
Compliance
Ad Hoc Support
Plan Management
• Input from your leadership & Council• Strategy, based on goals
and objectives• Work plan calendar
• Annual plan/budget goals• Plan design modeling• Rate setting and
contribution strategy
• Audits• Network, claims &
cost containment • Renewals/RFPs
• Communication review and assistance
• Wellness communications
• Compliance assessments• Legislative and regulatory
updates• Training sessions,
(HIPAA, etc.)
• Administration and technology support
• Specialized research• Benchmarking

5
• The benchmarking states have been de-identified, but include:– Alabama (PEEHIP)– Georgia– Illinois– North Carolina– Tennessee– Wisconsin
• Data Collected:– Plan type (PPO, HMO, HDHP, etc.)– Plan design (deductibles, copays, maximum out-of-pocket limits, etc.)– Cost (total costs/premiums, employee/state cost share, coverage tier structure)
• TRS and Benchmark States’ plan information is current
• TRS Current Enrollment
TRS Requested Segal to Benchmark Peer States
Program Employees/Retirees Dependents Total ParticipantsActiveCare 282,000 149,000 431,000
Care Standard 50,000 16,000 66,000
Medicare Advantage 138,000 20,000 158,000
Total 470,000 185,000 655,000

6
Plan Efficiency–Measures how efficient plans are by comparing total costs–Captures the amount of health care each dollar of premium buys–Holds benefit designs constant to allow for an apples-to-apples comparison
What’s the Benchmark?
What the Employer/State
Contributes
Premium the Member Pays
Member Out-of-Pocket Costs when they Seek Care
Efficiency Benchmark looks atTotal Costs

7
–TRS plans are efficient compared to peers in the benchmarking study• Each dollar of premium in TRS buys more health care than peers• This is especially pronounced for TRS-ActiveCare where total costs are 15% - 25% less
than peers• TRS-Care Standard’s population makes it challenging to benchmark. Costs look to be
consistent with peers.–TRS health plans receive considerably less funding than peers
• Employer contributions in TRS-ActiveCare are 55% - 65% of peers• State contributions in TRS-Care are more in line with peers• TRS members bear a greater share of the total costs as reflected in higher member
premiums and out-of-pocket costs than peers–TRS plans outperform peers from a total cost perspective, reflecting effective management of the programs
–TRS has had annual trends of 2 -3 % less than market over the last 6 y ears
Key Findings
The efficiencies amount to over $ 3 00 million saved annually .

8
Benchmark Plan Types
% of States
HDHP/CDHP Plans
P ercentage of B enchmark States O ffering
PPO Plans
HMO/EPO Plans
100%
6 7 %
92%
59%
57%
6 7 %
ActiveCare Care Standard
ActiveCare is consistent with B enchmark states, but Care Standard is the only pre-6 5 retiree program not linked to active plan options

9
Term Definition
Covered Benefits Medical and Pharmacy services covered by the Plan
Total Cost Negotiated Cost of Covered Benefits under the Plan
Member Out of Pocket Cost (OOP)
Portion of Total Cost paid by Member= Deductible + Coinsurance + Copays
Premium Rate Portion of Total Cost paid by the Plan= Total Cost less Member OOP
Actuarial Value Calculated Percentage of Covered Benefits paid by the Plan = Premium Rate / Total CostSimilar to Exchange Metal Level Plans (60%,70%,etc)
Employer Contribution Amount of Premium Rate paid by employer
Employee Contribution Amount of Premium Rate paid by employee
Employer Cost Employer Contribution
Employee Cost Employee Contribution + Member OOP
Employer Subsidy % Percent of Total Cost paid by Employer
Definitions of Health Plan Costs

10
• Actuarial value provides measurement of overall plan value to the member out-of-pocket (OOP) costs (deductible, coinsurance, copays). A plan that has simply a 30% coinsurance would have a 70% AV.
• As Actuarial Values increase, member Out of Pocket costs decrease
ActiveCare: Benchmark States Actuarial Value (AV)
0%
10%
20%
30%
40%
50%
60%
70%
80%
90%
100%
AV Member OOP Cost %
TRS AV s are on the lower end of the B enchmark States

11
ActiveCare: Employer Cost – Single
Total Employer Cost Single
$ 0
$ 100
$ 200
$ 300
$ 400
$ 500
$ 600
$ 700
$ 800
$ 900
$ 1,000
O n Average: Tex as contributes 3 5 -4 5 % less than the B enchmark States

12
ActiveCare: Employee Cost – Single
TRS Employ ee Costs are higher than the B enchmark States
Total Employee Cost = EE Premiums + EE OOP Costs
$ 0
$ 50
$ 100
$ 150
$ 200
$ 250
$ 300
$ 350
EE Premiums EE Out of Pocket Costs

13
• Total Cost represents the “Allowed Cost” or “TOP Line” covered claims expense
• The lower the Total Cost, the better the management of health care dollars.
ActiveCare: Total Cost – Single
Total Cost Single
O n Average: TRS’ s Total Cost is 15 -2 5 % lower than the B enchmark States
$ 0
$ 200
$ 400
$ 600
$ 800
$ 1,000
$ 1,200
$ 1,400
ER Contributions EE Premiums EE Out of Pocket Costs
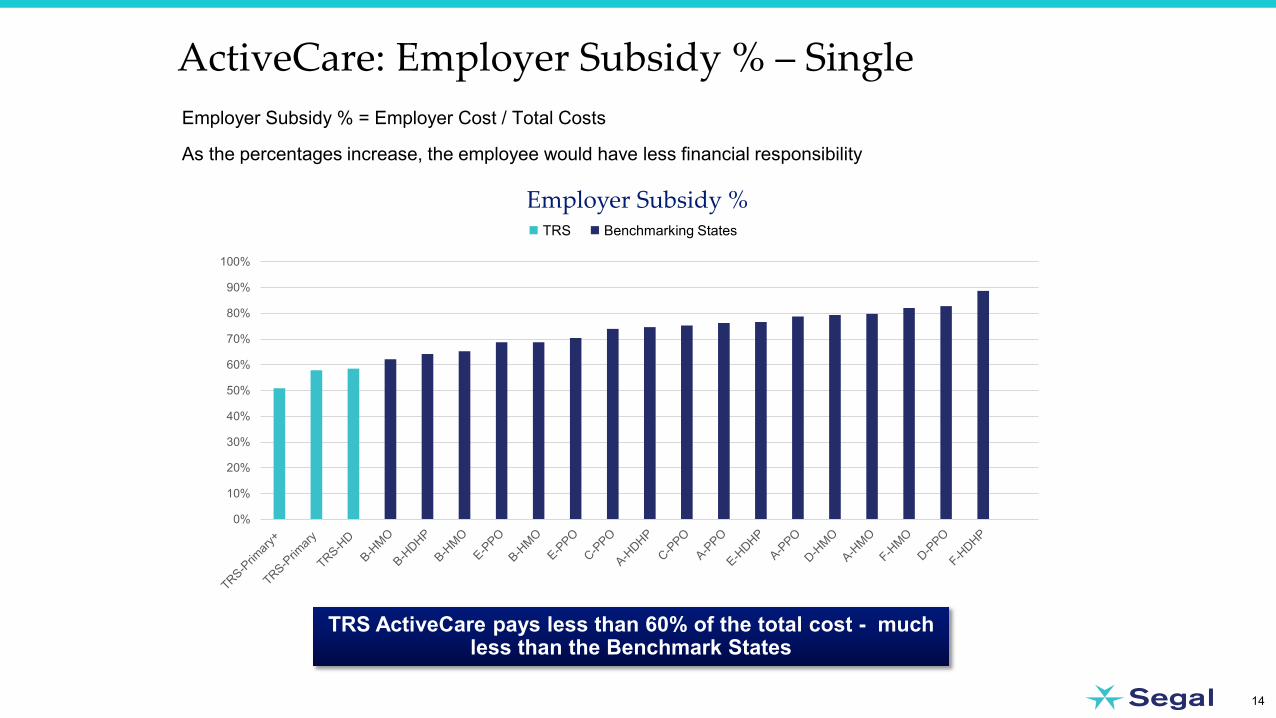
14
Employer Subsidy % = Employer Cost / Total Costs
As the percentages increase, the employee would have less financial responsibility
ActiveCare: Employer Subsidy % – Single
Employer Subsidy %TRS Benchmarking States
TRS ActiveCare pay s less than 6 0% of the total cost - much less than the B enchmark States
0%
10%
20%
30%
40%
50%
60%
70%
80%
90%
100%

15
Historical Trends – Comparison to TRS
0.0%
1.0%
2.0%
3.0%
4.0%
5.0%
6.0%
7.0%
8.0%
9.0%
2016 2017 2018 2019 2020 2021
PPO HMO Rx TRS
Source: 2020 Segal Health Plan Cost Trend Survey
TRS Average P remium Increases have consistently been lower than the marketApprox imately 2 -3 % lower over the past 6 y ears

16
TRS Care Standard comparable to Benchmark States – right in middle of pack
Populations vary between states with likely risk differentials, making direct comparisons more difficult
Care Standard: Total Cost – Single
Total Cost - Single
H igh variability between states – ER Cost, EE P remiums & EE O O P Cost
$ 0
$ 200
$ 400
$ 600
$ 800
$ 1,000
$ 1,200
$ 1,400
$ 1,600
$ 1,800
$ 2,000
ER Contributions EE Premiums EE Out of Pocket Costs

17
Employer Subsidy % = Employer Cost / Total Costs
As the percentages increase, the employee would have less financial responsibility
Care Standard: Employer Subsidy % – Single
Employer Subsidy %TRS Benchmarking States
Care Standard percentage more consistent with B enchmark States
0%
10%
20%
30%
40%
50%
60%
70%
80%
90%

18
• Successful Procurements–Best in class RFPs–Unbiased objective evaluation
• Networks and Pricing• Medical management
–Changed 2 vendors this year• Major Undertaking for Implementations• BCBS
Pricing SavingsCurating NetworksDeep dive on Medical ManagementValue Based Design
• UHC Medicare Advantage – Guaranteed Pricing with a Market Leader
• Size–Administrative fees are low, < 4% of total cost (meaning 96% pays for member claims)–Stop Loss Reinsurance not necessary, this saves 1.5% – 3% annually
Why does TRS have lower costs?
TRS has some of the best contracts in the Country for medical, pharmacy and Medicare Advantage programs

19
• Successful Contract Management–Working with BCBS to Curate Networks and new to market solutions for specific services–PBM Market Check yields one of the best contracts in the industry
• Medical Network Management–Balancing network depth, breadth, quality and pricing–Utilization Management–Large Case Management–Other programs and Point Solutions (e.g. Diabetes pilot)
• Pharmacy Program Management–Rapidly changing market–Contract terms – discounts, rebates, Utilization management (Including Prior Auths for
Specialty drugs with a robust pipeline)
• Staying on top of New Legislation
Why does TRS have lower costs?
Given the siz e of the TRS staff, the level of ex pertise and q uality is clearly shown in program performance

20
• ACA Strengthening
• New Federal Legislation–Price Transparency
• Hospitals• Health Plans• Surprise Billing (Out of Network, ER and
Ambulance)• New consumerism tools
• Pharmacy–Rx Pricing Reduction Act (Most Favored Nations)–Point-of-Sale Rebates for Medicare–Potential Pharmacy Part D Redesign
• COVID-19–Vaccinations–Mental Health Support
• Innovative and Curative Therapies
• Value Based Care – more evolution
• Digital Solutions / Telemedicine
• Social Determinants of Health
• Mental Health Parity and Addiction Equity Act–Non Q uantitative Limits
Health Care Market Forecast
N ew Administration with different initiative could change … … . every thing

21
Thank you!
What additional questions can we address today?

Katrina DanielChief Health Care OfficerFebruary 2021
HEALTH CARE REPORT
Teacher Retirement Sy stem of Tex as B oard of Trustees
Katrina DanielChief Health Care OfficerFebruary 2021
HEALTH CARE REPORT
Teacher Retirement Sy stem of Tex as B oard of Trustees

23
TRS-ActiveCare: Competing Coverage Creates Risks to P ublic Education Employ ees
• Districts offering competing coverage represent 14% of participating districts and employ 10% of eligible employees
• Increase in costs represents 1.7% of TRS-ActiveCare annual claims paid
• Current impact to TRS manageable• However, competing coverage presents
greater financial risk over longer-term
School D istricts O ffering Competing Coverage
Made with flourish.studio

• Transfers financial risk to employees
• No contracts with hospitals to define network or protect members from balancing billing
• Burdensome authorization process
• Potentially narrow network of physicians
• Excludes most specialty drug coverage
• High cost of specialty drugs may impair access to potentially life-saving treatment
24
Features of Competing Plans Increase Costs for Members who Need Health Care the Most
TRS-ActiveCare: Competing Coverage Shifts Costs to Employees who Need Care the Most

25
TRS-ActiveCare: Competing Coverage Shifts Costs to Employees who Need Care
In Most Districts Employees Leaving TRS-ActiveCare Have Higher Average Costs
In most districts, employees leaving TRS-ActiveCare have higher average costs
Note: PEPY = Per Employee Per Year Cost
$6,448
$7,450
$4,752
No Competing Coverage
Stayed Left
99%118%
% o
f Avg
PEP
Y

26
TRS-ActiveCare: Competing Coverage Shifts Costs to Employees who Need Care
Competing Coverage Leaves ActiveCare with Employees that Have Higher Total Cost
adverse selection: lower cost employees leave and higher-cost employee stay
Note: PEPY = Per Employee Per Year Cost
$6,448
$7,450
$4,752
No Competing Coverage Competing Coverage
Stayed Left Stayed Left
99%118% 114%
73%
% o
f Avg
PEP
Y

27
TRS-ActiveCare: Competing Coverage Creates Adverse Selection
100% 100%74%
No Competing Coverage Competing Coverage
Stayed Yes Stayed Left
% o
f Avg
PEP
Y
125%
Members Leaving in Competing Coverage Districts Have Lower Specialty Drug Costs Paid by Plan Compared to Employees Staying
Note: PEPY = Per Employee Per Year Cost
adverse selection:lower cost employees leave and higher-cost employee stay

28
TRS-ActiveCare: The Financial Impact of Adverse Selection
Competing Plans Attract Lower-Cost Employees,Increasing Costs in TRS-ActiveCare
$240 40% $41 MEmployees leaving TRS had 38% lower monthly medical &
pharmacy costs
Employees leaving TRS had 40% lower specialty
drug costs
Increase in premiums to
remaining employees
Note: Comparisons are between employees leaving and staying within districts offering competing coverage.

The Committee recommends that the plan be structured in such a way to avoid adverse selection by the school districts.
29
TRS-ActiveCare: Legislative H istory
[T]he greater resulting issue of districts backing out of ActiveCare is the resulting ‘adverse selection’ that
occurs.

30
TRS-ActiveCare: Competitive Costs for Similar Coverage
$702
$795
TRS-ActiveCare Non-Par TX ISDs
TRS-ActiveCare HD Monthly Per Employee Cost are Lower than Similar Plans in Texas
Method notes available in appendix.
TRS per employee cost is $93 and
12% below median

31
Implementation Update: Vendor Transitions
Implementations occurred close together for large volume of members
• 100% Remote workforce • Implementation of 4 new health plans • +700,000 members impacted• TRS-ActiveCare transition final on 9/1/20• TRS-Care transition final on 1/1/21

32
Implementation Update: V endor Coordination
Implementation req uired ex tensive vendor coordination
• Included coordinating with four medical vendors during transition
• Goals included continuity of benefits, network adequacy, and smooth data transmission for minimal disruptions to members and partners
TRS
UHCCVS
BCBSTX
bSwift
AetnaHumana
Segal
Teladoc
RediMD
Payflex

33
Implementation Update: Intra-agency Coordination
Coordination within TRS involved + 3 0 people across divisions
• Execute contracts• Communicate changes to
members• Share eligibility & key data with
vendors• Evaluate & monitor risk• Provide customer service
TRS
Ops
Finance
Comms
LegalInternal
Audit
PMO
Exec
TRS IT

0
2,000
4,000
6,000
Apr
Jul
Oct
Jan
By Incurred Week
Dis
tinct
Peo
ple
Suspected Confirmed
COVID-19 New Diagnoses By Week
34
TRS-Care & TRS-ActiveCare: COVID Case Counts Similar to State Trends
Case counts will increase as more claims are received for this period. The decrease each week in December is at least partially due to claims submission lag. TRS cases have followed broader Texas trends.
Note: An individual is only counted once in this chart based on the first relevant diagnoses.

35
TRS-Care & TRS-ActiveCare: COVID Case Counts
Program Confirmed Suspected Percentage of Enrollment
TRS-Care-MA 4,648 n/a 3%TRS-Care-Standard
2,954 10,451 21%
TRS-ActiveCare 20,266 73,744 20%
TRS-ActiveCare Relationship
Total Confirmed & Suspected
Percentage of Enrollment
Employee 72,139 23.65%Dependents 21,849 12.95%
Note: Cases/counts are shown for members enrolled in December 2020.

36
TRS-Care & TRS-ActiveCare: COVID Costs for Self-Insured Plans
Note: FY 2021 costs will depend on the degree of community spread of COVID-19 and various factors which can change depending on vaccinations and public health interventions.
$73.2 m$166.4 m$26.5 m
$96.2 m
FY2020 FY2021
COVID Costs Expected to Grow in FY2021 after $100 M in FY2020
TRS-ActiveCare TRS-CareStandard• Due to fund balance, primary financial risk is to TRS-ActiveCare
• Anticipate maintaining a positive fund balance in FY20 and beyond
• COVID costs and changes in broader utilization will be a factor in rate setting
• Most of TRS-Care population is in Medicare Advantage which is fully insured – the carrier bears the risk of the cost

37
Implementation Update: Developing New TRS-ActiveCare Roles to Improve Service
-DA-District
Ambassadors
-PHG-Personal Health
Guide
• Contact for district leadership• Provide general plan info & education• Offer annual enrollment, health fairs,
& wellness presentation support
• Participant & school district calls• Support for benefits, claims,
prior authorizations & referrals• Locate & assign primary care providers• Refer to other BCBS departments

38
Implementation Update: Communicating Changes to TRS-Care Members
16
4 4
10
FY 2018 FY 2019 FY 2020 FY 2021
Touch Points Per ParticipantIncreased mailings and communications to prepare
retirees for transition• Increase in avg contacts per
member before year of plan changes
• Meetings, webinars, direct mail, emails, and web traffic all increased

39
Implementation Update: High Volume of Work Completed
High volume of tasks completed on top of existing duties
• ActiveCare: +1,600 action items• Example: Collect PCP selections
through bswift when district vendor cannot
• TRS-Care: +650 action items• Example: Establish IVR phone
routing from BCBSTX for members asking for HIB staff
Workstreams
Enrollment & Eligibility
Customer Service
Network
Benefits
Comms
Contracting

40
TRS-Care: Call Volumes Increased in December During Implementation
0%
20%
40%
60%
80%
100%
September October November December
Service Level (HIB & ACT)
26,222 28,770 26,266
40,979
10,058 10,239 11,230
15,495
September October November December
TRS-Care Calls ReceivedReceived by Carriers Received by ACT & HIB
Service Level for Carriers is 90% within 1 Minute

41
Implementation Update: Outcomes
Everyone enrolled
ID cards distributed
Care transitions occurred
Scripts filled
Premiums collected
Calls answered
timelyLargest transition of members in TRS history
• All key dates achieved• Very few escalations by
members• +800,000 ID cards distributed
to members

TAB 12

Brian GuthrieAndrew RothAdam FambroughBilly LoweJennifer Whitman
TEAM ProgramPresentation

TEAM TIMELINE
2
2009 - The Next Generation (TNG) Project2009 - ERM Spotlight Report – Legacy system a risk2010 - Educational Tour2010 - Developed a Roadmap for TEAM2011 - Included TEAM in the 2011–2015 TRS Strategic Plan 2012 - Developed RFO for LOB System Replacement2013 - HP selected as the LOB vendor Oct 20132014 - TEAM officially kicked off Jan 20142017 - Phase 1 Go Live Oct 20172020 - Terminated the contract with Perspecta (formerly HP) Feb 2020

TEAM – TAKING ON REMAINING DEVELOPMENT IN-HOUSE
3
ISSUE ENCOUNTED WITH PERSPECTA RESOLUTION BY BRINGING IT IN-HOUSE1. Waterfall methodology used by Perspecta resulted in
difficulty adapting to changing business prioritiesTwo of the twelve principles behind the Agile methodology being used by TRS are:• Early and Continuous Delivery of Valuable Software• Embrace Change
2. Quality of the product being delivered by Perspecta The Agile methodology produces smaller, more frequent releases, which means fewer chances of defects in the final product
3. Attrition of key Perspecta staff The key TEAM Program team are TRS staff, which has an extremely low attrition rate
4. Continued company buyouts after the initial contract signed with Hewlett-Packard (HPSL)
Ownership of the solution stays with TRS, whose only purpose is to serve its membership
5. Contractual bound to two major phase deployments Split the remaining Phase 2 phase release into multiple releases as defined in the TRUST Incremental Release plan
FACTORS FOR THE DECISION

WHY UNDERTAKE TEAM
4
Why was the Legacy System a risk?(Before) (After)
Teacher Retirement System of Texas - Application Portfolio - DraftUpdated: 9/2/2011, Version: 8.0Author: Simon Robe,
1.0 7/6/2011 Inital template. Imported form Forester application asssessment documents2.0 7/13/2011 Initial layout3.0 7/14/2011 Includes ERP and member records meetings4.0 7/21/2011 Includes more member records, payrol and health insurance meetings. All interfaces transcribed. Second layout.5.0 7/22/2011 Updated with complexity metric and banding. Added Application groups6.0 7/27/2011 Updated after first review. Added data base and shared service boxes.7.0 8/3/2011 Remaining review transcriptions and re-layout8.0 8/3/2011 Proofed. Added Property Inventory and OPIN. E-Mailed to TRS
Change Log
Integration %
SUMMARYBusiness Functions : Member RecordsSource : ..?IT Contact : ..?Owner : ..?Languages : NaturalDatabases : AdabasePlatforms : ..?Middleware : ..?Comments : ..?
Employee Member
Employee Member Account
_
Employee Member Data
TRSP - TRS PayrollA copy of the USPS state payroll data forthe 500 or so TRS employees. Replicatessome of the fuctionality of the TRAQS andMEMR applications but separates the data
for privacy reasons. Produces the datarequired to produce annual statements for
employees.
Workflow %Logging / Audit %
Reporting / Analytics %
Remaining Functionality %
SUMMARYBusiness Functions : General AccountingSource : CustomIT Contact : Deering Blazer/Travis GageOwner : Jamie MichelsLanguages : NaturalDatabases : DB2Platforms : MainframeMiddleware : TIBCOComments : ..?
Budget Line Item
TRS Fund
Department
Contracts
Expense Category
_
Budget Sub LedgerTRS operating budget and related expense and payment information. Vendor and
contract information.DBMS : ADABAS 8.1.3
Associated Applications : BEVO, GLASAccess Tools : Natural 4.2.3
Data Exchange : Texas Building and Procurement ComissionProduction Date : 1991
_ _
Shared Services
BEVO - Budget, Expense, and VoucheringTracks TRS operating budget and related expenses. Tracks contracts related tooperating expenses. Generates payment requests which are sent to the Uniform
Statewide Accounting System (USAS). Provides reports for central and departmentalmanagement. Stores data used in answering budget/expenditure questions from TRS
Board, central agencies, legislature.
Outbound Correspondence %
Workflow %Logging / Audit %
Integration %
Reporting / Analytics %
Remaining Functionality %
SUMMARYBusiness Functions : Benefit ProcessingSource : CustomIT Contact : Linda BrownOwner : Liz OliphintLanguages : NaturalDatabases : ADABASPlatforms : MainframeMiddleware : ..?Comments : ..?
Member
Member Account
_
Claim
Death Beneficiary
_
Claims DataInformation needed to process all member death claims madeby beneficiaries. Processing information is transferred from
the Member Records and Annuity Payroll databasesdepending on the status of the member at the time of death.
Contains additional processing and tracking information that isentered and maintained through on-line applications.
DBMS : ADABAS 8.1.3, DB2 9Associated Applications : DCLM
Access Tools : Natural 4.2.3Data Exchange : N/A
Production Date : 1988
NLTRService : Letter Writing
ProfileService : GUI and Workflow
IDEN/SAASService : Security
DJDCService : Report Distribution
ReportsProdService : Report Distribution
Shared Services
DCLM - Death ClaimsSystem designed to process all claims by beneficiaries including lump sum
death benefits and continuing retirement options.
Reporting / Analytics %
SUMMARYBusiness Functions : General AccountingSource : CustomIT Contact : Deering Blazer/Travis GageOwner : Jamie MichelsLanguages : NaturalDatabases : ADABASPlatforms : MainframeMiddleware : ..?Comments : ..?
GL Account
TRS Fund
Ledger
Fiscal Year
GL Transaction
_
General LedgerGeneral ledger transactions and balances. USAS interface
tracking and cash reconciliation.DBMS : ADABAS 8.1.3
Associated Applications : BEVO, GLASAccess Tools : Natural 4.2.3
Data Exchange : Texas Comptroller of Public AccountsProduction Date : 1991
IDEN/SAASService : Security
DJDCService : Report Distribution
Shared Services
GLAS - General Ledger Accounting SystemTracks TRS General Ledger. Tracks cash received at TRS. Creates
reports and spreadsheets for cash reconciliation. Stores & reports USAScash info. Stores USAS payment info for non-member-benefit transactions.
Tracked at the fund level.
Workflow %Logging / Audit %
Reporting / Analytics %
Remaining Functionality %
SUMMARYBusiness Functions : CARESource : CustomIT Contact : Linda BrownOwner : Bob JordanLanguages : NaturalDatabases : ADABASPlatforms : MainframeMiddleware : ..?Comments : ..?
Member
Member Insurance Plan
Insurance Plan
Plan Options
Insurance Premium Payments
_
Member Health Insurance Data
HEIN - Care Group Health InsuranceMaintains information regarding health insurance coverage for all eligiblepublic school members, retirees, and dependents. Claims are handled byAETNA. TRS and AETNA exchange coverage information electronically.
Remaining Functionality %
SUMMARYBusiness Functions : TelecomSource : Package/CustomIT Contact : ..?Owner : Kyle WeigumLanguages : NaturalDatabases : ADABAS/DB2/VSAM/HIPATHPlatforms : MainframeMiddleware : ..?Comments : ..?
NLTRService : Letter Writing
Shared Services
Member Calls
_
_
Call Data
IVR - Interactive Voice ResponseAllows members a self-service option for interacting with TRS. IVR classifies the
purpose of member calls and routes call to appropriate Benefit Counselor.
Remaining Functionality %
SUMMARYBusiness Functions : MDSSource : Package/CustomIT Contact : Cherylene PalmerOwner : Jimmie SavageLanguages : vb.netDatabases : SQL SVRPlatforms : Mainframe with a partitionMiddleware : ..?Comments : The current version has a seperate login. The new version will use Active Directory. Includes a VBap[plication for direct access but most access is through the Profile interface.
Remaining Functionality %
SUMMARYBusiness Functions : Open SystemsSource : PackageIT Contact : Nobody in-houseOwner : Juan WassenLanguages : unknownDatabases : OraclePlatforms : Unix ServerMiddleware : ..?Comments : ..?
Images
FileNet - Panagon ImageThis system performs Imaging and document management. Document Management
gives our Records Manager the necessary control of the life cycle of a TRSdocument. This includes security and access of the document.
Document
Member
Reporting Entity
Document Type
_
_
Document Indexing DataThis database is an index of all imaged documents for all active and retired
members of TRS. The index values are the key to randomly accessing imageddocuments from optical storage.
DBMS : Oracle8i 8.1.7.4.0, SQL Server 2005Associated Applications : Member Profile, Imaging, Filenet Panagon Imaging Services
Access Tools : Filenet Panagon 3 and Visual Basic 6Data Exchange : N/A
Production Date : 1984
Imaging - ImagingThe Imaging application is an in-house customization of FileNet’s Panagon IDM Desktop.
It is designed for business users to access imaged member documents that are storedon the FileNet Image Server. It enables the business users to view documents out of aworking queue in conjunction with the TRS Profiles application, which is a GUI interfacefor users to enter member data into the mainframe system via the terminal emulator and
screen scraping. Users can also enter data directly into the mainframe system via theterminal emulator application (Attachmate Extra!). The program also allows for ad hocqueries via File Search. The application also maintains user information such as user’s
department id, team id and menu access levels on a Microsoft SQL Server database.The SQL Server database also stores various log files for reporting and audit trail
purposes. Hard-copy documents are scanned into the system and converted to imagesand then are indexed and committed in the Records Management department via two
online programs (Batch Scan and Batch Indexing). Both the mainframe-generated formsand TRS Profiles-generated screen shots are automatically indexed and committed intothe image server via a batch processing program called AutoCommit or AutoImage. Thedistributor application, a batch processing program, routes newly-committed documents
to work queues based on batch prefix (batch type) and DocType (Form Number).Documents are also consolidated by tax number and filed in subfolders via the distributor
program.
Payee Address
Payee
Anuitant
Payee Addresses
SUMMARYBusiness Functions : Benefit Accounting/MDS/Benefit ProcessingSource : CustomIT Contact : Greg Speer/Doug Marshall/Wayne FriesOwner : Margie Hoton/Jimmie Savage/LizOliphintLanguages : NaturalDatabases : ADABASPlatforms : MainfraimMiddleware : ..?Comments : Key file is the Benefits Payeefile
PADR - Payee AddressManages a subset of the demographicsfor payees including the payee address.
Outbound Correspondence %
SUMMARYBusiness Functions : Benefit AccountingSource : CustomIT Contact : Charlie VahrenkampOwner : Margir Horton/Art Mata/LizOliphintLanguages : NaturalDatabases : ADABASPlatforms : MainframeMiddleware : ..?Comments : ..?
Form Templates
Form Templates
NLTR - Letter writingGeneralized templated letter
writing service. Supports massmailings (welcome letters) andon-request individual mailings.
Workflow %
Business Rules %
Integration %Reporting / Analytics %
Remaining Functionality %
SUMMARYBusiness Functions : Benefit AccountingSource : CustomIT Contact : Kim Webb /James TullosOwner : Margie HortonLanguages : Natural/JAVADatabases : DB2Platforms : Sun Application Server/Web ApplicationMiddleware : ..?Comments : ..?
Reporting Entity Ledger
Reporting Entity Contacts
Member
Member Account
TRAQS WebSimilar data to the TRAQS Internal data base but accessible outside the
firewall to reporting entities. No historyDBMS : DB2 LUW 9
Reporting Entity Ledger
Reporting Entity Contacts
Member
Member Account
TRAQS InternalPayroll information, TRS contribution amounts, and miscellaneous
information reported to TRS by over 1300 school districts and highereducation entities each month. Includes history. The design is based on
the Enterpise "Legacy" data model. There is a newer version.DBMS : DB2 UD
Associated Applications : TRAQSAccess Tools : Natural 4.2.3
Data Exchange : 1300+ Texas School Districts and Higher EducationProduction Date : 2000
TRAQS - TRS Reporting and QuerySubmission and validation processing and balancing of payroll and
miscellanenous reports required by TRS from reporting entites. System alsoallows for viewing of processing results for both internal and external users.
Logging / Audit %
Business Rules %
Reporting / Analytics %Remaining Functionality %
SUMMARYBusiness Functions : Benefit Accounting/MDS/General AccountingSource : CustomIT Contact : Kim WebbOwner : Margie Horton/Jimmie Savage/Jamie MichelsLanguages : NaturalDatabases : VSAMPlatforms : MainframeMiddleware : ..?Comments : ..?
Life InsuranceBeneficiary
In case of death whilestill a member.
Beneficiary Calculation
Appeal
Member
Child Support
Spousal Support
Payee
Member Account
Member Contract
Member RecordsCurrent year contribution posting information and 25+
years of historical postings for all active records,statistical and biographical information, terminationhistories, active member addresses, and a limited
amount of information regarding the status of areporting entity.
DBMS : ADABAS 8.1.3, VSAMAssociated Applications : Member Records
Access Tools : Natural 4.2.3Data Exchange : N/A
Production Date : 1981
NLTRService : Letter Writing
ProfileService : GUI and Workflow
DJDCService : Report Distribution
IDEN/SAASService : Security
Shared Services
MEMR - Member RecordsMaintains the master membership account information for the current year.
Logging / Audit %
Reporting / Analytics %
Remaining Functionality %
SUMMARYBusiness Functions : Benefit ProcessingSource : CustomIT Contact : Wayne FriesOwner : Liz OliphintLanguages : NaturalDatabases : DB2Platforms : MainframeMiddleware : ..?Comments : There are only 700 members on DROP that isa deprecated program.
Member
Drop Transactions
_
DROP Participant Data
DROP - Deferred RetirementOption Plan
This system administers enrollment andmaintenance of members who elect to work
and accrue funds in a special account.Allows members eligible for retirement to
defer receiving payment in order to accrueinterest on their pension that was taken as aone-time payment when they activate their
payments. No longer offered but stillsupported.
Remaining Functionality %
SUMMARYBusiness Functions : LegalSource : CustomIT Contact : John YagerOwner : Clarke HowardLanguages : vb.netDatabases : SQL SVRPlatforms : ServerMiddleware : Chrystal ReportsComments : Standslone application. Not actually in useas no comnplaints have been filed.
Member
HIPAA Complaint
HIPAA Complaints(HIPAA)
Information related to trackingHIPAA complaints
DBMS : SQL Server 2005Associated Applications : HIPAAAccess Tools : Visual Basic 6.0
Data Exchange : N/AProduction Date : 2003
Active DirectoryService : Authentication and
Authorization
Chrystal ReportsService : Reporting
Shared Services
HIPPA - HIPAA complaintsDatabase
This database is used by the TRS LegalDepartment to track HIPAA complaints.
The types of complaints that are handledare: Use, Disclosure, and HIPAA Rights.A complaint is processed and can havethe following dispositions: Valid, Invalid,Untimely. A complaint can be filed with
OAG, HHS, or both.
Health Insurance
ERP
Remaining Functionality %
SUMMARYBusiness Functions : Benefit CounselingSource : CustomIT Contact : Greg SpeerOwner : Tom GuerinLanguages : NaturalDatabases : ADABAS/DB2/VSAMPlatforms : MainframeMiddleware : ..?Comments : ..?
Identity DataTax Id to data base cross reference
INFO - InformationThe purpose of the INFO system was
originally to provide general informationabout all systems at TRS. Later,commands were added which
consolidates all TRS information for agiven member id number.
Remaining Functionality %
SUMMARYBusiness Functions : ActiveCareSource : CustomIT Contact : John YagerOwner : Bob JordanLanguages : vb.netDatabases : SQL SVRPlatforms : ServerMiddleware : ..?Comments : Standalone application. Tracks insurance claim appeals.
Member
Appeal
Claim
Active Care Appeals (ACAD)Information related to active care appeals.
DBMS : SQL Server 2005Associated Applications : ACAD
Access Tools : Visual Basic 6Data Exchange : N/A
Production Date : 2002
Active DirectoryService : Authentication and
Authorization
Chrystal ReportsService : Reporting
Shared Services
ACAD - ActiveCare AppealsThis database is used by TRS-ActiveCare to track appeals made by
members who are appealing decisions made by Blue Cross/Blue Shieldregarding their coverage. The types of appeals that are tracked are asfollows: Medical, Drug, Eligibility/Enrollment, HIPAA, and Other. Thedatabase has the following choices as reasons why Blue Cross denied
the member’s claim or coverage: Plan Design, Plan Exclusion,Precertification failure, Eligibility/Enrollment, Preexisting condition,
Nonmedical necessity, COBRA, and Other. A single record can containone or more TRS Actions, which are comprised of TRS action
(Administrative, Appeal Committee, Appeal Hearing, TRS AppealConference, and Other), the date the action took place, and comments
about the action. The TRS Executive Director has the final say in anappeal if it is denied and the member requests that the ED review the
case. The database tracks the date of the Executive Director decision,the date the letter about the decision was postmarked, and their
comments about the decision.
Logging / Audit %
Integration %
Reporting / Analytics %
Remaining Functionality %
SUMMARYBusiness Functions : Benefit AccountingSource : CustomIT Contact : Wayne Fries/Doug Marshall/Jed MonroeOwner : Art Mata/Margie HortonLanguages : NaturalDatabases : ADABASPlatforms : MainframeMiddleware : TIBCOComments : ..?
Annuitant
Benefit Payment
Benefit Withholding
_
_
_
Annuity PayrollRepository for all data representing annuities paid to retired
members and other annuitants.DBMS : ADABAS 8.1.3, VSAM
Associated Applications :ALTP,ANPA,BENE,BULL,DCLM,DROP,HEIN,PADR,RETP,RTTS,OPIN
Access Tools : Natural 4.2.3Data Exchange : Texas Department of Human Services, Employees Retirement
System of Texas, Texas Comptroller of Public AccountsProduction Date : 1987
NLTRService : Letter Writing
ProfileService : GUI and
Workflow
DJDCService : Report
Distribution
IDEN/SAASService : Security
Shared Services
ANPA - Annuity PayrollThe Annuity Payroll System supports the administration of TRS
annuities. It adds annuitants from the Retirements System, and hasannuitants added or updated by the Claims System. The Annuity
Payroll System processes monthly benefit payments for allqualifying annuitants, withholding applicable amounts for federaltax withholding, insurance deductions, and association dues. The
system tracks all transactions and issues annual 1099R statementsand other supporting documentation and forms as requested.
Outbound Correspondence %
Business Rules %
Remaining Functionality %
SUMMARYBusiness Functions : Benefit Accounting/ProcessingSource : CustomIT Contact : Greg SpeerOwner : Art Mata/Liz OliphintLanguages : NaturalDatabases : ADABASPlatforms : MainframeMiddleware : ..?Comments : ..?
Payee
Annuitant
_
Alternative Payee Data
ALTP - Alternate PayeeThe purpose of the ALTP system is to
automate ongoing payments, which arepayments deducted from the benefits ofTRS Members or the ongoing benefit to
their beneficiaries. Examples arerollovers, child support payments
Annuity Payroll
SUMMARYBusiness Functions : Benefit ProcessingSource : CustomIT Contact : Ron McGrathOwner : Liz OliphintLanguages : NaturalDatabases : ADABASPlatforms : MainframeMiddleware : ..?Comments : ..?
Member
Member AccountService time, Health
insurance eligibility, Salary,Years of service, Start
dates, District
Eligible Service
Disability
ERS Service
Retirement EstimatesThe pending retirement
estimate is based onexisting data. Other
"What if" estimates arealso stored.
RetirementsAll data necessary for calulating retirement and disability
benefits for a member.DBMS : ADABAS 8.1.3, VSAMAssociated Applications : RET*
Access Tools : Natural 4.2.3Data Exchange : N/A
Production Date : 1989
NLTRService : Letter Writing
Uses the files but not theprocess
ProfileService : GUI and
Workflow
DJDCService : Report
Distribution
ReportsProdService : Report
Distribution
Shared Services
Acronym - 415B SubsystemHandles annuity payments larger than the federal threshold.
415B - 415B SubsystemHandles annuity payments larger than the federal threshold.
RETP - RetirementsInformation needed to transition a member from active service toretirement. Existing salary, service, demographic, and beneficiary
information is transferred from the Member Records database.Contains additional processing and tracking information that is
entered and maintained through on-line applications. Asubmodule handles disability processing for members retiring on
dsiability.
Retirement
Outbound Correspondence %
Logging / Audit %
Integration %
Remaining Functionality %
SUMMARYBusiness Functions : Benefit ProcessingSource : CustomIT Contact : Robert RamirezOwner : Liz OliphintLanguages : NaturalDatabases : ADABASPlatforms : MainframeMiddleware : ..?Comments : ..?
Member
Refund
_
RefundsInformation needed to refund contributions to amember who is terminating service with TRS.
Existing contribution and demographicinformation is transferred from the Member
Records database. Contains additionalprocessing and tracking information that is
entered and maintained through on-lineapplications.
DBMS : ADABAS 8.1.3Associated Applications : REFM
Access Tools : Natural 4.2.3Data Exchange : N/A
Production Date : 1989
REFM - RefundsMember refunds are created when employment hasbeen terminated and required documents have beenreceived by TRS. Refunded amounts are depositedamounts posted on the MEMR file from employmentdate to termination date which get sent back to the
former employee.
Outbound Correspondence %
Logging / Audit %
Business Rules %
Integration %
Reporting / Analytics %
Remaining Functionality %
SUMMARYBusiness Functions : Benefit Accounting/ProcessingSource : CustomIT Contact : Ivan LidakerOwner : Margir Horton/Art Mata/Liz OliphintLanguages : NaturalDatabases : ADABASPlatforms : MainframeMiddleware : ..?Comments : ..?
Member
Service Entitlement
_
SSBB DataInformation related to member purchaseof special services such as withdrawn,
military, out-of-state, etc. Includes billingand purchase agreement information.
DBMS : ADABAS 8.1.3, DB2 9Associated Applications : SSBB
Access Tools : Natural 4.2.3Data Exchange : Texas Comptroller of Public Accounts
Production Date : 1992
SSBB - Special Service Buy-Back
The Special Service Buy-back applicationallows the purchase of previously withdrawn
TRS service, the purchase of previous militaryservice, and the purchase of qualified out-of-
state service.
Miscellaneous
Remaining Functionality %
SUMMARYBusiness Functions : ..?Source : ..?IT Contact : ..?Owner : ..?Languages : Visual Basic .netDatabases : DB2Platforms : ..?Middleware : EntireXComments : ..?
Department
Budget Line Item
Fund
_
Expense Category
Enterprise Data Base
TBRS - Budget RequestUsed by TRS management and accounting staff for the
purpose of viewing, editing, and submitting theirdepartment's budget for upcoming fiscal years.
Remaining Functionality %
SUMMARYBusiness Functions : Benefit ProcessingSource : CustomIT Contact : Linda BrownOwner : Liz OliphintLanguages : NaturalDatabases : DB2Platforms : MainframeMiddleware : ..?Comments : This is another view of theClaims Benficiary files. It has beensporadically maintained ans is one of thesources of data quality issues.
Annuity Beneficiary
Annuitant
_
Beneficiary MasterData
Pension beneficiaries (lumpsum or monthly)
DBMS : Adabase
BENE - BenficiaryThis system is used to add andmaintain beneficiary information
for annuitants both living anddeceased.
Remaining Functionality %
SUMMARYBusiness Functions : BenefitProcessingSource : CustomIT Contact : Kim WebbOwner : Liz OliphintLanguages : NaturalDatabases : VSAMPlatforms : MainframeMiddleware : ..?Comments : ..?
MEMB - MemberBenefits
DescriptionUsed tomaintain “Black Book”
information and printrequests for service
billing. There is a dataentry screen for adding
and maintaininginformation on districts
such as: ineligible salarypayments, salary
applications, career ladderpayments, etc.
SUMMARYBusiness Functions : Benefit ProcessingSource : CustomIT Contact : Java DudesOwner : Craig NicholasLanguages : JAVA /NaturalDatabases : DB2/ADABASPlatforms : Sun Application Server/Web ApplicationMiddleware : ..?Comments : ..?
_
_
_
TRS Rapid InformationExchange (SchoolCalendar) (TRIX)
School district reporting entitiescalendar year information
DBMS : DB2 LUW 9Associated Applications : TRIX
Access Tools : JAVA2Data Exchange : N/A
Production Date : 2002
TRIX - TRS RapidInformation exchange
Web-based school district reporting entitiescalendar year information
Shared Services
Remaining Functionality %
SUMMARYBusiness Functions : Benefit Accounting/Processing/CARESource : CustomIT Contact : Linda BrownOwner : Art Mata/Liz Oliphint/Margie Horton/FrankDilorenzoLanguages : NaturalDatabases : SequentialPlatforms : MainframeMiddleware : ..?Comments : ..?
Bulletin
Bulletin Data
BULL - Bulletin BoardMessage system for pertinentinformation pertaining to active
members and annuitants (keyed off oftaxID). This can be a general messagerelating to an alternate payee, healthinsurance, or an “Owes TRS” bulletin.
Outbound Correspondence %
SUMMARYBusiness Functions : InvestmentsSource : CustomIT Contact : JAVA dudesOwner : Howard Goldman, Margie HortonLanguages : JAVADatabases : DB2Platforms : Sun Application Server/WebApplicationMiddleware : ..?Comments : ..?
_
_
_
TRS Email System(TRSU)
TRS employees email the TRSUpdate and general email to
reporting entities and the TRSNews to members signed up
through MEAC.DBMS : DB2 LUW 9
Associated Applications : TRSUAccess Tools : JAVA2Data Exchange : N/A
Production Date : 2005
TRSU - TRS EmailSystem
TRS employees email the TRSUpdate and general email to
reporting entities and the TRS Newsto members signed up through
MEAC.
RE - ReportingEntities
1300 reporting entitiesincluding school districts,
charter schools and highereducation institutions.
From : RETo : TRAQS
Membership InformationFrequency : Ad hoc
From : TRSUTo : RE
Informational Emailmessages
From : RETo : TRAQS
Payroll contribution dataand SSBB deductions
Frequency : Monthly
From : TRAQSTo : MEMR
Membership Information
From : TRAQSTo : MEMR
Verfied contribution data
TINS - ControllerController's office.
uitse
he3,
onnPA
EAc
icerk
From : PADR
To : TINS
USAS - Uniform Statewide Accounting System
From : BEVOVouchers (mostly vendors
and operating paymentrequests)
To : USASVouchers (mostly vendors
and operating paymentrequests)
From : USASTo : GLAS
Payment confirmations andcash liquidation
transactionsTechnology : ftp processed by
AP1200Frequency : Daily
AETNA - AETNAHealth Insurer for members
From : AETNATo : HEIN
Membership confirmationinformation
Technology : Excel SpreadsheetFrequency : Bi-Annual
Used to check eligibility recordsconsistency
From : HEINTo : AETNA
Eligibility changesFrequency : Weekly
Business Rules %
SUMMARYBusiness Functions : Member ServicesSource : CustomIT Contact : JAVA dudesOwner : Liz OliphintLanguages : JAVADatabases : DB2Platforms : Sun Application Server/Web ApplicationMiddleware : ..?Comments : This is a member web site that does not requireauthentication and signon.
Request
_
_
Online Self ServiceApplications
(OSSA)Web-based Retirement Calculators
DBMS : DB2 LUW 9Associated Applications : OSSAAccess Tools : JAVA2, Natural
Data Exchange : N/AProduction Date : 2002
OSSA - Online Self ServiceApplications
Web-based Retirement Calculators, RequestWithdrawn Service Bill, Request Retirement
Estimate
Member Records
SUMMARYBusiness Functions : Benefit AccountingSource : CustomIT Contact : ..?Owner : Kimm Webb, Doug MarshalLanguages : Cobol, NaturalDatabases : VSAM, DB2Platforms : MainframeMiddleware : ..?Comments : ..?
Annuitant
Annuitant Work Hours
_
EAR Data
EAR - Employment AfterRetirement
Employment after retirement processingof report details as submitted by reporting
entities. This information is utilized toensure compliance with applicable lawsand rules regarding employment after
retirement.
From : BEVOTo : TBRS
Departmental budget andactuals
Technology : BatchFrequency : Annual (Feb)
From : TBRSTo : BEVO
Departmental budget andactuals
Technology : ManualFrequency : Annual
TBRS creates Excel spreadsheetbudgets. When approved, this
spreadsheet is then entered backinto BEVO.
From : BEVOTo : GLAS
Payments summary, e.g,payroll cash receipts and
manually entered paymentsTechnology : BatchFrequency : Daily
From : EBExcess benefits data 415B
Frequency : Monthly
To : USPSExcess benefits data 415B
Frequency : Monthly
USPS - State Payroll System
pa
udd
Da
Wrut
e
Se
d S
syha
From : USPSPay details for TRS
employees.Frequency : Monthly/Daily
In future, details of work hours will beincluded to calculate impact oneligibility of leave without pay.
To : TRSPPay details for TRS
employees.Frequency : Monthly/Daily
In future, details of work hours will beincluded to calculate impact oneligibility of leave without pay.
From : USPS415B Payments. Highcontribution retirement
deposits.Frequency : Monthly
To : EB415B Payments. Highcontribution retirement
deposits.Frequency : Monthly
From : USPSTRS employee data.
Address, budgeted salary.Technology : ftpFrequency : Daily
To : HRTRS employee data.
Address, budgeted salary.Technology : ftpFrequency : Daily
fofofe
et
From : TRSPPay data entries for each
department (budgetactuals)
Technology : Batch File
To : BEVOPay data entries for each
department (budgetactuals)
Technology : Batch File
rt
up
From : GLASVoucher document
numbers
To : REFMVoucher document
numbers
From : DCLMTo : GLAS
Voucher documentnumbers
m : Teach
From : GLASVoucher document
numbers
To : ANPAVoucher document
numbers
From : GLASTo : BEVO
Voucher documentnumbers
LB - Controller's LockBox Application
From : LBTo : GLAS
Lock Box payments. Usedto confirm paymentpostings in GLAS.
Technology : BatchFrequency : Daily
From : USASVendor / Employee 1099s.These are recomputed by
BEVO.
To : BEVOVendor / Employee 1099s.These are recomputed by
BEVO.
IRS - Internal Revenue Service
Systtes
O
From : BEVORecomputed 1099s
To : IRSRecomputed 1099s
SB - State St Bank
From : GLASTo : SB
Investment summary info topost in journalling file
Frequency : 3 entries per month
IRS - InternalRevenue Service
From : ANPATo : IRS
1099s
n
n/
m
Ne
ee
e
R
From : REFM1099s
To : IRS1099s
G
nsa
in
As
E
AStio
From : REFMTermination transactions
(Savings to retired)Frequency : Daily
To : USASTermination transactions
(Savings to retired)Frequency : Daily
DSHS - Texas DSHS
From : DSHSTo : DCLM
Deaths
From : TRAQSTo : RE
Membership InformationInvalid RecordsFrequency : Ad hoc
From : RETo : TRAQS
Employment AfterRetirement Report. Workhours required to check
eligibility.Frequency : Monthly
From : RETo : TRAQS
Miscellaneous informationrequired from reporting
entities in order to identifyinvalid payments.
Frequency : Monthly
From : TRAQSTo : RE
Invalid Employment afterretirement records
Frequency : Monthly
TXNET -Controller's application
From : TXNETTo : TRAQSPayment deposit
confirmationsFrequency : Daily
From : TRAQSPending subledger
transactions
To : GLASPending subledger
transactions
From : MEMRTo : LGRS
Archived member data andledger information
Frequency : Annual
Remaining Functionality %
SUMMARYBusiness Functions : Benefit AccountingSource : CustomIT Contact : Kim WebbOwner : Margie HortonLanguages : NaturalDatabases : VSAMPlatforms : MainframeMiddleware : ..?Comments : ..?
Life InsuranceBeneficiary
In case of death whilsstill a member.
Beneficiary Calculation
Appeal
Member
Child Support
Spousal Support
Payee
Member Account
Member Contract
Member RecordsArchived previous year member account information.
DBMS : ADABAS 8.1.3, VSAMAssociated Applications : Member Records
Access Tools : Natural 4.2.3Data Exchange : N/A
Production Date : 1981
LGRS - Member RecordsArchived member account information
From : MEMRTo : RETP
Member recordsFrequency : Daily
Copy is persisted in the retirmentsystme for termination processing,
e.g., paid military time, last salaries,out-of-state time, DOB, service
years.
From : RETPTo : MEMR
Request to terminateFrequency : Daily
From : RETPTo : GLAS
Termination transactions(Active savings to
retirement reserve)
From : MEMRTo : GLAS
Termination transactions(Active savings to
retirement reserve)
From : MEMRTo : REFM
Member recordsFrequency : Daily
Copy is persisted in the retirmentsystme for termination processing
From : REFMTo : MEMR
Request to terminateFrequency : Daily
From : SSBBTo : MEMR
Confirmed account credits
From : MEMRTo : SSBB
Memeber name and DOB
From : TRAQSTo : SSBB
SSDTechnology : BatchFrequency : Daily
Remaining Functionality %
SUMMARYBusiness Functions : ActiveCareSource : CustomIT Contact : John YagerOwner : Bob JordanLanguages : vb.netDatabases : SQL SVRPlatforms : ServerMiddleware : Crystal ReportsComments : Stand alone application. Tracks only changes to coverage inital andongoing eligability and membership is tracked elsewhere.
Active DirectoryService : Authentication and
Authorization
Chrystal ReportsService : Reporting
Shared Services
Member
Medical Insurance Plan
Plan Option
Plan Changes
_
_
Acive Care Exceptions
ACED - ActiveCare ExceptionsThis database is used by TRS Active-Care to track enrollment exceptionsby school district employees. The types of requests that are handled are:
Administrative Action, Add Dependent(s), Annual Enrollment, AddEnrollee, Change Effective Date, COBRA Enrollment, Credit/Funding,
COBRA Plan Change, COBRA Reinstatement, COBRA Extension,Decline Coverage, Drop Dependent(s), Drop Enrollee, Initial Enrollment,Not Applicable to ActiveCare, Plan Change, Plan Change, and SpecialEnrollment. The requests are processed and a decision is made. The
types of decisions are: Approved, Allow 15 Days to Close, Denied, Dropis no further restrictions, Forwarded to other TRS Department, Pending,Referred to Appeals Committee, Resolved Issue, Request Withdrawn,
Special Future Enrollment, and Split Decision.
GL Tra
P llFrom : DCLM
TerminationsThis is a direct update by DCLM; not
strictly an interface
To : HEINTerminations
This is a direct update by DCLM; notstrictly an interface
Caremark - CaremarkPharmacy insuranceFrom : HEIN
To : CaremarkEligibility changes
RDS - Retiree DrugSubsidy
Texas program thatprovides a subsisdy for
some drug costs.
From : HEINTo : RDS
Eligible members
From : RDSTo : HEIN
Eligibility confirmations
ining Func
Fund
D ptuals
P yh receipts
Rec
From : HEINVouchers and refunds
Frequency : Weekly
To : GLASVouchers and refunds
Frequency : Weekly
BCBS - Blue CrossBlue Shield of Texas
From : BCBSTo : HEIN
Members moving thierhealth care over to
retirement
FroFrom : HEIN
Insurance contributiondeductions
To : ANPAInsurance contribution
deductions
From : TRAQSInsurance billing payments
To : GLASInsurance billing payments
From : ONACPayment info. Gross/netpay and IRS deductions
To : ANPAPayment info. Gross/netpay and IRS deductions
? - ?Private supplier of death notifications
From : DCLMTo : ?
Member listings
From : ?To : DCLM
Deaths
From : MEMRTo : GLAS
DROP AdjustmentFrequency : Annual
From : RETPTo : ANPA
Retirement DataThis is the calculated retirement data.
Annuity, PLSO (Paritla Lump SumOption), Years of Service, Start Date,
etc.
From : TRAQSTo : ONAC
Limited memberdemographics
Long name, birth date
From : MEMRMember and annuitants
recordsIncludes annual statemnts, 1099 data
To : ONACMember and annuitants
recordsIncludes annual statemnts, 1099 data
From : REFMTo : ONAC
Member records
From : SSBBTo : ONAC
TRUS
r s
Fil
of tMR
f
t
From : RETP
To : ONAC
rate
QS
y of
S
hlwo
alc
ns
t ::
ngDD
esuc
uaoy
From : RETPMember tax withholding
Entered online
To : ONACMember tax withholding
Entered online
From : DROPTo : ONAC
Member records
From : ONACIs this the batch auto issue
process? In that case itshould go through Imaging.
To : PADRIs this the batch auto issue
process? In that case itshould go through Imaging.
This systembers w
ccount.
R cords
From : TRSPActuarial data
Frequency : Fiscal year endAggregated data. Check this?
To : TRAQSActuarial data
Frequency : Fiscal year endAggregated data. Check this?
From : TRSPTo : MEMR
Dump of TRS employeeend of year statement data.
Frequency : Annual
From : TRAQSTo : RE
Active Care billing dataFrequency : Monthly
/M
S
e
?
cofofof
F
From : SSBBBuy Back Contributions
Frequency : MonthlyVolume : 1-2 per month
To : GLASBuy Back Contributions
Frequency : MonthlyVolume : 1-2 per month
From : DROPTo : MEMR
End of year money transferFrequency : Annual
ging
unti
ervvrvr
From : REFMRequest for information oftermination refund data
Frequency : On Request
To : TRAQSRequest for information oftermination refund data
Frequency : On Request
From : TRAQSTo : SSBB
District deposit balancesFrequency : Daily
From : TRAQSTo : SSBB
SSB PaymentsFrequency : Daily
From : INFOTo : TRSP
Technology : EntireX
y : Daily
the 500i ality of the T
d ta
From : TRAQSRetiree hours
Technology : Direct UpdateFrequency : Every 30 minutes
Volume : One dataset per entity permonth
To : EARRetiree hours
Technology : Direct UpdateFrequency : Every 30 minutes
Volume : One dataset per entity permonth
SUMMARYBusiness Functions : ISSSource : CustomIT Contact : Charlie VahrenkampOwner : T.A. MillerLanguages : NaturalDatabases : DB2Platforms : MainframeMiddleware : ..?Comments : Part manual process and part batchjob.
Ex-Spouse Court Orders
_
_
800.005 Data
804.005 - 804.005 PayeeFile managed in the Temporary Work Filelocation that tracks ex-spouses who areallocated a portion of a retiree's pension.
Not considered an application.
Rem
emmb
ngpp
be
From : 804.005804.005 Payee payment
amountsFrequency : Monthly
To : GLAS804.005 Payee payment
amountsFrequency : Monthly
From : ALTPTo : ANPA
Alternate payee voucherdata
From : PADRAlternate payee voucher
data
To : ANPAAlternate payee voucher
data
Reporting
Member Counsellingand Services
FUNCTIONFunctional Group : RetirementPrimary Users : ..?# Of Users : ..?Business Functions : ISSCriticality : ..?Primary Data Subjects : ..?
Member
_
ERS Data
ERST - ERS ServiceERS sends a file to verify a subset of
retirees with TRS and to bill TRS
FUNCTIONFunctional Group : ServicesPrimary Users : ..?# Of Users : 50-60Business Functions : ISSCriticality : ..?Primary Data Subjects : ..?
Report Distrifbution Rules
Report Templates
_
ReportManagement Data
DJDC - ReportDistribution
System designed to allow thespecification and distribution of
reports.
Remaining Functionality %
FUNCTIONFunctional Group : MiscellaneousPrimary Users : ..?# Of Users : ..?Business Functions : Internal AuditCriticality : ..?Primary Data Subjects : ..?
Audit Recommendation
_
_
Audit RecommendationTracking (ARTS)
Information related to tracing audit findingsand recommendations.
DBMS : SQL Server 2005Associated Applications : ARTSAccess Tools : Visual Basic 6
Data Exchange : N/AProduction Date : 2001
ARTS - Audit RecommendationsTracking System
The ARTS system is used by Internal Audit staff totrack their findings and recommendations.
Quarterly reports are generated by the databaseand used for presentation to the TRS Board of
Trustees audit committee. These consist ofImplemented, Non-Implemented – Less than 1
Year, and Non-Implemented – More than 1 Yearreports. Other reports are used for Internal Audit’s
use. Some of these include: ImplementationDelayed, Divisions/Departments, and Audit Type.
Inbound Correspondence %
FUNCTIONFunctional Group : MiscellaneousPrimary Users : ..?# Of Users : 7Business Functions : ..?Criticality : ..?Primary Data Subjects : ..?
Job Posting
Job Applicant
Interview
Department
HR DataEnterprise database tables.The IDEN (security)and COM (addresses, emails and phones) are
shared. Most tables are job-related and used byJPATH only.
DBMS : Db2Associated Applications : JPATH
Data Exchange : N/AProduction Date : 2010
JPATH - Job Posting/ApplicantTracking
Description
Remaining Functionality %
FUNCTIONFunctional Group : ERPPrimary Users : ..?# Of Users : ..?Business Functions : ISSCriticality : ..?Primary Data Subjects : ..?
Employee
Department
_
Database
HR - HR DataWarehouse
Remaining Functionality %
FUNCTIONFunctional Group : MiscellaneousPrimary Users : ..?# Of Users : 220Business Functions : Special ProjectsCriticality : ..?Primary Data Subjects : ..?
_
_
_
403B Exchange403B InformationDBMS : DB2 LUW 9
Associated Applications : 403BAccess Tools : JAVA2
Data Exchange : 403B CompaniesProduction Date : 2007
FOTB - 403(b) WebApplication
Web-based application showing403(b) products and fees.
Remaining Functionality %
FUNCTIONFunctional Group : MemberServicesPrimary Users : ..?# Of Users : 250000Business Functions : ..?Criticality : ..?Primary Data Subjects : ..?
Integration %FUNCTIONFunctional Group : Member ServicesPrimary Users : ..?# Of Users : ..?Business Functions : ..?Criticality : ..?Primary Data Subjects : ..?
EL - Enterprise LoadInterface application that synchronises the mainframe member data with the ONAC data. This is a two-way feed
Member
_
_
Member Account
_
_
Member Contact
_
_
_
_
_
Online Personal Access (OAPI)Active members account information.
DBMS : DB2 LUW 9Associated Applications : OAPI
Access Tools : JAVA2, Natural 4.2.3Data Exchange : N/A
Production Date : 2002
ONAC - My TRSOnline Access for members, retirees, and beneficiaries receiving a continuing annuity. Includes access to 1099-Rs, addresses, annualstatements, withholding information, and other information. Allows members to register for presentations, subscribe to TRS-Connect
publications and submit requests for retirement, replacement packets and service purchase bills.
From : IVRTo : TCCCall log data
SUMMARYBusiness Functions : Annuity PayrollSource : ..?IT Contact : ..?Owner : ..?Languages : NaturalDatabases : AdabasePlatforms : MainframeMiddleware : ..?Comments : This function is part of the TRSP applicationas it is performed by the same depertment but is entirelyindependent of the TRS payroll function.
Annuitant
415B Payment
415B Data
EB - Excess BenefitsProcess monthly 415B payments forannuitants who recive more than the
federally restricted pension amount. Thedifference is made up by the state.
bbe
be
Da
From : TCCIn-house appointments with
potential retireesTechnology : Entire X
Frequency : On Request
To : RETPIn-house appointments with
potential retireesTechnology : Entire X
Frequency : On Request
From : PADRTo : BENE
Beneficiary addressesThis is initiated via a profile interface.
FUNCTIONFunctional Group : ServicesPrimary Users : ..?# Of Users : 50-60Business Functions : ISSCriticality : ..?Primary Data Subjects : ..?
Report
ReportManagement
Data
RPROD - Reports ProdSystem for writing reports as PDFs
to shared folders.
FUNCTIONFunctional Group : ServicesPrimary Users : ..?# Of Users : 50-60Business Functions : ISSCriticality : ..?Primary Data Subjects : ..?
Form Templates
Form Templates
LifeCycle - LCAdobe replacement product for
Exixior for creating custom forms.
From : ALTPBeneficiary addresses
To : EBBeneficiary addresses
From : BENETo : EB
Beneficiary data
From : RETPTo : ANPA
Annuity Corrections, e.g., toadjust for late bonuses or
mis-entered data.Technology : MANUALLY Entered
From : RETPTo : ALTP
trustee rollover withholdinginfo
%
From : 415BAs new hire
To : USPSAs new hire
From : 415BTo : ANPA
415B calculation data
OP - D
ABASms : M
Miid
From : SSBBEligible service years.
Annual salary
To : RETPEligible service years.
Annual salary
From : DCLMBeneficiary data
To : RETPBeneficiary data
From : EBTo : ANPA
415B Payments
From : HRTo : JPATHemployees and
departmentsRemaining Functionality %
SUMMARYPrimary Users : ..?Technologies : ..?Business Functions : ..?Comments : ..?Ownership : ..?ITGroup : ..?Owner : ..?Languages : 0Databases : ..?Platforms : ..?Middleware : ..?
DJDCService : Report Distribution
Shared Services
SRD - State ReportDistribution
Receives reports generated by thestate systems and distributes them
within TRS
From : USASState-produced reports
To : SRDState-produced reports
From : USPSState-produced reports
To : SRDState-produced reports
From : TRIXTo : MEMB
School calendar data
From : ONACTo : TCC
Online member requestactivity
Technology : ODBC
From : ONACTo : TCC
Field AppointmentsTechnology : ODBC
SUMMARYPrimary Users : ..?Technologies : ..?Business Functions : ..?Comments : Dashboard is a series of Profile screens with the addition of an IVRinterface and a call logging data base.Ownership : ..?ITGroup : ..?Owner : ..?Languages : 0Databases : SQL ServerPlatforms : WindowsMiddleware : EntireX
ProfileService : GUI and Workflow
Batch FormsService : Outbound
Correspondence
ImagingService : Imaging
Shared Services
Member Calls
_
_
Call Data
TCC - DashboardProvides information from various applications to the telephone counselorsand personnel in TRS-Card. Logging data is stored for reporting purposes.
a
A
Tdep
y :
AAsces
asn D
FM
From : TRAQSDistrict info
Technology : EntireX
To : TCCDistrict info
Technology : EntireX
From : SSBBService years purchased
with rollover money.
To : DCLMService years purchased
with rollover money.
RecR
Usesproce
SDistribu
e
ALTPof th
menbenefit
From : PADRPayee addressses
To : DCLMPayee addressses
From : MEMRTo : DCLM
Active member deaths
To : GL
From : ANPARetiree Deaths
To : DCLMRetiree Deaths
M
Muency
the rsing,
Retireretir
e
From : ALTPAlternate payee rollover
addresses
To : DCLMAlternate payee rollover
addresses
From : DCLMTo : TRAQSReported deaths
Remaining Functionality %
FUNCTIONFunctional Group : Shared ServicesPrimary Users : ..?# Of Users : ..?Business Functions : ..?Criticality : ..?Primary Data Subjects : ..?
TablesMiscelaneous tables
TBMA - TableMaintenance
Miscellaneous tables used for codes,security access lists and totals.
Remaining Functionality %
FUNCTIONFunctional Group : Shared ServicesPrimary Users : ..?# Of Users : ..?Business Functions : ..?Criticality : ..?Primary Data Subjects : ..?
TablesMiscellaneous tables
TABL - Table LookupMore static lookup tables, e.g.,
holidays. Currently deprecated withno new tables in favor of TBMA.
Remaining Functionality %FUNCTIONFunctional Group : Shared ServicesPrimary Users : ..?# Of Users : ..?Business Functions : ..?Criticality : ..?Primary Data Subjects : ..?
TablesMiscellaneous tables
PARM - ParametersPARM is a small system that sets up
and displays records that othersystems use for such things as record
counters, run times, flags, and soforth. The system itself does no
processing of any kind, produces noreports, and runs no batch programs.
Remaining Functionality %
FUNCTIONFunctional Group : Shared ServicesPrimary Users : ..?# Of Users : ..?Business Functions : ..?Criticality : ..?Primary Data Subjects : ..?
Work RequestsQueued work requests
TW - Temp WorkAn adabase file used to queue work
requests. Effectively a workflowqueuing mechanism.
Integration %
SUMMARYBusiness Functions : ..?Source : CustomIT Contact : Yalin, Greg Noll, LissetteOwner : ..?Languages : VBDatabases : see commentPlatforms : see commentMiddleware : ..?Comments : ..?
NLTRService : Letter Writing
ImagingService : Workflow and Inbound
Correspondence
Shared Services
TRSP - ProfilesConsolidated internal membershipinformation for internal use. This
application provides a common interaceto multiple applications and is organizedaround particular functions, e.g., Benefit
Profile. Typically invokes CICScommands using an emulator and
displays the green screen in a window,but also uses screen scraping to both
display and update CICS screens alongwith the imaging system and other non-
mainframe applications.
Security %
FUNCTIONFunctional Group : Shared ServicesPrimary Users : ..?# Of Users : ..?Business Functions : ..?Criticality : ..?Primary Data Subjects : ..?
User IDsAuthentication data
IDEN - IdentificationSign-on
Maintains agency employee IDS
Security %
FUNCTIONFunctional Group : Shared ServicesPrimary Users : ..?# Of Users : ..?Business Functions : ..?Criticality : ..?Primary Data Subjects : ..?
Authorization DataMainframe command authorizations
SAAS - SecurityApplication Access
SystemNatural command access by user id.
Reporting / Analytics %
FUNCTIONFunctional Group : Shared ServicesPrimary Users : ..?# Of Users : ..?Business Functions : ..?Criticality : ..?Primary Data Subjects : ..?
Access Data ?Does this application maintain access
history?
MOA - SecurityReporting
Security reporting
FM
To : MEM
includedithout pay
rt details as stilized to
%
Databasess : A
t ct : Charlie Va
amounts
i
From : TRAQSLimited address updates
To : PADRLimited address updates
oe
NaturalDatab
surance c
From : RETPPending retirements
To : TargetPending retirements
From : PADRPayee demographics
To : HEINPayee demographics
ingd
pote
Rat
oili
d p
A
Me
nt
AAsAc
Tood
A
From : TRSUMember activity emails
To : ONACMember activity emails
Servrvr ic
From : SourceRequested refund and
termination dataFrequency : On Request
To : TargetRequested refund and
termination dataFrequency : On Request
FUNCTIONFunctional Group : ServicesPrimary Users : ..?# Of Users : ..?Criticality : ..?Primary Data Subjects : ..?
Form Templates
Form Templates
Batch Forms - BF
From : TRAQSTo : MEMR
Payment depositconfirmations from TXNETafter validation by TRQS
Frequency : Daily
From : TRSPTo : MEMR
Balances of terminatedemployees.
Security Nomenclature Mashup / CommonInterface Inbound Correspondence / Workflow Reporting Outbound
Correspondence
Key
Data Subject
DatabaseName
Service NameService : Type ofservice (security,
Nomenclature, etc.)
Shared Services
SUMMARYPrimary Users : ..?Technologies : ..?Business Functions : ..?Comments : ..?Ownership : ..?ITGroup : ..?Owner : ..?Languages : 0Databases : ..?Platforms : ..?Middleware : ..?
Acronym -Application Name
Description
From : SourceTo : Target
Short DescriptionTechnology : ..?Frequency : ..?
Volume : ..?Style : ..?
Long DescriptionNotes
The total shaded arearepresents the relative
complexity of theapplication as a whole. Thecolored bands represent anestimate of the proportion of
the code dedicated toproviding each type of
functionality.
INTERFACE COLORSFor split interfaces connectors, the color of each end is the color
of the source and target applications as an aid to finding theother end of the connector.
For direct (non-split) interfaces, it is the color of the sourceapplication.
From : Source To : Target
The line color of theapplication is associatedwith its Functional group.
Acronym - ExternalSource Name
An external source or targetfor data coming into or
going out of the enterprise
In Development
Outbound Correspondence %
Security %Workflow %
Inbound Correspondence %Logging / Audit %Business Rules %
Integration %Reporting / Analytics %
Remaining Functionality %
Based on the legacyenterprise data model
Based on the currententerprise data model
From : OPINTo : AETNA
Enrolled members anddeductions
From : AETNATo : OPIN
Confirmed payments
Annuitant
Benefit Payment
Benefit Withholding
Integration %
Reporting / Analytics %
FUNCTIONFunctional Group : MiscellaneousPrimary Users : ..?Criticality : ..?Primary Data Subjects : ..?
IDEN / SAASService : Security
DJDCService : Report Distribution
Shared Services
Property Item
Property Data
INVY - PropertyInventory
Tracks TRS equipement andfurniture. Slated for replacement by
a spreadsheet system.
From : INVYTo : SPA
Inventory itemsTechnology : Manual transfer
SPA - SPAState Controller Application
From : SPATo : INVY
Inventory itemsTechnology : Manual transfer
FUNCTIONFunctional Group : Health InsurancePrimary Users : ..?# Of Users : ..?Criticality : ..?Primary Data Subjects : ..?
IDEN / SAASService : Security
DJDCService : Report Distribution
Shared Services
Member
LT Care Enrollment
LT Care Payment
Property Data
OPIN - OptionalInsurance
For retired members with optionallong term care insurance
MS Dynamics
CRM
HP Clarety LOBBatch, Web Services, Self -Service
IBMFilenet
ECM
KoFaxDocument Scanning
HPExStream
Correspondence Generation &
Delivery
Credit Card Processing
Service
External Systems• Government• HealthCare• Financial• Others
Monitoring &
Logging
TRS - ESB
Contact Center Siemens
OpenScape
Monitoring &
Logging
Scan Services
IVR Services
ID Service
Common Information
Model
ECM Services
CRM Services
Mail Services
VPN, SFTP VPN, SFTP, email
Active Directory
& Security
ID
Security Service
Corticon BRE
WhosOnMessaging/Chat
Prebuilt Integration
IIOP Adapter
AdapterAdapter Adapter
Polling Service
MFT Adapter
Clarety Services
Doc Creation
Doc Retrieve
Saved Reports
Customer Data LOB Data Communi
cationsCC
PaymentsOther
Services
MFT Adapter
File Adapter
Common File
Service
Secure File Storage
System
Prebuilt (Screen Pop)Integration
PrebuiltIntegration
Silanis Electronic Signature
Adapter
eSign Services
Applications / SystemsCommon Services
Application ServicesESB Components
Prebuilt Integration
Service based integration
Index:
Two Main Drivers1. Modernize our technology to better serve and provide value to our members 2. The legacy system was a “high risk” for TRS

TEAM QUALITY ASSURANCE
Continuous quality rigor built into the processContinuous Agile Testing
Multiple Regression CyclesUser Acceptance Testing
AutomationIncreased automation to retest previously developed features
5

TEAM QUALITY ASSURANCE
Quality is high priorityHolding ourselves to a higher standard
6
Vendor Trend TRS In-House Trend

7
KEY STATUS UPDATESINCREMENTAL RELEASE PROGRESSAchievements
• 12/14/2020 – HILOB Pre-UAT (preparation for User Acceptance Testing) began• 01/04/2020 – Payment Address and Web Self Service Releases completed fifth
development sprints• 01/21/2021 – HILOB UAT Entry Quality Gate / HILOB User Acceptance Testing
began• 01/25/2021 – HILOB Cutover Dry Run #1
Key Goals Upcoming
• 03/01/2021 – Payment Address Release & Web Self Service Business Process Regression Testing Round 1
• 03/20/2021 – HILOB Cutover Dry Run #2
Issues/Risks
• Resource constraints on key technical teams
TEAM – WHERE WE ARE NOW
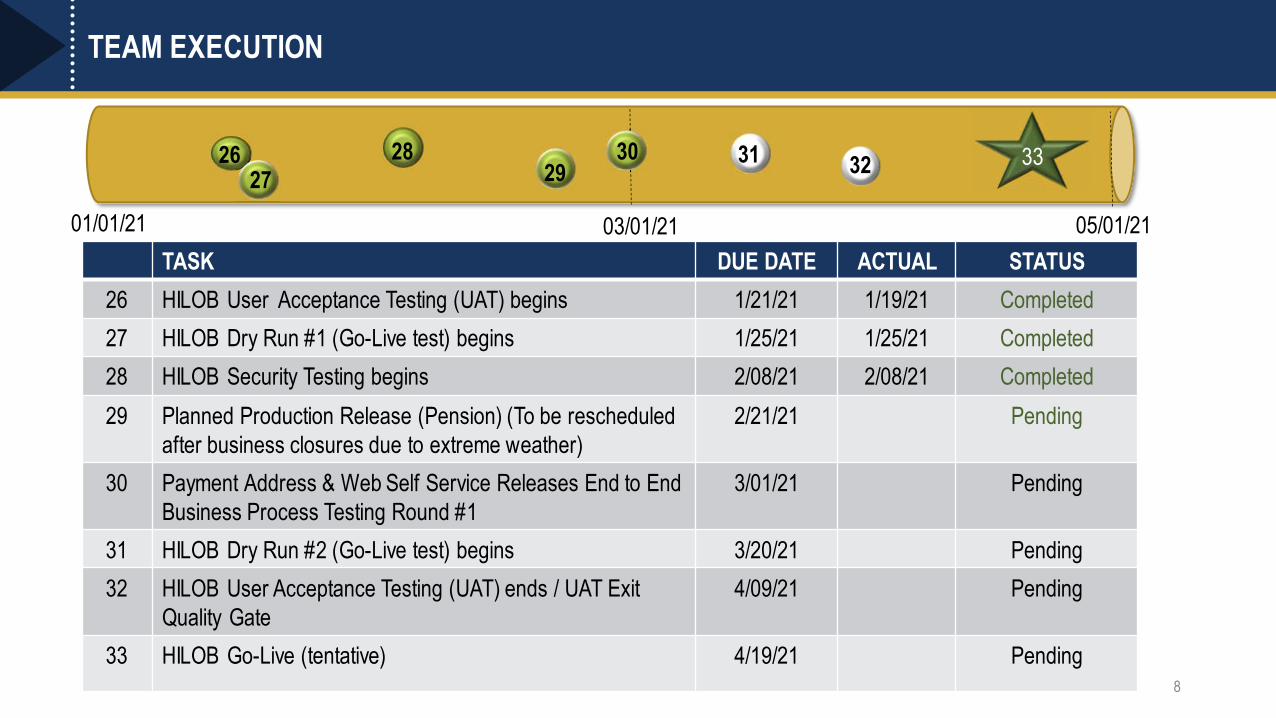
8
TASK DUE DATE ACTUAL STATUS26 HILOB User Acceptance Testing (UAT) begins 1/21/21 1/19/21 Completed27 HILOB Dry Run #1 (Go-Live test) begins 1/25/21 1/25/21 Completed28 HILOB Security Testing begins 2/08/21 2/08/21 Completed29 Planned Production Release (Pension) (To be rescheduled
after business closures due to extreme weather)2/21/21 Pending
30 Payment Address & Web Self Service Releases End to End Business Process Testing Round #1
3/01/21 Pending
31 HILOB Dry Run #2 (Go-Live test) begins 3/20/21 Pending32 HILOB User Acceptance Testing (UAT) ends / UAT Exit
Quality Gate4/09/21 Pending
33 HILOB Go-Live (tentative) 4/19/21 Pending
2728
293126 32
01/01/21 03/01/21 05/01/21
30 33
TEAM EXECUTION

Improvements with HILOB
• Modern interface and navigation• Expedited processes for maintaining and
tracking sensitive populations• Automated reporting for population tracking• Automate process for surviving spouses• Built-in logic to avoid errors and discrepancies
that happen in current legacy system• Will be integrated with Pension Line of Business
system, reducing data entry errors and maintaining a single member profile
9
MEMBER BUSINESS VALUE

Additional Detailed Information
10
APPENDIX
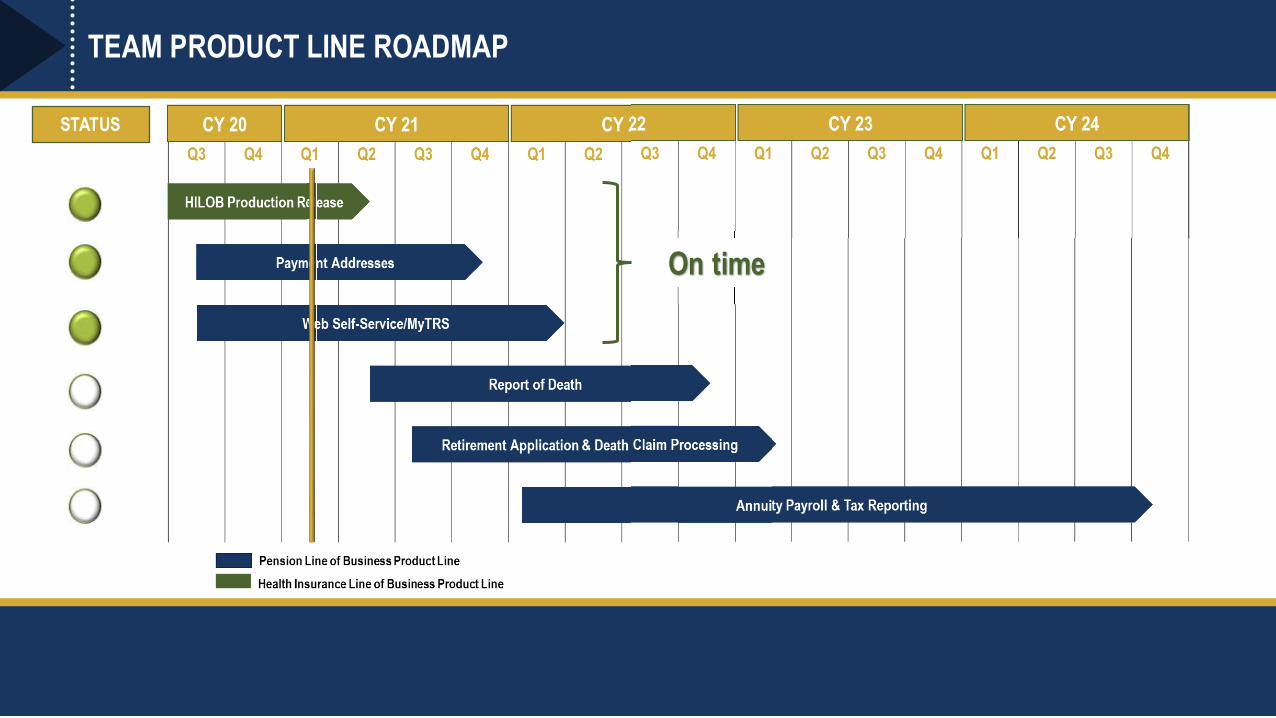
TEAM PRODUCT LINE ROADMAP
STATUS
On time

TEAM PRODUCT LINE ROADMAP – 12 MONTH VIEW

BUDGET

TEAM EXECUTION
14
Completed
TASK DUE DATE ACTUAL STATUS22 Begin End to End Regression testing for Health Insurance
Line of Business System (HILOB)11/02/20 11/02/20 Completed
23 Post Procurement for Performance Test Vendor for MyTRS/WSS (Pension Line of Business System)
11/20/20 11/20/20 Completed
24 Planned Production Release 12/13/20 12/13/20 Completed
25 HILOB Quality Gate – UAT Entry 1/20/21 1/15/21 Completed26 HILOB User Acceptance Testing (UAT) Begins 1/21/21 1/19/21 Completed27 HILOB Dry Run #1 (Go-Live test) begins 1/25/21 1/25/21 Completed
01/01/2112/01/20 02/01/21
2324
262522
11/01/2027

TEAM EXECUTION
15
TASK DUE DATE ACTUAL STATUS28 HILOB Security Testing begins 2/08/21 2/08/21 Completed29 Planned Production Release - (To be rescheduled after
business closures due to extreme weather)2/21/21 Pending
30 Payment Address & Web Self Service Releases End to End Business Process Testing Round #1
3/01/21 Pending
31 HILOB Dry Run #2 (Go-Live test) begins 3/20/21 Pending32 HILOB User Acceptance Testing (UAT) ends / UAT Exit
Quality Gate4/9/21 Pending
33 HILOB Go-Live (tentative) 4/19/21 Pending
04/01/2103/01/20 05/01/21
30 323128
02/01/21
Current
3329

TEAM EXECUTION
16
Next
TASK DUE DATE ACTUAL STATUS34 Payment Address Release Code Complete 5/11/21 In Progress
35 Payment Address Release Final Regression Testing begins 6/23/21 Not Started36 Retirement Application Processing & Death Application
Processing (RAP/DTH) Release Development begins6/23/21 Not Started
07/01/2106/01/20 08/01/21
35
3634
05/01/21

17
Historical Architecture
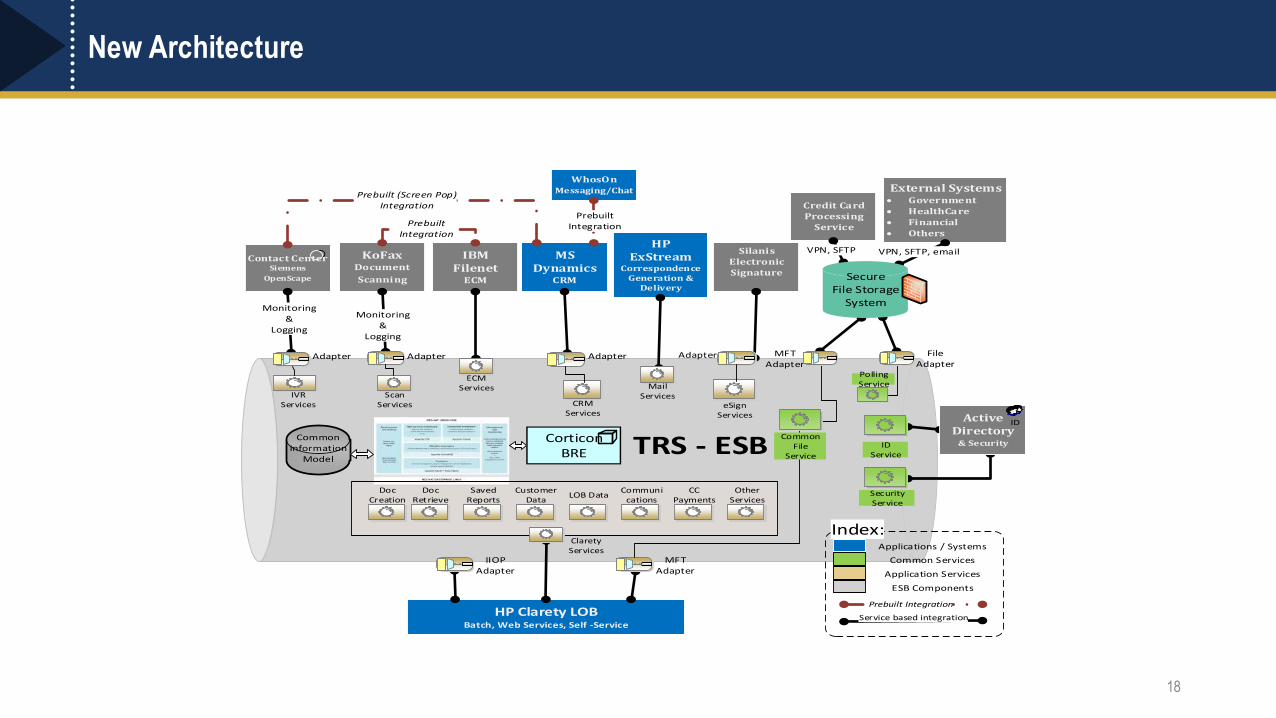
18
New Architecture
MS Dynamics
CRM
HP Clarety LOBBatch, Web Services, Self -Service
IBMFilenet
ECM
KoFaxDocument Scanning
HPExStream
Correspondence Generation &
Delivery
Credit Card Processing
Service
External Systems• Government• HealthCare• Financial• Others
Monitoring &
Logging
TRS - ESB
Contact Center Siemens
OpenScape
Monitoring &
Logging
Scan Services
IVR Services
ID Service
Common Information
Model
ECM Services
CRM Services
Mail Services
VPN, SFTP VPN, SFTP, email
Active Directory
& Security
ID
Security Service
Corticon BRE
WhosOnMessaging/Chat
Prebuilt Integration
IIOP Adapter
AdapterAdapter Adapter
Polling Service
MFT Adapter
Clarety Services
Doc Creation
Doc Retrieve
Saved Reports
Customer Data LOB Data Communi
cationsCC
PaymentsOther
Services
MFT Adapter
File Adapter
Common File
Service
Secure File Storage
System
Prebuilt (Screen Pop)Integration
PrebuiltIntegration
Silanis Electronic Signature
Adapter
eSign Services
Applications / SystemsCommon Services
Application ServicesESB Components
Prebuilt Integration
Service based integration
Index:

TAB 13

Board IPA Update
February 2021

Agenda
Page 2
01 Reintroduction
03 Activity to Date
02 Board Expectations
04 Program Summary

IPA Team and Objectives
Page 3
Mark GoldblattProject Lead Analyst
Hassan MirzaProject Analyst
Richard (Doug) HoltAccount Executive
Jonathan ScofieldEngagement Lead
Gather, analyze, and provide recommendations thatimprove program governance
Advise on significant program activities and leadingpractices in key areas of the program
Assess program effectiveness and efficiency so TRScontinues to serve the expanding and ever-changing needsof your stakeholders
You have prioritized the importance of an independentprogram assessment partner to contribute the firmfoundation needed to proceed with greater confidence

Expectations for April Board Meeting
10 February 2021Page 4
Quick Wins andRecommendations
Provide immediateimprovement
actions and longrun enhancementrecommendations
Opportunitiesand Risks
Identify State of theprogram
and categorizeTEAM programimprovement
opportunities andrisks
Wall of Fame
Celebrate ourpeople, teams andaccomplishments
Summary of IPAwork to date
Provide cumulativesummary of workcompleted over
previous quarter
Capture and trackTEAM programtrends and keyperformance
metrics
Trends andKPIs

Activity to Date
Page 5
Summary and Highlights:• Kicked off program 2/3/21• Conducted executive
retrospective• Began developing partnerships• Introductions and invites to
SteerCo meetings, daily standups, demos, and retrospectives
• Onboarding:• System access• Information gathering
• Next up:• Attending/shadowing
SteerCo meetings, dailystand ups, demos, andretrospectives
Executive Retrospective Responses – sentiment on Programefforts to date
Collaboration
Good support fromexecutive leadership
Shared vision of thefuture and end goal
More collaborationbetween business & IT
Collaboration
Responsiveness
Relationship between ITand Business
Pivoting to changingneeds
Addressing businessneeds/priorities
Addressing blockers
Able to respond quicklyto demands
Schedule
Meeting Milestonedeadlines
Making progress
Meeting milestones
What has gone well?Relationship
Stronger relationshipwith IPA
Collaboration betweenTRS and IPA
IPA partnership forsuccess/not just looking
for gotchas
Focusing on the rightthings with IPA effort
Program Lifecycle
Resource Managementacross portfolio
Advanced notice ofissues
Controlling intakepipeline for other
projects
Integration
Managing day-to-daybusiness with
implementation
What can we improve?

TEAM Program Summary
10 February 2021Page 6
Summary
Quick Wins
Wall of Fame Risks
Trends and KPI’s
85%Program Governance
55%Product Management
25%Technical Solution
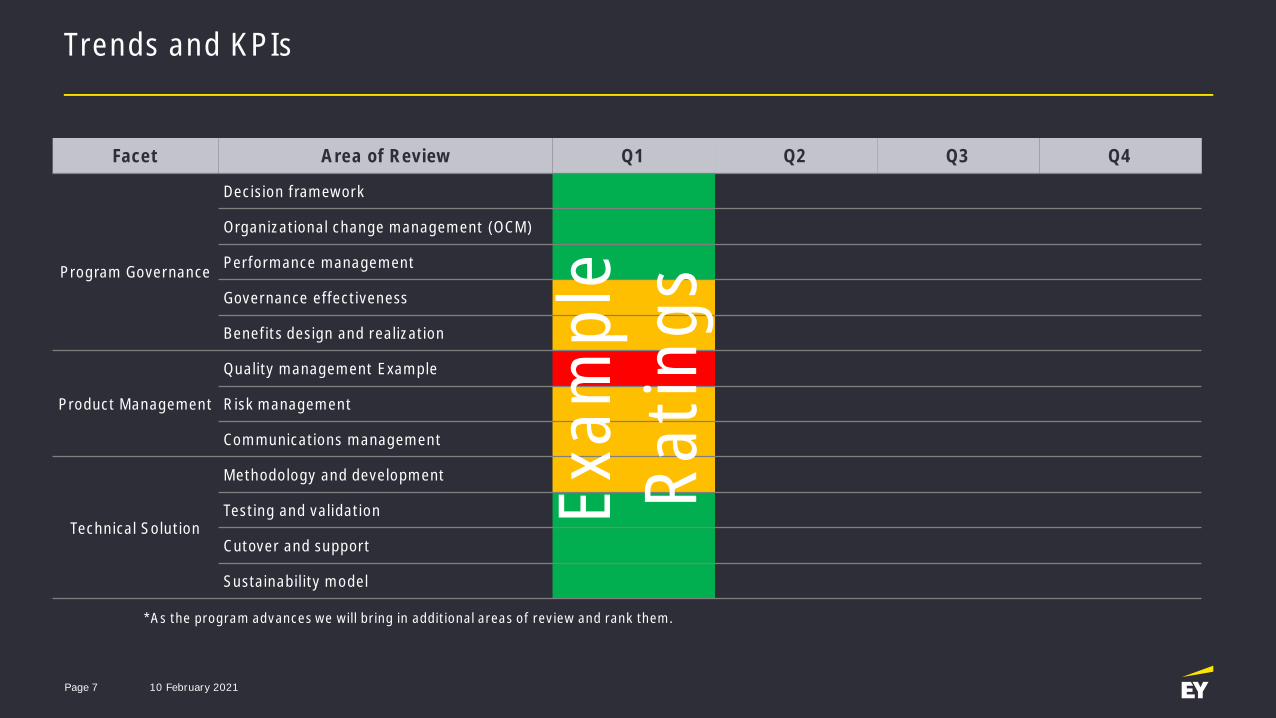
Trends and KPIs
10 February 2021Page 7
Facet Area of Review Q1 Q2 Q3 Q4
Program Governance
Decision framework
Organizational change management (OCM)
Performance management
Governance effectiveness
Benefits design and realization
Product Management
Quality management Example
Risk management
Communications management
Technical Solution
Methodology and development
Testing and validation
Cutover and support
Sustainability modelEx
ampl
eRa
tings
*As the program advances we will bring in additional areas of review and rank them.

Questions

TAB 14

Brian GuthrieAndrew RothBarbie PearsonDon GreenFebruary 25, 2021
PENSION BENEFITS REPORTTeacher Retirement System of Texas

Pension BenefitCustomer Service

3
Front Office FTEs

4
Sunset Recommendations and Survey Highlights
Sunset Recommendations
• Repair relationship with members by focusing on their needs. oDevelop a communication
and outreach plan to better help members and employers plan for retirement.
oMake improved efforts to return contributions to inactive members before funds are forfeit.
oAdopt a member engagement policy to increase transparency on key decisions.
Member Survey
• Members want:o more availability of staff to
answer calls and respond to emails;
o inform about MyTRS and enhancements to MyTRS (chat, balance access, pension estimates, personalized information, simplified retirement process, mobile app);
o refine language in the Benefits Handbook relating to estimating benefits, decision to retire, and healthcare benefits; and
o provide retirement planning education and education on saving for retirement outside TRS.
Employer Survey
• Employers want:o TRS to respond to
questions within 48 hours;
o responses by email; and
o less direction to appropriate resources on the web.

5
What is customer service?
TCCProcessing
Employer Reporting
Training, QA & WFM
Health Insurance
1,682,708
1.26 1.25 1.25 1.33
1.12 1.22
1.49
-
0.50
1.00
1.50
2.00
2.50
3.00
1,000,000
1,100,000
1,200,000
1,300,000
1,400,000
1,500,000
1,600,000
1,700,000
1,800,000
2010 2011 2012 2013 2014 2015 2016 2017 2018 2019 2020 2021
Member & FTE Trends
Membership Benefit Services FTE's/10K Members
Peer System4.2 Customer Service FTEs
per 10K Members
As of 1/2021

6
Key Activities & Customer Service FTEs
2010 vs. 2020
Retirement 2020Estimates: 94,412; 88% increase Retirements: 19,770; 18% increase
Death Claims 2020Claims: 18,470; 21% increase
Member Calls 2020Received: 603,663; 25% increase
Employer ReportingReports: 92,535; 470% increase
583,896
962,072
0
100
200
300
400
500
600
100,000
300,000
500,000
700,000
900,000
1,100,000
FY10 FY11 FY12 FY13 FY14 FY15 FY16 FY17 FY18 FY19 FY20 FY21
FTEs
Key A
ctivit
ies
Fiscal Years
Key Activities FTEs

7
FY2010 FY2011 FY2012 FY2013 FY2014 FY2015 FY2016 FY2017 FY2018 FY2019 FY2020 FY2021Projection
FY2022Projection
Retirement Estimates 59,754 72,250 66,065 68,246 64,409 62,905 69,526 68,765 74,631 91,213 94,412 99,133 104,089Retirements 16,751 21,109 21,742 21,397 20,901 20,132 21,807 20,426 19,385 23,820 19,770 20,759 21,796
0
20,000
40,000
60,000
80,000
100,000
120,000
140,000
Retirements Retirement Estimates
Retirement Processes

8
FY2010 FY2011 FY2012 FY2013 FY2014 FY2015 FY2016 FY2017 FY2018 FY2019 FY2020 FY2021Projection
FY2022Projection
Death Claims 14,693 15,148 15,616 16,099 16,597 16,608 18,220 18,263 16,798 18,925 18,470 19,394 20,363
-
5,000
10,000
15,000
20,000
25,000
Death Claims
Death Claims

9
FY2010 FY2011 FY2012 FY2013 FY2014 FY2015 FY2016 FY2017 FY2018 FY2019 FY2020 FY2021Projection
FY2022Projection
Member Calls Received 481,868 553,634 560,166 577,620 513,065 501,593 550,147 597,055 621,641 656,489 603,663 689,313 723,779Member Calls Answered 457,364 496,210 494,281 504,998 500,668 486,572 506,362 550,865 424,436 575,651 510,816 536,357 563,175Member Calls Abandoned 24,504 57,775 69,076 65,495 12,397 15,021 43,785 46,190 197,205 80,838 92,847 97,489 102,364
-
100,000
200,000
300,000
400,000
500,000
600,000
700,000
800,000
Member Calls Received Member Calls Answered Member Calls Abandoned
Telephone Counseling

10
Employer Reporting Customer Service
FY2014 FY2015 FY2016 FY2017 FY2018 FY2019 FY2020Employer Calls 13,753 20,321 12,099 12,693Employer eMails 182,109 280,583 273,848 267,408Employer Reports Completed 16,065 16,293 15,789 15,875 151,442 109,017 92,535
0
50,000
100,000
150,000
200,000
250,000
300,000
350,000
400,000
450,000
500,000
Employer Reports Completed Employer eMails Employer Calls
• Community/Junior Colleges• Senior Universities• Medical/Dental Universities
Higher Education
• ISDs• Regional Service Centers• Charter Schools
Non-Higher Education

11
Customer Service FTE Request
TeamsCurrent
FTE2021 FTE
Need Total
Claims Team 16 10 26
Current Benefit Services FTEs: 248
Total FTE increase needed: 10Total Benefit Services FTEs with increase: 258
Benefit Services percentage increase in FTEs: 4%
Recruiting, Hiring and Training PlanProject hiring 10 FTEs in May 2021 to address steadily increasing workload in the Benefit Processing area.
1-3 Months
Recruit & Hire
3 Months 6-8 Months
Train
8-12 Months
Results

12
Member & Employer Experience
Goals for Increasing FTEs❖ Provide world class service to members and employers❖ Deliver services that exceed expectations❖ Continually improve member and employer experience
Assumptions❖ Membership will continue to increase❖ Members prefer face-to-face & telephone service; written
communication and email correspondence❖ Employers prefer email correspondence, timely responses, and
in-person training❖ TRS pension benefits are complex
Strategies❖ Maintain competitive salaries and reward excellent performance❖ Develop strong retention policy❖ Develop & maintain knowledge-based system❖ Deliver year-round training to enhance pension and health care
knowledge❖ Expand quality assurance reviews to back-office processing key
activities❖ Understand member and employer information delivery
preferences
Opportunity❖ Improve service level
o Answer 80 percent of calls in three minuteso Prepare and mail 90 percent of retirement estimates within 31 dayso Claims acknowledged within 14 days of notificationo Claims payments made within 31 days of receipt of all paperworko 90 percent of regular reports completed by the end of each quarter
❖ Open more channels of communication including chat and screen sharing
❖ Ability to cross-train staff to use their skills in critical areas as needed
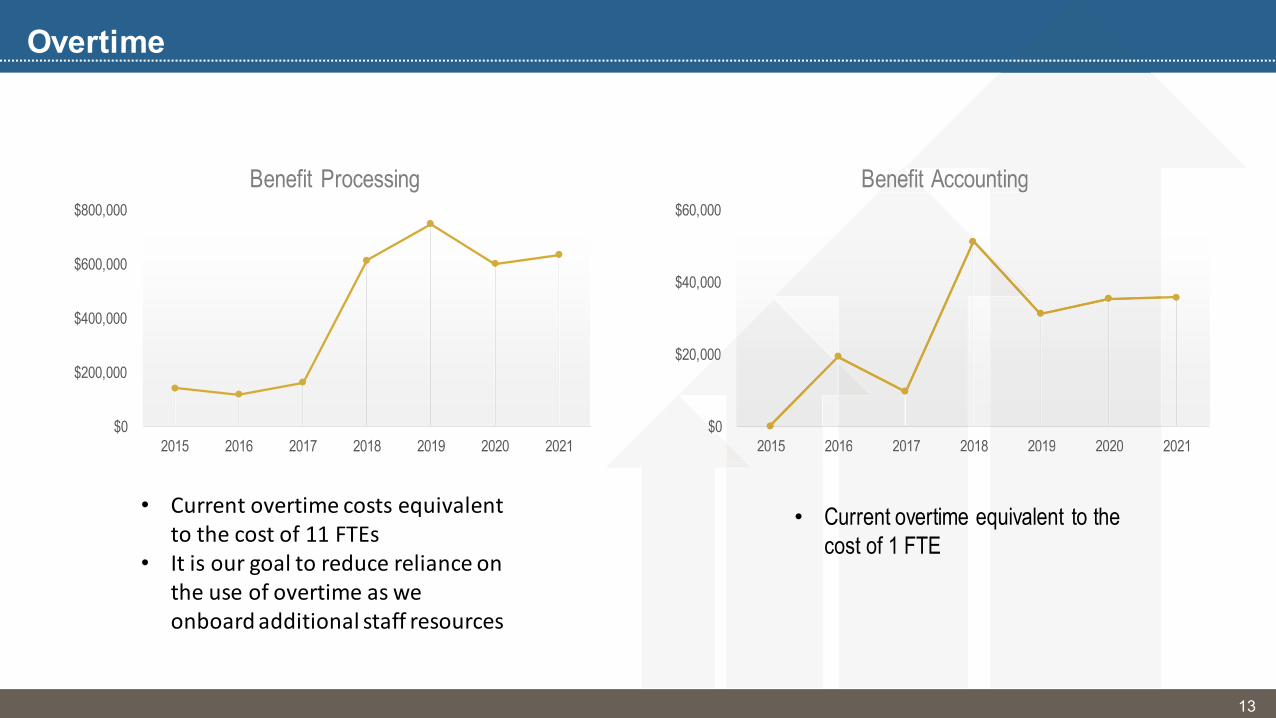
13
Overtime
$0
$200,000
$400,000
$600,000
$800,000
2015 2016 2017 2018 2019 2020 2021
Benefit Processing
$0
$20,000
$40,000
$60,000
2015 2016 2017 2018 2019 2020 2021
Benefit Accounting
2019 2020
Benefit Accounting
2016 2017 2018
Benefit Accounting
$20,000
2015$0
• Current overtime costs equivalent to the cost of 11 FTEs
• It is our goal to reduce reliance on the use of overtime as we onboard additional staff resources
• Current overtime equivalent to the cost of 1 FTE

14
Fiscal Impact
• FY 2021 Fiscal Impact
• Projects hiring 10 FTEs in May 2021 to address steadily increasing workload in the Benefit Processing area
• Cost estimate is $228K, includes salaries and benefits that can be funded within available budget
• FY 2022 Resource Planning
• Plan to provide an analysis at the July Board meeting on future Benefit Services workload and staffing need projections for FY22 as part of the annual budget development process

15
Historical Trend
145166 164 165 167
182 191 192 192 189 195 204 206
248
0
100
200
300
2000 2005 2010 2011 2012 2013 2014 2015 2016 2017 2018 2019 2020 2021
Benefit Services FTE
Actual FTE
204 206
248
2019 2020 2021
189 195 204
2017 2018
204
20162015
Actual FTE
• 4% average increase over the last 20 year

16

TAB 15

Frank WilliamsFebruary 25, 2021
INFORMATION SECURITY REPORT
Teacher Retirement System of Texas
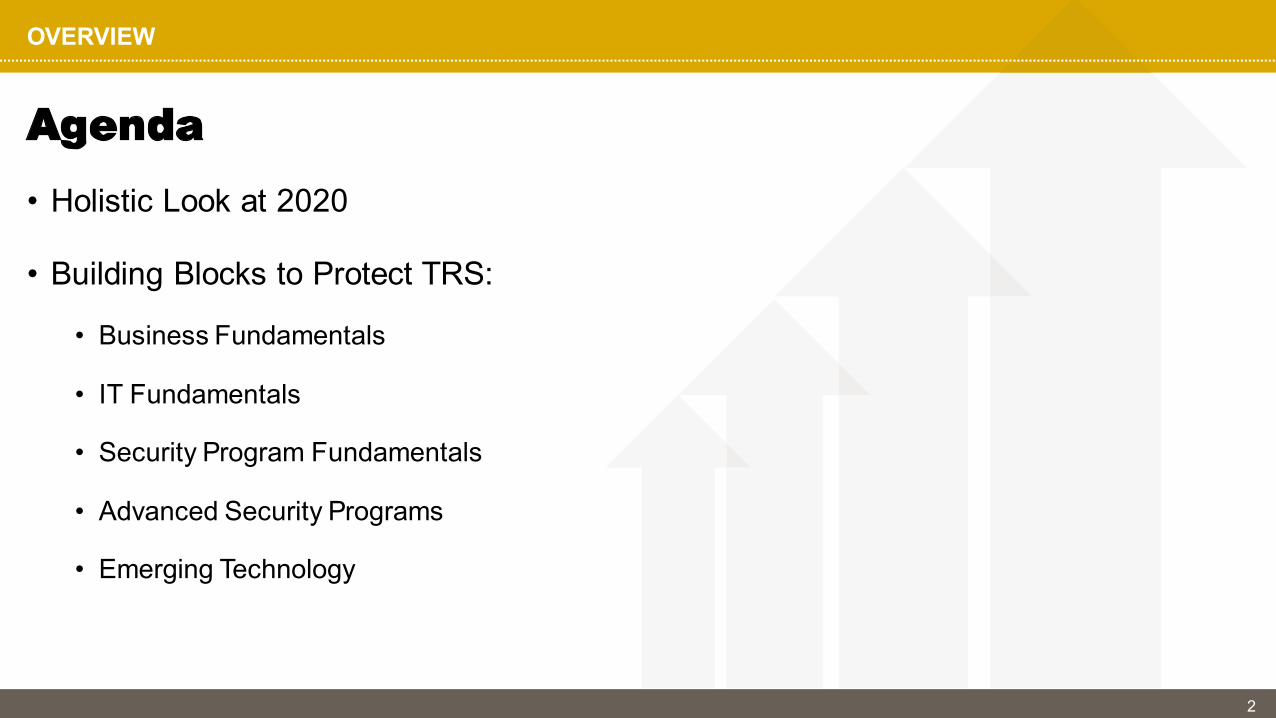
2
OVERVIEW
Agenda• Holistic Look at 2020
• Building Blocks to Protect TRS:
• Business Fundamentals
• IT Fundamentals
• Security Program Fundamentals
• Advanced Security Programs
• Emerging Technology
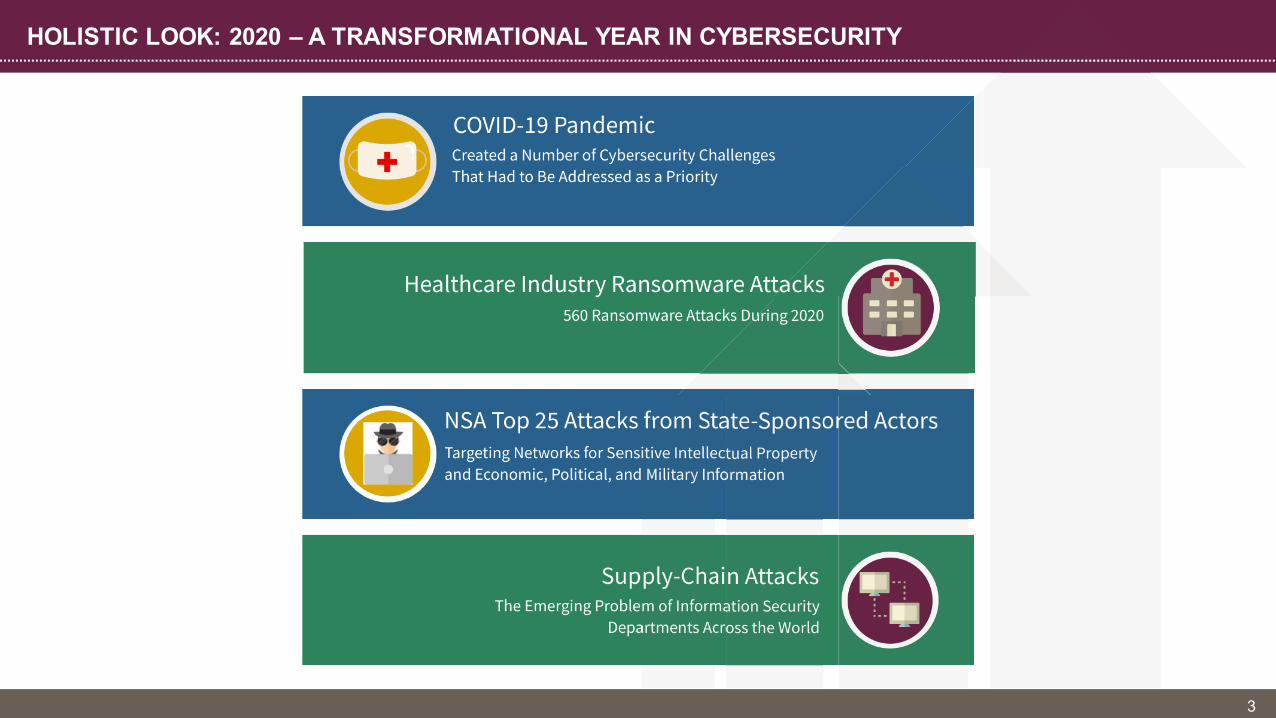
3
HOLISTIC LOOK: 2020 – A TRANSFORMATIONAL YEAR IN CYBERSECURITY

4
BUILDING BLOCKS: BUSINESS FUNDAMENTALS
Digital Transformation initiatives frequently outpace the ability to provide effective security. These digital ambitions dramatically expand our cyber attack surface. Regulations and oversight are also constantly evolving.
The top 2 factors that help determine the priority ofTRS’s cybersecurity spending are:
1) Implementing security best practices2) Compliance mandates

5
LEGISLATIVE AND REGULATORY BURDENS
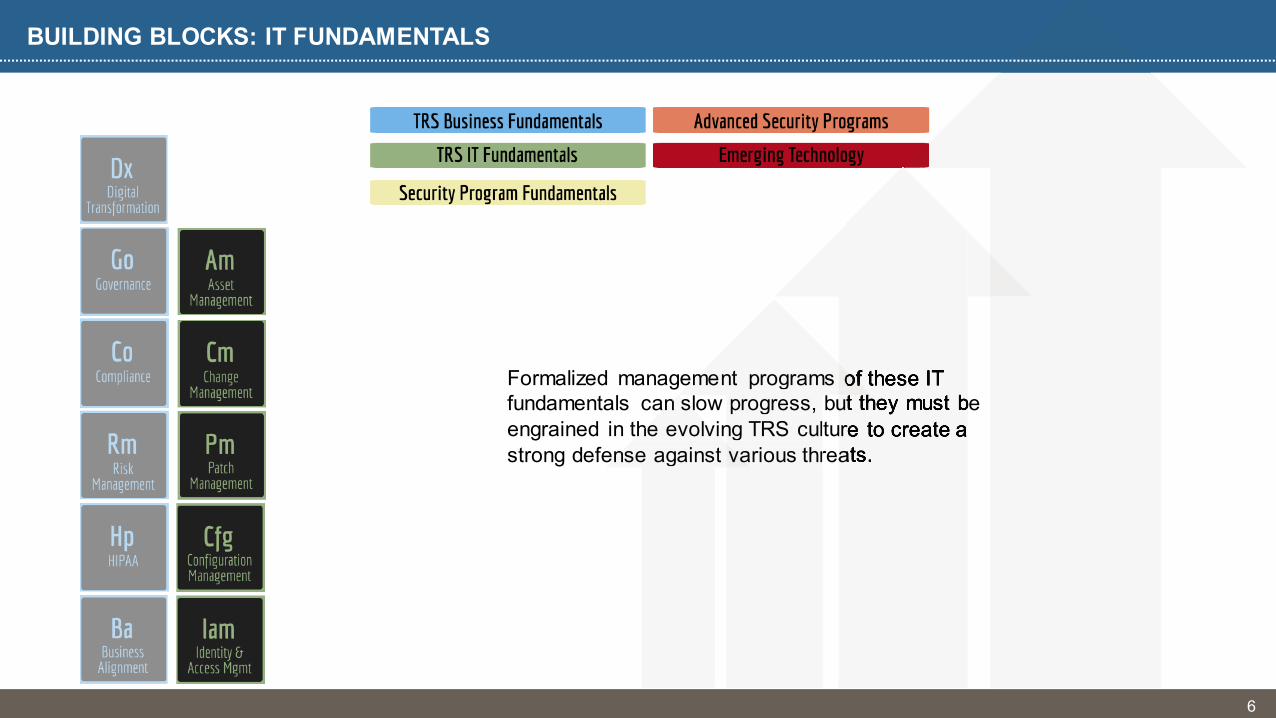
6
BUILDING BLOCKS: IT FUNDAMENTALS
Formalized management programs of these IT fundamentals can slow progress, but they must be engrained in the evolving TRS culture to create a strong defense against various threats.
Formalized management programs of these IT Formalized management programs of these IT fundamentals can slow progress, but they must be fundamentals can slow progress, but they must be fundamentals can slow progress, but they must be engrained in the evolving TRS culture to create a engrained in the evolving TRS culture to create a strong defense against various threats. strong defense against various threats.
Formalized management programs of these IT fundamentals can slow progress, but they must be engrained in the evolving TRS culture to create a strong defense against various threats.
Formalized management programs of these IT Formalized management programs of these IT fundamentals can slow progress, but they must be fundamentals can slow progress, but they must be fundamentals can slow progress, but they must be engrained in the evolving TRS culture to create a strong defense against various threats.
fundamentals can slow progress, but they must be
strong defense against various threats.

INTERNAL PROJECTS: IMPROVEMENTS TO INFRASTRUCTURE
7

8
BUILDING BLOCKS: SECURITY PROGRAM FUNDAMENTALS
Effective threat management is about understanding your attack surface and gaps. TRS Information Security operations continue to evolve beyond traditional security mechanisms, and our program fundamentals are constantly adapting to the changes coming out of digital transformation.

9
TRS-WIDE TRAINING

10
BUILDING BLOCKS: ADVANCED SECURITY PROGRAMS
Beyond the fundamentals,TRS cybersecurity staff provide highly adaptive services to support the speed of enterprise expansion amongst a full stack of new growth opportunities.

11
ENTERPRISE GROWTH

12
BUILDING BLOCKS: EMERGING TECHNOLOGY
These emerging technologies can be used for cyber defense to fully harness the power of installed security technology that is often siloed in nature.
These technologies are alsoempowering the future of cyber crime.

13
OPERATIONAL MODEL: BUILDING BLOCKS TO PROTECT TRS

TAB 18

Investment advice and consulting services provided by Aon Investments USA Inc., an Aon Company
Nothing in this document should be construed as legal or investment advice. Please consult with your independent professional for any such advice. To protect the confidential and proprietary information included in this material, it may not be disclosed or provided to any third parties without the approval of Aon.
Teacher Retirement Sy stem of Tex asInvestment Education Presentation
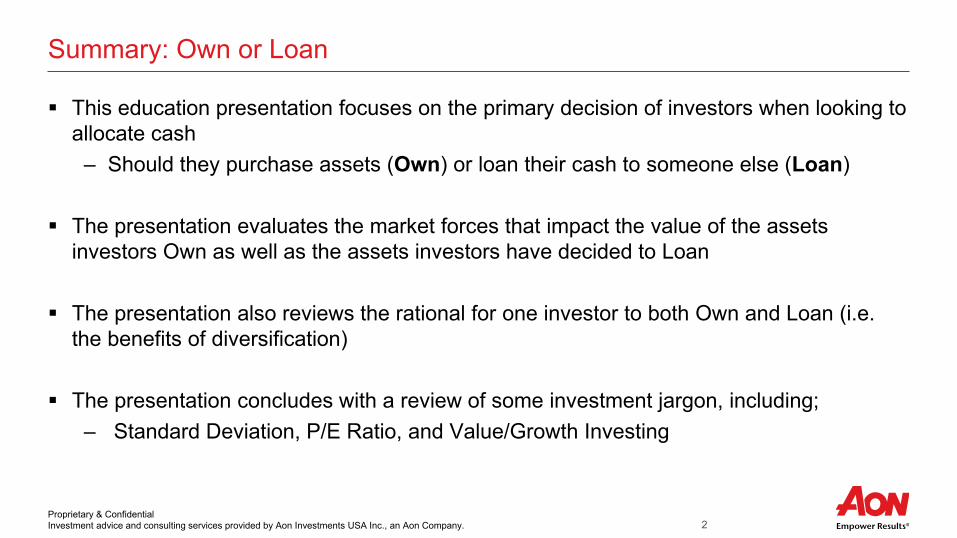
Proprietary & Confidential Investment advice and consulting services provided by Aon Investments USA Inc., an Aon Company. 2
Summary: Own or Loan
This education presentation focuses on the primary decision of investors when looking to allocate cash
– Should they purchase assets ( O wn) or loan their cash to someone else (Loan)
The presentation evaluates the market forces that impact the value of the assets investors Own as well as the assets investors have decided to Loan
The presentation also reviews the rational for one investor to both Own and Loan (i.e. the benefits of diversification)
The presentation concludes with a review of some investment jargon, including;– Standard Deviation, P/E Ratio, and Value/Growth Investing

Proprietary & Confidential Investment advice and consulting services provided by Aon Investments USA Inc., an Aon Company. 3
Investment Decision
Asset owners looking to invest have two primary options
– O wn Assets – Purchase Return Seeking Assets
Equity (public and private)Real EstateInfrastructureNatural Resources
– Loan Assets – Purchase BondsU.S. TreasuriesCorporate Bonds
Own Loan

Proprietary & Confidential Investment advice and consulting services provided by Aon Investments USA Inc., an Aon Company. 4
O wning Assets

Proprietary & Confidential Investment advice and consulting services provided by Aon Investments USA Inc., an Aon Company. 5
Considerations of Asset Ownership
Investors can make money through – D ividends – A portion of the profits of an asset paid
back to the asset owner on a regular reoccurring basis
– Capital Appreciation – An increase in the value of an asset due to its increased efficiency, desirability, demand, or scarcity
i.e. increased demand for mobile services resulting from COVID
Investors can lose money through – Capital D epreciation – A decrease in value of an
Asset due to its decreased desirability, demand, or scarcity – Typically unique scenarios (above)
– B ankruptcy – Inability to meet the promised obligation to debt holders
i.e. interest on debt is increasing more quickly than profitability of the asset
Black Monday10/87-10/87
Asian & Russia Crisis10/97-10/88
Dot Com Bubble3/00 –10/02
COVID Pandemic
2/20 – 3/20Financial
Crisis9/08 – 3/09
-10%
-5%
0%
5%
10%
15%
20%
25%
Rolling 5-year Return of the MSCI ACWI IMI
Total Return Price Return Dividend Return

Proprietary & Confidential Investment advice and consulting services provided by Aon Investments USA Inc., an Aon Company. 6
Factors Affecting Asset Owners
0.0%
2.0%
4.0%
6.0%
8.0%
10.0%
0.0%1.0%2.0%3.0%4.0%5.0%6.0%
Rolling 10-year Real GDP and Inflation
Real GDP Inflation
01234567
05
10152025303540
Historical MSCI ACWI P/E Ratio and Federal Funds Rate(Jun 1994 - Dec 2020)
ACWI PE Ratio Fed Funds Rate
Broadly speaking, assets appreciate in the long run due to; – Economic Growth – The world will grow and become
more efficient over time– Inflation – The purchasing power of a dollar will
decrease over time
Asset prices bounce around in the short term due to; – Investor Ex pectations – Changes in investor outlook
for future growth (P/E Ratio)– Interest Rates – Rising short term (Fed controlled)
interest rates makes cash more desirable (higher return) and borrowing less desirable (more expensive)

Proprietary & Confidential Investment advice and consulting services provided by Aon Investments USA Inc., an Aon Company. 7
Loaning Assets

Proprietary & Confidential Investment advice and consulting services provided by Aon Investments USA Inc., an Aon Company. 8
Considerations of Loaning Assets (Bonds)
Loans (Bonds) can make money through – Coupon P ay ments – Required payment agreed upon
in advance for loaning money– Capital Appreciation – Due to falling interest rates
The coupon payment is now higher than what the market is offering, so people will pay more for it
Bonds can lose money through – D efault – Inability to make required interest payment
Treasury positions are unlikely to ever default– Capital D epreciation – Due to rising interest rates
An investor can purchase a new bond offering a higher yield, so they are not willing to pay full price for an older bond with a lower yield
-5.0%
0.0%
5.0%
10.0%
15.0%
Rolling 10-year Return of Blmbg. Barc. U.S. Long Treasury
Price Return Coupon Return Total Return

Proprietary & Confidential Investment advice and consulting services provided by Aon Investments USA Inc., an Aon Company. 9
0
20
40
60
80
100
0%
5%
10%
15%
20%
10-year Treasury Bond Yield(1/1/1962 - 12/31/2020)
Factors Affecting Asset Loaners:Interest Rates – Why do they Change
The Federal Reserve Can buy bonds using cash (increase supply of cash &
decrease rates), or sell bonds receiving cash (decrease supply of cash & increase rates)
– The Fed sets short term interest rate (yield on cash)– The Fed can impact longer duration interest rates by
buying or selling longer duration bonds
Inflation An increase in inflation (or expected inflation) can drive
interest rates higher– Investors demand a higher return to offset the reduced
purchasing power
Supply and D emand Like the price of any other asset, interest rates are a
reflection of a supply/demand equilibrium – Demand for Treasury bonds tend to increase during
market volatility, which drives rates lower

Proprietary & Confidential Investment advice and consulting services provided by Aon Investments USA Inc., an Aon Company. 10
0
20
40
60
80
100
0100200300400500600700
Jun-
89Ju
n-90
Jun-
91Ju
n-92
Jun-
93Ju
n-94
Jun-
95Ju
n-96
Jun-
97Ju
n-98
Jun-
99Ju
n-00
Jun-
01Ju
n-02
Jun-
03Ju
n-04
Jun-
05Ju
n-06
Jun-
07Ju
n-08
Jun-
09Ju
n-10
Jun-
11Ju
n-12
Jun-
13Ju
n-14
Jun-
15Ju
n-16
Jun-
17Ju
n-18
Jun-
19Ju
n-20
bps
(Monthly)
U. S. IG Corporate Credit: O AS over Treasuries (bps) through D ecember 2 02 0
Source: Barclays
Factors Affecting Asset Loaners: The Yield Curve & Credit Spreads
Bonds that have credit risk require an additional return to compensate for the additional risk
– Credit spreads are the additional yield over risk free bonds (Treasuries), to compensate for this risk
Changes in spread impact the value of a bond in the same way as changes in interest rates
– Rising spreads decreases the value of a bond, and declining spreads increase the value
The Yield Curve is currently and typically upward sloping– This is to compensate for the reduced liquidity of longer
duration bonds– Represents an expectation that rates will rise in the
future
0.0%
0.4%
0.8%
1.2%
1.6%
2.0%
0 1 3 5 7 10 20 30
Yiel
d
Maturity (Years)
U.S. Treasury Yield Curve
2/8/2021

Proprietary & Confidential Investment advice and consulting services provided by Aon Investments USA Inc., an Aon Company. 11
B enefit of O wning and Loaning

Proprietary & Confidential Investment advice and consulting services provided by Aon Investments USA Inc., an Aon Company. 12
Why do Investors Own and Loan? (Hypothetical) The table to the right shows a simplistic
and hypothetical portfolio of 2 assets– Each asset returns 8%– An investor can achieve higher returns
at a reduced level of volatility through diversification
– Removing the correlation benefit or choosing to not rebalance eliminates this benefit
This is why investors diversify their portfolio and set rebalancing ranges
Y ear 1 Y ear 2 Cumulative
Negative Correlation & Annual RebalanceInvestment “A” 20% -10% 8%Investment “B” -10% 20% 8%50/50 Portfolio 5% 5% 10.3%
Correlation = 1 (i.e. no diversification benefit)Investment “A” 20% -10% 8%Investment “B” 20% -10% 8%50/50 Portfolio 20% -10% 8%
Remove RebalancingInvestment “A” 20% -10% 8%Investment “B” -10% 20% 8%50/50 Portfolio 20% -10% 8%

Proprietary & Confidential Investment advice and consulting services provided by Aon Investments USA Inc., an Aon Company. 13
Why do Investors Own and Loan? (Actual)
-1-0.8-0.6-0.4-0.2
00.20.40.60.8
1
Rolling 5-Year Correlation of Global Equities and Long Treasuries
5-Year Risk and Return
Over the time period show the average correlation has been ~ 0
As show the correlation has fluctuated– Since the late 90s the correlation has been negative– From 1977 to 1998 the correlation was positive
Over the trailing 5-Year period an investor was able to achieve dramatically better returns by diversifying between stocks and bonds

Proprietary & Confidential Investment advice and consulting services provided by Aon Investments USA Inc., an Aon Company. 14
TRS Implications

Proprietary & Confidential Investment advice and consulting services provided by Aon Investments USA Inc., an Aon Company. 15
Asset Allocation – The Most Important Decision
Long-term asset allocation (which asset classes to use and in what percent) explains more than 90% of the difference in returns between institutional funds
Selecting investments that are appropriately diversified, and consider the liability of the investment program is paramount
Source: Brinson, Singer and Beebower, “Determinants of Portfolio Performance II: An Update” 1991
Long-Term Target Asset
Allocation, 91%
Short-Term Allocation
Changes, 2%
Active Security Selection
(Managers), 5%
Unexplained, 2%
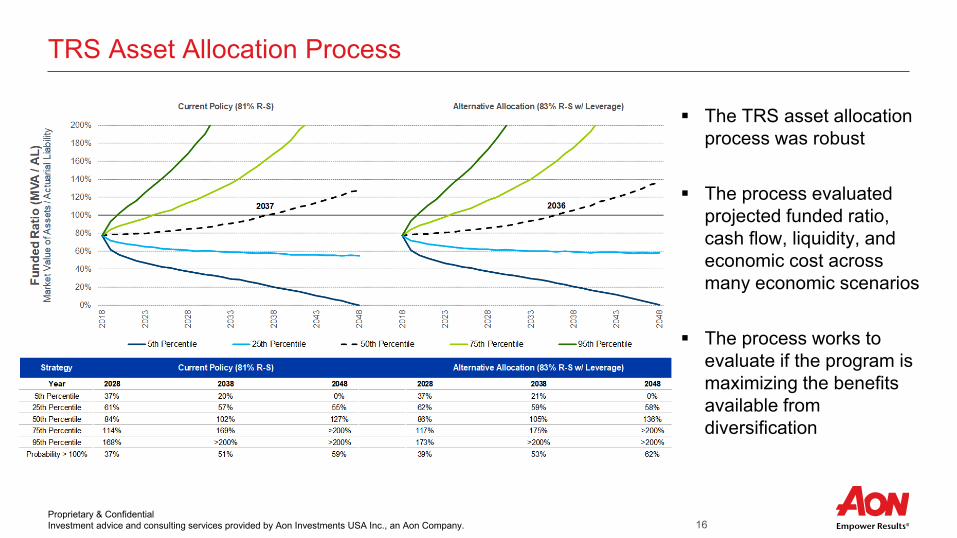
Proprietary & Confidential Investment advice and consulting services provided by Aon Investments USA Inc., an Aon Company. 16
TRS Asset Allocation Process
The TRS asset allocation process was robust
The process evaluated projected funded ratio, cash flow, liquidity, and economic cost across many economic scenarios
The process works to evaluate if the program is maximizing the benefits available from diversification

Proprietary & Confidential Investment advice and consulting services provided by Aon Investments USA Inc., an Aon Company. 17
TRS Diversification Framework

Proprietary & Confidential Investment advice and consulting services provided by Aon Investments USA Inc., an Aon Company. 18
Investment Jargon

Proprietary & Confidential Investment advice and consulting services provided by Aon Investments USA Inc., an Aon Company. 19
What is Standard Deviation?
Standard deviation is a measure of how widely an investment return can differ from its expected, or average, result
– Or has differed in the past
Suppose we have an investment with an expected return of 10% per year and a standard deviation of 20%
– We would expect the return to be between -10% and + 30% in 2 of 3 years
– We would expect the return to be between -30% and + 50% in 19 of 20 years
Distribution of Returns
-60 -50 -40 -30 -20 -10 0 10 20 30 40 50 60 70 80
1 Standard Deviation (2/3)
2 Standard Deviations (19/20)
Expected Return = 10% Standard D eviation=
Risk=
V ariance=
V olatility

Proprietary & Confidential Investment advice and consulting services provided by Aon Investments USA Inc., an Aon Company. 20
What is PE Ratio?
The P/E ratio is a reflection of the current value of a company relative to its current earnings– A higher P/E ratio means that investors are paying more for the same level of earnings, which
would imply that investors expect higher expected earnings growth into the future (or why would they pay more?)
The chart to the right shows that higher growth industries tend to have higher P/E ratios
-60
-20
20
60
100
140
MSCI ACWI P/E Ratio by SectorAs of December 31, 2019
Trailing P/E Forward P/E

Proprietary & Confidential Investment advice and consulting services provided by Aon Investments USA Inc., an Aon Company. 21
What is a Value Stock? What is a Growth Stock?
V alue Stocks – Stocks that are expected to outperform because they are trading below what they are really worth
– Represent ~ half of the equity market with financial ratios that exhibit “Value”
The table above outlines the difference in common ratios for the market, value, and growth
– Have outperformed over very long periods of time– Have underperformed over recent periods
0%
5000%
10000%
15000%
20000%
Cumulative Returns of the S&P 500 Growth and S&P 500 Value Indices(Jan 1975 - Dec 2020)
S&P 500 Growth S&P 500 Value
Growth Stocks – Stocks that are expected to outperform in the future because of their potential to grow quickly– Represent ~ half of the equity market with financial
ratios that exhibit “Growth”– Have significantly outperformed over recent periods
0.55
75.8%
3.0% 7.6%0.15
24.1%
0.8%2.7%
0.37
53.2%
1.9% 5.0%
0.000.100.200.300.400.500.600.700.80
Book toPrice
Sales toPrice
DividendYield
Free CashFlow Yield
9.7
6.0
15.914.2
12.410.1
0.0
5.0
10.0
15.0
20.0
EarningsGrowth
SalesGrowth
Value Ratios Growth Ratios

Proprietary & Confidential Investment advice and consulting services provided by Aon Investments USA Inc., an Aon Company. 22
Appendix – Glossary of Selected Investment Terms

Proprietary & Confidential Investment advice and consulting services provided by Aon Investments USA Inc., an Aon Company. 23
Appendix— Glossary of Selected Investment TermsActive Returns: Measures the average excess return of the portfolio relative to a benchmark. The excess return is annualized. The higher the active return, the better the portfolio’s performance versus the benchmark.
Alpha: Measures nonsystematic return, or the return that cannot be attributed to the market. Thus, it can be thought of as how the manager performed if the market had no gain or loss. A positive alpha implies that the manager has added value to the return of the portfolio over that of the market.
B eta: Measures the risk level of the manager. Beta measures the systematic risk, or the return that is attributable to market movements. A beta equal to one indicates a risk level equivalent to the market. Higher betas are associated with higher risk levels, while lower betas are associated with lower risk levels.
Common Stock: Securities that show ownership in a corporation. Stockholders share profits or losses in the corporation through dividends and changes in the stock’s market value.
Consumer P rice Index (CP I): A measure of the average change in prices over time of a fixed group of goods and services. The CPI is published by the Bureau of Labor Statistics in the Department of Labor and is released monthly. It is widely used as a cost-of-living benchmark.
Correlation: Statistical measure of the degree to which the movements of two variables are related, ranging from 1 to -1. For asset allocation purposes, mixing two assets with a correlation less than 1 results in a benefit of diversification because the two assets do not behave in exactly the same manner.
Coupon: The interest on a debt security, e.g., a bond, the issuer promises to pay the holder until maturity, expressed as an annual percentage of the security’s face value. For example, a bond with a 10% coupon will pay $ 10 per $ 100 of the face amount per year.
Credit Risk: The risk that an issuer may default on its securities. Relative degrees of credit risk are delineated by the rating agencies.
Currency Risk: Fluctuations in exchange rates can add to, or detract from, investment returns.
D ebt: General name for bonds, notes, mortgages, and other forms of paper evidencing amounts owed and payable on specified dates or on demand.
D erivatives: Securities, such as futures, options, or swaps, that derive their value from another security.
D iversification: Reducing risk by investing in more than one type of security, such as stocks, bonds, and money market instruments.
D ividend: A cash or other distribution to preferred or common stockholders.
D ividend Y ield: Annual percentage of return earned by an investor on a common or preferred stock. The yield is determined by dividing the amount of the annual dividends by the current market price.
D uration: Measure of the price change of a bond to a change in its yield to maturity. It summarizes, in a single number, the characteristics that cause bond prices to change in response to a change in interest rates. The price of a bond with a duration of three years will rise by approximately 3% for each 1% decrease in its yield to maturity. That price will decrease by 3% for each 1% increase in the bond’s yield. Price changes for two different bonds can be compared using duration. A bond with a duration of six years will exhibit twice the percentage price change of a bond with a three year duration. The actual calculation of a bond’s duration is somewhat complicated, but the idea behind the calculation is straight forward. The first step is to measure the time interval until receipt for each cash flow (coupon and principal payments) from a bond. The second step is to compute a weighted average of these time intervals. Each time interval is measured by the present value of that cash flow. This weighted average is the duration of the bond measured in years.
Efficient Market: A securities market in which prices accurately reflect all available knowledge and adjust immediately to any new information. Academicians who subscribe to the efficient market hypothesis maintain that a professional money manager can only achieve consistently superior investment results by taking greater than market risk.
Emerging Market: A financial market of a developing country, usually a small market with a short operating history.
Eq uity : Ownership or proprietary rights and interests in a company. Synonymous with common stock.
ERISA: The Employee Retirement Income Security Act of 1974 (ERISA) protects the retirement assets of Americans, by implementing rules that qualified plans must follow to ensure that plan fiduciaries do not misuse plan assets.
Ex cess Risk: A measure of the standard deviation of a portfolio’s performance relative to the risk free return, represented by 90-Day T-Bills. Ex ecution Costs: Total execution costs (the cost of buying and selling stocks) have three components: (1) the actual dollars paid to the broker in commissions, (2) the market impact (i.e., the impact that a manager’s trade has on the market price for the stock, this varies with the size of the trade and the skill of the trader), and (3) the opportunity cost (positive or negative) that is the result of not executing the trade instantaneously
Ex pense Ratio: A figure that represents the percentage of fund assets paid for operating expenses and management fees, including 12b-1 fees, administrative fees, and all other asset-based costs incurred by the fund, except for brokerage costs and sales charges.
Fiduciary : An individual, corporation, or association holding assets for a beneficiary. The fiduciary is charged with the responsibility of investing the money wisely for the beneficiary’s benefit.

Proprietary & Confidential Investment advice and consulting services provided by Aon Investments USA Inc., an Aon Company. 24
Appendix— Glossary of Selected Investment TermsInterest-Rate Risk: When interest rates rise, the market value of fixed-income securities (such as bonds) declines. Similarly, when interest rates decline, the market value of fixed-income securities increases.
Investment Grade: Bonds rated in the top four rating categories (AAA, AA, A, BBB) are commonly known as investment grade securities.
Junk B ond: A bond with a rating of BB or less. Also know as “non-investment grade”.
Liq uidity : The ability to convert an investment into cash promptly with a minimum risk of principal.
Market Risk: Fluctuations in prices for the market as a whole or in specific sectors, brought on by outside forces. It is part of a security’s risk that is common to all securities of the same general class (stocks, bonds) and thus cannot be eliminated through diversification.
Maturity : The date on which a loan, bond, mortgage or other debt security becomes due and is to be paid off.
Modern P ortfolio Theory : The theoretical framework for designing investment portfolios based upon the risk and reward characteristics of the entire portfolio, which is held not to be equivalent to the aggregation of the individual securities of the portfolio. The major tenet of the theory holds that reward is directly related to risk, which can be divided into two basic parts: 1) systematic risk (portfolios' behavior as a function of the market' s behavior), and 2) unsystematic risk (portfolios' behavior attributable to selection of individual securities). Because un-systematic risk can be largely eliminated through diversification, the portfolio will be subject principally to systematic risk.
Mortgage-B acked Securities: Bonds which are a general obligation of the issuing institution, but are secured by a pool of mortgages.
Mutual Fund: An investment company that pools money of individuals and invests it into stocks, bonds and other securities under the guidance of a professional manager.
P assive Management: Buying and holding all (or most) of the stocks in an index (such as S&P 500 Index). There is no research done to select individual securities.
Fix ed Income: Securities/investments in which the income during ownership is fixed or constant. Generally refers to any type of bond investment.
Futures: Contracts to by or sell anything (a stock, a basket of stocks, commodities such as grain, gold, etc.) on a specified day in the future for a preset price. These contracts are traded on exchanges.
Government B onds: Bonds backed by the federal government, whether issued by the Treasury or one of the government agencies.
Growth Stock: Stock of a company which is growing earnings and/or revenue faster than its industry or the overall market and is expected to continue to show high levels of profit growth and P/E multiples. Such a company usually pays little or no dividends, preferring to use the income to finance further expansion. Generally, these stocks are contrasted with value stocks that trade at lower P/E multiples.
H edge Funds: A subset of alternative investments that incorporate all investment strategies run with an orientation to producing primarily absolute returns using largely marketable securities. These strategies typically include short-selling and often require the use of leverage. As a result, correlations with broader markets are expected to be modest to low.
H igh Y ield B ond: Debt issued by a company that is experiencing financial difficulty and may not be able to meet payments on its obligations. These securities carry a higher interest rate than other corporate bonds due to their higher risk.
Immuniz ation: A process for designing fixed income portfolios to obtain a target rate of return over a specified time period, within a narrow range, despite market conditions.
Index : A statistical yardstick composed of a basket of securities with a set of characteristics. An example of this would include the " S&P 500“, which is an index of 500 stocks.
Inflation: A general rise in prices, usually measured by changes in prices of major indices, such as the Consumer Price Index.
Information Ratio: The Information Ratio to a manager series vs. a benchmark series is the is the quotient of the annualized excess return and the annualized standard deviation of excess return. This is one estimate of how much value is being added through active management decisions.
Interest Rates: The percentage paid as a fee for the use of money, expressed as an annual percentage of the principal amount. The rate is influenced by a variety of factors including economic growth, inflation, supply/demand and international factors.

Proprietary & Confidential Investment advice and consulting services provided by Aon Investments USA Inc., an Aon Company. 25
Appendix— Glossary of Selected Investment TermsP rice/ Earnings Ratio This is the weighted average of the price/earnings ratios of all stocks in a fund’s portfolio. The P/E ratio of a stock is obtained by dividing the current price of the stock by its trailing 12 months’ earnings per share.
P rice/ B ook Ratio: The ratio of a stock’s price to its book value per share. This number is used by securities analysts and money managers to judge whether a stock is undervalued or overvalued. A stock selling at a high price/book ratio, such as 3 or higher, may represent a popular growth stock with minimal book value. A stock selling below its book value may attract value-oriented investors who think that the company’s management may undertake steps, such as selling assets or restructuring the company, to unlock the hidden value on the company’s balance sheet.
P rice/ Earnings Ratio: The ratio of a company’s stock price to its earnings per share. Price/Earnings ratio is a common measure of the relative valuation of a stock.
P rivate Eq uity : Equity capital invested in a private company.
Rate of Return: The yield obtainable on a security based on its purchase price or its current market price. This may be amortized yield to maturity on a bond or the current income return.
Return: The amount of money received annually from an investment, usually expressed as a percentage.
Risk: Uncertainty as to whether or not an investment choice will perform as expected, particularly due to factors beyond one’s control (in other words, the odds an investment will make or lose money.)
Risk Return Graph: This graph is used to compare the performance and risk (standard deviation) of the fund against the performance and risk of an appropriate benchmark for a specific period of time.
Risk/ Reward: The trade-off between preserving your investment and maximizing your profit. In general, the higher the return, the more likely you are to lose your initial investment. Lower risk usually results in less profit.
RO E (Return on Eq uity ): The amount, expressed as a percentage, earned on a company’s common stock investment for a given period. Return on equity tells commons stockholders how effectually their money is being employed.
R-Sq uared Statistic: A statistic that measures the reliability of alpha and beta in explaining the return of a manager as a linear function of the market. Higher R-squared values indicate more reliable alpha and beta statistics and are useful in assessing a manager’s investment style.
Sector: A particular group of stocks, usually found in one industry or a combination of industries, such as airline or railroad stocks.
Sharpe Ratio: This is a risk-adjusted measure calculated by using standard deviation and excess return to determine reward per unit of risk. In general, the higher the Sharpe Ratio, the better the fund’s historical risk-adjusted performance. The Sharpe ratio is calculated by dividing the fund’s annual excess return by the fund’s annualized standard deviation.
Spread: The yield or price differential between two different securities
Standard D eviation: A statistical gauge of risk which measures the spread of the difference of returns from their average. The more a portfolio’s returns vary from its average, the higher the standard deviation.
Stock: A certificate of ownership. A contract between the issuing corporation and the owner which gives the latter an interest in the management of the corporation the right to participate in its profits.
Total Return: The aggregate increase or decrease in the value of the portfolio resulting from the net appreciation or depreciation of the principal of the fund, plus or minus the net income or loss experienced by the fund during the period.
Tracking Error: The deviation of a dependent variable (i.e., an investment portfolio) with respect to a reference function (i.e., a benchmark.)
Treasuries: Negotiable debt obligations of the U.S. government, secured by its full faith and credit and issued at various schedules and maturities.
Trustee: A bank designated as the custodian of funds and official representative of bondholders to enforce their contract with the issuer.
Turnover: The rate at which securities within a portfolio are bought and sold.
Turnover Ratio: This is a measure of the fund’s trading activity that is calculated by taking the lesser of purchases or sales (excluding all securities with maturities of less than one year) and dividing by average monthly assets. The resulting percentage loosely represents the percentage of the portfolio’s holdings that have changed over the past year.
Universe: These are composites of managers that share a common investment style and provide a peer analysis of how the fund is performing relative to other investments in the same asset and style category.
Universe Up/ D own Capture: The up and down capture is a measure of how well a manager was able to replicate or improve on phases of positive benchmark returns, and how badly the manager was affected by phases of negative benchmark returns. To calculate the capture, we first form a new series from the manager and benchmark series by dropping all time periods where the benchmark return is zero or negative. The up capture is then the quotient of the annualized return of the resulting manager series, divided by the annualized return of the resulting benchmark series. The down capture is calculated analogously.
V alue Stock: A stock that is considered to be a good investment at a desirable price, based on fundamental analysis, such as its P/B and its P/E, among other criteria. Generally, these stocks are contrasted with growth stocks that trade at higher P/E multiples.

FootnoteInvestment advice and consulting services provided by Aon Investments USA Inc. 26
Legal Disclosures and Disclaimers
Investment advice and consulting services provided by Aon Investments USA Inc. The information contained herein is given as of the date hereof and does not purport to give information as of any other date. The delivery at any time shall not, under any circumstances, create any implication that there has been a change in the information set forth herein since the date hereof or any obligation to update or provide amendments hereto.
This document is not intended to provide, and shall not be relied upon for, accounting, legal or tax advice. Any accounting, legal, or taxation position described in this presentation is a general statement and shall only be used as a guide. It does not constitute accounting, legal, and tax advice and is based on Aon Investments’ understanding of current laws and interpretation.
Aon Investments disclaims any legal liability to any person or organization for loss or damage caused by or resulting from any reliance placed on that content. Aon Investments reserves all rights to the content of this document. No part of this document may be reproduced, stored, or transmitted by any means without the express written consent of Aon Investments.
Aon Investments USA Inc. is a federally registered investment advisor with the U.S. Securities and Exchange Commission. Aon Investments is also registered with the Commodity Futures Trading Commission as a commodity pool operator and a commodity trading advisor, and is a member of the National Futures Association. The Aon Investments ADV Form Part 2A disclosure statement is available upon written request to:
Aon Investments USA Inc.200 E. Randolph StreetSuite 700Chicago, IL 60601ATTN: Aon Investments Compliance Officer
© Aon plc 2020. All rights reserved.

TAB 19
CIO UP D ATE
Jase Auby, Chief Investment OfficerFebruary 2021
INVESTMENT MANAGEMENT DIVISION
Teacher Retirement Sy stem of Tex as

2
CIO UpdateIMD at a Glance
Priorities Our People
Snapshot as of January 2021IMD FTEs 191
Shared-Services 15Contractors 19
Secondees 6
Activity Phase I Phase IIHired 30 16
Recruiting 2 3Pipeline 0 12
32 31
Key Dates and Upcoming Events
Event Location DatesCouncil of Institutional Investors (CII) Spring Conference
Virtual March 8-10, 2021
Strategic Partnership Network (SPN) Summits
Virtual May 27, 2021
• Total Trust. Ended 2020 calendar year at an all-time high inassets under management ($176.9B). 1-year return of 11.6%.
• Return to Office. Continue to monitor COVID-19 conditions in anticipation of next phase of the Return to Office program
• Emerging Managers. Virtually hosted the 2021 Emerging Manager Conference with over 2,600 attendees, including representation from 55 allocators
• Recruiting and Talent Management Activities
o Town Hall. Hosted annual Town Hall event virtually to emphasize IMD culture and collaboration including guest speaker TRS Trustee Nanette Sissney
o Announced winners of the Annual Excellence in Investing Award and Spotlight Award
o Recruiting. Resumed Build the Fleet hiring with a target of 8 new FTE fleet hires throughout the first quarter
o Internship Program. Completed recruiting process for the IMD Intern Class of 2021. Includes six interns in Public Markets and two interns in Investment Operations.

Market Update

4
Executive Summary
• The second half of 2020 was characterized by:
o Resurgence of COVID-19 infection rates and approval of multiple vaccines with better-than-expected efficacy
o Continued recovery and rally in global equity markets, led by the United States and Emerging Markets
o Accommodative global monetary policy stance while interest rates remained near record lows
o Strong initial rebound of global economic growth as other leading economic indicators remain mixed
o Political tensions within the United States and the election of a new presidential administration
• In the first half of 2021, markets are focused on:
o Widespread vaccination of population has potential to uplift economic growth and virus depressed sectors
o Global monetary policy to remain accommodative to recovery with suppressed worldwide interest rates
o Continued fiscal stimulus and government spending to add further momentum to economic recovery
o Inflation to remain subdued while unemployment begins to recover with new stimulus and potential growth
o New political leadership and policies in the US could add volatility to markets and international economy
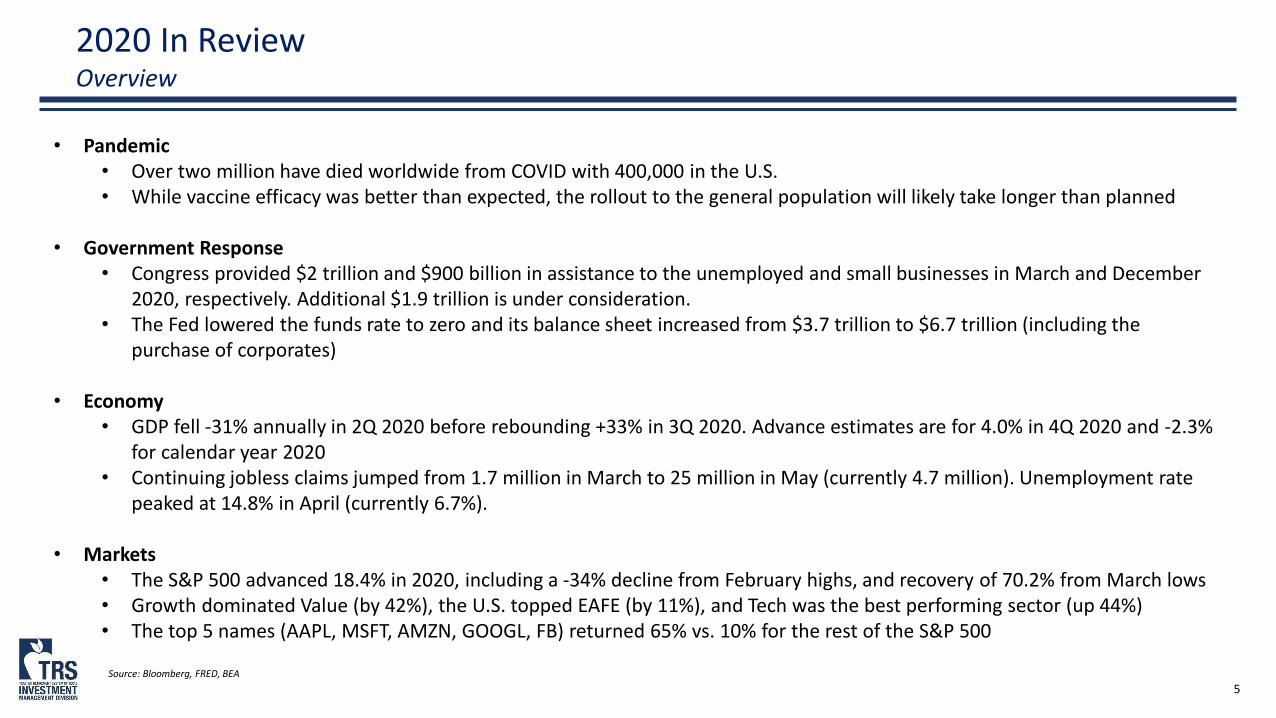
5
2020 In ReviewOverview
• Pandemic• Over two million have died worldwide from COVID with 400,000 in the U.S.• While vaccine efficacy was better than expected, the rollout to the general population will likely take longer than planned
• Government Response• Congress provided $2 trillion and $900 billion in assistance to the unemployed and small businesses in March and December
2020, respectively. Additional $1.9 trillion is under consideration.• The Fed lowered the funds rate to zero and its balance sheet increased from $3.7 trillion to $6.7 trillion (including the
purchase of corporates)
• Economy• GDP fell -31% annually in 2Q 2020 before rebounding +33% in 3Q 2020. Advance estimates are for 4.0% in 4Q 2020 and -2.3%
for calendar year 2020• Continuing jobless claims jumped from 1.7 million in March to 25 million in May (currently 4.7 million). Unemployment rate
peaked at 14.8% in April (currently 6.7%).
• Markets• The S&P 500 advanced 18.4% in 2020, including a -34% decline from February highs, and recovery of 70.2% from March lows• Growth dominated Value (by 42%), the U.S. topped EAFE (by 11%), and Tech was the best performing sector (up 44%)• The top 5 names (AAPL, MSFT, AMZN, GOOGL, FB) returned 65% vs. 10% for the rest of the S&P 500
Source: Bloomberg, FRED, BEA

6
2020 In ReviewMarket Returns
Source: Bloomberg
-40%
-30%
-20%
-10%
0%
10%
20%
30%
40%
50%
Gre
ece
Eq
. -3
5.7
%
Bra
zil R
eal
-29
.0%
WTI
-2
7.5
%
Bra
zil E
q.
-20
.9%
Ru
ssia
n R
ub
le -
20
.0%
Ru
ssia
Eq
. -1
7.1
%
UK
Eq
. -1
6.1
%
Nat
Gas
-1
5.9
%
Spai
n E
q.
-13
.7%
Live
Cat
tle
-1
1.6
%
Ital
y Eq
. -8
.3%
Fran
ce E
q.
-6.0
%
Me
xica
n P
eso
-5
.2%
NA
HY
-4
.6%
Me
xico
Eq
. -4
.0%
Au
stra
lia E
q.
-3.7
%
USD
Tra
de
Wei
ghte
d -
2.7
%
Ind
ian
Ru
pe
e -
2.4
%
Sou
th A
fric
a Eq
. -1
.0%
Jap
an B
. -0
.2%
EM C
red
it -
0.1
%
Euro
pe
Cre
dit
0.0
%
Ger
man
y Eq
. 0
.1%
Euro
pe
Xo
ver
0.1
%
NA
IG 0
.2%
Can
ada
Eq.
0.9
%
Ho
ng
Ko
ng
Eq.
2.0
%
CA
D 2
.0%
Fran
ce B
. 2
.4%
Ger
man
y B
. 2
.7%
Ch
ina
B.
2.8
%
GB
P 3
.0%
UK
ILB
3.6
%
JPY
4.9
%
UK
B.
5.1
%
Au
stra
lia B
. 5
.4%
Sou
th K
ore
an W
on
6.0
%
Ch
ina
Re
nm
inb
i 6
.3%
Jap
an E
q.
6.6
%
Bra
zil I
LB 6
.9%
Suga
r 6
.9%
Co
tto
n 7
.7%
Ital
y B
. 7
.9%
EUR
8.2
%
CH
F 8
.4%
AU
D 8
.8%
Au
stra
lia IL
B 8
.9%
Alu
min
um
9.4
%
Can
ada
B.
9.4
%
Wh
eat
9.6
%
US
B.
10
.0%
US
ILB
11
.0%
Euro
pe
ILB
11
.2%
Co
rn 1
2.7
%
Ind
ia E
q.
16
.8%
Nic
kel
18
.5%
USA
Eq
. 2
1.1
%
Go
ld 2
2.5
%
Co
pp
er 2
3.8
%
Ch
ina
Eq.
26
.7%
Taiw
an E
q.
26
.9%
Soyb
ean
32
.5%
Ko
rea
Eq.
34
.0%
Silv
er
43
.9%
Asset Class PerformanceDecember 31, 2019 - December 31, 2020 • Local • Percent (%)
Dev Equity EM Equity Bonds Commodities Currency Credit ILB
75% of assets had positive returns in calendar year 2020
• Top 5: Silver +44%, Korea Eq +36%, Soybeans +33%, Taiwan Eq +32%, China Eq +28%
• Bottom 5: Greek equities ‐33%, Brazilian Real ‐29%, WTI ‐28%, Russian Ruble ‐20%, Nat Gas ‐16%
US Equity
US Bonds
Oil

7
2020 In ReviewThe S&P 500’s historic drawdown
Source: Bloomberg
Dec 14: US Begins Vaccinations
Dec 21: US $900b Stimulus
3756
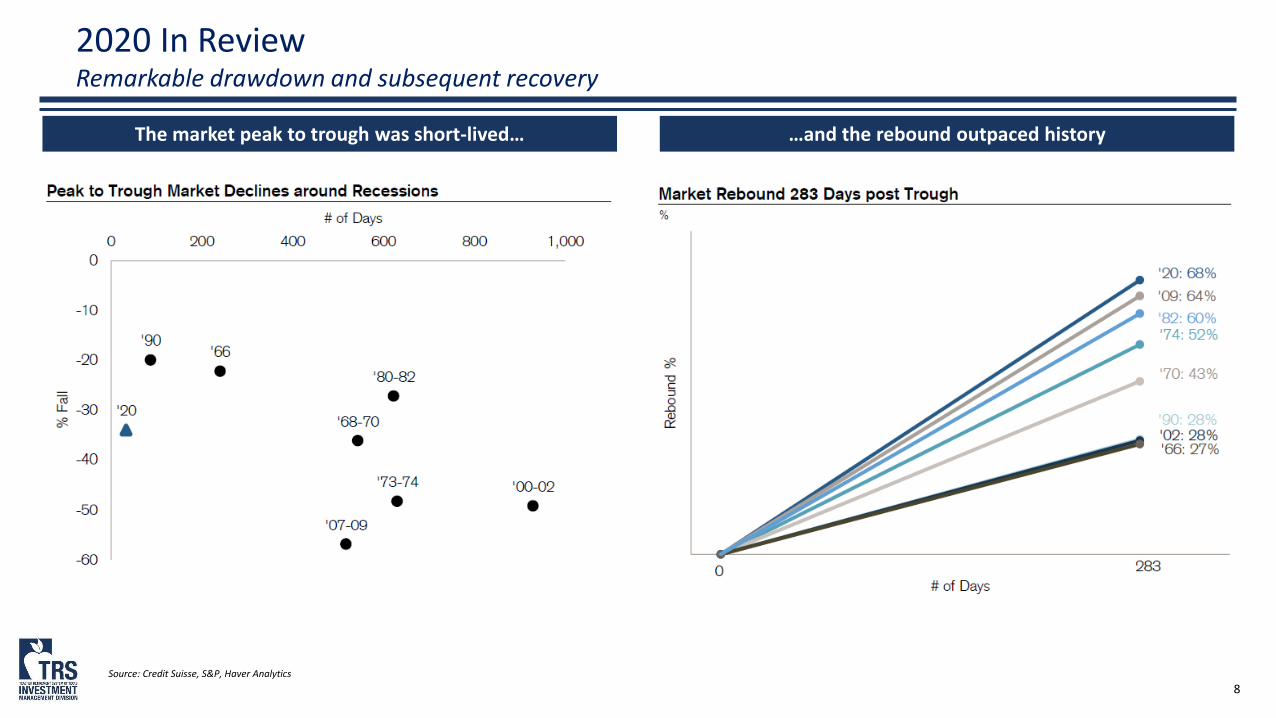
8
2020 In ReviewRemarkable drawdown and subsequent recovery
Source: Credit Suisse, S&P, Haver Analytics
The market peak to trough was short-lived… …and the rebound outpaced history
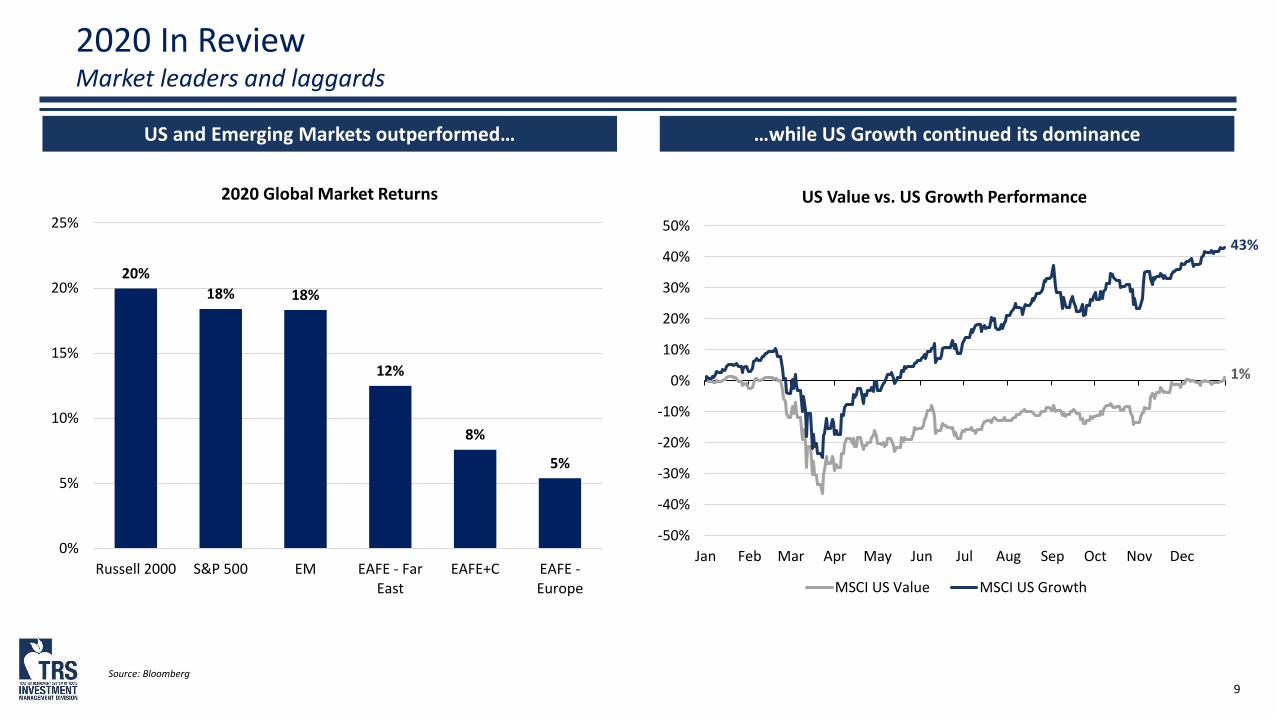
9
2020 In ReviewMarket leaders and laggards
Source: Bloomberg
US and Emerging Markets outperformed… …while US Growth continued its dominance
20%
18% 18%
12%
8%
5%
0%
5%
10%
15%
20%
25%
Russell 2000 S&P 500 EM EAFE - FarEast
EAFE+C EAFE -Europe
2020 Global Market Returns
-50%
-40%
-30%
-20%
-10%
0%
10%
20%
30%
40%
50%
Jan Feb Mar Apr May Jun Jul Aug Sep Oct Nov Dec
US Value vs. US Growth Performance
MSCI US Value MSCI US Growth
43%
1%

10
0
5
10
15
20
25
30
1996 2000 2004 2008 2012 2016 2020
S&P 500 P/E Ratio
S&P 500 P/E
Equity and Bond Yields
Source: Bloomberg, FactsetNote: P/E Ratio = S&P 500 index price/forward annual earnings per share = 3756/$167.4 = 22.4x. Earnings Yield (E/P) = S&P 500 forward annual earnings per share/index price = $167.4/3756 = 4.5%
Average = 16.2x
-4%
-2%
0%
2%
4%
6%
8%
1996 2000 2004 2008 2012 2016 2020
Equity Premium (S&P 500 E/P Ratio – 10 Year UST Yield)
Average = 2.7%
3.6%
Overvalued
Undervalued
22.4x
4.5%
0.9%0%
2%
4%
6%
8%
10%
12%
1996 2000 2004 2008 2012 2016 2020
S&P 500 E/P Ratio
S&P 500 E/P 10-Yr UST Yield
Undervalued
Overvalued
Undervalued
Overvalued

11
Indicators show the US is in Early to Mid Cycle
Source: TRS IMD
US Cycle Conditions
• The US is currently between Early (8 signals on) and Mid (11 signals on) Cycle
Count of Signals On 8 11 4

Special Topic: Long-Term Investing

13
0%
2%
4%
6%
8%
10%
12%
14%
16%
18%
1980 1985 1990 1995 2000 2005 2010 2015 2020
-1.0%
0.0%
1.0%
2.0%
3.0%
4.0%
2010 2011 2012 2013 2014 2015 2016 2017 2018 2019 2020 2021
Core CPI Core PCE Fed Target
Special Topic: Long-Term InvestingOverview
Source: US Bureau of Economic Analysis (BEA), Federal Reserve Economic Data (FRED), Goldman Sachs, BloombergNote: Inflation figures calculated year over year on a monthly basis, adjusted S&P 500 EPS calculated as twelve trailing months on a quarterly basis
Special Topics Update on Growth Special Topic
Update on Inflation Special Topic Update on Interest Rates Special Topic
As of 12/31
As of 11/30 As of 12/31
Topic Date
1 Recession September 20172 Growth February 20183 Inflation September 20184 Strategic Asset Allocation February 20195 Value September 20196 Diversification February 20207 Interest Rates September 20208 Long-Term Investing February 2021
0
40
80
120
160
200
240
400
1200
2000
2800
3600
4400
5200
S&P 500 Adjusted EPS (RHS)
S&P 500 Price (LHS)
2021E4300
2022E4600
12/313756
2021E$178
2022E$196
0.91%
US 10 Year Bond Yield

14
Special Topic: Long-Term InvestingWhy invest over the long-term?
Source: JPMorgan
“You have never lost money in stocks over any 20-year period.” – Jeremy Siegel, author of ‘Stocks for the Long Run’
1. Weather Volatility. Market corrections and drawdowns will happen
2. Stay Invested. Most investors cannot accurately time the markets
3. Diversification. Withstand various economic cycles and worldwide geopolitical conflicts
4. Hold Illiquid Assets. Long-term horizon allows for a higher allocation to illiquid assets
5. Avoid Emotional Biases. Short-term investing can allow feelings to dictate often poorly timed decisions
6. Power of Compounding. Reinvesting earnings and compounding can make an exponential difference over time
1. Weather Volatility

15
Special Topic: Long-Term Investing1. Weather Volatility. Volatility is normal and should not be a deterrent
Source JPMorgan, FactSet, S&PNote: As of December 31, 2020. Red dots indicate intra-year drops which refers to the largest market drop from a peak to a trough. Bars represent calendar year returns
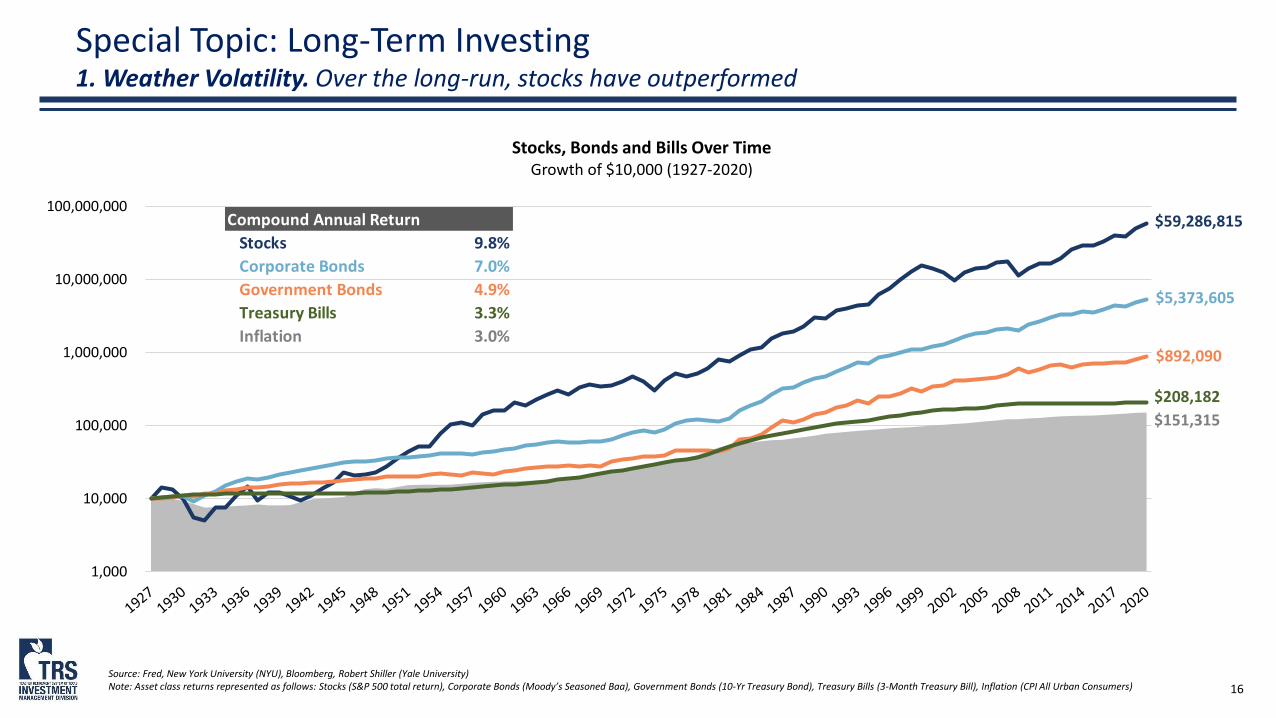
16
Special Topic: Long-Term Investing1. Weather Volatility. Over the long-run, stocks have outperformed
Source: Fred, New York University (NYU), Bloomberg, Robert Shiller (Yale University)Note: Asset class returns represented as follows: Stocks (S&P 500 total return), Corporate Bonds (Moody’s Seasoned Baa), Government Bonds (10-Yr Treasury Bond), Treasury Bills (3-Month Treasury Bill), Inflation (CPI All Urban Consumers)
1,000
10,000
100,000
1,000,000
10,000,000
100,000,000
Stocks, Bonds and Bills Over TimeGrowth of $10,000 (1927-2020)
Compound Annual Return
Stocks 9.8%
Corporate Bonds 7.0%
Government Bonds 4.9%
Treasury Bills 3.3%
Inflation 3.0%
$59,286,815
$5,373,605
$892,090
$208,182
$151,315

17
Special Topic: Long-Term Investing2. Stay Invested. Staying invested matters, especially on the best days
Source: Bloomberg
$38,386
$17,586
$10,428
$6,692
$4,479 $3,075 $2,178
Fully Invested Missed 10 Best Days Missed 20 Best Days Missed 30 Best Days Missed 40 Best Days Missed 50 Best Days Missed 60 Best Days
S&P 500 Total Return ScenariosGrowth of $10,000 (January 2000-December 2020)
6.6% Annualized
Return
2.7%
0.2%
-1.9%-3.8%
-5.5%-7.0%
Since 2000… • Three of the S&P 500’s ten best days occurred in 2020
• All ten of the best days occurred in volatile and recessionary conditions (2008, 2009, 2020)
• On average, the 60 best days returned 4.9%

18
Special Topic: Long-Term Investing3. Diversification. Long-term value of diversification
Source Bridgewater
Since 1900, a diverse, equal-weight portfolio mix across five developed countries performed almost as well as the best performer

19
Special Topic: Long-Term Investing4. Hold Illiquid Assets. Long-term investing allows for a higher allocation to illiquid assets
Source: Morgan Stanley, State Street BankNote: Long-term expected returns calculated from Capital Markets Assumptions survey responses submitted by 26 firms representing TRS external managers, Strategic Partners and consultants.
Pensions continue to shift towards more illiquid assets… …with the potential for higher uncorrelated returns
Public Equities
TRS 2019 SAA

20
Special Topic: Long-Term Investing6. Power of Compounding. The power of compounding can have a dramatic effect
Source: Bloomberg, Robert Shiller (Yale University)
-
200,000
400,000
600,000
800,000
1,000,000
1,200,000
1,400,000
1,600,000
1,800,000
2,000,000
70 75 80 85 90 95 00 05 10 15 20
S&P 500 Price Return vs. Total ReturnGrowth of $10,000 Since 1970
With Dividends Reinvested
Price Return Only
December 2020: $1,736,036
December 2020: $405,588
Annualized Cumulative
Total Return 10.6% 17,260%
Price Return 7.5% 3,956%

21
Special Topic: Long-Term InvestingLong-Term Investing Considerations
Risk factors and opportunities which move too slowly to affect the short-term need to be accounted for in the long-run:
1. Demographics. Aging populations and number of workers can affect economic growth
2. Valuation Cycles. Equity and bond valuation trends are observable in the long-run
3. Commodity Cycles. Long-term structural changes in demand
4. Sector Composition. S&P 500 sector composition has shifted over time
5. Market Concentration. Today’s market has become quite concentrated in the top 5 stocks
6. Shiller Valuations. Long-term metrics help understand fluctuations over different periods of a business cycle
7. Inflation. Stocks have been a proven hedge against inflation

22
Special Topic: Long-Term Investing1. Demographics. Number of workers is a lead determinant of economic growth
Source: JPMorgan, Census Bureau, DOD, DOJ, BLSNote: Future working-age population is calculated as the total estimated number of Americans from the Census Bureau, per the February 2020 report, controlled for military enrollment, growth in institutionalized population and demographic trends. Growth in working-age population does not include illegal immigration; DOD Troop Readiness reports used to estimate percent of population enlisted. Numbers may not sum due to rounding.
3.1% 2.5% 0.9% 1.4% 2.0% 1.5% 0.9%
1.2%
1.9%
2.4%
1.7%
1.3%
0.3%
1.4%
0.0%
0.5%
1.0%
1.5%
2.0%
2.5%
3.0%
3.5%
4.0%
4.5%
5.0%
'50-'59 '60-'69 '70-'79 '80-'89 '90-'99 '00-'09 '10-'19
Drivers of GDP GrowthAverage Year-Over-Year % Change
4.3%4.4%
3.3%3.1%
3.4%
1.8%
2.3%
Growth in workers+ Growth in real output per worker
Growth in real GDP

23
Special Topic: Long-Term Investing1. Demographics. Aging populations and longer life spans make long-term investing even more important
Source: Organisation for Economic Co-Operation and Development (OECD)Note: Working age population defined as ages 15-64. Actual data from 1960-2018, forecasted data from 2019-2060
50%
55%
60%
65%
70%
75%
19
60
19
65
19
70
19
75
19
80
19
85
19
90
19
95
20
00
20
05
20
10
20
15
20
20
20
25
20
30
20
35
20
40
20
45
20
50
20
55
20
60
World
50%
55%
60%
65%
70%
75%
19
60
19
65
19
70
19
75
19
80
19
85
19
90
19
95
20
00
20
05
20
10
20
15
20
20
20
25
20
30
20
35
20
40
20
45
20
50
20
55
20
60
United States
50%
55%
60%
65%
70%
75%
19
60
19
65
19
70
19
75
19
80
19
85
19
90
19
95
20
00
20
05
20
10
20
15
20
20
20
25
20
30
20
35
20
40
20
45
20
50
20
55
20
60
European Union
50%
55%
60%
65%
70%
75%
19
60
19
65
19
70
19
75
19
80
19
85
19
90
19
95
20
00
20
05
20
10
20
15
20
20
20
25
20
30
20
35
20
40
20
45
20
50
20
55
20
60
China
50%
55%
60%
65%
70%
75%
19
60
19
65
19
70
19
75
19
80
19
85
19
90
19
95
20
00
20
05
20
10
20
15
20
20
20
25
20
30
20
35
20
40
20
45
20
50
20
55
20
60
Japan
50%
55%
60%
65%
70%
75%
19
60
19
65
19
70
19
75
19
80
19
85
19
90
19
95
20
00
20
05
20
10
20
15
20
20
20
25
20
30
20
35
20
40
20
45
20
50
20
55
20
60
G20
65.3%
61.8%
65.4%
60.1%
64.6%
56.2%
71.2%
55.7%
59.7%
51.6%
67.7%
60.7%
Working Age Population as % of Total Population (Ages 15-64)

24
Special Topic: Long-Term Investing2. Valuation Cycles. Long-term valuation cycles
Source: Deutshe Bank, GFD
1. First Era of Globalization(1860-1914)
2. Great Wars and the Depression (1914-1945)
3. Bretton Woods and Gold-Based Monetary System(1945-1971)
4. Start of Fiat Money and High Inflation Era(1971-1980)
5. Second Era of Globalization (1980-2020?)
6. Age of Disorder(2020? - ????)
1 2 3 4 5 6
Aggregated 15 DM country average bond (nominal yields) and equityPercentile valuations (100% = most expensive; 0% = cheapest)

25
Special Topic: Long-Term Investing3. Commodity Cycles. Long-term commodity “super cycles”
Source: Stifel, Warren & Pearson Commodity Index (1795–1912), WPI Commodities (1913–1925), equal-weighted (1/3rd ea.) PPI Energy, PPI Farm Products and PPI Metals (Ferrous and Non-Ferrous) ex-precious metals (1926-1956), Refinitiv Equal Weight (CCI) Index (1956–1994), and Refinitiv Core Commodity CRB Index (1994 to present)Note: Blue dots forecast dots are estimates
US Commodity Price Index Since 1795 = Inflation Peak = Inflation Trough
10
-Yr
Ro
llin
g C
om
po
un
d G
row
th R
ate

26
Special Topic: Long-Term Investing4. Sector Composition. S&P 500 sector composition has shifted over time
Source: Goldman Sachs

27
Special Topic: Long-Term Investing5. Market Concentration. Today’s market has become quite concentrated in the top 5 stocks
Source: Morgan Stanley, Cornerstone

28
Special Topic: Long-Term Investing6. Shiller Valuation. Long-term P/E ratios look expensive
Source: Deutsche BankNote: Data as of December 31, 2020. Legend arranged from high to low based on the current value
Long-Term (10 Year) P/E Ratio
Overvalued
Undervalued

29
Special Topic: Long-Term Investing6. Shiller Valuation. However, adjusted for interest rates, valuations are not stressed
Source: Deutsche BankNote: Data as of December 31, 2020
Long-Term Earnings Yield (10 Year) minus Bond Yield
Undervalued
Overvalued

30
Special Topic: Long-Term Investing7. Inflation. Stocks have been a proven hedge against inflation
Source: Stocks for the Long Run (Jeremy Siegel)

31
Special Topic: Long-Term InvestingConclusion
• Market Update
o The second half of 2020 was characterized by a continued recovery in global equity markets, led by the US and Emerging Markets, amid a resurgence in COVID-19 infection rates and political tensions within the US
o Over the first half of 2021, global markets are expected to extend the momentum of strong performance propelled by the anticipation of widespread vaccination, potential revival of the global economy, and accommodative global monetary and fiscal policy
• Special Topic: Long-Term Investing
o A long-term investment horizon is a strength for TRS
o It allows us to avoid short-term volatility and realize higher returns over time
o When your time horizon is long-term, slow moving factors need to be considered as drivers of returns

APPENDIX
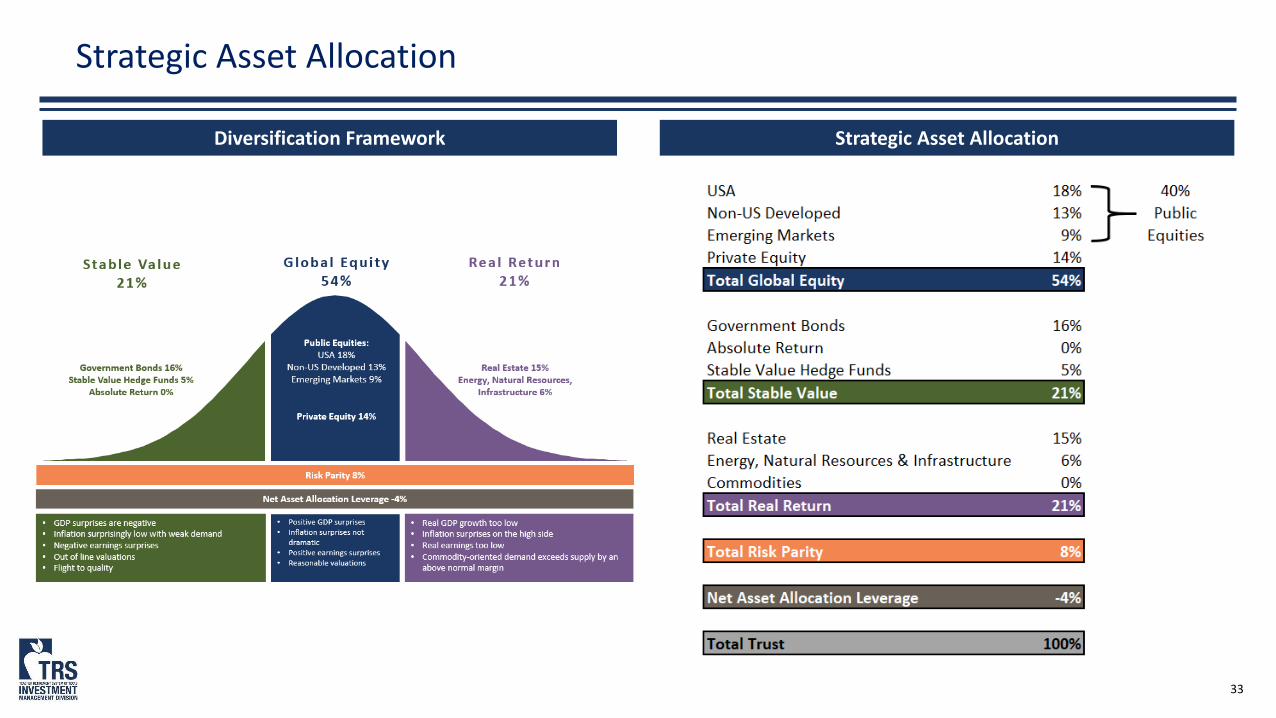
33
Strategic Asset Allocation
Diversification Framework Strategic Asset Allocation

34
Macroeconomic UpdateInflation, Growth, Leading Economic Indicators (LEI)
Source: Bloomberg, FactSet, TRS IMD, Blackrock as of 12/31/20201 Equity Risk Premium is the forward earnings yield of the local equity market index less applicable 10 year government bond yield2 For USA, 10yr US Treasuries; for Europe, 10yr German gov. bonds; for Japan, 10yr Japanese gov. bonds; for EM, a blend of 10yr Chinese, South Korean, and Brazilian gov. bonds
Region10yr gov.
bond yields2
Equity Risk Premium
Current 10-Year Average
USA 0.9% 3.6% 4.4%
Eurozone -0.6% 6.4% 6.8%
UK 0.2% 6.8% 6.3%
Japan 0.0% 5.4% 7.0%
Emerging Markets 3.1% 3.4% 4.9%
USA 9-Box Leading Economic Indicators
Global 9-Box Government Bond Yields and ERP1
March 2020 June 2020 September 2020
US Box 4 Box 7 Box 4
Europe Box 4 Box 7 Box 7
Japan Box 4 Box 4 Box 4
China Box 1 Box 4 Box 5
EM ex-China Box 5 Box 4 Box 4

35
60
80
100
120
140
160
180
200
2011 2012 2013 2014 2015 2016 2017 2018 2019 2020 2021USA Japan World Emerging Markets Europe
-3.1
6.9
9.5
7.2
11.5
9.9
14.2
9.5
15.8
26.1
-31.5
-2.8
4.8
7.8
11.7
13.5
19.9
23.0
6.526.2
14.414.4
28.811.9
29.425.2
34.826.2
-35 -30 -25 -20 -15 -10 -5 0 5 10 15 20 25 30 35
EnergyFinancials
UtilitiesCons Staples
IndustrialsHealthcare
MaterialsTelecom
Cons DiscInfo Tech
2H 2020 1-Year 5-Year
25.321.5
31.1
20.823.3
21.1
7.6
18.3
5.4
14.515.5
7.6
12.8
6.88.7
0
5
10
15
20
25
30
35
USA IMI (18% of BMark)
Non-US Developed(13% of BMark)
Emerging Markets(9% of BMark)
Europe Japan
2H 2020 1-Year 5-Year
Public Equities40% of TRS Policy Benchmark
Source: Bloomberg, FactSetNote: All returns are in US Dollar terms
40% of Benchmark
20.820.823.3
5.4
14.5
6.86.88.7
Europe Japan
Current3rd Quartile
Median
1st Quartile
Legend
As of 12/31, Forward PE (2001-2020)As of 12/31, USD, % Annualized
As of 12/31, USD, % Annualized, Sorted by 1-Year As of 12/31, Forward EPS Indexed to 100
5
10
15
20
25
30
USA Non USDeveloped
EmergingMarkets
Europe Japan
Regional Performance Regional Valuations
Global Sector Performance Regional Earnings

36
-2
0
2
4
6
8
10
2011 2012 2013 2014 2015 2016 2017 2018 2019 2020 2021
Government Bonds Non-US Govt Bonds TIPS High Yield
0.1 0.1 0.1
0.1 0.1 0.1
-8
-3
2
7
2000 2003 2006 2009 2011 2014 2017 2020 2022 2025
Taylor Rule Fed Funds Eff. Fed Exp Market Exp
0.0
0.5
1.0
1.5
2.0
2.5
3.0
3.5Today Beg of 2020 5 Years Ago
-2.9
0.1
4.7
9.611.3
17.7
0.6
11.0 10.8
7.17.8
1.2
5.1 5.2
8.6
-5
0
5
10
15
20
Government Bonds(16% of BMark)
Cash(2% of BMark)
TIPS Non-US GovernmentBonds
High Yield
2H 2020 1-Year 5-Year
Fixed Income16% of TRS Policy Benchmark
Source: Bloomberg, MSCI, FactSet (note all returns are in US Dollar terms)1Taylor Rule Definition: A central bank nominal policy rate set equal to a neutral real rate plus the current level of inflation, which responds to changes in the inflation gap (as measured by the difference between the current rate of inflation and the central bank's inflation target) and the output gap (as measured by the difference between NAIRU and the current unemployment rate).
Performance Yields
Cash Rate1 US Yield Curve
As of 12/31, %As of 12/31, USD, % Annualized
As of 12/31, % As of 12/31, Yield to Maturity, %

37
7.9
12.2
21.4
10.1
6.8 6.05.7
10.3
17.4
6.27.4
5.33.4
4.5
8.2
5.4
3.02.1
0
5
10
15
20
Stable Value(5% of BMark)
Directional EquityLong/Short
Credit CTA Macro
2H 2020 1-Year 5-Year
398209
335 291 257
581
925 91811391225
801634
-812
-239
192338
235 156 176
-11
-328
-49 -98-258-255
-1000
-500
0
500
1000
1500
1.1
1.2
1.3
1.4
1.5
1.6
1.7
1.8
2008 2009 2010 2011 2012 2013 2014 2015 2016 2017 2018 2019 2020
Equity Hedge Event Driven Macro Relative Value Fund of Funds
100
110
120
130
140
150
160
170
180
Directional HFs (HFRI FOF Index) Stable Value HF (HFRI FOFC Index)
Hedge Funds5% of TRS Policy Benchmark
Source: Bloomberg, HFR1Jensen’s alpha is a measure of alpha versus the equity market at equivalent risk. For example, if hedge funds are 20% as risky as the market then they are judged to have a 20% equity/80% cash benchmark.
Performance Alpha Versus Equivalent Risk Equity1
Average Hedge Fund Fees Hedge Fund Launches v. Liquidations
As of 12/31, Cumulative Jensen’s Alpha, Indexed to 100As of 12/31, USD, % Annualized
As of 9/30, Average Management Fee Per Strategy (%) As of 9/30, Count of Net Launches (Launches – Liquidations)

38
20.4 19.9
25.5
10.2
13.911.7
28.9
1.8
12.3 13.115.6
6.5
0
5
10
15
20
25
30
35
Private Equity(14% of BMark)
Buyout Venture Private Debt
2H 2020 1-Year 5-Year
279
165
0
40
80
120
160
200
240
280
320
Capital Raised ($bn) Average
418
185
0
100
200
300
400
500
Capital Invested ($bn) Average
-2x
3x
8x
13x
18x
1999 2000 2001 2002 2003 2004 2005 2006 2007 2008 2009 2010 2011 2012 2013 2014 2015 2016 2017 2018 2019 2020 2021
Public to Private Spread Russell 1000 Index Large US Buyouts (>$500M)
Private Equity14% of TRS Policy Benchmark
Source: State Street Bank, Preqin, S&PNote: Market data for US Large Buyout Market unless specified otherwise1PE Benchmark performance shown as TWRs, PE Strategy (Buyout, Venture, Private Debt) performance shown as IRRs. PE Benchmark and Strategy performance based on valuations as of 9/30/2020.
Performance1 Multiples
Transaction Volume Fundraising Activity
As of 12/31As of 12/31, USD, % Annualized
As of 12/31 As of 12/31

39
-1.5-0.2 -0.1
-4.3
4.1
0.52.8 2.3
-6.3
10.1
5.7 5.9 5.7
3.1
12.6
-10
-5
0
5
10
15
Real Estate(15% of BMark)
Office Apartment Retail Industrial
2H 2020 1-Year 5-Year
5.0%
5.5%
6.0%
6.5%
7.0%
7.5%
8.0%
8.5%
9.0%
2010 2011 2012 2013 2014 2015 2016 2017 2018 2019 2020
Average Apartments Industrial Office Retail
-20.0
-15.0
-10.0
-5.0
0.0
5.0
10.0
15.0
2001 2005 2008 2011 2014 2017 2020
Average Apartments Industrial Office Retail
-15
-10
-5
0
5
10
2001 2004 2007 2010 2013 2017 2020
Income Appreciation Total Return
Real Estate14% of TRS Policy Benchmark
Source: Bloomberg, NCREIF, Real Capital Analytics, State Street Bank1Property Type Return Indices are Property-level indices and do not reflect leverage or asset management fees, whereas NCREIF ODCE is a fund-level index and is levered and net of fees. Returns are for US-based properties only. Real Estate Benchmark and Strategy performance (Office, Apartment, Retail, Industrial) shown as TWRs based on valuations as of 9/30/2019.
Performance1 Cap Rates
Income Growth Composition of Returns
As of 9/30As of 12/31, USD, % Annualized
As of 9/30 As of 9/30

40
5.1 4.87.7
-5.4
-20.2
6.6
2.1
-2.8
10.7
-24-22-20-18-16-14-12-10
-8-6-4-202468
1012
ENRI(6% of BMark)
Natural Resources Infrastructure
2H 2020 1-Year 5-Year
20
25
30
35
40
5
8
10
13
15
18
20
2012 2013 2014 2015 2016 2017 2018 2019 2020
OP
EC P
rod
uct
ion
(m
mb
bls
/d)
US
/ Sa
ud
i Pro
du
ctio
n
(mm
bb
ls/d
)
US (LHS) Saudi Arabia (LHS) OPEC (RHS)
0
1
2
3
4
5
0
20
40
60
80
100
120
2014 2015 2016 2017 2018 2019 2021
Crude Spot (LHS, $/bbl) Natural Gas Spot (RHS, $/mmbtu)
-
20
40
60
80
100
120
140
160
0
200
400
600
800
1,000
1,200
2011 2012 2013 2014 2015 2016 2017 2018 2019 2020 2021
S&P 500 Energy Total Return Index (LHS, Price) Crude Spot (RHS, $/bbl)
Energy, Natural Resources and Infrastructure6% of TRS Policy Benchmark
Source: State Street Bank, Bloomberg, Cambridge, EIA1ENRI Benchmark performance shown as TWRs, ENRI Strategy (Natural Resources and Infrastructure) shown as IRRs. ENRI benchmark and Strategy performance based on valuations as of 9/30/2019
Performance1 Energy Equity Performance
Energy Prices Oil Market Production
As of 12/31As of 12/31, USD, % Annualized
As of 12/31 As of 9/30

TAB 20

EMERGIN G MAN AGER AN N UAL UP D ATE
Kirk Sims, Emerging Manager Program DirectorFebruary 2021
INVESTMENT MANAGEMENT DIVISION
Teacher Retirement Sy stem of Tex as

2
Executive Summary
Performance
• The Program’s performance was affected by the COVID environment, resulting in the 5-year return versus the Benchmark at -34 bp
• $515 million approved to be allocated across 23 emerging managers in 2020
• $4.5 billion allocated to emerging managers since inception
Manager Graduation
• Since program inception, 7 managers have been promoted to the TRS Premier List and received a Trust-level commitment
• Trust-level commitments to EM Program graduates is $3.0 billion
Commitment to Diversity
• 53% of total capital allocated since inception, and 70% of capital allocated in 2020 was to diverse managers
Source: State Street as of September 30, 2020; TRS IMD
Key Objectives Key Accomplishments
EM Select
• 1 Private Equity and 2 Real Estate managers received EM Select allocations in 2020
• In total, $280 million has been allocated to 4 managers since 2019 as part of the EM Select Program
Building the Fleet
• Olivia Dwan joined the team to support administrative and event planning activities
Program Activity
• 54% of private markets capital allocated to Innovation
• Hosted over 134 manager meetings in 2020
• Program Director participated in 30 engagement activities including publications across well know media outlets and investor conferences
• TRS / ERS hosted the first ever virtual Emerging Manager Conference on January 26, 2021
• Recognition from the publication Institutional Investor for innovation in 2020

3
TRS Emerging Manager Program Team
Kirk Sims, CFAProgram Director
Key Partners
Private Markets Public Markets
Charles PippenDedicated GCM Secondee(Onsite at TRS in Austin)
EM Program Team
Tommy Heitz, CAIASr. Investment Analyst
EM Program Advisors
Jase Auby, CFAChief Investment Officer
Scott RamsowerDirectorPrivate Equity
Matt HalsteadDirectorReal Estate
Michael Ijeh, CAIAAssociatePublic Markets
Carolyn HansardSr. DirectorEnergy, Infrastructure, & Natural Resources
Sylvia Bell, CPAChief Operating Officer
Olivia DwanAdmin - Contractor

4
Emerging Manager Program Highlights
Source: TRS IMD
$4.5 bnUnderlying Commitments
$5.9 bn program size
#
16Years Program History
190Managers Backed
7TRS Graduates to
Premier List
$3.0 bn invested with EM Graduates at the Trust
Level
4EM Select Commitments
323Investments
53%Diverse Manager
Commitments

5
Performance and CommitmentsAs of September 30, 2020
Source: State Street and TRS IMD
Emerging Manager Program
Total Time Weighted Returns
1-Yr 3-Yr 5-Yr
Returns -1.6% 6.5% 7.7%
Benchmark 4.8% 7.4% 8.0%
Alpha (bp) -637 -96 -34
Underlying Allocations: $4,510 MM
Private Equity$2,228
Real Estate$1,365
ENRI$140
Public Markets
$777
Net Asset Value: $2,002 MM
Private Equity$891
Real Estate$602
ENRI$42
Public Markets
$468
Commitments by Diversity Type
Non-minority47.2%
16.5%
13.4%
12.2%
10.8%
Women
Asian American
HispanicAmerican
African American
6
This slide was intentionally left blank.

7
This slide was intentionally left blank.

8
This slide was intentionally left blank.

9
This slide was intentionally left blank.
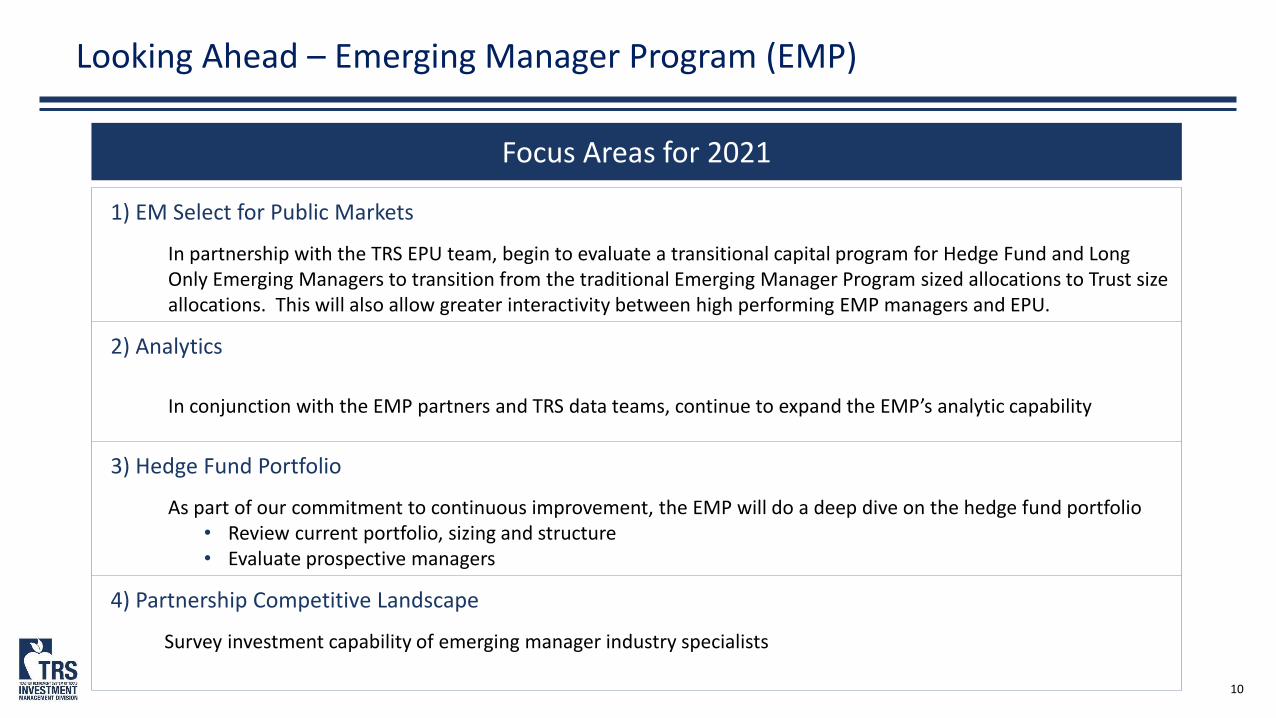
10
Looking Ahead – Emerging Manager Program (EMP)
1) EM Select for Public Markets
In partnership with the TRS EPU team, begin to evaluate a transitional capital program for Hedge Fund and Long Only Emerging Managers to transition from the traditional Emerging Manager Program sized allocations to Trust size allocations. This will also allow greater interactivity between high performing EMP managers and EPU.
2) Analytics
In conjunction with the EMP partners and TRS data teams, continue to expand the EMP’s analytic capability
3) Hedge Fund Portfolio
As part of our commitment to continuous improvement, the EMP will do a deep dive on the hedge fund portfolio • Review current portfolio, sizing and structure• Evaluate prospective managers
4) Partnership Competitive Landscape
Survey investment capability of emerging manager industry specialists
Focus Areas for 2021
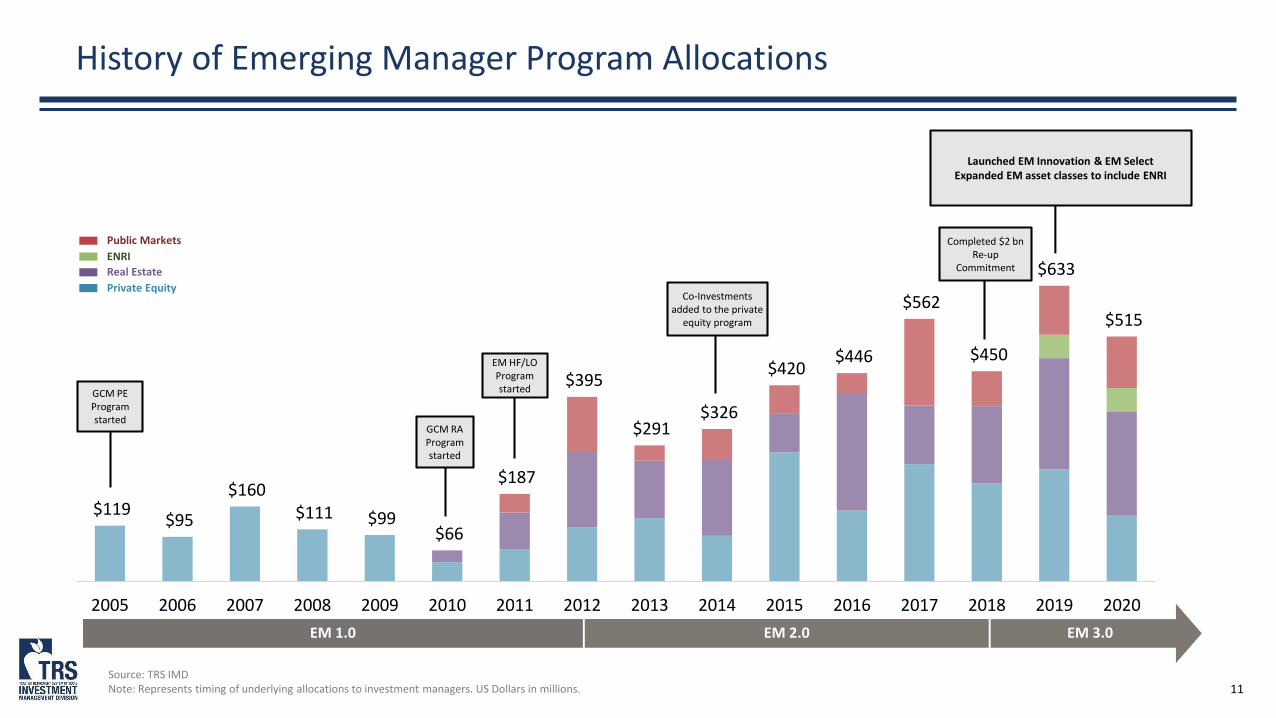
11
$119 $95
$160 $111 $99
$66
$187
$395
$291 $326
$420 $446
$562
$450
$633
$515
2005 2006 2007 2008 2009 2010 2011 2012 2013 2014 2015 2016 2017 2018 2019 2020
EM 1.0 EM 2.0 EM 3.0
Co-Investments added to the private
equity program
GCM PE Program started
EM HF/LO Program started
GCM RA Program started
Completed $2 bnRe-up
Commitment
Public Markets
Real Estate
Private Equity
ENRI
History of Emerging Manager Program Allocations
Source: TRS IMDNote: Represents timing of underlying allocations to investment managers. US Dollars in millions.
Launched EM Innovation & EM SelectExpanded EM asset classes to include ENRI

APPENDIX
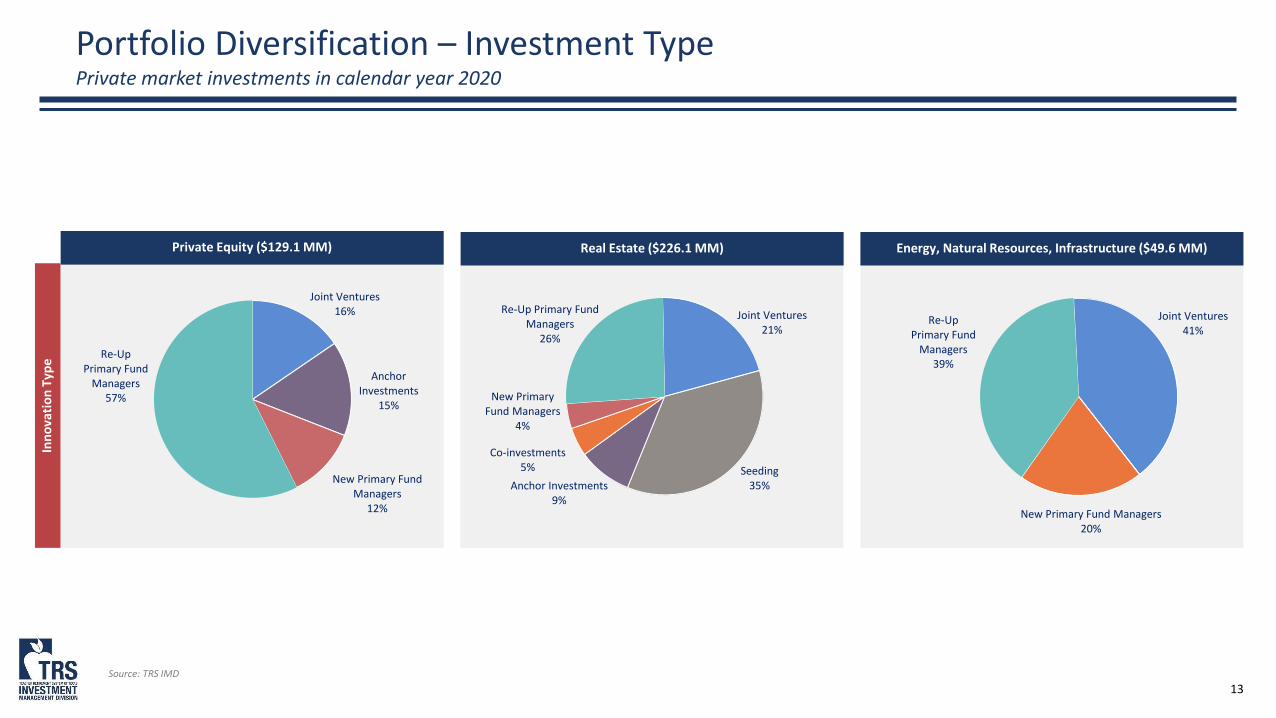
13
Joint Ventures21%
Seeding35%Anchor Investments
9%
Co-investments5%
New Primary Fund Managers
4%
Re-Up Primary Fund Managers
26%
Portfolio Diversification – Investment TypePrivate market investments in calendar year 2020
Source: TRS IMD
Joint Ventures41%
New Primary Fund Managers20%
Re-Up Primary Fund
Managers39%
Joint Ventures16%
Anchor Investments
15%
New Primary Fund Managers
12%
Re-Up Primary Fund
Managers57%
Inn
ova
tio
n T
ype
Real Estate ($226.1 MM)Private Equity ($129.1 MM) Energy, Natural Resources, Infrastructure ($49.6 MM)

14
Credit, 18%
Event Driven, 15%
Long Only, 31%
Equity Long/Short, 28%
Equity Market Neutral, 8%
Opportunistic, 48%
Value-Add, 34%
Core, 2%
Rass, 16%
Non Minority, 54%
Hispanic American, 16%
African American, 4%
Asian American, 8%
Women, 18%
Portfolio DiversificationAs of September 30, 2020
Source: TRS IMD
Real EstatePrivate Equity
Mid/Small Buyout, 60%
Credit/Special Situations, 22%
Growth, 12%
Venture Capital, 6%
Non Minority, 19%
African American, 7%
Hispanic American, 16%
Women, 24%
Asian American, 34%
Public Markets
Non Minority, 53%
Hispanic American, 12%
African American, 19%
Asian American, 8%
Women, 8%
Div
ers
ity
Stra
tegy

15
This slide was intentionally left blank.


TAB 21

AN N UAL UP D ATE O N TRS IN V ESTMEN T O P ERATIO N S
Sylvia Bell, Chief Operating OfficerFebruary 2021
INVESTMENT MANAGEMENT DIVISION
Teacher Retirement Sy stem of Tex as

2
Executive Summary
• Investment Operations objective is to manage a scalable operating model to support the execution of all investment decisions
o Investment Operations: Manage the investment book of record for optimal investment decision-making
o Talent Management: Attract, retain and grow a best-in-class TRS investment team
o Investment Data & Systems: Manage our technology platform for data accessibility and collaboration
Investment Investment Management Management
Division

3
Investment OperationsGlobal Reach, Breadth, and Impact
Manage Core Investment Systems and Relationships• 128 investment applications and services managed• 24 counterparties and clearing brokers• 37 medium and large sized projects planned and executed• Manage State Street relationship
o 11 key measures, 116 reports, and 33 data feeds on custom service level agreement
o 69 member dedicated team with 1 on-site• Fully integrated with RR Shared Services (OE, Fiscal Services, IT)
Settle Trades and Move Cash Globally 24x7• 133,580 transactions ($656.6 billion) with 99.9% settlement success rate
o 56 markets and 38 currencieso 105,176 equity transactions ($61.0 billion)o 8,800 foreign exchange transactions ($67.0 billion)o 8,898 derivatives transactions ($373.1 billion)o 2,080 fixed income transactions (70.0 billion)o 5,628 cash transactions ($70.4 billion)o 2,998 derivative collateral movements ($15.1 billion)
• Internal Transition Management team led $17.9 billion in transfers across 50 different accounts
• Added $44.6 million to the Trust by investing excess cash in SSB short-term investment fund
Reconciliation, Pricing and Asset Servicing• 19,904 assets priced daily or monthly• 1,695 accounts reconciled daily or monthly• Multi-source, multi-level pricing hierarchy• Daily custom cash forecasting and liquidity reporting• 2,997 corporate actions • $51.1 million tax reclaims filed and $27.8 million collected• $6.6 million commissions saved by custom trade netting process (since
inception)• $13.0 million saved by implementing enhanced custody (since inception)
Deliver Investment Results for Investment Decision Making• 311 daily custom reports, 9,000+ data fields, 405 interfaces• Daily holdings, performance, liquidity, counterparty, and leverage for
asset allocation, risk and compliance• Monthly performance results for Management Committee and Board
Manage Talent, Budget, Travel, and Audits• 215+ IMD team members (FTE and contractors) and growing• Over 1,000 learning hours delivered via 22 events • $103.5 million in IMD Budget
o $66.4 million in operating and state street budget managed o $21.6 million in commissions forecast, verified, and paido $15.5 million in legal and research fees paid from the Trusto 218 domestic and 30 international trips managed, significantly less
due to COVIDo 229 vendors managed
• 62 audits completed successfully in last 5 yearsSource: TRS IMDNote: All transaction amounts are as of or for the period end 2020 unless otherwise noted
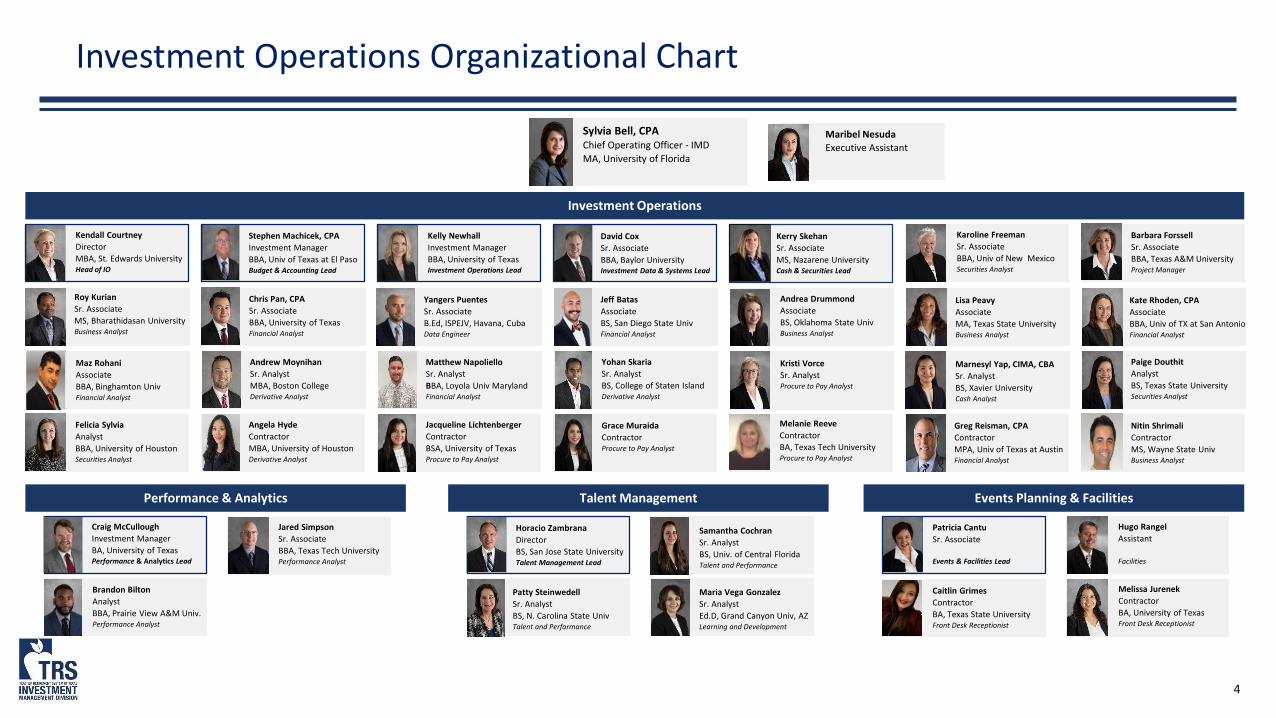
4
Investment Operations Organizational Chart
Sylvia Bell, CPAChief Operating Officer - IMDMA, University of Florida
Maribel NesudaExecutive Assistant
Kendall CourtneyDirectorMBA, St. Edwards UniversityHead of IO
Kelly NewhallInvestment ManagerBBA, University of TexasInvestment Operations Lead
Craig McCulloughInvestment Manager BA, University of TexasPerformance & Analytics Lead
Stephen Machicek, CPAInvestment ManagerBBA, Univ of Texas at El PasoBudget & Accounting Lead
Investment Operations
Karoline FreemanSr. AssociateBBA, Univ of New MexicoSecurities Analyst
David CoxSr. AssociateBBA, Baylor University Investment Data & Systems Lead
Yangers PuentesSr. AssociateB.Ed, ISPEJV, Havana, CubaData Engineer
Barbara ForssellSr. AssociateBBA, Texas A&M UniversityProject Manager
Roy KurianSr. AssociateMS, Bharathidasan UniversityBusiness Analyst
Kerry SkehanSr. AssociateMS, Nazarene UniversityCash & Securities Lead
Chris Pan, CPASr. AssociateBBA, University of TexasFinancial Analyst
Jeff BatasAssociateBS, San Diego State UnivFinancial Analyst
Andrea DrummondAssociateBS, Oklahoma State UnivBusiness Analyst
Lisa PeavyAssociateMA, Texas State UniversityBusiness Analyst
Kate Rhoden, CPAAssociateBBA, Univ of TX at San AntonioFinancial Analyst
Maz RohaniAssociateBBA, Binghamton UnivFinancial Analyst
Performance & Analytics Talent Management Events Planning & Facilities
Jared SimpsonSr. AssociateBBA, Texas Tech UniversityPerformance Analyst
Brandon BiltonAnalystBBA, Prairie View A&M Univ.Performance Analyst
Horacio ZambranaDirectorBS, San Jose State UniversityTalent Management Lead
Maria Vega GonzalezSr. Analyst Ed.D, Grand Canyon Univ, AZLearning and Development
Samantha CochranSr. AnalystBS, Univ. of Central FloridaTalent and Performance
Patty SteinwedellSr. AnalystBS, N. Carolina State UnivTalent and Performance
Patricia CantuSr. Associate
Events & Facilities Lead
Hugo Rangel Assistant
Facilities
Melissa JurenekContractorBA, University of TexasFront Desk Receptionist
Caitlin GrimesContractorBA, Texas State UniversityFront Desk Receptionist
Andrew MoynihanSr. AnalystMBA, Boston CollegeDerivative Analyst
Matthew NapolielloSr. AnalystBBA, Loyola Univ MarylandFinancial Analyst
Yohan SkariaSr. AnalystBS, College of Staten IslandDerivative Analyst
Kristi VorceSr. AnalystProcure to Pay Analyst
Marnesyl Yap, CIMA, CBASr. AnalystBS, Xavier UniversityCash Analyst
Felicia SylviaAnalystBBA, University of HoustonSecurities Analyst
Paige DouthitAnalystBS, Texas State UniversitySecurities Analyst
Angela HydeContractorMBA, University of HoustonDerivative Analyst
Jacqueline LichtenbergerContractorBSA, University of TexasProcure to Pay Analyst
Grace MuraidaContractorProcure to Pay Analyst
Melanie ReeveContractorBA, Texas Tech UniversityProcure to Pay Analyst
Greg Reisman, CPAContractorMPA, Univ of Texas at AustinFinancial Analyst
Nitin ShrimaliContractorMS, Wayne State UnivBusiness Analyst
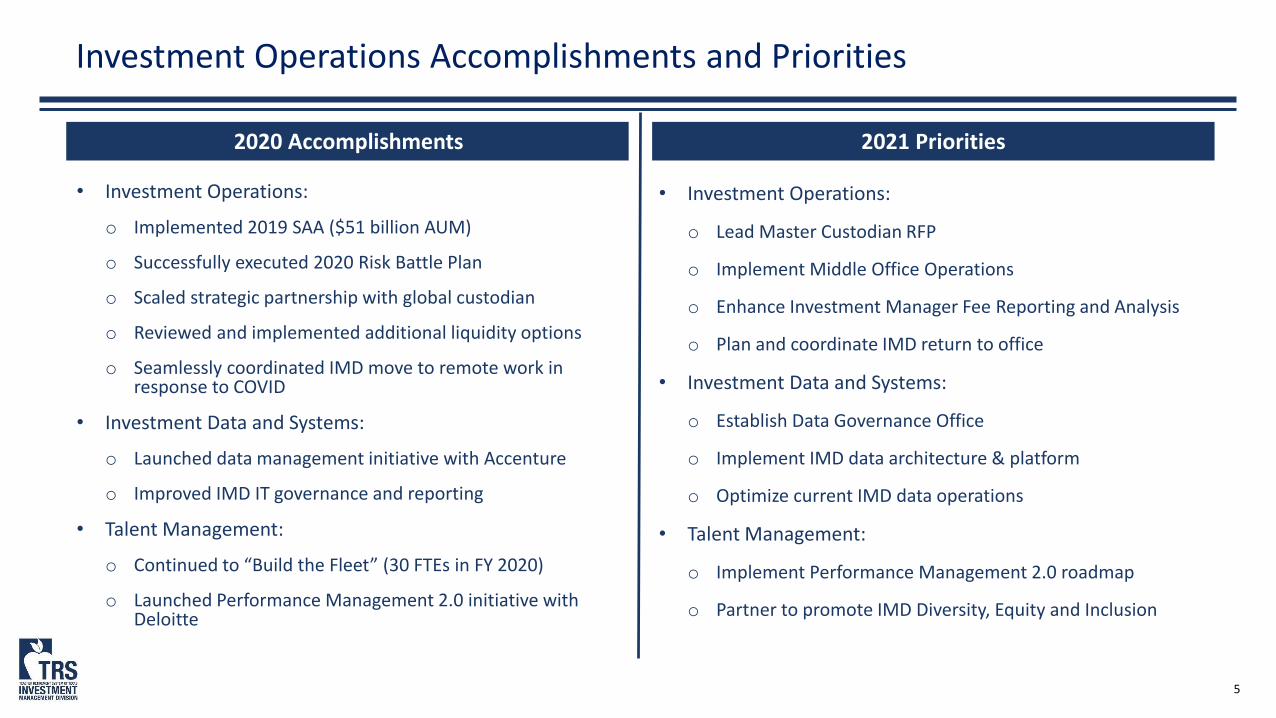
5
Investment Operations Accomplishments and Priorities
• Investment Operations:o Implemented 2019 SAA ($51 billion AUM)
o Successfully executed 2020 Risk Battle Plan
o Scaled strategic partnership with global custodian
o Reviewed and implemented additional liquidity options
o Seamlessly coordinated IMD move to remote work in response to COVID
• Investment Data and Systems:o Launched data management initiative with Accenture
o Improved IMD IT governance and reporting
• Talent Management:o Continued to “Build the Fleet” (30 FTEs in FY 2020)
o Launched Performance Management 2.0 initiative with Deloitte
• Investment Operations:
o Lead Master Custodian RFP
o Implement Middle Office Operations
o Enhance Investment Manager Fee Reporting and Analysis
o Plan and coordinate IMD return to office
• Investment Data and Systems:
o Establish Data Governance Office
o Implement IMD data architecture & platform
o Optimize current IMD data operations
• Talent Management:
o Implement Performance Management 2.0 roadmap
o Partner to promote IMD Diversity, Equity and Inclusion
2020 Accomplishments 2021 Priorities

6
Investment Operations Priority Master Custodian RFP
• Shift focus from service delivery to service partnership that will scale as TRS grows
• Leverage Custodian to enhance the TRS Middle Office operations:
o Improve the Investment Book of Record (IBOR)
o Align custodian resources to allow TRS resources to focus on higher value work
o Increased emphasis on enriched fit-for-purpose investment portfolio data
o Focus on governance to enhance accountability of results
RFP Effort Aligned to IO Strategy RFP Summary Timeline
Event Target Completion Date
Develop RFP and Statement of Work February 2021
Issue RFP April 2021
Respondent Proposals Due May 2021
Staff Recommendation Due August 2021
Board Selection and Award September 2021
Contract Negotiations Complete January 2022

7
Investment Operations Priority Enhance Investment Manager Fee Reporting & Analysis
• Operating expenses represent 7% of total costs
• Expenses netted to performance represent 93% of total costs of which 87% represents manager and performance fees
• Background:o Management and performance fees totaled $1.3 billion in
2020, 87% of total costs
o Build The Fleet initiative aims to reduce investment fees and increase efficiencies by hiring more internal investment resources and making more direct investments
• Benefits:o Increased transparency, analytics, and controls to ensure
manager fees are accurate and reasonable
o Quarterly reporting
• Activitieso Engaged external consultant to collect and independently
calculate Private Equity, Real Estate, Special Opportunities, and ENRI management fees and carry
o Develop total trust quarterly fee reporting and analysis
Note: Operating Expenses includes Commission Credits of $20,844,305 and $21,366,146 for fiscal year 2019 & 2020, respectively which are expenses also netted from performance
IMD Actuals Investment Manager Fee Reporting & AnalysisExpenses FY 2019 FY 2020 ChangeSalaries & Benefits Expense 39,970,269$ 43,947,770$ 3,977,502$ Subscriptions and Reference Data 14,043,919 14,895,841 851,922 Rent Expense 4,993,640 4,380,919 (612,721) Professional Fees and Services 3,380,495 3,925,503 545,008 Contract Labor 2,634,068 2,711,531 77,463 Other Operating Expenses 1,806,919 851,590 (955,329) Travel 970,016 711,784 (258,232) Software 355,956 36,608 (319,348) Indirect Expenses 15,695,636 29,187,741 13,492,105 Total Operating Expenses 83,850,918$ 100,649,287$ 16,798,369$ Management & Performance Fees 1,302,875,647 1,273,343,601 (29,532,046) Broker Commissions 47,067,970 35,753,286 (11,314,684) External Custodial Fees 27,154,060 32,319,422 5,165,362 Bank Fees 16,453,271 8,222,073 (8,231,198) Research Fees 9,643,681 8,853,740 (789,941) External Legal Fees 5,178,624 6,030,055 851,431 Expenses Netted to Performance 1,408,373,253$ 1,364,522,177$ (43,851,076)$ Grand Total $ 1,492,224,171 $ 1,465,171,464 $ (27,052,707)
APPENDIX

9
Investment Operations The Investment Process
Pre-Trade Trade Processing Daily Monitoring
From Investment Decision to Investment Book
From Investment Book to Investment Decision
State Street BankAccounting, Performance, Compliance &
Investment Book of Record
InvestmentDecision
Investment Systems Data Warehouse
Asset Management
Investment Analytics & Reporting
Pre-Trade Trade Processing
AssetManagement
DailyMonitoring
DataWarehouse
InvestmentSystems
Investment Analytics and Reporting

10
Investment Operations State Street Bank Operations

11
Investment Operations PriorityMiddle Office and Data Management
• Background:o Industry is shifting from asset type expertise to portfolio
management expertise
• Benefits:o Middle Office team and processes effectively bridges Back
and Front Office for business valueo Allows Front Office to refocus on investment decisions, not
preparing data
• Activities:o Procure custody services provider matched to IMD Middle
Office needso Refine workforce resource planning & formalize roles and
responsibilitieso Develop roadmap to success for better portfolio
management alignmento Establish robust governance process and measures of
success
• Background: o Data is an investment asset and must be managed
accordingly
• Benefits:o Data platform effectively supports investment decision
makingo Data is trusted and operations are scalable
• Activities:o Data Architecture and Platformo Design centralized capture, storage, and distribution of data
across IMDo Data Governance & Organizationo Implement top-down alignment for enterprise data
governance
Enhance Middle Office Modernize Data Management

TAB 22

IN V ESTMEN T LEGAL & CO MP LIAN CE UP D ATE
Heather Traeger, General Counsel & Chief Compliance OfficerFebruary 2021
INVESTMENT MANAGEMENT DIVISION
Teacher Retirement Sy stem of Tex as

2
Securities Litigation
Equities & Derivatives
Funds and Allocated Structures
Foreign Offices
Investment Management Agreements
Ethics
Investment Policies
Direct Investments
Legislation
Regulations, Statues & Policies
Executive
Public Markets
Risk and Portfolio
Management
Private EquityReal Estate
Energy Natural Resources &
Infrastructure
Trade Management
Investment Operations
Investment Legal & Compliance: Essential to IMD Mission
L&C guiding principles: better deal terms, risk mitigation,
compliance, ethical integrity, and profit center
• Expert Legal Advice
• Relentless Client Focus
• Trusted Business Partner
IMD Legal & Compliance

3
Investment Legal & Compliance: Partner in IMD Transactions
0
50
100
150
200
250
FY2016 FY2017 FY2018 FY2019 FY2020
Investment Matters by Group
ENRI PE RE External Public Markets Executive Other
Sourcing & Building Partnerships
• Work directly with external manager's L&C teams
Investment Due Diligence & Decision Making
• Work with IMD early in investment and operational due diligence process to address potential issues
• Analyze structuring, regulatory and policy issues
Legal & Closing Process
• Work side-by-side with IMD in negotiating terms and documenting the business deals
• Manage legal negotiation, external counsel, document drafting
Monitoring and Governance
• Address post-investment issues
• File and track regulatory forms
Source: TRS IMD Note: Funds = Co-Investments, Commingled Funds, Single LP Funds, Direct Investments, IMA’s, Hedge Funds

4
This slide was intentionally left blank.

5
Investment Legal & Compliance: Organization
`
Alice McAfee
Team Lead, Government
Procurement Solutions (GPS)
JD, MA, BA, UT Austin
Stephanie Perkins
Assistant General Counsel
JD, UT Austin
BA, Vanderbilt
Heather Traeger
General Counsel & Chief
Compliance Officer
JD, University of Houston
BA, Williams College
Denise Lopez, CPA
Team Lead, Investments
JD, Cornell
BBA, UT Austin
Jessica Palvino
Chief of Staff/COO
JD, Baylor
BS, Texas A&M
Dennis Gold
Sr. Investment Counsel
JD, BA, UT Austin
Lane Arnold
Investment Counsel
JD, SMU
BA, Harvard College
Deanna Buck, CPA
Investment Counsel
LLM, NYU
JD, BA, Georgetown
Bianca Sandoval Green
Investment Counsel
JD, BA, UT, Austin
Steve Poliner
Investment Counsel
JD, NYU
BS, BA, Duke University
Bo Simmons
Investment Counsel
JD, Columbia
BA, University of Missouri
Jennifer Steiger
Investment Counsel
JD, MBA,UT Austin
BA, Stanford University
BOARD, PIA, PROCUREMENT
EMPLOYMENT / IP
LEGAL OPERATIONS / TAX
Anna Espinosa
Legal Assistant
BA, Paralegal Certification,
UT Austin
Adam Costa
Sr. Compliance Specialist
BA, University of Pittsburgh
Michele Fullon
Compliance Specialist
MBA, CUNY Baruch College
BS, Northeastern University
INVESTMENT LEGALINVESTMENT COMPLIANCE
Elena Ivanova
Compliance Specialist
BA, MEBIK
COMPLIANCE
J.R. Morgan
Investment Counsel
JD, UCLA
BA, BS, Evergreen State
Chris Bowlin
Compliance Counsel
JD, Texas Wesleyan
MS, BS, Texas A&M
22Advanced
degrees and certificates
20Years average
of legal experience
20Years average of compliance
experience
Shared Services

6
Investment Legal & Compliance: Summary of Accomplishments
• Hosted 5th annual Legal Investment Summit
• Hosted first legal bootcamp
• Created external counsel manual
• Provided IMD limited partnership agreement training
• Integrated with IMD Business Continuity Team
• Supported recession reaction
• Monitored and responded to temporary regulatory relief and requirements
• Developed and implemented remote operating plan to ensure no workflow interruptions for the business teams
• Automated annual Employee Ethics Policy certification
• Collaborated with Investment Operations on refining the operational due diligence process
• Implemented daily compliance testing on Internal Portfolio Management Agreements (IPMA)
• Consulted on IPS revisions and IIC procedures guide
• Worked with outside counsel and peers to respond to the shareholder disclosure amendment with the Japan Foreign Exchange and Foreign Trade (FEFTA)
• Addressed MNPI/Personal trading issues with market volatility
• Analyzed impact of new non-U.S. regulations
Addressed COVID-19 Issues Training
Implemented Best Practices Adhered to new Regulatory Requirements

7
Investment Legal & Compliance: 2021 Priorities
• Legal Summit 2021
• Real estate initiatives for 87th Legislative Session
• DE&I initiatives
• Internal counsel practice manual
• Tricot 2.0 and long-term facilities issues
• Procurement & Contracting-IMD process
• Data architecture projects
• Charles River transition for Compliance
• Centralize operational due diligence process for public and private markets
• Additional training programs
• Mechanism to compare key business terms
Training Legal 3.0
Office Initiatives Best Practices

APPENDIX

9
Investment Legal & Compliance: Integral and Accretive to IMD
• Walk side-by-side with IMD through full transaction life cycle
• Understand “must-have” versus “nice-to-have” and have judgement and experience to differentiate
• Deliver creative solutions for IMD innovations
• Provide confidence to IMD to conduct business in new markets, jurisdictions and financial arenas
• Enhance IMD and TRS brand
• Advise on business issues, structures, legal requirements, and “Texas Way” on terms
• Avoid litigation, regulatory deficiencies, criminal and civil penalties, headline risk, and policy violations for failure to satisfy legal and policy obligations
• Identify and address emerging risks
• Prevent unnecessary disruption of transactions
• Employ technology and systematic procedures to enhance risk mitigation program
• Organize information-sharing sessions with peers
• Significant involvement in industry and regulatory groups on issues of shareholder and investor rights
• Craft cultural realignment to reflect sophistication and scope of IMD operations
• Build compliance and risk awareness into daily business processes
• Provide centralized resource to IMD for questions and concerns
• Inform management and trustees of compliance efforts
• Develop expertise to take advisory, consulting, and training function in-house and reduce reliance and associated costs on consultants or external counsel
• Design and implement technology and operational solutions that allow scaling of functions and staff
• Strategic management of costs: selective distribution of internal vs external workload and deliberative selection of external counsel and consultants
• Internal staffing: maintain legal fees for 4 consecutive years despite year-on-year increase in number and complexity of transactions)
• Securities class actions: drive lower fees, seek participation opportunities, and support innovations to market to increase recoveries
Better Deal Terms Risk Mitigation
Culture of Compliance and Ethical Integrity Profit Center


TAB 23

UP D ATE O N ESG IN V ESTIN G
Lauren Gellhaus, Head of ESG
Meredith Jones, Partner Responsible Investment & ESG AdvisoryFebruary 2021
INVESTMENT MANAGEMENT DIVISION
Teacher Retirement Sy stem of Tex as

2
Discussion Agenda
• Current Status of ESG Investing – Aon
o ESG and Why it Matters
o 2020 ESG Influencing Factors
• ESG Update – IMD
o Overview of Peer Practices and ESG Policies
o IMD Polices and Practices
o ESG in Action: Proxy Voting

ESG and Why it Matters
Material Environmental, Social, and Governance (ESG) factors are becoming mission-critical to companies and their stakeholders, and as such are gaining in importance with asset owners
Four organizations publishing the most commonly cited ESG reporting frameworks are: the CDP (formerly the Carbon Disclosure Project), the Global Reporting Initiative (GRI), the Sustainability Accounting Standards Board (SASB), and the Task Force on Climate-related Financial Disclosures (TCFD).
Sources: : “Rate the Raters 2020” SustainAbility, March 2020 http://dx.doi.org/10.1080/20430795.2015.1118917 , https://www.bloomberg.com/news/articles/2019-04-01/global-sustainable-investments-rise-34-percent-to-30-7-trillion https://hbr.org/2016/10/the-comprehensive-business-case-for-sustainability
Aon | Retirement & Investment Proprietary & Confidential
Dramatic increase in ESG-focused investment products
Environmental & Social issues can demonstrably harm shareholder value
Corporate performance: 90% of studies show ESG-CFP correlation
Lack of reporting standards create uncertainty for ESG stakeholders
Environmental, social and governance (“ESG”) refers to non-financial risks associated with a company or industry that have the potential to have a material financial impact on a company in the future.

Aon | Retirement & Investment Proprietary & Confidential
ESG Stakeholders
Company Customers Investors Society Regulators
Corporate financial performance
Cohesive Human Capital strategy
Employee engagement & retention / Productivity
Product Innovation
Branding opportunities / Public Relations
Best in class products & solutions Designed for an evolving future
Innovation
A trusted and enduring partner
Resiliency in the face of a changing global landscape
Holistic Risk Management
Best practice protection against environmental, social & governance pitfalls
Value Protection
Pride of Ownership
Innovation for Value Creation
Companies positioned to positively impact people and planet
Resilient companies create resilient employees, local and global economies
Innovation to solve future problems
While TRS is subject to state and US regulation, global regulation will prompt changes in the way ESG is evaluated . A growing list of regulations across geographies increase expectations for corporate, asset manager and investor behavior with regards to environmental, social and governance issues
Employees
Safe workplaces
Job security
Fair wages
Opportunities for upskilling & promotion
Diversity, equity and inclusion
Increased resiliency
Benefits to people and planet

Aon | Retirement & Investment Proprietary & Confidential
2020: An ESG Accelerator
Covid-19o Workforce safety becomes an industry-wide
issueo Who is “essential”?o “K” shaped recoveryo Proportionality of furloughs, pay cuts, etc.o Supply chains, cash flow, benefits, liability, etc.
Social Justiceo Diversity and inclusiono Systemic racismo Economic opportunityo Economic mobilityo “K” shaped recovery
Regulationo US - Regulation S-Ko EU - Sustainable Finance Disclosure
Regulation, Climate BenchmarksRegulation, Taxonomy Regulation
o UK – Stewardship Code
Climate Changeo Environmental risks pose the greatest
threats to the global economy, perCambridge Global Risk Index
o Prioritizing a “green” Covid-19 recovery
US Administration Changeo Biden Administration likely to enact new
climate change regulations & disclosureso Investors may be less constrained using
ESG in investment decisions / 2020 DOLguidance vacated or amended
Result: Record Asset Flows for Sustainable Funds

Aon | Retirement & Investment Proprietary & Confidential
2020 Department of Labor ESG Guidance
– As a minimum requirement for meeting the standard of loyalty and fiduciary care, fiduciaries must evaluate investments and investment courses of actionbased “solely on pecuniary factors and based on appropriate investment horizons.”
– Fiduciaries cannot sacrifice returns or increase risk to promote non-financial goals, which might include environmental or social causes.
– Fiduciaries must consider reasonably available alternatives as part of their duty of fiduciary care.
– If a fiduciary uses non-financial factors to choose among investments that are otherwise indistinguishable financially, the rule requires documentationproving that such decisions were made with appropriately careful “analysis and evaluation.”
– The rule does not categorically prohibit investments that support non-financial goals. However, fiduciaries still must satisfy the prudence and loyaltyprovisions in ERISA and in the final rule, which means pecuniary interests must still be served.
– While the rule is considered “final” and has been submitted to the Office of Management and Budget, there are still challenges to implementation. A newadministration could vacate the rule altogether, and, barring that, legal challenges are expected.
Source: https://www.dol.gov/agencies/ebsa/about-ebsa/our-activities/resource-center/fact-sheets/final-rule-on-financial-factors-in-selecting-plan-investments

7
ESG Peer Practices
• There is no “standard” approach to ESG. Significant variation exists across and within regions, asset classes, and organization types.
• Overall, most institutions are at the early stage of integrating ESG into their processes, particularly in the US
• Based on a global study, the top three drivers for the broad adoption of ESG investing include: 1) Right Thing to Do, 2) Risk-Adjusted Performance, and 3) Mitigate Investment Risk
• As institutional investors pursue ESG investing, ESG integration is the most popular approach with 75% of global respondents currently, or considering, integrating ESG into their investment decisions
Sources: BlackRock Global Client Sustainable Investing Survey. July – September 2020, BlackRock 2020 Global Sustainable Investing Survey, Barclays ESG Investor Pulse December 2020
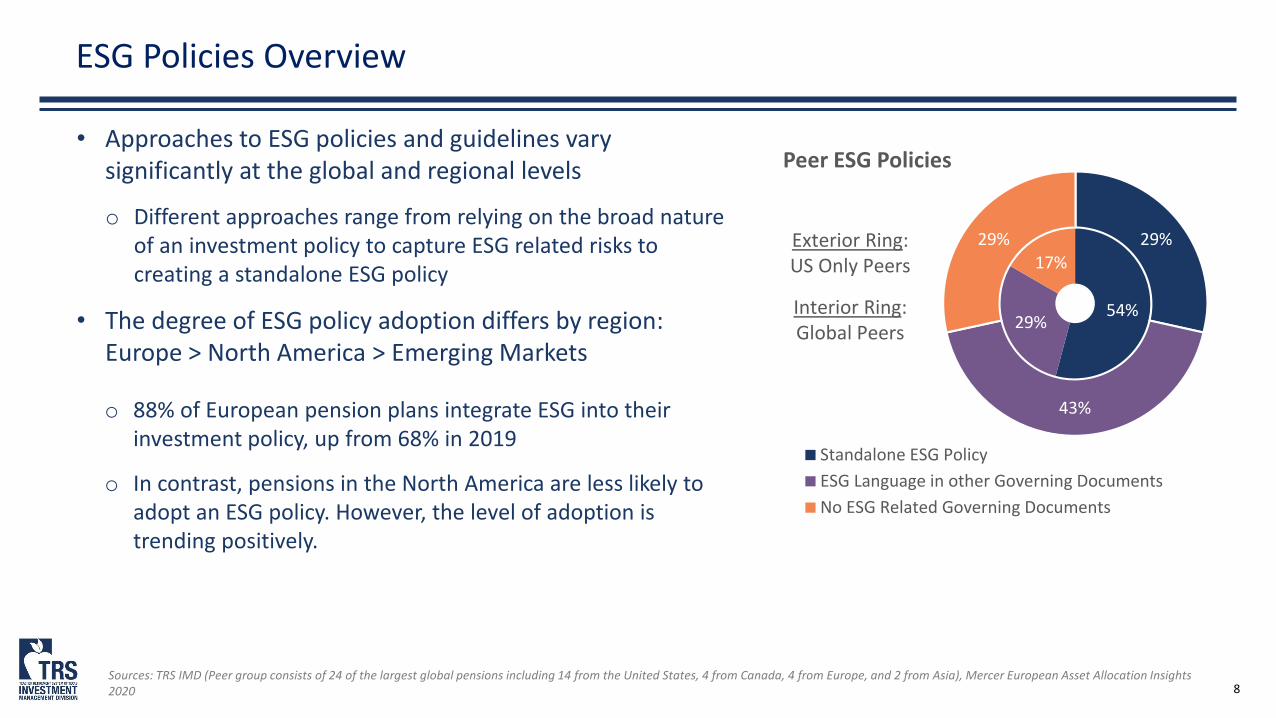
8
ESG Policies Overview
• Approaches to ESG policies and guidelines vary significantly at the global and regional levels
o Different approaches range from relying on the broad nature of an investment policy to capture ESG related risks to creating a standalone ESG policy
• The degree of ESG policy adoption differs by region: Europe > North America > Emerging Markets
Sources: TRS IMD (Peer group consists of 24 of the largest global pensions including 14 from the United States, 4 from Canada, 4 from Europe, and 2 from Asia), Mercer European Asset Allocation Insights 2020
54%29%
17%29%
43%
29%
Peer ESG Policies
Standalone ESG PolicyESG Language in other Governing DocumentsNo ESG Related Governing Documents
Exterior Ring: US Only Peers
Interior Ring:Global Peers
o 88% of European pension plans integrate ESG into their investment policy, up from 68% in 2019
o In contrast, pensions in the North America are less likely to adopt an ESG policy. However, the level of adoption is trending positively.

9
Current IMD Polices and Practices
• Voting Proxieso Institutional Shareholder Services (ISS) serves as
TRS’s proxy advisor, providing benchmark guidelines, inclusive of ESG related topics, for all proxy votes conducted by IMD
• Legal and Policy Exclusionso State Law: No investments in Iran, Sudan,
terrorism, and companies boycotting Israelo Board Policy: No investments in adult
entertainment
• Dedicated ESG Resourceso IMD has a designated investment professional
focusing on ESG research, trust-wide education, and the implementation of best practices
• Emerging Managers Programo Diverse managers represent a majority of IMD’s
Emerging Manager Program commitments
• Transparency & LP Alignmento Private Equity helped author ILPA’s Principles
• Due Diligence & Monitoringo IMD Public and Private Equity teams include ESG
questions in their formal due diligence
• Invested Capital o 67 external managers are UN PRI Signatories,
equating to >$59B in invested capital
Source: TRS IMD, UN PRI

10
IMD ESG Update
• 2020 Accomplishments
o Added ESG questions to External Public Markets annual certification questionnaire
Working to add similar questions to External Private Markets questionnaires
o Established an educational series on ESG-related topics e.g. SASB presented on materiality
o Initiated subscription to MSCI ESG ratings and ESG indices after a successful trial of the products
o Worked with partners to better understand the latest ESG research, best practices, and key themes
Completed an ESG project with BlackRock as part of the annual SPN project series
• 2021 Goals
o As part of IPS process, IMD will likely recommend adding a statement on ESG
o Continue educational efforts by bringing in industry leaders and experts to present on ESG-related topics
o Work with each IMD group to ensure that material ESG risks and considerations are considered when assessing new and existing investments
o Establish a committee from across IMD to drive trust-wide ESG initiatives
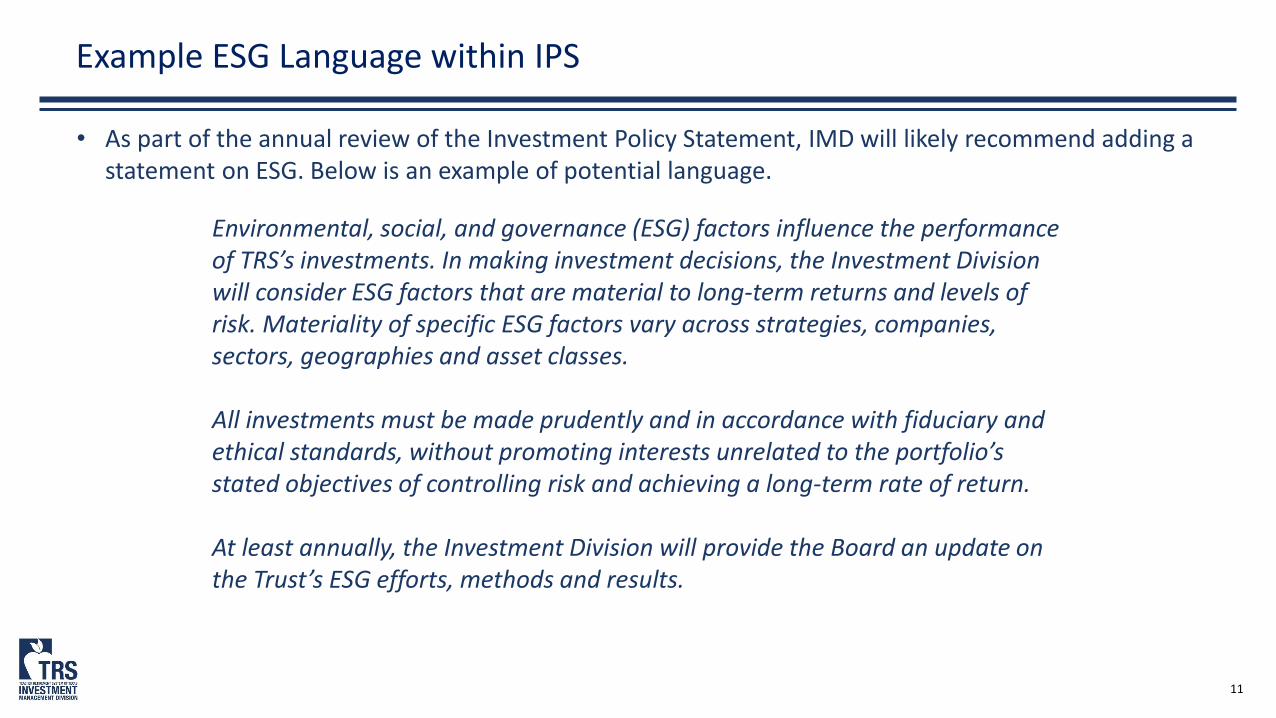
11
Example ESG Language within IPS
• As part of the annual review of the Investment Policy Statement, IMD will likely recommend adding a statement on ESG. Below is an example of potential language.
Environmental, social, and governance (ESG) factors influence the performance of TRS’s investments. In making investment decisions, the Investment Division will consider ESG factors that are material to long-term returns and levels of risk. Materiality of specific ESG factors vary across strategies, companies, sectors, geographies and asset classes.
All investments must be made prudently and in accordance with fiduciary and ethical standards, without promoting interests unrelated to the portfolio’s stated objectives of controlling risk and achieving a long-term rate of return.
At least annually, the Investment Division will provide the Board an update on the Trust’s ESG efforts, methods and results.

12
Proxy Voting
• Proxy votes are a Trust asset
• IMD’s objective is to vote proxies prudently and in the best economic interests of the Trust so to maximize portfolio returns over time
• TRS’s Proxy Advisor, currently Institutional Shareholder Services (ISS), is selected by the TRS Board
o ISS has served as TRS's Proxy Advisor since 2002
o ISS has 3,100 clients globally, of which 185 are pension funds (46% US/54% outside the US)
o ISS services 119 global markets and ensures coverage of 100% of all domestic and international securities traded on major exchanges and indices
o 52,000 meetings and 12.2mn ballots voted in 2020
• ISS votes proxies on TRS’s behalf based on ISS’s Benchmark Policy recommendations
o 21,535 ballots processed on behalf of TRS in 2020
Source: ISS

13
ISS Benchmark Policy Overview
• ISS's Benchmark Policy focuses on the following key topics:
Details on the benchmark policy can be found on the ISS website: https://www.issgovernance.com/policy-gateway/voting-policies/
Governance
Social
o Board Independence and Compositiono Director on Multiple Boardso Adequate Risk Oversight by Directoro Auditor Standardso Auditor Rotationo Executive Compensationo Incentive Planso Capital and Restructuringo Mergers and Acquisitions
o Board Diversity (e.g. gender and racial/ethnic)o Adequate Risk Oversight by Directoro Disclosure (e.g. consumer and product safety, human
rights, animal welfare, political activities)
Environmental
o Adequate Risk Oversight by Directoro Disclosure (e.g. climate change, sustainability)

14
Governance Example: Board Director Independence
• ISS benchmark guidelines promote a minimum of 1/3 of independent board directors with higher minimums in more developed regions such as the US, Canada, and Europe
o ISS Action: ISS will generally recommend voting against non-independent directors if minimums are not met
Source: ISS1 Percent reflects the minimum percent of independent Board directors. A number means the required number of independent directors. 2 Variation exists across and within countries. The numbers shown are approximates. 3 These tallies are approximate as each against vote rationale often contains multiple considerations
Boards should be sufficiently independent from management to ensure that they are able and motivated to effectively supervise management's performance

15
Governance Example: Executive Compensation
• ISS Benchmark Guidelines: ISS votes case-by-case on executive compensation proposals, considering multiple quantitative and qualitative factors. Core principles underlying all evaluations:o Maintain appropriate pay-for-performance alignment, with emphasis on long-term shareholder valueo Avoid arrangements that risk “pay for failure”o Maintain an independent and effective compensation committeeo Provide shareholders with clear, comprehensive compensation disclosures
Source: ISS
Executive pay practices must be designed to attract, retain, and appropriately motivate the key employees who drive shareholder value creation over the long-term

16
Social Example: Board Diversity
• ISS benchmark guidelines promote gender and ethnic/racial board diversity in select regions
o ISS Action: ISS will generally recommend voting against the chair of the nominating committee (or other directors on a case-by-case basis) if the amount of board diversity doesn't meet the minimum guideline
Source: ISS1 2020 US gender diversity minimum includes a list of mitigating factors that were removed within the 2021 guidelines2 These tallies are approximate as each against vote rationale often contains multiple considerations
Boards should be sufficiently diverse to ensure consideration of a wide range of perspectives

17
Environmental Example: Environmental Disclosures
• ISS Benchmark Guidelines: ISS does not have strict guidance in terms of environmental proposals, but ISS’s guidance promotes disclosure and reasonable oversight
o ISS Action: ISS is amending policy guidelines globally to include environmental risks as part of boards’ explicit oversight responsibilities with a focus on climate change
Source: ISS
Many shareholders are increasingly focused on a range of environmental factors that can impact their investments and are engaging with companies regarding such risks; however, these issues have yet
to receive broad investor support.

18
Summary Information
• ESG continues to be a growing trend. In 2020, several catalysts helped propel ESG forward, including the COVID crisis, the emphasis on social justice, and the change of presidential administration.
• Whereas ESG was once synonymous with simple screens that narrowed the investable universe (e.g. excluding tobacco), ESG integration is now the most common approach for sustainable investors
• ESG research continues to be a priority for IMD and IMD is also actively engaged in numerous efforts including internal education opportunities and ESG integration within investment processes
• IMD will continue to take prudent steps forward while being ever mindful of its fiduciary duty and objectives to control risk and produce a long-term rate of return

APPENDIX

20
Appendix
• ISS Policy Development Process
• ESG Policy Examples
o Employees Retirement System of Texas
o New York State Common Retirement Fund
o Minnesota State Board of Investments
o California State Teachers' Retirement System
• ESG Questions Added to External Public Markets Questionnaire
• Summary of Findings from 2020 EPU Certification Questionnaire

21
ISS Policy Development Process
Feb 1stNovemberOctoberJuly/AugustProxy Season through June
Internal Reviewduring and after
proxy season
New Policy takes effect
• Every year, ISS conducts a global policy review process and updates the ISS Benchmark Proxy Voting Guidelines for the upcoming year
• IMD's Proxy Committee reviews updates to the ISS Benchmark Policy, confirms that they are appropriate for IMD, and prepares a summary to the TRS Board highlighting key changes
Policy Survey and Roundtables
Open Comment Period
Final Policy Updates
announcement
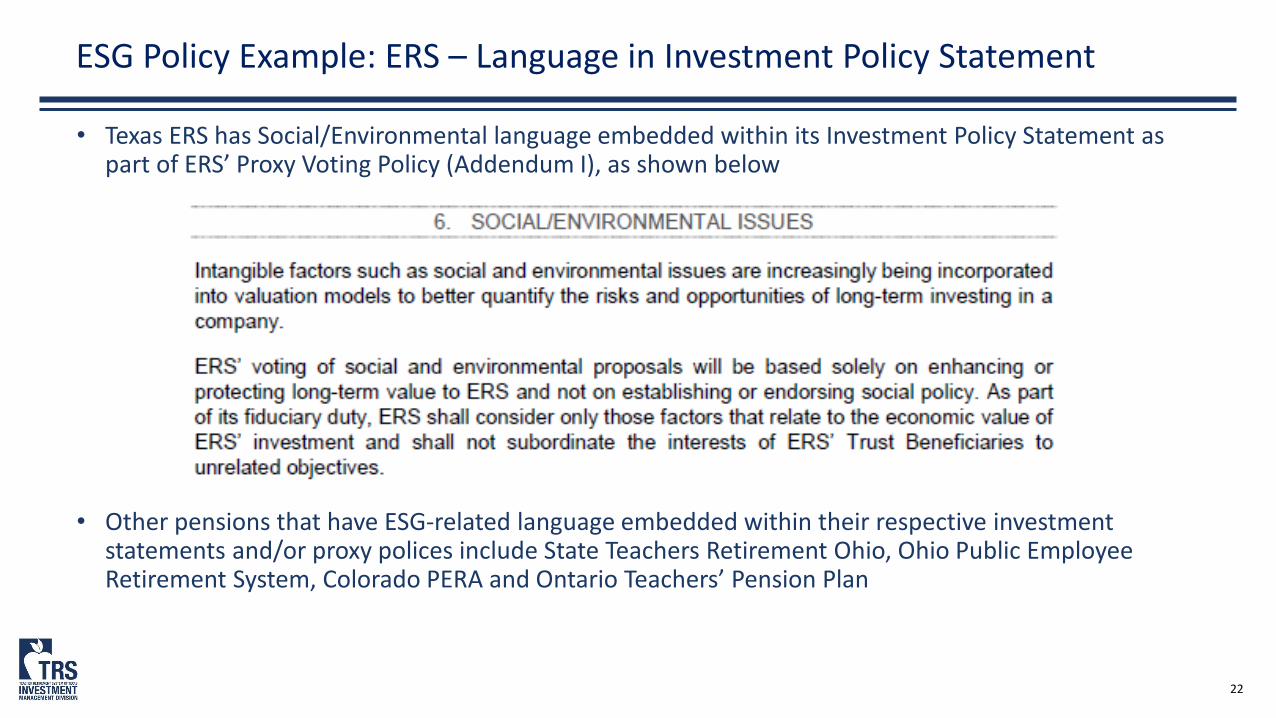
22
ESG Policy Example: ERS – Language in Investment Policy Statement
• Texas ERS has Social/Environmental language embedded within its Investment Policy Statement as part of ERS’ Proxy Voting Policy (Addendum I), as shown below
• Other pensions that have ESG-related language embedded within their respective investment statements and/or proxy polices include State Teachers Retirement Ohio, Ohio Public Employee Retirement System, Colorado PERA and Ontario Teachers’ Pension Plan

23
ESG Policy Example: New York Common – ESG Proxy Guidelines
• New York State Common Retirement Fund makes all proxy voting decisions independently, using its Environmental, Social & Governance Principles and Proxy Voting Guidelines to determine how the fund votes its proxies.
• According to the Guidelines, “The Fund’s Investment Philosophy requires the consideration of environmental, social, and governance (ESG) factors in the Fund’s investment process because they can influence both risk and return. The Fund, as a long-term owner that invests in all sectors of the economy (i.e., a “universal owner”), works to promote sound ESG practices at its portfolio companies through active ownership and public policy advocacy. The Corporate Governance Program is designed to enhance long-term value through a commitment to ESG and a strategic focus on sustainability, diversity, and accountability.”
• Issues covered in the Guidelines include, but are not limited to, a) board of director’s independence, accountability & responsibility, b) executive and director compensation, c) climate change, d) diversity, equity & inclusion, and e) human capital management, labor & human rights.

24
ESG Policy Example: Minnesota – ESG Initiatives Resolution
• Minnesota State Board of Investments (MSBI) adopted a resolution that outlines the pension’s ESG initiatives. The resolution is brief, less than two pages, and therefore does not go into as much depth as a full policy.
• The resolution emphasizes that fiduciary responsibility is the touchstone of any decision of the MSBI.
• The resolution addresses:
o Continuing to actively vote proxies in accordance to MSBI proxy guidelines, policies, and precedents
o Participating in ESG coalitions and engaging with corporations on ESG related issues i.e. Council of Institutional Investors, UN Principles for Responsible Investing, and Institutional Limited Partners Association
o Preparing ESG informational materials and Stewardship Report updates
o Developing and implementing plans to address ESG investment risks, evaluating options for reducing investments to long-term carbon risk exposure, and promoting efforts for greater diversity and inclusion on corporate boards and within the investment industry

25
ESG Policy Example: CalSTRS – Standalone ESG Policy
• CalSTRS has a distinct Investment Policy for Mitigating Environmental, Social, and Governance Risks (ESG Policy) that is an attachment to its Investment Policy and Management Plan.
• According to the ESG Policy, to help manage the risk of investing a global portfolio in a complex governance environment, CalSTRS has developed a series of procedures to follow when faced with any major environmental, social or governance issue as identified by the ESG risk factors. When faced with a decision or other activity that potentially violates CalSTRS ESG Policy; the Investment Staff, CIO and Investment Committee will undertake the following actions:
o The CIO will assess the potential ESG policy violation both as an ESG risk and as an impact to the System. The extent of the responsibility of the System to devote resources to address these issues will be determined by: 1) the size of the investment, and 2) the gravity of the violation of CalSTRS ESG Policies.
o At the CIO’s direction, the Investment Staff will directly engage corporate management or other appropriate parties to seek information and understanding concerning the ESG policy violation and its ramifications on the System.
o The CIO and investment staff will provide a report to the Investment Committee of the findings associated with an ESG policy violation engagement and recommend any further action of engagement or need to commit further System resources. The Investment Committee can marshal further resources given the gravity of the situation.
• CalSTRS expects all investment managers, both internal and external, to assess the risk of each of the following factors whenmaking an active investment:
o Monetary Transparency, Data Dissemination, Accounting, Payment System: Central Bank, Securities Regulation, Auditing, Fiscal Transparency, Corporate Governance, Banking Supervision, Payment System: Principles, Insolvency Framework, Money Laundering, Insurance Supervision, Respect for Human Rights, Respect for Civil Liberties, Respect for Cultural and Ethnic Identities, Respect for Property Rights, Respect for Political Rights, Discrimination Based on Race, Sex, Disability, Language, or Social Status, Worker Rights, Environmental, Climate Change, Resource Efficiency, War/Conflicts/Acts of Terrorism, and Human Health

26
ESG Questions Added to External Public Markets Questionnaire
• External Public Markets requires the completion of an Annual Certification Questionnaire by invested managers and by prospective managers that are being taken to the Internal Investment Committee
• In 2020 four ESG-related questions were added to the questionnaire:
o Does your firm have an established ESG policy? Why or why not? If yes, are you willing to provide a copy of the policy?
o Is ESG incorporated into your investment decision-making process? If yes, how does your firm identify, assess, and integrate ESG into security selection and portfolio construction?
o What firm resources are dedicated to ESG research and / or ESG integration?
o Does your firm have any ESG and / or diversity and inclusion initiatives at the firm-level? If so, can you please broadly describe the current initiatives?
• The questions were based on industry standards and existing peer practices, while also considering what is most informative for IMD’s internal purposes

27
Summary of Findings from 2020 EPU Certification Questionnaire
• 57% of long-oriented (LO) respondents have an established ESG policy and 67% explicitly incorporate ESG into investment decisions with another 10% doing so on a limited basis
• An additional 19% of LO respondents are either exploring or are currently in the process of developing an ESG policy
• Similar results were found for hedge fund (HF) respondents with 68% stating that they have or are in the process of developing an official ESG policy
• Amongst HF respondents, over two-thirds incorporate ESG to some extent into investment making decisions; however, this was significantly more pronounced within directional managers (85%) than stable value managers (55%)
Source: TRS IMD
ESG Incorporated into Investment DecisionsExternal Public Market Mangers
LO - Yes HF - Yes LO - LimitedHF - Limited LO - No HF - No
No (28.8%)
Yes(61.5%)
Limited(9.6%)

Aon | Retirement & Investment Proprietary & Confidential
Disclaimer
This document has been produced by Aon’s investment manager research team and is appropriate solely for institutional investors. Nothing in this document should be treated as an authoritative statement of the law on any particular aspect or in any specific case. It should not be taken as financial advice and action should not be taken as a result of this document alone. Consultants will be pleased to answer questions on its contents but cannot give individual financial advice. Individuals are recommended to seek independent financial advice in respect of their own personal circumstances. The information contained herein is given as of the date hereof and does not purport to give information as of any other date. The delivery at any time shall not, under any circumstances, create any implication that there has been a change in the information set forth herein since the date hereof or any obligation to update or provide amendments hereto. The information contained herein is derived from proprietary and non-proprietary sources deemed by Aon to be reliable and are not necessarily all inclusive. Aon does not guarantee the accuracy or completeness of this information and cannot be held accountable for inaccurate data provided by third parties. Reliance upon information in this material is at the sole discretion of the reader.
This document does not constitute an offer of securities or solicitation of any kind and may not be treated as such, i) in any jurisdiction where such an offer or solicitation is against the law; ii) to anyone to whom it is unlawful to make such an offer or solicitation; or iii) if the person making the offer or solicitation is not qualified to do so. If you are unsure as to whether the investment products and services described within this document are suitable for you, we strongly recommend that you seek professional advice from a financial adviser registered in the jurisdiction in which you reside. We have not considered the suitability and/or appropriateness of any investment you may wish to make with us. It is your responsibility to be aware of and to observe all applicable laws and regulations of any relevant jurisdiction, including the one in which you reside.
Aon Solutions UK Limited is authorized and regulated by the Financial Conduct Authority. Registered in England & Wales No. 4396810. When distributed in the US, Aon Investments USA Inc. is a registered investment adviser with the Securities and Exchange Commission (“SEC”). Aon Investments USA Inc. is a wholly owned, indirect subsidiary of Aon plc, a public company trading on the NYSE. In Canada, Aon Hewitt Inc. and Aon Investments Canada Inc. are indirect subsidiaries of Aon plc. Investment advice to Canadian investors is provided through Aon Investments Canada Inc., a portfolio manager, investment fund manager and exempt market dealer registered under applicable Canadian securities laws. Regional distribution and contact information is provided below.
Aon plc/Aon Solutions UK LimitedRegistered officeThe Aon Centre The Leadenhall Building122 Leadenhall StreetLondonEC3V 4AN
Aon Investments USA Inc.200 E. Randolph StreetSuite 700Chicago, IL 60601USA
Aon Hewitt Inc./Aon Investments Canada Inc. 20 Bay Street, Suite 2300Toronto, ONM5J 2N9Canada
28

TAB 24

Brian Guthrie, Executive DirectorAndrew Roth, COAO
February 26, 2021
TRS Long-Term Facilities Update
1

TRS Long-Term Facilities: Agenda
I. Vision: Generational SolutionII. Overview of September and December BOT meetingsIII. Indeed Tower Sublease UpdateIV. Current WorkstreamsV. Status of Remote WorkVI. Next Steps
2

TRS Long-Term Facilities: Vision
Generational Solution • Generates significant savings to the fund by decreasing use of leased space• Consistent with Texas Facilities Commission’s mission on consolidating agency facilities and
minimizing use of leased offices• Reduces need for costly improvements on outdated HQ buildings• Eliminates a costly piecemeal approach
Why is this necessary?• Space needs compounded over time• TRS is out of space; relying on work-from-home an unsustainable solution• Status quo is the most expensive option
3

TRS Long-Term Facilities: Vision
Other Considerations• Current environment is uncertain and unprecedented• Pandemic-driven changes require cautious, deliberate, and thoughtful approach
Non-negotiables• Decision must be in the best interest of the members and the fund• A prudent fiduciary decision needs to be made• Most economically advantageous long-term decision
4

September 2020 Board Meeting
• Presented business case for additional space
• Highlighted ongoing diligence activities• Provided WFH analysis efforts• Shared update on leasing activities and
options• Discussed current market conditions• Detailed options and cost• Approved a resolution to negotiate with
selected finalists
December 2020 Board Meeting
• Updated the board on Indeed Tower subleasing activities
• Discussed the need for space: flexibility, timing, and cost
• Discussed cost and timing associated with current options as of December 2020
TRS Long-Term Facilities: 2020 Overview
5

TRS Long-Term Facilities: Indeed Tower Sublease Update
Sublease Activity• Building expected to be completed in Spring of 2021• Cushman & Wakefield aggressively marketing space
o Responding to multiple inquiries about the spaceo Conducting tours for potential sublessees
• TRS staff toured the space to determine necessity of build-out worko Moving forward to request appropriate permits
6

Build-to-Suit Opportunities
• Follow through on design work for potential Build-to-Suit (BTS) options
• Explore potential legal issues with existing options
• Explore potential legal issues with proposed transaction structures
Red River Campus
• Initiate critical maintenance projects• Identify areas to remodel to provide
additional seating• Identify and implement necessary COVID
protocols for existing seating and pending remodel opportunities
• Develop 3, 5, and 7-year facilities plans
TRS Long-Term Facilities: Current Workstreams
7

TRS Long-Term Facilities: Current Workstreams
• Lease extended to March 2023• Additional 2-year term provides flexibility and stability while assessing solutions• Space can be utilized for transition and supports continued growth of IMD team• Continue to develop long-term facilities solution
8
816 Congress

Strengths
• Flexibility• Reduced employee stress associated with
traffic and commuting• Productivity gains in certain areas• Allows TRS to continue to deliver
uninterrupted services to members during a global pandemic
Challenges
• Technology issues• Productivity loss in key member-facing
business areas• Compliance and data security associated
with remote work strategies• Suboptimal employee onboarding and
training experience• Culture erosion
TRS Long-Term Facilities: Status of Remote Work
9

TRS Long-Term Facilities: Next Steps
Next Steps
• Continue due diligence on existing options• Continue to look for the best possible option for TRS and its members • Evaluate potential issues with return to work
➢Members (in-person visits at Red River)➢External Partners (in-person visits to 816 Congress)
• Initiate maintenance and space efficiency activities at Red River that can be done while staff occupancy is low
10

Appendix

2021
• Ramp up RTO efforts for staff at Red River and 816 Congress locations
• Prepare buildings for social distancing in the workplace with initial significant wave of RTO activities
• Continue diligence work on potential BTS options
• Aggressively market sublease space at Indeed Tower
• Obtain permits for “whiteboxing” space at Indeed to attract sublease tenants if necessary
2022
• If no BTS solution identified in 2021, determine if (and when) additional leased space for Red River campus is necessary
• Determine what options exist for IMD team at 816 Congress
• Identify parking solutions for both Red River and 816 Congress
TRS Long-Term Facilities: Updated Timeline
12

2023
• Lease at 816 Congress expires 3/31/23• Space needs at Red River will exceed
available space
2024
• Space needs at Red River will exceed available space
TRS Long-Term Facilities: Status of Return to Office Efforts
13