Traces Generation To Simulate Large-Scale Distributed ...
10
HAL Id: inria-00638561 https://hal.inria.fr/inria-00638561 Submitted on 5 Nov 2011 HAL is a multi-disciplinary open access archive for the deposit and dissemination of sci- entific research documents, whether they are pub- lished or not. The documents may come from teaching and research institutions in France or abroad, or from public or private research centers. L’archive ouverte pluridisciplinaire HAL, est destinée au dépôt et à la diffusion de documents scientifiques de niveau recherche, publiés ou non, émanant des établissements d’enseignement et de recherche français ou étrangers, des laboratoires publics ou privés. Traces Generation To Simulate Large-Scale Distributed Applications Olivier Dalle, Emilio Mancini To cite this version: Olivier Dalle, Emilio Mancini. Traces Generation To Simulate Large-Scale Distributed Appli- cations. Winter Simulation Conference, Dec 2011, Phoenix, AZ, United States. pp.2993-3001, 10.1109/WSC.2011.6148000. inria-00638561
-
Upload
khangminh22 -
Category
Documents
-
view
3 -
download
0
Transcript of Traces Generation To Simulate Large-Scale Distributed ...

HAL Id: inria-00638561https://hal.inria.fr/inria-00638561
Submitted on 5 Nov 2011
HAL is a multi-disciplinary open accessarchive for the deposit and dissemination of sci-entific research documents, whether they are pub-lished or not. The documents may come fromteaching and research institutions in France orabroad, or from public or private research centers.
L’archive ouverte pluridisciplinaire HAL, estdestinée au dépôt et à la diffusion de documentsscientifiques de niveau recherche, publiés ou non,émanant des établissements d’enseignement et derecherche français ou étrangers, des laboratoirespublics ou privés.
Traces Generation To Simulate Large-Scale DistributedApplications
Olivier Dalle, Emilio Mancini
To cite this version:Olivier Dalle, Emilio Mancini. Traces Generation To Simulate Large-Scale Distributed Appli-cations. Winter Simulation Conference, Dec 2011, Phoenix, AZ, United States. pp.2993-3001,�10.1109/WSC.2011.6148000�. �inria-00638561�

Proceedings of the 2011 Winter Simulation ConferenceS. Jain, R. R. Creasey, J. Himmelspach, K. P. White, and M. Fu, eds.
TRACES GENERATION TO SIMULATE LARGE-SCALE DISTRIBUTED APPLICATIONS
Olivier Dalle
Universite Nice Sophia AntipolisLaboratoire I3S UMR CNRS 6070
INRIA Sophia Antipolis - Mediterranee2004, Route des Lucioles,
Sophia Antipolis,France
Emilio P. Mancini
Laboratoire I3S UMR CNRS 6070INRIA Sophia Antipolis - Mediterranee
2004, Route des Lucioles,Sophia Antipolis,
France
ABSTRACT
In order to study the performance of scheduling algorithms, simulators of parallel and distributed applicationsneed accurate models of the application’s behavior during execution. For this purpose, traces of low-levelevents collected during the actual execution of real applications are needed. Collecting such traces is adifficult task due to the timing, to the interference of instrumentation code, and to the storage and transferof the collected data. To address this problem we propose a comprehensive software architecture, whichinstruments the application’s executables, gather hierarchically the traces, and post-process them in orderto feed simulation models. We designed it to be scalable, modular and extensible.
1 INTRODUCTION
Grid computing facilities offer massively parallel but loosely coupled computing resources. Exploring theseresources in order to reach peak performances requires fine tuned scheduling and load balancing algorithms.These need an accurate model of the application behavior in order to take the best scheduling decisions.At the lowest level of this optimization methodology, traces of real applications executions are neededto design and validate such models, and compare the performance of competing scheduling algorithms.Unfortunately, for large systems and long running programs, the size of trace files tends to explode. Theperformance engineers usually make an offline analysis, buffering the data locally, and sending them tothe analyzer after the end of the program; however, this method has some scalability issue (Wolf et al.2006). The instrumentation of parallel programs can also raise the problem of the interference betweenthe instrumentation and the original code: the first one competes with the application for the bandwidth,for computational resources and for storage space.
The perturbation can be a difficult task to handle, especially when the users exploits the simulationin run-time scenarios. For example, distributed systems can self-optimize themselves simulating differentconfigurations with current load conditions, and choosing the one that offers the best performances (Manciniet al. 2006), but the data measurement and propagation perturbations can lead to traces that make inaccuratesimulations.
To address these problems, we studied a comprehensive system that traces an application, interceptingunintrusively a set of defined events and collecting the information in an efficient way. It implementsthe three following elements: an instrumentation tool able to capture transparently the low-level events ofany application using a system level mechanism, a hierarchical system to gather them efficiently on thecomputation nodes, and a post-processing unit to export the data.
The paper is structured as follows. Section 2 describes the methodology we follow to gather theinstrumentation data. Section 3 describes the proposed architecture. Section 4 analyzes some related work.Section 5 draws the conclusions and discusses our future works.

Dalle, and Mancini
Management Unit Application Sensors Collectors
a. Starts
b. Starts with instrumentation
d. Evente.
h. Gathers data
Simulator
j. Traces
f. Post processing
i. Post processing
g. Propagation
c. Estimate overhead
Figure 1: The sequence diagram of the trace collect methodology.
2 THE TRACE COLLECTION METHODOLOGY
Event tracing is a commonly used technique to analyze bottlenecks and improve parallel and distributedsystems, but it can easily produce a hardly manageable amount of data. This amount is proportional toseveral factors, as the number of processes, the temporal coverage of the experiment (it may be shorterthan execution time), the frequency of event generation, and the number of measured events (Wolf, Freitag,Mohr, Moore, and Wylie 2006). Several ways exist to improve the scalability of this process. For example,system designers can get a better file format, or they can use early pattern detection, or they can rely onthe distributed analysis.
The system we propose tries to manage large traces using distributed buffering and processing, andthe hierarchical propagation of the traces. We designed it with three kinds of modules: the ManagementUnit, the Collectors and the Sensors.
• The Management Unit is a centralized module that drives the launching and the data gatheringprocesses;
• The Collectors assemble the information from the sensors and from other collectors, eventuallythey apply some post-processing algorithm (e.g., compression, decimation ...), and then they sendthe resulting stream to some other collector or to the Management Unit;
• The Sensors instruments the application, interfacing it with the lowest level Collectors.
Figure 1 shows the sequence diagram of the methodology we implemented to efficiently gather andprocess the trace data. The user interacts with the Management Unit (a) to start the collectors both onthe local nodes (Node Collectors) and on selected gateway hosts (Local Collectors). The Node Collectorsgather the information directly from the instrumented application, while the Local Collectors gather it fromlower Collectors.
Then the user starts the instrumented application (b). An initial overhead analysis allows the system tocalibrate itself and take better measures (c); the sensors make the estimate on each node, assuming to runon a heterogeneous system. In this way, at the cost of a longer initialization time, the sensors may estimate

Dalle, and Mancini
Node 1
Application
Node Collector / Post processor
Node 2
Application
Main Collector /Post processor
Node 3
Application
Local Collector / Post processor
Node 4
Application
Node Collector / Post processor
Gateway / Switch Gateway / Switch
Gateway / Switch
Figure 2: The hierarchical interaction between collectors.
the instrumentation’s overhead every time the application starts on local hosts. The collectors propagatethe overhead estimate, so that analysis tools can adjust the traces with the coefficient related to the actuallocal sites. For example, if a distributed system has both magnetic and solid-state storage devices andthe sensors buffer the data on the mass storage, the instrumentation overhead will be very dissimilar indifferent nodes, requiring a more specific adjustment.
In the current prototype, the launcher wraps selected library calls, with a modified version implementedin the sensors. For example, to trace the disk writes, the sensor may want to wrap the functions fwriteor fprintf, and execute the original routine measuring the times and recording the relevant information(d). For example, TAU uses a similar approach, among others (Shende and Malony 2006).
At this point, the sensors send data to the Node Collector (e), which can buffer or propagate them.Sometime the collectors receive a large amount data. To make them manageable, the user can use apost-processing algorithm that may remove the uninteresting information, or compress the data stream (f).The data reduction makes it possible to handle also the trace generation at run-time, that is useful to feedthe simulators in certain scenarios (e.g., (Mancini et al. 2006, Rouvoy et al. 2008)). The collector, then,propagates the processed data to another, upper level collector (g).
The Management Unit can make both a run-time or post-mortem analysis (off-line, after the end of theapplication), gathering the data from the collectors at the highest level (h). Once it collects a satisfactoryamount of records, it can post process the complete data set (i) and store or send it to the simulator (j).
A critical point of the presented methodology is the location of collector modules. The user shouldstart every collector in a position as close as possible to his data sources; in a future improvement, thesystem will autonomously choose a good layout. In the example shown in Figure 2 the subnet of Nodes 3and 4 is connected with a slow link with the Nodes 1 and 2, so Node 4 sends his trace data more efficientlyto the Local Collector on Node 3. This one may buffer and compress the data before sending them to themain collector, reducing in that way the band consumption on the slow link, and hence the perturbation ofthe application’s communication. The perturbation on the computation resources due to the compressioncould be reduced in other ways, for example, reserving a processor’s core setting the CPU’s affinity of theprocesses.
3 THE SYSTEM’S ARCHITECTURE
Distributed programs often run on heterogeneous hardware: each involved host may have a differentcomputational efficiency and different memory capacity and they may be connected with links withdifferent speed. Modern computational clusters also show a sort of heterogeneity, with the tasks spread on
Dalle, and Mancini
Management unit
Launching unit
Traces management
unit
Trace files
Application
Sensor
Collector
Collectors hierarchy
Application
Sensor
Operating systems
Operating systems
Simulator
Storage
Analysis
Post processor
Buffer
Client/Server
Collector
Post processor
Buffer
Client/Server
Figure 3: The architecture of the system.
multiple cores and GPUs, and the communication that have to hop multiple levels of switches when thesender and the receiver are not in the same rack. For example, two tasks of the same application running ontwo cores of the same processor, communicate much more efficiently than two tasks on two different hosts.Therefore, exploiting the locality principle can improve the performance of such kind of applications. Wehad taken advantage of this, studying a hierarchical model for the trace generation system. In this modelthe data are buffered and processed close to the place where they are generated, and sent over non locallink only after a reduction.
At the root of the system’s hierarchical model (Figures 2 and 3), there is the Management Unit andat the leaves, there are the sensors that measure the application’s events. One or more levels of collectorsgather the sensor’s data. In that way, a collector manages a single subnet or a single site. It collects the data,and makes some processing on them, for example, it can apply some compression or decimation algorithm.Then, it sends the processed data to an upper level collector, or to the management unit. This schemaensures an optimized use of the bandwidth, when collecting traces at runtime, but it can also improvethe post-mortem (off-line) analysis, making easy the implementation of distributed elaboration (Geimer,Wolf, Wylie, and Mohr 2006). It is effective when the network is heterogeneous, as commonly happensin distributed computing, because it can easily reduce the amount of information sent on slow link.
3.1 The Management Unit
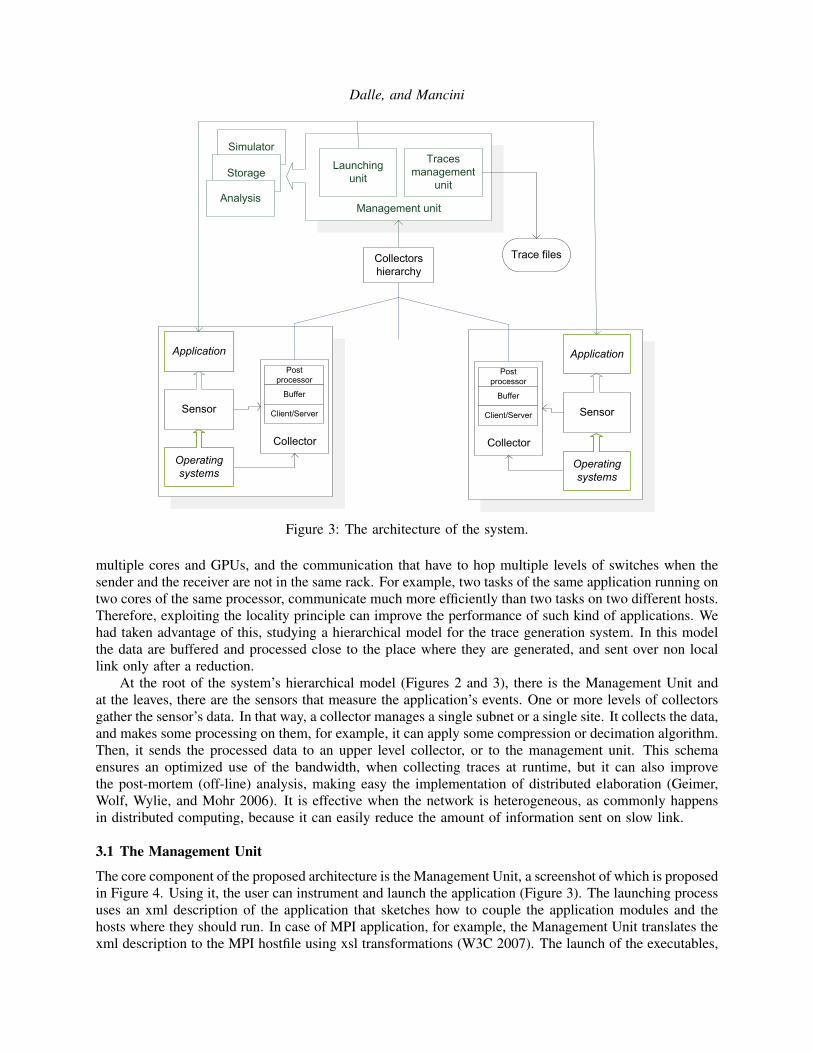
The core component of the proposed architecture is the Management Unit, a screenshot of which is proposedin Figure 4. Using it, the user can instrument and launch the application (Figure 3). The launching processuses an xml description of the application that sketches how to couple the application modules and thehosts where they should run. In case of MPI application, for example, the Management Unit translates thexml description to the MPI hostfile using xsl transformations (W3C 2007). The launch of the executables,

Dalle, and Mancini
Figure 4: A screenshot of the GUI of the ManagementUnit.
Figure 5: Comparison of the overhead of plain andinstrumented fwrite function
is different on distinct platforms and it may require a specific support, in particular, MPI implementationsuse proprietary launching systems, with just a subset of common options (MPI Forum 2009), a solutionwe plan to implement, is the interfacing with existing analysis applications like Vampir (Knupfer, Brunst,Doleschal, Jurenz, Lieber, Mickler, Muller, and Nagel 2008).
The Management Unit also includes the module for the trace generation. It takes the raw data fromthe root Collector, and translates them, using an appropriate filter, to generate the format requested by thesimulator or by the analysis tools.
3.2 The Collectors
The function of the Collectors is to move, buffer and post-process the data, acting as consumers for theSensors and Collectors, and as producer for other Collectors and for the Management Unit.
Most of the distributed computing patterns are intrinsically dynamic: their topology, connections antinteractions change continuously during the execution time. That means that the sensors may join or leavethe system at run-time. The Collectors handle this behavior implementing the aggregation in a client-serverstructure. In this way, after the launch, a Collector waits for dynamic incoming connections, new sensorsor new Collectors can join at any time. Once it establishes the connection with lower level components,it starts to receive and buffer the data. It keeps the buffers in memory, and sends them when they reach athreshold (e.g., a threshold of one or more measures, a buffer overflow ...) or after some event (e.g., theapplication termination).
3.3 The Sensors
The Sensors are the components that instrument the application. The current prototype wraps the libraryprocedures at launch time, without the needing to recompile or annotate the code. We designed the sensorsto be extensible, with a separation from the instrumenting and the network/IPC modules, so that existingtechnologies, like DynInst (Buck and Hollingsworth 2000), can be easily integrated.
The sensors can measure the information in two ways, responding to events (e.g., when an I/O operationis requested) or sampling some parameter (e.g., instantaneous process memory consumption), however thegranularity of the sampling can greatly affect the size of the traces.
Figure 5 show the impact of current code instrumentation on the library routines. This test refers tothe worst case when we did not use memory buffering mechanisms. It compares the time spent on a plainand on an instrumented write in the current prototype for different data block sizes: while the impact isproportionally small for long operations, it becomes significant for the quick ones.

Dalle, and Mancini
The distributed trace generation and pre-processing raises a clock synchronization problem. We rely onthe Network Time Protocol, NTP (Mills 1995), which is satisfactory in most scenarios, but other solutionsare possible. For example, Wu et al. (2000) take advantage of the hardware globally synchronized clock ofswitch adapters (Stunkel et al. 1999), while other implementations rely on specific hardware infrastructure(e.g., Blue Gene (Milano et al. 2006)).
4 RELATED WORK
The problem to efficiently catch, collect and store large set of trace data of parallel applications has beenextensively studied in literature. Wolf et al. (2006) survey the approaches to improve trace analysis in termsof scalability. An overview of instrumentation, profiling, tracing, and analysis methods, can be found in(Shende and Malony 2006), where the authors present TAU, a well-known tool for performance analysis.Moreover, the description of an interesting project about the scalability of simulation experimentation layerscan be found in (Himmelspach, Ewald, and Uhrmacher 2008).
In their inspiring paper (Aguilera et al. 2006), the authors present a methodology for the analysis ofcommunication traces of parallel scientific applications. It extracts communication data from trace files,pre-elaborates the information, and exploits clustering techniques in order to identify process pairs andimprove the analysis. They use KOJAK (Kit for Objective Judgement and Knowledge-based Detectionof Performance Bottlenecks)to collect execution data and EARL (Wolf and Mohr 1999) to store themefficiently. Mohr and Wolf studied KOJAK , (Mohr and Wolf 2003), as an automated tracing collectorand performance analyzer for scientific parallel programs (typically using MPI and/or OpenMP). Anotherwell known family of tools for instrumentation, measurement and visualization is Vampir (Knupfer et al.2008, Brunst et al. 2009). The system we propose, allows the developers to define the hierarchy taking inaccount the actual topology. This is important in order to optimize the bandwidth in computational clustersthat use multilevel switches (e.g., Infiniband Fat Trees, Zahavi et al. 2010), or in distributed environments(for example in the Grids), and allow run-time analyses.
Supinski et al., in the other inspiring paper (Supinski et al. 2008), present a scalable tools designedfor the analysis of petascale systems, reporting also some case study that demonstrate the framework’sfunctionalities. They designed it using a dynamical hierarchical topology. Also the open source project OpenSpeedShop uses a hierarchical approach to gather performance data (Schulz et al. 2009). It instrumentsrunning application with DynInst (Buck and Hollingsworth 2000), and propagate the data across the system,building a tree based on overlay network.
Geimer et al. (2006) present an interesting approach to analyze automatically the traces of large-scaleapplications. They evaluate local trace files in parallel, using an analyzer that matches the target application.They implemented the proposed system, using MPI and KOJAK. Also in our approach, we make a pre-elaboration locally, in order to reduce the quantity of data to transfer to the upper levels. The problem ofthe size of the traces rises also when running simulations. Also in this case there is the need to handle andanalyze huge amount of data, as does the OSIF Project (Ribault et al. 2010).
The lowest level in the trace generation process is the code instrumentation. Smith et al. (2009)describe an approach to recording call path for HPC applications, providing a low runtime overhead withoutinstrumentation. Arnold and Ryder (2001) propose an interesting framework that uses the instrumentationsampling to reduce the instrumentation cost, switching from instrumented and not instrumented code.Some particular instrumentation problem offers hard challenges, as in the case of heterogeneous multicoresystems (Hung et al. 2010).
5 CONCLUSION
Collect large traces in a distributed system is a challenging task. It requires the minimization of theinterference between the original code and the analysis infrastructure. The traces, the gathering modules,and the instrumentation code, perturb the execution, and may lead to deceptive results.

Dalle, and Mancini
In this paper, we studied the problem of handling large traces generated from distributed programs. Wepresented a methodology and the architecture of a system that efficiently collects traces from programs,both at run-time and off-line, to make performance analysis or to feed simulators. The solution we followis the distributed post-processing and buffering of the collected data, in a way that matches the capacityof the distributed system’s links.
Future improvements will include the automatic discovery of the network topology (Lawrence andYuan 2008), in order to optimize the collectors’ placement. Other interesting areas of study will be theautomatic simulation code generation and the use of other instrumentation techniques, as for example thecompiler annotations. Once we have the data, we can either use them for direct replay, or attempt to derivebehavior models, using techniques such as Calzarossa et al. suggest in (Calzarossa et al. 2000).
ACKNOWLEDGMENTS
This work is partly funded by the French Agence Nationale de la Recherche (ANR), in the Mascotte andUSS-SimGrid projects (INRIA 2011). SimGrid is a lead project in the simulation of HPC systems (Casanova,Legrand, and Quinson 2008). The USS-SimGrid project implementing Ultra Scalable Simulations withSimGrid, aims to increase the scalability, the optimization, the easiness, and develop new tools.
REFERENCES
Aguilera, G., P. Teller, M. Taufer, and F. Wolf. 2006. “A systematic multi-step methodology for performanceanalysis of communication traces of distributed applications based on hierarchical clustering”. In Proc. of20th International Parallel and Distributed Processing Symposium, edited by P. Spirakis and H. Siegel,388–395. Rhodes Island, Greece: IEEE Computer Society.
Arnold, M., and B. G. Ryder. 2001. “A framework for reducing the cost of instrumented code”. In Proc.of the ACM SIGPLAN 2001 conference on Programming language design and implementation, editedby M. Burke and M. L. Soffa, PLDI ’01, 168–179. New York, NY, USA: ACM.
Brunst, H., D. Kranzlmuller, M. S. Muller, and W. E. Nagel. 2009, July. “Tools for scalable parallel programanalysis: Vampir NG, MARMOT, and DeWiz”. Int. J. Comput. Sci. Eng. 4:149–161.
Buck, B., and J. K. Hollingsworth. 2000. “An API for Runtime Code Patching”. The International Journalof High Performance Computing Applications 14:317–329.
Calzarossa, M., L. Massari, and D. Tessera. 2000. “Workload Characterization Issues and Methodologies”.In Performance Evaluation: Origins and Directions, edited by G. Haring, C. Lindemann, and M. Reiser,459–481. London, UK: Springer-Verlag.
Casanova, H., A. Legrand, and M. Quinson. 2008. “SimGrid: A Generic Framework for Large-ScaleDistributed Experiments”. In Proc. of International Conference on Computer Modeling and Simulation,edited by D. Al-Dabass, A. Orsoni, A. Brentnall, A. Abraham, and R. Zobel, 126–131. Los Alamitos,CA, USA: IEEE Computer Society.
Geimer, M., F. Wolf, B. Wylie, and B. Mohr. 2006. “Scalable Parallel Trace-Based Performance Analysis”.In Recent Advances in Parallel Virtual Machine and Message Passing Interface, edited by B. Mohr,J. Trff, J. Worringen, and J. Dongarra, Volume 4192 of Lecture Notes in Computer Science, 303–312.Springer Berlin / Heidelberg.
Himmelspach, J., R. Ewald, and A. Uhrmacher. 2008, December. “A flexible and scalable experimentationlayer”. In Proc. of Winter Simulation Conference (WSC’08), edited by S. Mason, R. Hill, L. Monch,O. Rose, T. Jefferson, and J. Fowler, 827–835.
Hung, S.-H., C.-H. Tu, and T.-S. Soon. 2010. “Trace-based performance analysis framework for heteroge-neous multicore systems”. In Proc. of the 2010 Asia and South Pacific Design Automation Conference,edited by Y.-L. Lin, ASPDAC ’10, 19–24. Piscataway, NJ, USA: IEEE Press.
INRIA 2011. “USS-SimGrid Project”. Web Site. http://uss-simgrid.gforge.inria.fr (accessed October 18,2011).

Dalle, and Mancini
Knupfer, A., H. Brunst, J. Doleschal, M. Jurenz, M. Lieber, H. Mickler, M. S. Muller, and W. E. Nagel.2008. “The Vampir Performance Analysis Tool-Set”. In Tools for High Performance Computing, editedby M. Resch, R. Keller, V. Himmler, B. Krammer, and A. Schulz, 139–155. Springer Berlin Heidelberg.
Lawrence, J., and X. Yuan. 2008, April. “An MPI tool for automatically discovering the switch leveltopologies of Ethernet clusters”. In Proc. of 22nd IEEE International Symposium on Parallel andDistributed Processing, IPDPS 2008, edited by J. Wu, 1–8. Miami, Florida USA: IEEE.
Mancini, E. P., M. Rak, R. Torella, and U. Villano. 2006. “Predictive Autonomicity of Web Services inthe MAWeS Framework”. Journal of Computer Science 2 (6): 513–520.
Milano, J., G. Muller-Shultz, and G. Lakner. 2006. Blue Gene/L: Hardware Overview and Plan-ning. IBM Corp. http://workshops.alcf.anl.gov/gs10/files/2010/01/Morozov-BlueGeneP-Architecture.pdf (accessed October 18, 2011).
Mills, D. L. 1995. “Improved Algorithms for Synchronizing Computer Network Clocks”. IEEE/ACMTransactions on Networking 3:245–254.
Mohr, B., and F. Wolf. 2003. “KOJAK: A Tool Set for Automatic Performance Analysis of Parallel Programs”.In Euro-Par 2003 Parallel Processing, edited by H. Kosch, L. Bszrmnyi, and H. Hellwagner, Volume2790 of Lecture Notes in Computer Science, 1301–1304. Springer Berlin / Heidelberg.
MPI Forum 2009. “MPI A Message-Passing Interface Standard. Version 2.2”. Technical report, MPI Forum.http://www.mpi-forum.org/docs/mpi-2.2/mpi22-report.pdf (accessed October 18, 2011).
Ribault, J., O. Dalle, D. Conan, and S. Leriche. 2010. “OSIF: A Framework To Instrument, Validate, andAnalyze Simulations”. In Proc. of the 3rd International ICST Conference on Simulation Tools andTechniques (SIMUTools ’10), edited by I. Chlamtac, 56–65. Torremolinos, Spain.
Rouvoy, R., D. Conan, and L. Seinturier. 2008, June. “Software Architecture Patterns for a Context-Processing Middleware Framework”. IEEE Distributed Systems Online 9:1–12.
Schulz, M. snf Galarowicz, J., D. Maghrak, W. Hachfeld, D. Montoya, and S. Cranford. 2009, May.“Analyzing the Performance of Scientific Applications with OpenSpeedShop”. In Parallel ComputationalFluid Dynamics: Recent Advances and Future Directions, edited by R. Biswas, 151–159. Moffet Field,CA, United States.
Shende, S. S., and A. D. Malony. 2006, May. “The Tau Parallel Performance System”. Int. J. High Perform.Comput. Appl. 20:287–311.
Smith, J. A., S. D. Hammond, G. R. Mudalige, J. A. Davis, A. B. Mills, and S. A. Jarvis. 2009. “hpsgprof: ANew Profiling Tool for Large-Scale Parallel Scientific Code”. In Proc. of Uk Performance EngineeringWorkshop 2009 (UKPEW09), edited by K. Djemame, 1–11.
Stunkel, C. B., J. Herring, B. Abali, and R. Sivaram. 1999. “A new switch chip for IBM RS/6000 SPsystems”. In Proc. of the 1999 ACM/IEEE Conference on Supercomputing (Supercomputing ’99), editedby C. Pancake, 1–16. New York, NY, USA: ACM.
Supinski, B. R. D., F. Mueller, R. Fowler, P. Ratn, T. Gamblin, and M. Schulz. 2008, June. “An openinfrastructure for scalable, reconfigurable analysis”. In Proc. of International Workshop on ScalableTools for High-End Computing (STHEC 2008) ACM/SIGARCH, edited by M. Gerndt, J. Labarta, andB. Miller, 39–50.
W3C 2007. “XSL Transformations (XSLT) Version 2.0 (W3C Recommendation 23 January 2007)”. Technicalreport, W3C. http://www.w3.org/TR/xslt20 (accessed October 18, 2011).
Wolf, F., F. Freitag, B. Mohr, S. Moore, and B. J. N. Wylie. 2006. “Large Event Traces in Parallel PerformanceAnalysis”. In Proc. of 8th Workshop on Parallel Systems and Algorithms (PASA), Frankfurt, Germany,edited by W. Karl et al., Volume P-81 of Lecture Notes in Informatics.
Wolf, F., and B. Mohr. 1999. “EARL: A programmable and extensible toolkit for analyzing event tracesof message passing programs”. In High-Performance Computing and Networking, edited by P. Sloot,M. Bubak, A. Hoekstra, and B. Hertzberger, Volume 1593 of Lecture Notes in Computer Science,503–512. Springer Berlin / Heidelberg.

Dalle, and Mancini
Wu, C. E., A. Bolmarcich, M. Snir, D. Wootton, F. Parpia, A. Chan, E. Lusk, and W. Gropp. 2000. “FromTrace Generation to Visualization: A Performance Framework for Distributed Parallel Systems”. InProc. of Supercomputing Conference, edited by L. Turcotte et al., 50–68. Los Alamitos, CA, USA:IEEE Computer Society.
Zahavi, E., G. Johnson, D. J. Kerbyson, and M. Lang. 2010. “Optimized InfiniBand fat-tree routing forshift all-to-all communication patterns”. Concurrency and Computation: Practice and Experience 22(2): 217–231.
AUTHOR BIOGRAPHIES
OLIVIER DALLE is Maitre de Conferences (associate professor) in the Computer Sciences departmentof the Faculty of Sciences at the University of Nice-Sophia Antipolis (UNS). He received his B.Sc. fromthe University of Bordeaux 1 and his M.Sc. and Ph.D. from UNS. From 1999 to 2000, he was a postdoc-toral fellow at the French Space Agency center in Toulouse (CNES-CST), where he started working oncomponent-based discrete-event simulation of multi-media telecommunication systems. In 2000, he wasappointed to UNS, and he joined the MASCOTTE research group, a joint team of UNS, CNRS and INRIA.His current research interests in discrete-event simulation are on methodology support, very large-scalenetworked systems, and wireless communication systems. His email address is [email protected].
EMILIO P. MANCINI is a Post-Doc researcher INRIA Sophia Antipolis - Mediterranee. He received hisPh.D. in Information Engineering and his M.Sc. in Computer Engineering from the University of Sannio,Italy. His research interests are in the area of simulation, high performance computing, and autonomiccomputing. His e-mail is [email protected].