A Resistivity Survey of Phosphate Nodules in Oshoshun ...
12
103 Open Access. © 2018 Sanuade O.A., Olaojo A.A, Akanji A.O., Oladunjoye M.A., OmolaiyeG.E., published by Sciendo. This work is licensed under the Creative Commons Attribution-NonCommercial-NoDerivatives 4.0 License. Received: Aug 07, 2017 Accepted: Mar 09, 2018 DOI 10.1515/rmzmag-2018-0006 Original scientific paper Abstract This geophysical study was carried out to determine the occurrence of phosphate nodules in the Oshoshun Formation of the Dahomey Basin, Southwestern Nige- ria. The electrical resistivity method, comprising 1D vertical electrical sounding (VES; using Schlumberger array) and 2D geoelectrical imaging (using Wenner array), was used to determine the nature and depth of occurrence of the phosphate nodules. Six profile lines were established within the study area, and inverted sections were generated from the apparent resistiv- ity data using DIPRO inversion algorithm. Five VES points were also acquired in the study area, and Win- Resist programme was used to process and interpret the field resistivity data. Four pits were dug along the profiles to verify the interpreted results. The results obtained by both techniques reveal similar geoelectric units: the top soil, clay, clayey sand and clay at different depths. These layers host pockets of phosphate nodules (78–≥651 Wm) with varying thicknesses. The strong correlation between the lithology profiles obtained from the pits and the interpreted results of the inverted apparent resistivity sections demonstrates the efficacy of the electrical resistivity method in characterising phosphate occurrence within the formation. Key words: imaging • inversion • Oshoshun • phospha- te nodules • resistivity A Resistivity Survey of Phosphate Nodules in Oshoshun, Southwestern Nigeria Raziskava Upornosti Nahajališča Fosfatnih Gomoljev v Oshoshunski Formaciji v Jugozahodni Nigeriji Oluseun Adetola Sanuade 1 ,*, Abayomi Adesola Olaojo 2 , Adesoji Olumayowa Akanji 3 , Michael Adeyinka Oladunjoye 4 , Gabriel E. Omolaiye 5 1 Department of Geophysics, Federal University Oye-Ekiti, Ekiti State, Nigeria 2 Earth Sciences Department, Ajayi Crowther University, Oyo, Nigeria 3 Geoexperts Nigeria Ltd, Rockstone Ville Estate, Badore, Ajah, Lagos, Nigeria 4 Department of Geology, University of Ibadan, Ibadan, Nigeria 5 Crustcut and Minerals Limited, 16 Odudu Eleyiwo Street, Victoria Island, Lagos State, Nigeria *[email protected] Povzetek Namen te geofizikalne raziskave je bil opredeliti na- hajališče fosfatnih gomoljev v oshoshunski formaciji dahomejske kadunje v jugozahodni Nigeriji. Z uporabo metode električne upornosti so določili naravo in globi- no nahajališča fosfatnih gomoljev, in sicer z 1D vertikal- nim električnim sondiranjem ob uporabi Schlumber- gerjevega razporeda in z 2D geoelektrično preiskavo z Wennerjevim razporedom. Na raziskovanem območju so izmerili šest profilov in izdelali iz podatkov navide- zne upornosti prognozne preseke ob uporabi inverzij- skega algoritma DIPRO. Na proučevaneem ozemlju so izvedli tudi pet vertikalnih električnih sondiranj (VES). Za obdelavo in interpretacijo terenskih meritev upor- nosti so uporabili program WinResist. Za preverbo interpretiranih rezultatov so izkopali ob profilih štiri jaške. Rezultati obeh postopkov so podobni, razkrivajo navzočnost vrhnjih tal, gline in glinenega peska v raz- ličnih globinah. V teh plasteh so žepi fosfatnih gomo- ljev (78 - ≥651 Wm) različne debeline. Visoka stopnja ujemanja med litološkimi podatki iz jaškov in rezultati iz interpretiranih profilov navidezne upornosti priča o učinkovitosti električne upornostne metode za ugo- tavljanje fosfatnih nahajališč v plasteh. Ključne besede: sondiranje, interpretacija, oshoshun- ska formacija, fosfatni gomolji, upornost
-
Upload
khangminh22 -
Category
Documents
-
view
4 -
download
0
Transcript of A Resistivity Survey of Phosphate Nodules in Oshoshun ...

103
Open Access. © 2018 Sanuade O.A., Olaojo A.A, Akanji A.O., Oladunjoye M.A., OmolaiyeG.E., published by Sciendo. This work is licensed under the Creative Commons Attribution-NonCommercial-NoDerivatives 4.0 License.
Received: Aug 07, 2017
Accepted: Mar 09, 2018
DOI 10.1515/rmzmag-2018-0006
Original scientific paper
AbstractThis geophysical study was carried out to determine the occurrence of phosphate nodules in the Oshoshun Formation of the Dahomey Basin, Southwestern Nige-ria. The electrical resistivity method, comprising 1D vertical electrical sounding (VES; using Schlumberger array) and 2D geoelectrical imaging (using Wenner array), was used to determine the nature and depth of occurrence of the phosphate nodules. Six profile lines were established within the study area, and inverted sections were generated from the apparent resistiv-ity data using DIPRO inversion algorithm. Five VES points were also acquired in the study area, and Win-Resist programme was used to process and interpret the field resistivity data. Four pits were dug along the profiles to verify the interpreted results. The results obtained by both techniques reveal similar geoelectric units: the top soil, clay, clayey sand and clay at different depths. These layers host pockets of phosphate nodules (78–≥651 Wm) with varying thicknesses. The strong correlation between the lithology profiles obtained from the pits and the interpreted results of the inverted apparent resistivity sections demonstrates the efficacy of the electrical resistivity method in characterising phosphate occurrence within the formation.
Key words: imaging • inversion • Oshoshun • phospha-te nodules • resistivity
A Resistivity Survey of Phosphate Nodules in Oshoshun, Southwestern NigeriaRaziskava Upornosti Nahajališča Fosfatnih Gomoljev v Oshoshunski Formaciji v Jugozahodni Nigeriji
Oluseun Adetola Sanuade1,*, Abayomi Adesola Olaojo2, Adesoji Olumayowa Akanji3, Michael Adeyinka Oladunjoye4, Gabriel E. Omolaiye5
1 Department of Geophysics, Federal University Oye-Ekiti, Ekiti State, Nigeria2 Earth Sciences Department, Ajayi Crowther University, Oyo, Nigeria3 Geoexperts Nigeria Ltd, Rockstone Ville Estate, Badore, Ajah, Lagos, Nigeria4 Department of Geology, University of Ibadan, Ibadan, Nigeria5 Crustcut and Minerals Limited, 16 Odudu Eleyiwo Street, Victoria Island, Lagos State, Nigeria*[email protected]
PovzetekNamen te geofizikalne raziskave je bil opredeliti na-hajališče fosfatnih gomoljev v oshoshunski formaciji dahomejske kadunje v jugozahodni Nigeriji. Z uporabo metode električne upornosti so določili naravo in globi-no nahajališča fosfatnih gomoljev, in sicer z 1D vertikal-nim električnim sondiranjem ob uporabi Schlumber-gerjevega razporeda in z 2D geoelektrično preiskavo z Wennerjevim razporedom. Na raziskovanem območju so izmerili šest profilov in izdelali iz podatkov navide-zne upornosti prognozne preseke ob uporabi inverzij-skega algoritma DIPRO. Na proučevaneem ozemlju so izvedli tudi pet vertikalnih električnih sondiranj (VES). Za obdelavo in interpretacijo terenskih meritev upor-nosti so uporabili program WinResist. Za preverbo interpretiranih rezultatov so izkopali ob profilih štiri jaške. Rezultati obeh postopkov so podobni, razkrivajo navzočnost vrhnjih tal, gline in glinenega peska v raz-ličnih globinah. V teh plasteh so žepi fosfatnih gomo-ljev (78 - ≥651 Wm) različne debeline. Visoka stopnja ujemanja med litološkimi podatki iz jaškov in rezultati iz interpretiranih profilov navidezne upornosti priča o učinkovitosti električne upornostne metode za ugo-tavljanje fosfatnih nahajališč v plasteh.
Ključne besede: sondiranje, interpretacija, oshoshun-ska formacija, fosfatni gomolji, upornost
Sanuade O.A., Olaojo A.A, Akanji A.O., Oladunjoye M.A., Omolaiye G.E.
104
RMZ – M&G | 2018 | Vol. 65 | pp. 103–114
Southwestern Nigeria. Although the slightly older (Paleocene) phosphate deposits of Soko-to State have been extensively worked for agri-cultural material, the Ogun phosphate rock has received little attention [9,10]. It is important to carry out geophysical characterisation stud-ies of Ogun phosphate rock to ascertain the availability of phosphates. Therefore, this study was carried out to determine the occurrence of phosphate nodules and evaluate the nature and depth of such phosphate beds in the study area.
Location and geology of the study area
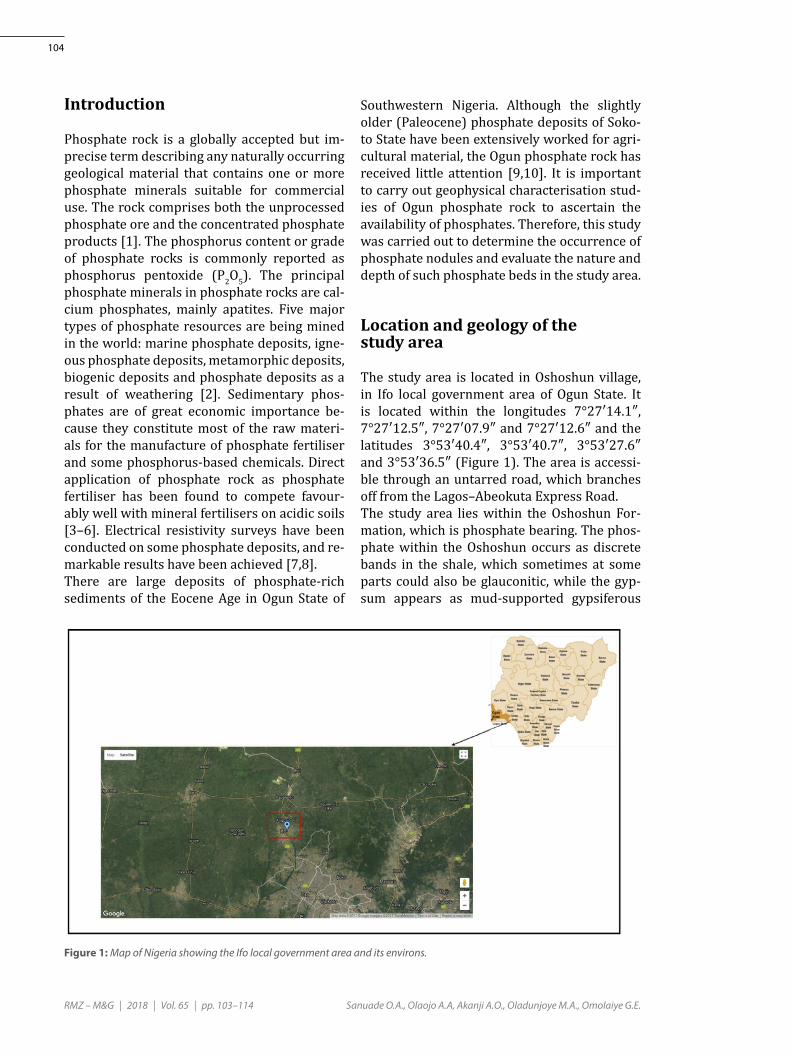
The study area is located in Oshoshun village, in Ifo local government area of Ogun State. It is located within the longitudes 7°27′14.1″, 7°27′12.5″, 7°27′07.9″ and 7°27′12.6″ and the latitudes 3°53′40.4″, 3°53′40.7″, 3°53′27.6″ and 3°53′36.5″ (Figure 1). The area is accessi-ble through an untarred road, which branches off from the Lagos–Abeokuta Express Road.The study area lies within the Oshoshun For-mation, which is phosphate bearing. The phos-phate within the Oshoshun occurs as discrete bands in the shale, which sometimes at some parts could also be glauconitic, while the gyp-sum appears as mud-supported gypsiferous
Introduction
Phosphate rock is a globally accepted but im-precise term describing any naturally occurring geological material that contains one or more phosphate minerals suitable for commercial use. The rock comprises both the unprocessed phosphate ore and the concentrated phosphate products [1]. The phosphorus content or grade of phosphate rocks is commonly reported as phosphorus pentoxide (P2O5). The principal phosphate minerals in phosphate rocks are cal-cium phosphates, mainly apatites. Five major types of phosphate resources are being mined in the world: marine phosphate deposits, igne-ous phosphate deposits, metamorphic deposits, biogenic deposits and phosphate deposits as a result of weathering [2]. Sedimentary phos-phates are of great economic importance be-cause they constitute most of the raw materi-als for the manufacture of phosphate fertiliser and some phosphorus-based chemicals. Direct application of phosphate rock as phosphate fertiliser has been found to compete favour-ably well with mineral fertilisers on acidic soils [3–6]. Electrical resistivity surveys have been conducted on some phosphate deposits, and re-markable results have been achieved [7,8].There are large deposits of phosphate-rich sediments of the Eocene Age in Ogun State of
Figure 1: Map of Nigeria showing the Ifo local government area and its environs.

A Resistivity Survey of Phosphate Nodules in Oshoshun, Southwestern Nigeria
105
shale. The Oshoshun is overlain by the Ilaro For-mation, which is made up of both marine and continental massive yellow and poorly consol-idated sandstones (Figure 2). The phosphates occur as nodules at ~3–6 m of depth within the formation.
Methodology
Electrical Resistivity SurveysSix 2D geoelectrical resistivity profile lines were measured (Figure 3) with the aid of an Ohmega
Campus model resistivity meter using the Wen-ner-alpha array. Each of the 2D traverses was 50 m in length, and they formed an orthogonal set such that the total area covered by the 2D traverses was ~2500 m2. Five vertical electrical sounding (VES) data were also collected in the site using Schlumberger array to supplement the observed 2D resistivity imaging data and to provide layering information on the lithology of the study area. Figure 3 shows the survey plan with the locations of the traverses and the VES points. The measurements commenced at the east end for the in-lines and at the north end
Figure 2: Geological map of Ifo and environs showing the study area.

Sanuade O.A., Olaojo A.A, Akanji A.O., Oladunjoye M.A., Omolaiye G.E.
106
RMZ – M&G | 2018 | Vol. 65 | pp. 103–114
for the cross-lines. Four pits were dug along the profiles 1, 2, 4 and 6 (Figure 3) to verify the in-terpreted results.
Data Processing and InversionThe electrical imaging data was processed and interpreted using computer-assisted DIPRO software and presented as inverted sections. The VES curves were quantitatively interpreted by partial curve matching and computer-assist-
ed 1D forward modelling with the WinResist software, version 1.0 [11].
Results and Discussion
Geoelectric ProfilesFigure 4 shows a system of three geoelectric layers from the inverted section. The top soil has resistivity values ranging from 52 to 85 Wm
Figure 3: Map of the study area showing locations of geophysical 1D (VES) and 2D resistivity imaging lines (Profiles 1, 2, 3, 4, 5 and 6) surveys.

A Resistivity Survey of Phosphate Nodules in Oshoshun, Southwestern Nigeria
107
Figure 4: Inverted model section of Profile line 1.
Figure 5: Soil profile of Pit 1 (P1) dug along Profile 1.
Figure 6: Inverted model section of Profile line 2.
Figure 7: Soil profile of Pit 2 (P2) dug along Profile 2.

Sanuade O.A., Olaojo A.A, Akanji A.O., Oladunjoye M.A., Omolaiye G.E.
108
RMZ – M&G | 2018 | Vol. 65 | pp. 103–114
extending from the surface to an average depth of 1.0 m; the next layer has resistivity values be-tween 32 and 52 Wm. This lithology is charac-terised by the presence of clayey material [12]. The clayey material occurs at both flanks of the traverse line. The third layer has resistivi-ty values increasing from 63 to ≥ 139 Wm. This indicates the presence of clayey sand [12]. The phosphate-nodule bed (139–≥226 Wm) occurs within the clayey sand materials in the central lower part of the section.The lithological column (Figure 5) of Pit 1 dug along Profile 1 reveals two horizons comprising clay (0.1–2 m thick) and clayey sand (2–> 5 m). Phosphate nodules are encountered at ~3.2 m within the clayey sand horizon. This result cor-responds with the interpretation of the invert-ed section.As observed from the 2D resistivity model in Figure 6, three varying geoelectric layers are
Figure 8: Inverted model section of Profile line 3.
Figure 9: Inverted model section of Profile line 4.
Figure 10: Soil profile of Pit 3 (P3) dug along Profile 4.

A Resistivity Survey of Phosphate Nodules in Oshoshun, Southwestern Nigeria
109
detected. The resistivity values of the top soil are between 36 and 86 Wm, as seen at the be-ginning of the profile up to the station at dis-tance of 18 m, with an average depth of 1.5 m. The clayey soil layer has resistivity varying from 15 to 36 Wm between stations at dis-tances of 3 and 12 m. The clayey sand extends to the surface between stations at distanc-es of 42 and 48 m, and its resistivity rang-es from 86 to ≥ 202 Wm; the phosphatic bed (202–≥475 Wm) is embedded in this layer.The soil profile (Figure 7) of Pit 2 dug along Pro-file 2, depicts two layers composed of clay and clayey sand. Phosphate nodules are embedded in the clayey sand at a depth of 1.5–≥4 m. This result corroborates the interpretation from the inverted section.Profile 3 (Figure 8) shows an ordered arrange-ment of the geoelectric layers, although the lay-ers tend to dip slightly at an angle. The top soil has resistivity value in the range of 43–106 Wm, its horizontal extension being between 8 and 28 m. The underlying lithology is suggest-ed to be clayey based on its resistivity value (17–43 Wm), also occurring at the surface be-tween stations at distances of 3 and 8 m. The clayey sand layer has resistivity values ranging from ≤ 106 to ≥ 263 Wm. The phosphate-rich sequence is embedded within this layer, thus having resistivity value from 263 to ≥ 651 Wm. The phosphatic nodule is concentrated at pro-file distances of 40–46 m.The inverted section of Profile 4 (Figure 9) ex-hibits an ordered internal arrangement of the
geoelectric layer, and its resistivity value in-creases with depth. Three geoelectric layers are observed in the inverted section; these include the top soil, clayey soil and clayey sand. The top soil shows that material of low resistivity (14–25 Wm) is enclosed within a more resis-tive layer (25–33 Wm); it extends to an average depth of 2.6 m. The clayey soil has resistivity value between 33 and 59 Wm, and its thickness is ~1.2 m. The next layer underlying the clayey soil is depicted to be clayey sand, with its re-sistivity value varying from 59 to ≥ 103 Wm. This layer hosts the phosphate concentrate (78–≥103 Wm).The soil profile (Figure 10) of Pit 3 dug along Profile 4 shows two layers made up of clay and clayey sand. Phosphate nodules are embedded in the clayey sand at a depth of 3.5–≥5 m. This result agrees with the interpretation of the in-verted section in Figure 9.Figure 11 (Profile 5) shows chaotic distribution of resistivities when compared with the distri-bution in other profiles (1–4): it is characterised by decrease in resistivity values as the depth in-creases. The top soil is composed of moderate resistive material (40–≥80 Wm), with pockets of resistive material occurring at the surface. These pockets are referred to as the phosphate nodules. The phosphatic bed has resistivity be-tween 80 and >160 Wm occurring at stations at distances of 37–40 m. The clayey soil under-lying the top soil has resistivity value ranging from 10 to 20 Wm. The next layer is clayey sand having resistivity between 20 and >40 Wm.
Figure 11: Inverted model section of Profile line 5.

Sanuade O.A., Olaojo A.A, Akanji A.O., Oladunjoye M.A., Omolaiye G.E.
110
RMZ – M&G | 2018 | Vol. 65 | pp. 103–114
Profile 6 (Figure 12) shows the gradual tran-sition of one lithology into another as can be assumed from the changing resistivity values horizontally along the profile. The top soil is characterised by resistivity values in the range of 19–71 Wm. A resistive body is embedded with the clayey sand layer: this resistive body is suspected to be composed of nodules of phos-phate. The phosphatic nodules are concentrat-ed at stations at distances of 38–45 m in the top soil.The soil profile (Figure 13) of Pit 4 dug along Profile 6 reveals two layers made up of clay and clayey sand. Phosphate nodules are encoun-
tered in the clayey sand at depth of 1.5–≥5 m. This result agrees with the interpretation of the inverted section.
VES dataThe resistivity sounding curves of the five VES stations obtained from the study area have four layers, which are KH-type curves with r1 < r2 > r3 < r4 (Figure 14). The analysis and interpreta-tion of the VES curves and the geoelectric pa-rameters indicate that four layers are delineat-ed, including top soil, clay unit, clayey sand and clay. Each litho-unit varies in thickness from one point to another within the study area (Fig-ure 14A–E).
Geoelectric SectionsThe 2D view of the geoelectric parameters obtained from the VES data are presented as VES-derived geoelectric sections (Figures 15 and 16). The VES model resistivity values com-plement the inversion results of the 2D image by distinguishing four different layers.
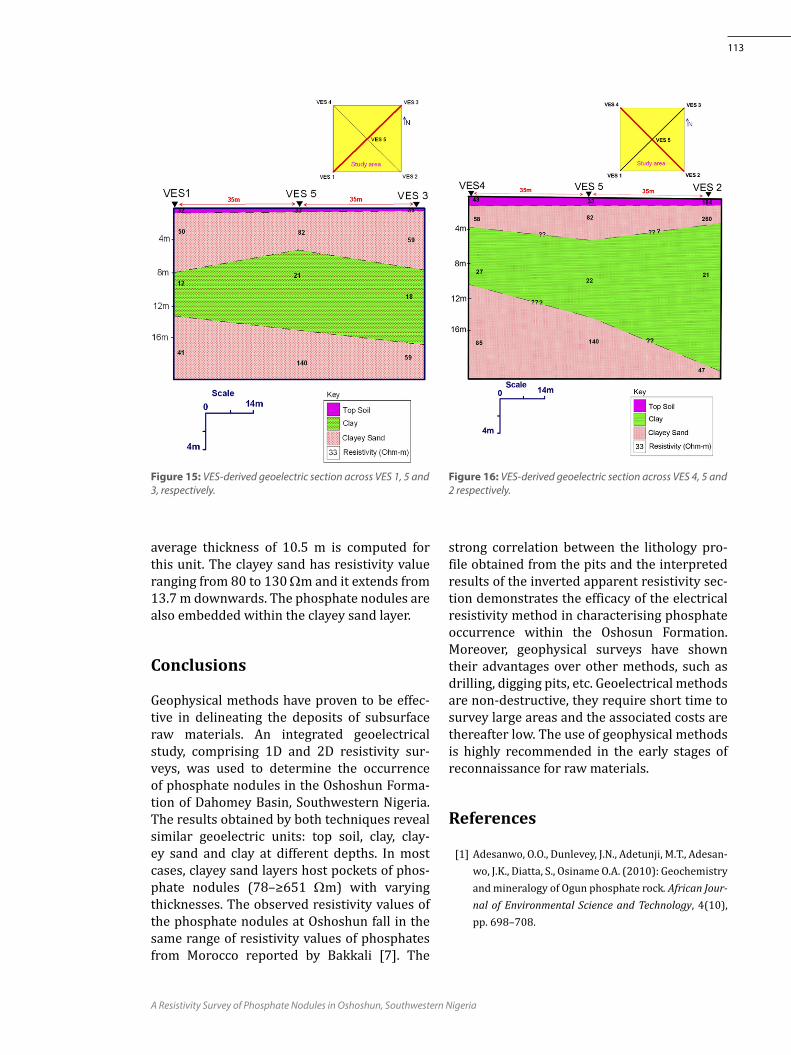
Geoelectric section 1Figure 15 is deduced from the joint layer pa-rameters of VES 1, 5 and 3. From the VES geoelectric section, the following layers are ob-tained: the top soil, clayey sand, clay and clayey sand. The top soil has resistivity value ranging from 62 to 67 Wm, with an average thickness of 0.93 m. The next layer underlying this unit is clayey sand, its thickness ranges from 3.9 to 7.1 m and the resistivity value of this unit varies
Figure 12: Inverted model section of Profile line 6.
Figure 13: Soil profile of Pit 4 (P4) dug along Profile 6.

A Resistivity Survey of Phosphate Nodules in Oshoshun, Southwestern Nigeria
111
Figure 14: Schlumberger layer model (A) VES 1; (B) VES 2; (C) VES 3 (all are representatives of KH-type curve: r1 < r2 > r3 < r4).
Sanuade O.A., Olaojo A.A, Akanji A.O., Oladunjoye M.A., Omolaiye G.E.
112
RMZ – M&G | 2018 | Vol. 65 | pp. 103–114
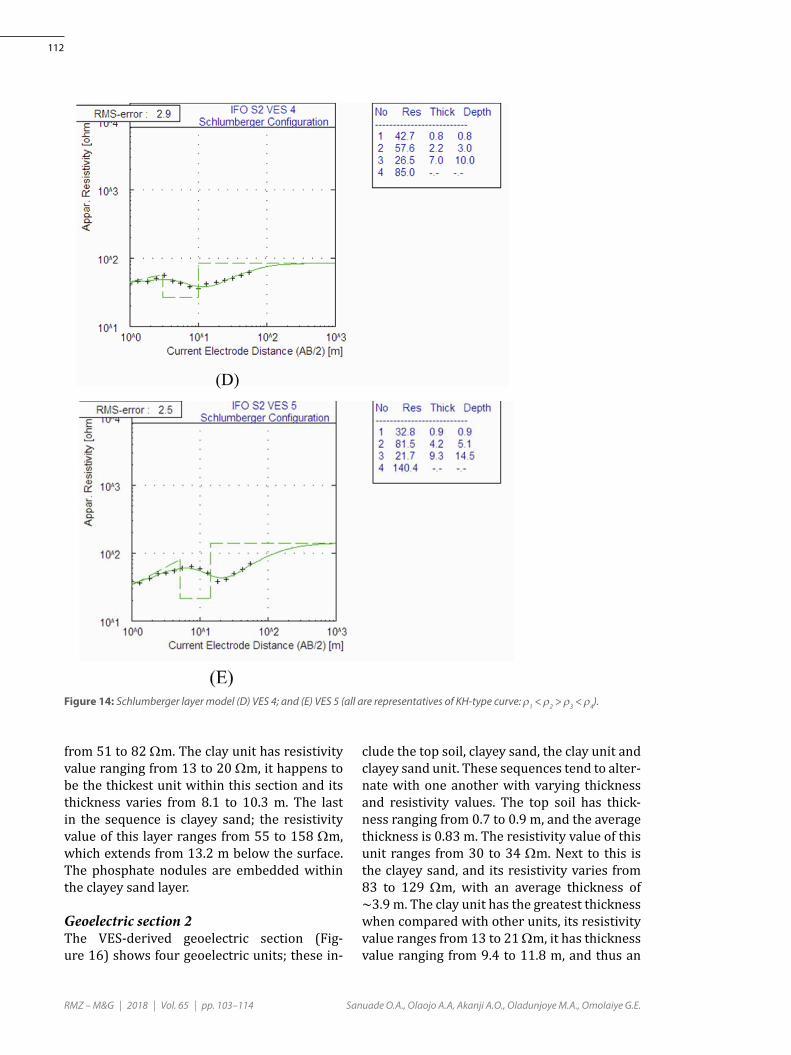
from 51 to 82 Wm. The clay unit has resistivity value ranging from 13 to 20 Wm, it happens to be the thickest unit within this section and its thickness varies from 8.1 to 10.3 m. The last in the sequence is clayey sand; the resistivity value of this layer ranges from 55 to 158 Wm, which extends from 13.2 m below the surface. The phosphate nodules are embedded within the clayey sand layer.
Geoelectric section 2The VES-derived geoelectric section (Fig-ure 16) shows four geoelectric units; these in-
clude the top soil, clayey sand, the clay unit and clayey sand unit. These sequences tend to alter-nate with one another with varying thickness and resistivity values. The top soil has thick-ness ranging from 0.7 to 0.9 m, and the average thickness is 0.83 m. The resistivity value of this unit ranges from 30 to 34 Wm. Next to this is the clayey sand, and its resistivity varies from 83 to 129 Wm, with an average thickness of ~3.9 m. The clay unit has the greatest thickness when compared with other units, its resistivity value ranges from 13 to 21 Wm, it has thickness value ranging from 9.4 to 11.8 m, and thus an
Figure 14: Schlumberger layer model (D) VES 4; and (E) VES 5 (all are representatives of KH-type curve: r1 < r2 > r3 < r4).
A Resistivity Survey of Phosphate Nodules in Oshoshun, Southwestern Nigeria
113
average thickness of 10.5 m is computed for this unit. The clayey sand has resistivity value ranging from 80 to 130 Wm and it extends from 13.7 m downwards. The phosphate nodules are also embedded within the clayey sand layer.
Conclusions
Geophysical methods have proven to be effec-tive in delineating the deposits of subsurface raw materials. An integrated geoelectrical study, comprising 1D and 2D resistivity sur-veys, was used to determine the occurrence of phosphate nodules in the Oshoshun Forma-tion of Dahomey Basin, Southwestern Nigeria. The results obtained by both techniques reveal similar geoelectric units: top soil, clay, clay-ey sand and clay at different depths. In most cases, clayey sand layers host pockets of phos-phate nodules (78–≥651 Wm) with varying thicknesses. The observed resistivity values of the phosphate nodules at Oshoshun fall in the same range of resistivity values of phosphates from Morocco reported by Bakkali [7]. The
strong correlation between the lithology pro-file obtained from the pits and the interpreted results of the inverted apparent resistivity sec-tion demonstrates the efficacy of the electrical resistivity method in characterising phosphate occurrence within the Oshosun Formation. Moreover, geophysical surveys have shown their advantages over other methods, such as drilling, digging pits, etc. Geoelectrical methods are non-destructive, they require short time to survey large areas and the associated costs are thereafter low. The use of geophysical methods is highly recommended in the early stages of reconnaissance for raw materials.
References
[1] Adesanwo, O.O., Dunlevey, J.N., Adetunji, M.T., Adesan-wo, J.K., Diatta, S., Osiname O.A. (2010): Geochemistry and mineralogy of Ogun phosphate rock. African Jour-nal of Environmental Science and Technology, 4(10), pp. 698–708.
Figure 15: VES-derived geoelectric section across VES 1, 5 and 3, respectively.
Figure 16: VES-derived geoelectric section across VES 4, 5 and 2 respectively.

Sanuade O.A., Olaojo A.A, Akanji A.O., Oladunjoye M.A., Omolaiye G.E.
114
RMZ – M&G | 2018 | Vol. 65 | pp. 103–114
[2] Newman, D.K., Banfield, J.F. (2002): Geomicrobiology: How molecular-scale interactions underpin biogeo-chemical systems. Science, 296, pp.1071–1077.
[3] Bolan, N.S., White, R.E. and Hedley, M.J. (1990): A re-view of the use of phosphate rocks as fertilizers for direct application in Australia and New Zealand. Aus-tralian Journal of Experimental Agriculture, 30, pp. 297–313.
[4] Chien, S.H., Sale, P.W.G., Hammond, L.L. (1990): Com-parison of the effectiveness of phosphorus fertilizer products. In: Phosphorus requirements for sustain-able agriculture in Asia and Oceania. Int. Rice Res. Inst., Manila, Philippines, p. 143–156.
[5] Akande, M.O., Aduayi, E.A., Sobulo, R.A., Olayinka A. (1998): Efficiency of Rock phosphate as fertilizer source in South – western Nigeria. Journal of Plant Nutrition, 2, pp. 1339–1353.
[6] Adediran, J.A., Oguntoyinbo, F.I., Omonode, R., Sobu-lo, R.A. (1998): Agronomic evaluation of phosphorus fertilizers developed from Sokoto rock phosphate in Nigeria. Communications in Soil Science and Plant Analysis, 29, pp. 2659–2673.
[7] Bakkali, S. (2006): A resistivity survey of phosphate deposits containing hardpan pockets in Oulad Ab-doun, Morocco. Geofísica Internacional, 45(1), pp. 73–82.
[8] Bakkali, S., Amrani, M. (2008): About the use of spa-tial interpolation methods to denoising Moroccan resistivity data phosphate “Disturbances” map. Acta Montanistica Slovaca Ročník, 13(2), pp. 216–222.
[9] Adegoke, O.S., Ajayi, T.R., Nehikhare, J.I., Rahaman, N.A. (1989): Fertiliser raw material situation in Nige-ria. Paper presented at the Workshop Organized by National Fertilizer Company, Durbar Hotel, Kaduna, June, 2–7.
[10] Akintokun, O.O., Adetunji, M.T., Akintokun, P.O. (2003): Phosphorus availability to soybean from an indigenous phosphate rock sample in soil from south – western Nigeria. Nutrient Cycling in Agroeco-systems, 65, pp. 35–42.
[11] Adelusi, A.O., Akinlalu, A.A., Nwachukwu, A.I. (2013): Integrated geophysical investigation for post-con-struction studies of buildings around School of Sci-ence area, Federal University of Technology, Akure, Southwestern, Nigeria. International Journal of Physi-cal Science, 8(15), pp. 657–669.
[12] Loke, M.H. (2000): Electrical imaging surveys for environmental and engineering studies: A practical guide to 2-D and 3-D surveys, 61 p.