Germination and Agronomic Traits of Phaseolus vulgaris L ...
Upload
khangminh22Category
view
1download
0
Citation: Shah, S.M.D.M.; Shabbir, G.;
Malik, S.I.; Raja, N.I.; Shah, Z.H.;
Rauf, M.; Zahrani, Y.A.; Alghabari, F.;
Alsamadany, H.; Shahzad, K.; et al.
Delineation of Physiological,
Agronomic and Genetic Responses of
Different Wheat Genotypes under
Drought Condition. Agronomy 2022,
12, 1056. https://doi.org/10.3390/
agronomy12051056
Academic Editors: Monica Boscaiu
and Ana Fita
Received: 25 March 2022
Accepted: 26 April 2022
Published: 28 April 2022
Publisher’s Note: MDPI stays neutral
with regard to jurisdictional claims in
published maps and institutional affil-
iations.
Copyright: © 2022 by the authors.
Licensee MDPI, Basel, Switzerland.
This article is an open access article
distributed under the terms and
conditions of the Creative Commons
Attribution (CC BY) license (https://
creativecommons.org/licenses/by/
4.0/).
agronomy
Article
Delineation of Physiological, Agronomic and GeneticResponses of Different Wheat Genotypes underDrought ConditionSyed Muhammad Dawood Murtaza Shah 1, Ghulam Shabbir 1 , Saad Imran Malik 1, Naveed Iqbal Raja 2,Zahid Hussain Shah 1,* , Muhammad Rauf 3 , Yahya Al Zahrani 4, Fahad Alghabari 5, Hameed Alsamadany 4 ,Khurram Shahzad 6,* and Seung Hwan Yang 7,*
1 Department of Plant Breeding and Genetics, Pir Mehr Ali Shah, Arid Agriculture University,Rawalpindi 46000, Pakistan; [email protected] (S.M.D.M.S.); [email protected] (G.S.);[email protected] (S.I.M.)
2 Deparment of Botany, Pir Mehr Ali Shah, Arid Agriculture University, Rawalpindi 46000, Pakistan;[email protected]
3 Vegetable Research Institute Lal Esan, Karor Lal Esan 31100, Pakistan; [email protected] Department of Biological Sciences, King Abdulaziz University, Jeddah 21589, Saudi Arabia;
[email protected] (Y.A.Z.); [email protected] (H.A.)5 Department of Arid Land Agriculture, King Abdulaziz University, Jeddah 21589, Saudi Arabia;
[email protected] Department of Plant Breeding and Genetics, The University of Haripur, Haripur 22620, Pakistan7 Department of Biotechnology, Chonnam National University, Yeosu 59626, Korea* Correspondence: [email protected] (Z.H.S.); [email protected] (K.S.);
[email protected] (S.H.Y.)
Abstract: Abioticstress such as drought is a potential threat posing a severe challenge to wheatproduction across the globe. The current study comparatively delineated the performance of elitePakistani bread wheat genotypes at physiological (chlorophyll, canopy temperature, cell membranepercentage stability and leaf relative water content), agronomic (plant height, tillers plant−1, flag leafarea, spike length, spikelets spike−1, grains spike−1, grain yield spike−1, thousand grain weight andplant biomass) and genetic (TaDREB1A, TaGROS-A, TaLEA3, TaHSFA1a, TaWRKY44 and TaEXPA2)levels. Atri-replicate experiment was conducted in a two factorial arrangement using RCBD, and datawere analyzed statistically using the computer-based programsStatistix8.1 and R-studio. In general,all wheat genotypes illustrated significant (p ≤ 0.05) alterations in physiological and agronomictraits under drought stress as compared to the control; however, this alteration was significantly(p ≤ 0.05) different among all genotypes owing to their varying genetic potential. Furthermore, thesegenotypes were evaluated for the extent of the association of physiological and agronomic traitsusing PCA, correlation and heatmap analysis, which proved statistically significant variation in thepaired association of traits among all genotypes during drought stress as compared to the control. Inaddition, based on statistical evaluations, the genotypes Pakistan-13, Shahkar-13, AAS-11, Chakwal-86, Chakwal-50 and AUR-09 were found to be tolerant, while genotypes Anmol-97, Chakwal-97,Bhakkar-02 and BWP-97 were comparatively susceptible. Furthermore, these screened genotypesshowed differential expression of drought-related genes, with relatively high expression in tolerantgenotypes compared to susceptible genotypes. The current study concluded that physiological,agronomic and molecular characteristics are significantly interconnected, and these associationsdetermine the end productivity of wheat genotypes during abiotic stress. Therefore, their integratedstudy can enhance the pace of wheat breeding for drought tolerance in the near future.
Keywords: drought; PCA; heatmap; correlation; gene expression
Agronomy 2022, 12, 1056. https://doi.org/10.3390/agronomy12051056 https://www.mdpi.com/journal/agronomy

Agronomy 2022, 12, 1056 2 of 16
1. Introduction
Wheat (Triticum aestivum L.) is an important cereal crop used as the main staple food inmany countries across the globe, but its yield is compromised because of many biotic andabiotic factors, among which drought is the most devastating constraint [1].Drought stressis a potential threat to crop production in arid and semi-arid regions of the world owingto its tendency to inhibit the development and growth of the plant [2]. In addition, thefrequency and severity of drought around the world have increased because of the varyingprecipitation and rising temperature caused by climate change [1]. Various studies havedemonstrated that climate change not only negatively affects the current worldwide foodproduction but will also have a more severe impact on future crop production [2–4]. A largearea of the world is severely affected by stresses imposed by multivariate environments,with drought being the most important one [5]. It necessitates the introduction of cropcultivars with a high degree of drought tolerance in cropping systems [1]. Abiotic stresses,particularly drought, disrupt the plant water content, leading to decreased membranefluidity [5]. Furthermore, continuous electrolyte leakage leads to cell death. Drought stresschanges the concentrations of various ions, such as K and Mg, which are essential to sustainvarious physiological attributes, including the chlorophyll content and photosynthesisrate [6]. Plants are equipped with natural processes that counter the detrimental effects ofstress at a molecular level. From this perspective, the varying expression of stress-associatedgenes is worthy of consideration, which marks the varying tendencies of genotypes toresist stress [7]. Drought stress perturbs physiological processes within plants, such as areduction in chlorophyll and enhanced canopy temperature (CT), which leads to a reductionin photosynthesis and other metabolic activities within plants [8]. In addition, droughtstress triggers the production of ROS, which also results in the deterioration of membraneintegrity, causing a reduction in the membrane stability index (MSI) and leaf relative watercontent (LRWC) [9].Efficient physiological processes trigger metabolic activities, leadingto high agronomic yield in terms of grain number, grain weight and plant biomass [8].Plants, like every biological system, have a built-in tendency to counter the effects ofabiotic stresses, including drought; however, they show resilience up to a certain extent [9].Wheat is an ideal system to unravel the mysterious dynamics of drought stress, whichtriggers the expression of various genes regulating signaling pathways in it [10]. Fromthisperspective, the regulation of characterized genes is an important indicator to mark agenotype as being tolerant or susceptible. For instance, the overexpression of ARGOS genesenhances drought tolerance in maize and wheat through the activation of an ethylene-dependent pathway [11]. Moreover, LEA proteins, belonging to the class of late-inducedstress-responsive genes, are activated in wheat during water deficit condition sand initiatevarious mechanisms that induce a state of stress tolerance [12]. Dehydration-responsiveelement binding (DREB) proteins also regulate some functional genes imparting stresstolerance [13]. Similarly, heat shock factors (Hsf) play a pivotal role in inducing thermaland drought stress tolerance in wheat due to their role as osmoprotectants [14]. Theoverexpression of genes from the WRKY family imparts tolerance to abiotic stresses owingto the activation of the antioxidant system and has been studied in model plant systemssuch asrice and Arabidopsis; however, there has been limited research in wheat owing toits large and complex genome [15]. The TaEXPA2 gene from the expansin family loosensplant cell walls and regulates the drought tolerance phenotype when it is overexpressed,whereas its down regulation imparts drought susceptibility in wheat [16]. Drought is amajor limiting constraint, particularly in arid zones of the world, and wheat is highlysusceptible to it [17]. Correspondingly, in Pakistan, 20 percent of wheat production area liesin rainfed regions where seasonal drought spellsare a major problem. Although variouswheat cultivars have been developed for drought tolerance in multivariate environments,their performance has been variable. In the current study, elite Pakistani drought-tolerantwheat genotypes were collected and reinvestigated for their performance at the molecular,physiological and agronomic levels. In order to screen out tolerant wheat genotypes in anenvironment with diverse conditions, it is important to highlight selection indicators at

Agronomy 2022, 12, 1056 3 of 16
physiological, agronomic and molecular levels. From this perspective, the current researchhypothesized that agronomic, physiological and molecular traits would respond differentlyto control and drought stress conditions, and their relative performance will provide apathway for future drought tolerance breeding programs.
2. Materials and Methods
Elite Pakistani drought-tolerant wheat genotypes (Table S1) collected from various re-search institutions of Pakistan were evaluated in a pot experiment in the research area of De-partment of Plant Breeding and Genetics, PMAS Arid Agriculture University, Rawalpindi,Pakistan. Atri-replicate experiment was conducted with an RCBD design using a two facto-rial arrangement, with genotype as one factor and drought treatment as the second factor.
2.1. Crop Husbandry and Treatment Imposition
In the pot experiment, six seeds were planted in each plastic pot of size 2 L, andoptimum practices such as hoeing and weeding were continued throughout the cropgrowing period. Physiological and morphological traits of all wheat genotypes wereexamined by arranging the pots in two different environments: control and moisture stress.At the seedling stage, thinning was performed, and three plants per pot were maintained.Under the ordinary situation, the control set of plants was retained in an open environment,while drought-stress-treated pots were kept under arain shelter, and at the pre-anthesisstage (95 ± 10 DAS), plants were exposed to a dry spell cycle. Pots of the control setswere watered normally on an optimum basis whenever required to maintain a normalwell-watered level. By withholding the water supply for about 10 to 15 days, droughtstress was induced until drought symptoms started to appear in the form of temporary leafrolling or wilting. When plants reached the pre-anthesis stage, the control set of pots waswatered normally, while for the stress pot arrangement, irrigation was intermitted. After10 to 15 days, plants in stress treatment pots were watered normally. To minimize the effectof positional errors, randomly placed pots in the glass house were repositioned on alternatedays until the plant attained physiological maturity.
2.2. Quantification of Physiological Traits
Canopy temperature (CT) was taken on sunny days with the help of infrared ther-mometer (Testo-845, Titisee-Neustadt, Germany). Chlorophyll content was measured byusing the SPAD-502 (Spectrum Technologies, Bridgend, UK).At three different points, datawere recorded on each leaf, and as the final reading for each leaf, their average was calcu-lated. RWC was calculated following the method used by Bannister [18] with the help offormula RWC = [(FW − DW)/(TW − DW) × 100, where FW = fresh weight; DW = dryweight; TW = total weight]. Moreover, cell membrane stability percentage (CMPS) of threerandomly selected leaf samples was calculated using the formula CMPS = [(1 − (T1/T2))/(1 − (C1/C2))} × 100, where T1 = stress sample conductance before autoclaving; T2 = stresssample conductance after autoclaving; C1 = control sample conductance before autoclaving;C2 = control sample conductance after autoclaving].
2.3. Quantification of Agronomic Parameters2.3.1. Growth Traits
Among growth traits, flag leaf area (FLA) was calculated using a scale by followingFarooq et al.’s [19] method. Likewise, plant height (PH) of five randomly selected plantswas calculated from shoot base to apex at the time of maturity and averaged. Furthermore,tillers plant−1 (TPP) were estimated from three to five randomly selected plants of allgenotypes, and mean values were obtained.
2.3.2. Yield Traits
Five spikes were selected from randomly tagged plants of all genotypes, and theirlength (SL) was measured by numeric scale and averaged. From the same number of
Agronomy 2022, 12, 1056 4 of 16
spikes, spikelets spike−1 (SPS) were counted and then averaged. Then, number of grainsspike−1 (GPS) was counted for each genotype and averaged afterward. The thousandgrain weight (TGW) of each wheat genotype was measured by electronic weighing balance(Bioevopeak, Jinan, China). Grain yield spike−1 (GYP) was recorded from all fertile spikesof five randomly tagged plants of all genotypes and then converted into final yield toobtainyield in grams plant−1. For plant biomass (PBM), at the time of harvesting, threerandomly selected plants were weighed separately with the help of an electric balance(Bioevopeak, China) before threshing toobtain their biological yield in grams, and theiraverage was calculated.
2.4. Statistical Analysis
The collected data were analyzed statistically using computer-based programs Statis-tix8.1 (McGraw-Hill 2008) and R-studio RStudio version 1.3.959 (RStudio Team 2020)following the procedure used by Alghabari et al. [20].
2.5. Gene Expression Analysis
For expression studies of drought-related genes (TaDREB1A, TaGROS-A, TaLEA3,TaHSFA1a, TaWRKY44 and TaEXPA2), RNA was extracted from selected tolerant and sus-ceptible wheat genotypes (based upon physiological and agronomic evaluation) with thehelp of Qiagen RNeasy kit (Qiagen, German Town, Vail, CO, USA) according to a set proto-col used by Li et al. [21]. Subsequently, cDNA was prepared by following the methodologyof Ahmed et al. [11]. For this purpose, a total of 2 µg of RNA was used in accordance withthe manufacturer’s instructions. Afterward, qRT-PCR analysis was conducted. Addition-ally, the expression of genes was normalized with the help of the TaActin1-expressing gene.The primers used in the expression study are mentioned in Table S2.
3. Results3.1. Physiological Parameters
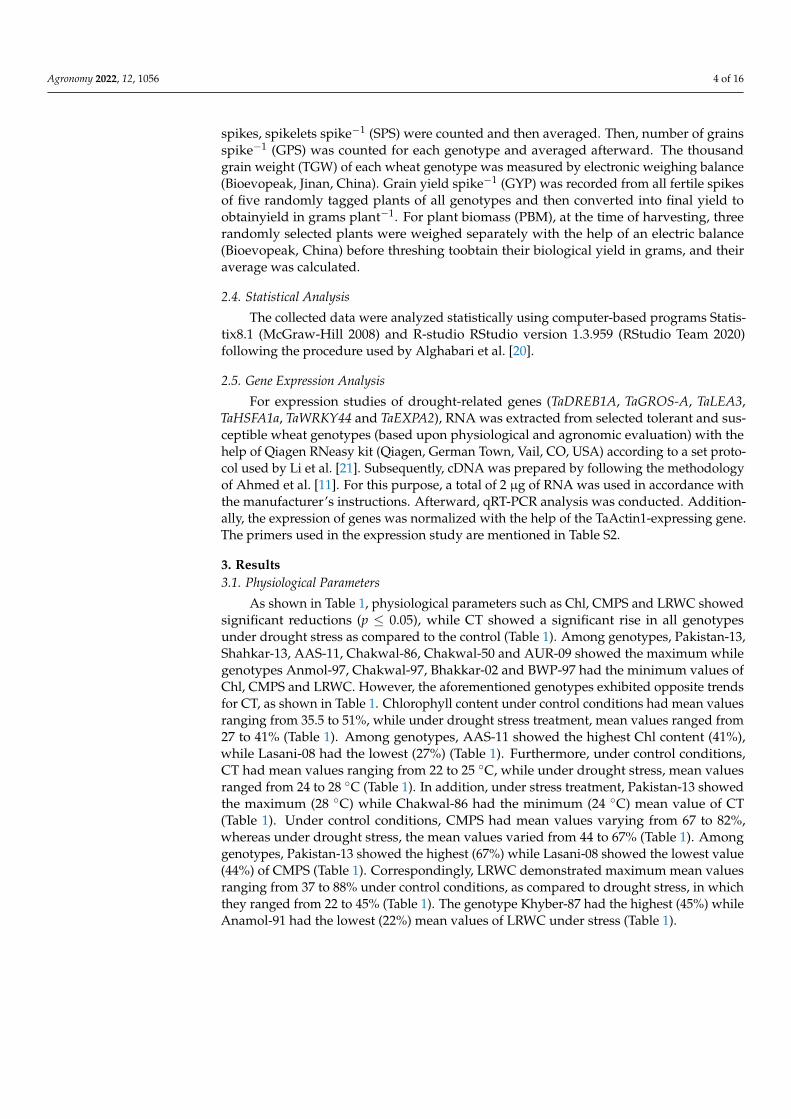
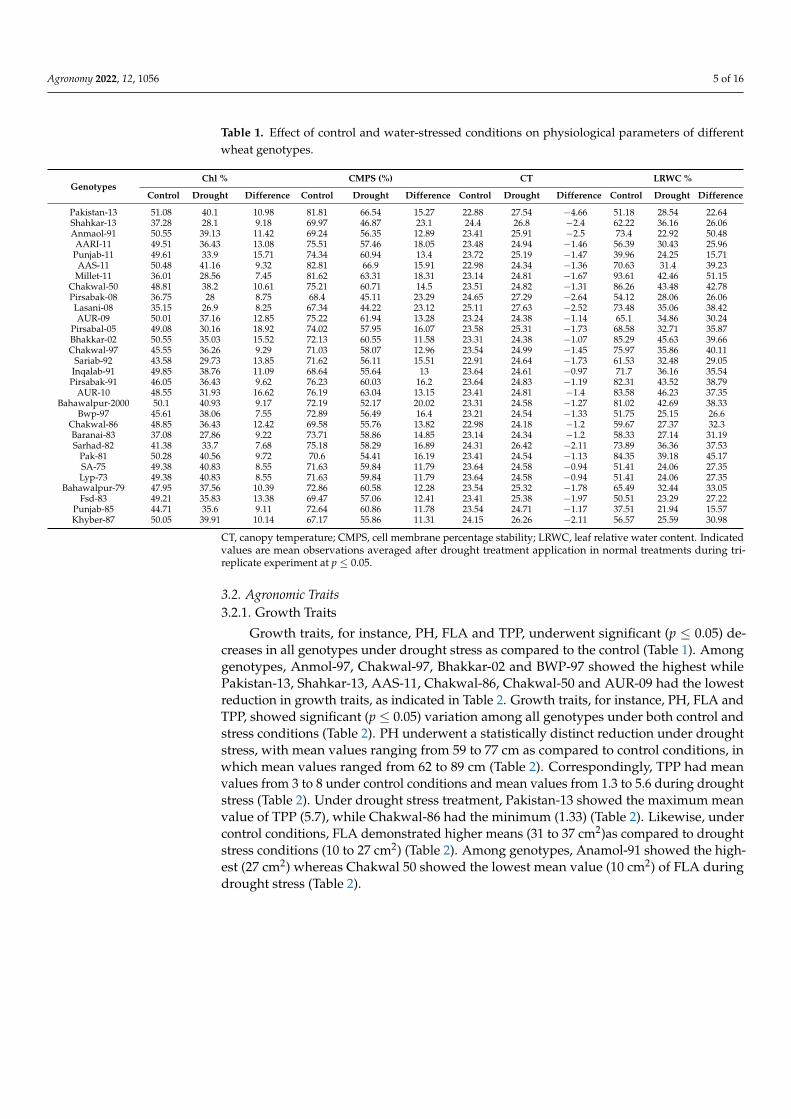
As shown in Table 1, physiological parameters such as Chl, CMPS and LRWC showedsignificant reductions (p ≤ 0.05), while CT showed a significant rise in all genotypesunder drought stress as compared to the control (Table 1). Among genotypes, Pakistan-13,Shahkar-13, AAS-11, Chakwal-86, Chakwal-50 and AUR-09 showed the maximum whilegenotypes Anmol-97, Chakwal-97, Bhakkar-02 and BWP-97 had the minimum values ofChl, CMPS and LRWC. However, the aforementioned genotypes exhibited opposite trendsfor CT, as shown in Table 1. Chlorophyll content under control conditions had mean valuesranging from 35.5 to 51%, while under drought stress treatment, mean values ranged from27 to 41% (Table 1). Among genotypes, AAS-11 showed the highest Chl content (41%),while Lasani-08 had the lowest (27%) (Table 1). Furthermore, under control conditions,CT had mean values ranging from 22 to 25 ◦C, while under drought stress, mean valuesranged from 24 to 28 ◦C (Table 1). In addition, under stress treatment, Pakistan-13 showedthe maximum (28 ◦C) while Chakwal-86 had the minimum (24 ◦C) mean value of CT(Table 1). Under control conditions, CMPS had mean values varying from 67 to 82%,whereas under drought stress, the mean values varied from 44 to 67% (Table 1). Amonggenotypes, Pakistan-13 showed the highest (67%) while Lasani-08 showed the lowest value(44%) of CMPS (Table 1). Correspondingly, LRWC demonstrated maximum mean valuesranging from 37 to 88% under control conditions, as compared to drought stress, in whichthey ranged from 22 to 45% (Table 1). The genotype Khyber-87 had the highest (45%) whileAnamol-91 had the lowest (22%) mean values of LRWC under stress (Table 1).
Agronomy 2022, 12, 1056 5 of 16
Table 1. Effect of control and water-stressed conditions on physiological parameters of differentwheat genotypes.
GenotypesChl % CMPS (%) CT LRWC %
Control Drought Difference Control Drought Difference Control Drought Difference Control Drought Difference
Pakistan-13 51.08 40.1 10.98 81.81 66.54 15.27 22.88 27.54 −4.66 51.18 28.54 22.64Shahkar-13 37.28 28.1 9.18 69.97 46.87 23.1 24.4 26.8 −2.4 62.22 36.16 26.06Anmaol-91 50.55 39.13 11.42 69.24 56.35 12.89 23.41 25.91 −2.5 73.4 22.92 50.48
AARI-11 49.51 36.43 13.08 75.51 57.46 18.05 23.48 24.94 −1.46 56.39 30.43 25.96Punjab-11 49.61 33.9 15.71 74.34 60.94 13.4 23.72 25.19 −1.47 39.96 24.25 15.71AAS-11 50.48 41.16 9.32 82.81 66.9 15.91 22.98 24.34 −1.36 70.63 31.4 39.23
Millet-11 36.01 28.56 7.45 81.62 63.31 18.31 23.14 24.81 −1.67 93.61 42.46 51.15Chakwal-50 48.81 38.2 10.61 75.21 60.71 14.5 23.51 24.82 −1.31 86.26 43.48 42.78Pirsabak-08 36.75 28 8.75 68.4 45.11 23.29 24.65 27.29 −2.64 54.12 28.06 26.06Lasani-08 35.15 26.9 8.25 67.34 44.22 23.12 25.11 27.63 −2.52 73.48 35.06 38.42AUR-09 50.01 37.16 12.85 75.22 61.94 13.28 23.24 24.38 −1.14 65.1 34.86 30.24
Pirsabal-05 49.08 30.16 18.92 74.02 57.95 16.07 23.58 25.31 −1.73 68.58 32.71 35.87Bhakkar-02 50.55 35.03 15.52 72.13 60.55 11.58 23.31 24.38 −1.07 85.29 45.63 39.66Chakwal-97 45.55 36.26 9.29 71.03 58.07 12.96 23.54 24.99 −1.45 75.97 35.86 40.11
Sariab-92 43.58 29.73 13.85 71.62 56.11 15.51 22.91 24.64 −1.73 61.53 32.48 29.05Inqalab-91 49.85 38.76 11.09 68.64 55.64 13 23.64 24.61 −0.97 71.7 36.16 35.54Pirsabak-91 46.05 36.43 9.62 76.23 60.03 16.2 23.64 24.83 −1.19 82.31 43.52 38.79
AUR-10 48.55 31.93 16.62 76.19 63.04 13.15 23.41 24.81 −1.4 83.58 46.23 37.35Bahawalpur-2000 50.1 40.93 9.17 72.19 52.17 20.02 23.31 24.58 −1.27 81.02 42.69 38.33
Bwp-97 45.61 38.06 7.55 72.89 56.49 16.4 23.21 24.54 −1.33 51.75 25.15 26.6Chakwal-86 48.85 36.43 12.42 69.58 55.76 13.82 22.98 24.18 −1.2 59.67 27.37 32.3Baranai-83 37.08 27.86 9.22 73.71 58.86 14.85 23.14 24.34 −1.2 58.33 27.14 31.19Sarhad-82 41.38 33.7 7.68 75.18 58.29 16.89 24.31 26.42 −2.11 73.89 36.36 37.53
Pak-81 50.28 40.56 9.72 70.6 54.41 16.19 23.41 24.54 −1.13 84.35 39.18 45.17SA-75 49.38 40.83 8.55 71.63 59.84 11.79 23.64 24.58 −0.94 51.41 24.06 27.35Lyp-73 49.38 40.83 8.55 71.63 59.84 11.79 23.64 24.58 −0.94 51.41 24.06 27.35
Bahawalpur-79 47.95 37.56 10.39 72.86 60.58 12.28 23.54 25.32 −1.78 65.49 32.44 33.05Fsd-83 49.21 35.83 13.38 69.47 57.06 12.41 23.41 25.38 −1.97 50.51 23.29 27.22
Punjab-85 44.71 35.6 9.11 72.64 60.86 11.78 23.54 24.71 −1.17 37.51 21.94 15.57Khyber-87 50.05 39.91 10.14 67.17 55.86 11.31 24.15 26.26 −2.11 56.57 25.59 30.98
CT, canopy temperature; CMPS, cell membrane percentage stability; LRWC, leaf relative water content. Indicatedvalues are mean observations averaged after drought treatment application in normal treatments during tri-replicate experiment at p ≤ 0.05.
3.2. Agronomic Traits3.2.1. Growth Traits
Growth traits, for instance, PH, FLA and TPP, underwent significant (p ≤ 0.05) de-creases in all genotypes under drought stress as compared to the control (Table 1). Amonggenotypes, Anmol-97, Chakwal-97, Bhakkar-02 and BWP-97 showed the highest whilePakistan-13, Shahkar-13, AAS-11, Chakwal-86, Chakwal-50 and AUR-09 had the lowestreduction in growth traits, as indicated in Table 2. Growth traits, for instance, PH, FLA andTPP, showed significant (p ≤ 0.05) variation among all genotypes under both control andstress conditions (Table 2). PH underwent a statistically distinct reduction under droughtstress, with mean values ranging from 59 to 77 cm as compared to control conditions, inwhich mean values ranged from 62 to 89 cm (Table 2). Correspondingly, TPP had meanvalues from 3 to 8 under control conditions and mean values from 1.3 to 5.6 during droughtstress (Table 2). Under drought stress treatment, Pakistan-13 showed the maximum meanvalue of TPP (5.7), while Chakwal-86 had the minimum (1.33) (Table 2). Likewise, undercontrol conditions, FLA demonstrated higher means (31 to 37 cm2)as compared to droughtstress conditions (10 to 27 cm2) (Table 2). Among genotypes, Anamol-91 showed the high-est (27 cm2) whereas Chakwal 50 showed the lowest mean value (10 cm2) of FLA duringdrought stress (Table 2).

Agronomy 2022, 12, 1056 6 of 16
Table 2. Effect of control and water-stressed conditions on growth traits of different wheat genotypes.
GenotypesFLA (cm2) TPP PH (cm)
Control Drought Difference Control Drought Difference Control Drought Difference
Pakistan-13 36.98 26.82 10.16 7.86 5.76 2.10 83.33 77.66 5.67Shahkar-13 30.88 20.77 10.11 6.45 4.33 2.12 65.11 61.66 3.45Anmaol-91 36.98 27.04 9.94 7.78 5.45 2.33 72.31 67.67 4.64
AARI-11 36.49 27.02 9.47 7.61 5.66 1.95 75.12 68.33 6.79Punjab-11 36.66 14.43 22.23 4.72 2.66 2.06 64.35 60.33 4.02AAS-11 36.73 20.83 15.90 6.61 4.66 1.95 82.38 76.66 5.72
Millet-11 29.58 23.31 6.27 6.63 4.66 1.97 77.33 73.56 3.77Chakwal-50 36.16 10.32 25.84 5.67 3.45 2.22 62.66 59.45 3.21Pirsabak-08 30.70 22.83 7.87 5.20 3.33 1.87 68.30 61.33 6.97Lasani-08 30.13 32.35 −2.22 6.67 4.66 2.01 72.45 68.56 3.89AUR-09 36.63 24.84 11.79 5.59 3.66 1.93 81.39 77.34 4.05
Pirsabal-05 36.33 27.67 8.66 6.60 4.66 1.94 72.31 69.33 2.98Bhakkar-02 36.93 26.57 10.36 6.32 4.33 1.99 89.66 81.27 8.39Chakwal-97 34.54 25.05 9.49 7.29 5.33 1.96 71.29 65.33 5.96
Sariab-92 33.24 16.03 17.21 4.64 2.66 1.98 67.21 62.33 4.88Inqalab-91 36.74 11.79 24.95 4.48 2.45 2.03 77.48 70.45 7.03
Pirsabak-91 34.84 21.77 13.07 7.62 5.66 1.96 73.36 68.66 4.70AUR-10 35.98 18.57 17.41 6.30 4.33 1.97 78.51 73.33 5.18
Bahawalpur-2000 36.74 16.93 19.81 4.51 2.56 1.95 79.22 74.33 4.89Bwp-97 34.41 21.50 12.91 5.45 3.78 1.67 78.33 75.67 2.66
Chakwal-86 35.91 24.43 11.48 3.45 1.33 2.12 78.45 72.33 6.12Baranai-83 30.11 26.50 3.61 4.58 2.66 1.92 78.78 72.56 6.22Sarhad-82 32.84 21.73 11.11 5.60 3.66 1.94 78.25 69.33 8.92
Pak-81 36.84 22.90 13.94 6.31 4.33 1.98 80.69 73.33 7.36SA-75 36.51 19.50 17.01 6.38 4.33 2.05 80.66 76.56 4.10Lyp-73 35.74 11.58 24.16 4.65 2.66 1.99 80.33 75.34 4.99
Bahawalpur-79 36.31 13.50 22.81 4.69 2.66 2.03 79.56 73.33 6.23Fsd-83 34.13 25.13 9.00 6.35 4.33 2.02 80.66 75.39 5.27
Punjab-85 37.10 21.73 15.37 5.67 3.66 2.01 75.33 70.23 5.10Khyber-87 33.87 20.53 13.34 4.63 2.66 1.97 72.66 65.45 7.21
FLA, flag leaf area (cm2); TPP, tillers plant−1; PH, plant height (cm). Indicated values are mean observations madeas plants attained physical maturity after application of drought stress as compared to control treatment duringtri-replicate experiment at p ≤ 0.05.
3.2.2. Yield Traits
All yield traits, including SL, SPS, GPS, GYP, TGW and PBM, showed statistically sig-nificant (p ≤ 0.05) differences among all genotypes under both stress and normal conditions(Table 3). Under control conditions, SL ranged from 9 to 11.5 cm, while under droughtstress, SL ranged from 8 to 10 cm. Under drought stress, the cultivar SA-75 showed thehighest (10 cm) whereas Pirsabak-05 and Inqalab-91 showed the lowest (8.5 cm) meanvalues for SL (Table 3). Moreover, GPS under control condition shad mean values rangingfrom 32 to 51, while under drought stress treatment, mean values varied from 25 to 50(Table 3). Among genotypes, AARI-11 had the maximum (50) while Punjab-11 had theminimum (27) GPS under drought stress (Table 3). Additionally, SPS had mean valuesin the range of 13 to 18 in the control treatment and mean values in the range of 11 to 16during drought stress application (Table 3). Among genotypes, Fsd-83 and Pak-81 hadthe maximum (15.6) while Chakwal-97 had the minimum (11) SPS with the application ofdrought stress (Table 3). In addition, under control conditions, the mean values of GYPvaried from 4 to 10.5 g, whereas under drought treatment, mean values varied from 1.3 to8g (Table 3). Under drought stress treatment, the cultivar Pakistan-13 showed the highest(8g) while the cultivar Inqalab-91 showed the lowest (1.26) GYP (Table 3).On the other hand,TGW demonstrated mean values ranging from 29 to 38 g under normal conditions, andmean values ranged from 25 to 34 g under stress conditions (Table 3). Among genotypes,Shakkar-13 had the highest (33.9 g) while Bhakkar-02 showed the lowest (25g) TGW withthe application of drought stress (Table 3). Furthermore, PBM had mean values rangingfrom 43 to 58 g under control application conditions, and mean values ranged from 37to 52 g during drought stress treatment (Table 3). Under drought stress treatment, the

Agronomy 2022, 12, 1056 7 of 16
genotype Khyber-87 showed the maximum (52 g) whereas the genotype Punjab-11 showedthe minimum (37g) mean value of PBM (Table 3).
3.3. Correlation, PCA and Heatmap Analysis
The paired analysis of physiological, growth and yield parameters revealed significantcorrelations among traits; however, all traits that showed a largeextent of associationunder stress conditions wereslightly different (Figure 1). The physiological attribute Chlshowed significant positive associations with CT, CMPS, PH and SL under drought stressas compared to the control (Figure 1). Furthermore, CT manifested positive correlationswith CMPS and SL under both drought and normal treatments (Figure 1). Among growthtraits, FLA had significant paired associations with CMPS, PH and SL that were statisticallymore distinct under stress as compared to the control (Figure 1).On the other hand, bothCMPS and LRWC revealed statistically significant positive paired associations with TPPand GYP under both control and stress conditions that were comparatively equal in extent(Figure 1). Additionally, yield traits such as SL, GPS, GYP and TGW also had significantpositive paired correlations among them; however, their association was stronger undercontrol conditions as compared to stress (Figure 1). Moreover, the PCA scatter plot revealedmore dispersion of traits from the origin under conditions of drought stress as comparedto the control (Figure 2). In general, all traits, with the exception of CT, remained inclose proximity under control conditions and manifested maximum parallelism in theirassociated expression. Furthermore, PCA illustrated that the extent of the association oftraits varied under drought as compared to the control, which means that both drought andcontrol conditions have different influences on the pairing of traits. The manifestation ofall traits under study was different in all wheat genotypes; therefore, from the perspectiveof traits, all differentially expressedgenotypes were segregated and categorized into eachquadrant of the biplot (Figure 3). Furthermore, in the context of the differential extent oftrait association, a heatmap dendrogram categorizing all genotypes into six sub-clusters isindicated in Figure 4.
Table 3. Effect of control and water-stressed conditions on yield traits (spike length, spikeletsspike−1, grains per spike, grain yield spike−1, thousand grain weight and plant biomass) of differentwheat genotypes.
GenotypesSL (cm) SPS GPS
Control Drought Difference Control Drought Difference Control Drought Difference
Pakistan-13 10.45 7.88 2.57 38.06 33.85 4.21 56.91 50.16 6.75Shahkar-13 8.08 5.43 2.65 38.2 33.95 4.25 54.88 48.51 6.37Anmaol-91 9.01 6.36 2.65 31.96 27.67 4.29 52.74 46.06 6.68
AARI-11 9.48 6.83 2.65 35.5 31.35 4.15 51.99 45.23 6.76Punjab-11 7.15 4.56 2.59 36.56 32.3 4.26 42.77 36.54 6.23AAS-11 9.45 6.84 2.61 37.71 33.35 4.36 49.98 43.74 6.24
Millet-11 8.78 6.15 2.63 37.1 32.85 4.25 47.84 41 6.84Chakwal-50 8.31 5.66 2.65 37.63 33.45 4.18 52.34 46.27 6.07Pirsabak-08 8.41 5.76 2.65 34.82 30.45 4.37 50.91 44.56 6.35Lasani-08 9.28 6.63 2.65 34.56 30.35 4.21 57.98 51.57 6.41AUR-09 8.85 6.24 2.61 36.96 32.55 4.41 58.42 52.08 6.34
Pirsabal-05 8.48 5.83 2.65 36.26 32.74 3.52 50.98 44.52 6.46Bhakkar-02 5.15 2.53 2.62 28.96 24.77 4.19 57.9 52.44 5.46Chakwal-97 6.75 3.86 2.89 28.57 24.96 3.61 49.25 43.43 5.82
Sariab-92 6.67 3.76 2.91 35.36 31.76 3.6 57.46 51.26 6.2Inqalab-91 4.15 1.26 2.89 34.38 30.76 3.62 49.13 43.21 5.92
Pirsabak-91 7.56 4.66 2.9 35.89 31.46 4.43 48.2 42.35 5.85AUR-10 8.13 5.26 2.87 33.56 29.91 3.65 48.66 42.3 6.36
Bahawalpur-2000 7.66 4.83 2.83 34.35 30.66 3.69 55.5 49.76 5.74Bwp-97 7.31 4.53 2.78 31.16 27.56 3.6 49.45 43.22 6.23
Chakwal-86 7.03 4.28 2.75 37.25 33.66 3.59 57.95 51.78 6.17Baranai-83 5.65 2.76 2.89 31.74 28.16 3.58 49.64 43.29 6.35

Agronomy 2022, 12, 1056 8 of 16
Table 3. Cont.
GenotypesSL (cm) SPS GPS
Control Drought Difference Control Drought Difference Control Drought Difference
Sarhad-82 8.52 5.73 2.79 35.44 31.86 3.58 47.45 41.27 6.18Pak-81 8.78 6.03 2.75 33.64 30.06 3.58 54.93 48.76 6.17SA-75 7.03 4.25 2.78 34.56 30.96 3.6 53.34 47.22 6.12Lyp-73 6.63 3.81 2.82 35.95 32.36 3.59 58.9 52.71 6.19
Bahawalpur-79 6.5 3.16 3.34 35.14 31.56 3.58 56.78 50.79 5.99Fsd-83 8.03 5.25 2.78 33.23 29.66 3.57 53.54 47.16 6.38
Punjab-85 6.76 3.86 2.9 31.78 28.16 3.62 49.4 43.21 6.19Khyber-87 8.93 6.23 2.7 35.95 32.36 3.59 58.24 52.28 5.96
GenotypesGYP (g) TGW (g) PBM (g)
Control Drought Difference Control Drought Difference Control Drought Difference
Pakistan-13 10.45 7.88 2.57 38.06 33.85 4.21 56.91 50.16 6.75Shahkar-13 8.08 5.43 2.65 38.2 33.95 4.25 54.88 48.51 6.37Anmaol-91 9.01 6.36 2.65 31.96 27.67 4.29 52.74 46.06 6.68
AARI-11 9.48 6.83 2.65 35.5 31.35 4.15 51.99 45.23 6.76Punjab-11 7.15 4.56 2.59 36.56 32.3 4.26 42.77 36.54 6.23AAS-11 9.45 6.84 2.61 37.71 33.35 4.36 49.98 43.74 6.24
Millet-11 8.78 6.15 2.63 37.1 32.85 4.25 47.84 41 6.84Chakwal-50 8.31 5.66 2.65 37.63 33.45 4.18 52.34 46.27 6.07Pirsabak-08 8.41 5.76 2.65 34.82 30.45 4.37 50.91 44.56 6.35Lasani-08 9.28 6.63 2.65 34.56 30.35 4.21 57.98 51.57 6.41AUR-09 8.85 6.24 2.61 36.96 32.55 4.41 58.42 52.08 6.34
Pirsabal-05 8.48 5.83 2.65 36.26 32.74 3.52 50.98 44.52 6.46Bhakkar-02 5.15 2.53 2.62 28.96 24.77 4.19 57.9 52.44 5.46Chakwal-97 6.75 3.86 2.89 28.57 24.96 3.61 49.25 43.43 5.82
Sariab-92 6.67 3.76 2.91 35.36 31.76 3.6 57.46 51.26 6.2Inqalab-91 4.15 1.26 2.89 34.38 30.76 3.62 49.13 43.21 5.92
Pirsabak-91 7.56 4.66 2.9 35.89 31.46 4.43 48.2 42.35 5.85AUR-10 8.13 5.26 2.87 33.56 29.91 3.65 48.66 42.3 6.36
Bahawalpur-2000 7.66 4.83 2.83 34.35 30.66 3.69 55.5 49.76 5.74Bwp-97 7.31 4.53 2.78 31.16 27.56 3.6 49.45 43.22 6.23
Chakwal-86 7.03 4.28 2.75 37.25 33.66 3.59 57.95 51.78 6.17Baranai-83 5.65 2.76 2.89 31.74 28.16 3.58 49.64 43.29 6.35Sarhad-82 8.52 5.73 2.79 35.44 31.86 3.58 47.45 41.27 6.18
Pak-81 8.78 6.03 2.75 33.64 30.06 3.58 54.93 48.76 6.17SA-75 7.03 4.25 2.78 34.56 30.96 3.6 53.34 47.22 6.12Lyp-73 6.63 3.81 2.82 35.95 32.36 3.59 58.9 52.71 6.19
Bahawalpur-79 6.5 3.16 3.34 35.14 31.56 3.58 56.78 50.79 5.99Fsd-83 8.03 5.25 2.78 33.23 29.66 3.57 53.54 47.16 6.38
Punjab-85 6.76 3.86 2.9 31.78 28.16 3.62 49.4 43.21 6.19Khyber-87 8.93 6.23 2.7 35.95 32.36 3.59 58.24 52.28 5.96
SL, spike length (cm); SPS, spikelets spike−1; GPS, grains spike−1. Indicated values are mean observations madeas plants attained maturity after application of drought stress as compared to control treatment during tri-replicateexperiment at p ≤ 0.05. GYP, grain yield spike−1 (g); TGW, thousand grain weight (g); PBM, plant biomass (g).Indicated values are mean observations made as plants attained maturity after application of drought stress ascompared to control treatment during tri-replicate experiment at p ≤ 0.05.

Agronomy 2022, 12, 1056 9 of 16
Agronomy 2022, 12, x FOR PEER REVIEW 10 of 18
Figure 1. Effect of control and water stress conditions on the significance of association of physiological, growth and yield parameters of different wheat genotypes. Chl, chlorophyll; CT, canopy temperature; CMPS, cell membrane percentage stability; LRWC, leaf relative water content; FLA, flag leaf area; PH, plant height; TPP, tillers plant−1; SL, spike length; SPS, spikelets spike−1; GPS, grains spike−1; GYP, grain yield spike−1; TGW, thousand grain weight; PBM, plant biomass. *** = Significant at p ≤ 0.001; ** = Significant at p ≤ 0.01; * = Significant at p ≤ 0.05.
Figure 1. Effect of control and water stress conditions on the significance of association of physiological, growth and yield parameters of different wheat genotypes.Chl, chlorophyll; CT, canopy temperature; CMPS, cell membrane percentage stability; LRWC, leaf relative water content; FLA, flag leaf area; PH, plant height;TPP, tillers plant−1; SL, spike length; SPS, spikelets spike−1; GPS, grains spike−1; GYP, grain yield spike−1; TGW, thousand grain weight; PBM, plant biomass.*** = Significant at p ≤ 0.001; ** = Significant at p ≤ 0.01; * = Significant at p ≤ 0.05.

Agronomy 2022, 12, 1056 10 of 16
Agronomy 2022, 12, x FOR PEER REVIEW 11 of 18
Figure 2. PCA scatter diagram illustrating the extent of similarity and dissimilarity in the expression of physiological, growth and yield traits of wheat genotypes under control and stress treatment conditions. Chl, chlorophyll; CT, canopy temperature; CMPS, cell membrane percentage stability; LRWC, leaf relative water content; FLA, flag leaf area; PH, plant height; TPP, tillersplant−1; SL, spike length; SPS, spikelets spike−1; GPS, grains spike−1; GYP, grain yield spike−1; TGW, thousand grain weight; PBM, plant biomass.
Figure 2. PCA scatter diagram illustrating the extent of similarity and dissimilarity in the expressionof physiological, growth and yield traits of wheat genotypes under control and stress treatmentconditions. Chl, chlorophyll; CT, canopy temperature; CMPS, cell membrane percentage stability;LRWC, leaf relative water content; FLA, flag leaf area; PH, plant height; TPP, tillersplant−1; SL, spikelength; SPS, spikelets spike−1; GPS, grains spike−1; GYP, grain yield spike−1; TGW, thousand grainweight; PBM, plant biomass.

Agronomy 2022, 12, 1056 11 of 16Agronomy 2022, 12, x FOR PEER REVIEW 12 of 18
Figure 3. Biplot scattering genotypes into different quadrants based on the extent of trait association. Chl, chlorophyll; CT, canopy temperature; CMPS, cell membrane percentage stability; LRWC, leaf relative water content; FLA, flag leaf area; PH, plant height; TPP, tillers plant−1; SL, spike length; SPS, spikelet spike−1; GPS, grains spike−1; GYP, grain yield spike−1; TGW, thousand grain weight; PBM, plant biomass.
CC
CT
LA
LMSI
LRWC
PH
TNSLSPS
GPS
GYTGW
BM
Pakistan-13
Shahkar-13
Anmaol-91
AARI-11
Punjab-11
AAS-11
Millet-11
Chakwal-50
Pirsabak-08
Lasani-08
AUR-09
Pirsabal-05
Bhakkar-02
Chakwal-97
Sariab-92
Inqalab-91
Pirsabak-91
AUR-10
Bahawalpur-2000
Bwp-97
Chakwal-86
Baranai-83
Sarhad-82
Pak-81SA-75 Lyp-73Bahawalpur-79
Fsd-83
Punjab-85
Khyber-87
-20
-15
-10
-5
0
5
10
15
20
-30 -25 -20 -15 -10 -5 0 5 10 15 20 25
F2 (2
0.57
%)
F1 (42.77 %)
Biplot (axes F1 and F2: 63.35 %)
Active variables Active observations
Figure 3. Biplot scattering genotypes into different quadrants based on the extent of trait association.Chl, chlorophyll; CT, canopy temperature; CMPS, cell membrane percentage stability; LRWC, leafrelative water content; FLA, flag leaf area; PH, plant height; TPP, tillers plant−1; SL, spike length; SPS,spikelet spike−1; GPS, grains spike−1; GYP, grain yield spike−1; TGW, thousand grain weight; PBM,plant biomass.

Agronomy 2022, 12, 1056 12 of 16Agronomy 2022, 12, x FOR PEER REVIEW 13 of 18
Figure 4. Heatmap dendrogram dividing wheat genotypes into different clusters based on the extent of association of physiological and agronomic traits under drought and control conditions. Chl, chlorophyll; CT, canopy temperature; CMPS, cell membrane percentage stability; LRWC, leaf rela-tive water content; FLA, flag leaf area; PH, plant height; TPP, tillers plant−1; SL, spike length; SPS, spikelet spike−1; GPS, grains spike−1; GYP, grain yield spike−1; TGW, thousand grain weight; PBM, plant biomass.
3.4. Gene Expression Analysis The relative gene expression of drought-related genes, such as TaDREB1A, TaGROS-
A, TaLEA3, TaHSFA1a, TaWRKY44 and TaEXPA2, showed considerable differences in se-lected wheat genotypes under drought stress as compared to the control (Figure 5). All genes were up regulated during drought stress in selected genotypes; however, their ex-pression was relatively high in the genotypes Pakistan-13, Shahkar-13, AAS-11, Chakwal-86, Chakwal-50 and AUR-09 while comparatively low ingenotypesAnmol-97, Chakwal-97, Bhakkar-02 and BWP-97. Overall, all selected genotypes showed relatively high gene expression during drought stress as compared to the control.
Figure 4. Heatmap dendrogram dividing wheat genotypes into different clusters based on theextent of association of physiological and agronomic traits under drought and control conditions.Chl, chlorophyll; CT, canopy temperature; CMPS, cell membrane percentage stability; LRWC, leafrelative water content; FLA, flag leaf area; PH, plant height; TPP, tillers plant−1; SL, spike length; SPS,spikelet spike−1; GPS, grains spike−1; GYP, grain yield spike−1; TGW, thousand grain weight; PBM,plant biomass.
3.4. Gene Expression Analysis
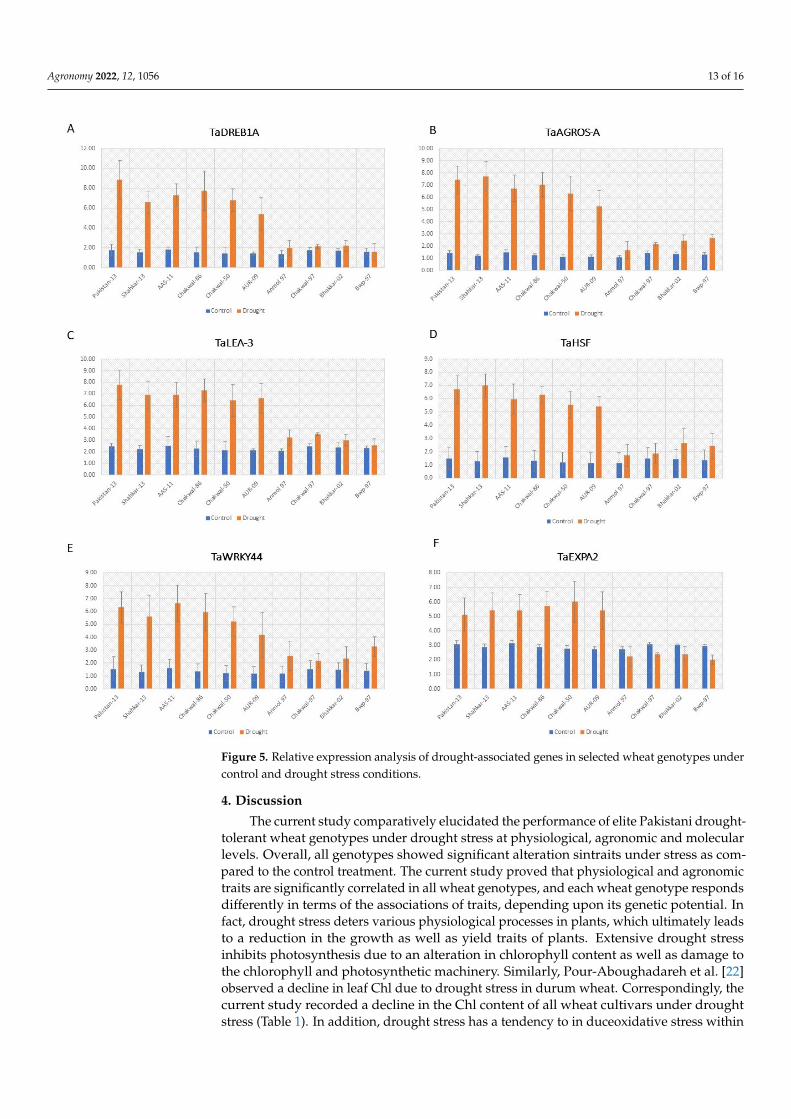
The relative gene expression of drought-related genes, such as TaDREB1A, TaGROS-A,TaLEA3, TaHSFA1a, TaWRKY44 and TaEXPA2, showed considerable differences in selectedwheat genotypes under drought stress as compared to the control (Figure 5). All genes wereup regulated during drought stress in selected genotypes; however, their expression wasrelatively high in the genotypes Pakistan-13, Shahkar-13, AAS-11, Chakwal-86, Chakwal-50and AUR-09 while comparatively low ingenotypes Anmol-97, Chakwal-97, Bhakkar-02 andBWP-97. Overall, all selected genotypes showed relatively high gene expression duringdrought stress as compared to the control.
Agronomy 2022, 12, 1056 13 of 16Agronomy 2022, 12, x FOR PEER REVIEW 14 of 18
Figure 5. Relative expression analysis of drought-associated genes in selected wheat genotypes un-der control and drought stress conditions.
4. Discussion The current study comparatively elucidated the performance of elite Pakistani
drought-tolerant wheat genotypes under drought stress at physiological, agronomic and molecular levels. Overall, all genotypes showed significant alteration sintraits under stress as compared to the control treatment. The current study proved that physiological and agronomic traits are significantly correlated in all wheat genotypes, and each wheat genotype responds differently in terms of the associations of traits, depending upon its genetic potential. In fact, drought stress deters various physiological processes in plants, which ultimately leads to a reduction in the growth as well as yield traits of plants. Exten-sive drought stress inhibits photosynthesis due to an alteration in chlorophyll content as well as damage to the chlorophyll and photosynthetic machinery. Similarly, Pour-Aboughadareh et al. [22] observed a decline in leaf Chl due to drought stress in durum wheat. Correspondingly, the current study recorded a decline in the Chl content of all
Figure 5. Relative expression analysis of drought-associated genes in selected wheat genotypes undercontrol and drought stress conditions.
4. Discussion
The current study comparatively elucidated the performance of elite Pakistani drought-tolerant wheat genotypes under drought stress at physiological, agronomic and molecularlevels. Overall, all genotypes showed significant alteration sintraits under stress as com-pared to the control treatment. The current study proved that physiological and agronomictraits are significantly correlated in all wheat genotypes, and each wheat genotype respondsdifferently in terms of the associations of traits, depending upon its genetic potential. Infact, drought stress deters various physiological processes in plants, which ultimately leadsto a reduction in the growth as well as yield traits of plants. Extensive drought stressinhibits photosynthesis due to an alteration in chlorophyll content as well as damage tothe chlorophyll and photosynthetic machinery. Similarly, Pour-Aboughadareh et al. [22]observed a decline in leaf Chl due to drought stress in durum wheat. Correspondingly, thecurrent study recorded a decline in the Chl content of all wheat cultivars under droughtstress (Table 1). In addition, drought stress has a tendency to in duceoxidative stress within

Agronomy 2022, 12, 1056 14 of 16
plant cells, leading to the generation of ROS that ultimately disrupt the integrity of the cellmembrane [9]. This disruption leads to more electrolyte leakage, which results in adeclinein CMPS and LRWC [20]. Likewise, the present study reported a significant decline inCMPS and LRWC among all wheat cultivars under drought stress as compared to thecontrol (Table 1). Canopy temperature (CT) is an important physiological trait indicatingthe water status of plants [23] and is an established parameter for targeting stomatal con-ductance [24]. Since drought stress has a tendency to increase CT due to enhanced stomatalconductance, wheat cultivars with cooler canopies are more tolerant to drought stress, asreviewed by Khadka et al. [25]. Likewise, the current study found a differential increasein CT of all wheat cultivars, which is an indicator of their differential potential againstdrought stress. PH, TPP and FLA are important growth traits affected directly by droughtstress. In fact, low moisture content reduces photosynthesis and nutrient translocation,particularly during stem elongation and the tillering stage, resulting in reduced PH, TPPand FLA [26]. The extent of the reduction in PH, TPP and FLA depends on both the droughtstress duration and genotype [25]. Likewise, the current study revealeda significant re-duction in PH, TPP and FLA among all genotypes; however, the extent of the reductionwas different in all genotypes (Table 2). This can be attributed to the differential genetictolerance of all genotypes against drought stress [9]. An efficient physiological processprovides sufficient translocation to plants, which not only accelerates their growth butalso increases their yield [27]. Drought stress inhibits different plant physiological pro-cesses, including photosynthesis, which leads to a dramatic reduction in yield parameters,including SL, SPS, GPS, GYP, TGW and PBM [14,22]. In the present study, our resultsindicate a statistically distinct reduction in all of the aforementioned yield traits among alltested genotypes under drought stress (Table 3). Additionally, a breeding program can bemade more efficient in diverse environments by gaining deep insight into the associationsbetween various physiological and agronomical traits serving as selection indices [28,29].Although various physiological, morphological and agronomic traits have been studied toelucidate the dynamics of drought tolerance in wheat, few of them have been suggested toimprove ina practical breeding program. Fromth is perspective, a few traits, such as Chl,CMPS, LRWC, CT, PH, TPP, FLA, SL and SPS, are used as selection indices owing to theirdirect relation with grain yield under drought stress [29–32]. In this context, the presentstudy revealed significant positive correlations of GPS, GYP and TGW with Chl, CMPS,LRWC, PH, TPP, FLA, SL and SPS (Figure 1) under drought conditions. Furthermore, theextent of the association between traits among cultivars was different, depending upon thetreatment and genotype (Figures 2–4). Moreover, correlation analysis confirmed the directassociation of traits under study in determining the ultimate grain yield in wheat genotypes(Figure 1). The paired association of these traits appeared to be more significant underconditions of stress, which confirmed yield as an output of the association between physio-logical and agronomical traits (Figures 1 and 2). However, differential responses of wheatgenotypes in terms of physiological and agronomic traits confirmed variations in theirgene architectures (Figure 4), as reviewed by Shah et al. [9]. In this regard, the genotypesPakistan-13, Shahkar-13, AAS-11, Chakwal-86, Chakwal-50 and AUR-09 exhibitednoteworthy performance. On the other hand, like every living organism, plants have a naturaltendency to cope with any sort of stress through the regulation of genetic determinants con-trolling the homeostatic machinery. The varying expression of drought-responsive genes inwheat genotypes under drought stress is an indicator of their varying tendencies of droughttolerance [9]. For instance, Liu et al. [13] reported the high expression of the TaDREB1 genein a wheat cultivar during drought-imposed osmotic stress. Moreover, the TaHSFA1a generegulates the accumulation of heat shock protein, which prevents plants from the hazardsof heat and other abiotic stresses [14]. Ahmed et al. [11] observed the high expression ofthe TaRGOS-A gene in drought-tolerant wheat genotypes, which they attributed to thedynamic role of TaRGOS-A in triggering the production of ABA, which elicits the droughtresistance pathway in wheat. In addition, transgenic wheat with the overexpression ofHVA1, which regulatesthe LEA protein, enhances drought tolerance in wheat under water

Agronomy 2022, 12, 1056 15 of 16
deficit conditions, as reported by Sivamani et al. [33] and Xiao et al. [13]. On the other hand,Wang et al. [34] confirmed the role of the wheat gene TaWRKY44 in conferring droughttolerance by transferring it into tobacco due to its tendency to eliminate ROS through theactivation of the antioxidant defense system. Correspondingly, Yang et al. [16] observedthe high expression of the TaEXPA2 gene in transgenic wheat genotypes, which triggeredthe drought tolerance potential of wheat genotypes in a water deficit environment due toincreased lateral root development. Complementary to these findings, the present studyrevealed the high expression of drought-related genes TaDREB1A, TaHSFA1a, TaRGOS-A,TaLEA3, TaWRKY44 and TaEXPA2 in drought-tolerant genotypes Pakistan-13, Shahkar-13,AAS-11, Chakwal-86, Chakwal-50 and AUR-09 as compared to susceptible genotypesAnmol-97, Chakwal-97, Bhakkar-02 and BWP-97 underwater deficit conditions (Figure 5).Therefore, further integration of these genotypes with the demarcation of drought tol-erance indices would prove a fruitful tool in the future for devising breeding programsin multivariate environments. The current study concluded that the simultaneous studyof physiological and agronomic traits provides important criteria for the delineation ofdrought tolerance in wheat genotypes. Furtherstudy linking physiological, agronomicand molecular parameters serving as selection indices will accelerate the pace of wheatbreeding for drought tolerance in the near future.
Supplementary Materials: The following supporting information can be downloaded at: https://www.mdpi.com/article/10.3390/agronomy12051056/s1. Table S1. List of wheat genotypes usedin the study. Table S2. List of primers used in relative gene expression analysis.
Author Contributions: G.S., S.I.M. and N.I.R. developed the idea and supervised the study; S.M.D.M.S.conducted experiments; M.R. and Z.H.S. conducted the statistical analysis; S.M.D.M.S. and Z.H.S.wrote the manuscript; Z.H.S., F.A., Y.A.Z. and H.A. proofread and K.S. and S.H.Y. critically reviewedthe manuscript. All authors have read and agreed to the published version of the manuscript.
Funding: The publication of the present work is supported by the National Research Foundation ofKorea (NRF) grant funded by the Korean government (MSIT) (NRF-2021R1F1A1055482).
Institutional Review Board Statement: Not applicable.
Informed Consent Statement: Not applicable.
Data Availability Statement: Not applicable.
Conflicts of Interest: The authors declare no conflict of interest.
References1. Raza, A.; Razzaq, A.; Mehmood, S.S.; Zou, X.; Zhang, X.; Lv, Y.; Xu, J. Impact of Climate Change on Crops Adaptation and
Strategies to Tackle Its Outcome: A Review. Plants 2019, 8, 34. [CrossRef] [PubMed]2. Fahad, S.; Bajwa, A.; Nazir, U.; Anjum, S.A.; Farooq, A.; Zohaib, A.; Sadia, S.; Nasim, W.; Adkins, S.; Saud, S.; et al. Crop
Production under Drought and Heat Stress: Plant Responses and Management Options. Front. Plant Sci. 2017, 8, 1147. [CrossRef][PubMed]
3. Ali, S.; Liu, Y.; Ishaq, M.; Shah, T.; Abdullah; Ilyas, A.; Din, I.U. Climate Change and Its Impact on the Yield of Major Food Crops:Evidence from Pakistan. Foods 2017, 6, 39. [CrossRef] [PubMed]
4. Ray, D.K.; West, P.C.; Clark, M.; Gerber, J.S.; Prishchepov, A.V.; Chatterjee, S. Climate change has likely already affected globalfood production. PLoS ONE 2019, 14, e0217148. [CrossRef] [PubMed]
5. Seleiman, M.F.; Al-Suhaibani, N.; Ali, N.; Akmal, M.; Alotaibi, M.; Refay, Y.; Dindaroglu, T.; Abdul-Wajid, H.H.; Battaglia, M.L.Drought Stress Impacts on Plants and Different Approaches to Alleviate Its Adverse Effects. Plants 2021, 10, 259. [CrossRef][PubMed]
6. Pandey, A.; Khobra, R.; Mamrutha, H.M.; Wadhwa, Z.; Krishnappa, G.; Singh, G.; Singh, G.P. Elucidating the Drought Respon-siveness in Wheat Genotypes. Sustainability 2022, 14, 3957. [CrossRef]
7. Chaudhary, S.; Devi, P.; Bhardwaj, A.; Jha, U.C.; Sharma, K.D.; Prasad, P.V.V.; Siddique, K.H.M.; Bindumadhava, H.; Kumar,S.; Nayyar, H. Identification and Characterization of Contrasting Geno-types/Cultivars for Developing Heat Tolerance inAgricultural Crops: Current Status and Prospects. Front. Plant Sci. 2020, 11, 587264. [CrossRef]
8. Morales, F.; Ancín, M.; Fakhet, D.; González-Torralba, J.; Gámez, A.L.; Seminario, A.; Soba, D.; Ben Mariem, S.; Garriga, M.;Aranjuelo, I. Photosynthetic Metabolism under Stressful Growth Conditions as a Bases for Crop Breeding and Yield Improvement.Plants 2020, 9, 88. [CrossRef]

Agronomy 2022, 12, 1056 16 of 16
9. Shah, Z.H.; Rehman, H.M.; Akhtar, T.; Daur, I.; Nawaz, M.A.; Ahmad, M.Q.; Rana, I.A.; Atif, R.M.; Yang, S.H.; Chung, G. Redoxand Ionic Homeostasis Regulations against Oxidative, Salinity and Drought Stress in Wheat (A Systems Biology Approach).Front. Genet. 2017, 8, 141. [CrossRef]
10. Kang, Y.; Udvardi, M. Global regulation of reactive oxygen species scavenging genes in alfalfa root and shoot under gradualdrought stress and recovery. Plant Signal. Behav. 2012, 7, 539–543. [CrossRef]
11. Ahmed, K.; Shabbir, G.; Ahmed, M.; Noor, S.; Din, A.M.U.; Qamar, M.; Rehman, N. Expression profiling of TaARGOS homoeolo-gous drought responsive genes in bread wheat. Sci. Rep. 2022, 12, 3595. [CrossRef] [PubMed]
12. Xiao, B.; Huang, Y.; Tang, N.; Xiong, L. Over-expression of a LEA gene in rice improves drought resistance under the fieldconditions. Theor. Appl. Genet. 2007, 115, 35–46. [CrossRef] [PubMed]
13. Liu, M.; Wang, Z.; Xiao, H.-M.; Yang, Y. Characterization of TaDREB1 in wheat genotypes with different seed germination underosmotic stress. Hereditas 2018, 155, 26. [CrossRef] [PubMed]
14. Xue, Q.; Rudda, J.C.; Liua, S.; Jessupa, K.E.; Devkotaa, R.N.; Mahano, J.R. Yield determination and water use efficiency of wheatunder water-limited conditions in the U.S. Southern High Plains. Crop Sci. 2013, 34, 47. [CrossRef]
15. Niu, C.-F.; Wei, W.; Zhou, Q.-Y.; Tian, A.; Hao, Y.-J.; Zhang, W.-K.; Ma, B.; Lin, Q.; Zhang, Z.-B.; Zhang, J.-S.; et al. Wheat WRKYgenes TaWRKY2 and TaWRKY19 regulate abiotic stress tolerance in transgenic Arabidopsis plants. Plant Cell Environ. 2012, 35,1156–1170. [CrossRef]
16. Yang, J.; Zhang, G.; An, J.; Li, Q.; Chen, Y.; Zhao, X.; Wu, J.; Wang, Y.; Hao, Q.; Wang, W.; et al. Expansin gene TaEXPA2 positivelyregulates drought tolerance in transgenic wheat (Triticum aestivum L.). Plant Sci. 2020, 298, 110596. [CrossRef] [PubMed]
17. Lan, Y.; Chawade, A.; Kuktaite, R.; Johansson, E. Climate Change Impact on Wheat Performance—Effects on Vigour, Plant Traitsand Yield from Early and Late Drought Stress in Diverse Lines. Int. J. Mol. Sci. 2022, 23, 3333. [CrossRef]
18. Bannister, P. The Water Relations of Certain Heath Plants with Reference to their Ecological Amplitude: III. Experimental Studies:General Conclusions. J. Ecol. 1964, 52, 499–509. [CrossRef]
19. Farooq, J.; Khaliq, I.; Kashif, M.; Ali, Q.; Mahpara, S. Genetic analysis of relative cell injury per-centage and some yield contributingtraits in wheat under normal and heat stress conditions. Chil. J. Agric. Res. 2011, 71, 511. [CrossRef]
20. Alghabari, F.; Shah, Z.H.; Elfeel, A.A.; Alyami, J.H. Biochemical and Physiological Responses of Thermostable Wheat Genotypesfor Agronomic Yield under Heat Stress during Reproductive Stages. Agronomy 2021, 20, 80. [CrossRef]
21. Li, S.; Wang, R.; Jin, H.; Ding, Y.; Cai, C. Molecular Characterization and Expression Profile Analysis of Heat Shock TranscriptionFactors in Mungbean. Front. Genet. 2019, 9, 736. [CrossRef] [PubMed]
22. Pour-Aboughadareh, A.; Mohammadi, R.; Etminan, A.; Shooshtari, L.; Maleki-Tabrizi, N.; Poczai, P. Effects of Drought Stress onSome Agronomic and Morpho-Physiological Traits in Durum Wheat Genotypes. Sustainability 2020, 12, 5610. [CrossRef]
23. Mason, R.E.; Singh, R.P. Considerations when deploying canopy temperature to select high yielding wheat breeding lines underdrought and heat stress. J. Agron. 2014, 191, 201. [CrossRef]
24. Deery, D.M.; Rebetzke, G.J.; Jimenez-Berni, J.A.; Bovill, W.D.; James, R.A.; Condon, A.G.; Furbank, R.T.; Chapman, S.C.; Fischer,R.A. Evaluation of the phenotypic repeatability of canopy temperature in wheat using continuous-terrestrial and airbornemeasurements. Front. Plant Sci. 2019, 10, 875. [CrossRef]
25. Khadka, K.; Earl, H.J.; Raizada, M.N.; Navabi, A.A. Physio-Morphological Trait-Based Approach for Breeding Drought TolerantWheat. Front. Plant Sci. 2020, 11, 715. [CrossRef]
26. Sarto, M.V.M.; Sarto, J.R.W.; Rampim, L.; Rosset, J.S.; Bassegio, D.; da Costa, P.F.; Inagaki, A.M. Wheat phenology and yield underdrought: A review. Aust. J. Crop Sci. 2017, 11, 941–946. [CrossRef]
27. Ahmadi, J.; Pour-Aboughadareh, A.; FabrikiOurang, S.; Mehrabi, A.A.; Siddique, K.H.M. Wild relatives of wheat: Aegilops–Triticum accessions disclose differential antioxidative and physiological responses to water stress. Acta Physiol. Plant. 2018, 40, 90.[CrossRef]
28. Foulkes, M.J.; Sylvester-Bradley, R.; Weightman, R.; Snape, J.W. Identifying physiological traits associated with improved droughtresistance in winter wheat. Field Crop Res. 2007, 11, 24. [CrossRef]
29. Lafitte, H.R.; Blum, A.; Atlin, G. Using secondary traits to help identify drought tolerant genotypes. In Hardy Breeding Rice forDrought-Prone Environments; Fischer, K., Lafitte, S.R., Fukai, G., Atlin, B., Eds.; IRRI: Los Baños, Philippines, 2003; Volume 38, p. 39.
30. Poursiahbidi, M.; Pour-Aboughadareh, A.; Tahmasebi, G.; Jasemi, S. Evaluation of genetic diversity and interrelationships ofagro-morphological characters in durum wheat (Triticum durum desf.) lines using multivariate analysis. Int. J. Agric. Res. Rev.2013, 184, 194.
31. Pour-Aboughadareh, A.; Ahmadi, J.; Mehrabi, A.A.; Etminan, A.; Moghaddam, M.; Siddique, K. Physiological responses todrought stress in wild relatives of wheat: Implications for wheat improvement. Acta Physiol. Plant. 2017, 39, 106. [CrossRef]
32. Pour-Aboughadareh, A.; Omidi, M.; Naghavi, M.R.; Etminan, A.; Mehrabi, A.A.; Poczai, P.; Bayat, H. Effect of Water Deficit Stresson Seedling Biomass and Physio-Chemical Characteristics in Different Species of Wheat Possessing the D Genome. Agronomy2019, 9, 522. [CrossRef]
33. Sivamani, E.; Bahieldin, A.; Wraith, J.M.; Al-Niemi, T.; Dyer, W.E.; Ho, T.-H.D.; Qu, R. Improved biomass productivity and wateruse efficiency under water deficit conditions in transgenic wheat constitutively expressing the barley HVA1 gene. Plant Sci. 2000,155, 1–9. [CrossRef]
34. Wang, X.; Zeng, J.; Li, Y.; Rong, X.; Sun, J.; Sun, T.; Li, M.; Wang, L.; Feng, Y.; Chai, R.; et al. Expression of TaWRKY44, a wheatWRKY gene, in transgenic tobacco confers multiple abiotic stress tolerances. Front. Plant Sci. 2015, 6, 615. [CrossRef] [PubMed]
Copyright © 2022 FDOKUMEN