
Morphological, Physiological and Anatomical Adaptations in ...
Upload
khangminh22Category
view
4download
0
TISSUE OXYGEN TENSlONS UNDER PHYSIOLOGICAL AND PATHQLOGICAL CONDITIONS
(ZUURSTOFMETINGEN IN WEEFSEL ONDER FYSIOLOGISCHE EN
PATHOLOGISCHE OMSTANDIGHEDEN)
PROEFSCHRIFT
TER VERKRIJGING VAN DE GRAAD VAN DOCTOR AAN DE ERASMUSUNIVERSITEIT ROTTERDAM
OP GEZAG VAN DE RECTOR MAGNIFICUS PROF. DR. A.H.G. RINOOY KAN
EN VOLGENS BESLUIT VAN HET COLLEGE VAN DEKANEN. DE OPENBARE VERDEDIGING ZAL PLAATSVINDEN OP
WOENSDAG 15 JUNI 1988 OM 13.30 UÛR
DOOR
MICHAEL FENNEMA
GEBOREN TE AUCKLAND

PROMOTIECOMMISSIE
PROMOTOR: PROF. DR. W. ERDMANN
. CO-PROMOTOR: DR. N.S. FAITHFULL
OVERIGE LEDEN: PROF. DR. G.H. ZEILMAKER PROF. DR. P.J.J. SAUER PROF. DR. C.J.J. AVEZAAT

To my parents and Linda


CONTENTS
CHAPTER 1 GENERAL INTRODUCTION . . . . . . . . . . . . . . . . . 1
AIMS OF THIS THESIS.
REPERENCES .
• 7
• 7
OWN PUBLICATIONS IN THIS FIELD . • • • • 8
CHAPTER 2 METHODOLOGY . .................... 11
ON LINE DETERMINATION OF P0 2 , OXYGEN DIFFUSION,
TISSUE PERFUSION AND ACTION POTENTIALS WITH A
10 MICRON ELECTRODE SYSTEM .....•....... 11
INTRODUCTION . . . . . . . . 11
THE POLAROGRAPHIC PRINCIPLE. . 11
0 2 CONCENTRATION VERSUS PARTlAL PRESSURE
MEASUREMENTS . . . . . . . . . . . . 13
OXYGEN DIPFUSION AND CONDUCTIVITY MEASUREMENTS . 14
-Determination of D02 . . . . . 17
-Determination of K0 2 . . . . 18
CONSTRUCTION OF MICROELECTRODES. . 18
-Fabrication of gold/glass wire . 18
-Fixing the electrode tips to the conducting
wire ....
-Insertion of electrode into guide capillaries.
-Construction of P02 multi-microelectrodes ..
-Indifferent electrode.
-Construction of double barrel microelectrode
for P02 , o2 conductivity and 0 2 solubility
determination. . . .
DESIGN OF THE ELECTRONIC EQUIPMENT .
-The P02 amplifying circuit ..
-Additional circuit for measurement of o2
1 9
• 1 9
. 20
• 21
23
. 23
. 23
concentration and diffusion parameters . . . . . 24
-Equipment for combined o2 and H2 clearance
measurements . . . 24
-General circuit. . 24
-Specified circuit for H2-o2 polarography . . 24
-Electronic equipment for simultaneous action
potential measurements and P02 -H2-polarography . 25
THE PROBLEMS OF SHIELDING WHEN WORKING WITH
10 MICRON MICROELECTRODES.
-Sheilding procedure. . ...
-Electronic equipment for AP and P02 -Do 2 transmission . .
RECORDING EQUIPMENT.
CONCLUSION
REFERENCES
. 28
28
29
31
31
31
GENERAL REMARKS ON P0 2 ELECTRODE CHARACTERISTICS .. '33
LINEARITY ...... .
CALIBRATION PROCEDURE.
DRIFT ....
-Baseline drift
-Measurement drift.
TEMPERATURE ..
RESPONSE TIME.
CONCLUSION . . •
CHAPTER 3 OXYGEW TENSION IN THE PRE-OVULATORY AND
. 33
33
34
• • • • 3 4
34
34
• 34
. 35
NON-OVULATING OVARIUM FOLLICLE OF THE RAT . . . . . 3 7
INTRODUCTION
MATERIAL AND METHODS
RESULTS.
DISCUSSION
REFERENCES .
37 38
41
42
42

CHAPTER 4 TISSUE OXYGEN TENSIONS IN THE CERBRAL CORTEX
OF THE RABBIT . ....
INTRODUCTION . . . . . .
MATERIAL AND METHODS .
RESULTS AND DISCUSSION
REPERENCES . • . . . .
• • • • 45
• • 45
. 46
47
52
CHAPTER 5 OXYGENATION IN THE MYOCARDIUM. . . . . . . . . . . . 53
CHAPTER 6
INTRODUCTION
MATERIAL AND METHODS
CARDIAC SWINGS • .
-Results ..
-Discussion
RESPIRATORY SWINGS
ELECTRICAL ACTIVITY.
CHANGES IN THE INSPIRATORY
OXYGEN (Fi0 2 ) ...•...
TEMPORARY OCCLUSION OF THE
PERCENTAGE OF
LEFT ANTERIOR
DESCENDING CORONARY ARTERY .
-Results ..
-Discussion
PERMANENT LAD OCCLUSION ..
-Results •.
-Discussion . .
GENERAL DISCUSSION
REPERENCES . . . .
MICROCIRCULATION AND FLUOROCARBONS . .
INTRODUCTION .
• • • • 5 3
54
57
57
. 59
• 61
62
• • • • • • 6 3
64
. 64
• • • 6 6
68
69
72
• • 7 3
• • • • 75
79
• • 79
THE EFFECTS OF HAEMODILUTION ON OXYGEN TENSION IN
THE ACUTELY ISCHAEMIC MYOCARDIUM . 82
. 82
83
90
-Material and methods
-Results ..•
-Discussion

PROPHYLACTIC TREATMENT AGAINST MYOCARDlAL
ISCHAEMIA WITH FLUOROCARBONS
-Material and methods
-Results ..
-Discussion .
LIMB PRESERVATON IN REPLANTATION SURGERY .
-Material and methods
-Results ...
-Discussion .
GENERAL DISCUSSION
REPERENCES . . . . .
CHAPTER 7 CHANGES IN INTRA MYOCARDIAL OXYGEN TENSIONS
DURING HYPOTBERMIA IN PIGS . . . . . . . . .
INTRODUCTION . . . .
MATERIAL AND METHODS •
RESULTS.
DISCUSSION .
REPERENCES
91
91
93
95
. 96
. 96
. 98
• 1 01
• 1 03
• • 1 os
• • • 1 09
• 1 0 9
• • • 11 0
• 11 3
• 11 9
• 1 20
CHAPTER 8 GENERAL CONCLUSIONS . ................ 123
SUMMARY . . . . . . . . . . . . . . . . . . . . . . . . . . . . 1 2 5
SAMENVATTING . . . . . . . . . . . . . . . . . . . . . . . . . . 1 3 3
GLOSSARY OF ABBREVIATIONS ................... 141
ACKNOWLEDGEMENTS . . . . . . . . . . . . . . . . . . . . . . . . 1 4 3
CURRICULUM VITAE . . . . . . . . . . . . . . . . . . . . . . . . 1 4 5

CHAPTER 1
GENERAL INTRODUCTION
For the normal function and survival of an organism, a continuous
supply of energy is necessary. Without energy nearly all physiological
processes, such as electrolyte pumping, could nat take place; in other
words, Cannan's 'homeostasis' would nat exist. On the cellular level,
oxydative phosphorylation produces energy. This process is maintained
by an almast continuous supply of oxygen. Therefore oxygen is the
decisive vital parameter in (human) life. Disturbance in tissue
respiration causes a decrease in cellular function, reversible
functional breakdown and, finally, irreversible cell death.
Oxygen transport to tissue occurs in three steps:
1. oxygen uptake in the lung
2. oxygen transport in blood
3. diffusion of oxygen from the capillaries to the tissue and
through the tissue to the cells
When pulmonary gas exchange, cardiac output and oxygen transport
capacity of the blood are within the normal range, oxygen supply to
the tissue is furthermore dependent on the following micro
physiological parameters:
1. Distribution/perfusion ratio of the capillary meshwork
2. Oxygen consumption of the cell
3. Oxygen diffusion parameters from capillaries to tissue, through
the tissue and across the cell membrane into the cell
venule arteriole
AVA
venule ~~ -- ~
arteriole ~
Fig. 1: Two-dimensional schematic drawing of a micro
circulatory unit.
AVA artericveneus anastomosis
EM end of roetarteriele
Normally, capillary perfusion and oxygen consumption are in balance
and oxygen supply to the cell is continuously autoregulated to i ts
needs. Fig. 1 shows that (micro-)collaterals between capillaries of
different artericles can help to maintain an adequate supply of oxygen
to all areas. However, many pathophysiological conditions can severely
interfere with this balance, for example: changes in blood P02 , Pco2 ,
or pH; acute or chronic acelusion of blood vessels, edema, hypothermia
and certain pharmacological drugs. From fig. 1, it can beseen that
if, for instance, one of the artericles is completely blocked, certain
parts of the capillary meshwork might not be sufficiently supplied
with oxygenated blood, even though the other artericles might
partially compensate. If the distance between this micro-area and the
nearest well-oxygenated capillary is too great, the oxygen pressure
could fall solowas to cause cell death (fig. 2).
2

----------------
P0 (mmHg) 2
80
60
40
20
Fig. 2: Oxygen distribution between two capillaries.
The tissue P02 in those areas which are nat in
the irnrnediate neighbourhood of a (well
oxygenated) capillary rnay be very low.
Studies of rnacrophysiological parameters such as blood gases, blood
pressures, blood flow and oxygen consurnption of whole organs have been
possible for years. In the absence of suitable measuring techniques,
rnany scientists have atternpted to explain rnicrophysiology with the aid
of theoretical rnathernatical roodels. Fick was probably the first to
approach the unanswered questions concerning o2 supply when he stated
his diffusion law's in the second half of the last century. Kragh's
papers (1904-1918) provided another major step forward, when he
discussed the theoretical oxygen partial pressure distribution in a
tissue cylinder (fig. 3).
make assurnptions about
inaccessible) micro-area
These assurnptions were:
These, and other workers, obviously had to
the basic conditions in the (for thern
in order to develop rnathernatical roodels.
3

1. Homogenous capillary pattern
2. Homogenous capillary perfusion
3. Homogenous oxygen consumption in the intercapillary tissue
4. Homogenous diffusion coefficient
5. No shunt perfusion
6. No shunt diffusion, or homogenous shunt diffusion.
Arterial blood
KROGH TISSUE CYLINDER
Fig. 3: Krogh's tissue cylinder model. Re radius of
capillary. This is a two dimensional model,
which only considers an average length of the
capillary with an average arterial input and
venous output.
Venous Blood
For years, all calculations concentrated on two-dimensional
capillary models. Three-dimensional models were only developed in
recent years (Metzger 1969, 1973) (Fig. 4). Bearing in mind that all
these computations were based on these assumptions, it is obvious that
the information derived through these methods is only an approx-
imation of the actual conditions in the microarea. Indeed, when one
microscopically views a capillary netwerk (best represented by fig. 1)
4

one can see that the capillary flow is a dynamic process, impossible
to predict by man or computer.
I+ 60 .urn +I
Fig. 4: Metzger's three-dimensional model of a
capillary unit. This model is still based on
the assumptions mentioned in the text, but
takes into account differences in arterial
inlet and venous outlet, so thus that one can
compute that very low tissue P0 2 values are
possible.
Another advance in understanding of oxygen supply to the microarea
was the development of microelectrades for the measurement of tissue
oxygen partial pressures. Electrochemical measurements of oxygen with
metal electrades in an electrolyte salution have been performed since
the end of the 19th century, when Daneel (1897) observed the reduction
of oxygen in a watery salution on a noble metal surface to which a low
voltage had been applied. Blinks and Skow (1938) applied this
technique for biological purposes and Davies and Brink (1942)
developed it for use in mammalian tissue. A renewal of the
microelectrode system was made in 1959 by Ca ter, Silver and Wilson
5

with the development of a 10-micron platinum-in-glass electrode. Since
then many types of electrades have been produced.
The next chapter explains the theory behind and the fabrication of
the microelectrades that are used in the studies in later chapters.
This electrode system, based on the original electrades made by
Erdmann, Krell, Metzger and Nixderf (1970), are also suitable for
sirnul taneous measurement of oxygen diffusion, tissue perfusion and
action potentials (Kunke et al 1972, Erdmann & Krell 1976). For
studies in (myocardial) muscle, commercial steel-protected micro
electrades (Clark Electromedical Instruments) were used. Although
these electrades are thicker, the principles discussed in Chapter 2
remain the same.
In the last fifteen years an enormous number of publications have
accumulated on oxygen transport to tissue. In this same period, a
relatively small amount of work has taken place on oxygen partial
pressure measurements with needle microelectrades in vivo. This thesis
gives a braad view of the implications of oxygen partial pressure
measurements in physiological, pathological and even therapeutical
condi ti ons in experimental and clinical settings. In Chapter 3 the
first example of the application of oxygen partial pressure
measurements with needle microelectrades in physiological conditions
is given: a comparison between the oxygen tensions in the pre
ovulatory and non-ovulating ovarium follicle of the rat is shown.
Chapter 4 is also basically concerned with physiological conditions,
but also mentions the effects of hyperoxia and hypercapnia on the P0 2 in the rabbit cortex. Chapter 5 begins with investigations into normal
oxygen partial pressure distributions in the myocardium of the pig. An
at tempt is made to explain the fluctuations in the readings. The
following sectien shows the effects of acute and chronic ischaemia in
the myocardium. After contemplating on the micro-circulatory changes
during ischaemia, an experimental trial is presented in chapter 6
where fluorocarbons (oxygen carrying compounds) are used to try and
imprave the oxygen delivery to the areas of the myocardium where
oxygen supply is impaired. Fluorocarbons might also imprave oxygen
supply and delivery in other tissues. Human extremities are perfused
wi th fluorocarbons and their viabil i ty is moni tored wi th, amongst
others, oxygen measurements of the (tissue. A special pathophysio-
6

logical situation is hypothermia, which can be caused by exposure to a
cold environment (especially in water), but can also be iatrogenic.
Chapter 7 shows the effect of hypothermia on myocardial oxygenation.
AIMS OF THIS THESIS
The aims of this thesis are twofold:
I to describe a reliable micro-electrode system for determination of
oxygen partial pressures in the micro-area of the tissue and to
demonstrate that it is applicable in exxerimental and clinical
situations.
II: to demonstrate that measuring tissue oxygen partial pressures can
increase the understanding of oxygenation in the micro-area and
imprave our insight in how to act in special clinical situations.
This thesis attempts to solve the follgwang problems:
1. What is the normal oxygen pressure in tissues?
2. Is there a relationship between follicular P02 and ovulation?
3. What is the effect of infarction on myocardial oxygenation?
4. Do fluorocarbons amprove myocardial oxygenation af ter
infarction?
5. Are fluorocarbons a suitable perfusate in traumatically
amputated extremities?
6. What is the effect of hypothermia on tissue oxygenation?
REPERENCES
Blinks L.R., Skow R.B. (1938) Measurement of oxyoen in suspension of
plant cells. Proc Nat Acad Sci, U.S., 24: 420.
Cater D.B., Silver I.A., Wilson G.M. (1959) Microelectrades for P02 measurements in tissue. Proc Roy ~' 151: 256.
Danneel H. (1887) sauerstoff reduktion an edlen Metallen. ~
Elektroehem 4: 227.
Davies P.W., Brink K.F. (1942) Microelectrades for measuring local
oxygen tension in animal tissue. Rev Scient Instr 13: 542.
7

Erdmann w., Krell W., Metzger H. (1970) Ein Verfahzen zur Herstell ng
standardisierter Gold-mikroelektroden fuer die P02-messung im
Gewebe. Pflueger Arch 319: 69.
Erdmann W., Krell W. (1976) Measurement of ditfusion parameters with
noble roetal electrodes. Adv Exp Med Biol 75
Krogh A. (1918/19). The rate of ditfusion of gases through animal
tissues with some remarks on the coefficient of invasion. ~
Physiol 52: 391.
Kunke S., Erdmann W., Metzger H. (1972) A new methad for simultaneous
P02 and action potential measurements with a single electrode
tip. ~ ~ Physiol 32: 436.
Metzger H. (1969) Distribution of oxygen partial pressure in a two
dimensional tissue supplied by capillary meshs and concurrent
and countercurrent systems. Math Bioscience 5: 143.
Metzger H. (1973) Geometrie considerations in rnadelling oxygen
transport processes in tissue. Adv Exp Med Biol 37B: 761.
THE FOLLOWING OWN PUBLICATIONS WERE THE BASIS OF THIS THESIS
Faithfull N.S., Fennema M., Essed C.E., Erdmann W., Lapin R. (1983)
Fluorocarbon mediated changes in oxygen supply in the
ischaemically hypoxic myocardium - Preliminary report. ~
Bloodless Surg 1: 23-27.
Faithfull N.S., Fennema M., Essed C.E., Erdmann W., Jeekel H., Lapin
R. (1983) Collateral oxygenation of the ischaemie myocardium
the effects of the viscosity and oxygen carrying fluorocarbons.
Prog Clin Biol Re 122: 229-236.
Faithfull N.S., Erdmann W., Smith A.R., van Alphen W.A., Fennema M.,
Essed C.E., Trouwborst A., Lapin R. (1983) Impravement of
oxygenation by fluorocarbons. Abstract: Acta Anaes Scand
s78(27): 104.
Faithfull N.S., Fennema M., v. Alphen W.A., Smith A.R., Erdmann W.,
v.d. Zee H., Essed C.E., Kok A., Lapin R., Salt P.J. (1984)
Fluorocarbons and the microcirculation. Acta Anaesth Belg 35:
69-78.
Faithfull N.S., Fennema M., Erdmann W .. Lapin R., Smith A.R, v. Alphen
W.A., Essed C.E., Trouwborst A. (1985) Tissue oxygenation by
fluorocarbons. Adv Exp Med Biol 180: 569-579.
8

Faithfull N.S., Erdmann W., Fennema M. (1985) Oxygen supply to the
myocardium. Adv Exp Med Biol 180: 411-423.
Faithfull N.S., Smith A.R, v. Alphen W.A., Fennema M., Erdmann W.,
Lapin R., Essed C.E., Trouwborst A. (1185) The ability of
perfluorochemicals to provide microcirculatory oxygenation.
Anaesthesia- Innovations in Management eds. Droh R., Erdmann W.,
Spintge R. Springer-verlag, Berlin Heidelberg New York
Tokyo,123-131.
Faithfull N.S., Erdmann W., Fennema M. (1985) Oxygen tensionsin the
ischaemie myocardium(following haemodilution with fluorocarbons
or dextran. Br ~ Anaesth. 57: 817.
Fennema M., Erdmann W. (1985) Online determination of P02 , o2 diffusion, tissue perfusion and AP's with a 10 micron tip
electrode system. Sensor 5: 8201-8217.
Smith A.R, v. Alphen W.A., Faithfull N.S., Fennema M. (1985) Limb
preservation in replantation surgery. ~ Plast & Reconstr Surg
75(2): 227-237.
Faithfull N.S., Erdmann W., Fennema M. (1986) Role of fluorocarbons in
myocardial infarction. Am~ Cardiol. 51: 500.
Faithfull N.S., Erdmann W., Fennema M., Kok A. (1986) Effects of
haeeodilution with fluorocarbons or dextran on P02 in the
acutely ischaemie myocardium. Brit~ Anaesth. 58: 1031-1040.
Faithfull N.S., Fennema M., Erdmann W., Dhasmana M.K., Eilers G.
(1986) Early mygcardial oxygen tensionchanges during acute
ischaemia. Adv Exp Med Biol 200: 339-348.
Fennema M., Zeilmaker G., Faithfull N.S., Erdmann W. (1986) Oxygen
tension in the pre-ovulatory and non ovulating ovarium follicle
of the rat. Adv Exp Med Biol 200: 457-462.
Fennema M., Prakash 0., Dhasmana M.K., Faithfull N.S., Erdmann W.
(1986) Changes in intramyocardial oxygen tensions during
hypothermia in pigs. Adv Exp Med Biol 200: 349-358.
Faithfull N.S., Erdmann W., Fennema M., Smith A., van Alphen W., Kok
A. (1987) Microcirculatory support by fluorocarbons. JWAEDM
3(2): 53-58.
Faithfull N.S., Fennema M., Erdmann W. (1987) Prophylaxis and treat
ment of myocardial ischaemia by haemodilution with fluorocarbon
emulsions. Adv Exp Med Biol 215: 89-95.
9


CHAPTER 2
METHOOOLOGY:
ON LINE DETERMINATION OF P02 , OXYGEN DIFFUSION, TISSUE PERFUSION AND
ACTION POTENTIALS WITH A 1 0 MICRON TIP ELECTRODE SYSTEM
M. Fennema, W. Erdmann
In: Sensor 1985 (5) 8.2.1-17
INTRODUCTION
Cellular o 2 supply is continuously adjusted to meet dynamic needs
of cellular metabolism. It is dependent on: arterial Po2 , o 2 transport capacity of the blood, tissue perfusion and oxygen diffusion
from the erythrocytes to the cell. Lack of o 2 supply is followed by a
breakdown of cellular functions (e.g. action potential generation in
neurons). An electrode system has been developed to make it possible
to investigate several of these parameters and their interactions
simultaneously. The electrode system is based on the polarographic
principle.
THE POLAROGRAPHIC PRINCIPLE.
This principle is derived from the phenomenon that a high ohmic
layer is formed between an electrolyte salution and a noble roetal at
the point of contact (Helmholtz Double-layer) which prevents
electrans from passing from the roetal through the electrolyte to an
11

indifferent electrode when a voltage is supplied to the metal. This
induces an overloading of electrans on the metal surface so that a
potential difference is built up to equal that of the supplied
voltage. When a suitable voltage is supplied to the noble metal
electrode, electrochemical neutral molecules which are in the salution
can be reduced (0 2 ) or oxidised (hydrogen), as soon as they have
diffused into the double layer. These molecules therefore serve as
electron acceptars or donators. The reduction of o2 occurs in several
steps. The comprehensive formula is as follows (Kolthoff and Lingane,
1 952):
02
+ 2H2
0 + 2e ----? H2 02
+ 20H
H2o
2 + 2e ~ 20H-
20H- + 2H+ -----? 2H2
0
Oxidisation occurs as follows :
~20H-+ 2H+
-~?:il>2H2o2 + 2e
The electrans consumed or supplied by this chemical process are
compensated by a current flowing to or from the electrode surface. The
indifferent electrode must not be polarisable; this means that there
has to be a transmitter surface between the metal and the electrolyte,
consisting of the metal in ionic form and an ion out of the solution.
This can be done by chloridising silver, so that silver chloride acts
as a transmitter layer. There are also other indifferent electrades
e.g. Calomel-mercury. The current measured in the circuit is dependent
on the voltage supplied to the electrodes, on the amount of substance
to be reduced or oxidised and on the kind of metal used. When the
voltage current curve for 02 is registered (fig. 1 ) 1 nearly stable
levels of current can be observed between -500 and -1100 mV (gold);
the so-called plateau for gold. The plateau has a range of 350 mV for
platinum and 600 mV for gold. Wh en the applied voltage is further
increased, the current increases again because now other molecules or
ions in the salution take over acceptor function.
1 2

IH2 [nA/02
0.6 1,5
0,4 1,0
0,2 0.5
+200 0 -1200 Up [mV]
-0.2 -0,5
Fig. 1 : o2 and H2 polarograms of a 1 0 micron gold
electrode. The o2 curve has a braad plateau
between -500 and -1100 mV, the H2 curve
between +200 and -100 mV, and a secondary less
characteristic one between -600 and -1000 mV.
As the o2 voltage current curve cuts the base
line at about +200 to +100 mV, this would be
the voltage range suitable for H2-clearance
measurements.
OXYGEN CONCENTRATION VERSUS PARTIAL PRESSURE MEASUREMENTS.
In the range of the plateau, a further increase in voltage does nat
induce an increase in current because all the electrans which are at
the surface are immediately reduced. Thus, the current is only
dependent on o2 diffusion rate to the surface of the electrode
(diffusion limited current). This diffusion rate is proportional to
the o2 concentratien in the solution. This means that the measured
current is proportional to the o2 concentratien in the solution. In
medical research, as well as in clinical medicine, o2 concentratien is
1 3

of minor importance because it changes from micron to micron,
depending on the highly variable o2 solubility coefficient. The only
comparable value in blood and tissue is the o2 partial pressure, which
according to the gas laws equilibrates in different mediums and is
independent of the solubility coefficient dependent o2 concentration:
0 2-concentration = P0 2 x ao 2 a solubility coefficient
P02 = o 2 partial pressure
In order to change the concentration measuring system described above
into a partial pressure measuring system, a constant medium has to be
maintained on the electrode surface, which equilibrates with the
partial pressure of the surrounding mediums. Therefore, a recessed
electrolyte-filled chamber covers the noble metal surface, separated
from the surroundings by an o2 permeable membrane. The membrane
material must also prevent proteins diffusing to the metal surface, as
well as preventing contamination of the electrolyte solution, which
would result in a change in its solubility coefficient.
OXYGEN DIFFUSION AND CONDUCTIVITY MEASUREMENTS.
When starting a p0 2 measurement with a bare electrode, a primarily
high current is observed with a rapid exponential decrease (fig. 2).
the time course of the diffusion limiting current can be divided into
two parts:
1. an initial time dependent change of the diffusion limiting current
with a steep decrease from a maximal value directly after closing
the circuit.
2. after 30 msec., the diffusion limiting current approaches a
constant final value, the stationary part of the curve.
1 4

-c Q) ,_ ,_ :::::1 (.)
_0 10 20 30
time (ms.)
Fig. 2: Time course of diffusion limited current after
closing the electric circuit for o2 polaro
graphy.
Before measuring, the o2 concentration is constant, also at the
surface of the electrode. When the electric circuit is closed, all o2 molecules directly adjacent to the electrode surface are reduced so
that a maximal current is produced (together with the current
necessary to load the electrode capacitance when closing the circuit).
Due to this instant reduction of the molecules at the surface of the
electrode, a steep concentration difference between the surrounding
medium and the area adjacent to the electrode develops. o2 molecules
in the immediate area diffuse into the area and are reduced as soon as
they reach the electrode surface. This means that an o2 gradient field
is building up around the electrode. Thus, in the course of time it
takes the o2 molecules longer to diffuse to the electrode surface; in
other words the reduction rate is decreasing. This process continues
until the oxygen gradient field has reached its final dimensions which
are also determined by convection in the medium. At this point as many
o 2 molecules will diffuse to the surface as are consumed there,
1 5

marking the second stable part of the current/time curve where the
diffusion limited current remains constant. The time dependent change
of the diffusion gradient during the first part of the curve is
defined solely by the o 2 diffusion coefficient ( Do2 ). According to
Fick's second law, the diffusion time is reciprocally proportional to
D02 . This is independent of the area geometrics (Thews, 1960).
A hypothetical case of o2
diffusion through a membrane: it is
assumed that the 0 2 concentratien at one side of the membrane remains
constant, and that inside and behind the membrane there are no o 2 molecules. All o 2 molecules arriving behind the membrane are
imrnediately counted and removed, thus keeping the
concentratien constantly at zero. At the start of
molecules are diffusing into and through the membrane.
o 2 molecule
o 2 diffusion,
The number of
molecules arriving per time unit behind the membrane is now dependent
on two membrane factors:
1. on the resistance with which the membrane material is opposing the
diffusing o 2 molecules
2. on the number of o 2 molecules remaining in the membrane.
Instead of using resistance we may talk of the reciprocal value which
is conductivity; in this case represented by the diffusion
conductivi ty coefficient ( Ko2
). The number of molecules remaining
inside the membrane is defined by the o 2 solubility coeffi
cient ( ao2 ). When the membrane is saturated with o 2 , the diffusion is
only dependent on K0 2 in the membrane, and the surrounding P02 ,
according to Thews (1960):
K D =
60x a
The diffusion coefficient is directly proportional to K0 2 (diffusion
conductivity coefficient) and inversely proportional to
(solubility coefficient).
Assuming that by means of the electrode and the connecting
measuring system, o 2 molecules can be counted and eliminated, we can
conclude that the primarily rapidly decreasing current is defined by
D02 (as it is independent from ao2 and K0 2 ) and that the final stable
value is defined by K0 2 and P0 2 in the medium ( Erdmann and Krell,
1 6

1976). Changes of oo2 in a medium can only be recognised according to
the change of the first part of the current/time curve. Changes in K02 correspond with changes in the stationary part of the final value,
assuming that P02 and all other influences such as temperature, pH,
conveetien etc. are kept constant. On the basis of these consider
ations, it is possible to evaluate at least the relative values of
diffusion defining parameters. If a continuous measurement of the
actual P02 is performed by membrane covered electrodes, it is possible
to measure the oo2 , K02 and a o2 wi th a second bare electrode.
Determination of 002 .
As described above, the relationship between diffusion coefficient
and diffusion time is reciprocal. The hyperbol function is taken for
mathematical analysis of the time course of the adjustment curve:
1 )Y
where X
y
a + b x
time passed
current values registered
b can be calculated according to:
X1Y1 - X2Y2 b
x1 - x2
a can be calculated with known b according to:
a = (Y-b)X
For the calculation of the unknown diffusion coefficient of a medium, -5 a is measured in physiological NaCl with known oo2 = 2,0.10
(cm.sec- 1 ) (Goldstick, 1966). Then ä of the medium with unknown oo2 is
measured and D02 is calculated according to:
-5 2,0.10 ·a
a 1 2
a 1 mean value of n constants of a in physiological NaCl
a 2 mean value of n constants of a in analysed medium
1 7

Determination of K02 .
Bare and membrane covered electrode tips are calibrated in a
glycerine concentratien with known Ko 2 = K02 ( 1 ) (Gmelin, 1958). The
output voltages of the two amplifiers are adjusted to the same value.
The measurement is repeated in a second glycerine concentratien with
Ko2 ( 2 ) and the difference between the output voltages (Vd( 1 )) of the
two electrades is noted. This difference is proportional to the
difference of K0 2 in the two solutions The K0 2 (Ko2 ( 3 )) of the medium
to be analysed is calculated as follows:
3) Ko2 ( 3 l K02 ( 1) + ______________ .vd(2)
difference of output voltages in second glycerine salution
difference of output voltage in analysed medium
CONSTRUCTION OF MICROELECTRODES.
Fabrication of gold/glass wire.
Gold is chosen for electrode material as it is known that gold is
better suited for o 2 measurements than platinum. To simplify electrode
production a newly developed method, similar to the Taylor methad
( 1924), is used for constructing glass-covered gold wires (Nixdorf,
1967). They give a good basis for electrode construction and provide
the possibility to construct 3-dimensional multi-electrodes. A glass
tube is filled with gold dust and heated until the glass is soft and
the roetal has melted; then it is pulled out into a thin fibre. The
feed ratio of the glass/metal combination, in relation to the drawing
velocity of the fibre determines the diameter of the wire. This ~ay be
smaller than 1 micron. With this methad the production of thin gold
wire insulated by glass is simple, inexpensive and reproducible. The
glass-gold wire is cut into pieces of 1 - 2 cm. These gold wire pieces
are then put into a plastic tube cut at a 45° angle. The intermediate
space is filled out with a quick hardening plastic (Technovit 4071-d,
Kulzer & Co., Germany). The electrode tips are then ground in three
steps: Rough and fine sandpaper and finally leather polish. After the
grinding process, the plastic' block with the electrode tips in it is
1 8

put into acetone for a few hours to dissolve the plastic. The
electrode tips are now ready; they have the same length, they have an
oblique tip and are well ground with a defined gold surface.
<HI-----Capillary
~+--+----lnsulation
+-'!!!-+--+---Copper
~+-----1------t'-------- Gold nucleus
+---+-----,f------ Glass
1+---------- Membrane
Fig. 3: Oxygen microelectrode.
Fixing the electrode tips to the conducting wire.
This is achieved with the use of a stereomicroscope. A gold-glass
wire is stuck on a piece of adhesive tape. About mm of glass is
tweaked off the unground si de of the gold core wi th the aid of
tweezers. Then a conducting wire is fixed to a microdrive and brought
into contact with the free gold end of the electrode tip. A drop of
silver lacquer (Auromal 37 M, Doduco-Ng., Pforzheim, Germany) Fixes
both wires tagether in a few seconds, giving better conductivity than
soldering (see fig. 3). Finally the electrical contact is checked by
connecting the electrode system to a 4 V battery and measuring the
current flow.
Insertion of electrode system into guide capillaries.
For the final preparatien of the electrodes, glass capillaries of
mm inner diameter are pulled out in a electrode puller by means of a
1 9
heated platinum sling (own design). The conical tip is carefully
braken toa lengthof 0.5 - 1.5 cm, depending on the lengthof the
gold-glass wire. The diameter of the conical tip can be regulated by
the ratio of melting heat to pulling power. The glass capillaries are
fixed under the microscope and gold-glass wires are carefully inserted
under optical control. This procedure is easy because of the
flexibility and stability of the gold-glass wire combination. If the
wire bends, a short wi thdrawal is sufficient. The wire is inserted
until it sticks out of the capillary at the desired length. A drop of
waterproof glue is applied to both ends of the glass capillary.
Capillary action sucks the glue up, ensuring a perfect seal. The
electrades are placed in the open air for about 3 hrs to harden the
glue.
For production of the recessed chamber, the gold-glass conducting
wire system is cönnected to a 9 V battery and introduced into a beaker
of HCl. This is placed on a loudspeaker which vibrates at a controlled
rate. A horizontally adjusted microscope permits checking of the
chamber size. When ready, the electrades are dipped into a salution of
3 rnalar KCl for the electrolyte in the measuring chamber and then into
a special plastic such as Primal Ac+35. Primal produces very thin
membranes down to 1 to 2 micron and adheres tightly to the surface of
the electrode. The membrane characteristics of Primal are well suited
to the stirring effect, do not affect response time too much and save
recalibrating the values in different mediums (Krell 1973, Med Diss.
Mainz).
Construction of P02 multi-microelectrodes.
One-tip microelectrades are the basis for the production of
multi-microelectrodes. A glass capillary is drawn out to a diameter
which will suit as total diameter of the multi-microelectrode. Then a
gold-glass wire with the conducting wire is inserted into the
capillary and fixed as described above for one-tip electrades. Six
more electrode tips are fixed equidistantly to the outside by silver
lacquer to form a hexagon. The electrode tips are left free and as
long as the central gold-glass wire (fig. 4). By rnaving the
multi-microelectrode into the tissue in defined steps, a 3-dimen
sional P0 2 , tissue perfusion and action potential registration in a
tissue cylinder can be performed.
20

conducting wire
Ag/AgCI
Uhu plus 5-minutes
gold wire with glass coating
....... r
7
ARRANGEMENT OF ELECTRODE TIPS
Fig. 4: Diagram of multi-microelectrodes.
Indifferent electrode.
For indifferent electrodes, Ag/AgCl electrades can be used. For
this purpose, a thin layer of the above described silver lacquer is
applied to the outside of the electrode. In mul ti-electrodes, the
lacquer used for fixing the electrades to the capillary can be used.
Sametimes a separate reference electrode is necessary (eg. when using
custom-made myocardial electrodes). In this case, a silver wire
electrolytically covered wi th AgCl can be inserted in the nearby
tissue. As AgCl tends to form chemical complexes with protein, the
bare AgCl electrode cannot be used for highly accurate measurements.
21

Bare tip
Conducting wire
Drawn out double barrel glass cappillary
Glue
Gold glass wire
Membrane covered recess chamber
Fig. 5: Double-barrelled microelectrode for P02 , o2 concentration, K0 2 and o2-solubility deter
mination.
For this purpose the Ag/AgCl electrode is modified: a silver wire
combined with AgCl is inserted into a glass capillary and one side is
fixed with glue. This capillary is then filled with a 1 M KCl
solution. The other side of the capillary is then closed with
agar-agar in 1 M KCl. This way contact is prevented between tissue
protein and AgCl while a reliable electrolyte bridge is ensured.
22

Construction of double-barrelled microelectrode for P0 2L Q2 concentration, oo
2L Ko2 and Q
2 solubility determination. (fig. 5).
The measuring device consists of a double-barrelled o 2 micro
electrode: a bare o 2 concentratien measuring electrode and a membrane
covered recessed tip P02 measuring electrode. The P02 electrode is
calibrated in the polarographic circuit in 25% albumin at 150 mm Hg
and in 0.2 M KCl at 150 mm Hg. Only electrades which yield the same
current in bath solutions, proving absolute partial pressure measure
ments, are used for the studies.
Design of electronic equipment.
The P02 amplifying circuit.
The current measured by microelectrades can only be registered
through extremely high amplification. For this purpose,
amplifiers wi th field effect transistor input are used
integrating
( 1 011 ohms
input impedance, type 100902 or 1421, Philbrick/Niexus, Massachusetts,
USA). These operational amplifiers (OA's) are characterised by maximal
amplification (open feedback circuit) of 10 5 ; this means 100 micro
volts at the input of the amplifiers is enough to obtain maximal
output voltage (10 V). Because of the extremely high input impedance
of the OA the current runs over the resistor in the feedback circuit.
As the potential difference at the input of the amplifier is only 100
microvolts during maximal amplification, negative input of the
amplifier merely is on mass potential. The potential drop of 100
microvolts is extremely
of 800 millivolts; this
completely supplied to
resistor in the feedback
small compared with the polarisation voltage
means that the polarisation voltage is almast
the electrades. The voltage drop over the
circuit is identical to the output voltage of
the amplifier. As Ie runs over the resistor R, Ua will be according to
ohm's law: Ua Ie.R. The current running over the amplifier thus
produces at the output of the amplifier a voltage which is directly
proportional to the current. This voltage can be used to drive regis
trating apparatus. To obtain different amplification factors,
changeable resistors from 10 megohm to 1 gigohm are brought into the
feedback circuit.
23

Additional circuit for measurement of Q2 concentratien and diffusion
parameters.
A second polarographic circuit is connected to the bare electrode
tip and o2 concentratien is registered. A circuit breaker is
introduced which intermittently disconnects the bare electrode from
the polarisation voltage while shorting it to the reference electrode.
After re-application of the polarisation voltage a diffusion
determined curve is registered from which D02 is calculated as
previously described.
Eguipment for combined Q2
and ~2-measurement. It is also possible to measure hydragen clearance with the same
electrode tip. The time course of hydragen clearance is used to
determine tissue perfusion. For this purpose, the polarisation voltage
must be rapidly changed from -800 mV for P0 2 measurements to +100 mV
for PH2 measurements. The demands on the amplification circuit are:
rapid reproducible change of polarisation voltage within milliseconds
and sensitivity for current measurements in the range of 10-11 to 10- 6
amperes.
General circuit.
The polorisation voltage of -800 mV and +1 00 mV is supplied by 2
batteries over 2 voltage dividers. The desired polorisation voltage
can be separately adjusted by means of 2 linear werking 10 kilohm
potential meters. When changing over from one polorisation voltage to
the other, the measuring circuit is short-circuited for 10 to 100 msec
so that capacitive components in the circuit are unloaded, ensuring
rapid adjustment. The feedback circuit of the amplifying oa consist of
3 different resistors to change the amplification factor. A capacitor
of 100 pf eliminates noise amplification.
Specified circuit for ~2 ~ Q2 polaroqraphy.
The very simply constructed electronic circuit described above is
much more complicated when changing over from 3 batteries to one
battery supplying the OA's and the polorisation voltages. This means
that additional separating amplifiers have to be introduced to prevent
interference between werking and polorisation voltages. Furthermore,
it is sametimes desirable to be able to register the voltageleurrent
curve (polarogram) of the microelectredes for H2 and o2 . The elec-
24
tronie circuit is shown in fig. 6.
6.8~F
Fig. 6: Diagram of a specified H2-o2 measuring system.
Polarisation voltage is produced by the output of an OA (OA2). For
the measuring circuit, a current to voltage converting amplifier, OA3,
with a high input impedance of 1012 is used. The range of current
measurement is changed by switching the feedback resistor. The polor
isation voltage can be changed by means of different potentiometers.
an integrator is included for automatic registrations of o2- and H2-
polarograms. The integration time can be changed by introducing
different resistors between battery and integrator OA1. The voltage
range of integration is given by the position of the two potentio
meters described above.
Electronic eguipment for sirnul taneous action potential measurements
and P02-H2-polarography.
sametimes it is necessary to obtain a functional relationship
between the regional P02 value, tissue perfusion and one of the most
important physiological parameters in the bra in tissue: the local
action potentials. The electronic circuit has been adapted so tha t
25

simultaneous registration of the action potentials and either tissue
P0 2 or H2 clearance is possible. In this case, two opposing
requirements must be fulfilled: AP measurements have to be performed
using an amplifier with a high input impedance, while Po2 measure
ments require a current amplifier with a low input impedance. At first
resistors (Rv) of up to 10 6 ohms were connected in series with the
electrode (Rel; Rv<Re1 ), but their resistance was too low; one was
essentially short circuiting the input of the de amplifier, making the
input signal almost unmeasurable. Later, resistors (Rv: R9_12 ) of
107-101
0 ohms (Rv>Rel) were used. Under these circumstances one
decreases sensitivity as well as adding non-linearity. Since the
voltage between the electrades (Uel) now changes in response to Rel·
Uel becomes a function of Rel and Rv according to the formula Uel = Ua.Re1 .(Rel + Rv) (Erdmann, Kunke & Krell, 1973).
To obtain a constant polarisation voltage and to overcome the
described difficulties, a feedback circuit is introduced. In the new
system (fig. 7), the polarisation voltage is measured and regulated by
an amplifier (OA1). The input of OA1 is connected via potentiometer R1 to the negative pole of the power supply. R1 is adjusted to the
desired polarisation voltage. The output potential of OA1 corresponds
to the difference between the desired polarisation voltage and the
actual value. As the output
polarisation voltage, the
output of OA2 is connected
(in this case R10 ).
potential should compensate for changes in
output value must be inverted (OA2). The
to the electrode in series with resistor Rv
Dynarnic properties of the feedback circuit: The DC voltage across Rel
is kept constant because OA2 only responds to very slow changes in
potential. Therefore the input voltage to OA4 is a function of Rel'
which is proportional to P02 . OA4 is a leaky integrater and the output
voltage is proportional to P0 2 • 0A1 and OA3 respond to rapid changes
in potential and measure action potentials.
26

Fig. 7: Electric feedback circuit maintaining a
constant polarisation voltage at a desired
value. This voltage is measured by operational
amplifier OA1. OA2: inverting amplifier; OA3:
for AC amplification; OA4: o2 /H2 amplifier.
List of major resistance and capacitance
values:
R1 500 ohm R13 1 0 k c3 1 00 nf
R2 4.7 k R14 1.2 M c4 220 nf
R3 1 0 k R16 1 0 M cs 8 pf
R4 50 k R17 80 M
R6 1 0 k R18 680 M
R7 1 M R19 G
R1o= 1 00 M
Accuracy of the polarisation voltage: Only a minimal potential
difference of 2 mV at the input of OA1 is necessary for regulating the
polarisation voltage to a constant value, because the open-loop
27

circuit amplifies 500 times. This means that the accuracy is within
0.2%.
AP measurements: Action potentials are coupled with the electrode
system by capacitance of the plastic membrane and the electrical
double layer at the electrode tip. OA1 has an amplification factor of
5; a secondary amplification ( 1 00) of the AP signal is obtained by
OA3. Frequency linearisation is possible by varying capacitance c 4 and
c5 . OA2 is a DC amplifier. The bandwidth is limited to about 5 Hz by
means of a feedback capacity.
THE PROBLEMS OF SHIELDING WHEN WORKING WITH lQ MICRON ELECTRODES.
The signal to noise ratio can be very low because AP signals are
sametimes far below 100 microvolts and P02-dependant currents in the
picoampere range. Capaci ti ve filtering cannot be used because the
action potential signals would also be filtered out. Thus shielding is
necessary. This must comply with several requirements:
a. Measurements must be performed in a closed roetal cage.
b. Conneetion cables must be well shielded.
c. As registration instruments are supplied by line voltage,
disturbances may occur. Another souree of interf erenee may come
from registration instruments thernselves (e.g. spikes frorn electro
magnetic equipment). A di scanneetion should therefore be intro
duced between the shielded measuring circuit and the registrating
circuit.
Shielding procedure:
The experiments are performed in a closed chamber of 5 mm steal
wi th a second internal chamber of 2 rnrn copper; or in a highly
shielded pre-fabricated charnber by Siernans (Faraday cage). All cables
in the system are shielded. In this way outside disturbances are
suppressed (fig. 8). However, disturbances are still caused by the
registration system, through the output circuit of the amplifier, into
the highly sensitive pre-amplifying system. These disturbances can
only be suppressed by a total disconnection of the amplifying system
and recording systern. This absolute galvanic isolation can be achieved
using an infra-red telernetric transmission of the information
(fig. 9).
28

insp. gas
stereotact. holder
DC
AC
Fig. 8: Experimental procedure in highly shielded
cage. The animal is fixed in a stereetactie
holder inside a chamber of 2 mm capper
surrounded by a chamber of 5 rnrn steel. The
electrode is driven in the tissue by means of
a micromanipulator. The signals are outputed
via LED's sa that na galvanic conneetion
exists between the inside and outside of the
cage.
Electronic eguipment for AP and P02 ~ D02 transmission:
The voltage output of the amplifier drives a light-emitting diode
(LED; gallium-arsenide diode). The light-modulated signalis received
by a phototransistor, which is connected to another amplifier. High
output voltage of the amplifying system causes high light intensity of
the emitting diode and produces a higher current in the photo
transistor (Through emitter and collector). The voltage drop in the
emitter circuit of the phototransistor is amplified by the succeeding
amplifier mentioned above. The output of this amplifier supplies the
recording system.
29

h.t. ~
I I
I I I net
conrwcted
oe OUTPUT
Fig. 9: Diagram of a symmetrie two-channel electronic
system for DC transmission with automatic
temperature correction.
The LED is driven by the output of the pre-amplifying system, which
means by the battery inside the cage. On the other hand, the photo-
transistor
battery, so
and corresponding amplifier are supplied by their own
that the pre-amplifying and recording system are fully
disconnected. The active parts of these circuits are sensitive to
temperature changes. So for P02 /H2 transmission, temperature stabil
isation is achieved with a symmetrie two-channel opto-electronic
system driven by a double transistor. Both channels consist of exactly
the same parts, implying that they have the same temperature error.
One channel reproduces the information while the other shows a com
parison (indifferent channel). As the output signal is picked up as
the difference between the output of both channels, temperature error
is compensated. To prevent loss of energy by diverging light, a glass
fibre bundle can be used. That way, considerable di stances can be
bridged, even around corners.
30

Problems relating to the continuous registration of cardiovascular
and respiratory parameters must also be taken into consideration. Two
demands have to be fulfilled: (a) the electronic circuit must be DC
supplied, werking on batteries inside the cage; (b) all parameters
must also be transmitted via light bridge as described above.
RECORDING EQUIPMENT.
All commonly used recorders for either DC or AC registration as
well as oscilloscopes are applicable. As the output of the OA is
always secured against accidental short circuiting by 1-10 kilohm
resistors, the input impedenee of the recorder should be at least 10
times higher (preferably 1 megaohm) in order to avoid voltage dividing
problems.
CONCLUSION.
The described system has been routinely used in our laboratory to
investigate basic physiological problems that were, until now,
inaccesssible. The combined measurement of various micro-
physiological parameters offers new insight into processes within the
cell itself. This in turn has significant implications for clinical
* knowledge and, ultimately clinical treatment regimes.
REPERENCES
Erdmann W., Kunke S., Krell W.(1973) Tissue P02 and Cell Function- an
Experimental Study with Multi-microelectrodes in the Rat Brain.
Oxygen supply Ed. Kessler et al. Urban & Schwarzenberg,
Muenchen, Berlin, Wien.
Erdmann W., Krell W. (1976) Measurement of Diffusion Parameters with
Noble Metal Electrodes. Adv Exp Med Biol Eds. Grote et al.
Plenum Press, New York-London.
Kolthoff J.M., Lingana J.J. (1952) Polarography. Interscience
Publishers, New York-london.
Gmelin (1958) Handbuch der anorganischen Chemie. Hrsg. Deutsche
Chemische Gesellschaft, Weinheim/Bergstr.: Chemie 3: 446.
Goldstick T.K. (1966) Diffusion of Oxygen in Protein Solutions Ph.D.
* see later chapters 31

Thesis, Univ. of California. Berkley USA.
Nixderf I. {1967) Ein neues Verfahren zur Herstellung duenner Draehte
mit Durchmessern im Micron-bereich. Draht Welt. 53: 676
Taylor G.F. {1924) A Methad for Drawing Metallic Filaments and a
Discussion of their Properties and Uses. Phys Rev 23: 655-660.
Thews G. {1960a) Ein Verfahren zur bestimmung des o2-Diffusion
koeffizienten, der o2-Leitfahigkeit und des o2-Loslich
keitskoeffizienten im Gehirnewebe. Pflugers Arch. Ges Physiol
271: 227.
Thews G. {196Gb) Sauerstoffdiffusion im Gehirn. {ein Beitrag zur Frage
der Sauerstoffversorgung der Organe). Pflugers Arch Ges Physiol
271: 197
Whalen W.J., Riley J., Nair P. {1967) A Microelectrode for Measuring
Intracellular P02 . ~ ~ Physiol 23: 789.
32

GENERAL REMARKS ON P02 ELECTRODE CHARACTERISTICS
The previous section explains the theory behind P02 measurements,
and gives details of the fabrication of the microelectrades and the
electronic circuits. In order to use the electrades the reliability of
the electrode system must also be tested. Therefore certain factors
must be taken into consideration, including: linearity, calibration,
drift, temperature and response time.
LINEARITY
This was checked by bubbling 100% N2 , 2% 0 2 , 5% 0 2 and air through
a bubble chamber into which the electrode was inserted. It could thus
be shown that in all electrades there was a positive linear relation
ship between the P02 and the readout of the amplifier or the
deflection of the recorder. This linearity remains true even if there
is a drift in the absolute measurements in the course of time. The
drift itself, in these in vitro studies, also proved to be linear in
the course of time. As described in the previous section, only those
electrades were used which produced the same results in saline as in
protein solutions when equilibrated to the same P02 .
CALIBRATION PROCEDURE
Before each experiment the electodes were inserted into a bubble
chamber containing a saline salution kept at 37° C. Gases of a known
P02 were bubbled through the chamber and, after equilibration, the
measurements recorded. The in vivo measurements could be then compared
to the calibration points to calculate the actual P02 .
33

There are two kinds of drift:
Baseline drift
If P02 is measured in 100% N2 , the current measured should be nil.
This is only sa, however, if the electrades are allowed to stabilise
for to 2 hours (depending on the type of electrode) after
polarisation. After this period of time the current measured with 0%
o2 is indiscriminantly low, thus this baseline drift can be discarded.
Measurement drift
The electrades were also calibrated at the end of each experiment.
Often a drift in the measured current was observed. It was therefore
necessary to calculate the drift per time unit and correct all
measurements. If the drift was more than 7.5% per hour, the electrode
was discarded.
TEMPBRATURE
Due to the physical quali ties of the noble me tal, the current
produced by the microelectrades is proportional to the temperature. In
vitro it could be shown that this current is linear to the temperature
between 20° C and 38° Catdifferent P02 's. With the aid of a Philips
P2000 computer all measurements were corrected for temperature and
drift.
RESPONSE TIME
The response time of the electrode system is difficult to measure
because of the quick response of the microelectrodes. The response can
only be demonstrated on an oscillograph in the farm of the adjustment
current as demonstrated in fig. 2 (previous section). In this figure
it can easily be seen that adjustment to a terminal new P0 2 value
takes less than 30 ms. To reách within 10% of this value takes less
34

than 10 ms. This is the case in all electrodes. Direct measurement of
the response time is not possible (or necessary) as changes in P02
from one partial pressure environment to another takes longer than the
response time itself.
CONCLUSION
Now that it is possible to fabricate a reliable electrode system
that will produce realistic and reproducible results, it is possible
to use this system in vivo. This is shown in the following chapters.
35


CHAPTER 3
OXYGEN TENSION IN THE PRE-OVULATORY AND NON-OVULATING FOLLICLE OF THE
RAT
* ** * * M. Fennema , G. Zeilmaker , S. Faithfull , W. Erdmann
* ** Departments of Anesthesiology and Endocrinology
Erasmus University, Rotterdam
Adv. Exp. Med. Biol.(1986) 200: 457-462
INTRODUCTION
In 1978 Edwards and Steptoe were the first to fertilise an oocyte
in vitro. Succestul reimplantation of the embryo subsequently led to
the birth of the first 'test tube' baby. This procedure has been
repeated many times and since 1982 has become routine in this
institute (Zeilmaker et al, 1984). In view of these developments, it
has become more and more important to understand the mechanisms
determining ovulation, so that oocytes can be incubated under optimal
conditions.
As shown in figure 1 , ovulation cammences after a sharp increase in
the luteinising hormone (LH) and follicle stimulating hormone (FSH).
Pincus (1935), after demonstrating in vitro oocyte maturation in the
absence of hormonal changes, concluded that the hormonal changes that
take place only have an indirect influence on the oocyte. Zeilmaker et
al (1972) showed that, in vitro, oocytes incubated in a high oxygen
concentratien (90%) matured, while those incubated in the absence of
oxygen did not. This in vivo investigation was performed to determine
the relationship between oxygenation of the follicle and ovulation.
37

Days before and after surge secretion.
Fig. 1 : Monthly changes in the human ovarium tissue
(top) and the uterus (bottom) are induced by
changes in gonadetropie hormone concentra
tions in the blood. The surge of secretion of
luteinising hormone (LH) and the follicle
stimulating hormone (FSH) leads to ovulation:
the oocyte is released after the first meiotic
division. Degeneration of the corpus luteum
causes menstruation.
MATERIAL AND METHODS
Two groups of RxU rats were compared:
- A non-ovulating group of proestrus rats, where ovulation was
inhibited by phenobarbitone (35 mg.kg- 1 ). This was always given at
13.00 hrs to ensure that experiments were always performed in the same
phase in the oestrus cycle.
38

- An untreated pre-ovulatory group.
The measurements always took place between 16.00 and 18.00 hrs so that
all the rats would be secreting the pre-ovulatory LH-surge. This was
confirmed by examinatien of vaginal smear. Under tribromaethanol
anaesthesia, the abdomen was opened, and an ovary exposed. An o2 microelectrode was then introduced into an ovarian follicle using a
micromanipulator and stereo-microscope (Leitz).
Polarographic techniques were employed to measure oxygen partial
pressure (P02 ). When a noble metal electrode is negatively polarised,
oxygen is reduced, causing a current to flow through the measuring
circuit. At -800 mV, this current is directly proportional to the
oxygen concentration, or the partial pressure if measured in a medium
with a constant o2-solubility coefficient, as described by Erdmann et
al (1970). Briefly, these electrades are made as fellows (fig. 2): a
glass-covered gold wire of approximately 10 microns diameter is glued
with silver lacquer to a copper wire and this combination is inserted
into a tapered glass capillary ( 2 mm diameter) so that the gold
protrudes from the tapered end by about 0.5 mm. The gold wire is glued
into the capillary, while the copper wire is also glued to the
capillary so that it cannot be pulled out. The tip of the gold
electrode is covered with an oxygen permeable plastic membrane
(Rhoflex) so that the electrode measures in a medium with a constant
o2-solubility coefficient. This ensures correct partial pressure
measurements. This membrane also prevents protein poisoning and
minimises conveetien disturbances. A detailed description of the
fabrication of the electrades and electrooie circuitry involved is * described elsewhere (Fennema and Erdmann 1985).
An hour befare each series of measurements, a microelectrode was
connected to the polarisation voltage, using a Ag/AgCl wire as
reference electrode. This system was connected to a Knick nano-ampere
meter which amplified the current measured so that the readings could
be recorded on a Ricka Denki recorder model KA 60. Because the -8 -12 currents measured are so small ( 1 0 to 1 0 amperes) , the measure-
ments were performed in a Faraday cage.
* see chapter 2 39

....-+---Capillary
li*-+---+----lnsulation
-lil-+---+---- Copper
~'-------1---f----- Gold nucleus +---1---t'------ Glass
11+---------- Membrane
Fig. 2: Oxygen microelectrode.
This electrode consists of a gold wire of 1-5
microns, with a glass layer of the same
thickness. The gold is connected to a
conducting copper wire with silver lacquer.
Th is wire is connected to the polarisation
voltage (-800 mV). The gold and copper is
protected by a glass capillary.
After stabilisation, the electrode was calibrated in a 37° C saline
solution, through which gases containing 2 or 5% oxygen in nitrogen
could be bubbled for equilibration. The electrades were recalibrated
after the experiment, and the results discarded if the drift was more
than 7.5% per hour. After discarding measurements that did not meet
the above mentioned criterea, there remained 41 different follicle
oxygen tension measurements in the non-ovulating group, and 68 in the
* pre-ovulatory group . Statistical analysis, consisting of unpaired
* 40 12 and 16 rats resp.

Student-t tests and the Kolmogorow-Smirnow tests for distribution
differences, were performed using a Commodore-64 microcomputer. Signi
ficanee was accepted at a p value of less than 0.05.
fi 15
10
5
fj 15
10
5
mean = 23,5 SD = 11,90 SEM = 1,44 skewness = 0,736 Kurtosis = -0,077
2 6 1 0 14 18 22 26 30 34 38 42 46 50 54 58
non-ovulation mean = 11,7 SD = 7,16
SEM = 1,12 skewness = 1,070
kurtosis = 0,632
2 6 1 0 14 18 22 26 30 34 38 42 46 50 54 58
Student t test : p < 0,001 Kolmogorov-Smirnov test : p < 0,001
Fig. 3: Histograms of oxygen tension in the rat
follicles.
RESULTS
The mean P02 in the non-ovulating ovarian follicles was 11.7 mm Hg
(~1.12 SEM). This was lower than the oxygen tension in the ovulatory
follicles, which showed values of 23.5 mm Hg (~1.44 SEM). These re
sults were highly significant on an unpaired Student-t test (p <
0.001 ). As shown in figure 3, there was a significant difference in
41

P02 distribution between the two groups (Kolmogorow-Smirnow test, p <
0.001).
DISCUSSION
This investigation demonstrated that oxygen partial pressure in the
ovarian follicle increased just befare maturation of the oocyte.
Zeilmaker et al (1974) have postulated that oxygen may be the limiting
factor in the resumption of the first meiotic division in the
pre-ovulatory oocyte. The P02 is probably critical, as Whiten (1969)
has shown that incubation in a toa high concentrations of o2 is
probably detrimental to oocyte and zygote development. Although some
investigations have been performed (Zeilmaker et al, 1972, 1974), more
biochemical information is needed to determine the relationship
between LH increase, oxygen partial pressure increase, metabolism and
ovulation. It is possible that a change in oxidation/reduction
potentials in the follicular fluid effects the oocyte. Direct or
indirect effect of LH might increase the oxygen permeability of the
follicular wall and this would cause the P02 to increase. More ATP
could be produced, which might enable continuous maturation of the
oocyte.
More investigations are needed to establish the optimum P02 for
oocyte and embryo (or zygote) incubation. The onset of ovulation and
the time of reimplantation can then be manipulated to coincide with
ideal uterine environment.
REPERENCES
Edwards R.G., (1962), Meiosis in ovarian oocytes of adult mammals.
Nature, 196: 446.
Erdmann W., Krell W., Metzger H., Nixderf I., (1979), Production of a
standardised gold microelectrode for measurement of tissue P02 •
Pflugers Arch Ges Physiol, 319.
Fennema M., Erdmann W., (1985) Online determination of P02 , oxygen
diffusion, tissue perfusion and action potentials with a 10
micron electrode system. Proc Sensor '85, Netwerk Events.
5:8.2.1
42

Pincus G., Enzmann E.V., (1935), The comparative behavior of mammalian
eggs in vivo and in vitro. ~ Exp Med, 62: 665.
Whiten W.K., (1969), The effect of oxygen on cleavage of mouse eggs in
vitro. Prae Soc Study Reprod, 2: 29.
Zeilmaker G.H., Hulsmann F., Wensinck F., Verhamme C,. (1972)
Oxygen-triggered mouse oocyte maturation in vitro and lactate
utilisation by mouse oocyte and zygote.~ Reprad Fert, 29:151.
Zeilmaker G.H., Verhamme C.M.P.M., (1974), Observations on rat oocyte
maturation in vitro: Morphology and energy requirements. Biol of
Reprod, 11: 145
Zeilmaker G.H., Alberda A.T., van Gent I., Rijkmans M.P.M., Drogendijk
A.C., (1984), Two pregnancies following transfer of intact
frozen-thawed embryos. Fert Steril, 42(2): 293.
43


CHAPTER 4
TISSUE OXYGEN TENSION IN THE CEREBRAL CORTEX OF THE RABBIT
INTRODUCTION
Oxygen supply to the tissue micro-area is dependent nat only on
cardiac minute volume, pulrnonary gas exchange and the distribution of
circulatory blood volume, but also on:
capillary perfusion,
oxygen diffusion through erythrocyte, plasma, capillary wall and
interstitiurn,
oxygen consurnption of the cells in the surrounding area.
Conditions such as bleeding, shock, ischaernia and drug
adrninistrati.on, as well as anaesthetic procedures, rnay rnarkedly affect
one ar more of these factors. Thus sirnple external factors can affect
rnany internal rnechanisrns wi th a re sul ting decrease ar increase in
tissue oxygen tension (P0 2 ). These changes rnay leadtoa disturbance
in the regula ti on of the supply I dernand ratio, sametirnes wi th severe
adverse effects.
It is known that autoregulative rnechanisrns exist to rnaintain
balance in the internal environment. Chen et al. ( 1 978) and Erdrnann
(1978) have hypothesised that an autoregulative rnechanisrn exists in
the cell rnernbrane which enables it to rnaintain an intracellular P02 at
a (low) value of 5-6 rnrn Hg. Their studies showed that the relation
ship between intra- and intercellular P02 is nat statie, thus rnaking
predietien of P02 profiles by computer rnodels difficult (Chapter 1 ).
This study was perforrned to test the reliability of the glass-gold
microelectrades in vivo, to assess the cerebral P02 profile under
normal conditions of anaesthesia and to investigate the effects of
45

hyperoxia and hypercapnia on cerebral tissue P02 and its auto
regulation.
MATERIAL AND METHODS
A pilot study was perforrned in 7 adult albino New Zealand rabbits
(~ 2.5 kg). For rneasurernent of cortical P02 , single-barrelled glass
protected gold microelectrades (as described in Chapter 2) were used.
Because such electrades break with any lateral rnechanical rnovernent,
the animal was treated to preclude all possible rnovernent. This was
achieved in the following rnanner:
A few days befare the experiment the rabbi t was subj ected to
induction of anaesthesia with halothane and operated on under strict
sterile conditions. After exposing the frontal portion of the skull, a
bolt was fixed to the skull by rneans of dental cement. The grip of the
cernent was strengthened by four srnall balts, screwed into the skull
around the large bolt head. The animal was then allowed to recuperate
for three days. For the actual experiment (4th day), induction of
anaesthesia was perforrned wi th thiopental ( 3 0 rng /kg i.v. ) and the
rabbit was intubated. Ventilation was rnaintained with 30% oxygen and
70% nitrous oxide using a Keuskamp infant ventilator, set to a
frequency of 40 per minute. Muscle relaxation was achieved with
adrninistration of pancuroniurn (2 rng/hour) via an ear vein. The head of
the rabbit was firrnly attached to a rnodified stereotactic holder (own
design) by rneans of the 'unicorn' bolt and the electrode attached to a
micromanipulator as a fixed part of the stereotactic holder; thus
movement of the rabbi t' s he ad, in rel a ti on to the electrode, was
irnpossible.
Two srnall holes were drilled into the skull to facilitate EEG
recordings. Arterial pressure was rnoni tored by rneans of a catheter
inserted in one of the fernoral arteries. To check adequate vent
ilation, end expiratory co2 was rneasured by capnography at the
entrance of the intubation tube. The tubing leading to the capnograph
was ~ 2 rn long with a total volurne of ~ 2 rnl, accounting for a time
delay in registration of about 3 seconds when using a suction rate of
40 rnl/rnin. I
46
A burr hole was drilled above the right visual cortex. After
removal of the dura mater, a thin layer of paraffine was applied to
the cortex, supplemented by a layer of agar-agar to prevent 0 2 leakage
and minimise movement of the cortex due to ventilation. The electrode
was calibrated and inserted into the cortex with a micromanipulator
under visual guidance of a stereo-microscope. The reference electrode
was inserted into a muscle exposed by the surgical wound. All
parameters were registered and recorded on a mingograph recorder
(Siemens).
The experiments were performed in a Faraday cage, while the
ventilatory and registration apparatus were outside the cage to
eliminate feedback noise and electrical interterenee (see Chapter 2).
This meant that the length of tubing from the ventilator to the animal
was about 2 m. Conseguently, there was an enlarged system volume and a
rather long latency period following changes in inspiratory gas
concentrations.
RESULTS AND DISCUSSION
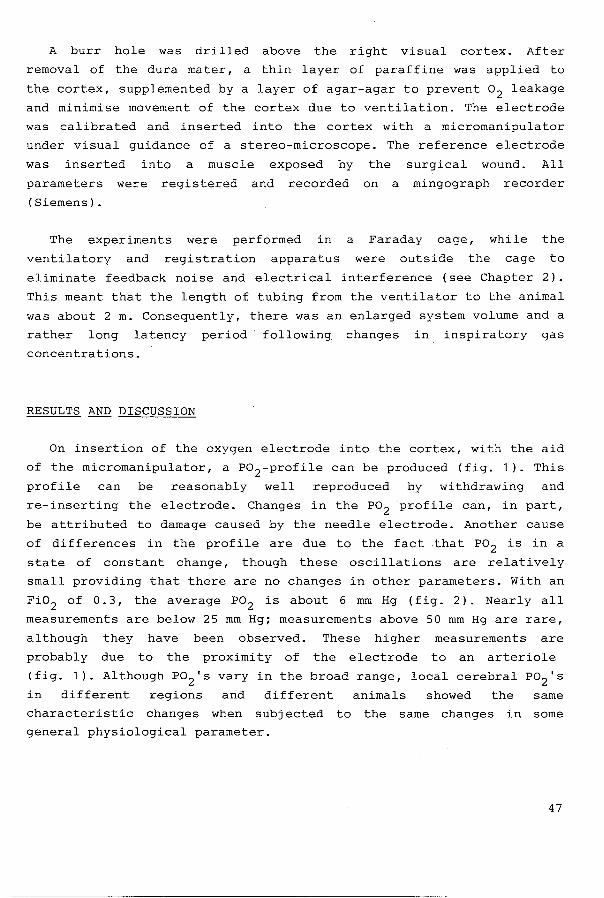
On insertion of the oxygen electrode into the cortex, with the aid
of the micromanipulator, a P02-profile can be produced (fig. 1 ). This
profile can be reasonably well reproduced by withdrawing and
re-inserting the electrode. Changes in the P02 profile can, in part,
be attributed to damage caused by the needle electrode. Another cause
of differences in the profile are due to the fact that P02 is in a
state of constant change, though these oscillations are relatively
small providing that there are no changes in other parameters. With an
Fi02 of 0.3, the average P02 is about 6 mm Hg (fig. 2). Nearly all
measurements are below 25 mm Hg; measurements above 50 mm Hg are rare,
although they have been observed. These higher measurements are
probably due to the proximity of the electrode to an arteriole
(fig. 1 ). Although P02 's varyin the broad range, local cerebral Po2 's
in different regions and different animals showed the same
characteristic changes when subj ected to the same changes in some
general physiological parameter.
47

30
01 ::c E E 20
N
0 c..
10
100 200 300 400
depth of electrode (JJ)
Fig. 1: Typical example of a P02 profile in the cortex
of a rabbit. Note the high sensitivity of the
electrode.
It should be noted that these electrades can measure values less
than 1 mm Hg. In these studies measurements of even lower values were
not necessary as mitochondrial activity ceases at 0.4 mm Hg (Chance et
al., 1957).
Figure 3 shows the typical pattern of cerebral tissue P02 following
a change from an F i02 of 0. 3 to 1 . 0. The arterial pressure and
expiratory co 2 remain constant. Whilst still ventilated with 30% 0 2 ,
the tissue P02 in this animal was .±. 23 mm Hg. This high value is
probably due to the electrode being close to a well-oxygenated
arteriole. Measurements in a poorly-oxygenated area will produce less
marked effects of hyperoxia. The period of more than one minute delay
after the increase in inspiratory o2 is partly due to the enlarged
system volume of the tubing system. In addition, there is a time lag
befare the increased Fi02 actually has an effect on the capillary and
48
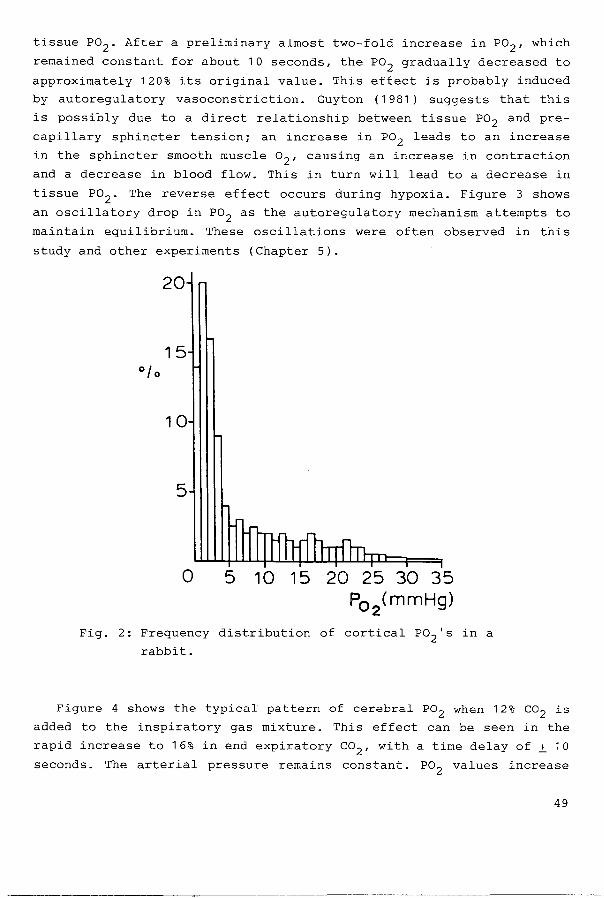
tissue P02 . After a preliminary almost two-fold increase in P02 , which
remained constantforabout 10 seconds, the P02 gradually decreased to
approximately 120% its original value. This effect is probably induced
by autoregulatory vasoconstriction. Guyton (1981) suggests that this
is possibly due to a direct relationship between tissue P02 and pre
capillary sphincter tension; an increase in P02 leads to an increase
in the sphincter smooth muscle o2 , causing an increase in contraction
and a decrease in blood flow. This in turn will lead to a decrease in
tissue P02 . The reverse effect occurs during hypoxia. Figure 3 shows
an oscillatory drop in P02 as the autoregulatory mechanism attempts to
maintain equilibrium. These oscillations were often observed in this
study and other experiments (Chapter 5).
20
15
10
5
0 5 10 15 20 25 30 35 P02
(mmHg)
Fig. 2: Frequency distribution of cortical P02 's in a
rabbit.
Figure 4 shows the typical pattern of cerebral P02 when 12% co2 is
added to the inspiratory gas mixture. This effect can be seen in the
rapid increase to 16% in end expiratory co2 , with a time delay of~ 10
seconds. The arterial pressure remains constant. P02 values increase
49

slowly to nearly three times their original value and show li ttle
tendency to compensate. This increase in P02 is due to a direct effect
of co2 and H+ on blood vessels, leading to vasodilation and a
consequent increase in blood flow and tissue Po2 . In normal
circumstances this increase in blood flow would eliminate co2 ,
diminishing the vasodilation stimulus so that P02 would decrease. In
this study co2 was kept artificially high, so that maximum vaso
dilation was maintained. It should be noted that in non-ventilated
animals (or humans) a high arterial Pco2 leads to hyperventilation,
with an increase in tital volume, causing a transient rise in
expiratory co2 . Inspiratory co2 values of higher than 9% cause
depression of respiration, rather than a further increase. This can
ultimately lead to death.
50
50 P02
(mmHg)
40
30
20 Fi0 2 100%
10
0 I
i
0 60 70 80 90 1 00 11 0 1 20
Time (sec)
Fig. 3: An example of change in cerebral
response to a change in Fi02 from 0.3
in a rabbit.
1 30
P02 in
to 1 • 0 1

This experiment demonstrates that, as is generally accepted, co2 stimulates an increase in blood flow. This effect is strenger than the
effect of hypoxia. A level of 12% inspiratory co2 will lead to an
increase in cerebral tissue P02 . During the relatively short period of
observation (~ 5 min) Po2 values remairred high; no cernpensatien for
the vasodilatory effect of co2 was observed.
30
25
20
15
10
5
0
0
Fig. 4: An
in
e e P0 2 (mmHg)
~ exp. co2 (vol. %)
1 0 20 30 40 50 60 70
Time (sec)
example of cerebral tissue
80
P02 relation to end expiratory co2 .
90 1 00 11 0
in a rabbit
The above results can be explained by relatively simple micro
physiological mechanisms. These mechanisms provide an explanation for
the changes in cerebral intercellular P02 's. Erdmann et al. {1979) and
Clark et al. {1978) showed that intracellular P02 can be regulated by
changes in the tissue o2 diffusion coefficient and that the changes in
o2 diffusion can have significant effects. More investigations using
the technology described in Chapter 2 are needed to help explain the
mechanisms involved in the causes of cell death { and survival) in
critical situations.
51
REPERENCES
Chance B., Schoener B., Schindler F. (1957) Cellular oxygen
requirements Fed Proceedings 16: 671.
Chen C., Erdmann W., Halsey J. (1978) The sensitivity of aplysia giant
neurons to changes in extracellular and intracellular Po2 . Adv
Exp Med Biol 94: 691.
Clark D.K., Erdmann W., Halsey J.H., Strong E. (1978) Oxygen
diffusion, conductivity and solubility coefficients in the
microarea of the brain Adv Exp Med Biol 94: 697.
Erdmann W. (1978) Microelectrode studies in the brain of fetal rats
and new barn rats. Adv Exp Med Biol 94: 455.
Erdmann W., Salt P., Agoston S., Langrehr D. (1979) The importance of
new microphysiological methods in determining cellular oxygen
metabolism in anaesthesia. Acta Anaesth Belg 30: 51.
Guyton A.C. (1981) In: Textbook of medical physiology, 6th ed., Chapt.
20: 232, Saunders Publ. Philadelphia, London, Toronto.
52
CHAPTER 5
OXYGENATION OF THE MYOCARDIUM
INTRODUCTION
Acute myocardial infarction continues to be a major cause of
morbidi ty and mortal i ty in spi te of considerable advances in the
trea tment of this condition over the last decade. Currently 1 much
effort is directed towards investigation of methods aiming to produce
an increased salvage rate of the ischaemie myocardium. Hany deaths
still occur in the immediate post-infarction period. These are usually
the result of fatal myocardial arrythmias accuring within two hours of
the beginning of the ischaemie period (Corr and Sobel 1979) and are
due to electrophysiological disturbances caused by hypoxia and the
accumulation of noxious metabolites as a consequence of reduced tissue
perfusion. In vi~w of the vital importance of oxygen for the normal
functioning of physiological processes it would seem logical to judge
the severity of myocardial infarction by measuring changes in intra
myocardial oxygen tension ( Pmo2 ). Host of the studies on Pmo2 that
have been performed in the beating heart have been carried out in dogs
(Hoss 1968 1 van der Laarse 1978 1 Reves et al. 1978 1 Rude et al. 1982 1
Rude et al. 1984 1 Schuchhardt 1985). This species is known to have a
number of microscopie collateral vessels 1 in contrast to humans or
pigs that have few such structures (Berne and Rubio 1979). As far as
we are aware 1 no studies have been performed to determine the
distribution of Pmo2 values in the myocardium of the pig. Nor have
investigations been made on minute-to-minute changes in Pmo2 dis
tribution during condi ti ons of acute myocardial ischaemia. In this
chapter 1 results based on Pmo2 measurements in pigs under physio
logical and pathological conditions will be presented.
53

MATERIAL AND METHODS
Juvenile Yorkshire pigs (~ 25 kg) were anaesthetised with an intra
peritoneal injection of sodium thiopentone at a dose of 30 mg.kg- 1
bodyweight. After the trachea had been intubated with a 7.5 mm Rusch
cuffed endotracheal red rubber tube, anaesthesia was maintained with a
mixture of nitreus oxide in oxygen ( 2:1) and 1-1.5% halothane. The
animals were artificially ventilated using a Minivent ventilator,
which was adjusted to maintain the arterial carbon dioxide partial
pressure in the range of 35-45 mm Hg (4.7-6.0 kPa). This ventilator is
especially suitable for use in the electrically noise-free atmosphere
of the Faraday cage. Muscular relaxation was maintained by continuous
infusion of pancuronium bromide at a rate of 0.5 mg.kg- 1 .hour-1 using
a Braun Melsungen Perfusor pump.
A six French gauge BP 6 angiographic catheter (William Clark,
Europe) was introduced into the femoral artery through an incision in
the right inguinal region and a seven French gauge KMA thermodilution
Swan Ganz catheter was introduced into the left femoral vein. The
latter was advanced under pressure monitoring into a position in the
pulmonary artery in which pulmonary capillary wedge pressure could be
obtained. Thermodilution cardiac output measurements were performed
using a KMA cardiac output computer Model 3500 E. Into the ether
femoral vein another Cook BP 6 angiographic catheter was passed into
the inferior vena cava in order to obtain central veneus pressure
measurements. All the above pressure lines were connected to Gould
Statham P23DC pressure transducers and the output amplified using a 12
channel Grass 7D polygraph. Via the right carotid artery, a Millar
microtip pressure transducer PC470 was introduced into the left
ventricle to measure left intraventricular pressure and dP/dt. The
thorax was opened via a midline thoracotomy and the pericardium was
opened. The heart was supported in a pericardial sling and an
electromagnetic flow probe was mounted around the left circumflex
coronary artery and connected toa Transflow 601 flowmeter (Skalar). A
permanent recording was made using a Grass ink writing oscillograph.
This data was fed into a Philips P2000 microcomputer so that the
following parameters could be calculated: left and right ventricular
minute work, systemic and pulmonary vascular resistance.
54

Mixed venous and arterial blood gas estimations were performed at
regular intervals using a Radiometer ABL 1 acid/base laboratory.
Arterial and mixed venous haemoglobin estimations and oxyhaemoglobin
saturations were measured using a Radiometer OSM2 Hemoximeter.
Because the P02 measurements took place in the myocardium, it was
impossible to use the glass-protected microelectrades. Therefore we
used steel-protected microelectrades (Clark Electromedical Instru
ments). These electrodes, 200 microns in diameter, were embedded in a
thin flexible plastic plate .±_ S cm x 2 cm, which was sewn onto the
epicardium. The distance between electrades was 1 cm and in position
they protruded 3 mm into the left ventricular wall. With these
electrades it was also possible to measure local myocardial activity,
using Grass AC EEG amplifiers. As described in Chapter 2, special
a dj ustments to the electronic circui try are necessary in cerebral
action potential measurement, but this is nat the case for measure
ments of myocardial activity because the ECG voltages are much higher
and of a lower freguency than in EEG measurements.
Left IntraventricuJ..dJ'+--7<-..::"h.fll Pressure Line
t'"--1-----Arterial Line
r-----~:~~e~=~z
Fig. 1: Experimental arrangement of the animal in the
electrically noise-free Faraday cage.
ss

The electrode plate was sewn onto the epicardium in such a way that
if the left anterior deseending artery (LAD) was occluded at
two-thirds its length two electrades would be in the infarcted area
(with one in deep ischaemia and one in the border area) and two in the
non-ischaemie area (with one in the border area). Expertise in the
correct placement of the plate was obtained in a pilot study of 10
pigs. Once this technique had been mastered, a fellow-up study in 18
pigs was performed. The electrical output from the electrades was
amplified by DC amplifiers (CRW, Rotterdam) situated inside the
Faraday cage and on-line Pmo2 was displayed on a Rikadenki recorder
model KA 60 and the Grass oscillograph. Measurements were recorded
after allowing time for stabilisation. The experimental arrangement is
demonstrated diagramatically in figure 1.
All the measured and derived parameters were stared on floppy discs
for statistical analysis. Statistical significanee was assessed using
paired Student's t tests. Pmo2 distributions were compared using the
Kolmogorov-Smirnov test.
The following four sections attempt to explain oxygenation under
normal circumstances (ar as close as possible under experimental
conditions). The remaining two sections describe the effects of
ischaemia. Results on experiments attempting to imprave myocardial
oxygenation under ischaemie conditions are presented in Chapter 6.
During the pilot study it became apparent that oxygen pressure
values measured at the tip of the microelectrades varied considerably
between individual electrades. This depended on the di stance of the
electrode from a blood vessel and the state of oxygenation of that
blood vessel (see chapters 1 and 4). Also, the oxygen values measured
wi th each electrode were nat constant in time but showed, in all
studies, two patterns of change which will be described in the
following two sections.
56

CARDIAC SWINGS
Results
Almast invariably, variations in oxygen tension coinciding with
heart beat were observed, the amplitude of which varied between
individual electrodes. The degree of variation depended on the
oxygena ti on sta te of the heart. In general, the higher the Pmo2 measurement the greater the variation in the Pmo 2 throughout the heart
cycle.
Individual electrades displayed a constant variation in Pm02 depending on the phase of the heart cycle. Figure 2 shows that, in
this electrode, maximum intramyocardial oxygen tension coincided with
ventricular diastole - when the left ventricular pressure was at its
lowest.
LVP
150 P02
(mmHg)
0
sec
~- - -- --
Electrode 1 - base
Fig. 2: Tracings demonstrating a rise in myocardial
oxygen tension during ventricular diastole.
57

Figure 3 shows that maximal coronary flow coincides with the
dieretic notch of the arterial pressure. This notch is caused by the
closing of the aartic valve, which implies that maximal coronary flow
occurs during diastole (Marston et al, 1959). In electrades 1 and 3
maximum P0 2 values were reached about 200 msec after aartic valve
closure (during diastole) so that there seems to be a postive
correlation between coronary flow and Pmo2 . In figure 4 this pattern
is repeated in electrades 3 and 4, but peak oxygen values in
electrades and 2 were reached during ventricular systole. This
figure a lso shows that the amplitude of P02 variatien is closely
related to the mean myocardial 0 2 tension at that electrode. These
differences in bath the timing of peak values and the degree of
amplitude of P02 were a common feature in all studies.
58
1 sec LJ
AP
Coronary flow - LAD
Electrode 1 - base
Electrode 2
Electrode 3
Electrode 4 - apex
Fig. 3: An example of the relationship between
myocardial oxygen tension and coronary artery
flow.

150
0
150
P02
(mmHg) 0
150
0
150
LVP
Electrode 1 - base
Electrode 2
Electrode 3
Electrode 4 - apex
Ssec
Fig. 4: An example of the relationship between
Discussion
myocardial oxygen tension and intraventricular
pressure.
The beat-to-beat period of the pig's heart cycle is about 600 msec.
That means that 300 msec is the maximal phasic difference in P02
that
can be measured between two electrodes. Chapter 2 demonstrates that
the response time of the electrode system is at the most 30 msec, so
that even if the response time per electrode differs slightly, this
could never explain the phasic difference in P02
measurements.
Therefore there must be a physiological explanation for the phasic
difference in cardiac swings.
As mentioned previously, coronary artery blood flow occurs
predominantly during diastole in the period irnrnediately following
59

closure of the aartic valve. These investigations have shown, however,
that this observation does not necessarily imply arrival of oxygen to
the tissues during diastole.
The blood supply of the myocardium is modified by extravascular
compression of the coronary vessels as they course through the
myocardium, and Gregg ( 1 963) has shown that this may cause a small
back flow in the artery at the beginning of systole. This effect is
demonstrated in figure 3. Whereas flow in the main coronary arteries
of the left ventricle is greater in diastole than in systole, the
reverse is true for the right ventricle, in which flow during systole
is not greatly opposed by the much smaller intra-mural tension
generated in this chamber.
The above statements are true for the major coronary arteries,
though they do not apply in the case of microcirculation. Tillmans et
al (1974), using high-speed cinematography with transillumination of
the left ventricle, have studied flow in arterioles, capillaries and
venules in turtle and dog hearts. They demonstrated that there is a
transition of flow pattern from predominantly diastolic flow to pre
dominantly systolic flow at the region of the arteriolar-capillary
junction. Hence, it is reasonable to conclude that the maximum
oxygenation measured with microelectrades will vary, depending on
where they are positioned. For example, when the microelectrode is
situated near an arteriole, maximum oxygenation will occur in dia
stole; when the microelectrode is placed in the vicinity of a
capillary or venule, however, maximum oxygenation will occur in
systole.
This condition is further complicated by the spread of contraction
through the ventricles. This spread begins in the intraventricular
septurn and at the atrial ventricular region. Spread through the
ventricular walls passes from endocardium to epicardium. Harris (1941)
has shown that the last portion of the ventricle to be activated is
the apex. Hence, in some parts of the ventricle, blood will be
squeezed onwards by extra-vascular compression during systole,
slightly earlier than in other parts of the ventricle. This causes
further variatien in the precise timing of the arrival of maximal
oxygen flux in the myocardium during systole.
60

RESPIRATORY SWINGS
In addition to variatien in Pmo2 during the cardiac cycle,
variations in oxygen pressure measurements coinciding with different
phases of the respiratory cycle were also observed: during inspiration
there was always a downward deflection of Pmo2 . These respiratory
swings we re sametimes very large and,
swings, caused variations of up to 10% in
examples of these swings in two different
75 P0 2
(mmHg)
50
25
0 0 30 60
Fig. 5: Examples of variatien in
superimposed on the
measured P02 . Figure
electrodes.
Electrode 4 (apex}
Electrode 2
Npto~ 2:1
6
4 resp. press. (cm HP)
2
time (sec.)
myocardial oxygen
tension in relation to the respiratory cycle
cardiac
5 shows
In Figure 5 the large downward deflections of P02 coincide wi th
inspiration and, hence, increased intravascular pulmonary pressure
(Fig. 6) caused by intermittent positive pressure ventilation (IPPV).
These decreases in Pmo2 also coincide with a rise in CVP, PAP and AP.
The following factors are involved in causing these changes: inflation
of the lungs leads to an increase in blood flow to the left atrium,
61

this in turn increases left ventricular fibre length and thus
increases the force of contraction, leading to increased cardiac work
laad concomitant with a rise in interstitial static pressure. Coronary
blood flow decreases and myocardial oxygen consumption increases
leading to a fall in oxygen concentration in the myocardial tissue
(change in the supply/demand ratio).
1 min
200
mmHg 100
AP
0
20
mmHg 0
CVP
40
20 PAP
mmHg 0
100
Electrode 1 - base 50
0
Fig. 6: An example of the relationship between myo
cardial oxygen tension and various cardio
vascular parameters.
ELECTRICAL ACTIVITY
Generally, the amplitude of electrical activity measured at the tip
of the electrode was in proportion to measured Pmo2 . There appeared to
62

be a cri ti cal Pmo2
below which the amplitude of electrical acti vi ty
was very low and only electrical background noise remained. These
effects are shown in Fig. 7, which demonstrates that electrical
act i vi ty rnarkedly declined when, in this example, Pmo2 measurements
were below 30 mm Hg. The critical Pmo2 level, however varied greatly
depending on the area being measured.
Electrode 1 ECG
F~l
ot=L-"-~~ ~\~,_,_,,,-~~' -r'$F:'\=%::c:L\_'-\ \
P0 2 (mmHg)
75
Electrode 1 P02
Fig. 7: An example of decreases in local action
potentials concomitant with decreases in local
myocardial oxygen tension.
CHANGES IN THE INSPIRATORY PERCENTAGE OF OXYGEN (Fi02)
dö I I ~'.cG
I~§
j.=ct= :cc:t-
~Ë,~ ~~'==~~ ~E
ië=F
.V~
An increased percentage of oxygen in o 2 :N20 ratio of the inspired
gas mixture led to changes in Pmo2 • A delay of up to 10 minutes was
observed, depending on the length of the tubing in the ventilatory
system. Paradoxically, changes in P02 measurements showed not only an
increase but, in some electrodes, a decrease. Thus, the range of P02 values increased, as did the average value. This, and the fact that
there was already a wide spread in Pmo2 •s at an Fiü2 of 0.3 (see next
section) means that there is a poor correlation between arterial P02 and myocardial Po 2 .
63

Figure 8 shows a histogram of 5 8 Pm02 measurements in 1 8 pigs
ventilated with 100% o 2 . The mean Pmo 2 was 112.7 mm Hg (± 8.48 SEM)
with a median value of 99.2 mm Hg. More than 75% of the values lay
between 40 and 140 mm Hg.
14
12
10
8
N 6
4
2
0 40 80 120 160 200 240 280 320
PM02 (mm Hg)
Fig. 8: Distribution of myocardial oxygen tensions
pigs ventilated with 0,5% (Pm02 ) in 1 8
halothane in oxygen.
TEMPORARY OCCLUSION OF THE LEFT ANTERIOR DESCENDING CORONARY ARTERY
As mentioned before, a pilot study in 10 pigs was performed to try
and predict the proper placement of the microelectrades to register
Pmo2 changes during LAD occlusion.
Results
Under normal condi ti ons, wi th an Fi02 of 0. 3 and befare LAD
occlusion, P02 measurements displayed a braad range of values, mostly
between 20 and 120 mm Hg (Figs 9 and 10).
64

225
200
175
150
Pmo2 125
(mm Hg) 100
75
50
25
clamp clamp off on I I /\ I r./ \
'\ I ('./ I 1, I[ I/\
_I liJ '- ---1 ~ ~\ /~~~--. ' , :1 V\ / 'I ' ~
~--1.
~ : I ''I \} I
I
0 2 3 4 5
Time (min)
Electrode 1 = (base)--Electrode 2 = - · - · - · - . - · -. Electrode 3 = -----Electrode 4 =(apex)-------
Fig. 9: An example of myocardial P02 (Pm02 ) responses
to LAD occlusion.
Following occlusion, the Pmo2 responses varied greatly depending on
the position of the electrode in the capillary network and on the
degree of ischaemia, collateral or steal perfusion and reactive hyper
aemia. This is clearly demonstrated in Figs 9 and 1 0. In strongly
affected areas, tissue P02 decreased and remained low throughout the
acelusion peri ad. Th is effect occurred af ter some delay (Fig. 1 0,
electrode 3) or immediately following acelusion (Fig. 9, electrode 3).
Same tissue P02 measurements dropped to values below 1 mm Hg. In other
areas, P0 2 values fell drastically following occlusion, then reeavered
and even displayed hyperoxic supply (Fig. 9, electrode 4). Conversely,
tissue P02 values increased following acelusion in some areas,
followed by a decline in values (Fig. 9, electrades 1 and 2; Fig. 10,
electrades 1 , 2 and 4). This secondary decrease in P02 , following a
hyperoxic phase, can even drop to below the original value (Fig. 9,
electrades and 2; Fig. 10, electrode 2). In other cases, P02 decreased but measurements remain higher than the original value (Fig.
10, electrades 1 and 4).
65

Pmo 2 (mm Hg)
225
clamp clamp 200 on off
175
150
125
100
75
50
25
0
I ....... ,
I \ I \
{\ : ,,----/---- \ : ~ I f\,/ / '--~--1 h. 111 ~\ / ', -----------.:::..--=---=---1 I,- I / -- -----=:.-----
.}- 1 I : '-/ '---- --------
--,. \Ir : : 1/ I \ I:
Jll
\1/ I \V ,.r·, __ f ..... V . -- .. __ ,...-L/ - I ... _____ ------· -·· \ \ .... · ·---------· I • _,
0 2 3 4 5 6 7 8 9 10 11 12 13
Time (min)
Fig. 10: An example of myocardial P02 (Pm0 2 ) responses
to LAD occlusion. (Electrode numbers are the
sameasin Fig. 9).
At terminatien of the acelusion period, tissue P02 rapidly
increased to hyperaemic values in these areas where tissue P02 was low
at the end of the acelusion phase (Fig. 9, electrades 1 ; Fig. 1 0,
electredes 2,3 and 4). Electrades displaying hyperoxic values at
terminatien of acelusion phase showed an immediate fall in P02 (Fig.
9, electrode 4) to the original value. The post-acelusion period is
followed by an oscillatory phase of tissue P02 values. Often, a
considerable length of time (± 5 mins) is required befere P0 2 returns
to pre-elamping values.
Discussion
Reves et al. ( 1978) have presented results of cross-elamping the
LAD in dogs using 300 micron oxygen electredes and have described a
myocardial 'steal' effect in which Po2 , in normal areas of the
66

myocardium, decreased. They attributed this effect to the shunting of
blood via collaterals into hypoxic border areas in which auto
regulation had resulted in decreased coronary vascular resistance.
The biphasic nature of the curves in Figs 9 and 10 indicate that
the initial decreased oxygen supply due to impaired myocardial
circulation is, in some instances, rapidly compensated by auto
regulation and opening of the collateral supply channels. Many authors
have postulated the existance of these channels. Stam and de Jong
( 1977) produced embolisation of the coronary arteries of isolated
perfused rat hearts using 20-80 micron diameter microspheres. Coronary
blood flow decreased rapidly following microsphere injection but then
increased to achieve a constant rate ten minutes later. At this point
blood flows were significantly higher than that observed two minutes
after embolisation.
Berne and Rubio (1969) considered adenosine to be the only
substance that could account for the entire process of coronary
dilation observed in myocardial ischaemia. Stam and de Jong ( 1977)
noted that no rise in coronary flow following micro-embolisation
occurred if the perfusate contained adenosine, a breakdown product of
ATP, produced by de-phosphorylation of AMP. De Jong and Goldstein
(1974), in pig studies, investigated the effects of ischaemie hypoxia
on the release of inosine, hypoxanthine and lactate from the
myocardium. They found highly significant increases in the level of
these substances over a six minute period following 72% acelusion of
the LAD.
Local release of ATP breakdown products may be of sufficient rate
and magnitude to account for the extremely rapid increases in Pmo2 that were observed. Indeed, Thompson et al. (1980) observed cyclical
changes in the adenosine level during the cardiac cycle, with
increases occurring during each systolic contraction of the myo
cardium. It may egually well be argued that these changes are caused
by local haemadynamie changes in the microcirculation leading to
increased local perfusion in certain areas.
67

PERMANENT LAD OCCLUSION
Once the pilot study mentioned in the previous section was
completed, it became possible to predict whether an electrode would be
in an ischaemie or non-ischaemie area following LAD occlusion. A
follow-up study in 18 pigs was performed to enable statistical
analysis of the effects of LAD acelusion on different areas of the
myocardium. As the analysis was based on averages, the rapid changes
occurring within a minute of acelusion were averaged out. This section
is primarily concerned with the 'long-term' effects of LAD acelusion
on the ischaemie and non-ischaemie myocardium.
0 :I:
~ 200 ~ N 0 180 ~ 11..
160
1ij0
120
100
80
60
qo
20
ELECTRODE 1
~OCCLUSION
o 1 2 3 q 5 6 1 8 9 1 o 11 12 n H 15 30 q5 60
TIME (MIN.)
Fig. 11 : The effect of LAD acelusion on Pmo2 in the
normal myocardial tissue, si tuated furthest
from the ischaemie area (n=13).
The animals were ventilated with oxygen (99.5%) and halothane
( 0. 5%). This was necessary because af ter one hour of ischaemia the
pigs were subjected to another protocol requiring a high arterial Po2
68

( see Chapter 6). A period of at least 30 rninutes was allowed for
stabilisation befere rneasurernents were cernmeneed and, after baseline
Prno2 •s had been obtained, the LAD was tied. On-line Prno2 values,
corrected for ternperature and drift, were obtained each minute frorn
0-15 rninutes and then every 15 rninutes up to 1 hour.
0 :r ;:;; ~ "" 0 ;:;; 11.
ELECTRODE 2
200
180
160
1q0 'OCCLUSION
120
100
80
60
20
o4-,_+-+-+-+-r-r-r-~~~-+-+~-~·rl-r-r--o 1 2 3 q 5 6 1 8 9 1 o 11 12 13 1 q 15 30 q5 60
TIME (MIN.)
Fig. 12: The effect of LAD occlusion on Prno2 in normal
rnyocardial tissue berdering the ischaemie area
(n=1 4).
Results
18 experirnents were perforrned. After discarding electredes with a
drift of more than 7.5%/hour or other technical faults, two to four
electredes per experiment could be used for statistical analysis. A
total of 58 electredes yielded satisfactory Prn02 rneasurernents. The
pre-occlusion va lues are presented in histogram forrn in figure 8.
69

Figures 11-14 show changes in Pmo2 following LAD acelusion in four
separate areas, each averaged over eighteen animals. The electrades
were situated so that electrode 4 was expected to be situated in the
most ischaemie area (referred to as the ischaemie deep electrode) and
electrode 1 at the opposite end of the plate in the non-ischaemie area
( the non-ischaemie deep electrode). Electrades 2 and 3 were in the
border areas ( the non-ischaemie and ischaemie border electrades) .
Befare occlusion, there was no significant difference between the 4
areas (Student's t grouped test).
lJ J: :::;: 200 :::;:
N 0 180 :::;: D-
160
ELECTRODE 3
140 lOCCLUSION
120
100
80
60
40
20
!I 0 1 2 3 4 5 6 7 8 9 1 0 11 12 13 14 1 5 30 45 60
TIME (MIN.)
Fig. 13: The effect of LAD acelusion on Pmo2 in the
ischaemie border area (n=16). Significanee
from pre-ischaemia: **=p<0.001.
Following LAD occlusion, immediate and significant decreases in
Pmo2
were observed in the ischaemie deep area (Student' s t paired
test). By four rninutes post-acelusion these decreases had abated but
at the expense of the adjacent ischaemie border area. This area
70

continued to show highly significant decreases in Pmo2 throughout the
first hour of post-occlusion. No significant decreases were seen in
the non-ischaemie border or non-ischaemie deep areas.
Following occlusion, the distribution of Pmo2 values in the 18 pigs
was compared with the pre-ischaemie values for each area. The
distributions were compared using the Kolmigorov-Smirnov test and a p
value of 0.01 was taken to indicate significance. Only in the
ischaemie border area were significant changes in Pmo2 distribution
patterns observed when compared to pre-acelusion values. These changes
were seen at minute 3 and minutes 5-13 after LAD occlusion. Figure 15
clearly shows the shift in distribution towards lower Pm02 values at 8
minutes of ischaemia. This is the point at which mean percentage
decreases in Pmo2 were maximal.
0 :r ::;; ~ N
0 ::;; CL
200
180
160
140
120
100
80
60
110
20
0
ELECTRODE 4
lil 0 1 2 3 Ij 5 6 7 8 9 1 0 11 12 13 111 15 30 115 60
TIME (MIN.)
Fig. 1 4: The effect of LAD acelusion on Pm02 in the
deep ischaemie area (n=15). Significanee from
pre-ischaemia: *=p<0.01.
71

N
N
ELECTRODE 3 ( ISCHAEMIC BORDER) PRE-ISCHAEMIA
10
8
6
4
2
50 1 00 1 50 200 250 300
PM0 2 (mm Hg)
ELECTRODE 3 ( ISCHAEMIC BORDER) 8 MINS OF ISCHAEMIA
10
8
6
4
2
50 100 150 200 250 300
PM0 2 (mm Hg)
Fig. 15: Distribution of myocardial oxygen tension
( Pmo2 ) in the ischaemie border area before
and afteronset of ischaemia (n=16).
Discussion
Reves et al. (1978) have demonstrated the preserree of a myocardial
steal effect in dogs. They were able to demonstrate steal from both
border and normal areas but made no attempt at statistical evaluation
72

of its significance. Studies on P02 in both ischaemie and border areas
in pigs have been carried out by Walfridsson et al ( 1 985) . They
measured epicardial oxygen tension (Pe02 ) in animals in which the Pa0 2 was maintained between 75 and 105 mm Hg. They reported mean resting
values of 55.5 mm Hg in the epicardium. LAD acelusion resulted in
marked decreases in Pe0 2 and significant persistent distribution
changes in the ischaemie area. In the border area, significant
distribution changes were seen 5 minutes after occlusion, but these
had reeavered by 30 minutes post-occlusion. Our results suggest that
Peo2 changes are not typical for conditions in the myocardium. It
would seem that myocardial steal occurs, wi th blood flow shifting
during acelusion from the border area to the severely ischaemie area.
Our experiments took place under hyperoxia (99.5% o 2 ). That would
mean that the oxygen supply/demand ratio would be favourable. It is
qui te possible that when ischaemia occurs under normoxic condi tions
the steal effect would not be so efficient.
GENERAL DISCUSSION
Oxygen tensions in the myocardium (Pm02 ) have been estimated in a
variety of species over the last few years. Some investigators (Rude
et al. 1 982, 1 984) used relatively large mass spectrometer probes
embedded in the myocardium. Others used epicardial surface electrades
to study the distribution of partial pressures of oxygen over much
smaller areas than can be achieved with the aid of mass speetrometry
(Kessler et al. 1983, Walfridsson et al 1985). The latter methods are
relatively non-invasive, enabling rnany measurements in a short period
of time to rapidly produce P02 histogram distributions of the under
lying epicardium. It is debatable however, as to whether the values so
obtained truly reflect the P02 values of the underlying myocardium.
Studies demonstrating the occurrence of lower P02 values in the
sub-endocardial myocardium than in the sub-epicardial tissues (Moss
1968, v.d. Laarse 1978) increase this doubt.
Studies on Pm0 2 have also been carried out using polarographic
methods and employing needle electrodes. These methods are, of course,
considerably more invasive than the use of epicardial electrades and
73

are particularly susceptible to movement artifacts. Movement of fluid
about the tip, or movement of the tip of the electrode (the stirring
effect) will enhance current flow in the polarographic circuit and
lead to abnormally high P02 values. It is a lso inevi table that a
certain amount of tissue damage will be caused by the introduetion of
the needle and that this will interfere with microcirculatory flow in
the vicinity of the tip of the electrode. However, it has been shown
(v.d. Laarse 1978) that probes as large as 2 mm in diameter may cause
only minimal mechanical damage of the cells around the insertion
channel. Lund (1985) has, however, maintained that both needle
electrades and mass spectrometer probes may, by compression of
surrounding tissues, cause Pmo 2 readings that are too low.
Another question concerns the effect that the halothane, present in
the inspired gas mixture, may have on the accuracy of the Pmo2 measurements. Severinghaus (1971) showed that a number of anaesthetic
gases, i nel uding halothane, can be detected wi th polarography. The
presence of substantial quantities of halothane tends, in some
instances, to give a somewhat high reading for P02 . It was concluded
however, that in view of the low concentrations associated with
clinical anaesthesia, errors would be relatively small in most cases.
In the experiments presented in this thesis, the inhaled concentratien
of halothane was kept constant for at least half an hour before
measurements of P02 were cammeneed and i t was thereby hoped that a
constant low level of halothane would be maintained in myocardial
tissue. Thus, though any error occurring would be constant, changes in
Pmo 2 would be of no significance. Indeed, the presence of halothane
error would tend to decrease the percentage changes of Pmo 2 readouts.
It is, thus, possible that the calculated percentage changes in
myocardial Po2 may in fact be less than the true changes.
As far as we are aware very few measurements of Pmo2 have been
carried out during hyperoxia none at all using pigs. Results
obtained from dogs have been extremely variable. V.d. Laarse (1978)
has reported small but significant increases in Pmo2 in dogs when the
arterial oxygen tension (Pa02 l was increased from 93 to 220 mm Hg. In
our experiments, the mean Pa0 2 was much higher and amounted to 359
mm Hg. Feola et al (1979), using smaller electrades than those used in
our series, reported a mean Pm02 of 1 4 mm Hg C±. 3 SEM) in dogs
74

breathing a gas mixture containing 50% 0 2 . Schuchhardt ( 1 985) has
contended that a Pmo2 value of more than 100 mm Hg is very rarely seen
and, using polarographic needle electrodes, has measured mean values
of 46 mm Hg in dogs with a mean Pao2 of 440 mm Hg. Rude et al (1984)
using mass spectrometer probes has measured myocardial tensions in
dogs breathing 100% o 2 following infusion of dextran or fluorocarbon
emulsions. In the farmer, Pmo 2 was 66 mm Hg (~ 18 SEM) at a mean Pao 2 of 490 mm Hg, while in the latter the mean value of Pmo2 was 127 mm Hg
at a mean Pao2 of 546 mm Hg.
In conclusion, we have demonstrated that considerable variation in
Pmo2 may be measured throughout the cardiac cycle and that these are a
net result of the supply/demand situation in the tissues. Oxygenation
of the myocardium in the normally functioning heart is not uniform but
varies considerably over a relatively short distance this, we
suggest, is governed by the relationship to different vascular
structures. Rapid and seemingly unpredictable changes may occur in
myocardial P02 as a result of acelusion of terminal branches of the
coronary arteries, but this chapter tries to show that there is an
autoregulatory mechanism at the micro-level which attempts to
compensate for the threatening hypoxia.
REFERENCES
This chapter was based on work published in the fo11owing articles:
Faithfull N.S., Fennema M., Erdmann W. (1985) Oxygen supply to the
myocardium. Adv Exp Med Biol. 180: 411.
Faithfull N.S., Fennema M., Erdmann W., Dhasmana M., Eilers G. (1986)
The effects of acute ischaemia on intramyocardial oxygen
tensions. Adv Exp Med Biol. 200: 339.
Other references:
Berne R.M., Rubio R. (1969) Acute coronary occlusion: Early changes
that induce coronary dilation and the development of collateral
circulation. Am~ Cardiol. 24: 766.
Berne R.M., Rubio R. (1979) Coronary circulation, In: Handbook of
75

Physiology Berne R.M.,Sperelakis N. and Geiger S.R. (eds.)
American Physiology Society, Bethesda, Maryland.
Corr P.B., Sobel B.E., (1979) The importance of metabolites in the
genesis of ventricular dysrhythmia induced by ischaemia. Modern
concepts of cardiovascular disease. 48: 43.
De Jong J.W., Goldstein S. (1974) Changes in coronary venous inosine
concentration and myocardial wall thickening during regional
ischaemia in pigs. Circulation Res. 35: 111.
Feola M., Azar D., Wiener L. (1979) Improved oxygenation of ischaemie
myocardium by haemodilution with stroma-free hemoglobin
solution. Chest. 75: 369.
Gregg D.E. (1963) Physiology of the coronary circulation. The George
E. Brown Memorial Lecture. Circulation. 27: 1128.
Harris S.A. (1941) The spread of excitation in turtle, dog, cat and
monkey ventricles. Am~ Physiol. 134: 319.
Kessler M., Vogel H., Gunther H., Harrison D.K., Hoper J. (1983) Local
oxygen supply of the myocardium after extreme hemodilution with
Fluosol-DA. Prog Clin Biol Res. 122: 237.
Laarse A. v.d. (1978) On the multiple polarographic measurement of
myocardial oxygen tension. PhD Thesis, University of Amsterdam.
Lund N. (1985) Skeletal and cardiac muscle oxygenation. Adv Exp Med
Biol. 191: 37.
Marston E.L., Barefoot C.A., Spencer M.P. (1959) Non-cannulating
measurements of coronary blood flow. Surg Forum. 10: 336.
Moss A.J. (1968) Intramyocardial oxygen tension. Cardiovasc Res.
3: 14.
Reves J.G., Erdmann W., Mardis M., Karp R.B., King M., Lell W.A.
(1978) Evidence for existence of myocardial steal. Adv Exp Med
Biol. 94: 755.
Rude R.E., Izquierdo C., Buja L.M., Willerson J.T. (1982) Effects of
inotropic and chronotropie stimuli on acute myocardial ischaemie
injury. Studies with dobutamine in the anesthetized dog.
Circulation. 65: 1321.
Rude R.E., Bush L.R., Tilton G.D. (1984) Effects of fluorocarbons with
and without oxygen supplementation on cardiac hemodynamics and
energetics. Am ~ Cardiol. 54: 880
Schuchhardt S. (1985) Myocardial oxygen pressure: Mirror of oxygen
supply. Adv Exp Med Biol. 191: 21.
Severinghaus J.W., Weeskopf B.B., Nishimura M., Bradley A.F. (1971)
76

Oxygen electrode errors due to polarographic reduction of
halothane. ~ ~ Physiol. 31: 640.
Stam H., de Jong J.W. (1977) Sephadex-induced reduction of coronary
flow in the isolated rat heart: A model for ischaemie heart
disease. ~ Molec Cell Cardiol. 9: 633.
Tillmans H., Ikeda s., Hansen H., Sarma J.S.M., Fauvel J-M., Bing
R.J., (1974) Microcirculation in the ventricle of the dog and
turtle. Circulation Res. 34: 561.
Thompson C.I., Rubio R., Berne R.M. (1980) Changes in adenosine and
glycogen phosphorylase activity during the cardiac cycle. Am J
Physiol. 238: 389.
Walfridsson H., Lewis D., Sjoberg F., Lund N. (1985) Myocardial oxygen
pressure across the lateral border zone after acute coronary
acelusion in the pig heart. Adv Exp Med Biol. 191: 203.
77


CHAPTER 6
MICROCIRCULATION AND FLUOROCARBONS
INTRODUCTION
Chapter 5 discussed myocardial microcirculation, using oxygen
tissue tension as a major parameter. The changes in Pmo2 during acute
ischaemia are shown and the effects of intercapillary collaterals are
explained. It is apparent that the level of collateral blood flow is
not sufficient to compensate for myocardial infarction. Due to
redistribution of the blood flow, portions of the micro-area become
hypoxic and this can lead to necrosis. In this situation, blood flow
might be improved by decreasing the viscosity of the perfusion fluid.
This can be achieved by diluting the blood with, for instance,
dextran. Unfortunately, dextran has a low oxygen carrying capaci ty
(Zander and Makowski, 1982) being almest the same as plasma (~ 0.3 ml
o 2 per 100 mm Hg and 100 ml plasma). Later in this chapter, it will be
shown that dextran actually slightly increases hypoxia due to haemo
dilution which leads to a reduction in o 2 transport capaci ty. If
haemodilution is performed with a preparatien that not only reduces
viscosity but also has an oxygen transporting capacity significantly
higher than that of plasma, oxygenation of ischaemie and/or hypoxic
tissue could be improved.
Fluorocarbons, also known as perfluorochemicals or perfluoro
carbons, are almest completely inert chemical substances with a high
solubility for oxygen. This property was dramatically demonstrated by
Clark and Gollan ( 1 966) in mice survi ving total immersion in these
liquids. As fluorocarbons are almest completely insoluble in water (or
blood) , they must be emulsified before u se. One example of these
products is marketed under the trade name of Fluosol-DA (Green Cross
Corporation, Osaka, Japan). The composition of Fluosol-DA 20% (weight
per volume %) is shown in Table I.
79

80
Table I: Composition of Fluosol-DA 20% (weight per volume percent).
(after Naito and Yokoyama, 1978)
Perfluorodecalin 14.0 KCL 0.034
Perfluorotripropylamine 6.0 MgC1 2 0.020 Pluronic F-68 2.7 CaCl2 0.028 Yolk phospholipids 0.4 NaHC0 3 0.210 Glycerol 0.8 Glucose 0.180 Hydroxyethyl starch 3.0 Na Cl 0.600
50 mmHg blood Ht 45% P02 550 mmHg
;;; 20 I
ö >
blood Ht 30% ... c 15 CU ... c 0 u c CU C'l 10
blood Ht >- 15% x 0
5
0 0 100 200 300 400 500 600 700
P02
(mmHg)
Fig. 1: Oxygen content of Fluosol-DA emulsion and
blood at various haematocrits (after Grote et
al., 1985). The amount of oxygen released
between P02 values of 550 and 50 mm Hg are indicated by asterisks.

As shown in figure 1, Fluosol-DA 20% (the product used in our
investigations) can carry about 0.75 ml o2 in 100 ml per 100 mm Hg
(Grote et al 1985). This capacity is very low in comparison to the
content in normal human blood under similar condi tions. Hence, in
practice, it is necessary to breathe as high a percentage of oxygen as
possible. At an arterial P02 of 550 mm Hg, being about the maximal
achievable with an Fi02 of 1 .0, Fluosol-DA 20% contains about 4.1 ml
o2 per 100 ml emulsion. Normal blood contains about five times that
amount of oxygen but, because of the proportional relationship between
P02 and oxygen content in fluorocarbons, the delivery of o2 to tissue
is nearly the same with Fluosol-DA 20% as with blood (Fig. 1 ).
Fluorocarbon emulsions have a very low viscosity, about 0.55 times
that of blood. Furthermore, whereas the viscosity of blood increases
markedly under the low-flow shear rates existing in the micro
circulation, the viscosity of fluorocarbon emulsions is almast
independent of shear rate. As can be seen in Fig. 2, Fluosol-DA 20% is
only about 0.34 times as viseaus as blood under these conditions .
• 8 \. ........... a.
\ u Normal Human Blood 6 >. ·~ (Het 46%) -Vl
0 ·----u •, Mixture of -• Vl
•'•-fluosoi-DA and Blood (1 • 1) > 4 • • ·-·-· •
2 Fluosol- DA 20%
0 1020 40 77 192
Shear ra te (sec-') Fig. 2: Viscosity of Fluosol-DA, whole human blood and
their mixture (1:1) at various shear rates, at
a temperature of 37° C (after Naito and
Yokoyama, 1978).
81
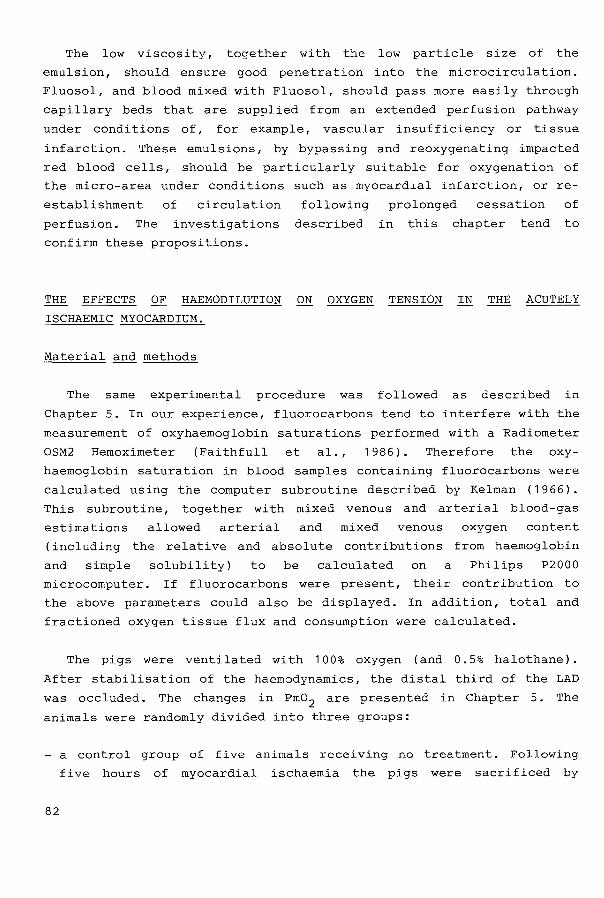
The low viscos i ty, together wi th the low partiele si ze of the
emulsion, should ensure good penetratien into the microcirculation.
Fluosol, and blood mixed with Fluosol, should pass more easily through
capillary beds that are supplied from an extended perfusion pathway
under condi tions of, for example, vascular insufficiency or tissue
infarction. These emulsions, by bypassing and reoxygenating impacted
red blood cells, should be particularly suitable for oxygenation of
the micro-area under conditions such as myocardial infarction, or re
establishment of circulation following prolonged cessation of
perfusion. The investigations described in this chapter tend to
confirm these propositions.
THE EFFECTS OF HAEMODILUTION ON OXYGEN TENSION IN THE ACUTELY
ISCHAEMie MYOCARDIUM.
Material and methods
The same experimental procedure was followed as described in
Chapter 5. In our experience, fluorocarbons tend to interfere with the
measurement of oxyhaemoglobin saturations performed with a Radiometer
OSM2 Hemoximeter (Faithfull et al., 1986). Therefore the oxy
haemoglobin saturation in blood samples containing fluorocarbons were
calculated using the computer subroutine described by Kelman (1966).
This subroutine, together wi th mixed venous and arterial blood-gas
estimations allowed arterial and mixed venous oxygen content
( including the relative and absolute contributions from haemoglobin
and simple solubility) to be calculated on a Philips P2000
microcomputer. If fluorocarbons were present, their contribution to
the above parameters could also be displayed. In addition, total and
fractioned oxygen tissue flux and consumption were calculated.
The pigs were ventilated with 100% oxygen (and 0.5% halothane).
After stabilisation of the haemodynamics, the distal third of the LAD
was occluded. The changes in Pm02 are presented in Chapter 5. The
animals were randomly divided into three groups:
82
a control group of five animals receiving no treatment. Following
five hours of myocardial ischaemia the pigs were sacrificed by

ventilation with 100% nitreus oxide.
- a second group of five animals in which bleeding was cammeneed after
one hour of vascular occlusion. 20 ml of blood per kg bodyweight was
removed and then immediately replaced with the same volume of
Fluosol-DA 20%.
a third group of five pigs in
weight) in 0.9% saline was
Fluosol.
which 5% dextran 40 (400000 molecular
used for haemodilution instead of
The haemodilution procedures were completed within one hour. After
haemodilution there was no significant difference in haematocrit
between the dextran and Fluosol groups. After five hours of infarction
(about three hours of haemodilution) all pigs were sacrificed and the
hearts removed for pathological examination.
Results
The measured and calculated systemic cardiovascular parameters for
the three groups are presented in Tables II, III and IV respectively.
In Table V, the calculated values for whole body oxygen flux (arterial
oxygen content times cardiac output) are presented for the three
groups of animals.
As can be seen in Table II, in which results of the control group
are presented, the degree of myocardial infarction was not severe
enough to cause statistically significant changes in any of the
presented variables. The procedure did, however, produce a macro- and
microscopically visible infarctive area in the myocardium.
Haemodilution with Fluosol-DA 20% was cammeneed after 1 hour of
ischaemia. At this point no significant changes had occurred (Table
III). Haemodilu"tion was complete by 2 hours post-occlusion. At this
stage cardiac output was significantly higher in the group as a whole
than was the case in the control group. At 3 hours, mean arterial
pressure and systemic vascular resistance were also significantly
lower than in the control group. However, the changes seen did not
reach values that were significantly different from those observed
prior to LAD occlusion.
83

Table II: Non-treatment (control) group: Changes in systemic
cardiovascular variables following left anterior deseending
coronary artery (LAD) occlusion (n=5).
Pre-LAD
occlusion hour
2
hours
3
hours
4 5
hours hours
=================================================================
HR
AP
co
LVW
SVR
11 2
+7.4
10.9
+0.47
2. 1
+0.22
22
+2.5
302.9
+43.18
122
.±_8.5
11 . 0
.±_0.63
2. 1
+0.20
22
+2.6
320.2
+48.25
127
.±_9.6
1 0. 7
.±.1 • 1 0
2.0
.±_0.26
1 9
.±_3.8
293.9
.±_70.12
1 29
.±_8.7
1 2. 1
.±_0.54
2.3
.±_0.25
25
.±_3.2
304.2
.±_38.18
1 28
.±_8.6
11 • 4
.±_0.76
2.3
.±_0.32
25
.±_4.2
297.9
.±_51. 29
1 32
.±_9. 5
1 2. 2
+0.77
2.4
+0.40
25
.±_3. 7
338.8
.±_60.43
Results are expressed as mean .:!:. SEM. Times are given from
occlusion. No significant differences from pre-LAD occlusion
values are present.
HR Heart rate (beats/min)
AP Mean arterial pressure (kPa)
CO Cardiac output (1/min)
LVW Left ventricular work (J/min)
SVR Systemic vascular resistance (kPa.sec/1)
84

Tab1e III: Haemodi1ution with F1uoso1-DA 20%: Changes in systemic
cardiovascu1ar variab1es fo11owing 1eft anterior deseending
coronary artery (LAD) occ1usion (n=5).
Pre-LAD 2 3 4 5
occ1usion hour hours hours hours hours
========================~========================================
HR
AP
co
LVW
SVR
1 02
.:t_5. 1
9.5
.:!:_0.93
2.6
.:!:_0.31
20
.:!:_2.4
211 • 3
.:t_46.00
. 99
.:!:_1 .3
9.7
.:!:_0.64
2.8
.:!:_0.24
24
.:!:_2.5
1 97.9
.:t_31. 1 9
11 3
.:!:_3.7
9.7
.:!:_0.48
3.5#
.:t_O. 42
27
+3.0
153.3
.:t_30 .1 0
Haemodi1ution was performed between
1 08
.:!:_4. 1
9.5#
.:t_O. 37
2.7
.:!:_0.36
22
.:t_2.4
173.4#
.:t_15.20
11 8
.:t_7. 1
9.8
.:!:_0.70
2.5
.:!:_0.22
21
+2.6
220.0
.:t_32.07
122
.:t_5.3
9.9
.:!:_0.87
2.5
+0.09
21
.:!:_2.6
206.5
.:t_19.80
and 2 hours after LAD
occ1usion. Times are given from occ1usion. Resu1ts are expressed
as mean .:!:. SEM. No significant differences from pre-occ1usion
va1ues are present. Significant difference from the contro1
group: #=p<0.05
HR Heart rate (beats/min)
AP Mean arteria1 pressure (kPa)
CO Cardiac output (1/min)
LVW Left ventricu1ar work (J/min)
SVR Systemic vascu1ar resistance (kPa.sec/1)
85

Table IV: Haernodilution with dextran: Changes in systernic
86
cardiovascular variables following left anterior deseending
coronary artery (LAD) acelusion (n=5).
Pre-LAD 2 3 4 5
acelusion hour hours hours hours hours
=================================================================
HR
AP
co
LVW
SVR
91
+6.0
1 0. 4
.±_0.13
2.2
.±_0.20
21
.±_3.6
251.2
.±_16.30
90
.±_5.2
1 0. 7
.±_0.77
2.0
.±_0.24
20
.±_4.0
289.9
.±_28.16
98
+4.1
1 0. 7
.±_0.69
2.8
+0.22
25
+2.6
** 1 95.5
+24.52
Haernodilution was perforrned between
1 06
.±_7.4
9.5#
.±_0.80
2.7
.±_0. 22
23
.±_3.7
1 09
.±_7.2
9.2
+0.62
2.4
+0.25
21
.±_3. 1
182.4***# 200.7**
.±_18.89 +24.22
111
.±_7.7
9.9#
.±_0.44
2.5
.±_0.25
25
+2.5
216.7
.±_28.57
and 2 hours after LAD
occlusion. Tirnes are given frorn occlusion. Results are expressed
as rnean .±_ SEM. Significant difference frorn pre-acelusion values:
**=p<0.01, ***=p<0.001. Significant difference frorn the control
group: #=p<0.05
HR Heart rate (beats/min)
AP Mean arterial pressure (kPa)
CO Cardiac output (l/rnin)
LVW Left ventricular work (J/rnin)
SVR Systernic vascular resistance (kPa.sec/1)

Haemodilution with 5% dextran 40 (Table IV) produced very
significant decreases in systemic vascular resistance in cernparisen to
pre-acelusion values. Mean arterial pressure was lower than that
obtained in the control group at 1 and 3 hours after the completion of
haemodilution. In the dextran group there was no significant change in
CO, therefore, because of the drop in oxygen content due to haemo
dilution, very significant decreases in whole body oxygen flux
occurred (Table V). No decreasein oxygen flux occurred in the Fluosol
group and it should be noted that at all times after haemodilution the
oxygen flux in the Fluosol group was significantly higher than that of
the dextran group. Although there was no significant difference in
oxygen flux between the Fluosol group and the control group, the
oxygen extraction coefficient in the Fluosol group was significantly
higher than that of the control group at the end of haemodilution.
Table V: Changes in whole body oxygen flux (ml/min) following left
anterior decending coronary artery (LAD) acelusion (n=5).
Pre-LAD 2 3 4 5
acelusion hour hours hours hours hours
==================================================================
Group I 336
(control) _:~:_44.2
Group II 359
(Fluosol) _:~:_36.4
316
_:~:_44.2
399
_:~:_30.2
336
+54. 1
428
+34.3
382
_:~:_41 . 5
374
_:~:_30.4
340
_:~:_54.6
334
_:~:_20.4
389
_:~:_42. 3
329
_:~:_24.7
------------------------------------------------------------------** 233***# ** 235**# Group III 306 280 240 223
(Dextran) _:~:_28.8 _:~:_31.6 +23.0 _:~:_25.4 _:~:_32.8 +28. 1
Haemodilution was performed between and 2 hours after LAD
occlusion. Times are given from occlusion. Results are expressed
as mean _:i: SEM. Significant difference from pre-acelusion values:
**=p<0.01, ***=p<0.001. Significant difference from the control
group: #=p<0.05
87

Following LAD occlusion, marked and abrupt changes
observed. This was interpreted as being due to
interactions taking place and was the end re sult of
in Pmo 2 were
complicated
impairment of
blood supply caused by vascular occlusion, dilation of vessels in the
'border' areas and a concomitant diversion of blood to collateral
capillary circulatory pathways ( described in detail in Chapter 5).
This experiment aimed at improving Pmo2 in the most hypoxic area,
which was not necessarily the area in the middle of infarction.
Analysis of measurements in each animal was therefore confined to the
electrode indicating the greatest percentage decrease in Pmo2 during
the first hour of occlusion. This electrode was then assumed to be in
the 'most hypoxic area' of the infarct.
Tabl.e VI: Changes in myocardial oxygen tension ( mm Hg) in the
most hypoxic area of the myocardium following left anterior
decending coronary artery (LAD) occlusion (n=5).
Pre-LAD
occlusion hour
2
hours
3
hours
4 5
hours hours
=================================================================
Group I 1 40.2
(control) .±_34.92
Group II 1 46. 3
(Fluosol) .±_32.60
* 51 . 1
.±_11.18
* 76.4
+17.80
* 44.7
+9. 1 2
79.1
+23.37
* 41 . 4
+8.84
81 . 8
.±_19.07
* 38.4
+10.24
81 . 9 #
+14.12
* 37.4
.±_8.37
1 31 . a#
+31. 1 9
-----------------------------------------------------------------* * * * * Group III 1 41 . 6 73.6 68.8 68.0 60.7 52.8
(Dextran) .±_50.34 +22.70 .±_28.73 +32.26 .±_28.67 .±_25.53
Haemodilution was performed between and 2 hours after LAD
occlusion. Times are given from occlusion. Results are expressed
as mean .±. SEM. Significant difference from pre-occlusion values:
*=p<0.05. Significant difference from the control group: #=p<0.05
88

The values obtained from the electredes defined as being in the
most hypoxic area are presented in Table VI. Significant decreases in
Pmo2 were observed in all groups at one hour after LAD occlusion;
there were no significant intergreup differences at this point. Mean
Pmo2 values in the control group continued to decline slowly from 51.1
to 37.4 mm Hg (26.8%) between 1 and 5 hours post-occlusion. The Pmo2 values in the dextran group showed a slightly steeper decline from
73.6 to 52.8 mm Hg (28.3%) in the same period, while in the Fluosol
group the Pmo2 values showed a mean increase from 76.4 to 131.8 rnrn Hg
(72.5%). At 4 and 5 hours post-acelusion the Fluosol group values were
significantly higher than those in the control group. These percentage
changes in Pmo2 as compared to 1 hour LAD acelusion are shown in Fig.
3. After 5 hours of ischaemia, mean Pmo2 in the Fluosol group had
reecvered to 90.1% (~ 19.6 SEM) of the pre-acelusion values, whereas
Pmo2 in the dextran and control groups were still significantly
reduced to 37.3% and 26.7% respectively.
%
+100 e--eControl ~Fiuosol
+80 o-oDextran
+60
+40
+20
0
-20
-40
-60
-80
-100 0 2 3 4 5
Time after acelusion ( hours)
Fig. 3: Percentage changes in Pmo2 in the most ischae
mie area of infarction. 1 hour after infarc
tion all Pmo2 •s are considered as 100%; mean
changes from these values have been plotted.
89

Pathalogical examinatien showed areas of ischaemie change in all
three groups. No significant difference in the degree of ischaemia
could be seen between the groups. A reasen for this could be that the
period of time between infarction and death is relatively short ( 5
hours) for pathological examination.
Discussion
This study shows that Fluosol at least prevents a further decrease
in myocardial oxygenation after an infarct. In fact 1 it actually
impraves oxygenation. The delay in apparent impravement could be due
to several factors. Firstly 1 there is a delay of two hours between
infarction and completion of haemodilution. Secondly 1 it takes time
for the Fluosol molecules to penetra te the ischaemie area. Once the
small blood vessels and erythrocytes in this area have been
re-oxygenated 1 blood flow will increase so that a further impravement
of oxygenation can take place (see general discussion at the end of
this chapter).
Haemodilution with Ringer's lactate salution has been employed by
Yoshikawa et al. (1973) to study the effect of low haematocrit on
canine myocardial ischaemia. Following extreme haemodilution (haemato
crit of 6%) they observed that ischaemia 1 assessed by ECG ST segment
elevations 1 did not increase. Brazier et al. (1974) performed similar
werk with dextran. They postulated that the maintenance of myocardial
oxygenation was due to an increase in coronary blood flow secondary to
a decrease in viscosity. Cohn et al. (1975) showed that haemo
dilution1 in dogs 1 wi th dextran 40 or 70 could imprave the surface
manifestations of ischaemie myocardial injury 1 assessed by ST
elevation 1 during temporary ( 30 min) LAD occlusion. Following
permanent ligatien of the LAD 1 administration of dextran 70 improved
blood flow to non-ischaemie areas 1 but no increase in flow was
observed in the areas of infarction 1 in spite of impravement of ST
elevation in this area. Tucker et al. ( 1980) 1 following a study of
infarct size treated with dextran haemodilution 1 concluded that
infarct size was not increased by a 50% reduction in red cell mass.
Moores et al. (1983) have shown that 50% exchange with stroma-free
haemoglobin (SFH) solutions has no effect on myocardial blood flow
90

during exercise in pigs. In dogs suffering frorn rnyocardial ischaernia,
Biro and Beresford-Kroeger (1980) dernonstrated that there was a
greater increase in rnyocardial collateral blood flow with SFH haerno
dilution than with dextran haernodilution; oxygen delivery was also
better in the SFH group. The superiority of SFH over dextran has been
confirrned by Feola et al. (1979) and is, of course, due to the oxygen
carrying capabilities of the haernoglobin. Unfortunately sorne problerns
with this salution still exists, such as its short half-life and low
PSO values; these problerns are being investigated.
Kessler et al. ( 1 983) have reported near normal epicardial Po 2 histograrns in dogs breathing 30% oxygen at a haernatocrit of only 8%
and a 'fluorocrit' of 16%. Biro (1983), also werking in dogs, used
rnicrospheres and histological staining to assess the volurne of rnyo
cardial infarction and the effect of subsequent haernodilution wi th
dextran or Fluosol-DA 20%. A rnarginal decrease in infarcted rnuscle was
found in the Fluosol group, though a rnarked impravement in blood flow
to the ischaemie area was observed. Nunn et al (1983), assessing the
ratio of the area of necrosis to the area at risk in rnyocardial
infarctions, found significantly less necrosis in dogs treated 1 hour
post-acelusion with Fluosol-DA 20% haernodilution than those treated
with saline or left untreated.
This study has dernonstrated that haernodilution itself does not
actually imprave rnyocardial oxygenation, whereas re-oxygenation of
areas of the ischaemie rnyocardiurn is possible following haernodilution
treatrnent using fluorocarbon ernulsions. This has been proved possible
in pigs - animals known to possess only minimal functional collaterals
in cornparison with dogs (Eckstein, 1954), and are also considered to
be more suitable (frorn the point of view of clinical parallels) for
cardiovascular investigations (Moores et al., 1983).
PROPHYLACTIC
FLUOROCARBONS.
TREATMENT
Material and rnethods
AGAINST MYOCARDlAL ISCHAEMIA WITH
The previous sectien dernonstrated that treatrnent with fluoro-
91

carbons after myocardial infarction impraves
subsequent study was to investigate whether
dilution with fluorocarbons could provide
myocardial ischaemia.
myocardial P02 . The
prophylactic haemo-
proteetion against
Table VII: Haemodilution with Fluosol-DA 20% befare left anterior
deseending coronary artery (LAD) occlusion: Changes in systemic
cardiovascular variables following LAD acelusion (n=5).
Pre-LAD
acelusion hour
2
hours
3
hours
=================================================================
HR
AP
co
LVW
SVR
1 41
.:t_12.9
9.7
.:t_0.72
3.3#
.:t_O. 55
34
+6.7
138#
.:t_15.9
1 42
.:t_15.6
9.4
.:!:_0.56
3.3#
.:!:_0.36
26
+4.0
1 65#
+17. 1
148
+20.5
9.8
+0.77
3. 1 #
.:!:_0.36
27
+3.8
1 62
.:t_15.5
1 52
.:t_18.2
9.7#
+0.53
2.9
+0.44
27
+4.8
1 82
.:t_26.2
Haemodilution was performed 30 min. befare LAD occlusion. Times
are given from occlusion. Results are expressed as mean .:!:. SEM. No
significant differences from pre-acelusion values are present.
Significant difference from the control group: #=p<0.05.
HR Heart rate (beats/min)
AP Mean arterial pressure (kPa)
CO Cardiac output (1/min)
LVW Left ventricular work (J/min)
SVR Systemic vascular resistance (kPa.sec/1)
92

The experimental setup was the same as described in the previous
study, except that five pigs were haemodiluted by bleeding 20 ml/kg
bodyweight and replacing the wi thdrawn blood wi th Fluosol-DA 20% 30
minutes befare the distal third of the LAD was occluded. These pigs
were compared to the control group of 5 non-treated animals.
Results
After prophylactic treatment with Fluosol (and befare LAD
occlusion), cardiac output was significantly higher and systemic
vascular resistance significantly lower in the Fluosol group. This
corresponds to the changes in the group treated with Fluosol after
occlusion. LAD acelusion caused no significant changes in cardio
vascular parameters for the 3 hours during which measurements were
made (Table VII).
%
+40
+20
0
-20
-40
-60
-80
-100 0 60
~ Pre-treatment Fluosol ...._... Control
120 180
Time after LAD acelusion ( mins) Fig. 4: Percentage change in Pmo2 in the most is
chaemie area of myocardial infarction in pigs
(mean ~ SEM). Significant changes (in measured
values) following occlusion: *=p<O.OS
93

Initial analysis of myocardial oxygen tension was performed by the
same method as described in the previous sub-chapter; i.e. re sul ts
were analysed from those microelectrades showing the greatest
percentage decrease in Pmo2 over the first hour of acelusion in each
animal. Figure 4 shows percentage change, from such electrodes, for
control and Fluosol groups. Mean Pmo2 significantly decreased after 15
minutes of ischaemia in the control group, whilst this effect occurred
af ter 45 minutes
%
+40
+20
0
-20
-40
-60
-80
-100 0
in the Fluosol group.
60
o-o Pre-treatment Fluosol ._. Control
120 180
Time after LAD occlusion (mins)
Fig. 5: Percentage change in myocardial oxygen
tensions in all electrades (mean .±. SEM)
following LAD acelusion in pigs. Significant
changes (in measured values) following
occlusion: *=p<0.05, **=p<0.01, ***=p<0.001.
Significant difference from the control group:
#=p<0.05
Percentage changes for all electrades are shown in figure 5. Even
though the mean Prno2 in this figure also represents non-ischaemie
tissue, the mean Pmo2 was significantly lower after 15 minutesin the
94
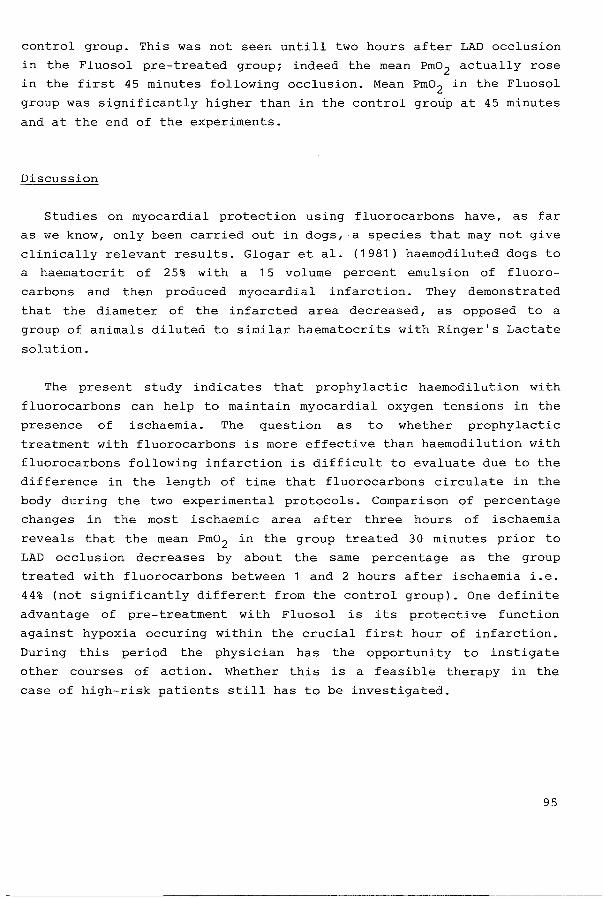
control group. This was not seen untill two hours after LAD occlusion
in the Fluosol pre-treated group; indeed the rnean Prno2 actually rose
in the first 45 rninutes following occlusion. Mean Prno2 in the Fluosol
group was significantly higher than in the control group at 45 rninutes
and at the end of the experirnents.
Discussion
Studies on rnyocardial proteetion using fluorocarbons have, as far
as we know, only been carried out in dogs, a species that rnay not give
clinically relevant results. Glogar et al. (1981) haernodiluted dogs to
a haerna toerit of 25% wi th a 1 5 volurne percent ernulsion of fluoro
carbons and then produced rnyocardial infarction. They dernonstrated
that the diameter of the infarcted area decreased, as opposed to a
group of animals diluted to sirnilar haernatocrits with Ringer's Lactate
solution.
The present study indicates that prophylactic haernodilution with
fluorocarbons can help to rnaintain rnyocardial oxygen tensions in the
presence of ischaernia. The question as to whether prophylactic
treatrnent with fluorocarbons is more effective than haernodilution with
fluorocarbons following infarction is difficult to evaluate due to the
difference in the length of time that fluorocarbons circulate in the
body during the two experirnental protocols. Cornparison of percentage
changes in the most ischaemie area after three hours of ischaernia
reveals that the rnean Prno2 in the group treated 30 rninutes prior to
LAD occlusion decreases by about the sarne percentage as the group
treated with fluorocarbons between 1 and 2 hours after ischaernia i.e.
44% (not significantly different frorn the control group). One definite
advantage of pre-treatment with Fluosol is its protective function
against hypoxia occuring within the crucial first hour of infarction.
During this period the physician has the opportunity to instigate
other courses of action. Whether this is a feasible therapy in the
case of high-risk patients still has to be investigated.
95

LIMB PRESERVATION IN REPLANTATION SURGERY
Material and Methods
In five patients who had undergone traumatic amputations, the
amputated part was perfused with Fluosol-DA 20% for between 16 and 46
hours:
Patient A: a 42-year-old man whose left lower leg was severed in a
car accident. Due to extensive crush injury, replantation was not
possible without shortening the leg by about 20 cm.
Patient B: a 50-year-old right-handed man who was admitted to
hospital after an accident invalving a circular saw. The first and
third digits of his left hand were injured and the second digit was
subtotally amputated. The two damaged digits were surgically
repaired, but the amputated finger could not be replanted due to
poor blood outflow of both digital arteries proximal to the injury.
Patient C: a 49-year-old mechanic who suffered total amputation of
his left thumb at the metacarpophalangeal joint. Arterial outflow
was very poor probably due to the fact that the patient was a heavy
smoker. Soft tissue and bone crush was extensive over a long
distance, making replantation impossible.
Patient D: a 28-year-old left-handed carpenter who severed digi ts
2,3,4 and 5 of his left hand with a rotary saw. Replantation surgery
was performed in which digit 3 was replanted on ray 2, digit 4 on
ray 3, and digit 5 on ray 5. Digit 2 was preserved by perfusion with
Fluosol. The reason for this decision was based on experience with
similar cases in which replantation of the final digit almost
invariably produced poor results, due to the longer period of
ischaemia. Digit 2 was chosen for this treatment as it had been am
putated at the interphalangeal joint and thus had the worst
prognosis for viability
Patient E: a 32-year-old right-handed tulip bulb grower who am
putated his left thumb with a circular saw, just proximal to the
96

interphalangeal joint. At the time of admission, surgeons of the
replantation team were engaged in another emergency operation.
Consequently an attempt was made to preserve the thumb by perfusion
with Fluosol.
The main supplying artery of the extremity or digit was cannulated,
and perfusion was started with Fluosol-DA 20%. The perfusate, cocled
to 5°C, was oxygenated by means of a bubble oxygenator using a gas
mixture of 95% oxygen and 5% carbon dioxide. A pulsatile pump was used
and the mean arterial pressure was maintained at about 90 mm Hg as
measured by an aneroid pressure gauge. The perfusate was allowed to
drain spontaneously from veins and venules at the cut surface and drip
into the oxygenator (Fig. 6).
pulsatile pump
cooling fluid
oxygenator: 02 + co2 _j
Fig. 6: Experimental setup for perfusing amputated
extremities.
Microcirculatory oxygenation was monitored by placing steel
protected gold microelectredes at various intramuscular and sub
cutaneous sites. Biochemical measurements of K+, lactate and glucose
from the total perfusate were performed at regular intervals of 4 or 6
hours. Gas tensions and acid-base status were a lso moni tored at the
97

same intervals. Muscle biopsies were taken from the foot of patient A
and examined histologically. The levels of ATP and its breakdown
products were measured in several muscle specimens. At the end of the
experiments, sections were taken of muscle, artery and vein for
electron microscopie examination.
Results
Clinical Appearance
During perfusion wi th Fluosol-DA 20%, eederna gradually developed
and was clinically manifest after 8 hours of perfusion. The weight of
the perfused digits increased by ± 2.5 g (10% increase). At the end of
the perfusion period, when Fluosol was replaced by blood to simulate
replantation, the colour of the extremity and digits became pink, with
normal capillary refill and blood outflow from the veins. In Patient
D, the digit was replanted after 24 hours (8 hours cold ischaemia and
16 hours perfusion). This digit survived for 3 days but unfortunately,
tagether with another digit, had to be removed. Patient E achieved
completely successful replantation of a perfused thumb 22 hours after
amputation ( 3 hours warm ischaemia, 2 hours cold ischaemia and 17
hours perfusion).
Histology
Light microscopy. In the foot of Patient A there were no gross
alterations between the histology of tissue befare perfusion and after
46 hours of perfusion. The only changes observed was an increased
space between the muscle fibres, probably caused by oedema. In
sections of the digi ts of the other patients, eederna was present
mainly in the vicinity of the blood vessels.
Electron microscopy. The only pathological finding was the absence
of vascular endothelium. After one month, a biopsy was taken of the
replanted thumb in Patient E. No abnormal findings were detected in
this tissue.
98
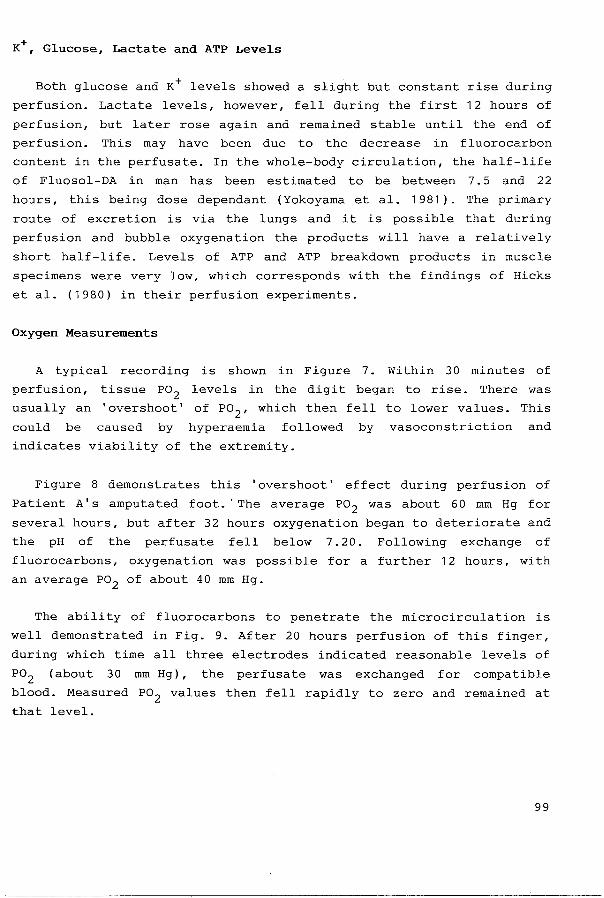
K+, Glucose, Lactate and ATP Levels
Both glucose and K+ levels showed a slight but constant rise during
perfusion. Lactate levels, however, fell during the first 12 hours of
perfusion, but later rose again and remained stable until the end of
perfusion. This may have been due to the decrease in fluorocarbon
content in the perfusate. In the whole-body circulation, the half-life
of Fluosol-DA in man has been estimated to be between 7. 5 and 22
hours, this being dosedependant (Yokoyama et al. 1981). The primary
route of excretion is via the lungs and it is possible that during
perfusion and bubble oxygenation the products will have a relatively
short half-life. Levels of ATP and ATP breakdown products in muscle
specimens were very low, which corresponds with the findings of Hicks
et al. (1980) intheir perfusion experiments.
Oxygen Measurements
A typical recording is shown in Figure 7. Within 30 minutes of
perfusion, tissue P02 levels in the digit began to rise. There was
usually an 'overshoot' of P02 , which then fell to lower values. This
could be caused by hyperaemia followed by vasoconstriction and
indicates viability of the extremity.
Figure 8 demonstrates this 'overshoot' effect during perfusion of
Patient A's amputated foot. 'The average P02 was about 60 mm Hg for
several hours, but after 32 hours oxygenation began to deteriorate and
the pH of the perfusate fell below 7.20. Following exchange of
fluorocarbons, oxygenation was possible for a further 12 hours, with
an average P02 of about 40 mm Hg.
The ability of fluorocarbons to penetrate the microcirculation is
well demonstrated in Fig. 9. After 20 hours perfusion of this finger,
during which time all three electrades indicated reasonable levels of
P02 (about 30 mm Hg), the perfusate was exchanged for compatible
blood. Measured P02 values then fell rapidly to zero and remained at
that level.
99

Oxygen tension in mmHg
100
mm Hg
145
108
72
-----------------------------------------, 36 ··. ··.
..... ___________ ...
'·· ~· ·············································· ············· ....................
2 4 6 8 10 12 14 hours of perfusion
Fig. 7: Tissue oxygen tensions during Fluosol
108
72
36
perfusion of an isolated digit.
Exchange of fluosol
~(\ 33h.
i\ i' .. ... :'i \ :! : f. ·\ r·-~ _____ , , ,,, ~ ---- ......... .. IJ~ • / ---- : ', :.t ··-~-.:>-· ·--·-· --". L \ . .. .... ______________ .. ~ .. ..---------- ----------------------..... ~. i: ".-.. \
,. ..... •· ···• ":••,, '·1 I ', .' .• .\ ..• -.. . -~~ F:.._j_:?-·\ 'ï-· .. . \~ .. -:~.!'
0 1 2 3 4 6 8 10 12 14 16 18 20 22 24 26 28 30 32 34 36 38 40 42 44 46
Hours of perfusion
Fig. 8: Tissue oxygen tensions during Fluosol
perfusion of a traumatically amputated foot.
16

Oxygen tension in mmHg
145
108
72
36
0
_ ..... , . / :
"' ·" : ' : . \: ~
=', • .. .......... · ..
.... -.,· .. __
Replacement of fluosol by blood
• \\ ··-................ -··· ..... ~ . . \
\ \ \ \ \
2 4 6 8 1 0 12 14 16 18 20 22 24
Hours of perfusion
Fig. 9: Failure to re-perfuse with blood following
Fluorosol perfusion of an isolated digit.
Discussion
Although cases of extremely long periods of ischaemia prior to re
plantation have been reported (May, 1981), these tend to be incidental
successes that are difficult to repeat. The successful replantation of
larger amputated parts (a complete hand or foot) with a period of cold
ischaemia greater than 24 hours has also been reported (Lapchinsky
1960). However, this often results in a hazardous postoperative period
and the necessity for re-amputation. In these cases, moreover, the
ultimate level of function is generally poor as impaired oxygenation
ultimately results in muscle fibrosis.
The use of suitable perfusion fluids in order to avoid irreversible
tissue damage due to ischaemia has been investigated by several
authors (Harashina and Buncke 1975, Hayhurst et al. 1974, Hicks et al.
1 980, Maurer at al. 1 982). Basically these papers report that low
temperature of the perfusate is the most important factor, due to the
1 01

fact that this decreases metabolism. In addition, perfusion can help
to wash out (toxic) breakdown products. Perfusion with fluorocarbons
has the added advantage of increasing oxygen supply. Fluorocarbons in
replantation surgery was initiated by Asai et al. (1981), who perfused
an amputated left forearm for half an hour prior to replantation. No
significant problems occurred following replantation.
In our studies, the anoxic period was drastically shortened in
comparison to those of the above-mentioned authors. No significant
changes occurred in the microscopie sections, probably due to
continuous del i very of oxygen to the tissues. Electron-microscopie
tests showing the lack of endothelium suggests, however, that the
vessels were indeed damaged. This may be due to the period of warm
ischaemia prior to perfusion (Morrison et al. 1976), or it might be a
consequence of oxygen radical toxicity. The fact that replantation is
possible after 24 hours of perfusion supports the idea of neo-intima
formation (Smith et al. 1980).
Perfusion of extremities with fluorocarbons at low temperatures
will both increase the oxygen carrying capacity of the perfusate and
decrease oxygen consumption of the extremity. At 15°C the oxygen
carrying capacity of Fluosol-DA 20% is increased by approximately 20%
(Naito and Yokoyama, 1978), whereas oxygen consumption is decreased by
approximately 85% (Benazon, 1974). It may, therefore, be possible to
perfuse with fluorocarbons equilibrated with room air instead of 95%
o2 which may prevent the disappearance of vascular endothelium.
The benefits of fluorocarbon perfusion can be summarised as
fellows:
1. Starage of digits with minimal tissue damage is possible, e.g. in
patients with multiple digit replants, in situations wher'e the
replantation team is occupied, or in multi-traumatised patients in
whom life-threatening conditions must be treated first.
2. Patient and extemi ties transportation over longer di stances or
periods of time might be feasible.
3. Perfusion might provide useful data (P02 levels, good inflow and
outflow) that indicate the condition of an amputated extremity.
This information may then influence decisions as to whether
replantation surgery is indicated, especially in doubtful cases.
1 02

In conclusion, the above work has demonstrated that extracorporal
perfusion with fluorocarbons can maintain oxygenation and viability of
isolated extremities for periods of up to 48 hours.
GENERAL DISCUSSION
In order to understand the mechanism whereby impravement in oxy
genation is effected by fluorocarbons, it is necessary to consider
some of the properties of normal blood and of the Fluosol-DA 20% used
in these studies. Blood is a non-Newtonian fluid: a liquid whose
viscosity changes with shear rate; at low flows its viscosity can be
10 to 100 times that at high flows. This situation will tend to impede
flow in the microcirculation. Two important factors tend to imprave
the circulation through capillaries:
1. 'Plasma skimming' takes place, in which the smaller vessels receive
proportionately more plasma and less erythrocytes than are present
in the general circulation. This decrease in haematocrit leads to a
lower viscosity in the smallest vessels.
2. The 1 Fahraeus-Lindquist phenomenon 1, whereby erythrocytes can flex
to such an extent that they can pass through vessels of
considerably smaller diameter than themselves. This is so effective
that the blood then behaves like a Newtonian fluid, with a
viscosity that does not differ from pure plasma (Goslinga, 1982).
This phenomenon only hclds good to a certain extent and, at
cri ti cal diameters of the capillaries, the sa-called 1 inversion
phenomenon 1 occurs, whereby further decreases in capillary dia
meter results in a sudden sharp increase in viscosity.
Under certain conditions, the inversion phenomenon occurs at a
greater vascular diameter than normal. These conditions include
platelet aggregation and acidosis, in which vascular flexibili ty is
decreased (Schmid-Schoenbein et al. 1973). In an ischaemie area,
considerable decreases in pH may be found and Cohn et al. (1974) have
used epicardial pH measurements to map the extent of experimental
myocardial ischaemia. They found a statistically significant
correlation between ST segment elevation and pH decreases with a mean
surface pH of 7.23 in the maximal ischaemie area. According to
1 03

Schmid-Schoenbein et al. (1973), this
pliabili ty of the erythrocytes. Khuri
would
et al.
be enough to reduce
( 1 979) measured even
lower pH values in the myocardium following 3 hours of LAD acelusion
in the dog. Hence, blood viscosity will increase markedly under
condi ti ons of ischaemie hypoxia and impaction of erythrocytes will
occur.
It is well established that whole body blood viscosity is increased
in patients with myocardial infarction (Dintenfass, 1964~ Ditzel et
al. 1968). Jan et al. (1975) have shown that the early changes in
blood viscosity are due to a combination of high haematocrit and
increases in plasma viscosity and red cell aggregation - factors which
will impede collateral capillary flow to ischaemie areas. Biro (1983)
has shown that viscosity is markedly raised hour after LAD
occlusion. When fluorocarbon ar dextran haemodilution is performed,
viscosity is considerably lowered in camparisen with the control
animals.
The particles of emulsified fluorocarbons in Fluosol are very
small. The mean diameter is 0. 118 microns and more than 90% of the
particles are less than 0.2 microns in diameter (Naita and Yokoyama,
1978). The mean diameter of erythrocytes is very large in comparison.
It is probable that a combination of low viscosity and small emulsion
partiele size confers a unique ability for penetrating deep into
collateral capillary pathways and for bypassing stiffened ery
throcytes. It is a lso possible tha t reoxygena ti on of these impacted
red cells occurs with subsequent further impravement in penetratien of
the ischaemie area. In this way the viscious ei rele of stagnant
acidosis can be braken.
The clinical implications of the above findings are numerous and
diverse. Fluorocarbons relieves us of the problem of bloodtype
incompatibilities, although, as in all plasma expanders, adverse
clinical reactions can occur (Tremper et al. 1984). The use of Fluoro
carbons instead of blood products can help to reduce the number of
cases of hepatitis B and A.I.D.S. There are many more possible
applications of fluorocarbons including the treatment of Jehovah's
Witnesses needing blood transfusion (Lapin, 1 983), the treatment of
solid tumours (Teicher and Rose, 1984) and intraperitoneal perfusion
1 04

with fluorocarbons in pulmonary insufficiency (Klein et al. 1986).
Faithfull (1987) has reviewed these applications in more detail. The
importance of fluorocarbons in maintaining and improving
microcirculatory oxygenation should not be underestimated and, in the
future, even more possibilities may be discovered.
REPERENCES
This chapter was based on work published in the following articles:
Faithfull N.S., Fennema M., Erdmann W., Lapin R., Smith A.R.,
van Alphen B., Essed C.E., Trouwborst A. (1985} Tissue
oxygenation by fluorcarbons. Adv Exp Med Biol. 180: 569.
Faithfull N.S., Erdmann W., Fennema M., Kok A. (1986) The effects of
haemodilution with fluorocarbons or dextran on oxygen tensions
in the acutely ischaemie myocardium. Br ~ Anaesth. 58: 1031.
Faithfull N.S., Fennema M., Erdmann W. (1987) Prophylaxis and treat
ment of myocardial ischaemia by haemodilution with fluorocarbon
emulsions. Adv Exp Med Biol. 215: 89.
Smith A.R., van Alphen B., Faithfull N.S., Fennema M. (1985) Limb
preservation in replantation surgery. Plast Reconst Surg. 75:
227.
Other references:
Asai M., Tangiku 0., Wada E., Kodama N., Yagisawa Y., Akahoshi Y.
(1981) Amputated forearm preservation with perfusion of Fluosol
DA-20. Case report. Jap Soc Surg Hand. 129.
Benazen D. (1974) Hypothermia. In: Schurr C. and Feldman S. (eds.):
Scientific Foundations of Anaesthesia. William Heinemann Medical
Books, London. p. 344.
Biro G.P, Beresford-Kroeger D. (1980) The effect of hemodilution with
stroma-free hemoglobin and dextran on collateral perfusion of
ischaemie myocardium in the dog. Am Heart ~· 99: 64.
Biro G.P. (1983) Flurocarbon and dextran hemodilution in myocardial
ischaemia. Can ~ Surg. 26: 163.
Brazier J., Cooper N., Maloney J.V., Buckberg G. (1974) The adequacy
1 os

of myocardial oxygen delivery in acute normovalemie anaemia.
Surgery. 75: 508.
Clark L.C., Gollan F. (1966) Survival of mammals breathing organic
liquids equilibrated with oxygen at atmosperic pressure. Science
152: 1755.
Cohn L.H., Fujiwara Y., Collins J.J. jr. (1974) Mapping of ischemie
myocardium by surface pH determination. ~ Surg Res. 16: 210.
Cohn L.H., lamberti J.J., Florian A. Moses R., Vandevanter S., Kirk E,
Collins J.J.jr. (1975) Effects of hemodilution on acute myo
cardial ischemia. ~ Surg Res. 18: 523.
Dintenfass L. (1964) Viscosity and clotting of blood in veneus
tbrambosis and coronary occlusions. Circ Res. 14: 1.
Ditzel J., Bang H.O., Thorsen N. (1968) Myocardial infarction and
whole-blood viscosity. Acta Med Scand. 183: 577.
Eckstein R.W. (1954) The ineffectiveness of cortisoneon functional
coronary interarterial collateral circulation. Circ Res. 2: 466.
Faithfull N.S. (1987) Fluorocarbons: Current status and future
applications. Anaesth 42: 234.
Feola M., Azar D., Wiener L. (1979) Improved oxygenation of ischemie
myocardium by hemodilution with stroma-free hemoglobin
solutions. Chest. 75: 369.
Glogar D.H., Kloner R.A., Muller J., de Boer L.W.V., Braunwald E.,
Clark L.C.jr. (1981) Fluorocarbons reduce myocardial ischemie
damage after coronary occlusion. Science. 211: 1439.
Goslinga H. (1982) The viscosity of blood. An experimental study into
the effects of alterations in blood viscosity during shock. PhD
Thesis. University of Utrecht.
Grote J., Steuer R., Muller R., Sontgerath C., Zimme K. (1985) o2 and
co2 solubility of the fluorocarbon emulsion Fluosol-DA 20% and
o2 and co2 dissociation curves of blood - Fluosol-DA mixtures.
Adv Exp Med Biol. 191: 453.
Harashina T., Buncke H.J. (1975) Study of washout solutions for micro
vascular replantation and transplantation. Plast Reconstr Surg.
56: 542.
Hayhurst J.W., O'Brien B. McC., Ischida H., Baxter T.J. (1974)
Experimental digital replantation after prolonged cooling. Hand.
6: 134.
Hicks T.E., Boswiek J.A., Solomans e.c. (1980) The effects of per
fusion on an amputated extremity. J Trauma. 20: 632.
1 06

Jan K.M., Chien S., Bigger J.T.jr. (1975) Observations on blood
viscosity changes after acute myocardial infarction.
Circulation. 51: 1079.
Kelman G.R. (1966) Digital computer subroutines for the conversion of
oxygen tension into saturation. ~ AE2l Physiol. 21: 1375.
Kessler M., Vogel H., Gunther H., Harison D.K., Haper J. (1983) Local
oxygen supply of the myocardium after extreme hemodilution with
Fluosol-DA. Prog Clin Biol Res. 122: 237
Khuri S.F, Kloner R.A., Rillis L., Tow D.E., Barsamian E.M.,
Maroko P.R., Braunwald E. (1979) Intraroural PC02 : A reliable
index of the severity of myocardial ischemie injury. Am~
Physiol. 237: 253.
Klein J., Faithfull N.S., Salt P.J., Trouwborst A. (1986) Trans
peritoneal oxygenation with fluorocarbons. Anesth Anal. 65: 734.
Lapchinsky A.G. (1960) Recent results of experimental transplantation
of preserved limbs and kidneys and possible use of this
technique in clinical practice. Ann Acad Sci. 87: 539.
Lapin R. (1983) The feasibility and physiological aspectsof
anesthesia and surgery without homologous blood transfusion. PhD
Thesis, Erasmus University, Rotterdam.
Maurer W.G., Wilsou L.C., Higgs W.R. (1982) The preservation of a
traumatically amputated limb utilising crystalloid cardioplegia
solution: Case report.~ Extraeerpor Technol. 14: 453.
May J.W. jr. (1981) Digit replantation with full survival after 28
hours of cold ischaemia: Case report. Plast Reconstr Surg. 67:
566.
Moores Y.M., White F.C~, Bloor C., Greenburg A.G., Mack R., Will
ford D.C. (1983) The physiologic effects of oxygen transport by
hemoglobin solutions. Prog Clin Biol Res. 122: 89.
Morrison A.D., Orci L., Eerwiek L. (1976) A new look at the metabolism
of the arterial wall. Trans Assoc Am Physicians. 89: 237.
Naito R., Yokoyama K. (1978) Perfluorochemical blood substitutes.
Green Cross Corporatien Tech Inform Ser No. 5, Osaka, Japan.
Nunn G.R., Dance G., Peters J., Cohn L.H. (1983) Effects of fluora
carbon exchange transfusion on myocardial infarction size in
dogs. Am ~ Cardiol. 52: 203.
Schmid-Schoenbein H., Weiss J., Ludwig H.A. (1973) A simple method for
measuring red cell deformability in methods of the micro
circulation. Blut. 16: 369.
107

Smith A.R., Kort W.J., van der Meulen J.C. (1980) Preliminary obser
vations on allergenie and isogenie vein grafts in rats. Int J
Microsurg. 2: 87.
Teicher B.A., Rose C.M. (1984) Perfluorochemical emulsions can
increase tumor radiosensitivity. Science. 223: 934.
Tremper K.K., Vercellotti G.M., Hammerschmidt D.E. (1984) Hemadynamie
profile of adverse clinical reactions to Fluosol-DA 20%. Crit
Care Med. 12: 428
Tucker W.Y., Bean J., Vandewater S., Cohn L.H. (1980) The effect of
hemodilution on experimental myocardial infarct size. Eur Surg
Res. 1 2: 1 .
Yokoyama K., Watanabe M., Naito R. (1981) Retentien of per
fluorochemicals (PFCs) in blood of human recipients after
infusion of Fluosol-DA 20%. In: Frey R., Beisbarth H., Stosseck
K. (eds.) Oxygen carrying Colleidal Blood Substitutes.
Zuckschwerdt Verlag, Munchen, p. 214.
Yoshikawa H., Powell W.J.jr., Bland J.H.L., Lowenstein E. (1973)
Effects of acute anemia on experimental myocardial ischemia. Am
~ Cardiol 32: 670
Zander R., Makowski H.V. (1982) In: Frey R., Beisborth H., Stossek K.
(eds.) Oxygen carrying Colleid Substitutes. Zuckschwerdt
Verlag, Munchen, p. 131.
108

CHAPTER 7
CHANGES IN INTRAMYOCARDIAL OXYGEN TENSION DURING HYPOTHERMIA IN PIGS.
M. Fennema, 0. Prakash, M. Dhasmana, S. Faithfull, W. Erdmann.
Department of Anesthesiology,
Erasmus University, Rotterdam
Adv. Exp. Med. Biol. (1986) 200: 349-358.
INTRODUCTION
Hypothermia is firmly established as a therapeutic measure in open
heart surgery. The effects of hypothermia on the body were noted as
early as 1798 when James Currie of Liverpool treated patients with
fever by cooling them to 32° C. Observations on the effect of body
cooling on animals were made during the 19th and early 20th century by
Claude Bernard. Smith and Fay (1940) demonstrated the analgesie
effects of hypothermia in the cancer patient. Bigelow et al. (1950)
caoled dogs by surface immersion in cold water to below 25° C and
maintained circula tory arrest for 1 5 minutes. The introduetion of
cardiopulmonary bypass in the 1950's enabled rapid safe cooling of the
patient; hypothermia was improved for clinical use during cardiac
surgery by Swan (1984).
Many workers have reported on the roetabolie changes occurring
during hypothermia {Lloyd and Mitchell 1974, Prakash et al. 1978,
Becker et al. 1981, White 1981, Wong 1983, Swain et al. 1984) but, as
far as we are aware, no studies have been made on the effects of
hypothermia on myocardial oxygen tension ( Pmo2 ) . Experiments were
109

therefore perforrned in pigs to investigate any changes in Prn02 that
occur under whole body hypotherrnia. This paper reports our prelirninary
findings.
MATERIAL AND METHOOS
In eight juvenile Yorkshire pigs (+ 25 kg), anaesthesia was induced
with intraperitoneal sodiurn thiopento~e (30 rng.kg- 1 ) and rnaintained on
mixtures of ni trous oxide and oxygen ( 3: 2) . Muscular relaxa ti on was
rnaintained by continuous infusion of pancuroniurn bromide -1 -1 (0.5 rng.kg .hr ) using a Braun Melsungen perfuser. The animals were
intubated and ventilated using a Serve ventilator, the minute volurne
of which was adjusted to produce an end tidal carbon dioxide
percentage of between 4 and 5 volumes percent.
A six French gauge BP6 angiographic catheter (Williarn Cook, Europe)
was introduced into the fernoral artery, through an incision in the
right inguinal region, and a seven French gauge KMA therrnodilution
Swan Ganz catheter was introduced into the left fernoral vein. The
latter was advanced under pressure monitoring into the pulrnonary
artery so that pulrnonary capillary wedge pressure could be obtained.
Therrnodilution cardiac output rneasurernents were perforrned using a KMA
cardiac output computer Model 3500E. Via the ether fernoral vein,
another Cook BP6 catheter was passed into the inferior vena cava in
order to obtain central veneus pressure rneasurernents. All the above
pressure lines were connected to Gould Statham P23D pressure
transducers. Via the right carotid artery, a Millar microtip pressure
transducer PC470 was introduced into the left ventricle for
ventricular pressure and dP/dt rneasurernents. ECG signals were obtained
frorn needle electrodes.
A rnidline thoracotorny was perforrned and the pericardium was
reflected. An electrornagnetic flow probe was rnounted around the left
circumflex coronary artery and connected to a transflow 601 flowmeter
(Skalar). All the above signals were fed into a 12 channel Grass 7D
polygraph and recorded on paper. After offline input of the cardio
vascular variables into a Philips P2000 microcomputer, left and right
ventricular minute work and systernic and pulrnonary vascular resistance
could be calculated.
11 0

Temperatures from the nasopharynx, rectum and tympanie membrane
were measured by the use of thermistor probes and an Ellab Instru
ments electrical thermometer system type TE 5. In addition, a needle
thermister was placed subcutaneously in the thoracotomy wound. The
pulmonary arterial temperature was displayed on the KMA cardiac out
put computer.
Mixed veneus and arterial blood gas estimations were performed at
regular intervals using a Radiometer ABL Acid/base laboratory.
Arterial and mixed veneus haemoglobin estimations and oxyhaemoglobin
saturations were measured using a Radiometer OSM2 Hemoximeter. The
above mentioned measurements allowed the following parameters to be
calculated on the Philips P2000 microcomputer: arterial and mixed
veneus oxygen contents and whole body flux and consumption.
Statistical significanee was assessed on a Commodore 64 microcomputer
using paired Student's t tests and the nul hypothesis was rejected at
p<0.05.
Fig. 1: Experimental setup.
1= Intraventricular line
2= Central venous line 3= Microelectrades
4= Amplifier 5= Arterial line
6= Swan Ganz TD catheter 7= Faraday cage
111

Measurement of Pmo2 was accomplished with the use of four
steel-protected gold microelectrades (Clark Electromedical Instru
ments) and a Ag/AgCl reference electrode. These electrodes, 200
microns in diameter, were embedded in a thin flexible plastic plate
~5 cm x 2 cm, which was sewn onto the epicardium of the left
ventricle. The distance between the electrades was cm and in
position they protruded 3 mm into the left ventricular wall to ensure
contact with the myocardium. When the gold electrades are negatively
polarised, oxygen is reduced causing a current to flow through the
amplifier ( Knick nanoamperemeter). At a voltage of -800 mV, this
current is directly proportional to the o 2 concentration. To ensure
partial pressure measurement, the electrode tips are covered with a
plastic membrane, which also prevents protein poisoning and minimises
conveetien dependency (Erdmann et al. 1979, Fennema and Erdmann 1985).
Because the currents are so small (1-20 nanoamperes) measurements were
performed in an isolated Faraday cage. The amplified signals were
registered on a Rickadenki recorder model KA 60.
About 2 hours after polarisation, the electrades were calibrated in
a 22° C saline solution, through which gases of known o 2 partial
pressure could be bubbled for equilibration. After the experiments,
the electrades were again calibrated to ensure reliability and to
estimate any drift that had taken place. Results were discarded from
any electrode having a drift of more than 7.5% per hour. Due to the
physical qualities of the noble metal, the current produced by the
microelectrades is proportional to the temperature, so that the Pmo2 measurements had to be corrected for temperature and drift with the
use of the Philips P2000 computer.
After allowing time for stabilisation of the preparation, cooling
was cammeneed using a Therma-Rite heat exchanger and mattress. The
temperature was reduced at a rate of 2° C per hour until a temperature
of approximately 30° C was achieved. The pig was then rewarmed, at
about the same rate, until the temperature was stable at 37-38° C. Our
research group, and other workers (Rahn and Reeves 1982, Wong 1983,
Swan 1984), consider that the blood gas values should not be corrected
for temperature and uncorrected arterial carbon dioxide tensions
should be maintained between 35 and 45 mm Hg. For this reason
ventilation was not adjusted during hypothermia.
11 2

RESULTS
The tympanie temperature, an indication of the brain temperature
(Swan 1984), was constantly about 0.2° C lower than the temperature
measured in the pulmonary artery which was approximately 0.1° higher
than the reetal temperature. The temperature of the nasopharynx was
always lower than all the temperatures mentioned above and this
discrepancy increased during rewarming. The thoracic wall sub
cutaneous temperature was 2 to 4 degrees lower than the blood
temperature. For these reasons the temperature at the tip of the
Swan-Ganz catheter was used as a marker for core temperature (Reinhold
et al 1 982).
Table I shows the changes occurring in measured and derived cardio
vascular values during induction and recovery from hypothermia. During
induction of hypothermia, significant decreases in cardiac output (CO)
and left ventricular work (LVW) were seen, accompanied by a
significant increase in systemic vascular resistance ( SVR) (fig. 2).
During the in i ti al decrease in temperature, both arterial pressure
(AP) and dP/dt showed significant increases, returning to normal
values at 31° C. In general these changes were reversed during
rewarming, but SVR and AP remained high at the end of rewarming. In
general, these changes were also reflected in the pulmonary
circulation.
As previously mentioned, the ventilation was not adjusted during
the experiment, and therefore end expiratory co2 concentration
decreased during hypothermia (p<0.001 ). The arterial PC02 , bicarbonate
and pH also showed significant decreases, but remained wi thin the
normal range (Table II). Af ter rewarming, the bicarbonate
concentration was still lower than control levels (p<0.01). The haemo
globin concentrations increased (P<O.OS), whilst the oxyhaemoglobin
saturations remained constant throughout the whole experiment. None of
the above mentioned changes presented problems.
11 3

Table I: Cardiovascular changes during hypothermia and rewarming
37°C 35°C 33°C 31°C +33°C +35°C +37°C
================================================================= AP
PCWP
co
CF
1 07
.±_4.9
12
.±_1.4
2.53
.±_0.32
39
+2.7
11 4
.±_7.4
1 2
.±_1.9
2.35
.±_0.33
41
.±_2.0
* 1 20
+6.7
1 2
.±_1.8
2.22
+0.29
41
.±.2. 1
11 3
.±_7.5
11
.±_2.3
**
* 1 23
.±_7.5
1 3
+2.3
1.61 1.72
.±_0.27 .±_0.22
38 49
.±.3. 8 .±_5.8
* 1 24
.±_6.6
1 3
+3.4
1 • 94
+0.34
48
.±_6.4
11 7
.±_6.1
1 3
+3.5
1 • 78
.±_0.48
53
+9.0
-----------------------------------------------------------------dP/dt * * 4.23 4.90 5.88 5.25 5.92 6.56 5.92
+0.27 +0.28 +0.54 .±_0.32 .±_0.45 .±_0.50 .±_0.37
HR 1 31 1 45 120 1 24 135 153 1 51
+ 1 0. 1 +7.9 +20.4 .±_2.9 .±_11.7 .±_7.7 .±_13.5
-----------------------------------------------------------------* LVW 3.1 4 3.33 3.32 2.34 2.66 3.00 2.66
+0.52 .±_0.53 +0.44 .±_0.32 .±_0.44 .±_0.58 +0.82
-----------------------------------------------------------------* * *
SVR 3500 4310 4520 5850 5430 5110 5580
+370 +917 .±_722 .±_1100 +717 .±_816 +826
( 8) ( 8) ( 8) ( 7) ( 5) ( 5) ( 5)
Results are expressed as mean .±. SEM. Significanee on paired
Studentt-test compared to control (37° C): *=p<0.05, **=p<0.01.
The number of observations are in parenthesis at the bottorn of
the Table.
AP Arterial Pressure (mm Hg)
PCWP= Pulmonary Capillary Wedge Pressure (mm Hg)
CO Cardiac Output (1/min)
CF Left Circumflex Coronary Flow (ml/min)
HR Heart Rate (beats/min)
LVW Left Ventricular Work (kg.m/min)
SVR Systemic Vascular Resi~tance (Dynes.sec/cm5 )
11 4

200
180
160
'" HO :I:
E E 120
<1. < 100
80
60
40
20
37 35 33 31 33+ 35+
Temp. (Deg. Celsius}
37+ Temp. (Deg. Celsius)
20000
5.4 18000
4.8 16000
4.2
~ 14000
~112000 él 10000
- 3.6 1:
~ 3 E
"' > 8000 ~ 2.4
3: "' 6000
:; 1.8
4000 1.2
2000 • 6
oY----+---4--~r---~--~--~----3 35 33 31 33+ 35+ 3 + 33 31 33+ 35+ 37+
Temp. (Deg. Celsius) Temp. (Deg. Celsius)
Fig. 2: Changes in arterial pressure (AP), cardiac
output (CO), systernic vascular resistance
(SVR) and left ventricular work (LVW) during
hypotherrnia and rewarrning. Significanee on a
paired Student's t test: *=p<O.OS, **=p<0.01
11 5

Table II: Acid-base, haemoglobin and oxygenation status during
hypothermia and rewarming.
33C
================================================================ Hb 1 0. 93
.±_0.31
Art. 97.9
Sat. .±_0.3
Paco2 34.2
.±_1 .4
H+ 32.4
+0. 96
* 1 2. 1 8
+0.33
94.1
+2.7
34.7
+0.6
35.4
+1. 23
*
* 1 2. 40
+0.62
95.0
.±_2.0
33.2
+ 1 • 1
37.3
.±_1.60
*
* 12.35 12.66
.±_0.58
97.4
.±_1.0
31 . 1
.±_1.3
35.3
.±_1.36
.±_0.68
94.8
+2.7
33.6
+ 1 • 5
39.4
.±_1.43
**
1 3. 1 0
+0.87
91 . 3
+4.3
34.6
.±_0.9
38.9
+1. 82
1 2. 34
+0.75
93.6
.±_2. 7
37.2
.±_2.8
39.7
.±_2.07
----------------------------------------------------------------HC0
3 26.1
.±_0.8
Exp. 4. 5
co2 +0.27
1 53
.±_7.6
53
+1 . 7
1 5. 1
.±_0.62
9.0
.±_0.28
24.1
+0.7
* 4.1
.±_0.19
1 42
.±_10.3
** 41
.±_1. 7
1 6. 1
+0.53
*
* 1 0. 6
+0.64
21 . 9
+0.8
** 3.5
+0.22
1 41
.±_11.5
41
.±_1.4
16.0
.±_0.44
***
* 11 • 0
+0.95
Continuedon next page .••
11 6
*** 21 . 6 21.0
.±_0.6 + 1 • 1
*** * 2.9 3.8
.±_0.16 +0.24
1 41
.±_16.1
38
.±_2.9
**
1 55
.±_13.3
45
.±_1.2
16.4 16.7
.±_0.61
9.4
.±_0.83
+0.51
9.7
.±_1.28
** 21 • 9
+1 . 3
4. 1
.±_0.21
1 53
.±_15.1
42
+3.2
1 6. 8
+0.87
9.2
+1. 30
* 21 . 7
.±_1.3
4.7
+0.24
1 30
.±_7.2
44
+ 1 • 1
1 6. 0
.±_0.45
7.5
+ 1 • 1 4
*

Tab1e II continued.
33C
================================================================ (a-v) 6. 1 5.6 5.0 6.9 7.0 7.6 8.5 Do
2 .±_0.65 +0.83 .±_0.84 .±_1.15 .±_0.88 .±_1.16 .±_0.91
----------------------------------------------------------------Qo *
2 380.2 368.5 366.3 261.5 293.4 323.4 2 91 . 4
.±_51 .3 +46.4 +50.1 .±_38.5 .±_52.8 .±_55.3 .±_89.6
vo 2 1 48.0 11 2. 5 1 00. 6 1 02. 1 114.5 1 32.5 137.5
+22.2 +7.9 +6.4 .±_15.1 .±_7.3 .±_6.3 .±_26.4
( 8) (8) ( 8) (7) ( 5) ( 5) ( 5)
----------------------------------------------------------------* * ** * Pmü2 87.3 74.7 69.4 54.9 85. 1 93.8 96.3
+8.6 .±_8.2 .±_9.2 +10.7 .±_12.1 .±_10.9 .±_13.2
( 1 5) ( 15) ( 1 5) ( 11 ) ( 9) ( 9) ( 9)
Results are expressed as
t-test eeropared to 3 7° C:
mean + SEM. Significanee on paired
*=p<0.01, **=p<0.01, ***=p<0.001. The
number of observations are in parenthesis.
Hb Haemoglobin (g/100 ml)
Art.Sat.= Arterial oxygen saturation (%)
Arterial carbon dioxide oxygenation (mm Hg)
Hydragen concentratien (pH; nmol/1)
Bicarbonate (mmol/1)
Exp. co2= Expiratory carbon dioxide (vol. %)
Pao2 Arterial oxygenation (mm Hg)
Pvo2 Cao2 Cvo2 (a-v)D02 =
Q02
vo2
Pmü2
Mixed veneus oxygenation (mm Hg)
Arterial oxygen content (ml/100 ml)
Mixed veneus oxygen content (ml/100 ml)
Oxygen content difference (ml/100 ml)
Oxygen flux (ml/min)
Oxygen consumption (ml/min)
Myocardial oxygenation (mm Hg)
117

Table II shows the changes in some of the parameters that
determine the oxygenation status of the body. Due to an increase in
haemoglobin concentration, increases were seen in both art~rial and
mixed veneus oxygen content. Nevertheless, due to significant
decreases in cardiac output, whole body oxygen flux was significantly
decreased. Decreases in oxygen consumption did not reach significance.
From the 8 pigs, 15 microelectrode measurements fell within our
reguirements. Intramyocardial oxygen tension steadily declined from a
normethermie mean value of 87.3 mm Hg (~8.61 SEM) to a mean value of
54,9 mm Hg (~10.72 SEM) at 31° C (p<0.01) as shown in fig. 3. All the
above mentioned values returned to their normal values after
rewarming.
11 8
100
90
o; 80 :I:
E 70 E
N 60 0
c. .. 50
40
30
20
10
0
37 35 33 .31 33+ 35+ 37+
Temp. (Deg. Celsius)
Fig. 3: Myocardial oxygen tensions during hypothermia
and rewarming. the readings have been cor-
rected for ternperature and
nificance on paired Student's
to 37° C: *=p<0.05; **=p<0.01.
drift. Sig-
t test cornpared

DISCUSSION
In this investigation, higher Pmü2 1 s were measured than by other
workers (Lund 1986). Moss (1968), using bare tipped electrodes,
measured very low Pmo2 1 s of 18 mm Hg .±_2. 3 SEM in dogs that were
ventilated with room air. Because these electrades were not protected,
progressive protein poisoning would cause lower measurements. As also
shown by Moss, electrode needle movement within the myocardium would
cause higher Pmo2 measurements, due to the stirring effect. Using a
polarisation voltage of -660 mV, v.d. Laarse (1978) measured canine
Pm021 s of 25,8 mm Hg .±_0.4 SEM.
As far as we know, no studies have been performed in which porcine
Pmo2 has been measured. However, Walfridson et al (1986) have measured
a mean of 45 mm Hg in the pig epicardium using an MDO surface
electrode. The Pao2 in their study was kept at 100 mm Hg whereas in
the present investigation the pigs were ventilated with 40% oxygen so
that arterial P02 was 153 mm Hg (.±_7.6 SEH). Hence it would seem that
the Pmo2 is higher in pigs than in dogs. Even though the absolute
measurements obtained with our electrades seem to be rather high, the
relative changes obtained in the past have always been realistic
(Faithfull et al 1985, Smith et al 1985).
Intramyocardial oxygen tension greatly decreases under hypo
thermia. One might assume that this could be explained by a decrease
in oxygen flux to the myocardium and consequent relative excess of
consumption over flux. There was a significant decrease in whole body
oxygen flux, but it is debatable whether this was the case in the myo
cardium, because the coronary flow barely changed. It is known that
plasma viscosity may be increased by hypothermia (Somer 1966). This,
in combi na ti on wi th the haemaeoncentra ti on tha t was observed in the
present study, would increase whole blood viscos i ty and effect the
microcirculatory distribution of blood flow. Erythrocyte stiffening
also occurs under hypothermia (Barnikol and Burkhard 1984) and this
would also disturb the myocardial microcirculation and decrease oxygen
availability to the myocardium.
In conclusion it has been demonstrated that the main cardio
vascular changes occurring during hypothermia in the pig may be
11 9

attributed to a progressive decrease in cardiac output in conjunction
with an increase in peripheral resistance. Pmo2 's are reversably
decreased under hypothermia and the possibility of microcirculatory
mismatch of supply and demand at low temperatures should be barn in
mind.
REFERENCES
Barnikol W.K.R., Burkhard 0. (1986 in press) Dependenee of erythro
cytes deformability on pH and temperature. Adv Exp Med.
Becker H., Vinten-Johansen J., Buckberg G.D., Robertson J.M., Leaf
J.D., Lazar H.L., Manganoro A.J. (1981) Myocardial damage caused
by keeping pH at 7.40 during systemic deep hypothermia. ~ Thorac
Cardiovasc Surg, 82: 810.
Bigelow W.G., Lindsay W.K., Greenwold W.F. (1950) Hypothermia,
possible role in cardiac surgery, investigations of factors
governing survival in dogs at low body temperature. Am J
Physiol, 160: 125.
Erdmann W., Salt P., Agoston S., Langehr D. (1979), The importance of
new microphysiological methods in determining cellular
metabolism in anaesthesia. Act Anaes Belg, 30: 51.
Faithfull N.S., Fennema M., Erdmann w. (1985) Oxygen supply to the
myocardium, Adv Exp Med Biol, 180: 411.
Fennema M., Erdmann W. (1985) Online determination of Po2 , oxygen
diffusion, tissue perfusion and action potentials with a 10
micron electrode system. Proc Sensor, network events Ltd. 5:
8. 2. 1 .
Laarse A. v.d. (1978) On multiple polarographic measurements of
myocardial oxyen tension. Thesis, University of Amsterdam.
Lloyd E.L., Mitchell B. (1974) Factors affecting the onset of
ventricular fibrillation in hypothermia, Lancet, 30: 1294.
Lund N. (1986 in press) Skeletal and cardiac muscle oxygenation, Adv
Exp Med Biol.
Moss A.J. (1968) Intramyocardial oxygen tension, Cardiovasc Res, 3:
31 4.
Prakash 0., Jonson B., Egbert B., Meij S., Hugenholtz P.G., Hekman W.
(1978) Cardiorespiratory and roetabolie effects of profound
hypothermia. Crit Care Med, 6(3): 165.
1 20

Rahn H., Reeves R.B., (1982) Hydragen ion regulation during
hypothermia: Applied physiology, In: "Clinical Respiratory
Care", 0. Prakash, ed. Chap. 1 Boston, London. Martinus Nijhoff
Pubs.
Reinhold H.S., Zee J. v.d., Faithfull N.S., Rhoon G.v., Wyke-Hooley J.
(1982) Use of the Pomp-Siemans hyperthermia cabin. J Nat Cancer
Inst, 61: 371.
Smith L.W., Fay T., (1940) Observations on human beings with cancer
maintained at reduced body temperature 79-90° Fahrenheit. Am J
Pathol, 1 0 : 1 .
Smith A.R., van Alphen B., Faithfull N.S., Fennema M. (1985) Limb
preservation in replantation surgery. ~ Plas Reconstr Surg, 75:
227.
Somer T. (1966) The viscosity of blood plasmaand serum in dys- and
paraproteinemias. Acta Med Scand suppl. 456 I.
Swan H. (1984) The importance of acid-base management for cardiac and
cerebral preservation during open heart operations. Surgery,
Gynecology and Obstetrics, 158: 391.
Swain C.A., White F.N., Peters R.M. 81984) The effect of pH on the
hypothermie ventricular fibrillation threshold. J Thoracic
Cardiovasc Surg, 87: 445.
Walfridsson H., Lewis D., Sjoberg F., Lund N. (1986 in press) Acute
coronary occlusion: Oxygen pressure in the border zone studied
in the pig. Adv Exp Med Biol.
White F.N. (1981) A comparative physiological approach to hypothermia.
~ Thoracic Cardiovasc Surg, 82: 821.
Wong K.C. (1983) Physiology and pharmacology of hypothermia (medical
progress). West~ Med, 138: 227.
1 21


CHAPTER 8
GENERAL CONCLUSIONS
The fabrication of the micro-electrode system is described in the
beginning of this thesis. Here it is shown that if the electrades are
calibrated carefully and certain precautions are taken (e.g.
ternperature correction, electrical noise-free environment), accurate
measurements of tissue oxygenation can be achieved. Under normal
conditions tissue Po2 shows a broad range of values from as low as 1
mm Hg to up to 100 rnm Hg, depending on in which organ the rneasurement
takes place and where the electrode tip is positioned in relation to
the capillary network. Therefore, a single momentary measurernent is of
little use as the exact morphological position of the electrode can
not be determined. However, P02 measurements have an informative value
if trend analysis is performed with one, or preferably more,
electrodes. This is demonstrated particularly well in chapter 6 where
the viability of amputated extremities perfused with flurocarbons is
rnoni tored wi th the aid of P02 microelectrode rneasurements. On the
other hand multiple mornentary measurernents can be useful for answering
scientific questions when statistical analysis is applied, as is shown
in chapter 3 when measuring follicular P02 's.
This thesis covers a large area in (patho)physiology with, as
common denorninator, micro-circulation and oxygenation. Basically this
thesis shows the necessi ty to consider tissue oxygen tensions in
medical science. This is supported with the aid of P02 micro-electrode
measurements.
In conclusion, I would like to summarise which new insights have
been achieved by studying the questions outlined in the aims of this
thesis:
1 23

1 • There is a wide range of P02 's, the so called P0 2-profile, so that
there is no normal P02 in tissues. Factors that influence tissue
P02 are: Pao2 , 02 transport of the blood, tissue perfusion,
distance from capillary, o 2 diffusion and o 2 consumption. The
absolute P02 is not important, but the relative changes are, as
cells show an environmental adaption to local P02 . An intact
auto-regulation is necessary to ensure adequate oxygenation.
2. At least in the rat, an increase in follicular P0 2 is associated
with ovulation. This could mean that it is important to consider
environmental P02 during in vitro fertilisation.
3. An important consequence of infarction in the pig, is myocardial
oxygen steal from the border area to the ischaemie area.
Considering that the porcine heart is similar to that of the human,
this effect might also be the case in man.
4. Fluorocarbons can effectively reduce ischaemia in the infarcted
myocardium, whether given before or after infarction.
5. Fluorocarbons are a suitable perfusate in traumatically amputated
extremities, especially in situations where immediate replantation
is not possible. Tissue P02 measurements are needed for deciding
whether sufficient revitilisation has taken place before proceeding
with replantation.
6. Even though oxygen consumption decreases under hypothermia,
myocardial Po 2 also decreases, so that one must still consider an
oxyen supply/demand mismatch.
124

SUMMARY
CHAPTER 1 INTRODUCTION
For the normal function and survival of an organism, a continuous
supply of energy, and therefore oxygen, is necessary. Oxygen trans
port to tissue occurs in three steps:
1. Oxygen uptake in the lung.
2. Oxygen transport in blood.
3. Diffusion of oxygen from the capillaries to the tissue, and through
the tissue to the cells.
When pulmonary gas exchange, cardiac output and oxygen transport
capacity of the blood are within the normal range, oxygen supply to
the tissue is dependent on the following microphysiological
parameters:
1. Distribution/perfusion ratio of the capillary meshwork.
2. Oxygen consumption of the cell.
3. Oxygen diffusion parameters from the capillaries to the tissue,
through the tissue and across the cell membrane into the cell.
Normally capillary perfusion and oxygen consumption are in balance
and oxygen supply to the cell is continuously autoregulated to i ts
needs. However, many pathophysiological conditions can severely
interfere with this balance.
Studies of macrophysiological parameters such as blood gases, blood
pressures, blood flow and o2 consumption of whole organs have been
possible for years. In the absence of suitable measuring techniques,
many scientist have tried to explain microphysiology with the aid of
theoretica! mathmatical formulae. These workers obviously had to make
assumptions for the basic condi ti ons in the, for them, inaccesible
micro-area. It would, therefore, seem obvious that the information
derived through these methods is only an approximation of the actual
conditions in the microarea.
125

Another step forward to the understanding of the oxygen supply to
the microarea was the development of microelectrades for the measure
ment of tissue oxygen partial pressures. Chapter 2 explains the
fabrication of these electrodes. The next chapters prove the
importance of this technique in explaining microphysiology in patho
physiological conditions.
CHAPTER 2 METHODOLOGY ON LINE DETERMINATION OF P0 2 , OXYGEN
DIFFUSION, TISSUE PERFUSION AND ACTION POTENTIALS WITH A 10 MICRON TIP
ELECTRODE SYSTEM.
Electrades for P0 2 measurements are fabricated as follows: A gold
wire is drawn out in glass to a diameter of 5 microns and cut into
adequate pieces for electrode production. The bare gold surface is
ground obliquely and covered with a membrane so that it can serve as a
polarographic Po 2 sensor.
P02 measurements are performed as current measurements to the
negatively charged (-800 mV) noble metal with an Ag/AgCl electrode
serving as an indifferent anode. Perfusion measurements can be
performed intermittently via H2-clearance with the same electrode
system, but with a polarisation voltage of +200 mV.
The electronic circuit can be adj usted to achieve sirnul taneous
amplification of the low P0 2 dependent DC current and the high
frequency AC potentials of neuronal activity.
For oxygen diffusion (D0 2 ) measurements, a second blank gold/glass
wire is inserted, in addition to a membrane covered sensor, into a
double-barrelled drawn-out glass capillary. o 2 diffusion cán be
calculated from the current/time curve when the bare electrode is
polarised. By camparing the difference in measurements between the
bare and membrane covered electrode, it is possible to calculate the
oxygen conductivity coefficient (K02 ). Since one can determine D02 and
K02 , it is now possible to calculate the solubility coefficient (a)
for oxygen in the tissue according to:
1 2 6
K02 a 02
D02x60
To avoid noise disturbance, the measurements are performed in a
double shielded Faraday cage. If necessary, the pre-amplified ( P02 )
values can be transmitted by light across the interspace of the two
walls.
CHAPTER 3 OXYGEN TENSlONS IN THE PRE-OVULATORY AND NON-OVULATING
OVARIUM FOLLICLE OF THE RAT.
To test the hypothesis that ovulation might be accompanied by an
increase in the P02 of the ovarian follicle, P02 was measured wi th
microelectredes of 10 microns diameter. Two groups were compared:
1. A non-ovulating group of proestrous rats, where ovulation was
inhibited with phenobarbital (35 mg/kg BW).
2. An untreated pre-ovulatory group.
The mean P0 2 in follicles not exposed to the LH surge was 11.7
mm Hg ~ 1.12 SEM, as opposed to 23.5 mm HG + 1.44 SEM in the ovulatory
control follicles (p<0.001; Student's t test).
These observations lend support to the hypothesis that oxygen may
be the limiting factor in the resumption of the first meiotic division
in the pre-ovulatory oocyte.
CHAPTER 4 TISSUE OXYGENATION IN THE CEREBRAL CORTEX OF THE RABBIT.
Clinical events such as ble2ding, shock, ischaemia and drug
administration can influence oxygen transport to tissue dec i si vely.
This simple external factors can effect many internal mechanisms with
a resulting decrease or increase in tissue P02 , sametimes with severe
adverse effects.
This study was performed to assess the cerebral P02 profile under
normal conditions of anaesthesia and investigate the effects of
hyperoxia and hypercapnia on cerebral tissue P02 .
1 27

When inserting an oxygen electrode into the cortex with the aid of
a micromanipulator, one can produce a P0 2-profile. This profile can be
reasonably well reproduced by withdrawing and re-inserting the elec
trode. With an Fio2 of 0.3, the overall average P0 2 is about 6 mm Hg.
Nearly all measurements are below 25 mm Hg and measurements above 50
mm Hg are very rare.
When the Fi02 is increased to 1 .0, tissue P0 2 increases, then grad
ually decreases to approximately 120% it's original value. This is
probably due to vasoconstriction.
When 12% C0 2 is added to the inspiratory gas mixture the P0 2 rises
slowly to nearly three times i t's original value and shows li ttle
tendancy to compensate. This rise in P02 is due to the direct effect
of co2
and H+ on the blood vessels, causing vasodilation, and
therefore an increase in blood flow and tissue Po 2 . Normally this
increase in blood flow would wash out the co2 , decreasing the vaso
dilation stimulus so that P02 would drop. In this case co2 is kept
artificially high, so that maximum vasodilation is maintained.
CHAPTER 5 OXYGENATION OF THE MYOCARDIUM
Aspects on oxygenation of the myocardium are discussed in relation
to myocardial contraction, coronary flow, ventilation and ischaemia.
These theories are supported by tissue measurements in the pig, using
steel protected microelectrades, 200 microns in diameter. The elec
trades were embedded in a thin flexible plastic plate which was sewn
onto the epicardium. The distance between the electrades was 1 cm and
they protruded 3 mm into the left ventricular wall. The plate was
placed in such a way that when occluding a branch of the LAD, 2 elec
trades would be in the ischaemie area, and 2 in the non-ischaemie
area. The most important findings are:
Cardiac swings
Oxygen tension swings coincide with heart beat, but there is a
phasic difference between the areas measured. There are several
explanations, the most important being that during myocardial
1 28

contraction blood flow in the artericles decreases, while it
increases in capillaries and venules. Also, the degree of contraction
varies in different areas of the myocardium, depending on the progress
of the depolarisation wave over the heart.
Respiratory Swings
Duri-ng intermittent positive pressure ventilation, inspiration
causes an increase in left ventricle blood volume which in turn causes
both a decrease in coronary blood flow and an increase in cardiac
work. This change in the oxygen supply/demand ratio causes the
myocardial tissue oxygen tension to drop.
Electrical activity
There appears to be a critical Pmo 2 below which myocardial
electrical activity ceases. This threshold varies in different areas
of the myocardium.
Changes in Fi02
When Fi02 is increased, the average P02 increases although, para
doxically, in some areas the P02 decreases.
Temporary acelusion of the LAD
In short term acelusion (~30 sec.) some areas show a decrease in
P02 , but some show an increase. Often there is an overshoot in the
opposite direction. The biphasic nature of the oxygen curves indicate
that the initial decreased oxygen supply is in some cases rapidly
compensated for by autoregulation.
Permanent acelusion of the LAD
The results of an experiment to investigate the long term effects
of acelusion of the distal third of the LAD are discussed. Following
occlusion, immediate highly significant decreases in Pmo2 were seen in
the most ischaemie area. 4 minutes post-acelusion these had reeavered
at the expense of the adjacent ischaemie border area which continued
1 29

to indicate highly significant decreases of Pmo2 throughout the first
hour post-occlusion 1 These changes were interpreted as indicating a
high degree of myocardial steal.
CHAPTER 6 MICROCIRCULATION AND FLUOROCARBONS
Fluorocarbons are chemical substances with a high solubility for
oxygen. The emulsified product available to us can carry about 0.75 ml
o 2 in 100 ml per 100 mm Hg, and releases o 2 more readily than haemo
globin. Furthermore 1 the fluorocarbon emulsion has a low viscosity
which 1 as opposed to blood, is almest independent of the low flow
shear rate existing in the microcirculation. This 1 tagether with the
small partiele size 1 helps to ensure better penetratien in the micro
circula ti on to imprave oxygena ti on af ter 1 for instanee 1 myocardial
infarction or limb amputation.
The effects of haemodilution on oxygen tension in the acutely
ischaemie myocardium
The pigs mentioned in the previous chapter were divided into three
groups. In group I no treatment was given and in group II and III 20%
haemodilution was performed with fluorocarbons or dextran respectively
after one hour of LAD occlusion. After haemodilution Pmo2 in the
fluorocarbon group II (in contrast to groups I and III) was no longer
significantly lower than pre-acelusion values. After 5 hours of
acelusion mean Pmo2 in this group had returned to 90.1% of the
pre-acelusion values whereas in groups I and III i t was 26.7% and
37.3% respectively. This study demonstrates that haemodilution itself
does not imprave myocardial oxygenation 1 whereas re-oxygenation of the
areas of the ischaemie myocardium is possible following haemodilution
treatment using fluorocarbon emulsions.
Prophylactic treatment against myocardial ischaemia with fluoro
carbons.
In this case 5 pigs were haemodiluted with fluorocarbons 30 minutes
befere the distal third of the LAD was occluded. Mean Pmo 2 was always
(sometimes significantly) higher than the non-treated control animals.
130

This supports the theory that prophylactic administration of fluoro
carbons might help proteet the myocardium in the vital first hours of
infarction.
Limb Preservation in replantation surgery
Five patients are presented in whom a traumatically amputated
extremity or digit was perfused with oxygenated fluorocarbons.
Perfusion lasted between 16 and 46 hours. Besides tissue P02 measure
ments, K+, lactate, glucose and ATP levels were measured and electron
microscope sections of vessels were investigated. All these parameters
suggest that the tissue was sufficiently provided with oxygen and
viable after many hours of perfusion. Conclusive evidence of the
viability of a perfused digit was given by its successful replantation
after 17 hours of fluorocarbon perfusion.
CHAPTER 7 CHANGES IN INTRAMYOCARDlAL OXYGEN TENSlONS DURING
HYPOTHERMIA IN PIGS
In 8 juvenile pigs, 4 Po2 microelectrades were introduced into the
myocardium as described before. After stabilisation, the pigs were
caoled down to 30° C and then rewarmed. Although there were changes in
cardiovascular and acid-base parameters, these did not present any
problems. Due to a significant decrease in cardiac output during
cooling, whole body oxygen flux was significantly decreased. This was
probably not the case in the myocardium because coronary flow hardly
changed. There was, however, a significant decrease in intra
myocardial P02 , probably due to an increase in viscosity which effects
the microcirculatory distribution of blood flow. Therefore, even
though the animal reeovers after rewarming, microcirculatory mismatch
of supply and demand at low temperatures should be born in mind.
1 31


SAMENVATTING
HOOFDSTUK 1 INLEIDING
Het normale functioneren en de overleving van een organisme is
afhankelijk van een continu voorraad van energie, dus ook van zuurstof.
Zuurstofvervoer naar weefsel neemt in drie stappen plaats:
1. Zuurstofopname in de longen
2. Zuurstofvervoer in het bloed
3. Diffusie van zuurstof van de capillairen naar het weefsel en door
het weefsel naar de cellen
Als pulmonaire gasuitwisseling, cardiac output en de zuurstof
dragende capaciteit van het bloed binnen het normale bereik blijft, is
de zuurstoftoevoer naar het weefsel afhankelijk van de volgende micro
fysiologische parameters:
1. Verdeling/perfusie verhouding van het capillaire netwerk.
2. Zuurstofconsumptie van de cel.
3. Zuurstofdiffusie parameters van de capillairen naar het weefsel,
door het weefsel heen en door het celmembraan de cel in.
Gewoonlijk zijn capillaire perfusie en zuurstofconsumptie in even
wicht. De zuurstoftoevoer naar de cel is d.m.v. autoregulatie
aangepast aan de behoefte. Maar vele pathofysiologische omstandig
heden kunnen dit evenwicht ernstig verstoren.
Het bestuderen van macrofysiologische parameters zoals bloed
gassen, bloeddrukken, bloedstroomsnelheid en zuurstofconsumptie van
organen is al vele jaren mogelijk. In de afwezigheid van toepasbare
meettechnieken hebben vele wetenschappers microfysiologie proberen te
verklaren m.b.v. wiskundige modellen. Daardoor moesten zij bepaalde
simplificaties aannemen voor de basis condities van de, voor hun,
onbereikbare micro-gebieden. Het moet dus duidelijk zijn dat de gegevens
die op deze manier gevonden worden, alleen maar een benadering van de
werkelijkheid zijn.
1 33

Een grote stap vooruit in het begrip van de zuurstoftoevoer naar
het micro-gebied was de ontwikkeling van de microelectodes voor het
meten van de zuurstof partiële druk. Hoofstuk 2 legt uit hoe deze
electrades gemaakt worden. De volgende hoofdstukken bewijzen het belang
van die techniek in het verklaren van microfysiologie in patho
fysiologische omstandigheden.
HOOFDSTUK 2 FABRICAGE VAN ZUURSTOF MICROELECTRODES.
Een electrode systeem is ontwikkeld om het mogelijk te maken diverse
parameters en hun interacties gelijktijdig te onderzoeken, nl. partiële
zuurstof druk (P0 2 ), zuurstofdiffusie, weefselperfusie en actie
potentialen. Een gouden draad wordt in glas uitgetrokken tot een
diameter van ±5 micron. De naakte gouden punt wordt schuin afgeslepen
en dan met een membraan gedekt zodat het geschikt is voor polara
grafische P02 metingen.
P02 metingen worden uitgevoerd als electrische stroom metingen
tussen het edelmetaal met een spanning van -800 mV ten opzichte van
een indifferente Ag/AgCl electrode. Perfusiemetingen worden uitgevoerd
met dezelfde electrode maar met een polarisatiespanning van +200 mV.
Het electronisch cicuit kan aangepast worden zodat gelijktijdig meten
van laag P0 2 afhankelijk DC stroom en hoog frequent AC potentialen van
neuronen mogelijk is.
Voor zuurstofdiffusie ( Do 2 ) metingen wordt een naakte goud-glas
draad samen met een membraan beschermde draad in een dubbel-loops glas
capillair gebracht. Zuurstofdiffusie kan worden berekend uit de
stroom/tijd curve als het naakte metaal onder spanning wordt gezet.
D.m.v. het verschil in stroom uitslag tussen het naakte en de
beschermde electrades is het mogelijk om de zuurstof conductiviteits
coëfficient (K02 ) uit te rekenen. M.b.v, deze parameters is het nu
mogelijk om de zuurstofoplosbaarheids coëfficient ( a o 2 ) uit te
rekenen:
134

ao2 D02 x 60
Om electrische ruis uit te sluiten, vinden de metingen in een
Faraday kooi plaats. Indien nodig worden gegevens via licht-trans
missie buiten de kooi gebracht.
HOOFDSTUK 3 P02 METINGEN IN HET OVARIUM FOLLIKEL VAN DE RAT
Om de hypothese te toetsen dat ovulatie samenhangt met een toename
van P02 in het ovarium follikel, werd de zuurstofspanning gemeten
m.b.v. 10-micron naald electrodes. Twee groepen werden vergeleken:
1. Een niet-ovulerende groep ratten in pro-oestrus, bereikt d.m.v
remming met fenobarbitol (35 mg/kg).
2. Een onbehandelde pre-ovulatoire groep.
Onder tribroma-ethanol anasthesie werd de ovarium blootgesteld en de
electrode in een follikel geintroduceerd. De gemiddelde Po2 van de
follikels niet onderheven aan een LH piek was 11 , 7 mm Hg, signi
ficant lager dan 23,5 mm Hg in de pre-ovulerende controle groep.
Deze waarnemingen ondersteunen de hypothese dat zuurstof de
beperkende factor is om de eerste meiotische verdeling in de
pre-ovulatoire oÖcyte te laten continueren.
HOOFDSTUK 4 WEEFSEL OXYGENATIE IN DE CEREBRALE CORTEX VAN DE KONIJN.
Klinische toestanden zoals bijv. haemorrhagieën, shock, ischaemie en
toediening van geneesmiddellen kunnen zuurstoftoevoer naar weefsels
ingrijpend beinvloeden. Dit betekent dat een externe factor diverse
interne mechanismes kan beinvloeden, met het uiteindelijke resultaat
van of een toename, of een afname van weefsel P02 , soms met ernstige
consequenties. Met dit onderzoek werd de cerebrale P02 profiel onder
normale omstandigheiden, en onder omstandigheiden van hyperoxie en
hypercapnie onderzocht.
135

Als een P0 2 electrode m.b.v. een micromanipulator in de cortex
wordt ingebracht, kan men een P0 2 profiel produceren. Dit profiel is
redelijk herhaalbaar als de electrode teruggetrokken wordt, en dan weer
ingebracht. Bij een Fio2
van 0, 3 is de gemiddelde P0 2 6 mm Hg. Bijna
alle metingen zijn onder de 25 mm Hg, en metingen boven de 50 mm Hg zijn
zeldzaam.
Als de Fi0 2 wordt verhoogd tot 1,0 stijgt weefsel Po2 , en dan daalt
het langzaam tot ongevee'r 120% van de oorspronkelijke waarde. Dit is
waarschijnlijk een gevolg van vasoconstrictie.
Als 12% co2 wordt toegevoegd aan de inademingsgassen, neemt weefsel
P0 2 tot bijna drie keer zijn oorspronkelijke waarde en neigt niet tot + dalen. Dit komt door het directe vasodilatoire effect van co2 en H
zodat de bloed doorstroming toeneemt. Normaal gesproken zou de co2 uitgewassen worden zodat vasodilitatie af zou kunnen nemen, maar hier
wordt co2 kunstmatig hoog gehouden.
HOOFSTUK 5 ZUURSTOFTOEVOER NAAR HET MYOCARD
Aspecten van oxygenatie van het myocard worden besproken in relatie
tot contractie van het hart, doorstromen van de coronaire vaten,
ademhaling en ischaemie. Deze theorieën werden ondersteund met weefsel
metingen in het varken, gebruik makende van staal-beschermde micro
electredes van 200 micron diameter. De electrades waren gefixeerd in
een dunne flexibele plastic plaat en gehecht op de epicard. De
afstand tussen de electredes was cm en zij staken 3 mm in de myocard
van de linker ventrikel. Er werd naar gestreefd om de plaat op zo een
manier te bevestigen dat als een deel van de voorste ramus inter-
ventricularis onderbonden werd, 2 electrades in het ischaemisch, en
2 in het niet ischaemisch gebied zich zouden bevinden. De voornaamste
bevindingen waren:
Cardiale schommelingen
De myocardiale Po 2 (Pmo 2 ) toont schommelingen met dezelfde frequentie
als de hartfrequentie, maar vaak met een faseverschil tussen de
electrades. Er zijn diverse verklaringen, met als belangerijkste het
1 36

feit dat gedurende rnyocardcontractie, bloeddoorstroming in de
artericles afneemt, terwijl het toennernt in capillairen en venules. De
graad van contractie varieert over het myocard, afhankelijk van de
vordering van de depolarisatie golf over het hart.
Adernhalingsschornrnelingen
Met intermitterend positief druk ventilatie (IPPV) is er een
toename in de linker ventrikel bloed volurne. Dit veroorzaakt een
afname in de coronair flow en een toename in hart arbeid. Deze
wijziging in de zuurstof vraag/aanbod verhouding bewerstelligt een
afname van Prno2 .
Electrische activiteit
Er is blijkbaar een kritisch Prno 2 , waaronder myocard electrische
activiteit ophoudt. Deze drempel varieert in verschillende gebieden
van het myocard.
Veranderingen in Fio2
Als Fio2 verhoogd wordt, neemt de gemiddelde P02 toe alhoewel in
sommige gebieden het P0 2 juist afneemt.
Kortdurende coronaire onderbinding
Tijdens een kortdurende occlusie ( ±30 sec.) is er niet alleen een
afname van Prno 2 , maar vaak ook een toename. Het bifasisch karakter
van de zuurstofcurves geven aan dat de oorspronkelijke afname in
zuurstoftoevoer soms snel wordt gecompenseerd door autoregulatie.
Langdurig coronaire onderbinding
Gelijk na de occlusie werd er een hoog significant daling in Prn02 in
het meest 'ischaernisch' gebied waargenomen. Vier minuten na occlusie
was deze weer hersteld ten koste van de ernaast liggende 'ischaernisch
rand' gebied. Dit gebied bleef significant lager Prno2 meten gedurende
het eerste uur van ischaemie. Dit werd geinterpreteerd als een hoge
graad van 'lenen van' zuurstof van het 'randgebied'.
137

HOOFDSTUK 6 MICROCIRCULATIE EN FLUOROCARBONEN
Fluorocarbonen z~n chemische stoffen met een hoge oplosbaarheids
coëfficient voor zuurstof. Het door ons toepasbaar middel is een
emulsie die ongeveer 0,75 ml o 2 in 100 ml per 100 mm Hg draagt. Het
geeft zuurstof makkel~ker af dan haemoglobine. Verder heeft de fluora
carbon emulsie een laag viscositeit die, i. t. t bloed, haast niet
toeneemt in de microcirculatie. Dit, samen met z~n kleine afmeting,
helpt om een betere penetratie van de microcirculatie te bewerk
stelligen zodat oxygenatie verbeterd kan worden b~, b~voorbeeld,
myocard infact of extremiteit amputatie.
De effecten van bloedverdunning m.b.v. fluorocarbonen of dextraan in
het acuut ischaemisch myocard
De eerder genoemde varkens werden verdeeld in 3 groepen van 5
dieren. Groep I was een controle groep. Na afname van 20 ml/kg bloed
kreeg groep II fluorocarbonen en groep III dextraan. Hierdoor was er
in groep II (i.t.t. groepen I en III) geen significant verschil meer
in Pmo 2 in vergel~king met voor occlusie. Na 5 uur van occlusie was de
gemiddelde Pmo 2 in deze groep 90,1% van voor occlusie. In groep I
(controle) was dat 26,7%, en in groep III 37,3%. Deze studie bew~st
dat haemodilutie niet voldoende is om myocard oxygenatie te
verbeteren, maar dat re-oxygenatie wel mogel~k is m.b.v. haemodilutie
met fluorocarbonen emulsies.
Prophylactisch behandeling tegen myocard ischaemie met fluoro
carbonen
Vijf varkens werden 30 minuten voor occlusie ''an de distale derde
van de LAD verdund met fluorocarbonen. Pmo2 was altijd hoger (soms
significant) dan in de controle groep. Dit ondersteunt de theorie dat
prophylactisch behandeling met fluorocarbonen het myocard beschermt in
de vitale eerste uren na een infarct.
1 38

Preservatie van extremiteiten in reimplantatie chirurgie
Vijf pa tienten worden voorgedragen waarbij een extremiteit die
traumatisch geamputeerd
fluorocarbonen. Perfusie
was, geperfundeerd werd
varieerde van 16 tot
met
46
gëoxygeneerde
uren. Micro-
circulatoire oxygenatie werd gecontrolleerd met 200 micron zuurstof
electrodes. K+, lactaat, glucose en ATP werden ook gemeten, en
electron microscopisch onderzoek van bloedvaten werden verricht. Alle
bovengenoemde parameters gaven aan dat de weefsels voldoende met
zuurstof waren voorzien en vitaal waren na vele uren van perfusie.
Onomstotelijk bewijs van de vi tal i te i t van een geperfundeerde vinger
werd gegeven na een gelukte reimplantatie na 17 uur van perfusie met
fluorocarbonen.
HOOFDSTUK 7 HYPOTHERMIE EN P02 METINGEN
In acht jonge varkens werden zuurstofelectrades in het myocard
geplaatst zoals hiervoor beschreven. Na stabilisatie werden de varkens
afgekoeld tot 30° C en daarna weer verwarmd. Alhoewel er wel
veranderingen in cardiovasculaire en zuur/base parameters waar te
nemen waren, veroorzaakte die geen moeilijkheden. De zuurstofflux
daalde met 32%. Dit nam waarschijnlijk niet plaats in de myocard omdat
de coronair flow niet noemenswaardig veranderde. Maar Pmo 2 daalde wel
met 37%, dit waarschijnlijk onder andere t.g.v een toename in
viscositeit die een negatief effect heeft op microcirculatoire bloed
doorstroming. Men moet dus realiseren dat, alhoewel het dier herstelt
na verwarming, het mogelijk is dat er een negatieve verandering heeft
plaatsgevonden in de zuurstof vraag I aanbod verhouding van de micro
circulatie.
1 39


a
AC
Ag Cl
AP
AP
Art Sat
Art PC0 2 ATP
(a-v)D02 ao
2 c
cao2 CF
co
co2 Cvo
2 CVP
DC
dP/dt
D0 2 e
el
ECG
EEG
exp. co2 f
Fi02
FSH
G H+
Hb
HCl
Hco3
-
HR
Ht
IPPV
GLOSSARY OF ABBREVIATION
Average calculated a
Alternating current
Silver Chloride
Systemic arterial pressure
Action potentials
Saturation of haemoglobin with oxygen in arterial blood
Partial pressure of carbon dioxide in arterial blood.
Adenosine Triphosphate
Arterial and mixed venous difference in oxygen content
Oxygen solubility coefficient
Capacitor
Arterial oxygen content
Coronary flow
Cardiac output
Carbon Dioxide
Mixed venous oxygen content
Central venous pressure
Direct current
Change in ventricular pressure over change in time
Oxygen diffusion coefficient
Electron
Electrades
Electrocardiaogram
Electroencephalogram
Expiratory carbon dioxide
Frequency
Inspiratory percentage of oxygen
Follicle stimulating hormone
Giga-ohm
Hydragen ion or proton
Haemoglobin concentratien
Hydrochloric acid
Bicarbonate
Heart rate
Haemotocrit
Intermittent positive pressure ventilation
1 41

k
K0 2 LAD
LED
LH
LVW
M
M
n
N2
0
OA
OH
02 p
Pao 2 PAP
PC02 PCWP
Peo2
pH
PH2 Pmo 2 P0
2 Pvo2 Q02 r
R
SD
SEM
SVR
u
uP vo2
1 42
Kilo-ohm
Oxygen conductivity coefficient
Left anterior deseending coronary artery
Light emmitting diode
Lutienising hormone
Left ventricular work
Male
Mega-ohm
Population
Nitreus Oxide
Operational amplifier
Hydroxide radical
Oxygen
Statistical probability of chance
Partial pressure of oxygen in the arterial blood
Pulmonary arterial pressure
Partial pressure of carbon dioxide
Pulmonary capillary wedge pressure
Partial pressure of oxygen in the epicardium
Concentratien of hydragen ions in a salution
Partial pressure of hydragen
Partial pressure of oxygen in the myocardium
Partial pressure of oxygen
Partial pressure of oxygen in mixed veneus blood
Oxygen flux
Radius
Resistor
Standard deviation
Standard deviation of the mean
Systemic vascular resistance
Voltage
Polarisation voltage
Oxygen consumption

ACKNOWLEDGEMENTS
In the third year of my medical studies it was possible for me to
participate in some form of research for a five month period (Keuze
practicum). I opted for a post in the Department of Experimental
Anaesthesiology at the Erasmus University, Rotterdam as it affered the
oppertunity to do pre-clinical research. Professor Dr. W. Erdmann was
only too happy to take me on, because I was the only student who
applied for that job. Actually, I was the first in a long line of sub
sequent students to work for Professor Erdmann at the Erasmus
University in the following years. It soon became apparant that I had
to help establish the microphysiological laboratory that Professor
Erdmann had worked on in the previous ten years, first in Mainz,
Germany and later in Birmingham, USA. Dr. Stefan Kunke taught me how
to build and install the electronics, while Professor Erdmann
demonstrated the fabrication of the electrodes.
Once we had overcome the teething problems, Jack Wessel (currently
a resident in Neurology) and I performed experiments in the brain
cortex of the rabbit. At about the same time I worked with Professor
Dr. G.H. Zeilmaker of the Department of Endocrinology on measurements
of P02 in the ovarian follicles of rats. Dr. N. Sirnon Fa i thfull,
former co-ordinator of the Department of Experimental Anaesthesiology,
and I performed many experiments in pigs. The Fluosol used for some of
these studies was supplied by Alpha Therapeutic Corporation, USA. Bill
van Alphen and Dr. Arlan Smith (at that time both in the Department
of Plastic Surgery) supplied their microsurgical expertise for
experiments on replantation. I worked with K. Mohan Dhasmana and Dr.
Omar Prakash on the hypothermia experiments.
I am most indebted to my promotor, Professor Erdmann, for firstly
giving me the chance to perfarm these experiments and, secondly, for
giving his time to review and discuss this thesis. Dr. Faithfull was
my mentor and guide throughout the trepedations of research. His
experience spared me from having to jump too many obstacles along the
1 43

way. I would like to thank Professors G.H. Zeilmaker, P.J.J Sauer and
C.J.J. Avezaat fortheir critical review of this thesis.
Laraine Visser-Isles not only checked my English, but also
performed extensive editorial work. Of course, a great deal of credit
a lso goes to my co-authors of the various articles. The expertise
contributed by each of these workers made it possible to perfarm these
studies: A special word of thanks goes to Arie Kok for performing most
of the teehuical work wi th the animals. An important part of this
thesis, or any scientific article, is the figures and drawings. I
would like to thank the Audiovisual Department, especially Cor van
Dijk, for their professional work. Last, but not least, I must thank
my friends and family, and especially my future wife Linda, who had
more confidence in me than I had in myself.
1 44

CURRICULUM VITAE
The writer of this thesis was born on the 13th of July, 1959 in
Auckland, New Zealand. In 1971 he rnoved with his farnily to South
Africa, and in 1973 began studies at Gerrniston High School. In 1977 he
and his farnily left South Africa for The Netherlands. He attained his
Atheneurn certificate in 1 979 at the Groen van Prinsteren College in
The Hague. In the sarne year he started rnedical studies at the Erasrnus
University, Rotterdam. Since 1982 he has been a research assistant in
the Department of Experirnental Anaesthesiology, co-ordinator Dr. N.S.
Faithfull and head Professor Dr. W. Erdrnann. In 1985 he received his
Univarsity Degree and in 1986 his Medical Degree at the Erasrnus
University. In 1986 he also becarne a merober of the International
Society of Oxygen Transport to Tissue ( ISOTT). He is currently a
resident in anaesthesiology at Dijkzigt Academie Hospital, Rotterdam,
under Professor Dr. W. Erdrnann.
1 45


Copyright © 2022 FDOKUMEN