Delineation of Groundwater, Drought and Flood Potential ...
16
Delineation of Groundwater, Drought and Flood Potential Zone Using Weighted Index Overlay Analysis and GIS for District Patna, Bihar, India Nikhilesh Gaurav† and Geeta Singh Department of Environmental Engineering, Delhi Technological University, Daulatpur, New Delhi-110042, India †Corresponding author: Nikhilesh Gaurav; [email protected] ABSTRACT For groundwater evaluation, delineation, discovery, and resource management in drought and flood zones, the geographical information system (GIS) has a wide range of uses. For the study area, various thematic layers were prepared, such as a digital elevation map (DEM), geomorphology, LULC, soil, drainage density, precipitation, and slope. The thematic layers were combined using the WIOA technique. The possible areas for groundwater have been demarcated into four zones: 1-poor, 2-moderate, 3-good, and 4-very good. In the eastern parts of the district, very strong (GWPZs) were found, while in the west and mid regions, moderate and bad categories were found. Drought and flood potential danger areas were divided into four zones: 1-no risk, 2-low risk, 3-moderate risk, and 4-high risk. In the middle part of the region, there was a higher risk of drought and a reduced risk of flooding in the eastern part of the area, an elevated risk of flooding in the eastern part of the area, and a lower to no risk of flooding in the western and central regions. The groundwater, drought, and flood potential zonation map built in the present study will be useful for scholars, and implementers in exploring appropriate water exploration locations and implementing resource utilization. INTRODUCTION In all living life on earth, groundwater plays a major role and is the most valuable available freshwater resource on earth. Remarkable demands for consumption, coupled with advances in agricultural and industrial activities, are leading to an imminent need to maximize the utilization of groundwater sources. Scientific data-building activities for the management of water resources started several years ago by means of proximal sensing as well as remote sensing, but even then, practical data-catering knowledge on ground- water availability, and optimal permissible extraction. In India, the optimal value of allowed wells in the watershed continues to be decreased. Recharging groundwater is nothing but the flow of water during the natural cycle from the unsaturated surface level to the saturated underground stratum. Most rural communities and urban communities in India rely on groundwater owing to their everyday needs. Regrettably, there is a decrease in groundwater levels due to the overuse of groundwater for cultivation and other inhumane uses. Following reports of poor precipitation with the drying of crops, the Bihar government declared 8 out of 23 blocks of Patna district as drought-affected. As per the IMD, the monsoon season finished with the nation showing a rainfall deficiency in three states of India, which are Bihar, Jharkhand, and West Bengal, the greatest rainfall deficiency has been reported. The IMD data indicates that Patna recorded 27 percent of the weak precipitation. This project will be very helpful in delineating drought zones be- cause of this pattern of drought occurrence and will enable the government to take the requisite measures to resolve it and set up facilities in drought-prone zones. India’s most flood-prone state in Bihar. Over 70% of the geographical area as a whole is at risk of annual floods, putting lives at risk and contributing to major financial losses. Upstream from the Ganga, Patna is located. The influential banana cultivation on the banks of the river Ganga between Patna and Bhagalpur, based on the evaluation of hundred years of flooding in the Ganga, is also one of the reasons for the floods. The report of the Central Water Commission stated that the sedimentation at Ganga in Bihar is essentially due to the immense load of sediment from its northern tributaries, Ghaghra, Gandak, and Kosi. In Patna, places such as Kankarbagh, Rajendra Nagar, and their environs are susceptible to flooding. It will help to identify areas vulnerable to flooding, based on the severity of flooding, by delineating flood potential zones, which will assist local officials to set up emergency response plans and take action to resolve and prepare before the crisis occurs. MATERIALS AND METHODS Study Area Many factors, including DEM, geomorphology, drainage 2022 pp. 813-828 Vol. 21 p-ISSN: 0972-6268 (Print copies up to 2016) No. 2 Nature Environment and Pollution Technology An International Quarterly Scientific Journal Original Research Paper e-ISSN: 2395-3454 Open Access Journal Nat. Env. & Poll. Tech. Website: www.neptjournal.com Received: 31-07-2021 Revised: 04-10-2021 Accepted: 20-10-2021 Key Words: Flood and drought zones GIS GWPZs Weighted index overlay analysis Original Research Paper https://doi.org/10.46488/NEPT.2022.v21i02.046
-
Upload
khangminh22 -
Category
Documents
-
view
0 -
download
0
Transcript of Delineation of Groundwater, Drought and Flood Potential ...

Delineation of Groundwater, Drought and Flood Potential Zone Using Weighted Index Overlay Analysis and GIS for District Patna, Bihar, IndiaNikhilesh Gaurav† and Geeta SinghDepartment of Environmental Engineering, Delhi Technological University, Daulatpur, New Delhi-110042, India†Corresponding author: Nikhilesh Gaurav; [email protected]
ABSTRACTFor groundwater evaluation, delineation, discovery, and resource management in drought and flood zones, the geographical information system (GIS) has a wide range of uses. For the study area, various thematic layers were prepared, such as a digital elevation map (DEM), geomorphology, LULC, soil, drainage density, precipitation, and slope. The thematic layers were combined using the WIOA technique. The possible areas for groundwater have been demarcated into four zones: 1-poor, 2-moderate, 3-good, and 4-very good. In the eastern parts of the district, very strong (GWPZs) were found, while in the west and mid regions, moderate and bad categories were found. Drought and flood potential danger areas were divided into four zones: 1-no risk, 2-low risk, 3-moderate risk, and 4-high risk. In the middle part of the region, there was a higher risk of drought and a reduced risk of flooding in the eastern part of the area, an elevated risk of flooding in the eastern part of the area, and a lower to no risk of flooding in the western and central regions. The groundwater, drought, and flood potential zonation map built in the present study will be useful for scholars, and implementers in exploring appropriate water exploration locations and implementing resource utilization.
INTRODUCTION
In all living life on earth, groundwater plays a major role and is the most valuable available freshwater resource on earth. Remarkable demands for consumption, coupled with advances in agricultural and industrial activities, are leading to an imminent need to maximize the utilization of groundwater sources. Scientific data-building activities for the management of water resources started several years ago by means of proximal sensing as well as remote sensing, but even then, practical data-catering knowledge on ground-water availability, and optimal permissible extraction. In India, the optimal value of allowed wells in the watershed continues to be decreased. Recharging groundwater is nothing but the flow of water during the natural cycle from the unsaturated surface level to the saturated underground stratum. Most rural communities and urban communities in India rely on groundwater owing to their everyday needs. Regrettably, there is a decrease in groundwater levels due to the overuse of groundwater for cultivation and other inhumane uses. Following reports of poor precipitation with the drying of crops, the Bihar government declared 8 out of 23 blocks of Patna district as drought-affected. As per the IMD, the monsoon season finished with the nation showing a rainfall deficiency in three states of India, which are Bihar, Jharkhand, and West Bengal, the greatest rainfall deficiency has been reported. The IMD data indicates that
Patna recorded 27 percent of the weak precipitation. This project will be very helpful in delineating drought zones be-cause of this pattern of drought occurrence and will enable the government to take the requisite measures to resolve it and set up facilities in drought-prone zones. India’s most flood-prone state in Bihar. Over 70% of the geographical area as a whole is at risk of annual floods, putting lives at risk and contributing to major financial losses. Upstream from the Ganga, Patna is located. The influential banana cultivation on the banks of the river Ganga between Patna and Bhagalpur, based on the evaluation of hundred years of flooding in the Ganga, is also one of the reasons for the floods. The report of the Central Water Commission stated that the sedimentation at Ganga in Bihar is essentially due to the immense load of sediment from its northern tributaries, Ghaghra, Gandak, and Kosi. In Patna, places such as Kankarbagh, Rajendra Nagar, and their environs are susceptible to flooding. It will help to identify areas vulnerable to flooding, based on the severity of flooding, by delineating flood potential zones, which will assist local officials to set up emergency response plans and take action to resolve and prepare before the crisis occurs.
MATERIALS AND METHODS
Study Area
Many factors, including DEM, geomorphology, drainage
2022pp. 813-828 Vol. 21p-ISSN: 0972-6268 (Print copies up to 2016) No. 2
Nature Environment and Pollution Technology An International Quarterly Scientific Journal
Original Research Paper
e-ISSN: 2395-3454
Open Access Journal
Nat. Env. & Poll. Tech.Website: www.neptjournal.com
Received: 31-07-2021Revised: 04-10-2021Accepted: 20-10-2021
Key Words:Flood and drought zones GISGWPZsWeighted index overlay analysis
Original Research Paperhttps://doi.org/10.46488/NEPT.2022.v21i02.046
814 Nikhilesh Gaurav and Geeta Singh
Vol. 21, No. 2, 2022 • Nature Environment and Pollution Technology
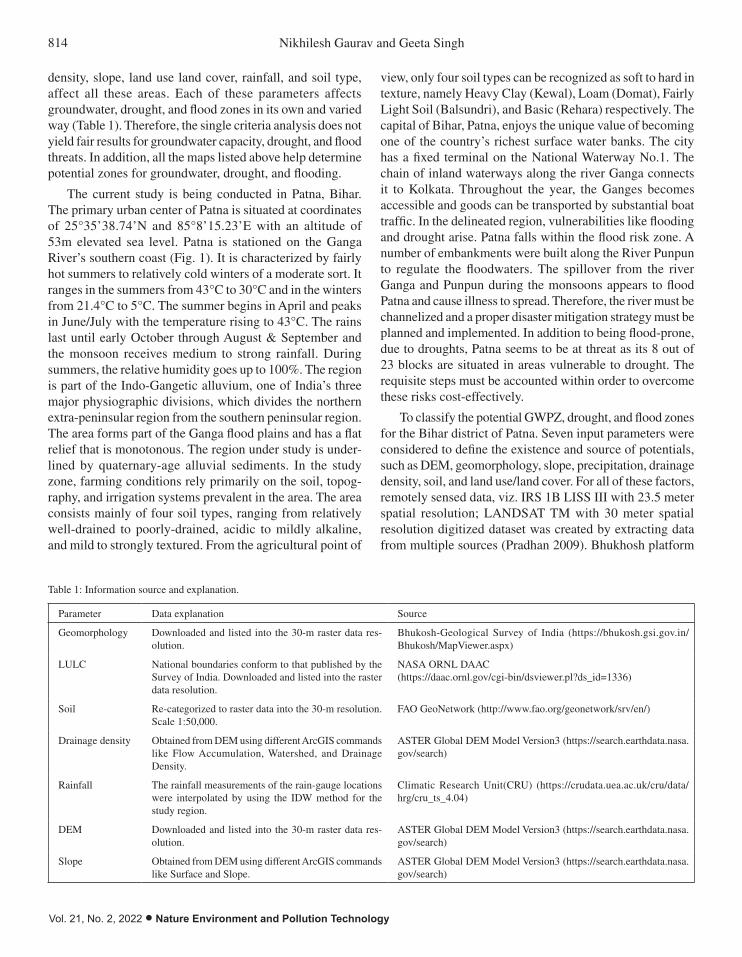
density, slope, land use land cover, rainfall, and soil type, affect all these areas. Each of these parameters affects groundwater, drought, and flood zones in its own and varied way (Table 1). Therefore, the single criteria analysis does not yield fair results for groundwater capacity, drought, and flood threats. In addition, all the maps listed above help determine potential zones for groundwater, drought, and flooding.
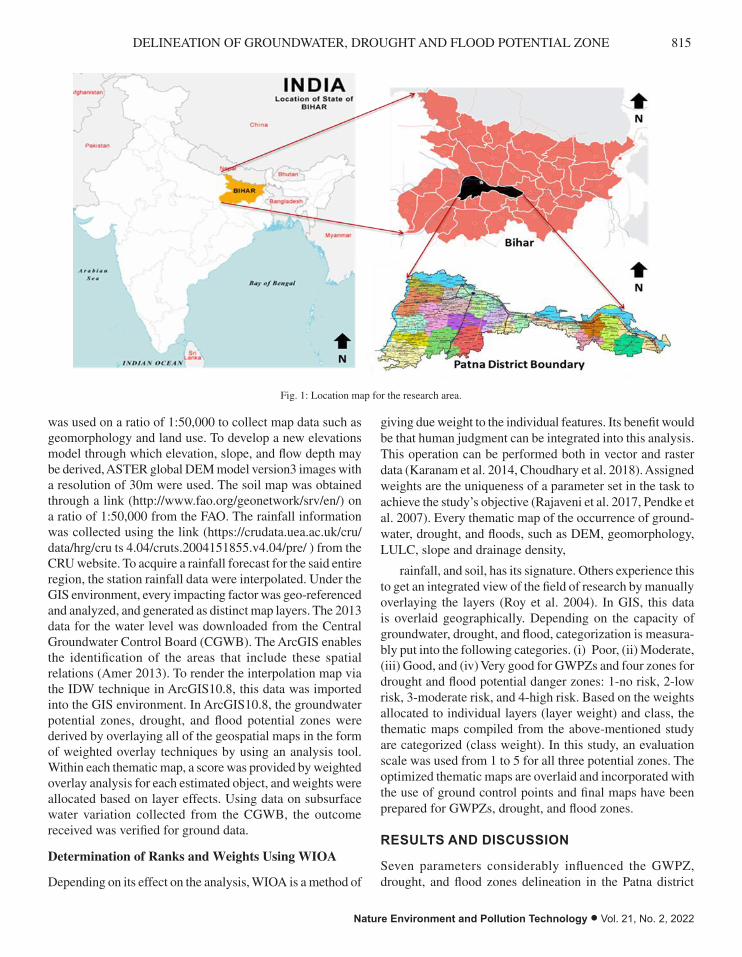
The current study is being conducted in Patna, Bihar. The primary urban center of Patna is situated at coordinates of 25°35’38.74’N and 85°8’15.23’E with an altitude of 53m elevated sea level. Patna is stationed on the Ganga River’s southern coast (Fig. 1). It is characterized by fairly hot summers to relatively cold winters of a moderate sort. It ranges in the summers from 43°C to 30°C and in the winters from 21.4°C to 5°C. The summer begins in April and peaks in June/July with the temperature rising to 43°C. The rains last until early October through August & September and the monsoon receives medium to strong rainfall. During summers, the relative humidity goes up to 100%. The region is part of the Indo-Gangetic alluvium, one of India’s three major physiographic divisions, which divides the northern extra-peninsular region from the southern peninsular region. The area forms part of the Ganga flood plains and has a flat relief that is monotonous. The region under study is under-lined by quaternary-age alluvial sediments. In the study zone, farming conditions rely primarily on the soil, topog-raphy, and irrigation systems prevalent in the area. The area consists mainly of four soil types, ranging from relatively well-drained to poorly-drained, acidic to mildly alkaline, and mild to strongly textured. From the agricultural point of
view, only four soil types can be recognized as soft to hard in texture, namely Heavy Clay (Kewal), Loam (Domat), Fairly Light Soil (Balsundri), and Basic (Rehara) respectively. The capital of Bihar, Patna, enjoys the unique value of becoming one of the country’s richest surface water banks. The city has a fixed terminal on the National Waterway No.1. The chain of inland waterways along the river Ganga connects it to Kolkata. Throughout the year, the Ganges becomes accessible and goods can be transported by substantial boat traffic. In the delineated region, vulnerabilities like flooding and drought arise. Patna falls within the flood risk zone. A number of embankments were built along the River Punpun to regulate the floodwaters. The spillover from the river Ganga and Punpun during the monsoons appears to flood Patna and cause illness to spread. Therefore, the river must be channelized and a proper disaster mitigation strategy must be planned and implemented. In addition to being flood-prone, due to droughts, Patna seems to be at threat as its 8 out of 23 blocks are situated in areas vulnerable to drought. The requisite steps must be accounted within order to overcome these risks cost-effectively.
To classify the potential GWPZ, drought, and flood zones for the Bihar district of Patna. Seven input parameters were considered to define the existence and source of potentials, such as DEM, geomorphology, slope, precipitation, drainage density, soil, and land use/land cover. For all of these factors, remotely sensed data, viz. IRS 1B LISS III with 23.5 meter spatial resolution; LANDSAT TM with 30 meter spatial resolution digitized dataset was created by extracting data from multiple sources (Pradhan 2009). Bhukhosh platform
Table 1: Information source and explanation.
Parameter Data explanation Source
Geomorphology Downloaded and listed into the 30-m raster data res-olution.
Bhukosh-Geological Survey of India (https://bhukosh.gsi.gov.in/Bhukosh/MapViewer.aspx)
LULC National boundaries conform to that published by the Survey of India. Downloaded and listed into the raster data resolution.
NASA ORNL DAAC (https://daac.ornl.gov/cgi-bin/dsviewer.pl?ds_id=1336)
Soil Re-categorized to raster data into the 30-m resolution. Scale 1:50,000.
FAO GeoNetwork (http://www.fao.org/geonetwork/srv/en/)
Drainage density Obtained from DEM using different ArcGIS commands like Flow Accumulation, Watershed, and Drainage Density.
ASTER Global DEM Model Version3 (https://search.earthdata.nasa.gov/search)
Rainfall The rainfall measurements of the rain-gauge locations were interpolated by using the IDW method for the study region.
Climatic Research Unit(CRU) (https://crudata.uea.ac.uk/cru/data/hrg/cru_ts_4.04)
DEM Downloaded and listed into the 30-m raster data res-olution.
ASTER Global DEM Model Version3 (https://search.earthdata.nasa.gov/search)
Slope Obtained from DEM using different ArcGIS commands like Surface and Slope.
ASTER Global DEM Model Version3 (https://search.earthdata.nasa.gov/search)
815DELINEATION OF GROUNDWATER, DROUGHT AND FLOOD POTENTIAL ZONE
Nature Environment and Pollution Technology • Vol. 21, No. 2, 2022
was used on a ratio of 1:50,000 to collect map data such as geomorphology and land use. To develop a new elevations model through which elevation, slope, and flow depth may be derived, ASTER global DEM model version3 images with a resolution of 30m were used. The soil map was obtained through a link (http://www.fao.org/geonetwork/srv/en/) on a ratio of 1:50,000 from the FAO. The rainfall information was collected using the link (https://crudata.uea.ac.uk/cru/data/hrg/cru ts 4.04/cruts.2004151855.v4.04/pre/ ) from the CRU website. To acquire a rainfall forecast for the said entire region, the station rainfall data were interpolated. Under the GIS environment, every impacting factor was geo-referenced and analyzed, and generated as distinct map layers. The 2013 data for the water level was downloaded from the Central Groundwater Control Board (CGWB). The ArcGIS enables the identification of the areas that include these spatial relations (Amer 2013). To render the interpolation map via the IDW technique in ArcGIS10.8, this data was imported into the GIS environment. In ArcGIS10.8, the groundwater potential zones, drought, and flood potential zones were derived by overlaying all of the geospatial maps in the form of weighted overlay techniques by using an analysis tool. Within each thematic map, a score was provided by weighted overlay analysis for each estimated object, and weights were allocated based on layer effects. Using data on subsurface water variation collected from the CGWB, the outcome received was verified for ground data.
Determination of Ranks and Weights Using WIOA
Depending on its effect on the analysis, WIOA is a method of
giving due weight to the individual features. Its benefit would be that human judgment can be integrated into this analysis. This operation can be performed both in vector and raster data (Karanam et al. 2014, Choudhary et al. 2018). Assigned weights are the uniqueness of a parameter set in the task to achieve the study’s objective (Rajaveni et al. 2017, Pendke et al. 2007). Every thematic map of the occurrence of ground-water, drought, and floods, such as DEM, geomorphology, LULC, slope and drainage density,
rainfall, and soil, has its signature. Others experience this to get an integrated view of the field of research by manually overlaying the layers (Roy et al. 2004). In GIS, this data is overlaid geographically. Depending on the capacity of groundwater, drought, and flood, categorization is measura-bly put into the following categories. (i) Poor, (ii) Moderate, (iii) Good, and (iv) Very good for GWPZs and four zones for drought and flood potential danger zones: 1-no risk, 2-low risk, 3-moderate risk, and 4-high risk. Based on the weights allocated to individual layers (layer weight) and class, the thematic maps compiled from the above-mentioned study are categorized (class weight). In this study, an evaluation scale was used from 1 to 5 for all three potential zones. The optimized thematic maps are overlaid and incorporated with the use of ground control points and final maps have been prepared for GWPZs, drought, and flood zones.
RESULTS AND DISCUSSION
Seven parameters considerably influenced the GWPZ, drought, and flood zones delineation in the Patna district
Fig. 1: Location map for the research area.
To classify the potential GWPZ, drought, and flood zones for the Bihar district of Patna. Seven
input parameters were considered to define the existence and source of potentials, such as
DEM, geomorphology, slope, precipitation, drainage density, soil, and land use/land cover. For
all of these factors, remotely sensed data, viz. IRS 1B LISS III with 23.5 meter spatial
resolution; LANDSAT TM with 30 meter spatial resolution digitized dataset was created by
extracting data from multiple sources (Pradhan 2009). Bhukhosh platform was used on a ratio
of 1:50,000 to collect map data such as geomorphology and land use. To develop a new
elevations model through which elevation, slope, and flow depth may be derived, ASTER
global DEM model version3 images with a resolution of 30m were used. The soil map was
obtained through a link (http://www.fao.org/geonetwork/srv/en/) on a ratio of 1:50,000 from
the FAO. The rainfall information was collected using the link
(https://crudata.uea.ac.uk/cru/data/hrg/cru ts 4.04/cruts.2004151855.v4.04/pre/ ) from the
CRU website. To acquire a rainfall forecast for the said entire region, the station rainfall data
were interpolated. Under the GIS environment, every impacting factor was geo-referenced and
analyzed, and generated as distinct map layers. The 2013 data for the water level was
downloaded from the Central Groundwater Control Board (CGWB). The ArcGIS enables the
identification of the areas that include these spatial relations (Amer 2013). To render the
interpolation map via the IDW technique in ArcGIS10.8, this data was imported into the GIS
environment. In ArcGIS10.8, the groundwater potential zones, drought, and flood potential
zones were derived by overlaying all of the geospatial maps in the form of weighted overlay
techniques by using an analysis tool. Within each thematic map, a score was provided by
Fig. 1: Location map for the research area.

816 Nikhilesh Gaurav and Geeta Singh
Vol. 21, No. 2, 2022 • Nature Environment and Pollution Technology
weighted overlay analysis for each estimated object, and weights were allocated based on layer
effects. Using data on subsurface water variation collected from the CGWB, the outcome
received was verified for ground data.
Determination of Ranks and Weights Using WIOA
Depending on its effect on the analysis, WIOA is a method of giving due weight to the
individual features. Its benefit would be that human judgment can be integrated into this
analysis. This operation can be performed both in vector and raster data (Karanam et al. 2014,
Choudhary et al. 2018). Assigned weights are the uniqueness of a parameter set in the task to
achieve the study's objective (Rajaveni et al. 2017, Pendke et al. 2007). Every thematic map of
the occurrence of groundwater, drought, and floods, such as DEM, geomorphology, LULC,
slope and drainage density,
rainfall, and soil, has its signature. Others experience this to get an integrated view of the field
of research by manually overlaying the layers (Roy et al. 2004). In GIS, this data is overlaid
geographically. Depending on the capacity of groundwater, drought, and flood, categorization
Fig. 2: Methodology flowchart. Fig. 2: Methodology flowchart.
of Bihar. The results of each attribute and the ranks and weights assigned to them are shown below. Tables 3, 4 & 5 illustrate how each parameter was rated and how much weight it was given in GWPZs, drought, and flood potential zones respectively.
Geomorphology
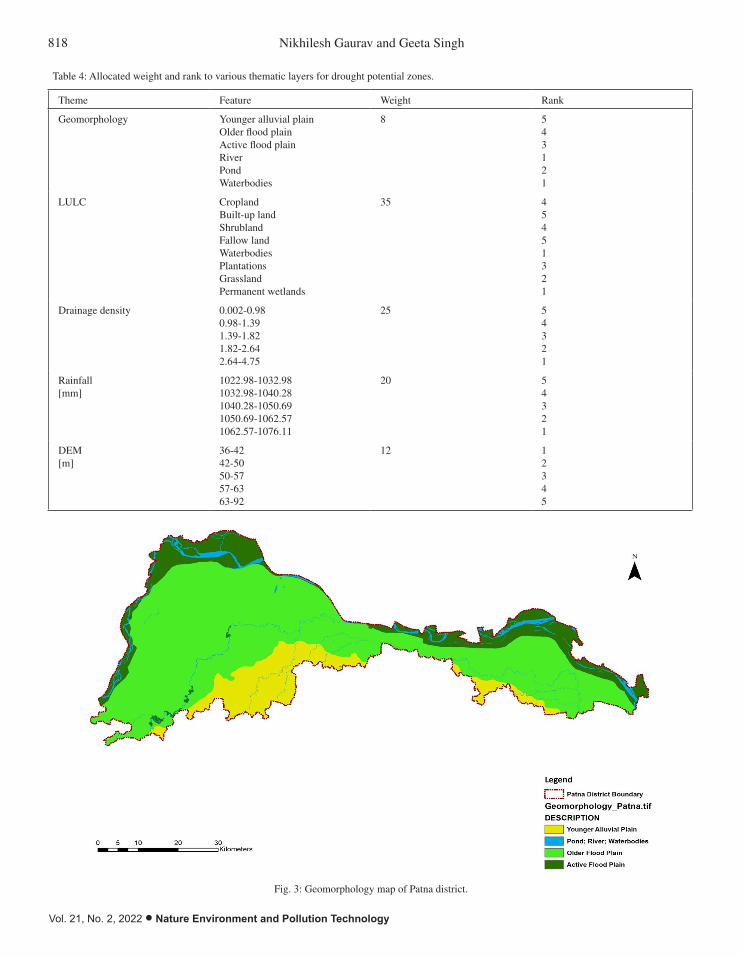
The geomorphology of any area reflects the structure of the subsurface, which is highly important in the regulation of groundwater (Krishna & Kumar 2018). Based on its impact on GWPZs, drought, and flood zones, the spatial geomor-phology map was attributed to the weight. The area of study is divided into five groups, i.e. Younger Alluvial Plain, Older Flood Plain, Active Flood Plain, River, Pond, and Waterbod-ies. These six topographical units were grouped into four groups to make the allocation of rank and weight easy, in which Younger Alluvial Plain which is about 421.405 km2 in
area of total geomorphological formation in the study region and comprises 12.90%, is assigned a low rank as it is located on the elevated side of the district having less influence on GWPZs and flood zones but higher rank for drought zones as it is elevated more than other classes so water availabil-ity will be less as compared to other classes. Older Flood Plain and Active Flood Plain constitute about 2201.89 km2
(67.38%) and 527.21 km2 (16.13%) in area respectively of the research area’s entire geomorphological composition and assigned moderate and high values respectively for GWPZs because these are flood plains and will help recharge groundwater more.
For flood potential zones, Older Flood Plain and Active Flood Plain are ranked high and higher values respectively, because of more possibility of occurrence of flood in these regions. For drought potential zones Older Flood Plain and Active Flood Plain are ranked moderately because of fewer
Table 2: Composition of the soil of Patna district.
S No. Clay % Silt % Sand %
3681 21 38 41
3743 18 44 38
3808 21 35 44

817DELINEATION OF GROUNDWATER, DROUGHT AND FLOOD POTENTIAL ZONE
Nature Environment and Pollution Technology • Vol. 21, No. 2, 2022
chances of flood occurrence in these regions. Similarly, riv-ers, Pond, and Waterbodies all constitute of total 117.33 km2
(3.59%) in the area and are ranked highest because of water availability throughout the year and will help in recharge of groundwater also study area is mainly a plain region. For flood, potential zones are ranked high because mainly flood occurs in this study zone because of water bodies, and for drought zones, they are ranked lowest because of very less chance of occurrence of drought in these regions, because of the availability of water throughout the year. The geomor-phology of the region studied is shown in Fig. 3.
Drainage Density
Drainage density is known as the proportion of the total runoff channel length of the region to the area of the entire
drainage basin. The surface water infiltration is found to be more in the sheet wash than in channel flow (Sitender 2011). It relies on the characteristics of land, slope, and near-sur-face topography (Rajaveni et al. 2017). Using the ASTER Global DEM Model Version3 30-m resolution images, In the ArcGIS, both flow accumulation and the drainage density map were extracted for the study area. The analysis area’s drainage density varies from 0.0028 to 4.75 m.m-2. The ranking was given in a manner that there would be more infiltration where more streams are passing from the field. If there is more infiltration, the water will go below ground and it will be easier to recharge groundwater resources. The region with better drainage density would have a greater value and lower drainage density will have a smaller value for the classification of flood potential zones.
Table 3: Allocated weight and rank to various thematic layers for GWPZ.
Theme Feature Weight Rank
Geomorphology Younger alluvial plainOlder flood plainActive flood plainRiverPondWaterbodies
10 234555
LULC CroplandBuilt-up landShrublandFallow landWaterbodiesPlantationsGrasslandPermanent wetlands
10 54215534
Soil 3681 Loamy Soil3743 Loamy Soil3808 Loamy Soil
5 354
Drainage density 0.002-0.980.98-1.391.39-1.821.82-2.642.64-4.75
25 12345
Rainfall[mm]
1022.98-1032.981032.98-1040.281040.28-1050.691050.69-1062.571062.57-1076.11
15 12345
DEM[m]
36-4242-5050-5757-6363-92
30 54321
Slope 0-0.820.82-2.202.20-4.054.05-6.816.81-23.47
5 54321
818 Nikhilesh Gaurav and Geeta Singh
Vol. 21, No. 2, 2022 • Nature Environment and Pollution Technology
Waterbodies all constitute of total 117.33 km2 (3.59%) in the area and are ranked highest
because of water availability throughout the year and will help in recharge of groundwater also
study area is mainly a plain region. For flood, potential zones are ranked high because mainly
flood occurs in this study zone because of water bodies, and for drought zones, they are ranked
lowest because of very less chance of occurrence of drought in these regions, because of the
availability of water throughout the year. The geomorphology of the region studied is shown
in Fig. 3.
Fig. 3: Geomorphology map of Patna district.
Drainage Density
Drainage density is known as the proportion of the total runoff channel length of the region to
the area of the entire drainage basin. The surface water infiltration is found to be more in the
sheet wash than in channel flow (Sitender 2011). It relies on the characteristics of land, slope,
and near-surface topography (Rajaveni et al. 2017). Using the ASTER Global DEM Model
Version3 30-m resolution images, In the ArcGIS, both flow accumulation and the drainage
density map were extracted for the study area. The analysis area's drainage density varies from
0.0028 to 4.75 m.m-2. The ranking was given in a manner that there would be more infiltration
where more streams are passing from the field. If there is more infiltration, the water will go
Fig. 3: Geomorphology map of Patna district.
Table 4: Allocated weight and rank to various thematic layers for drought potential zones.
Theme Feature Weight Rank
Geomorphology Younger alluvial plainOlder flood plainActive flood plainRiverPondWaterbodies
8 543121
LULC CroplandBuilt-up landShrublandFallow landWaterbodiesPlantationsGrasslandPermanent wetlands
35 45451321
Drainage density 0.002-0.980.98-1.391.39-1.821.82-2.642.64-4.75
25 54321
Rainfall[mm]
1022.98-1032.981032.98-1040.281040.28-1050.691050.69-1062.571062.57-1076.11
20 54321
DEM[m]
36-4242-5050-5757-6363-92
12 12345

819DELINEATION OF GROUNDWATER, DROUGHT AND FLOOD POTENTIAL ZONE
Nature Environment and Pollution Technology • Vol. 21, No. 2, 2022
Promising areas with higher drainage density will have lower rankings for the classification of drought zones and areas with lower drainage density will have top ranking because less drainage will have more drought possibili-ties. In Fig. 4, the drainage density of the sample area is given.
Slope
The slope of the area defines the availability of water for re-plenishment and the roughness of the landscape of any region (Kundal & Joshi 2004). On steeper slopes, groundwater may or may not be present but at lower slopes, water will certainly stay. Therefore, there is not much variation in slope, so the slope is less valuable for GWPZs and flood zones. Fewer slope results in more stability of water and will have a higher value and a higher slope will have less stability and results in low ranking values. So ranking was done based on this fact, and we don’t consider slope map for drought potential zones delineation because slope will not affect much on drought zone. After all, it can occur irrespective of slope at any place. The whole district is plain which constitutes the loamy soil. The slope of the study area has been divided into five classes (0-0.82), (0.82-2.20), (2.20-4.05), (4.05-6.81), (6.81-23.47). Much of the field of research shows that a 0-0.82% slope comprises an area of 1475.48km2 which indicates that the whole area of the district comes under the plain terrain. In Fig. 5, the slope of the sample area is given.
Rainfall
The precipitation serves as the key source of refueling for groundwater supplies. The amount of precipitation signifi-cantly influences the amount of groundwater replenishment. Higher rainfall will result in higher infiltration resulting in easy groundwater recharge. Heavy and untimely rainfall will result in severe floods too, and also less and no rainfall will result in severe drought too, so rainfall will have a major in-fluence on all three potential zones namely GWPZ, drought, and flood zones. The study area’s mean annual rainfall is about 1031 mm. The precipitation map for the research region was rated as 1022.89 and 1076.11 mm, in five categories with min and max precipitation, respectively. Higher ranks for GWPZs and flood zones are reserved for higher rainfall, but the inverse situation persists for drought regions. Fig. 6 shows the study area’s rainfall map.
Soil
To demarcate the groundwater potential areas, the soil is an essential factor. Subject to the soil types, it likewise gives a proof around the groundwater holding limit and penetration rate (Balakrishnan 2019). The soil map has been obtained from FAO for the study field. The soil type data shows that three distinct compositions of loamy soils primarily cover the study region. All three types with their composition are shown in Fig. 7. The soil in lower elevations will have a
below ground and it will be easier to recharge groundwater resources. The region with better
drainage density would have a greater value and lower drainage density will have a smaller
value for the classification of flood potential zones.
Promising areas with higher drainage density will have lower rankings for the classification of
drought zones and areas with lower drainage density will have top ranking because less
drainage will have more drought possibilities. In Fig. 4, the drainage density of the sample area
is given.
Fig. 4: Drainage Density map of Patna district.
Slope
The slope of the area defines the availability of water for replenishment and the roughness of
the landscape of any region (Kundal & Joshi 2004). On steeper slopes, groundwater may or
may not be present but at lower slopes, water will certainly stay. Therefore, there is not much
variation in slope, so the slope is less valuable for GWPZs and flood zones. Fewer slope results
in more stability of water and will have a higher value and a higher slope will have less stability
and results in low ranking values. So ranking was done based on this fact, and we don’t consider
slope map for drought potential zones delineation because slope will not affect much on
drought zone. After all, it can occur irrespective of slope at any place. The whole district is
Fig. 4: Drainage Density map of Patna district.

820 Nikhilesh Gaurav and Geeta Singh
Vol. 21, No. 2, 2022 • Nature Environment and Pollution Technology
Fig. 5: Slope map of Patna district.
Fig. 6: Rainfall map of Patna district. Fig. 6: Rainfall map of Patna district.
Fig. 5: Slope map of Patna district.
Fig. 6: Rainfall map of Patna district.
Fig. 5: Slope map of Patna district.

821DELINEATION OF GROUNDWATER, DROUGHT AND FLOOD POTENTIAL ZONE
Nature Environment and Pollution Technology • Vol. 21, No. 2, 2022
Fig. 7: Soil map of Patna district.
LULC
Another significant parameter influencing the circulation and presence of groundwater in a
region is LULC. The LU phenomenon has a stronger influence on the recovery of groundwater
and also on the frequency of drought and floods. By looking at the LULC trend of the study
region, the extent of land use, human habitation, and the length of uneven regions where
groundwater can be recharged are determined. The change in land use/land cover pattern
affects the groundwater recharge potential (Mangeshkumar et al 2019). The LULC area map
was graded into eight different classes namely Cropland, Built-up Land, Shrubland, Fallow
Land, Water Bodies, Plantations, Grassland, and Permanent Wetlands. The cropland, water
bodies, and plantations were deemed to be among the most appropriate replenish zone for
GWPZs because they prefer the seepage of rainwater and irrigated water; hence, they were
given higher ranking followed by built-up land because the population tends to live near the
place where groundwater is easily available and then permanent wetlands and then comes
grassland, shrubland, fallow land in decreasing value of ranking respectively.
For drought zone delineation built-up and fallow land were given higher ranking followed by
crop and shrubland and then plantation, grassland, water bodies, and permanent wetland were
given value in decreasing order respectively.
Fig. 7: Soil map of Patna district.
higher rank and vice-versa, for GWPZ and flood zones and drought zones soil will be less or not influential therefore in this study, I ignored this map in drought zone delineation. Fig.7 shows the study area’s soil map. Table 2 demonstrates the different compositions of the soil of the Patna district.
LULC
Another significant parameter influencing the circulation and presence of groundwater in a region is LULC. The LU phenomenon has a stronger influence on the recovery of groundwater and also on the frequency of drought and floods. By looking at the LULC trend of the study region, the extent of land use, human habitation, and the length of uneven regions where groundwater can be recharged are determined. The change in land use/land cover pattern affects the groundwater recharge potential (Mangeshkumar et al 2019). The LULC area map was graded into eight different classes namely Cropland, Built-up Land, Shrubland, Fallow Land, Water Bodies, Plantations, Grassland, and Permanent Wetlands. The cropland, water bodies, and plantations were deemed to be among the most appropriate replenish zone for GWPZs because they prefer the seepage of rainwater and irrigated water; hence, they were given higher ranking followed by built-up land because the population tends to live near the place where groundwater is easily available and then permanent wetlands and then comes grassland, shrubland, fallow land in decreasing value of ranking respectively.
For drought zone delineation built-up and fallow land were given higher ranking followed by crop and shrubland and then plantation, grassland, water bodies, and permanent wetland were given value in decreasing order respectively.
For flood zone delineation cropland and built-up land were given higher ranks followed by shrubland then wa-terbodies and grassland were given moderate ranks and then plantation, permanent wetlands, and fallow land were assigned low ranks respectively. The study region’s land use and land cover are shown in Fig. 8.
DEM
Digital elevation models (DEMs) are collections of hori-zontally referencing spaced evenly elevation values either to a Universal Transverse Mercator (UTM) projection or to a spatial coordinate system with a significant effect on the demarcation of GWPZs, drought, and flood regions. ASTER Global DEM Model Version3 with a resolution of 30 m was used for the Patna district. DEM in the study area is classified into five categories. For GWPZs lower elevation is more important and ranked with higher value and higher elevation with lower ranks and same follows for flood zone delineation because at lower elevation there will be more availability of groundwater and also the possibility of rainwater staying at a lower elevation so the risk of occurrence of flood will be at the higher side and for higher elevation, there will be less groundwater availability so rank will be less and in case of

822 Nikhilesh Gaurav and Geeta Singh
Vol. 21, No. 2, 2022 • Nature Environment and Pollution Technology
flood at higher elevation rainwater will not stay for long so less important and was given lower rank.
For drought zone delineation higher elevation will be of more importance so given a high rank because of less rainwater staying at elevated area resulting in more prone to drought occurrence and lower elevation will have a lower value because of more rainwater availability resulting in no or minimal risk of drought in a particular area. The study region’s land use and land cover are shown in Fig. 9.
GWPZs
The classification of various groundwater zones is focused on the overlay analysis method worked out by seven influ-encing factors in the ArcGIS for the Patna district in Bihar. To achieve a more objective outcome, the parameters and their sub-categories were evaluated in-depth and relevant ranks and weights were allocated based on the expertise of professionals and references from different literature. The conceivable area thereby identified was divided into four sets poor, moderate, good, and very good based on the amount. As a result of better drainage density, plain field, greater rainfall intensity, and geomorphology, the eastern part indicates a very strong potential zone for groundwater has been seen. The western part of the district is more elevated than the eastern part with lesser drainage density, and less rainfall
magnitude which leads to less availability of groundwater potential zones in this area. About 3.47% of the entire area was assigned to such a favorable region, 30.00% in good, 55.16% in moderate, and 11.37% in poor for groundwater potential zones. Table 3 comprises four GWPZ groups for the Patna district showing weights and ranks of different parameters, as well as Fig. 10, which displays the spatial map.
The Groundwater Prospective Zonation Map Validation
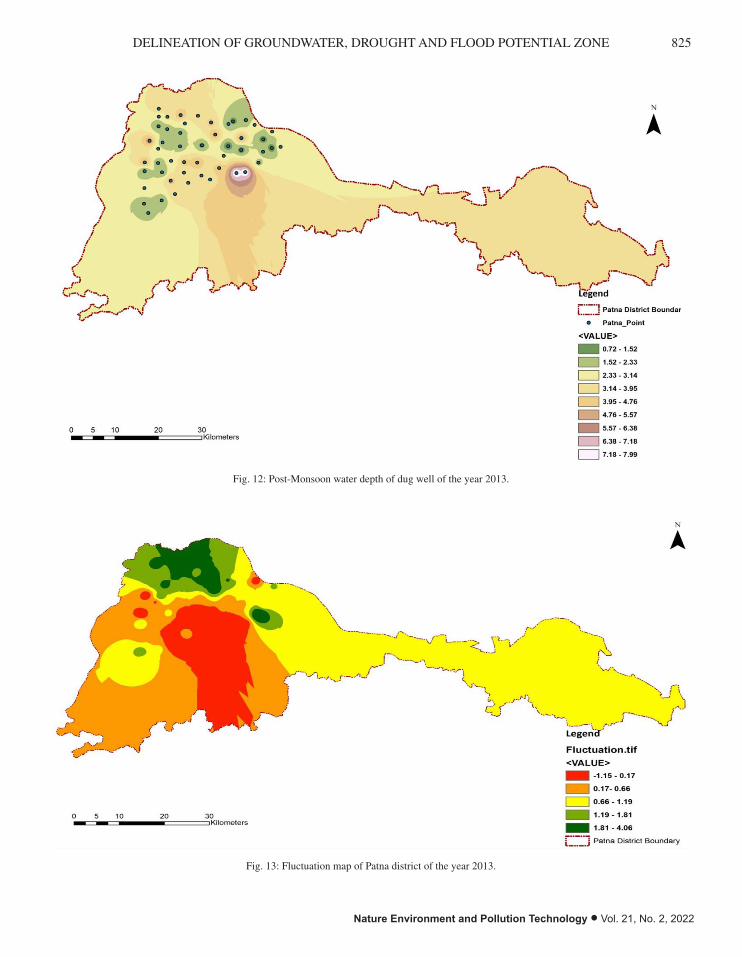
Utilizing well discharge data for 50 wells, and groundwater depth data gathered from CGWB, the groundwater potential zonation map was verified. For this, the pre-monsoon and post-monsoon groundwater deviation results were analyzed for the year 2013. Patterns of water table rise and decline have been identified on these targeted wells, and it was categorized in five different ranges according to fluctuation in ground-water level for pre and post-monsoon data of the year 2013. These ranges are 1.15 to 0.17 which indicates less fluctuation and results in a continuous decrease of groundwater in that zone because of located in mostly built-up and agricultural areas, where groundwater is the major source of needing the demands of people and also for the crop growth. In this range total of 13 wells are found. Then ranges are 0.17 to 0.66(10 wells), 0.66 to 1.19(11 wells), 1.19 to 1.81(9 wells),
For flood zone delineation cropland and built-up land were given higher ranks followed by
shrubland then waterbodies and grassland were given moderate ranks and then plantation,
permanent wetlands, and fallow land were assigned low ranks respectively.
The study region's land use and land cover are shown in Fig. 8.
Fig. 8: LULC map of Patna district.
DEM
Digital elevation models (DEMs) are collections of horizontally referencing spaced evenly
elevation values either to a Universal Transverse Mercator (UTM) projection or to a spatial
coordinate system with a significant effect on the demarcation of GWPZs, drought, and flood
regions. ASTER Global DEM Model Version3 with a resolution of 30 m was used for the Patna
district. DEM in the study area is classified into five categories. For GWPZs lower elevation is
more important and ranked with higher value and higher elevation with lower ranks and same
follows for flood zone delineation because at lower elevation there will be more availability of
groundwater and also the possibility of rainwater staying at a lower elevation so the risk of
occurrence of flood will be at the higher side and for higher elevation, there will be less
groundwater availability so rank will be less and in case of flood at higher elevation rainwater
will not stay for long so less important and was given lower rank.
Fig. 8: LULC map of Patna district.

823DELINEATION OF GROUNDWATER, DROUGHT AND FLOOD POTENTIAL ZONE
Nature Environment and Pollution Technology • Vol. 21, No. 2, 2022
57-63
63-92
2
1
Slope
0-0.82
0.82-2.20
2.20-4.05
4.05-6.81
6.81-23.47
5 5
4
3
2
1
Fig. 10: GWPZs map of Patna district.
The Groundwater Prospective Zonation Map Validation
Utilizing well discharge data for 50 wells, and groundwater depth data gathered from CGWB,
the groundwater potential zonation map was verified. For this, the pre-monsoon and post-
monsoon groundwater deviation results were analyzed for the year 2013. Patterns of water table
rise and decline have been identified on these targeted wells, and it was categorized in five
different ranges according to fluctuation in groundwater level for pre and post-monsoon data
of the year 2013. These ranges are 1.15 to 0.17 which indicates less fluctuation and results in
a continuous decrease of groundwater in that zone because of located in mostly built-up and
agricultural areas, where groundwater is the major source of needing the demands of people
and also for the crop growth. In this range total of 13 wells are found. Then ranges are 0.17 to
Fig. 10: GWPZs map of Patna district.
For drought zone delineation higher elevation will be of more importance so given a high rank
because of less rainwater staying at elevated area resulting in more prone to drought occurrence
and lower elevation will have a lower value because of more rainwater availability resulting in
no or minimal risk of drought in a particular area.
The study region's land use and land cover are shown in Fig. 9.
Fig. 9: DEM map of Patna district.
GWPZs
The classification of various groundwater zones is focused on the overlay analysis method
worked out by seven influencing factors in the ArcGIS for the Patna district in Bihar. To
achieve a more objective outcome, the parameters and their sub-categories were evaluated in-
depth and relevant ranks and weights were allocated based on the expertise of professionals
and references from different literature. The conceivable area thereby identified was divided
into four sets poor, moderate, good, and very good based on the amount. As a result of better
drainage density, plain field, greater rainfall intensity, and geomorphology, the eastern part
indicates a very strong potential zone for groundwater has been seen. The western part of the
Fig. 9: DEM map of Patna district.

824 Nikhilesh Gaurav and Geeta Singh
Vol. 21, No. 2, 2022 • Nature Environment and Pollution Technology
all these regions are in the moderate fluctuation zones and the ranged value 1.81 to 4.06 indicates the more fluctuation and results in recharging of groundwater easily because of located in near about waterbodies and in Ganga river vicinity and a total of 7 wells are found in this region. This statement, therefore, confronts the fact that the technique obtained for demarcating the possible groundwater region holds well and that adequate results have been obtained. Figs. 11, 12 &13 display the spatial map.
Drought Potential Zones
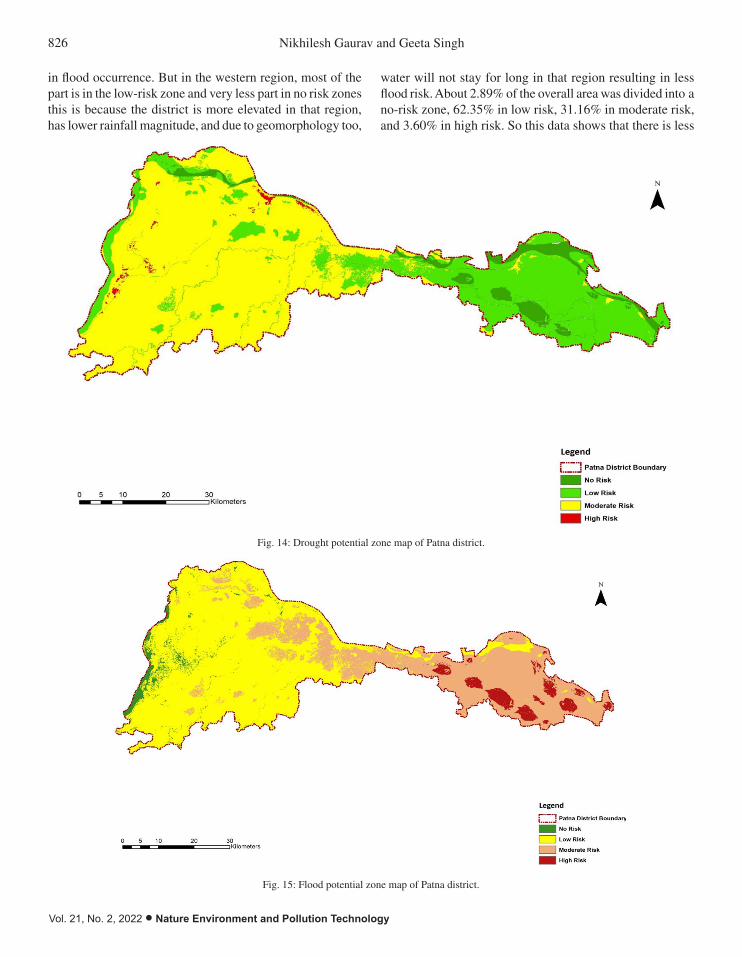
The delineation of drought potential zones is centered on the overlay analysis method performed out by five controlling parameters in the ArcGIS for the Patna district in Bihar. To achieve a more objective outcome, the parameters and their sub-categories were evaluated in-depth and relevant ranks and weights were allocated based on the expertise of professionals and references from different literature. The conceivable area thereby identified was divided into four categories like no risk, low risk, moderate risk, and high risk, based on the value. The eastern region after delineation shows that there is no low-risk zone because of located at lower elevations and higher rainfall occurrence and due to geomorphology too. But in the western region, most of the part is in moderate risk zone and very less part in high-risk
zones this is because the district is more elevated in that region, plain terrain, lower rainfall extent, and due to ge-omorphology too. About 5.82%% of the overall area was divided into a no-risk zone, 30.41% in low risk, 63.22% in moderate risk, and 0.55% in high risk. So this data shows that there is less possibility of severe drought but there is a possibility of drought occurrence in the district. Table 4 comprises four drought potential groups for the Patna district showing weights and ranks of different parameters, as well as Fig. 14, which displays the spatial map.
Flood Potential Zones
The delineation of flood potential zones is centered on the overlay analysis method performed out by seven controlling parameters in the ArcGIS for the Patna district in Bihar. To achieve a more objective outcome, the parameters and their sub-categories were evaluated in-depth and relevant ranks and weights were allocated based on the expertise of profes-sionals and references from different literature. The conceiv-able area thereby identified was divided into four categories like no risk, low risk, moderate risk, and high risk, based on the value. Upon delineation, the eastern area suggests that there is a high and moderate risk zone because of located at lower elevations and higher rainfall occurrence, and due to geomorphology too, water will stay for long and will result
0.66(10 wells), 0.66 to 1.19(11 wells), 1.19 to 1.81(9 wells), all these regions are in the
moderate fluctuation zones and the ranged value 1.81 to 4.06 indicates the more fluctuation
and results in recharging of groundwater easily because of located in near about waterbodies
and in Ganga river vicinity and a total of 7 wells are found in this region. This statement,
therefore, confronts the fact that the technique obtained for demarcating the possible
groundwater region holds well and that adequate results have been obtained. Figs. 11, 12 &13
display the spatial map.
Fig. 11: Pre-Monsoon water depth of dug well of the year 2013. Fig. 11: Pre-Monsoon water depth of dug well of the year 2013.
825DELINEATION OF GROUNDWATER, DROUGHT AND FLOOD POTENTIAL ZONE
Nature Environment and Pollution Technology • Vol. 21, No. 2, 2022
Fig. 12: Post-Monsoon water depth of dug well of the year 2013.
Fig. 13: Fluctuation map of Patna district of the year 2013.
Fig. 12: Post-Monsoon water depth of dug well of the year 2013.
Fig. 12: Post-Monsoon water depth of dug well of the year 2013.
Fig. 13: Fluctuation map of Patna district of the year 2013. Fig. 13: Fluctuation map of Patna district of the year 2013.
826 Nikhilesh Gaurav and Geeta Singh
Vol. 21, No. 2, 2022 • Nature Environment and Pollution Technology
1.82-2.64
2.64-4.75
2
1
Rainfall
[mm]
1022.98-1032.98
1032.98-1040.28
1040.28-1050.69
1050.69-1062.57
1062.57-1076.11
20 5
4
3
2
1
DEM
[mm]
36-42
42-50
50-57
57-63
63-92
12 1
2
3
4
5
Fig. 14: Drought potential zone map of Patna district.
Flood Potential Zones
The delineation of flood potential zones is centered on the overlay analysis method performed
out by seven controlling parameters in the ArcGIS for the Patna district in Bihar. To achieve a
more objective outcome, the parameters and their sub-categories were evaluated in-depth and
Fig. 14: Drought potential zone map of Patna district.
in flood occurrence. But in the western region, most of the part is in the low-risk zone and very less part in no risk zones this is because the district is more elevated in that region, has lower rainfall magnitude, and due to geomorphology too,
water will not stay for long in that region resulting in less flood risk. About 2.89% of the overall area was divided into a no-risk zone, 62.35% in low risk, 31.16% in moderate risk, and 3.60% in high risk. So this data shows that there is less
2.64-4.75 5
Rainfall
[mm]
1022.98-1032.98
1032.98-1040.28
1040.28-1050.69
1050.69-1062.57
1062.57-1076.11
20 1
2
3
4
5
DEM
[m]
36-42
42-50
50-57
57-63
63-92
20 5
4
3
2
1
Slope
0-0.82
0.82-2.20
2.20-4.05
4.05-6.81
6.81-23.47
5 5
4
3
2
1
Fig. 15: Flood potential zone map of Patna district.
Fig. 15: Flood potential zone map of Patna district.

827DELINEATION OF GROUNDWATER, DROUGHT AND FLOOD POTENTIAL ZONE
Nature Environment and Pollution Technology • Vol. 21, No. 2, 2022
Table 5: Allocated weight and rank to various thematic layers for Flood potential zones.
Theme Feature Weight Rank
Geomorphology Younger alluvial plainOlder flood plainActive flood plainRiverPondWaterbodies
8 245333
LULC CroplandBuilt-up landShrublandFallow landWaterbodiesPlantationsGrasslandPermanent wetlands
22 55413232
Soil 3681 Loamy Soil3743 Loamy Soil3808 Loamy Soil
5 132
Drainage density 0.002-0.980.98-1.391.39-1.821.82-2.642.64-4.75
20 12345
Rainfall[mm]
1022.98-1032.981032.98-1040.281040.28-1050.691050.69-1062.571062.57-1076.11
20 12345
DEM[m]
36-4242-5050-5757-6363-92
20 54321
Slope 0-0.820.82-2.202.20-4.054.05-6.816.81-23.47
5 54321
possibility of occurrence of flood in the western region of the district but the eastern region of the district has a chance of flood occurrence. Table 5 comprises four flood potential groups for the Patna district showing weights and ranks of different parameters, as well as Fig. 15, which displays the spatial map.
CONCLUSION
The study showed that the methods and strategies used were extremely efficient as they enabled the analyst to make a decision based upon its impact on the aspects considered and also supported by ArcGIS to better visualize the result’s geographical extent. The conceivable area thereby identified was divided into four groupings poor, moderate, good, and very good extending about 11.37%, 55.16%, 30.00%, and
3.47%, of area respectively. The result was highly influenced by factors such as drainage density, DEM, and rainfall, while components such as soil, LULC, slope, and geomorphology had relatively less impact.
For drought potential locations, the simulation results are grouped into four grouping 1-no risk, 2-low risk, 3-moder-ate risk, and 4-high risk extending about 5.82%, 30.41%, 63.22%, and 0.55% of area respectively.
For flood potential locations, the simulation results are grouped into four grouping 1-no risk, 2-low risk, 3-moder-ate risk, and 4-high risk extending about 2.89%, 62.35%, 31.16%, and 3.60% of area respectively.
It helps the government to be prepared for the worst scenario in more risky zones of drought and flood and also to place NDRF teams near the higher or moderate-risk zones

828 Nikhilesh Gaurav and Geeta Singh
Vol. 21, No. 2, 2022 • Nature Environment and Pollution Technology
to start the relief process as fast as possible in the affected region in the Patna district.
REFERENCESAmer, R. 2013. An integrated approach for groundwater potential zoning in
shallow fracture zone aquifers. Int. J. Remote Sens., 34(19): 6539-6561.Balakrishnan, M. 2019. Groundwater potential zone mapping using geo-
spatial techniques in Walayar watershed. Int. J. Eng. Adv. Technol., 9(1): 1157-1161.
Choudhary, K. M., Boori, S. and Kupriyanov, A. 2018. An approach to delineate groundwater potential zones in Orenburg, Russia. Disaster Adv., 11(8): 30-38.
Karanam, H., Mahapatra, A., Saranya, S., Vinaya, S., Prathyusha, S. and Shaik, M. 2014. Delineation of groundwater potential zones in the Greater Visakhapatnam Municipal Corporation (Gvmc) area. Int. J. Innov. Sci., 1(4): 478-492.
Krishna, A.P. and Kumar, A. 2018. Assessment of groundwater potential zones in coal mining impacted hard-rock terrain of India by integrating geospatial and analytic hierarchy process approach. Geocarto Int., 33(2): 105-129.
Kundal, R. and Joshi, A.K. 2004. Water resources development action plan for sasti watershed, Chandrapur district, Maharashtra using remote sensing and geographic information system. J. Indian Soc. Remote, 32(4): 363-372.
Mageshkumar, P., Anandakumar, S., Elango, L. and Pradeep, T. 2019. Ap-plication of geospatial techniques in delineating groundwater potential zones: A case study from South India. Arab. J. Geosci., 2(5): 1-15.
Pendke, M.S., Sreenivasan, G., Bhuibar, B.W., Kadale, A.S. and Khodke, U.M. 2007. Delineation of groundwater potential zones in Pingalgarh watershed of Maharashtra State using geospatial. J. Agric. Res. Tech-nol., 42(3): 65-69.
Pradhan, B. 2009. Groundwater potential zonation for basaltic watersheds using satellite remote sensing data and GIS techniques. Central Europ. J. Geosci., 1(1): 120-129.
Rajaveni, K., Brindha, K. and Elango, L. 2017. Geological and geomor-phological controls on groundwater occurrence in a hard rock region. Appl. Water Sci., 7(3): 1377-1389. doi:10.1007/s13201-015-0327-6.
Roy, B., Saraf, A.K., Choudhury, P.R., Sarma, B., Vijay, S. and Choudhury, S. 2004. GIS-based surface hydrological modeling in the identification of groundwater recharge zones. Int. J. Remote Sens., 25(24): 5759-5770.
Sitender, R. 2019. Delineation of groundwater potential zones in Mewat District, Haryana, India. Int. J. Geomat. Geosci., 2(1): 270-281.


![.Noah's Flood WTJ2004[1]](https://static.fdokumen.com/doc/165x107/631c39e73e8acd997705cf6b/noahs-flood-wtj20041.jpg)