ChallENgES iN flooD aND Drought MaNagEMENt (at SaME ...
8
www.IndianJournals.com Members Copy, Not for Commercial Sale Downloaded From IP - 65.21.229.84 on dated 22-Jul-2022 Volume 10 v No. 1 v January 2021 1. INTRODUCTION The study area lies in Kukadi Irrigation Project, in K5 sub basin of Krishna in Maharashtra. The project envisages cluster of 5 major dams (named Dimbhe, Manikdoh, Wadaj, Pimpalgaon Joge and Yedgaon) having irrigation potential of 156000 ha with annual 943.98 Mcum water utilization. Live water storage capacity of all the dams is 864.48 Mcum. The average annual rain fall in catchment varies from 900 mm to 3600 mm and in command varies from 400 mm to 600 mm.The command area lies in drought prone area of Pune, Ahmednagar and Solapur districts of state Maharashtra. (Figure 1) The project is planned for a gross utilization of 1101 Mcum (38.9 TMC). It is intended to extend Irrigation benefits to Pune District (Junnar, Ambegaon, and Shirur Tehsils), to Ahmednagar District (Parner, Shrigonda and Karjat Tehsils) and Solapur District (Karmala Tehsil). The Gross Command Area (GCA), Culturable Command Area (CCA) and the area proposed to be irrigated under different canal system are mentionedfor reference. The CCA is based on the village statistics.The average percentage of GCA to CCA is considered as 80%. The percentage for CCA to irrigable area is adopted as 65% to spread out irrigation facilities to larger areas as the area is drought prone. The Satelite image with longitudinal section is plotted (Figure 2) The Arial distance between the longest points of the catchment and command is around 182 km. The highest point is at altitude of 1600 m and the lowest point is around 525 m above MSL. CHALLENGES IN FLOOD AND DROUGHT MANAGEMENT (AT SAME TIME) IN KUKADI BASIN (UPPER KRISHNA) IN MAHARASHTRA Hanumant Dhumal 1 , Sucheta Dumbre 2 , Dr. Sunil B Thakare 3 ABSTRACT Kukadi Irrigation Project lies in K5 sub basin of Krishna in Maharashtra. The project envisages cluster of 5 major dams (named Dimbhe, Manikdoh, Wadaj, Pimpalgaon Joge and Yedgaon) having irrigation potential of 146053 ha with annual 1101 Mcum water utilization. Live water storage capacity of all the dams is 864.48 Mcum. The average annual rain fall in catchment varies from 900 mm to 3600 mm and in command varies from 400 mm to 600 mm.The command area lies in drought prone area of Pune, Ahmednagar and Solapur districts of Maharashtra. The Yedgaon dam is like pick up weir having its own yield and storage. It also receives water from Dimbhe dam (though DLBC), Wadaj dam (through MLBC), Manikdoh dam (through river) and through Pimpalgaon Joge dam (through river) and Chilhewadi dam. The project has main canals having total length of 582 km. Its major canal is KLBC, (Kukadi left bank canal). The KLBC starts from Yedgaon dam and runs for 249 km, in Pune (25 km), Ahmednagar (185. km) and Solapur (39 km) districts and the KLBC runs on water of Yedgaon dam.Every year, the project manager has to face the flood and drought situation at the same time. In July-August 2019 there was extreme situation, when catchment area received more than 200 % of precipitation and in command the precipitation was even less than 25 % of annual average. The river was flooded with water and the banks within 5 kms were having extreme scarcity of water in mid monsoon. The upper reaches and river bank project engineers were busy in flood mitigation and command area was waiting for tankers of drinking water. The paper envisages the challenges in K5 sub basin of Bhima (Upper Krishna) to handle extreme event of drought and flood situation at the same time. In present study, simultaneous flood and drought management in Kukadi sub basin is discussed. Keywords : drought, flood, management, scarcity 1. Research Scholar, Dr. D. Y. Patil Institute of Technology Pimpri, Pune, India 2. Assistant Exectuive Engineer, Water Resources Department, Pune, India 3. Research Supervisor, Principal, Anantrao Pawar College of Engineering & Research, Pune, India
-
Upload
khangminh22 -
Category
Documents
-
view
4 -
download
0
Transcript of ChallENgES iN flooD aND Drought MaNagEMENt (at SaME ...

ww
w.In
dia
nJo
urn
als.
com
Mem
ber
s C
op
y, N
ot
for
Co
mm
erci
al S
ale
Do
wn
load
ed F
rom
IP -
65.
21.2
29.8
4 o
n d
ated
22-
Jul-
2022
Volume10vNo.1vJanuary2021
1. INTRODUCTION
The study area lies in Kukadi Irrigation Project, in K5 sub basin of Krishna in Maharashtra. The project envisages cluster of 5 major dams (named Dimbhe, Manikdoh, Wadaj, Pimpalgaon Joge and Yedgaon) having irrigation potential of 156000 ha with annual 943.98 Mcum water utilization. Live water storage capacity of all the dams is 864.48 Mcum. The average annual rain fall in catchment varies from 900 mm to 3600 mm and in command varies from 400 mm to 600 mm.The command area lies in drought prone area of Pune, Ahmednagar and Solapur districts of state Maharashtra. (Figure 1)The project is planned for a gross utilization of 1101 Mcum (38.9 TMC). It is intended to extend Irrigation benefitstoPuneDistrict(Junnar,Ambegaon,andShirur
Tehsils), to Ahmednagar District (Parner, Shrigonda and Karjat Tehsils) and Solapur District (Karmala Tehsil). The Gross Command Area (GCA), Culturable Command Area (CCA) and the area proposed to be irrigated under different canal system are mentionedfor reference.The CCA is based on the village statistics.The average percentage of GCA to CCA is considered as 80%. The percentage for CCA to irrigable area is adopted as 65% to spread out irrigation facilities to larger areas as the area is drought prone.The Satelite image with longitudinal section is plotted (Figure 2)The Arial distance between the longest points of the catchment and command is around 182 km. The highest point is at altitude of 1600 m and the lowest point is around 525 m above MSL.
ChallENgES iN flooD aND Drought MaNagEMENt (at SaME tiME) iN kukaDi BaSiN
(uPPEr kriShNa) iN MaharaShtra
Hanumant Dhumal1, Sucheta Dumbre2, Dr. Sunil B Thakare3
ABSTrACTKukadi Irrigation Project lies in K5 sub basin of Krishna in Maharashtra. The project envisages cluster of 5 major dams (named Dimbhe, Manikdoh, Wadaj, Pimpalgaon Joge and Yedgaon) having irrigation potential of 146053 ha with annual 1101 Mcum water utilization. Live water storage capacity of all the dams is 864.48 Mcum. The average annual rain fall in catchment varies from 900 mm to 3600 mm and in command varies from 400 mm to 600 mm.The command area lies in drought prone area of Pune, Ahmednagar and Solapur districts of Maharashtra. The Yedgaon dam is like pick up weir having its own yield and storage. It also receives water from Dimbhe dam (though DLBC), Wadaj dam (through MLBC), Manikdoh dam (through river) and through Pimpalgaon Joge dam (through river) and Chilhewadi dam. The project has main canals having total length of 582 km. Its major canal is KLBC, (Kukadi left bank canal). The KLBC starts from Yedgaon dam and runs for 249 km, in Pune (25 km), Ahmednagar (185.km) and Solapur (39 km) districts and the KLBC runs on water of Yedgaon dam.Every year, the project manager has to face the flood and drought situation at the same time. In July-August 2019 there was extreme situation, when catchment area received more than 200 % of precipitation and in command the precipitation was even less than 25 % of annual average. The river was flooded with water and the banks within 5 kms were having extreme scarcity of water in mid monsoon. The upper reaches and river bank project engineers were busy in flood mitigation and command area was waiting for tankers of drinking water. The paper envisages the challenges in K5 sub basin of Bhima (Upper Krishna) to handle extreme event of drought and flood situation at the same time. In present study, simultaneous flood and drought management in Kukadi sub basin is discussed.
Keywords : drought, flood, management, scarcity
1. Research Scholar, Dr. D. Y. Patil Institute of Technology Pimpri, Pune, India2. Assistant Exectuive Engineer, Water Resources Department, Pune, India 3. Research Supervisor, Principal, Anantrao Pawar College of Engineering & Research, Pune, India

ww
w.In
dia
nJo
urn
als.
com
Mem
ber
s C
op
y, N
ot
for
Co
mm
erci
al S
ale
Do
wn
load
ed F
rom
IP -
65.
21.2
29.8
4 o
n d
ated
22-
Jul-
2022
38 NDC - WWC Journal
Volume10vNo.1vJanuary2021
2nd InternationalConferenceonSustainableWaterManagementisbeing organized byWaterResourceDepartment,Govt.ofMaharashtraduringNovember6-8,2019at
Pune,Maharashtra,India for CCA to irrigable area is adopted as 65% to spread out irrigation facilities to larger areas as the area is drought prone. The Satelite image with longitudinal section is plotted below.
Fig. 2: Catchment and Command with L section
The Arial distance between the longest points of the catchment and command is around 182 km. The highest point is at altitude of 1600 m and the lowest point is around 525 m above MSL.
Table 1: Dam wise / Canal wise Utilization in Drought prone area Sr.No. Name of Canal CCa ha. CCa ha. irrigation area
ha. 1 Kukadi LBC 173249 138600 90089 2 Ghod Feeder (DLBC) 5060 4048 2631 3 Ghod Branch 8327 6662 4330 4 Meena Branch 28873 23098 15014 5 Dimbhe RBC 29298 22382 14549 6 Pushpavati 3346 2677 1740 7 Meena Feeder (LBC) 6856 5485 3565 8 Pimpalgaon Joge (LBC) 22134 17708 11510 9 Manikdoh LBC 4356 3485 2265
10 Wadaj RBC 692 554 360 Total 280871 224699 146053
Fig.1 : Study area
2nd InternationalConferenceonSustainableWaterManagementisbeing organized byWaterResourceDepartment,Govt.ofMaharashtraduringNovember6-8,2019at
Pune,Maharashtra,India 1. introduction
The study area lies in Kukadi Irrigation Project, in K5 sub basin of Krishna in Maharashtra. The project envisages cluster of 5 major dams (named Dimbhe, Manikdoh, Wadaj, Pimpalgaon Joge and Yedgaon) having irrigation potential of 156000 ha with annual 943.98 Mcum water utilization. Live water storage capacity of all the dams is 864.48 Mcum. The average annual rain fall in catchment varies from 900 mm to 3600 mm and in command varies from 400 mm to 600 mm. The command area lies in drought prone area of Pune, Ahmednagar and Solapur districts of state Maharashtra.
Fig 1: Study area
The project is planned for a gross utilization of 1101 Mcum (38.9 TMC). It is intended to extend Irrigation benefits to Pune District (Junnar, Ambegaon, and Shirur Tehsils), to Ahmednagar District (Parner, Shrigonda and Karjat Tehsils) and Solapur District (Karmala Tehsil). The Gross Command Area (GCA), Culturable Command Area (CCA ) and the area proposed to be irrigated under different canal system are mentioned for reference. The CCA is based on the village statistics. The average percentage of GCA to CCA is considered as 80%. The percentage
Fig.2: Catchment and Command with L section

ww
w.In
dia
nJo
urn
als.
com
Mem
ber
s C
op
y, N
ot
for
Co
mm
erci
al S
ale
Do
wn
load
ed F
rom
IP -
65.
21.2
29.8
4 o
n d
ated
22-
Jul-
2022
39
Volume10vNo.1vJanuary2021
As per project planning, major irrigation (90089 Ha) is on KLBC through Yedgaon dam. The Yedgaon dam has storage capacity of 79.27 Mcum and utilization from this reservoir is 50.67 Mcum. Thus, it works on its own yield plus feeding from Wadaj, Manikdoh, Dimbhe and Pimpalgaon Joge. As per Kukadi Project Report, the dam wise feeding to Yedgaon dam is as below. 1. Dimbhe (though DLBC): 176.065 Mcum
2. Manikdoh (though Kukadi river): 242.306 Mcum3. Wadaj (through Meena Branch and then DLBC): 15.746 Mcum4. Pimpalgaon Joge (through Aar river): 3.115 McumThe KLBC represents the variation from highest to lowest water availability in the study area, as it passes through both the areas. (Figure 3)
Challenges in Flood and Drought Management (At Same Time) in Kukadi Basin (Upper Krishna) in Maharashtra
2nd InternationalConferenceonSustainableWaterManagementisbeing organized byWaterResourceDepartment,Govt.ofMaharashtraduringNovember6-8,2019at
Pune,Maharashtra,India
As per project planning, major irrigation (90089 Ha) is on KLBC through Yedgaon dam. The Yedgaon dam has storage capacity of 79.27 Mcum and utilization from this reservoir is 50.67 Mcum. Thus, it works on its own yield plus feeding from Wadaj, Manikdoh, Dimbhe and Pimpalgaon Joge. As per Kukadi Project Report, the dam wise feeding to Yedgaon dam is as below.
1. Dimbhe (though DLBC): 176.065 Mcum 2. Manikdoh (though Kukadi river): 242.306 Mcum 3. Wadaj (through Meena Branch and then DLBC): 15.746 Mcum 4. Pimpalgaon Joge (through Aar river): 3.115 Mcum
The KLBC represents the variation from highest to lowest water availability in the study area, as it passes through both the areas.
Fig. 3: Kukadi Project Cluster showing waterflow chart
2. general rain fall Pattern:
Table1 : Dam wise / Canal wise Utilization in Drought prone area
Sr.No. NameofCanal CCAHa. CCAHa. IrrigationAreaHa.1 Kukadi LBC 173249 138600 900892 Ghod Feeder (DLBC) 5060 4048 26313 Ghod Branch 8327 6662 43304 Meena Branch 28873 23098 150145 Dimbhe RBC 29298 22382 145496 Pushpavati 3346 2677 17407 Meena Feeder (LBC) 6856 5485 35658 Pimpalgaon Joge
(LBC)22134 17708 11510
9 Manikdoh LBC 4356 3485 226510 Wadaj RBC 692 554 360
Total 280871 224699 146053
Fig.3:KukadiProjectClustershowingwaterflowchart

ww
w.In
dia
nJo
urn
als.
com
Mem
ber
s C
op
y, N
ot
for
Co
mm
erci
al S
ale
Do
wn
load
ed F
rom
IP -
65.
21.2
29.8
4 o
n d
ated
22-
Jul-
2022
40 NDC - WWC Journal
Volume10vNo.1vJanuary2021
2. GENERALRAINFALLPATTERN
Sahyadri range hills divides western Maharashtra in heavy rainfall zone and rain shadow zone. The Isohytal map shows the rainfall distribution. In Konkan and on Sahyadri tops, the annual rainfall varies from 3000 mm to 6000 mm while in plateau it is from 400 mm to 700 mm.Average water available per hector in Konkan is 73 times that of plateau, per capita water availability in upper reaches is 15 times that of plateau. Also, annual rainy days in upper reaches are 111, while in plateau are only 34. Every year in June and July the upper reaches faces flood problems and the plateau faces scarcity.TheGovernmenthastoworkonfloodreliefandscarcityrelief work simultaneously.
b. FloodFig.5 : Diversity within 50 km.
3.1 RainfallVariationThere is large variation in precipitation received in July-August 2019 in catchment and command. Seven rain gauges studied in the area are Khireshwar (Junnar), Bhimashankar (Ambegaon), Ghod (Shirur), Nighoj (Parner), Shrigonda, Sina (Karjat), and Karmala. The
2nd InternationalConferenceonSustainableWaterManagementisbeing organized byWaterResourceDepartment,Govt.ofMaharashtraduringNovember6-8,2019at
Pune,Maharashtra,India
Sahyadri range hills divides western Maharashtra in heavy rainfall zone and rain shadow zone. The Isohytal map shows the rainfall distribution. In Konkan and on Sahyadri tops, the annual rainfall varies from 3000 mm to 6000 mm while in plateau it is from 400 mm to 700 mm. Average water available per hector in Konkan is 73 times that of plateau, per capita water availability in upper reaches is 15 times that of plateau. Also, annual rainy days in upper reaches are 111, while in plateau are only 34. Every year in June and July the upper reaches faces flood problems and the plateau faces scarcity. The Government has to work on flood relief and scarcity relief work simultaneously.
Fig. 4: Isohytal map
3. july august 2019 flood / Drought Scenario
2nd InternationalConferenceonSustainableWaterManagementisbeing organized byWaterResourceDepartment,Govt.ofMaharashtraduringNovember6-8,2019at
Pune,Maharashtra,India In July 2019 heavy rains started in the catchment area of Kukadi project dams, but the
command area was almost nil rainfall. At the end of July most of the reservoirs in upper catchment were about to spill. The Dimbhe started spilling on 02nd August, Yedgaon on 27th July and Ghod on 04th August. On the contrary the resrvoirs in lower areas were having nil water storages. In first week of August 2019, the dam administration had to face flood situation in upper area and drought in command area at the same time. Though, the flood was restricted to limited area and alongside the river banks of Ghod, it has mitigated by reservoir operation, The drought was wide spread and there was conflict in demands in command area. The flood and drought position are shown in figure 5 below. While upstream engineers were busy with flood mitigation and management and others busy in drought management at the same time.
Fig. 5: Diversity within 50 km. a.Drought b. Flood
3.1 rainfall variation
There is large variation in precipitation received in July-August 2019 in catchment and command. Seven rain gauges studied in the area are Khireshwar (Junnar), Bhimashankar (Ambegaon), Ghod (Shirur), Nighoj (Parner), Shrigonda, Sina (Karjat), and Karmala. The Khireshwar and Ambegaon are on ridges of Sahyadri and Karmala farthest in command near to Marathwada.The rainfall variation among these gauges in July-August 2019 is plotted on bar chart in Figure 6 below. It can be seen from figure that the maximum rainfall is around 5000 mm and minimum rainfall is around 100 mm.
Fig. 6: Rainfall variation in July August 2019
010002000300040005000
Rain
fall
in m
m
Khireshwar(Junnar)
Bhimashankar (
Ambegao)
Ghod(Shirur)
Nighoj(Parner) Shrigonda Sina (Karjat) Karmala
Jul-19 2395 2525 79 92 110 132 89Aug-19 2538 1906 44 52 37 26 24Total 4933 4431 123 144 147 158 113
Fig.4 : Isohytal map
3. JULYAUGUST2019FLOOD/DROUGHTSCE-NAriO
In July 2019 heavy rains started in the catchment area of Kukadi project dams, but the command area was almost
nil rainfall. At the end of July most of the reservoirs in upper catchment were about to spill. The Dimbhe started spilling on 02nd August, Yedgaon on 27th July and Ghod on 04th August. On the contrary the resrvoirs in lower areas were having nil water storages.In first week ofAugust2019,thedamadministrationhadtofacefloodsituation in upper area and drought in command area at the same time.Though, the floodwas restricted tolimited area and alongside the river banks of Ghod, it has mitigated by reservoir operation, The drought was wide spreadandtherewasconflictindemandsincommandarea.Thefloodanddroughtpositionareshowninfigure5below.Whileupstreamengineerswerebusywithfloodmitigation and management and others busy in drought management at the same time.
a. Drought
ww
w.In
dia
nJo
urn
als.
com
Mem
ber
s C
op
y, N
ot
for
Co
mm
erci
al S
ale
Do
wn
load
ed F
rom
IP -
65.
21.2
29.8
4 o
n d
ated
22-
Jul-
2022
41
Volume10vNo.1vJanuary2021
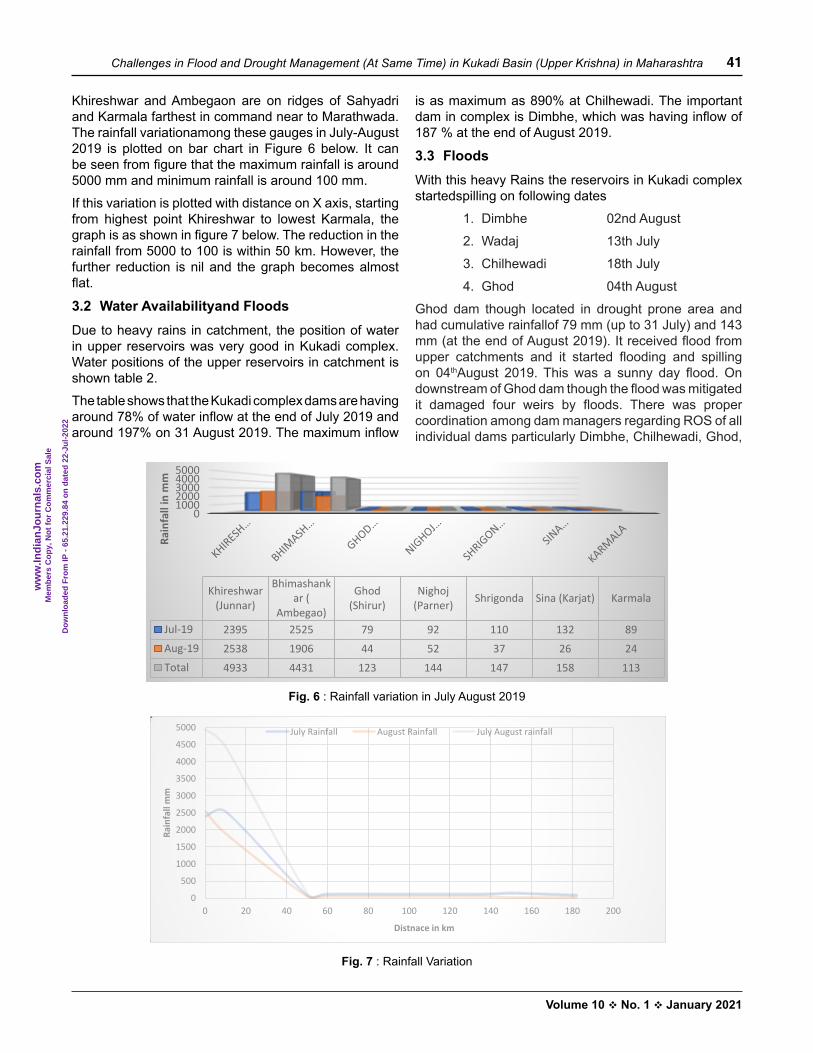
Khireshwar and Ambegaon are on ridges of Sahyadri and Karmala farthest in command near to Marathwada.The rainfall variationamong these gauges in July-August 2019 is plotted on bar chart in Figure 6 below. It can beseenfromfigurethatthemaximumrainfallisaround5000 mm and minimum rainfall is around 100 mm. If this variation is plotted with distance on X axis, starting from highest point Khireshwar to lowest Karmala, the graphisasshowninfigure7below.Thereductionintherainfall from 5000 to 100 is within 50 km. However, the further reduction is nil and the graph becomes almost flat.
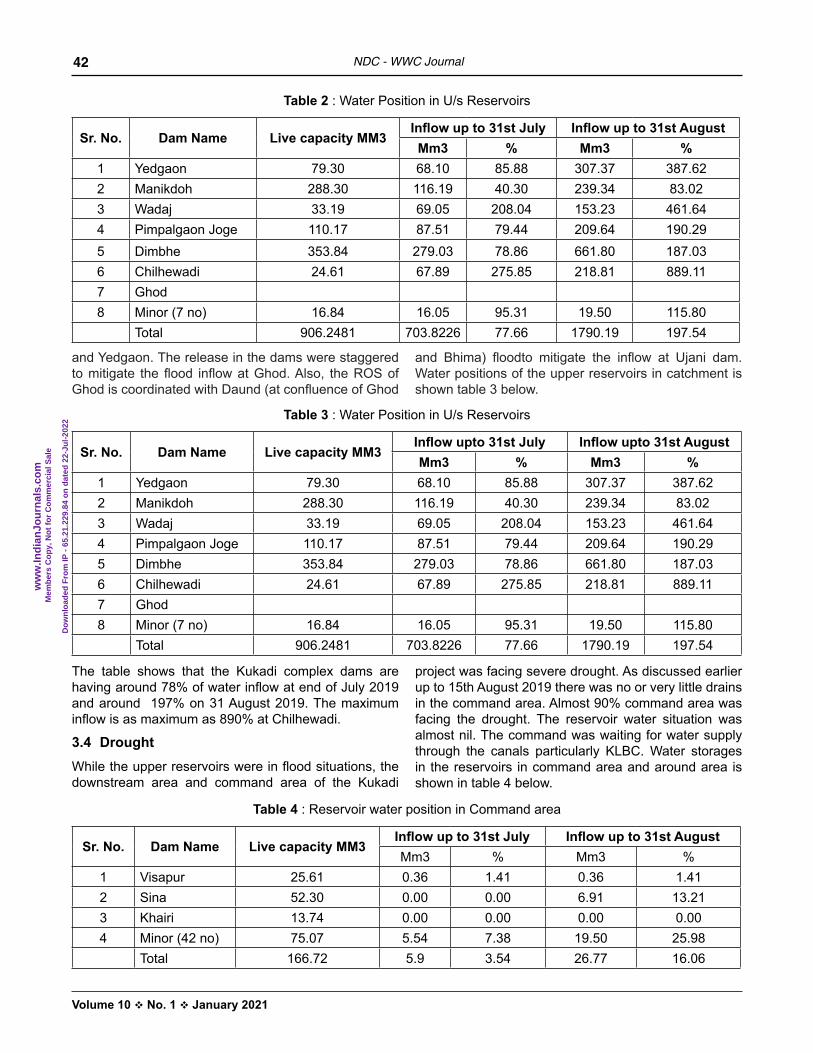
3.2 WaterAvailabilityandFloodsDue to heavy rains in catchment, the position of water in upper reservoirs was very good in Kukadi complex.Water positions of the upper reservoirs in catchment is shown table 2.The table shows that the Kukadi complex dams are having around78%ofwaterinflowattheendofJuly2019andaround197%on31August2019.Themaximuminflow
Challenges in Flood and Drought Management (At Same Time) in Kukadi Basin (Upper Krishna) in Maharashtra
2nd InternationalConferenceonSustainableWaterManagementisbeing organized byWaterResourceDepartment,Govt.ofMaharashtraduringNovember6-8,2019at
Pune,Maharashtra,India In July 2019 heavy rains started in the catchment area of Kukadi project dams, but the
command area was almost nil rainfall. At the end of July most of the reservoirs in upper catchment were about to spill. The Dimbhe started spilling on 02nd August, Yedgaon on 27th July and Ghod on 04th August. On the contrary the resrvoirs in lower areas were having nil water storages. In first week of August 2019, the dam administration had to face flood situation in upper area and drought in command area at the same time. Though, the flood was restricted to limited area and alongside the river banks of Ghod, it has mitigated by reservoir operation, The drought was wide spread and there was conflict in demands in command area. The flood and drought position are shown in figure 5 below. While upstream engineers were busy with flood mitigation and management and others busy in drought management at the same time.
Fig. 5: Diversity within 50 km. a.Drought b. Flood
3.1 rainfall variation
There is large variation in precipitation received in July-August 2019 in catchment and command. Seven rain gauges studied in the area are Khireshwar (Junnar), Bhimashankar (Ambegaon), Ghod (Shirur), Nighoj (Parner), Shrigonda, Sina (Karjat), and Karmala. The Khireshwar and Ambegaon are on ridges of Sahyadri and Karmala farthest in command near to Marathwada.The rainfall variation among these gauges in July-August 2019 is plotted on bar chart in Figure 6 below. It can be seen from figure that the maximum rainfall is around 5000 mm and minimum rainfall is around 100 mm.
Fig. 6: Rainfall variation in July August 2019
010002000300040005000
Rain
fall
in m
m
Khireshwar(Junnar)
Bhimashankar (
Ambegao)
Ghod(Shirur)
Nighoj(Parner) Shrigonda Sina (Karjat) Karmala
Jul-19 2395 2525 79 92 110 132 89Aug-19 2538 1906 44 52 37 26 24Total 4933 4431 123 144 147 158 113
Fig.6: Rainfall variation in July August 2019
Fig.7 : Rainfall Variation
2nd InternationalConferenceonSustainableWaterManagementisbeing organized byWaterResourceDepartment,Govt.ofMaharashtraduringNovember6-8,2019at
Pune,Maharashtra,India If this variation is plotted with distance on X axis, starting from highest point Khireshwar to lowest Karmala, the graph is as shown in figure 6 below. The reduction in the rainfall from 5000 to 100 is within 50 km. However, the further reduction is nil and the graph becomes almost flat.
Fig. 7: Rainfall Variation
3.2 Water availability and floods
Due to heavy rains in catchment, the position of water in upper reservoirs was very good in Kukadi complex.Water positions of the upper reservoirs in catchment is shown table 2 below.
Table 2: Water Position in U/s Reservoirs
Sr. No. Dam Name
live capacity
MM3 inflow up to 31st july inflow up to 31st august
Mm3 % Mm3 % 1 Yedgaon 79.30 68.10 85.88 307.37 387.62 2 Manikdoh 288.30 116.19 40.30 239.34 83.02 3 Wadaj 33.19 69.05 208.04 153.23 461.64 4 Pimpalgaon Joge 110.17 87.51 79.44 209.64 190.29 5 Dimbhe 353.84 279.03 78.86 661.80 187.03 6 Chilhewadi 24.61 67.89 275.85 218.81 889.11 7 Ghod 8 Minor (7 no) 16.84 16.05 95.31 19.50 115.80
Total 906.2481 703.8226 77.66 1790.19 197.54
The table shows that the Kukadi complex dams are having around 78 % of water inflow at the end of July 2019 and around 197 % on 31 August 2019. The maximum inflow is as maximum as 890% at Chilhewadi. The important dam in complex is Dimbhe, which was having inflow of 187 % at the end of August 2019.
0
500
1000
1500
2000
2500
3000
3500
4000
4500
5000
0 20 40 60 80 100 120 140 160 180 200
Rain
fall
mm
Distnace in km
July Rainfall August Rainfall July August rainfall
is as maximum as 890% at Chilhewadi. The important damincomplexisDimbhe,whichwashavinginflowof187 % at the end of August 2019.
3.3 FloodsWith this heavy Rains the reservoirs in Kukadi complex startedspilling on following dates 1. Dimbhe 02nd August 2. Wadaj 13th July 3. Chilhewadi 18th July 4. Ghod 04th AugustGhod dam though located in drought prone area and had cumulative rainfallof 79 mm (up to 31 July) and 143 mm(attheendofAugust2019).Itreceivedfloodfromupper catchments and it started flooding and spillingon 04thAugust 2019. This was a sunny day flood.OndownstreamofGhoddamthoughthefloodwasmitigatedit damaged four weirs by floods. There was propercoordination among dam managers regarding ROS of all individual dams particularly Dimbhe, Chilhewadi, Ghod,
ww
w.In
dia
nJo
urn
als.
com
Mem
ber
s C
op
y, N
ot
for
Co
mm
erci
al S
ale
Do
wn
load
ed F
rom
IP -
65.
21.2
29.8
4 o
n d
ated
22-
Jul-
2022
42 NDC - WWC Journal
Volume10vNo.1vJanuary2021
Table3 : Water Position in U/s Reservoirs
Sr.No. Dam Name LivecapacityMM3Inflowupto31stJuly Inflowupto31stAugustMm3 % Mm3 %
1 Yedgaon 79.30 68.10 85.88 307.37 387.622 Manikdoh 288.30 116.19 40.30 239.34 83.023 Wadaj 33.19 69.05 208.04 153.23 461.644 Pimpalgaon Joge 110.17 87.51 79.44 209.64 190.295 Dimbhe 353.84 279.03 78.86 661.80 187.036 Chilhewadi 24.61 67.89 275.85 218.81 889.117 Ghod8 Minor (7 no) 16.84 16.05 95.31 19.50 115.80
Total 906.2481 703.8226 77.66 1790.19 197.54
Table2 : Water Position in U/s Reservoirs
Sr.No. Dam Name LivecapacityMM3Inflowupto31stJuly Inflowupto31stAugustMm3 % Mm3 %
1 Yedgaon 79.30 68.10 85.88 307.37 387.622 Manikdoh 288.30 116.19 40.30 239.34 83.023 Wadaj 33.19 69.05 208.04 153.23 461.644 Pimpalgaon Joge 110.17 87.51 79.44 209.64 190.295 Dimbhe 353.84 279.03 78.86 661.80 187.036 Chilhewadi 24.61 67.89 275.85 218.81 889.117 Ghod8 Minor (7 no) 16.84 16.05 95.31 19.50 115.80
Total 906.2481 703.8226 77.66 1790.19 197.54
and Yedgaon. The release in the dams were staggered tomitigate theflood inflowatGhod.Also, theROSofGhodiscoordinatedwithDaund(atconfluenceofGhod
and Bhima) floodto mitigate the inflow at Ujani dam.Water positions of the upper reservoirs in catchment is shown table 3 below.
The table shows that the Kukadi complex dams are havingaround78%ofwaterinflowatendofJuly2019and around 197% on 31 August 2019. The maximum inflowisasmaximumas890%atChilhewadi.
3.4 DroughtWhiletheupperreservoirswereinfloodsituations,thedownstream area and command area of the Kukadi
project was facing severe drought. As discussed earlier up to 15th August 2019 there was no or very little drains in the command area. Almost 90% command area was facing the drought. The reservoir water situation was almost nil. The command was waiting for water supply through the canals particularly KLBC. Water storages in the reservoirs in command area and around area is shown in table 4 below.
Table4 : Reservoir water position in Command area
Sr.No. Dam Name LivecapacityMM3Inflowupto31stJuly Inflowupto31stAugustMm3 % Mm3 %
1 Visapur 25.61 0.36 1.41 0.36 1.412 Sina 52.30 0.00 0.00 6.91 13.213 Khairi 13.74 0.00 0.00 0.00 0.004 Minor (42 no) 75.07 5.54 7.38 19.50 25.98
Total 166.72 5.9 3.54 26.77 16.06

ww
w.In
dia
nJo
urn
als.
com
Mem
ber
s C
op
y, N
ot
for
Co
mm
erci
al S
ale
Do
wn
load
ed F
rom
IP -
65.
21.2
29.8
4 o
n d
ated
22-
Jul-
2022
43
Volume10vNo.1vJanuary2021
Challenges in Flood and Drought Management (At Same Time) in Kukadi Basin (Upper Krishna) in Maharashtra
It can be observed that the water storages in command area are only 4 % at the end of June and 16% at the endofAugust.Thediversityininflowofupperreservoirs(197%) and 11 % at lower reservoirs is too much.This scarce situation was widespread throughout the command Area. There was anultimate demand all over commandatthesametimeinfirstweekofAugust2019.Therewasa conflict in demandsat various locations.It was a tough challenge to manage these demands at the same time. The irrigation rotation of KLBC started on 29thJuly 2019. It was presumed that the current demandwillbe fulfilled thisrotation.Unfortunately, thedrinking water situation was worse in the command area which enforced the management to intervene Irrigation rotation. So, there were little changes made in the rotationtofulfilthedrinkingwaterdemands.Thenaturalstructures and minor tanks, which are the sources of drinkingwaterwerefilledwiththiswater.Itdisturbedtheirrigation rotation.There was no water for irrigation and also scarcity of drinking water in Parner, Shrigonda, Karjat, Jamkhed, and Karmala tehsils. The drinking water was to be supplied through tankers. The details of tankers consumed for drinking water mentioned in below table for ready reference.
Table5 : Number of Tankers in Kukadi Command Area in July and August 2019
Tehsil July AugustParner 110 59Shrigonda 72 27Karjat 82 47Jamkhed 58 57Karmala 81 48Total 403 238
2nd InternationalConferenceonSustainableWaterManagementisbeing organized byWaterResourceDepartment,Govt.ofMaharashtraduringNovember6-8,2019at
Pune,Maharashtra,India outflow can be controlled. Also, on downstream of Ghod there are two constraints, first is the natural channel capacity and second is the outflow in Bhima river. Because after confluence of Ghod with Bhima, the Daund city gates afftected. So to mitigate flood effects of Daund, it is essentisl to control Ghod outflow based on the flood at Bund garden (Pune). So, the ouflow at Ghod is mitigated on above to reduce on above two parameters. To control outflow it was essential to control inlfow. The inflow can be cotrolled by staggering Yedgaon and Dimbhe outflows. In following figure 7, it can be seen how the inflow can be mitigated.
Figure 7: Outflow from Yedgaon, Dimbhe and Inflow at Ghod
The peaks of Yedgaon and Dimbhe are staggered and the inflow at Ghod is reduced to maintain the outflow from Ghod. 4.2 Drought Mitigation
When the total storage in a sub basin is not above 33 % at the end of monsoon, the planning consists of reserving water for domestic purpose only, barring irrigation scheduling. The better co-ordination of all state government departments makes the impact of drought minimal. The EGS scheme, rural development schemes and planning for making available drinking water, food and fodder in / near the affected area make the drought impact bearable. To mitigate the drought, all canals KLBC, DRBC, GBC, MLBC were started at the end of first week of August. The main canal is KLBC. It was running since 29th July to 13th October 2019. It was operational for irrigation rotation and feeding of drinking water resources. Total quantity of water released through this rotaion from all canals is 376.174 Mcum. Out of this 112.852 was for drinking and 263.322 for irrigation purpose. observations /Conclusions 1. Kukadi sub basin in K5 sub-basin of Krishna is a typical sub-basin where the flood and
droughts are to be handlled simultaneouly. 2. The rainfall variation in the sub basin is from 5000 mm to 100 mm. 3. The rainfall variation reduces from 5000 to 100 mm in 50 km then it is constant. 4. The inflow in resrvoirs in sub basin is 200 % to 10%. 5. The proper reservoir operations can mitigate the flood risks. 6. The drought can be partialy mitigated by canals in sub basins. 7. The canals are not sufficient to reduce the drought risks.
0
10000
20000
30000
40000
50000
60000
216 240 264 288 312 336 360 384 408 432 456 480
Inflo
w/O
utflo
w/in
Cus
ecs
TimeinHrs
DimbheGhod InflowYedgao
Though the number of tankers were reduced in August, it is important to note that the drinking water was to be supplied by tankers in August as well.
4. ACTIONFORMITIGATION
4.1FloodmitigationThefloodmitigationwasdonebystartingcanalreleasesandstagering theoutflowfromvariousreservoirs.ThemainoutflowonthisperiodwasfromYedgaon,Dimbheand Ghod. Though the spilway design discharge of Yedgaon, Dimbhe and Ghod are 3204, 1485 and 2323Cumecs respectively,the natural river channel capacities are 1245, 707and 1132 cumecs respectively. To avoid flood inundation on downstrearm of dams itisessential tomaintain theoutflowswithin thenaturalchannel capacities. The Ghod dam, last resrvoir in the complexhasnofloodabsorptioncapacityandhas tobemaintained tocontrolthe inflow.So that, theoutflowcan be controlled. Also, on downstream of Ghod there aretwoconstraints,firstisthenaturalchannelcapacityandsecondistheoutflowinBhimariver.BecauseafterconfluenceofGhodwithBhima, theDaundcitygatesafftected. So tomitigate flood effects of Daund, it isessentisltocontrolGhodoutflowbasedonthefloodatBundgarden(Pune).So,theouflowatGhodismitigatedon above to reduce on above two parameters. To control outflow it was essential to control inlfow. The inflowcan be cotrolled by staggering Yedgaon and Dimbhe outflows.InfollowingFigure7, itcanbeseenhowtheinflowcanbemitigated.The peaks of Yedgaon and Dimbhe are staggered and the inflow atGhod is reduced tomaintain the outflowfrom Ghod.
4.2DroughtMitigationWhen the total storage in a sub basin is not above 33 % at the end of monsoon, the planning consists
Figure7:OutflowfromYedgaon,DimbheandInflowatGhod

ww
w.In
dia
nJo
urn
als.
com
Mem
ber
s C
op
y, N
ot
for
Co
mm
erci
al S
ale
Do
wn
load
ed F
rom
IP -
65.
21.2
29.8
4 o
n d
ated
22-
Jul-
2022
44 NDC - WWC Journal
Volume10vNo.1vJanuary2021
of reserving water for domestic purpose only, barring irrigation scheduling. The better co-ordination of all state government departments makes the impact of drought minimal. The EGS scheme, rural development schemes and planning for making available drinking water, food andfodderin/neartheaffectedareamakethedroughtimpact bearable. To mitigate the drought, all canals KLBC,DRBC,GBC,MLBCwerestartedattheendoffirstweek of August. The main canal is KLBC. It was running since 29thJuly to 13thOctober 2019. It wasoperational for irrigation rotation and feeding of drinking water resources. Total quantity of water released through this rotaion from all canals is 376.174 Mcum. Out of this 112.852 was for drinking and 263.322 for irrigation purpose.
OBSErVATiONS /CONCluSiONS
1. Kukadi sub basin in K5 sub-basin of Krishna is a typicalsub-basinwherethefloodanddroughtsareto be handlled simultaneouly.
2. The rainfall variation in the sub basin is from 5000 mm to 100 mm.
3. The rainfall variation reduces from 5000 to 100 mm in 50 km then it is constant.
4. The inflow in resrvoirs in sub basin is 200% to10%.
5. Theproperreservoiroperationscanmitigatethefloodrisks.
you are 60% water Save 60% of yourSElf
6. The drought can be partialy mitigated by canals in sub basins.
7. Thecanalsarenotsufficienttoreducethedroughtrisks.
8. As all reservoirs in Kukadi project are multi-purpose, it is essential to prepare integrated ROS and also to update ROS of all the dams considering the purpose of reservoirs.
rEfErENCES
(1) Kukadi Irrigation Project report, Water Resource Department, Government of Maharashtra.
(2) http://rtsfros.com/RTDAS/KrishnaRiver(3) Sinha, S.K. and R. Shrivastava, 2006: Role of large
dams in floodmoderation—case studies,DisasterManagement Congress, November 2006, New Delhi, India.
(4) Chaskar, D.S. and H.K. Varma, 2007: Risk management of water related disaster, Disaster Management Congress, November 2006 New Delhi, India.
(5) National Commission for Integrated Water Resources Development Report (1997).
(6) Chaskar, D.S. and H.K. Varma, 2007: Risk management of water related disaster, Disaster Management Congress, November 2006 New Delhi, India.