Drought Monitoring in Food-Insecure Areas of Ethiopia by Using Satellite Technologies
Upload
khangminh22Category
view
2download
0
1
Flood and drought risk assessment for agricultural areas (Tagus
Estuary, Portugal)
Paula Freire1, Marta Rodrigues
1, André B. Fortunato
1, Alberto Freitas
2
1Laboratório Nacional de Engenharia Civil, Lisboa, 1700-066, Portugal
2Direção Geral de Agricultura e Desenvolvimento Rural, Lisboa, 1949-002, Portugal 5
Correspondence to: Paula Freire ([email protected])
Abstract. Estuaries are coastal systems particularly vulnerable to climate change. Within these systems, agriculture is one of
the most potentially affected sectors. This paper proposes a risk assessment approach for helping the decision-making
process at a local level, addressing two risks that affect agricultural areas located in estuarine margins: the unavailability of
freshwater for irrigation resulting from the upstream propagation of estuarine brackish water during droughts, and land 10
inundation by high water levels associated with high tides and storm surges. For each risk, quantitative consequence
descriptors are proposed to support risk level determination and evaluation through a continuous consequence/probability
diagram. The approach applicability is discussed through its application to the Lezíria Grande de Vila Franca de Xira,
located in the Tagus Estuary (Portugal). Results indicate that the approach is appropriate to support risk owners in taking
actions to mitigate the risk. Examples of risk control measures for the risks addressed are presented. The main strengths of 15
the proposed approach are its flexibility to be adapted to local conditions and updated through time, and the ease of its
application by the risk owner.
1 Introduction
Agriculture is one of the economic sectors most vulnerable to climate change effects (Gornall et al., 2010; Burke and
Emerick, 2016; Thornton et al., 2018). Extreme weather events, such as floods and droughts, coupled with changing rainfall 20
patterns, increasing temperatures and rising water demand can reduce crop productivity, as already observed in some
southern European countries (Calzadilla et al., 2013; IPCC, 2014; Kovats et al., 2014; European Environment Agency,
2019). In coastal areas, agriculture is experiencing negative impacts mostly associated with the increase of submersion
frequency by salt water (IPCC, 2014). Under the influence of both marine and freshwater environments, estuaries are
particularly affected by changes in climate, through mean sea level rise, increasing storminess, global warming and 25
dwindling precipitation (Wong et al., 2014). The development of mitigation and adaptation measures to reduce the impacts
of climate change in the agricultural sector is one of the EU Common Agricultural Policy priorities (European Union, 2019).
Risk management approaches are increasingly used to help stakeholders in decision-making (Plate, 2002; Ale et al., 2015;
Aven, 2016). Risk management aims at anticipating and preventing or mitigating harm that can be avoided, by ensuring that
2
significant risks are identified and reduced through appropriate measures (Simonovic, 2012). The risk management process 30
should incorporate evidence-based information in supporting the definition of mitigation and adaptation measures (ISO,
2009b). UNISDR (2017) argues that an effective risk management should be based on an understanding of risk from all
sources and of the links between hazards and vulnerabilities. Recognizing the complexity of the risk management process,
different national and international guidelines have been produced (e.g. AS/NZS, 2004; IRM, 2002). Among them, the
ISO 31000 (ISO, 2009) provides generic guidance for the adoption of a consistent process to ensure effective risk 35
management. This Standard presents a comprehensive framework, which structures the risk management process through
five main steps: establishing the context, risk assessment, risk treatment, communication, and monitoring and review. Risk
assessment outcomes support the design of risk mitigation measures, their implementation and their effectiveness
assessment. While this framework is useful to guide the applications throughout the risk management process, it remains
very generic. Hence, its operational implementation needs to be detailed for each specific application. A wide range of 40
approaches for assessing risk have been developed, including qualitative, semi-quantitative or quantitative techniques (ISO,
2009b; Marhavilas et al., 2011; Sun et al., 2020). Chemweno et al. (2018) discuss the extent of application of several
approaches dependent on failure dependencies and on the uncertainty often associated with the lack of reliability data. A
comparative review of risk assessment and management methodologies addressing hydro-meteorological natural hazards
emphasizes the wide range of approaches followed, as well as their development level and complexity, mostly depending on 45
the location and target subjects (Cirela et al., 2014). Nevertheless, approaches addressing challenges that climate change will
bring to the agricultural areas located in estuarine margins and suitable to support local decision-makers to manage risk
remain to be developed. Agricultural estuarine areas without water storage capacity and located in low elevation terrains are
particularly vulnerable to changes in water availability for irrigation and inland inundation.
The present study aims at developing a risk assessment approach considering two natural risks that affect agricultural 50
estuarine lowlands: the scarcity of freshwater for irrigation and the marine submersion. Both phenomena are not new, but
they are exacerbated by climate change, through more frequent and intense droughts, increasing storminess and sea level
rise. The new approach is applied to an agricultural area (Lezíria Grande Public Irritation Perimeter) located in the Tagus
estuary (Portugal). The approach addresses two main challenges: (1) to assess two risks that affect estuarine agricultural
areas with different temporal scales of consequences (the scarcity of freshwater for irrigation and estuarine inundation of 55
agricultural terrains); (2) to consider hazard uncertainty in the risk evaluation. The final goal is to contribute with a tool that
can support the decision-making process at a local level in order to manage risk.
The paper is structured in five sections besides this introduction. Section 2 presents the risk assessment approach proposed
and Sect. 3 characterises the study area where the approach is applied. Results of the approach application are described in
Sect. 4 (Risk context) and Sect. 5 (Risk assessment). Results are discussed and the main conclusions summarized in Sect. 6. 60

3
2 Risk assessment approach
A risk assessment approach is developed to address two natural hazards that often affect agricultural areas located near
estuaries, particularly those dependent on surface water for crop irrigation and presenting low topography. These hazards
are: i) water salinity increase due to droughts, and ii) estuarine high water levels that can promote inland inundation. In order
to support stakeholders and decision-makers in the definition of mitigation and adaptation strategies, the approach should be 65
easy to perceive by the stakeholders and suitable to be updated according to local conditions. The approach is summarized in
Fig. 1 and is based on the generic risk management framework of ISO 3100 (ISO, 2009). The definitions used herein are
adapted from ISO (2009a).
70
Figure 1: Risk assessment approach followed in the present study.
The risk assessment has to be preceded by the establishment of the risk context, which defines the risk management
objectives, the consequence descriptors and the criteria to grade consequences, likelihood and risk (ISO, 2009b). The risk
context depends on the site-specific characteristics and must be supported by historical information, and stakeholders and the 75
risk owner judgement. The risk owner is the person or entity responsible for the risk management (ISO, 2009a).
As discussed above, several approaches are available to operationalize risk analysis and evaluation. Risk matrices,
combining qualitative or semi-quantitative information on consequence and probability, are used in several risk management
standards and guidelines to rank and prioritize risk (ISO, 2009b). Despite several disadvantages pointed out in the literature
(e.g. Cox, 2008; Duijm, 2015), risk matrices are widely used in risk acceptance discussion and risk communication to 80
broader audiences, supporting decision-making, as they present complex concepts in a simple way (Woodruff, 2005; Ale et
al., 2015). As an adequate tool to deal with risk level uncertainty, in both consequence and expected frequency, a continuous
consequence/probability diagram is chosen in the present study as the suitable technique to assess risk.
The consequence is defined as an event outcome that affects the risk management objectives (ISO, 2009a). The proposed
approach defines quantitative consequence descriptors of the two hazards through indicators of the potential economic 85
impact for the risk owner.

4
For the water salinity increase during droughts, the consequence descriptor was defined as the water unavailability for
irrigation during the most critical period for the crops to be watered. The water unavailability for irrigation (Wu) is given by
Eq. (1):
𝑊𝑢 = 1 − [𝑣𝑜𝑙𝑢𝑚𝑒 𝑜𝑓 𝑤𝑎𝑡𝑒𝑟 𝑎𝑣𝑎𝑖𝑙𝑎𝑏𝑙𝑒 𝑤𝑖𝑡ℎ 𝑠𝑎𝑙𝑖𝑛𝑖𝑡𝑦<1𝑝𝑠𝑢
𝑣𝑜𝑙𝑢𝑚𝑒 𝑜𝑓 𝑤𝑎𝑡𝑒𝑟 𝑛𝑒𝑒𝑑𝑒𝑑] (1) 90
Concerning estuarine high water level, several elements are exposed to hazards such as the land, people or infrastructures
including dykes that prevent lowland inundation during high spring tides. When dykes are present, inundation normally
occurs when the water level is above the dyke crest or when the dyke is breached. This exposed element can provide a direct
quantification of the hazard economic impact for the risk owner. Thus, the high water level consequence is based on the dyke
overflowing and the chosen descriptor is the relative cost of dyke damage repair, considering that the risk owner is the 95
organization responsible for repairing the dykes. The relative cost of dyke damage (RCDD) given by Eq. (2):
𝑅𝐶𝐷𝐷 =𝑙𝑒𝑛𝑔𝑡ℎ 𝑜𝑓 𝑡ℎ𝑒 𝑎𝑓𝑓𝑒𝑐𝑡𝑒𝑑 𝑑𝑦𝑘𝑒 𝑥 𝑟𝑒𝑝𝑎𝑖𝑟 𝑐𝑜𝑠𝑡 𝑝𝑒𝑟 𝑢𝑛𝑖𝑡 𝑙𝑒𝑛𝑔𝑡ℎ
𝑟𝑖𝑠𝑘 𝑜𝑤𝑛𝑒𝑟 𝑎𝑛𝑛𝑢𝑎𝑙 𝑖𝑛𝑐𝑜𝑚𝑒 (2)
Criteria to grade the consequence severity should rely on past events information from the area where this approach is
applied, with the stakeholder’s involvement. The same must be followed when selecting classes of likelihood, defined as the
chance of something happening and can be presented as a probability of an event. 100
In the present approach, the definition of risk levels considers the ISO (2009a) criteria and the tolerable risk concept that is
normally used to assist decision-makers (Marszal, 2001). Tolerable risk is defined by ICOLD (International Commission on
Large Dams) in 2002 as “a risk within a range that society can live with so as to secure certain net benefits”. It is a range of
risk that cannot be neglected or ignored and should rather be kept under surveillance and reduced if possible (Bowles, 2003).
Below tolerable risk, the risk is acceptable, i.e. risk is considered insignificant or adequately controlled, and above risk is 105
unacceptable (HSE, 2001). For the hazards considered, risk is divided in three levels in the consequence/probability diagram
corresponding to different bands: a) high risk (red band), where the level of risk is considered intolerable and risk treatment
is essential whatever its cost; b) medium risk (yellow band), where the risk is considered tolerable; c) low risk (green band),
where the level of risk is considered negligible, so no risk treatment measures are needed. Risk tolerance limits depend on
the study area characteristics and should be defined based on information from past events and risk owner judgement. 110
After establishing the risk context for the area where the approach is applied, hazard scenarios based on historical data and
stakeholder’s information have to be defined to support risk assessment. Consequence descriptors are evaluated for the
defined scenarios and risk levels are determined, compared and evaluated against risk criteria and tolerance limits previously
defined. Results provide scientifically-supported information to help stakeholders and risk owners to discuss the
acceptability of the risk magnitude. The consequence descriptors can be evaluated through the analysis of model results, and 115
historical and monitoring data.

5
3 Study area
3.1 The Tagus estuary
The Tagus estuary, located at the mouth of the Tagus River basin (Fig. 2 (a)), is framed by the largest metropolitan area of
Portugal, hosting along its margins 1.6 million inhabitants (Tavares et al., 2015). With a surface area of about 32,000 ha, the 120
estuary presents a marked contrast of occupation between both margins: extensive artificial areas are present along the
northern margin and agricultural and semi-natural areas including a Natural Reserve (one of the most important sanctuaries
for birds in Europe with about 14,000 ha) in the eastern area. Agriculture is the most relevant economic activity in the Tagus
estuary upper region, in particular irrigated agriculture. Two different types of water resources management are present: the
collective management existing in the irrigation perimeters of state / public initiative, either through distribution from 125
reservoirs (Vale do Sorraia) or through direct extraction from the Tagus River (Lezíria Grande de Vila Franca de Xira); and
individual management carried out by farmers outside these perimeters.
The main source of freshwater discharging into the estuary is the Tagus River, with an average, maximum and minimum
annual flows of 336 m3 s
-1, 828 m
3 s
-1 and 102 m
3 s
-1, respectively (APA, 2012). The Sorraia and the Trancão rivers also
contribute to the freshwater inflow into the estuary. The Tagus is the longest river of the Iberian Peninsula with a watershed 130
of 80,100 km2 distributed between Portugal (30%) and Spain (70%). The hydrological regime is highly modified by several
reservoirs constructed since the 1950’s in both countries, along the Tagus River and its tributaries. Although a convention
was signed between the two countries in 2001 to agree on annual water releases in the Tagus River at the international
border, particularly during droughts these releases are irregular and difficult to account for (Henriques, 2018). Therefore, the
water availability downstream strongly depends on the water resources management practices in the basin. 135
The hydrodynamics of the Tagus estuary is primarily driven by tides. The tidal range varies between 0.55 m and 3.86 m at
the coast (Guerreiro et al., 2015), and increases inside the estuary due to resonance (Fortunato et al., 1999). During extreme
conditions, other forcings may also be important. High river flows can increase water levels in the riverine stretch of the
estuary (Vargas et al., 2008) and stratify the water column (Rodrigues and Fortunato, 2017). During storms, wind,
atmospheric pressure and surface waves can also increase the water levels significantly (Fortunato et al., 2017). 140
The upper part of the estuary is affected by natural hazards with different meteorological and oceanographic origins, often
with relevant socio-economic impacts. Droughts can result from extremely dry periods aggravated by the impact of the water
management practices in the Tagus river basin. These water scarcity events significantly reduce the river flow reaching the
estuary and consequently increase the saltwater intrusion, as observed in 2005 and 2012 (Rodrigues et al., 2019). The
vulnerability of the water for human consumption, in terms of quantity and quality, was assessed for the EPAL (Public 145
Water Supply Company) water intake located in the Tagus estuary upper sector (Valada do Tejo) for different climatic
scenarios (Rodrigues et al., 2012). Both the results of that study and those of Rodrigues et al. (2019) suggest that only very
low river flows would lead to a significant increase of the salinity in the area. Historical data show that the Tagus estuarine
margins are also vulnerable to floods from two different origins that can widely affect the agricultural lands due their low
6
elevation (Freire et al., 2016; Rilo et al., 2017): extreme water discharges in the Tagus and Sorraia rivers (riverine flood), 150
and strong winds and low atmospheric pressure conditions combined with high spring tides (Fortunato et al., 2017).
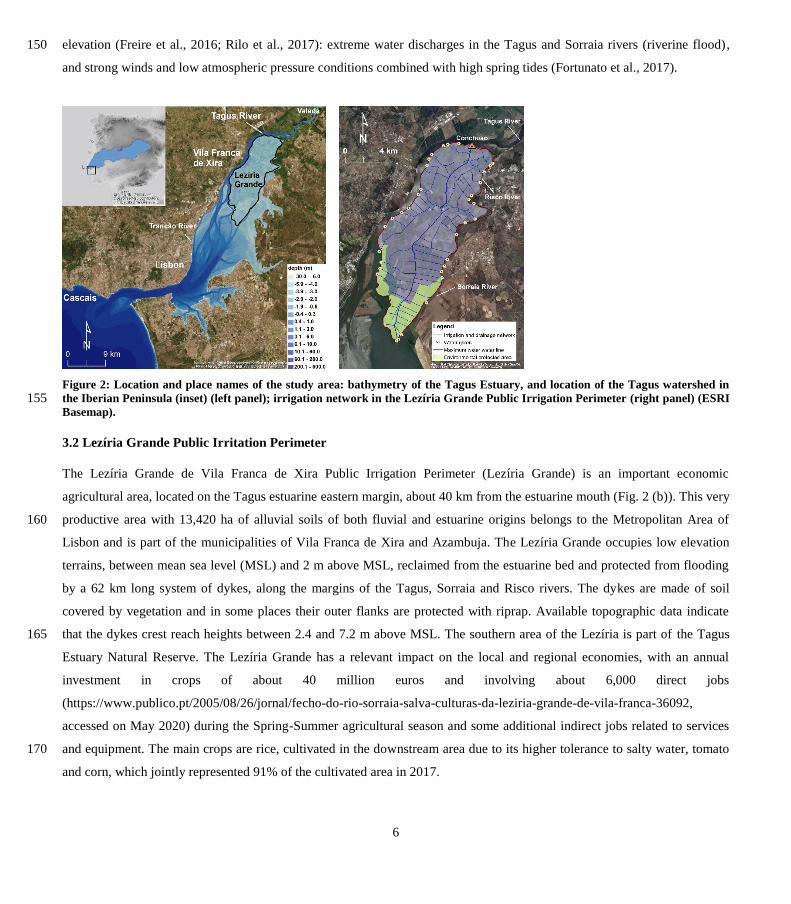
Figure 2: Location and place names of the study area: bathymetry of the Tagus Estuary, and location of the Tagus watershed in
the Iberian Peninsula (inset) (left panel); irrigation network in the Lezíria Grande Public Irrigation Perimeter (right panel) (ESRI 155 Basemap).
3.2 Lezíria Grande Public Irritation Perimeter
The Lezíria Grande de Vila Franca de Xira Public Irrigation Perimeter (Lezíria Grande) is an important economic
agricultural area, located on the Tagus estuarine eastern margin, about 40 km from the estuarine mouth (Fig. 2 (b)). This very
productive area with 13,420 ha of alluvial soils of both fluvial and estuarine origins belongs to the Metropolitan Area of 160
Lisbon and is part of the municipalities of Vila Franca de Xira and Azambuja. The Lezíria Grande occupies low elevation
terrains, between mean sea level (MSL) and 2 m above MSL, reclaimed from the estuarine bed and protected from flooding
by a 62 km long system of dykes, along the margins of the Tagus, Sorraia and Risco rivers. The dykes are made of soil
covered by vegetation and in some places their outer flanks are protected with riprap. Available topographic data indicate
that the dykes crest reach heights between 2.4 and 7.2 m above MSL. The southern area of the Lezíria is part of the Tagus 165
Estuary Natural Reserve. The Lezíria Grande has a relevant impact on the local and regional economies, with an annual
investment in crops of about 40 million euros and involving about 6,000 direct jobs
(https://www.publico.pt/2005/08/26/jornal/fecho-do-rio-sorraia-salva-culturas-da-leziria-grande-de-vila-franca-36092,
accessed on May 2020) during the Spring-Summer agricultural season and some additional indirect jobs related to services
and equipment. The main crops are rice, cultivated in the downstream area due to its higher tolerance to salty water, tomato 170
and corn, which jointly represented 91% of the cultivated area in 2017.

7
The Lezíria Grande presents a complex irrigation and drainage system network of channels 720 km long that are connected
to the adjacent rivers (Tagus, Sorraia and Risco) by water intakes and drainage gates. The main water intake that supplies the
freshwater for the farmland irrigation is located in the Tagus River, at Conchoso, and includes a pumping station (Fig. 2 (b)).
The total irrigated area is about 10,000 ha, 60 % of which are irrigated by surface irrigation and 40 % under pressure. 175
As the Conchoso water intake is located close to the upstream limit of the salinity propagation, the availability of water with
quality for irrigation strongly depends on the freshwater input from the Tagus River into the estuary. Because the effect of
droughts in the freshwater input usually starts in July, the critical month for irrigation, crops can be lost, with relevant
economical losses. During the most recent severe droughts, in 2005 and 2012, several emergency measures were undertaken
in the Lezíria Grande to minimize the negative impacts, such as the water supply exclusively from the Risco river water 180
intake and the construction of a temporary weir at the Sorraia river. The installation of the pumping system at the Conchoso
water intake, allowing the extraction of water from the Tagus River during low tide, and the construction of a removable
weir in the Risco River are recent improvements to increase the resilience to droughts.
Due to its low elevation terrains, the Lezíria Grande is vulnerable to flooding episodes of both riverine and estuarine origins.
High water discharges of the Tagus and Sorraia rivers can promote dyke breaching and extensive agricultural lands 185
inundation as occurred in February 1979 (Rebelo et al., 2018). During this event, the Lezíria Grande dyke was ruptured both
in the north and south sides, originating either displaced or evacuated people and relevant economic losses. About 2,000
people were reported to have been affected due to dyke failures in the surrounding area (Loureiro, 2009).
Estuarine high water levels caused by spring tides and severe storm surges can also overflow and damage the Lezíria Grande
dykes, promoting extensive inland inundation. The most dramatic estuarine flood event that affected this area, destroying all 190
the channels and dykes in this area, occurred on February 15, 1941 (Madaleno, 2006). This event affected several locations
along the Portuguese coast with devastating human and physical impacts (Muir-Wood, 2011; Freitas and Dias, 2013) and is
considered the major calamity that affected the Iberian Peninsula in the last 200 years. Besides the severe damages in
infrastructures, the impacts in the upper estuary include human losses and drowned cattle (Muir-Wood, 2011). The most
recent estuarine flood event that affected the Lezíria Grande occurred on February 27, 2010 resulting from the passage of the 195
storm Xynthia in the Portuguese territory (André et al., 2013; Fortunato et al., 2017). The dykes in the southern area of the
Lezíria Grande were overflown and damaged and the farmland flooded. As the event occurred out of the active farm season,
witnesses report that only up to 5 families and some cattle had to be evacuated. After the event the dykes were repaired and
elevated in some places.
4 Risk context 200
4.1 Risk management objectives
The Associação de Beneficiários da Lezíria Grande de Vila Franca de Xira (ABLGVFX), a collective organization
responsible for the management of the public infrastructures, under the supervision of the General Directorate of Agriculture

8
and Rural Development (DGADR), acted as risk owner as they are the most representative stakeholder. The overall risk
management objective of the Lezíria Grande is the management and exploitation of a public irrigation infrastructure during 205
extreme weather conditions. These conditions can be aggravated by climate change effects, namely more extreme droughts
and floods. For the present application and considering the saltwater intrusion hazard, the risk management objective is to
ensure water with good quality at the Conchoso intake, i.e. water with salinity below 1 psu, during the agricultural irrigation
campaigns. Despite the natural conditions that contribute to the droughts, the water resources management practices at
regional and local levels affect this objective. At the regional level, the volumes discharged from Spain during exceptional 210
meteorological conditions and the EDP hydropower production regime are the main conditioning factors for the water
availability downstream. The adaptive capacity of the farmers, such as improving the adequacy and efficiency of the
irrigation practices, changing the type of cultures, and increasing emergency planning and response capability are examples
of local water resources management factors. Concerning the high water level hazard, during estuarine floods, the specific
risk management objective considered is to avoid the dykes overflow and damage, preventing inland inundation. Due to the 215
Lezíria Grande low topography, the dyke integrity is crucial to protect the farmland, support facilities and infrastructures
from being inundated and damaged, not only during extreme events but also daily during high tide. This objective can be
reached by flood adaptation measures, including raising the dykes height, as decided after the 2010 flood event, increasing
the area of salt tolerant crops, and increasing emergency planning and response capability.
4.2 Consequence and likelihood criteria 220
For the water salinity at Conchoso during droughts, which results from the upstream saltwater propagation, the consequence
is evaluated using the consequence descriptor presented in Eq. (1), considering the water unavailability for irrigation during
the month of July as it is the most critical for irrigation. Water unavailability is computed on a weekly basis and the
minimum weekly water need is considered as 1,029x103 m
3, which corresponds to the worst case scenario based on
historical needs (Aqualogus/Campo d'Água, 2016). The usable volume of water is estimated by multiplying the time during 225
which water with salinity below 1 psu is available at the Conchoso intake per week by the maximum pumping capacity at the
Conchoso station. The Conchoso pumping rate capacity considered was 4.5 m3 s
-1, which corresponds to the pumping rate
capacity with low water level (Aqualogus/Campo d'Água, 2016a). This criterion is justified by the absence of reservoirs in
the Lezíria and it is assumed that the water is used as soon as it is abstracted. The severity grade criteria of this consequence
were defined based on the past occurrences and their consequences (Table 1). 230
During the most recent droughts, the consequences were more severe in 2005 than in 2012 as less water was available. In
2005, freshwater was unavailable at the Conchoso water intake from mid-July onwards. The water was therefore supplied to
the Lezíria exclusively from the Risco River water intake and the consequences were very severe with significant losses of
crops (Rodrigues et al., 2016). Thus, severity is considered low when less than 1 % of the water needed is unavailable for
irrigation, leading to negligible losses of crops. The severity is considered medium when 1 %-25 % of water is unavailable, 235
9
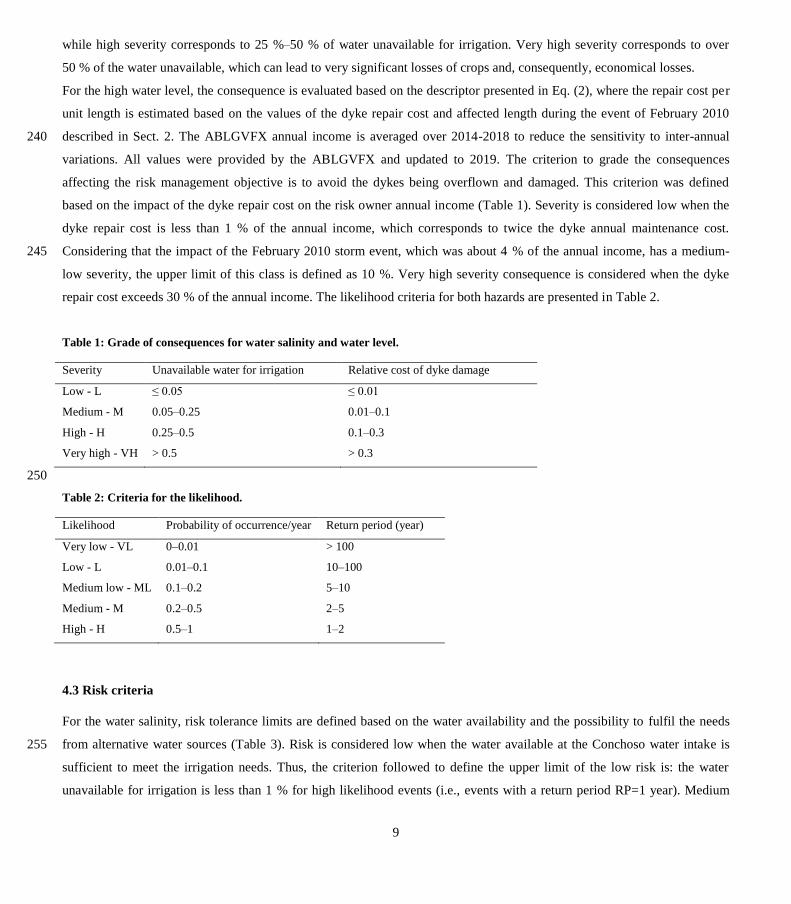
while high severity corresponds to 25 %–50 % of water unavailable for irrigation. Very high severity corresponds to over
50 % of the water unavailable, which can lead to very significant losses of crops and, consequently, economical losses.
For the high water level, the consequence is evaluated based on the descriptor presented in Eq. (2), where the repair cost per
unit length is estimated based on the values of the dyke repair cost and affected length during the event of February 2010
described in Sect. 2. The ABLGVFX annual income is averaged over 2014-2018 to reduce the sensitivity to inter-annual 240
variations. All values were provided by the ABLGVFX and updated to 2019. The criterion to grade the consequences
affecting the risk management objective is to avoid the dykes being overflown and damaged. This criterion was defined
based on the impact of the dyke repair cost on the risk owner annual income (Table 1). Severity is considered low when the
dyke repair cost is less than 1 % of the annual income, which corresponds to twice the dyke annual maintenance cost.
Considering that the impact of the February 2010 storm event, which was about 4 % of the annual income, has a medium-245
low severity, the upper limit of this class is defined as 10 %. Very high severity consequence is considered when the dyke
repair cost exceeds 30 % of the annual income. The likelihood criteria for both hazards are presented in Table 2.
Table 1: Grade of consequences for water salinity and water level.
Severity Unavailable water for irrigation Relative cost of dyke damage
Low - L ≤ 0.05 ≤ 0.01
Medium - M 0.05–0.25 0.01–0.1
High - H 0.25–0.5 0.1–0.3
Very high - VH > 0.5 > 0.3
250
Table 2: Criteria for the likelihood.
Likelihood Probability of occurrence/year Return period (year)
Very low - VL 0–0.01 > 100
Low - L 0.01–0.1 10–100
Medium low - ML 0.1–0.2 5–10
Medium - M 0.2–0.5 2–5
High - H 0.5–1 1–2
4.3 Risk criteria
For the water salinity, risk tolerance limits are defined based on the water availability and the possibility to fulfil the needs
from alternative water sources (Table 3). Risk is considered low when the water available at the Conchoso water intake is 255
sufficient to meet the irrigation needs. Thus, the criterion followed to define the upper limit of the low risk is: the water
unavailable for irrigation is less than 1 % for high likelihood events (i.e., events with a return period RP=1 year). Medium
10
risk level, which corresponds to the tolerable risk, corresponds to events during which the water available at Conchoso
cannot meet the irrigation demands, but the Risco River can be used as an alternative source to fulfil the needs. The upper
and lower limits of the tolerable risk band were defined based on estimates of the minimum and maximum volumes of water 260
available in the Risco River. The minimum volume of water available in the Risco River was defined based on Rodrigues et
al. (2019), which estimates that the volume of water available in the Risco River ranges from 1–4x10⁶ m
3. Considering that
the Risco River should provide an alternative water source during one month, the minimum weekly volume available in the
Risco River is 0.25x10⁶ m
3, which corresponds to 24 % of the total water needs for irrigation per week. The maximum water
volume available is determined by the water abstraction capacity. The average abstraction capacity was taken as 0.97 m3 s
-1 265
(Aqualogus/Campo d'Água, 2016), which corresponds to a weekly volume of 584,558 m3
(57 % of the irrigation needs).
Thus, the risk is considered tolerable if the water unavailable in Conchoso is less than 24 % (for high likelihood events, i.e.,
RP=1 year) or 57 % (for low likelihood events, i.e., RP=100 years). The risk is considered high when the water available
from both Conchoso and the Risco river is insufficient to fulfil the irrigation needs and risk treatment is required.
270
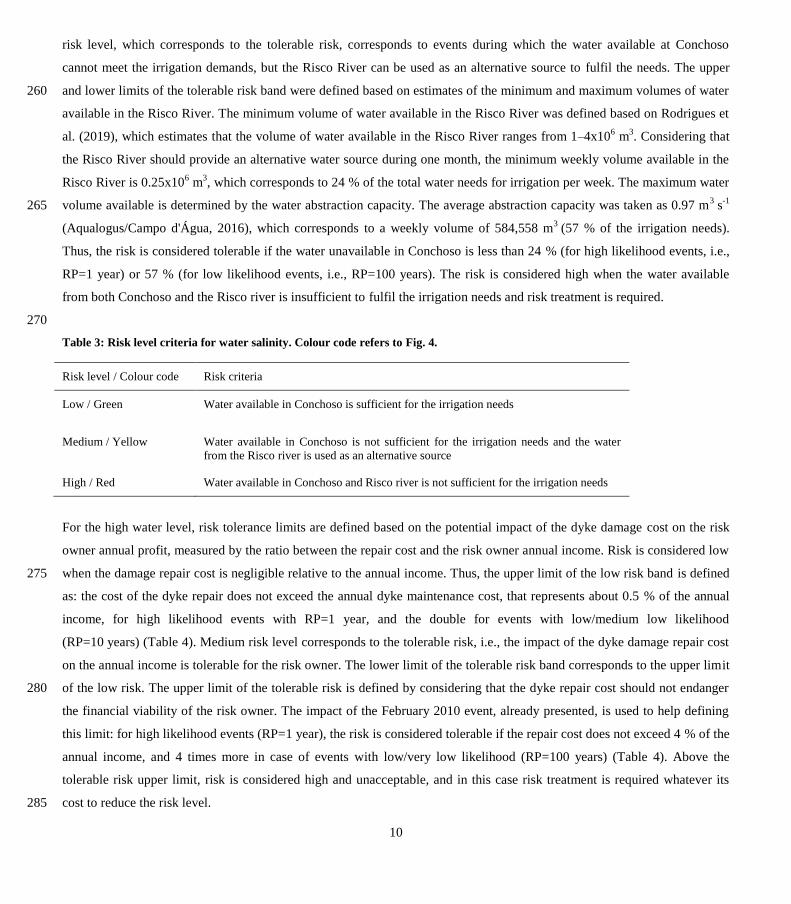
Table 3: Risk level criteria for water salinity. Colour code refers to Fig. 4.
Risk level / Colour code Risk criteria
Low / Green Water available in Conchoso is sufficient for the irrigation needs
Medium / Yellow Water available in Conchoso is not sufficient for the irrigation needs and the water
from the Risco river is used as an alternative source
High / Red Water available in Conchoso and Risco river is not sufficient for the irrigation needs
For the high water level, risk tolerance limits are defined based on the potential impact of the dyke damage cost on the risk
owner annual profit, measured by the ratio between the repair cost and the risk owner annual income. Risk is considered low
when the damage repair cost is negligible relative to the annual income. Thus, the upper limit of the low risk band is defined 275
as: the cost of the dyke repair does not exceed the annual dyke maintenance cost, that represents about 0.5 % of the annual
income, for high likelihood events with RP=1 year, and the double for events with low/medium low likelihood
(RP=10 years) (Table 4). Medium risk level corresponds to the tolerable risk, i.e., the impact of the dyke damage repair cost
on the annual income is tolerable for the risk owner. The lower limit of the tolerable risk band corresponds to the upper limit
of the low risk. The upper limit of the tolerable risk is defined by considering that the dyke repair cost should not endanger 280
the financial viability of the risk owner. The impact of the February 2010 event, already presented, is used to help defining
this limit: for high likelihood events (RP=1 year), the risk is considered tolerable if the repair cost does not exceed 4 % of the
annual income, and 4 times more in case of events with low/very low likelihood (RP=100 years) (Table 4). Above the
tolerable risk upper limit, risk is considered high and unacceptable, and in this case risk treatment is required whatever its
cost to reduce the risk level. 285
11
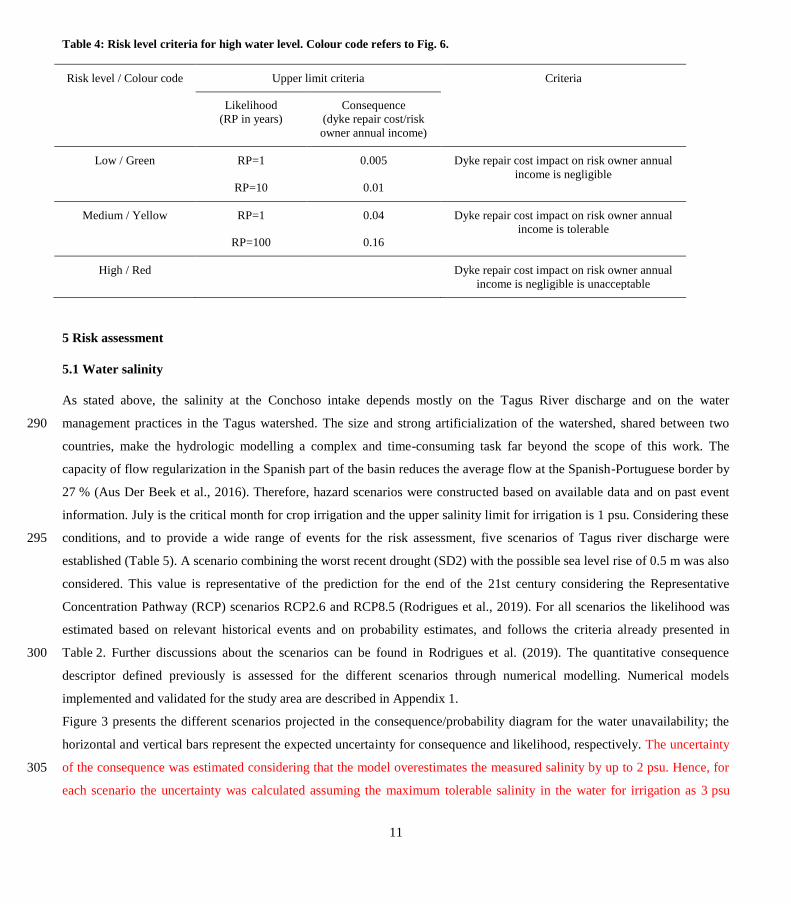
Table 4: Risk level criteria for high water level. Colour code refers to Fig. 6.
Risk level / Colour code Upper limit criteria Criteria
Likelihood
(RP in years)
Consequence
(dyke repair cost/risk
owner annual income)
Low / Green RP=1 0.005 Dyke repair cost impact on risk owner annual
income is negligible RP=10 0.01
Medium / Yellow RP=1 0.04 Dyke repair cost impact on risk owner annual
income is tolerable RP=100 0.16
High / Red Dyke repair cost impact on risk owner annual
income is negligible is unacceptable
5 Risk assessment
5.1 Water salinity
As stated above, the salinity at the Conchoso intake depends mostly on the Tagus River discharge and on the water
management practices in the Tagus watershed. The size and strong artificialization of the watershed, shared between two 290
countries, make the hydrologic modelling a complex and time-consuming task far beyond the scope of this work. The
capacity of flow regularization in the Spanish part of the basin reduces the average flow at the Spanish-Portuguese border by
27 % (Aus Der Beek et al., 2016). Therefore, hazard scenarios were constructed based on available data and on past event
information. July is the critical month for crop irrigation and the upper salinity limit for irrigation is 1 psu. Considering these
conditions, and to provide a wide range of events for the risk assessment, five scenarios of Tagus river discharge were 295
established (Table 5). A scenario combining the worst recent drought (SD2) with the possible sea level rise of 0.5 m was also
considered. This value is representative of the prediction for the end of the 21st century considering the Representative
Concentration Pathway (RCP) scenarios RCP2.6 and RCP8.5 (Rodrigues et al., 2019). For all scenarios the likelihood was
estimated based on relevant historical events and on probability estimates, and follows the criteria already presented in
Table 2. Further discussions about the scenarios can be found in Rodrigues et al. (2019). The quantitative consequence 300
descriptor defined previously is assessed for the different scenarios through numerical modelling. Numerical models
implemented and validated for the study area are described in Appendix 1.
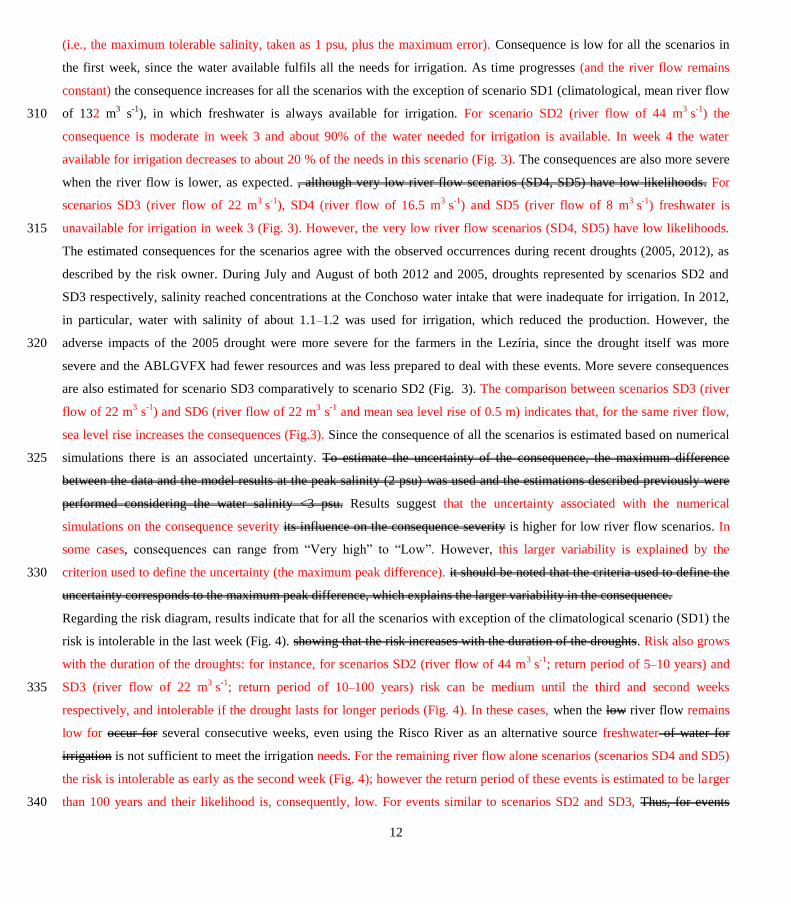
Figure 3 presents the different scenarios projected in the consequence/probability diagram for the water unavailability; the
horizontal and vertical bars represent the expected uncertainty for consequence and likelihood, respectively. The uncertainty
of the consequence was estimated considering that the model overestimates the measured salinity by up to 2 psu. Hence, for 305
each scenario the uncertainty was calculated assuming the maximum tolerable salinity in the water for irrigation as 3 psu
12
(i.e., the maximum tolerable salinity, taken as 1 psu, plus the maximum error). Consequence is low for all the scenarios in
the first week, since the water available fulfils all the needs for irrigation. As time progresses (and the river flow remains
constant) the consequence increases for all the scenarios with the exception of scenario SD1 (climatological, mean river flow
of 132 m3 s
-1), in which freshwater is always available for irrigation. For scenario SD2 (river flow of 44 m
3 s
-1) the 310
consequence is moderate in week 3 and about 90% of the water needed for irrigation is available. In week 4 the water
available for irrigation decreases to about 20 % of the needs in this scenario (Fig. 3). The consequences are also more severe
when the river flow is lower, as expected. , although very low river flow scenarios (SD4, SD5) have low likelihoods. For
scenarios SD3 (river flow of 22 m3 s
-1), SD4 (river flow of 16.5 m
3 s
-1) and SD5 (river flow of 8 m
3 s
-1) freshwater is
unavailable for irrigation in week 3 (Fig. 3). However, the very low river flow scenarios (SD4, SD5) have low likelihoods. 315
The estimated consequences for the scenarios agree with the observed occurrences during recent droughts (2005, 2012), as
described by the risk owner. During July and August of both 2012 and 2005, droughts represented by scenarios SD2 and
SD3 respectively, salinity reached concentrations at the Conchoso water intake that were inadequate for irrigation. In 2012,
in particular, water with salinity of about 1.1–1.2 was used for irrigation, which reduced the production. However, the
adverse impacts of the 2005 drought were more severe for the farmers in the Lezíria, since the drought itself was more 320
severe and the ABLGVFX had fewer resources and was less prepared to deal with these events. More severe consequences
are also estimated for scenario SD3 comparatively to scenario SD2 (Fig. 3). The comparison between scenarios SD3 (river
flow of 22 m3 s
-1) and SD6 (river flow of 22 m
3 s
-1 and mean sea level rise of 0.5 m) indicates that, for the same river flow,
sea level rise increases the consequences (Fig.3). Since the consequence of all the scenarios is estimated based on numerical
simulations there is an associated uncertainty. To estimate the uncertainty of the consequence, the maximum difference 325
between the data and the model results at the peak salinity (2 psu) was used and the estimations described previously were
performed considering the water salinity <3 psu. Results suggest that the uncertainty associated with the numerical
simulations on the consequence severity its influence on the consequence severity is higher for low river flow scenarios. In
some cases, consequences can range from “Very high” to “Low”. However, this larger variability is explained by the
criterion used to define the uncertainty (the maximum peak difference). it should be noted that the criteria used to define the 330
uncertainty corresponds to the maximum peak difference, which explains the larger variability in the consequence.
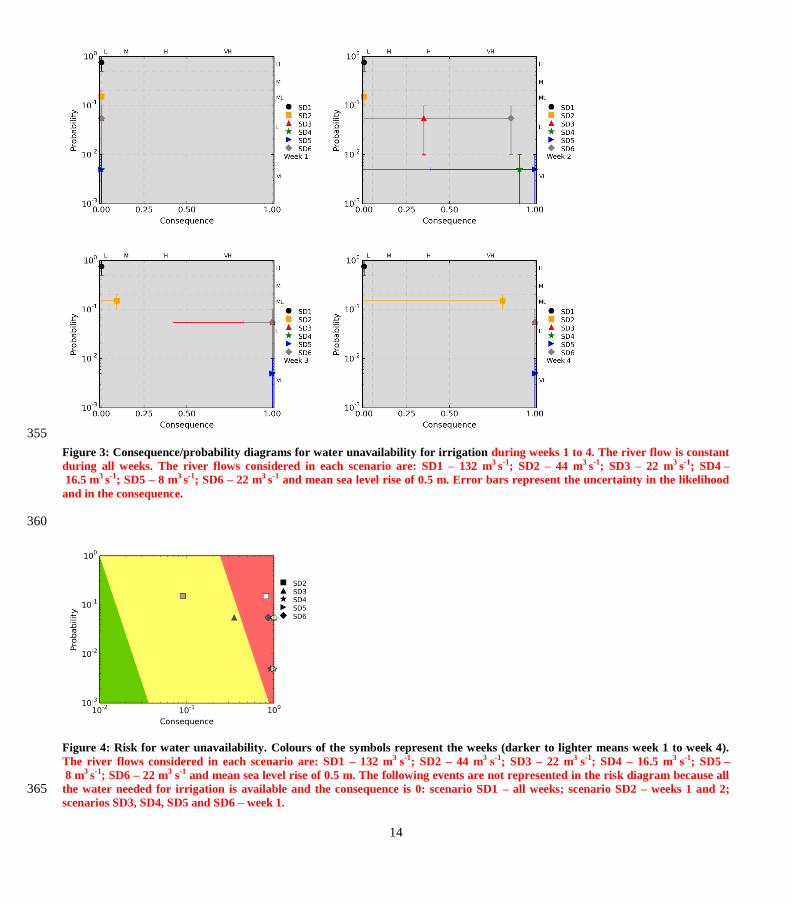
Regarding the risk diagram, results indicate that for all the scenarios with exception of the climatological scenario (SD1) the
risk is intolerable in the last week (Fig. 4). showing that the risk increases with the duration of the droughts. Risk also grows
with the duration of the droughts: for instance, for scenarios SD2 (river flow of 44 m3 s
-1; return period of 5–10 years) and
SD3 (river flow of 22 m3 s
-1; return period of 10–100 years) risk can be medium until the third and second weeks 335
respectively, and intolerable if the drought lasts for longer periods (Fig. 4). In these cases, when the low river flow remains
low for occur for several consecutive weeks, even using the Risco River as an alternative source freshwater of water for
irrigation is not sufficient to meet the irrigation needs. For the remaining river flow alone scenarios (scenarios SD4 and SD5)
the risk is intolerable as early as the second week (Fig. 4); however the return period of these events is estimated to be larger
than 100 years and their likelihood is, consequently, low. For events similar to scenarios SD2 and SD3, Thus, for events 340

13
similar to these scenarios, risk treatment is mandatory to reduce risk level and may include the use of alternative water
sources, the selection of alternative crops, the reduction of the irrigated area and/or investments regarding the construction of
water storage facilities. Mean sea level rise may constitute an additional source of risk (scenario SD6, Fig. 4) and should also
be taken into account in the establishment of risk management and climate change adaptation plans for this agricultural area.
345
Table 5: Scenarios for water salinity and corresponding likelihood considering the Tagus river flow (Q) and sea level rise (SLR)
conditions.
Scenario Q (m3/s)
SLR (m)
Description Likelihood
SD1 climatological
scenario
132
0
Mean daily discharge at the Almourol station (http://snirh.pt) between 1990 and
2017 during the month of July
Medium
SD2
recent drought
44
0
River flow representative of one of the recent droughts that occurred in 2012,
estimated based on data measured at Almourol (https://snirh.ambiente.pt)
Medium low
SD3
worst recent drought
22
0
River flow representative of one of the worst recent drought using data from
Matrena and Tramagal stations (https://snirh.ambiente.pt) during July 2005
Low
SD4
minimum river flow
16.5
0
Minimum mean weekly river flow that must be guaranteed between July 1st and
September 30th near the upstream boundary of the Tagus estuary (Muge) by the
revised Spanish-Portuguese Albufeira Convention and Additional Protocol
(Portuguese Parliament Resolution n. 62/2008, November 14)
Very low
SD5
worst case scenario
8
0
Minimum river flow that guarantees the operation of the main thermoelectric
power plant in the Tagus River (Pego power plant)
Very low
SD6
sea level rise
22
0.5
Combination of the worst recent drought with a sea level rise of 0.5 m Low
350
14
355
Figure 3: Consequence/probability diagrams for water unavailability for irrigation during weeks 1 to 4. The river flow is constant
during all weeks. The river flows considered in each scenario are: SD1 – 132 m3 s-1; SD2 – 44 m3 s-1; SD3 – 22 m3 s-1; SD4 –
16.5 m3 s-1; SD5 – 8 m3 s-1; SD6 – 22 m3 s-1 and mean sea level rise of 0.5 m. Error bars represent the uncertainty in the likelihood
and in the consequence.
360
Figure 4: Risk for water unavailability. Colours of the symbols represent the weeks (darker to lighter means week 1 to week 4).
The river flows considered in each scenario are: SD1 – 132 m3 s-1; SD2 – 44 m3 s-1; SD3 – 22 m3 s-1; SD4 – 16.5 m3 s-1; SD5 –
8 m3 s-1; SD6 – 22 m3 s-1 and mean sea level rise of 0.5 m. The following events are not represented in the risk diagram because all
the water needed for irrigation is available and the consequence is 0: scenario SD1 – all weeks; scenario SD2 – weeks 1 and 2; 365 scenarios SD3, SD4, SD5 and SD6 – week 1.

15
5.2 High water level
Estuarine high water levels are forced by spring tides and severe storm surges, which are associated with very low
atmospheric pressure conditions. Based on the past extreme events of 1941 and 2010, described in Sect. 3.2, that caused 370
overtopping of the Lezíria Grande dykes and inundation of agricultural lands, four scenarios of extreme water levels were
defined (Table 6). Extreme water level conditions of the scenarios result from the oceanographic and meteorological
conditions of the events. The same sea level rise scenario for the end of the century used for the salinity was considered here
(SF4), combined with the storm surge and tide conditions of the 1941 cyclone (SF2). The scenarios were assessed through
numerical models implemented and validated for the study area and that are described in Appendix 1. The model estimates 375
of the extent of dyke overflown entails uncertainties associated with several error sources. The tidal levels predicted by the
model have errors of the order of 15 cm in the upper estuary, while errors associated with the storm surge can reach about
10 cm (Fortunato et al., 2017). Topographic errors, in particular, in the dykes’ crest height, were taken as 10 cm. Taking the
overall error as the square root of the sum of the squares of the individual errors leads to a vertical uncertainty of 20 cm. To
determine the uncertainty in the estimate of the overflown dyke length, we considered that a difference of 50 cm in water 380
level between two simulations (scenarios S2 and S4 described below) leads to a discrepancy of 130 % in the overflown
extent of the dyke. Assuming a linear relationship between the horizontal and vertical dimensions, the uncertainty in the
estimate of the length of the dyke overflown is 50 %.
Table 6. Scenarios for maximum water levels considering different storm surge, tide and sea level rise (SLR) conditions. Wm is the 385 maximum water level at Cascais tide gauge and Q is the Tagus river flow.
Scenario Wm
(m, above CD)
Q (m3/s)
SLR (m)
Description Likelihood
SF1
storm Xynthia 2010 2.24
3917
0
Storm surge and tide conditions observed during
the Xynthia storm
Medium low
SF2
1941 cyclone 2.34
4517
0
Storm surge and tide conditions observed during
1941 cyclone
Low
SF3
1941 cyclone and spring
tide
2.54
4517
0
Storm surge conditions observed during 1941
cyclone and considering an equinoxial spring tide
Very low
SF4
1941 cyclone and sea
level rise
2.84
4517
0.5
Combination of the storm surge and tide conditions
of 1941 cyclone with a possible sea level rise for
the end of the century
Low

16
For all high water level scenarios, the area where the dyke is potentially affected is located in the southern half of the Lezíria
(Fig. 5). In scenario S1, about 1 km of dyke near the Lombo do Tejo island is affected. In the scenario SF2, the dyke is
affected in the same zone but the length doubles. When a spring tide is considered (scenario SF3) the length of the affected 390
dyke increases up to 4 km, extending the affected area to north of the Alhandra island and to the southern extreme of the
Lezíria. The length of the potentially affected dyke increases to 8 km if sea level rise is considered (SF4).
Figure 5: The Lezíria inundation areas for the hazard scenarios showing the locations where the dyke is potentially affected, and 395 affected dyke length (ESRI Basemap).
Figure 6 (a) presents the different scenarios projected in the consequence/probability diagram for the relative cost of dyke
damage (RCDD). Again, the expected uncertainty for both consequence and likelihood is represented by horizontal and
vertical bars. The consequence severity of the scenarios with low (SF1) and medium severity (SF2) is consistent with the 400
known impacts of the 1941 and 2010 events, which were much higher in 1941, as described in Sect. 3.2. Medium severity,
corresponding to a dyke repair cost of 1 to 10 % of the ABLGVFX annual income, can be reached for low likelihood
scenarios with RP between 10 and 100 years. The consequence severity is “high” (repair cost is up to 30 % of the
ABLGVFX annual income) for the very low likelihood scenario (scenario 3, RP>100 years). In this case, besides the 1941
storm surge conditions, an extreme tidal range is considered (equinoxial spring tide). Very high consequence severity, 405
expressed by the dyke repair cost over 30 % of the ABLGVFX, is reached if sea level rise is considered (SF4). Limitations
of the model can underpredict the severity level. The model was run with a fixed geometry, i.e., the bathymetry and
topography were assumed to remain unchanged during the simulations not considering dykes’ erodibility. In reality, events
of this type can erode and breach the dykes at several locations, as actually occurred in February 2010, increasing the
potential dyke length affected. Because the 1941 scenario is more energetic (in terms of wind speed, water currents and 410

17
waves), the breaching should also be more severe. Hence, the length affected during this scenario is probably more
underpredicted by the model than for the 2010 scenario. None of the scenarios considered has an associated low risk
(Fig. 6 (b)), i.e., the dyke is not overflown. This is explained as this risk is not associated with average oceanographic and
meteorological conditions. In all scenarios without sea level rise, the risk conditions are moderate (tolerable level), indicating
that risk has to be monitored regularly to decide if adaptation measures have to be taken to reduce the risk level. However, as 415
sea level rises, risk will become unacceptable. Hence, risk treatment will be required in the future to bring the risk down to
an acceptable level.
(a) (b)
420
Figure 6: Consequence/probability diagram for relative cost of dyke damage (a). Horizontal and vertical bars indicate the
uncertainty of the hazard in both consequences and likelihood, respectively. Risk diagram for water level relative cost of dyke
damage (b).
6 Discussion and conclusions 425
The risk assessment approach proposed in this study intended to integrate the hazard dimensions that most affect agricultural
areas located in estuarine margins. Highly dependent on water resources, agriculture is one of the economic sectors most
vulnerable to climate change effects (Aleksandrova et al., 2016). Its vulnerability is highest for agricultural areas located in
estuaries where changes in hydrological regimes and sea level rise can impact both salt water landward intrusion and low-
lying areas inundation (Kimmerer and Weaver, 2013). The main challenge of the approach developed herein was to find 430
suitable consequence descriptors of the two hazards that incorporate scientific-based data but can easily be applicable by the
risk owner and be updated in time. For this purpose, the difference in elements at risk, coverage and temporal scale of
impacts for the two hazards were considered in the definition of consequence descriptors for risk assessment.
For saltwater landward intrusion due to droughts, the water resources availability is the element at risk. The scarcity of
suitable water for irrigation has an economic impact for the risk owner, mainly due to crop losses resulting from lack of 435
18
water or/and salinization of land if salty water is used. Enabling risk owners with tools that anticipate the expected water
availability is thus essential to support decision making both before and during the agricultural campaign. An adaptive risk
assessment in a temporal scale of weeks during the most critical period for crop irrigation is suitable to help managing
freshwater scarcity.
For estuarine extreme water levels associated with tides and storm surges, the elements at risk are mainly the agricultural 440
land itself, and infrastructures such as dykes, support facilities, roads and access infrastructures. Damages in those assets and
ultimately the loss of agricultural land due to inundation have a direct economic impact for the risk owner. In agricultural
lands located in low-lying estuarine areas, dykes or other protection structures are often present to prevent frequent land
inundation during high spring tides. Using the relative cost of dyke damage as a consequence descriptor provides a direct
quantification of the hazard economic impact for the risk owner, and is easily estimated through information normally 445
available to the risk owner.
Due to the uncertainty of the factors that control both risks, a continuous consequence/probability diagram was found to be
the most adequate technique for risk level estimation and evaluation, as it integrates the uncertainty in the process. In
addition, this tool is suitable for communicating the risk in a simple way to the risk owner. The applicability of the
developed approach was explored through the application in the Lezíria Grande agricultural area, known to be affected by 450
those two hazards. Results show that concerning freshwater scarcity, the risk increases with the duration of the droughts and
when low river flows occur for several consecutive weeks, even using the Risco River as an alternative source of water for
irrigation is not sufficient to meet the water needs. The total dependence of irrigation on the Tagus and Sorraia fluvial
discharges, with other users upstream, suggests that previous knowledge of the water availability reserved in Spain and
Portugal and the consumption expected for the different sectors upstream is essential in assessing the risk of freshwater 455
unavailability for irrigation. Real-time knowledge of the upstream discharges, existing consumptions and possible runoff
from the rice crops, particularly those located along Sorraia River, will definitely contribute to decision-making regarding
the best periods for estuarine water intake.
Considering the estuarine inundation, the results presented above show that presently the risk in Lezíria Grande is moderate.
The hazard can be significant, but only for very extreme events with a high return period. However, sea level rise will 460
increase the risk. Hence, the risk owner should consider risk reduction measures, as they will become necessary in the future.
Furthermore, the sea level rise considered herein was based on the 5th IPCC assessment report (IPCC, 2014). Since that
report was published, several studies indicate that sea level may rise faster than anticipated (Shepherd et al., 2012; Khan et
al., 2014; Scambos and Shuman, 2016; Seo et al., 2015; Martín-Español et al., 2016; Kopp et al., 2017). Hence, the
possibility that the 0.5 m rise in sea level used in scenario SF4 is reached long before the end of the century should be 465
considered. Finally, the uncertainty in both the probability and the consequence are large. Further studies and data collection
should therefore be conducted to reduce these uncertainties. Examples include considering dyke breaching and simulating
the combined effect of river floods and storm surges (Zhang et al., 2020).
19
Differences in the temporal scales of both risks have an impact on the time horizon of risk assessment and consequently on
the selection of possible actions to be taken to reduce risk. Results highlight the differences between the hazard 470
consequences of the two risks for the risk owner, with different extent and impact level depending on the hazard severity.
The freshwater scarcity can have economic and even social consequences at other risk management levels, as farmers, agro-
industry and local communities, particularly if production is severely affected in quality and quality having impact in related
trade and services. Besides the economic impact for the risk owner, inundation can have consequences for farmers if the
agricultural land loss is high. Considering the context of the study area, a broader impact of the consequences in agro-475
industry and local communities can be considered negligible.
The risk assessment approach application in the study area raised some challenges. The definition of both consequence and
risk criteria have to be based on in situ knowledge and historical information. Even if the risk owner has most of the
information required, other relevant data are often dispersed in different institutions requiring their aggregation and a prior
informed-analysis. The definition of hazard scenarios is another important point to be considered when this approach is 480
applied. As stated before, hazard scenarios have to be anchored on past events information. Valuable information about
historical events can be found in a variety of sources, including databases where systematized data are suitable for
supporting risk assessment (Santos, et al., 2014). Several global and national disaster databases are available (e.g. EM-DAT,
2013; DISASTER database, Zêzere et al., 2014) but their resolution is inappropriate for local scale analyses. Regional and
local databases are scarcer (e.g. Rilo et al., 2017) but should be used and their development encouraged. The choice of 485
events for the scenarios definition should cover a wide range of consequences and probability, to provide a suitable risk
spectrum. Whenever possible scenarios construction should consider the main controlling factors of the hazard severity (e.g.
river discharge, maximum water level, and sea level rise). Monitoring information is crucial in supporting risk management.
Timely information will allow the updating of consequence and risk criteria, and hazard scenarios, and will support
mitigation and adaptation strategies definition. 490
As directed to support decision-making, the risk assessment approach presented here should be applied together with a risk
treatment plan (ISO, 2009). The plan will identify appropriate measures to be taken, in particular to reduce risk when the
level of risk approaches or exceeds an unacceptability threshold. For each specific site, this plan is built upon the knowledge
acquired and supported by monitoring and early warning systems. Risk control measures should be identified, evaluated and
accepted by stakeholders before being applied (Simonovic, 2012). Examples of control measures to cope with water salinity 495
and high water level risks are presented in Table 7. The responsibility for the decision-making and measures implementation
will depend on the risk level. Some measures can be implemented by the risk owner and local stakeholders (e.g. farmers);
others may require the involvement of decision-makers and authorities at the national level (e.g. water, agricultural,
environment and civil protection authorities). The risk level determines when each measure should be implemented. An
adaptive strategic approach (Mearns, 2010) will be adopted to better deal with uncertainty in the decision-making process. 500
Periodic monitoring and review of the risk assessment and treatment processes, including the communication and
consultation to all involved parts, will held. This approach will contribute to reduce the uncertainty of the process by

20
updating the risk criteria and risk control measures. The improvement of the knowledge about the system, based on more
data and better predictive tools, may also contribute to better characterise, quantify and reduce the uncertainty over time.
505
Table 7. Examples of risk control measures concerning water salinity and high water level risks.
Risk Measure Responsible for decision making /
implementation
When the implementation should take
place
Water salinity
Extract freshwater from
an alternative source
Risk owner / Risk owner and local
stakeholders
When the level of risk is tolerable but
rising
Reuse irrigation water Risk owner / Risk owner and local
stakeholders
When the level of risk is tolerable but
rising
Adapt crops (higher salt
tolerance, less water
demanding, shorter
growth period)
Risk owner / Risk owner and local
stakeholders When the level of risk is intolerable
Construct reservoir Risk owner and National authorities /
Risk owner and National authorities When the level of risk is intolerable
High water
level
Implement flood
monitoring and early
warning systems
Risk owner and National authorities /
Risk owner and National authorities Immediately, to support risk management
Raise dyke level Risk owner / Risk owner When the level of risk is tolerable but
rising
Reinforce dyke
Risk owner / Risk owner and
Environment and Agricultural
authorities
When the level of risk is tolerable but
rising
Transfer valuable goods
and infrastructures to
other areas
Risk owner / Risk owner When the level of risk is tolerable but
rising
Implement a water
retention basin along the
dyke
Risk owner and Environment and
Agricultural authorities / Risk owner
and Environment and Agricultural
authorities
When the level of risk is intolerable
Create new artificial
wetlands
Risk owner and Environment and
Agricultural authorities / Risk owner
and Environment and Agricultural
authorities
When the level of risk is intolerable
As main conclusions, this study presents a risk assessment approach that can be replicated in other agricultural estuarine
areas. The approach incorporates scientific-based knowledge of the hazard processes and is suitable to support

21
decision-making at a local level. The consequence descriptors considered can be adapted according to local specificities and 510
updated in time to reflect the evolution of hazard, exposure and vulnerability conditions. At first sight, the extent of the
information required to the approach application can be pointed out as a limiting factor. However, the complexity level in
both consequence evaluation and criteria definition can be adapted to the available information and tools. Complex
numerical models can be used, as in the application to Lezíria Grande presented herein, giving greater scientific robustness
to the results. In the absence of this possibility, consequence evaluation and criteria definition can rely on expert judgment 515
supported by past events information. Finally, the risk assessment approach showed to be appropriate to support the
discussion of potential mitigation and adaptation measures for risk level reduction, mainly when the possible impact of
climate change in risk levels is considered. As future work, the approach is foreseen to be applied to other estuarine
agricultural areas and the possible incorporation of further discussion from stakeholders.
520
Code and data availability. The model SCHISM is publicly available at https://github.com/schism-dev/schism.git. The
model input files and data are not provided due to the confidentiality of the data.
Author contribution. Conceptualization of the risk assessment approach: PF, MR and ABF, with contributions from AF.
AF obtained the local data and other information from the risk owner. Application to study area: MR implemented the 525
numerical model, performed the simulations and treated the results for water salinity; ABF implemented the numerical
model and performed the simulations for water levels, and PF treated the results for risk assessment. Discussion: all authors
contributed. Manuscript preparation: PF prepared the manuscript with contributions from all authors.
Competing interests. The authors declare that they have no conflict of interest.
Acknowledgements. This work was partially conducted in the scope of the BINGO European H2020 project. The authors 530
thank The Associação de Beneficiários da Lezíria Grande de Vila Franca de Xira (ABLGVFX) for providing data and
contributing for discussions about the results.
Financial support. This work was partially funded by the BINGO European H2020 project (grant no. 641739).
References
Ale, B., Burnap, P., and Slater, D.: On the origin of PCDS – (Probability consequence diagrams), Safety Sci., 72, 229–239, 535
https://doi.org/10.1016/j.ssci.2014.09.003, 2015.

22
Aleksandrova, M., Gain, A. K. and Giupponi, C.: Assessing agricultural systems vulnerability to climate change to inform
adaptation planning: an application in Khorezm, Uzbekistan, Mitig. Adapt. Strat. Gl., 21, 1263–1287,
https://doi.org/10.1007/s11027-015-9655-y, 2016.
André,C., Monfort, D., Bouzit, M. and Vinchon, C.: Contribution of insurance data to cost assessment of coastal flood 540
damage to residential buildings: insights gained from Johanna (2008) and Xynthia (2010) storm events, Nat. Hazard Earth
Sys., 13, 2003–2012, https://doi.org/10.5194/nhess-13-2003-2013, 2013.
APA: Plano de Gestão da Região Hidrográfica do Tejo, Relatório Técnico - Síntese, Agência Portuguesa do Ambiente,
Ministério da Agricultura, do Mar, do Ambiente e do Ordenamento do Território, Lisbon, Portugal, 294 pp., 2012.
Aqualogus/Campo d'Água: Projeto de Execução de Modernização dos Blocos V e VI do Aproveitamento Hidroagrícola da 545
Lezíria Grande de Vila Franca de Xira Nota, Técnica 2 Parte 1 - Rede de Rega Primária, 230 pp., 2016.
Aqualogus/Campo d'Água: Projeto de Execução de Modernização dos Blocos V e VI do Aproveitamento Hidroagrícola da
Lezíria Grande de Vila Franca de Xira, Volume II - Bombagem Auxiliar do Conchoso, Tomo 1 - Memória Descritiva e
Justificativa, 39 pp, 2016a.
AS/NZS: Risk management guidelines: companion to AS/NZS 4360:2004, HB 436:2004, Standards New Zealand, 550
https://www.saiglobal.com/PDFTemp/Previews/OSH/as/misc/handbook/HB436-2004(+A1).pdf, 116 pp., 2004.
Aus Der Beek, T., Alphen, H. J van., Alves, E., Bruggeman, A., Camera, C., Fohrmann, R., Fortunato, A., Freire, P.,
Lacovides, A., Lacovides, I., Kristvik, E., Lorza, P., Kübeck, C., Lorza, P., Muthanna, T., Novo, E., Rocha, F., Rodrigues,
M., Rodrigues, R., Russo, B., Sánchez, P., Scheibel, M., Spek, T., Witte, F. and Zoumides, C.: D3.1 - Characterization of the
catchments and the water systems, BINGO project report from WP3: Integrated analysis of the water cycle, European 555
Commission, Brussels, 98 pp., 2016.
Aven, T.: Risk assessment and risk management: Review of recent advances on their foundation, Eur. J. Oper. Res., 253 (1):
1–13, https://doi.org/10.1016/j.ejor.2015.12.023, 2016.
Bowles, D.S.: Alarp evaluation: using cost effectiveness and disproportionality to justify risk reduction. Proceedings of the
Australian Committee on Large Dams Risk Workshop, Launceston, Tasmania, Australia October 2003, 560
https://www.osh.org.il/UpLoadFiles/00_alarp_tolerable_risk_theory.pdf, 2003.
Burke, M. and Emerick, K.: Adaptation to Climate Change: Evidence from US Agriculture, Am. Econ. J-Econ. Polic., 8(3):
106–40, https://www.aeaweb.org/articles?id=10.1257/pol.20130025, 2016.
Calzadilla, A., Rehdanz, K., Betts, R., Falloon, P., Wiltshire, A. and Tol, R. S. J.: Climate change impacts on global
agriculture, Climatic Change, 120, 357–374, doi: https://doi.org/10.1007/s10584-013-0822-4, 2013 565
Chemweno, P., Pintelon, L., Muchiri, P. N. and Van Horenbeek, A.: Risk assessment methodologies in maintenance decision
making: A review of dependability modelling approaches, Reliab. Eng. Syst. Safe., 173, 64–77,
https://doi.org/10.1016/j.ress.2018.01.011, 2018.

23
Cirella, G., Semenzin, E., Critto, A. and Marcomini, A.: Natural Hazard Risk Assessment and Management Methodologies
Review: Europe. In: Linkov I. (eds) Sustainable Cities and Military Installations, Nato Sci. Peace Sec. C, 570
https://doi.org/10.1007/978-94-007-7161-1_16, 2014.
Cox, L. A.: What’s Wrong with Risk Matrices?, Risk Anal., 28 (2), 497–512, https://doi.org/10.1111/j.1539-
6924.2008.01030.x, 2008.
Duijm, N. J.: Recommendations on the use and design of risk matrices, Safety Sci., 76, 21–31,
https://doi.org/10.1016/j.ssci.2015.02.014, 2015. 575
EM-DAT: The International Disaster Database, Centre for Research on the Epidemiology of Disasters (CRED), Université
Catholique de Louvain, https://www.emdat.be/database (last access 14 December 2020), 2013.
European Environment Agency: Climate change adaptation in the agriculture sector in Europe, EEA Report 04/2019,
https://www.eea.europa.eu/publications/cc-adaptation-agriculture (last access 14 December 2020), 108 pp., 2019.
European Union: The Post-2020 Common Agricultural Policy: Environmental Benefits and Simplification, Agriculture and 580
Rural Development, https://ec.europa.eu/info/sites/info/files/food-farming-fisheries/key_policies/documents/cap-post-2020-
environ-benefits-simplification_en.pdf (last access: 14 December 2020,15 pp., 2019.
Fortunato, A. B., Oliveira, A and Baptista, A. M.: On the effect of tidal flats on the hydrodynamics of the Tagus estuary.
Oceanol. Acta, 22 (1), 31–44, https://doi.org/10.1016/S0399-1784(99)80030-9, 1999.
Fortunato, A. B., Freire, P., Bertin, X., Rodrigues, M., Ferreira, J. and Liberato, M. L.: A numerical study of the February 15, 585
1941 storm in the Tagus estuary, Cont. Shelf Res., 144, 50–64, https://doi.org/10.1016/j.csr.2017.06.023, 2017.
Freire, P., Tavares, A., Sá, L., Oliveira, A., Fortunato, A.B., Santos, P. P., Rilo, A., Gomes, J. L., Rogeiro, J., Pablo, R. and
Pinto, P. J.: A local scale approach to estuarine flood risk management, Nat. Hazards, 84, 1705–1739, doi:
http://dx.doi.org/10.1007/s11069-016-2510-y, 2016.
Freitas, J. G. and Dias, J. A.: 1941 windstorm effects on the Portuguese Coast. What lessons for the future?, J. Coastal Res., 590
SI 65, 714–719, https://doi.org/10.2112/SI65-121, 2013.
Gornall, J., Betts, R., Burke, E., Clark, R., Camp, J., Willett, K. and Wiltshire, A.: Implications of climate change for
agricultural productivity in the early twenty-first century, Philos. T. Roy. Soc. B, 365(1554), 2973–2989,
https://doi.org/10.1098/rstb.2010.0158, 2010.
Guerreiro, M., Fortunato, A. B., Freire, P., Rilo, A., Taborda, R., Freitas, M. C., Andrade, C., Silva, T., Rodrigues, M., 595
Bertin, X. and Azevedo, A.: Evolution of the hydrodynamics of the Tagus estuary (Portugal) in the 21st century, Journal of
Integrated Coastal Zone Management, 15, 65–80, https://www.aprh.pt/rgci/rgci515.html, 2015.
Henriques, A. G.: Reflexões sobre a monitorização dos recursos hídricos, a Convenção de Albufeira e o licenciamento de
descargas nas massas de água, a propósito do incidente de poluição do rio Tejo de janeiro de 2018, Journal of Water
Resources, 39, 9-17, https://www.aprh.pt/rh/pdf/v39n1_destaque-1.pdf, 2018. 600
HSE: Reducing Risks, Protecting People: HSE’s decision-making process. Risk Assessment Policy Unit, Health and Safety
Executive. HSE Books, Her Majesty’s Stationery Office, London, UK, 73 pp., 2001.
24
IPCC: Climate Change 2014: Impacts, Adaptation, and Vulnerability. Part A: Global and Sectoral Aspects. Contribution of
Working Group II to the Fifth Assessment Report of the Intergovernmental Panel on Climate Change, edited by: Field, C. B.,
Barros, V. R., Dokken, D. J., Mach, K. J., Mastrandrea, M. D., Bilir, T. E., Chatterjee, M., Ebi, K. L., Estrada, Y.O., Genova, 605
R. C., Girma, B., Kissel, E. S., Levy, A. N., MacCracken, S., Mastrandrea, P. R. and White, L. L., Cambridge University
Press, Cambridge, United Kingdom and New York, NY, USA, https://www.ipcc.ch/report/ar5/wg2/, 1132 pp., 2014.
IRM: The Risk Management Standard, the Institute of Risk Management, https://theirm.org/media/4709/arms_2002_irm.pdf,
14 pp., 2002.
ISO: ISO 31000: 2009 Risk Management - Principles and guidelines, International organization for standardization, Geneva, 610
Switzerland, 24 pp., 2009.
ISO: SO GUIDE 73: 2009 Risk Management – Vocabulary, International organization for standardization, Geneva,
Switzerland., 15 pp., 2009a.
ISO: ISO 31010: 2009 Risk Management - Risk assessment techniques. International organization for standardization,
Geneva, Switzerland, 90 pp., 2009b. 615
Khan, S., Kjær, K., Bevis, M., Bamber, J. L., Wahr, J., Kjeldsen, K. K., Bjørk, A. A., Korsgaard, N. J.,Stearns, L. A., van
den Broeke, M. R., Liu, L., Larsen, N. K. and Muresan, J. S.: Sustained mass loss of the northeast Greenland ice sheet
triggered by regional warming, Nat. Clim. Change, 4, 292–299, doi: https://doi.org/10.1038/nclimate2161, 2014.
Kopp, R. E., Deconto, R. M., Bader, D. A., Hay, C. C., Horton, R. M., Kulp, S., Oppenheimer, M., Pollard, D. and Strauss,
B. H.: Evolving understanding of Antarctic ice-sheet physics and ambiguity in probabilistic sea-level projections. Earth’s 620
Future, 5, 1217–1233, https://doi.org/10.1002/2017EF000663, 2017.
Kovats, R. S., R. Valentini, L. M. Bouwer, E. Georgopoulou, D. Jacob, E. Martin, M. Rounsevell, and J.-F. Soussana:
Europe. Climate Change 2014: Impacts, Adaptation, and Vulnerability. Part B: Regional Aspects. Contribution of Working
Group II to the Fifth Assessment Report of the Intergovernmental Panel on Climate Change, edited by: Barros, V. R., Field,
C. B., Dokken, D. J., Mastrandrea, M. D., Mach, K. J., Bilir, T. E., Chatterjee, M., Ebi, K. L., Estrada, Y. O., Genova, R. C., 625
Girma, B., Kissel, E. S., Levy, A. N., MacCracken, S., Mastrandrea, P. R. and White L. L., Cambridge University Press,
Cambridge, United Kingdom and New York, NY, USA, https://archive.ipcc.ch/pdf/assessment-report/ar5/wg2/WGIIAR5-
Chap23_FINAL.pdf, 1267–1326, 2014.
Kimmerer, W. and Weaver, M. J.: Vulnerability of Estuaries to Climate Change. Climate Vulnerability: Understanding and
Addressing Threats to Essential Resources, 4, 271–292, https://doi.org/10.1016/B978-0-12-384703-4.00438-X., 2013. 630
Loureiro, J. M.: Rio Tejo. As grandes cheias 1800 – 2007, Tágides, ARH Tejo, I.P.,
https://apambiente.pt/_zdata/Divulgacao/Publicacoes/Tagides/TAGIDES_01.pdf, 79 pp., 2009
Madaleno, I. M.: Companhia das Lezírias – o passado e o presente, Hispania nova. Revista de História Contemporânea, 6,
http://hispanianova.rediris.es/6/HISPANIANOVA-2006.pdf, 2006.
Marszal, E.M.: Tolerable risk guidelines, ISA T, 40, 391–399, https://doi.org/10.1016/S0019-0578(01)00011-8, 2001. 635

25
Martín-Español, A., Zammit-Mangion, A., Clarke, P. J., Flament, T., Helm, V., King, M. A., Luthcke, S. B., Petrie, E.,
Rémy, F., Schön, N., Wouters, B.: Spatial and temporal Antarctic Ice Sheet mass trends, glacio-isostatic adjustment, and
surface processes from a joint inversion of satellite altimeter, gravity, and GPS data, J. Geophys. Res-Earth, 121(2), 182–
200, https://doi.org/10.1002/2015JF003550, 2016.
Marhavilas, P. K., Koulouriotis, D., Gemeni, V.: Risk analysis and assessment methodologies in the work sites: On a review, 640
classification and comparative study of the scientific literature of the period 2000 - 2009, J. Loss Prevent. Proc., 24, 477–
523, https://doi.org/10.1016/j.jlp.2011.03.004., 2011.
Mearns, L. O: The drama of uncertainty. Clim. Change, 100,77–85, DOI 10.1007/s10584-010-9841-6, 2010.
Muir-Wood, R.: The 1941 February 15th Windstorm in the Iberian Peninsula. Trébol, 56, 4–13,
https://www.researchgate.net/publication/265573064_The_1941_February_15_th_Windstorm_in_the_Iberian_Peninsula, 645
2011.
Neves, F. S.: Dynamics and hydrology of the Tagus estuary: results from in situ observations. PhD Thesis, Universidade de
Lisboa, Portugal, file:///C:/Users/pfreire/AppData/Local/Temp/ULSD059240_TD_tese.pdf, 2010 pp., 2010.
Plate, E. J.: Flood risk and flood management, J. Hydrol., 267 (1–2), 2–11, doi: https://doi.org/10.1016/S0022-
1694(02)00135-X, 2002. 650
Rebelo, L., Ramos, A., Pereira, S. and Trigo, R.: Meteorological Driving Mechanisms and Human Impacts of the February
1979 Extreme Hydro-Geomorphological Event in Western Iberia, Water-Sui., 10, 454, doi: https://www.mdpi.com/2073-
4441/10/4/454, 2018.
Rilo, A., Tavares, A., Freire, P., Santos, P. P., and Zêzere, J. L.: The contribution of historical information to flood risk
management in the Tagus estuary, Int. J. Disast. Risk Re., 25, 22–35, doi: https://doi.org/10.1016/j.ijdrr.2017.07.008, 2017. 655
Rocha, R., Bruggeman, A., Freitas, A., Luís, A. M., Fortunato, A. B., Martins, B., Russo, B., Strehl, C., Zoumides, C.,
Sunyer, D., Martínez, E., Giannakis, E., Novo, E., Kristvik, E., Vollmer, F., van Alphe, H-J, Koti, J., Locatelli, L., Scheibel,
M., van Huijgevoort, Rodrigues, M., Freire, P., Lorza, P., Brito, P., Rodrigues, R., Spek, T., Muthann, T.: D 4.3 Risk
Analysis - Likelihood and consequences of each extreme weather event at the six research sites, BINGO project report from
WP4: Assessment of Impacts of extreme weather events, European Commission, Brussels, 142 pp., 2018 660
Rodrigues, A. C., Diogo, P. and Colaço, P.: ADAPTACLIMA – EPAL. Tarefa 5. Intrusão salina no troço final do rio tejo
face a cenários de alterações climáticas. Relatório Final. DCEA/FCT/UNL, 69 pp, 2012.
Rodrigues, M., Freire, P., Fortunato, A.B. and Alves, E.: Characterization of the Hydro-Agricultural Development of the
Lezíria Grande de Vila Franca de Xira and of the Mouchão de Alhandra. Report 169/2016 – DHA/NEC, LNEC, 26 pp.,
2016. 665
Rodrigues, M. and Fortunato, A. B.: Assessment of a three-dimensional baroclinic circulation model of the Tagus estuary,
AIMS Environmental Science, 4(6), 763–787, https://doi.org/10.3934/environsci.2017.6.763, 2017.
Rodrigues, M., Fortunato, A. B. and Freire, P.: Saltwater Intrusion in the Upper Tagus Estuary during Droughts.
Geosciences, 9, 400, https://doi.org/10.3390/geosciences9090400, 2019.

26
Roland, A., Zhang, Y.J., Wang, H.V., Meng, Y., Teng, Y.-C., Maderich, V., Brovchenko, I., Dutour-Sikiric, M. and Zanke, 670
U.: A fully coupled 3D wave-current interaction model on unstructured grids, J. Geophys. Res. 117, C00J33,
https://doi.org/10.1029/2012JC007952, 2012.
Santos, P. P., Tavares, A. O., Zêzere, J. L.: Risk analysis for local management from hydro-geomorphologic disaster
databases, Environ. Sci. Policy, 40, 85–100, https://doi.org/10.1016/j.envsci.2013.12.007, 2014.
Scambos, T. and Shuman, C.: Comment on ‘Mass gains of the Antarctic ice sheet exceed losses’ by HJ Zwally and others, J. 675
Glaciol., 62(233), 599–603, https://doi.org/10.1017/jog.2016.59, 2016.
Seo, K.‐ W., Wilson, C. R., Scambos, T., Kim, B.‐ M., Waliser, D. E., Tian, B., Kim, B.‐ H., and Eom, J.: Surface mass
balance contributions to acceleration of Antarctic ice mass loss during 2003–2013. J. Geophys. Res-Sol. EA, 120, 3617–
3627, https://doi.org/10.1002/2014JB011755, 2015.
Shepherd, A., Ivins, E. R., Geruo, A., Barletta, V. R., Bentley, M. J., Bettadpur, S. and Briggs, K. H.: A reconciled estimate 680
of ice-sheet mass balance, Science, 338, 1183–1189, https://doi.org/10.1126/science.1228102, 2012.
Simonovic, S.: Floods in a changing climate: Risk management, Cambridge University Press, 2012.
Sun, R., Gao, G., Gong, Z. and Wu, J.: A review of risk analysis methods for natural disasters, Nat. Hazards, 100, 571–593,
https://doi.org/10.1007/s11069-019-03826-7, 2020.
Tavares, A. O., Santos, P. P., Freire, P., Fortunato, A.B., Rilo, A. and Sá, L.: Flooding hazard in the Tagus estuarine area: 685
The challenge of scale in vulnerability assessments, Environ. Sci. Policy, 51(1), 238–255,
https://doi.org/10.1016/j.envsci.2015.04.010, 2015.
Thornton, P., Dinesh, D., Cramer, L., Loboguerrero, A. M. and Campbell, B.: Agriculture in a changing climate: Keeping
our cool in the face of the hothouse, Outlook Agr., 47(4), 283–290, https://doi.org/10.1177/0030727018815332, 2018.
UNISDR: National Disaster Risk Assessment. Governance System, Methodologies, and Use of Results. Words into Action 690
Guidelines, https://www.preventionweb.net/files/52828_nationaldisasterriskassessmentpart1.pdf , 100 pp., 2017.
Vargas, C. I. C., Oliveira F. S. B. F., Oliveira, A. and Charneca, N.: Análise da vulnerabilidade de uma praia estuarina à
inundação: aplicação à restinga do Alfeite (estuário do Tejo), Journal of Integrated Coastal Zone Management, 8(1), 25–43,
https://www.aprh.pt/rgci/rgci26.html, 2008.
Wong, P. P., Losada, I. J., Gattuso, J.-P., Hinkel, J., Khattabi, A., McInnes, K. L., Saito, Y. and Sallenger, A.: Coastal 695
systems and low-lying areas. Climate Change 2014: Impacts, Adaptation, and Vulnerability. Part A: Global and Sectoral
Aspects. Contribution of Working Group II to the Fifth Assessment Report of the Intergovernmental Panel on Climate
Change, edited by: Field, C.B., Barros, V. R., Dokken, D. J., Mach, K. J., Mastrandrea, M. D., Bilir, T. E., Chatterjee, M.,
Ebi, K.L., Estrada, Y. O., Genova, R. C., Girma, B., Kissel, E. S., Levy, A.N., MacCracken, S., Mastrandrea, P. R. and
White, L.L. , Cambridge University Press, Cambridge, United Kingdom and New York, NY, USA, 700
https://www.ipcc.ch/site/assets/uploads/2018/02/WGIIAR5-Chap5_FINAL.pdf, 361–409, 2014.
Woodruff, J. M.: Consequence and likelihood in risk estimation: A matter of balance in UK health and safety risk assessment
practice. Safety Sci., 43, 345–353, https://doi.org/10.1016/j.ssci.2005.07.003, 2005.
27
Zêzere, J. L., Pereira, S., Tavares, A. O., Bateira, C., Trigo, R. M., Quaresma, I., Santos, P. P., Santos, M. and Verde, J.:
DISASTER: a GIS database on hydro-geomorphologic disasters in Portugal, Nat. Hazards, 72, 503–532, 705
https://doi.org/10.1007/s11069-013-1018-y, 2014.
Zhang, Y. J., Ye, F., Stanev, E. V. and Grashorn, S.: Seamless cross-scale modeling with SCHISM, Ocean Model. 102, 64–
81, https://doi.org/10.1016/j.ocemod.2016.05.002, 2016.
Zhang, Y., Ye, F., Yu, H., Sun, W., Moghimi, S., Myers, E. P., Nunez, K., Zhang, R., Wang, H. V., Roland, A., Du, J. , and
Liu, Z.: Simulating compound flooding events in a hurricane, Ocean Dynam., 70, 621–640, https://doi.org/10.1007/s10236-710
020-01351-x, 2020.
APPENDIX A:
The shallow water model SCHISM (Zhang et al., 2016), including its wave module WWM (Roland et al al. 2012), was
implemented, calibrated and validated in the Tagus estuary in 2D depth-averaged mode to simulate inundation. At the ocean 715
boundary, the model was forced by tides, surges, and waves taken from regional models. River flows at the upstream
boundaries (Tagus and Sorraia) were estimated from data. At the surface, the model is forced by atmospheric pressure and
winds originating from reanalyses. The grid resolution varies between 2 and 800 m. Extensive comparisons with field data
showed the model’s excellent accuracy, with elevation errors on the order of 10 cm (Fortunato et al., 2017). This accuracy
was considered adequate to analyse inundation of the margins under extreme events. To simulate salinity intrusion the 720
system of models SCHISM was also used, but was implemented in 3D baroclinic mode. The numerical model is forced by
tides at the oceanic boundary, river flows at the riverine boundaries (Tagus and Sorraia) and atmospheric data at the surface.
The model was previously calibrated and extensively validated in the Tagus estuary against field data (Rodrigues and
Fortunato, 2017; Rodrigues et al., 2019). Results showed its ability to represent the circulation and salinity patterns. At Vila
Franca de Xira (the station located farther upstream and nearest to Conchoso), in particular, salinity errors were about 2 psu 725
(Rodrigues and Fortunato, 2017). At Conchoso, the Root Mean Square Error and the Mean Absolute Error were 0.4 psu and
0.3 psu, respectively; the model tends to overestimate the data. The maximum difference between the data and the model
results at the peak salinity was about 2 psu (Rodrigues et al., 2019). A detailed description of the model implementation and
validation can be found in Rodrigues and Fortunato (2017) and Rodrigues et al. (2019).
730
Copyright © 2022 FDOKUMEN