Multiband Versus Multispectral Supervised Classification of Architectural Images

Flood Detection of Tsunami Affected Areas Using Multispectral Images
Siti Yuhaniz
Surrey Space Centre University of Surrey, GU2 7XH UK
Tanya Vladimirova Surrey Space Centre
University of Surrey, GU2 7XH UK [email protected]
Martin N. Sweeting Surrey Space Centre
University of Surrey, GU2 7XH UK [email protected]
Abstract: The Disaster Monitoring Constellation (DMC) is a constellation of Earth observing small satellites developed by the Surrey Satellite Technology Limited (SSTL) and jointly owned by several countries. The DMC offers a novel approach to disaster monitoring by providing daily coverage of any place of the Earth using medium spatial resolution multispectral images. The DMC satellites carry multispectral imagers that have three bands, which are similar to the bands of the Landsat imagers. This paper presents a study on flood detection methods using images captured by the DMC satellites of the Southeast Asia Tsunami disaster that happened last year. The research is aimed at automating the flood detection process and finding the most optimal method, in term of accuracy and computing resources used, so that it is suitable for implementation on-board small satellites. The potential use of DMC images for detecting flooding areas is tested. The NDVI differencing and Near-infrared band differencing and four conventional classification methods (parallelepiped, maximum likelihood, minimum distance and mahalanobis distance) are investigated for their suitability to detect flooding areas. The efficiency of the investigated flood detection methods is compared based on DMC multispectral data of Tsunami affected areas and reference pre-flooding images from Landsat. Testing results illustrating their accuracy as well as the performance and required resources of the on-board computer systems are presented. Keywords: Flood detection, change detection, on-board processing 1. Introduction
The Disaster Monitoring Constellation (DMC) is a constellation of Earth observing small satellites developed by the Surrey Satellite Technology Limited (SSTL) and jointly owned by several countries. It has been operated since 2003 with the launch of AlSAT-1, the first of the micro-satellites in the DMC. Until now, the DMC satellites have captured images of several disaster areas including the 2004 Tsunami in South East Asia. Fig. 1 shows the UKDMC satellite, which is the UK-owned DMC satellites, before it was shipped for launch.
Figure 1: The UKDMC Satellite
The main payload of the DMC satellites is a multispectral imager that is similar to Landsat TM spectral and spatial resolution in Near-Infrared (0.76 µm to 0.9 µm), Red (0.63 µm to 0.69 µm), and Green (0.52 µm to 0.62 µm) bands. The

DMC imagers are capable of scanning an area with 660km wide swath and able to revisit daily. This feature is a big advantage and compares favourably with Landsat that has 16 days revisit or IKONOS with 26 days (nadir imaging). The need of quick response for disaster management is important. NOAA-AVHRR data are very high in temporal resolution (6 hours), however, they provide a coarse spatial resolution (1.1 km). DMC satellites provide medium spatial resolution (32m) and a daily revisit.
We are investigating the possibility of implementing an intelligent system on-board small satellite so that the satellite can make decision before the data are transmitted to the ground stations. It is planned that the intelligent system can detect changes between two observation times and make decisions based on the information of the changes. In order to do that, we are developing a prototype system, Automatic Change Detection System (ACDS) as shown in Fig. 2.
On-board automatic change detection system (ACDS) is proposed to facilitate flood-monitoring process. By implementing this process on-board, it is projected that only relevant information is transmitted to the ground station, thus is saving the bandwidth transmission. Also, it might help to forecast the next flooding event by monitoring a high-risk area to flood, integrated with other data such as meteorological data. Further more, it can help to achieve faster response as the images are processed before being sent to the ground station.
This system will provide capability for detecting temporal changes in newly captured images based on comparison with reference images, which will be retrieved from an on-board database. Such a capability is extremely useful for disaster monitoring and warning applications. Normally it is the high ratio image compression capability that can serve the purpose of increasing the transmission bandwidth. The availability of an automatic change detection system on-board a satellite can also help in that as only the change images can be sent to ground instead of the whole images. Other possible advantage of having change detection on-board is using the changed/unchanged information in conjunction with the image scheduling system. This can allow the satellite to dynamically reschedule the scanning of an area if the recently captured image has been recognised as changed and represents an area of interest.
NoYes
No
Image Tiling
Database
New image from imagers
Base image
Pre-Processing
Change/Unchanged image tiles
Weather data
Detect Flood?
Detect Changes?
Yes
Flood Detection
Change Detection
Flood detected
image tiles
Image Compression
Transmission
Start
End
Stamp GPS
Figure 2: Flow chart of the on-board automatic change detection system (ACDS)
This paper focuses on the comparison of flood detection methods, which is one of the processing blocks in ACDS. It is
important to choose the most optimal method for on-board implementation, in term of accuracy, processing time and memory consumed by each method. The comparison work was performed on the DMC and Landsat images on several areas that were affected by the 2004 Tsunami. The paper is organised as follows. Section 2 explains the test imagery. Section 3 reviews flood detection methods that are used and compared in here. Section 4 details the experimental work of the flood detection and lastly is the conclusion.

2.Test Imagery Coastal areas of north Sumatra and west Thailand were hit by huge tidal waves or Tsunami on 26 December 2004.
Some areas were inundated for a couple of hours, while others for a few days, and some areas even lost to the sea. DMC satellites acquired the images of these areas as depicted in Table 1. The before flooding images used by this research are taken from Landsat images.
The first data set, Indonesia, is 1500x2500 pixels; meanwhile the Thailand data set is 1500x1500 pixels. For easier processing of the huge image size, the images were split into 500x500 pixels image size before going to flood detection process. The images were almost cloud free. Fig. 3 and Fig. 4 show pairs of test images tiles for Indonesia. Fig. 5 shows the test images for west Thailand.
Table 1: Test data information
Before Flood After Flood Place Name Date Acquired Image Source Date Acquired Image Source North Sumatra, Indonesia 15 August 2001 Landsat7 ETM+ 4 January 2005 UKDMC West Thailand 15 January 2002 Landsat7 ETM+ 27 December 2004 UKDMC
Figure 3: North Sumatra before the Tsunami. The image on the left hand side is the tile in the bottom left corner of the image on the right

Figure 4: North Sumatra after the Tsunami. The image on the left hand side is the tile in the bottom left corner of the image on the right
Figure 5: West Thailand before (left) and after (right) Tsunami
3.Flood Detection Methods
SAR images have always been the choice as the main source of data to detect flood because of their capability to penetrate clouds. However, optical images should not be neglected as optical Earth Observation satellites are relatively cheaper and have more revisit capability than SAR satellites. For flood detection methods using multispectral images, it is essential to identify water in before and after flooding images. There are several water body detection model based on NOAA-AVHRR images as described by Sheng [1]. From the models, it can be seen that Near Infrared and red band are the most useful in detecting water.
In this paper, two flood detection methods that were described in [2] and four classification methods are performed and compared to each other in term of their accuracy and computing performances.
NIR Differencing. This method subtracts a Near Infrared band of after and flooding image, as water in this band has very low reflectance compared to other land cover types. However, this method is very sensitive to factors such as atmospheric condition and sun illumination, thus leads to difficulty in setting the thresholds that separates water and non-water areas.
NIRA - NIRB ≤ TC , (1)

where NIRA is the image of after flooding in Near Infrared band and NIRB is the before flooding image in Near Infrared. TC is the threshold that separates the flooding and non-flooding pixels. TC is selected interactively by looking at the NIRA - NIRB histogram. In this work, TC is equal to 50.
NDVI Differencing. Water is detected based on the Normalised Difference Vegetation Index (NDVI). This method has
the advantage over NIR differencing of stability to differences of atmospheric condition, reflection of sun and water turbidity [2]. NDVI is calculated as:
NDVI = (NIR band – Red band) / (NIR band + Red band). (2)
The water and non-water pixels are separated by thresholding the NDVI of after and before images:
NDVIA - NDVIB ≤ TC and NDVIA ≤ TW , (3)
where NDVIA is the NDVI for after flooding images and NDVIB is the NDVI for before flooding images. TC is the threshold that detect the decrease of NDVI by flood and TW to exclude non-water surfaces after flood. In this work, TC is set to 0.5 and TW to 0.8.
The other four methods tested for detection are post-classification comparison, where images of before and after
flooding are individually classified using four methods to detect water and non-water areas. Then the two images are compared based on the classification results. The region of interest was selected by running Sheng [1] model of water detection:
Water, if NIR/Red ≤ T0, Land, if NIR/Red >T0. (4)
T0 is located between the two peaks in the histogram of the ratio of Near Infrared (NIR) and Red band images.
The four classification methods are Parallelepiped, Maximum Likelihood, Minimum Distance and Mahalanobis Distance [3]. Parallelepiped classification is the simplest form of classification method. The classified pixels are describes in a multidimensional box or parallelepiped, where the upper and lower significant on the histograms describes the range of the parallelepiped. Parallelepiped classification is always used when the speed is needed.
Maximum likelihood or Bayes classification is one of the most common supervised classification method used with remote sensing image data. The decision rule used in maximum likelihood classification, the gi(x) or discriminant function is referred to:
gi(x) = ln p(x|wi) + ln p(wi), (5)
where ln is natural logarithm, p(x|wi) is the probability distribution of class wi to find x and p(wi) is the probability of class wi. x is belongs to class wi if :
x∈ wi if gi(x) > gj(x) for all j≠i (6) The discriminant function for minimum distance classifier is described as:
d(x,mi)2 = (x-mi)t(x-mi), (7) and the discriminant function for mahalanobis distance classifier is described as:
d(x,mi)2 = (x-mi)tC-1(x-mi). (8) where x is the position of the pixel to be classified, m is the mean of the classes and C is the covariance matrix of the classes. x is belongs to class wi if :
x∈ wi if d(x,mi)2 > d(x,mj)2 for all j≠i (9)
4.Experimental Works for Flood Detection Pre-Processing
It is anticipated that the flood detection process would perform robustly without radiometric calibration in on-board implementation. So, the pre-processing involved here is only the co-registration between before and after images. The before and after images were registered by selecting several control points and mapped them to rigid-body projection.

After that, the images were split into small image tiles (500x500 pixels) before going to flood detection process. Several registration methods were compared and the results are discussed in [4]. Accuracy Comparison
We used three types of error measurement to test the accuracy of each method as shown in Table 2. Omission error is the percentage of flooding pixels that are detected as non-flooding pixels. Meanwhile, commission error is the percentage of non-flooding pixels that are detected as flooding pixels. Overall accuracy is calculated by counting all the pixels that have been classified correctly and divided by the total number of pixels. The ground truth images were created by manual inspection on the before and after images and also by referring to inundation map created by Dartmouth Flood Observatory [5].
The after flooding images were acquired a few days after the Tsunami was happened, thus, some areas which were flooded during the Tsunami have receded and did not show up in the images. This can be seen especially in west coast of Thailand where the flooding was minimal and only happened for a few hours after the Tsunami struck. So, the ground truth of Thailand data sets does not contain any flooded areas.
For Indonesia data sets, the devastated areas can be clearly seen even from the after flooding images. The main problem while making the ground truth for Indonesia data sets is recognising the places that are still flooding at the time of the images were acquired. To solve this problem, a water detection model by Sheng [1] was performed on the after flooding image and was used as the base for generating the ground truth image. Fig. 6 shows the water-detected image of Sumatra in where the black areas are water. Fig. 7 shows the ground truth for Sumatra.
Figure 7: The ground truth for North Sumatra, Indonesia
Figure 6: Water detection on after-flooding image of North Sumatra
Table 2: Accuracy comparison of flood detection methods for North Sumatra, Indonesia
Method Commission Error (%)
Omission Error (%)
Overall Accuracy (%)
NIR Differencing 52 3 90 NDVI Differencing 52 43 90 Parallelepiped 43 59 92 Maximum Likelihood 47 62 91 Minimum Distance 89 64 68 Mahalanobis Distance 64 85 89
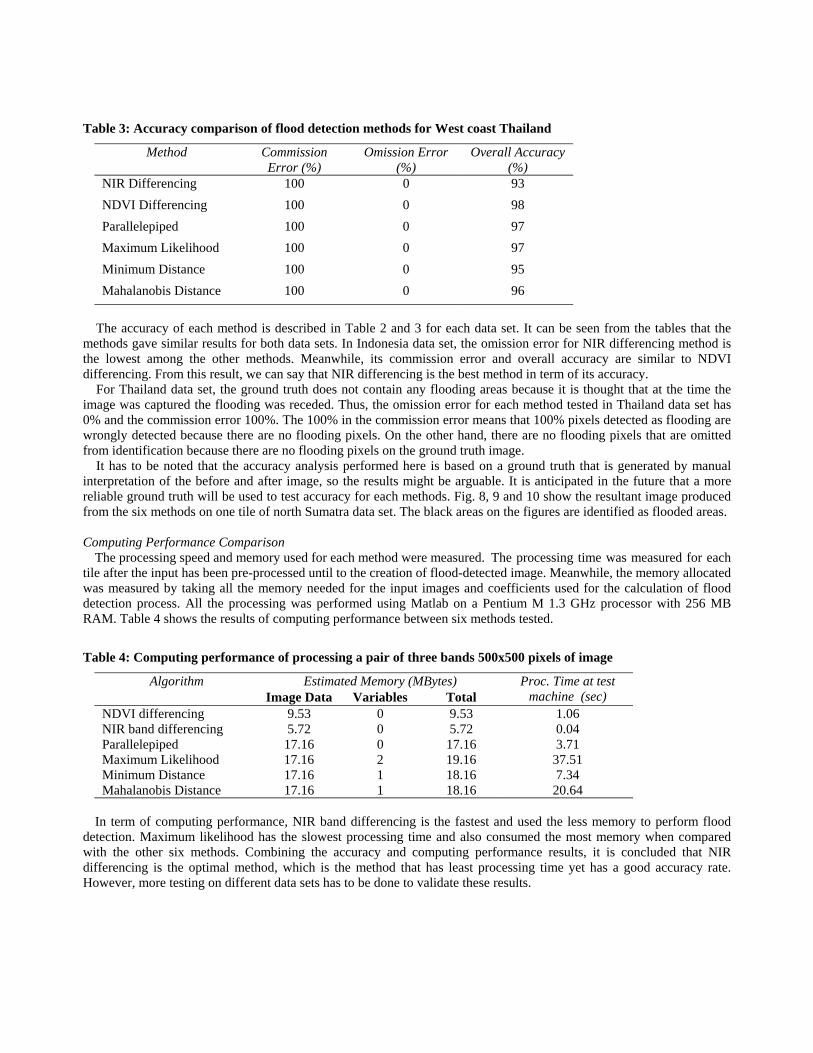
Table 3: Accuracy comparison of flood detection methods for West coast Thailand
Method Commission Error (%)
Omission Error (%)
Overall Accuracy (%)
NIR Differencing 100 0 93 NDVI Differencing 100 0 98 Parallelepiped 100 0 97 Maximum Likelihood 100 0 97 Minimum Distance 100 0 95 Mahalanobis Distance 100 0 96
The accuracy of each method is described in Table 2 and 3 for each data set. It can be seen from the tables that the
methods gave similar results for both data sets. In Indonesia data set, the omission error for NIR differencing method is the lowest among the other methods. Meanwhile, its commission error and overall accuracy are similar to NDVI differencing. From this result, we can say that NIR differencing is the best method in term of its accuracy.
For Thailand data set, the ground truth does not contain any flooding areas because it is thought that at the time the image was captured the flooding was receded. Thus, the omission error for each method tested in Thailand data set has 0% and the commission error 100%. The 100% in the commission error means that 100% pixels detected as flooding are wrongly detected because there are no flooding pixels. On the other hand, there are no flooding pixels that are omitted from identification because there are no flooding pixels on the ground truth image.
It has to be noted that the accuracy analysis performed here is based on a ground truth that is generated by manual interpretation of the before and after image, so the results might be arguable. It is anticipated in the future that a more reliable ground truth will be used to test accuracy for each methods. Fig. 8, 9 and 10 show the resultant image produced from the six methods on one tile of north Sumatra data set. The black areas on the figures are identified as flooded areas.
Computing Performance Comparison The processing speed and memory used for each method were measured. The processing time was measured for each tile after the input has been pre-processed until to the creation of flood-detected image. Meanwhile, the memory allocated was measured by taking all the memory needed for the input images and coefficients used for the calculation of flood detection process. All the processing was performed using Matlab on a Pentium M 1.3 GHz processor with 256 MB RAM. Table 4 shows the results of computing performance between six methods tested.
Table 4: Computing performance of processing a pair of three bands 500x500 pixels of image
Estimated Memory (MBytes) Algorithm Image Data Variables Total
Proc. Time at test machine (sec)
NDVI differencing 9.53 0 9.53 1.06 NIR band differencing 5.72 0 5.72 0.04 Parallelepiped 17.16 0 17.16 3.71 Maximum Likelihood 17.16 2 19.16 37.51 Minimum Distance 17.16 1 18.16 7.34 Mahalanobis Distance 17.16 1 18.16 20.64
In term of computing performance, NIR band differencing is the fastest and used the less memory to perform flood
detection. Maximum likelihood has the slowest processing time and also consumed the most memory when compared with the other six methods. Combining the accuracy and computing performance results, it is concluded that NIR differencing is the optimal method, which is the method that has least processing time yet has a good accuracy rate. However, more testing on different data sets has to be done to validate these results.

Figure 8: Image result of North Sumatra, Indonesia. NIR Differencing (left) and NDVI Differencing (right)
Figure 9: Image result of North Sumatra, Indonesia. Parallelepiped (left) and Maximum Likelihood (right)
Figure 10: Image result of North Sumatra, Indonesia. Minimum Distance (left) and Mahalanobis Distance (right)

5.Conclusions Radar images are always being used for flood monitoring because the capability of penetrating clouds, however, radar
images are expensive and lower in revisit capability compared to other EO multispectral satellites such as Landsat, NOAA-AVHRR and DMC satellites. NOAA-AVHRR has a high revisit capability but very low in spatial resolution. Meanwhile, DMC satellites can provide daily revisit imaging capability and medium spatial resolution. High resolution satellite imagers such as SPOT has a 26 days revisit The uniqueness about DMC is a constellation of several small satellites, so they are relatively cheaper than other conventional big satellites.
On-board automatic change detection system (ACDS) is proposed to facilitate flood-monitoring process. By implementing this process on-board, it is projected that it can reduce the volume of images needed to transmit to ground stations, so more relevant images can be stored in one orbit. Also, it may help to forecast the next flooding event by monitoring a high-risk area to flood, integrated with other data such as meteorological data. Further more, it can help to achieve faster response as the images are processed before being sent to the ground station.
Six methods for flood detection were investigated for their suitability to be used in on-board implementation. This paper has presented the results of accuracy and computing performance for each method when performed on two sets image data from DMC and Landsat imagery. In term of computing performance, NIR band differencing is the fastest and used the less memory to perform flood detection. Maximum likelihood has the slowest processing time and also consumed the most memory when compared with the other six methods. Combining the accuracy and computing performance results, it is concluded that NIR differencing is the optimal method, which is the method that has the least processing time yet has a good accuracy rate. However, more testing on different data sets have to be done to validate these results. References [1] Sheng, Y., Gong, P. and Xiao, Q. 2001. Quantitative dynamic flood monitoring with NOAA AVHRR. Int. J. of Remote Sensing,
22(9): 1709–1724 [2] Takeuchi, S., Konishi, T., Suga, Y., and Kishi, S. 1999. Comparative study for flood detection using JERS-1 SAR and Landsat
TM data. Proceedings of IEEE 1999 International Geoscience and Remote Sensing Symposium,. IGARSS '99, 2:873-875 [3] Richards, J.A. 1993. Remote Sensing Digital Image Analysis: An Introduction. Springer-Verlag New York, pp. 181-193 [4] Yuhaniz, S., Vladimirova, T. and Sweeeting, M. 2005. Embedded Intelligent Imaging On-Board Small Satellites. In proceedings
of ACSAC 2005, LNCS 3740, Springer-Verlag Berlin Heidelberg 2005 pp. 90 - 103, 2005. [5] URL: DFO of Southern Asia - Earthquake and Tsunami - Indonesia, Sri Lanka and India. Available at
http://www.dartmouth.edu/~floods/2004193.html
Copyright © 2022 FDOKUMEN