Multiband Versus Multispectral Supervised Classification of Architectural Images
13
Photogrammetric Record, 17(97): 89–101 (April 2001) MULTIBAND VERSUS MULTISPECTRAL SUPERVISED CLASSIFICATION OF ARCHITECTURAL IMAGES J L. L ( [email protected]) Polytechnic University of Valencia, Spain Abstract For the conservation of historic monuments, there may be considerable value in automating the methods of detection and analysis of surface con- dition and deterioration. This paper describes tests using a range of multiband and multispectral images for the assessment of architectural fac ¸ade cover by means of supervised image classifications. From the spectral training sets, both pairwise distances (the Euclidean distance and the Jeffries-Matusita (J–M) distance) are calculated and are used to predict the a posteriori accuracy of image classification. Furthermore, the effects of increasing the number of spectral bands (blue, green, red and near-infrared) in the super- vised maximum-likelihood classification procedures are also analysed, as are the benefits of applying principal components. The resultant multiband data- sets increased both the J–M distance and the classification accuracy of the architectural fac ¸ade, and thus enabled better identification and recognition of the different kinds of fac ¸ade-cover features. K: architectural photogrammetry, computer vision, feature recognition, image classification I T methods for automatic or semi-automatic feature recognition and understanding has developed during the past decade in a wide variety of disciplines including digital image processing, image analysis, computer and robot vision, and photogrammetry. Such methods are now used to solve a huge variety of problems (Gonzalez and Woods, 1992; Schowengerdt, 1997). However, most of the digital processing tasks put into practice in digital archi- tectural photogrammetry have been dedicated to geometric issues for the purpose of creating orthoimages or virtual models. The automated identification of masonry wall materials and degraded areas on the monument has tended to be limited to low or intermediate level processing, such as segmentation by means of multi- thresholding (A ´ ngel et al., 1997) or watershed methods ( Wiedemann and Rodehorst, 1997). Little attention has been given to field recognition and interpret- ation of architectural photogrammetry until the late 1990s despite the encouraging Photogrammetric Record, 17(97), 2001 89
-
Upload
independent -
Category
Documents
-
view
0 -
download
0
Transcript of Multiband Versus Multispectral Supervised Classification of Architectural Images

Photogrammetric Record, 17(97): 89–101 (April 2001)
MULTIBAND VERSUS MULTISPECTRALSUPERVISED CLASSIFICATION OF
ARCHITECTURAL IMAGES
J L. L ( [email protected])Polytechnic University of Valencia, Spain
Abstract
For the conservation of historic monuments, there may be considerablevalue in automating the methods of detection and analysis of surface con-dition and deterioration. This paper describes tests using a range of multibandand multispectral images for the assessment of architectural facade cover bymeans of supervised image classifications. From the spectral training sets,both pairwise distances (the Euclidean distance and the Jeffries-Matusita(J–M) distance) are calculated and are used to predict the a posterioriaccuracy of image classification. Furthermore, the effects of increasing thenumber of spectral bands (blue, green, red and near-infrared) in the super-vised maximum-likelihood classification procedures are also analysed, as arethe benefits of applying principal components. The resultant multiband data-sets increased both the J–M distance and the classification accuracy of thearchitectural facade, and thus enabled better identification and recognitionof the different kinds of facade-cover features.
K: architectural photogrammetry, computer vision,feature recognition, image classification
I
T methods for automatic or semi-automatic feature recognitionand understanding has developed during the past decade in a wide variety ofdisciplines including digital image processing, image analysis, computer and robotvision, and photogrammetry. Such methods are now used to solve a huge varietyof problems (Gonzalez and Woods, 1992; Schowengerdt, 1997).
However, most of the digital processing tasks put into practice in digital archi-tectural photogrammetry have been dedicated to geometric issues for the purposeof creating orthoimages or virtual models. The automated identification of masonrywall materials and degraded areas on the monument has tended to be limited tolow or intermediate level processing, such as segmentation by means of multi-thresholding (Angel et al., 1997) or watershed methods (Wiedemann andRodehorst, 1997). Little attention has been given to field recognition and interpret-ation of architectural photogrammetry until the late 1990s despite the encouraging
Photogrammetric Record, 17(97), 2001 89

L. Multiband versus multispectral supervised classification of architectural images
results initially obtained for stone-built monuments (castles) by Strackenbrocket al. (1990).
The recognition of constituent or deteriorated materials on historic buildingfacades has been accelerated by means of digital photogrammetry and geometricpattern recognition techniques, such as multispectral image classification (Lerma,1999). Furthermore, the classified images can provide rigorous, metric and objectiveplots, as well as statistical descriptions of the monuments that can be difficult toproduce using conventional (analytical or analogue) procedures.
Statistical supervised pattern classification for architectural facades has beentested by the author under different situations and constraints for a variety offeatures on different monuments. The overall accuracy of classification for mortarsand paintings (among others) was 83·6% (Herraez et al., 1997); for limestones was94·5%; for mortars was 90·8% (Lerma and Herraez, 1999); and for mixed mortars,limestones, wood and glass was 90·1% (Lerma, 1999). In addition, the benefits ofintegrating both spectral and textural image analysis to ease the recognition of amixed and highly deteriorated rock facade have also been studied (Lerma andRuiz, 1999; Lerma and Ruiz, 2000).
This paper shows empirically how the pairwise distances, Euclidean distanceand Jeffries-Matusita (J–M) distance (Niblack, 1986), can be used to predict thefinal accuracy of supervised classification images of an architectural facade, andhow a multiband image classification can be used to improve the accuracy of amultispectral image classification of facade cover. The concept of multiband imagehere means a set of registered images, each related to the same object but taken atdifferent times, from different positions, with different lighting and sensors, and atdifferent electromagnetic wavelengths. The images resulting from the processes areevaluated on the basis of classification accuracy and compared using a test imageinstead of sampling schemes (Congalton, 1988).
S S M
The study site is the Virgin’s Basilica located in the old part of the city ofValencia (Spain). The Virgin’s Basilica was built from the sixteenth to the twentiethcentury. The materials consisted of limestone, bricks and coloured plasters,although since the 1920s all the brickwork has been rendered with masonry cement(Bosch et al., 1994).
Direct observation allows the identification of several masonry wall materials:
(1) fine ochre-coloured cement mortar used to render the pilaster;(2) fine white cement mortar used to render the pilaster;(3) coarse orange-coloured cement mortar used to render the face;(4) rock; and(5) wood.
These five features (Table I ) were selected for the semi-automatic recognition andcharacterisation of the facade. Other features such as ceramic tiles, a burglar alarm,glass, a lattice grille and large numbers of doves were excluded because of theirlack of interest or relevance, or their small dimensions.
Photogrammetric Record, 17(97), 200190

L. Multiband versus multispectral supervised classification of architectural images
T I. Features selected for spectral image classification.
Class Feature on the masonry wall
Pilaster(1) Fine ochre-coloured cement mortar used to render the pilasterPilaster(2) Fine white cement mortar used to render the pilasterFace Coarse orange-coloured cement mortar used to render the faceRock Godella and Rocafort limestoneWood Balcony doors
I A M C
Though the concept of a multiband image is rather broad (Haralick andShapiro, 1992), it can be understood as a multitemporal and multisensor set ofspectral images. If there is no multitemporal component the image is treated asmultispectral. Thus, the number of bands in a multispectral image will be less thanor equal to the number in a corresponding multiband image.
The multiband conditions were generated by registering the set of images tothe main facade, with images obtained either on a cloudy day or on a sunny day(with the facade in the shade). Two normal-angle amateur cameras were used, adigital camera for the reflected-visible wavelength and a film camera for near-infrared radiation. Finally, ground distances between cameras and the front of thefacade were set so as to achieve a resampled ground resolution of 1 cm.
The digital camera provided a CCD colour image sensor with 832×608 pixels.The conventional 35 mm camera used for reflected near-infrared radiation requiredthe following material: (1) a black-and-white infrared-sensitive film, (2) a KodakWratten gelatin filter No. 87 (Kodak, 1990) to remove the visible light wavelengthreaching the film, (3) a professional mount for gelatin filters and (4) a filter carrier.The camera aperture and the shutter speed settings used for the near-infraredphotography were changed for every image in order to achieve the required illumi-nation, whereas the settings for the digital camera were established automaticallyby the camera.
Each digital colour image (300 nm waveband and 24 bits per pixel ) was con-verted into three images (100 nm waveband and 8 bits per pixel ): visible blue,visible green and visible red. The near-infrared photographs were scanned by meansof a desktop publishing scanner with a resolution of 600 dpi and a quantisationlevel of 8 bits per pixel.
Due to the different orientation and attitude of the cameras for each scene,warping was performed on the different spectral images in order to obtain geometri-cally correct data from them. Thus, the first registration operation was to rectifyone spectral image (Fig. 1(a)) to the facade. Due to the planarity of the architecturalfacade, a two dimensional projective transformation was applied. Using five well-distributed ground control points a root mean square error of 0·008 mm wasachieved. The output image was resampled with a bilinear interpolation, as wasproposed by Dikshit and Roy (1996) for improving the classification of imagescontaining few spectrally distinct class boundaries, and was extracted afterwards.This georeferenced band (Fig. 1(b)) was used to merge all other spectral imagesby means of corresponding two dimensional projective transformations and bilinear
Photogrammetric Record, 17(97), 2001 91

L. Multiband versus multispectral supervised classification of architectural images
(a) (b)
F. 1. (a) Original green spectral image. (b) Rectified and extracted green spectral band (vlc.g).
interpolations. This was the procedure followed to create both the multiband andmultispectral images.
Three sets of images were made in order to study the accuracy obtained byapplying individual image classifications:
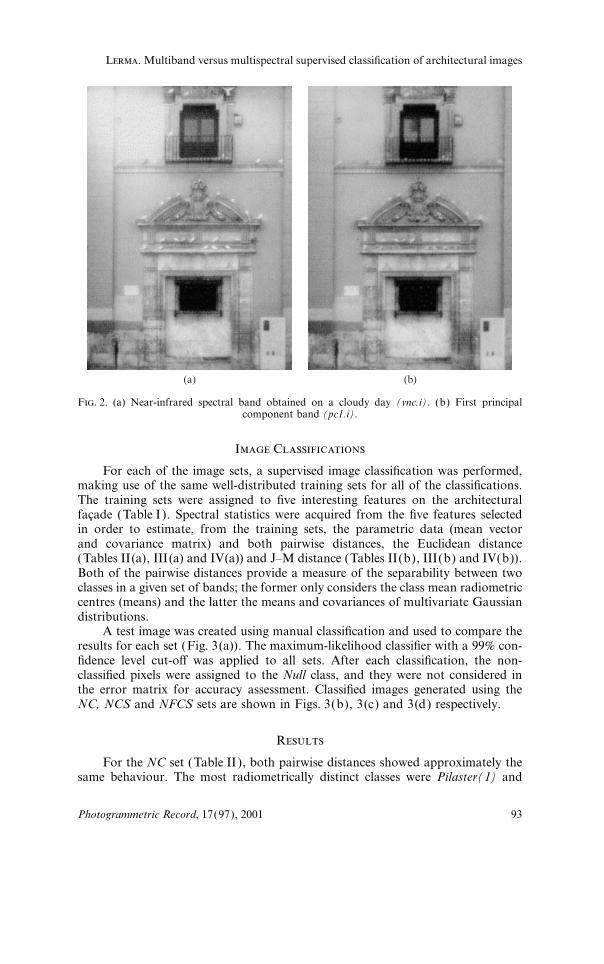
(1) Near-cloudy (NC) set; a multispectral image comprising four spectralbands: blue (vlc.b), green (vlc.g), red (vlc.r) and near-infrared (vnc.i,Fig. 2(a)); all were obtained on a cloudy day. The distances from thesensors to the facade were 19 m for the digital camera and 22 m for theconventional camera.
(2) Near-cloudy/shade (NCS) set; a multiband image comprising eight spectralbands: blue (vlc.b), green (vlc.g), red (vlc.r), near-infrared (vnc.i), blue(vm2c.b), green (vm2c.g), red (vm2c.r) and near-infrared (vt2c.i). Thelast four bands were taken on a sunny day but with the facade in the shade.
(3) Near-far/cloudy-shade (NFCS) set; a multiband image comprising fourspectral bands: blue (vlc.b), green (vlc.g), red (vlc.r) and near-infrared( pc1.i, Fig. 2(b)). The latter near-infrared band was the result of applyingprincipal components to four original near-infrared bands taken either oncloudy days or in shade conditions, from both camera–target distances,22 m and 32 m; pc1.i was the first computed principal component bandand its eigenvalue accounted for 76·6% of the total variance. The appli-cation of principal component analysis allowed correction for the lack ofillumination on small and unpredictable areas of the near-infraredbands (Fig. 2).
Photogrammetric Record, 17(97), 200192
L. Multiband versus multispectral supervised classification of architectural images
(a) (b)
F. 2. (a) Near-infrared spectral band obtained on a cloudy day (vnc.i). (b) First principalcomponent band (pc1.i).
I C
For each of the image sets, a supervised image classification was performed,making use of the same well-distributed training sets for all of the classifications.The training sets were assigned to five interesting features on the architecturalfacade (Table I ). Spectral statistics were acquired from the five features selectedin order to estimate, from the training sets, the parametric data (mean vectorand covariance matrix) and both pairwise distances, the Euclidean distance(Tables II(a), III(a) and IV(a)) and J–M distance (Tables II(b), III(b) and IV(b)).Both of the pairwise distances provide a measure of the separability between twoclasses in a given set of bands; the former only considers the class mean radiometriccentres (means) and the latter the means and covariances of multivariate Gaussiandistributions.
A test image was created using manual classification and used to compare theresults for each set (Fig. 3(a)). The maximum-likelihood classifier with a 99% con-fidence level cut-off was applied to all sets. After each classification, the non-classified pixels were assigned to the Null class, and they were not considered inthe error matrix for accuracy assessment. Classified images generated using theNC, NCS and NFCS sets are shown in Figs. 3(b), 3(c) and 3(d) respectively.
R
For the NC set (Table II ), both pairwise distances showed approximately thesame behaviour. The most radiometrically distinct classes were Pilaster(1) and
Photogrammetric Record, 17(97), 2001 93

L. Multiband versus multispectral supervised classification of architectural images
T II. Pairwise distances for NC training sets: (a) Euclidean distance; (b) J–M distance.
(a) Euclidean distance
Class name Pilaster(1) Pilaster(2) Face Rock
Pilaster(2) 57·6Face 33·7 61·6Rock 56·2 62·0 27·5Wood 238·0 236·8 206·2 184·6
Mean 116·4
(b) J–M distance
Class name Pilaster(1) Pilaster(2) Face Rock
Pilaster(2) 1·96Face 1·76 1·99Rock 1·60 1·95 1·34Wood 2·00 2·00 2·00 1·99
Mean 1·86
T III. Pairwise distances for NCS training sets: (a) Euclidean distance; (b) J–M distance.
(a) Euclidean distance
Class name Pilaster(1) Pilaster(2) Face Rock
Pilaster(2) 68·9Face 34·5 87·2Rock 58·0 86·4 36·1Wood 299·7 343·4 279·7 268·2
Mean 156·2
(b) J–M distance
Class name Pilaster(1) Pilaster(2) Face Rock
Pilaster(2) 2·00Face 1·77 2·00Rock 1·83 2·00 1·82Wood 2·00 2·00 2·00 2·00
Mean 1·94
Wood whilst the worst were Rock and Face. The Wood class seemed to be easilyidentified with both distances. In contrast, the Face and Rock classes appeared tobe the most difficult to identify, with the Euclidean and the J–M distancesrespectively.
Better a priori statistical results were obtained using the NCS set (Table III ).All pairwise distances increased their values, mainly those involving Wood (withall the pairwise distances reaching top values) and Pilaster(2). Within this set, theaverage pairwise distances had maximum values. Both pairwise distances had mini-mum separability with the Pilaster(1) and Face classes.
Photogrammetric Record, 17(97), 200194

L. Multiband versus multispectral supervised classification of architectural images
T IV. Pairwise distances for NFCS training sets: (a) Euclidean distance; (b) J–M distance.
(a) Euclidean distance
Class name Pilaster(1) Pilaster(2) Face Rock
Pilaster(2) 34·8Face 27·7 56·6Rock 38·5 64·0 17·0Wood 228·8 247·7 203·7 190·3
Mean 110·9
(b) J–M distance
Class name Pilaster(1) Pilaster(2) Face Rock
Pilaster(2) 1·94Face 1·88 2·00Rock 1·63 1·93 1·65Wood 2·00 2·00 2·00 2·00
Mean 1·90
Contradictory results were reached with the NFCS set (Table IV ). Whilst theaverage pairwise Euclidean distance decreased as compared with the NC set, theaverage J–M distance increased. The pairwise distances showed that the Face classhad the lowest separability among classes of the whole set, with minimum valuesfor Face and Rock and Face and Pilaster(1).
Accuracy assessment was conducted over the entire study area by comparingthe classified images with the facade-truth image. A summary of classification accu-racies for the three image sets is presented in Table V. The overall classificationaccuracies increased from 89·8% (multispectral image, NC set), to 90·4% (multibandimage that included a near-infrared principal component, NFCS set) and to amaximum of 96·0% (multiband image, NCS set).
All the sets showed high accuracies for discriminating Face, Rock and Woodclasses, the most widespread features on the facade. However, the recognition ofthe Pilaster(2) class was rather difficult due to the high rate of omission andcommission errors, mainly involving Pilaster(1) and Rock. Nevertheless, the mis-classifications of Pilaster(2) had little global impact as they involved an area ofless than 1% of the whole.
In the multispectral classification of the NC set, the producer accuracy forFace, Rock and Wood classes was over 91·7%. Pilaster(1) had a much lower pro-ducer accuracy (79%) and Pilaster(2) was the worst (approximately 70%). Theuser accuracy was more homogeneous over the spectral classes, with a medianvalue of 88%.
Regarding the multiband classification of the NCS set, the overall accuracyreached a maximum value of 96·0%, with the Kappa index showing an accuracyof 93·7%. For all classes, producer accuracies were over 96%, except for Pilaster(2).Better results were obtained taking into account user accuracy, with a minimumvalue of 92·8% for Pilaster(1), and a maximum value of 99·9% for the Wood class.The most common class, Face, reached 98·5% accuracy.
Photogrammetric Record, 17(97), 2001 95

L. Multiband versus multispectral supervised classification of architectural images
(a) (b)
(c) (d)
F. 3. (a) Facade-truth image (test image). (b) Classified image obtained using theNC set. (c) Classified image obtained using the NCS set. (d) Classified image obtained using
the NFCS set.
Photogrammetric Record, 17(97), 200196

L. Multiband versus multispectral supervised classification of architectural images
T V. Supervised classification accuracies (%) achieved for NC, NCS and NFCS sets.
NC set NCS set NFCS set
Producer User Producer User Producer Useraccuracy accuracy accuracy accuracy accuracy accuracy
Pilaster(1) 79·0 86·6 97·2 92·8 82·5 86·4Pilaster(2) 69·9 72·6 54·9 95·2 77·7 61·1Face 91·7 92·8 96·2 98·5 91·8 93·1Rock 92·0 88·7 96·1 94·8 91·9 90·0Wood 94·4 88·8 96·4 99·9 96·0 95·8
Overall 89·8 96·0 90·4accuracy
Kappa index 83·8 93·7 84·8
The multiband classification of the NFCS set produced poorer results com-pared with the NCS set, but still increased and homogenised the producer accuracyachieved in the multispectral classification. The producer accuracy for thePilaster(2), Pilaster(1) and Wood classes rose with respect to the NC set. In con-trast, the user accuracy showed very good results with the Wood and Face classesand good results with the Rock and Pilaster(1) classes, but insufficient accuracywith Pilaster(2).
D
The resulting values of a priori mean pairwise distances and a posteriori classi-fication analysis carried out applying multibands instead of multispectral imagescan be seen in Fig. 4. With multiband classification, both the producer accuracy
F. 4. Statistical a priori and a posteriori studies: E.D.=average Euclidean distance;J–M D(n)=average normalised Jeffries–Matusita distance1; O.A.=overall accuracy;
K.I.=Kappa index; Null C.=null class.
1J–M D(n)=(J–M D−1·80)×500.
Photogrammetric Record, 17(97), 2001 97

L. Multiband versus multispectral supervised classification of architectural images
and user accuracy increased their values with regard to multispectral classification:the multiband parameters were either more meaningful (because of the use of morevariables in the maximum-likelihood classifier) or more homogeneous (thanks tothe use of principal components).
A priori statistical pairwise distances enabled identification of whether or notthe spectral classes were numerically separable. Results were different for the twopairwise distances. First, there was a non-linear but direct relationship betweenJ–M distance and the overall accuracies achieved (Fig. 5). The higher the value ofJ–M distance, the better classification accuracy achieved, mainly over a value of1·88 either for the overall accuracy and for the Kappa index. Second, there wasnot a clear relationship between Euclidean distance and overall accuracies (Fig. 6).
F. 5. Relationship between J–M distance (J–M D) and both the overall accuracy (O.A.) and theKappa index ( K.I.).
F. 6. Relationship between Euclidean distance (E.D.) and both the overall accuracy (O.A.) andthe Kappa index ( K.I.).
Photogrammetric Record, 17(97), 200198

L. Multiband versus multispectral supervised classification of architectural images
Classification accuracies increased using multiband images, although the Euclideandistance slightly decreased (for example the NFCS set). However, it would beinteresting to study the extent to which the final classification accuracy is sensitiveto pairwise distances.
This study showed that not only is the mean value important for discriminatingclasses (as used by the Euclidean distance) but so also is the covariance matrix foreach class. In fact, the parametric data becomes more representative and homo-geneous as the number of bands increases. Moreover, the training sets must havea unimodal (normal ) spectral signature distribution if an acceptable classificationis to be attained (Huang and Mausal, 1994). This result implies the need for similarlighting conditions, otherwise the benefits of multiband over multispectral classifi-cation can be reduced (Lerma, 1999).
Finally the Null class percentage was studied over the whole classification. Ingeneral, the higher the number of image sets the higher the Null class percentage,although it can be reduced in part if principal components are used (Fig. 4). Thischaracteristic peculiarity was mainly due either to the numerous doves, some ofthem moving, partly obscuring the facade on each image, or to the high confidencelevel cut-off selected for the unclassified (Null) class.
C
Multiband supervised classifications examined in this study have permitted anincrease in final accuracies when applied to architectural images. Whenever thenumber of multitemporal and multisensor images has been increased in the classifi-cation procedure, the corresponding classified images have also increased theiraccuracy. However, care has to be taken with multiband images, and it is necessaryto use similar lighting conditions and avoid partial shading as well as movingobjects such as doves, when examining architectural facade cover.
Regarding the pairwise distances, the J–M distance has predicted a posterioriclassification accuracies more effectively than the Euclidean distance, and has pro-duced direct relationships between class separability and classification accuracy.
The application of principal components in classification has shown its valuein homogenising and correcting lighting problems in the near-infrared bands, andhas also helped to reduce the Null class within multiband classifications.Furthermore, it has permitted an increase in the multispectral classificationaccuracy.
Although the results described in this paper are empirical, they indicate thatremotely-sensed architectural images benefit from the integration of multibands forthe classification of facade cover. The multiband classification provides morereliable and accurate results than the multispectral classification under idealenvironmental conditions.
A , M. C., M, B., P, N., R, F. and H, C., 1997. Evaluacionalterografica y evolucion del deterioro en monumentos por tecnicas digitales de imagenes.Ingenierıa Civil, 105: 45–53.
B, I., S, R., P, B., M, V., M, V., F, M., E, J. andR, P., 1994. Investigaciones previas conducentes a la recuperacion integral del conjunto
Photogrammetric Record, 17(97), 2001 99
L. Multiband versus multispectral supervised classification of architectural images
patrimonial de la Basılica de la Virgen de los Desamparados de Valencia. Actas del X Congresode Conservacion y Restauracion de Bienes Culturales (Grupo 8, Punto 10), Cuenca, Spain.
C, R. G., 1988. A comparison of sampling schemes used in generating error matricesfor assessing the accuracy of maps generated from remotely sensed data. PhotogrammetricEngineering & Remote Sensing, 54(5): 593–600.
D, O. and R, D. P., 1996. An empirical investigation of image resampling effects uponthe spectral and textural supervised classification of a high spatial resolution multispectralimage. Ibid., 62(9): 1085–1092.
G, R. C. and W, R. E., 1992. Digital Image Processing. Addison-Wesley, Reading,Mass. 716 pages: 2–6.
H, R. M. and S, L. G., 1992. Computer and Robot Vision. Vol. 2. Addison-Wesley,Reading, Mass. 630 pages: 573.
H B, J., N E, P. and L G, J. L., 1997. Integration of normalcolour and colour infrared emulsions for the identification of pathologies in architecturalheritage using a digital photogrammetric system. International Archives of Photogrammetryand Remote Sensing, 32(5C1B): 240–245.
H, K.-Y. and M, P. M., 1994. Comparing a piecewise linear classifier with Gaussianmaximum-likelihood and parallelepiped classifiers in terms of accuracy and speed.Photogrammetric Engineering & Remote Sensing, 60(11): 1333–1338.
K P F H, 1990. Eastman Kodak Publication B-3.L, J. L., 1999. Methodology of multispectral image classification for the recognition and charac-
terisation of materials and damages on architectural facades (Ph.D. thesis). UniversidadPolitecnica de Valencia, Valencia. 367 pages.
L, J. L. and H, J., 1999. Reconocimiento y cartografiado automatico de monumentosarquitectonicos. Proceedings of the XI International Congress of Graphic Engineering,Pamplona–La Rioja, Spain. Pages 732–740.
L, J. L. and R, L. A., 1999. Analysis of historic building facades by spectral and textureimage methods. Proceedings of the VIII National Symposium of Pattern Recognition and ImageAnalysis, (Vol. 1), Bilbao, Spain. 550 pages: 235–242.
L, J. L. and R, L. A., 2000. Analisis de fachadas de edificios historicos mediantemetodos espectrales y de texturas. Revista Electronica de Vision por Computador, 2:http://www.cvc.uab.es/revc/revista/02/0204-art.-pdf [Accessed: April 2000].
N, W., 1986. An Introduction to Digital Image Processing. Prentice-Hall, Englewood Cliffs.215 pages: 177–181.
S, R. A., 1997. Remote Sensing. Models and Methods for Image Processing. AcademicPress, San Diego. 522 pages: 2.
S, B., S, G. and G, J.-M., 1990. Image processing for mapping damagesto buildings. CIPA XIII International Symposium: 258–262.
W, A. and R, V., 1997. Towards automation in architectural photogrammetryusing digital image processing. International Archives of Photogrammetry and Remote Sensing,32(5C1B): 209–214.
Resume
Dans la conservation des monuments historiques, il peut y avoir ungrand interet a automatiser les methodes de detection et d’analyse des etatsde surface et de leurs deteriorations. On presente dans cet article des essaismenes en utilisant une gamme d’images avec bandes spectrales en nombrenormal ou accru, pour evaluer les surfaces des facades architecturales, parclassification dirigee de ces images. A partir de jeux d’apprentissage, oncalcule des couples de distances (Euclidiennes ou de Jeffries-Matusita(J–M)) que l’on utilise pour predire la precision a posteriori de la classifi-cation d’image. On analyse en plus les effets de l’accroissement du nombredes bandes spectrales (bleu, vert, rouge et proche-infrarouge) dans les pro-cedes de classification dirigee d’apres le maximum de vraisemblance, ainsi
Photogrammetric Record, 17(97), 2001100

L. Multiband versus multispectral supervised classification of architectural images
que les benefices de l’analyse en composantes principales. La multiplicationdes bandes permet d’accroıtre a la fois la distance J–M et la precision de laclassification relative a la facade architecturale, procurant ainsi une meilleureidentification des differents elements qui recouvrent les facades.
Zusammenfassung
Fur die Erhaltung historischer Denkmaler kann die Automation derVerfahren zur Entdeckung und Analyse der Oberflachenbedingungen und-verschlechterungen von betrachtlichem Wert sein. Es werden Tests unterVerwendung einer großen Anzahl von Multiband- und Multispektral-bildern zur Bewertung der Fassadenbedeckung mit Hilfe gesteuerterBildklassifikationen beschrieben. Aus den spektralen Trainingssatzen werdenpaarweise Strecken (die Euklidische und die Jeffries-Matusita (J–M)-Strecke) berechnet und genutzt, um die a posteriori Genauigkeit derBildklassifikation vorherzusagen. Weiter werden die Einflusse einer gesteig-erten Anzahl von Spektralbandern (blau, grun, rot und nahes Infrarot) beider kontrollierten Maximum-Likelihood-Klassifizierung analysiert und wiedie Vorteile bei der Anwendung der Hauptkomponenten sind. Die resultier-enden multispektralen Datensatze erhohten sowohl die J–M-Strecke als auchdie Klassifizierungsgenauigkeit der Architekturfassade und ermoglichten soeine bessere Identifizierung und Erkennung der unterschiedlichen Arten vonCharakteristiken der Fassadenoberflachen.
Photogrammetric Record, 17(97), 2001 101