MULTISPECTRAL PHOTOGRAPHY FOR EARTH RESOURCES
279
MULTISPECTRAL PHOTOGRAPHY FOR EARTH RESOURCES SONDRA WENDEROTH RAJENDER KALIA EDWARD YOST with ROBERT ANDERSON FIUS sUM ar TO cw Reproduced by NATIONAL TECHNICAL INFORMATION SERVICE US Department of Commerce Springfield, VA. 22151 Science Engineering Research Group C. W Post Center Long Island University Greenvale, New York https://ntrs.nasa.gov/search.jsp?R=19750007066 2020-03-23T01:29:14+00:00Z
-
Upload
khangminh22 -
Category
Documents
-
view
1 -
download
0
Transcript of MULTISPECTRAL PHOTOGRAPHY FOR EARTH RESOURCES

MULTISPECTRAL PHOTOGRAPHY
FOR EARTH RESOURCES
SONDRA WENDEROTH RAJENDER KALIAEDWARD YOST with ROBERT ANDERSON
FIUS sUM ar TO cw
Reproduced by
NATIONAL TECHNICALINFORMATION SERVICE
US Department of CommerceSpringfield, VA. 22151
Science Engineering Research GroupC. W Post Center
Long Island UniversityGreenvale, New York
https://ntrs.nasa.gov/search.jsp?R=19750007066 2020-03-23T01:29:14+00:00Z

Prepared for the National Aeronautics and SpaceAdministration and subject to Clause 90, Rights in Data.
PR&rAn. u, t uA, A U.,UNTRACTNAS9-11188
1972PRINTED IN THE UNITED STATES OF AMERICA BY
WEST HILLS PRINTING COMPANY, HUNTINGTON, NEW YORK.COLOR PHOTOGRAPHS PRINTED BY
LEBANON VALLEY OFFSET COMPANY, ANNVILLE, PENNSYLVANIA.

Multispectral Photography for Earth Resources

Dedicated
to
All the individuals responsible for the merger of space
and remote sensing technology.

Preface
"Nothing succeeds as well as a good idea whose time has come" andmultispectral photography in the year 1972 is that idea.
This manual has been written for those persons who are involved (or
expect to be involved) in the routine applications of multispectral photography
with regard to space or aircraft assessment of the environment. Many
individuals fall into this category: the users whose prime interest lies in the
photo interpretation of the final results, the photo technicians whose principal
concern rests with the precision processing of multispectral imagery, the
student who desires to know what multispectral photography is all about, andthe aerial photographer who wants to broaden his background.
There have been numerous remote sensing books written for theengineers, designers, photographers, and photo interpreters of aerialphotographic systems, but there has been little or no information available for
those who are interested in applying multispectral concepts to their ownproblems and who may not have an aerial photographic background. Thismanual has been written for them. We solicit any comments, suggestions, or
criticisms of the readers.
The authors wish to express their deep appreciation to those individualswho provided unmeasurable assistance in the preparation of this text: FredPearce, NASA Manned Spacecraft Center, Carl Anderson and Richard Rehrigof Spectral Data Corporation, and Peggy Stollar of Long Island University.
Special thanks to John Wiley & Sons, Inc. and Morgan & Morgan, Inc. forpermission to use illustrations from their publications.

TABLE OF CONTENTS
Chapter Title Page
1 INTRODUCTION
Purpose of Manual 1-1
What is Color? 1-1Additive Color Formation 1-3
Multispectral or Additive Color Photography 1-3
Subtractive Color Formation 1-6Tripack or Subtractive Color Photography 1-8
Summary 1-10
2 CAPABILITIES AND LIMITATIONS OF COLORAND COLOR INFRARED FILMS
Capabilities of Color Films 2-1Limitations of Color Films 2-2Controllable Causes of Color Error 2-4Uncontrollable Causes of Color Error 2-7Relationship Between Processed Color 2-11
and Standard Test Panel ColorSummary 2-14
3 IMAGE COLOR MEASUREMENTS
The Muncell System 3-1CIE Colorimetric System 3-4CIE Spectrophotometric System of Color 3-21
SpecificationColor Density 3-38Summary 3-39
4 METHODS OF RELATING GROUND PHENOMENATO FILM DENSITY AND COLOR MEASUREMENT
Ground Reference Targets 4-1Effective Use of Reference Targets and 4-6
Their CalibrationGround Truth 4-12Summary 4-13
5 SENSITOMETRY
Sensitometric Test Procedures 5-2
Exposure 5-2Sensitometers 5-4Processing 5-5Fixing and Washing 5-7Processing Summary 5-9

Chapter Title Page
Measurement of Sensitometric Data 5-9Densitometers 5-12Densitometer Operation 5-16Design of Sensitometric Data Sheets 5-16Summary 5-17
6 SENSITOMETRIC DATA HANDLING
Density vs. Density (Relative Log E) 6-2Curves
D Log E Curves 6-3Use of Characteristic Curves 6-5Reciprocity Law and Reciprocity Law 6-16
FailureSummary 6-18
7 NEGATIVE EXPOSURE AND PROCESSING OFMULTISPECTRAL BLACK-AND-WHITE PHOTOGRAPHY
Considerations in the Selection of Film 7-1and Exposure for Use in MultispectralPhotography
Processing Control for Multispectral 7-20Imagery
Negative Film Densitometry 7-22Summary 7-26
8 POSITIVE DUPLICATION OF BLACK-AND-WHITEMULTISPECTRAL NEGATIVES
Multispectral Positive Printing 8-1Characteristics of Multispectral Positive 8-3
TransparenciesCharacteristics of Duplicating Materials 8-7Reproduction of Tone 8-8Summary 8-13
9 ADDITIVE COLOR PRESENTATIONS AND THEIRMEASUREMENT
Data Reduction Procedure 9-1Multispectral Viewers 9-4
10 CONSIDERATIONS IN THE SELECTION OFMULTISPECTRAL CAMERAS AND COMPONENTS
Multispectral Lenses 10-1Photographic Resolving Power 10-5Characteristics of Multispectral 10-10
FiltersShutters and Shutter Timing 10-13

Chapter Title Page
Four-Lens Multispectral Camera vs. Four 10-14Camera Multispectral Array
Summary 10-15
11 PHOTOGRAPHIC MATERIALS FOR COLOR ANDBLACK-AND-WHITE PHOTOGRAPHY
Black-and-White Films 11-2Color Films 11-4Reversal Coloi Films 11-5Duplicating Films 11-5
12 APPLICATIONS INCLUDING ISOLUMINOUSTECHNIQUES
Isoluminous Techniques 12-1Applications 12-4
13 MISSION PLANNING
Camera 13-1Films and Filters 13-2Season and Weather Conditions 13-4Photographic Day 13-4Summary 13-5
GLOSSARY
REFERENCES

CHAPTER 1
INTRODUCTION
Purpose of Manual
There is little doubt in anyone's mind that the photographic interpretation of a complex groundscene is greatly facilitated by the use of color photography. In the earth resources disciplines, wherethe phenomenon is often very subtle, the use of black-and-white photography has been almost totallyreplaced by the use of color systems, and for a good reason. Physiologists have told us that the normaleye-brain combination can detect some 7.5 million different colors, while it can sense only 200 differentshades of gray. However, as often happens, the phenomenon to be detected is even too subtle to be"seen" on conventional color and color infrared films, so a new technique called multispectralphotography has been developed to enhance small color differences between specific items of interest.Unfortunately, multispectral photography has been used only in research efforts to demonstrate itsapplication to earth resources problems. The rather spectacular results which this technique produceshave generated a worldwide interest and enthusiasm for employing it as a new remote sensing tool.
Because of the accuracy necessary in the exposure and processing of multispectral imagery,conventional aerial photographic procedures are inadequate to assure meaningful results. Hence,much of the multispectral photography obtained by those who have failed to observe the requiredphotographic procedures is disappointing at best.
The purpose of this Manual is twofold. First, it is intended as a guide to producing accuratemultispectral results for earth resources applications. An established procedure is presented in aneffort to minimize "learning time" and to eliminate unnecessary research effort which has alreadybeen performed. The second purpose of the Manual is to present to the reader the theoretical andanalytical concepts of both color and multispectral photography in order to facilitate anunderstanding of the established procedures. This Manual has been written in a very simplifiedmanner; the bibliography should be referred to for a more detailed treatise of the concepts includedherein.
1.1 What is Color?
In order to form an accurate concept of color it is helpful to consider, initially, the entireelectromagnetic spectrum. This spectrum consists of radiant energy travelling through space in theform of waves of various lengths. The longest of these waves is radio broadcast, while the shortest iscosmic rays. It should be noted that each part of the electromagnetic spectrum has exactly the samenature and differs from the other parts only in wavelength (length of one wave). The upper portion ofthe following diagram (Figure 1) represents the major divisions of the electromagnetic spectrum inwhich the wavelength of the energy is given in nanometers (10-6 meters). That small wavelengthregion from 380 to 760 nm consists of visible radiant energy called light and is shown in the lower partof Figure 1. This range of visible radiant energy may itself be subdivided into many components,
each one of which can be described as a color. For example,
1-1

Wavelength Range Apparent Color380 nm to 430 nm Violet
430 nm to 475 nm Blue
475 nm to 510 nm Cyan
510 nm to 560 nm Green
560 nm to 590 nm Yellow
590 nm to 620 nm Orange
620 nm to 760 nm Red
10-12 10- 10 4 100 1 4 108 1012 ?\in nanometers
o
Violet Blue Green I Orange Red RediI t I-( I
400 500 600 700
1 in nanometers
Figure 1. Parts of the electromagnetic spectrum and an expansion
of the visible spectrum.
The definition of color may be given as that aspect of visual perception by which an observer may
distinguish between objects having the same size and shape. There are three characteristics of color:
hue, saturation, and brightness.
Hue is that characteristic which causes one to describe a color as red, yellow, green, blue, etc.
However, in addition to hue, all colors consist of other characteristics. Saturation is that property of a
color which indicates the purity or amount of white contained in the color. The horizontal group of
paint swatches in Plate I shows a red hue at several levels of saturation, the most saturated (or
1-2

purest) being level 6 and the most desaturated (white) being level 1. It is interesting to note that as
the hue approaches the limit of desaturation, the color becomes a neutral white or gray. More
specifically, saturation is the ratio of the amount of hue in a color to the total amount of energy in a
color. For example, if a color contains three units of blue light and six units of white light, then:
3 units (blue)Saturation = = 33.33%
9 units (total)
In other words, this color combination is only about 33 percent pure blue.
The third major characteristic of color is brightness. Brightness is a measure of the amount of
black in a color. It is that attribute, for example, which makes scarlet red different from maroon red or
royal blue different from navy blue. Referring again to Plate I the vertical column of colors differs
only in brightness. As a hue becomes less bright, it approaches pure black.
Most color photographic processes are designed to accurately reproduce the hue, saturation,
and brightness characteristics of any color which the eye perceives. In other words, it is the intent of
color photography to simulate the visual mechanism of the eye and to produce a "hard copy" of the
color images for future reference. There are two main approaches to this task:1. Additive color photography which was the first method by which a
scene could be reproduced in full color.2. Subtractive color photography which today is the technique upon which
most commercial color processes are based.The theoretical aspects of the additive and subtractive production of color will now be presented
together with their respective techniques called multispectral and multilayer color photography.
1.2 Additive Color Formation
In 1861, Clark Maxwell noted that the visual appearance of a color could be matched by a
correct mixture of three different light sources: red, green, and blue. He also realized that these
primary colors could be mixed in varying proportions to produce almost every conceivable color. This
concept is best illustrated in Plate II.The combination of red and green light results in a yellow beingproduced and by adding together the blue and green beams, a cyan color is produced. The addition of
blue and red light yields magenta, while the mixture of all three primaries produces white. It should
be noted that additive production of color is dependent upon the individual projection of each primaryonto a common screen. Maxwell applied this concept to the photographic process and generated what
is now known as multiband or multispectral photography.
1.3 Multispectral or Additive Color Photography
Multispectral or additive color photography consists of three basic tasks:The color analysis or separation of the scene by use of filtered photographs.
-- The processing of the film.The color synthesis or recombination of the photographs in an additiveprojection system.
1-3

Suppose it is desired to photograph a series of different colored patches using additive techniques andthe configuration of the scene is that of Figure 2a.
The following procedure is used to produce the required separation negative films shown inFigure 2b:
-- The scene is photographed with a camera using black-and-white film andequipped with a red filter in front of the lens.
-- Without moving the camera, the red filter is replaced by a green filter and thecolor patches are again photographed with black-and-white film.
-- The green filter is then replaced by a blue filter in front of the lens and thescene is photographed once again.
Each of these three pieces of film is developed as a negative and will have densities as illustrated inFigure 2b.
These negative films are then printed into positives before being projected in additive color.Naturally, the densities (or grayness) of the images in each positive film will be opposite of what theywere in the negative as shown in Figure 2c.
These three positive films are now ready for recombination or synthesis onto a viewing screen.Each is placed into a separate projector (shown diagrammatically in Figure 2d); the projectorcontaining the red record has a red filter over the lamp, the projector containing the green record has agreen filter over the lamp, and the projector containing the blue record has a blue filter over the lamp.The projectors are moved close together so that the three projected film images superimpose exactlyon the viewing screen. Referring now to the additive mixtures shown in Plate II, the projectedcombinations of the three positive films will yield the final scene reproduction shown in Figure 2d.
Patch Color Synthesized or Additive Color
Black In none of the three positive films is this imageclear; hence, no light is projected on the screen sothat the color of this color patch is black.
White This image is clear in all three records; hence, red,green, and blue light will be projected in this area.We have seen from Plate II that the combinedeffect of red, green, and blue is white.
Red Only the red positive record has this image asclear; red will be projected and the green and bluelight will be stopped by the densities on theirfilms.
Green The green positive record has this patch sample asclear; no red or blue light will be projected onto thescreen so that the image will appear as pure green.
1-4

W R G IB Y C M laci Original Scene
Figure 2a
Red iiiiiiii iii Cross-section of multispectralnegative records after silverhalide grains have been
exposed in the camera and
Green . ___ j developed.
Blue I II..
Figure 2b
Red [.Cross-section of multispectral
Green positive records after printingfrom the negative records andprocessed.
Blue . Iii ..11 1Figure 2c
Red Filter I Green Filter Blue FilterRed Positive Record Green Positive Record Blue Positive Record
Figure 2dAdditive color reproduction of the original color patches.
Figure 2. Reproduction of colors using additive multispectral techniques.
1-5

Blue Only the blue positive record is clear at this image;hence, green and red are not projected and thepatch appears blue.
Cyan Both the green and blue positive records show thatthe image of this patch is clear; no red light istransmitted. The addition of green and blue lightsproduces cyan.
Yellow The red and green positive images of the yellowpatch are clear.Plate:II illustrates that the additionof red and green lights is yellow.
Magenta The green record is opaque (dark) for this last colorsample. The blue and red records are clear and willtransmit these colors to produce magenta on thescreen.
We have seen, then, how a single scene composed of many colors can be additively reproducedaccurately by:
1. Separating, onto three pieces of black-and-white film, the reflected energy inthree spectral regions; namely, red, green, and blue.
2. After processing the film to positives, they are projected using the sameprimary filters through which the photos were exposed.
3. The superimposition of these three positive photos onto a common screenproduces a full color reproduction of the scene.
One should note that additive color produces not only the primaries used in projection, but a widegamut of secondary colors as well. A more detailed discussion of additive color production will begiven in Chapter 3 with the subject of color matching.
1.4 Subtractive Color Formation
Given a beam of white light (consisting of red, green, and blue components), it is possible toproduce color by removing or subtracting from that beam, light of various wavelengths. ConsiderFigure 3a in which a circular yellow filter, which transmits all spectral colors except blue, is placedover a light box. Only yellow light is transmitted through the filter. If a magenta filter, which passesall colors except green is placed over part of this yellow, then only red light is transmitted through thecombination (see Figure 3b). Similarly, if a cyan filter, which freely transmits the blue and greenspectral components, is placed over a portion of the yellow filter, then only the color green will betransmitted through the combination (see Figure 3c). Overlapping the cyan and magenta filters willpermit blue light to be transmitted as shown in Figure 3d. The superimposition of all three filters,shown in Figure 3e, transmits no light, thereby yielding black. One should note that in subtractivecolor theory, the primaries are opposite those foradditive color production, as shown in Figure 4.
1-6

Primaries
Additive Subtractive
Red Cyan
Green Magenta
Blue Yellow
Also, no individual projection of the subtractive primaries takes place; the primary colors are placedin physical contact with each other and the combination is projected.
Yellow ellow Magenta
Red
Yellow Primary Subtractive Combination of YellowFigure 3a & Magenta Primaries
Figure 3b.
Yellow Green
Cyan!
Subtractive Combination of Yellow & Cyan PrimariesFigure 3c
Blue BaMagenta Yellow Black
Cyan 7 a ge n I \ C~~Cyan _ -Green
Subtractive Combinations of Magenta, Subtractive Combination of Yellow,and Cyan Primaries Magenta, & Cyan Primaries
Figure 3d Figure 3e
1-7

Green
Additive Primaries
Cyan A Yellow
White
Blue Red
Subtractive Primaries
Magenta
Figure 4. Additive and subtractive primaries are oppositeeach other or are complimentary colors.
1.5 Tripack or Subtractive Color Photography
All color films (negative, as well as reversal types) consist of three emulsion layers, each one of
which is sensitive to a different spectral region. In addition, each emulsion contains a dye which is the
compliment of the color to which the emulsion is sensitive. That is, the blue sensitive layer contains a
yellow dye, the green sensitive layer contains a magenta dye, and the red sensitive layer contains a
cyan dye. A cross-section of a color film is shown in Figure 5. Referring to Figure 5a, any blue light
which is incident upon the film will expose the top emulsion layer. No blue light can pass through this
top layer and sensitize the other two emulsions due to the presence of a yellow filter between the top
and middle layers. Green light falling on the film will not sensitize the first emulsion because of its
wavelength. It will, however, pass through the filter (since a yellow filter transmits both red and green
light) and sensitize the green sensitive emulsion. Similarly, red light will not effect the blue and green
sensitive layers, but will pass on through these emulsions exposing the third or red sensitive layer.
White light, of course, will sensitize each of the three emulsions since it is composed of essentially
equal parts of red, green, and blue light. Conversely, the absence of reflected light (black) will
sensitize none of the emulsion layers. The remaining colors shown in Figure 5a, namely, yellow,
magenta, and cyan, will record proportionately on more than one emulsion. For negative color films,
the color dyes of each layer are formed in the development stage of processing in the following way.
Chemical substances known as couplers are incorporated into each emulsion. These couplers combine
with the oxidation products resulting from a reaction between the developer and the exposed silver
halide. The dye is formed in each layer in proportion to the amount of silver developed. The developed
1-8

White Red Green Blue Yellow Magenta Cyan Black
.l[ . Blue Sensitive Layer
Y L OW F I T I R
Green Sensitive Layer
E I I__::::::: :.: Red Sensitive Layer
Figure 5a. Exposure of color patches onto a negative filmas seen in cross-section.
Yellow Yellow Yellow Yellow
Magenta Magenta Magent Magenta
Cyan Cyan Cyan Cyan
Figure 5b. Color negative film after silver grains have beenbleached leaving the dye image.
Black Cyan Magenta Yellow Blue Green Red WhiteI ]
Figure 5c. Resultant color negative image generated frompatches shown in Figure 5a.
Figure 5. Reproduction of colors using negative films.
1-9

silver grains are then bleached out, leaving only the negative dye images, as shown in Figure 5b. The
resultant negative transparency (Figure 5c), is essentially complimentary to the original scene in both
tone and color. The overall orange appearance on the final negative film is caused by the residual
yellowish and reddish color couplers which provide automatic masking for color correction.Color positive emulsions basically perform in the same way that color negatives do. However,
during the development process, the film undergoes reversal which generates the positive images.Referring to Figure 6a, the color positive film is exposed to a series of color patches. The first
developer converts the camera exposed silver halide particles into metallic silver. After thisdevelopment has been completed and the processing has been stopped using a "stop bath", the film is
either exposed to room lights or chemically fogged. This procedure causes a reversal effect to take
place in the camera-exposed silver particles and the remaining unexposed silver halide crystals are
now exposed for the first time. This is shown in Figure 6b. The development by-products react with
the dye couplers in the film emulsion to form the cyan, magenta, and yellow dye images shown in
Figure 6c.The white patch is rendered clear in the final reversal image of Figure 6d, while the black patch
will be opaque since the subtractive combination of yellow, cyan, and magenta is black. Referring toFigure 3, the remaining subtractive combinations will be seen to result in the correct color
reproduction of the original scene shown in Figure 6a.
One further color film is worth describing in this section; namely, color positive infrared. Unlikethe color reversal film just discussed, color infrared is sensitive to the green, red, and near infraredportions of the spectrum, instead of the usual blue, green, and red. A yellow filter is placed in front ofthe camera lens to assure that no blue light will be imaged. Figure 7a shows a subject which reflectsall visible light, as well as infrared. After exposure in the camera, the film layers are sensitized asshown in Figure 7b. Unlike the usual color reversal films, the infrared sensitive layer contains a cyandye, the green sensitive layer contains a yellow dye, and the red sensitive layer contains a magentadye. After reversal exposure and color processing, the dye images of Figure 7d result. The blueportion of the scene is rendered black, the green portion is blue, while the reds are reproduced as greenand the infrared as red (see Figure 7c). The resulting transparency is a false color presentation of thesubject and the addition of the infrared light component makes this film quite useful for earthresources studies. Like other color films, however, it does have some serious limitations which will bediscussed in the next chapter.
When the infrared component of, say, vegetation is high, it tends to predominate over thenatural green color so that the foliage appears brilliant red on color infrared film. As the infraredreflectance decreases, more equal amounts of green and infrared may be imaged on the film. This
causes a shift in the foliage color from bright red to magenta.
1.6 Summary
The electromagnetic spectrum consists of radiant energy of different wavelengths; thewavelength interval from 380-760 nm is known as light and is composed of differentcolors.Color has three properties: hue, brightness, and saturation.
1-10

C Ma entalue Bran Red Infra- iWhite Red Green Blue Yellow Cyan agenta Black Blue Green Red Ira-ed Original Subject
LFigure 7a.
Bee ni y Yellow Fil er over Ca nera Lens: Blue Sensitive Layer
Y E L L O W F I L T E R.
X :Green Sensitive Layer
Red Senitive Layer :Infrared Sensitive LayerX.. "Red Sensitive Layer
Figure 6a. Cross-section of positive color film after exposureto color patches above. Green Sensitive Layer
Dyes:Yellow
.- .. - :.:.. Red Sensitive Layer
: : Figure 7b. Cross-section of positive color infraredMagenta D film after exposure to original scene.
.ii
: :
Dyes: Iii: ii i
Cyan Cyan
Figure 6b. Cross-section of positive color film after chemicalfogging of the emulsion. Yello
Yellow
Yellow Yellow Yellow Yellow
M agenta ........ .................... .............Magenta Magenta Magenta Cyan Magenta
Figure 7c. Cross-section of positive infraredCyan Cyan Cyan Magenta film after reversal.
Figure 6c. Color reversal film after silver grains have beenbleached leaving the dye image. Cyan Cyan Cyan
White(Clear) Red Green Blue Yellow Cyan Magenta Black Yellow Yellow Yellow
Figure 6d. Final color reversal image generated from patchesshown above.
Magenta Magenta Magenta
Figure 7d. Color infrared film after silver grains
Figure 6 have been bleached leaving dye images.
Black Blue Green Red
Figure 7e. Final color infrared image generatedfrom original scene.
Figure 7. Reproduction of colors using positive reversal film.

Color photographic processes are designed to accurately reproduce hue, brightness, andsaturation.Multispectral photography is based upon the additive color theory.Multispectral photography consists of imaging a scene with three primary filters andrecombining them on a viewer screen.Tri-pack color films employ the subtractive principal of color reproduction.Negative color films are usually used for production of photographic prints.Positive color or reversal films produce a positive transparency directly.It is possible to photograph the near infrared spectral region with the use of speciallysensitized materials.Additive and subtractive primaries are complimentary.
1-12

CHAPTER 2
CAPABILITIES AND LIMITATIONS
OF COLOR AND COLOR INFRARED FILMS
The human eye is a great deal more sensitive to differences in color than it is to differences inbrightness; as a result, a 10 percent error in the brightness of a black-and-white photograph will not
be particularly noticeable to the eye. However, a 10 percent error in, say, the blue balance of a colorphoto can degrade warm facial colors into shallow corpse-like tints. To assure against this, the
subtractive tripack system of color photography must provide accurate controls at every stage.
Cumulative color errors of 5 percent are generally considered to be the maximum since greater errorscan cause distortion and even complete loss of a color image. In spite of this, the manufacturers of
color films produce emulsions which, by and large, yield good results. This is accomplished by their
control of the imperfections at every stage: the film manufacture, the recommended exposure time,and the exact conditions of color film processing which they specify in detail. However, beforeselecting an emulsion for detailed scientific experiments, it is essential that one understand the exactlimitations and capabilities of color films.
2.1 Capabilities of Color Films
The greatest advantage of color tripack emulsions over multispectral additive photographyrests in the ability of the photographer to obtain a color reproduction of the scene within a reasonablelength of time and with the minimum amount of inconvenience. The photographer need only worryabout the lighting balance and the exposure in order to guarantee himself reliable scene reproduction.In addition, a great number of color film processing facilities exist, most of which are able to maintain
the precise processing control necessary in color work so that even this burden is removed from the
user. Regardless of whether negative color emulsions (producing prints) or reversal color films(transparencies) are used, there exist no major requirements for equipment with which to analyze theresults. A light table or projector for viewing transparencies is the.exception.
Since three layers of emulsion are coated onto a single base, light falling onto the film andexposing the three layers is, of necessity, registered automatically. That is, there exists no color
fringing around the edges of objects such as one often sees in printed photographic material such as
journals, textbooks, and comic pictures. This factor has obvious advantages, especially in aerialphotography taken at high altitudes.
The final resolution of an additive color presentation is less than a color emulsion owing to the
fact that multiple images must be superimposed manually through a series of projectors. To
understand the resolution advantage of color films over multispectral presentation, the following
example is given. Assume that a reversal color photograph, as well as three multispectral images of ascene have been taken at the same scale and that the resolution of each photo is 40 lines/mm. The
color film is projected at a magnification of 1:1, as are each of the multispectral records. After
superimposing the multispectral images as shown in Figure 8, the resultant composite will be the
color transparency.
2-1

I Color / Composite
Photo S Additivp
Figure 8. Projection of color photo and additive color presentation for comparison of resolution.
Neglecting any resolution loss caused by the projector optics, the color film image on the screen
/ \
of the color film is still excellent.II / I / - *.
/ / \ }'
Tri-pack Color Film Red Record Green Record Blue Record
Figure 8. Projection of color photo and additive color presentation for comparison of resolution.
Neglecting any resolution loss caused by the projector optics, the color film image on the screenstill has a resolution of 40 lines/mm. The multispectral presentation will only have a resolution of 40lines/mpecm if the projectors are set up correctly to within .0005 inches of each other.
Manufacturers of three-layer color films generally quote the resolution of their emulsions in thetechnical data sheets. For example, Eastman Kodak Ektachrome M-S film # 2448 has a resolution of80 lines/mm at a contrast of 1000:1 and 40 lines/mm at a contrast of 1.6:1. Although contrasts of1000:1 are almost never encountered in aerial work and contrasts of 1.6:1 are common, the resolutionof the color film is still excellent.
Color films are exposed through single lens cameras which, unlike multispectral multiple lens ormultiple camera systems, are easier to operate, cheaper, and require no special calibrations. Use oftripack films for the production of color photographs represents the ultimate in simplicity. Providingthe lighting and exposure are correct, color or color infrared photos produce acceptable results whichare intended to be pleasing to the eye and to approximate the colors in the scene.
2.2 Limitations of Color Films
Tripack color emulsions are not, however, without their limitations and disadvantages,especially when they are used for scientific purposes such as aerial photography.
One of the major difficulties encountered with the use of color films is the fixed exposure ratio ofeach layer to light. For example, if one is primarily interested in reproducing the blue parts of a sceneon a color film and there is only a small amount of blue light being reflected, the red and greenreflected light will mask or even eliminate the effect of the blue. Unlike tripack films, additive color
2-2

photography is not hampered by this situation. In the latter case, the imagery is obtained usingseparate lenses and one would merely open up the iris diaphragm of the blue lens and close down thered and green apertures. The final color of such a combination would then possess an adequateamount of blue.
By way of illustration, consider a scene in which the red and green components of the reflectedlight are 16 times greater than the blue component. Using a color film, the red and green emulsionlayers would receive 32 units of light for every 2 units received by the blue layer. In terms of exposure,this difference is 4 stops which is certainly sufficient to mask the blue light reflected from the scene.If, however, a multispectral photograph of the same scene were taken, the blue lens could be set at f/4and the red and green lenses at f/32. The blue multispectral image would then receive exactly thesame exposure as the red and green images. In other words, the blue component of the scene wouldappear to be as bright as the red and green. The result of such a procedure has the effect of"enhancing" the subtle color in the scene, i.e. blue.
The second major drawback of color films is that each layer is sensitive to a fixed range of color;namely, red, green, and blue (or in the case of color infrared film, green, red, and infrared). It may beimpossible, therefore, to tell the difference between two different color greens. The green layer mayrecord both colors identically so they will be indistinguishable. For example, consider the case of twowater masses identical in color except for two differences in the green spectral region. Theirreflectance curves might be similar to those shown in Figure 9. Using conventional color films, water
Water Mass A
100 - Water Mass B100
80-
60-
S 40
20-
0400 500 600 700
Wavelength in Nanometers
Figure 9. Subtle spectral distribution difference between two water masses.
mass A and water mass B would not be distinguishable. However, using additive color it would bepossible to filter one camera lens from 550 to 565 nm and another lens from 580 to 600 nm. Aftermaking black-and-white transparencies of each image and placing them in an additive color viewer,
2-3

one of the photos can be projected as green and the other as red. The color differences between thewater masses will now become obvious, whereas they would be indistinguishable on color emulsions.Unless it becomes possible to alter the wavelength bands, sensitivities, and exposure ratios of eachlayer, conventional color emulsions will not be extensively employed in the detection andidentification of subtle environmental color differences.
Another major disadvantage of color films lies in the fact that once the film is exposed andprocessed there is almost no way to alter the results. They are fixed and inflexible. The photointerpreter must analyze the film as presented to him without control over the density of color of theimagery. Additive color photographs have no such limitation, since the blue, hue, brightness, andsaturation of each image can be altered in the multispectral projector.
Color emulsions are somewhat hampered by poor keeping qulaities which can cause differentialASA speed changes between the layers. This will affect the color balance of the resultant imagery and,since there is no way to control either the density or the contrast of each layer, correction of thisproblem is almost impossible.
The inherent difficulties associated with exposure and processing of color films are discussedlater in this chapter. Lengthly processing times, as well as precise requirements for color filmdevelopment, can be disadvantageous when color imagery is required without the optimal processingconditions. Often when operating outside the United States, users cannot find adequate processingfacilities or cannot develop their color films because of poor water conditions, temperature, etc. Theyare required to ship their color films to the States for processing at a high cost and long delay.
In spite of these disadvantages, good to adequate color reproduction is possible using a tripackor multilayer emulsion, if certain requirements are satisfied both before and after exposure of the filmin the camera. Some of the factors which affect the reproduced color and which will now be examinedare:
- film storage prior to exposure- photographic exposure- the quality or color characteristics of the illuminant- film storage after exposure and before processing- processing conditions- final viewing conditions for the transparencies
2.3 Controllable Causes of Color Error
2.3.1 Film Aging
The manufacturers of multilayer color films naturally desire that their emulsions produce thebest possible results at the time of exposure and processing. Hence, they are generally quiteconcerned about aging of the film; color emulsions are perishable in that their characteristics changewith time and environmental conditions. Since color tripacks consist of three emulsion layers insteadof one (as is the case for black-and-white films), changes in temperature and storage conditions willaffect each of three layers somewhat differently. The result is that emulsion aging is considerablymore apparent in a color photograph than on a black-and-white one.
Using experience and statistical studies, color film manufacturers have ascertained the normal
2-4

conditions to which an emulsion will be subjected between its manufacture and its time of use. Colorfilm packages contain an expiration date based upon the assumption that the film was subjected to
these normal conditions. If the storage conditions were worse than normal, the film would naturally
prove unsatisfactory prior to the stated expiration date. Conversely, if the film had been stored in a
freezer at some temperature well below the suggested storage temperature of 68 0 F, then the film
would still produce satisfactory color long after the expiration date had passed.
In temperate climates no special precautions for film storage are necessary; this assumes thatthe film is kept in its moisture-proof packing until just prior to use. If the packing is removed, the film
must be kept free from moisture, preferably in a sealed container with a drying or desicating agent'
such as silica gel. If it has been stored in a refrigerator or freezer, the film should be kept in themoisture-proof wrapping until it becomes temperature stablized with the environment. Storage in
such a container also keeps chemical fumes (which exist in areas used for storing developer, hypo,fixer, etc.) from deteriorating the unexposed emulsion. High humidity also causes and increase in the
rate of change of the color film emulsion layers. However, it should be noted that subjecting the latent
image to high temperature and/or high humidity after exposure, but before processing, will cause
greater undesirable effects in the image than the same conditions would cause in unexposed film.
2.3.2 Exposure of Color Films
There are two basic types of tripack color films: the negative emulsion (which is generally usedfor the production of positive prints) and the reversal positive emulsion (which yields a positivetransparency directly). Accordingly, these two film types require different camera exposure controlsto create accurate scene reproduction. The exposure considerations for negative materials will beconsidered first.
Color Negatives:
Unlike the reversal transparency, a color negative is not the end product itself, but only themeans to an end - namely, a color print. In this sense, the exposure requirements for negativeemulsions are considerably less stringent than those for reversal materials. That is to say, an error inthe exposure of a negative color film may yet be corrected in the printing stage in order to alter boththe density of the images and the color balance. Printing a positive from a poorly exposed colornegative does, however, require a series of complicated tests to determine the exposure and colorbalance corrections necessary.
In order to reproduce correct tone and color, the negative color film must record the minimumdensity (darkest shadows), as well as the maximum density (brightest highlights) on the straight lineportion of the characteristic curve. There is, however, no constraint on the position of the maximumdensity along the straight line; hence, negative films have considerable latitude towards overexposureand it is much better to slightly overexposure the film if one is in doubt of the exact exposurerequired.
The brightness range of the scene is very important for negative films since color print materialcan only reproduce a limited brightness range. Any objects in the scene less bright than the lowerlimit of the print material and any objects which are more bright than the upper limit of the printmaterial will be distorted. Brightness and color are inseparable in color films; hence, any brightnessor tone distortions will cause a distortion in the color of the subject as well. An error such as this
2-5

cannot be removed during the printing process, since the unbalance exists within the brightnessrange. Color correction is only possible when we wish to eliminate unwanted color from the entirepicture, not when we wish to correct the color in the darkest and/or brightest areas. A very smallamount of this color unbalance may be removed by reducing the image contrast in the negative,however. Care should be taken that a suitable light meter is used to establish the minimum exposurenecessary for the darkest shadows. As long as the high and low tones are contained on the straightline portion of the characteristic curve, we are assured that all other brightness or tones of the subjectwill be in their correct positions on the curve.
Color Positives:
Reversal tripack films are used to yield a positive transparency directly and are, therefore, thefinal end product. The quality of a reversal transparency will depend upon the conditions present atthe time of exposure and little or nothing can be done to improve upon a poorly exposed image. Acolor transparency must possess exactly the right amount of unaltered silver halide in order toproduce the positive image, after the negative image has been developed to metallic silver. Grossoverexposure, therefore, will cause very little of the unaltered silver halide to remain and there is nochemical which can restore an image which has been dissolved away (as metallic silver) duringprocessing. Moderate overexposure will cause more than the desired amount of silver halide to beconverted into metallic silver in the highlights of the image. Hence, a loss of the small detail in thesehighlights should be expected with moderate overexposure.
Underexposure of a reversal film will leave an excess of neutral dye over the entire positivetransparency. Also, there will exist a lack of detail in the dark or shadowed areas and like itscounterpart, overexposure, there is no chemical which can restore the loss of detail in these dark areas.The range of exposure over which satisfactory results are obtained is quite small for reversalmaterials; deviations of between /2 and 1 stop from the optimal exposure are sufficient to causenoticeable color quality losses. It is essential, therefore, that an exposure meter be used to determinethe correct exposure on reversal films. The only exception to this rule is when exposure is taken undersunlight conditions. This is because the exposure of a reversal material is set in order to correctlyreproduce the highlights and the exposure of the highlights depends largely upon the intensity of theilluminant. The illuminant, sunlight, is sufficiently predictable for the manufacturer to be able torecommend reliable exposure times which will produce transparencies as satisfactory as thoseexposed with the aid of a light meter. When, however, the subject is in the shade or an artificialilluminate is used, we must again rely on the use of the exposure meter.
It has been stated that the exposure of a reversal material is selected so as to correctlyreproduce the highlights of the scene. This is because highlight details and the lighter tones of a sceneattract the attention of the eye due to their relative brightnesses. If exposure were based upon theshadow areas, the amount of dye left in the highlights would depend upon the contrast range of thescene. Hence, we expose for the highlights and let the shadow areas fall where they might.
There is one more interesting aspect of exposing a reversal film for highlights. Generally, thetransparency is viewed through a projector or is back-lit with a light box or table. If an error is madeby under-exposure of a reversal material, then viewing or projecting it with a brighter light willincrease the apparent luminosity of the highlights so that it looks as if it were correctly exposed.
2.3.3 Light Source Used for Exposure
2-6

The energy distributions of various light sources differ enormously. Figure 10 shows the outputof daylight, tungsten, and sunlight as a function of wavelength. Usually it is necessary to employ acolor correction filter in conjunction with both negative and reversal films so that consistentreproduction of the scene is maintained regardless of the illuminating light. Manufacturers of colorfilms publish the recommended filters for particular film and light conditions. Generally, no twocombinations are the same and strict adherence to this published advice is essential.
Illuminant A(Tungsten)
100 - - Sunlight
80 - Daylight
60 -
40 -
20- (
400 500 600 700 800
Wavelength in Nanometers
Figure 10. Spectral distribution of daylight, sunlight, and tungsten lamp (Illuminant A).
2.3.4 Color Film Processing
One of the greatest sources of error in the accurate reproduction of color using tripack films
rests with the extremely long and tedious development procedure. Processing color emulsions is much
more complex than processing black-and-white films and as such requires a high degree of regulation
each step of the way. All of the care which is taken to correctly expose the film may be completely lostif the development is not precisely controlled. This includes exact specifications as to:
- processing time- agitation- solution temperatures- correct mixing proportions of chemicals- solution replenishment
For color development, a rather large number of tanks are required; there should be one tank for
each stage of the process. The tanks generally come supplied with a number of holders for sheet film
or a reel upon which roll film is wound. Either one permits the film to be quickly transferred from one
tank to the next. Although it is possible to use fewer tanks by emptying one solution and refilling the
2-7

tanks with another, this method is tedious and may appreciably influence the timing of the processingstrips. Color emulsions must be processed in total darkness for long periods of time so that anuncomplicated darkroom set-up will assist the operator in maintaining the development schedule, aswell as his sanity. For example, Table I shows the processing sequence for negative and reversal coloremulsions. The estimated time to complete these steps ranges between sixty and ninety minutes.One can readily understand that a tank for each of the steps mentioned in Table I definitely has itsadvantages over using the same tank for different solutions by transferring them from storagecontainers.
Step # Color Negative Color Reversal
1 Color Development First Development2 Washing Wash or Stop Bath3 Stop Bath Hardening4 Washing Washing5 Bleaching Second Exposure6 Fixing Color Development7 Washing Washing8 Hardening & Stabilizing Bleach9 Drying Washing
10 Fixing11 Washing12 Drying
Table I. Procedure for processing negative and reversal color films.
The manufacturer's instructions supplied with color films generally recommend the use ofprocessing kits for development. The pre-measured chemicals which are contained therein areaccurately proportional so that by following the mixing instructions exactly, the best guarantee ofconsistent results is offered. Never use mixing instructions from a previous processing kit;manufacturers often make minor changes both in the proportions of the chemicals and the timing ormixing instructions in order to achieve better results. It is imperative that no contamination of thechemicals take place since it is likely that the result will be a roll of film which is unuseable orunprintable.
Since the rate of development is dependent upon the solution temperature, the manufacturer'sspecifications (generally 680 F) must be adhered to. This is important since the rate of development ofeach layer will change under different solution temperatures and yield a color balance in the filmwhich is incorrect. The easiest way to maintain the recommended temperature is to place each tank ina common water bath which is maintained at 680 F. Thermostatically controlled water mixing units oran accurate thermometer serve to keep this variable constant. The temperature must be checkedbefore the start of development.
In addition to temperature, the rate of development of each layer is affected by the agitation ofthe films in solution. The processing instructions usually specify exactly the amount of agitation to beused in a given interval of time. This is one of the tasks which makes color processing so tedious.
2-8

If one intends to do any great amount of color developing, a reference standard should be used
to judge the acceptability or unacceptability of the process. A number of step wedges are exposed in a
sensitometer using the same film type (and preferably the same film lot) as will be used to expose the
scene. With fresh chemistry from a suitable processing kit, one of the step wedges is processed and
becomes the "standard". The others remain unprocessed and are stored for future use when it will be
desirable to compare the results of the used chemicals with the results when the chemistry was new. A
fairly accurate idea of developer depletion can be seen by plotting the measured density differences
between the standard wedge and the test wedge. The exact procedure for setting up such control
charts is discussed in Chapter 7.
2.3.5 Color Film Storage After Processing
Color films are much more stable after processing than they are before. Nevertheless all color
films (particularly negatives since they are used to produce positives) should be handled with care to
avoid degradation of the color. High humidity (especially in conjunction with heat) can cause a mold
to form which will leave tiny, indelible marks on the film. Storage of films in air-tight containers with
a desiccant will eliminate the problem.
Films should be kept clean, dust free, and handled only by the edges. Transparent sleeves
provide adequate protection from finger marks and dirt. Gloves should be worn when the films are not
mounted in slide holders or sleeves. In addition to physical handling, long exposures from projection
lamps will accelerate fading of the color. Moisture increases the fading rate, while chemical fumes will
char.ge the color balance and eventually ruin the dye images. Films can be cleaned by either of the
follox ring methods:
- Dust and Lint - Remove with a clean camel hair brush or soft, lint-free cloth.-- Fingermarks or Grease - Remove with commercially available film cleaners applied with a
soft wad of cotton.
2.4 Uncontrollable Causes of Color Error
2.4.1 Manufacturing Tolerances
The ability of either a negative or reversal tripack emulsion to yield acceptable colorreproduction and tone is dependent not only upon the care of the user, but also upon manufacturing
limitations. Theoretically, all rolls of film of the same type should perform identically under identical
conditions. This is, in fact, not feasible since no manufacturer can make all production runs of an
emulsion coating exactly alike. Small variations from the ideal set of film specifications constitute afilm tolerance which must not be exceeded. For example, Eastman Kodak only releases those batches
of Ekachrome film which are correctable to the rated film speed by adjustment of the camera lens
diaphragm not to exceed 1/2 stop. Assuming the film has been stored correctly, the speed of
Ektachrome film will be within '/2 stop of the published value (given on the film data sheet). Similarly,the color balance of the Ektachrome emulsion is maintained so that all the released film meets the
following specification. The color balance of the released emulsion must be no greater than the color
shift generated by using a Kodak CC10 Color Compensating Filter. Fpr optimal results, however, thecolor balance and speed of any film should be established by trial exposures so as to account for any
2-9

small variations in manufacturing tolerances, storage anomalies, and processing conditions.
2.4.2 Reciprocity Effect
All photographic emulsions are designed to be exposed for some nominal time to a specificsource of light. This assures correct color balance and tone. It is not always possible, however, tofollow these exposure times and often the necessary exposures are considerably longer or shorter thanthe manufacturer's recommendations. Beyond certain limits this causes a shift in the exposure of eachlayer, as well as the rated film speed and is known as reciprocity effect. The film manufacturersusually supply (for each emulsion) the adjustments which are required for exposures quite differentfrom the normal exposure times. Consider Figure 11. The reciprocity law failure characteristics aresimilar over the range of exposures from .10 second to .001 second. Exposure times longer than .10second cause a change in the speed of each layer. Hence, a filter over the lens would be required toproduce the correct color balance. Also, the rated film speed of ASA 64 would only be valid over theexposure range of .1 to .001 seconds. An example of the reciprocity characteristics of color films assupplied by the manufacturers is as follows:
Exposure Time Exposure Correction Filters Required
1/1000 sec. None None1/100 sec. None None1/10 sec. None None1 sec. +1 Stop CC10 Red10 sees. +1 '/2 Stops CC10 Red100 +2 1/2 Stops CC10 Red
If the ASA of this film is 64 and one is using a light meter, then at an exposure of one second, themeter should be set at ASA 32 (1 stop less). The addition of the red correction filter indicates that thereciprocity law failure is least for the blue and green sensitive emulsion layers.
Time (Seconds)
100 10 1 0.1 0.01 0.001
o
)1.0
2.0 1.0 0 1.0 2.0
Log I (meter candles)
Figure 11. Reciprocity law failure in a reversal color film.
2-10

It is often more practical to send color films out to a developer to be processed than to equip alab with the necessary controls for accurate results. Several aerial film processing centers areavailable and reliable results are guaranteed. The following companies offer such services and theirwork is quite good:
- Data Corporation, Dayton, Ohio- Color Technique, Chicago, Illinois- Key Color, Mineola, New York
'It is also true that government agencies such as NASA, RADC, WPAFB, etc., have excellent colorfilm processing facilities. They are, however, often backlogged and it may take some time before thework can be done.
2.5 Relationship Between Processed Color and Standard Test Panel Color
Whenever it is required to produce the best possible results using color negatives or reversalfilms, both exposure and processing tests should be made. Understanding corrective procedures forcolor emulsions is invaluable for the skillful handling of these materials. The means for determiningthe printing characteristics of color negative films will be considered first.
The principal causes for speed and color balance changes in the color negative are:manufacturing variations, poor storage conditions, incorrect exposing illumination, film sensitivitydifferences as a function of light level, and non-standard processing conditions. One or more of thesecauses can occur at the same time (their effect is usually additive); hence, unsatisfactory prints will beproduced unless compensation is made in advance.
When evaluating the exposed color negative for printing, it is essential that determination bemade of the exact exposure, as well as the specific set of printing filters to be used. A procedure hasbeen established which consists of comparing the relative amounts of red, green, and blue light whichare transmitted through a standard step wedge on the film. This standard wedge may be either: (a)placed in the scene and photographed under the same illumination conditions as the subject, or (b)sensitometrically exposed on the leading and trailing ends of the color film roll prior to cameraexposure. This test target usually consists of a gray scale; Chapter 4 discusses the advantages ofplacing such a target in the scene.
Regardless of the exact color printing material used, each consists of three layers sensitized to aparticular color light - red, green, or blue. Hence, each layer must receive the correct exposure inorder to yield both satisfactory density and color balance on the reproduction. A change in the overallexposure time will affect all three dye images, while color compensating or printing filters will affectthe exposure of one or two of the emulsion layers. For example, a yellow filter affects only the bluelayer, while a green filter will affect both a blue and red sensitive layer. By manipulating the overallexposure, as well as the printing filters, a proper exposure on each of the three layers can be obtained.The evaluation of a color negative consists basically of a measurement of the red, green, and bluedensities of the standard target negative which indicates the adjustment necessary to produce correctcolor reproduction.
Three step wedges will be evaluated in this analysis. They are:
- The standard which is exposed onto the film leader and trailer.- The negative step wedge resulting from processing the color film.
2-11

- The best possible color print step wedge.
Measurements of color densities require the use of a color densitometer or, if the densitometer is not
supplied with color filters, the use of a Kodak Wratten #70 (red) filter, a #99 (green), and a #47B (blue)will suffice. After color processing the entire roll of film, the step wedge is removed from the roll and a
series of test prints are made from it. The gray scale should (in the positive) be strictly gray - no tint
of red, green, or blue should be present. The best possible color print is then set aside and the
following procedure is used to print the positives of the actual photography. Reference is made to the
data sheet of Figure 12. Assume that the densities for the standard negative are: R = .95, G = 1.0, B= 1.20. Assume that the densities for the production negative are: R = 1.10, G = .95, B = 1.10.
- Measure the red, green, and blue densities of the midgray scale patch in the standard
negative wedge. Reading to two places is usual. The red reading is recorded under cyan of
Figure 12, the green reading is recorded under the magenta in Figure 12, while the blue
density is shown under the yellow column of Figure 12.- In the appropriate column, record the values of the printing filters used to produce the best
positive of the step wedge.- Add the steps 1 and 2 in Figure 12 for each column.- Measure the red, green, and blue densities from the negative produced from the standard
wedge. Enter these values in the appropriate columns of Figure 12.
- Subtract the values shown in Step 4 from those in Step 3 of Figure 1.2
- Add or subtract the amount shown in the first column of Figure 12, so that the cyan value is
zero, (step 6).- The resulting values under magenta and yellow represent the printing filters to be used.
(step 7).- To determine the correct exposure for the print, take the cyan value (step 6) shown in Figure
12, refer to Table II, and multiply the exposure used to produce the negative step wedge by
the value shown in this table.
Cyan Magenta YellowStep # (Red Reading) (Green Reading) (Blue Reading)
1 .95 1.00 1.20 Standard WedgeDensity
2 +0 + .65 + .80 Print Filters
3 .95 1.65 2.00 Add 1 and 24 -1.10 - .95 -1.10 Production Nega-
tive Density
5 - .15 .70 .90 Subtract 4 from 3
6 + .15 + .15 + .15 Value added orsubtracted to makecyan = 0
7 0 + .85 + 1.05
Printing Filters = 85M and 105Y
Figure 12. Negative evaluation table for printing positives.
2-12

Cyan Value ofStep #6 +.40 2.6
+.30 2.0+.20 1.6 Multiply Standard+.10 1.25 Exposure by this+0 1 Value.
-.10 0.8-.20 0.65-.30 0.50-.40 0.40
Table II. Exposure Calculation Table
This procedure gives the correct printing filters and exposures required to produce color correctprints.
The use of test exposures is even more essential in the case of reversal materials since it is notpossible to alter the density or color balance in the final reproduction. Positive images are produceddirectly so that it is essential to: (1) expose a number of step wedges onto the reversal film, (2) processthem before the actual imagery, and (3) examine them for accuracy of reproduction, relative to theoriginal step wedge. A list of possible color processing errors is shown in Table III and each stepwedge processed by the reversal development kit is examined for these errors. When found, thecorrective procedure indicated in Table III should be taken.
Table III. Positive color processing errors.
Appearance of Film Possible Causes
Very dark, almost opaque Bleach or fixer omitted.
Dark overall Idadequate time, temperature, or agitation in FirstDeveloper. First Developer underreplenished,exhausted, or diluted.
Light Overall Excessive time, temperature, or agitation in FirstDeveloper. First Developer overreplenished.
Overall density variation from batch to batch Inconsistencies in time, temperature, or agitationin First Developer; or variations in First Developerreplenishment rate.
Red Color developer improperly mixed.
Bluish-magenta Color developer diluted, exhausted, or under-replenished.
2-13

Magenta areas and streaks Uneven or insufficient agitation in First or Color
Developers.
Yellow Film fogged by room lights during First Developerstep (may show partial negative image).
Yellowish-green Film fogged by yellow-green safelight; ColorDeveloper overreplenished or too alkaline.
Blue specks Chemical contamination. Do not allow metallicparticles or chemical dust to come in contact withfilm.
Fungus or algae in processing solutions Can be controlled by cleaning and sterilizingsolutions or wash tanks processing, replenisher, and wash tanks periodical-
ly. Use a 50-micron rating (or finer) filter in thewater supply system.
2.6 Summary
- Color films possess the following basic advantages: excellent resolution or registration of the.
color, any single lens camera is adequate for exposure of color film, results are generally goodapproximations of the colors in the scene, no requirement for auxiliary equipment withwhich to view the results, a single exposure value is valid for each of the three layers.
- Color films are limited by the following factors: fixed exposure ratio between the emulsionlayers, fixed sensitivity of each layer to light of a particular color, final color on film cannot
be altered to any great extent, requirement for precise exposure and processing, high cost.
- Storage of color emulsions should be at low temperatures and humidity; they should be keptaway from processing chemicals which can cause them to deteriorate.
- Errors in brightness of a scene on color films, also affects the color of the subject.- Negative color films are exposed so that both shadows and highlights fall on the straight line
portion of the characteristic curve.- Reversal color films are exposed so as to correctly reproduce the highlights of the scene.- Color films often require the use of a correction filter because of differences in the quality of
the illuminating source.- Processing kits are recommended for developing color films and strict adherence to the
manufacturer's instructions is essential.- Solution temperature, agitation, and processing times greatly affect the appearance of
images on color films.- Storage of processed color films away from high humidity, dust, long exposures to light, and
chemical fumes will maintain the stability of the color dye images.- Negative color film evaluation consists of determining the correct exposure and printing
filters which will be required to obtain satisfactory color reproduction.- Changes in printing exposure alters the color balance of all three dye layers.- Use of printing filters alters the color of only one or two of the emulsion layers.
2-14

CHAPTER 3
IMAGE COLOR MEASUREMENTS
The complete interpretation of color imagery requires that the photo interpreter be able toaccurately define his visual color sensations on an extremely consistent basis. Some typical questionsconcerning color quality may be: "Just how red is the red image", "To what extent does it differ fromanother red image?", and more importantly "How much variability in the perceived red color existsbetween several photo interpreters?". The importance of these questions rests in the fact that what wesee in an image, including its color, is our best guess as to what it is. In an effort to solve the dilemmaof accurately specifying a color sensation, many color languages and systems have been devised. Onlythree will be presented here, but they are the most popular: the Munsell, the CIE Colorimetric, andthe CIE Spectrophotometric systems of color definition.
3.1 The Munsell System
The Munsell System consists basically of specifying the appearance of a color by visuallycomparing it to a set of standard color chips or samples. These color chips are positioned in what isknown as the Munsell Color Solid, shown in Figure 13. The central axis, representing the neutral orgray colors, is divided into ten equal steps with the white point at the top and the black point at thebottom. This axis specifies the degree of lightness or brightness of a color and is called VALUE in theMunsell notation. Munsell value is zero for an ideal black surface having a reflectance equal to zero;the Munsell value is ten for an ideal diffusing white surface having a reflectance equal to 100 percent.
Munsell
White
9/ 9/2 9/4 9/6 9/8 9/10 9/12 9/14
8/2 8/4 8/6 8/8 8/10 8/12
7/2 7/4 7/6 7/8 7/10
6 6/2 6/4 6/6 6/8
5/2 5/4 5/6
B5B 10 5 10
BG B G 4/ 4/2 4/4
3/ 3/2
2/ 2/2
/1
Quarter of solid
;-removed to show1 1interior selection
Figure 13 - Munsell Color Solid.
3-1

The Munsell System defines 100 hues of equal perceptible difference. These hues are divided
into ten groups of ten hues each. The hue groups are given initials representative of the central
member of the group as shown in Figure 14a. The groups are, actually, ten equally spaced vertical
planes (Figures 14b) passing through the neutral or value axis and specify the major colors in the
Munsell System. Ten minor hues surround each principal hue and they are numbered from one to ten.
Hence, the most purplish of the red group is designated as 1R, the most yellowish of the red group as
10R, while the pure red hue is denoted as 5R, or simply R. More detailed letter abbreviations become
difficult to handle so that the number-letter combinations (such as 3G) are generally used. The
saturation of a color is determined by its horizontal distance from the central value axis and is known
as CHROMA in the Munsell notation. The number of chroma steps depend upon the hue and value;however, each step represents equal saturation intervals.
R 23456
Figure 14a. Hue designations in the Munsell Color Chart.
YR 9 1BI I
9 I
8IR 7
6 ,
Neutral RP 5 , I
Axis 4 /
Figure 14b. Hue planes of the Munsell Color Solid.
3-2

The appearance of a color in the Munsell System may be specified in two basic ways:
- By visual description - purple, yellow-green, etc., as shown in Figure 15. The difficultywith this method is the confusion of associating the color name with the visual sensation.
- By letter and number - for example, 7R (or the 7 section in the red segment).
Munsell 4R-6R10-
White9 - Pale Light
Pink Pink
Strong Vivid8 Yellowish Yellowish
Pink PinkLight Gray-
Gray ish Moderate
7 - Pink Pink
Light Deep6 Grayish Dark Deep Yellowishre Pink Pink
Medium 0 Red Pink
Gray
C - Grayish Moderate StrongRed Red Red
4-
DarkGray V
3 -w DarkGray- Dark Red Deep
ish RedRed
VividRed
Black'0Very
1 Very Dark DeepRed Red
0il l l I I I I I l l
0 1 2 4 6 8 10 12 14Munsell Chroma
Figure 15. Color names associated with Munsell solid.
The complete Munsell description of color is written in the following way: Hue Value/Chroma.Hence, 5Y 6/5 designates a color which has a pure yellow hue, is slightly brighter than the centervalue, and has a chroma which is five steps from the neutral gray value of six. It should be noted thatintermediate hue values are possible, such as 5.5Y 6/5. Neutrals or grays are given the letter notion
3-3

N; for example, N/5 represents a gray in the center of the value scale since there is, of course, no hue
description for neutrals. The Munsell Book of Color, containing over 1200 chips, is so manufactured
that the hue, value, and chroma spacing between the samples is intended to be visually uniform. The
Book of Color is used to subjectively evaluate the appearance of a color, providing that average
daylight (neutral or artificial) is used as the illuminant. When comparing an unknown color with the
Munsell chips, the unknown must be placed adjacent to the chip and held in the same plane. If this
cannot be accomplished, then rectangular paper masks of the same size are placed over both the
sample and the chip. It is essential that the brightness or value of the mask be about the same as the
sample. That is, if the unknown sample is light, the mask should be light and if the unknown is dark,the mask should be dark. Precise color comparison is not possible when the value of the mask is
appreciably different from the unknown. Examples of this fact are shown in "Color: A Guide to Basic
Facts and Concepts" by Burnham, Hanes and Bartleson.
The primary disadvantages to the Munsell System are threefold:
1. It employs the extremely variable human eye.2. It is only applicable to opaque test objects.3. It is extremely difficult to manufacture the exact required color in the chips and, indeed, it is
often impossible.
3.2 CIE Colorimetric System
In 1931, the CIE System was adopted as the international standard for the specification ofcolor. Contrary to the Munsell System, the CIE precisely defines the illuminant and viewingconditions of the sample (color) and has established a mathematical framework for the objectivespecification of color.
A set of three standard illuminants exists in the CIE system:
1. Illuminant A, which consists of a gas-filled tungsten lamp operating at a color temperatureof 2854 0 K.
2 Illuminant B, which consists of an illuminant A lamp and a special filter to produce an
approximation of noon sunlight. Its color temperature is 4870 0K.3. Illuminant C, which consists of an illuminant A lamp and a special filter to produce an
approximation of daylight or a completely overcast sky. Its color temperature is 67400 K.
Let us assume that one of the CIE standard illuminants is used to view a colored object. It is
apparent that the appearance of the colored object will change depending upon its size, its
background color, and its proximity to other colors. Variations in the adaption of the visualmechanism of the eye can affect the color that is observed. In an effort to minimize these effects, the
CIE system has precisely defined a standard manner in which colors are to be viewed:
- A circular field of view subtending a visual angle of 2 degrees.- A completely dark background.- For reflecting materials, the illumination angle must be 450 and the sample must be viewed
normal to its surface.
3.2.1 Colorimetry
Colorimetry is defined as the technique associated with the physical measurement of a color. Itwas developed to fulfill the critical need for a color specification system which would be more accurate
3-4

and more precise than the system of using color chips and color names. Colorimetry is not a subjectivescience; that is, unlike the Munsell it is generally not dependent upon an observer. Rather it is amathematical description of the color perceived by the visual mechanisms of the eye, in terms of thethree basic independent variables of hue, brightness, and saturation.
It would seem natural, therefore, that these three attributes of color could be envisioned by andrepresented in a three-dimensional diagram. The CIE system established a color solid shaped like arounded triangle standing on its apex, as shown in Figure 16. The brightness is represented by thevertical axis with the black point at the bottom of the solid and the white point at the top. The huesare located around the periphery of the triangle, while the line of desaturation exists between any huepoint on the periphery and the neutrals or vertical axis.
GREEN
HUE
SATURATION RED
BLUE
VARIABLES1 - HUE2- BRIGHTNESS
Figure 16. CIE color solid. BLACK 3- SATURATION
THE COLOR SOLID
If one takes a horizontal slice through the color solid of Figure 16 at any brightness level, thenFigure 17 is produced and is commonly called a chromaticity diagram. Referring to Figure 17, the hueis given around the edge of the chromaticity diagram in terms of dominant wavelength. Notice thatthe wavelength of the deepest purple is 380 nm at the lower left of the figure. Following the peripheryof the pure colors towards green to yellow and red, the highest dominant wavelength for the visiblespectrum is 700 nm.
The question which arises at this point is, just what do the color coordinates (x, y) shown infigure 17 represent and how do they relate to the color sensation we perceive. The color coordinates (orchromaticity coordinates) uniquely describe a particular visual stimulus in terms of hue, brightness,
3-5

.700
YELLOWISH
GREEN
YELLOWGREEN
.200 -
ORANGFigure 17. CIE chromaticity diagram.REDDISH
Also, we shall now measure:
-- the distance between the white point and the pure hue (BW)
- the distance between the color and the pure hue (AB). If AB is one unit long, then BW
measures about 3.5 units long. Desaturation of the color is computed directly from these two
measurements as follows:
Desaturation = AB = 1 = .285BW 3.5
Since desaturation is the opposite of saturation, the latter may be written the following way:
% Saturation = 100% - (% Desaturation)
Hence, in the example above, the color is 28.5 percent desaturated or it is 71.5 percent saturated or it
3-63-6

.6 %
.4
W
.2
.2 .4 .6 .8
Figure 18. Calculation of desaturation from chromaticity diagram.
is 71.5 percent pure. Summarizing now what has been determined about the chromaticity coordinates
(.15, .7) plotted in Figure 18.
- the general color is green- the dominant wavelength or hue is 520 nm
- the saturation is 71.5 percent
- its brightness is 100 percent
Note that in the above case, not only were the chromaticity coordinates given, but the brightness level
of 100 percent were defined. The correct way of specifying this set of color coordinates as well as the
brightness level is (x, y, Y), where Y is the percent brightness of the color.
The versatility of the chromaticity diagram also allows for a simple determination of the
resultant color produced by an additive combination of two lights. Consider Figure 19. The primary
lights are represented by the corners of the inscribed triangle. The choice of primaries for additive
viewing should fulfill two conditions:
- The area within the triangle should be as large as possible, since only colors located within it
may be additively produced by mixture of the primaries blue, green and red.
- The triangle should be shifted towards the yellow region since pure yellow exists in nature,while pure cyan does not.
The colors produced by the addition of the red and green primaries of Figure 19 will all lie along the
line GR, their exact positions being a function of the amounts of each primary mixed to produce the
color. The additive combinations of the red and blue primaries will lie along the line BR and the
additive combinations of the green and blue primaries will produce colors along the line BG. It can
also be seen from Figure 19 that the additive combination of one primary and its complimentary color
will produce hues which lie along the line passing through the white or neutral point. For example,adding blue and yellow light will produce colors along the line BWY.
3-7

Green G
538
G Yellow
Cyan WC
' C615 Red, W C R
Blue ' MagentaB
420x
Figure 19. CIE diagram showing primaries and the color triangle produced by them.
To understand how the chromaticity coordinates (x, y, Y) are generated, it is necessary toexplain one of the most fundamental concepts of color: any sample color can, in general, be matchedby the mixture of at least three primary colors. This concept will now be explained.
3.2.2 Color Mixture
The Three Primary Method of color mixing consists of matching a sample color by thecombination or addition of three primary colors nominally described as red,.green, and blue. Considera set of four projectors arranged as in Figure 20. Notice that the first projector contains a blue filter,the second a green filter, and the third a red filter. Projector #4 contains no filter and each unit isequipped with an iris diaphragm to control the amount of each primary being projected onto thescreen.
Iris .#4 -- -- Sample
* - Color
Sample
#3 Red Filter U ' -- -A
Additive#2 Green Filter - Mixture
#1 Blue Filter :_ ..... .-.
Figure 20. Three Primary Method of color matching.
3-8

Let us initially ignore projector #4 and examine what happens when we optically mix differentamounts of the primary colors.\By turning off the blue light and altering the proportions of red andgreen, a series of colors is produced on the screen ranging from pure red to pure green and passingthrough orange-red, orange, yellow, and yellow-green. Similarly, by turning off the red light andprojecting the blue and green, a series of colors is produced ranging from pure green to pure blue andpassing through cyan (turquoise). Again, by turning off the green light and projecting only varyingamounts of blue and red, it is possible to produce all colors ranging from pure blue to pure red andpassing through magenta (red-blue). If equal amounts of the red, green, and blue primaries areprojected, the resultant color is white or neutral gray. When unequal amounts of the three primaries
are projected, the color combination is something other than white or neutral gray.
If a sample color, H, is shown on the screen through projector #4, there will exist somecombination of the amounts of the primary colors' from projectors, 1, 2, and 3 which will match thesample color. Hence, it is said that the color, H, is equal to, or is produced by, optically mixingtogether X units of the red primary, Y units of the green primary, and Z units of the blue primary.Writing this mathematically.
H = (X)r + (Y)g + (Z)b
This color may not be specified in terms of X, Y, Z; that is, in terms of the amounts of the threeprimaries necessary to create a match to the sample color. X, Y, and Z are called TRISTIMULUSvalues.
Assume now that the color, H, consists of 86 units of red, 52 units of green, and 8 units of blue.
Written mathematically,
H = 86r + 52g + 8b
Although we might be tempted to say that this color is reddish (since there are more units of red thangreen or blue), it is easier to analyze the color in terms of percentage of red, the percentage of green,and the percentage of blue than analyze it in terms of number units.
#Red Units = 86 = .589Proportion Red = Total #Units 146
#Green Units = 52 = .356Proportion Green -
Total #Units 146
Proportion Blue = #Blue Units = 8 = .055Total #Units 146
Therefore, the color H, is 58.9 percent red, 35.6 percent green, and 5.5 percent blue. The proportions ofthe primaries as defined above are now rewritten using the tri-stimulus notation:
XProportion Red = - xX+Y+Z
Proportion Green = = yX+Y+Z
Proportion Blue = - zX+Y+Z
3-9

x, y, z are called TRICHROMATIC coefficients. Note that x and y are the chromaticity coordinates
that were discussed previously and the tristimulus value of Y defines the brightness level. Hence the
color, H, is uniquely defined as (x, y, Y) = (.589, .356, 52). The question may arise as to why one
specifices this color as (x, y, Y) and not as (x, y, z, Y). Since x, y, and z are proportions, they will
always add up to the number 1.00; therefore, if x and y are known, then z is also known:
z= -x-y
In order to examine the effects of the tristimulus values (X, Y, Z) and the trichromatic or
chromaticity coordinates (x, y, Y) in terms of hue, brightness, and saturation of a color, consider the
sets of tristimulus values in Table IV.
Tristimulus Value Case # 1 Case #2 Case # 3 Case # 4
X 40 30 50 20
Y 80 60 90 80
Z 20 15 30 20
Table IV
- Case #1: Represents an arbitrary set of tristimulus values.
- Case # 2: Each tristimulus value of case # 1 is reduced 25 percent.
- Case # 3: Each tristimulus value of case #1 is increased by 10 units.
- Case # 4: The X tristimulus value decreased from case # 1; Y,Z values identical with case # 1.
Using the Equation 3.1 for x and y given previously, the trichromatic coefficients for each of the
above cases are now computed:
X 40Case # 1 x X+Y+Z 140 .285
Y 80y - .571
X+Y+Z 140
y = y = 80
X 30Case # 2 x = - = .285
X+Y+Z 105
Y 60yY= .571X+Y+Z 105
y = y = 60
3-10

Case # 3 X 50 .294X+Y+Z 170
Y 90Y X+Y+Z 170
y = Y = 90
Case # 4 x X 20 .166X+Y+Z 120
Y 80y - .666
X+Y+Z 120
y = Y = 80
Plotting these four sets of chromaticity coordinates in Figure 21 and summarizing the results,
we find:
Case # 1 Case # 2 Case # 3 Case # 4
x .285 .285 .294 .166
y .571 .571 .529 .666
Y 80% 60% 90% 80%
Dom. A 543 nm 545 nm 545 nm 520 nm
Saturation 60% 60% 50% 70%
Table V
Examination of these results leads to the following conclusions:
1. As long as the ratio between the tristimulus values (X,Y,Z) remains the same, both hue and
saturation will be constant; only the brightness of the color is altered (see Case #1 and Case
#2.)2. Adding an equal amount of extra light units to each tristimulus value will desaturate the
color and make the image brighter; the hue, or dominant wavelength, remains the same (see
Case # 1 and Case # 3). Since equal amounts of (X, Y, Z) produce white, then it may be said
that this is equivalent to adding white light to the color in Case # 1 or desaturating it;
brightness is naturally increased by addition of more units.
3. The hue, or dominant wavelength, is only changed by altering the proportions of X,Y,Z (see
Case # 1 and Case # 4).
Summarizing: The Three Primary Method of colorimetry consists of matching any sample color by
the mixing of three primary colors; nominally, red, green, and blue. In order to successfully match
3-11

" \ so\ o
520
.602.5 50 \ 0
.10
.2 0 8 4 8 5
.05
450
.05 .10 .15 .20 .25 .30 .35 .40 .45 .50 .55 .60 .65 .70
X
Figure 21. Chromaticity coordinates associated with the data of Table V.
any sample, the following two conditions are necessary:
- That none of the primaries may be matched by any combination of the other two; that is,each primary is unique.
- That the brightness or luminance of each primary be continuously variable. That is, eachprimary may be added, to a greater or lesser extent, to create a match to the sample color.
When a visual match has been made to the sample, the amounts of each primary required for thatmatch are measured and they become the specification of the sample. Chromaticity coordinates, onthe other hand, are specified as the proportion of the primaries in the matched color (not the amount).Most sample colors can be matched by the mixture of the three primaries: red, green, and blue. Thatis, a color, H, may be specified as:
H = r units of red + g units of green + b units of blueor:
H -r(R) + g(G) + b(B)
Further analysis has shown, however, that some colors cannot be suitably matched in thisfashion. That is, there appears to be (to the eye) an excess of one primary in the matching field. Hence,the sample color and the mixed primaries can only be made to match by adding some primary to thesample color. For example,
(1) Non-match: H = r(R) + g(G)(2) Match: H + b(B) = r(R) + g(G)
In this illustration, the color, H, (in situation 1) is not matched to r units of red and g units of green;there appears to be an excess of blue in the primary field. By adding b units of blue to the sample field(as in 2), however, a color match is made. The equation (2) above may be written:
H = r(R) + g (G) - b(B)
3-12

The amount of primaries in a mixture, then, may exist as either positive or negative quantities. Using
this Three Primary Method of color matching, the CIE in 1931 selected a set of three primary colors
(peaking at about 436 nm, 546 nm, and 700 nm) to match very narrow color bands throughout the
visible spectrum. The amounts of red, green, and blue primaries required to create these matches were
then plotted and are shown below in Figure 22.
0.36
0.32(b)
0.28
6 0.24
S0.20
S0.16
8 0.12-zp 0.08-
0.04
W 0.00
-0.04 -
-0.08
-0.12 I I I
400 500 600 700
WAVELENGTH
Figure 22. Standard observer color mixture curve.
The pure color at 470 nm, for example, was matched by 16 units of blue, 3 units of green, and minus 4
units of red, or:
H470 = -4R + 3G + 16B
These curves shown in Figure 22 are called color mixture curves and indicate exactly the amounts of
each specified primary necessary to match the sample (naturally for a standard observer). It would be
ideal, therefore, to use filters for all color matching problems which are identical to the curves of
Figure 22. However, because they possess negative values they would be impossible to manufacture.
Although such filters are non-existent, it is feasible to generate a second set of filters which are a
linear, homogeneous combination of the curves in Figure 22. Such a set could possess no negative
values and one of these new color-mixture curves could be made identical with the luminosity function
of the eye. That is, the human eye possesses a different sensitivity depending upon the region of the
spectrum under observation, as shown in Figure 23.
3-13

1.1
1.0
0.9
0.8
| 0.7
E 0.6
0 0.5
T 0.4
0.3
0.2
0.1
400 500 600 700Wavelength (millimicrons)
Figure 23. Luminosity function of the human eye.
Notice that the eye is most sensitive at 555 nm and possesses no sensitivity to light below 400 nm orabove 700 nm. Using this luminosity function as the green primary will yield two results:
- The amount of green in the sample.- The brightness of the sample.
Using the transformation procedure established in the next section, a new set of CIE color mixturecurves, as shown in Figure 24, have been generated.
2.0
1.8 -z
1.6
1.4
1.2-
1.0 - x
0.-
0.6
0.4 -
0.2
0
400 500 600 700Wavelength (mp)
Figure 24. CIE tri-stimulus values, x, y, and z for the spectral colors.
3-14

Conversely, these color mixture curves (or the amounts of these primaries required for color matching
the sample) may be transformed back into the "impossible to manufacture, but theoretically perfect"
primaries of Figure 22.
3.2.3 Transformation of Primaries
In the previous section it was emphasized that the basic condition which any set of primaries
must fulfill is that none of the primary colors may be matched by the mixture of the other two. If there
exist two sets of such primaries, then each of the components of one set may be matched by an
additive mixture of the second set. For example, consider two groups of primary colors as follows:
Set # 1 Set # 2R LG MB N
The color of primary R may be matched using a mixture of L, M, and N:
[R]
R = aL + a2M + a3N
where a 1, a 2, and a 3 are the amounts of primaries L, M, and N required to match the color of R.
Similarly,
G = a4 L + a M + a6 N
and
B = a7 L + a8M + a9 N
Writing these together:
R = aL + a 2 M+a 3 N
G = a4 L+ a5M + a N
B = a7L + a8M + a9 N
These sets of equations are known as transformation equations and the sets of a's are transformation
coefficients. The above example shows the relationship between primary colors. A similar relationship
exists between the tri-stimulus values of a color (using the primaries R, G, B) and the tri-stimulus
values of the same color using the second set of primaries (L, M, N).
The principal reason for transformations between primary systems lies in the fact that one may
wish to compare the measured color of an object using one colorimeter against the measured color
using another unit. Also, one may not have access to a colorimeter; in such a case, another instrument
3-15

(say, a color densitometer) can take the place of a costly colorimeter which may not be frequentlyused. Thirdly, most colorimeters have apertures ranging anywhere from .250 to .500 inches in
diameter. One may wish to measure the tri-stimulus coordinates of an object which is much smallerthan this range so that the use of a densitometer (with an aperture of 1 mm) becomes the onlypractical way to solve the problem.
3.2.4 Transformation of Tri-Stimulus and Tri-Chromatic Values
In order to successfully measure the tri-stimulus values of unknown colors in one instrumentand convert those to another set of tri-stimulus values associated with a second instrument, two tasksmust be performed:
- Three pieces of filter glass (say, red, green and blue) are analyzed on a reliable colorimeterand their tri-stimulus values measured.
- The same pieces of glass are measured for their new tri-stimulus coordinates on the secondinstrument (for example, a color densitometer).
To help solve the first task, the National Bureau of Standards will, for a small fee, measure theCIE tri-stimulus values of the sample glasses. Also, the manufacturers of colorimeters are oftenwilling to demonstrate their equipment and will measure a few samples free of charge.
Now, suppose the sample glasses have associated with them the following CIE tri-stimulusvalues:
Red filter X, Y1, Z1
Green filter X2 Y2 2 Z2
Blue filter X3,Y 3, Z3
and in the second instrument (assume it's a color densitometer), the tri-stimulus values are:
Red filter R , G , BI
Green filter R2 , G2 , B2
Blue filter R3 , G3 , B3
Providing that the condition given at the beginning of Section 3.2.3 is fulfilled, this second set ofvalues times some set of transformation coefficients (T) will yield the CIE tri-stimulus values. Inmatrix notation:
R1 G B1 al a2 a3 Xl YI ZI
R2 G2 2 4 a5 a6 X2 Y2 Z2
R3 G3 B3 7 a8 a9 3 Y3 Z3
3-16

or [R] = T] [X] Equation 3-2
Solving for [T]:
XI' [R] = T] Equation 3-3
Equation 3-3 represents the transformation matrix [T] from the R, G, B system of tri-stimulus valuesof the CIE X, Y, Z tri-stimulus sytem.
Solving for [X] in equation 3-2 yields:
[X] = [R] [T]' Equation 3-4
Substituting any set of tri-stimulus values R, G, B into equation 3-4, together with the inverse ofmatrix T in equation 3-3, will yield directly the X, Y, and Z values of the color.
The manipulation of the matrices [R], [T], and [X] is a difficult and tedious task, at best, so that
the use of a small time-sharing terminal, on line to a computer, is definitely the most economic way tosolve for [T] (T inverse). The following program "TRANS" shown in Figure25 waswrittenin basiclanguage for a G-E time-sharing system. Some modifications may be required to assure compatibilitywith other computer systems.
This simple program performs the entire task, including both the evaluation of the inversetransformation matrix, as well as the calculation of the CIE chromaticity coordinates. If one wishedto evaluate only E Tl]'then the following steps should be eliminated: 8, 12, 45, 50, 55, and 100 to 200.Also, line number 52 should read MAT PRINT G.
3.2.5 Colorimeters
The instrument which is employed to directly measure the tri-stimulus coordinates (X,Y,Z) of acolor is known as a colorimeter of which there are two basic types: visual and photoelectric. Mostcolorimeters are designed improvements over the four projector system which was shown in Figure20 and discussed in Section 3.2.2.
Visual tri-stimulus colorimeters are optical devices in which an unknown color fills one-half of afield of view and a mixture of three primary colors fills the second half. This second half is known asthe comparison field and the operator has control over the amounts of the three primaries in thecomparison field. The operator looks at these two fields and adjusts the color of the comparison fielduntil it matches the unknown color. This recorded adjustment then becomes a specification for thesample color. The purpose of visual colorimeters is to obtain a three-number specification of thesample color as simply as possible. These three numbers will then be converted into the tri-stimuluscoordinates X, Y, and ,Z or tri-chromatic coefficients x, y, Y.
It should be noted that color specifications, in terms of tri-stimulus values, are a function of
three basic variables:
- The transmission of the measured sample.- The quality of the illluminating source.- The sensitivity of the human eye which performs the matching task.
Visual colorimeters which employ the human eye as the sensing mechanism contain all the
components necessary to fulfill the mathematical definition of tri-stimulus value.
3-17

Program Name - TRANS (Transformation of Chromaticity Coordinates)
Line # Statement
1 REMARK Program "TRANS" calculates chromaticity2 REMARK coordinates x, y, z from R, G, B3 REMARK percent transmission values from densitometer4 REMARK input data "Matrix C"; output data5 REMARK "Matrix F"6 DIM A (3, 3)7 DIM B (3, 3)8 DIM C (1, 3)9 DIM D (3, 3)
10 DIM E (3, 3)11 DIM G (3, 3)12 DIM F (1, 3)15 MAT READ A20 MAT READ B30 MAT D = INV(B)35 MAT E = D*A40 MAT G = INV(E)45 MAT READ C50 MAT F = C*G52 MAT PRINT C, F55 GO TO 4570 DATA72 DATA74 DATA76 DATA78 DATA80 DATA100 DATA
Transmission values of
colors to be evaluated.
200 DATA999 END
Symbol DefinitionMat A Percent R, G, B transmission values for three sample glasses
R1 G1 B Note: These values are
R G B 2 percentages and the sum of
2 2 2 all the rows must equal 1.00.1 3 G3 B3
3-18

Program TRANS Continued
Symbol Definition
Mat B x, y, z CIE chromaticity coordinates for sample glasses
Xl Y1 zl
x 2 Y2 z 2
X 3 Y 3 z 3
Mat F x, y, z CIE coordinates for color to be evaluatedMat D Inverse of matrix B, [B]-1Mat E Transformation matrixMat G Inverse of transformation matrixMat C R, G, B transmission values of color to be evaluated
X= K RXHXiAX
Y= K Rx Hx X Note: These equations will be discussed
further in Section 3.3.1.
Z =K RxH X z AX
That is, the object transmits or reflects Rx, is illuminated by HX, and is viewed by the eye or by the x,y, and z visual sensitivity distributions. In photo-electric instruments, however, the object stilltransmits or reflects RX, is still illuminated by HA, but the human eye is no longer the sensor, so x, y,and z in the above equations are missing. This condition results in the requirement that the threephoto detectors (one for the red, one for the green, and one for blue) MUST possess sensitivities whichare very close to the x, y, z. Providing this condition is fulfilled, the detectors will accurately take theplace of the human eye and the three readings obtained for any sample (the amounts of the threeprimaries required for a color match) will then be proportional to the tri-stimulus values of that
sample. In practice, however, it is extremely difficult to effect an exact match of photocell sensitivityto the x, y, and z distribution curves. Good approximations have been made by employing auxiliaryfilters in front of the photocells. Figure 26 shows the accuracy to which the filter-photocell responsesmatch the CIE curves x, y, z.
3-19

10 / X-AMBER
90 -Y-GREEN \
80- Z-BLUE Y-GREEN
70- THEORETICAL' ACTUAL
z 60
z 50I
40 \\
/I \S30 \
I \
20-/ \ \
400 500 600 700 800
WAVE LENGTH IN NANOMETERS
Figure 26 - Comparison of Tris'timulus Curves
An example of a visual colorimeter is the Lovibond Tintometer which operates on the principleof subtractive color. This unit employs a set of magenta, yellow, and cyan glass slides as thesubtractive primaries. Each set of glass slides ranges from a very light shade of the primary to aheavily saturated color. Each slide is assigned a number (the palest colors being number 1) so thatany number slide may be reproduced by the addition of two or more slides whose sum equals thatnumber. For example,
Cyan # 9 = Cyan # 4 + Cyan # 3 + Cyan # 2 = Cyan # 6 + Cyan # 3Yellow # 4 = Yellow # 3 + Yellow # 1
The sample to be matched is placed in one-half of a four degree (40) field of view, while the second half,illuminated by white light, has provision for insertion of the color slides. The tintometer comesequipped with a conversion graph which transforms the Lovibond measurements into CIEtrichromatic coefficients, x and y. Tables are provided for measurement of the luminance orbrightness Y which, when coupled with x, y, yields the complete specifications of the sample color.The primary disadvantage of this instrument is that the color matching can only be performed indiscrete steps.
The Model XL-10 Gardner digital colorimeter is a photo-electric colorimeter for measuring color
on several tri-stimulus scales, including the (CIE), the (Rd, a, b) or (L, a, b). The CIE scale permits theinstrument to be used as a direct reading colorimeter in terms of x, y and z tri-chromatic values forcolor, while the (Rd, a, b) and (L, a, b) scales permit direct readings for color differences.
The unit incorporates all solid-state components for greater reliability and stability. Thiscolorimeter may also be purchased with an attachment for measuring the transmission of such,amples as plastic films, liquids, glass, or other translucent (transparent) materials. The unit
3-20

provides for BCD output (Binary Coded Decimal). This, in general, is a means of transmitting digital
data to peripheral hardware such as a printer, digital comparator, etc. A coupler or translator accepts
the BCD input and converts this input to a different code which, in turn, is compatible with otherhardware devices. It is possible by use of digi-switches to include in the format a sampleidentification. These digi-switches set up four numbers for sample identification as part of the outputformat. A printer is also available to write out on paper tape the data being displayed on the panel
meter of the Gardner instrument. The approximate price of this colorimeter is $6,000 with thetransmission attachment, BCD output, and printer.
The IDL color analysis computer system is designed for analyzing the color difference between
a sample and a control standard. It describes the direction of the color difference in visuallyunderstandable terms of hue (dominant wavelength), saturation (purity), and lightness (luminance). It
also analyzes the magnitude of the color difference in terms of Mac Adam units which are widely
recognized as agreeing with the human eye's estimates of the size of color differences. The coloranalysis display computer (CADC) and a chromaticity display computer (CDC), together with a colormeasuring instrument, comprise the color analysis system. The measuring instrument can be almostany tristimulus colorimeter or any spectro-photometer that is equipped with a tri-stimulus integrator.Measurement information from a colorimeter is analyzed directly without the need for complexcomputations or charts. It takes only minutes to analyze the color difference between a sample andthe standard, yielding a repeatable numerical value for each color difference. The system permits theestablishment of consistent, repeatable procedures for inspection and approval of color differencesfrom shift to shift and day to day. In production applications where the colorist must maintain thecolor within tolerance, the Color Analysis Computer System will provide the direction of colordifference to aid the colorist in keeping the process within tolerance.
One of the newest instruments for measuring light source emissions is called TRIRAD, anautomatic tri-stimulus colorimeter-radiometer, manufactured by Kollmorgan.
TRIRAD digitally displays the CIE chromaticity coordinates (x, y) after a scan and computecycle of only 20 seconds. Additionally, it will display illuminance (Y), on a continuous basis if desired,in terms of lumens/square feet, or in the case of a CRT, when the sensor is placed against the face ofthe tube, illuminance (Y) is displayed in foot-lamberts.
TRIRAD is designed for rapid, precise, colorimetric evaluation of luminous emitters such as
fluorescent tubes, electroluminescent sources, cathode ray tubes, color television picture tubes, andall types of lamp or lamp/filter combinations. The "signature" feature of TRIRAD, whereby closeagreement to the CIE standard observer response curve is achieved, is accomplished through the useof a combination of a specially selected high sensitivity photomultiplier and individually shapedtri-stimulus filters.
3.3 CIE Spectrophotometric System of Color Specification
In previous sections, we saw that the color of an object could be specified in terms of a color
name or simple visual specifications such as those associated with the Muncell System. Describingthe same visual sensation in terms of the hue, brightness, and saturation parameters the CIEcolorimetric system was shown to be an even more accurate color designator. However, both the
Muncell and the CIE colorimetric system are concerned solely with the visual specification of a color.
No attempt has yet been made to describe the spectral distribution of the color. It is this distribution
3-21

which, when viewed by a standard observer, yields the visual sensations described by the Muncell andCIE Systems.
The science associated with analyzing a color into its component spectral parts and measuringthe energy in each part is known as spectrophotometry. More specifically, spectrophotometrymeasures an object's radiant energy which enters the eye in various spectral regions.
With the exception of pure spectral lines (from the sun, for example) very few objects possess acolor which has a single wavelength associated with it. For example, a theoretically perfect or purespectral orange might be plotted as shown in Figure 27, with a dominant wavelength at 610 nm.
1.0 A- =610
Energy (watts)
I I I400 500 600 700
Wavelength in NanometersFigure 27. Spectra of a theoretically perfect orange hue with dominant wavelength at 610 nm.
Generally, however, the color results from a combination of energies emitted at many wavelengths,each one of which exists in varying proportions. For example, a color orange with a dominantwavelength at 610 nm might have a distribution as shown in Figure 28. The color would then consistof:
Wavelength of Radiation Units of Energy600 nm .1605 nm .5610 nm 1.0615 nm .7620 nm .3625 nm .1
1.0
Energy (watts)
.5
400 500 600 700Wavelength in Nanometers
Figure 28. Spectral distribution of an actual orange color with dominant wavelength at 610 nm.
3-22

The true significance of spectrophotometric data or spectral distribution data can be illustrated
with the aid of Figure 29. Two objects, a and b, illuminated by the same light source were measured to
obtain the spectrophotometric curves. Because of the difference in these distributions, it might be
concluded that the two objects possess entirely different visual colors. Correct? No! An observer
viewing these objects simultaneously, under the same light source, would correctly state that the
colors of a and b are identical. This example emphasizes one of the most basic principles of
spectrophotometry, namely: that a spectrophotometric curve produces one and only one visual
sensation of color to the eye [x, y, Y]; whereas, for any color [x, y, Y] there exists an infinite number of
spectral distributions which can generate that color.
1.0 -
0.8
0.6-
'0.4 -
0.2-
400 500 600 700Wavelength (nm)
Figure 29. Two spectral distributions can produce the same CIE coordinate (x, y, Y).
It is obvious from this fact that it would be impossible to attempt to generate the spectral
distribution of an object knowing only its chromaticity coordinates. Since, however, every curve orsignature creates a unique color, it is possible to deduce the visual sensation which that distributionwill produce in terms of the coordinates (x, y, Y). Several procedures have been set up to do this:
- Weighted Ordinate Method of Colorimetry- Selected Ordinate Method of Colorimetry
These two methods will be discussed in the following section.
3.3.1 Reduction of Spectrophotometric Data to Tri-S.timulus Coordinates
The spectral distribution of an object is obtained by the use of a spectrophotometer. This
3-23

instrument measures the radiation reflected from the object in very narrow spectral regions (say,every 5 nm from 400 nm to 700 nm). The CIE tri-stimulus data is a function of this reflectance, as wellas two other variables:
-the spectral distribution of the source illuminating the object- the spectral response of the human eye
Let RX be the inherent reflectance of an object at any wavelength, X, and HX be the amount oflight which illuminates the object in the small wavelength interval, AX. Figure 30 diagrammaticallyshows this for , = 550. The inherent reflected energy of the object is modified by the source
Rss55 0 H o ( ) Source
Object with R 550
Figure 30. Illuminance and reflected brightness of an object in the spectral region 550 nm + (AX/z).
illuminating it. Hence, if H AA is the illuminant at wavelength X and Rx is the object's reflectanceat X, then the product of the two, or Rx *H AX is the energy which is incident upon the eye. The CIEhas specified the visual response of the standard observer (see Figure 24) and these curves are called"weighting functions" of the eye. To determine the tri-stimulus values of the reflectedl light, i t is onlynecessary to add up the energy associated with these functions x, y, and z for all values of x. That is,
X = -K (R x HkAk)Y =-' (RxHxAx)
Z= E (RkHAX)
770
X =kf RX HHx x dX
380Y = RxHXy dx
Z k RAHXz dx
380
3-24

3.3.1 Weighted Ordinate Method
This method of computing the tri-stimulus values of an object consists basically of weightingthe color matching functions of the eye, x, y, z, by RX H AX . Elaborate tables have been generatedcontaining the product Hkx, Hay, HAz for CIE illuminants A, B, and C. In order to carry out thiscalculation of tri-stimulus values, the use of Table VI is helpful. The only item to be inserted into this
table is the spectrophotometric data. At each wavelength indicated in Column 1, the reflectance of the
object should be read from the reflectance curve and placed in Column 2. After multiplication of thereflectance and weighting factors, the results are added separately. That is, the sum of Column 3, the
sum of Column 5, and the sum of Column 7 are recorded at the bottom of the sheet and the color
coordinates are computed as shown.
Selected Ordinate Method
This second method of reducing spectrophotometric data to tristimulus coordinates is actually
quite similar to the weighted method with one major exception. That is, the wavelength intervals Ay
are not fixed to be, say 10 nms wide; rather,theyare selected so thatHxxAX, HXYAx, and HzAA have
the same value throughout the spectrum. Hence, the wavelengths under consideration using the
Selected Method are different for different light sources.
Both the Weighted Ordinate and the Selected Ordinate Methods of determining tri-stimulus
values from spectrophotometric data are really only approximations. It stands to reason that as the
number of ordinates of wavelengths is increased, so is the accuracy of the computation. Unless the
Selected Method employs 100 or more wavelength points, it is generally less accurate than the
Weighted Methods.
3.3.2 Spectrophotometers and Spectroradiometers
It has been shown that the most fundamental way to analyze the color of an object is to measure
its reflected (or transmitted) energy in many small spectral regions. The instruments which perform
this task are known as spectroradiometers and they employ either prisms or gratings to isolate these
narrow wavelength bands. The sensors which measure the energy may be either photomultipliertubes or thermopiles.
Spectroradiometers have three basic parts:
- The input optics which collect the radiant flux or energy to be measured.- The monochromator which isolates the narrow spectral region to be measured.- The detector which records the energy in appropriate units such as microwatts per
centimeter squared per nanometer of the spectrum.
Figure 31 is a schematic of a single prism spectroradiometer.
The energy from the light to be measured enters slit S1, and by means of lens L1 is made
parallel before being dispersed by the prism. The second slit S2 may be moved across the spectrumto isolate the wavelength region desired. It stands to reason that as the slits S1 and S2 are made
smaller the isolated spectral region becomes narrower, but the amplitude of the light falling onto the
detector also decreases manufacturers supply sets of slits, S1, and S2, to be used for obtainingmeasurements at different bandwidths.
3-25

Table VI
Illuminant "A" - Weighted Ordinate Method
Object Identification: Spectrophotometer:Analyzed by: Date:
Wavelength ReflectanceX RX (RH)x Rhx (RH)x (yH). Rk x (yH)A (H)A Rk x(EH)X
380 .001 .000 .006390 .005 .000 .023400 .019 .001 .093410 .071 .002 .340420 .262 .008 1.256430 .649 .027 3.167440 .926 .061 4.647450 1.031 .117 5.435460 1.019 .210 5.851470 .776 .362 5.116480 .428 .622 3.636490 .160 1.039 2.324500 .027 1.792 1.509510 .057 3.080 .969520 .425 4.771 .525530 1.214 6.322 .309540 2.313 7.600 .162550 3.732 8.568 .075560 5.510 9.222 .036570 7.571 9.457 .021580 9.719 9.228 .018590 11.579 8.540 .012600 12.704 7.547 .010610 12.669 6.356 .004620 11.373 5.071 .003630 8.980 3.704 .000640 6.558 2.562 .000650 4.336 1.637 .000660 2.628 .972 .000670 1.448 .530 .000680 .804 .292 .000690 .404 .146 .000700 .209 .075 .000710 .110 .040 .000720 .057 .019 .000730 .028 .010 .000740 .014 .006 .000750 .006 .002 .000760 .004 .002 .000770 .002 .000 .000
Tri-Stimulus Add Column 4 Add Column 6 Add Column 8Coordinates RA (H) A = ( ) R (yH) A = ( ) RX(H) = (
or ( Y ( ) Z= (X+Y+Z = (
Chromaticity X Y ZCoordinates x= = ) y= ) z
X+Y+Z X+Y+Z X+Y+Z

able VI continued ....Illuminant "B" - Weighted Ordinate Method
bject Identification: Spectrophotometer:.nalyzed by: Date:
avelength Reflectance
X RX (RH)X Rx x(H)X (9H)X R X x(yH) (2H)x R x(2H)X
380 .003 .000 .014390 .013 .000 .060400 .056 .002 .268410 .217 .006 1.033420 .812 .024 3.899430 1.983 .081 9.678440 2.689 .176 13.489450 2.744 .310 14.462460 2.454 .506 14.085470 1.718 .800 11.319480 .870 1.265 7.396490 .295 1.918 4.290500 .044 2.908 2.449510 .081 4.360 1.371520 .541 6.072 .669530 1.458 7.594 .372540 2.689 8.834 .188550 4.183 9.603 .084560 5.840 9.774 .038570 7.472 9.334 .021580 8.893 8.396 .016590 9.728 7.176 .010600 9.948 5.909 .007610 9.436 4.734 .003620 8.140 3.630 .002630 6.200 2.558 .000640 4.374 1.709 .000650 2.815 1.062 .000660 1.655 .612 .000670 .876 .321 .000680 .465 .169 .000690 .220 .080 .000700 .108 .039 .000710 .053 .019 .000720 .026 .009 .000730 .012 .004 .000740 .006 .002 .000750 .002 .001 .000760 .002 .001 .000770 .001 .000 .000
i-Stimulus Add Column 4 Add Column 6 Add Column 8ordinates YR X (KH) = ( ) R X(YH) X = ( ) RX(H) A = (or X = ( ) ( ) (
X+Y+Z = ( )
iromaticity X Y Z
,ordinates x = ) y ) z =x(X+Y+Z o X+Y+Z - - X+Y+Z

Table VI continued...
Illuminant "C" - Weighted Ordinate Method
Object Identification: Spectrophotometer:Analyzed by: Date:
Wavelength ReflectanceSR (H) R x(H) (H) Rx(H) (H)H) R x(x(YH)H
380 .004 .000 .020390 .019 .000 .089400 .085 .002 .404410 .329 .009 1.507420 1.238 .037 5.949430 2.997 .122 14.628440 3.975 .262 19.938450 3.915 .443 20.638460 3.362 .694 19.299470 2.272 1.058 14.972480 1.112 1.618 9.461490 .363 2.358 5.274500 .052 3.401 2.864510 .089 4.833 1.520520 .576 6.462 .712530 1.523 7.934 .388540 2.785 9.149 .195550 4.282 9.832 .086560 5.880 9.841 .039570 7.322 9.147 .020580 8.417 7.992 .016590 8.984 6.627 .010600 8.949 5.316 .007610 8.325 4.176 .002620 7.070 3.153 .002630 5.309 2.190 .000640 3.693 1.443 .000650 2.349 .886 .000660 1.361 .504 .000670 .708 .259 .000680 .369 .134 .000690 .171 .062 .000700 .082 .029 .000710 .039 .014 .000720 .019 .006 .000730 .008 .003 .000740 .004 .002 .000750 .002 .001 .000760 .001 .001 .000770 .001 .000 .000
Tri-Stimulus Add Column 4 Add Column 6 Add Column 8
Coordinates R x (H)X = ( ) ZR X( H) = ( ) R (H) =or x=( ) Y =( ) z ( )
X+Y+Z =(
Chromaticity X Y ZCoordinates - x -( ) Y -( ) z - (S3- X+Y+Z X+Y+Z X+Y+Z
LightSource Prism
o)Slit L s
(S 1 ) (L) (S 2 ) Lens(L2)(L 2 ) Detector
Figure 31. Schematic of a single prism spectroradiometer system.
The primary advantage to the use of spectroradiometers is that the resultant data is notrelative; it is an absolute quantity. The data can be made relative by measuring simultaneously boththe absolute energy illuminating the object (Hk) and the absolute energy being reflected ortransmitted (Rk). The ratio of Rk/H, is then the relative reflectance or transmission of the object.
Several precautions must be taken, however, if meaningful spectroradiometric data is to beobtained:
1. A standard lamp must be purchased from the National Bureau of Standards which iscalibrated with respect to the energy it emits in each spectral region. Generally, these values
are supplied at every 10 nanometers. Figure 32 is an example of such a calibration. Noticethat this lamp must be operated at an exact voltage and amperage, at an exact distance fromthe spectroradiometer.
2. The spectroradiometer is then placed at the prescribed distance; the output of the lamp is
measured at the wavelengths shown on the calibration table by the spectroradiometer.
3. Prior to using any spectroradiometer data, it is essential that the dark current of the photo-multiplier (detector) be measured and subtracted from the readings. The exact procedure for
this consists of closing off all light from the monochromator and detector. The output from
the spectroradiometer is measured at each wavelength given in the calibration table and
these values are subtracted from the data.4. A correction curve is generated by plotting the actual spectroradiometer lamp readings
along the x axis and the calibrated lamp readings along the y axis.5. Subsequent spectroradiometric data must 1) have the photo tube dark current subtracted
and 2) be corrected to the standard lamp prior to use.
The following data sheet (Figure 33) greatly facilitates the taking of accurate spectroradiometricmeasurements.
In spite of the tedious task of calibration, spectroradiometers are the only instruments capable
of obtaining the accurate in situ spectral measurements of objects which are essential for determiningsubtle color differences in the environment. Spectroradiometers are most often employed for field
measurements when a physical disturbance of the object will significantly alter its spectral
reflectance. For example, plants lose water and nutrients within minutes after being removed from the
3-29

Energy Distribution of Illuminant A
Wavelength EA Wavelength EA
380 9.79 590 121.73
390 12.09 600 129.04
400 14.71 610 136.34
410 17.68 620 143.62
420 21.00 630 150.83
430 24.67 640 157.98
440 28.70 650 165.03
450 33.09 660 171.96
460 37.82 670 178.77
470 42.87 680 185.43
480 48.25 690 191.93
490 53.91 700 198.26
500 59.86 710 204.41
510 66.06 720 210.36
520 72.50 730 216.12
530 79.13 740 221.66
540 85.95 750 227.00
550 92.91 760 232.11
560 100.00 770 237.01
570 107.18 780 241.67
580 114.44
Figure 32. National Bureau of Standards calibration sheet for standard illuminate "A" source.
3-30

SPECTRORADIOMETER DATA BY:
TARGET NUMBER SCAN DATE STARTING TIME
WAVELENGTH & TIME INCIDENCE REFLECTANCEUNIT UNIT
START VIS CALIB.
START VIS D.C.
START VIS. TIME
380
400
425
450
475
500
525
550
575
600
625
650
675700
725
750
END VIS DC
END VIS CALIB.
END VIS TIME
START IR CALIB.
START IR DC
START IR TIME
750
800
850
900
950
1000
1050
1100
1150
1200
1250
END IR DC
END IR CALIB.
END IR TIME
3-31

soil and their leaf reflectances change drastically; also, when soils are dug up and moved into alaboratory for spectral reflectance analysis, changes take place in their spectra owing to a disturbanceof the surface and subsurface layers, moisture content, etc. There are, however, some cases in whichobjects may be moved from their environment and still maintain their reflectance properties. Forexample, single rocks, certain types of marine fauna, man-made objects such as asphalt, roofingmaterials, etc.
Adequate spectral measurement of such objects can be made in the laboratory using aspectrophotometer, which produces the reflectance (or transmission) of an object in narrow spectralregions directly. This is accomplished by measuring simultaneously both the amount of light fallingon the object (H,) and the light which is reflected from it (RA). The ratio of (Rx)/,(HI) x100 is thepercent reflectance. The light incident upon the object is generally a standard Illuminant "A" whichis incorporated into the spectrophotometer, while the sensing mechanism may be either aphotodetector or the human eye. Photoelectric spectrophotometers may be recording or non-recordinginstruments. The former requires that the data be taken wavelength by wavelength from a meter,whereas the recording instrument automatically plots the variations in transmission or reflectance asa function of wavelength.
Photoelectric spectrophotometers have almost completely replaced the visual instruments
because of their greater speed and convenience. A schematic of a single pass photoelectricspectrophotometer is shown in Figure 34.
Reference LampLR
S\
(L)
Mirror S LIM 1 L
L2
L3
Detector (D)
Figure 34. Schematic of a photoelectric spectrophotometer.
Two light sources (Illuminant A) are employed in this instrument: lamp L provides theillumination for the sample S, while LR is the reference source. A first surface mirror M may beinserted into the path to permit measurement of the standard lamp LR. When it is removed from thelight path, illumination from the sample S is measured. The light, after passing through the entranceslit S1 is dispersed by the prism P and an enlarged image of S2 is formed on the detector D. At anygiven wavelength and with the mirror M removed, the output of D is measured(this value isproportional to the radiant flux transmitted through the sample). M is then placed in the path and the
3-32

reference source is measured at the same wavelength. The ratio of the transmitted (or reflected) fluxat any wavelength to the amount of flux in the reference beam at that wavelength is known as the
percent transmittance or reflectance.
Not all spectrophotometers operate on this single beam principle, i.e., the photodetector sensing
first the reference source and then the sample. Many units now incorporate a double beam principle in
which the flux from the reference source and the sample are simultaneously measured; their outputs
are then electronically amplified and divided to provide the spectrophotometric curve directly.
It should be noted that most spectrophotometers have been designed to measure the percent
transmission of a sample, but attachments are available to convert the unit into one which will
measure percent reflectance. One such attachment consists of an intergrating sphere coated inside
with magnesium oxide (MgO). Referring to Figure 35, light from the source L is directed into the
integrating sphere onto the sample. The sample reflects the radiation in all directions and after many
reflections off the walls of the sphere, some o f the light will pass through tlHe aperture A and be
L
Black or WhiteCap (C)
S2 A
Detector
Figure 35. Reflectance attachment for spectrophotometer:
directed to the dispersion prism or grating and thence to the photodetector. The integrating spherealso contains two caps, either one of which may be placed over the aperture at C. These are necessaryin order to measure either of two types of reflectances: diffuse and specular. The specular component
of reflected light is that portion which is commonly called glossy or shiny. The diffuse component
consists of the flat or matte portion of the reflected light. The diffuse and specular components of
reflected light for some common materials is given in the following table:
Table VII
Material % Specular Reflection % Diffuse Reflection
Cardboard 30 70
Silver Foil 99 1
Newspaper 11 89Asphalt 40 60
Blotter Paper .2 99.3
3-33

If, for example, one wishes to measure the total reflectance of a sample without regard for its specularor diffuse components, then the white cap is used over the aperture at C. If, however, one wishes toeliminate the specular component from the resultant reflectance measurements than the black cap(generally made of velvet or some other light absorbing medium) is placed over the aperture at C. Onewill notice in Figure 35 that the angle (01 between the normal to the sphere N and the source L is thesame as that between N and C. Hence, the entire specular component reflected from the sample willfall onto the black cap at C and be totally absorbed by it.
The choice of whether to purchase a spectrophotometer or a spectroradiometer is a rather simpleone. It is almost totally dependent upon whether the objects to be measured must be analyzed in situor if they belong to that sub-class of objects whose reflectance will not change if disturbed from theirenvironment. The effort required to maintain the spectroradiometer in calibration may also be afactor. Unless a sufficient number of measurements warrant its purchase, it is often easier andcheaper to either rent or lease the spectroradiometer or to sub-contract that phase of effort to anorganization which already owns an instrument and is familiar with it. Chances are that suchorganizations already have the calibration and data reduction simplified so that considerable time andeffort can be saved.
The purchase of a spectrophotometer is obviously dependent on the kind of specimens which areto be analyzed: transmitting, reflecting, or fluorescing samples. However, a major consideration isalso the sample size; each spectrophotometer is extremely limited by the maximum dimensions whichthe specimen holders can accommodate. Generally, this ranges up to a few inches in diameter. Also,consideration should be given to the average sample stability to light and heat. Depending upon thedesign of the instrument, the illumination incident upon the sample may be either confined to a smallspectral region or contain all wavelengths of the spectrum from the near ultraviolet through theinfrared. An instrument designed to illuminate with the entire spectrum causes a good deal of heat(infrared) energy to be focused on the specimen. Some samples change their spectral characteristicswith the application of heat or, due to their instability, have a tendency to fade. An example of such amaterial is the well-known Eastman Kodak gelatin filters. These filters are quite unstable to light andheat even when sandwiched between glass.
The choice of a recording or non-recording spectrophotometer is dependent upon the number ofsamples to be analyzed per day or per week and the speed with which the resultant data is required. Ameasure of the visible spectral reflectance or transmittance and a plot of this data may only take twominutes on a recording instrument. The same task on a non-recording spectrophotometer can take upto about 60 minutes to accomplish. When large volumes of spectral curves must be generated, therecording instrument can supply the data in several days, against perhaps months for thenon-recording. There is, however, the additional consideration of cost; unless one is anticipating theanalysis of hundreds of specimens per year, it may not be worth the initial high price of the recordingspectrophotometer.
The spectral range of the instrument is also of importance; most can be purchased with sensors(photomultipliers) which cover either the near-ultraviolet spectrum (200-380 nm), the visible (380-750 nm), or the near infrared spectrum (750-1800 nm). Often, two photomultipliers (say, visible andinfrared) are installed in the spectrophotometer with the operator being able to select which spectralregion he desires to scan. The near-ultraviolet sensor is generally employed to measure thecharacteristics of fluorescent materials and the near-infrared is usually employed in the study ofvegetation reflectance and heat absorbance in objects.
3-34

The choice of a spectrophotometer is lastly dependent upon whether customized components arenecessary. For example, certain units may be modified to punch out the transmission or reflectancedata onto cards for future analysis in a high-speed computer. Consultation with the manufacturers ofcolor measuring instruments, prior to purchase, will prove extremely valuable in terms of moneysaved and knowledge gained. The characteristics of several spectroradiometric andspectrophotometric systems are now presented.
The incidence spectroradiometer manufactured by Instrument Specialties Company uses a
wedge interference filter system enabling the spectrum from 380 to 1250 nanometers to be continuallyscanned. The spectroradiometer is equipped with a diffusing screen so that its directional response is
proportional to Lambert's cosine law. This method of measuring sunlight is pertinent since incident
global radiation falls upon the earth's surface and is reflected into an entire hemisphere regardless ofits original direction of propagation. True cosine response also eliminates the need for precise aiming
of the instrument. This incidence spectroradiometer (ISCO) measures in units of energy rate intensity
per bandwidth such as microwatts per centimeter square per nanometer. This latter system of units is
most meaningful for measurements of illumination; a graph of spectral distribution of radiant
intensity versus wavelength can be obtained and the area under such a curve will be numerically and
dimensionally equal to energy available in the wavelength interval of interest. The ISCO
spectroradiometer is capable of measuring from .01 to 1000 microwatts per centimeter square per
nanometer. These values correspond roughly to illumination levels of .03 to 30,000 foot candles.
The accurate use of the ISCO spectroradiometer requires verification, periodically, during theexperiment. A spectral standard lamp, serially numbered and individually calibrated against theNational Bureau of Standards is used. The lamp is of the ribbon filament tungsten type and has anominal accuracy of plus or minus five percent relative to the NBS standard. The precise regulation ofthe current to the lamp is maintained by a precision electrical power supply unit.
The half bandwidth of this spectroradiometer which may be used to measure the incidentillumination is approximately 15 nanometers in the 380 to 750 range and 30 nanometers in the 750 to1250 range. Stray light response to unwanted wavelengths of 15 nanometers bandwidth and far fromthe wavelength of interest is usually in the order of .01 percent. Stray light error results in a too highreading and limits the accuracy of measurement of low intensity spectral energy in the presence ofhigh-intensity radiation in different wavelengths. The most severe stray light error results whenmeasuring the short wavelengths (in the 400 nanometer region) of red rich light sources, such as solarradiation in the afternoon. This ISCO instrument reads approximately 3 percent too high at 400nanometers when measuring a standard 2800 degree Kelvin source because of stray light passage oflonger wavelengths. This amount of error may be compensated for by placing a blue absorbing filterover the sensing head and noting the amount of stray light indicated on the meter. The value is thensubtracted from the measured intensity to determine the correct values throughout the wavelengthregion.
Periodic calibration of the incidence spectroradiometer allows an accuracy of plus or minusseven percent in the long wavelength of the spectrum, and plus or minus ten percent in the shortwavelength of the spectrum. Most of this error, of course, comes from uncertainty in the secondarystandard used. The relative accuracy of all points with respect to each other throughout thewavelength measured is approximately plus or minus three percent.
The E.G. & G. Model 585 spectroradiometer system allows the user to make measurements with
direct meter and recorder readout of the integrated energy from pulsed light sources and the average
3-35

power of continuous light sources.
To measure the amount of reflected radiation from the target, two separate detectors are used;one for the visible range from 350 nm to 750 nm, and the second for the near infrared range from 750nm to 1250 nm. Both are attached to the readout unit which displays the output on an analog meter.Power for the readout unit is supplied by internal battery so the entire system is completely portable.
The reflectance spectroradiometer system allows absolute measurements of the solar radiationreflected by objects of interest. By means of a grating monochromator, these energy and powerreadings can be made at selected wavelengths over a bandwidth determined by the grating and theslits. This instrument basically consists of an optical system which limits the entrance of energy to atwelve degree field, a monochromator grating to spectrally isolate the visible energy to a fivenanometer halfband pass or a monochromator grating to spectrally isolate the infrared energy to a tennanometer halfband pass, and a detector head to sense the magnitude of the incident energy.
The Gamma Scientific Model 3000/3300 scanning spectroradiometers are instruments designedfor the automatic, rapid, absolute spectral analysis of radiant energy sources. The Model 3000 systemis designed to cover the visible spectrum from 400 nm to 700 nm, while the 3300 system covers thenear infrared region from 600 nm to 1000 nm. The optical heads are interchangeable so that thespectrum can be scanned from 400 to 1000 nm with the two heads, a single control unit and x, yrecorder. A digital package is also available providing digital output for both wavelength and powerfrom the spectroradiometers. This attachment allows direct interfacing with digital logging andcomputer systems. The near infrared S1 photontiltiplier is thermoelectrically cooled and acompensation system flattens the sensitivity of this unit from 600-1000 nm.
In view of the present interest in spectral radiometric study and characteristics of agriculturalcover, Exotech has developed a versatile field instrument (Model 20) capable of taking reliableradiometric data under rigorous field conditions. The Model 20 is based on a circular variable filterapproach which is the best way to obtain a simple, rugged, field instrument with high radiometricefficiency.
The complete instrument is comprised of two separate optical units with a single control unitcontaining signal processing electronics and power supplies. The short wavelength optical unit coversthe spectral range 0.35k to 2 .5, and is capable of measuring spectral reflectivity by making use of anintegral reference surface that provides data on incident radiation. The long wavelength optical unitcovers the spectral range 2.8k to 14> and contains a temperature controlled black body reference.
The field of view of the instrument is 10 with primary lens inserted and 150 with primary lensremoved.
System signal to noise ratio is greater than 1,000:1 over the wavelength region 0.35 to 2.3microns, greater than 10,000:1 over the wavelength region 0.5 to 1.5 microns (for a target with 100percent reflectivity), and greater than 100:1 over the wavelength region 3.5 to 14 microns.
The instrument operates on 115 volts AC+20 percent, 60 cps + 1 cps and requires less than 150watts. The system incorporates an internal blackbody to which all radiance measurements arereferenced, as well as an incident radiation reference. The instrument provides capability forautomatic alternate scans of incoming or target radiance.
The collecting optics are able to focus from infinity to one (1) meter or less, and a photographicadapter is provided to permit a Hasselblad 70mm camera to photograph the target scene through thesighting telescope. The system provides signals suitable for a real time display of the radiation
3-36

received by the instrument as a function of wavelength. These signals are suitable for driving anoscilloscope, a strip chart recorder or an x-y plotting type recorder, and a tape recorder.
The unit is capable of operation within specifications over the temperature range -20 0C to+55 0 C and over the humidity range 0 to 100 percent providing that condensation does not occurinternal to the instrument.
Color-Rad is an instrument that utilizes an array of sixteen narrow bandpass interference filters.As such, it provides a quantitative spectral analysis of luminous sources having candlepower ratingsas small as 0.5 candlepower. It is the only known practical instrument at the present time that canprovide this type of abridged spectral analysis of colored luminous sources of such low candlepowerand provide data for accurate (x, y) chromaticity control. In addition, Color-Rad uses separate built-intristimulus X, Y and Z equal energy filters for simplified color difference measurements. Their usereduces to a minimum the arithmetical computation required to obtain approximate (x, y) locations incolor space when working in production matching of luminous sources or source-filter combinations.Therefore, it is possible with the Color-Rad to obtain an abridged spectral energy survey and/or atristimulus approximation of a given luminous source. A reference source is used in all measurements.The standards supplied are tungsten lamps calibrated and controlled to serve as reference sources ofknown spectral emittance. Other standards, such as known-source and known-filter combinations,may be used as applicable.
An adaptation of the widely used CARY 14 spectrophometer, the CARY spectroradiometer hasbeen developed for special radiation measurements and comprehensive studies in fields such as spacephysics, chemistry, and biology. It is the first capable, direct reading instrument combining widespectral range, high sensitivity, and resolving power with values of accuracy, speed, and convenience.
An integrating sphere system eliminates problems caused by differences in source geometry ordetector response, while the rapid alternation removes uncertainties occurring from electronic drift.The system is sensitive only to changes in the known/unknown source intensity ratio. The CARYspectroradiometer is capable of measuring ratios of two beam intensities with an accuracy of 2 percentfor reasonably intense sources. The spectral bandwidth is less than 0.1 nm from 360 nm to 600 nm. Awavelength cam system enables the spectroradiometer to be pre-programmed from the knownirradiance versus wavelength characteristics of the standard lamp. In this way, the ratiomeasurement between the known and unknown lamps is recorded as the absolute irradiance of theunknown lamp on a linear scale.
The Bausch & Lomb Spectronic 20 spectrophotometer is available in two models with a wide
selection of accessories which make colorimetric or spectrophotometric measurements accurate,time-saving, and inexpensive. The unit is a single beam, ratio indicating, spectrophotometer, usablein either a transmittance or absorption mode. It may be used as a spectrophotometer or as acolorimeter. As a spectrophotometer, the certified diffraction grating accurately pinpoints absorptionmeasurements of quickly selected wavelengths from 340 nm to 600 nm without changing phototubes
or using filters. As a colorimeter, readings in optical density or percent transmittance are taken
directly from the scale. The spectral range can be changed from 340 nm to 600 nm with a change ofsupplementary phototube and infrared transmitting filter. No adjustment of slit width or sensitivitycontrol is necessary since dispersion of a grating is linear and output constant. The fixed slit produces
a constant, narrow bandpass of 20 nm over the instrument range.
The Perkin Elmer SG-4 spectrophotometer permits detailed spectral analysis of remote sourceradiation from the ultraviolet to the far infrared.
3-37

It is particularly useful for meteorological/atmospheric and geological studies, measurement of
emissivity and reflectance of coatings and surfaces, spectral analysis of combustion processes and
products, light sources and plasmas.
The instrument employs a four-inch reflecting telescope, an oscillating-grating monochromator,
slit transfer optics, and a detector/amplifier selected for the wavelength interval of interest. Gratings,filters, spectral slits, and field stops are easily interchanged, as are the detector/amplifier modules
which are prefocused and self-aligning. When appropriate, these modules include cryogenic fittingsfor liquid-nitrogen transfer. Use of the SG-4 is facilitated by selectable automatic gain control,self-calibration, a reflex eyepiece, and the provision for remote operation, including filter selection.
Baird-Atomic's Model SF-100 fluorescence spectrophotometer is a compact instrument
specifically designed to meet the requirements of those engaged in the field of fluorescence.
The monochromators may be scanned automatically or manually, covering both the excitation
and fluorescent spectra from 220 to 700 nanometers. Readout is direct, using the front panel meter.
Output jacks are provided for driving such auxiliary readouts as oscilloscopes, x-y recorders, or linear
recorders. Radiation from a xenon light source is dispersed by a monochromator which permits
selection of the wavelength incident upon the sample. A second monochromator scans the fluorescent
light emitted by the sample. Light of the selected wavelength is transmitted to the photomultiplier
tube detector which converts the light energy into an electrical signal which is proportional to the
light intensity. This signal is amplified and indicated on the front panel meter.
Selection of the excitation wavelength and the fluorescent wavelength are independentlycontrolled by cams which adjust the angles of the gratings. A series of three position slits are located
at the entrance slit of the excitation monochromator, at both the entrance and exit slits of the samplechamber, and at the exit slit of the second monochromator. Independent choice of each of these allows
the operator to choose the optimum combination of sensitivity and resolution.
The use of larger slits allows more light to pass through the monochromator to excite the sample
which, in turn, causes the sample to emit more fluorescent radiation. This is very advantageous when
working with samples at low concentrations because a maximum amount of energy is made available
without any sacrifice in resolution.
3.4 Color Density
In addition to the Muncell, the colorimetric and spectroradiometric methods of measuring color,some mention should be made regarding the use of densities as a color specification. This technique isprimarily used in conjunction with color transparencies, and computer programs have been
established to convert the date to the commonly used CIE system (see Section 3.2.4).
The measurement of the color density of a reversal or negative film is complicated by the natureof the dye images formed. Each dye has significant absorption throughout the spectrum so that the
color density measurement of one layer is affected by the dyes in the other two layers. Color densitymeasurements are usually made for either of two reasons: (a) to determine the effect which the colorfilm has upon a light beam transmitted through it, or (b) to determine the composition of the image in
terms of the individual dyes which form it. Because of this situation, several methods of measuring
color densities have been devised and each method will produce different information about the
image. * Figure 36 shows a block diagram of various types of color density measurements.
Analytical densities consist of measuring the individual absorptions of the dye layers of colorfilms. Such measurements can indicate the exact composition of the image in terms of the amounts of
3-38

dyes present. To study each dye separately, the tri-pack color material must be exposed so that only a
single layer of dye is formed. As such, they are extremely difficult to obtain and are often specified as
only valid for a particular detector. Analytical density analysis is usually employed when extreme
accuracy is required, such as the evaluation of color film manufacturing tolerances.
Integral color density measurements, however, are used to evaluate the total effect of the three
dye layers and are employed in the processing of color films. There are several types of integral color
density measurements. Spectral integral densities are an indication of the wavelength by wavelength
absorption characteristics of the film image. That is, if the transmission of the tri-pack, at any
wavelength, is defined as TX, then the integral density of the film is Dk = - log T. A
spectrophotometer is generally employed as the measuring device and the final data consists of the
spectral transmission characteristics of the entire image in terms of density.
Integral printing density measurements are used to define the exposure required for each dye
layer in order to reproduce an acceptable positive. The exposing intensity is altered as a function of
the print material sensitivity. For example, printing densities may be measured in a color
densitometer with filter-photocell sensitivites which approximate that of the print material.
Colorimetric densities differ from the printing densities in that the filter-photocell sensitivities
must be a set of visual, three-color mixture curves (for example, Figure 26). The primary advantage of
the use of this method of color density measurement is that the results bear a close correspondence to
the visual appearance of the image.
Three filter color densitometers employ an arbitrary set of three filters: red, green, and blue.
Since no specification of the total system sensitivity is given, the measurements are only used to
match the image to a standard. They are relatively easy to obtain and are, therefore, used for
processing control of color films.
3.5 Summary
- The Muncell System of color specifications is based upon the visual appearance of the object
in terms of hue, value, and chroma.
- The CIE colorimetric system specifies the color of objects in terms of mathematical tri-
stimulus or trichromatic coefficients.
- Any color can generally be matched by the mixture of at least three independent primarycolors.
- Adding an equal amount of light from each primary to the color will have the effect of de-
saturating it.- Hue may be altered only by changing the proportions of primary in the color mixture.
- None of the additive color primaries may be matched by a mixture of the other two.
- Color specifications may be transformed from one set of primaries to another by determiningthe transformation coefficients.
- Colorimeters will directly measure the tristimulus values and trichromatic coefficients.
- The spectrophotometric system of color specification describes the distribution of the color
as a function of wavelength. The data may be readily converted to colorimetric units usingthe selected or weighted ordinate method.
- A given spectroradiometric curve will produce one and only one color; but, any color may be
be produced by any number of spectroradiometric curves.
3-39

Color Density
Integral Density - measurementof total effect of the three dye layers together.
3 Filter Colorimetric Spectral PrintingDensity - used Density - Density - Density - in-for process predicts what density mea- dicates effectcontrol to color will be sured on of a colordetermine if when viewed spectropho- film whensample matches by an observer. tometer to printed on astandard. Red, tell wave- particulargreen, and length by material withblue filters wavelength a particularare used. the absorp- printer.
tion of thecolor image.
Analytical Density - measurementof the effect of each ofthe dye layers separately.
Analytical Equivalent EquivalentSpectral Den- Neutral Density Neutral Print-sity - mea- density of the ing Density -surement of neutral gray same as equiv-the effect of which would alent neutraleach of the visually be density exceptdye layers formed if that a printingseparately. appropriate material is
amounts of used insteadthe other two of the eye asdyes were receptor.added to it.
Figure 36. Block diagram of various types of color density measurements.
3-40

- The color of an object is dependent upon the spectroradiometric distribution, the illuminate
and the standard observer's eye sensitivity.
- Spectroradiometers are used for in vivo spectral reflectance measurements in absolute units.
- Spectrophotometers produce relative reflectance data and are generally unsuitable for field
measurements.
3-41

CHAPTER 4
METHODS OF RELATING GROUND PHENOMENA TO
FILM DENSITY AND COLOR MEASUREMENT
The primary objective of aerial photography is to ultimately obtain quantitative information
about the environment. It has been shown that such information is very often related to the inherent
spectral distributions or colors in the scene. The final density and color of either an additive or
subtractive aerial image, however, is a function of many variables besides the spectral reflectance
characteristics of objects, namely:1. The spectral distribution of illuminant.2. The atmospheric haze between the ground and the aircraft.3. Effect of secondary reflections from ground objects.4. Camera exposure.5. Processing conditions.6. Viewing illumination.
Since not all of the above variables can be controlled during the exposure stage, we must at least make
provisions for their measurement so that compensation can be made at the viewing stage. To facilitate
colorimetrically accurate and repeatable photographic data and to relate these results to the
environmental conditions present, the following should be provided for:
- the location of "standard" objects in the scene,- the collection of complete ground truth for correlation with the imagery,- a valid method of correcting the image chromaticity data so that it is a true representation of
ground objects.
4.1 Ground Reference Targets
Ground reference targets usually consist of six neutral gray scales ranging from black to white
with nominal reflectances of 4%, 8%, 16%, 32%, 64%, and 88%, as well as four color panels - red,green, blue, and yellow. The first consideration in the fabrication of such targets is, of course, the
physical size required. It is essential that when photographed onto the film, their images be large
enough for measurement on a densitometer and colorimeter. Targets are made in sizes about 20' x 20'
which, if larger ones are required, may by placed in an array. For example, four targets (20' x 20')
placed in a square yield a target 40' x 40'. The size of 20' x 20' is rather arbitrary, but since the canvas
substrates weigh about 50 pounds each, a panel of this size can easily be handled by one man.
In addition to these physical considerations, the targets should be non-specular and although
they will not be perfectly diffuse, the highlights or bright spots reflected from them should be
minimal. This condition is placed on the targets so that regardless of sun or camera angle to the
targets, their reflectance will be almost uniform. In addition to being diffuse, the neutral gray targets
must exhibit the same reflectance values throughout the spectrum. Figure 37 shows the reflectance of
several gray targets from 380 nm to 750 nm. These flat distributions are about as good as
4-1

manufacturers are capable of producing. Ground reference targets are subjected to considerableamounts of solar illumination and hence they should either be treated or the coating should beselected in order to minimize fading. Targets fulfilling all of these conditions are manufactured byData Corporation, Ohio, although their cost is quite high. If, however, a considerable amount ofimagery is obtained throughout the year, such targets are a worthwhile purchase and hold up verywell to the abuses which are a natural consequence of field work. It should be mentioned that DataCorporation will also rent the targets for photographic tests and will provide the personnel to handlethem.
60 -64%
50 -
40
30 - 32%
16%
20
---- - 8%10 4%
400 440 480 520 560 600 700 800 900 1000Wavelength in Nanometers
Figure 37. Spectral reflectance curves for Data Corporation gray scale targets with nominalreflectances of 4%, 8%, 16%, 32%, and 64%.
In addition to the ground targets discussed above, another set may be needed for specialstudies, such as underwater investigations. In this particular case the substrate, as well as thecoatings, must be resistant to the hydro-environment including biological growth, naturalbreakdown, and tidal currents. They must also be retrievable; mounting them in a suitable frame withshock cord will maintain them in a linear array which can be lowered to any desired depth. A typicalarrangement for mounting sub-surface targets is shown in Figure 38. Because of their high costs,targets should be manufactured so that they may be used in as many environmental situations aspossible.
4.1.1 Colorimetric and Spectrophotometric Calibration of Targets
The use of ground targets to relate final densities or colors in the photographic imagery toobjects in the scene requires that the panels be calibrated prior to use.
The initial spectral calibrations of the targets should be performed in the laboratory using anNBS standard source and regulated power supply. Target coatings often change with time and,although the manufacturers generally supply a graph of the nominal reflectances, it is worthwhile tocheck these values periodically. A special target calibration notebook should be kept in which the
4-2

repeated chromaticity and spectrophotometric data on the reference panels is logged. This gives a
clear indication of the effects of their exposure to solar energy, dirt, etc., and a constant comparison
can be made with swatches of panel material generally supplied with the targets. These swatches are
about 1' x 1' square and, since they were manufactured at the same time, have exactly the same
substrate and coatings as the reference panels.
.7 7 .
Figure 38. Sub-surface targets mounted in a frame can be submerged to any desired depth with ease.
Using a tri-stimulus colorimeter, laboratory measurements of the chromaticity coordinates of
each color and gray panel are measured. Most colorimeters operate fairly rapidly so that it is possible
to obtain large sets of data in shcrt periods of time. For this reason, at least five sets of chromaticity
coordinates should be measured on each of the reference panels. An average of these five sets will then
yield a more valid set of chromatic coefficients (x, y, Y). Usually, these laboratory measurements are
taken using a standard A source as the illuminant. The colorimeter measures the reflectance of the
target against a white magnesium oxide standard, both substances being illuminated by the same
source. The resulting data represents the inherent color of the panel. However, when measuring the
chromaticity coordinates of the reference targets in the field, the illuminating source for the panels is
the sun and skylight, although the illuminant for the white magnesium oxide standard must still be
illuminant A. As far as the colorimeter is concerned, it is still measuring the chromaticity of the
panels using illuminant A for both the standard and the targets. It would record a different inherent color
for the panels, however. This difference between the laboratory and field CIE coordinates only
represents the color discrepancy between the solar illuminant and illuminant A. Since the inherent
color of the panels in terms of the CIE coordinates were generated in the laboratory, the sole purpose
of obtaining chromaticity coordinates of the targets under sunlight conditions is to determine the
biasing effect of the solar illuminant. In other words, to what degree does the sun degrade the inherent
color of the targets? For example, at low sun angles the distribution of the solar illuminant increases
appreciably at the red end of the spectrum, casting a reddish hue on the terrain. Colorimetric field
4-3

measurement of, say, the white target will indicate the magnitude of this color shift and will permitthe interpreter of multispectral imagery to correct the viewer illumination by that amount. This willbe discussed later in the chapter.
These two sets of chromaticity coordinates (laboratory and field) should be measured each timea flight test is made; naturally, the field measurements will be taken throughout the photographicday in order to study the color bias introduced by different sun angles during the photo mission.Although colorimetric laboratory and field calibration of the ground reference panels will give a clearindication of the apparent color shift (this shift will be evidenced in the photography), such data tellsnothing regarding the change in solar spectral distribution.
One may recall from Chapter 3 that any set of chromaticity coordinates (x, y, Y) can result froman infinite number of spectrophotometric curves. It is essential, therefore, that one ascertain thosespectral regions which are affected by the solar illuminant. This may be conveniently done bymeasuring the white target spectral distribution both in the laboratory and in the field. As with thecolorimetric laboratory procedure, an NBS standard illuminant A source and a regulated powersupply is essential for the laboratory spectrophotometric calibration. The source-to-target andtarget-to-spectrophotometer (or spectroradiometer) distances and angles are set up according to theNBS source specification. Also, photodetectors contained within the spectroradiometer do not have aconstant response as a function of wavelength and the spectroradiometer must itself be calibratedagainst a pure white reflectance standard of, say, magnesium oxide or barium sulfate. The calibrationprocedure includes setting the spectroradiometer and the source on an optical bench in order tomaintain the precise alignment and distance between the spectroradiometer, the standard plate, andthe source as specified by NBS.
Assuming that the standard plate is 100 percent reflective throughout the spectrum and thatthe angle between the source and the normal to the plate (see Figure 39), as well as the angle betweenthe normal and the detector is small, the response of the spectroradiometer with wavelength can bedetermined. For example, suppose at 550 nm, the illuminant A source has an output of 60 microwattsper cm squared according to NBS. If the spectroradiometer measures only 40 mw/cm 2 /nm after thelight is reflected off the white standard, then any data measured at 550 nm must be corrected by
I WhiteReflectance
I Standard
Normal toPlateRegulated
SpectroradiometerPower NBSSupply Illuminant
Standard Readout
Device
Figure 39. Laboratory set-up to measure spectroradiometer spectral response.
4-4

multiplying it by 1.5. A spectroradiometric correction curve can be generated for the entire spectralregion under consideration by plotting the correction factors, CX, along the y axis, and the wavelengthalong the x axis as shown in Figure 40.
2.0
S-10 S-1
1.6 -
O 1.2
.8
.4
0l I
400 500 600 700 800 900 1000
Wavelength in Nanometers
Figure 40. Correction factors for visible and near infrared photomultipliers.
Returning to the spectroradiometer calibration of the white target panel, the standardmagnesium oxide plate is replaced by the ground reference panel and the procedure outlined above isrepeated. That is, the spectroradiometer measures the reflectance of the target illuminated by thestandard sources. This data is then multiplied by the correction factors illustrated in Figure 40.
Let the NBS lamp output at any wavelength be LA, the spectroradiometer measurement at anywavelength be SA, and the correction factor at any wavelength be CX. Then,
CX (sX) = LX (PX)
where pX is the target reflectance at A, or:CA (SX)
PX=LX
The values of P for each wavelength become the laboratory spectroradiometer calibration of the whitepanel.
The field spectroradiometric data is obtained in the same fashion, except sunlight is now theilluminant. Although it may be interesting to measure the spectrophotometric properties of eachreference panel, the large volumes of data make this impractical in most cases. From a statisticalviewpoint it is far better to measure the white panel ten times, than each of the ten targets only once.The correct use and interpretation of these laboratory and field calibrations will now be discussed.
4-5

4.2 Effective Use of Reference Targets and Their Calibration
The ground reference panels are used in the taking, processing, and viewing of multispectral
photography in order to determine:
- The correct exposure ratio between the multispectral bands.- The corrections necessary when printing the positive images in order to produce satisfactory
transparencies for the additive color viewer.- The correct hue, brightness, and saturation of the multispectral additive color images for
optimal interpretation of the scene.
Without the use of at least the gray scale standard, the tasks described above would become tediouslydifficult to perform with any degree of accuracy or repeatability.
4.2.1 Exposure Determination
Multispectral photography has the advantage over subtractive films in that the exposure of
each record can be varied individually. Once selected, the exposures of each record will vary only ifchanges are made in any one of the following:
- the camera lens transmission- the selection of different camera filters- the use of a different emulsion- the spectral distribution of the solar illuminant
Prior to flight, all of the above should be invariant with the exception of the illuminant so that it is
possible to photometrically calibrate the camera and generate a set of pre-selected f/number
differences between the records.
The first step in this process consists of establishing an exposure criteria based upon the
reflectance of objects in the scene. The following are given as examples of this exposure relationship:
- that the photographic exposure be identical for each lens-filter-film combination,- that the blue image have 2.5 times the exposure of the green, while the infrared have '/2 the
green exposure, etc.
When the exposure ratios have been established, the set of f/numbers corresponding to these ratiosare determined in the following way:
- place the set of gray scale ground panels out of doors beyond the hyperfocal distance of thecamera lenses,
- place the desired film in camera and the selected filters over the lenses,- use a standard brightness meter or photometer to measure incoming solar illuminant,- expose film at each f/number for every lens; that is, set each lens at f/2.5 and expose; reset
lenses to f/5.6 and expose; repeat for all f/numbers. This should take only a few minutes tocomplete,
- remove filters from camera,- measure incoming solar radiation with each individual filter in front of the photometer;
record the data,- after processing the film, examine the gray panels on the film, select those f/numbers (one
for each record) which yield the gray scale density ratios required to fulfil your exposure
4-6

criteria. For example, suppose for equal exposure of the gray scale on each record, thefollowing f/numbers are selected as shown in Table VII.
Photometer MeasurementsThrough Filters
Record # Filter # f/Number Pre-Flight At Flight1 A 8 2002 B 2.5 803 C 5.6 1604 D 4 100
Table VII
- The data is xeroxed and taken into the field during the flight test and the solar illuminationis again measured using the same photometer and a duplicate set of selected camera filters.The last column of Table VII may now be filled in. Suppose the data is:
Photometer MeasurementsThrough Filters
Record # Filter # f/Number Pre-Flight At Flight
1 A 8 200 2202 B 2.5 80 1203 C 5.6 160 1204 D 4 100 100
Obviously, the pre-defined f/numbers will not yield the expected results due to a shift in theilluminant quality. Changes in the f/number or insertion of neutral density filters behind the coloredcamera filters will make the camera expose correctly. To determine the corrections necessary, wedivide the pre-flight data by the at flight data, or:
200Record #1 220 = Negligible Shift
80Record #2 8 -1/2 Stop
120
160Record #3 120 +1/2 Stop
100Record #4 100 No Change
This new data is relayed to the aircraft via ground-to-air communication so that the photographer caninsert the appropriate N.D. filters behind the spectral filters.
4-7

It is not always possible to possess two sets of every camera filter (one for the sensor and asecond for the photometer). The more practical method is to eliminate the photometer and to employthe spectroradiometer which is already required for the in situ spectral stdies of target reflectances.Instead of placing a filter over the collecting aperture, the total illumination is measured at a fewpoints covering the transmission bands of each filter (naturally the same spectroradiometer wouldhave to be employed to obtain both the pre-flight and the at flight data.) The resulting measurementswill be valid as long as: (1) the measurements are taken from the white target, the reflectance of whichis already known, and (2) the reflectance of the white target is measured at the same wavelengthswhen taking pre-flight and at flight data. Since,
Reflected Energy (R) = Incident Energy (I) x Target Reflectance (P) then,I = R/ p Equation 4-1
where: R is the reflected energy measured with the spectroradiometer in the fieldP is the inherent target reflectance measured in the laboratory
The question arises as to which wavelengths are to be selected for an evaluation of (I) in the previousequation. Each filter in a multispectral camera possesses a peak wavelength and half bandwidthpoints, as shown in Figure 41. The peak wavelength is that value of A at which the percenttransmission of the filter is a maximum, while the 1/2 bandwidth points are those upper and lowervalues of A for which the transmission is 1/2 of the peak transmission.
Peak T
' 50% Point -
-. Bandwidth X Peak + Bandwidth X
Figure 41. Definition of peak wavelength and /2 bandpass wavelength.
If, for example, four filters were chosen so that their transmission characteristics are similar tothose of 42, then the wavelengths at which I is measured, both prior to and during the flight test, areshown along the x-axis and are recorded in Table VIII. At the tiine of pre-flight calibration, the
2 4
" III
400 500 600 700 1 800 900
2 II i p3 I (/2 4(1/2 )Xpi II 1(/2)I
/2 A 3 %) X3,X( ) AX2(,) A3(/2) A3() lS(/) 4P2 p4
Figure 42. Peak and /2 bandwidth wavelength of four multispectral filters.
4-8

Pre-Flight Illumination
Record # 1 2 3 4
A I A I A I A I
-1/2 ) 425 nm ( ) 515 nm ( ) 715 nm ( ) 835 nm ( )
Peak X 450 nm ( ) 535 nm ( ) 755 nm ( ) 850 nm (
+1/2A 525 nm ( ) 567 nm ( ) 780 nm ( ) 859 nm ( )
values of R for the wavelengths shown are measured and substituted into equation 4-1 to obtain the
I's. That is,
R(-1/2)=I(-1/2 )
P(-1/2 )
'(A) = I (,)
P(X)
R(+1/2X) = I(+1/2)
P(+1/2)
Each column of I's is then averaged to indicate the amount of solar energy incident in the particularspectral band. A similar set of data is obtained during the flight and the ratios between the pre-flightillumination and the at flight illumination are handled in the same way as for the photometermeasurements.
Using this procedure, the pre-defined exposure ratios will always be adhered to, regardless of
any changes in the quality of the illuminating solar energy which may occur on the day of flight.
4.2.2 Exposure and Processing Corrections
It will be shown in Section 7.3 that sensitometric step wedges must be placed on the leading and
trailing edges of all rolls of film to maintain processing control. There is, however, for practical
purposes, no substitute for a step wedge in the scene and the calibrated ground reference panels (gray
scales) serve this purpose. By placing the ground targets somewhere around the middle of the flight
line, it is not particularly inconvenient to overfly them several times in a single roll of film.
Although the ground target sensitometric wedges of each multispectral record are developed
together for the same length of time, their gammas or the slopes of their characteristic curves will not
be the same. Gamma depends not only upon the emulsion type and processing conditions, but also
upon the spectral characteristics of the exposing radiation.
4-9

After processing the negative multispectral records and measuring the densities of the target
panels on each, a set of characteristic curves possessing different gammas similar to those of Figure43 are generated. These negative photographs must then be printed in positive transparency form for
final recombination in the additive color viewer. If no correction for gamma is made in this printingstage, the higher wavelength multispectral photographs will predominate in the final viewerpresentation. To eliminate this difficulty, the shapes of the characteristic curves for each record mustbe made identical. That is, the relationship between scene brightness range and density range must be
be the same for each multispectral record as illustrated in Figure 44. This may be accomplished by a
Infrared
Red
Green
Blue
Log E
Figure 43. Gamma depends upon the wavelength of the exposing radiation.
InfraredRed
GreenBlue
Log E
Figure 44. Gamma may be corrected in printing of the positive multispectral transparencies.
tone reproduction analysis (presented in Chapter 8) and four such reproduction diagrams must be
generated - one for each multispectral record. The camera flare curve is constant for each record and
4-10

is plotted in the first quadrant of the tone reproduction figure. The characteristic curves for the
negative material (one for each record) are different, as shown in Figure 43; these curves are plotted in
quadrant II. In addition, acceptable multispectral positive images must possess the following
characteristics:
- low minimum density- highest possible gamma consistent with the scene brightness range of the subject.
These two conditions allow one to predict the optimal shape of the final reproduction shown in
quadrant IV. This curve is identical for each multispectral photograph in a single frame. By extendingthe lines from quadrant II and IV to intersect in quadrant III, the characteristic curve of the positive
material is obtained. That is, the shape of the H&D curve of quadrant III indicates the correct
exposure and processing gamma of the positive material necessary for optimal reproduction of the
scene. Since the shapes of the curves of Figure 43 are all different, the final exposure and gamma for
the positive material will be different for all records. In summation, correct tone reproduction for
positive multispectral imagery is produced by drawing four tone reproduction diagrams (one for each
multispectral record) and filling in the quadrants as follows:
- drawing the camera flare curve in quadrant I of each diagram (this curve is constant),- drawing the final desired reproduction curve in quadrant IV of each diagram (this curve is
constant),- drawing the characteristic curves for the multispectral negatives from the data .contained in
Figure 43 (this data changes for each wavelength band),- generating the required H&D curve for the positive material in quadrant III of each diagram
(this data changes for each multispectral record).
4.2.3 Color Correction of the Final Imagery
The use of standard gray scale and color targets in the scene is required for correct cameraexposure and positive printing.
Suppose now that both multispectral additive and tri-pack subtractive imagery are flown over atest area containing the standard targets and that the white panel has laboratory CIE coordinates of
(.33, .33, 80%) and field CIE coordinates of (.40, .30, 70%). Assume that photographic imagery of thewhite panel was obtained during the time when the chromaticity coordinates were measured and that
perfect color reproductions of the scene resulted. The chromaticity coordinates measured from eitherthe additive presentation or the color film would be (.40, .30, 70%). We already know that these
coordinates are incorrect; however, by transforming (.40, .30, 70%) into (.33, .33, 80%) we will thenhave the truly correct color presentation of the scene. In an additive color viewer with controlled hue,
brightness, and saturation, this transformation is rather simple to accomplish using a colorimeter
equipped with a fiber optic probe. One merely adjusts the three parameters of color while measuringthe chromaticity coordinate of, say, the white target until the desired (.33, .33, 80%) is obtained. On
any other roll of film, on any other day, one merely adjusts the viewer until the white target again has
the same coordinates. All other images will then have the correct color regardless of atmospheric
effects, time of day, secondary reflectors, etc. This is particularly advantageous since photographictests of the same types of ground objects are often flown over a period of days under widely varying
solar illumination conditions. Also, once the desired photographic color characteristics of the ground
objects have been established, they should be maintained. In other words, if a certain object has a
4-11

color Q associated with it in one photo, it is desirable that it always remains the same regardless of theday or time. Measurement from standard panels in the scene greatly facilitates this.
While correction for tone and color balance in color negative materials is a rather complicatedprocedure (see Chapter 2), the known color of standard targets in the scene provides for a quantitativeassessment of the compensations required in printing. Little or nothing can be done to correct apoorly exposed reversal transparency unless an internegative is made.
4.3 Ground Truth
To accurately interpret a photograph not only in terms of its general content and obviouscharacteristics, but also in terms of its most subtle density and color changes is the primary task ofthose engaged in remote sensing. Through the medium of photographic imagery, one attempts toassign to certain density and color effects, an environmental phenomena or cause present on theground. Remote sensing looks beyond the obvious in a photograph, obtaining quantitative densityand color data contained therein. The final step, of course, is to accurately demonstrate that suchdensity and color measurements do, in fact, correlate with the conditions of the environment.
Natural terrain objects (unlike man-made) do not usually possess a consistent spectraldistribution. Although the basic shape of the spectroradiometric curve may appear constant, thereexist subtle color changes which depend upon the age of the object, its exact composition, theenvironmental conditions in which it exists and many more. In order to accurately interpret remotesensing imagery, it is necessary to provide a set of "keys" giving examples of typical terrain objectsunder varying conditions of the environment. These keys take the form of ground truth data, colorand spectroradiometric measurements, and associated imagery over the ground truth area.
The site selected for ground truth analysis should possess the following characteristics:
- It should be small enough in area to be investigated rather thoroughly by a ground truthteam.
- It should contain most of the objects under investigation and preferably a sufficient numberof specimens for statistical sampling.
- Optimally, it should contain similar objects under different sets of environmental conditions.It is sometimes possible to artificially alter the environmental conditions of some specimens(e.g., irrigating some areas or artifically fertilizing several samples, etc.).
- The area selected for ground truth should be sufficiently isolated so that it remainsundisturbed by the rest of humanity. (One classical example of this: a group of foresters hadselected a site, taken extensive ground truth, overflown the area, and found somediscrepancies in the imagery. They returned to the site for a double check only to find thatmost of the forested area had been cut down for Christmas trees!)..
Ground truth should be collected as near to the time of flight as possible since the physicalappearance and spectral reflectance of some objects change appreciably at certain times of the year.Ground truth is then annotated onto black-and-white prints of the area, preferably exposed at lowaltitude for clarity.
A set of sample data sheets for ground truth collection are included at the end of this chapter.They will, no doubt, have to be modified depending upon the particular characteristics of the test site,time of year, and the photographic mission objective. Nevertheless much of the physical description
4-12

ground truth targets can easily be obtained prior to the measurement of reflectance spectra. As muchdata as possible should be filled out on the ground truth sheets, so that the crews equipped with theseforms and an aerial photo of the area can concentrate their efforts on reflectance measurements andthe immediate environmental factors which will influence that data.
Each ground truth team should consist of at least two people to measure reflectance and a third(familiar with the targets - for example, a forester, hydrologist, agronomist) to record the remainder ofthe data and to select samples for laboratory analysis.
For the sake of accuracy, it is advantageous if those who collect the data also reduce and analyzeit. Ground truth teams are a good deal more careful in the selection of samples and the measurementof field data if they are made aware that they will be responsible for the test results and anyconclusions drawn from them.
In addition to the incidence and reflectance spectroradiometric instrumentation discussedpreviously, the collection of adequate ground truth requires little in the way of auxiliary equipment.Properly labeled vials for laboratory samples, as well as a Polaroid color camera to photograph thetargets, are essential. These photos, taken from the direction of the spectroradiometer, can be easilyattached to the data sheets for future reference on exact target size, location, sun angle, etc.
4.4 Summary
- Quantitative analysis of color imagery necessitates placing standard panels in the scene,collecting complete ground truth, and making provision to color correct the photographicresults.
- Ground targets should be diffused and the gray scale should exhibit flat spectraldistribution over the visible-near infrared wavelength regions.
- Four color and six gray targets are considered the minimum number of ground panelsnecessary for quantitative analysis of film.
- Colorimetric and spectroradiometric calibration of ground targets should be made both inlaboratory and in the field.
- Laboratory illuminant for calibration of targets must be an NBS standard.- Exposure ratios between spectral bands are determined from in situ reflectance spectra of
objects in scene.- Different gammas on each multispectral negative record must be corrected for in the
printing stage.- Tone reproduction analysis will indicate requirements of the positive multispectral records
so that gammas will match.- Ground truth permits one to relate the color effect on the film with an environmental cause.
4-13

Agricultural Ground Truth Data Sheet
Date: Field Designation:
Time: Owner:
Weather: By:
Physical Description:
Size of Field: x or acres Photo #
General Soil Types:
Species or Cover:
Variety:
*Population: plants/acre
*Row Width:
*Row Directions:
*applicable for row crops
Agricultural Data:
Planting/seeding date:
Planting Technique:
Flowering Date: % Cover: Height:
Heading/Tasseling Date: % Cover: Height:
Maturity Date % Cover: Height:
Anticipated Harvesting Date:
Plant Vigor:
Previous Rainfall: Date: Light Medium_ Heavy
Soil Moisture:
Treatment (fertilization, cultivation, etc.)
Type Date
Spectral Reflectance Data:
Time: Start End
Instrument (Incidence): Sun to crop angle:
Instrument (Reflectance): Crop to SR angle:
(Append data and reflectance curves on next sheet)
Figure 45
4-14

Geologic Ground Truth Data Sheet
Date: Site Designation:
Time: Owner:
Weather: By:
Physical Description:
Area within Site: Photo #
General Soil Types:
Ground Cover:
Target #: General Target Classification:
Check Those Applicable:
Welded: Non-Welded: Vitric: Volcanic:
Rubble: Outcrop: Soil: Type:
Weathered: Crystalline: Sample Taken: Yes No
Group Classification:
Target Size:
Laboratory Mineralization Tests:
Date:
Test Performed:
Target Composition:
Spectral Reflectance Data:
Time: Start End
Sun to Target Angle:
Target to SR Angle:
Instrument (Incidence):
Instrument (Reflectance):
(Append data and reflectance curves on next page)
Figure 46
4-15

Hydrological and Oceanographic Ground Truth Data Sheet
Date: Site Designation:
Time: U.S.C.G. Chart #:
Weather: By:
Physical Description: Photo No.:
Location (referenced to land):
Tide: In Out
Currents: Yes No Direction: Speed:
Channel: Bay:
Wind Speed: Wind Direction:
Bottom Depth:
Water Temperature:
Salinity:
Presence of Injected Effluents: Location:
Water Samples Taken: Yes No
Depth:- Number:
Depth: Number:
Depth: Number:
Depth: Number:
Depth: Number:
Laboratory Analysis of Samples:
Date: Type of Test:
Depth #Refractile/cc # /cc # /cc # /cc # /cc # /cc Total #
ft
ft
ft
ft
Spectral Transmission Data:
Time: Start End
Depth:
Instrument (Incidence):
Instrument (Reflectance):
(Append data and reflectance curves on next page)Firgure 47
4-16

Forestry Ground Truth Data Sheet
Date: Site Designation:
Time: Owner:
Weather: By:
Physical Description:
Area Within Site: Photo #:
General Soil Type:
Ground Cover: Species:
Variety:
Population: trees/acre
Target Description:
Height: Plant Vigor:
Density: Soil Moisture:
Crown Size: Previous Rain:
Maturity:
Needle Samples Taken: Soil Sample Taken:
Laboratory Analysis of Samples:
Date:
Type of Test:
Minerals in Soil Mined Minerals in Ash (ppm)
Spectral Reflectance Data:
Time: Start End
Sun to Target Angle:
Target to SR Angle:
Instrument (Incidence):
Instrument (Reflectance):
(Append data and reflectance curves on next page)
Firgure 48
4-17

CHAPTER 5
SENSITOMETRY
The photographic process consists of a rather complex chain which links the photographedsubject with the final positive, suitable for detailed interpretation. A block diagram of the process isshown in Figure 49. It should be noted that the sensor (camera) plays a rather minor role in the overallscheme, while the emulsion selected and the conditions used each affect the final photographicproduct. A black-and-white photographic process must only simulate or reproduce the tonal values of
Block Diagram of a Photographic Process
Figure 49. Block Diagram of a Photographic Process
a scene. Full color photography, however, must be capable of reproducing the multitude of hues in ascene, as well as their brightness or tone. For pictorial photography, it is usually sufficient for the userto decide either that he likes or does not like the photo reproduction of his scene. However, for moresubtle photographic applications (such as earth resources study), the aerial photographer isparticularly concerned with how well the resultant image density or color relates to the conditionspresent in the scene.
By way of illustration, consider the problem of interpreting density changes on black-and-whiteaerial photographs. Assume that a flight line is photographed at 9:00 AM, 12:00 noon, and 4:00 PM,and the film is processed immediately after each run. An examination of the three film strips showsthat different densities are present for the same image depending upon the hour of the flight. Question- what caused the different densities? Several possibilities come to mind:
1. The effect of differences in solar sun angle and illumination, since the red component of thesun increased in the early morning and late afternoon.
2. The effect of late afternoon haze conditions caused by industrial smoke in the area. Althoughthis wasn't a factor at 9:00 AM, it could have been at 4:00 PM.
3. The effect of altering the camera exposure since less exposure was required at noon when thesun was brightest.
4. Any effect which might have been caused by using three separate rolls of film, since filmscharacteristically differ from roll to roll.
5. Reuse of the same developer which might have produced different densities of each roll offilm since developer loses its strength with use.
5-1

The most important question the photographer might ask is - "If I fly another area tomorrow with
the same types of objects in the scene, how can I interpret the resulting image densities accurately
when I get different densities on today's flights over the same area?". The problem appears, at first
glance, to have no solution. However, by applying certain measurements to the photographic process,
a relationship can be made between the ground object and its image density on the film regardless of
solar conditions, atmospheric haze, film or processing conditions. This is accomplished through the
use of accurate and continued sensitometric control.
Sensitometry is a science fundamentally concerned with the measurement and evaluation or 1 u
response of a photographic emulsion to radiant energy. It involves five distinct tasks:
- The exposure of the film to a source of illumination whose radiant energy is known.
- The development of the film under accurately controlled conditions of temperature, time,
chemical strength, solution agitation, and drying.- The use of a density standard such as a "density step tablet".- The precise measurement of the image densities produced on the film.
- The interpretation of these measurements.
Sensitometry is primarily used to established correct development time so that accurate and
reproduceable imagery results. However, such techniques are also employed to determine the speed,
gamma, and exposure latitudes of film and to investigate the maximum contrast in a scene which a
film can record correctly.
5.1 Sensitometric Test Procedures
5.1.1 Exposure
Photographic films are coated with a gelatin emulsion into which are embedded tiny crystals of
silver halide. Some of these crystals are made to be more sensitive to different kinds of light - for
example,x-ray, infrared, ultraviolet, visible, etc. Exposure of these crystals to light, for a given length
of time, causes the formation of a latent image on the film. The exposed silver halide is then converted
to metallic silver by an agent in the developer. The extent of conversion to metallic silver (density) is. a
function of the amount of light exposing the crystals (photographic exposure) and is given by:
E = It
where I is the intensity of the light source and t is the exposure time in seconds. For visible light, the
source intensity is measured in units of meter-candles resulting in a photographic exposure expressed
in meter-candle seconds. When processed, the final image will have a density which may be related to
its photographic exposure. Sufficient variation in this photographic exposure (E) will produce an
entire range of film densities from clear to opaque.
The light source employed for the sensitometric evaluation of a film should have the same
characteristic as the source under which the actual imagery will be taken. In the case of aerial
photography, sunlight is used as the scene illuminant; a flash tube with a color temperature of
5400 0K, which approximates sunlight, is employed for sensitometric tests since this light source
fulfills the following conditions:
- its spectral distribution covers the entire photographic region from 360 nm to 920 nm,- it maintains an almost constant intensity over long periods of time.
5-2

The sensitometric characteristics of a film are determined by analyzing the densities whichresult from various exposures. Since the photographic exposue (E) is related to both intensity (I) andtime (t), it is necessary to alter either the radiant output of the light source or the exposure time. Thisis performed by an instrument which is used to expose photographic materials for testing andevaluation and is known as a sensitometer (shown schematically in Figure 50). It consists basically ofa light source, either a shutter or timer to control exposure, and a density step wedge (Figure 51) tocontrol the illumination falling onto the film. The step wedge is made by exposing between 11 and 21steps to a lighted field in succession; generally, the densities of the steps are such that they producefilm exposures which increase as the log of .15, ranging from 0 density to 4.0 density. Although theycan be made in the photo lab, gray scale step wedges are commercially available from, say, EastmanKodak Company and are supplied with precise density measurements of each step.
Density Step Wedge
LightExposure Source
Timer
110v, 60c/s
Figure 50. Schematic of sensitometer showing basic components.
Figure 51. Density step wedge.
5-3

5.1.2 Sensitometers
The E.G.&G. Mark VI Sensitometer, a self-contained unit housed in a molded plastic case, is
solidly constructed and conveniently sized for inclusion in any modern darkroom arrangement. Four
operating controls (On-Off toggle and 10-2, 10-3 , and 10 4 exposure time selector switches) are located
on the front panel of the instrument. A fourth control (trigger switch) is located under the hinged
cover platen at the top of the instrument. Triggering is accomplished either by depressing the platen
or remotely through a receptacle on the right of the base. (A suitable contactor and leads must be
provided.)
The sensitometer operates on standard 115 V, 60-cycle, a/c power. A built-in voltage regulator
circuit prevents change in light output with line-voltage fluctuations from 95 V to 130 V. The time
constants of the three different RC circuits provide three precise duration flashes at three different
energy levels. The highest output, approximately 3000 meter-candle-seconds (M.C.S.) is obtained
from the 10-3 sec circuit. The 10-2 and 10-4 sec circuits deliver approximately 600 and 55 M.C.S.,
respectively.
The complete Mark VI system consists of the sensitometer, a gray-scale box, flashtube shield,
two variable-area filters, and a Kodak No. 2 photographic 21-step tablet. The gray-scale box, which is
inserted into the body cavity under the platen of the instrument, provides the exposure platform upon
which the film undergoing test is exposed. The variable area filters (3-line and 19-line), which are
inserted between the flashtube shield and the gray-scale box, allow the user to balance the light
output. The 3-line and 19-line filters, which can be considered equivalent to ND 1.70 and ND 1.0
filters, are used to reduce the light output of the 10-3 and 10-4 sec circuits, respectively, to that of the
10-4 sec circuit. The reduction of the light output of the three circuits can be useful in studying film
characteristics and exposure reciprocity effects. The step tablet is supplied as an exposure modulator.
Neutral density filters, which must be cut to fit into the body cavity, can be used to reduce the light
output of the individual circuits to suit the needs of the specific film undergoing test. Neutral density
filters (Kodak Wratten 96 series, or equivalent) can be obtained from most photographic supply
houses.
The Mark VI, because of the precise duration and repeatability of its 10- 2, 10 -3,. and 10-4 circuit
outputs, is an ideal tool for exposure reciprocity effects studies. With this instrument, the reciprocity
effect for a given film can be demonstrated simply by generating separate characteristic curves using
each of the separate exposure time settings with the required variable area compensator in place.
Since the total light output in the film plane is nearly constant for all circuits when the compensators
are inserted,, each film would be receiving the same exposure as the product of the different
intensity-time factors. Any shift in the resultant characteristic curve from that achieved at the
standard exposure duration would indicate the effect of exposure reciprocity.
The Herrnfeld Sensitometer finds its primary use in the motion picture industry for testing of
the film samples and processing control. This instrument uses tungsten light source; the exposure
time can be varied by changing the width of a slit adjacent to the sample.
The Eastman Kodak Processing Control Sensitometer incorporates a tungsten light source, a
motor driven shutter at a fixed time of 1/5th or 1/10th second, and can be obtained with various step
tablets (optical wedges). As the name of this instrument implies, it is not offered as a precision
instrument nor does it conform completely to the present standard. It is useful for the exposure of
samples intended to be employed in tests of processing equipment control. It also is widely used as
the basis of tests for comparing different films, developers, etc.
5-4

There are several alternatives to the use of a sensitometer if none is available to expose thewedge onto the film. First, a standard transmission type step wedge may be procured and eithercontact printed or projection printed (using an enlarger) onto the strip of test film. Although thismethod is much less accurate and reproducible than exposing the wedge in a sensitometer, it is,nevertheless, far superior to having no step wedge exposed on the film at all. The second method ofobtaining sensitometric data on film is to purchase or rent large step wedge panels which may beplaced in the scene and photographed with the camera. Data Corporation in Dayton, Ohio, leases suchcanvas panels (up to 100' x 100' square) and their nominal reflectances are 4%, 8%, 16%, 32%, and64%. When placed in a line, these panels act as a modified step wedge on the film as may be seen inFigure 52.
Figure 52. Large gray scale and color panels placed in the scene.
5.1.3 Processing
When the density step wedge has been properly exposed, the film is then processed. It isabsolutely essential that the development be reproducible and that it be uniform throughout the teststrip. Processing standards must be established and include such factors as:
- Developer strength- Control of agitation- Washing and fixing control- Drying factors
A typical darkroom arrangement for developing black-and-white films is shown in Figure 53.Five trays are used and the processing takes place from left to right in the following sequence:
1. Development of image.2. First wash to remove residual development chemicals from the emulsion.3. Film rinsed in short stop to quickly stop the development process from continuing. Note:
development continues to this point.4. Clearing of the film in the hypo to remove the unexposed silver from the emulsion.5. Final wash to remove residual chemicals.6. Option of using photo flow to assure even drying of the film.
5-5

Several steps preparatory to processing should be taken to assure accurate reproduction of the teststrip step wedges. Development may be performed using either tanks or trays, although roll film ismore easily processed in tanks or automatic processing machines. Nevertheless, all containers shouldbe thoroughly cleaned to remove any residue of old chemicals which might have accumulated. Prior tomixing the developer and hypo, an analysis of the water used should be made; often there existsexcessive quantities of sand in the tap water, especially when the water is supplied from an artesianwell. This sand, although in suspension, tends to stick to the gelatin emulsions producing a "sandy"feel and appearance on the film. Filters which may be set into the water line to remove sand andexcess chemicals from the water are commercially available.
Printing ContactRefrig. Freezer Material Enlarger Printerink
Storage
FilmStorageArea
Printing Dark Room Processing SinkDark Room
0 2 Sink
DarkRoomSeal
WorkArea
Light Table
Wr
-- Laboratory Area
SDesk
o Desk
Light Table
Office Space
S DFilesO Densitometer I[ I eS I
Figure 53. Layout of a precision darkroom and adjoining area.5-6

The type of developer used to process a particular film is specified by the film manufacturer and
requires mixing just prior to use. Mixing directions for both developer and fixer must be followed
exactly if repeatable results are to be expected. Making small batches of the developer and fixer is
often more economical than mixing large volumes at once since the solutions oxidize with time and
have a shelf life of only about one to two months depending upon the chemical composition of the
developer.
Once the chemicals have been mixed, they must be cooled before using; in most cases processing
temperatures are specified to be 68 0 F (20 0C), although some materials may be processed at
temperatures as high as 85 0F. The time-temperature charts discussed in Chapter 6 will show that the
resultant film density is a function of processing, chemistry, temperature, and time. Therefore, the
temperature of the processing solutions should be kept accurate to+V±2F, especially when developing
color films. The simplest method of maintaining a constant solution temperature is to place all tanks
and trays in a large water bath. The temperature of this water jacket can be controlled by use of a
thermostatically regulated immersion heater. It is often helpful to keep the darkroom temperature at
the same level as the processing solutions; heat transfer into and out of the water jacket will then beminimized.
Developing solutions can generally be used to process a considerable amount of film over
appreciable lengths of time. Some agents such as D-76 may become dark and cloudy with use but thisdoes not impair their effectiveness. The developer does, however, become slower in action due to (1)the depletion of the developing chemicals in solution, and (2) the accumulation of processing
by-products in the developer. Hence, the length of time in which a film is processed must be increased
gradually as the developer strength decreases with use. The best control over development strengthcan be maintained by exposing a sensitometric step wedge on a strip of film and processing it in a newbatch of developer. This strip then becomes the standard. As the developer is depleted, several other
wedges are exposed, processed for different lengths of time, and compared to the standard. The wedgewhich best matches the standard represents the new development time. In large scale processing orwhen economy is desirable, replenishing agents may be added to the depleted developer in order to (1)
substantially increase its life, and (2) to make increases in processing time unnecessary.
A note of caution: extreme care should be taken so that the developer does not become
contaminated by other solutions such as fixer, short stop, etc.
5.1.4 Fixing and Washing
After the development process, both the metallic silver image and the undeveloped silver halide
(the areas not exposed to light) still exist together in the emulsion. Also the undeveloped silver halide
is still sensitive to light. In order to remove the unwanted silver halide from the gelatin and to
stabilize the image, the film undergoes a process called fixing. Fixers such as sodium thiosulfate
convert the unwanted silver to a water soluble form permitting them to be "washed out" of the
emulsion. Hardening agents are added to the fixer in order to make the gelatin tough and resistant to.
scratches.
There has been much discussion concerning the length of time for which a film should be fixed.
Generally, the maximum time is thirty minutes, although with commercially available rapid fixer the
time has been reduced to about four minutes. As the unwanted silver goes into solution, the film loses
its opacity and clears. A good rule of thumb is to fix the film twice as long as it takes to clear. A note
5-7

of caution: do not turn on darkroom lights until the film has cleared. When in doubt, it is better to
wait another few minutes than to inadvertently expose the undeveloped silver to light. A fewcomments on fixers:
- A fixer will clear the film faster when the temperature of the solution is increased.- Smaller grain films fix faster than large grain films.- Thinner emulsions fix faster than thick emulsions.- Fixer may be used in concentrations of 25-40 percent; follow manufacturer's directions for
mixing and concentration.- Do not use exhausted fixer; it produces staining, clearing is difficult, and the film requires
more time for drying.- Test fixer for exhaustion by employing a technique such as the potassium iodide
precipitation test as follows:
- 10 milliliters of 4% potassium iodide mixed with 100 milliliters of hypo to be tested.- Shake the solution.- If a yellow precipitate falls out, then the hypo is exhausted.
Having completed the fixing process, the film is thoroughly washed to prevent crystallization of anyresidual processing chemicals or dissolved silver on the film surface. The film should be washed for atime depending upon how long one wishes the film to last without staining. In general, 90% of thechemicals are removed from the film surface in five minutes; of the remaining 10%, 90% of these areremoved in the next five minutes; of the remaining 1%, 90% of these are removed in the next fiveminutes, and so forth. Generally, films should be washed for at least thirty minutes to one hour forpermanency. This time interval will differ depending upon the circulation rate and efficiency. Figure54 below, shows two types of washing tanks, and if the poor design is employed, then the washingtime must be at least doubled.
Poor wash-tank design. Note that the Good wash-tank design, producingwater is turbulent only near the top of the tank turbulence throughout the tank.
Figure 54. Two types of washing tanks for photographic film.
Some brief comments about washing:
- Washing time is decreased with an increase in the water bath temperature. This, however,will tend to soften the emulsion and extreme care must be taken that the film is not touchedby anything which might cause the emulsion to peel. This includes the edges of other piecesof film in the tank.
- A hypo cleaning agent such as sodium sulfite will decrease the required washing time.- Films fixed in a solution which lacks a hardening agent take more time to wash since an
unhardened emulsion tends to hold more hypo than a hardened film.
5-8

Drying the film is the last step in the processingprocedure. This should take place in an area with a
relative humidity of about 65% and a temperature of about 68 0 F. Increasing the ambient room
temperature will, of course, speed up the drying process. Nevertheless, too much heat will melt the
emulsion or cause the outer gelatin layers to dry while those nearest to the base will still be damp.
This condition may set-up stains within the emulsion and increase the graininess of the images.Sufficient air flow is essential to an even drying of the film and it follows that as the air circulation isincreased, the drying time will be decreased. It is also helpful to squeegee the surface water from the
film; this step (optional) must be done with extreme care lest scratching of the soft emulsion take
place. One of the best film drying methods consists of hanging the film in a drying cabinet. Most of
these units consist of electrical heaters and blowers which keep the air circulating. They are
commercially available, do not take up much room, and are very helpful in keeping the water off thefloor.
One further note: a darkroom can become a very sloppy place to work in. Chemicals splash, thefilm drips wet while being moved from tank to tank, and working under completely dark conditions
amplifies this situation. Wipe all surfaces with a clean sponge or rag after processing of each batch of
film. Chemicals left on surfaces can permanently stain or otherwise ruin darkroom equipment.
5.1.5 Processing Summary
The following procedure should be followed in order to accurately and repeatedly process both
sensitometric step wedges and exposed imagery:1. Select the developer and fixer to be used from the film manufacturer's recommendation. This
information is supplied with the film.2. Check the quality of the water supply, and, if necessary, use a filter to remove excess
chemicals and suspended material.3. Use tanks or trays depending upon the quality of film to be processed.4. Clean all equipment prior to use, including:
- Tanks or trays - four in all - for developer, developer wash, fixer, and final wash.- Solution mixing bottles.- Thermometer.
5. Mix developer and fixer EXACTLY according to the manufacturer's instructions.6. Cool solutions prior to use.7. Place tanks or trays in a water bath to maintain correct processing temperature.8. Check solution temperatures just prior to developing.9. Use a darkroom clock and preset the alarm for desired processing time.
10. Agitate tank or tray according to manufacturer's instructions.
5.2 Measurement of Sensitometric Data
As stated previously, the conversion of a latent image into a metallic silver deposit (density) onthe film is related to the amount of light striking the film (exposure). The density of film is a measureof the transmission characteristics of the developed emulsion, while the density of paper is a measureof its reflectance properties. Hence, there exist two types of densities - transmission and reflection,each one requiring a different method of measurement. Only transmission densitometry will beconsidered here.
5-9

A processed photographic film is basically translucent and when light strikes it some of the
light is absorbed, some is transmitted, and some is reflected. The transmission of a film is defined as
the ratio of the light which passes through it to the total amount of light incident.That is,
Transmitted LightTransmission =
Incident Light
The extent of opaqueness due to metallic silver in the emulsion is called opacity and it is defined as thereciprocal of the transmission or:
Opacity Incident LightTransmitted Light
When the transmission of the emulsion becomes very small, the opacity becomes quite large andcumbersome to use. To simplify the situation, the density of film is used and is defined as the commonlogarithm of opacity:
Density = lo10 0 opacity
By way of illustrating the relationship between transmission, opacity, the following table is given:
TABLE IXRelationship Between Transmission, Opacity, and Density
Transmission 1/2 1/4 1/8 1/16
Opacity 2 4 8 16Density .3 .6 .9 1.2
It should be noted that there are two distinct definitions of density which relate to the nature of
photographic films. A beam of light passing through an emulsion is scattered in all directions by the
silver particles as shown in Figure 55. When a narrow beam of light falls on the film sample and the
densitometer collecting aperture or integrating sphere is placed sufficiently far away so that only the"paraxial" rays enter the sensing head, then the density measurements are said to be specular asshown in Figure 56.
Notice that only the rays which emerge almost perpendicular to the film are measured. Diffuse
density can be measured in two ways. Figure 57 illustrates the case in which light from all angles falls
onto an opal diffusing glass before passing through the film. The collecting sphere is placed
sufficiently far away so that only the rays which are almost perpendicular to the film are measured.The second method of measuring diffuse density consists of focusing a narrow beam of light onto theemulsion and placing the collecting aperture in contact with the film. This situation is illustrated inFigure 58. As may be expected, the specular density will be higher than the diffuse density measuredfrom the same film area. This is due to the fact that not as many rays of light enter the integrating
sphere of the densitometer where it is placed away from the film. Specular density is difficult to
measure because of the necessity of exact alignment between the incident light, the film, and thecollecting aperture of the instrument.
5-10

because of the necessity of exact alignment between the incident light, the film, and the collecting
aperture of the instrument.
Although most densitometers used today are electronic, direct reading instruments which
measure diffuse density, both visual and electronic types will be discussed.
Figure 55. Scattering of light by silver particles within an emulsion.
Figure 56. Measurement of specular density.
Figure 57. Measurement of diffuse density.
Figure 58. Second method of measuring diffuse density.
5-11

5.2.1 Densitometers
A visual densitometer is one which depends upon a visual comparison and evaluation of the filmwith a standard density. Although they are, in general,- sufficiently reliable for most measurements,the great variable in the system is the human eye. Visual densitometers employ two adjacent fields oflight; the first field of view contains the sample to be measured and the second contains a continuousdensity wedge. A knob on the face of the instrument controls the position of the wedge and indicatesthe amount of density in the second field of view which is required to create a visual match. Thedensity of the sample is then read from the knob. Figure 59 illustrates two cases in which the film andstandard densities do not match and one case in which they do.
Sample denser than Sample lighter than Matched densities betweenstandard standard sample and standard
Figure 59. Densitometer fields showing their differences, as well as a good density match.
A schematic diagram of a visual densitometer is shown in Figure 60 below. Two identical lightsources, S1 and S2, illuminate the sample (f) and density wedge (w) respectively. A circular mirror, M,with a hole in it directs the light from the wedge onto a diffuser, D. The illumination from the sample(f) passes through the hole in the mirror and is focussed in the center of the angular ring from thestandard beam. A density match is made by moving the wedge.
Figure 60. Double light source densitometer.
5-12

Another more accurate visual densitometer is shown in Figure 61. It is a well-known fact that
the illumination from a light source decreases as a function of the square of the distance from it. That
is,I0
d d2
where 10 is the intensity of the light measured at a distance one foot from the source,
Id is the illumination at a distance d from the light source. For example, if a source radiates 20
foot candles of light (Io), then at a distance (d) two feet away, the light (Id) is only five foot candles
since:
20
d = (2)2 5
The densitometer shown in Figure 61 is based upon this principle and is known as an inverse
square law instrument. As the light source, S, is moved to the left, the amount of light through the
sample (f) is increased, while the amount of light in the comparison beam is decreased. Moving the
light source to the right produces the opposite effect. The scale attached to the light source is
calibrated according to the difference in the distance between the beams and reads directly in density.
L
M• \ M2
M3
fD S
V M 1r '..... ... " ' DENSITY SCALE
Figure 61. Inverse Square Law visual densitometer.
The sensitivity of the eye is such that the precision of the visual densitometer is limited to
density differences of .005. Actually, the instruments are not even that precise, owing to eye fatigue
which results in lower density discrimination. As a result, most visual densitometers have been
replaced by photo-electric instruments. In addition to being able to measure density differences to
about .0005 (ten times better than the visual densitometers), photo-electric units can make about
sixty readings per minute compared to six readings per minute for the visual densitometer.
There are two common types of photo-electronic densitometers: direct reading and balancing or
null. Figure 62 shows some of the components of a direct reading photo-electric densitometer.
Referring to Figure 62 the illumination from the source is directed (by means of a lens) through a
small aperture. This illumination then falls onto a photodetector, the electrical output of which is
amplified and displayed on a meter calibrated in density units. When no film density is being
5-13

measured, the light transmission through the aperture is 100 percent and the meter reads "zero"density. However, when a photographic emulsion is placed over the aperture, the amount of lightreaching the photodetector is reduced by the opacity of the film and the meter reads the correct valueof density directly.
PHOTOCELL DIRECTREADING
SAMPLE METER
LENS
HEAT ABSORBINGGLASS
LAMP
Figure 62. Basic components of a direct reading photoelectric densitometer.
Figure 63, below, shows a schematic of a null or balancing densitometer. This particularinstrument separates the illumination into two light beams and the meter indicates whether or notthere exists a balance between the two beams. When no film is placed over the aperture, the twobeams are balanced and the meter reads zero density. When film is placed over the aperture, thebeams are not balanced. The operator then brings the needle on the meter to the null position bymoving the neutral density wedge and the film density is read from a calibrated scale on the wedge.
Recorder
5- ---------
Sanimp Wedge
Figure 63. Null or balancing type densitometer.
Most densitometers have provision for measuring not only black-and-white densities, but alsothe color densities (red, green, and blue) which are associated with color films. The instrumentscontain a set of three filters (red, green, and blue) which may be successively inserted in front of thesource to measure color density as follows. One of the color filters (say, green) is inserted into the lightpath and absorbs the red and blue components of the source. The photo detector then only "sees" theamount of green transmitted by the film which is read as a density. Without moving the film, the redand blue filters are placed into the light path and their densities are measured. The advantage of acolor densitometer is that it gives an indication of both the density contained in each dye layer of a
5-14

color film, as well as the composite density of all three layers (by removing any filters from the light
path).
The Macbeth Quantalog Transmission Densitometer TD-102 has been developed to fill the need
for an easy-to-operate, reliable, precision instrument for measuring the color and visual densities of
materials. The readings taken with the TD-102 indicate diffuse transmission density, on the linear
meter scale, with evenly spaced gradations. The total power consumed by the TD-102 is
approximately 60 watts and the power transformer of the TD-102 has been designed for either 115 or
230 volt operation at power line frequencies of 50 and 60 cycles/second.
The electronic power supply of the TD-102 is self-regulated and hence is not affected by normal
line voltage variations. However, line voltage variations will affect the stability of the energy radiated
by the optical system's light source. Therefore, a voltage regulator must be used to prevent these
fluctuations from causing reading errors. The instrument is equipped with a color filter turret which
contains four filter positions. The filters installed are the Wratten #92 in the red, the #93 in the green,
the #94 in the blue, and the #106 in the visual filter position. The linear 0 to 4.0 density scale is divided
into 200 gradations, each equal to 0.02 density units. The circular stage diffuser hasa brightness of
approximately 100 foot lamberts. Circular apertures of 1mm, 2mm, and 3mm are supplied for
measuring different size images.
The Itek recording densitometer, Model RD-2, is a compact, precision densitometer providing
automatic readout and plotting of black-and-white film density. The instrument permits automatic
plotting of characterisitic curves, scene density spread, or image density by means of a photometer
system integrally coupled to a direct density readout and an automatic curve plotter. In addition,
the unit can act as a precise spot reading and available as BCD electrical outputs.
The instrument provides density readout and plots from 0 to 4.0 ± 0.02 density unit accuracy.
Film density can be measured continuously or at any point over a 5-inch long scan track of the sample
by 1/2 millimeter wide collection aperture which energizes an all-solid state regulated, DC photometer.
Density readings are repeatable to 0.005 density unit from scan to scan over the sample.
The reading station accommodates all film sizes in roll or chip form without film cutting or the
use of film clamping platens, thus minimizing film handling and abrasion. Characteristic curves can
be read and plotted from continuous or step density wedges in fifteen seconds for process control uses
or in forty-five seconds for precision laboratory measurements by scan speed selection. A cross-hair
reticle is provided to enable accurate positioning of the sample spot over the reading aperture during
spot density reading. In addition to the aperture supplied ('/2 by 11/2 millimeters), the unit can be
provided with a variety of smaller apertures for specialized densitometric operations.
A digital readout meter which converts the analog voltage to a digital signal to operate the
numeric display is installed in the RD-2. Terminals that are provided on the meter permit the digital
signal to be tapped off for transmission directly to a computer or to computer terminal equipment.
When using the Tech/Ops color recording densitometer, three color filters and three
corresponding pens are automatically selected during a single, forty-five second scanning cycle to
provide a three-color plot of optical density along a 16mm or 35mm sample. The color recording
densitometer contains an internal reference wedge for accuracy within i 0.01 density up to 2.0 density
and within.+ 0.02 density for the full 0 to 3.5 density range. The unit is calibrated for ASA fine-grain
film. A differential speed control slows down the scanning speed when large density changes occur.
It is difficult to recommend one particular densitometer over another. The choice of a unit is
dependent upon many factors: stability, price, work load, maintenance requirements, etc. In
5-15

situations where the work load is high, an automatic densitometer might be worth the additional costin order to obtain data which is recorded, punched on cards, or plotted automatically. Although visualdensitometers are the most time consuming to use, they are very stable and may be employed insituations where the sensitometric work load is small.
5.2.2 Densitometer Operation
Once the choice of a densitometer has been made, the unit must produce repeatable results overlong periods of time. The following precautions should be taken to assure this.
- Photo-electric densitometers require long warm-up times to reach stability. Therefore, thedensitometer should be turned on and left on continuously, even when not in use. The lampis turned off, except during use.
- Films should be handled only while wearing cotton gloves; particular care should be takenwhen handling calibrated step wedges to avoid scratches, fingermarks, dirt, etc.
- The densitometer must be zeroed prior to each set of measurements. This is accomplished byreading the density when there is no film in the gate. Should the density reading appearhigher than zero or lower (off the scale), the "zero adjust" knob is turned until the densityscale on the meter reads zero. A periodic check on this zero point should be made whiletaking density measurements.
- Some densitometers are supplied with apertures of various sizes (for example, 1mm, 2mm, and3mm). Often the densitometer light source has two wattage ratings associated with it, onefor the 1mm and 2mm apertures and the other for the 3mm aperture. A switch on the back ofthe densitometer is provided to select either the "high" or "low" beam depending upon theaperture used. Always check that the switch is in the correct position.
- A calibrated step wedge must be employed as a standard density scale. Checking themeasured density readings from the densitometer with those measured densities suppliedwith the wedge gives a good indication of instrument performance and allows a density cor-rection curve to be generated.
The design of data sheets to record and plot the sensitometric and densitometric measurementsdiscussed in this chapter, as well as Chapter 6, are now given.
5.3 Design of Sensitometric Data Sheets
This section gives the required procedure and the data sheets used to analyze the results ofsensitometric film testing. Some of the illustrations may require modification depending upon thespecific instruments employed or user applications.
- Densitometer Correction Curve: The operational performance of densitometers is relativelyconstant over long periods of time. However, if the instrument exhibits some drift, it will becomenecessary to generate a correction curve so that the accurate measurement of density is still possible.Using the data sheet of Figure 64, the densities of a standard calibrated step wedge are copied directlyfrom the wedge and recorded on the data sheet. Each step is then read on the densitometer in questionand these measured densities are also recorded. The measured densities of the wedge are then plottedagainst the calibrated density values of each step. If no densitometer error exists, the resultingcorrection curve will be a straight line at 450 to the x axis. The curve will take some other shape iferror is present in the instrument. To obtain accurate density values, one finds the measured densityalong the y axis, moves horizontally until reaching the correction curve, and reads the true density
5-16

from the value along the x axis at that point.- Relative log E Curve: The characteristic curve of a film may be plotted as either the density
of the original vs. the density of the reproduction or as the step number of the original vs. the densityof the reproduction. The x axis of Figure 65 shows both the step number and the density of theoriginal calibrated step wedge. The densities of a 21-step tablet have increments of .15 density. Notethat step #1 of the original wedge is located near the right side of the x axis while the #21 step is
located near the left side.
- D log E (or Characteristic) Curve: The D log E curve is similar to the Relative log E curve,except that the common logarithm of the exposure must be determined. This is accomplished by (1)obtaining the sensitometer lamp output (in meter candles) from the manufacturer, (2) multiplyingthis value by the sensitometer exposure time, and (3) finding the common log of the result of (2). Thisproduces the log of the sensitometer exposure. To find the log exposure of each step in the reproducedwedge, one merely subtracts the calibrated densities of the original wedge from the log of thesensitometer exposure. The y axis of the graph of Figure 66 can be expanded to accommodate agreater density scale if necessary, while the log E range shown along the x axis is generally sufficient.
- Time-Gamma Curve: Generally time-gamma and time-fog curves are plotted on a singlegraph together with a family of H&D curves showing the change in gamma with development. Toconstruct these plots, identically exposed sensitometric wedges are processed at varying times for thesame agitation and temperature. The H&D curve of each wedge is plotted on the same graph andlabelled as to the time of development. Five such wedges give reliable results and three is definitelythe minimum number required. After measuring the gamma of each curve, the values are plottedagainst development time in the corner of the large graph, as shown in Figure 67. Some increase in foglevel may also exist as the gamma increased and this information can also be plotted againstdevelopment time. The x axis of the small graph represents the development time, while the fog leveldensity is shown on the left side y axis and the gamma on the right side y axis.
- Time-Temperature Chart: To plot a time-temperature chart, one requires at least two (2)time-gamma curves as shown above. One of these curves should be generated from a set ofsensitometric wedges processed at 650 F and the second curve from a set of wedges processed at 75 0F.Select a gamma value. From the 65 0F time-gamma curve, determine the processing time necessary toachieve this gamma. Plot this point on the time-temperature chart of Figure 68. Determine theprocessing time at a temperature of 75 0 F necessary to achieve the same gamma and plot this secondpoint. Connect the two points with a straight line and repeat the process for each gamma value of
interest. Usually, the time-temperature curve is plotted on semi-log as shown in Figure 68.
5.4 Summary
- Sensitometry is the study of the response of a film emulsion to radiant energy.- Sensitometry consists of the precise exposure, processing, and measurement of a film.- Standard calibrated21-step wedges have nominal incremental density differences of .15.- Precision processing involves exact control of chemical strength, temperature, agitation.- Transmission of light is defined as the ratio of the light passing through a film to the total
amount incident.- Opacity is the reciprocal of transmission.- Density is the common log of opacity.- Specular density is always higher than diffuse density.
5-17

Figure 64
Densitometer Correction Curve
Densitometer: Data Read By:Wedge #: Date:
Step Calibrated Measured Step Calibrated MeasuredNo. Density Density No. Density Density
1 112 123 134 145 156 167 178 189 19
10 20
3.0-
2.8-
2.6-
2.4-
2.2-
2.0-
. 1.8-
1.6-
S1.4-
1.2-
1.0-
.8-
.6-
.4-
.2-
0- I I I I 1r
.2 .4 .6 .8 1.0 1.2 1.4 1.6 1.8 2.0 2.2 2.4 2.6 2.8 3.0
Density of Original Step Tablet5-18

Figure 65
Relative D log E Curve
Film: Step Wedge No.:Developer: Sensitometer Exp.:Develop. Time: Data Read By:Develop. Temp: Date:Agitation:
Step Calibrated Measured Step Calibrated MeasuredNo. Density Density No. Density Density
1 112 123 134 145 156 167 178 189 19
10 20
2.0-
1.8
1.6
1.4-
1.2
S1.0-
.8
.6
.4-
.2
3.2 3.0 2.8 2.6 2.4 2.2 2.0 1.8 1.6 1.4 1.2 1.0 .8 .6 .4 .2Calibrated Density
- I I I I I I I I I I
21 20 19 18 17 16 15 14 13 12 11 10 9 8 7 6 5 4 3 2 1
Step #
5-19

Figure 66
D log E (Characteristic) Curve
Film: Step Wedge No.:Developer: Sensitometer Exp.:Develop. Time: Data Read By:Develop. Temp: Date:Agitation:
Step Calibrated Measured Step Calibrated MeasuredNo. Density Density No. Density Density
1 112 123 134 145 156 167 178 189 19
10 20
3.0
2.0
1.0-
0- I I
1.0 .0 1.0 0 1.0 2.0 3.0
Log Exposure
5-20

Figure 67
Time-Gamma, Time-Fog Curves
Film: Step Wedge No.:Developer: Sensitometer Exp.:Develop. Time: Data Recorded By:Develop. Temp: Date:Agitation
Wedge No. Development Time Resultant Gamma Fog Density
1
2
3
4
1.3- 1.31.2 1.21.1 - 1.11.0 1.0
.9 .9.8- .8
+: .7 .7
.6 .6
S .5- .5 Eo.4 _ .4
.3. .3
.2. .2
.1 .1
.1.I I I
5 10 15 20
2.0- Time (minutes)
1.0
.0 E T.o 0 1.0 2.0
Log Exposure
5-21

Figure 68
Time-Temperature Chart
Film: Step Wedge No.:Developer: Sensitometer Exp.:Develop. Time: Data Recorded By:Develop. Temp: Date:Agitation:
Temperature OF Temperature OF
Time Gamma Time Gamma
85
80
75
70
65
60
1 5 15Time in Minutes
5-22

CHAPTER 6
SENSITOMETRIC DATA HANDLING
The complex interrelationship and dependency of the photographic variables of film, exposure,
and processing schedules are such that a hit-and-miss approach to the process will rarely result in
useful quantitative photographic data. With accurate sensitometric techniques, however, the complex
photographic variables can be analyzed, both separately and scientifically. The precision and
repeatability of an accurate sensitometer makes it possible to consider all aspects of the photographic
process from the point of view of exact, controlled exposure. Film characteristics and the effects of
processing conditions can thus be determined easily and precisely.
The primary function of sensitometry consists of the generation and interpretation of
characteristic curves. These curves are established by exposing a piece of test film for a given length
of time to a specific source of illumination which is attenuated by use of a density step wedge. Figure
69 shows the configuration of an E.G.&G. sensitometer and the following procedure is used to obtain
sensitometric data from this unit:
1. Insert the necessary neutral density filter over the flashtube shield.
2. Make certain that the supporting glass which will hold the standard wedge and test film is
clean.3. Place a 21-step tablet, emulsion side up, on the supporting glass.
4. Turn the power to the sensitometer "on".
5. If the exposure time of the flashtube can be varied, depress the necessary exposure time
switch.6. Raise the cover platen.7. Extinguish all darkroom lights.8. Insert a suitable length of test film emulsion down on top of the standard step wedge.
9. Lower the platen until the flashtube has been triggered. (Usually a click will be noticeable
and serves as an indicator that an exposure has been made.)
10. Raise the platen, remove the film strip, and process as prescribed. (The particular processing
will depend on the application.)
Figure 69. E.G.&G. laboratory sensitometer.
6-1

When these steps have been performed, the user will have a test film from which a characteristic curvecan be generated. Two types of characteristic curves will be described in this chapter. They are therelative log E curve and the log E curve. Consideration will then be given to specific applications andinterpretation of the data contained in these curves.
6.1 Density vs. Density (Relative Log E) Curves
After processing, the sensitometrically exposed step wedge is read on a densitometer and thedata is plotted. The simplest form of characteristic curve for any emulsion consists of plotting thedensities recorded on the tested film strip against the densities of the original step wedge. Theprocedure for plotting such a curve is as follows:
- The densities of the original step tablet used to expose the film, are read and recorded.- The densities obtained on the test film strip are read and recorded.- A data sheet, such as that shown in Figure 65 is used to plot the measured densities. The y
axis represents the measured density values of the test strip and the x axis represents thesteps (or densities) of the original tablet. Since no attempt is made to determine thephotographic exposure of each step, the measurements are only relative.
- For each step of the original tablet, plot the corresponding test density along y. Continueuntil all points are plotted.
- These plotted points are connected by a best fit curve through them and the result is knownas a characteristic curve, an H & D curve, or a relative log E curve.
Figure 70 shows a typical plot of relative log E. Since all characteristic curves look somewhatsimilar, every graph should contain all the densitometric measurements, as well as the pertinentinformation regarding development time, chemistry, film type, etc. Most sensitometer anddensitometer manufacturers will supply data sheets similar to that shown in Figure 70 if a specificformat is required. In any event, some standardized form should be used for the efficient tabulationand preservation of sensitometric data.
2.0
1.8 -
1.6
1.4 -
1.2 -Curve of Best
1.0 - Fit
.8 /
.6 * Data Points
/.4 /
.2 -
3.2 3.0 2.8 2.6 2.4 2.2 2.0 1.8 1.6 1.4 1.2 1.0 .8 .6 .4 .2 0Density
21 20 19 18 17 16 15 14 13 12 11 10 9 8 7 6 5 4 3 2 1Step #
Figure 70. Plot of density vs. density or relative log E.
6-2

6.2 D log E Curves
To construct a D log E curve (not relative log E), it is necessary to determine the logarithms ofthe exposures which created the densities on the test film. Since exposure is equal to illumination
multiplied by time, we need only consult the sensitometer manufacturer's data for the lamp output (I)in meter candles and the pulse time (t) in seconds. These values are multiplied together to obtain the
maximum exposure; the logarithm of this maximum exposure (log Em) may be immediately
determined. It will be noted that the output of the sensitometer is modified by the densities of the
21-step tablet. To determine the value of log exposure (log E) for each of these steps, it is necessary to
subtract the density of each step from the maximum exposure. For example,
Log E (Step E) = Log Em - Density (Step 8)
The log E values thus obtained for each step of the standard step wedge will be invariant provided
that the sensitometer light output and exposure time do not change. (Generally, sensitometers are
constructed so that the light output is constant over very large periods of time. Light meters do not
exist verifying sensitometer stability, however.)
Plotting D log E curves is relatively simple; the y axis represents the density and is marked off
in increments of 0.2 density. The x axis is marked off in units of log exposure with the lightest step
(usually #1) to the extreme right and the 21st step on the extreme left side of the axis. The density ofeach step is read from the test film and recorded. The calculated log E's of each of the 21 steps aremarked off along the x axis and the recorded densities of the test film are plotted in their proper
positions above them. A typical D log E curve is shown in Figure 71 with the actual exposure values,
as well as the log exposure values shown along the x axis. The pertinent sensitometric and
densitometric information and measurements should also appear on the graph as they are in Figure66.
z
3.0
2.0
1.0
EXP (MCS) .001 .01 .10 1.0 10.0 100.0 1000.0
POWERS OF TEN 10- 3 10-2 10-1 104 101 102 103LOG E -3.0 -2.0 -1.0 0.0 1.0 2.0 3.0
Figure 71. Typical D log E curve showing the exposure values, as well as the log E values along the x
axis.
6-3

The D log E curve is a graphical representation of the exposure-development relationship.Increasing the exposure will cause the curve to be shifted towards the right, as shown in Figure 72a,while decreasing exposure will move the curve to the left (see Figure 72b). Hence, when setting up thex axis values, consideration must be given to the exposure used in order to accommodate the rangeof log E's. Figure 66 shows a typical log E range.
All D log E curves possess the same general shape which may be divided into four regionsshown in Figure 73.
- The area of lowest density, called the toe, in which the ratio of density to log E increases asvalue of E increases. The lowest density will never be zero; it will have a finite valuerepresenting the density of both the film base and its fog level.
- The central region, called the straight line, in which the ratio of density to log E is a constantas E increases.
- The upper region, called the shoulder, in which the ratio of density to log E decreases withexposure.
- If the exposure is increased still further, the process known as reversal takes place. That is,the density of an area will decrease with further exposure.
Almost all images will have densities which exist on the toe and straight line portions of the curves;although some images may occasionally fall on the shoulder, generally none will exist in the region ofreversal unless the film is specifically processed for that condition.
D z Z
-- LOG E - - LOG E -+(a) (b)
Figure 72. Lateral shift in the D log E curve caused by differences in exposure.
" I
Region of RegionREGION OF CONSTANT Decreasing of
INCREASING - GRADIENT Gradient Reversal
0 GRADI f OE'4.0 INERTIA 0.0 5.0
EXPOSURE
Figure 73. The components of D log E curve.
6-4

6.3 Use of Characteristic Curves
6.3.1 Film Speed
The speed of an emulsion can be readily determined from a characteristic curve exposed andprocessed in a predefined manner. Many different methods of computing film speed have been devisedover the years and they may be classified according to that portion of the characteristic curve which isthought to be important for a particular application. There are three basic speed groups:
- Threshold speeds - based upon the assumption that the minimum density (D min) will notfall below a predefined value, usually on the toe or the straight line. Pictorial negativeemulsions, both color and black-and-white, are given speed values of this type. For example,H & D speed, ASA, DIN, and Aerial Exposure Index.
- Midtone speeds - based upon the assumption that satisfactory images are produced whenthey fall at about the center of the H & D curve. Reversal films specify speeds of this type.
- High density speeds - based upon the assumption that the images are all of highluminance, such as industrial x-ray, microfilm subjects, etc.
It should be noted that speed values quoted by manufacturers usually include a tolerance of about /V3stop. That is, a film with an ASA rating of 125 could actually possess any speed between about 105and 145. Poor storage or overaged film will naturally extend these tolerances. Hence, if an accuratemeasure of speed is required, appropriate experimental sensitometric tests must be made.
Threshold Speeds
H & D Speed - this speed value was based upon the assumption that the objects of interestmust fall on the straight line of the curve and the lowest possible exposure must be at the beginning ofthe straight line. Often the point defining these conditions is difficult to determine since many filmsdo not possess true straight line. The solution to this dilemma is to extend the straight line of the H &D curve (or the average straight line) so that it intersects the x axis at a point called the inertia (i) (seeFigure 74); the speed is then defined as:
Speed = 34
D
LOG E
Figure 74. H and D (inertia) speed.
6-5

Generally, H & D speeds are no longer used and have been replaced by either ASA or DIN for pictorialphotography. Multispectral photography requires use of the straight line so that the ASA film speedspecification is valid for this application.
ASA Speed - to determine the ASA speed rating of an emulsion, a number of sensitometricwedges are exposed onto the test film, each wedge being processed to a different development time.The curve selected to determine the ASA speed must have a specified shape (that is, contrast). Thecorrect shape of the curve is determined in the following way and reference is made to Figure 75.
2.0-
1.0-N
.80
OI I
3.0 i 2.0 0.0
1.30 , Log E --
log Em
Figure 75. Method for determining ASA speed for black-and-white films.
- Select the point (M) which is .10 above base, plus fog density on the H & D curve.- Measure to the right of point M, 1.30 log E units and call the second point N.- The density difference between points M and N must be .80.- Increase or decrease the gamma (development time) until this density difference between M
and N is. obtained.- The arithmetic ASA speed, Sx , is given by:
Sx = .8/Emwhere Em, is the log E value of the point M which is read from the log E axis.
DIN Speed - this film speed is rarely used since, in 1954, its specification was changed tocoincide with the ASA specifications. The DIN speed was based upon the exposure necessary toproduce a density of .10 above base fog.
DIN speed = log (.49/E.1 0 )
where E. 1 0 is the exposure corresponding to the density level of .10.
6-6

Aerial Exposure Index - this speed value is generally used by the U.S. military and is also agradient method. AEI is determined in the following way:
- Plot the H & D curve of the emulsion.- Determine the gamma of the film (see following section).- Take 60% of that gamma.- Find that point on the curve where the slope is 60% of y and measure the log E at that point.- AEI speed = .5/E
This method of specifying speed is not often used; it can be misleading in that the index sometimesdecreases with increasing contrast which is generally not the case with ASA.
ASA Color Speed - since color negative films consist of three layers sensitive to red, green,and blue light, the method of calculating ASA speed for color films requires an averaging of the speedpoint, Em, of each layer. To determine the average value of Em, the following procedure is used:
#3
#2
2.0-
B #1
I AD 2
-/-4
a 1.30
3.0 2.0 1.0 0.0Figure 76. First steps for computing ASA color negative speed. Log E
- Plot the H & D curve for each layer on the same graph as shown in Figure 76.- Locate the point A which is 0.10 density above fog for the center curve #2.- Locate a second point B which is 1.30 log E units to the right of A on curve #2.- Determine the density difference ( AD 2) between points B and A. Take 20 percent of AD 2
and call that value m.- Determine the fog level for curves #1, #2, and #3.- Measure m density units up on each curve and mark these points R,G, and B respectively.
Refer to Figure 77.
- Measure the corresponding values of log E for R, and B called ER., EG, and EB.- Compute the average log Em as:
Log Em = log ER + log EG + log EB3
- ASA color speed equals 1/Em.
6-7

#2
IG #1
S II
EBEGER Log E --
Figure 77. Final steps in determining ASA color negative speed.
Midtone Speeds - these speeds are based upon the assumption that reproduction of themidtones is more important than the shadow detail. Film speed values for astronomical use are basedupon a density of .6 above fog and are computed as 1/E. Medical x-ray films also have speeds definedas 1/E, although they are based on a density of 1.0 above base fog.
ASA Reversal Speed - whereas the ASA value of a color negative emulsion was based uponthreshold speed, the ASA value of a reversal film is based upon midtone speeds. Unlike color negativematerials, the ASA speed of a reversal film is found by plotting a single H & D curve; that is, bymeasuring the total diffuse density through the layers simultaneously. The resultant curve will looksimilar to Figure 78 in which the shape of the curve is reversed from that of the color negativeemulsion since the reversal film is a positive. That, is, the highlights have less density than theshadows. Referring now to Figure 78, the point H is determined at a density value of 0.20 above basefog and represents the general highlights of the scene. A line tangent to the H & D curve is drawnfrom H. One, and only one, such point should exist and is labeled as S for shadowed areas. Generallythe tangent point S occurs at densities less than 2.0; when S occurs at densities greater than thatvalue, it is placed at the level of 2.0. That is, the density associated with S is never greater than 2.0.The corresponding log E values are measured as EH and ES respectively. The vlaue of Em is thencomputed by:
Em= [EH ES] 1
and the ASA speed value is:
ASA speed = 8/Em
6-8

2.0S
1.0
I I
ES11 1 1 .23.0 2.0 1.0 EH
Log E --
Figure 78. Method of determining speed of a color reversal film.
High Density Speeds - the use of high density speeds assumes that the accurate reproduction
of high luminance areas or white is essential.
Microfilms specify the speed of the emulsion, measured from a density of 1.2 above base fog, as
being:
Speed = 45/E
Industrial x-ray film speeds require a net density of 1.5 above base fog and are defined as:
Speed = 1/E
Positive transparency films, which are used for pictorial subjects, require that the exposure E be
determined at that point where the net density is 1.20. The speed formula is:
Speed = 1000/E
Differences in the slopes or gammas of the characteristic curves necessitate that the significant
portion of the curve be clearly defined for speed specification. Figure 79 illustrates this point. Films A
and B have the same gammas, although their toes are considerably different. A speed specified along
the straight line portion of the curves would yield the same value for both films A and B. If, however,the speed point was defined at the toe of the curve, film A would be faster than film B since it requires
less exposure to reach the desired density level (d). Speed also depends upon exactly what density
level is measured,'as shown in Figure 80. If the speed is measured at the toe, then film A is fastr than
film B; if the speed is defined along the straight line, than we would conclude that the films possessed
6-9

about the same speed value. Measurement of speed at high density levels would show that film B wasfaster than A.
d - B
I IEA EB Log E
Figure 79. Film speed depends on the gamma of the film.
Film B
Film AI I
- - --- - -- --
EA1 EB1 EA EB EB2 EA2Figure 80. Speed depends on point of measurement on H & D curve
6-10

PLATE I - Color variables of saturation and
brightness, for a red hue - dominantwavelength 670 nanometers. Saturation SATURATION
consists of the amount of white contained in acolor. At zero percent saturation, the colortends to white or gray, while at 100 percentsaturation the color is identical with the pure
which makes pale yellow different from canaryyellow. The brightness level of a color is shown
along the vertical column and represents a LEVS
measure of the amount of black contained inthe color. As the brightness level decreases tozero, all hues approach pure black. For each
degree of saturation there exists a multitude ofbrightness levels and conversely everybrightness level also contains varying levels ofsaturation. In this figure only one level ofsaturation and one level of brightness is shown.
PLATE II - Additive reproduction of color.Projecting three primary hues so that each oneoverlaps the other shows that the combinationof red and green produces yellow. The additivecombination of blue and red produces magentawhile green and blue yields cyan. The additionof all three primary lights results in white. Bydecreasing the relative brightness of each ofthe three primaries, a complete gamut of bothprimary and secondary colors is produced.Decreasing the brightness of each lamp by thesame amount produces resultant colors whichare darker in value: i.e., royal blue becomesnavy blue.

PLATE IIIa PLATE IIIb
PLATE IIIc PLATE IIId
PLATE III - Four color panels, as well as a black-and-white gray scale, have been placed inthe scene and the effect of increasing the gamma of the multispectral positive records is shown.The gamma ranges from .6 in the upper left hand figure to 2.3 in the lower right handphotograph. The effect of such an increase in contrast can be seen as a distinct increase in thesaturation level of the colors in the final multispectral rendition. Each multispectral band ofeach of the photographs above have been processed to exactly the same gamma. A differentialgamma between the records would produce a gray scale which was not neutral.
PLATE IVa PLATE IVb
PLATE IV - An increase in the camera exposure results in an increased density on themultispectral records or a loss in color for the dark objects in the scene. Notice the green panelin figure IVb has a brightness level very close to black. Both multispectral renditions havebeen processed to exactly the same gamma, i.e., 2.0. 4 j_ /

PLATE Va PLATE Vb
PLATE V - Multispectral additive color photography permits the interpreter to alter the three
variables of color - hue, brightness and saturation. Plates Va, Vb, and Vc are multispectral false
color renditions of a forested area around the Bucks Lake, California while Vd is a multispectral
simulation ofEktachromefilm. The sparsity of vegetation at the bottom of the photos is apparent
in Va and Vc while the simulated Ektachrome and EktachromeInfrared renditions falsely indicate
that the area is lush. The body of water in the upper right corner is projected as black since water
absorbs both red and infrared radiation to a great extent. Complete interpretation of multispectral
imagery is dependent upon examination of the scene in a multitude of additive color renditions.
This frame of imagery was exposed using broadband filters in the camera, namely, red, green,
blue and near infrared. The first three of the set also incorporated an infrared blocking filter since
they transmit readily in the 700-950 nanometer region of the spectrum. Plate Va was projected
using blue, red, and green filters for the infrared, red and green taking filter photos. Plates Vb and
Vc projected the IR, red and green taking filter photos as red, green, blue and green, red, blue
respectively. The simulated true color rendition of Plate Vd projected the red, green and blue
taking filter photos as red, green and blue.
PLATE Vc PLATE Vd
~-lill

PLATE VIa - False color multispectral PLATE VIb - The use of narrow bandrendition of marsh land area in Louisiana. filters in the multispectral camera permitsTwo different species of marsh grass detection of subtle phenomenon such aspredominate. Upland vegetation is a this plankton bloom in the water areacyan-green while grass along the water between Sawdust Bayou and South Pass inedge is purple. the Mississippi Delta.
PLATE VIc - Multispectral narrow band, PLATE VId - Speciation of marshlandfalse color rendition of a South Carolina vegetation is facilitated using narrow bandmarsh. The stream in the lower portion of camera filters. Disticulus sp, Typha sp, S.the photo shows black indicating pollution. Alternaflora, Salicornia bigelovii andThe stream at the top is red, the water Juncus roemerianus can be distinguishedmass being clean. by their photo colors.
PLATE VIe - A coastal area in PLATE VIf - The presence of a salt-freshMassachusetts has been photographed to water interface in an estuary ofdetermine the water penetration ability of Massachusetts is visible as a light yellowmultispectral imagery. Beach areas are against an orange background. The centerpink while the open water is blue. Shades of plume was only apparent on one of themagenta represent various depths. I multispectral records.

PLATE VIIa - Conventional Multi- PLATE VIIb - An isoluminous renditionspectral photograph of the Gunnison Hills of the same photograph shown in Platearea, Arizona. Varying terrain brightness VIIa. The removal of all brightnesscauses difficulty classifying the soil- differences creates an image, the colorvegetation units on left and right of photo. variations of which represent changes in
the soil spectral distributions.
PLATE VIIc - Simulated Color Infrared PLATE VIId - Conventional Colorphotograph of White Mt. area, California. Infrared photograph of-the same area asDifferences between sedimentary and Plate VIIc. Fixed exposure ratio betweenvolcanic rocks as well as fault contacts are the dye layers prevents detection of rockclearly visible in this presentation. types and fault contacts.
PLATE VIIe - Multispectral simulated PLATE VIIf - Conventional ColorColor Infrared photo of Owens Desert Infrared photograph of same area as PlateCalifornia. Flood plain deposits are red; VIIe. Overall blue cast to the image isnon welded tuff is yellow-green while caused by a larger green exposure ratio inpartially welded tuff tends to grey-green, the dye layers.

PLATE VIIIa An additive color PLATE VIIIb - A twenty timesrendition of Apollo IX multispectral enlargement of a portion of Plate VIIIa. Anphotograph #3799. The color difference analysis of the multispectral color showedbetween vegetation, soil and water was that barley, alfalfa and sugar beets could beenhanced so that no color overlap exists differentiated from other crops grown inbetween these land use categories. Imperial Valley.
PLATE VIIIc - A conventional multi- PLATE VIIId - A multispectralspectral photograph of an avacado grove isoluminous rendition of Plate VIIIc inwhich is partially infested with root rot which the healthy trees are a vivid yellowdisease. A color difference between the color while the diseased trees are a brillianthealthy and diseased trees does not exist red. Disease detection is possible here.here.
PLATE VIIIe - Multispectral simulated PLATE VIIIf - Multispectral simulatedColor Infrared photograph exposed over Color Infrared photograph exposed overDavis California. Alfalfa, barley, corn and Imperial Valley, California. Bare soil, cottontomatoes can be differentiated solely by and sorgum as well as alfalfa on rye grasstheir chromatic characteristics. are identified due to their unique color4 //1, signatures.

PLATE IXa PLATE IXb
PLATE IX - Forestry Applications: Plate IXa is a false color multispectral rendition of a forest
stand in Yosemite Valley. The larger oak and cottonwood trees are presented as a saturated
pea-green hue while the pine and cedar conifers are a brownish purple. Plate IXb taken over the
Meadow Valley - Bucks Lake region of California shows the medium to high density conifers as
deep green. The low density conifers are pink due primarily to the superimposition of the soil
which is light pink. Wet and dry meadow sites are also a pinkish color. Plate IXc taken in the same
Bucks Lake area presents the medium to high density conifers as a deep blue while the low densityconifers are yellow-orange. The wet and dry meadow sites to the left of the lake are light blue. The
lake itself is projected as black due to the infrared absorbtion properties of the water mass. Plate
IXd was also exposed over the Bucks Lake region and the blue to cyan portions of the photograph
indicate bare soil and rock. The medium to high density conifers are a distinct magenta color while
the brush and dry site hardwood range from deep red to light magenta. There exists little
difference between the wet and dry meadow sites and the brush-dry site hardwoods, both havingthe same magenta color in general. Plates IXa and IXb were exposed using narrow band camera
filtration while the Plates IXc and IXd were exposed through broadband blue, green, red, and
infrared filters.
PLATE IXc PLATE IXd
6-i

PLATE Xa - This photograph showsa dock off Montauk Point, New York, inwhich two sets of targets have beenembedded into the scene. A color andgray scale have been placed on the topof the dock and the second set has beensubmerged alongside it. The processingand exposure of this figure was suchthat reproduction of the highlightedareas is maximized.
PLATE Xb - Optimal exposure andprocessing for shadowed areas reproducesthe submerged panel array fairlyaccurately. However, the target array onthe dock (in the highlights) is notreproduced at all. Hence, if one isconcerned with interpreting low-bright-ness areas, the exposure must be selectedfor that portion of the scene and with noregard for the highlighted areas.
PLATE Xc - This presentationconsists of a special processing-masking procedure called isoluminousphotography. All brightness levels havebeen reduced to a common value as canbe seen from a comparison of theindividual gray scale, i.e., the whitepanel is approximately the same coloras the black panel while the colortargets maintain vivid hues. It is this
technique which permits information contained in both the shadow and highlighted areas to bereproduced simultaneously on the same photograph. Notice also that the yellow surface panelwhich has a shadow falling across it in Plate X-a is now reproduced without any loss ofchromaticity in that corner.
-/6XI

6.3.2 Gamma
The gamma or processing characteristics of a film can be determined from an examination of theH & D curve. This quantity is defined as the slope of the straight line portion of the characteristiccurve (see Figure 81) and is determined by the following equation:
S D2 - D1
log E2 - log E1
D-
THRESHOLD I
BASEIPLUS-FOG
INERTIA LOG E 1 LOG E2
Figure 81. Gamma is defined as ratio of change in density to change in log E.
The gamma is a means of expressing the degree of emulsion development or the effect of developmentupon the characteristic curve.
If it becomes inconvenient to determine the values of D1 , D2 , log E1 and log E2 , from the curve,the gamma may also be determined graphically. The straight line of the H & D curve is extended sothat it intersects the x axis. By moving to the right of that point, a distance equal to 1.0 log E units,
and reading the corresponding density of this second point, then that density will equal the gamma.The only condition to this method is that the density of the second point must fall on the straight line.The use of a gamma meter is also a rapid means of determining the gamma, especially if many
samples are involved. Figure 82 shows such a meter and Figure 83 demonstrates its use.
Since the degree of development is indicated by the shape of the H & D curve and the slope of
the straight line portion, any increases in development time will cause the straight line to be
steepened. Larger density differences will result for the same exposure values as shown in Figure 84.The effect of increased development upon gamma is shown in Figure 85 and one shold note that there
exists a processing time after which further development will not increase the gamma of the image.
6-11

16- 8.0 - 4.0 - 2.0
15 - 3.8 - 1.9
- 3.6 - 1.814- 7.0
- 3.4 - 1.7-13 - 3.2 1.6
12- 6.0 - 3.0 - 1.5
-- 2.8 - 1.4-11
- 2.6 - 1.3-10- 5.0
- 2.4 - 1.2
-9 - 2.2 - 1.1 Gammeter8 --4.0 - 2.0 - 1.0 3.00 1.507 - 1.8 - 0.9 - 2.75
- 2.50 1.25S3.0 - 1.6 - 0.8 - 2.25
, 2.00 1.0- 1.4 - 0.7 2.75- 1.2 - 0.6 2.50 .75
12 01.2- 1.0 - 0.5 - 0 .50
0.8 - 0.4 .75.50 .25
- 0.6 - 0.3 .25
0.4 - 0.2 y= 075
- 0.2 - 0.1
Log-E
Figure 82. Gamma Meter Figure 83. Use of Gamma Meter.
Ad2
Adi
E 1 1 Log Exposure E2
Figure 84. Higher gamma creates larger density differences between images.
6-12

Such a family of H & D curves, varying with development time, is generated by exposing a number of
sensitometric wedges and processing each for a different length of time. All other conditions, such as
developer strength, agitation, etc., must be constant for all wedges. The densities of each step of the
wedge are read on a densitometer and plotted on the single graph of Figure 85. Several things can be
seen from an examination of this figure, such as:
- The toe regions for all curves are about the same, regardless of the development time.
- The length of the straight line portion is greatest at low gamma.
- The slope of the curves increase with increasing development time.4.0 Minutes
8
5
3.0
3
2.0 2
1.0
0Log Exposure
-3.0 -2.0 -1.0 0
Figure 85. A set of characteristic curves representing different development times (aerial film, D-19
developer at 68 0F).
It is evident, therefore, that the tones of an image will change with processing, depending upon theirexposure or where on the H & D curves they lie. For example,
- An image which is underexposed (on the toe) can never result in significant densities,regardless of how long the film is processed.
- An image which falls on the straight line or shoulder can be made more or less densedepending upon the development time.
Gamma has often been equated with the concept of contrast. This is, in fact, incorrect since
gamma is only a measure of the development conditions, including agitation time, chemical strength,and temperature. The total contrast of a negative is actually the density difference between the
deepest shadows and the brightest highlights contained in the film. As such, it is dependent upon
many factors, including exposure, spectral distribution of the illuminant, brightness ratio betweenshadows and highlights, and processing conditions or gamma. Hence, gamma is only one factor which
affects the total contrast of a negative. By way of illustration, consider exposing an emulsion to ascene which does not have a very great ratio between the highlight and shadows. Regardless of how
long the film is developed (resulting in a high gamma), the image will not be contrasty. Similarly,exposing'a film to a scene containing a large luminance ratio will produce images of large contrast,although processed to a small gamma. It is true, however, that contrast will increase with increasing
gamma providing the images fall on the straight line portion of the characteristic curve.
6-13

In order to solve this gamma vs. contrast dilemma, the use of a contrast index has becomepopular. Whereas, gamma is based upon an exact straight line, the contrast index only considers theaverage slope or the slope of a line drawn between two distinct points on the characteristic curve. Acontrast index meter, shown in Figure 86 is used to determine the index number. This transparentmeter is placed over the H & D curve so that the curve intersects the same value on both circular arcs.That value is known as the contrast index. Although this index serves the same purpose as gamma,i.e., processing control, it is often more valid since many films either contain no straight line portionor contain more than one straight line.
876 5 4
1.00.9
0.80.7
0.6
0.5
0.3.
0.2
.5 DENSITY OF BASE PLUS FOG DENSITY0
I I:ALOG E = 2.0 ii-l
Figure 86. Contrast index meter.
6.3.3 Time-Gamma and Time-Temperature Charts
Several useful processing controls can be established by developing a series of sensitometricwedges under pre-determined conditions. At least five wedges are exposed onto separate pieces of filmand developed at the same temperature and agitation with the only variable being the time ofdevelopment. These times should cover the range from very short (say, two minutes) until infinitygamma is reached (say, twenty minutes). Beyond infinity gamma, only the base plus fog level of thefilm increases. The H & D curves for each development time are plotted on the same graph as inFigure 85.
A time-gamma curve is then generated by plotting the development time along the x axis andthe resultant gammas obtained along the y axis. Such a curve will permit the selection of theparticular processing time required in order to produce a desired gamma for that particular filmemulsion. An example of the time-gamma curve is shown in Figure 87, together with the set of H &Dcurves used to geenrate it.
6-14

1.21.1
1.2
1.00.8
0.6
0.4
0.2
0.0.1
Figure 87. Plotting time-gamma and time-fog curve.
Another useful graph derived from the family of H & D curves is called a time-temperature
chart. To construct a time-temperature plot, the following procedures are used:
- Plot a family of H & D curves at a specific agitation and temperature (say, 65 0 F) varying
only the development time as described previously. Generate a time-gamma curve.
- Repeat the process using the same chemistry and agitation, but a new temperature (say,750 F).
- Set up a graph (on semi-log paper) with temperature plotted along the y axis and time inminutes along the x axis.
- Select a value for gamma on the 65 0 F time-gamma curve and plot the processing timerequire£l to achieve that gamma.
- For the same value of gamma, determine the processing time from the 75 0 F time-gamma
curve. Plot this point on the time-temperature chart. Connect the two points with a straightline.
- Repeat this process for each value of gamma desired.
Such a chart permits one to select the processing temperature, as well as the time which is necessary
to produce a specific gamma on the film. Figure 88 illustrates the resultant time-temperature chart.
Although time-gamma curves and time-temperature charts are supplied by film manufacturers, they
only indicate the recommended gammas for ordinary photographic applications. Precision
photographic experiments, however, often require large departures from the ordinary and such
supplied manufacturer's data would be of no value.
By referring subsequent characteristic curves to the gamma variable plots, the processor can
monitor his development schedule. Any displacement in the subsequent curves would show that a
chailge has occurred in the processing. The direction of the shift and the record of the particular
6-156-15

processing operation will give some indication of the factor causing the change. In the case of routineprocessing, generation of an occasional characteristic curve should suffice to warn of any change inthe processing. For critical processing, however, test strips should be run and read prior to the actualfilm development. In additon, exposed (but not processed) test strips may be fixed to the beginningand end of both hand and machine-processed films. This yields a record of any change occuring duringprocessing, i.e. from the beginning of the roll to the end. All such test strips must naturally be of thesame film type as that being processed (and from the same lot number, if possible). These step wedgesshould also be given the sensitometric exposure that best approximates those received by the film tobe processed.
90 - - - -
85 - .
80 ---
75
65 -- - -
60
1 2 3 4 5 6 7 8 910 11
Figure 88. Time-temperature chart. TIME IN MINUTES
It has been stated that the degree of agitation during development has marked effect upon thequality of the final image. Although increased agitation will increase the slope or gamma of thecharacteristic curve (as in the case of time and temperature), the most significant effect that agitationhas is upon the shape of the characteristic curve. Six identical films which have been given the sameexposures and processed to the same gamma using different agitation schedules will show curves withshoulder portions having substantial deviation, as shown in Figue 89. These deviations, ifuncontrolled, represent what would constitute an unpredictable distortion in the tonal values of thefinal film record. If no agitation is given, muddy and uneven highlights must result in the finalpicture.
6.4 Reciprocity Law and Reciprocity Law Failure
The basic equation for the exposure of images onto a photographic emulsion has been shown tobe:
E = I (t) where I is the illumination and t is the exposure time.
6-16

6
5Rocks
4 perMinute
3
1
Log E
Figure 89. Effects of agitation upon the characteristic curve.
The reciprocity law states that the density of the image formed is dependent only upon E and
not upon the components of the equation, I or t. Experimentation has shown, however, that although
E remains constant, changes in I or t will produce images which are considerably different. This fact is
known as reciprocity law failure. To study the effect of I and t upon the resultant image density, a
series of reciprocity law failure curves are generated. Sensitometric tests are made in which both I and
t are varied, while the total exposure E remains constant. It should be noted that conventional
sensitometers do not possess the required flexibility to produce reciprocity law failure data. Hence,
this information is supplied by the film manufacturers and takes the form of that shown in Figure 90.
The reciprocity failure curves are usually symmetric for a considerable illumination range in the
vicinity of the minimum point; deviations, however, increase at both high and low intensity values. If
no reciprocity failure existed, then the curves would become horizontal lines. One should note that the
shallowness of the curves does not indicate that reciprocity failure is slight. The data is plotted on
log-log paper and so there is considerable flattening of the curves. The exposure intensity (I), for
maximum efficiency, is that value which produces a medium density (say, 1.5) within the exposure
time (t) range of .1 and 10 seconds.
Referring to Figure 90, any vertical line represents a constant intensity. To determine the
constant time lines at 450, the following procedure is used:
- Locate on the graph, the point (log I = -2.0, log E = -2.0). Also locate the point (log I = 1.0,
log E = 1.0).- Draw a 450 line connecting the points. This line is the constant time line for one second
exposure.- Locate the point (log I = -2.0, log E = -1.0) and the point (log I = -1.0, log E = 0). Connect
the points. This line, also at 450, represents a constant time line for ten seconds.
- Locate the point (log I = 2.0, log E =0) and the point (log I = 3.0, log E = 1.0). Connect the
points. This line at 450 represents a constant time line of 100 seconds.
6-17

t = 10 secs. t = 1 sec.
2.50.2 I 2.0
1.5 h
0 1.2 .7 .4
2.22 -
I I I I I I3.2 2.2 1.2 .2 1.2
Figure 90. Reciprocity law failure curves. Log I
- Repeat the procedure for as many time lines as are required. Reciprocity law failure datamust be obtained by extenive sensitometric tests on the film since it cannot be predictedfrom either theory or emulsion characteristics. Hence, it is strongly recommended that theuser consult the manufacturer's data sheets for the reciprocity characteristics of a film. Thisdata is usually much more reliable than the reciprocity curves which are generated in theaverage photo lab.
6.5 Summary- Relative log exposure curves consist of plotting the densities of a step wedge exposed onto a
test film against the densities of the original wedge.- Log exposure curves consist of plotting the densities of a step wedge exposed onto a test
film against the logarithms of the photographic exposures which created those densities.- The log E values for the exposed step wedge are determined by taking the log of the
maximum exposure minus the densities of the original wedge.- Log exposure curves are also known as H & D or characteristic curves.- Increasing the step wedge exposure will shift the H & D curve to the right.- H & D curves have four major regions: toe, straight line, shoulder, and reversal region.- Most photography is taken so as to place the imagery on the toe or straight line.- Film speed depends upon the gamma of the characteristic curve, as well as the density level
at the point of measurement.- Gamma is a measure of the processing conditions under which the film was developed.- Contrast is not to be equated with gamma.- Straight line portion of characteristic curve is greatest for low gamma.- Gamma or slope of the H & D curve increases with increasing development time, agitation,
and solution temperatures.- Contrast index is used instead of gamma when no true straight line portion exists on the
characteristic curve.- Time-gamma curves indicate the development time required to produce a particular gamma
on the film.- Time-temperature charts permit the selection of both development time and solution
temperature in order to achieve a particular gamma on the film.- Reciprocity law failure curves indicate the source intensity and exposure time required to
produce a particular density on the emulsion.
6-18

CHAPTER 7
NEGATIVE EXPOSURE AND PROCESSING
OF MULTISPECTRAL BLACK-AND-WHITE PHOTOGRAPHY
Chapter 1 discussed briefly the concept of additive or multispectral photography; no attemptwas made to describe the exact procedure which must be followed if meaningful imagery is to result.This is the subject of Chapters 7, 8, and 9.
To produce a multispectral additive color photograph of a scene requires four distinct tasks:
- The analysis of color dissection of the scene. This involves the choice of optimal photo-graphic components (including camera lenses, spectral filters, and black-and-white films)selected specifically to maximize the detection of particular ground objects. Often two ormore sets of these components are used in a single photo mission, especially if one set willnot adequately differentiate between all the targets of interest.
- The development of the black-and-white negatives. This process includes determining thebest negative contrast in order to include the entire scene brightness range on the straightline portion of the characteristic curve. Filter and film selection, as well as exposure andprocessing conditions will be discussed in this chapter.
- Chapter 8 specifies the requirements for printing the black-and-white multispectral trans-parencies. This involves the correct exposure and processing conditions so as to producehigh image brightness and color saturation in the additive color viewer. In this stage, correc-tion is also made for inherent differences in contrast between the multispectral recordscaused by the dominant wavelength of the camera filters.
- The synthesis or recombination of the black-and-white positive transparencies in theadditive color viewer is the subject of Chapter 9. This includes alterations in the hue, bright-ness, and saturation of each multispectral record in order to maximize the color differencebetween one or more classes of objects.
Though the procedures outlined in the following sections may at first appear somewhat
complex, excellent multispectral results should be obtained by taking such precautions.
7.1 Considerations in the Selection of Film and Exposure for Use in Multispectral Photography
Of all the factors which affect the final outcome of a multispectral photographic missionincluding camera exposure, film emulsion, and the 11rocessing-printing conditions, the most importantare the spectral filters used in conjunction with each multispectral lens. Providing that accurateground spectroradiometric data has been obtained, the task of filter selection is ratherstraight-forward. If, however, no such data is available, then one must resort to recommendationsprovided by other investigators (as reported, for example, in the scientific literature). For detection ofsubtle phenomena, this will amount to no more than a best guess and meaningful multispectralimagery probably will not result. It will be assumed, for this discussion, that spectroradiometric datawill be taken for a particular target type embedded in a single background.
7.1.1 Spectroradiometric Reflectance Spectra
In situ spectroradiometric measurements provide the photographer with the data necessary to
7-1

select an optimal set of multispectral camera filters. Two types of spectra can be measured on anytarget - perceived and inherent. Perceived spectra are obtained using only a reflectance radiometerand represent the spectral distribution of the target as modified by the quality of the illuminant. Theinherent spectra, on the other hand, represents the color distribution of objects without the biasingeffect of the illuminant. Inherent spectra are obtained by measuring not only the perceived spectra ofthe object, but also the distribution of the incident illumination. To accomplish the task of measuringinherent spectra, two spectroradiometers are required. The first, a reflectance unit, has a telescope infront of the monochromator to focus on and to collect the reflected radiation from a particular targetarea. The incidence radiometer measures the total downwelling global radiation (sun and skylight)over a hemispheric solid angle of 27r steradians by means of a translucent disc placed over thecollecting aperture.
Each spectroradiometer usually has two separate photodetectors (one for the visible spectrumand one for the IR) which are interchanged at some point during the measurement. Because of thistime delay between the start and end of each scan and because cloud or haze conditions may changeduring the measurement cycle, the incident and reflected radiation data for any given wavelengthmust be taken simultaneously. In other words, the incident and reflectance monochromators are setat a particular wavelength and this data is recorded. The process is repeated for each value ofwavelength to be measured. If, however, the solar angle is high and the atmosphere is clear, then theincident and reflectance spectra need not be taken simultaneously. A difference of a few minutesbetween the spectra will not seriously affect the results under these conditions.
Filter selection is based upon determination of the inherent spectra of ground objects and twomethods will be presented. The first is based upon a statistical analysis of the spectra, while thesecond merely examines the regions of color difference in order to predict the tonal values which willresult with the use of a particular emulsion.
One set of spectroradiometric data for the target and one set of data for the background isinsufficient for the proper analysis of the spectral differences between the two. The accuracy of thedata is greatly increased by obtaining many sets of such spectra, although four is considered to be theminimum number required; that is, four sets (each including incidence solar illumination and reflectedradiation measurements) are necessary for both the target and its background. What is desired, then,consists of measuring the solar illumination four times, as well as measuring four separate areas of thetarget (not the same area four times). In situ measurements of the target reflectance spectra must bemade from observation situations which maximize the uniformity of the target; that is, target areasare selected which do not contain: (a) large amounts of unwanted background objects, or (b) largeamounts of shadowed areas. Of these two categories, the former is more serious since it introducesdrastic errors into the target reflectance distribution. Shadowed areas merely decrease the amplitudeof the spectra. If one is presented with a choice between (1) an object (say, foliage) which is evenlyilluminated, but contains other unwanted objects (e.g., bark, soil, etc.) or, (2) an object (foliage)unevenly illuminated, but having no unwanted objects in the measuring field, the latter should beselected.
Referring to Figure 91, the percent directional reflectance or inherent spectra is measured in thefollowing way:
(a) The dark current, for both the incidence and reflectance photo detectors, is measured priorto the spectral scan of the object and is recorded in Columns 2 and 3 as DC1.
7-2

Site: Time:Target: Instrument: Weather: SPECTRORADIOMETRIC DATA SHEET
Date: Ground Truth Sheet #: By:
Scan *1 Scan #2 Scan *3 Scan *4 Reflectance Data (Decimal)
Starting DarkCurrent (DC1) ( ) ( ) ( ) ( ) ( ) ( ) ( ) ( ) Scan l1 Scan *2 Scan #3 Scan *4 Average
Incidence Reflec. Incidence Reflec. Incidence Reflec. Incidence Reflec.( R-DC )
I I-DC R R-DC I I-DC R R-DC I III-DC R R-DC I I-DC I-DC I-DC I-DC I-DC I
380400425450475500525550575600625650675700
go 725
7 Ending DarkCurrent (DC2) ( ) ( ) ( ) ( ) ( ) ( ) ( ) ( )
DCV= DCV= DCV= DCV= DCV= DCV= DCV= DCV=
2
Starting DarkCurrent (DC3) ( ) ( ) ( ) ( ) ( ) ( ) ( ) ( )
7507758008258508759009259509751000
Ending Dark ( ) ( ) ( ) ( ) ( ) ( ) ( ) (Current (DC4)
DCIR=(DC 3 +D C4 ) DCIR= DCIR = DCIR= DCIR= DCIR= DCIR= DCIR= DCIR=
2 ( ) (

(b) Beginning at about 380 nms, the incident and reflectance spectra are measured andrecorded as I and R in Columns 2 and 3.
(c) At the end of the visible scan, the dark current of each detector is again measured andrecorded as DC2.
(d) At about 700-750 nm, the visible photodetectors will generally have to be interchangedwith the infrared sensitive detectors. Care must be taken that these tubes are disconnectedfrom the power supply before they are separated from the monochromator housings.
(e) The dark current for both the incident and reflectance infrared photodetectors is measuredand recorded as DC3.
(f) The near infrared incident and reflectance spectra are measured and the ending darkcurrent is recorded as DC4.
(g) This concludes the spectral measurements required for Scan #1.(h) The reflectance spectroradiometer is now aimed at a different part of the same target, care
being taken to avoid unwanted backgrounds in the field of view.(i) Steps (a) through (f) are repeated for Scan #2, Scan #3, and Scan #4.(j) The average visible dark current for each scan is computed as: DCV = (DC1 + DC2)/2.
The average infrared dark current for each scan is computed as: DCIR = (DC1 + DC2)/2.(k) Step (j) is repeated for both the incident and reflectance spectroradiometers for each scan.(1) The measured spectra (both incident and reflectance) are reduced by the average values of
the dark currents and are recorded as either (I-DC) or (R-DC).(m) The reflectance of the object (for, say Scan #1) is computed as: (R-DC)/(I-DC). This
quantity is a decimal and may be converted to percent directional reflectance (PDR) bymultiplying by 100.
(n) At each wavelength, the decimal reflectances for all scans are averaged and entered intoColumn 14 of Figure 91.
(o) Assuming that correction curves have been generated to account for both the incident andreflectance photodetector responses (see Chapter 4), the quotient C = CR/C I is generatedfor each value of wavelength. (CR is the reflectance spectroradiometric correction factor atany X and CI is the incidence spectroradiometric correction factor at the same X ).
(p) This set of C's is multiplied by the final average decimal reflectances,Reflectance X = (Rk/IX )CX
(q) The last column of Figure 91 indicates the target average spectral reflectance over thevisible and near-infrared regions. A similar set will exist for the background spectraassociated with the target. These average reflectances are then plotted against wavelengthas shown typically in Figure 92.
Photographic emulsions are not sensitive beyond 950 nm so that usually there is no need tomeasure the spectra beyond this point, although most radiometers will measure up to 1500 nm. Also,the wavelengths associated with Figure 91 may require modification depending upon the spectralbandwidth of the radiometer. The more expensive units contain a series of entrance and exit slitswhich will vary the bandwidth from about 25 nm to 5 nm. The accuracy of the data will, naturally, beincreased as the bandwidth is decreased (i.e., the number of wavelengths at which data is takenincreases).
At this point, one can either examine the target and background spectra statistically or in termsof the inherent amplitude differences as a function of wavelength. This choice is usually dependentupon the length of time available for analysis prior to flight.
7-4

/ Background
\ /I Target
400 500 600 700 800 900
Wavelength in Nanometers
Figure 92. Typical average spectral reflectance curves for a group of targets and backgrounds.
The statistical analysis of spectra and the results produced will depend largely upon theassumptions which are made concerning the distributions of the data (spectral reflectances). Suppose,for example, that a very large number of spectra are taken for a particular target (say, fifty sets).After plotting all fifty sets, most of the curves are pretty well grouped together on the graph,although a few are higher or lower than this main group (see Figure 93).
.80
.60 __ f- Main Group
.40
.20
400 500 600 700 800 900Wavelength in Nanometers
Figure 93. Spectral reflectance of individual target cluster about a single average reflectance value,although some targets have values greater or lower than this mean.
If a plot is made of the average reflectance vs. the number of spectral curves at that value, thedistribution might look like Figure 94. Notice that this curve is rather symmetric, the number ofspectra above the mean being about the same as those below the mean. Such a group of spectralreflectance data (Figure 94) is then said to be normally distributed. If one had plotted a large numberof spectra from random targets (of the same type, naturally) and had noticed that the general patternsof Figures 93 and 94 were present, there would be no further need to question the nature of thedistribution - it would be firm and fixed as being normal. However, a definite assumption of'thistype is invalid when plotting a small number of spectra - in our case, a minimum of four. It may well
7-5

40-
30
20 -Mean or Average
E/
Z 10-I I
0 .1 .2 .3 .4 .5 .6 .7 .8 .9 1.0
Average Reflectance
Figure 94. Distribution of target reflectances shown in Figure 93 indicates that they are normallydistributed.
happen that the distribution of the spectra is not normal. Returning again to our theoretical fifty setsof spectra, one may notice that they are grouped as in Figure 95a and the resultant distribution curvewould look like Figure 95b.
1.0 - 50 -
.8 ----- 40
.6 30
.4 20
.2 10
.1 .2 .3 .4 .5 .6 .7 .8 .9(a) Average Reflectance
(b)Figure 95. Reflectance of individual targets; the distribution of the data shows that it is not normal.
50 -
40-
(a) Average Reflectance
-- - 30
(b)
20
_ _ _ _ \
X .1 .2 .3 .4 .5 .6 .7 .8 .9(a) Average Reflectance
(b)Figure 96. Reflectance of individual targets which do not follow a normal distribution.
7-6

Or, perhaps, the data would be grouped as in Figure 96a. In this case, the non-normaldistribution of Figure 96b would result.
These two examples illustrate the concept of non-normal distribution. The dilemma, therefore, isas follows: If one cannot necessarily assume that the spectra has a normal distribution, whatassumption can be made? The answer lies in the performance of two different statistical tests on thesame sets of target and background spectra:
- The first is a t-test based upon the assumption that the spectra is normally distributed.- The second is a non-parametric Mann-Whitney test which makes no assumptions as to
distribution of the spectra at all.
These two statistical tests will cover all contingencies and their results will obviously differ. If,however, one compares the results of both tests and selects only those spectral regions which aresignificant in both tests, then obviously one may use those filtered regions with confidence in amultispectral camera. By way of illustration, suppose the results of the t- and Mann-Whitney testsindicate the following blacked in spectral regions as being useful in detecting a target from itsbackground (Figure 97).
400 500 600 700 800 900 1000
Wavelength 450 550 650 750 850 950
(in nanometers)
t-test
Mann-Whitney
Figure 97. Example of useful spectral regions as determined by statistical analysis of reflectance data.
One would then select those wavelength intervals which are common to both tests, namely:
- 500 to 550 nm- 730 to 750 nm- 800 to 825 nm
and would purchase multispectral filters which covered these regions.
Step-by-step procedures are now given for the computation of both the t-test andMann-Whitney test. No attempt here is made to present theoretical considerations; the reader isreferred to the text by R.P. Runyon and A. Haber entitled General Statistics and also the text byW.J. Conover entitled Practical Non-Parametric Statistics, for a detailed discussion of these tests.
7-7

7.1.2 Statistical Analysis of Reflectance Spectra
It will be recalled that one set of spectra for a given target must consist of at least four scans.However, at least four targets of the same type should be measured for the statistical validity of theanalysis. In other words, for any target type (for example, red spruce trees), four targets (individualtrees) should be measured four times (four scans). The total number of spectral reflectance sets thenconsists of:
Target = 4 samples x 4 scans = 16 data sets
Each data set consists of an incidence and reflectance measurement so that the minimum number ofspectra per target or background type is 32, as shown in Figure 98.
Target l*1 Target *2
Scan Scan Scan San Scan Scan Scan San1 2 3 4 1 2 3 4
IR IR IR IR IR IR IR IR
Target *3 Target .4
Scan Scan Scan Scan Scan Scan Scan Scan1 2 3 4 1 2 3 4
IR IR IR IR IR I IR I
I = Incident Spectroradiometric DataR = Reflectance Spectroradiometric Data
Figure 98. Minimum number of spectral sets per target type is 32.
7-8

t-Test Computation
Assume:
- Four targets of the same type given number designations, say 1, 2, 3, 4, etc.- Four scans/target- Twenty-seven wavelength points- Four backgrounds of same type, given number designations, say, 5, 6, 7, 8.- Four scans/background
1. Compute average reflectances of four scans for each of the four targets and four backgrounds(use Figure 91) for all wavelengths. Call these RAn where the subscript n indicates the desig-nation number.
2. For targets: at each value of wavelength (A), average the four reflectances resulting from step 1.Call them RAT.
3. Repeat step 2 for the backgrounds. Call these averages RAB-4. Compute sigma squared for the targets at each wavelength as:
2 (RX 1 R )2 + (RX 2 )2 +(RA3-T)2 +(RA4 - )2
T or3 where RX T average of the Rx T'sor: N
2 1 (RA n -_RX )2a = n=1 NT-1
where NT is the total number of targets.5. Compute sigma squared for the backgrounds at each X as:
12 (RA5-RAB ) + {RA 6 -RAB) + (RA 7 -RAB) + (RA8 - AB)or: B =NB 3 where IK B = average of the RA B's
a2 = (RAn-RAB)NB-1 2 2 2
where NB is the total number of backgrounds. (a T/NT +(a B/NB)6. Compute degrees of freedom, v: = (a2/N )2( 2/NB)2 -26.-
r o - RB (NT + 1) + (NB+)7. Compute statistic, t = 2 21 /
Mann-Whitney Computation NT NB
The same assumptions are made concerning the data for the Mann-Whitney statistical test, i.e.,four targets and four backgrounds. The percent reflectance, which has already been computed, isagain used. The procedure for performing the Mann-Whitney test is as follows.
(a) For a given wavelength (A), the reflectances of both the target and backgrounds are listedin ascending order. Place a T after the target reflectances and a B after the backgrounds sothat you can keep track of which group each value belongs in. Assign. a rank to each.
(b) Find the sum of ranks for backgrounds and sum of ranks for targets as shown above; callthem R B and RT respectively. NT(NT+1)
(c) Compute the U statistic: U = NTNB + 2 RT
7-9
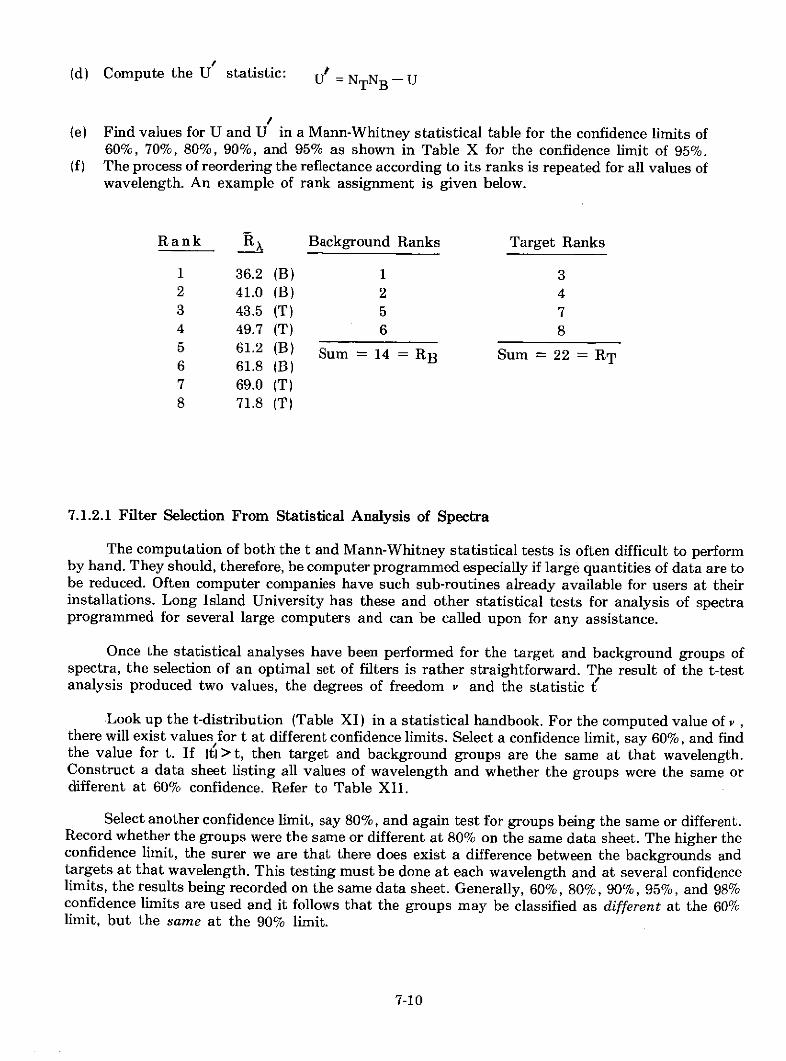
(d) Compute the U statistic: U = NTNB - U
(e) Find values for U and U in a Mann-Whitney statistical table for the confidence limits of60%, 70%, 80%, 90%, and 95% as shown in Table X for the confidence limit of 95%.
(f) The process of reordering the reflectance according to its ranks is repeated for all values ofwavelength. An example of rank assignment is given below.
Rank Rx Background Ranks Target Ranks
1 36.2 (B) 1 32 41.0 (B) 2 43 43.5 (T) 5 74 49.7 (T) 6 85 61.2 (B) Sum = 14 = RB Sum = 22 = RT6 61.8 (B)7 69.0 (T)8 71.8 (T)
7.1.2.1 Filter Selection From Statistical Analysis of Spectra
The computation of both the t and Mann-Whitney statistical tests is often difficult to performby hand. They should, therefore, be computer programmed especially if large quantities of data are tobe reduced. Often computer companies have such sub-routines already available for users at theirinstallations. Long Island University has these and other statistical tests for analysis of spectraprogrammed for several large computers and can be called upon for any assistance.
Once the statistical analyses have been performed for the target and background groups ofspectra, the selection of an optimal set of filters is rather straightforward. The result of the t-testanalysis produced two values, the degrees of freedom v and the statistic t
Look up the t-distribution (Table XI) in a statistical handbook. For the computed value of v ,there will exist values for t at different confidence limits. Select a confidence limit, say 60%, and findthe value for t. If Itl > t, then target and background groups are the same at that wavelength.Construct a data sheet listing all values of wavelength and whether the groups were the same ordifferent at 60% confidence. Refer to Table XII.
Select another confidence limit, say 80%, and again test for groups being the same or different.Record whether the groups were the same or different at 80% on the same data sheet. The higher theconfidence limit, the surer we are that there does exist a difference between the backgrounds andtargets at that wavelength. This testing must be done at each wavelength and at several confidencelimits, the results being recorded on the same data sheet. Generally, 60%, 80%, 90%, 95%, and 98%confidence limits are used and it follows that the groups may be classified as different at the 60%limit, but the same at the 90% limit.
7-10

Critical Values of U1 and U2 for a One-tailed Test at = 0.05 or a Two-tailed Test at = 0.10
To be significant for any given n and n : Obtained U must be equal to or less than the value shown in the table.Obtained UI must be equal to o greate than the value shown in the table.
T 2 3 4 5 6 '7 8 9 10 11 12 13 14 15 16 17 18 19 20
19 20
0 0 0 1 1 1 1 2 2 2 3 3 3 4 4 42 - -- 10 12 14 15 17 19 21 22 24 26 27 29 31 32 34 36
0 0 1 2 2 3 3 4 5 5 6 7 7 8 9 9 10 113 9 12 14 16 19 21 24 26 28 31 33 35 38 40 42 45 47 49
4 0 1 2 3 4 5 6 7 8 9 10 11 12 14 15 16 17 1812 15 18 21 24 27 30 33 36 39 42 45 48 50 53 56 59 62
0 1 2 4 5 6 8 9 11 12 13 15 16 18 19 20 22 23 255 10 14 18 21 25 29 32 36 39 43 47 50 54 57 61 65 68 72 75
0 2 3 5 7 8 10 12 14 16 17 19 21 23 25 26 28 30 326 - 12 16 21 25 29 34 38 42 46 50 55 59 63 67 71 76 80 84 88
0 2 4 6 8 11 13 15 17 19 21 24 26 28 30 33 35 37 3914 19 24 29 34 38 43 48 53 58 63 67 72 77 82 86 91 96 101
1 3 5 8 10 13 15 18 20 23 26 28 31 33 36 39 41 44 478 15 21 27 32 38 43 49 54 60 65 70 76 81 87 92 97 103 108 113
1 3 6 9 12 15 18 21 24 27 30 33 36 39 42 45 48 51 5417 24 30 36 42 48 54 60 66 72 78 84 90 96 102 108 114 120 126
1 4 7 11 14 17 20 24 27 31 34 37 41 44 48 51 55 58 6210 19 26 33 39 46 53 60 66 73 79 86 93 99 106 112 119 125 132 138
1 5 8 12 16 19 23 27 31 34 38 42 46 50 54 57 61 65 6911 21 28 36 43 50 58 65 72 79 87 94 101 108 115 122 130 137 144 151
2 5 9 13 17 21 26 30 34 38 42 47 51 55 60 64 68 72 7712 22 31 39 47 55 63 70 78 86 94 102 109 117 125 132 140 148 156 163
2 6 10 15 19 24 28 33 37 42 47 51 56 61 65 70 75 80 8413 24 33 42 50 59 67 76 84 93 101 109 118 126 134 143 151 159 167 176
2 7 11 16 21 26 31 36 41 46 51 56 61 66 71 77 82 87 9214 26 35 45 54 63 72 81 90 99 108 117 126 135 144 153 161 170 179 188
3 7 12 18 23 28 33 39 44 50 55 61 66 72 77 83 88 94 10015 -- 27 38 48 57 67 77 87 96 106 115 125 134 144 153 163 172 182 191 200
3 8 14 19 25 30 36 42 48 54 60 65 71 77 83 89 95 101 10716 -- 29 40 50 61 71 82 92 102 112 122 132 143 153 163 173 183 193 203 213
3 9 15 20 26 33 39 45 51 57 64 70 77 83 89 96 102 109 11517 31 42 53 65 76 86 97 108 119 130 140 151 161 172 183 193 204 214 225
4 9 16 22 28 35 41 48 55 61 68 75 82 88 95 102 109 116 12318 32 45 56 68 80 91 103 114 123 137 148 159 170 182 193 204 215 226 237
0 4 10 17 23 30 37 44 51 58 65 72 80 87 94 101 109 116 123 13019 19 34 37 59 72 84 96 108 120 132 144 155 167 179 191 203 214 226 238 250
0 4 11 18 25 32 39 47 54 62 69 77 84 92 100 107 115 123 130 13820 20 36 49 62 75 88 101 113 126 138 151 163 176 188 200 213 225 237 250 262
(Dashes in the body of the table indicate that no decision is possible at the stated level of significance.)
Table X
7-11

Critical Values of t
For any given df, the table shows the values of t corresponding to various levels of probability. Obtained t issignificant at a given level if it is equal to or greater than the value shown in the table.
Level of significance for one-tailed test x 60% 80% 90o% 95% 98
.10 .05 .025 .01 .005 .000575 S S S S
Level of significance for two-tailed test400 D D S S S
df .20 .10 .05 .02 .01 .001 425 D D- - D -D1 3.078 6.314 12.706 31.821 63.657 636.6192 1.886 2.920 4.303 6.965 9.925 31.598 450 D D D - - D3 1.638 2.353 3.182 4,541 5.841 12.9414 1.533 2.132 2.776 3.747 4.604 8.610 475 D D - -D S S5 1.476 2.015 2.571 3.365 4.032 6.859 o500 S S S S6 1.440 1.943 2.447 3.143 3.707 5.9597 1.415 1.895 2.365 2.998 3.499 5.405 525 S S S S S8 1.397 1.860 2.306 2.896 3.355 5.0419 1.383 1.833 2.262 2.821 3.250 4.781 550 S S -S S
10 1.372 1.812 2.228 2.764 3.169 4.587 575 S S S S S11 1.363 1.796 2.201 2.718 3.106 4.43712 1.356 1.782 2.179 2.681 3.055 4.318 600 D S S S13 1.350 1.771 2.160 2.650 3.012 4.221 S14 1.345 1.761 2.145 2.624 2.977 4.140 625 S S S S S15 1.341 1.753 2.131 2.602 2.947 4.073 650 D D - 1) S
71 16 1.337 1.746 2.120 2.583 2.921 4.01517 1.333 1.740 2.110 2.567 2.898 3.965 675 D D -D S S18 1.330 1.734 2.101 2.552 2.878 3.922 700 D ,- S S S19 1.328 1.729 2.093 2.539 2.861 2.88320 1.325 1.725 2.086 2.528 2.845 3.850 725 D--D S S S21 1.323 1.721 2.080 2.518 2.831 3.819 750 D D I) S S22 1.321 1.717 2.074 2.508 2.819 3.79223 1.319 1.714 2.069 2.500 2.807 2.767 775 D ___U S S S24 1.318 1.711 2.064 2.492 2.797 2.74525 1.316 1.708 2.060 2.485 2.787 3.725 800 s S S S s
26 1.315 1.706 2.056 2.479 2.779 3.707 825 S S S S S27 1.314 1.703 2.052 2.473 2.771 3.69028 1.313 1.701 2.048 2.467 2.763 3.674 850 s s s s29 1.311 1.699 2.045 2.462 2.756 3.659 875 D - D S S30 1.310 1.697 2.042 2.457 2.750 3.646
900 D D D D D40 1.303 1.684 2.021 2.423 2.704 3.55160 1.296 1.671 2.000 2.390 2.660 3.460 925 D D _ D- - D- S
120 1.289 1.658 1.980 2.358 2.617 3.373oo 1.282 1.645 1.960 2.326 2.576 3.291 950 A3- s s s s
975 S S S S S
1000 D S S S
S = Same, D = Different Results of t-test spectral analysis.
Table XI Table XII

The interpretation of Table XII is obvious. The wavelengths having the highest probability of aspectral difference are the first filter choices (in this case, 425-450 nm and 900 nm). A filter peaking at650 nm would be the next choice, while one at 750 nm would be the last selection. In practice,spectroradiometers measure smaller wavelength intervals, resulting in a much finer analyses of the
spectral differences between groups. The dotted lines on Table XII give a rough indication of the
possible filter bandwidths.
The same type of data sheet (at Table XII) is constructed for the results of the Mann-Whitneytest. After finding the values for U1 and U2 in Table X, the following table is made: If Ul< U and U2 >
U , then the reflectances of the two groups are considered to be the same at that wavelength. If UU and U2
< U', then the reflectances of the two groups are considered to be different at that
wavelength. The results of both types of statistical analyses are now compared. Wavelength intervals
in which the groups are different for both the t- and the Mann-Whitney tests are the wisest choice. An
example of such similar regions is shown in Figure 97.
7.1.3 Graphical Analysis of Spectroradiometric Data
When a computer is not available, the statistical analysis of the spectra can become too time
consuming to be performed just prior to flight. Although the in situ reflectance measurements could
be obtained a considerable time before the flight, the environmental phenomena may be different,resulting in a set of invalid spectra at the time of flight. Hence, a graphical analysis of the data may bethe only practical method with which to choose a set of multispectral camera filters.
The percent directional reflectances of both the target and background groups must be
determined as shown in the preceding section. The difference between these reflectances is then
determined at each wavelength. Figure 99 shows a plot of these differences as a function ofwavelength. Notice that the background group is considered as constant along the x-axis. Thepositive or negative deviations of the average target group from this background are plotted along they-axis.
B
Deviation I C
I I I
I IA
+ I I
400 00 60 700 8 0 Wavelength
DeviationE
Figure 99. Graphical analysis of spectra showing deviations of target from background and candidatefilter bands.
7-13

Three factors determine the wavelength intervals (or bandwidths) of the filters selected fromFigure 99:
- The deviation (+ or -) from the x-axis must be as large as possible.- The band must also be of sufficient width.- The bands must not overlap.
Although spectral interval B possesses the greatest amplitude difference, it may not be wide enoughto yield adequate exposure. However, the interval (B and C) could be selected for a filter, as well as A,D, and E. All other things being equal, two bands having a positive deviation and two bands having anegative deviation should be selected. This will result in: (a) the target being lighter than thebackground on two of the multispectral records, and (b) the target being darker than the backgroundon the other two multispectral records.
Suppose, the spectral bands of Figure 99 are chosen for the multispectral filters as follows:
Record # Spectral Bands
1 A2 B+C3 D4 E
The following four combinations could be used in the additive color presentation of the scene:
Record # Viewing Filter Record # Viewing Filter1 Red 2 Magenta4 Green 4 Green1 Green 1 Deep Yellow2 Blue 1 Deep Yellow2 Blue 3 Deep Yellow4 Red 4 Cyan
The graphical analysis for multispectral camera filter selection is by no means accurate as thestatistical tests. Hence, some modification of the filters may be required and it is recommended that apreliminary flight test be conducted to assure adequate discrimination between objects in the scene.
7-14

7.1.4 Selection of Films for Multispectral Photography
A normal emulsion. is inherently very sensitive to low wavelength radiation including x-rays,
gamma-rays, ultraviolet light, and the shorter wavelengths in the visible spectrum since it is these
radiations which are readily absorbed by silver halide crystals. If an emulsion is to be sensitive to
longer wavelength radiation, it is necessary to make the silver halide crystals absorb such light; thisis effected by adding dyes to the silver halide grains.
Originally, the addition of dyes increased the halide sensitivity to about 600 nm and the
resultant film was called orthochromatic. It possessed no sensitivity to deep orange and red light.Further dye research permitted the range of emulsion sensitivity to be extended into the red region (to
about 700 nm) and the film was called panchromatic. As time progressed, three types of panchromatic
films were developed called Types A, B, and C. Figure 100 shows the sensitivity curves of ortho and
types B and C pan films. Type A has extremely low green sensitivity; hence, it is not widely used and
most pan films today are of the B and C type. Type C has greater red sensitivity which increases the
overall speed of the emulsion, while type B closely compares with the sensitivity of the eye. If the eyewere viewing colors in relative shades of gray, the sensitivity of the type B pan and the eye would be
very similar. Film manufacturers have found that bymixing the dyes in an emulsion, a film can be
made sensitive to different spectral regions or the film can be made more sensitive to one color and
less sensitive to another. An extended red sensitivity film was developed in 1957 which permitted
photography to be taklen not only in the visible spectrum, but also in the near infrared.
2.0- 2.0 - Panchromatic Films
Type C
1.0- Orthochromatic 1.0 -Sensitivity
0o 0Q) 0 -
1.0 I I .o I I .0400 500 600 700 400 500 600 700
Wavelength in Nanometers Wavelength in Nanometers
Figure 100. Sensitivity curve for panchromatic and orthochromatic type films.
The silver halide crystals which are embedded in most commercial emulsions range in size
between .1 microns and 4 microns in diameter. Fine-grain films will generally have a predominance in
the lower end of this range, whereas coarse-grained films will occupy a span in the upper end of the
range. The size of the grains in the film are dependent first upon the process used to introduce them
into the emulsion. The fine grains occur when the chemicals are quickly dumped into the solution and
large grains result when the chemicals are poured slowly into the emulsion.
Silver halide particles embedded in an emulsion are basically single entities. That is, when lightstrikes the film, the grains are either exposed or not, no grain is half-exposed. Also, the larger the
7-15

particle, the more sensitive it is to light; finer particles require more illumination to expose them.Hence, if an emulsion were constructed with only single size grains, the point of adequate exposurewould be reached by all particles simultaneously and no gradation of tones would be produced. It isfor this reason that emulsions contain a range of silver halide sizes. If the average size of the grains islarge, the emulsion is considered fast, whereas if the grains are small, the emulsion is slow in speed.
There exists one important trade-off which must be made in selecting an emulsion formultispectral photography. If one requires high resolution in the final image, then a fine grain filmshould be used. However, the bandwidth of the multispectral filters may be such that inadequateexposure will result from such a choice. Hence, one selects the finest grained film which will provideadequate minimum exposure in the spectral bands selected. This task amounts to little more thanhaving a film catalog and selecting the highest speed film which is sensitive to the regions covered bythe multispectral filters. For example, consider a case of photographing objects submerged in water.The film selected must have adequate speed for the scene being imaged, i.e., not land but sub-surfaceobjects. Conversely, when taking aerial imagery over desert test sites, one can employ a rather finegrained slow film because the terrain reflectance is so high. Regardless of the scene, it is absolutelynecessary to select and expose the film based upon the objects of interest and not the general terrain.Much of multispectral photography is rendered useless because of this oversight.
7.1.5 Exposure Calculations
The illumination Which is reflected from the scene in the form of brightness is modified not onlyby the lens and filter transmission, but by the lens aperture as well. The final exposure which forms theimage is a function of the reflected light from the terrain (B), the transmission of the lens (TL), thefilter (TF), the f/number of the lens (f), and the shutter speed (t). Consider, for a moment, thevariables entering into the final equation for photographic exposure:
- B: Brightness is actually equal to the incident illumination times the object's reflectance(this is the value given by the reflectance radiometer). The solar illumination at the time offlight will be fixed as will the target reflectance; hence, B is not variable.
- TF: The filter transmission is fixed by its manufacturing process and so is also not available.- TL: Similarly, the lens transmission is not variable.- f: Most lenses provide for a selection of f/numbers so that f is varaible.- t: Although most lenses provide for some control of the exposure time, each multispectral
shutter should be set at the same value. This assures that any aircraft motion which mightbe recorded by the camera (in terms of image displacement) will be the same for each
multispectral record.
In short, the one variable left open with which to create the correct photographic exposure is thef/number. Although some lenses have a rather limited range of f/stops, it is imperative that thesmallest f/number be as low as possible. One can always add neutral density filters to further reducethe light entering the camera, but the opposite is not true. Consider Table XIII.
7-16

Equivalentf/number (f/number - ND Combination)
1.4 f/1.42.5 f/1.4 + .3 ND4 f/1.4 + .6 ND5.6 f/1.4 + .9 ND8 f/1.4 + 1.2 ND
16 f/1.4 + 1.5 ND22 f/1.4 + 1.8 ND32 f/1.4 + 2.1 ND
Table XIII
As far as exposure is concerned, a lens could have a fixed aperture of low f/number, the higher
f/numbers being simulated by the choice of neutral density filters. Note: Some neutral density filters
are not neutral in the near-infrared part of the spectrum (e.g., Eastman Kodak Wratten #96 series)
and care should be taken that use of such filters is avoided when photographing between 700 and 900nm.
The equation used to determine the proper f/number for each spectral band will now be derived.
Referring to Figure 101, let s2 be the area of the image, S2 the area of the object, F the focal length of
the imaging lens, and L the lens-to-object distance.. Then, when S is infinitely far from the lens:
L- F -- "SI
S ss
Object Lens Image
Figure 101. Illumination at the image plane of an infinitely distant object.
s2 = S2 ( in (cm 2 )
L2
Now, let I' be the solar illuminance falling onto the object in the scene and p the inherent reflectanceof the object. The reflected brightness B is then:
B = I'( p ) in microwatts/cm 2
S2The illumination at the front of the lens is I - B in microwatts
L2 cm 2
The area of the lens aperture is given as: r D4 BS 2 7rD 2 in microwatts
Hence, the total light energy through the lens aperture is: L2 4
7-17

The illumination I per unit area, s2 ,therefore is: I= BS 2 rD 2 [ L = 7r BD 2 in watts
L2 4 S2 F 2 4F2 cm 2I = wB in . wattsor
4f 2 cm 2
The photographic exposure accounting for lens and filter transmission is defined as:
E = I(t) = 7B TL TF(t) in p.watts . secor: 4f 2 cm2
E = B 10 . TL TF (t) in ergs Equation7-1
4f 2 cm 2
This equation represents the photographic exposure for any multispectral record. Suppose, now, thatwe have decided that the minimum exposure which a multispectral record should get is one that willproduce a density on the film of .3 above base plus fog. Film manufacturers supply curves for theiremulsions which indicate the exposure required to produce a certain density. These are calledsensitivity curves, an example of which is shown in Figure 102.
2.0
1.0
Log Sensitivity = 0
1 =1 D=.3It E 1.0 -
2.0400 500 600 700
Wavelength in NanometersFigure 102. Example of spectral sensitivity of film or exposure required to produce a density of .3 onthe film.
The bandwidth of the filter under consideration is drawn on the sensitivity curve as shown inFigure 103 and the average sensitivity for the filter band is determined. Film sensitivity is defined as:
logS = log ( 1 ) or E = 1 in ( cm 2
E S ergsFrom this relationship, the minimum exposure for the filter band is obtained and substituted intoequation 7-2:
Filter BandwidthSensitivity =
log ( )D = .3
Wavelength X -
Figure 103. Sensitivity of film to a particular filter bandwidth.
f 2= B .10 . TL . TF (t)4E Equation 7-2
7-18

Each of the variables in equation 7-2 are fixed prior to flight with the exception of the reflected scenebrightness B and the f/number. The brightness is measured at flight time using either a photometerequipped with the spectral filter or the spectroradiometer. Substituting B into equation 7-2, yields the
correct f/number required to produce the predetermined minimum density.
It should also be noted that optimal exposure of a scene is such that after development, the
objects of interest lie on the straight line portion of the characteristic curve. By way of illustration,consider a strip of film exposed through a multispectral filter, F, with two objects of interest, M and
N, being imaged. A sensitometric step wedge is exposed on one end of the film through the same
multispectral filter. The resultant H and D curve after processing is shown in Figure 104, curve #1,
where A1 , B1 represents the straight line portion. Objects M and N possess densities D1 and D1respectively; object N lies on the straight line curve #1, whereas object M falls along the toe.
Assuming that the shape or gamma (y) of the curve is satisfactory, one may determine the correct
camera exposure necessary to place both M and N between the points Aland Blon the curve; this is
done in the following way:
1. Redraw curve #1 on a piece of tracing paper indicating the points A1 and B 1.
2. Slide the traced curve from right to left so that an extension of the vertical lines M and N willintersect this second curve along the straight line (A 1, B 1). The extended lines M and N are
shown in Figure 104, the traced H and D curve being designated as #2.3. Read the new values of density D2 and D' from the y-axis.4. ( = AD along the straight line)
Alog exposure
hence,
D -D( 2 1 )= AlogE
or
log [D 2 -D' ] -log y = AE
where AE is the increase in exposure required.Curve #2
SCurve #1
D,
DI
M N
Scene Brightness log E --Range of Objects
Figure 104. Exposure correction necessary when objects of interest do not fall on straight line portionof H and D curve.
7-19

5. Point N corresponds to log EN of one of the original images; take the logarithm of EN.
6. EN+ AE T
EN
where T is the number of times the original exposure, EN, required to place both objects onthe straight line of the characteristic curve. Example: Suppose EN is 160 and AE = 160.Then,
160+160 = 2 = T160
This means that the new exposure must be two times or twice the original exposure of 160.Suppose: EN is 160 and AE = 20. Then,
160+ 20 = 180 = 1.12 = T160 160
This means that the new exposure must be 1.12 times the original. The same analysis appliesto shifting the traced curve in the other direction to reduce the exposure.
It should be noted that the requirement for all objects to lie on the straight line portionof the H and D curve is not always possible:
- Sometimes the sensitivity of the film in isolated spectral regions is not sufficient toproduce densities corresponding to the straight line area. As an example, EK infra-red,black-and-white film #2424 has a low sensitivity in the green region. Exposing the film withthe green lens wide open sometimes yields inadequate exposure. This is one of the principalreasons for taking multispectral imagery on clear, bright days when the sun angle is high. Inspite of all precautions, the optimal exposure for each band is sometimes a compromise;that is, placing the objects of interest as close to the straight line as possible.
7.2 Processing Control for Multispectral Imagery
Chapter 5 discussed general darkroom sensitometric techniques, as well as the basic processingrequirements of temperature control, chemical strength, development time, etc. Under the conditionsof precision processing, the fundamentals of developing, fixing, washing, and drying remain the sameexcept that the procedures are improved and controlled by exacting methods. The goal of precisionprocessing, then, consists of performing the laboratory procedures to pre-established standards ofaccuracy which will produce an optimal set of results for the photographic material used. This goalrequires that the development process be both accurate and precise. Whereas precision relates to theexactness of the process and the variations within it, accuracy is thought of in terms of the finishedproduct; that is, the correctness of the final resultant image. All results are checked withinstrumentation so that consistent repeatability is obtained.
A precision photo lab will consist of a large area divided into separate rooms in order to isolatethe various functions for efficiency and cleanliness. Although the extent and size of the laboratoryequipment will depend on the expected photo accuracy, as well as the amount of processing per day,the function of each instrument (sensitometer, densitometer, colorimeter) must be checked andcalibrated at regular intervals. In addition to equipment performance, the film and processingconditions (chemical mixture, gamma, speed) must always fall within pre-defined limits to assureconsistent multispectral results. A graphical method of displaying the performance of both the darkroom instrumentation and the development process can be facilitated with the use of control charts.
7-20

Control charts for any process give a pictorial idea of past performance and allow one to detect
trends and observe when the process is out of control. Variations beyond the pre-defined limits can
seriously affect the photo product if left unattended. The series of control charts also indicate whether
or not corrective action should be taken in order to bring the process back into tolerance. In order to
construct control charts for the processing and measurement of multispectral imagery, some
preliminary study of variation is required. Variations exist in every instrument and in every process.
The nature of the variation must be determined, as well as its tolerable limits before any actual
variation can be compared to that which is allowed.
Most development processes follow what is known as a normal distribution. Normal
distributions arise from the operation of chance; that is, when chance factors exist and the effects of
these factors are about equal in their influence upon the process,.a normal pattern arises. When other
than a normal distribution occurs, we assign to it a cause other than chance. Two numbers describe
the characteristics of normality: the average or arithmetic mean (j) and the distance from the mean to
the point of inflection on the curve called standard deviation (a).
The mean or sample average not only identifies the maximum point of the distribution, but it
also indicates the average value of the variable. The significance of the standard deviation is readily
understood as: between the point ± la lies about 68% of the data; between ±2 a 95% of the data falls,
and between ±3a, exists about 99% of all the data, while the remaining 1% lies somewhere outside.
The arithmetic mean and standard deviation can be illustrated with the following example: There
exists a photographic process in which the average gamma is 2.0 having a standard deviation of .1.
This means that 68% of all the tested gammas were between the limits of 1.9 and 2.1, 95% of the
gammas were between 1.8 and 2.2, while 99.7% were between 1.7 and2.3; the remaining .3% of the H
and D curves had gammas less than 1.7 or greater than 2.3. If the process yielded a gamma of 2.2, we
would say that the process was under control. A gamma of 1.2, however, would indicate an unusualset of conditions and the process would have to be corrected. Assessment of the process deviation is
the primary purpose of the control charts. The following mathematical equations define the mean and
the standard deviation of a normal distribution.
Mean: X = (X 1 + X 2 + X3 + -. Xn)n
Where: X1, X2 , X3 , ... , X are the values of the variable - gamma, film speed, etc.is the mean of the variable values
n is the total number of values or sample readings.
Standard Deviation:s= nt(X2) ( X)2
n(n-1)
where n, X are the same as above and s is the standard deviation. The procedure for calculation of X
and s is given in Table XIV. A simplified control chart for any instrumentation or processingperformance can be prepared in the following way:
1. Determine the variables to be controlled for Example,- Densitometer stability - high and low readings.- Chemistry stability - pH, developer concentration in (grams/liter), solution temperature,
machine running speed, etc.
- Processing stability - gamma, ASA speed.- Printer optics performance - resolution, exposure.
7-21

2. Make preliminary tests for 15 consecutive days measuring the variable at least four timesduring each day.
3. For each day, average the readings.4. At the end of fifteen days, compute the mean and the standard deviation.5. On a piece of linear graph paper mark off the x-axis by days. The central y-axis is set at the
mean value of the variable, while the upper and lower limits are the lo, 20, and 3o values asshown below in Figure 105.
+3.0
+2.0
+1.0
Mean2 '/6 10 12 14 16 18 20 22 24 Days
-1.0
-2.0
-3.0
Figure 105. Example of control chart for processing of multispectral imagery. Note that the process isout of control on the 11th day.
Each day the data is measured and plotted on such a control chart. When the point extends beyondthe predetermined limit, the process is unstable and corrective action must be taken. Sometimes asingle data point will fall outside the control limits. Usually it will be noticed that in the fourmeasurements per day, one is abnormal. Providing the others are not equally as bad, that particularpoint may be dropped. Control charts such as that shown in Figure 105 are constructed for as manyvariables as possible in order to obtain repeatable processing results, a condition which is essential inmultispectral photography.
Besides maintaining control of the processing so-that optimal negatives always result, there isone major consideration for the development of multispectral imagery. The negative gamma must beas high as possible without placing any of the objects of interest on either the toe or shoulder of thecharacteristic curve. The higher the gamma, the smaller will be the log E range. In addition to thescene brightness range, the only major limitations on gamma are the inherent characteristics of thefilm and the development chemistry. The primary rule is to adequately test the entire developmentprocess before risking a valuable and, perhaps, irreplaceable roll of film to an unstable process.
7.3 Negative Film Desnitometry
The primary purpose of the use of sensitometric wedges in the processing of multispectralphotography is one of quality control. Both the speed of the emulsion and the gamma (contrast) of thenegative image are affected by the developer used and the degree of development given. Therefore, ifthe exposure given each spectral band is established by data collected in a previous exposure test, it isessential that the final imagery be given the same processing as the test. The procedure is as follows:
7-22

Control Variable: Process I.D.:
Date: By:
Sample Variable ValuesNumber (X) (X 2 ) Computation
1 n=( )
2 (n-1)=( )
3 n(n-1) = ( )
4
5 (n) (x)2 =(
6
7 Vi/ (X) 2 - (yX 2 )
8 n(n-1)
s=( )
10X = ( (X 2 ) = ( ) (X) = ( )
n
.(X)2 = (
Add up column Add upand then square column
Max. X = , Min. X=
R* = (Maximum ) - ( Minimum) = ( )
*R is the range or difference between the highest and the lowest value of X
Table XIV
7-23

1. A sensitometric wedge is exposed on the test film and processed with the test imagery. Theexposing source should be of daylight quality and should not be spectrally filtered.
2. The densities of the processed wedge are measured on a densitometer and the characteristiccurve plotted. For this purpose the densities of each step of the original wedge (used forexposing) are recorded on the absicissa (horizontal axis) of the graph paper. The densityincrements are usually about 0.15. These densities serve as the relative log exposure values.The density of the corresponding step of the reproduced wedge is plotted on the ordinate(vertical axis). A typical characteristic curve is shown in Figure 106.
3. Before the final imagery is processed, a wedge is exposed on a small piece of the sameemulsion as was used for the final imagery. This is then processed under the same conditionsas the final test. The results are measured and plotted and the curve compared to the curve ofthe first test. Adjustments in development time should be made to correct for any differencesin speed or gamma of the two curves. Differences may occur due to differences in theemulsion batches, deterioration during storage, or changes in the chemistry of the developer.
4. A wedge should be exposed on the leading and trailing ends of each roll of imagery processed,as a check on consistency of development through the length of the roll.
2.2-
Film - EK 2424 Infrared Aerographic2.0 - Sensitometer - E.G. & G. Mark IV
Exposure - 102 seconds, 2.4 NDDevelopment - Versamat, MX 641, 7'/min.
1.8- Gamma - 1.6
1.6-
1 .4
0
1.2-
0
1.0-
.8-
.6-
.4-
Relative Log E (Step #).2 -
1 3 5 7 9 11 13 15 17 19
3.0 2.7 2.4 2.1 1.8 1.5 1.2 .9 .6 .3
Density of Original Wedge
Figure 106
7-24

Sensitometric wedges are also useful in matching gammas of the spectral images. The gamma ofthe developed image varies with the wavelength of the exposing energy, as well as with developmenttime. Therefore, if each spectral image is recorded on a separate roll of film, the development of each
may be adjusted to provide equal gamma on each. In order to do this, each film must be exposed withthe camera filter placed in the sensitometer, in addition to any filters required to achieve daylightquality. Some adjustment of the intensity of illumination may be required in order to achieve a fullrange of densities in the negative wedge. When all spectral wedges have been read and plotted, the
gammas may be compared. Time-gamma curves, published by the film manufacturer, may be
consulted for information on approximate new development times. Exact matching of gammas willrequire further tests.
The spectral sensitometric wedge may also be used in subsequent analysis of the multispectralnegative imagery. If the densities of areas of interest in the multispectral imagery are measured, theirpositions on the H & D curve can be easily located. Their separation on the relative log exposure axis(the abscissa) can then be converted to relative brightness differences in that spectral region. This isillustrated in Figure 107. Here, the negative density of area A was measured and found to be 1.55 andarea B to be 1.15. When plotted on a sensitometric curve exposed through the same spectral filter,their separation on the relative log E axis was .30. Since the abscissa is a log, this indicates a factor of
2. Area A was approximately twice as bright as area B in this spectral region. If the reflectancecharacteristics of one are known, the other can be calculated. If area A is a calibrated target panelplaced in the scene, for example a neutral gray reflecting 64% of the energy incident upon it, then area
B reflects approximately 32% of incident energy in this spectral region. These figures are only
approximate as this simplified method does not take into account certain factors that also affect
image density, such as atmospheric scattering, lens flare, and vignetting.
When the spectral wedges are printed along with the imagery to produce a transparency foradditive projection, the positive wedges may be read and plotted to provide a simplified method ofcalculating system gammas of each spectral region. System gamma is the gamma of the completenegative-positive process as opposed to process gamma which is the gamma of a single step of theprocess.
2.2 -
1.4 a A
S1.0 -
. Relative Log E Sparation .3
.4 -
.2- Relative Log E (Stp #)1 3 5 7 9 11 1.3 15 17 19
3.0 2.7 2.4 2.1 1.8 1.5 1.2 .9 .6 .3
Density of Original Wedge
Figure 107. The use of spectral sensitometric wedges in sensitometric analysis of multispectralimagery.
7-25

7.4 Summary
- In situ spectral measurements are essential to the correct selection of multispectral camerafilters.
- Perceived spectra of a target does not account for the quality of the illuminating radiation.- Inherent spectral removes the biasing effect of the illuminant from the reflectance
measurements.- Filter selection is made using inherent spectra.- Four sets of reflectance measurements (each set containing four scans) is the minimum
number required for spectral analysis.- As the bandwidth of the spectroradiometer decreased, the reflectance distribution for the
object becomes more accurate.- Statistical analysis of spectra should consist of at least one parametric (t) test and one
non-parametric (Mann-Whitney) test.- t-test assumes that the spectra follow a normal distribution pattern.- Mann-Whitney test makes no assumptions regarding the distribution of the spectra.- A simple graphical analysis of the spectra can be performed, although it is not nearly as
accurate as the statistical test.- The film selected for multispectral photography should be the finest grained emulsion which
will provide adequate exposure of the scene.- Multispectral camera exposure is controlled by the f/stop selected which, in turn, is related
to the scene brightness at the time of flight.- Objects of interest on multispectral negative imagery should fall on the straight line portion
of the characteristic curve.- Control charts should be generated for the development process, as well as the dark room
instrumentation in order to assure accurate and repeatable multispectral results.- Multispectral negative gamma should be as large as possibel without placing objects of
interest on either the toe or shoulder of the H and D curve.
7-26

CHAPTER 8
POSITIVE DUPLICATION OF BLACK-AND-WHITE MULTISPECTRAL NEGATIVES
The previous chapters discussed the conditions for the correct exposure and processing ofmultispectral negatives including:
-- calculation of correct exposure and the need for identical shutter speeds to avoidreciprocity failure effects,
-- need to place subjects of interest on the straight portion of the characteristic curve,- - selection of films as a function of subject brightness, film speed, and grain,-- selection of gamma consistent with the scene brightness range.
Once these conditions have been fulfilled, a set of good multispectral negatives are available forprinting. Negative multispectral imagery is generally unsuitable for additive color viewing because ofthe inversion of the brightness scale (highlights look like shadows and vice-versa) and because therestill exist differences in contrast and gamma between the multispectral records. To correct theseshortcomings the negative images are reproduced or duplicated onto a suitable transparent material.The exact choice of a duplicating film will vary according to the desired result, but most materials fallinto one of two classes: normal and high definition. Unless extremely fine resolution is required, anormal definition film, such as Kodak Type 2420, is acceptable. Of all the duplicating materials, thistype is capable of the highest gamma.
Whatever emulsion is selected for the duplication of multispectral records, it must possesscertain characteristics:
- a clear base to minimize transmission losses through it during projection,- a stable base to minimize the dimensional changes during processing and storage,- adequate range of gamma controllable through processing,- a non-panchromatic sensitivity (preferably only blue sensitive) to enable handling under
safelights during processing,- a speed which is compatible with the printer illumination system. Slow speed films exposed
in a low illumination printer require extremely long exposures, while fast speed films in highillumination printers require extremely short exposure. Both of these exposure conditionsare difficult to control accurately and repeatable results (in terms of density) are not alwayspossible.
8.1 Multispectral Positive Printing
Multispectral negatives may be duplicated either by projection or contact printing. The primaryadvantage of projection printing lies in the fact that it is possible to make small correction in the scaleof the multispectral records. Such correction is necessary if: (1) the camera lenses were not matchedfor differential focal length (see chapter 10), and (2) if there exists no provision for scale correction inthe additive color viewing system. The lens used for projection printing must give excellent definitionon a flat surface for the range of enlargement or reduction necessary. Also, since the image is visuallyfocused, the projection lens must be well corrected for both lateral and logitudinal chromaticaberration. The position of the negatives in the object plane of the projector is also critical because ofthe inherent distortion of the lens. For example, if one multispectral record is displaced in the object
8-1

plane relative to the positions of the other three, then the distortion of any image in the displacedrecord will differ from the distortion of the same images in the other records. Such a situation will giverise to registration errors in the additive color viewer.
A rather simple procedure can be employed to assure both accurate scale correction in thetransparencies and correct positioning of the negatives in the projector object plane.
1. Place one of the negative records in the projector object plane.2. Make a positive print of this record using an extremely fine grain paper.3. After processing and drying, center the printin the image plane of the projector. Care must
be taken that the print is held flat. This can be done by dry mounting the print onto a heavy,smooth cardboard surface and tipping this to the easel.
4. Place one of the negative records in the object plane of the projector and register it to thepositive print, both in scale and in x, y position.
5. Place the duplicating film material over the reference print and expose.6. Remove this negative record and repeat steps 4 and 5 for the remaining three multispectral
records.
Negatives duplicated in a contact printer may be illuminated by either parallel or diffuse light.Parallel light is commonly used when negatives of good quality are to be reproduced. The source ofillumination is, generally, a small point source placed at a large distance from the film plane. With theemulsion of the duplicating material against the emulsion of the negative, the greatest imagedefinition is obtained with parallel light as shown in Figure 108. If, however, the negative isilluminated with non-parallel light, some flaring of the duplicated image takes place as shown inFigure 109. The resultant effect of using diffused illumination is a decrease in resolution, although thecontrast is increased owing to the path length of the light through the emulsion. Since diffuse light isincident upon the negative at all angles, any scratches on the negative will be lost in the reproduction.Conversely, scratches will be exactly reproduced by using a contact printer illuminated by parallellight.
Resolution losses can also occur in the diffused light printer due to an imperfect contact betweenthe negative and duplicating material emulsions. If both films are held fixed in a vacuum frame, thiscause may be attributed to either: (a) insufficient vacuum, or (b) lack of parallelism of the pressureglass or the backing plate. A fairly good indication of emulsion contact can be assured if one seesNewton rings surrounding the area of the photo. No Newton rings should be visible over the surface ofthe negative, however. The loss in resolution as a result of poor contact between the negative andprint material, can be seen in Table XV. The films were diffusely illuminated by a ground glass aboutfour inches below the negative and the two emulsions were separated using shims.
Positive-Negative Material Separation Resolution
Original negative 21 lines/mm
Good contact between negative and print material 19 lines/mm.0015" separation between films 11 lines/mm.003" separation between films 6 lines/mm.0045" separation between films 4 lines/mm
8-2

ParallelLight
Negative Base
.. X t o 0, Negative EmulsionPositive EmulsionPositive Base
Figure 108. Parallel light source gives greatest image definition in contact printer.
Negative Base........ Negative Emulsion
SPositive EmulsionPositive Base
Figure 109. Non-parallel light source reduces flaring around edges of duplicated image in contact
printer.
8.2 Characteristics of Multispectral Positive Transparencies
A correctly exposed and processed multispectral positive should have the following preferred
characteristics:
- A low base plus fog and low minimum image density.These conditions assure that the composite additive color image will have the highest
possible brightness. This is analogous to generating the largest chromaticity diagram by
taking an orthogonal slice through the color solid at a brightness level of 10. Base and fog
density level should be no greater than 0.05 which is generally attainable with EK type 2420film.
- Identical gammas on each multispectralrecord if the reflectance of theobjects of interest are
approximately the same in each filter band. This condition permits the correct balance of the
additive color composite image on the multispectral viewer screen. By way of illustration,
consider the case when the characteristic curves for two positive multispectral. records (red
and green) are not the same, as shown in Figure 110. If the target color is yellow, then equal
amounts of red and green should be projected onto the viewing screen regardless of whetherthe subject is in the highlight or shadow. An examination of Figure 110 shows that in the
8-3

shadow areas between the log E 1 and log E 2 values, this condition holds. That is, thepositive transparencies will transmit equal amounts of red and green light since the imagedensities are identical. However, consider the color produced on the screen when the target isin highlight, log E 3 . The green image is less dense (D 3 ) than the red (D4 ) and so will trans-mit more green light. The additive color of the target will then shift from a yellow towardspea green and could be misinterpreted as some other object. If, however, the gamma of thetwo records are identical throughout the range of log E, then equal densities will result
Red Record
Green Record
D2 ----
DI
logEl logE 2 log E 3Log Exposure
Figure 110. Effect of different gammas upon the additive color reproduction of highlights.
regardless of target brightness. Note: In practice, the curves never quite match throughoutthe entire scene brightness range. It is desirable, though, that the curves match in the lowerpart of the H and D curve, i.e., from the point defined as Dmin to the upper density limit forthe targets of interest, for example soil and trees. Figure 111 shows the case in which thecurves do not match over the entire log E range of the film. They do match, however, overthe scene brightness range defined by the subjects. Although it would be most desirable forall targets to be on the straight line portion of the positive H & D curve, it is more importantthat the minimum density be held low for ,purposes of high viewing brightness.
Red Record
Green Record
Dmax
DminTrees Soil
Log Exposure
Figure 111. Gamma should match within the scene brightness range when the reflectance of thesubjects is about the same in each spectral band.
8-4

- When the reflectance or brightness of the subjects in the scene are not the same in each
filter band, then the condition of matching the gamma for all records is replaced by a new
criteria. The Dmin and the density range of each record must mach. To illustrate this
condition, consider photographing both water and soil using an infrared filter and a green
filter. The brightness of the soil is about the same in both filter bands, whereas the bright-
ness of the water is high in the green and very low in the infrared. Let Figure 112 be the
H & D curve for the infrared positive transparency and Figure 113 be the curve for the
green positive transparency. Notice that the gammas are the same and the Dmin's (soil) are
matched. There is little density difference between the soil and water in the green record. In
order to enhance the color differences in the green region, the positive is processed to a
higher gamma, while maintaining the same Dmin as shown in Figure 114. Now the density
difference between the land and water on the green photo is the same as that of the infrared
and good additive color discrimination will result.
Infrared GreenD 2 n..Green
D2
D, D
Soil Water Log E -+ Soil Water log E -
Figure 112. Scene brightness range Figure 113. Scene brightness range
of soil and water on the positive of soil and water on the positive
infrared multispectral record. green multispectral record.
Green
D2
D I I
Soil Water Log E - -
Figure 114. Expansion of density range by increasing the gamma of the green record.
8-5

Summarizing the requirements for each multispectral record:
- Negatives are exposed so that objects of interest fall on straight line portion of characteristiccurve.
- Negatives are processed to the highest possible gamma which the film can produce withoutplacing any objects of interest on toe or shoulder. Figure 115 shows a series of characteristiccurves for the same emulsion type. Although curve D has the highest gamma, the highlightsfall on the shoulder so that curve C is the optimal choice.
- Select duplicating material which is blue sensitive, has stable base, and will yield thegreatest possible gamma.
- Exposure duplicate film so that brightest target of interest has lowest possible density(Dmin).
- When the scene brightness range is approximately equal on all records, process theduplicating film to the same gamma if possible.
- When the scene brightness range differs in each multispectral record, the duplicatingmaterial is processed to different gammas such that the density range of each record isequal.
- Same precision processing conditions must exist for the positives, as well as the negatives.
I D
C Optimal
o Scene ILog El Brightness Range Log E2 Log E --
Figure 115. Optimal gamma is highest possible value still producing scene brightness range onstraight line.
8-6

1.0
KODA DK-50 min. 68 F (20 C D .0
- 0.0
.0I \ AFF
400 450 500 550 600 650 700 750 3.0 I_ I L
WAVELENGTH (my 400 450 500 550 600
WAVELENGTH (mn )Curve A
Curve B
Illuminant: Tungsten. 1/5 second 3.6Development: KODAK DK-50 at 68 F (20 C)
in a Sensitometric Machine 3.2 lluminant: Tungsten.8
2.8 Development: DK-50 at 68 F in Sensilometric Machine- 2.42.8
2.4c- 2.0
2.0 1.6
-. 6 12 min16 min 1.2
-1.2 6 mIin
.8
.4AFC
4 0.0 .0 2.0AFF LOG EXPOSURE
0.0 1.0 2.0 Curve D
LOG EXPOSURE (mes)
Curve C
8.3 Characteristics of Duplicating Materials
Kodak Aero Kodak Aero Kodak AeroDup #2420 Dup #4427 Dup #2430
Base Estar Estar Estar
Base Thickness 4.0 mil 7.0 mil 4.0 mil
Backing Fast Drying (PX) Clear Gelatin Fast Drying (PX)
Design Goal Max. Dimensional Max. Dimensional For High AcutanceStability Stability Negatives
Safelight Kodak #1A Kodak #1A Kodak #1A
Sensitivity Blue Blue Blue
RMS Granularity 16 (in DK-50 16 (in DK-50 8.9 (in DK-50developer for 5 developer for 5 developer for 4
min. at 680F and min. at 68*F and min. at 689F and
read at net den- read at net den- read at net den-sity = 1.0) sity = 1.0) sity = 1.0)
Resolution 138 1/mm at 1000:1 138 1/mm at 1000:1 285 1/mm at 1000:184 1/mm at 1.6:1 84 1/mm at 1.6:1 120 1/mm at 1.6:1
SpectralSensitivity Curve A* Curve A* Curve B*
SensitometricCurves Curve C* Curve C* Curve D*
*See following page
8-7

8.4 Reproduction of Tone
The technical aspect of photographic quality deals with the manner in which the image densitiesrelate to the reflectance or brightness of the scene. Tone reproduction analysis, therefore, attempts toanticipate the appearance of the final positive transparency by considering the following:
- the brightness of the scene- camera flare- negative film characteristics- camera exposure- printing film characteristics- printing exposure and processing
Since tone reproduction curves are generated in terms of radiometric (or photometric) characteristics,three commonly used units are defined in Table XVI.
Definition Photometric Unit Radiometric Unit
Luminous Flux (time rate of Lumen or Micro- Watt or Microwattflow of radiant energy) lumen.
Luminance (flux per unit solid Foot lamberts or Watts/cm 2
angle emitted per unit pro- candles/ft 2
jected)
Illuminance (luminance inci- Lumen/meter 2 or Watts/cm 2 or cmdent per unit area of a meter/candle wattsurface)
Table XVI. Photometric and radiometric definitions of radiance characteristics.
Since the photometric units are not applicable for wavelength regions outside the visible spectrum, itis best to employ the radiometric units when using either the ultraviolet or infrared spectral regions.
Tone reproduction is established by use of a graphical description consisting of four quadrants,each one of which represents a portion of the reproduction cycle. These quadrants are described inFigure 116.
Quadrant III Quadrant IV
Positive FinalMaterial Reproduction
Quadrant II Quadrant I
Negative FlareMaterial Curve
Figure 116. Four quadrants of the tone reproduction diagram.
8-8

The procedure for determining the graphical descriptions for each quadrant will now be discussed.
Quadrant I - Flare Curve
Up until this point, it has been assumed that all the light entering the camera and forming the
image has come from the illuminance of the scene; that is, if a density is measured on the film and
transformed to the H & D curve, a numerical value is given to the log exposure forming that image.
It has been shown that:
E = I(t)
and the illuminance I is given by:I = B TL. TF
4f 2
Hence, film density was said to be produced from the object brightness. This is not exactly correct.
Although most of the exposure (and the resultant density) comes from the object brightness, a small
portion does not. At any point in the film plane of the camera, the illuminance (I), which forms the
image, comes from two sources:
- the light from the object,- extraneous light reflected from the lens elements, the barrel of the lens, etc. This light is
known as flare.
Flare has the effect of casting a uniform fog or veil over the images and generally is so small as not to
be noticed. Flare can sometimes be seen as a haze over one corner of the photo. Not all flare is caused
by internal optical reflections, the object itself can contribute to the presence of flare, an extreme
example of which is glitter reflected from the water's surface (see Figure 117). Although this is
generally thought of as a specular reflection, the net effect is flare light on the film. We should
naturally expect that this flare light would affect the shadows much more than the highlights.
Suppose that in a negative the shadow area has a density of 0.18 and a highlight density of 2.6; also,
assume a flare density of 0.18. The total densities for highlight and shadow are now 2.78 and .36
respectively. Notice that the density of the shadow has doubled, while that of the highlight is
relatively unchanged. This situation prohibits one from saying "a density of x indicates an object
illuminance of y".
Figure 117. Flare can be produced by objects in the scene, as well as by camera components.
8-9

In tone reproduction, the effect of flare must be determined and it constitutes the first step ofthe process. To measure the amount of flare light in a camera, the following procedure isrecommended:
- Set up a series of about five gray scale panels (reflectances of 4%, 8%, 16%, 32%, 64%) out ofdoors and at a distance sufficiently far away to be focused by the camera. Sheets of plywood,4' x 8', covered with flat paint or a cloth work rather well.
- Mount the camera so that the panels will be about centered on the photo.- At the time of exposure, the brightness of the panels must be measured with a standard
photometer (B1 , B 2 , B3 , B4 , B 5).- Process the film and plot the H & D curve from the sensitometric wedge on the leading or
trailing end. (It is assumed, by now, that step wedges are always placed on the film prior toexposure.)
- Measure the film densities of the step wedge which was placed in the scene and determinelog E's of each step from the x axis, as shown in Figure 118.
- After taking the antilogs of these values, generate the ratios:E2 E3 E4 E5.1 1 1E1 2 ' E2 3' E3 4 E4 5
- Take log of E2 , E3 , E4 , E5 ; log El =0.- Plot results of above against the log brightness of each panel as measured with the photo-
meter; the curve will look something like Figure 119.
In Figure 119, the point S represents the darkest shadow (4% target), while H is the brightesthighlight (64% target). This result is known as the flare curve and it occupies Quadrant #1 in the tonereproduction cycle, as shown in Figure 120.
Quadrant II - Characteristic Curve of Negative Material
The most important part of the H and D curve is the toe and straight line since highlights arerarely recorded up on the shoulder. To generate the correct characteristic curve for Quadrant II, usethe same material which will be exposed in the camera. Cut a strip off the roll and place asensitometric strip onto it. Certain precautions must be taken in doing this, however.
D s
D 4
Log of E1 E2 E3 E4 E5 LogE -
Figure 118. Density and log E values for scene gray scale.
8-10

El
E4
02 EI
2
El '- ,' No Flare II /
S HLog Subject Brightness
Figure 119. Typical camera flare curve.
Relative Log E
Figure 120. Tone reproduction diagram showing position of flare curve in Quadrant I.
- The step wedge must be exposed through the same multispectral filter as used in the camera.
- The sensitometric exposure time should be about the same as that used to expose the film in
the camera.
The film strip is then processed exactly as the negative would be. From the density measurements
made on the sensitometric strip, the D log E curve of Quadrant II is determined as shown in Figure
121. In the four quadrant tone reproduction diagram, this curve is oriented 900 counterclockwise with
respect to the flare curve and is shown in Figure 122. Extending the line from S and H on the flare
curve horizontally to intersect the negative characteristic curve shows the density difference which
would result from imaging S and H on the negative material.
Quadrant III - Characteristic Curve of Positive Material.
The characteristic curve of the positive transparency material is determined in exactly the same
manner as was the negative curve. The usual conditions of low minimum density and high gamma in
the actual positive image require that the test film be exposed and processed in the same fashion. The
position of the positive characteristic curve in the four quadrant reproduction diagram is somewhat
unusual. The log E axis is horizontal, but the direction of increasing density is downward. Hence, the
D log E curve of Figure 123, for the positive material, is oriented in the third quadrant as shown in
Figure 124. The lines S and H are drawn upwards from the negative curve of Quadrant II to the
positive curve of Quadrant III; extending the lines from Quadrant III towards the right to intersect
the vertical extension of S and H from Quadrant I yields two points in the final tone reproduction.
8-11

Log E
Figure 121. Characteristic curve of the negative material.
I-Flare
I i Iw Il-Negative----------I
S H
Density -o- Log B
Figure 122. Characteristic curve of the negative material as positioned in the tone reproduction curve.
Log E
Figure 123. Characteristic curve of positive duplicating material.
8-12

Log E -*
III-Positive IV-Reproduction
4SI i -- - I I
I , tI-FlareII
V.-------- --- I- I -- -- -L - 7 I
I II i
II-Negative l
IS H
Density -- Log B
Figure 124. Final tone reproduction diagram.
Similar tracings for the intermediate points result in the final tone reproduction shown in Quadrant
IV of Figure 124. An exact reproduction of the original scene would have produced a straight line at
450 to the axis in Quadrant IV.
The advantage of using this method of tone prediction is that it permits one to alter either the
exposure, processing, or type of positive/negative films in order to produce a final Quadrant IV curve
which is closer to the 450 straight line.
8.5 Summary
- Multispectral negatives are unsuitable for additive viewing which requires that they be
printed into positive form.- Eastman Kodak Type 2420 duplicating film is recommended for making multispectral
positives.- Projection printing allows correction for scale changes between multispectral records.
- Projection printing lenses must be well corrected for chromatic aberration.
- Contact printing with diffuse light increases photo contrast, but decreases resolution.
- Low base plus fog and low minimum density on positive multispectral records, produces
high brightness in the multispectral viewer.- Selection of printing gamma depends upon-subject reflectance.
- Tone reproduction analysis permits one to alter exposure, processing, or films in order to
produce desired results.
8-13

CHAPTER 9
ADDITIVE COLOR PRESENTATIONS AND THEIR MEASUREMENT
The final task associated with multispectral or additive techniques consists of synthesizing orrecombining the separate images in an appropriate viewing device. The resultant color presentationsare the end product towards which all previous efforts have been directed. Providing that all of the
procedures for exposure, negative processing, and positive printing have .been performed inaccordance with the directives of the foregoing chapters, this final task will be the easiest to perform.
It is assumed for this discussion that the following equipment is available either "in-house" oron a rental basis:
- A four-channel multispectral additive color viewer incorporating hue, brightness, and satur-ation control of each projection system, as well as x, y motion of projection lenses for regis-tration, and auxiliary scale correction lenses.
- A tri-stimulus colorimeter with a fiber optic probe for measurement of the color images.
- A set of viewing filters including red, green, blue, light blue or cyan, yellow-orange, andmagenta. Two of each filter should be available to minimize interchanging between theprojection systems.
- Chromaticity coordinate data sheets and diagrams. The exact configuration of these isdependent upon the instrument used.
- A list of the camera spectral bands most likely to produce the best multispectral results for agiven set of ground objects.
- Two standard frames of imagery, i.e., one containing the ground reference panels and thesecond containing the ground truth test site.
9.1 Data Reduction Procedure
The following procedure is used to examine the multispectral imagery. It should be noted,
however, that with sufficient experience with the additive viewer several of these steps may beeliminated.
1. Place the standard frame containing the ground truth site in the film plane of the viewer and
bring down the platen to maintain the film in this plane.2. Remove filters from each projection system and set the lamps to full brightness and full
saturation.3. Turn on each projection system (record) one at a time and adjust lenses to give good focus.
4. Turn on record #1 and record #2, inserting a red filter into record #1 and a green filter intorecord #2.
5. Fine focus record #1 for the red filter.6. Using the x, y adjustments, register record #2 with respect to record #1. This process will
perhaps require some small scale changes. Alter the scale of #2 and refocus the image. Note:Any change in scale usually requires a corresponding change in focus.
7. The images should display no color fringing in any portion of the format. (If fringing doesexist, it is a clear indication of unmatched camera optics, unsynchronized shutters, orunmatched viewing optics. One is then forced into analyzing the imagery one area at a time.)Decrease the brightness of the first record #1, then #2, and recheck that no misregistrationsare present.
9-1

8. Turn off record #2 and turn on #3, inserting a green filter into it. Do not touch record #1either in x, y, or focus since this image is the one to which all others will be registered.
9. Repeat steps 6 and 7 for record #3.10. Turn off record #3, turn on #4 using a green filter. Repeat steps 6 and 7.11. Select those bands which are believed will produce the best multispectral imagery. If three
bands are chosen, the least significant of the set should contain the blue filter. If only twobands are chosen, use a light-blue (cyan) and yellow-orange filter combination for viewing.Generally objects in the scene which reflect no differences in color (for the camera filtersused) will then appear white or some shade of gray.
12. Select two or three types of ground objects to colorimetrically examine.13. Alter the brightness and saturation of each record, in turn, until the maximum visual color
difference is displayed between the ground objects of interest.14. Measure chromaticity coordinates of the ground objects, record data, and plot.15. Repeat steps 12 and 13 for the same object (target) groups. Often a small change in bright-
ness or saturation level will expand the color difference between the objects for betterdiscrimination.
16. Measure the chromaticity coordinates of the same types of targets over the whole format.Record the data, and plot. This process will yield a set of CIE coordinates which occupysmall areas on the chromaticity diagram as shown in Figure 125.
.8
.6
.4 - B
.2
.2 .4 v .6 .8Figure 125. Color spaces occupied by classes of objects as measured from multispectral viewer screen.
17. Lift the platen and transport the film to the standard frame containing the gray scale andcolor panels in the scene. Measure the chromaticity coordinates of the white panel withoutaltering any of the hue, brightness, or saturation controls. The data sheet containing thecolor measurement of the target types (step 16) must also list the CIE coordinates of thewhite panel measured under the same set of viewer conditions.
18. Select another group of two or three types of ground objects to examine colorimetrically.19. Repeat steps 13-17.
9-2

20. Often a change in the viewing filters will enhance some object groups better than others.This is a matter of trial and error, although the red, green, blue, or cyan-orange combinations
are usually best for a first-cut analysis.21. Having determined the color coordinates which maximize the differentiation between
objects in the scene and the color coordinates of the white panel associated with each, a table
can be generated summarizing this set of photo-interpretation keys. See Table XVII.22. On any other roll of film, exposed with the same set of camera filters, measure the x, y coor-
dinates of the white panel, altering the hue, brightness, and saturation so that it conforms
with the value in the Table XVII. The ground objects to be differentiated will then have CIEcoordinates as shown.
23. Spot check results with ground examination.24. Photograph viewer screen presentations for documentation and reference using a color
negative film such as Kodacolor X or a color reversal film such as high-speed EktachromeType B.
Group # Ground Objects CIE of CIE of Multispectral FilterDifferentiated Object White Records Used
A wheat ( .22, .183)rye (.171, .51) 1 Redtomatoes
(flowering) ( .33, .15) (.4, .51) 2 Greentomatoes
(mature) ( .25, .29) 4 Bluebare soil (wet) ( .50, .35)
B bare soil (wet) ( .63, .28)bare soil (dry) ( .3, .59) (.5, .4) 2 Redsand ( .4, .. 5) 3 Green
C balsam fir ( .2, .4) (.34, .37) 1 Cyanred spruce ( .5, .3) 4 Orange
Table XVII
Table XVII. Color Coordinates of Ground Objects & White Standard Panel.
Since the standard panels are overflown several times in a roll of film at altitudes from which theactual multispectral imagery is exposed, correcting the white target to its predetermined color will
remove any atmospheric effects from the imagery; that is, the white panel (and, hence, the groundobjects) will appear exactly the same color regardless of the quality of the illuminant or the effects of
altitude (haze, etc.).
9-3

9.2 Multispectral Viewers
Multispectral additive color viewers, like most optical devices, are supplied with various optionsand the general rule of "getting what you pay for" applies particularly to these instruments. That is, arelatively cheap model may not provide those features which will permit the photointerpreter toextract all the information which is contained in a set of multispectral photographs. A well-designedmultispectral viewer will provide good registration and an even illumination over the'entire format.Note: A good rule of thumb when considering multispectral viewers - whatever convenience is notbuilt into the instrument will ultimately cost more in man-hours of effort. Providing only a few framesof data are to be analyzed at a time, extra effort may not be objectionable. However, when largevolumes of multispectral imagery (for example, ERTS) are to be interpreted, the use of a moresophisticated additive color viewer will place the technician's efforts where they will do the most good- analyzing the photos, not trying to get the imagery to register or inserting the proper filters inplace, etc.
The following considerations are essential to the selection of an additive color viewer:
- Format sizes acceptable.- Hue, brightness, and saturation control.- Registration correction.- Parameters of projection lenses.- Auxiliary scale correction lenses.- Film transport and guiding mechanisms.- Number of manual operations necessary.- Cost.
Multispectral photography is presently being supplied in a variety of format sizes, dependingupon whether the imagery is obtained using multiple camera arrays or a multiple lens camera. Currentmultispectral format sizes include:
- 70mm film chips- 70mm film in cassettes- 91/2 inch pre-registered roll film
Since the cost of multispectral additive color viewers is still somewhat high, the projector selectedshould accommodate as many of these film sizes as possible. In addition, some units are available asrear screen viewers, wall projectors, or both. The choice of model is completely dependent upon theapplication or use of the imagery and the viewer cost.
The primary purpose of the additive color viewer is to present to the photo interpreter acomposite multispectral image of the scene in good registration. Adequate registration accuracy ofthe photography can only be accomplished if the viewer incorporates four projection lenses which arewell matched and possess little differential distortion. The lenses should be individually focusable inorder to project each multispectral band at its maximum resolution. Any shift in the focus of oneprojection lens relative to the others will cause a change in the scale of the imagery. Hence, both focusand scale adjustments are essential in multispectral viewers. Some units provide for scale changeonly. In this situation the multispectral records are differentially defocused in order to facilitateregistration of the composite. In addition to providing less than adequate resolution of each band, theimagery causes severe eye strain and is difficult to interpret for any length of time. Use of viewersproviding matched scale, but less than optimal resolution, should be avoided. Matching the scale ofthe individual multispectral records is only one aspect of obtaining adequate composite registration.
9-4

When separate film chips or rolls are to be viewed additively, provision must be included in theprojector to rotate and translate each multispectral image in x and y on the viewer screen. Movementof the projection lenses in x and y also allows correction for differential film shrinkage along the widthof the film. Shrinkage along the length of the roll is generally negligible. x and y displacements maybe accomplished by moving either the projection lenses or the photos in the film gate relative to eachother. The former design is usually employed for x, y motion since the film is held flat with a platenarrangement which can accommodate a small amount of rotation.
Some film guide mechanism should be provided so as to minimize the extent of x, y lens motionrequired between frames. Optimally, one should be capable of registering the first set of multispectralphotos on a roll of film, progress down that roll, and be required to make very little furtheradjustment in x or y and no adjustment in focus or scale to maintain registration. Viewing systemswith good film guides are capable of this. The accurate tracking of multispectral roll film is alsogreatly facilitated by an automatic film transport operated in conjunction with a rheostat to controlfilm speed. This provides an even transport of the film along the guides rather than the relativelyjerky motions resulting from a manual crank arrangement.
The control of the color space in terms of hue, brightness, and degree of saturation is essential toan accurate interpretation of additive color imagery. A choice of at least three filters (red, green, andblue) per multispectral channel should be provided, as well as an open gate. Open gate brightnessshould be as high as possible in order to exploit the full scene brightness range of the composite screenimage. Since the densities of the same image on each record add when viewed as a registeredcomposite, inadequate brightness in the projector, will produce a loss of information in the shadows.Some viewers provide for decreasing the brightness of each multispectral channel by use of rheostats.Such an arrangement alters the color temperature of the lamps and, hence, the chromatic coefficientsof the imagery. Viewers which provide neutral density filters for brightness control are a much wiserchoice.
The color filters which are used in conjunction with each multispectral channel must be glass.Ordinary gelatin filters or gelatin sandwiched in glass are unstable in that they are very susceptible tofading and must be replaced at regular intervals. Heat (which is a normal consequence of burning four500 watt lamps in a confined space) will also cause buckling of the gelatin and separation of thesandwiched filters. Placement of the filters in the optical system must be such that no degradation ofthe imagery occurs and the thicknesses of the filters should be varied to compensate for the change inrefractive index at different wavelengths.
Desaturation is generally provided for by either the addition of white light to the filtered beam(by use of a beamsplitter and a second source offset by 900) or by incorporating several red, green, andblue filters of varying levels of saturation in each optical system. The latter scheme is better in thatthe heat level within the machine is kept low thereby increasing the life of the projection lamps.
Naturally, the illumination across the entire format of the screen should be as even as possible.Fall-off in illumination across the field will amplify the low brightness in the corners of the imagerywhich may result from any vignetting effect of the camera. Lastly, convenient placement of controls,writing space, physical size, and power requirements should be considered. In conclusion, theminimization of manual control for filter selection, film transport, brightness, and desaturation willcertainly facilitate a more rapid interpretation of multispectral imagery permitting the operator toalter the color space of each photo frame with the minimum of inconvenience.
9-5

9.3 Summary- Multispectral additive color viewers should incorporate hue, brightness, and saturation
control.- Registration on viewer screen is performed using red and green filters.- Two standard frames of data are required for initial colorimetric analysis of multispectral
imagery - one containing a gray scale in the scene and the second containing the groundtruth area.
- Multispectral viewer lenses must be selected for differential distortion and differential focallength.
- Even illumination across the viewer screen is essential for correct interpretation ofmultispectral imagery.
9-6

CHAPTER 10CONSIDERATIONS IN THE SELECTION OF
MULTISPECTRAL CAMERAS AND COMPONENTS
Once the filter, film, and exposure requirements have been determined, attention can be given to
the multispectral camera lenses. A very large number of lenses are available from both domestic and
foreign manufacturers and because of their high cost, considerable care must be taken to select the
right one for multispectral use. Lenses are designed with a particular application in mind, i.e.,
projection, mapping, ultra-high resolution, aerial surveying, printing, etc. Generally, the lens selected
for multispectral use must be a good quality aerial surveying lens which is manufactured in
reasonable quantities, has a large maximum aperture (low f/number) and good resolution (140-200
1/mm). Since the ultimate use of multispectral imagery is in a registered composite additive color
presentation, the selection of camera components must be geared to producing a minimum of
misregistration between the records. In addition to the lenses, this includes shutters and the image
motion compensation (IMC) device.
10.1 Multispectral Lenses
Regardless of whether one is using a multiple lens multispectral camera or several cameras in an
array, each lens should have been supplied with certain data, including: flange focal distance,
equivalent focal length, and lens distortion characteristics. Although angular coverage, aperture
range, color correction, resolution, etc. are also important, it is only necessary to have this
information when selecting the lens design. The specific lenses (i.e., serial numbers) must be chosen on
the basis of calibrated focal length and distortion characteristics. Prior to purchasing any lenses for
the multispectral camera, request a list of those available with their appropriate data and select the
best four. This is the reason for only considering a lens which is manufactured in large quantities.
Often, out of a possible one-hundred candidate lenses, only six or seven will be sufficiently close in
specification to be used in a multispectral camera.
The definition of flange focal length and equivalent focal length are shown in Figure 126.
Whereas the equivalent focal length is the distance between the rear principal plane of the lens and the
focal plane, flange focal distance is a mechanical measurement. Every lens has a mounting flange with
which it is attached to the camera body. The exact required distance from this mounting flange to the
focal plane is called the flange focal distance and is usually given to .001 inch. The significance of focal
length and flange focal distance will be realized if one considers a lens as being shaped like two prisms
as shown in Figure 127. Focal Plane
Flange Focal Distance
-8 I-5 I6 I
I Equivalent Focal Length
RearPrincipal Plane
Figure 126. Lens diagram showing flange focal distance and equivalent focal length.
10-1

I RedGreenViolet
Figure 127. Focus changes due to wavelength of incident radiation.
A prism will bend incoming parallel light by different amounts depending upon the wavelength;blue light is bent more upon emergence from a prism than is red light. A lens (being shaped somewhatlike a prism) does exactly the same thing causing blue light to focus at a shorter distance than thelonger wavelengths of green or red. Lens designs have eliminated most of this error within the visiblespectrum, although some residual usually exists. The back focal distance of a lens is generallymeasured using white light. Although blue light will still focus short and red will still focus long,white light focuses somewhere between these two (around green) and is called the equivalent focallength. The flange focal distance is a measure of the distance between the lens mounting surface andthe focal point for white light. If one filters the lens, all wavelengths, except green or white (no filter),will be out of focus.
It is imperative then that some correction be made in the flange focal distances of the fourmultispectral lenses. The procedure is as follows:
1. Load the camera with a black-and-white film sensitive to the range of all filters being used(Note: IR sensitive emulsion is required if filters having bandpasses above 730 nm are used).
2. Place one filter over each lens.3. Orient the camera so that it points at a sharp distant object. Taking the camera to the roof of
a building and pointing it at distant (one-half mile) telephone poles, parked automobiles,fences, etc. is a convenient way to perform this test.
4. Take one photo; remove that strip of film from the camera and develop it.5. Check that the exposure is not too light or not too dark to see the fences (or whatever) on
each multispectral record. If the image is too dark, open the iris diaphragm and if it is toolight, close the iris. Save the film.
6. Once the exposure is pretty well set, replace the camera in the same position on the roof.7. Expose the film again; wind the film to a new frame.8. Rotate each lens out one-half turn, expose and wind the film.9. Rotate each lens out another one-half turn, expose and wind the film.10. Repeat until each lens has been rotated out about three turns.11. Process the film and label each frame as to the number of turns.12. Examine each multispectral record at a time and select the one with the best resolution or
focus for the distant object. (When the distant object is out of focus, nearby objects may be
10-2

very sharp. This situation is of no consequence since-we are only interested in objects at an
infinite distance away.)13. Several focus situations can occur in the group of photos for each record. For example,
Original Out /Turn Out 1 Turn Out 11/2 Out 2 Out 2 /2Position Turns Turns Turns
Record A Good Excellent Good Fair Poor PoorRecord B Good Fair Poor Poor Poor PoorRecord C Exc. Good Fair Poor Poor PoorRecord D Fair Good Excellent Good Fair Poor
Record A - Optimal focus one-half turn out.
Record B - Good (not excellent) focus in original position.
Record C - Optimal focus in original position.
Record D - Optimal focus one turn out.
Record B may have attained excellent focus if it could have been rotated one-half turn in. A reliable
machine shop can cut away a small amount of metal from the aft side of the mounting flange so that
the lens will set closer to the film platen. Note: Although we have spoken in terms of rotating thelenses to provide for optimal focus in each band, this procedure is strictly not done. The one-quarter orone-half turn represents a distance depending upon the number of threads/inch and the lens should beshimmed out by the appropriate amount.
Actually, the lenses should have the same focal length for those parts of the spectrum which are
covered by the filters; that is, one lens should be used strictly with a blue filter, another lens with a
green filter, etc. The blue lens should have a white light focus longer than the white light focus of the
red lens. In this way, the focal position of the blue lens for blue light will be the same as the red lensfor red light. Consideration will now be given to the lens distortion.
Every lens has a nominal magnification associated with it and it also has small variations inmagnification called distortion which vary with field angle. Distortion is a measure of the distance
between: (1) the actual position of an image, and (2) the position the image would have if it were
generated by a theoretically perfect lens. A typical distortion curve is shown in Figure 128.
+100 -
+50-
- 00oo
00 100 200 300 400 500 600 700 800 900 1000
Figure 128. Typical lens distortion curve. Field Angle (degrees)
10-3

This curve shows that from 00 to 450 the lens exhibits barrel distortion; at about 500 the distortion isagain 0, while from 500 to 800 there is a pin cushion effect.
Any distortion which is present in a set of multispectral lenses should be matched. Thisstatement does not imply that the lenses must be distortion free. It merely indicates that whatevershape the distortion curve is for one lens, each of the other multispectral lenses should have the sameshape. If they are not matched, it is possible that the situation of Figure 129 may exist. An image inone record could have a maximum distortion of +50 microns, while the same image on another recordcould have a distortion of -25 microns or a total distortion difference of 75 microns. If the lenses hadthe same distortion characteristics, the distortion difference would then be zero.
Differential Distortion = 75 microns+100
0
+ 50
Lens A
- 100
200 300 400 500 600 700 800 900 1000
field angle (degrees)
Figure 129. Positive and negative distortions will be added in final multispectral composite image.
To realize the significance of a 75 micron distortion between two multispectral records, it isnecessary to analyze what effect it would have on the two photos registered in additive color on amultispectral viewer screen. Assume the viewer is a 4X system; 75 microns are approximately to .003inches. Enlarging the imagery four times would make the screen error, or misregistration, .012 inches.That is, some portions of the combined image would have perfect registration, while other parts wouldpossess a color fringing .012 inches wide and nothing could be done to eliminate it. In a 15 line/mmprojected composite image, the .012 inch error would reduce the viewing resolution to 2 lines/mm inthat specific photo area.
Assuming now that the lenses have been optimally focused and that their distortioncharacteristics have been angularly matched, their transmission as a function of wavelength shouldbe measured in order to perform exposure calculations. This can be accomplished most convenientlywith a spectrophotometer or if such an instrument is unavailable, the lens can be sent to a calibrationlaboratory. Lens transmission is measured every 5 or 10 nm from 380, to 950 nm and it is often helpfulto measure its characteristics off-axis as well. If anti-vignetting filters are to be used, the lenstransmissions must be measured with them in place.
10-4

10.2 Photographic Resolving Power
The ability of a camera to record fine detail in its imagery is usually expressed in terms ofresolving power. Resolution is not necessarily the best test of image quality, but is a simple way toquantitatively compare various combinations of lenses and films.
The resolution of a film is generated by photographing a series of black lines on a whitebackground with an extremely good quality lens. These black lines have an equal spacing betweenthem, come in sets of three vertical and three horizontal lines to a group and the groups decrease insize in some regular way as shown in Figure 130. If the width in millimeters of a single line and a spacein the smallest group which is resolvable in the image is called s, then its reciprocal is called resolvingpower in lines per millimeter:
1Resolution (1/mm) = -
Figure 130. Air Force resolution target.
The resolution of a lens is generated by viewing the aerial image of a resolution target (such asthat of Figure 130). In optical theory, the resolving power of a lens is a function of only the apertureand the wavelength of the radiation. Although most lenses do not follow this theoretical resolutionlaw, at small apertures the visual resolving power does approximate it. For practical purposes,photographic resolution is a measure of the combined effect of both lens and film, expressing thequality of definition at the image plane. Hence, we are generally interested in the size of ground detailwhich will be visible at a specific altitude. To generate a complete resolution test of a camera, it is
necessary to take photographs of a test target at several positions of focus and at several field angles.This may be done in the laboratory by using a highly corrected telescope objective as a collimatinglens providing that: (a) the focal length of this lens is much greater than that of the camera lens, and(b) the diameter of the collimating lens is larger than that of the camera lens. Figure 131 shows atypical set-up for testing the resolution of a camera.
Film Plane (F) Lens (L) Collimating Lens (C) Opal Glass (0)
/ /
Mounting Flange Target (T) Source (S)
Figure 131. Laboratory collimator arrangement for testing lens resolution.
10-5

A transparent resolution test target T, mounted at the first focal point of the collimating lens C,is illuminated by the light source S. An opal screen, 0, is provided so that the light is diffuse. Theradiation emerging from the collimator will be parallel so that the test target appears to be an infinitydistance away from the camera lens L. The lens L is mounted on a carriage which pivots about thevertical axis I. The film plane, F, moves along rails for focusing and care should be taken that thefront surface of L is coincident with the pivot point I. Hence, the incident light can strike the lens L atdifferent field angles. The focus position is visually set and a series of exposures are made on the samepiece of film for different field angles. This process is repeated at various focus positions and the filmsare processed. The developed images are examined under a magnifier which will indicate the smallestgroup just resolved.
Suppose that the separation between centers of the lines in the smallest resolved group is W inthe original target T. If the focal length of lens L is FL and that of the collimating lens C is FC, thenthe resolution of the on-axis image is:
Resolution = FCAxis (FL "W)
The off-center images become larger with increasing field angle so that at any angle 6, the resolutionof the radial and tangential lines is:
ResolutionRadial = ResolutionAxis -Cos 0
ResolutionTangential = ResolutionAxis -Cos 2 0The definition of radial and tangential resolution patterns is shown in Figure 132. (It should be notedthat lenses up to about 40 inches can be tested using a 100-inch collimating lens.)
illT
R R
R IR N \IIIT
T R TIll
T
Figure 132. Radial resolution patterns are those which radiate out from optical axis o; tangentialpatterns are perpendicular to radial.
10-6

To determine the ground resolution from the camera resolution just described, the following
relationship is used: A
ResolutionGround = FL (25R) in feet
where A is the flight altitude in feetFL is the camera focal length in inchesR is the camera resolution in lines/mm25 is the factor which converts R to lines/inch
Thus, if a six-inch lens has a resolution of 40 1/mm, then from 20,000 feet it resolves details which are
31/3 feet apart. Naturally, lenses which are to be employed using filters should be tested with the filters
in place.
According to optical theory, the resolution of an image should decrease with increasing
f/number as shown by the dotted line in Figure 133. The photographic resolving power, however, does
exactly the opposite; that is, the resolution increases with increasing f/number up to some maximum
point whereupon it begins to decrease. Further examination of Figure 133 shows the decrease in
resolution with: (a) lower contrast between the target and background, and (b) with the use of coarser
grained films. Also, notice that the maximum resolution shifts to higher f/numbers as the grain of the
film becomes coarser. Although Figure 133 is a generalization, all aerial lenses regardless of their focal
lengths, apertures, or field of view have resolution characteristics similar to these.
2.5 -
high contrast Theoretical Image Resolution
low contrastS2.0
fine grain film
1,
medium grain film
4 5.6 8 11 16 22Log f/number
Figure 133. Comparison of axial resolving power for high and low contrast and different grain films.
The resolving power obtained for a given film and leis combination in actual aerial
photographic tests is greatly dependent upon the contrast of the scene, exposure, and processing.
Since the resolution of a camera varies exponentially with contrast, it is imperative that the camera
be tested with resolution targets of about the same contrast as that which will be encountered in
actual flight. The presence of atmospheric haze must also be accounted for since it reduces the
contrast of the scene thereby reducing resolution. As a matter of fact, the loss of contrast not only
10-7

makes larger details difficult to see, but also causes some objects to disappear from the imagealtogether.
The effect of haze is to reduce brightness differences of all objects in the scene by the sameamount, the detail in the shadows being lost first. For example, suppose background and targets hadlog brightnesses as shown in Table XVIII and the same contrast (0.2).
Background Target
0 0.2.2 .4.4 .6.6 .8.8 1.01.0 1.21.2 1.41.4 1.6
Table XVIII. Log brightness of hypothetical background and target.
If these subjects are seen through a haze so that 20 percent of the maximum brightness is added toeach brightness, the new range of log brightness is now 0.73. The contrast of the first step decreasesfrom 0.2 to 0.27, while the contrast of the eighth step only drops from 0.2 to 0.159.
Resolution and contrast also decrease at very high altitudes. As the camera-to-subject distanceincreases, the size of the images is decreased according to the laws of optics. However, an altitude willbe reached at which the images are as small as the lens is capable of producing them. With increasingaltitude, then, the image size will remain the same, but less light flux will enter the lens resulting in adecrease in contrast. At very low exposure levels, the resolution is limited primarily by the lack ofcontrast since the slope of the toe portion of the characteristic curve is quite small. As exposure isincreased, the contrast and resolution also increase until the maximum is reached at the beginning ofthe straight line. No further increase in contrast takes place, although the grain of the film doesincrease with density. The net effect, therefore, is that resolution begins to drop off after it reaches itsmaximum due to graininess. Naturally, the resolution fall-off would become more rapid near theshoulder of the H & D curve.
Slow emulsions generally have a finer grain and better resolution than the faster types,although this does not mean that they are best for aerial photography. Slower emulsions requirelonger exposure times (either in terms of aperture size or shutter speed) and this may not be practicalfrom an operational point of view. In order to minimize image motion, the shutter speed should bekept fast, while the exposure is increased opening the lens aperture. The result is that while theresolution is increased by using a less grainy film, the lens resolution is decreased by using a largeraperture. Hence, the overall resolution will be increased by a small amount or may actually decreasedepending upon the actual lens and emulsion used. Generally, only a small area around the center ofthe photo will show any marked improvement by using a finer grained film.
Graininess of a film can be reduced by cutting down on the development time. However, thisalso results in a decrease in contrast and speed which may actually reduce the final image resolution.It should be noted that printing a positive on a contrasty film will not reveal details which are not
10-8

already visible in the negative. It may, however, improve the general appearance of the photo andmake interpretation easier by increasing the contrast on the broader areas of tone. Multispectralimagery combined additively in a color viewer will give a marked increase in resolution, as well as areduction in graininess. This is primarily due to the fact that negatives consist of graininess patternswhich are a random distribution of densities. Superimposing several images will cause a build-up ofthe image details, each one re-enforcing the others to a full strength image, while the random densitydifferences tend to cancel each other.
Image motion also contributes to the loss of photo resolution. These motions are caused by thevibratory movements and the steady forward speed of the aircraft. This first motion is readilyeliminated by using a stabilized mount for the camera. The effect of forward motion on the resolutionof ground images is most serious at low altitudes and large scales. Although the most obvious way toeliminate this is to reduce the camera exposure, the limited sensitivity of films makes this methodimpractical. The brightness of shadows is much less at low altitudes than at high and so moreexposure is required. Most lenses do not have a sufficient range of f/numbers to cope with therequired shorter exposures while still producing a well-exposed negative.
The blur, B, due to the uncompensated image motion can be calculated from:
VB =(-) F t
H
where: F = effective focal lengtht = exposure timeV = aircraft velocityH = aircraft altitude
It should be noted that the ratio (V/H) affects the dynamic resolution. The dynamic resolution isapproximately inversely proportional to the ratio V/H. The expression governing this relationship isgiven as:
Ro
Rd= 2Ro (-) +H
where: Rd = dynamic resolutionRo= static lens-film resolution
Substituting the parameters of velocity and altitude into the above expressions, the dynamicresolution of the uncompensated image can be determined. For example, if static film-lens resolution,Ro, is 45 line pairs/mm, then for the aircraft flying at 150 mph and at an altitude of 15,000 feet or less,i.e., V/H = .015 or greater, image motion compensation should be provided if a resolution of 20 linepairs/mm or greater is desired. Motion of an image may be stopped by either moving the film in thecamera or by tilting the camera axis during exposure so that the optical axis of the lens continues topoint at the same object. The required motion compensation for a moving film is:
Film Speed = ( ) *FH
where: V = aircraft velocity in ft./sec.H = aircraft altitude in feetF = focal length in feet
10-9

For example, if V = 300 mph = 440 ft./sec.H = 200 ft.
F = 6 inches = .5 ft.
Film Speed = 440 1 1.1 ft./sec.- ( 2 ) = 1.1 ft./sec.
200 2
10.3 Characteristics of Multispectral Filters
The spectral characteristics of reflected light are altered by the use of optical filters which maybe fitted onto the front of a camera lens. Such filters absorb a portion of the incident radiation eitherselectively or non-selectively regardless of whether such radiation is to be transmitted through orreflected from the filter surface.
Selective absorption filters have a distinct color associated with them dependent upon thenature of the dye molecules which have been incorporated into the base or support (gelatin, glass,plastic, liquid, etc.). Most absorption filters have a rather arbitrary set of color numbers associatedwith them so that examination of their transmission properties is necessary to determine their abilityto absorb light. From such data, an example of which is shown in Figure 134, both the peaktransmission and bandwidth can be determined. The bandwidth is actually the range of wavelengthwhich is not significantly absorbed by the filter. To determine the bandwidth draw a horizontal line atthat value of transmission which is equal to 50 percent of the peak transmission on the filter curve.This line will intersect the filter curve at two points and the difference in their wavelengths is thebandwidth.
100
80 Bandwidth80 I I0
. 60
4040 PeakTransmission
20 I
400 500 600 700 800
Wavelength in Nanometers
Figure 134. Definition of filter peak transmission and bandwidth.
Non-selective absorption filters (also called neutral density filters) serve to reduce the overallamount of light reaching the film by the same amount. With many such filters this does not happen.They have been found to absorb blue light and transmit more infrared light than their nominaltransmission values quote, as shown in Figure 135 for the Wratten #96 series.
10-10

50
40
i 30 Nominal Transmission = 10%(Wratten #96)
20 X
10 . Inconel
0 I I I I400 500 600 700 800 900
Figure 135. Absorption characteristics of Wratten #96 and Inconel coated neutral density filters forvisible and near infrared spectral regions.
For critical multispectral, as well as color photography one should employ an Inconel coated
density on glass as a non-selective filter. In addition to ordinary dye absorption filters, another type is
commonly used in multispectral photographic applications-namely, interference filters. These filters
are based on the principle that light reflected from two surfaces separated by a small distance will be
cancelled when they meet out of phase. The path difference between these reflections is optically equal
to an odd number of half wavelengths of the light cancelled. Such filters have the following properties:
- The maximum percent transmission is extremely low, often only as high as 2-4.percent.
- They possess very narrow bandwidths- The wavelength of the transmitted light varies with both the angle of incidence and the
temperature of the substrate.
By replacing the silver layers in these conventional interference filters with alternate coatings of
materials having high and low indexes of refraction, the filter will have a high peak transmission,80-90 percent, with relatively narrow bandwidths (say, 10 nm). The high index material (n = 2.4) and
the low (n = 1.4) are evaporated onto glass and as many as fifteen to twenty layers, one-quarter
wavelength in thickness, may be applied. The quality of the filter generally improves with the number
of layers and can be made to transmit infrared radiation, as well as visible.
There are two major sources for absorption and interference filter inefficiencies:
- Loss due to surface reflections
- Absorption in regions where there should be none
- Non-absorption in regions where there should be absorption
An uncoated surface of every filter reflects about 4-5 percent of all light which strikes it,
regadless of the wavelength or type of construction. Hence, for a single filter a total of between 8-10
percent of the light is lost because it contains two surfaces; coating the filter in the same way that a
lens is coated will reduce the transmission losses to about 1 percent per surface however.
A theoretically perfect filter should have a square wave shape as shown in Figure 136a.
Although this condition can be approximated, this ultimate shape is never achieved. The peak
transmission can be increased up to 95 percent, but only at the expense of the side slopes as shown in
10-11
Q)

Figure 136b. Conversely, the slopes can be made quite steep, but the peak transmission will decreaseaccordingly (Figure 136c). Such inefficiencies are unfortunate but cannot be eliminated whilemaintaining the spectral characteristics desired.
100 - 100
80 _ 80
60 - 60
40 - 40
20 - 20
400 - 500 400 'k 500(a) (b)
100
80
60
40
20
400 A 500(c)
Figure 136. A theoretically perfect absorption filter should have a square wave shape (a); largetransmission can be obtained by decreasing the side slopes of filter (b); steep side slopes necessitatedrop in peak transmission (c).
Some photographic applications require the use of more than one filter to achieve the spectralabsorption required. In such cases, the filters should be cemented together, thus minimizing thesurface reflection losses. For example, if three filters are to be used in combination, the surface losseswhen they are not cemented are about 30 percent, while they are only 10 percent for a cementedcombination. Light losses of this magnitude will present definite exposure problems when a relativelyslow film is used in the camera. In order to calculate the effect of combining several filters, the
10-12

transmission of each filter is multiplied wavelength by wavelength and the following will be noticed:
- The peak transmission is decreased- The bandwidth has become narrow
It should be noted that using absorption filters in conjunction with the lens for multispectral
photography will not only alter the response of the film, but a contrast change will take place if no
compensation is made in the development process. Generally, a decrease in contrast takes place if a
blue filter is used and an increase in contrast is seen when a red or near infrared filter is used. Care
should be taken that all lenses are focused with the filters in place since a thick filter will change the
effective focal length of the lens.
10.4 Shutters and Shutter Timing
There are two basic types of shutters used in photographic cameras - between-the-lens and
focal plane - each one of'which has its advantages for particular applications. As the name implies,
between-the-lens shutters are located in the air space between the front and rear lens elements. The
light is admitted by the opening and closing of blades made of some thin metallic material. These
blades are arranged so that they open from and close towards the center. Focal plane shutters consist
of an opaque, flexible curtain which is positioned just in front of the focal plane. The light is admitted
through a slit in the curtain across the line of film motion. The curtain is tensioned between two rollers
which pull the slit across the film at various speeds.
Between-the-lens shutters are primarily used in single lens multispectral systems and in single
cameras making up a multispectral array. Tests have shown, however, that the synchronization of a
set of shutters is far from perfect. That is, although each mechanism is fired off the same
intervalomter, there exists a time lag between the closing of the electrical circuit and the instant that
the shutters operate. This time lag (which differs for each lens shutter) can introduce drastic
misregistrations into the final multispectral images. (The effects of forward motion of the aircraft are
not being considered - it is assumed that some form of IMC device is being used.) The cause of image
displacement comes from two sources:
- The random vibrations of the aircraft- The motion of objects on the ground
It is obvious that considerable angular velocities are developed when a photo plane goes into a steep
turn; however, in bumpy air there will be continual violent movements which drastically produce
additional angular velocities of pitch, roll, and yaw. The magnitude of these irregular movements
depend upon the aircraft characteristics, pilot skill, as well as the air conditions. Hence, lack of
synchronization between shutters which are supposed to expose simultaneously will shift the nadir on
all multispectral records. Providing that this is the only "motion error", it can be removed in the
viewing stage by altering the x, y positions of the multispectral records relative to each other. This
assumes, of course, that each image exists on a separate piece of film.
When objects in the scene are themselves moving relative to the terrain, a lack of shutter
synchronization will produce a set of misregistered multispectral images which cannot be corrected.
Assume that at some time t, a vehicle (for example), is moving at some velocity v along the ground
and is' photographed with a multispectral camera equipped with an IMC device. If a time lag of at
exists'between the synchronization of the shutters, then the image displacement of the moving vehicle
on the multispectral records will be:
d = (A t)
10-13

where: v = the vehicle velocityf = the camera focal lengthH = the altituded = the image displacement
Stationary objects, however, will still be in register so that superimposition of the images will produceeither:
- Registered overall scene - moving vehicles misregistered- Registered moving vehicles - misregistered overall scene
Hence, in multiple camera arrays one of the units should contain a "master" shutter, while theremaining cameras contain "slave" shutters. Whereas the master is equipped with a complete shuttermechanism, the slaves have only a diaphragm and shutter blades which are coupled to the master andcontrolled by it.
Multispectral cameras which employ a multiplicity of lenses in a single body often incorporatefocal plane shutters. One should note that in such cases individual shutters are not used; rather asingle curtain is constructed in which not one, but four, slits exist. It can easily be seen that each partof each image is being exposed at exactly the same instant so that regardless of erratic aircraft motionthere is no differential positioning of nadir. Also, since the synchronization between the slits isperfect, no misregistration will occur due to the movement of objects in the scene. Since ease ofinterpretation is directly related to the resolution or registration of the final composite image, focalplane shutters with multiple slits should be used for multispectral photography wherever possible.
10.5 Four Lens Multispectral Camera Vs. Four Camera Multispectral Array
The choice of using either a four-lens camera (FLC) or a four-camera array (FCA) formultispectral photography has been a topic of discussion for the past decade. The use of more thanfour lenses in either configuration will not be presented since these systems require elaborate datareduction equipment and the number of photo combinations becomes extremely large making themimpractical for most multispectral photography.
Both the FLC and FCA systems have their advantages and disadvantages which may beclassified according to the three stages of the multispectral additive technique; i.e., exposing,processing, and viewing.
Four Lens Camera Four Camera ArrayExposure
Usually designed so that they accept only one type Four separate film magazines permit exposure onof film at a time for all multispectral records multiple types of black-and-white film or color(some units, however, have a modified magazine emulsions or a combination of both. Alsowhich will accept four rolls of 2.125 inch wide film). individual magazines can be interchanged during
flight for comparison of film response, etc.Use of a four-slit focal plane Use of between-the-lens shuttersshutter assures identical exposure introduces synchronization errors,time on each record and identical both in terms of length of exposurespatial positioning of all images time and time lag between the actualrelative to the principal point exposure of each record.of the lens.
10-14

Four slits in a focal plane shutter Exact synchronization of between-assure synchronization and are the-lens shutters requires elaboraterelatively easy to construct. design and construction.
Lenses aligned in a single body Difficult to maintain precisecan be pinned so that it is rela- vertical alignment between individualtively easy to maintain ortho- cameras.gonality of optical axis and focal plane.
Only one moving camera or moving film Four moving cameras or four moving filmIMC device required. IMC devices required.
Exposure changes can be made only Exposure can be varied with bothusing diaphragm of each lens. aperture and shutter timing of each
camera providing a wider latitude forscene brightness.
Processing
Processing four images on a single Processing of each multispectralfilm yields differential gammas negative can be tailored so as to
between records necessitating exactly match gammas.detailed printing procedures for correction.
Viewing
Alignment and film guide mechanism Each multispectral record must bein camera can be made compatible manually aligned with respect to the
with viewer so that composite multi- others for each frame viewed.spectral imagery is automatically registered.One registers only the first frame,each of the subsequent frames on thesame roll will be then in register.
10.6 Summary
- The primary variables with which multispectral lenses are selected are: focal length, flangefocal distance and distortion.
- Flange focal distance must be changed for each filter.- Thorough focus tests must be performed with filters in place.
- Multispectral lenses should possess a minimal amount of differential distortion between
them.- Photographic resolution depends upon both the film and lens.
- Resolution is a function of both film graininess and image contrast.
- IMC devices should be employed on all multispectral camera systems.
- Multispectral absorption filters are often a compromise between maximum transmission
and side slope.- Neutral density filters should be tested in near infrared before being used in camera.
- Bandpass of interference filters changes with angle of incidence and filter temperature.
- Combinations of filters for a single lens should be cemented together to minimize reflection
losses.
10-15

- Focal plane shutters and between-the-lens shutters are generally used for multiple lens andmultiple camera multispectral systems, respectively.
- Shutter synchronization determines in part the ultimate registered resolution of the multi-spectral composite image.
10-16

CHAPTER 11
PHOTOGRAPHIC MATERIALS FOR
COLOR AND BLACK-AND-WHITE PHOTOGRAPHY
The proper selection of a film for color and/or multispectral aerial photography is of paramountimportance because of the time and money expended in obtaining good aerial negatives. Hence, oneshould have a knowledge of the film characteristics which are included herein and which werediscussed in Chapter 6. Although most aerial emulsions are rather versatile, there is usually one whichis most suited for a particular application. Examination and comparison of film properties will help inchoosing the right emulsion for the photographic mission to be done.
The following are brief descriptions of the film characteristics which will be given in the datasheets of this chapter.
- Characteristic Curve: The way an emulsion responds to exposure and development is mostusually observed by plotting its characteristic curve. To obtain this curve, the material is given acarefully controlled exposure through a step tablet in an instrument called a sensitometer.Development of these exposures under very carefully controlled conditions yields a gray scale with aseries of steps that differ in density.
The amount of exposure that was given to each step is specified in terms of the light intensitymultiplied by the length of time the material was exposed. Density (D) is plotted versus the logarithmof exposure (log E). The characteristic curve, or D-log E curve, reproduced in the data sheetsrepresents the average product exposed and processed under normal conditions. The slope of any partof the curve indicates how rapidly the density changes with changes in exposure. Also the shape of thecharacteristic curve varies with different emulsions.
- Spectral Sensitivity: The spectral sensitivity of an emulsion describes its response toradiations of varying wavelength in the visible and invisible parts of the spectrum. It is possible toextend the sensitivity through the green (orthochromatic sensitization), through the red(panchromatic sensitization), and into the invisible infrared region of the spectrum.
Spectral sensitivity, or color sensitivity, is an important consideration in choosing a film for aparticular use. It determines the kind of filters that can be used with the material and the way the filmmust be handled in processing.
Which filters you can use with a particular film depends, of course, on the color sensitivity of theemulsion. For example, a red filter can be used only with a red sensitive, or panchromatic film.
Except for materials made for special purposes, Kodak films are divided into the following foursensitizing classes:
1. Blue Sensitive - films having only the blue and ultra-violet sensitivity inherent in any silverhalide.
2. Orthochromatic - this class is sensitive to green, as well as to blue and ultraviolet.3. Panchromatic - these films are sensitive to red, green, and blue, as well as to ultra-violet.4. Infrared - these films are sensitive to ultra-violet, blue, red, and invisible infrared radiation.
- Reciprocity Effect: Although the reciprocity effect is insignificant in most ordinary
11-1

applications of black-and-white photography, some lighting conditions require abnormally long orabnormally short exposures. Then the effect can be seen as underexposure, a change in contrast, orboth.
Films made for different purposes have different reciprocity characteristics. Therefore, whenyou select a film for use in a situation where you can foresee that exposures may be very long or veryshort, select a film with reciprocity characteristics that suit the application. To enable you to do this,tables of adjustments in both exposure and development to compensate for reciprocity effect aregiven in the data sheets.
- Graininess: The densities in a black-and-white negative are composed of microscopic grainsof silver which tend to clump together and form the familiar granular pattern that becomes visiblewhen a negative is enlarged. As a rule, the faster a film is, the greater its tendency towards graininess.Although each emulsion has an inherent graininess, this can be decreased by using an effectivefine-grain developer, but only at the expense of some loss of speed. Graininess is increased byoverdevelopment, whether caused by high temperature extended developing time, or an overlyenergetic developer. Moreover, apparent graininess is increased by high density in a negative.
- Resolving Power: The resolving power of an emulsion refers to its ability to record fine detaildistinguishably. The resolution of a film depends on the contrast of the test chart, but only slightly onthe degree of development of the film. The resolving power classifications given in the data sheets arebased upon the maximum values determined for the recommended processing. The loss of resolutionwith overexposure and underexposure is an important reason for exposing negatives as correctly ascircumstances permit.
11.1 Black-and-White Films
The main features of some aerial black-and-white films are presented here. One should refer tothe "Manual of Physical Properties of Kodak Aerial and Special Sensitized Materials" for moredetailed information, such as spectral sensitivity curves, time-gamma curves, etc.
- Kodak Plus-X Aerographic Film2402 (Estar Base)Military Designation 11-33-641Medium-speed, high dimensional stability for mapping
Base: 4-mil Estar polyester with fast-drying (PX) backing
Sensitivity: Panchromatic, with extended red sensitivityResolving Power: T.O.C. 1000:1 112 lines/nm (D-19)Resolving Power: T.O.C. 1.6:1 50 lines/mm (D-19)Aerial Exposure Index: 80 (Based on normal development of 8 minutes at 750 F in D-19).
- Kodak Tri-X Aerographic Film2403 (Estar Base)Military Designation 11-33-64kHigh-speed, high acutance aerial mapping film; especially suitable also for reconnaissanceunder minimal levels of illumination
Base: 4-mil Estar polyester with fast-drying (PX) backing
11-2

Sensitivity: Panchromatic, with extended red sensitivity
Resolving Power: 71 lines/mm at T.O.C. 1000:1 (12 minutes, D-19)22 lines/mm at T.O.C. 1.6:1 (12 minutes, D-19)
Aerial Exposure Index: Daylight - 250(Based on exposure without a filter and normal development of 12minutes at 68 0 F in Kodak D-19).
- Kodak Double-X Aerographic Film2405 (Estar Base)Military Designation 11-33-63iStandard film for mapping and charting; high dimensional stability
Base: 4-mil Estar polyester with fast-drying (PX) backing
Sensitivity: Panchromatic, with extended red sensitivity
Resolving Power : 85 lines/mm at T.O.C. 1000:1 (DK-50)Resolving Power: 38 lines/mm at T.O.C. 1.6: (DK-50)
Aerial Exposure Index: Daylight - 125(Based on normal development of 8 minutes at 68 0 F in DK-50)
- Kodak Aerographic Duplicating Film2420 (Estar Base)4427 (Estar Thick Base)Type SO-122 (Estar Thin Base)Military Designation 2420-14-33-23d; 4427-14-35-23dFor duplicating aerial negatives; high dimensional stability, increasing with base thickness.
Base: 2420: 4-mil Estar polyester with fast-drying (PX) backing4427: 7-mil Estar polyester with clear-gel backingType SO-122: 2.5-mil Estar polyester with clear-gel backing
Sensitivity: Blue-sensitive, positive materials.
Resolving Power: T.O.C. 1000:1 138 lines/mm (DK-50)145 lines/mm (K-76)
T.O.C. 1.6:1 84 lines/mm (DK-50)80 lines/mm (D-76)
- Kodak Panatomic-X Aerial Film3400 (Estar Thin Base)Military Designation 11-32-64qIntermediate-speed, thin-base, high-altitude reconnaissance film
Base: 2.5-mil Estar polyester with dyed gel backing
Sensitivity: Panchromatic, with extended red sensitivity
Resolving Power: 170 lines/mm at T.O.C. 1000:1 (D-19)Resolving Power: 65 lines/mm at T.O.C. 1.6:1 (D-19)
Aerial Exposure Index: Daylight - 20 (Based on development of 8 minutes at 68 0 F in D-19)
11-3

- Kodak Plus-X Aerial Film3401 (Estar Thin Base)Military Designation 11-32-64iMedium-speed, thin-base, high-altitude reconnaissance film
Base: 2.5-mil Estar polyester with dyed gel backing
Sensitivity: Panchromatic, with extended red sensitivity
Resolving Power: 105 lines/mm at T.O.C. 1000:1 (D-19)Resolving Power: 40 lines/mm at T.O.C. 1.6:1 (D-19)
Aerial Exposure Index: Daylight - 64(Based on normal development of 8 minutes at 68 0 F in D-19)
- Kodak Aerial Negative FilmType SO-206 (Estar Thin Base)Moderate speed, fine-grain film for high-altitude mapping or reconnaissance
Base: 2.5-mil Estar polyester with dyed gel backing
Sensitivity: Panchromatic, with extended red sensitivity
Resolving Power: 336 lines/mm at T.O.C. 1000:1 (D-19)Resolving Power: 112 lines/mm at T.O.C. 1.6:1 (D-19)
Aerial Exposure Index: Daylight - 6(Based on normal development of 8 minutes at 680 F in D-19)
- Kodak Direct Duplicating Aerial FilmType SO-239 (Estar Base)Very. fine-grain film for one-step duplication of aerial reconnaissance negatives of highdefinition.
Base: 4-mil Estar polyester with static-resistant backing
Sensitivity: Blue-sensitive, direct-reversal material (no re-exposure necessary)
Resolving Power: T.O.C. 1000:1 560 lines/mmResolving Power: T.O.C. 1.6:1 200 lines/mm Kodak Versamat Developer 641
11.2 Color Films
Kodak Aerocolor Negative Film 2445 (Estar Base) is a high-speed, extremely fine grain, colornegative areial film. This film has a wide exposure latitude. 2445 film has improved color blance and isabout two f/stops faster than Kodak Ektachrome MS Aerographic Film 2448 (Estar Base) when 2448film is processed to a color negative. The 4-mil estar base is moisture resistant and provides goodflexibility, extremely good dimensional stability, and very high resistance to tear.
Kodak Aerocolor is used in low-to-medium altitude aerial mapping and aerial reconnaissancephotography for such applications as geological, pollution, archaeological, crop, and forestry studies,traffic control, city planning, railway, highway, and hydraulic engineering.
The use of color-compensating filters is not necessary. A Kodak Wratten filter HF-3, or KodakWratten filter No. 2B, may be used to reduce the effect of atmospheric haze.
Resolving Power:
11-4

Test-Object Contrast 1000:1 - 80 lines/mm
Test-Object Contrast 1.6:1 - 40 lines/mm
RMS Granularity Value - 14 (at a net density of 1.0)
Kodak Aerial Color Film (Estar Thin Base) SO-242 and Kodak Aerial Color Film (EstarUltra-Thin Base) SO-255 films are extremely fine-grain, slow-speed, high-definition, aerial colorreversal films, and have high contrast and good color saturation to decrease the effect of atmospherichaze. The photographic properties of these two films are identical. They are designed forhigh-altitude, stabilized-platform aerial cameras with high-quality optical systems. These films areideal for use in conjunction with Kodak High Definition Aerial Film 1414 (E star Ultra-Thin Base) andKodak High Definition Aerial Film 3414 (Estar Thin Base) in high-altitude aerial photographicsystems where both color and black-and-white aerial photography may be required.
Kodak SO-255 (Estar Ultra-Thin Base) can be used in applications where maximum spoolcapacity is required and minimum storage space is available.
Aerial Exposure Index - Daylight (no filter) - 2Effective Aerial Film Speed - Daylight (no filter) - 6Resolving Power:Test-Object Contrast 1000:1 - 200 lines/mmTest-Object Contrast 1.6:1 - 100 lines/mmRMS Granularity Value - 11
11.3 Reversal Color Films
Kodak Aerochrome Infrared Films 2443 and 3443 are "false color" reversal emulsions. They aredesigned for aerial photography and are useful for camouflage detection, agricultural and forestrywork, and remote sensing applications where infrared discrimination is required. With these films, ayellow filter, such as the Kodak Wratten filter No. 12, should be used.
Kodak Aerochrome Infrared Film 2243 has a 4-mil Estar Base with a fast-drying backing.Kodak Aerochrome Infrared Film 3443 has a 2.5-mil Estar Thin Base with a clear gel backing. Bothhave aerial exposure indices at 10.
Kodak Ektachrome Multispectral Aerographic Film 2448 (Estar Base) is a medium-speed colorreversal film used primarily for low and medium altitude mapping and reconnaissance. This filmproduces color transparencies which can be viewed directly or can be used for printing diapositiveplates. Aerial Exposure.Index - 6.
11.4 Duplicating Films
Kodak Ektachrome Aerographic Duplicating Film SO-360 is an extremely fine-grain,low-contrast, high-resolution, color reversal aerial duplicating film. This film is not intended formaking original exposures in an aerial camera.
SO-360 is used to make color duplicate transparencies of Kodak Ektachrome and Aerochromefilm originals from aerial surveying and reconnaissance photography.
11-5

This multilayer, color reversal film is color balanced so as to allow printing to be done bytungsten quality illumination that has a color temperature of approximately 3000 0K and appropriatecompensating filters.
Resolving Power:
Test-Object Contrast 1000:1 - 125 lines/mmTest-Object Contrast 1.6:1 - 63 lines/mmRMS Granularity - 8 (at a net density of 1.0)
11-6

CHAPTER 12
APPLICATIONS INCLUDING ISOLUMINOUS TECHNIQUES
The photographic procedures described in the foregoing chapters have dealt with therelationships between:
- image density and the associated brightness of the subject- image color and the reflectance characteristics of the subject
The exact relationships were seen to depend upon the spectral bands photographed and thecharacteristic curves of both the negative and positive images. However, on conventionalmultispectral photography, large brightness differences in the terrain frequently prevent detection ofsubtle color differences between objects. A special process called isoluminous photography has beendeveloped to eliminate this brightness problem in multispectral composite imagery.
This technique, as well as examples of multispectral photography for a variety of disciplines, isthe subject of this chapter.
12.1 Isoluminous Techniques
An isoluminous multispectral composite photograph is one in which all objects in the scene arepresented at the same brightness level. Hence, all color differences which appear on the isoluminousmultispectral photograph relate to differences in the spectral distribution of the terrain. Isoluminousdisplays are generated from a standard set of multispectral negatives using a photographic maskingprocess.
In order to illustrate the isoluminous procedure, a hypothetical set of characteristic curves ofthe blue (B), green (G), and red (R) negatives are shown in Figure 137. The x-axis represents the logintensity of the image-forming light and the y-axis the corresponding density. The gamma of the threenegatives is the same and the black, gray, and white objects will, naturally, image as the same densityon each negative. An object (labelled as "o" on the x-axis) which has color will exhibit a difference inthe intensity of the image-forming light in each spectral band. This results in a different density ineach of the three negatives denoted as D o, D , and DoL respectively.
Blue Negative (B) Green Negative (Gt Red Negative (R)
DW
Do2D1 DO
DB DB DB1 2 3 G
Blue Grey White- Blue Grey White Blue White
LOG I (Ergs/cm 2)
Figure 137. Characteristic Curves of the Red, Green & Blue Multispectral Negatives.
12-1

Initially, the characteristic curve of each multispectral record or band is examined and thestraight line portions are defined. Two achromatic or gray areas on the imagery (one in the highlights,D max, and one in the shadows, D min) are selected for brightness normalization. That is, these areasrepresent the range of densities which will be reduced to a common value in the final presentation.Small circular neutral density "chips" which exactly match the D min and D max values may bereproduced along with the image in each of the processing steps. These chips will eliminate thedifficulty associated with locating the exact "highlight and shadow" image areas for subsequentprocessing measurements. The only constraints placed upon the selection of the D min - D max areasis that both points must lie along the straight lines of the characteristic curves and the brightnessranges, A log E, of each set must be almost identical. This latter condition assures that the two areasare truly achromatic.
The second step of the process, shown in Figure 138, consists of producing a half gammapositive mask of each record in which the density range of the positive is only 50 percent of itscorresponding negative. Verification of this desired density range is easily made by measurement of
MASK B MASK G MASK R
DO/
-/2 Do, _ _ _ _ _ 72 /2
0 to -to
Figure 138. Characteristic Curves of Half Gamma Masks Produced from Multispectral Negatives.
the D min - D max chips off the positive masks. The negative of each multispectral record is thenregistered together with the two positive masks of the other bands to form friskets of three films each,as shown in figure 139. For example:
Negative Positive 1/2 Gamma MaskBlue Green and Red
PlusGreen Blue and RedRed Blue and Green
Precise exposure control is required for the accurate photometric printing of the positive masks.
12-2

The density relationships of the three negative-positive mask combinations are shown in Figure140. The horizontal line corresponds to the linear relationship of the brightness for any colorlessobject lying on the straight line portion of the characteristic curve. The density of object "o",however, is different on all three masked positives. When projected in an additive color viewer withthe masked blue positive projected as red, the image shown in Plate Xc results. Note that the grayscale on the dock has a uniform gray level. The sub-surface gray scale target is a uniform green colorbecause of the transmission characteristics of the water mass. The colored objects maintain theirvivid hue.
If neutral chips have been masked along with the imagery, they will have the same density valuesindicating that the D max - D min brightness differences have truly been eliminated from the photo.
Frisket consisting ofBlue M-S record &half gamma mask ofgreen & red records.
Frisket consisting ofGreen M-S record& half gamma masksof blue & red records.
Frisket consisting ofRed M-S record &half gamma masksof blue & green records.
Figure 139. Positive friskets which were additively projected as blue, green and red respectively toproduce color plate Xc.
12-3

MASKED POSITIVE B
B,W,
D1 Masked Positive Blue for M-S Record.
.9d--
B Masked Positive for Green M-S Record.
Do MASKED POSITIVE G
B,W, G
DoWG MASKED POSITIVE R3 W,G
G
Masked Positive for Red M-S Record.
R
Figure 140. Characteristic curves of negative half-gamma positive mask combination.
12.2 Applications
This section presents several examples of the multispectral photographic techniques for avariety of user applications. Reference will be made to the color plates which are in the center of thistext. No spectral reflectance curves have been given because the distributions of terrain objectschange as a function of the environmental conditions and site location. The reader is referred toChapter 7. for a thorough discussion of both spectra acquisition and data reduction.
12-4

APPLICATION - COASTAL ECOLOGY
Test Site Description
BARATARIA BAY, Louisiana. This area just east of Milligan Point possesses a variety ofmarsh grasses. The water is extremely turbid due to the shallow depths and the dredging operationswhich are constantly underway to keep the waterway open. Strong winds from the Gulf of Mexicocause a good deal of wave action in the area.
Targets to be Detected
- Spartina alternaflora- Black mangrove- Distilus spicata
Flight Information
Date: 12 April 1969Time: 1340 ESTAltitude: 4,500 feetWeather: CloudyFilm: EK #8403Filters: Red, blue, deep red, green
Processing - Negative
Record 1 2 3 4Gamma 2.6 2.0 3.0 2.3Minimum Density .19 .22 .21 .20
Processing - Positive
Record 1 2 3 4Gamma 2.5 2.1 2.6 2.0Minimum Density .29 .28 .34 .32
Ground Truth - See figure 141c
1 - Spartina alternaflora dieback
2 - Spartina alternaflora
3 - Distichlis spicata
4 - Black mangrove
12-5

Figure 141a
Spectral Band - RedPeak Wavelength - 700 nmPeak Transmission - 91%
2 Bandpass - 130 nmf/Number - 4 +.4 ND
Figure 141b
Spectral Band - Blue
Peak Wavelength - 430 nmPeak Transmission - 40%
21 Bandpass - 55 nmf/Number - 4
Analysis of Black and White Positives
-- The first record, namely red, was selected for its ability to speciate the various types of
marshland vegetation. The Spartina alternaflora, labelled as 1 and 2 on the ground truth, can be
readily detected on this record due to its texture. The lush alternaflora, labelled 2, along the water'sedge and in the middle of the marsh region is differentiated from the alternaflora labelled 1 which is a
dieback. Black mangrove, although not shown in the multispectral color composite of Plate IVa, isquite apparent in this record. The Distichlis spicata can readily be seen as a low density area in the red
record. The blue spectral band is of little use in differentiating between marshland species. This can
be seen by comparing the density of the Spartina alternaflora with the black mangrove area. This blue
record was somewhat overexposed in order to preserve the ground detail contained in it. Record #3,
which is a deep red spectral band, is as useful as Record #1 for typing marshland vegetation.
Although the water areas appear to be somewhat overexposed, one should note that the density of
area 2 is approximately the same as that of the first record. The fourth multispectral band, light
green, shows no apparent difference in the areas labelled 1 and 2 (Spartina alternaflora). The
processing was such that the density of area 2 is approximately the same as that of Records #1 and #3.
12-6

Figure 141c
Spectral Band - Deep RedPeak Wavelength - 700 nmPeak Transmission - 79%-2 Bandpass - 60 nm
f/Number - 4
Figure 141d
Spectral Band - Light greenPeak Wavelength - 515 nmPeak Transmission - 52%
2 Bandpass - 42 nmf/Number - 4
Viewing Filters
Record 1 2 3 4Filter Red Blue - GreenSaturation Level 65% 90% - 60%
Evaluation of Multispectral Color Composite
- The multispectral color rendition shown in Plate VIa was reproduced by the additivecombination of Records #1, #2, and #4 projected as red, blue, and green respectively. The diebackalong the shore, as well as the less lush alternaflora, is produced here as a desaturated cyan color,while the more vigorous alternaflora is presented as a magenta color. In the lower portion of PlateVIa the Distichlis spicata is shown as an achromatic shade. Such color combinations result frombalancing the brightness of each projection system. That is, the brightness of Records #1 and #3 weredecreased substantially, while the brightness through Record #2, projected as blue, was increasedconsiderably. This particular rendition was useful in the rapid assessment of the vigor of alternaflora.
12-7

APPLICATION - ESTUARINE ECOLOGY
Test Site Description
MISSISSIPPI RIVER DELTA. The area between Sawdust Bayou and South Pass possesses
extremely turbid water. Plankton blooms from the upland marshes flow into the estuarian system in
great profusion.
Targets to be Detected
- Plankton bloom
- Turbidity dispersion
Flight Information
Date: 12 April 1969Time: 1334 EST
Altitude: 4,500 feetWeather: CloudyFilm: EK #8403Filters: Red, blue, deep red, green
Processing - Negative
Record 1 2 3 4
Gamma 2.6 2.0 3.0 2.3
Minimum Density .19 .22 .21 .20
Processing - Positive
Record 1 2 3 4
Gamma 2.5 1.6 2.3 1.8
Minimum Density .13 .24 .13 .22
Ground Truth - See figure 142d
1 - Phytoplankton outpouring
2 - Area without water turbidity
3 - Phytoplankton dispersion
12-8

Figure 142a
Spectral Band - Red
Peak Wavelength - 700 nmPeak Transmission - 91%
1/2 Bandpass - 130 nm
f/Number - 4 + .4 ND
Figure 142b
Spectral Band - BluePeak Wavelength - 430 nmPeak Transmission - 40%
1/2 Bandpass - 55 nm
f/Number - 4
Analysis of Black and White Positives
- The presence of turbidity in the form of a phytoplankton bloom along the Mississippi RiverDelta is most obvious on the red spectral record. The minimum density is low and the contrast isexcellent. Also clearly visible in this band are differences in vegetation species, including diebacks
along the shoreline in alternaflora and black mangrove on the left portion of the photograph. The blue
spectral region is low in brightness level and has poor contrast.
It was necessary to overexpose this positive record in order to enhance the presence of the planktombloom. The deep red spectral band lacks the contrast of the first record for the land areas; thisparticular set of processing conditions was selected to enhance the water area and, in particular, theturbidity. The diffusion of the phytoplankton into the surrounding water mass is not nearly asapparent on this third record as it was in the first. The light green band has been overexposed as wasthe blue in order to increase the visibility of the phytoplankton outpouring and also to show thediffusion pattern of the plankton into the surrounding water mass. Less exposure caused the diffusionpattern to blend with the surrounding water.
12-9

Figure 142c
Spectral Band - Deep Red
Peak Wavelength - 700 nm
Peak Transmission - 79%
/2 Bandpass - 60 nm
f/number -4
Figure 142d
Spectral Band - Light greenPeak Wavelength - 515 nm
Peak Transmission - 52%
S2 Bandpass - 42 nm
f/Number - 4
Viewing Filters
Record 1 2 3 4
Filter Blue - Red Green
Saturation Level 90% - 85% 100%
Evaluation of Multispectral Color Composite
- The multispectral rendition shown in Plate VIb was generated by projecting Records #1,#3,
and #4 as blue, red, and green respectively. The phytoplankton bloom itself is most obvious in the
combined projection of Records #1 and #4. The reader should note the small changes in hue just
above the plankton outpouring; small differences in density caused by some unknown turbidity
apparent on Records #3 and #4 become visible as a yellow hue. It is interesting to note here that the
diffusion of the plankton into the surrounding water mass is not as obvious on the color rendition as it
was on the black-and-white. This is due to the saturation balance in the multispectral viewer which
was set in order to maximize the presence of the bloom itself.
12-10

APPLICATION - POLLUTION MONITORING
Test Site Description
Laurel Bay, South Carolina. This test site is on the Broad River near the Laruel Bay Naval
housing area. The effluent from a sewage treatment plant located at Laurel Bay Village invades the
small tributaries on its path to the river.
Targets to be Detected
- Pollution detection in river near sewage treatment plant.
Flight Information
Date: 15 July 1971Time: 1010 ESTAltitude: 7,800 feetWeather: ClearFilm: EK # 2424Filters: Light green, yellow, orange, infrared
Processing - Negative
Record 1 2 3 4Gamma 1.2 1.1 1.6 1.5
Minimum Density .5 .38 .27 .35
Processing - Positive
Record 1 2 3 4
Gamma 2.2 2.0 2.2 2.1
Minimum Density .45 .40 .31 .37
Ground Truth - See Figure 143a
1 - Effluent from sewage treatment plant in small stream
2 - Uncontaminated stream3 - Effluent outpouring into Broad River
12-11

Figure 143a
Spectral Band - Light GreenPeak Wavelength - 520 nmPeak Transmission - 80%12 Bandpass - 62 nm
f/Number - 4
Figure 143b
Spectral Band - YellowPeak Wavelength - 620 nmPeak Transmission - 80%12 Bandpass - 50 nmf/Number - 8
Analysis of Black-and-White Positives
- The first record (light green spectral band) shows good discrimination between area 1 whichis the effluent from the Laurel Bay Village sewage treatment plant and area 2 which is anuncontaminated stream approximately 150 yards upstream. This record was exposed and processedin order to maximize the density differences within the marsh. The presence of effluent outpouringinto Broad River in area 3 is also clearly apparent. Record # 2 (yellow) also shows good discriminationbetween the contaminated and uncontaminated streams and waters. The positive exposure andprocessing were again selected in order to maximize differences in the marshland areas; hence, alldetail in the deciduous foliage on the left portion of the photograph is lost. Record #3 (orange band)shows excellent detail in the heavy deciduous foliage to the left of the photograph and it is also helpfulin discriminating between marsh vegetation types. However, this band is relatively useless indifferentiating between the contaminated and uncontaminated stream. The high gamma in thisrecord, as well as the reflectance characteristics of the effluent, make its outpouring into Broad Riverinvisible in this band. The fourth spectral record, the near-infrared, also shows no differentiationbetween the streams labelled 1 and 2. Again, the absorption characteristics of the water mass in thisband do not permit any differentiation between the effluent outpouring and the background waters ofBroad River. Positive exposure is reasonably heavy in order to enhance detail in the marshland areas,
12-12

I Figure 143c
Spectral Band - OrangePeak Wavelength - 723 nmPeak Transmission - 86%/2 Bandpass - 35 nmf/Number - 6.3
Figure 143d
Spectral Band - Near infraredPeak Wavelength - 860 nm
_ Peak Transmission - 60%1/2 Bandpass - 120 nm
f/Number -- 9.4
Viewing Filters
Record 1 2 3 4
Filter Blue Red Green -Saturation Level 90% 95% 25%
Evaluation of Multispectral Color Composite
- The multispectral color presentation shown in Plate VIc was generated by a recombination
of Records #1, #2, and #3 as blue, red, and green respectively. The presence of uncontaminated waters
in the upper stream, best seen in Records #1 and #2, causes the characteristic magenta color. Also, the
low density of the water in these two records results in the off-shore river area being a saturated deep
magenta. The stream which has been polluted by the sewage treatment plant effluent is naturally
rendered black because of the high density characteristics of this area on each of the positive
multispectral records. The only real contribution of Record #3 is to make vivid the lush vegetation
which lies on the left portion of the photograph and to enhance some of the marshland growth between
the contaminated and the uncontaminated streams.
12-13

APPLICATION - MARSHLAND ECOLOGY
Test Site Description
CALLAWASSIE ISLAND, South Carolina. This region is located off the Colleton River, due
west of Port Royal Sound. It contains a large number of vegetation species in its extensive
marshlands. Tidal inundation is nominally 4.5 feet twice a day, the barren mud flats being exposed at
the ebb.
Targets to be Detected
- Distichlis sp.
- Typha sp.
- Juncus roemerianus
- Salicornia bigelovii
- Spartina alternaflora (less than 2 ft. high)- Spartina alternaflora (very lush)- Barren mud flats
Flight Information
Date: 15 July 1971Time: 1000 ESTAltitude: 7,800 feetWeather: ClearFilm: EK #2424Filters: Light green, yellow, orange, infrared
Processing - Negative
Record 1 2 3 4
Gamma 1.2 1.1 1.6 1.5
Minimum Density .5 .38 .27 .35
Processing - Positive
Record 1 2 3 4
Gamma 2.2 2.0 2.2 2.1
Minimum Density .45 .40 .31 .37
12-14

Figure 144a
Spectral Band - Light greenPeak Wavelength - 520 nmnPeak Transmission - 80%' Bandpass - 62 nmf/Number - 4
Figure 144b
Spectral Band - Yellow1Peak Wavelength - 620 nm
Peak Transmission - 80%/2 Bandpass - 50 nmf/Number - 8
Ground Truth - See figure 144b
1 - Distichlis spicata
2 - Typha sp.3 - Juncus roemerianus4 - Salicornia bigelovii5 - Spartina alternaflora6 - Spartina alternaflora (less than 2 feet high)7 - Spartina alternaflora (very lush)8 - Barren mud flat
Analysis of Black-and-White Positives
- The first multispectral record (light green) has been printed and processed not only forenhancement of the marshland areas, but also to maintain the detail in the upland vegetation.Processing to a higher gamma resulted in the areas labelled 1, 2, and 3 being on the shoulder of thecharacteristic curve. A decrease in exposure in order to reduce the density of the barren area between3 and 4 resulted in a loss of detail in the marsh. The second spectral band (yellow) has been printed
12-15

Figure 144c
Spectral Band - Orange
Peak Wavelength - 723 nm
Peak Transmission - 86%
1/2 Bandpass - 35 nm
f/Number - 6.3
Figure 144d
Spectral Band - Near infraredPeak Wavelength - 860 nm
Peak Transmission - 60%
1/2 Bandpass - 120 nm
f/Number - 9.4
and processed in order to maximize the differences between the marshland species without regard for
the upland vegetation towards the left. Discrimination between areas labelled 7 and 8 is quite good,
while no discrimination is apparent between 2, 5, and 6. Record #3 (orange) has been printed and
exposed in order to maximize the detail of the marshes between regions marked 1 and 6. Differences
between areas5 and 6 which were invisible on the second record are now present. The reflectance
between areas 7 and 8 is exactly opposite of what it was for band #2, i.e., area 7 has a higher
reflectance than area 8 in the orange region. One should also note that the extreme detail surrounding
area 8 which was present in the yellow spectral band is missing in the orange. The fourth record,
near-infrared, was processed also for the marshland areas; hence, all detail in the decidous foliage
lying on the left portion of the photograph is lost. No detail exists in areas marked 1, 2 and 3 since the
exposure placed these areas on the toe portion of the characteristic curve. Exposing this particular
record for the left-hand portion of the photograph rendered the marshland area a uniform gray.
Viewing Filters
Record 1 2 3 4
Filter Blue Green - Red
Saturation Level 100% 90% - 100%
12-16

Evaluation of Multispectral Color Composite
- The additive recombination of Records #1, #2, and #4 projected as blue, green, and redrespectively results in the composite image shown in Plate VId. Area 4 is seen as a grayish-tan color,area 5 is a brown-gray, area 6 is a blue-purple, area 7 is an orange, and area 8 is seen as a desaturatedblue. It is unfortunate that the three regions marked 1, 2, and 3 have not been imaged in thisparticular rendition. Nevertheless, each of the other species of marshland vegetation can be uniquelycategorized according to its particular color. Record # 3 was not used in this rendition because of itsextremely low brightness level and the small density differences which exist in the marsh region of thephoto.
12-17

APPLICATION - OCEANOGRAPHY
Test Site Description
HULL ISLAND, MASSACHUSETTS lies along south Boston Harbor, east of Dorchester
Bay. The area is surrounded by stony beaches and an underwater terrain which varies in depths
between 2 and 31 feet. The currents run at approximately 1.5 knots along the northern shore.
Targets to be Detected
- Subsurface terrain features.
Flight Information
Date: 8 October 1971Time: 0900 EDTAltitude: 18,000 feetWeather: ClearFilm: EK #2424Filters: Blue, green, orange, deep red
Processing - Negative
Record 1 2 3 4Gamma 2.3 1.98 1.78 1.3Minimum Density .41 .37 .44 .62
Processing - Positive
Record 1 2 3 4
Gamma 2.3 2.1 2.0 1.9Minimum Density .25 .21 .22 .30
Ground Truth - See figure 145b
A - 1-4 feet at mean low tide
B - Beach area
C - 5-10 feet at mean low tide
R - Rocks
12-18

Figure 145a
Spectral Band - BluePeak Wavelength - 440 nmPeak Transmission - 80%1/2 Bandpass - 65 nmf/Number - 8
Figure 145b
Spectral Band - greenPeak Wavelength - 553 nmPeak Transmission - 78%/2 Bandpass - 60 nm
f/Number - 5.6
Analysis of Black-and-White Positives
- The first multispectral record, exposed through a broad band blue filter, shows no shorelinedetail. Each of the four multispectral bands have been exposed, printed, and processed in order toenhance underwater and shoreline details. The lack of contrast in the land areas (for Record #1) is dueto the fact that the imagery was exposed only for sub-surface features. Record #2 (green) showsexcellent underwater detail, particularly in the lower portion of the photograph. Beachline areasappear to be as dense as the rock, primarily because the tide was in a mid-position and the watercovering both the B and R areas was approximately the same. The area labelled A lies between twoand four feet of water and can clearly be differentiated from the rock and beach, as well as the deeperwater at C. The positive was printed quite heavily in order to place the shadows on the straight line ofthe H & D curve. The third spectral region (orange) also shows good underwater detail out to a depthof approximately eight feet. Detail in the highlighted areas is also improved over the green andindicates that this record is probably the one most valuable for a compromise photograph betweenhighlights and shadows. The fourth multispectral record (deep red) is not nearly as valuable forsub-surface terrain features as Records #2 and #3. Detail in the land areas is vastly improved over theother three, with the high reflectance characteristics of the sandy shoreline being most obvious inRecords #3 and #4.
12-19

Figure 145c
Spectral Band - OrangePeak Wavelength - 620 nm
Peak Transmission - 80%1/2 Bandpass - 62 nmf/Number - 8
Figure 145d
Spectral Band - Deep RedPeak Wavelength - 683 nmPeak Transmission - 80%
/2 Bandpass - 31 nm
f/Number - 4
Viewing Filters
Record 1 2 3 4
Filter - Blue Green Red
Saturation Level - 100% 50% 80%
Evaluation of Multispectral Color Composite
- The additive recombination of Records #2, #3, and #4 projected as blue, green, and red
respectively result in the additive combination seen in Plate Vie. The highlighted areas are extremely
desaturated in order to increase the detail of the off-shore area and the small differences in sub-surface
terrain brightness. The beachland areas in this rendition are seen as pink; water which lies at a depth
of between two and four feet is a deep blue. Submerged rocks are a pinkish-blue hue, while the open
water tends to a desaturated blue. The shallow waters are a darker blue than the open waters because
in the case of the former we are actually looking at the sub-surface terrain. A small amount of
reflection from the open water surface has decreased the density of area C in the positive records. The
consequence of this is that the blue hue associated with the greater depth is considerably more
desaturated in the final multispectral rendition.
12-20

APPLICATION - HYDROLOGY
Test Site Description
DEER ISLAND LIGHT, MASSACHUSETTS lies in the center of President Roads in Boston
Harbor. A sewage dump exists just east of the light where the water is about 50 feet deep. This main
entrance to Boston Harbor is well channeled with currents running between 1.3 and 1.7 knots.
Targets to be Detected
- Salt/fresh water interface.
Flight Information
Date: 8 October 1971Time: 1310 EDTAltitude: 9,000 feetWeather: CloudyFilm: EK #2424Filters: Blue, deep red, infrared, infrared
Processing - Negative
Record 1 2 3 4
Gamma 2.3 1.98 1.78 1.3
Minimum Density .41 .37 .44 .62
Processing - Positive
Record 1 2 3 4
Gamma 2.3 2.1 3 4
Minimum Density .25 .21 .22 .30
Ground Truth - See figure 146b
1 - Fresh water flow2 - Salt water
12-21

Figure 146a
Spectral Band - Blue
Peak Wavelength - 440 nmPeak Transmission - 80%
2 Bandpass - 65 nm
f/Number - 5.6
Figure 146b
Spectral Band - Deep RedPeak Wavelength - 683 nmPeak Transmission - 80%2 Bandpass - 31 nm
f/Number - 2.8
Analysis of Black-and-White Positives
- The presence of a fresh/salt water interface off Deer Island in the Boston Harbor area ismost apparent using a broad band blue filter. Although the blue record appears to be very low inbrightness, any exposure less than that shown resulted in a "wash-out" of the distinct line betweenthe fresh and salt water. The deep red spectral band has been purposely exposed only for the wateredareas. In the lower-most portion of the photograph, one can see the tip of Long Island Head in whichthe beach areas containing bluffs and heavily wooded regions are completely washed out. Thepresence of the fresh water bloom is not nearly as apparent in the deep red as it was in the blue. Thenear-infrared band was exposed in a multispectral camera in the hope that the difference between thebiological growth contained in the fresh and the salt water would be maximized; however, this recordproved to be useless for this purpose. Equally poor is the near-infrared record whose peaktransmission is 860 nanometers. Alterations in both exposure time and processing conditions failed toenhance the interface here.
12-22

Figure 146c
Spectral Band - Near infrared
Peak Wavelength - 723 nm
Peak Transmission - 80%1/ Bandpass - 35 nm
f/Number - 2.8
Figure 146d
Spectral Band - Near infrared
Peak Wavelength - 860 nm
Peak Transmission - 60%
/2 Bandpass - 120 nm
f/Number - 2.8
Viewing Filters:
Record 1 2 3 4
Filter Red Green Blue -
Saturation Level 90% 90% 70%
Evaluation of Multispectral Color Composite
- Plate VIf has been rotated 90' in a counter-clockwise direction from the black-and-white
positives shown in Figure 146a through 146d. The particular additive presentation in Plate VIf
resulted from the recombination of Records #1, #2, and #3 projected as red, green, and blue
respectively. These blooms were only visible in Records #1 and #2 with the addition of red and green
yielding a yellow bloom. Record #3 was added strictly for balancing purposes; in the final rendition of
Plate VIf the salt water can be seen as an orange, while the relatively fresh water is a greenish-yellow.
The primary reason for the inclusion of Record # 3 was to render the cloud as a pure white in order to
differentiate it from the bloom itself. Had Record #3 been excluded, this clouded area would have
appeared as a very bright yellow leading an interpreter perhaps to falsely believe that it could be an
extension of the interface.
12-23

APPLICATION - GEOLOGYTest Site Description
GUNNISON HILLS between Willcox and Tucson, Arizona, has a gentle slope of about 10degrees, although isolated peaks do exist. Variations in terrain brightness caused by the reliefpatterns is clearly evident when overflying the region. It is sparsely covered with vegetation.
Targets to be Detected
- Alluvium- Shale- Dolomite- Limestone
Flight Information
Date: 9 March 1969Time: 1150 MSTAltitude: 10,000 feetWeather: CloudyFilm: EK #2424Filters: Blue, Green, Red, Infrared
Processing - Negative
Record 1 2 3 4Gamma .8 .93 .93 .85Minimum Density .5 .4 .38 .35
Processing - Positive
Record 1 2 3 4Gamma 1.61 1.7 1.76 1.7Minimum Density .52 .44 .4 .39
Ground Truth - See Figure 147a
L,S - limestone and abundant thin beds of shaleA - alluviumL, D - limestone, dolomite
12-24

SFigure 147a
Spectral Band - BluePeak Wavelength - 440 nmPeak Transmission -- 50%
2 Bandpass - 73 nmf/Number - 16
147b
Spectral Band - GreenPeak Wavelength - 530 nm
Peak Transmission - 54%'/2 Bandpass - 67 nmf/Number - 5.6
Analysis of Black-and-White Positives
- The first spectral record (blue) possesses a rather low, but uniform, reflectance in the bluespectral region. The dark areas at the upper portion of the photograph are shadows of clouds. Thismultispectral record required more exposure in the positive printing than the other three in order topreserve the small amount of detail that was present in the negative. The second multispectral recordwas exposed through a green filter and the area labelled A is distinctly brighter than that labelled L,D, or S. The dark region on the right portion of the photograph is due to shadow caused by the slopingterrain. The region on the right portion of the photograph is approximately 500 feet higher than thaton the left, and the white area on the right is a small peak. In the third multispectral record (red), theregions marked A, L, and D are nominally the same brightness, although a darker band does exist inthe A region. Again, the effect of shadow on the extreme right-hand side of the photograph can beseen. The fourth multispectral record (near-infrared) has approximately the same spectralcharacteristics as the red region, although the presence of the shadow on the right-hand portion of thephotograph is much more pronounced. In general, these four multispectral records were somewhatdifficult to process because of the extreme differences in brightness which existed across the image.Much of the higher reflecting alluvium and limestone fell along the toe portion of the characteristiccurve, especially in Records # 3 and #4, while the extreme right-hand portion of the photographexisted primarily along the shoulder portion.
12-25

Figure 147c
Spectral Band - RedPeak Wavelength - 700 nmPeak Transmission - 90%
1/2 Bandpass - 110 nmf/Number - 11
Figure 147d
Spectral Band - Near infraredPeak Wavelength - 850 nmPeak Transmission - 90%1/2 Bandpass - 190 nm
f/Number - 16
Viewing Filters
Record 1 2 3 4Filter Blue Green RedSaturation Level - 90% 100% 85%
Evaluation of Multispectral Color Composite
- In an effort to differentiate between alluvium, limestone, dolomite, and limestone shale,Plate VIIa was generated using a recombination of Records #2, #3, and #4 projected as blue, green,and red respectively. This is an approximation to Eastman Kodak's color infrared film. In Plate VIIasome color difference does exist between the left portion of the photograph and the center; however,the extreme right-hand section containing the peak is heavily shadowed and so low in brightness thatit is impossible to interpret what the composition of the soil might be. The isoluminous techniquediscussed in Section 12.1 was applied to this frame of data. The elimination of all brightnessdifferences results in Plate VIIb. Alluvium is a pale blue, while the limestone dolomite area in thecenter of the photograph is a pinkish hue with the shale and limestone on the right-hand portion of thephotograph being a deep cyan. One must remember that only differences in the spectral reflectance ofthe terrain are being imaged as colors in this rendition.
12-26

APPLICATION - GEOLOGY
Test Site Description
WHITE MOUNTAIN, east of Bishop, California. This area of rough terrain contains a variety
of deposits as well as a number of well-defined fault contacts. The mountains are sparsely covered
with shrubbery and trees; due to the summer heat, many of the larger streams had already dried up
by the beginning of August.
Targets to be Detected
- Sedimentary deposits- Volcanics- Fault contacts- Sand and Granite
Flight InformationDate: 5 August 1967Time: 1320 PDTAltitude: 28,000 feetWeather: ClearFilm: EK #5420Filters: Blue, green, red, infrared
Processing - Negative
Record 1 -2 3 4Gamma 1.2 1.9 1.8 2.0Minimum Density .16 .17 .11 .15
Processing - Positive
Record 1 2 3 4
Gama 1.5 2.0 1.8 1.6Minimum Density .17 .10 .11 .10
Ground Truth - See Figure 148d
Vol - Volcanic formationsSed - Sedimentary rocksG, S - Gravel, sandFault - Fault contacts
12-27

Figure 148a
Spectral Band - BluePeak Wavelength - 440 nmPeak Transmission - 50%1/2 Bandpass - 73 nm
f/Number - 8+ .1 ND
Figure 148b
Spectral Band - GreenPeak Wavelength - 530 nmPeak Transmission - 54%'/2 Bandpass - 67 nm
f/Number
Analysis of Black-and-White Positives
- The first record shown here is a broad band blue which traditionally lacks the contrast of theother records. It is, however, printed light for the purposes of color balancing and to increase theoverall brightness of the composite multispectral image on the rear projection screen. Somebrightness difference does exist, however, between the upper and lower portions of the image -volcanics and sediments respectively. The green spectral band contains both low minimum densityand excellent contrast characteristics. Brightness differences between volcanics and sediments alsoexist in this record. Detail on the right portion of the photograph is lost due primarily to the presenceof shadows. The red record shows very vividly the difference between volcanics and sediments. Theshadow patterns in the upper portion of the photograph (volcanics) are not nearly as distinct in thisrecord as in the green. This tends to enhance the overall difference between the two types of deposits.Notice that the blue, green, and red records have been processed such that the roadway running alongthe gravel and sand area has approximately the same density in each of the records. The infrared bandwas overexposed in the positive. This overexposure created greater densities which did not tend tomask any small differences which existed in the blue, green, and red spectral regions. Smalldifferences in isolated areas of the volcanic section are lost in this infrared record and appear to beapproximately as dense as the extreme right-hand portion of the photograph. Near-infraredreflectance for the sediments, as well as gravel and sand, is quite uniform.
12-28

Figure 148c
Spectral Band - RedPeak Wavelength - 700 nmPeak Transmission - 50%
1/2 Bandpass - 110 nm
f/Number - 5.6 + .2 ND
Figure 148d
Spectral Band - Near infraredPeak Wavelength - 850 nmPeak Transmission - 90%12 Bandpass - 190 nm
f/Number - 11 + .8 ND
Viewing Filters
Record 1 2 3 4
Filter Blue Green Red
Saturation Level 100% 100% 100%
Evaluation of Multispectral Color Composite
- The multispectral rendition of Plate VIIc has been produced by the recombination of
Records #1, #3, and #4 projected as blue, green, and red respectively. Volcanics are shown as a deep
orange, sedimentary deposits are a pinkish-gray, and the sand and gravel are a distinct white. The
extreme right-hand portion of the photograph did contain some volcanic rock which is a deep
blue-purple. The presence of the fault contacts is reasonably obvious in this multispectral rendition.
Plate VIId is a conventional color infrared photograph exposed simultaneously with the multispectral
imagery and processed by Data Corporation in Ohio. Little or no differentiation can be seen between
the volcanics and the sediments. The fault contacts, if detectable at all, are only obvious because of
the texture of the terrain.
12-29

APPLICATION - GEOLOGY
Test Site Description:
OWENS DESERT, north of Bishop, California, is identified as Bishop Tuff. This relativelyflat area has been extensively analyzed and maps have been generated showing the predominant
geologic features. The flood plain deposits contain large amounts of vegetation and standing water
bodies.
Targets to be Detected:
- Alluvium
- Non-Welded Tuff
- Partially-Welded Tuff
- Flood Plain Deposits
Flight Information
Date: 5 August 1967Time: 1235 PDTAltitude: 28,000 feetWeather: ClearFilm: EK #5424Filters: Blue, green, red, infrared
Processing - Negative
Record 1 2 3 4
Gamma 1.8 2.1 2.0 2.1Minimum Density .6 .17 .11 .15
Processing - Positive
Record 1 2 3 4
Gamma 1.8 2.1 2.0 2.1
Minimum Density .11 .11 .13 .12
Ground Truth - See Figure 149a
1 - Alluvium
2 - Non-welded tuff
3 - Partially-welded tuff
4 - Flood plain deposits
12-30

3 Figure 149a
SSpectral Band - Blue2 Peak Wavelength - 440 nm
Peak Transmission - 50%1/2 Bandpass - 73 nm
f/Number - 8 + .1 ND
2
Figure 149b
Spectral Band Green
Peak Wavelength - 530 nmPeak Transmission - 54%/2 Bandpass - 67 nmf/Number - 4
Analysis of Black-and-White Positives
- The blue band shows the usual lack of contrast in the overall scene. Only the area labelled 4(flood plain deposits) is apparently different from the surrounding alluvium, non-welded tuff, andpartially-welded tuff. The lack of detail in the blue record makes it suitable for either correcting thecolor balance of the final multispectral rendition or for increasing the overall brightness of thecomposite image. A set of color panels can be seen in the extreme upper portion of the photographabove the flood plain deposits. The green spectral record shows alluvium to be differentiated fromboth the flood plain deposits and the tuff areas. Excellent contrast and image detail are apparent inthis record. The lower brightness associated with the alluvium and the partially-welded tuff to theright of the flood plain deposits is due primarily to the presence of small shadows. The red spectralband lacks the detail and contrast in the non-welded tuff which was apparent in the green record.Although an increase in the red contrast would have enhanced the areas marked 1, 2, and 3, it waspurposely not increased to maintain the detail in the flood plain deposit area. Record #4,encompassing the near-infrared region, shows a marked difference in the flood plain deposits. The lushvegetation shows large infrared reflectance, while the surrounding geological areas are only as brightas that shown on the green spectral record. The processing of the four Bishop Tuff multispectralimages was such that reproduction of the gray scale adjacent to the color panels was the same on eachof the four images.
12-31

Figure 149c
Spectral Band - Red
Peak Wavelength - 700 nm
Peak Transmission - 50%1/2 Bandpass - 110 nm
f/Number - 5.6 + .2 ND
SFigure 149d
Spectral Band - Near infrared
Peak Wavelength - 850 nm
Peak Transmission - 90%
1/2 Bandpass - 190 nm
f/Number - 11 + .8 ND
Viewing Filters
Record 1 2 3 4
Filter - Green Blue Red
Saturation Level - 95% 70% 85%
Evaluation of Multispectral Color Composite
- The multispectral record shown in Plate VIIe is produced by an additive combination ofRecords #2, #3, and #4 projected as green, blue, and red respectively. This is a simulation of Eastman
Kodak's Ektachrome infrared film, while Plate VIIf is a conventional color infrared photograph taken
at exactly the same time as the multispectral. In Plate VIIe, the flood plain deposits have
considerably more detail in them than the conventional infrared image as does the partially-welded
tuff to the right of the flood plain deposit. The lack of color contrast in Plate VIIf is principally due to
the fixed exposure ratio between the dye layers of the tri-pack emulsion. Alluvium tends to a whitish
hue in both Plates VIIe and VIIf, while the non-welded tuff in Plate VIIe is a distinct yellow-green
compared to a gray-green for the partially welded tuff. No such differentiation is possible in the
conventional color infrared photograph of Plate VIIf.
12-32

APPLICATION - AGRICULTURE
Test Site Description
IMPERIAL VALLEY, CALIFORNIA, is located between the Salton Sea and the country ofMexico. It is a relatively flat terrain consisting of large tracts of cultivated land. It is surrounded bymountainous regions to the east and west.
Targets to be Detected
- Vegetation- Water- Soil
Flight Information
Date: 12 March 1969Time: 0828 PSTAltitude: 129 milesWeather: ClearFilm: EK #3400 and EK SO-246Filters: Green, red, infrared
Processing - Negative
Record 1 2 3 4Gamma 3.2 2.9 1.6 -Minimum Density .62 .20 .12 -
Processing - Positive
Record 1 2 3 4Gamma 3.16 2.64 2.64 -Minimum Density .12 .12 .14
12-33

Figure 150a
Spectral Band - Green
Peak Wavelength - 530 nmPeak Transmission - 54%S/2 Bandpass - 67 nm
f/Number - 4
Figure 150b
Spectral Band - RedPeak Wavelength - 700 nmPeak Transmission - 50%1/2 Bandpass - 110 nmf/Number - 4
Analysis of Black-and-White Positives
- The first multispectral record of this Apollo 9 frame (blue) was reprocessed in order todecrease the maximum density of the image, as well as pull up the contrast. Some resolutionri has beenlost due to the necessity of generating an intermediate negative; this positive is a third generationimage. The contrast of this blue record is lower than that of the red and infrared records due to thelarge column of air between the ground and the spacecraft. Increasing the gamma to that of the red orinfrared records resulted in a complete washout of the agricultural area south of the Salton Sea.Record #2, obtained through a broad band red filter, has excellent contrast and adequate positiveprinting exposure to maintain the density differences between the adjacent plots in the ImperialValley area. The small blocked out region is that area of terrain which has been enlarged 20X in thefollowing Figure 151. Although some large areas did fall on the shoulder of the characteristic curve,most exist along the straight line portion. The third multispectral record was exposed through abroad band near-infrared filter, namely 89B. The contrast and exposure is excellent for cropspeciation and the Mexican-American border can clearly be seen by the wide difference in terrainbrightness caused by the relative vigor of the crops.
12-34

Figure 150c
Spectral Band - Near infraredPeak Wavelength - 850 nmPeak Transmission - 90%1/2 Bandpass - 190 nm
f/Number - 16
The fourth camera of theApollo 9 multispectralarray contained a colorinfrared emulsion
The multispectral rendition shown in Plate VIIIb was produced by projecting the green band asred, the red band as blue and the near infrared band as green. In this enlargement, barley, alfalfa, andsugar beets can be differentiated, although the visual color difference between them is not particularlyobvious. The chormaticity diagram (shown in figure 152) shows the color separation between thecrops which was measured from the multispectral viewing screen. Color differentiation between cropsis possible from high altitudes using multispectral techniques.
Viewing Filters
Record 1 2 3 4Filter Red Blue GreenSaturation Level 80% 85% 90%
Evaluation of Multispectral Color Composite
- Plate VIIIa shows an additive recombination of the Apollo 9 multispectral imagery whichwas reprocessed by Long Island University. Records #1, #2, and#3 were recombined in additivesynthesis using red, green, and blue filters respectively. The classification of vegetation, soil, andwater in Plate VIIIa is reasonably apparent. Those areas which are green are vegetation, those areaswhich are brown are bare soil, and those presented as black are water.
12-35

Figures 151a, 151b and 151c are 20X enlargements of the green, red and near infrared bands for thesmall area of Imperial Valley shown in figure 150b. The ground truth, shown in figure 151a, is asfollows:
X - Alfalfa
* - Safflowero - Barley
.38
SUGAR.37 BE ETS __
.36 - kLFA 'FA
.35 _ "
S.34
.33 ,. __ - -
.32
.41 .45 .50 .55x
Figure 152: Chromaticity measurements of images of alfalfa, barley and sugar beets from the abovecolor rendition.
12-36

APPLICATION - AGRICULTURE
Test Site Description
NELSPRUIT, SOUTH AFRICA is located in the Low Veld of the northern Transveld. The
region is flat and dry requiring a large irrigation network to provide water to its citrus groves. This
area is one of the experimental agricultural test stations for South Africa.
Targets to be Detected
- Root rot in avocado trees
Flight Information
Date: October 1970Time: 1420Altitude: 2,000 feetWeather: ClearFilm: EK #2424Filters: Infrared, red, none, infrared
Processing - Negative
Record 1 2 3 4
Gamma 1.8 2.0 2.1 2.1
Minimum Density .10 .09 .11 .10
Processing - Positive
Record 1 2 3 4
Gamma 4.2 3.8 2.2 4.1
Minimum Density .10 .12 .08 .09
Ground Truth - See figure 153b
Small groups of avocado trees infested with root rot disease have been marked.
12-37

Figure 153a
Spectral Band - Near infraredPeak Wavelength - 850 nmPeak Transmission - 70%1/2 Bandpass - 38 nm
f/Number - 8
Figure 153b
Spectral Band - RedPeak Wavelength - 625 nm
%,, Peak Transmission - 50%12 Bandpass - 43 nm
f/Number - 5.6
Analysis of Black-and- White Positives
- These four multispectral images have been exposed, printed, and processed very well for theoverall scene. The infestation of avocado root rot disease is not visually detectable. As a result thecircled clusters of trees in the grove do not appear to be any less or more dense than the healthy treessurrounding them. An examination of the color plates associated with this black-and-white frame willindicate that pre-visual detection of this infestation is not possible using conventional multispectralviewing techniques. Special processes, however, have been developed in order to provide the observerwith a pre-visual detection of the infestation. Examination of these black-and-white images showsthat those trees which have been diseased are generally not as vigorous and do not have the crown sizeof those which are healthy.
12-38

Figure 153c
Spectral Band -Peak Wavelength -
Peak Transmission -1/2 Bandpass -
f/Number - 16
Figure 153d
Spectral Band - Near infraredPeak Wavelength - 725 nm
Peak Transmission - 80%
12 Bandpass - 31 nm
f/Number - 8
Viewing Filters
Record 1 2 3 4
Filter Green Green Red
Saturation Level 100% 30% - 70%
Evaluation of Multispectral Color Composite
- The multispectral rendition shown in Plate VIIIc was reproduced using a combination of
Records #1, #2, and #4 projected as green, green, and red respectively. Bands 1 and 2 were both
projected as green in an effort to enhance the diseased trees. Unfortunately, however, the pre-visual
detection using conventional multispectral techniques was not possible in this particular rendition.
However, Plate VIIId was reproduced using an isoluminous procedure and the diseased trees are
fairly obvious as red, while those that are healthy are yellow. Previsual detection is possible using a
differential masking technique, in spite of the fact that it is not at all obvious on conventional
multispectral imagery. The reader should note that exactly the same negatives were used to produce
Plates VIIIc and VIIId; the additional enhancement associated with Plate VIIId is a result of
processing only.
12-39

APPLICATION - AGRICULTURE
Test Site Description
DAVIS, is an Agricultural Experimental Test Station associated with the University of
California, just west of Sacramento. The area is characterized by the cultivation of a wide variety of
agricultural crops, many of which are at different stages of vigor and maturity. The area has been
extensively analyzed and excellent ground truth is available for most of it.
Targets to be Detected
- Alfalfa- Corn- Barley- Tomatoes
Flight Information
Date: 20 July 1969
Time: 1425 PDTAltitude: 15,000 feetWeather: ClearFilm: EK #5424Filters: Blue, green, red, infrared
Processing - Negative
Record 1 2 3 4
Gamma 1.0 1.0 1.0 .98
Minimum Density .02 .17 .09 .22
Processing - Positive
Record 1 2 3 4
Gamma 1.7 1.4 1.1 1.5
Minimum Density .15 .2 .16 .18
Ground Truth - See figure 154b
S- SafflowerC - CornBS Bare SoilN - BeansA AlfalfaR - RyeB- BarleyE - Tomatoes
12-40

Figure 154a
Spectral Band - BluePeak Wavelength - 440 nmPeak Transmission - 50%1/2 Bandpass - 73 nm
f/Number - 16
Figure 154b
Spectral Band - GreenPeak Wavelength - 530 nmPeak Transmission - 54%
4/ Bandpass - 67 nmf/Number - 16
Analysis of Black-and-White Positives
- Record #1, taken through a broad band blue filter, shows the usual lack of contrast; this isdue to the fact that the imagery was taken at an altitude of 15,000 feet at 2:30 in the afternoon and thepresence of haze was obvious, although the day was clear. Increasing the printing exposure in order toenhance the darker areas of the photograph would have resulted in an increase in the minimumdensity or the addition of an overall gray to the photograph. Record #2, exposed through the greenspectral region, has good contrast; this can be seen by examining the white and black areas on theright-hand portion of the photograph. This record was purposely printed on the heavy side in order toreduce the overall brightness of the crops in the green spectral region. Since what we are looking for inmultispectral photography are density differences between objects of interest, it is not desirable thatany one spectral band predominate in brightness over the other three. The third multispectral record,exposed through a broad band red filter, shows excellent contrast and large density differencesbetween the crops in the area. It should be noted that each of these records was exposed and processedso that the gray panels on the ground appeared neutral when recombined in true color on themultispectral viewer. The typical high reflectance in the near-infrared spectral region for lush cropscan be seen in the black-and-white positive print of the fourth spectral record. An example of goodfilter selection is apparent upon examination of Records #4 and #3. If one looks at the bare soil area inthe lower center portion of the photograph on the near-infrared record, it is a darkish gray. In Record#3 the same bare soil plot has a very low density. Compare these to the alfalfa which lies diagonally to
12-41

Figure 154c
Spectral Band - RedPeak Wavelength - 700 nm
Peak Transmission - 50%
1/2 Bandpass - 110 nm
f/Number - 16
Figure 154d
Spectral Band - Near infrared
Peak Wavelength - 850 nm
Peak Transmission - 90%
1/2 Bandpass - 190 nmf/Number - 16
the right of this bare soil field; in- the near-infrared record this alfalfa stand is a very low density,
whereas on the red record it is black. This density reversal from one band to the next additively
produces two areas which are widely separated in color.
Viewing Filters
Record 1 2 3 4
Filter - Blue Green Red
Saturation Level - 100% 50% 18%
Evaluation of Multispectral Color Composite
- The multispectral rendition shown in Plate VIIIe is a simulation of color infrared film
reproduced by the combination of Records #2, #3, and #4 projected as blue, green, and red
respectively. A good many of the crops contained in this photograph can be differentiated on the basis
of their color without any auxiliary equipment. It was necessary, however, in differentiating corn,
alfalfa, and tomatoes to use a colorimeter in order to chromatically separate the individual crops.
These measurements are shown in the chromaticity diagram (figure 155) and extensive measurements
throughout the roll film showed that all alfalfa, barley, corn and tomatoes fell within the convex sets
shown in the diagram.
12-42

0.8 - 520
510 540
5600.6
-500
580
0.4 -00
490
0.2 -
480
460
0.2 0.4 0.6
Figure 155. Chromaticity diagram showing convex polygon for different crop measurements in colorrendition shown in Plate VIIIe.
12-43

APPLICATION - AGRICULTURE
Test Site Description
IMPERIAL VALLEY, CALIFORNIA lies in the extreme south-central part of California. The
valley extends from the Salton Sea on the north to the Mexican border on the south and has an areal
extent of about 4500 square miles. With almost a half million acres of cropped land, the Imperial
Valley is the largest single area of irrigated agriculture in the Western Hemisphere.
Targets to be Detected
- Alfalfa or rye grass- Cotton- Sorgum- Bare soil
Flight Information
Date: 29 July 1969Time: 1520 PDTAltitude: 17,500 feetWeather: ClearFilm: EK #5424Filters: Infrared, red, green, blue
Processing - Negative
Record 1 2 3 4
Gamma 1.5 1.85 .98 1.67
Minimum Density .12 .19 .10 .20
Processing - Positive
Record 1 2 3 4
Gamma 3.1 3.0 3.2 2.2
Minimum Density .27 .29 .31 .34
Ground Truth - See figure 156b
A,R - alfalfa or rye grassB - bare soilC - cottonS - sorgum
12-44

Figure 156a
Spectral Band - InfraredPeak Wavelength - 850 nmPeak Transmission 90%
2 Bandpass - 190 nmf/Number - 16
Figure 156b
Spectral Band - RedPeak Wavelength - 700 nmPeak Transmission - 50%12 Bandpass - 110 nm
f/Number - 4 + .2 ND
Analysis of Black-and-White Positives
- Each of the four multispectral records for this frame of data have been somewhatoverexposed in order to preserve the detail in the areas labelled alfalfa, or rye grass, and barley. Thecontrast was increased for each record to the point where the densest regions fell along the shoulder ofthe characteristic curve. The differences in spectral reflectance between the crops for the narrow bandfilters used were widely different so that it was difficult, at best, to place all the crops in each of therecords along the straight line portion. Only the blue spectral region possesses an overall set ofdensities which could be placed along the straight line. The horizontal lines in Records #2 and #4 arestatic marks caused by the use of an acetate base film.
12-45

Figure 156c
Spectral Band - GreenPeak Wavelength - 530 nmPeak Transmission - 54%
2 Bandpass - 67 nm
f/Number - 2.5
Figure 156d
Spectral Band - BluePeak Wavelength - 440 nm
Peak Transmission - 50%1/2 Bandpass - 73 nmf/Number - 8
Viewing Filters
Record 1 2 3 4
Filter Red Green Blue -
Saturation Level 95% 90% 70%
Evaluation of Multispectral Color Composite
- The multispectral rendition shown in Plate VIIIf was produced with the additive
combination of Records #1, #2, and #3 projected as red, blue, and green respectively. Here, safflower
tends to a reddish-orange, corn is a vivid red, while alfalfa or rye grass on the upper portion of the
photo is a red-magenta. The alfalfa or rye grass shown in the lower left-hand portion of the
photograph was sparse and spotty and accurate chromatic measurement of this area was not possible.
Barley was additively presented as a pure gray.
12-46

APPLICATION - FORESTRY
Test Site Description
YOSEMITE VALLEY, CALIFORNIA. This area is located in the center of the Yosemite
National Park. A variety of conifers and hardwoods make up the bulk of the vegetation. Lush meadow
areas exist, generally adjacent to the rapid flowing streams.
Targets to be Detected
Yosemite
- Coniferous forest stands (pine, incense cedar)- Hardwood trees (oak)
Flight Information
Date: 21 July 1969Time: 1120 PDTAltitude: 9,500 feetWeather: ClearFilm: EK #2424Filters: Infrared, green, red, infrared
Processing - Negative
Record 1 2 3 4Gamma 2.2 2.0 1.8 .48Minimum Density .32 .11 .10 .21
Processing - Positive
Record 1 2 3 4Gamma 1.03 1.3 1.8 2.0
Minimum Density .19 .07 .08 .09
Ground Truth - See figure 157d
P - Pine
O - OakI - Incense cedar
12-47

Figure 157a
Spectral Band - Near infraredPeak Wavelength - 754 nmPeak Transmission - 84%1/2 Bandpass - 39 nmf/Number - 5.6
Figure 157b
Spectral Band - GreenPeak Wavelength - 553 nmPeak Transmission - 52%1/2 Bandpass - 46 nmf/Number - 2.5 + .1 ND
Analysis of Black-and-White Positives
- The first multispectral record exposed in the near-infrared portion of the spectrum showsexcellent differentiation between hardwood and conifers. Although the exposure was somewhat on theheavy side, the hardwood trees are quite obvious, especially in the right-hand portion of thephotograph. Record #2, exposed through a green filter, has been printed and processed in order tomaximize any small differentiation which may exist between the conifers and hardwoods at the uppercenter portion of the photograph. Nevertheless, there was little spectral difference between these treetypes in the green region. The third multispectral record (red) has been exposed and processed for theoverall scene because little or no differentiation was possible between hardwoods and conifers in thisrecord. This band does, however, give a substantial amount of detail in the grass meadowland in thecenter of the photo. The fourth multispectral record (a second near-infrared band) has been exposedand processed for the center portion of the photograph. The discrimination between hardwoods andconifers is not as distinct as it was in the first multispectral record and much of the detail which waspresent in Record #3 in the grassy area in the center has been lost. It may be concluded from anexamination of these four bands that the two infrareds are the best selection for differentiatingbetween the two types of forest stands. When an image such as Record #1 is projected as green andRecord #3 is projected as red, there results a chromatic differentiation produced by the densitydifferences between the photos. Also, the detail which was not present in Record #1 of the grassyareas will become apparent when projecting Record #3. Differentiation between two types of conifers,namely pine and incense cedar, is not plainly obvious on any of these multispectral images.
12-48

Figure 157c
Spectral Band - RedPeak Wavelength - 682 nm
Peak Transmission - 80%
1/2 Bandpass - 31 nm
f/Number - 4
Figure 157d
Spectral Band - Near infrared
Peak Wavelength - 849 nm
Peak Transmission - 70%
A2 Bandpass - 38 nm
f/Number - 4 + .2 ND
Viewing Filters
Record 1 2 3 4
Filter Green Red Blue -
Saturation Level 100% 100% 100% -
Evaluation of Multispectral Color Composite
The false color multispectral rendition shown in color Plate IXa, was produced by projecting
records 1, 2 & 3 as green, red and blue, respectively. The deciduous trees are a vivid pea green
because:- they reflect heavily in the near infrared (projected as green)
- they possess the characteristic green color (projected as red)
Since the infrared reflectance is greater than the green, the resultant additive color for these trees is
brown, brownish purple and brownish red. It is not possible to differentiate between the incense cedar
and the pine.12-49

APPLICATION - FORESTRY
Test Site Description
MEADOW VALLEY, Bucks Lake. This region contains areas which are primarily covered with
either high density conifers or meadow hardwoods. The Bucks Lake area is a forestry test site. The
ground truth associated with it is very complete.
Targets to be Detected
- High-medium density conifers- Low density conifers
- Meadow and Riparian hardwoods
- Rock, water
Flight Information
Date: 21 July 1969Time: 1330 PDTAltitude: 19,000 feetWeather: ClearFilm: EK #5424Filters: Infrared, red, green, blue
Processing - NegativeRecord 1 2 3 4Gamma 2.2 2.0 1.8 .48Minimum Density .32 .11 .10 .21
Processing - Positive
Record 1 2 3 4Gamma 1.03 1.3 1.8 2.0Minimum Density .19 .07 .08 .09
Ground Truth - See figure 158d
1 - Medium-high density conifers2 - Low-density conifers
4 - Meadow and riparian hardwoods
5 - Bare soil and rock
12-50

Figure 158a
Spectral Band - Near infraredPeak Wavelength - 850 nm
Peak Transmission - 90%
1/2 Bandpass - 190 nm
f/Number - 16
Figure 158b
Spectral Band - Red
Peak Wavelength - 700 nmPeak Transmission - 50%
1/2 Bandpass - 110 nm
f/Number - 4 + .2
Analysis of Black-and-White Positives
- Multispectral Record #1 (near-infrared) has been well-exposed and processed for the twomajor types of vegetation in the area (conifers and hardwoods). The extreme spectral absorption ofnear-infrared radiation by water masses makes the stream in the upper portion of this photographdistinctly vivid. The three vertical lines at the bottom of this multispectral band were caused by staticin the camera. This is primarily due to the use of an acetate-base film. Such static markings appear indry climates at high altitudes using this particular film base. Near-infrared sensitive emulsionsdeveloped since 1969, however, use an estar base which is not prone to building up a static charge onit. The second multispectral record (red) has been processed to a gamma such that the detail in thevegetation has been placed on the straight line portion of the characteristic curve. The exposure issomewhat heavy in areas labelled 1 in order to maintain the detail in the areas labelled 4. The thirdspectral band (green) has also been processed to a reasonably high gamma to increase the colordifferentiation between the vegetation groups. Slight overexposure in the positive was necessary inorder to maintain detail in areas labelled number 4. The general effect of increasing the exposureconsists of lowering the resultant screen brightness on the multispectral viewer. Nevertheless it is thebest compromise between scene brightness and image detail. The fourth multispectral record (blue)has been processed (as the infrared has) to a nominal gamma since both the conifers and the
hardwoods reflect approximately the same; all vegetation appears on the straight line portion of thecharacteristic curve. The apparent lack of contrast is the result of areas 1 and 4 having a relativelysmall difference in density between them.
12-51

Figure 158c
Spectral Band - GreenPeak Wavelength - 530 nmPeak Transmission - 54%1/2 Bandpass - 67 nm
f/Number - 2.5
Figure 158d
Spectral Band - BluePeak Wavelength - 440 nm
Peak Transmission - 50%12 Bandpass - 73 nmf/Number - 8
Viewing Filters
Record 1 2 3 4
Filter Green Red Blue -
Saturation Level 66% 66% 66%
Evaluation of Multispectral Color Composite
- The additive rendition shown in Plate IXb is a result of recombining Records #1, #2, and #3
as green, red, and blue respectively. The low image density values on Record #1 for the areas marked 1
renders them a deep green in Plate IXb. Wide differences in color existed in areas marked 4, meadow
and riparian hardwoods; they reproduced as a deep brown to a pink or a very light green. The low
density conifers can easily be seen as the dark green against a pinkish background; the dark green
results from the vegetation itself, while the pink background is the soil which surrounds them.
12-52

APPLICATION - FORESTRY
Test Site Description
BUCKS LAKE, California. This area is heavily forested with stands of dense conifers. Some
riparian and meadow hardwoods exist between these areas as well as lush meadowlands.
Targets to be Detected
- High density conifers- Meadow and riparian hardwoods- Water
Flight Information
Date: 21 July 1969Time: 1250 PDTAltitude: 18,000 feetWeather: ClearFilm: EK #2424Filters: Infrared, red, green, blue
Processing - Negative
Record 1 2 3 4
Gamma 2.2 2.0 1.8 .48
Minimum Density .32 .11 .10 .21
Processing - Positive
Record 1 2 3 4Gamma - - - -
Minimum Density .19 .07 .08 .09
Ground Truth - See figure 159d
1 - Medium-high density conifers2 - Low-density conifers4 - Meadow and riparian hardwoods Preceding page blank6 - Water
12-54

Figure 159a
Spectral Band - Near infraredPeak Wavelength - 850 nmPeak Transmission - 90%12 Bandpass - 190 nm
f/Number - 16
Figure 159b
Spectral Band - RedPeak Wavelength - 700 nmPeak Transmission - 50%12 Bandpass - 110 nm
f/Number - 4 + .2 ND
Analysis of Black-and-White Positives
- The exposure and processing of the first record (near-infrared) is optimal for imaging of bothconifers and hardwoods. Some increase in exposure would have picked up the detail in the areaslabelled 4; however, this would only be accomplished at the sacrifice of detail in the areas labelled 1and 2. In this particular record, the low-density conifers are somewhat difficult to see and an increasein the minimum density would have rendered them approximately the same as areas labelled 1. InRecord #2 (red), we see a vivid difference between the medium-to-high density conifers and thelow-density conifers. The exposure for this record is light, but this was purposely done in order topreserve the detail which existed in the negative for area #4 on the right-hand portion of thephotograph. The third spectral band (green) has been exposed principally for the hardwood sites inthe center portion of the photograph. Increasing the contrast in order to maximize the densitydifference between areas 1 and 4 resulted in the high density conifers at the edges of the photographsto fall on the low shoulder portion of the characteristic curve. Record #4, exposed through a broadband blue filter, shows that little or no spectral difference exists between the hardwoods in site 4 andthe high-density conifers labelled 1. It was interesting to note that on the blue record some waterdetail was visible in the negative, although processing conditions for this set of multispectral recordsdid not permit enhancement of this area.
12-55

Figure 159c
Spectral Band - Green
Peak Wavelength - 530 nm
Peak Transmission - 54%
1/2 Bandpass - 67 nm
f/Number - 2.5
Figure 159d
Spectral Band - Blue
Peak Wavelength - 440 nm
Peak Transmisson - 50%
1/2 Bandpass - 73 nm
f/Number - 8
Viewing Filters
Record 1 2 3 4
Filter Blue Red Green -
Saturation Level 50% 70% 70%
Evaluation of Multispectral Color Composite
- The multispectral rendition, as shown in Plate IXc, has been produced by a recombination of
Records #1, #2, and #3 projected as blue, red, and green respectively. All sites labelled as 1 are
predominately a bluish color owing to the low image density of the #1 record. The low-density conifers
of area 2 can be seen as a spotted blue color against a bluish-yellow background which represents the
soil. The meadow and riparian hardwoods lie between a light blue and a blue-yellow hue because of the
background soil. All watered areas are black owing to the high absorption of the radiation in each
spectral region. The deep blue associated with the high-density conifers on the extreme right-hand
portion of the photograph is some indication of the closeness of the stands. The compactness of the
trees in any given areas can be measured colorimetrically by using a large aperture (4mm) on a
colorimeter sensing head. In regions where the conifers are tightly packed together, the color will be a
pure hue as shown in Plate IXc, right side. In regions where the conifers are less dense, the color will
be some combinaton of the soil and vegetation hues as shown in the center of Plate IXc.
12-56

APPLICATION - FORESTRY
Test Site Description
BUCKS LAKE, California. This region of the Bucks Lake forestry test site contains a wide
variety of conifers and hardwoods. A large amount of bare soil and rock is present adjacent to the
small bodies of water.
Targets to be Detected
- High density conifers- Brush and meadow hardwoods- Soil and rock- Water
Flight InformationDate: 21 July 1969Time: 1320 PDTAltitude: 19,000 feetWeather: ClearFilm: EK #2424
Filters: Infrared, red, green, blue
Processing - Negative
Record 1 2 3 4
Gamma 2.2 2.0 1.8 .48
Minimum Density .32 .11 .10 .21
Processing - Positive
Record 1 2 3 4
Gamma 1.03 1.3 1.8 2.0
Minimum Density .19 .07 .08 .09
Ground Truth - see figure 160d
1 - Medium-high density conifers3 - Brush and dry site hardwoods4 - Meadow and riparian hardwoods5 - Bare soil and rock6 - Water
12-57

Figure 160a
Spectral Band - Near infraredPeak Wavelength - 850 nm
Peak Transmission - 90%/2 Bandpass - 190 nm
f/Number - 16
Figure 160b
Spectral Band - RedPeak Wavelength - 700 nmPeak Transmission - 50%
2 Bandpass - 110 nmf/Number - 4 + .2 ND
Analysis of Black-and-White Positives
- The positive printing exposure and processing of each of these four multispectral records isexcellent for the targets under consideration. The tonal values of spectral band #1 (near-infrared) aredistinctly different from the other three, especially in the areas labelled as 3, 4, and 5. The shorthorizontal lines which can be seen on the right portion of Records #1 and #3 are static marks in thenegative itself. These static marks are generally visible when one flies at high altitudes in dry climatesusing a film emulsion having an acetate base.
12-58

Figure 160c
Spectral Band - GreenPeak Wavelength - 530 nm
Peak Transmission - 54%
1/2 Bandpass - 67 nm
f/Number - 2.5
Figure 160d
Spectral Band - BluePeak Wavelength - 440 nm
Peak Transmission - 50%
1/2 Bandpass - 73 nm
f/Number - 8
Viewing Filters
Record 1 2 3 4
Filter Red Green Blue -
Saturation Level 100% 55% 90% -
Evaluation of Multispectral Color Composite
- The color infrared simulation shown in Plate IXd was created by recombining Records #1,
#2, and #3 as red, green, and blue respectively. All water areas are black. Bare soil and rock tend to a
very desaturated blue, while brush and dry hardwoods, as well as meadow and riparian hardwoods,
are a pinkish-red. Medium-to-high density conifers exist as a deep magenta surrounded by some blue
soil showing through the trees.
12-59

APPLICATION - HYDROLOGY
Test Site Description
MONTAUK POINT, NEW YORK, lies at the easternmost tip of Long Island. A large amountof shoreline erosion and build-up occurs during the year due to storms and high winds. Waters on thenorth side of the point are rather turbid; most suspended materials consists of amorphous vegetativesubstances and silt.
Targets to be Detected
- Maximum depth to which submerged test panels are visible in turbid northern waters.- Surface and submerged targets visible on same multispectral reconstituted image.
Flight Information
Date: 7 October 1967Time: 1005 EDTAltitude: 1000 feetWeather: ClearFilm: EK # 2403Filters: None, red, green, blue
Processing - Negative
Record 1 2 3 4Gamma 1.7 1.8 1.6 1.5Minimum Density .23 .48 .32 .64
Processing - Positive
Record 1 2 3 4Gamma 1.1 .7 .8 1.0Minimum Density .32 .12 .11 .12
Ground Truth - see figure 161a and ca - yellowb - bluec - red
d - greene - whitef- gray (64% reflectance)
g- gray (32% reflectance)h - gray (16% reflectance)I - gray ( 8% reflectance)
j - black
12-60

Figure 161a
Spectral Band - no filterPeak Wavelength -Peak Transmission -!/2 Bandpass -
f/Number - 2.8
Figure 161b
Spectral Band - BluePeak Wavelength - 440 nmPeak Transmission - 50%1/2 Bandpass - 73 nm
f/Number - 2.8
Analysis of Black-and-White Positives
- The first image contains no filters and the positive exposure placed the highlights (thetargets on the pier) on the straight line portion of the H and D curve. The readers's attention is calledto the fact that target number A has the shadow of a building falling across one corner of it. Record#2, exposed through a broad band blue filter, was processed to place both the highlights and shadowareas (targets submerged twelve feet off the pier) on the straight line portion of the characteristiccurve. This, however, was not successful; only the white panel of the submerged target array isvisible. The remaining submerged targets are on the shoulder of the characteristic curve, while mostof the surface targets lie along the toe portion of the curve. Only the red and green, as well as thedeepest gray and black targets, lie on the straight line portion. Multispectral record #3, exposedthrough a green broad band filter, was processed in order to place the shadow areas on the straightline portion of the characteristic curve; hence most of the highlighted areas (the pier and the targetson it) lie along the toe of the curve. A comparison between this band and the first record whichcontains no filter indicates very clearly that one is required to process and expose the positivemultispectral imagery such that the targets of interest, i.e., highlights or brightness, fall along thestraight line portion without regard for other objects in the scene. The fourth band exposed throughthe broad band red filter was also processed as a compromise between the highlights and shadows.The result of doing this yields an image which has detail in neither region.
12-61

Figure 161c
r Spectral Band - GreenPeak Wavelength - 530 nmPeak Transmission - 54%1/2 Bandpass - 67 nmf/Number - 2.8
Figure 161d
Spectral Band - RedPeak Wavelength - 700 nmPeak Transmission - 50%1/2 Bandpass - 110 nm
f/Number - 2.8
Viewing Filters
Record 1 2 3 4Filter - Blue Green RedSaturation Level - 100% 50% 100%
Evaluation of Multispectral Color Composite
- The conventional true color multispectral rendition shown in Plate Xa was reproduced usingRecords #2, #3, and #4, the positives having been reprocessed only for the highlighted areas. Oneshould note that the yellow target on the left side of the pier is covered by a shadow and thelow-brightness green target appears black. Reprocessing for highlights has also caused the twodarkest panels in the gray scale to be non-differentiable. Plate Xb shows the same multispectralrecords (as Plate Xa) reprocessed for the shadowed areas only. Here the submerged targets array can
clearly be differentiated one from the other; however, the panels on the surface (in the highlights) arecompletely washed out. The isoluminous technique was applied to this frame and is shown in PlateXc. Note that each of the color panels on the surface possesses its own color and the effect of theshadow falling across the yellow target has been completely eliminated in this rendition. Also the grayscales are of a somewhat uniform nature owing to the fact that all brightness differences in the scenehave been eliminated. Only differences in the spectral distribution of the terrain objects are imaged ascolors.
12-62

CHAPTER 13
MISSION PLANNING
To effectively collect multispectral photo imagery, it is important to plan the flight in a way
which will satisfy the specified mission objectives and ensure that unnecessary labor and man-hours
are not consumed by the project.
Once the intended use of the photography has been defined, it is necessary to determine the
required characteristics of the imagery. The planning can then be carried forward by selecting from
the available sources photographic equipment and materials which, in a practical and economic way,
most nearly fulfill the requirements for the project under consideration. It is emphasized that a careful
estimation of the time required to complete the flight mission is essential owing to the high costs
which will be incurred.
While the requirements for both camera and film vary with the types of imagery desired, the
exact interpretative task determines such factors as resolution and filters. The time of flight is
selected to either minimize or maximize such factors as shadows and sunspot glare, while taking the
best advantage of topography, existing horizontal and vertical control, and sun angle.
It must be noted that multispectral photography differs from conventional aerial color because
it allows one to observe the subtle color differences existing in natural objects which are otherwise
difficult to perceive. Hence, careful consideration has to be given to the determination of altitude and
the differential exposures between camera bands.
This chapter reviews these and other variables to be considered in planning the flight. Reference
is made to previous sections of the manual for details.
12.1 Camera
The choice of a specific aerial camera for remote sensing studies depends upon the following:
- Required ground resolution for interpretation- Angular coverage per frame- Flight altitude- Overlap of imagery (60% for stereo viewing, 10% for mono viewing)- Camera magazine capacity- Types of imagery desired (black-and-white panchromatic, black-and-white infrared, color,
color infrared, multispectral, etc.)- Image motion compensation requirement- Size of aircraft camera portal
If more than one type of imagery is required (say, color, color infrared, and multispectral), some
modification of the camera mount may be necessary to fit this camera array into the opening of the
plane. Careful design of any multiple camera mount is essential (it is a federal offense to drop
anything from an aircraft!). When using multiple cameras for comparative studies of the imagery, it is
desirable that all sensors have the same focal lengths and approximately the same resolution. To
assure simultaneous exposure, all cameras should be fired off the same intervalometer.
13-1

Before the actual installation of the camera and accessories, it is important to ascertain if allcomponents will perform with good engineering reliability during the flight mission. A faithfullyexecuted check list of the equipment necessary will ensure that all the required parts are installed inthe aircraft. A sample aerial camera installation list is given in Figure 162.
Prior to selecting a multispectral sensor for use in a photographic mission, one should befamiliar with the necessary features of such a camera as described in Chapter 10. Particular attentionshould be given to the lens focal length and distortion characteristics since these will drastically affectthe final image registration and the ultimate interpretation of the scene.
The following information should be furnished to the pilot and crew so that they understand theexact photo requirements and can economically perform the mission.
1. Purpose of the photography2. Flight line layout3. Film type4. Filters to be used5. Exposure data6. Continuous flight strip requirement7. Image motion tolerance8. Scale9. Sun angle tolerance
10. Forward overlap and side-lap11. Sun spot tolerance12. Haze tolerance13. Allowable cloud cover14. Direction of flight15. Schedule
12.2 Films and Filters
There are several factors that affect the choice of filters and film: the end use (black-and-white,color, or color infrared for prints, transparencies, slides, or multispectral projection); environmentalphenomena to be studied; probable presence of haze; flight altitude, and the average light of theterrain. Section 7.1 discusses film and filter selection in detail and Chapter 11 gives the specificationsof candidate color and black-and-white films for aerial use.
Manufacturing tolerances for color negative and reversal emulsions are such that these filmsmust often be used in conjunction with filters. These filters are either supplied with the films or areexactly specified so that a faithful reproduction of both tone and color balance results. Do not guesson the use of a filter for color films; if none is specified, it only indicates that the manufacturer doesnot consider it necessary. If, however, haze is apparent at low altitude, using a Kodak Skylight Filter(#1A) sometimes helps.
The selection of a set of filters for multispectral photography requires knowledge of thefollowing parameters:
13-2

(a) The type of film to be used and its sensitometric characteristics.(b) Reflectance characteristics of the scene to be photographed.(c) The region of the spectrum which will best enhance anomalous features in the scene.
Project
Date Checked By
Item and Description Pre-FlightTested Installed in A/C
1. Camera Mount2. Camera3. Exposure Meter4. Camera Magazine5. Film Spools6. Camera Filters7. Cables8. Vacuum Pump Assembly9. Intervalometer
10. Camera Control Panel11. Viewfinder12. Inverter13. Tool and Spare Parts Kit14. Camera Manual15. Lens Tissue16. Aerial Film as specified in flight
plan and instructions17. Flight Plan18. Charts to Determine Exposure
Figure 162
As explained in Section 7.1, it is important to consider the transmission of the filters selected in
terms of the sensitivity of the film. Often neutral density filters are used in conjunction with spectral
filters to assure accurate exposure of multispectral photography. This situation requires that the
camera be calibrated prior to flight; that is, a pre-determination of the exposure ratio between each
lens-filter combination of the multispectral camera is essential. Exposure tests can be performed byphotographing a set of color, gray, and resolution targets from an elevated platform such as the roof
of a building. Care must be taken that the panels or color targets are placed beyond the hyperfocal
distance of the lens and that the focal length of the lens is changed if an infrared filter is used.
13-3
The primary purpose of pre-flight calibration is to assure that the resultant negative densities ineach multispectral record will be on the straight line portion of the characteristic curve. Hence, a chartmust be made to indicate the differential exposure required for each band taking into account theanticipated incident illumination at the time of flight.
12.3 Season and Weather Conditions
The season of the year must also be considered when planning a photo mission so that the mostdesirable ground cover conditions will occur when imagery is exposed. For example, in the case ofagricultural studies it is important to determine what stage of crop growth development will yield themost information.
The principal weather factors affecting photographic results are: solar altitude, clouds,turbulence, and haze. Cloudless days occur when the relative humidity is low and the air is stable.Occasionally a photographic mission is aborted because of a cloud forecast that fails to materialize.How much of the available clear weather may be used depends on such specifications as minimum sunangle and what percentage of cloud and cloud shadow can be tolerated. As an example, in mosttropical areas many days break clear and remain that way until cumulus clouds begin to build up,perhaps around 8 a.m. If the specifications require that the sun angle must be 300 or more and thatthe photographs be free of clouds or cloud shadows, acceptable photography is almost impossible toget in such areas.
Advance knowledge of anticipated weather conditions is invaluable for planning. Over a longperiod of years, the Weather Bureau has compiled statistics for the United States that are useful fordetermining optimum months or seasons for taking aerial photography. These data predict thenumber of days per month with 10% or less cloud cover that can be expected for any area. Care shouldbe exercised in using average weather data recorded on the basis of percentage of cloud cover sincesuch factors as haze, smoke, and fog are often not recorded. Rough air or turbulence bounces theaircraft causing image motion on the exposed film, thus reducing the final definition of thephotographic images. When exposing photography at high altitudes, the loss in interpretability canbecome extremely serious owing to the small scale of the imagery.
12.4 Photographic Day
Many factors influence the time required for the operation of a flight mission. Among these are:weather expectancy, distance of the site from flying base, length and orientation of flight lines,physical limitations of personnel, flight weight, and the speed of the aircraft in ascent and at workingaltitude.
As the distance between the site of photography and the operating base is increased, the ratio ofeffective photographing time to travel time becomes increasingly unfavorable. Thus, it is of primeimportance to base as close to the area as possible; not only is travel time minimized, but also theweather can be better evaluated. If the site area is far from the base, sometimes the weather at the siteis good, while the base is fogged in.
13-4

In estimating flying time, the air speed of the aircraft at the particular working altitude should
be reduced by the effect of probable winds and the time required to turn around between flight lines.
It is often economical to orient the flight lines in one direction rather than another. In the case of a
rectangular area, the strips should be laid out both ways to determine the most economical pattern
from the standpoint of flying time and the number of photos involved. The determination of the flight
day is dependent on the weather expectancy and on the nature of the discipline being studied. The
upper and lower time limits of the flight day are generally specified by the solar illumination
requirements taking into account the filter attenuation and the spectral sensitivity of the film. For
example, in oceanographic studies where fine image detail is desired, it is essential to avoid the
glittering patterns caused by the specular reflection from ripples and waves. Hence, photography
taken at high solar angles is avoided. In the case of agricultural studies, noon time photography ispreferred since a 900 sun angle causes a minimum of shadows to be imaged. If, however, the study isperformed for crop height determination, then the photography must be obtained at a time other than
noon so that by measuring the shadow length and the sun angle, the required mission objective can be
achieved.
It should be apparent, then, that the correct time of flight for an aerial photographic mission can
only be determined when the specific objectives of the project are known.
12.5 Summary
- Plan the photographic mission only after the objectives of the project are exactly specified.
- Choice of aerial sensor depends primarily upon final use of the imagery and the objects to be
photographed.- Checklists for pre-flight equipment tests and installation in aircraft are essential.
- Flight crew should be fully briefed on the project.- Pre-flight calibration of camera (especially multispectral) is essential for correct exposure.
- Select hour of day and time of year for flight test based upon objects to be photographed and
the mission objectives.
13-5

GLOSSARY
The following definitions are included for clarity and the reader's convenience.
Abridged spectrophotometry: measurement of spectral transmittance or reflectance at a limitednumber of wavelengths.
Absorption: conversion of radiant energy into other forms by passage through or by reflection frommatter.
Achromatic color: color that does not elicit hue.
Additive color mixture: superimposition or other non-destructive combination of light of differentchromaticities.
Additivity of luminance: luminance produced with a mixture of light from several sources is the sumof the luminances produced by the light from each of the sources acting separately.
Aperture: opening through which light passes.
Aperture stop: plane in optical system at which diaphragms of various sizes can be placed withoutvarying size of field imaged.
Blackbody: radiator that completely absorbs all incident energy and reflects none.
Boundary of real colors: spectrum locus, together with the straight line joining its extremities.
Brightness: attribute of sensation by which an observer is aware of differences of luminance.
Calibration: measurement and specification of properties or performance of device, for subsequent usefor subsidiary measurements.
Candle: unit of luminous intensity.
Chromatic aberration: imperfection of an image produced by variations of index of refraction ofelements of an optical system.
Chromatic colors: colors eliciting hue.
Chromaticity: composite of dominant wavelength and purity.
Chromaticity coordinates: proportions of standard components required for color match, used asordinate and abscissa to represent color in chromaticity diagram.
Chromaticity diagram: plane diagram formed by plotting one of the chromaticity coordinates againstanother.
C.I.E. chromaticity diagram: formed by plotting C.I.E. chromaticity coordinates.
C.I.E. source A: standard light source representative of quality of artificial illumination,recommended in 1931 by C.I.E.
C.I.E. source B: standard light source representative of direct sunlight at sea level, recommended in1931 by C.I.E.
C.I.E. source C: standard light source representative of quality of daylight, recommended in 1931 byC.I.E.
Color dictionary: compilation of color names, usually illustrated with chromatic samples.
Color matching: procedure of adjusting a color mixture until all visually apparent differences from asample color are eliminated.
Color-mixture curve: graph representing tri-stimulus value for unit flux of spectral energy, shown as afunction of wavelength.
Color-mixture data: amounts of components required in three-color colorimeter to match variouswavelengths.
Color reproduction: rendering of scene, by any process, in colors resembling the original.
Colorimeter: instrument designed for the direct measurement of color.

Colorimetric calculation: determination of color specifications by calculation from spectrophotometricdata.
Colorimetric specification: statement of tri-stimulus values, or chromaticity and luminance, of asample.
Colorimetry: technique of the measurement of color.
Complementary colors: pairs of samples of light that have complementary chromaticities and also theproper relative amounts of luminous flux to produce an achromatic mixture.
Dark current: current passed by photoelectric device when no radiant energy is incident on it.
Densitometer: instrument designed especially for measuring the densities of photographic deposits.
Desaturation: reduction of saturation, such -as is caused by adaptation.
Directional reflectance: reflectance measured for a specified mode of irradiation and collection.
Dispersing system: device for separating various wavelengths of radiant energy.
Dominant wavelength: wavelength of spectrally pure energy that if mixed with white light wouldmatch a color.
Entrance slit: slit through which energy enters a spectroscopic instrument.
Equal-energy: spectral distribution characterized by equal flux per unit wavelength interval.
Filter: device with desired characteristics of selective absorption and optical homogeneity, used to
modify the spectral composition of radiant energy.
Foot-candle: unit of illuminance equal to one lumen incident per square foot.
Gelatin filters: sheets of dyed gelatin used for optical purposes.
Hue: quality of sensation according to which an observer is aware of differences of wavelengths ofradiant energy.
Illuminance: luminous flux incident per unit area of a surface.
Indirect colorimetry: computation of colorimetric specifications from spectrophotometric andpsychophysical data.
Infrared: radiant energy with wavelengths somewhat longer than visible energy.
Integrating sphere: hollow sphere, with white interior, and small holes for admitting light and forobserving the interior.
Interference filters: extremely thin alternate layers of metals and dielectrics that have very narrowpassbands.
Inverse-square law: irradiance varies inversely as square of distance from a relatively small source.
Irradiance: radiant flux incident per unit area.
Lambert: unit of luminance.
Lambert's law: flux reflected per unit solid angle is proportional to cosine of angle measured fromnormal to surface.
Light: visual aspect of radiant energy.
Lovibond system: three sets of selectively absorbing glasses, used by superimposition to match and
specify colors.
Luminous emittance: total luminous flux emitted per unit area of surface.
Luminous intensity: measure of luminous flux per unit solid angle emitted by a source.
Luminosity coefficient: fraction of each color-mixture curve that enters into the luminosity curve.
Magnesium oxide: white, highly diffusing pigment used as white standard for spectrophotometry.
Monochromator: dispersive device for isolation of narrow portions of the spectrum. /3 7

Munsell chroma: portion of Munsell notation that corresponds to saturation.
Munsell hue: portion of Munsell notation that corresponds to hue attribute of sensation.
iMunsell system: system of classifying and designating attributes of opaque surface colors.
Munsell value: portion of Munsell notation that corresponds to lightness.
Negative component in color mixture: component that is mixed with the sample light in order todesaturate it sufficiently to obtain a match with a mixture of the other two components.
Neutral filter: filter that does not seriously alter the chromaticity of the light it transmits.
Nonselective filter: filter for which transmittance is substantially independent of wavelength.Optical density: common logarithm of reciprocal of transmittance.
Perfect diffuser: surface that reflects in accordance with Lambert's law.
Photoelectric colorimeter: device employing photoelectric detector to measure three quantities relatedby linear combination to tri-stimulus values of any sample.
Photographic exposure: time of exposure multiplied by irradiance or illuminance.
Photographic material: material used for recording images by means of chemical change produced bylight.
Photographic sensitometry: measurement of sensitivity of photographic materials and of relationsbetween exposure and density of developed images..
Photomultiplier: photoemissive detector in which amplification by secondary emission is employed.Primary: any one of three components used for production of extensive gamut of colors by additivemixtures.
Radiance: radiant intensity per unit projected area.
Radiant flux: rate of transfer of radiant energy.
Radiant reflectance: ratio of reflected radiant flux to incident flux.
Radiometry: measurement of radiant flux.
Reciprocity law: density of photographic image depends on the product of irradiance and time ofexposure.
Saturation: quality of sensation by which an observer is aware of different purities of any onedominant wavelength.
Selected-ordinate method: numerical integration using unequal intervals of integration variable, so asto eliminate multiplications in determination of contribution of each interval.
Selective absorption: absorption of different proportions of different wavelengths.
Sensitivity: capacity to detect small amounts of radiant energy.
Skylight: components of sunlight that are scattered by the atmosphere.Specification of color: statement of amounts of three components necessary to match the color.Spectrophotometer: device for the measurement of spectral transmittance, spectral reflectance, orrelative spectral emittance.
Spectrophotometric curve: graph of reflectance or transmittance versus wavelength.Spectroradiometer: device for the measurement of spectral distribution of radiant energy.Spectrum: spatial arrangement of components of radiant energy in order of their wavelengths.Spectrum color: color represented by any point on the spectrum locus.Spectrum locus: curve connecting points in chromaticity diagram that represent various wavelengthsof the spectrum.
Specular density: logarithm of the reciprocal of specular transmittance.

Specular reflection: reflected beam which leaves surface at an angle equal to the incident angle.
Steradian: unit of solid angle, subtended at center of sphere of one meter radius by one square meter
area on that sphere.
Three-color colorimeter: colorimeter in which colors are matched by mixtures of three colors of
invariable chromaticity but variable luminance.
Three-filter colorimeter: additive colorimeter employing three filters to produce mixture components.
Transformation of color mixture data: application of transformation equations to derive color-mixture
data for desired set of primaries from known color-mixture data for other primaries.
Trichromatic colorimetry: measurement of color in terms of mixtures of three prescribed
chromaticities.
Tristimulus value: amount of a component necessary in a three-color mixture matching a samplecolor.
Ultraviolet: radiant energy having wavelengths less than about 400 nm.
Wavelength: quantitative specification of kinds of radiant energy.
Weighted-ordinate method: numerical integration of product at equal intervals of variable.
White: color name, most usually applied to opaque, highly reflecting, diffusing objects.

REFERENCES
Baines, H. (1967): The Science of Photography, Wiley, New York. /0 -
Brewer, W.L., M.C. Goddard, and S.A. Powers (1955): "The Evaluation and Control of DirectReading Color Densitometers", J.S.M.P.T.E., Vol. 64, pp. 561-565.
Clark, W. (1946): Photography by Infrared, 2nd edition, Wiley, New York.
Committee on Colorimetry Optical Society of America, (1953): The Science of Color, Thomas Y.Crowell Co., New York.
Conrady, A.E. (1957): Applied Optics and Optical Design, Dover Publications, New York. Part Ireprinted 1957, Part II, 1960.
Evans, R.M. (1949): "Light Sources and Colored Objects", Illuminating Engineering, Vol. 44,pp. 47-54.
1948: An Introduction to Color, Wiley, New York.W.T. Hanson and W.L. Brewer: Principles of Color Photography, Wiley, New York.
Gibson, K.S., F.K. Harris, and I.G. Priest: (1927): "The Lovibond Color System: I. A Spectro-photometric Analysis of the Lovibond Glasses", Scientific Papers of the Bureau of Standards,Vol. 22, p. 1.
Greenleaf, A.R. (1952): Photographic Optics, The MacMillan Co., New York.
Hardy, A.C. (1936): Handbook of Colorimetry, Technology Press, Cambridge, Massachusetts.Helson, H. and J. Grove (1947): "Changes in Hue, Lightness, and Saturation of Surface Colors in
Passing from Daylight to Incandescent Lamp Light", Journal of the Optical Society ofAmerica, Vol. 37, pp. 387-395.
Hornsby, K. (1957): Sensitometry in Practice, Greenwood & Co., London.
Ives, H.E. (1923): "Transformation of Trichromatic Mixture Equations from .One. System toAnother", Journal of the Franklin Institute, Vol. 180, p. 673 (1915); Vol. 195, p. 23 (1923).
Jacobs, D.H. (1943): Fundamentals of Optical Engineering, McGraw-Hill, New York.Jenkins, F.A. and H.E. White (1950): Fundamentals of Optics, McGraw-Hill, New York.Judd, D.B. (1963): Color in Business, Science and Industry, Wiley, New York.
(1941): "Color Systems and Their Interrelations", Transactions of theIlluminating Engineering Society, Vol. 36, p. 336.
Koerner, A.M. (1954): "The Problems of Control of the Color Photographic Process", J.S.M.P. T.E.Vol. 63, pp. 225-270.
Kruse, P.W., L.D. McGlouchlin and R.B. McQuistan (1962): Elements of Infrared Technology,Wiley, New York.
Lester, H.M. (1953): Photo Lab Index - The Cumulation Formulary of Recommended PhotographicProcedures, 13th edition, Morgan & Lester, New York.
Letzer, E.K. and S.A. Powers (1954): "Interference Filters for Photographic Densitometry",J.O.S.A., Vol. 44:11, pp. 870-874.
Loberl, L. and M. DuBois: Sensitometry, The Technique of Measuring Photographic Materials,The Focal Press, London.
Lovibond, J.W. (1887): "The Tintometer - A New Instrument for the Analysis, Synthesis,Matching, and Measurement of Colour", Journal of the Society of Dyers and Colourists,Vol. 3, p. 186.
Mack, J.E. and M.J. Martin: The Photographic Process, Mc-Graw-Hill, New York.Mees, C.E.K. (1959): The Theory of the Photographic Process, MacMillan Co., New York.

Miller, G.W. (1942): Principles of Photographic Reproduction, MacMillan Co., New York.
Munsell, A.H. (1936): A Color Notation, Ellis, Boston, 1905, 1907, 1913, 1916; Munsell Color Co.,Baltimore, 1923-26, 1936.
Munsell Color Company (1929): Munsell Book of Color, Baltimore.
Neblette, C.B. (1959): Photographic Lens Manual and Directory, Morgan & Morgan, New York.
(1964): Photography: Its Materials and Processes, 6th edition, Van Nostrand,New York.
(1969): Fundamentals of Photography, Van Nostrand-Reinhold, New York.
Ronchi, V. and E. Rosen (1957): Optics, the Science of Vision, New York University Press, New York.
Rothschild, N. and C. Wright (1959): Filter Guide for Color and Black-and-White, AmericanPhotographic Book Publishing Co., Inc., New York.
Sears, F.W. (1949): Optics, Addison-Wesley Press, Cambridge, Massachusetts.
Smith, E.S. (1947): Control Charts, McGraw-Hill, New York.
Society of Motion Picure and Television Engineers (1962): Principles of Color Sensitometry, NewYork.
Society of Motion Picture and Television Engineers (1960): Control Techniques in Film Processing,New York.
Spencer, D.A. (1966): Color Photography in Practice, Focal Press, New York.
Todd, H.N. and R.D. Zakia (1969): Photographic Sensitometry, Morgan & Morgan, New York.
Trimble, L. (1959): "Photographic Laboratory Quality Control", Astia Document Nr. A.D. 230 939,
Ramo-Wooldridge.
U.S.A. Standard PH 4.1 (1962): Manual Processing of Black-and-White Photographic Films andPlates, U.S.A. Standards Institute, New York.
Walsh, J. (1958): Photometry, Dover Press, New York.
Wright, W.D. (1944): The Measurement of Color, Hilger Ltd., London.