Multispectral Optical Remote Sensing for Water-Leak Detection
Upload
khangminh22Category
view
9download
0
TECHNICAL REPORT Open Access
Multispectral intravital microscopy forsimultaneous bright-field and fluorescenceimaging of the microvasculatureBarry G. H. Janssen1,2* , Mohamadreza Najiminaini3,4, Yan Min Zhang2,5,6,7, Parsa Omidi3,4,7 andJeffrey J. L. Carson1,3,4,7
Abstract
Intravital video microscopy permits the observation of microcirculatory blood flow. This often requires fluorescentprobes to visualize structures and dynamic processes that cannot be observed with conventional bright-fieldmicroscopy. Conventional light microscopes do not allow for simultaneous bright-field and fluorescent imaging.Moreover, in conventional microscopes, only one type of fluorescent label can be observed. This study introducesmultispectral intravital video microscopy, which combines bright-field and fluorescence microscopy in a standardlight microscope. The technique enables simultaneous real-time observation of fluorescently-labeled structures inrelation to their direct physical surroundings. The advancement provides context for the orientation, movement,and function of labeled structures in the microcirculation.
Keywords: Multispectral microscopy, Brightfield microscopy, Fluorescence microscopy, Intravital microscopy
IntroductionThe microcirculation and intravital microscopyThe microcirculation is an essential physiological, ana-tomical structure for organ and tissue function. It en-ables blood cells and plasma to be transported intotissue and metabolic waste products to be removed.Conventional bright-field intravital light microscopy(IVM) allows the visualization of the microvasculature ingreat detail and can be used to investigate its role in tis-sue function during various physiological and patho-physiological conditions (James and Tanke 2012). IVMhas been used to investigate leukocyte-vessel wall inter-actions, essential for effective immunological response(Pinho et al. 2011). Furthermore, using an intravitalmicroscope equipped with a dual-filter camera system, ithas been possible to investigate both changes in tissue
perfusion and in-vivo RBC oxygen content (Ellsworthet al. 1987). Other researchers have used IVM for the in-vestigation of the behavior of platelets and thrombusformation (Jenne et al. 2011; Celi et al. 2003), vasculargrowth (Sckell and Leunig 2016), and tumor formationand metastasis (Beerling et al. 2011).
Intravital light microscopy and its limitationsIn intravital microscopy, conventional light sources suchas halogen, xenon or mercury lamps are used to illumin-ate the tissue. Bright-field illumination involves trans-illumination of the surgically exposed transparent tissue,while epi-illumination can be used to visualize the mi-crovasculature in thicker tissues (James and Tanke2012). IVM often involves the observation of fast movingred blood cell (RBC) through microvessels, it is usuallynecessary to enhance the RBC visibility as much as pos-sible. Since hemoglobin both in its deoxygenated andoxygenated form, have high optical densities between400 and 450 nm (Zijlstra et al. 1991; Nitzan et al. 2014),optical filters selective for this spectral range are
© The Author(s). 2021 Open Access This article is licensed under a Creative Commons Attribution 4.0 International License,which permits use, sharing, adaptation, distribution and reproduction in any medium or format, as long as you giveappropriate credit to the original author(s) and the source, provide a link to the Creative Commons licence, and indicate ifchanges were made. The images or other third party material in this article are included in the article's Creative Commonslicence, unless indicated otherwise in a credit line to the material. If material is not included in the article's Creative Commonslicence and your intended use is not permitted by statutory regulation or exceeds the permitted use, you will need to obtainpermission directly from the copyright holder. To view a copy of this licence, visit http://creativecommons.org/licenses/by/4.0/.
* Correspondence: [email protected] of Medical Biophysics, Western University, London, ON N6A5C1, Canada2Kidney Clinical Research Unit (KCRU), London Health Sciences Centre,London, ON N6C 6B5, CanadaFull list of author information is available at the end of the article
Applied MicroscopyJanssen et al. Applied Microscopy (2021) 51:12 https://doi.org/10.1186/s42649-021-00059-6
deployed to enhance image contrast and RBC visibility.Multispectral observations in living tissue have been per-formed using a dual camera system using 2 separatedigital cameras (Japee et al. 2005a; Japee et al. 2005b).Although this allowed to investigate both tissue perfu-sion and RBC oxygen levels in vivo, the use of separatecameras can create challenges in alignment and imageacquisition synchronization (Ellsworth et al. 1987).Visualizing other less visible components in the blood
stream generally requires the use of specific fluorescentlabeling to augment optical visibility. Fluorescence mi-croscopy requires a specific bandpass filter illuminatethe tissue with light containing the fluorochrome’s exci-tation wavelengths, while a second bandpass filter en-sures that only the emitted fluorecencent light can bevisualized. Fluorescent labeling of moving cells in themicrovasculature has been successfully used to investi-gate the in-vivo behavior of leukocytes and platelets(Janssen et al. 1994; Al-Khazraji et al. 2012; OudeEgbrink et al. 2002). Moreover, although different fluo-rochromes can be used concurrently, it is usually notpossible to visualize different fluorochromes simultan-eously during microscopy, since each fluororescent labelrequires a different filter set to visualize the emittedfluorescent light (James and Tanke 2012; Coling andKachar 2001).Up to now, conventional intravital light microcopy has
not been optimized for simultaneous bright-field andfluorescence microscopy. Mainly due to the limitationsof the emission filter set, which only allows fluorescentlight to pass, impeding simultaneous intravital brightfieldand fluorescence microscopy. In standard laboratoryIVM setups it is therefore, not possible to capture im-ages using both modalities concurrently but rather,bright-field and fluorescence images need to be recordedseparately. Since microvascular blood flow velocities canrange up to approximately 10,000 μm/sec (Al-Khazrajiet al. 2012; Tangelder et al. 1986), observing any movingcomponent in the microvascular blood flow becomes ex-tremely challenging and the manual switch between thedifferent modalities would result in a direct misregistra-tion of brightfield and fluorescent images, therebyobstructing any effective temporal resolution of the cap-tured microscopic images.
Objective and approachThis work aimed to evaluate if a multispectral imagingtechnique could perform simultaneous fluorescence/bright-field imaging during an IVM observation in livingtissue. Our approach was to extend an IVM setup with amultispectral (MS) system that allowed for simultaneousbright-field and fluorescence observation through astandard, inverted light microscope. We tested the newmultispectral intravital microscopy (MSIVM) setup by
capturing fluorescence images simultaneously at differ-ent emission wavelengths and by combining fluores-cence with conventional bright-field images at videoframe rates. The system was tested on a phantom modelbefore in-vivo testing on the microvasculature of a rat.With the new MSIVM setup, we acquired images thatcaptured the microvascular flow dynamics simultan-eously with fluorescently labeled structures that wouldtypically not be visible with conventional IVM.
Materials and methodsAnimal preparationAll experimental animal work described in this studywas performed in accordance with the legal guidelinesand regulations set by the Canadian Council of AnimalCare (CCAC) (https://www.ccac.ca), and approved bythe Animal Care and Use Committee (ACUC) of West-ern University, London, Ontario, Canada. All animalwork in the study was carried out in compliance withthe ARRIVE guidelines (https://arriveguidelines.org)(Percie du Sert et al. 2020).Male Sprague-Dawley rats, purchased from Charles
River (Wilmington, MA, USA), were housed understandard conditions, i.e., water and food ad libitum, 12/12 light-dark cycle at room temperature. The animalswere allowed to acclimatize for at least 72 h after arrivalat the animal facility before entering the experimentalprocedures.All animals (200–250 g body weight) were fully
anesthetized with isoflurane (induction 4%, mainten-ance 2–2.5%) and permitted to breathe freely duringthe experiment. Maintenance anesthesia was taperedto minimize its effects on blood pressure. Bodytemperature was maintained at 37 °C using a rectalprobe and an infrared lamp connected to an auto-mated temperature monitor (TCAT-2 TemperatureController, Physitemp Instruments Clifton NJ). A 24Gintravenous catheter was placed in the tail vein to fa-cilitate direct IV delivery of suspended microbeads;fluid resuscitation was used with heparinized (1 U/ml)0.9% sodium chloride (600 μl/100 g body weight/hr) toensure patency of the catheter during the experiment.
SurgeryMicrovascular observations were performed on the Ex-tensor Digitorus Longus (EDL) muscle, as previously de-scribed (Tyml et al. 1991). Briefly, the EDL muscle wasexposed and separated from the surrounding tissue, afterwhich the distal tendon was tied and detached from thebone. After exposing the muscle tissue, the animal wastransferred to an inverted optical microscope, and theexposed muscle was gently placed on a thin glass cover-slip. The exposed muscle tissue was regularly super-fused with physiological saline, covered with saran wrap,
Janssen et al. Applied Microscopy (2021) 51:12 Page 2 of 12
and a glass coverslip to isolate the muscle from the sur-rounding environment and prevent desiccation of thetissue. To minimize tissue movement, a suture at thetendon was used to hold the muscle in place and keepthe muscle at the approximately in-situ length withoutimpeding microvascular blood flow.
Overview of multispectral multicamera systemThe MSIVM system was designed to accommodate theclassical principles used for intravital microscopy (Jamesand Tanke 2012) (Spectral Devices, London (ON),Canada; https://www.spectraldevices.com). While inconventional microscopes, filters are either placed infront of the camera or, in the case of fluorescence mi-croscopy, in optical cubes within the microscope body,the MSIVM system allowed for filters to be placedwithin the optical path of each camera. This design fea-ture allowed for various filter possibilities, which weresuited to the observational circumstances. Since the fourindividual optical light paths in the MSIVM system weredesigned to act independently, specific filters in one lightpath could be used without interfering with the imageacquisition in other optical arms. Therefore, we couldtailor the optical characteristics for each camera withinthe MSIVM system. Although this could be easilyachieved for image acquisition in the two bright-fieldoptical arms, specific filter selection was required forsimultaneous fluorescent and bright-field imaging. Thisapproach contrasts with conventional fluorescence mi-croscopy, where excitation and emission light needed tobe well separated by filters with non-overlapping opticalranges to generate usable fluorescent images (Coling andKachar 2001). In the MSIVM system, we used selectiveillumination of the tissue using light in an optical rangethat only contained the fluorochromes’ excitation wave-lengths (i.e., wavelength range from 400 to 550 nm). Thisapproach had several advantages since it allowed forclear bright-field visualization of the RBCs in the micro-vasculature and efficient excitation of several fluoro-chromes of interest. Moreover, since a high-intensityxenon-light source was used for the intravital observa-tions in this study, optical filters were used that excludedUV and IR light, which could potentially damage the tis-sue during the observation. Combining this illuminationstrategy with specific band pass and long pass filters en-abled the simultaneous and separate visualization of twofluorescent images in the first two optical arms andbright-field images in the third and fourth optical armsof the MSIVM.
Multispectral multicamera setupFigure 1 shows the MSIVM system (MSMC-23-1-A,Spectral Devices Inc., London, Canada) consisting offour 2.3MP CMOS cameras (Omron Sentech, Japan,
Model STC-MBS231U3V) and several beam splittersto create four separate optical arms. Figure 1A showsthat one beam splitter (BS1) received incoming lightfrom the microscope and divided the optical path intotwo arms. One arm was used for bright-field imagingand the other for fluorescence imaging. Each opticalarm was folded with either a mirror or beam splitterto reduce the overall system size. After each foldingmirror/beam splitter, the light passed through anotherbeam splitter, thereby splitting the light in each arminto two directions, which was ultimately received bytwo cameras. The system could pick off light fromeach optical arm using accessory beam splitters, butthese were not installed for the experiments in thisstudy. At four positions along each optical arm, therewere holders for 25.4 mm optical elements. In total,the system provided four independent but co-registered imaging channels of the light exiting theside port of the microscope. This setup allowed us tocombine two basic illumination modalities, i.e.,bright-field and fluorescent microscopy. For this in-vestigation, only one bright-field channel was used incombination with 2 separate fluorescent channels.Perspective drawings of the MSMC-23-1-A are shownfor the front of the unit (Fig. 1B) and the rear (Fig.1C). A typical experimental arrangement of the MSIVM system on an inverted microscope is shown in Fig.1D. Since fluorescent light usually has a low intensity,we used a 90/10 beam splitter (BS1 in Fig. 1A) to en-sure that the two cameras used for fluorescent obser-vation (CAM3 and CAM4 in Fig. 1A) received 90% ofthe emanated light, while the remaining 10% was usedfor the bright-field observation.
Bright field intravital microscopyObservations in the tissue were made using an invertedmicroscope (Nikon Eclipse Ti, Nikon Instruments, Mel-ville, New York, USA) with a stage adapted for intravitalmicroscopy. The EDL tissue was transilluminated usinga 100W xenon light source (PTI LPS 220, Horiba Scien-tific, Piscataway NJ, USA) combined with an optical lightguide (Thorlabs, Newton, NJ, USA). The tissue wastrans-illuminated with light in the range of 400–550 nm,while an additional filter (450 nm/20 nm band-pass filter;450BP20, Omega Optical, Brattleboro, VT, USA) wasplaced in the light path directly in front of the bright-field camera. This approach enhanced the visualizationof red blood cells (RBC), facilitated fluorescence micros-copy, and prevented any tissue damage related to UVand IR light emanating from the xenon light source. In-travital images of the EDL microcirculation (see Fig. 1C)were acquired using the bright-field CMOS camera unitsof the MSIVM system and were stored on a computerfor later off-line analysis.
Janssen et al. Applied Microscopy (2021) 51:12 Page 3 of 12

Fluorescence intravital microscopyFluorescence microscopy tests were performed usingtwo different types of fluorescent microbeads; (Fluoro-Spheres: diameter 1.0 μm; excitation wavelength 540 nm,emission wavelength 560 nm; 1*1010 microbeads /ml;Molecular Probes, Inc., Eugene, OR, USA) and 1.0 μmfluorescent microbeads (TransFluoroSpheres: diameter1.0 μm; excitation wavelength 488 nm, emission wave-length 645 nm; 3.6*1010 microbeads /ml; MolecularProbes, Inc., Eugene, OR, USA).
In vitro visualization of microbeadsA quantity of 1*108 fluorescent microbeads was sus-pended in saline (total end volume of 1 ml) and vortexedbefore use. Of each microbead suspension, 10 μl wastaken separately or mixed on a glass slide and coveredwith a glass coverslip for microscopic inspection. Fluor-escent microscopic images of the microbeads were ac-quired using the fluorescence CMOS monochrome
cameras of the MSIVM system in combination with aband-pass filter (570/25 nm; 570IL25 Comar Optics, Lin-ton, UK) and long-pass filter (> 600 nm; FEL0600, Thor-labs, Newton, NJ, US).
In vivo visualization of the microbeadsA quantity of 4*109 beads was mixed in a total end vol-ume of 0.5 ml to achieve a final concentration of 8*109
microbeads/ml. The suspension was vortexed before in-jection into the infusion line connected to the 24G intra-venous (IV) catheter. The microbeads were slowlyinfused at a rate of 750 μl/100 g body weight/hr. for 10min. Intravital fluorescence images of the microbeadstraveling through the microvasculature of the EDLmicrocirculation were acquired using the fluorescenceCMOS monochrome camera units of the MSIVM sys-tem in combination with a band-pass filter (565/24 nm;MF565–24, Thorlabs, Newton, NJ, US) and long-pass fil-ter (> 600 nm; FEL600, Thorlabs, Newton, NJ, US).
Fig. 1 Schematic diagram of the MSMC-23-1-A showing the bright-field and fluorescence optical paths. (A): The instrument includes up to sevenbeam splitters (BS1 - BS7), four accessory ports (A1 - A4), eight filter holders (F1 - F8), four cameras (CAM 1 - CAM 4), and two input ports (IN1,IN2). The USB 3.0 port on each camera is connected to a 4-port USB 3.0 interface card in the PC workstation. Internally, the strobe output (S1)from CAM1 is connected to the trigger inputs (T2, T3, and T4) on the other 3 cameras (CAM2, CAM3, and CAM4). (B): Front perspective of theMSMC-23-1-A showing C-mount ports, filter holder slots, with one slot populated with a filter holder. (C): Rear perspective of the MSMC-23-1-A,showing C-mount backports, USB port connections, trigger and power connectors, and switches. (D): Photograph of the MSIVM system withMSMC-23-1-A attached to the side port of an inverted microscope
Janssen et al. Applied Microscopy (2021) 51:12 Page 4 of 12
Off-line analysisAll acquired images were subsequently stored on a com-puter for off-line analysis. We developed an applicationin MATLAB app designer (Matlab; The Mathworks Inc.,Natick (MA) USA) to perform co-registration amongthree separate camera images. The application was alsocapable of reducing artifacts from tissue movement dur-ing the experiment. For co-registration, we utilized thecontrol point registration software in MATLAB ImageProcessing Toolbox™. This software allowed us to selectgeometrical features (landmarks) in an image from thereference camera and apply them to the images from theother cameras. A 2-dimensional transformation matrixfor each camera was generated to co-register all cameraimages based on the selected landmarks. A similarmethod was used to select fixed landmarks among allframes from one camera and co-register all frames basedon the chosen landmarks to remove tissue movement.This processing resulted in a transformation matrix foreach frame applied to the corresponding frames fromthe other cameras. Finally, to show a single multispectralvideo for all cameras, synchronized frames from all cam-eras were overlaid using color coding to visualize the in-teractions between microbeads andRBCs (see “Availability of data and materials” section).ImageJ (NIH, USA; https://imagej.nih.gov/ij/) was usedfor basic image editing (cropping and resizing) andvisualization.
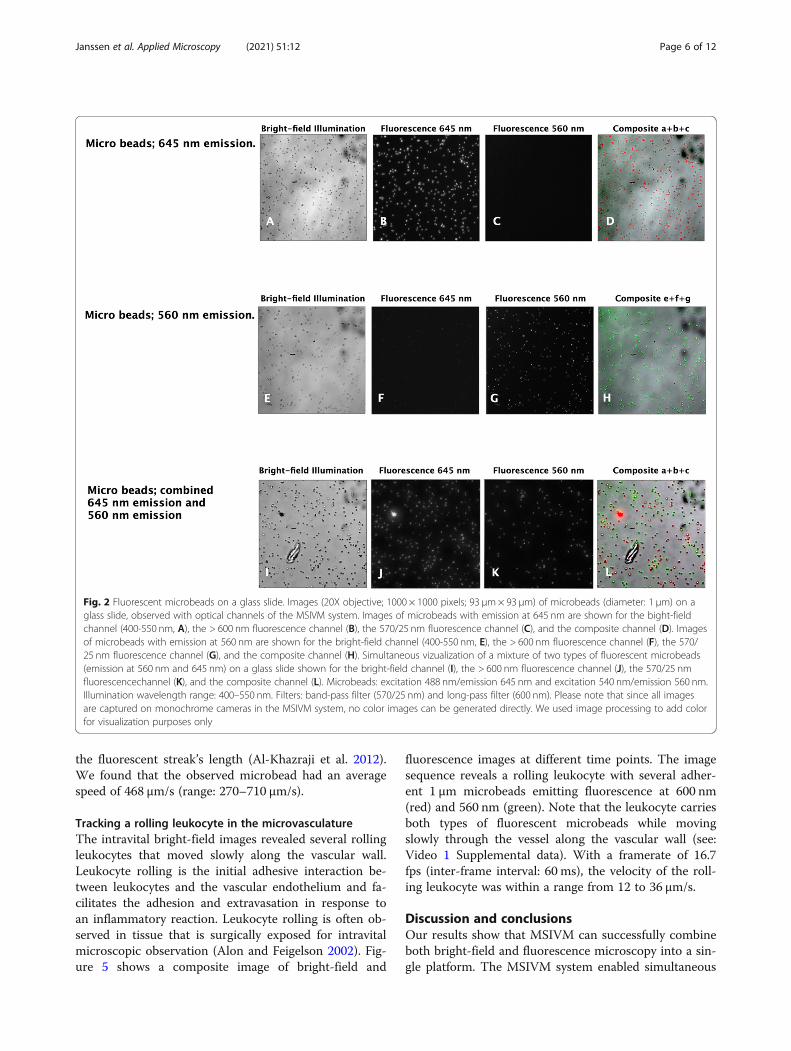
ResultsSimultaneous bright-field and fluorescent imagingThe MSIVM system allowed the visualization of bright-field and fluorescent images simultaneously. Imagestaken from the two different microbead types are shownin Fig. 2A-D and Fig. 2E-H showing images from the dif-ferent optical channels, i.e., bright-field and the 645 nmand 560 nm fluorescent channels. While Fig. 2A and Fig.2E exhibit a bright-field image of the microbeads, Fig.2B, F, and C and g show the respective fluorescent chan-nels. The images were combined in a composite imageof the bright-field and corresponding 645 nm (red) and560 nm (green) fluorescent images, as shown in Fig. 2Dand Fig. 2H, respectively. Figure 2I-L show images of amixture of the two different bead types and the compos-ite image, which demonstrated that the MSIVM systemcould simultaneously and separately image the differentbright-field and separate fluorescent optical channels.
In-vivo visualization of microbeadsFigure 3A: left image shows a cluster of injected fluores-cent microbeads adhered to the vascular wall in a vesselin the EDL muscle after infusion into the bloodstream.Since a 600 nm long-pass filter was used for these intra-vital observations, there was a slight optical overlap with
the emission spectrum of 560 nm microbeads, whereassome optical leakage of emitted fluorescent light in the> 600 nm channel was observed. Consequently, the 560nm microbeads were visible in the image associated withthe > 600 nm channel. Although optical leakage betweenchannels was difficult to avoid due to the fluorochromes’emission peak width, our results show that it was pos-sible to distinguish differently labeled structures withintissue. The 560 nm (green/yellow) microbeads show upin the composite picture as yellow/orange colored and,therefore, are distinguishable from the 645 nm microbe-ads, visible as deep red (Fig. 3A: middle image and rightimage, respectively).
Dynamic intravital bright-field and fluorescence imagingSimultaneous imaging in bright-field and fluorescencechannels allowed the visualization of structures and dy-namic processes that would not be visible with bright-field microscopy alone. For example, Fig. 3B,C and Dshow a postcapillary venule (diameter ~ 22 μm) at selecttime points from three simultaneously acquired imagesequences, i.e., image sequences with bright-field illu-mination (Fig. 3B) and fluorescence microscopy (Fig. 3Cand D, respectively). While a moving fluorescentmicrobead can be observed in the image sequence ofFig. 3C (yellow circle), it is not visible in the concurrentbright-field (Fig. 3B) or fluorescent (Fig. 3D) image se-quences. Moreover, since these images are acquired at aframe rate of 16.7 frames per second, it is possible to de-termine the velocity with which this microbead movesalong the vessel wall.To examine the complete 9-s long image sequence, a
composite image of 150 images was generated (Fig. 4A:left image). Analysis of the frames revealed that themean microbead velocity was approximately 7.9 μm/s,ranging from 2.3 to 40.1 μm/s (Fig. 4A: right image),which is considerably slower than the blood flow oftenfound in these types of vessels (Lipowsky 2005). Further-more, since blood flow in the microcirculation generallyinvolves a parabolic velocity profile across the vessellumen, the result likely represents a slow-movingmicrobead flowing in the outer slow-flowing fluid layerbloodstream close to the endothelial wall (Tangelderet al. 1986; Koutsiaris 2009).A microbead traveling in the fast-flowing center of the
bloodstream is shown in Fig. 4B, C and D. The figureshows three simultaneously acquired image sequencestaken using intravital bright-field (Fig. 4B) and fluores-cence microscopy (Fig. 4C and D). A visible streak, gen-erated by a free-flowing microbead, can be observed inthe > 600 nm channel (Fig. 4C), which is not visible inthe 560 nm channel (Fig. 4D). Since a 40ms exposuretime was used for each image, the free-flowing fluores-cent microbead’s velocity was determined by measuring
Janssen et al. Applied Microscopy (2021) 51:12 Page 5 of 12
the fluorescent streak’s length (Al-Khazraji et al. 2012).We found that the observed microbead had an averagespeed of 468 μm/s (range: 270–710 μm/s).
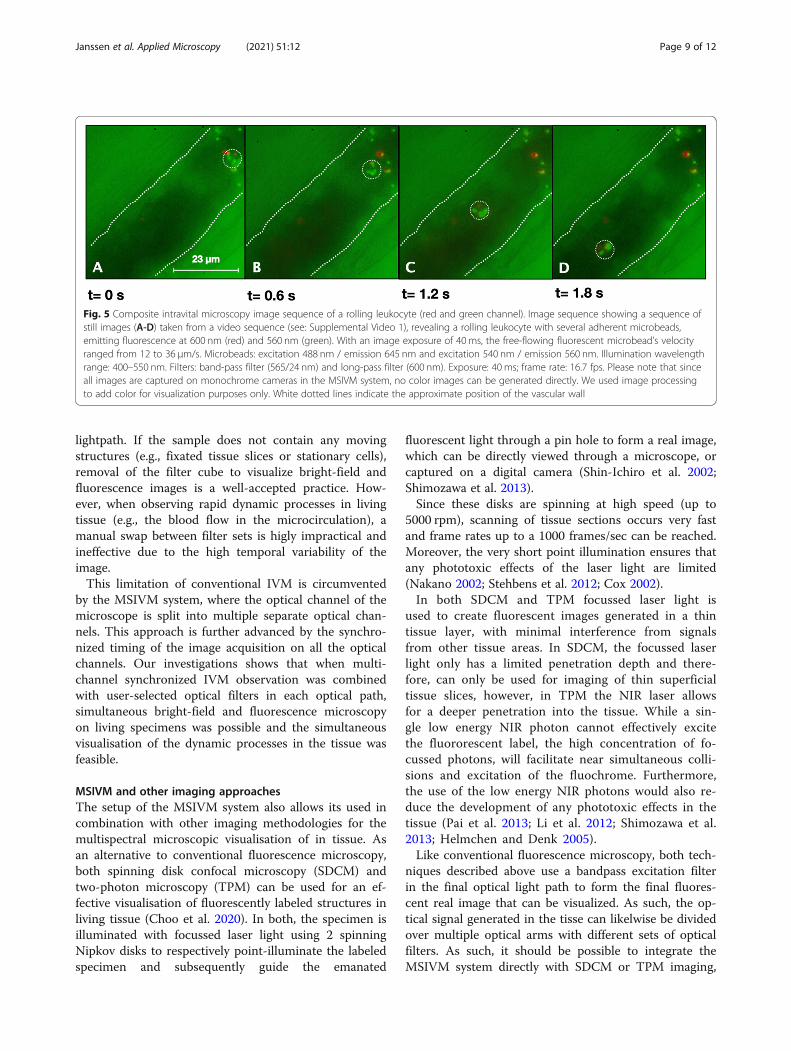
Tracking a rolling leukocyte in the microvasculatureThe intravital bright-field images revealed several rollingleukocytes that moved slowly along the vascular wall.Leukocyte rolling is the initial adhesive interaction be-tween leukocytes and the vascular endothelium and fa-cilitates the adhesion and extravasation in response toan inflammatory reaction. Leukocyte rolling is often ob-served in tissue that is surgically exposed for intravitalmicroscopic observation (Alon and Feigelson 2002). Fig-ure 5 shows a composite image of bright-field and
fluorescence images at different time points. The imagesequence reveals a rolling leukocyte with several adher-ent 1 μm microbeads emitting fluorescence at 600 nm(red) and 560 nm (green). Note that the leukocyte carriesboth types of fluorescent microbeads while movingslowly through the vessel along the vascular wall (see:Video 1 Supplemental data). With a framerate of 16.7fps (inter-frame interval: 60 ms), the velocity of the roll-ing leukocyte was within a range from 12 to 36 μm/s.
Discussion and conclusionsOur results show that MSIVM can successfully combineboth bright-field and fluorescence microscopy into a sin-gle platform. The MSIVM system enabled simultaneous
Fig. 2 Fluorescent microbeads on a glass slide. Images (20X objective; 1000 × 1000 pixels; 93 μm× 93 μm) of microbeads (diameter: 1 μm) on aglass slide, observed with optical channels of the MSIVM system. Images of microbeads with emission at 645 nm are shown for the bight-fieldchannel (400-550 nm, A), the > 600 nm fluorescence channel (B), the 570/25 nm fluorescence channel (C), and the composite channel (D). Imagesof microbeads with emission at 560 nm are shown for the bright-field channel (400-550 nm, E), the > 600 nm fluorescence channel (F), the 570/25 nm fluorescence channel (G), and the composite channel (H). Simultaneous vizualization of a mixture of two types of fluorescent microbeads(emission at 560 nm and 645 nm) on a glass slide shown for the bright-field channel (I), the > 600 nm fluorescence channel (J), the 570/25 nmfluorescencechannel (K), and the composite channel (L). Microbeads: excitation 488 nm/emission 645 nm and excitation 540 nm/emission 560 nm.Illumination wavelength range: 400–550 nm. Filters: band-pass filter (570/25 nm) and long-pass filter (600 nm). Please note that since all imagesare captured on monochrome cameras in the MSIVM system, no color images can be generated directly. We used image processing to add colorfor visualization purposes only
Janssen et al. Applied Microscopy (2021) 51:12 Page 6 of 12

imaging with two different optical modalities at framerates capable of visualizing the dynamic changes foundin the microvasculature. Furthermore, the MSIVM sys-tem, comprised of four independent optical arms,allowed the use of multiple fluorescent probes. The stra-tegic placement of separate optical filters allowed eachoptical arm to capture the different excitation and emis-sion wavelengths independently and image themsimultaneously.Both in-vitro and in-vivo experiments showed that
MSIVM could separately distinguish two types of 1 μmfluorescent microbeads in different optical channels,while in the bright field optical channel alone, no dis-tinction could be made between these two types ofmicrobeads. Additionally, we found that even in the caseof an optical overlap between fluorescent emission
spectra, it was still possible to observe the twomicrobead populations separately.Our investigations showed that the MSIVM system
allowed visualization of the dynamics of moving fluores-cently labeled microbeads, either free-flowing in the cen-ter of the bloodstream, moving close to the vascular wall(Fig. 4), or bound to the cell surface of a leukocyte trav-eling through a micro-vessel (Fig. 5). The MSIVM sys-tem provided direct visual reference of the labeledstructures within the surrounding tissue’s layout and themicrocirculation. Separate visualization of differently la-beled structures during MSIVM enabled independenttracking of these structures as they moved through themicrovasculature. In our study, the structures were ei-ther free-flowing microbeads in the bloodstream thatinteracted with the vascular endothelium or moving
Fig. 3 Mixture of infused fluorescent microbeads in-vivo. (A): left image: Composite images of adherent infused fluorescent 1 μm microbeads,middle image: green fluorescent (560 nm) microbeads, and right image: red fluorescent microbeads (> 600 nm). Notice that the green/yellowmicrobeads in the composite image represent green beads visible (green channel) and, due to an optical overlap of the 560 nm emissionspectrum are also visible in the red channel. In the composite picture, these appear as yellow-green, clearly distinguishable from the redfluorescent microbeads. The orange microbeads result from a positional overlap between 2 different beads (in red and green channelrepsectively). (B), (C), and (D): Show a sequence of intravital microscopy images of a microbead moving along the vascular endothelium. Imagesin (B) and (D), represent the image sequences displaying the location (red circles) of the fluorescent bead visible only in image sequence (C)(yellow circles). Bright-field illumination wavelength range: 400–550 nm (B). Filters: band-pass filter: 565/24 nm (C) and long-pass filter: 600 nm (D).Microbeads: excitation 488 nm / emission 645 nm (C) and excitation 540 nm / emission 560 nm (D). Exposure: 40 ms; frame rate: 16.7 fps. Pleasenote that since all images are captured on monochrome cameras in the MSIVM system, no color images can be generated directly. We usedimage processing to add color for visualization purposes only. White dotted lines indicate the approximate position of the vascular wall
Janssen et al. Applied Microscopy (2021) 51:12 Page 7 of 12

leukocytes. The MSIVM system allowed separatevisualization of these dynamic processes in the microvas-culature, which is usually not possible with conventionalbright-field light microscopy.
Advancement of MSIVM over IVMBoth brightfield and fluorescence IVM have beenused in a wide range of biological and biomedical re-search fields to study cell behavior directly in the sur-roundings of the living tissue often employing bothbrightfield and fluorescent imaging modalities (Jamesand Tanke 2012; Choo et al. 2020). IVM has beenused to investigate the in-vivo behavior of leukocytesin the blood stream and their adhesive interactionwith the vascular endothelium (Tangelder et al. 1986;Al-Khazraji et al. 2012; Ley et al. 2008), thrombi for-mation (Furie and Furie 2005), as well as the
dymamics of cell migration into tissues (Pai et al.2013; Li et al. 2012; Beerling et al. 2016). IVM hasbeen used to investigate the blood flow and and func-tionality of the microcirculation (Tangelder et al.1986; Al-Khazraji et al. 2012; Tozer et al. 2005), aswell as provided a better understanding of the func-tional microvascular hemodynamics and transport ofoxygen (Ellsworth et al. 1987) or targeted therapeuticdelivery of active particles (van de Ven et al. 2012).To enhance the observation of cells and tissue struc-
tures, fluorescent labels are used to improve visibility formicroscopic observation. In conventional fluorescentlight microscopy, this requires the use of a filter cube inthe light path to selectively visualize the fluorescence atthe expense of blocking all other light from the speci-men. Consequently, capture of brightfield images re-quires manual removal of the filter cube from the
Fig. 4 Composite picture of a 9 s image sequence of 150 images (red and green channel). (A): left image: The composite image shows the path(white arrow A) of a moving microbead observed in the fluorescent > 600 nm optical channel. A group of non-moving, adherent microbeads isalso visible (white arrow B); right image: Velocity of microbead A in left image of panel (A). The distance of the microbead was estimated in eachpair of successive images. Velocity was computed by determining the traveled distance in the interframe interval. (B), (C) and (D): Intravitalmicroscopy image sequence of a microbead (streak) moving in the bloodstream’s centerline. With an image exposure time of 40ms, this free-flowing fluorescent microbead’s average velocity was 468 μm/s (range: 270–710 μm/s). Arrows in image sequences (B and D), displaying thelocation of the fluorescent bead only visible in image sequence (C) (yellow arrow). Bright-field illumination wavelength range: 400–550 nm (B).Filters: band-pass filter: 565/24 nm (C) and long-pass filter: 600 nm (D). Microbeads: excitation 488 nm / emission 645 nm and excitation 540 nm/emission 560 nm. Exposure: 40 ms; frame rate: 16.7 fps. Please note that since all images are captured on monochrome cameras in the MSIVMsystem, no color images can be generated directly. We used image processing to add color for visualization purposes only. White dotted linesindicate the approximate position of the vascular wall
Janssen et al. Applied Microscopy (2021) 51:12 Page 8 of 12
lightpath. If the sample does not contain any movingstructures (e.g., fixated tissue slices or stationary cells),removal of the filter cube to visualize bright-field andfluorescence images is a well-accepted practice. How-ever, when observing rapid dynamic processes in livingtissue (e.g., the blood flow in the microcirculation), amanual swap between filter sets is higly impractical andineffective due to the high temporal variability of theimage.This limitation of conventional IVM is circumvented
by the MSIVM system, where the optical channel of themicroscope is split into multiple separate optical chan-nels. This approach is further advanced by the synchro-nized timing of the image acquisition on all the opticalchannels. Our investigations shows that when multi-channel synchronized IVM observation was combinedwith user-selected optical filters in each optical path,simultaneous bright-field and fluorescence microscopyon living specimens was possible and the simultaneousvisualisation of the dynamic processes in the tissue wasfeasible.
MSIVM and other imaging approachesThe setup of the MSIVM system also allows its used incombination with other imaging methodologies for themultispectral microscopic visualisation of in tissue. Asan alternative to conventional fluorescence microscopy,both spinning disk confocal microscopy (SDCM) andtwo-photon microscopy (TPM) can be used for an ef-fective visualisation of fluorescently labeled structures inliving tissue (Choo et al. 2020). In both, the specimen isilluminated with focussed laser light using 2 spinningNipkov disks to respectively point-illuminate the labeledspecimen and subsequently guide the emanated
fluorescent light through a pin hole to form a real image,which can be directly viewed through a microscope, orcaptured on a digital camera (Shin-Ichiro et al. 2002;Shimozawa et al. 2013).Since these disks are spinning at high speed (up to
5000 rpm), scanning of tissue sections occurs very fastand frame rates up to a 1000 frames/sec can be reached.Moreover, the very short point illumination ensures thatany phototoxic effects of the laser light are limited(Nakano 2002; Stehbens et al. 2012; Cox 2002).In both SDCM and TPM focussed laser light is
used to create fluorescent images generated in a thintissue layer, with minimal interference from signalsfrom other tissue areas. In SDCM, the focussed laserlight only has a limited penetration depth and there-fore, can only be used for imaging of thin superficialtissue slices, however, in TPM the NIR laser allowsfor a deeper penetration into the tissue. While a sin-gle low energy NIR photon cannot effectively excitethe fluororescent label, the high concentration of fo-cussed photons, will facilitate near simultaneous colli-sions and excitation of the fluochrome. Furthermore,the use of the low energy NIR photons would also re-duce the development of any phototoxic effects in thetissue (Pai et al. 2013; Li et al. 2012; Shimozawa et al.2013; Helmchen and Denk 2005).Like conventional fluorescence microscopy, both tech-
niques described above use a bandpass excitation filterin the final optical light path to form the final fluores-cent real image that can be visualized. As such, the op-tical signal generated in the tisse can likelwise be dividedover multiple optical arms with different sets of opticalfilters. As such, it should be possible to integrate theMSIVM system directly with SDCM or TPM imaging,
Fig. 5 Composite intravital microscopy image sequence of a rolling leukocyte (red and green channel). Image sequence showing a sequence ofstill images (A-D) taken from a video sequence (see: Supplemental Video 1), revealing a rolling leukocyte with several adherent microbeads,emitting fluorescence at 600 nm (red) and 560 nm (green). With an image exposure of 40 ms, the free-flowing fluorescent microbead’s velocityranged from 12 to 36 μm/s. Microbeads: excitation 488 nm / emission 645 nm and excitation 540 nm / emission 560 nm. Illumination wavelengthrange: 400–550 nm. Filters: band-pass filter (565/24 nm) and long-pass filter (600 nm). Exposure: 40 ms; frame rate: 16.7 fps. Please note that sinceall images are captured on monochrome cameras in the MSIVM system, no color images can be generated directly. We used image processingto add color for visualization purposes only. White dotted lines indicate the approximate position of the vascular wall
Janssen et al. Applied Microscopy (2021) 51:12 Page 9 of 12

and enable the use of multiple fluorescent probes and tosimultaneously create an image from different fluores-cent signals.
Limitations of this studyA drawback of the current MSIVM system was that lightcoming from the microscope was shared by four separ-ate optical arms, which reduced the light intensity ateach camera compared to a single optical path. Althoughthe use of a 90/10 beam splitter ensures that most ofany emanated fluorescent light will be captured by thecameras, visualization of any weak fluorescent signalmay still prove to be challenging. However, dichroicbeam splitters could replace the existing beam splitters,which would result in much higher efficiency in lighttransmission within each selected band. Furthermore,the images in this study were not enhanced with noisereduction and signal enhancement image processing al-gorithms, which could have revealed weak fluorescentsignals in the captured images.Another consideration for the use of the MSIVM sys-
tem relates to data processing. Since each camera couldacquire digital images at video frame rates up 40 fps, theresulting image data volumes exceeded 100 Gb per ex-periment. Clearly, at these data rates, the manageabilityof the image dataset becomes very challenging. Auto-mated image processing tools will be essential for hand-ling these large data sets in the future. Futuredevelopments will also involve improving image process-ing techniques and software to efficiently analyze largedata volumes associated with MSIVM experiments(Mahmoud et al. 2020).
Applications that could benefit from MSIVM and futuredirectionsTherefore, we anticipate that the MSIVM platform canbe successfully integrated in other microscopic imagingplatforms that will allow for a further in-depth investiga-tion of the dynamics of the physiological mechanisms intissue. For example, since the microcirculation providesa conduit to transport plasma with numerous differentbioactive substances and suspended cells into the tissue’ssmallest blood vessels. Numerous IVM studies have ex-amined the microvasculature’s functionality in varioustissues and different pathological circumstances using ei-ther bright-field or fluorescence microscopy (Tuma et al.2008). The microvasculature represents a unique phys-ical environment, comprising both slow (e.g., vascularendothelium and vessel geometry) and fast dynamicstructures and processes (e.g., immune responses, bloodcoagulation, and the investigation of plasma flow), whichare difficult to visualize. Therefore, fluorescent probesare often required for the necessary visualization. It indi-cates that the ability to combine both bright-field and
fluorescence IVM with the MSIVM system is especiallyvaluable since it allows us to investigate these dynamicmicrovascular changes in direct relation to their physicalsurroundings.
ConclusionsThe MSIVM platform allows simultaneous visualizationof the movement of RBC with conventional bright-fieldillumination while at the same time enabling the use offluorescent probes to image the less visible elements inthe blood flow (e.g., blood platelets and plasma). It al-lows for a detailed study of microvascular blood flowunder different pathophysiological conditions, e.g., dur-ing a severe inflammatory response. This response, gen-erally associated with a hyperinflammatory cytokinestorm, often induces significant blood flow disturbances(microvascular dysfunction), resulting in organ failureand permanent tissue damage (De Backer et al. 2014;Zaim et al. 2020). Moreover, microvascular dysfunctionis also associated with diabetes (Stehouwer 2018), ob-structive sleep apnea (Karaman Koç et al. 2019), heartfailure (Nelson et al. 2018), autoimmune conditions(Bordy et al. 2018), stroke, and Alzheimer’s disease (Rostet al. 2018; Jiang et al. 2018), indicating that it is foundin a wide range of different pathologies. As such, theMSIVM platform can be used to visualize disturbancesof the microvascular blood flow in great detail in a widerange of pathological conditions.
AbbreviationsEDL: Extensor Digitorus Longus; IV: Intravenous; IVM: Intravital videomicroscopy; MS: Multi-spectral; MSIVM: Multispectral intravital videomicroscopy; RBC: Red blood cell; SDCM: Spinning disk confocal microscopy;TPM: Two-photon microscopy
Supplementary InformationThe online version contains supplementary material available at https://doi.org/10.1186/s42649-021-00059-6.
Additional file 1 : Video 1.
AcknowledgementsNot applicable.
Authors’ contributionsThe multispectral camera unit was designed, tested, and built by Jeffrey J.L.Carson, Mohamadreza Najiminaini, and Barry G.H. Janssen. Intravitalmicroscopic experiments were performed by Barry G.H. Janssen and Yan MinZhang. Image processing software (Co-registration and overlay) wasdesigned, developed, and tested by Parsa Omidi; it can be downloaded fromthe Mathworks-link below. The author(s) read and approved the finalmanuscript.
FundingThis work was sponsored by the Western University and the Lawson HealthResearch Institute.
Availability of data and materialsAll data generated and analysed during this study are included in thispublished article and its Supplementary information files. The image
Janssen et al. Applied Microscopy (2021) 51:12 Page 10 of 12
processing software for co-registration and removal of any tissue movement(Co-registration and overlay) can be downloaded from the following link:https://www.mathworks.com/matlabcentral/fileexchange/73259-co-registration-and-overlay.Video 1 Combined composite movies of microbeads and a rolling leukocytein the EDL muscle microcirculation of the rat (Supplemental Video 1).Left panel: Composite video of images of the bright-field, red and green op-tical channel. Right panel: Composite video of images of the red and greenoptical channel only. Movie sequence is created using the co-registrationMatlab software, which can be downloaded from the Mathworks link in the“Availability of data and materials” section.Right panel: Composite video of images of the red and green opticalchannel only; movie sequence created using ImageJ (https://imagej.nih.gov/ij/).
Declaration
Competing interestsJeffrey Carson and Mohamadreza Najiminaini are co-founders, directors, andshareholders in Spectral Devices Inc. The other authors, Barry G.H. Janssen,Yan Min Zhang, and Parsa Omidi, have no conflict of interest to declare.
Author details1Department of Medical Biophysics, Western University, London, ON N6A5C1, Canada. 2Kidney Clinical Research Unit (KCRU), London Health SciencesCentre, London, ON N6C 6B5, Canada. 3Imaging Program, St.Joseph’s HealthCare, Lawson Health Research Institute, London, ON N6A 4V2, Canada.4Department of Pathology, Western University, London, ON N6A 5C1,Canada. 5Trauma Research Centre, Fourth Medical Center of the Chinese PLAGeneral Hospital, Beijing 100048, People’s Republic of China. 6School ofBiomedical Engineering, Western University, London, ON N6A 3K7, Canada.7Intensive Care Unit, Tianjin Nankai Hospital, Tianjin 300100, People’sRepublic of China.
Received: 12 February 2021 Accepted: 8 June 2021
ReferencesB.K. Al-Khazraji, N.M. Novielli, D. Goldman, P.J. Medeiros, D.N. Jackson, A simple
“Streak Length Method” for quantifying and characterizing red blood cellvelocity profiles and blood flow in rat skeletal muscle arterioles.Microcirculation 19(4), 327-335 (2012). https://doi.org/10.1111/j.1549-8719.2012.00165.x
R. Alon, S. Feigelson, From rolling to arrest on blood vessels: leukocyte tapdancing on endothelial integrin ligands and chemokines at sub-secondcontacts. Semin. Immunol. 14, 93 (2002)
E. Beerling, I. Oosterom, E. Voest, M. Lolkema, J. van Rheenen, Intravitalcharacterization of tumor cell migration in pancreatic cancer. Intravital 5(3),e1261773 (2016). https://doi.org/10.1080/21659087.2016.1261773
E. Beerling, L. Ritsma, N. Vrisekoop, P.W.B. Derksen, J. van Rheenen, Intravitalmicroscopy: new insights into metastasis of tumors. J. Cell Sci. 124, 299(2011)
R. Bordy, P. Totoson, C. Prati, C. Marie, D. Wendling, C. Demougeot, Microvascularendothelial dysfunction in rheumatoid arthritis. Nat. Rev. Rheumatol. 14, 404(2018)
A. Celi, G. Merrill-Skoloff, P. Gross, S. Falati, D.S. Sim, R. Flaumenhaft, B.C. Furie, B.Furie, Thrombus formation: direct real-time observation and digital analysisof Thrombus assembly in a living mouse by confocal and Widefield Intravitalmicroscopy. J. Thromb. Haemost. 1, 60 (2003)
Y.W. Choo, J. Jeong, K. Jung, Recent advances in Intravital microscopy forinvestigation of dynamic cellular behavior in vivo. BMB Rep. 53, 357 (2020)
D. Coling, B. Kachar, Principles and application of fluorescence microscopy. Curr.Protoc. Mol. Biol. Chapter 14, Unit 14.10 (2001)
G. Cox, Biological confocal microscopy. Mater. Today 5, 34 (2002)D. De Backer, D. Orbegozo Cortes, K. Donadello, J.-L. Vincent, Pathophysiology of
microcirculatory dysfunction and the pathogenesis of septic shock. Virulence5, 73 (2014)
M.L. Ellsworth, R.N. Pittman, C.G. Ellis, Measurement of hemoglobin oxygensaturation in capillaries. Am. J. Phys. 252, H1031 (1987)
B. Furie, B.C. Furie, Thrombus formation in vivo. J. Clin. Invest. 115, 3355 (2005)
F. Helmchen, W. Denk, Deep tissue two-photon microscopy. Nat. Methods 2, 932(2005)
J. James, H.J. Tanke, Biomedical Light Microscopy (Springer Science & BusinessMedia, Dordrecht, 2012)
G.H. Janssen, G.J. Tangelder, M.G.O. Egbrink, R.S. Reneman, Spontaneousleukocyte rolling in venules in untraumatized skin of conscious andanesthetized animals. Am. J. Physiol. 267, H1199 (1994)
S.A. Japee, R.N. Pittman, C.G. Ellis, Automated method for tracking individual redblood cells within capillaries to compute velocity and oxygen saturation.Microcirculation (New York, N.Y. : 1994) 12, 507 (2005a)
S.A. Japee, R.N. Pittman, C.G. Ellis, A new video image analysis system to studyred blood cell dynamics and oxygenation in capillary networks.Microcirculation (New York, N.Y. : 1994) 12, 489 (2005b)
C.N. Jenne, C.H.Y. Wong, B. Petri, P. Kubes, The use of spinning-disk confocalmicroscopy for the Intravital analysis of platelet dynamics in response tosystemic and local inflammation. PLoS One 6, e25109 (2011)
H. Jiang, Y. Wei, Y. Shi, C.B. Wright, X. Sun, G. Gregori, F. Zheng, E.A. Vanner, B.L.Lam, T. Rundek, J. Wang, Altered macular microvasculature in mild cognitiveimpairment and Alzheimer disease. J. Neuro-Ophthalmol. 38, 292 (2018)
A. Karaman Koç, H.E. Koçak, B.Ç. Erdoğan, H.A. Ulusoy, M. Yiğitbay, Z.T. Bilece, M.S.Elbistanlı, K.H. Kaya, Severe OSAS causes systemic microvascular dysfunction:Clinical evaluation of ninety-eight OSAS patients. Clin Otolaryngol 44(3), 412-415(2019). https://doi.org/10.1111/coa.13285
A.G. Koutsiaris, A velocity profile equation for blood flow in small arterioles andvenules of small mammals in vivo and an evaluation based on literaturedata. Clin. Hemorheol. Microcirc. 43, 321 (2009)
K. Ley, J. Mestas, M.K. Pospieszalska, P. Sundd, A. Groisman, A. Zarbock, Chapter11. Intravital microscopic investigation of leukocyte interactions with theblood vessel wall. Methods Enzymol. 445, 255 (2008)
W. Li, R.G. Nava, A.C. Bribriesco, B.H. Zinselmeyer, J.H. Spahn, A.E. Gelman, A.S.Krupnick, M.J. Miller, D. Kreisel, Intravital 2-photon imaging of leukocytetrafficking in beating heart. J. Clin. Invest. 122, 2499 (2012)
H.H. Lipowsky, Microvascular rheology and hemodynamics. Microcirculation 12, 5(2005)
O. Mahmoud, G. Janssen, M.R. El-Sakka, Machine-learning-based functionalmicrocirculation analysis. AAAI 34, 13326 (2020)
A. Nakano, Spinning-disk confocal microscopy. A cutting-edge tool for imagingof membrane traffic. Cell Struct. Funct. 27, 349 (2002)
M.D. Nelson, J. Wei, C.N. Bairey Merz, Coronary microvascular dysfunction andheart failure with preserved ejection fraction as female-pattern cardiovasculardisease: the chicken or the egg? Eur. Heart J. 39, 850 (2018)
M. Nitzan, A. Romem, R. Koppel, Pulse oximetry: fundamentals and technologyupdate. Med. Devices (Auckland, N.Z.) 7, 231 (2014)
M.G.A. Oude Egbrink, G.H.G.W. Janssen, K. Ookawa, D.W. Slaaf, R.S. Reneman, X.H.T. Wehrens, K.J.M. Maaijwee, N. Ohshima, H.A.J. Struijker Boudier, G.J.Tangelder, Especially Polymorphonuclear leukocytes, but alsomonomorphonuclear leukocytes, roll spontaneously in venules of intact ratskin: involvement of E-selectin. J. Invest. Dermatol. 118, 323 (2002)
S. Pai, K.J. Danne, J. Qin, L.L. Cavanagh, A. Smith, M.J. Hickey, W. Weninger,Visualizing leukocyte trafficking in the living brain with 2-photon intravitalmicroscopy. Front. Cell. Neurosci. 6(67), 1 (2013). https://doi.org/10.3389/fncel.2012.00067
N. Percie du Sert, V. Hurst, A. Ahluwalia, S. Alam, M.T. Avey, M. Baker, W.J. Browne,A. Clark, I.C. Cuthill, U. Dirnagl, M. Emerson, P. Garner, S.T. Holgate, D.W.Howells, N.A. Karp, S.E. Lazic, K. Lidster, C.J. MacCallum, M. Macleod, E.J. Pearl,O.H. Petersen, F. Rawle, P. Reynolds, K. Rooney, E.S. Sena, S.D. Silberberg, T.Steckler, H. Würbel, The ARRIVE Guidelines 2.0: updated guidelines forreporting animal research. PLoS Biol 18, e3000410 (2020)
V. Pinho, F.M. Coelho, G.B. Menezes, D.C. Cara, Intravital microscopy to studyleukocyte recruitment in vivo. Methods Mol. Biol. (Clifton, NJ) 689, 81(2011)
N.S. Rost, P. Cougo, S. Lorenzano, H. Li, L. Cloonan, M.J. Bouts, A. Lauer, M.R.Etherton, H.H. Karadeli, P.L. Musolino, W.A. Copen, K. Arai, E.H. Lo, S.K. Feske,K.L. Furie, O. Wu, Diffuse microvascular dysfunction and loss of white matterintegrity predict poor outcomes in patients with acute ischemic stroke. J.Cereb. Blood Flow Metab. 38, 75 (2018)
A. Sckell, M. Leunig, Dorsal skinfold chamber preparation in mice: studyingangiogenesis by intravital microscopy. Methods Mol. Biol. (Clifton, NJ) 1430,251 (2016)
T. Shimozawa, K. Yamagata, T. Kondo, S. Hayashi, A. Shitamukai, D. Konno, F.Matsuzaki, J. Takayama, S. Onami, H. Nakayama, Y. Kosugi, T.M. Watanabe, K.
Janssen et al. Applied Microscopy (2021) 51:12 Page 11 of 12

Fujita, Y. Mimori-Kiyosue, Improving spinning disk confocal microscopy bypreventing pinhole cross-talk for intravital imaging. PNAS 110, 3399 (2013)
K. Shin-Ichiro, N. Hideomi, O. Shinya, in Yokogawa technical report english Edition17. Confocal laser microscope scanner and CCD camera (2002)
S. Stehbens, H. Pemble, L. Murrow, T. Wittmann, Imaging intracellular protein dynamicsby spinning disk confocal microscopy. Methods Enzymol. 504, 293 (2012)
C.D.A. Stehouwer, Microvascular dysfunction and hyperglycemia: a vicious cyclewith widespread consequences. Diabetes 67, 1729 (2018)
G.J. Tangelder, D.W. Slaaf, A.M. Muijtjens, T. Arts, M.G.O. Egbrink, R.S. Reneman,Velocity profiles of blood platelets and red blood cells flowing in arterioles ofthe rabbit mesentery. Circ. Res. 59(5), 505-514 (1986). https://doi.org/10.1161/01.res.59.5.505. PMID: 3802426
G.M. Tozer, S.M. Ameer-Beg, J. Baker, P.R. Barber, S.A. Hill, R.J. Hodgkiss, R. Locke,V.E. Prise, I. Wilson, B. Vojnovic, Intravital imaging of tumour vascularnetworks using multi-photon fluorescence microscopy. Adv. Drug Deliv. Rev.57, 135 (2005)
R. F. Tuma, W. F. Duran, and K. Ley, (eds.), in Handbook of Physiology:Microcirculation, 2nd edn. (Academic Press, 2008).
K. Tyml, C.H. Budreau, A. New, Preparation of rat extensor Digitorum longusmuscle for Intravital investigation of the microcirculation. Int. J. Microcirc.Clin. Exp. 10, 335 (1991)
A.L. van de Ven, M. Wu, J. Lowengrub, S.R. McDougall, M.A.J. Chaplain, V. Cristini,M. Ferrari, H.B. Frieboes, Integrated Intravital microscopy and mathematicalmodeling to optimize nanotherapeutics delivery to tumors. AIP Adv. 2,011208 (2012)
S. Zaim, J.H. Chong, V. Sankaranarayanan, A. Harky, COVID-19 and multiorganresponse. Curr. Probl. Cardiol. 45(8), 100618 (2020). https://doi.org/10.1016/j.cpcardiol.2020.100618
W.G. Zijlstra, A. Buursma, W.P. Meeuwsen-van der Roest, Absorption spectra ofhuman fetal and adult oxyhemoglobin, de-oxyhemoglobin,carboxyhemoglobin, and methemoglobin. Clin. Chem. 37, 1633 (1991)
Publisher’s NoteSpringer Nature remains neutral with regard to jurisdictional claims inpublished maps and institutional affiliations.
Janssen et al. Applied Microscopy (2021) 51:12 Page 12 of 12
Copyright © 2022 FDOKUMEN