Standard precipitation index to track drought and assess impact of rainfall on watertables in...
19
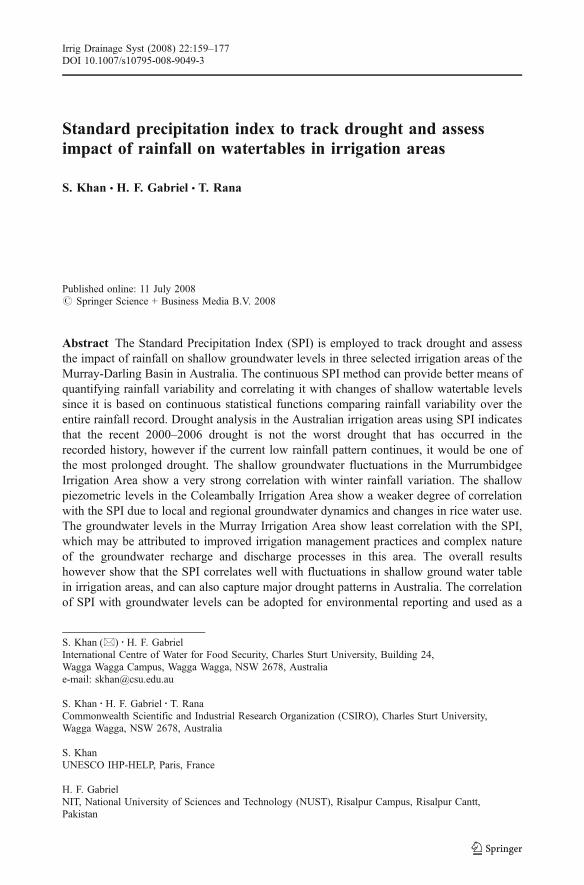
Standard precipitation index to track drought and assess impact of rainfall on watertables in irrigation areas S. Khan & H. F. Gabriel & T. Rana Published online: 11 July 2008 # Springer Science + Business Media B.V. 2008 Abstract The Standard Precipitation Index (SPI) is employed to track drought and assess the impact of rainfall on shallow groundwater levels in three selected irrigation areas of the Murray-Darling Basin in Australia. The continuous SPI method can provide better means of quantifying rainfall variability and correlating it with changes of shallow watertable levels since it is based on continuous statistical functions comparing rainfall variability over the entire rainfall record. Drought analysis in the Australian irrigation areas using SPI indicates that the recent 2000–2006 drought is not the worst drought that has occurred in the recorded history, however if the current low rainfall pattern continues, it would be one of the most prolonged drought. The shallow groundwater fluctuations in the Murrumbidgee Irrigation Area show a very strong correlation with winter rainfall variation. The shallow piezometric levels in the Coleambally Irrigation Area show a weaker degree of correlation with the SPI due to local and regional groundwater dynamics and changes in rice water use. The groundwater levels in the Murray Irrigation Area show least correlation with the SPI, which may be attributed to improved irrigation management practices and complex nature of the groundwater recharge and discharge processes in this area. The overall results however show that the SPI correlates well with fluctuations in shallow ground water table in irrigation areas, and can also capture major drought patterns in Australia. The correlation of SPI with groundwater levels can be adopted for environmental reporting and used as a Irrig Drainage Syst (2008) 22:159–177 DOI 10.1007/s10795-008-9049-3 S. Khan (*) : H. F. Gabriel International Centre of Water for Food Security, Charles Sturt University, Building 24, Wagga Wagga Campus, Wagga Wagga, NSW 2678, Australia e-mail: [email protected] S. Khan : H. F. Gabriel : T. Rana Commonwealth Scientific and Industrial Research Organization (CSIRO), Charles Sturt University, Wagga Wagga, NSW 2678, Australia S. Khan UNESCO IHP-HELP, Paris, France H. F. Gabriel NIT, National University of Sciences and Technology (NUST), Risalpur Campus, Risalpur Cantt, Pakistan
Transcript of Standard precipitation index to track drought and assess impact of rainfall on watertables in...
Standard precipitation index to track drought and assessimpact of rainfall on watertables in irrigation areas
S. Khan & H. F. Gabriel & T. Rana
Published online: 11 July 2008# Springer Science + Business Media B.V. 2008
Abstract The Standard Precipitation Index (SPI) is employed to track drought and assessthe impact of rainfall on shallow groundwater levels in three selected irrigation areas of theMurray-Darling Basin in Australia. The continuous SPI method can provide better means ofquantifying rainfall variability and correlating it with changes of shallow watertable levelssince it is based on continuous statistical functions comparing rainfall variability over theentire rainfall record. Drought analysis in the Australian irrigation areas using SPI indicatesthat the recent 2000–2006 drought is not the worst drought that has occurred in therecorded history, however if the current low rainfall pattern continues, it would be one ofthe most prolonged drought. The shallow groundwater fluctuations in the MurrumbidgeeIrrigation Area show a very strong correlation with winter rainfall variation. The shallowpiezometric levels in the Coleambally Irrigation Area show a weaker degree of correlationwith the SPI due to local and regional groundwater dynamics and changes in rice water use.The groundwater levels in the Murray Irrigation Area show least correlation with the SPI,which may be attributed to improved irrigation management practices and complex natureof the groundwater recharge and discharge processes in this area. The overall resultshowever show that the SPI correlates well with fluctuations in shallow ground water tablein irrigation areas, and can also capture major drought patterns in Australia. The correlationof SPI with groundwater levels can be adopted for environmental reporting and used as a
Irrig Drainage Syst (2008) 22:159–177DOI 10.1007/s10795-008-9049-3
S. Khan (*) :H. F. GabrielInternational Centre of Water for Food Security, Charles Sturt University, Building 24,Wagga Wagga Campus, Wagga Wagga, NSW 2678, Australiae-mail: [email protected]
S. Khan : H. F. Gabriel : T. RanaCommonwealth Scientific and Industrial Research Organization (CSIRO), Charles Sturt University,Wagga Wagga, NSW 2678, Australia
S. KhanUNESCO IHP-HELP, Paris, France
H. F. GabrielNIT, National University of Sciences and Technology (NUST), Risalpur Campus, Risalpur Cantt,Pakistan
method of relating climatic impacts on watertables. Differences in piezometric responsebetween years with similar winter and yearly SPI values can be attributed to improvementin irrigators’ management practices.
Keywords Australia . Drought . Murray-darling basin . Rainfall variability .
Standard Precipitation Index (SPI) . Regression .Watertable
Introduction
Rainfall is one of the key factors affecting the sustainability of irrigation areas in terms ofdictating the need for supplemental irrigation to meet crop water demand and determiningdrainage requirements to avoid shallow watertable conditions and secondary soilsalinisation. The variability of rainfall in the upper catchments of rivers determines thewater available in storage reservoirs that can be available for irrigation to meet crop wateruse requirements. In irrigation regions the volume of rainfall over and above crop waterrequirements and soil storage capacity enters the groundwater and contributes to risingwater tables and secondary salinisation.
Quantifying rainfall variability has been an area of great interest for many researchersstudying the droughts in Australia (Foley 1957; Gibbs and Maher 1967; Opoku-Ankomah andCordery 1993; Smith et al. 1993; White and O’Meagher 1995). While the effects of lowrainfall and associated drought are dramatic and immediately obvious, the effects of highrainfall are much less noticeable except in extreme cases, and even then the effects can oftengo unnoticed for many years. In Australia, concerns about the contribution of rainfall to thedevelopment of shallow water table condition over the irrigation areas arose in the early1930’s in the Riverine Plains in the New South Wales. During the winter of 1931, majorwaterlogging problems appeared on the horticultural farms of the Murrumbidgee IrrigationArea when 92 mm rainfall fell during June (Butler 1971) and perched watertable rose to theground surface in many places. Later investigations showed presence of ‘blue’ clay layers at3 m depth, which allow very slow vertical drainage. The limiting vertical drainage capacitycombined with overall shallow piezometric levels rendered areas of the Riverine Plains athigh risk of waterlogging and salinisation if winter rainfalls were above the average. Lately,during the period 2000–2006, shallow watertables in irrigation areas dropped due to lowerwater allocations, improved irrigation practices and below average rainfall.
There is a need to differentiate and quantify the influence of rainfall on water tables fromthe management impacts, to ascertain whether reductions in shallow watertable areas underthe irrigation areas are a result of dry climatic conditions or improved land and watermanagement practices or both. In order to understand the impact of rainfall on water tablesit is necessary to understand its seasonal variability. In this paper the Standard PrecipitationIndex (SPI) is employed to track drought and assess the impact of rainfall on water tables inthe three irrigation areas of the Murray-Darling Basin in Australia.
Standard precipitation index
Standard Precipitation Index is a state-of-the-art method for assessing climatic variabilityand was developed by McKee et al. (1993, 1995). The SPI is based on statisticaltechniques, which can quantify the degree of wetness by comparing three, six, 12 or 24-monthly rainfall totals with the historical rainfall period over the history. For example, a sixmonthly SPI for August 2006 will compare the March 2006 to August 2006 rainfall totals
160
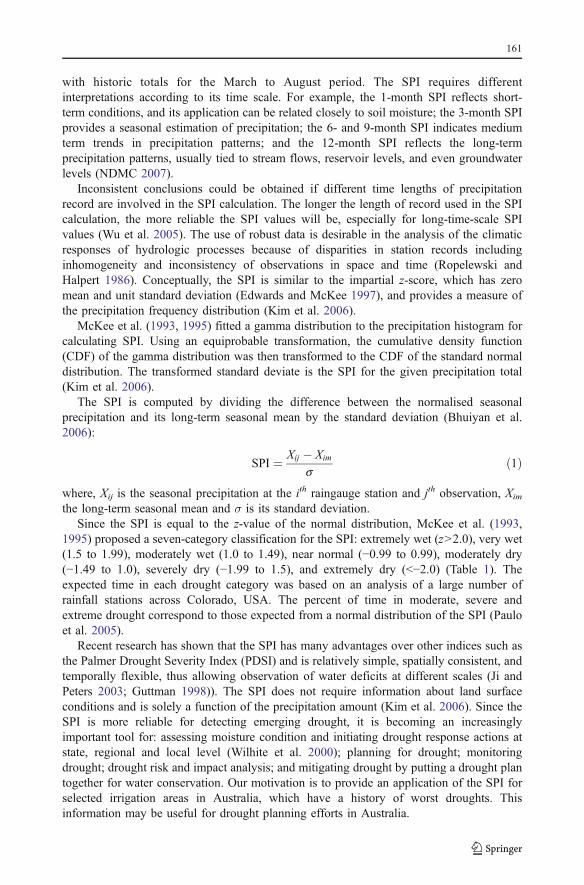
with historic totals for the March to August period. The SPI requires differentinterpretations according to its time scale. For example, the 1-month SPI reflects short-term conditions, and its application can be related closely to soil moisture; the 3-month SPIprovides a seasonal estimation of precipitation; the 6- and 9-month SPI indicates mediumterm trends in precipitation patterns; and the 12-month SPI reflects the long-termprecipitation patterns, usually tied to stream flows, reservoir levels, and even groundwaterlevels (NDMC 2007).
Inconsistent conclusions could be obtained if different time lengths of precipitationrecord are involved in the SPI calculation. The longer the length of record used in the SPIcalculation, the more reliable the SPI values will be, especially for long-time-scale SPIvalues (Wu et al. 2005). The use of robust data is desirable in the analysis of the climaticresponses of hydrologic processes because of disparities in station records includinginhomogeneity and inconsistency of observations in space and time (Ropelewski andHalpert 1986). Conceptually, the SPI is similar to the impartial z-score, which has zeromean and unit standard deviation (Edwards and McKee 1997), and provides a measure ofthe precipitation frequency distribution (Kim et al. 2006).
McKee et al. (1993, 1995) fitted a gamma distribution to the precipitation histogram forcalculating SPI. Using an equiprobable transformation, the cumulative density function(CDF) of the gamma distribution was then transformed to the CDF of the standard normaldistribution. The transformed standard deviate is the SPI for the given precipitation total(Kim et al. 2006).
The SPI is computed by dividing the difference between the normalised seasonalprecipitation and its long-term seasonal mean by the standard deviation (Bhuiyan et al.2006):
SPI ¼ Xij � Xim
sð1Þ
where, Xij is the seasonal precipitation at the ith raingauge station and jth observation, Xim
the long-term seasonal mean and σ is its standard deviation.Since the SPI is equal to the z-value of the normal distribution, McKee et al. (1993,
1995) proposed a seven-category classification for the SPI: extremely wet (z>2.0), very wet(1.5 to 1.99), moderately wet (1.0 to 1.49), near normal (−0.99 to 0.99), moderately dry(−1.49 to 1.0), severely dry (−1.99 to 1.5), and extremely dry (<−2.0) (Table 1). Theexpected time in each drought category was based on an analysis of a large number ofrainfall stations across Colorado, USA. The percent of time in moderate, severe andextreme drought correspond to those expected from a normal distribution of the SPI (Pauloet al. 2005).
Recent research has shown that the SPI has many advantages over other indices such asthe Palmer Drought Severity Index (PDSI) and is relatively simple, spatially consistent, andtemporally flexible, thus allowing observation of water deficits at different scales (Ji andPeters 2003; Guttman 1998)). The SPI does not require information about land surfaceconditions and is solely a function of the precipitation amount (Kim et al. 2006). Since theSPI is more reliable for detecting emerging drought, it is becoming an increasinglyimportant tool for: assessing moisture condition and initiating drought response actions atstate, regional and local level (Wilhite et al. 2000); planning for drought; monitoringdrought; drought risk and impact analysis; and mitigating drought by putting a drought plantogether for water conservation. Our motivation is to provide an application of the SPI forselected irrigation areas in Australia, which have a history of worst droughts. Thisinformation may be useful for drought planning efforts in Australia.
161
Previous studies to quantify rainfall variability
In the recent times Australia has been facing a very prolonged drought, which promoted thethen Australian Prime Minister to foreshadow the possibility of zero water allocation toagriculture in 2007/08. Tools and methods are hence increasingly being sought to analysethe droughts and develop mitigation plans. Khan and Short (2001) used the SPI to analysehow it relates with known years of drought in the Murray-Darling Basin. It was determinedthat persistently negative 12- and 24-monthly SPI were the best indicators of droughtconditions. In a similar vein, Khan et al. (2002) divided the historic rainfall amounts beforeand after 1950 to show an increase in the average annual rainfall and an increase in thevariability of that rainfall at sites along the Murrumbidgee River. The study also showedthat the average availability of water in the Murrumbidgee River increased after the 1950'sand allowed policy-makers to over-allocate surface and groundwater resources (Khan et al.2002).
Wu et al. (2001) evaluated the SPI, China-Z Index (CZI) and the statistical Z-Score on1-, 3-, 6-, 9- and 12-month time scales using monthly precipitation totals for four locationsin China from January 1951 to December 1998 representing humid and arid climates, andcases of drought and flood. The CZI and Z-Score provided results similar to the SPI for alltime scales, and that the calculations of the CZI and Z-Score was relatively easily comparedwith the SPI, possibly offering better tools to monitor moisture conditions.
Lloyd-Hughes and Saunders (2002) analysed the incidence of 20th century Europeandrought, based on the monthly SPIs calculated on a 0.5° grid over the European region 35–70° N and 35° E–10° W at time scales of 3, 6, 9, 12, 18, and 24 months for the period1901–1999. Their approach provided, for a given location or region, the time series ofdrought strength, the number, the mean duration, and the maximum duration of droughts ofa given intensity, and the trend in drought incidence.
Bonaccorso et al. (2003) carried out an analysis of drought in Sicily from 1926 to 1996.Drought occurrence was estimated by means of the SPI. To study long-term droughtvariability, a Principal Component Analysis (PCA) was also applied to the SPI field. Acombination of SPI and PCA was also used by Bordi et al. (2004) for studying the time–space covariability of dry and wet periods during the last 50 years in eastern China.
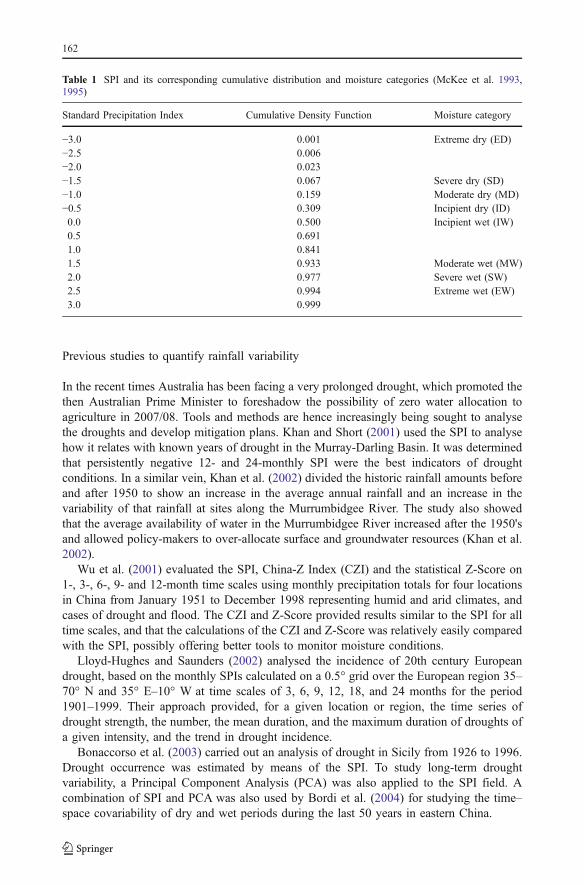
Table 1 SPI and its corresponding cumulative distribution and moisture categories (McKee et al. 1993,1995)
Standard Precipitation Index Cumulative Density Function Moisture category
−3.0 0.001 Extreme dry (ED)−2.5 0.006−2.0 0.023−1.5 0.067 Severe dry (SD)−1.0 0.159 Moderate dry (MD)−0.5 0.309 Incipient dry (ID)0.0 0.500 Incipient wet (IW)0.5 0.6911.0 0.8411.5 0.933 Moderate wet (MW)2.0 0.977 Severe wet (SW)2.5 0.994 Extreme wet (EW)3.0 0.999
162
Min et al. (2003) showed that the occurrence of droughts over central eastern China,Manchuria, and the north coast of Japan was highly correlated with those in Korea.However, the time scales of occurrence of droughts over the three regions were different:droughts in eastern China represented in-phase variations with those in Korea with a timeinterval of 5–8 years; those in Manchuria occurred with a time interval of 15 years; andthose in Japan had no coincident variations.
Quiring and Papakryiakou (2003) carried out a comparative performance analysis todetermine the most appropriate index for monitoring agricultural drought and predictingspring wheat yield on the Canadian prairies. A series of curvilinear regression-based cropyield models were generated for each of the 43 crop districts (20 in Saskatchewan, 12 inManitoba, and 11 in Alberta) based on four commonly used measures of agriculturaldrought (SPI, PDSI, Palmer’s Z-index, and NOAA Drought Index). The significantvariations in model performance between the four agricultural drought indices underscoredthe necessity of carrying out a performance evaluation prior to selecting the mostappropriate agricultural drought index for a particular application.
Wu et al. (2004) developed an agricultural drought risk-assessment model for Nebraska,USA, for corn and soybeans on the basis of variables derived from the SPI and crop-specific drought index using multivariate techniques. The model can be used to assess real-time agricultural drought risk for specific crops at critical times before and during thegrowing season by retaining previous and adding current, weather information as the cropspass through the various growth stages.
Data mining techniques have also been used to find associations between drought andseveral oceanic and climatic indices (Tadesse et al. 2004) that could help users in makingknowledgeable decisions before the drought actually occurs. The drought episodes weredetermined based on the SPI and PDSI. Associations were observed between droughtepisodes in Nebraska, USA and oceanic and atmospheric indices such as the SouthernOscillation Index and the Pacific Decadal Oscillation Index.
Likewise Paulo et al. (2005) showed that SPI and Markov chain stochastic models canbe used to monitor droughts and to produce early warning in combination with otherindicators for several sites of Alentejo, a drought prone region of southern Portugal.
Finally, research conducted in the Murrumbidgee Irrigation Area, Australia show thatacross the entire area, groundwater recharge from rainfall and irrigation cause changes indiscrete layers of shallow groundwater with different chemical compositions for 30 m fromthe top of the watertable. After an irrigation event, the salinity of the groundwater quicklydecreases, but during the drying phase, it increases due to the capillary uptake of freshwaterby the crops. The salt crystals are left behind and, as a result, the quality of the groundwaterdeteriorates (Northey et al. 2005).
The above studies show the possibility of using precipitation indices such as the SPI forseasonal water/irrigation management in several countries around the globe. Theknowledge-based for Australia is rather limited. This study therefore aims to assess theimpact of rainfall variability on shallow water tables in selected irrigation areas in Australia,to provide a management tool to farmers and irrigation companies.
Description of study area
The Murray-Darling Basin, which crosses four state boundaries in south-eastern Australianamely New South Wales, Victoria, South Australia, and Queensland, is characterized byits extensive irrigation schemes. It is one of Australia's largest drainage basins. It is
163
comprised of the three longest rivers in Australia. These are the Murray River, which is2,530 km long, the Darling River, which is 2,740 km long, and the Murrumbidgee Riverwhich is 1,690 km long (DEH 2005). Twenty-one smaller rivers and hundreds of othertributaries are also located within the Basin (Crabb 1997).
By covering 1,061,469 km2, the Murray-Darling Basin makes up 14% of Australia'slandmass (Crabb 1997). Globally it ranks 21st in drainage basin area (DEH 2005). Thisdrainage basin, however, is characterized by very low water runoff. In fact, 86% of theBasin contributes no runoff to the rivers except during times of flood (Crabb 1997). Sincethe majority of Australia receives between 0 to 500 mm of rain each year and the south-eastern Australia falls within this majority, water availability has historically beeninconsistent within the Murray-Darling Basin (BOM 2006). Since the 1950's, however,south-eastern Australia has shown a major climate shift leading to rainfall variability whichhas resulted in more frequent extremes in high and low rainfall events (Khan et al. 2002).
The lack of runoff and extreme variability of rainfall greatly affect the flow of the riversin the Basin. For example, in the town of Menindee, between 1885 and 1960, the DarlingRiver stopped flowing on 48 separate occasions and between 1902 and 1903, it had nowater for 364 consecutive days (Crabb 1997).
These periods of drought and lack of river flows caused the Australian federalgovernment to form the River Murray Agreement with the State governments of New SouthWales, Victoria, and South Australia in 1915. This agreement created plans for permanentflows of water for irrigation and navigation (Khan et al. 2002). It allowed for the creation oflocks and weirs along the Murray and Murrumbidgee Rivers. Also, reservoirs, such as theBurrinjuck Dam on the Murrumbidgee River, were created and irrigation areas weredeveloped. These areas quickly became vital to the economy. They provide water for the51,672 farms that make up 80% of the entire Murray-Darling Basin (Crabb 1997). Theproduction of the crops in the area depends greatly on the reliability of water. As a result,the irrigation areas and rainfall amounts affect the rice, wheat, barley, cotton, oil seeds,grapes, citrus fruits, and a large variety of other cereals and beans (Crabb 1997).
The Murrumbidgee Irrigation Area (MIA) and the Coleambally Irrigation Area (CIA) aretwo irrigation areas that were developed along the Murrumbidgee River. This river flowswest from the Snowy Mountains where it receives most of its source water. Near the townof Balranald, on the border between New South Wales and Victoria, it joins up with theMurray River. Together, the MIA and the CIA have a total of 10,000 km of irrigationchannels. Their irrigation industry provides 25% of New South Wales’ fruits andvegetables, 42% of its grapes, and 50% of all of Australia's rice. In total, agriculture inthese two irrigation areas contributes $1.9 billion annually to the Australian economy(NRM 2004).
Methodology
SPI data collection
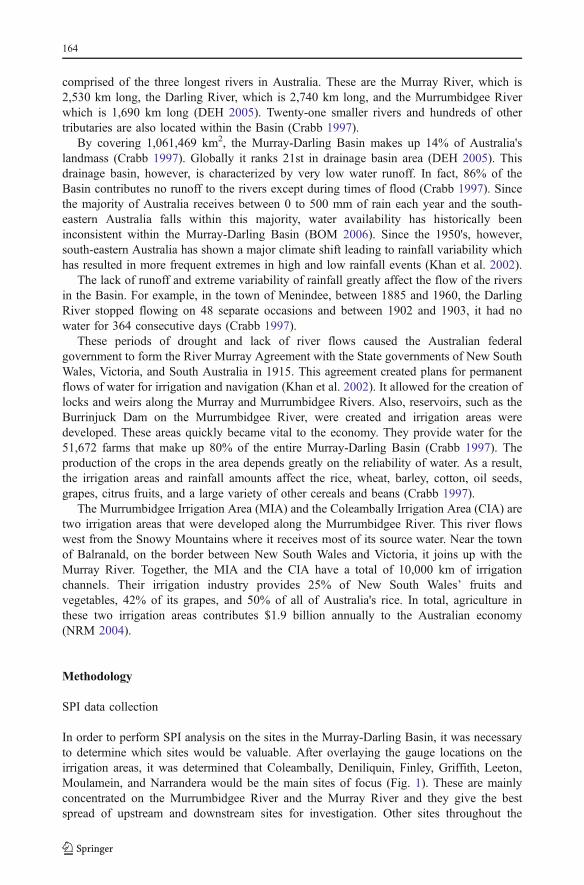
In order to perform SPI analysis on the sites in the Murray-Darling Basin, it was necessaryto determine which sites would be valuable. After overlaying the gauge locations on theirrigation areas, it was determined that Coleambally, Deniliquin, Finley, Griffith, Leeton,Moulamein, and Narrandera would be the main sites of focus (Fig. 1). These are mainlyconcentrated on the Murrumbidgee River and the Murray River and they give the bestspread of upstream and downstream sites for investigation. Other sites throughout the
164
Murray-Darling Basin were examined to gain a spatial comparison of rainfall conditions.The continuous daily meteorological data was retrieved from the websites of AustralianBureau of Meteorology (www.bom.gov.au/silo/) and Department of Natural Resources andWater (http://www.nrw.qld.gov.au/silo/). The evapotranspiration data from these sites werealso used to make comparisons on the amount of water provided by rainfall and the amountof water required by the crops at the different sites.
Groundwater data collection
Over 3,000 piezometers were used to collect data on the watertable behaviour in theMurray-Darling Basin. The groundwater data was used to create a comparison with the SPIanalysis. In theory, over the course of a dry year with a negative SPI value, the averagepiezometric level should decrease. This means that the watertable would get deeper becauseless water is available to recharge it. To test this hypothesis, September SPI values (three,six, 12 and 24 monthly) were plotted against the change in spatial average piezometricvalue in the Coleambally, Murrumbidgee and Murray Irrigation Areas.
Results and discussions
Drought analysis
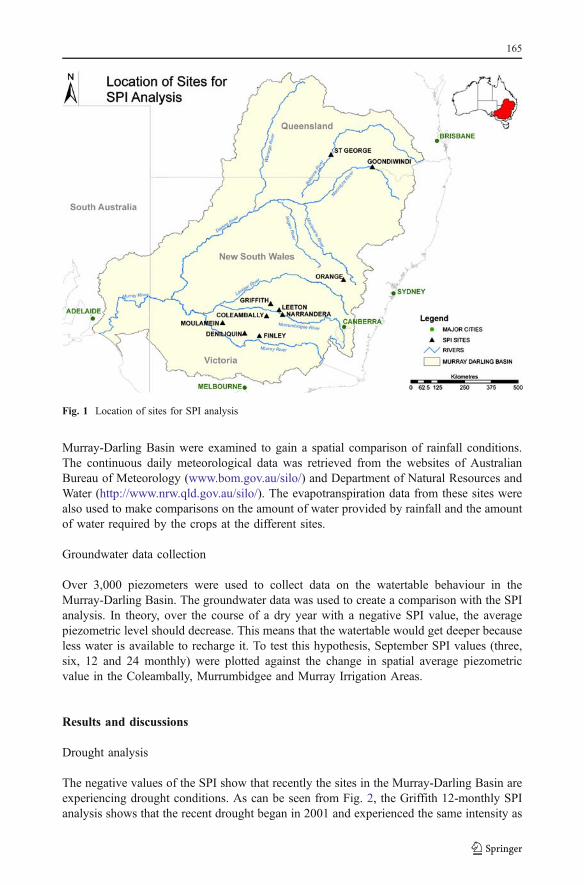
The negative values of the SPI show that recently the sites in the Murray-Darling Basin areexperiencing drought conditions. As can be seen from Fig. 2, the Griffith 12-monthly SPIanalysis shows that the recent drought began in 2001 and experienced the same intensity as
Fig. 1 Location of sites for SPI analysis
165
many droughts throughout history such as the ones that occurred in 1991, 1965, 1940,1929, and 1898. It is not nearly as intense as the droughts that occurred in 1982, 1914 and1902. It is, however, a much more prolonged drought than the previous droughts. As can beobserved from this figure, the more intense historical droughts would have very low rainfallfor 1 or 2 years followed by 1 or 2 years of above average rain. The recent drought has notbeen followed by years of above average rainfall. Instead, Griffith continues to have belowaverage rainfall conditions.
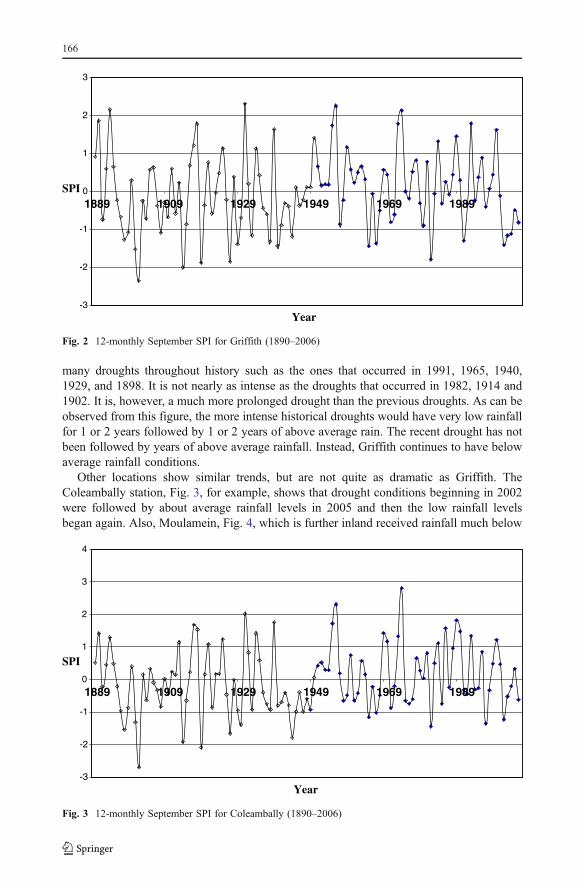
Other locations show similar trends, but are not quite as dramatic as Griffith. TheColeambally station, Fig. 3, for example, shows that drought conditions beginning in 2002were followed by about average rainfall levels in 2005 and then the low rainfall levelsbegan again. Also, Moulamein, Fig. 4, which is further inland received rainfall much below
-3
-2
-1
0
1
2
3
1889 1909 1929 1949 1969 1989
Year
SPI
Fig. 2 12-monthly September SPI for Griffith (1890–2006)
-3
-2
-1
0
1
2
3
4
1889 1909 1929 1949 1969 1989
SPI
Year
Fig. 3 12-monthly September SPI for Coleambally (1890–2006)
166
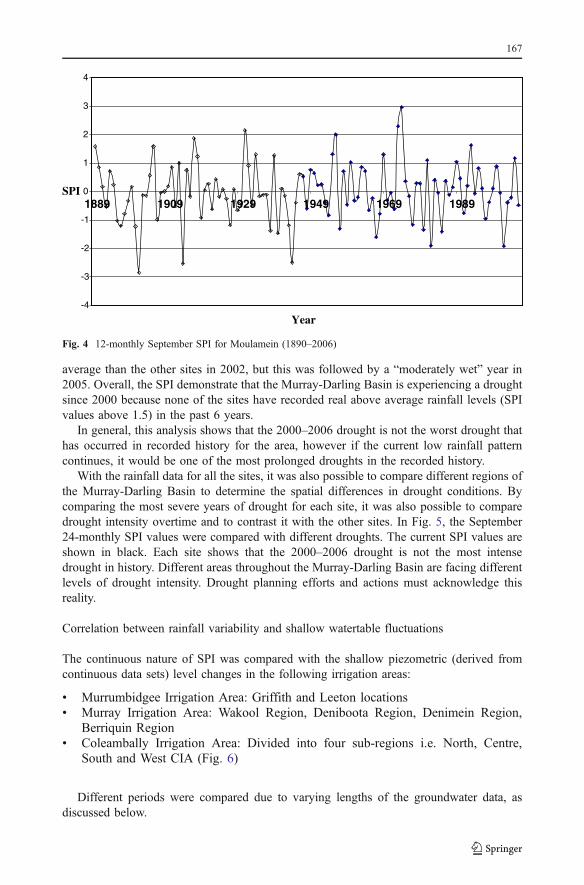
average than the other sites in 2002, but this was followed by a “moderately wet” year in2005. Overall, the SPI demonstrate that the Murray-Darling Basin is experiencing a droughtsince 2000 because none of the sites have recorded real above average rainfall levels (SPIvalues above 1.5) in the past 6 years.
In general, this analysis shows that the 2000–2006 drought is not the worst drought thathas occurred in recorded history for the area, however if the current low rainfall patterncontinues, it would be one of the most prolonged droughts in the recorded history.
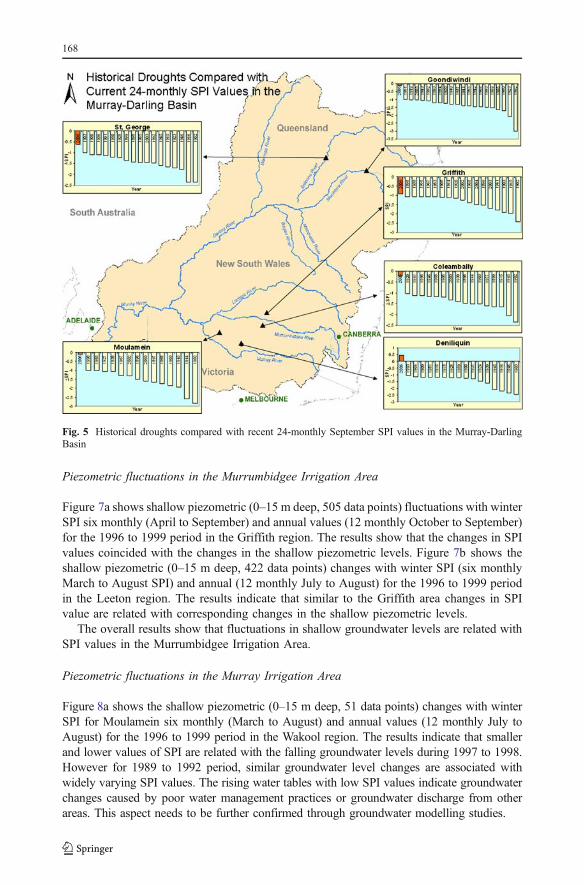
With the rainfall data for all the sites, it was also possible to compare different regions ofthe Murray-Darling Basin to determine the spatial differences in drought conditions. Bycomparing the most severe years of drought for each site, it was also possible to comparedrought intensity overtime and to contrast it with the other sites. In Fig. 5, the September24-monthly SPI values were compared with different droughts. The current SPI values areshown in black. Each site shows that the 2000–2006 drought is not the most intensedrought in history. Different areas throughout the Murray-Darling Basin are facing differentlevels of drought intensity. Drought planning efforts and actions must acknowledge thisreality.
Correlation between rainfall variability and shallow watertable fluctuations
The continuous nature of SPI was compared with the shallow piezometric (derived fromcontinuous data sets) level changes in the following irrigation areas:
& Murrumbidgee Irrigation Area: Griffith and Leeton locations& Murray Irrigation Area: Wakool Region, Deniboota Region, Denimein Region,
Berriquin Region& Coleambally Irrigation Area: Divided into four sub-regions i.e. North, Centre,
South and West CIA (Fig. 6)
Different periods were compared due to varying lengths of the groundwater data, asdiscussed below.
-4
-3
-2
-1
0
1
2
3
4
1889 1909 1929 1949 1969 1989
Year
SPI
Fig. 4 12-monthly September SPI for Moulamein (1890–2006)
167
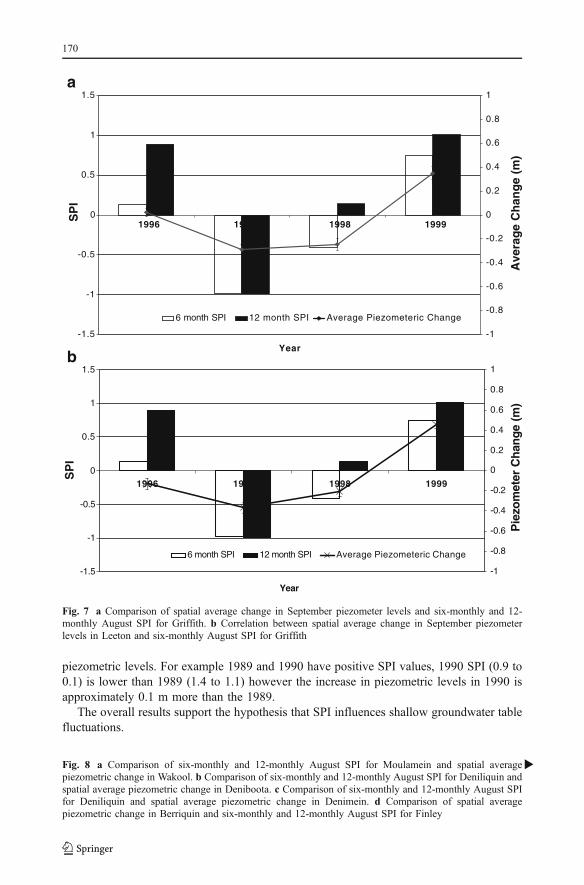
Piezometric fluctuations in the Murrumbidgee Irrigation Area
Figure 7a shows shallow piezometric (0–15 m deep, 505 data points) fluctuations with winterSPI six monthly (April to September) and annual values (12 monthly October to September)for the 1996 to 1999 period in the Griffith region. The results show that the changes in SPIvalues coincided with the changes in the shallow piezometric levels. Figure 7b shows theshallow piezometric (0–15 m deep, 422 data points) changes with winter SPI (six monthlyMarch to August SPI) and annual (12 monthly July to August) for the 1996 to 1999 periodin the Leeton region. The results indicate that similar to the Griffith area changes in SPIvalue are related with corresponding changes in the shallow piezometric levels.
The overall results show that fluctuations in shallow groundwater levels are related withSPI values in the Murrumbidgee Irrigation Area.
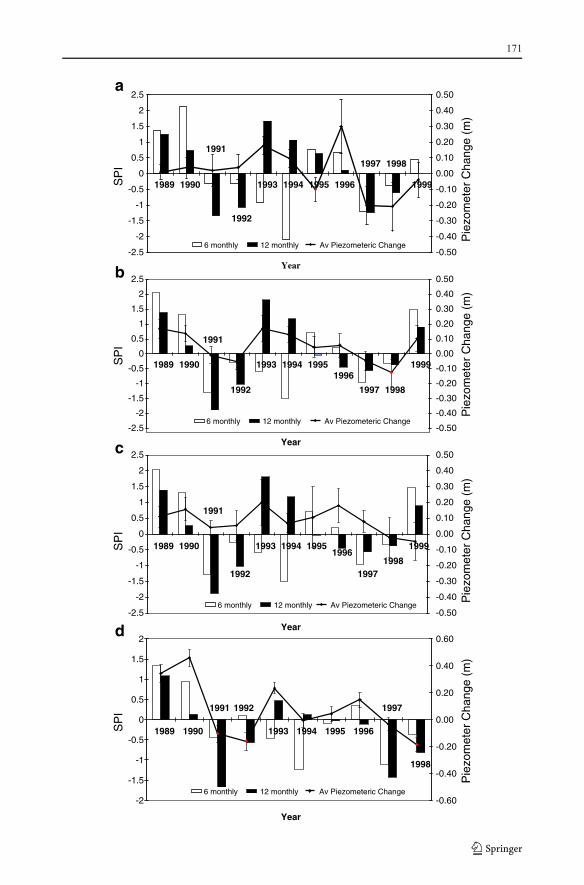
Piezometric fluctuations in the Murray Irrigation Area
Figure 8a shows the shallow piezometric (0–15 m deep, 51 data points) changes with winterSPI for Moulamein six monthly (March to August) and annual values (12 monthly July toAugust) for the 1996 to 1999 period in the Wakool region. The results indicate that smallerand lower values of SPI are related with the falling groundwater levels during 1997 to 1998.However for 1989 to 1992 period, similar groundwater level changes are associated withwidely varying SPI values. The rising water tables with low SPI values indicate groundwaterchanges caused by poor water management practices or groundwater discharge from otherareas. This aspect needs to be further confirmed through groundwater modelling studies.
Fig. 5 Historical droughts compared with recent 24-monthly September SPI values in the Murray-DarlingBasin
168
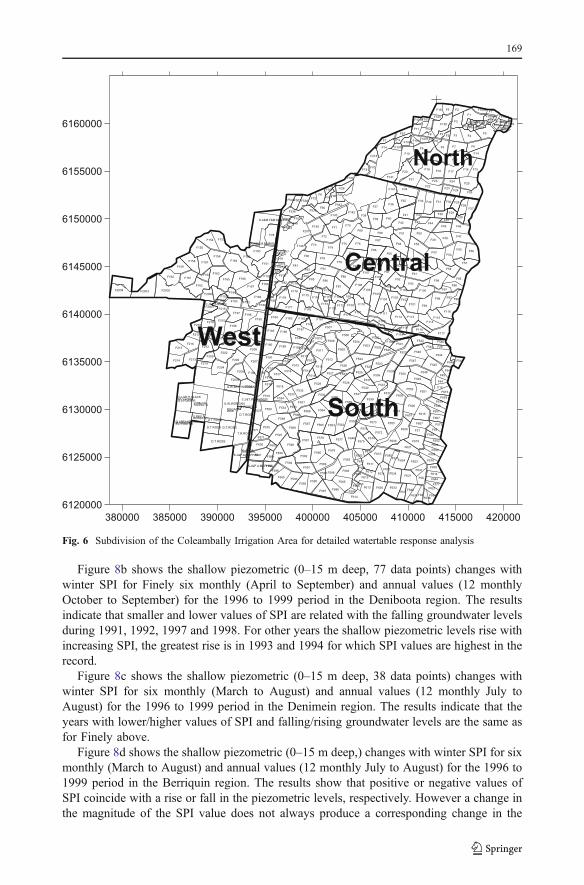
Figure 8b shows the shallow piezometric (0–15 m deep, 77 data points) changes withwinter SPI for Finely six monthly (April to September) and annual values (12 monthlyOctober to September) for the 1996 to 1999 period in the Deniboota region. The resultsindicate that smaller and lower values of SPI are related with the falling groundwater levelsduring 1991, 1992, 1997 and 1998. For other years the shallow piezometric levels rise withincreasing SPI, the greatest rise is in 1993 and 1994 for which SPI values are highest in therecord.
Figure 8c shows the shallow piezometric (0–15 m deep, 38 data points) changes withwinter SPI for six monthly (March to August) and annual values (12 monthly July toAugust) for the 1996 to 1999 period in the Denimein region. The results indicate that theyears with lower/higher values of SPI and falling/rising groundwater levels are the same asfor Finely above.
Figure 8d shows the shallow piezometric (0–15 m deep,) changes with winter SPI for sixmonthly (March to August) and annual values (12 monthly July to August) for the 1996 to1999 period in the Berriquin region. The results show that positive or negative values ofSPI coincide with a rise or fall in the piezometric levels, respectively. However a change inthe magnitude of the SPI value does not always produce a corresponding change in the
380000 385000 390000 395000 400000 405000 410000 415000 420000
6120000
6125000
6130000
6135000
6140000
6145000
6150000
6155000
6160000
F152
F167
F193
F196
F192
F209
D.T.ROSS
T.R.ROSS
E.P.WORGAN
G.W.&E.P.WORGAN
C.J&T.W.HAWKER
K.J&P.A.MCPHAIL
K.J&P.A.MCPHAIL
K.J&P.AMCPHAIL
G.L&R.H.BLACK
F215
F214
M.G.KOOKS.L.FOSTER
D.T.ROSS D.T.ROSS
D.T.ROSS
F200F211
F201
F202
F212
F209
F219
F217F217
F216
F213
F204
F205
F208
F2006
ROGART2006
D.T.ROSS
V.R&U.NROSSATO
V.R&U.NROSSATO
G.W.WORGAN
G.L&R.H.BLACKM.G.KOOKS.L.FOSTER
F160
F2003F2004 F2002
F159
F158
F161
F162
F162F163
F155
F154
F157
F156
F153
F164
F165 F166
F194
F193
F1026
F1005
F2000
F197
F198
F210
F219F2001
F218
F218
C.J&E.A.MUNN
F199 F185 F186
F634
F633
F575
F535
F554
F555
F609
F1025
F510
F511
F513
F529
F530
F564
F565
F580
F589
F591
F587
F579
F570 F568F571
F571
F591
F590F592
F593
F582F601
F599
F594
F595
F596
F596
F600 F600
F597
F599
F598
F581
F206
F207
F188
F188F189
F190
F191
F192
F507
F510
F510
F513
F514
F514F517
F517
F516
F516
F515
F515
F518
F518F519
F519F534
F533
F532
F534F520
F521
F533
F566
F569
F567
F566
F531
F572
F574
F636
F574
F610
F580F610
F611
F612
F612F612
F613
F613
F614
F586F586
F585
F585
F584
F583
F584
F611
F583
F610
F588
F578
F575
F646F577
F574
F502F503
F504
F645
F506
F508
F509
F512
F526
F527 F527
F524
F523
F525
F525
F528
F561
F560
F559
F563 F562
F506
F540
F537
F537
F539
F556
F541
F558
F557
F573
F537
F502
F59
F545
F552
F608
F590
F508
F578
F621
F619
F31
F606
F631
F647F640
F636 F94
F638F556
F623
F577
F644
F614
F56
F541
F623F624
F608
F117
F546
F28
F542
F542
F544
F545
F548
F547
F546
F549
F549
F542
F45
F44
F15
F615
F539
F615
F548
F551
F607
F573F607
F615
F606
F551F552
F607
F544
F501
F522
F550
F606
F119
F1015
F141
F92
F103
F112
F7
F181
F174
F173
F72
F79
F84
F60
F6
F78
F150
F169
F168
F180
F180
F151
F195F184
F183 F182
F182
F187
F179
F179
F177
F178
F178F175
F175F174
F176
F146F73
F80
F81
F83
F83
F85
K.A&M.M.BURKE
F82
F510
F169
F1022
F1021
F1020
F1019
F1018F1017
F1023
F145
F538F536
F511
F540F507F538F72
K.A&M.F&M.M.BURKE
F2011
F1014
F1018
F1023
F174
F173 F109
F109F172
F172
F171F171
F110
F106
F105
F104
F111
F74
F78
F88
F87
F86
F89
F90
F77
F107
F108
F66
F90
F107
F67
F76F75
F505
F507
108
F65
F91
F103
F170
F170
F71
F68
F39
F69
F70
F37
F38
F142
F143
F107
F107
F90
F90
F642
F25
F26
F108
F218
F14
F19F70
F141
F36
F40
F8F1010F4
F26
F57
F25
F16
F47F48
F49
F52
F53
F59
F54
F55
F63 F63
F61
F60
F94
F58
F95
F96
F97F100
F93
F96F97F98
F99F101
F102
F116
F115
F114
F113
F118
F118
F64
F62
F102
F119
F22
F35
F41
F33 F32 F31 F30
F30
F29
F29
F28
F28
F23F24
F46F45
F45
F44
F50
F43
F43
F17
F24
F18F19
F11
F20
F21
F10
F9
F11 F12
F8
F13
F7
F1012
F23
F34
F42
F51
F56
F27
F15
F6
F14
F4
F1
F1016
F3F3
F2
F2
F5F18
F120
F120
F639F11
F1016F1011
F1001
F57
F2
F8
F8 F5
F7F1009
F1001
F1003F1002
F1007F1004
F1004
F1006F1027
F1027
F1009
F1010F1011F1013F1004F1016
F1015F1012
North
Central
West
South
Fig. 6 Subdivision of the Coleambally Irrigation Area for detailed watertable response analysis
169
piezometric levels. For example 1989 and 1990 have positive SPI values, 1990 SPI (0.9 to0.1) is lower than 1989 (1.4 to 1.1) however the increase in piezometric levels in 1990 isapproximately 0.1 m more than the 1989.
The overall results support the hypothesis that SPI influences shallow groundwater tablefluctuations.
-1.5
-1
-0.5
0
0.5
1
1.5
1996 1997 1998 1999
Year
SP
I
-1
-0.8
-0.6
-0.4
-0.2
0
0.2
0.4
0.6
0.8
1
Ave
rag
e C
han
ge
(m)
6 month SPI 12 month SPI Average Piezometeric Change
-1.5
-1
-0.5
0
0.5
1
1.5
1996 1997 1998 1999
Year
SP
I
-1
-0.8
-0.6
-0.4
-0.2
0
0.2
0.4
0.6
0.8
1
Pie
zom
eter
Ch
ang
e (m
)
6 month SPI 12 month SPI Average Piezometeric Change
a
b
Fig. 7 a Comparison of spatial average change in September piezometer levels and six-monthly and 12-monthly August SPI for Griffith. b Correlation between spatial average change in September piezometerlevels in Leeton and six-monthly August SPI for Griffith
Fig. 8 a Comparison of six-monthly and 12-monthly August SPI for Moulamein and spatial averagepiezometric change in Wakool. b Comparison of six-monthly and 12-monthly August SPI for Deniliquin andspatial average piezometric change in Deniboota. c Comparison of six-monthly and 12-monthly August SPIfor Deniliquin and spatial average piezometric change in Denimein. d Comparison of spatial averagepiezometric change in Berriquin and six-monthly and 12-monthly August SPI for Finley
�
170
-2.5
-2
-1.5
-1
-0.5
0
0.5
1
1.5
2
2.5
1989 1990
1991
1992
1993 1994 19951996
19971998
1999
Year
-0.50
-0.40
-0.30
-0.20
-0.10
0.00
0.10
0.20
0.30
0.40
0.50
-2.5
-2
-1.5
-1
-0.5
0
0.5
1
1.5
2
2.5
1989 1990
1991
1992
1993 1994 19951996
1997 1998
1999
Year
-0.50
-0.40
-0.30
-0.20
-0.10
0.00
0.10
0.20
0.30
0.40
0.50
-2.5
-2
-1.5
-1
-0.5
0
0.5
1
1.5
2
2.5
1989 1990
1991
1992
1993 1994 1995 1996
1997 1998
1999
Year
-0.50
-0.40
-0.30
-0.20
-0.10
0.00
0.10
0.20
0.30
0.40
0.50
6 monthly 12 monthly Av Piezometeric Change
-2
-1.5
-1
-0.5
0
0.5
1
1.5
2
1989 1990
1991 1992
1993 1994 1995 1996
1997
1998
Year
-0.60
-0.40
-0.20
0.00
0.20
0.40
0.60
SP
IS
PI
Pie
zom
eter
Cha
nge
(m)
Pie
zom
eter
Cha
nge
(m)
Pie
zom
eter
Cha
nge
(m)
Pie
zom
eter
Cha
nge
(m)
SP
IS
PI
6 monthly 12 monthly Av Piezometeric Change
6 monthly 12 monthly Av Piezometeric Change
6 monthly 12 monthly Av Piezometeric Change
a
b
c
d
171
Piezometric fluctuations in the Coleambally irrigation area
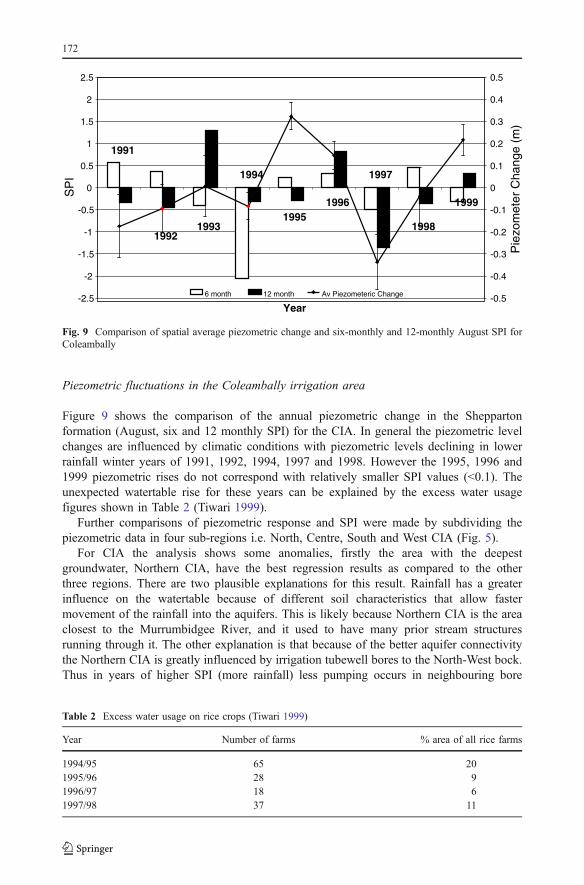
Figure 9 shows the comparison of the annual piezometric change in the Sheppartonformation (August, six and 12 monthly SPI) for the CIA. In general the piezometric levelchanges are influenced by climatic conditions with piezometric levels declining in lowerrainfall winter years of 1991, 1992, 1994, 1997 and 1998. However the 1995, 1996 and1999 piezometric rises do not correspond with relatively smaller SPI values (<0.1). Theunexpected watertable rise for these years can be explained by the excess water usagefigures shown in Table 2 (Tiwari 1999).
Further comparisons of piezometric response and SPI were made by subdividing thepiezometric data in four sub-regions i.e. North, Centre, South and West CIA (Fig. 5).
For CIA the analysis shows some anomalies, firstly the area with the deepestgroundwater, Northern CIA, have the best regression results as compared to the otherthree regions. There are two plausible explanations for this result. Rainfall has a greaterinfluence on the watertable because of different soil characteristics that allow fastermovement of the rainfall into the aquifers. This is likely because Northern CIA is the areaclosest to the Murrumbidgee River, and it used to have many prior stream structuresrunning through it. The other explanation is that because of the better aquifer connectivitythe Northern CIA is greatly influenced by irrigation tubewell bores to the North-West bock.Thus in years of higher SPI (more rainfall) less pumping occurs in neighbouring bore
-2.5
-2
-1.5
-1
-0.5
0
0.5
1
1.5
2
2.5
1991
19921993
1994
19951996
1997
1998
1999
Year-0.5
Pie
zom
eter
Cha
nge
(m)
SP
I
-0.4
-0.3
-0.2
-0.1
0
0.1
0.2
0.3
0.4
0.5
6 month 12 month Av Piezometeric Change
Fig. 9 Comparison of spatial average piezometric change and six-monthly and 12-monthly August SPI forColeambally
Table 2 Excess water usage on rice crops (Tiwari 1999)
Year Number of farms % area of all rice farms
1994/95 65 201995/96 28 91996/97 18 61997/98 37 11
172
blocks, reducing the gradient of flow between the aquifers, causing a rise in the watertablein the North (Khan et al. 2008a).
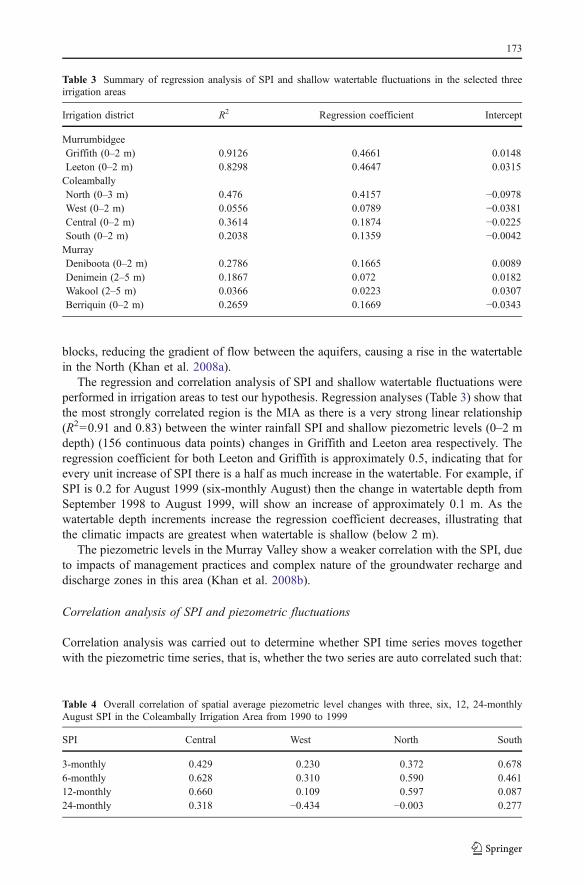
The regression and correlation analysis of SPI and shallow watertable fluctuations wereperformed in irrigation areas to test our hypothesis. Regression analyses (Table 3) show thatthe most strongly correlated region is the MIA as there is a very strong linear relationship(R2=0.91 and 0.83) between the winter rainfall SPI and shallow piezometric levels (0–2 mdepth) (156 continuous data points) changes in Griffith and Leeton area respectively. Theregression coefficient for both Leeton and Griffith is approximately 0.5, indicating that forevery unit increase of SPI there is a half as much increase in the watertable. For example, ifSPI is 0.2 for August 1999 (six-monthly August) then the change in watertable depth fromSeptember 1998 to August 1999, will show an increase of approximately 0.1 m. As thewatertable depth increments increase the regression coefficient decreases, illustrating thatthe climatic impacts are greatest when watertable is shallow (below 2 m).
The piezometric levels in the Murray Valley show a weaker correlation with the SPI, dueto impacts of management practices and complex nature of the groundwater recharge anddischarge zones in this area (Khan et al. 2008b).
Correlation analysis of SPI and piezometric fluctuations
Correlation analysis was carried out to determine whether SPI time series moves togetherwith the piezometric time series, that is, whether the two series are auto correlated such that:
Table 3 Summary of regression analysis of SPI and shallow watertable fluctuations in the selected threeirrigation areas
Irrigation district R2 Regression coefficient Intercept
MurrumbidgeeGriffith (0–2 m) 0.9126 0.4661 0.0148Leeton (0–2 m) 0.8298 0.4647 0.0315ColeamballyNorth (0–3 m) 0.476 0.4157 −0.0978West (0–2 m) 0.0556 0.0789 −0.0381Central (0–2 m) 0.3614 0.1874 −0.0225South (0–2 m) 0.2038 0.1359 −0.0042MurrayDeniboota (0–2 m) 0.2786 0.1665 0.0089Denimein (2–5 m) 0.1867 0.072 0.0182Wakool (2–5 m) 0.0366 0.0223 0.0307Berriquin (0–2 m) 0.2659 0.1669 −0.0343
Table 4 Overall correlation of spatial average piezometric level changes with three, six, 12, 24-monthlyAugust SPI in the Coleambally Irrigation Area from 1990 to 1999
SPI Central West North South
3-monthly 0.429 0.230 0.372 0.6786-monthly 0.628 0.310 0.590 0.46112-monthly 0.660 0.109 0.597 0.08724-monthly 0.318 −0.434 −0.003 0.277
173
the large values of SPI are associated with large fluctuations of piezometric data (positivecorrelation), or whether small values of one set are associated with large values of the other(negative correlation), or whether the values in both sets are uncorrelated (correlation nearzero). The correlation coefficient was determined by using equation (2):
ρXY ¼ cov X ; Yð ÞσXσY
ð2Þ
where is the correlation of the variables X and Y i.e. SPI and piezometric fluctuations, andare the standard deviation of variables X and Y, and cov (X, Y) is the covariance between thevariables X and Y.
For the four regions of the CIA the six- and 12-monthly August SPI (Table 4) showsgood correlation with the piezometric fluctuations i.e. rising watertables are associated withthe rising SPI values and vice versa. The least correlated regions are North and West CIA.Weaker correlation in North CIA is due to the influence of generally higher rice water usein the area and the influence of deep pumping bores to the north-west of the area ongroundwater dynamics (Khan et al. 2000, 2008a).
The four regions of the Murray Valley have piezometric fluctuations that are highlycorrelated to the six, 12 and 24 monthly SPI values (Table 5). The three-monthly SPI showsvery low correlation with the piezometric change. Of the four regions, Wakool series are theleast correlated, followed by Denimein. The weaker correlation is due to the complex natureof the recharge and discharge systems within the Murray Irrigation area. Lateral flowdynamics have a much greater influence on piezometric fluctuations in the Murray regionas compared to the MIA and CIA regions that show a greater response to precipitation andirrigation variables (Khan et al. 2008a, b).
Results of the correlation analysis for the MIA (Table 6) show that both the Leeton andGriffith piezometric levels and six-monthly SPI values are highly correlated.
The regression and correlation analysis thus show that SPI values and groundwater tablelevels in irrigation areas have a strong positive relationship, in general, however exceptionsare possible due to local and regional groundwater dynamics and changes in irrigationwater use. The overall results support the hypothesis that lower SPI values during droughtperiods are associated with falling groundwater table.
Table 5 August SPI for Finley and correlation with spatial average piezometric change from 1985 to 1999for Murray Valley
SPI Berriquin Denimein Deniboota Wakool
3-monthly 0.31 −0.09 0.06 −0.016-monthly 0.68 0.42 0.69 0.3312-monthly 0.7 0.55 0.9 0.4124-monthly 0.74 0.47 0.86 0.27
Table 6 August SPI for Leeton and Griffith with spatial average piezometric change from 1995 to 1999 forMurrumbidgee Irrigation Area
SPI Leeton Griffith
3-monthly 0.6 0.676-monthly 0.93 0.9612-monthly 0.75 0.8224-monthly 0.6 0.8
174
Conclusions
In irrigation areas with shallow watertable the rainfall variability is a very sensitive variableimpacting the overall sustainability of the area. Standard Precipitation Index is based oncontinuous statistical functions and can therefore capture rainfall variability on a continuousbasis over the entire rainfall record. The SPI was applied to analyse the drought spells andtheir impact on shallow watertable fluctuations using data from about 3,000 piezometers inthree major irrigation areas in the Murray-Darling Basin, Australia. This empiricalapplication of SPI showed that: low (high) SPI values can successfully capture dry (wet)periods; and the SPI can identify historical droughts over the century scale. It alsoconfirmed that the Murray-Darling Basin was experiencing a prolonged dry period since2000 because none of the four irrigation areas studied have recorded real above averagerainfall levels in the past 6 years to 2006 (SPI values above 1.5); and different irrigationareas throughout the Murray-Darling Basin were facing varying levels of drought intensity.In general, the analysis show that the 2000–2006 drought is not the worst drought that hasoccurred in recorded history for the area, however if the current low rainfall patterncontinues, it would be one of the most prolonged droughts in the recorded history.
The fluctuations in the piezometric levels in the selected irrigation areas show a strongpositive relationship with the rainfall variability, confirming that the shallow watertablefluctuations were influenced by SPI. Regression and correlation analyses also show thatshallow watertable levels were influenced by SPI vales and the two series were positivelycorrelated such that rising watertable correspond with the rising SPI values and vice versa.However exceptions to this generic conclusion are possible due to local and regionalgroundwater dynamics and differences in irrigation management. Somewhat weakercorrelation between the two time series for some irrigation areas, however, do support thegeneric conclusion when interpreted in terms of the regional groundwater dynamics andirrigation management practices. For instance, the piezometric levels in the MurrayIrrigation Area show only weaker correlation with the rainfall variability as measured bySPI. Other factors come into play, suggesting that shallow groundwater levels are alsoinfluenced by water management practices, changes in cropping patterns, irrigation waterdelivery, and groundwater recharge and discharge zones. These impacts need to beascertained and separated by detailed groundwater modelling studies. The overall resultssuggest that shallow water table are influenced by rainfall such that drought has impacts ongroundwater levels and have implications for sustainable agriculture in terms of cropchoices, salinity management, and drought assistance schemes. The findings may be usefulfor irrigators, irrigation companies, extension service, and regional authorities.
Acknowledgements The authors are grateful to the Cooperative Research Centre (CRC) for SustainableRice Production for funding this work.
References
Bhuiyan C, Singh RP, Kogan FN (2006) Monitoring drought dynamics in the Aravalli region (India) usingdifferent indices based on ground and remote sensing data. Int J Appl Earth Observ Geoinform 8:289–302
Bonaccorso B, Bordi I, Cancelliere A, Rossi G, Sutera A (2003) Spatial variability of drought: an analysis ofthe SPI in Sicily. Water Resour Manag 17:273–296
175
Bordi I, Fraedrich K, Jiang J-M, Sutera A (2004) Spatio–temporal variability of dry and wet periods ineastern China. Theor Appl Climatol 79:81–91
BOM (Bureau of Meteorology) (2006) Average annual and monthly rainfall. Australian Government: Bureauof Meteorology. http://www.bom.gov.au/climate
Butler BE (1971) A soil survey of the horticultural soils in the Murrumbidgee irrigation areas. New South Wales,Commonwealth Scientific and Industrial Research Organization (CSIRO), Melbourne, Bulletin No. 289
Crabb P (1997) Murray-Darling basin resources, the Murray-Darling basin commission. Canberra, AustraliaDEH (Department of the Environment and Heritage) (2005) Murray-Darling Basin, Australian Government:
Department of the Environment and Heritage http://www.deh.gov.au/water/basins/murray-darling.htmlEdwards DC, McKee TB (1997) Characteristics of 20th Century Drought in the United States at Multiple
Time Scales. Climatology Report No. 97–2, Colorado State University, Fort Collins, CO, USA, 155 pp.Foley JC (1957) Drought in Australia. Bulletin No. 43, Bureau of Meteorology, Commonwealth of Australia,
MelbourneGibbs WJ, Maher JV (1967) Rainfall deciles as drought indicators. Bulletin No. 48. Bureau of Meteorology,
Commonwealth of Australia, MelbourneGuttman NB (1998) Comparing the Palmer drought index and the standardized precipitation index. J Am
Water Resour Assoc 34:113–121Ji L, Peters AJ (2003) Assessing vegetation response to drought in the northern Great Plains using vegetation
and drought indices. Remote Sens Environ 87:85–98Khan S, Short L (2001) Assessing the impact of rainfall variability on watertables in irrigation areas.
Technical report: CSIRO Land and Water: Griffith, NSW, AustraliaKhan S, Short L, Best L (2000) Groundwater dynamics in the CIA, CSIRO consultancy report to the
Coleambally Irrigation Corporation LimitedKhan S, Blackwell J, Rana T, Beddele R (2002) What are the options for managing climate variability in
Australian catchments? CSIRO Land and Water, Griffith, NSW, AustraliaKhan S, Rana T, Hanjra MA (2008a) A cross disciplinary framework for linking farms with regional
groundwater and salinity management targets. Agric Water Manag 95:35–47Khan S, Mushtaq S, Hanjra MA, Schaeffer J (2008b) Estimating potential costs and gains from an aquifer
storage and recovery program in Australia. Agric Water Manag 95:477–488. doi:10.1016/j.agwat.2007.1012.1002
Kim T-W, Vald s JB, Nijssen B, Roncayolo D (2006) Quantification of linkages between large-scale climaticpatterns and precipitation in the Colorado River Basin. J Hydrol (Amst) 321:173–186
Lloyd-Hughes B, Saunders MA (2002) A drought climatology for Europe. Int J Climatol 22:1571–1592McKee TB, Doesken NJ, Kleist J (1993) The relationship of drought frequency and duration to time scales.
In: Proceedings of the 8th Conference on Applied Climatology. American Meteorological Society,Boston, MA, pp 179–184
McKee TB, Doesken NJ, Kleist J (1995) Drought monitoring with multiple time scales. In: Proceedings ofthe Ninth Conference on Applied Climatology, American Meteorological Society, Boston, pp 233–236
Min S-K, Kwon W-T, Park E-H, Choi Y (2003) Spatial and temporal comparisons of droughts over Koreawith East Asia. Int J Climatol 23:223–233
NDMC (2007) National drought mitigation center university of Nebraska, Lincoln, USA, Online http://www.drought.unl.edu/ accessed Jan 2008
NRM (Natural Resource Management) (2004) Murrumbidgee report card, Australian Government: NaturalResource Management http://www.nrm.gov.au/state/nsw/murrumbidgee/publications/report_card/index.html
Northey JE, Christen EW, Ayars JE, Jankowski J (2005) Occurrence and measurement of salinitystratification in shallow groundwater in the Murrumbidgee Irrigation Area, South-Eastern, Australia.Agric Water Manag 81:23–40
Opoku-Ankomah Y, Cordery I (1993) Temporal variation of relations between New South Wales rainfall andthe Southern Oscillation. Int J Climatol 13:51–64
Paulo AA, Ferreira E, Coelho C, Pereira LS (2005) Drought class transition analysis through Markov andLoglinear models, an approach to early warning. Agric Water Manag 77:59–81
Quiring SM, Papakryiakou TN (2003) An evaluation of agricultural drought indices for the Canadianprairies. Agric For Meteorol 118:49–62
Ropelewski CF, Halpert MS (1986) North American precipitation and temperature patterns associated withEl-Ninõ/Southern oscillation (ENSO). Mon Weather Rev 114:2165–2352
Smith DI, Hutchinson MF, McArthur RJ (1993) Australian climatic and agricultural drought. DroughtNetwork News 5:11–12
Tadesse T, Wilhite DA, Harms SK, Hayes MJ, Goddard S (2004) Drought monitoring using data miningtechniques: a case study for Nebraska, USA. Nat Hazards 33:137–159
176

Tiwari A (1999) Rice water use efficiency in the Coleambally irrigation area. In: Proceedings of the ricewater use efficiency workshop, CRC for Sustainable Rice Production, Griffith, March 1999
White DH, O’Meagher B (1995) Coping with exceptional draughts in Australia. Drought Network News 7(2):13–17
Wilhite DA, Hayes MJ, Svoboda MD (2000) Drought monitoring and assessment: status and trends in theUnited States. In: Vogt JV, Somma F (eds) Drought and drought mitigation in Europe. KluwerAcademic, Dordrecht, pp 149–160
Wu H, Hayes MJ, Weiss A, Hu Q (2001) An evaluation of the standardized precipitation index, the China-Zindex and the statistical Z-score. Int J Climatol 21:745–758
Wu H, Hubbard KG, Wilhite DA (2004) An agricultural drought risk-assessment model for corn andsoybeans. Int J Climatol 24:723–741
Wu H, Hayes MJ, Wilhite DA, Svoboda MD (2005) The effect of the length of record on the standardizedprecipitation index calculation. Int J Climatol 25:505–520
177