eTract: Same Tractor; Electrified
48
11/30/2018 eTract: Same Tractor; Electrified Bringing your Tractor into the 21st Century Zackery Weitzman and Brandon Bonan MCGILL UNIVERSITY – PRESENTED TO DR. CHANDRA MADRAMOOTOO FOR THE COURSE BREE495 – DESIGN III
-
Upload
khangminh22 -
Category
Documents
-
view
0 -
download
0
Transcript of eTract: Same Tractor; Electrified
11/30/2018
eTract: Same Tractor; Electrified Bringing your Tractor into the 21st Century
Zackery Weitzman and Brandon Bonan MCGILL UNIVERSITY – PRESENTED TO DR. CHANDRA MADRAMOOTOO FOR THE COURSE BREE495 – DESIGN III
1
Acknowledgements
We would like to thank Hubert Philion for his dedication to this project.
Thank you to Professor Valérie Orsat for her continued help and guidance.
Special thanks to Professor Chandra Madramootoo for his sustained support.
We would like to also acknowledge the help of François-Nicolas Lanciault and his team at
EcoTuned Automobile for their expertise.
2
Table of Contents Abstract ............................................................................................................................................ 4
Introduction ..................................................................................................................................... 5
About eTract ................................................................................................................................ 5
Vision Statement .......................................................................................................................... 6
Client and Initial Proposition ....................................................................................................... 6
Mentor Information ...................................................................................................................... 7
Partnerships .................................................................................................................................. 7
Funding ........................................................................................................................................ 7
Literature Review ............................................................................................................................ 7
Why Electrify? A Lifecycle Analysis Approach ......................................................................... 7
Biodiesel ...................................................................................................................................... 8
Batteries ....................................................................................................................................... 9
Nickel-iron Battery ................................................................................................................... 9
Lead-acid Battery ................................................................................................................... 10
Lithium-ion Battery ................................................................................................................ 11
Motors ........................................................................................................................................ 11
Transmissions ............................................................................................................................ 12
Québec Cost Comparison – Diesel vs. Electricity ..................................................................... 13
Diesel Prices ........................................................................................................................... 13
Electricity Costs ..................................................................................................................... 13
Design ............................................................................................................................................ 14
Adhering to the Engineering Design Process ............................................................................ 14
Identifying a need or problem ................................................................................................ 14
Researching Criteria and Constraints ..................................................................................... 14
Brainstorming Possible Solutions .......................................................................................... 14
Picking the Best Solution ....................................................................................................... 15
Offsetting Possible Hesitations .............................................................................................. 16
Constructing Prototype ........................................................................................................... 16
Test ............................................................................................................................................. 20
Solution ...................................................................................................................................... 21
Environmental, Social, Economic, Occupation Health & Safety and Ergonomic Factors ........ 25
Environmental Factors ........................................................................................................... 26
3
Social Factors ......................................................................................................................... 26
Economic Factors ................................................................................................................... 27
Occupational Health and Safety Factors ................................................................................ 27
Ergonomic Factors ................................................................................................................. 28
Battery Calculations: .................................................................................................................. 29
Tax Credits .................................................................................................................................... 30
Life-cycle Assessment of Project and Overall Sustainability ....................................................... 31
Lifecycle Assessment - Revisited .......................................................................................... 31
End-of-life Strategies ..................................................................................................................... 34
Additional Considerations ............................................................................................................. 35
Cost Analysis ................................................................................................................................. 36
Cost of Conversion .................................................................................................................... 36
Tax Implications and Depreciation ............................................................................................ 36
Payback Period ........................................................................................................................... 36
Conclusion ..................................................................................................................................... 39
Bibliography .................................................................................................................................. 41
Appendix ....................................................................................................................................... 44
Battery Power Requirements: .................................................................................................... 44
Fuel Use Estimation: .................................................................................................................. 45
Machine Cost Estimation: .......................................................................................................... 45
Additional Cash Flow Calculations: .......................................................................................... 46
4
Abstract With the increase in electrification of cars and trucks, farmers want to take advantage of
new technologies now available to them. While farmers are oftentimes reliant on hardware that
has been in their family for generations, a large majority of farms are continually looking for ways
to cut costs and increase profits. This report describes the steps required to upgrade a tractor from
diesel power generation to rely solely on electricity for the entirety of its functions. The change
has a goal of both decreasing the operating costs for a farmer, and lowering global greenhouse
gas emissions from the transportation and agricultural sectors. With a relatively inexpensive and
effective solution to convert pre-existing tractors, eTract is a fictional company positioning itself
as a leader in tractor conversions. eTract’s proprietary setup will allow for farmers to convert
their current equipment to run on electricity. These modified electric tractors will charge on the
charging grid currently developed for motor vehicles, making them practical for use in the coming
years. The final solution is a simple, reliable, and cost-effective methodology geared toward a
greenhouse gas-mitigating solution that tackles the triple bottom line, taking people, planet, and
profits into account.
5
Introduction Earth’s resources, though abundant, are finite. A perpetual growth of any kind in demand
for a resource that is not renewable is simply unsustainable. The anthropocentric burning of fossil
fuels is the main cause of global climate change, and this combustion reaction occurs in millions
of vehicles each day worldwide. Transportation in general is one of the largest contributors of
greenhouse gas emissions both in Canada and abroad. While many assume the only problem with
this industry lies in passenger vehicles, this could not be farther from the truth. For decades,
farmers have been using diesel-powered mechanized machinery, including tractors and mowers,
to produce crops and provide for the masses. While passenger vehicles are being improved in
efficiency and technology each day, farming vehicles like tractors take a figurative backseat and
continue to rely on ancient technologies that contribute to climate change. When it comes to the
automobile, the word “innovative” does not begin to describe what has transpired since its
inception. Today’s cars are more fuel efficient, safer to operate, and visually appealing than ever.
Furthermore, virtually all automakers both in Canada and abroad are looking into electrifying their
fleets to some degree; a viewpoint that should carry over to manufacturers of agricultural,
construction and forestry machinery. In Quebec, 99% of electricity is continually generated from
renewable energy sources (National Energy Board, 2016). This provides an astonishing
opportunity for the growth of vehicle electrification; one that should be exploited by manufacturers
and the province’s farmers.
Different farm types require different types of farm machinery. For reasons of excessive
power requirements and output needs, farms with industrial-sized operations may have trouble
electrifying the entirety of their equipment. Electric tractors are not as readily available and have
their restrictions when it comes to runtime and power. For smaller farms, however, like many
Canadian orchards, electric tractors are not only feasible replacements but worthwhile ones. The
savings an orchard farmer could acquire are numerous, and coupled with Quebec’s low electricity
prices, changing to a tractor that relies solely on electricity for the sum of its functions is a sensible
switch for many of the province’s orchard farmers.
About eTract
eTract is a fictional company founded by two McGill Engineering students in 2017. eTract
aims to be profitable by selling electric tractor conversions kits to farmers willing to commit to
6
being more environmentally conscious about their business practices. Farmers will welcome this
conversion, since a cost analysis shows that it will lead to added savings for then in the long-run.
Vision Statement
eTract aims to achieve a low-cost method for farmers to convert their current
tractors into functioning, high-powered electric vehicles able to achieve strong
autonomy without compromising on power. The design, large-scale, would have
the ability to lower greenhouse gas emissions from the agricultural sector.
Client and Initial Proposition
A Bioresource engineer and McGill alum, Mr. Hubert Philion owns and operates an
orchard in Hemmingford, Quebec called Vergers Écologiques Philion. On the orchard’s busiest
days, Mr. Philion’s main tractor burns through an entire tank of diesel per day, which is
unmistakably not sustainable. This heavy diesel usage is an economic burden to the farmer himself,
but an additional burden to the environment. Finding a team to design and build an electric tractor
for his orchard has been an objective for Mr. Philion for over two years. In 2014, the client was
approached by two pioneer companies in the electric car industry: Sun Country Highway and
Tesla. These companies offered to provide the farm with gratis high-voltage high-amperage
electric car chargers so long as the client took care of the accompanying installation costs.
Mr. Philion did not hesitate at this proposition. Not only was he attentive to the
electrification of the automobile industry that is currently underway, but he saw this proposition
as an opportunity to one day electrify his orchard’s own fleet of machinery. Markedly, he
recognized the numerous environmental impacts of his current diesel-powered tractor, and now
his orchard was abundantly prepared for an electric replacement. Today, with two distinct charging
stations that work with virtually any electric vehicle, this orchard has been ready to see its obsolete
diesel-powered machinery undergo electrification for quite some time. The tractor to be designed
must work ergonomically with at least one of the two chargers to make use of these valuable
resources. Nevertheless, e-Tract’s design will work with standard outlets as well so that farmers
without level-2 chargers can similarly electrify.
7
Mentor Information
Dr. Valérie Orsat, like Mr. Philion, graduated from McGill in Bioresource engineering.
Today, however, she continues her devotion to knowledge, and works at McGill University as a
full professor and was department chair of Bioresource engineering, preparing young engineers
for fruitful careers. This professor’s knowledge was an asset to this project, since in addition to
having contacts across the globe, she has overseen and supervised several projects in her profession
related to energy, sustainability, and agriculture.
Partnerships
eTract partnered with EcoTuned Automobile, a private company specializing in electric
conversions of Ford F-150 pick-up trucks and small buses. To date, EcoTuned Automobile has
received funding from the province of Quebec along with other partners. They are currently
contracted by the city of Montreal, the Pierre-Elliott-Trudeau Airport and the city of
Drummondville for multiple projects.
Funding
This project is being fully funded and supported by Hubert Philion. EcoTuned Automobile
has graciously offered any parts and/or pieces that may be required that they have on-site, at cost-
price. Although multiple calls for funding were sent out, none of them materialized. eTract was in
contact with various companies with regards to funding, including Kubota and Fendt, however
while discussions ensued, it became evident that third parties wanted to limit the sharing of
information, trade secrets, and intellectual property.
Literature Review
Why Electrify? A Lifecycle Analysis Approach
The term lifecycle analysis is defined by ISO as a compilation and evaluation of the inputs,
outputs, and potential environmental impacts of a product system through its lifecycle
(International Organization for Standardization, 2006). The LCA technique follows standard ISO
14040:2006, and involves phases of goal and scope definition, inventory analysis, impact
assessment and interpretation (International Organization for Standardization, 2006). Since a
tractor’s life includes stages from raw material procurement to disposal, it is important to consider
these stages when designing for electrification. Compared to diesel-powered tractors, electric
8
tractors involve different precious metals in their raw materials. These metals can often be recycled
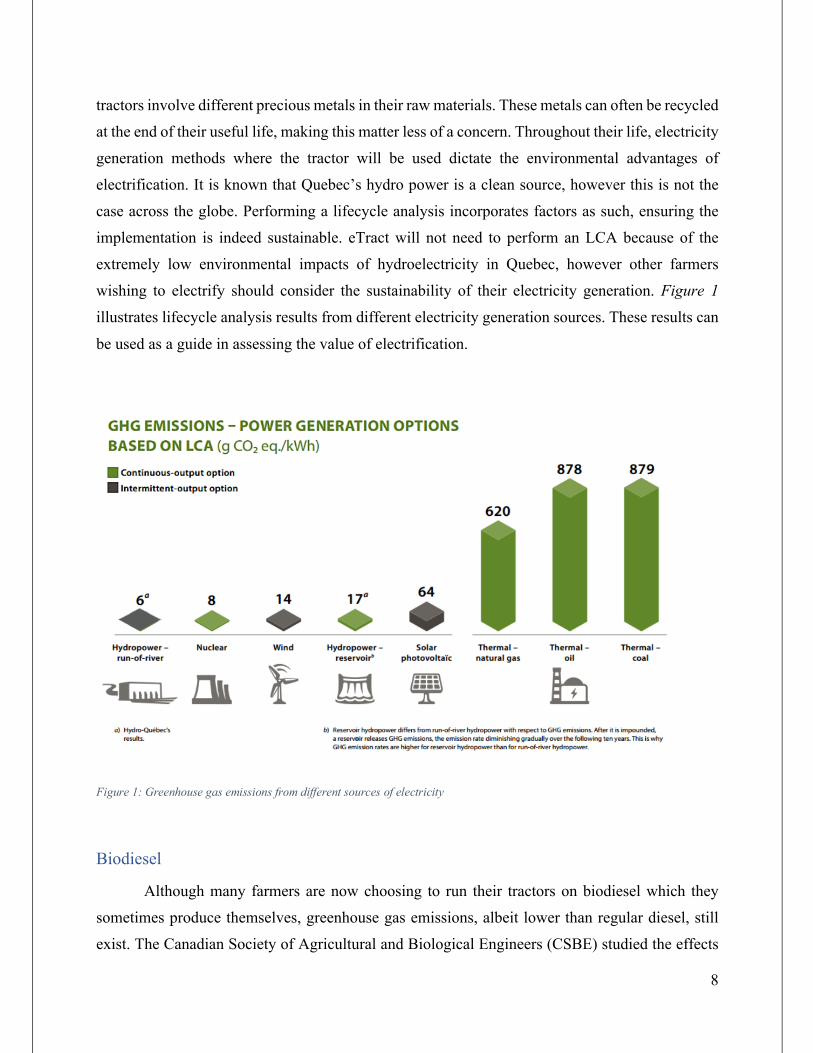
at the end of their useful life, making this matter less of a concern. Throughout their life, electricity
generation methods where the tractor will be used dictate the environmental advantages of
electrification. It is known that Quebec’s hydro power is a clean source, however this is not the
case across the globe. Performing a lifecycle analysis incorporates factors as such, ensuring the
implementation is indeed sustainable. eTract will not need to perform an LCA because of the
extremely low environmental impacts of hydroelectricity in Quebec, however other farmers
wishing to electrify should consider the sustainability of their electricity generation. Figure 1
illustrates lifecycle analysis results from different electricity generation sources. These results can
be used as a guide in assessing the value of electrification.
Biodiesel
Although many farmers are now choosing to run their tractors on biodiesel which they
sometimes produce themselves, greenhouse gas emissions, albeit lower than regular diesel, still
exist. The Canadian Society of Agricultural and Biological Engineers (CSBE) studied the effects
Figure 1: Greenhouse gas emissions from different sources of electricity
9
of emissions of tractors running on different blends of biodiesel. The results found in the research
conducted by Agri-Food Canada on behalf of CSBE determined that although there may be an
emissions reduction in carbon dioxide, nitrous oxide emissions increases. (Li & McLaughlin,
2005). This is a troubling finding since one pound of NOx is 300 times more powerful than one
pound of carbon dioxide as a greenhouse gas (EPA, 2017).
Biofuels are produced using the same crops that feed the world. Although it might seem to
some as though there is currently enough food and arable land to feed the entire population, that
is certainly not the case. There is only a finite amount of arable land available on Earth. With an
increase in biofuel production, due to supply and demand, the price of food will increase because
more and more of the available crops will be used up for biofuels (Ajanovic, 2011). Since the
population is increasing at an exponential rate and the amount of free arable land is decreasing, it
would therefore be difficult to consider the use of biofuels as a means to power agricultural
machinery since the current machines in use in industry are not efficient. Further, although the cost
of biofuels is relatively cheap today, it is difficult to gauge what the cost of fuels will be in the
years to come. It can therefore be inferred that due to the high emissions of biofuels, the low
efficiency of farming equipment, and not knowing what the consequences of an increase in the
demand for biofuels will bring, that the use of biofuel is not ideal for agricultural equipment.
Batteries
Multiple battery types exist which could be used to power an electric tractor. Beginning in
the early 1900’s, inventors such as Thomas Edison were inventing batteries to be used in electric
cars. At the turn of the millennium, new technology allowed for advancements in battery
technology. Cells are now able to be constructed out of materials which were never associated
with batteries. Further, new technologies allowed more and more cells to be fitted into one battery,
effectively increasing their power outputs. Battery life started seeing immense improvements with
the aforementioned technological advancements. Today, new devices, including motor vehicles,
can be fully battery-operated and attain performance benchmarks similar to their non-battery-
powered counterparts.
Nickel-iron Battery
Thomas Edison invented a battery that could be used to power electric vehicles in 1901,
the nickel-iron battery. At the beginning of the 20th century, electric cars accounted for roughly
50% of the car market in the United States (Westbrook, 2001). Edison’s invention offered a better
10
range than the lead-acid batteries which were being used in electric cars at the beginning of the
last century. As the electric car saw its demise following the invention of the internal combustion
petrol engine, the industries in which nickel-iron batteries were used changed. These batteries were
installed in commercial machines as a secondary source of energy in stationary applications
(Westbrook, 2001).
Although Nickel-iron batteries seemed at the time to be a breakthrough in battery
technology, their uses today are limited. These batteries need to be properly managed since they
require maintenance, unlike most other batteries. Nickel-iron batteries produce hydrogen and
oxygen while they are being discharged. Further, at low temperatures, these batteries have a
significantly reduced capacities (Westbrook, 2001).
Lead-acid Battery
The Lead-acid battery was invented by Gaston Planté, prior to the invention of Edison’s
Nickel-iron battery, in 1859. At the time of its invention, it was the first rechargeable battery able
to be used for commercial purposes (Buchmann, 2017). Since pure lead is too soft and would not
be able to support itself, these batteries are made from a lead alloy. Using an alloy allows the
battery to increase its mechanical strength and improve its electrical properties. Calcium, tin, and
selenium are often used to create the alloy (Buchmann, 2017). Lead-acid batteries can properly
function for 200 to 300 charge/discharge cycles. This is considered today to be a short life cycle.
The short life cycle is due to grid corrosion on the positive electrode, depletion of the active
material and expansion of the positive plates (Buchmann, 2017). The amount of use one gets out
of a lead-acid battery can be rapidly decreased when the battery is operating at high temperatures
and when it is drawing a high current.
While lead-acid batteries can be charged in multiple ways, the one key factor is to maintain
the correct voltage limits. There are two main ways of recharging a lead-acid battery: low-voltage
charging and high-voltage charging. With low-voltage charging, sulfation occurs on the negative
plate however, with high-voltage charging, the positive plate becomes corroded. Although
sulfation can be clean whereas corrosion is permanent, high-voltage charging improves the
performance of the battery (Buchmann, 2017).
11
Lithium-ion Battery
With an atomic mass of 6.941
g/mol, Lithium is the lightest metal
found on the periodic table of the
elements (Tro, Fridgen, & Shaw,
2016). Moreover, it is also the most
electropositive metal, making it ideal
for use in batteries. In any capacity, a
battery is a device that is able to store
electrical energy in the form of
chemical energy and convert that
energy into electricity (Bates, 2012).
Scientists and engineers alike have
exploited the metal’s idyllic
characteristics, designing storage
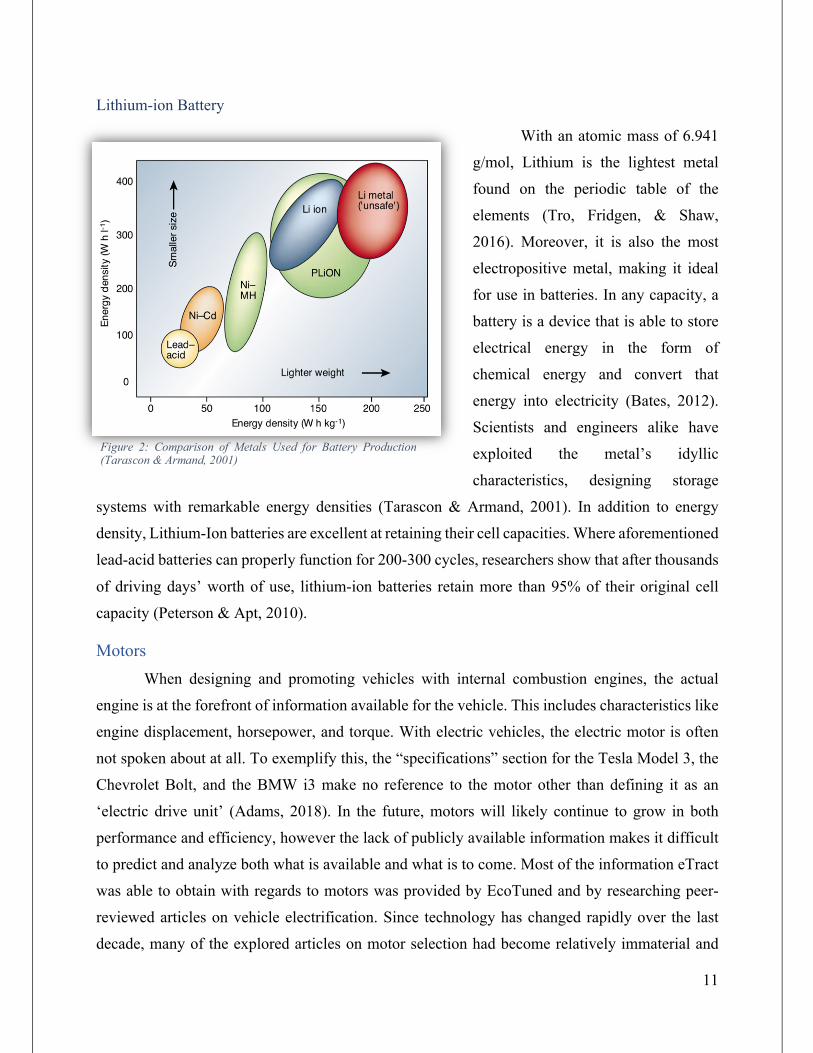
systems with remarkable energy densities (Tarascon & Armand, 2001). In addition to energy
density, Lithium-Ion batteries are excellent at retaining their cell capacities. Where aforementioned
lead-acid batteries can properly function for 200-300 cycles, researchers show that after thousands
of driving days’ worth of use, lithium-ion batteries retain more than 95% of their original cell
capacity (Peterson & Apt, 2010).
Motors When designing and promoting vehicles with internal combustion engines, the actual
engine is at the forefront of information available for the vehicle. This includes characteristics like
engine displacement, horsepower, and torque. With electric vehicles, the electric motor is often
not spoken about at all. To exemplify this, the “specifications” section for the Tesla Model 3, the
Chevrolet Bolt, and the BMW i3 make no reference to the motor other than defining it as an
‘electric drive unit’ (Adams, 2018). In the future, motors will likely continue to grow in both
performance and efficiency, however the lack of publicly available information makes it difficult
to predict and analyze both what is available and what is to come. Most of the information eTract
was able to obtain with regards to motors was provided by EcoTuned and by researching peer-
reviewed articles on vehicle electrification. Since technology has changed rapidly over the last
decade, many of the explored articles on motor selection had become relatively immaterial and
Figure 2: Comparison of Metals Used for Battery Production (Tarascon & Armand, 2001)
12
obsolete. EcoTuned uses a BorgWarner motor that is capable of providing adequate power, in
addition to functioning in Quebec’s harsh winters. The company is well-known in industry and
has over 100,000 motors in service (BorgWarner, 2016). Selecting a reputable company with
several years of experience is of great important to eTract since the process is to be replicated by
other farmers. Suggesting a motor that has not undergone rigorous testing could be detrimental, as
failure or serious injury could occur.
There are two types of motors that can be used for the conversion, either A/C or D/C
motors. Although the energy supplied by the batteries is in D/C, an inverter can be used with an
A/C motor. In terms of the differences, A/C motors provide more power in a smaller footprint
allowing for higher-powered machines with less weight and smaller volume requirements. A/C
motors can also be configured in single-phase or three-phase. Similarly, power outputs differ
between the two. Three-phase engine require “lower wire cost per watt delivered. At the same
current/voltage, a three-phase system requires 50% more conductor area, yet delivers 73% more
power” (Ferguson, 2017). Thus, three-phase A/C motors provide more power than single-phase
A/C motors for a small space sacrifice.
Transmissions
Current mass-produced electric vehicles are offered with an automatic one-gear
transmission only. This is due to many factors, but mainly because of the need to only have one
gear in an electric vehicle. Since electric motors can deliver instantaneous torque, there is no need
to build up enough energy to reach a desired engine rpm. Further, conventional manual and
automatic transmissions and gearboxes significantly increase the weight of the vehicle. To allow
for an electric vehicle to have an increased range without improving the battery would be to
decrease the weight of the vehicle (United States of America Patent No. US 5419406 A, 1991).
In terms of the transmission options, the client was hesitant is switching to an automatic
transmission and preferred the idea of staying with his current manual transmission. This presented
additional challenges which are revealed throughout the report.
13
Québec Cost Comparison – Diesel vs. Electricity
Diesel Prices
In Quebec, the average diesel price in cents per litre for the period of June – October 2017
was 107.7c/L (Statistics Canada, 2017). Working with an average consumption of 200L/week in
periods of increased usage (40 weeks per year), and 100L/week throughout less busy times (12
weeks per year), a very rough yearly consumption approximation is 8160L/year. Factoring in the
average diesel cost, the client for this project is spending close to $10,000 per year on fuel alone.
These numbers make it evident that diesel use does not only have environmental consequences,
but also excessive economic ramifications.
Electricity Costs
In the 2017 report, a specific battery had not yet been determined, therefore an estimate of
per-charge electricity costs was not yet possible. An estimation was done using information from
the Nissan Leaf, a typical electric car with a 30kWh battery (Nissan, 2017). Estimating 30 charges
per month, the projected electricity usage addition from eTract’s electric tractor was 900 kWh.
Using Hydro Québec’s farming electricity rates of $0.0577/kWh for the first 1,200kWh and
$0.0877/kWh for the remainder, and considering that Mr. Philion could fill the first 1,200 kWh
with other electricity demands, the added cost of electricity was estimated to be approximately
$78.93/month, and $947.16 per year (Hydro Quebec, 2017). Since the battery is now chosen, the
estimation is far less than anticipated. With the 11.6-kW battery eTract now plans to implement,
the added cost of electricity is estimated to be approximately $30.50/month, and $365.98 per year.
To come close to his current expenditures on diesel, the client would have to recharge an electric
car battery at least 20 times per day for an entire year incessantly. Even with variations in battery
capacities and number of recharges per day, it is evident from the information that in Quebec, an
electric tractor is more cost-efficient than a diesel-powered tractor.
14
Design
Adhering to the Engineering Design Process
Identifying a need or problem
The client, Mr. Hubert Philion, requested a fully electric tractor that relies solely on
electricity for the entirety of its functions. Brief ideas of a diesel-powered electric generator were
considered, however to comply with preliminary requirements, it was established that the tractor
would be fully electric.
Researching Criteria and Constraints
Orchard tractors differ from conventional tractors mostly in shape and size. To be able to
navigate through constricted orchards, the proposed design must have a narrow body. In addition,
all components of the tractor must have recommended operating temperatures comparable to the
Quebec’s temperatures during all four seasons. Since the client uses his current tractor in both
winter and summer months, the latter is a non-negotiable requirement. His current engine is a
Perkins A4-236 and has a maximum horsepower of 70HP. To have comparable performance, the
fully electric tractor will either have analogous or higher power ratings. In terms of costs, the
process should be projected under $15 000, a condition that was modified in the early stages of the
design solution. This price does not include the procurement of a tractor. Further, this price would
allow the farmer to break even on the cost of the upgrade in a relatively short amount of time. A
full cost analysis is found in a later section of the report.
Brainstorming Possible Solutions
Although many solutions were brainstormed, including the re-consideration of
implementing a diesel generator with an electric powertrain, two leading possible solutions
persisted until step three of the design process. The first heavily contemplated solution was to build
an electric tractor from raw materials, using new constituents only. The second was to design a
conversion system that would be used to convert an out-of-date or non-functional diesel-powered
tractor into a fully electric tractor. During the brainstorming process, pros and cons for each
possibility were considered, and their overall factors were tabulated.
15
Picking the Best Solution
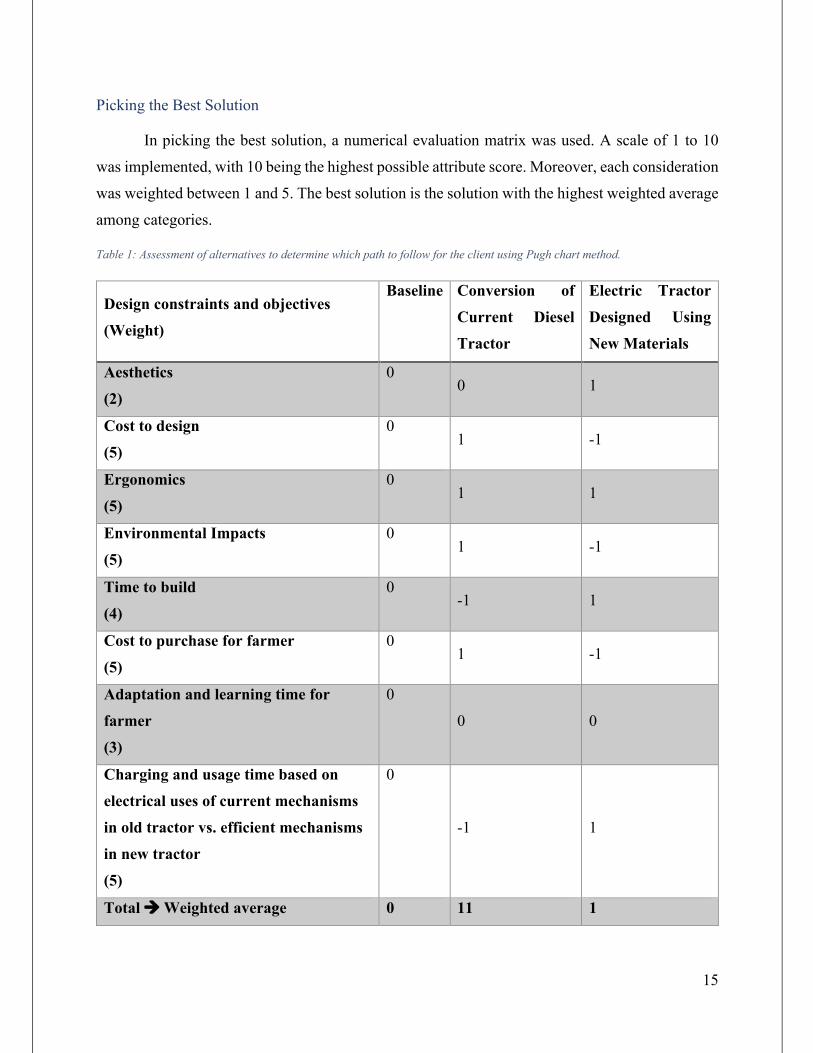
In picking the best solution, a numerical evaluation matrix was used. A scale of 1 to 10
was implemented, with 10 being the highest possible attribute score. Moreover, each consideration
was weighted between 1 and 5. The best solution is the solution with the highest weighted average
among categories.
Table 1: Assessment of alternatives to determine which path to follow for the client using Pugh chart method.
Design constraints and objectives
(Weight)
Baseline Conversion of
Current Diesel
Tractor
Electric Tractor
Designed Using
New Materials
Aesthetics
(2)
0 0 1
Cost to design
(5)
0 1 -1
Ergonomics
(5)
0 1 1
Environmental Impacts
(5)
0 1 -1
Time to build
(4)
0 -1 1
Cost to purchase for farmer
(5)
0 1 -1
Adaptation and learning time for
farmer
(3)
0
0 0
Charging and usage time based on
electrical uses of current mechanisms
in old tractor vs. efficient mechanisms
in new tractor
(5)
0
-1 1
Total à Weighted average 0 11 1
16
For reasons of cost efficiency and from conclusions based on the above tabulation, it was
established that the best solution for this project was to design and implement a process in which
a diesel-powered tractor can be modified to be fully electric. In addition to being more cost
effective, salvaging an old tractor involves less environmental consequences, less time to build,
and less adaptation and learning time for the farmer.
Offsetting Possible Hesitations
With electric cars, a large fear is a term widely known as “range anxiety.” This is the
apprehension many potential users have toward electric cars regarding battery drainage and the
lack of a nearby charging station. Since eTract is making a tractor with a runtime of approximately
one day, the issue will be more concentrated on power than on range. Farmers will worry about
factors such as runtime at maximum power, in addition to what would occur should there be a
major power outage.
Recommending a Home Battery
As stated in the vision statement, eTract aims to achieve strong autonomy without
compromising on power. Since autonomy is based on the ability to recharge when needed,
electricity availability remains an important and deciding factor. While the client for this project,
Mr. Hubert Philion, is not interested in investing in a stationary energy storage device, eTract
recommends it for those that live in regions where major power outages are not a rare occurrence.
The suggested home battery is a Tesla Powerwall. Not only does the Powerwall offer 14 kWh and
an integrated inverter, but it can be connected to solar panels to provide autonomous electricity
(Tesla Energy, 2018). Having this sort of storage system would allow farmers to pay less in
electricity, be better off in the event of a power outage, and avoid using greenhouse gas-emitting
electricity.
Constructing Prototype
eTract’s prototype was first constructed using Autodesk Inventor, and in the coming
semesters, the design will be modified and brought to fruition by the incoming design team and
fully incorporated into a Landini 85F tractor. This unit was acquired through auction by the
project’s client, Mr. Hubert Philion, and is not operational as of yet because the motor is not
17
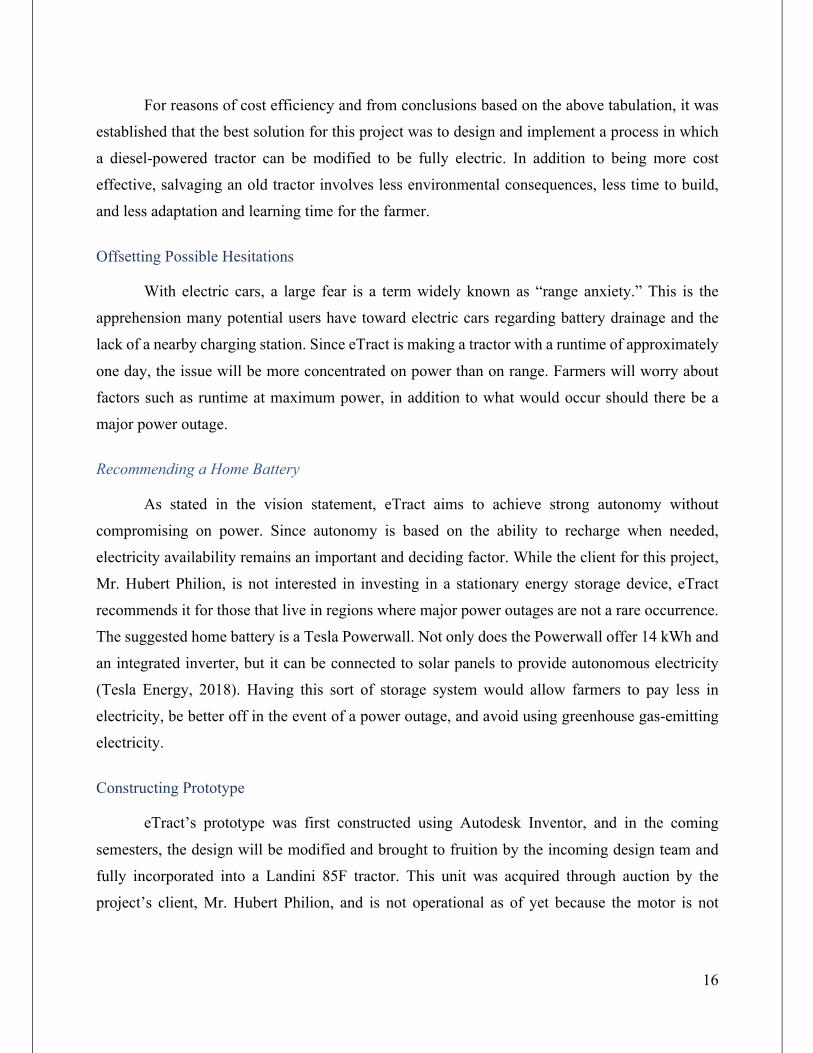
attached, and other components essential to running a diesel-powered engine are missing. Figure
3 shows the original tractor.
Tractor Requirements
In Fall 2018, the project acquired a Landini 85F tractor and cab, the final device to be
converted to electric power. The decision to purchase this specific tractor presented additional
challenges, since the original estimations in BREE490 were made using requirements of a smaller
tractor. The 85F originally contained a 4-cylinder diesel Perkins A4.248 engine with a power
output of 80 HP, 309 Nm of torque and a torque rpm of 1400 rpm. The original tractor is registered
at Quebec’s Ministry of Transportation at 2540 kg and has a wheelbase of 231 cm. The brakes are
wet disc and steering is provided using hydraulic power (TractorData, 2018). The client would like
to maintain the same torque and power output of the original tractor as to not have to make
additional modifications to the tractor’s frame. Further, weight must be properly monitored as an
increase in weight will change the ergonomics of the tractor and possibly jeopardize the tractor’s
frame and body.
Figure 3: The original Landini 85F tractor purchased at auction by Hubert Philion
18
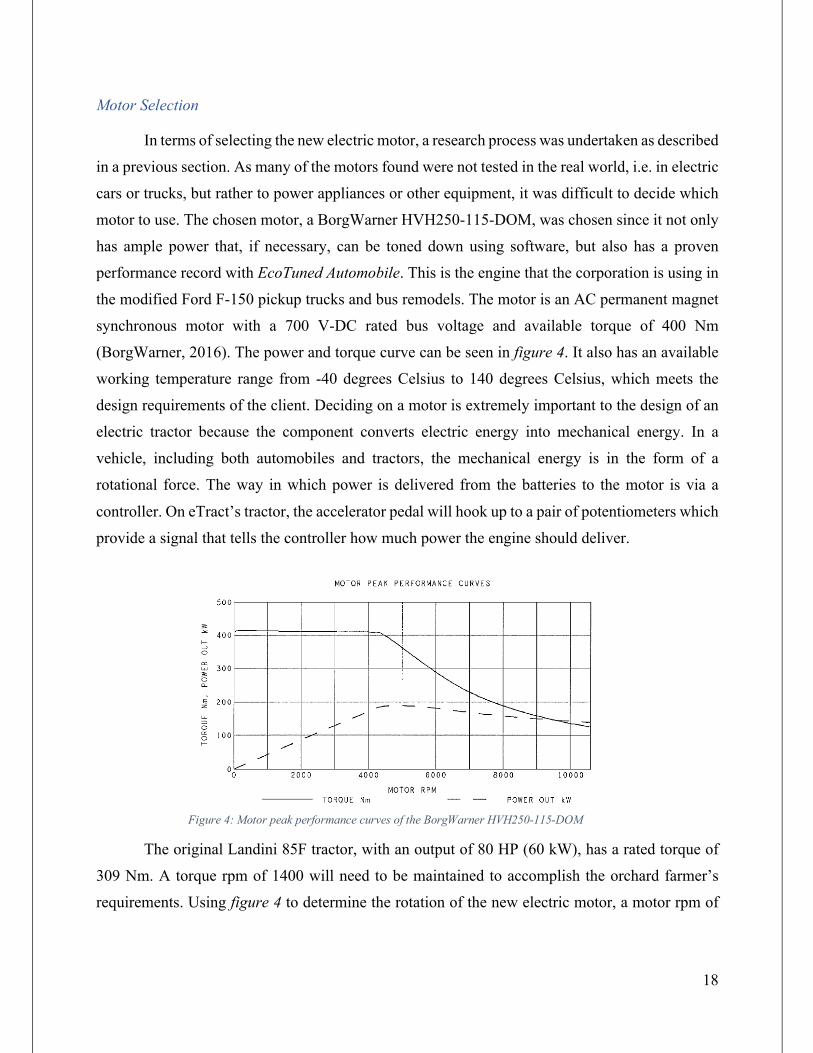
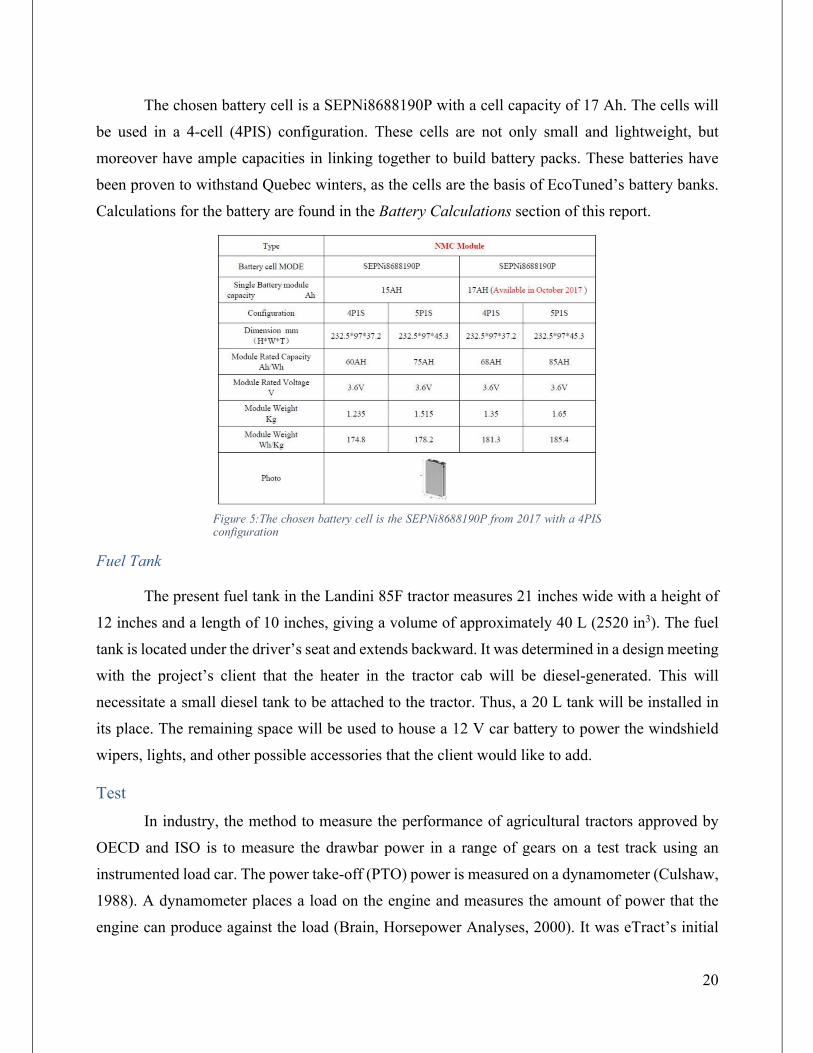
Motor Selection
In terms of selecting the new electric motor, a research process was undertaken as described
in a previous section. As many of the motors found were not tested in the real world, i.e. in electric
cars or trucks, but rather to power appliances or other equipment, it was difficult to decide which
motor to use. The chosen motor, a BorgWarner HVH250-115-DOM, was chosen since it not only
has ample power that, if necessary, can be toned down using software, but also has a proven
performance record with EcoTuned Automobile. This is the engine that the corporation is using in
the modified Ford F-150 pickup trucks and bus remodels. The motor is an AC permanent magnet
synchronous motor with a 700 V-DC rated bus voltage and available torque of 400 Nm
(BorgWarner, 2016). The power and torque curve can be seen in figure 4. It also has an available
working temperature range from -40 degrees Celsius to 140 degrees Celsius, which meets the
design requirements of the client. Deciding on a motor is extremely important to the design of an
electric tractor because the component converts electric energy into mechanical energy. In a
vehicle, including both automobiles and tractors, the mechanical energy is in the form of a
rotational force. The way in which power is delivered from the batteries to the motor is via a
controller. On eTract’s tractor, the accelerator pedal will hook up to a pair of potentiometers which
provide a signal that tells the controller how much power the engine should deliver.
The original Landini 85F tractor, with an output of 80 HP (60 kW), has a rated torque of
309 Nm. A torque rpm of 1400 will need to be maintained to accomplish the orchard farmer’s
requirements. Using figure 4 to determine the rotation of the new electric motor, a motor rpm of
Figure 4: Motor peak performance curves of the BorgWarner HVH250-115-DOM
19
1400 rpm is attainable. Moreover, the new configuration will have a higher available torque, at
slightly over 400 Nm, while maintaining an output power of 80 HP (60 kW).
To allow for the A/C motor to properly function, an A/C power source must be available.
As batteries feature D/C current, the electricity stored inside the batteries must be converted to
A/C before reaching the motor. This conversion can occur using an inverter. An inverter is a device
which changes D/C current into A/C current (IEEE Press, 2000). Inverters also amplify the D/C
current and Voltage to be changed when inverted into A/C current and Voltage. In many cases,
12V D/C will be inverted to 220V A/C. This will allow the A/C to properly function as well
maintain a low current throughout the system and therefore use higher gauge wires. The frequency
of each system much match. As the frequency in Europe and Africa is 50 Hz and in North America
is 60 Hz, this must be taken into consideration when purchasing electrical parts and systems.
Although this would be necessary for most D/C to A/C connections, the BorgWarner HVH250-
115-DOM was built with this flow of energy in mind since it was conceived to be used in electric
vehicles. Thus, there is a built-in inverter which allows the change of voltage from D/C to A/C.
Moreover, a wye (Y) connection is specified for this motor between the batteries and the motor. A
wye connection is used to allow for the phase current and line current to be equal, reducing losses
in the system.
Battery Selection
As with any piece of technology that runs on battery power, the tractor will only be as
useful as its operation time. In terms of the eTract electric tractor, various environmental and
ergonomic conditions must be met as per the request of the client. The tractor not only has to have
a high enough runtime to allow a farmer to perform tasks for an entire day, but also needs to be
able to operate in Quebec’s frigid winters for snow removal operations. As previously determined,
a lithium-ion battery not only ensures a long running time but can function relatively well in cold
temperatures. Additionally, as the battery banks will be the heaviest component and will be the
biggest modification made to the tractor, calculations will be made so to not overtax the tractor
when the full battery packs are assembled and installed.
20
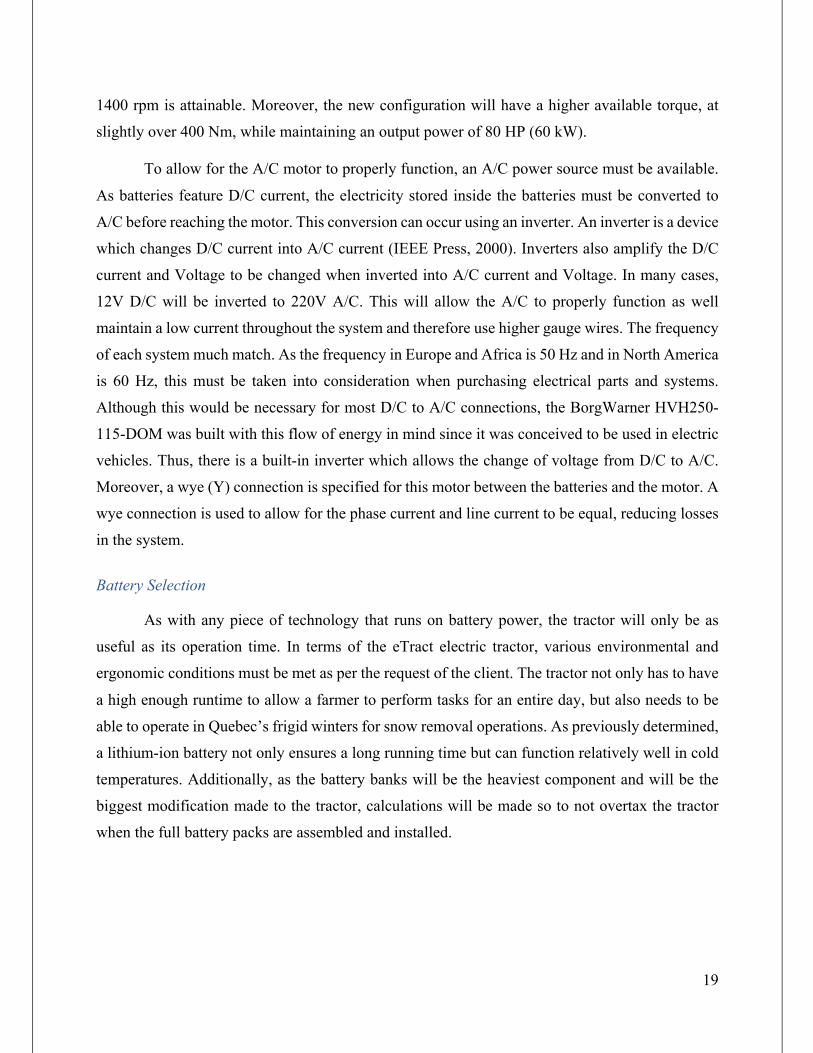
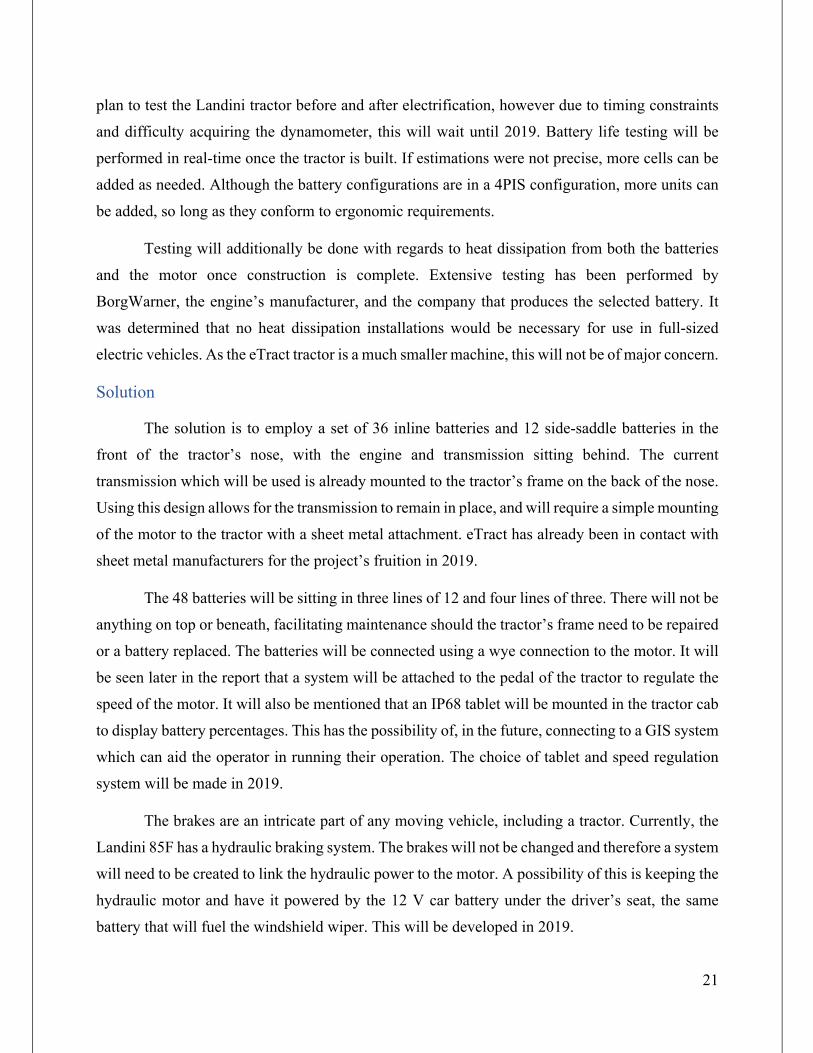
The chosen battery cell is a SEPNi8688190P with a cell capacity of 17 Ah. The cells will
be used in a 4-cell (4PIS) configuration. These cells are not only small and lightweight, but
moreover have ample capacities in linking together to build battery packs. These batteries have
been proven to withstand Quebec winters, as the cells are the basis of EcoTuned’s battery banks.
Calculations for the battery are found in the Battery Calculations section of this report.
Fuel Tank
The present fuel tank in the Landini 85F tractor measures 21 inches wide with a height of
12 inches and a length of 10 inches, giving a volume of approximately 40 L (2520 in3). The fuel
tank is located under the driver’s seat and extends backward. It was determined in a design meeting
with the project’s client that the heater in the tractor cab will be diesel-generated. This will
necessitate a small diesel tank to be attached to the tractor. Thus, a 20 L tank will be installed in
its place. The remaining space will be used to house a 12 V car battery to power the windshield
wipers, lights, and other possible accessories that the client would like to add.
Test In industry, the method to measure the performance of agricultural tractors approved by
OECD and ISO is to measure the drawbar power in a range of gears on a test track using an
instrumented load car. The power take-off (PTO) power is measured on a dynamometer (Culshaw,
1988). A dynamometer places a load on the engine and measures the amount of power that the
engine can produce against the load (Brain, Horsepower Analyses, 2000). It was eTract’s initial
Figure 5:The chosen battery cell is the SEPNi8688190P from 2017 with a 4PIS configuration
21
plan to test the Landini tractor before and after electrification, however due to timing constraints
and difficulty acquiring the dynamometer, this will wait until 2019. Battery life testing will be
performed in real-time once the tractor is built. If estimations were not precise, more cells can be
added as needed. Although the battery configurations are in a 4PIS configuration, more units can
be added, so long as they conform to ergonomic requirements.
Testing will additionally be done with regards to heat dissipation from both the batteries
and the motor once construction is complete. Extensive testing has been performed by
BorgWarner, the engine’s manufacturer, and the company that produces the selected battery. It
was determined that no heat dissipation installations would be necessary for use in full-sized
electric vehicles. As the eTract tractor is a much smaller machine, this will not be of major concern.
Solution
The solution is to employ a set of 36 inline batteries and 12 side-saddle batteries in the
front of the tractor’s nose, with the engine and transmission sitting behind. The current
transmission which will be used is already mounted to the tractor’s frame on the back of the nose.
Using this design allows for the transmission to remain in place, and will require a simple mounting
of the motor to the tractor with a sheet metal attachment. eTract has already been in contact with
sheet metal manufacturers for the project’s fruition in 2019.
The 48 batteries will be sitting in three lines of 12 and four lines of three. There will not be
anything on top or beneath, facilitating maintenance should the tractor’s frame need to be repaired
or a battery replaced. The batteries will be connected using a wye connection to the motor. It will
be seen later in the report that a system will be attached to the pedal of the tractor to regulate the
speed of the motor. It will also be mentioned that an IP68 tablet will be mounted in the tractor cab
to display battery percentages. This has the possibility of, in the future, connecting to a GIS system
which can aid the operator in running their operation. The choice of tablet and speed regulation
system will be made in 2019.
The brakes are an intricate part of any moving vehicle, including a tractor. Currently, the
Landini 85F has a hydraulic braking system. The brakes will not be changed and therefore a system
will need to be created to link the hydraulic power to the motor. A possibility of this is keeping the
hydraulic motor and have it powered by the 12 V car battery under the driver’s seat, the same
battery that will fuel the windshield wiper. This will be developed in 2019.
22
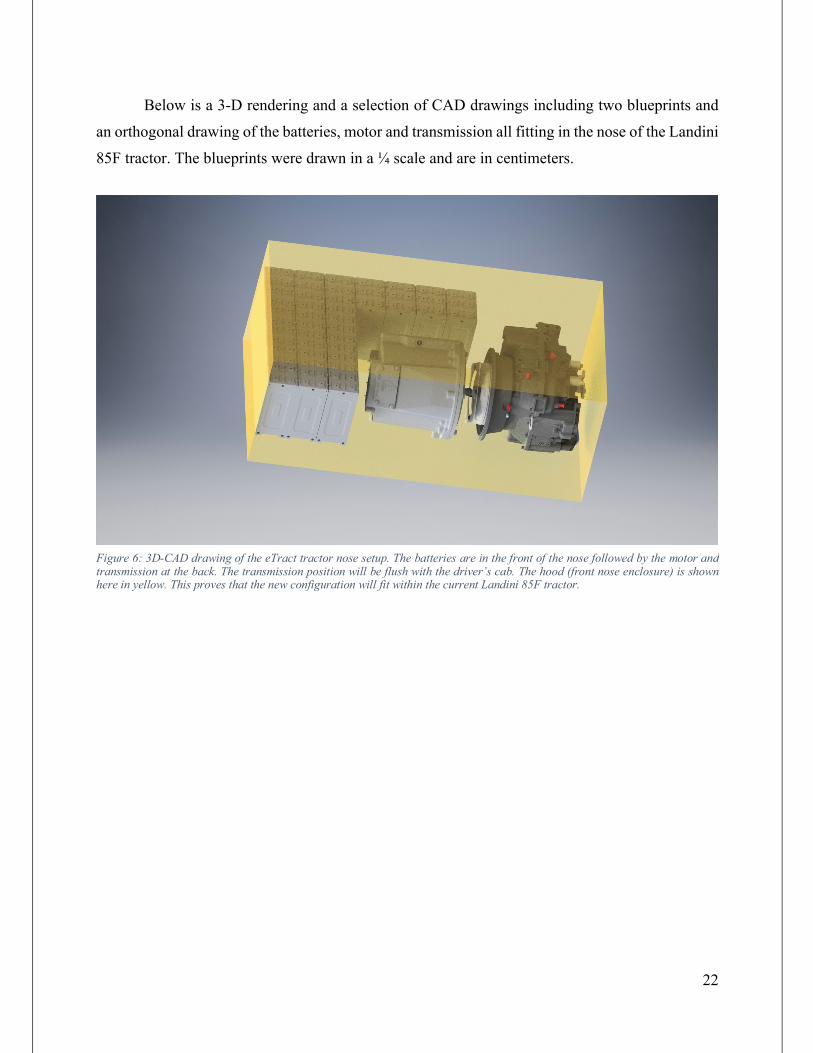
Below is a 3-D rendering and a selection of CAD drawings including two blueprints and
an orthogonal drawing of the batteries, motor and transmission all fitting in the nose of the Landini
85F tractor. The blueprints were drawn in a ¼ scale and are in centimeters.
Figure 6: 3D-CAD drawing of the eTract tractor nose setup. The batteries are in the front of the nose followed by the motor and transmission at the back. The transmission position will be flush with the driver’s cab. The hood (front nose enclosure) is shown here in yellow. This proves that the new configuration will fit within the current Landini 85F tractor.
23
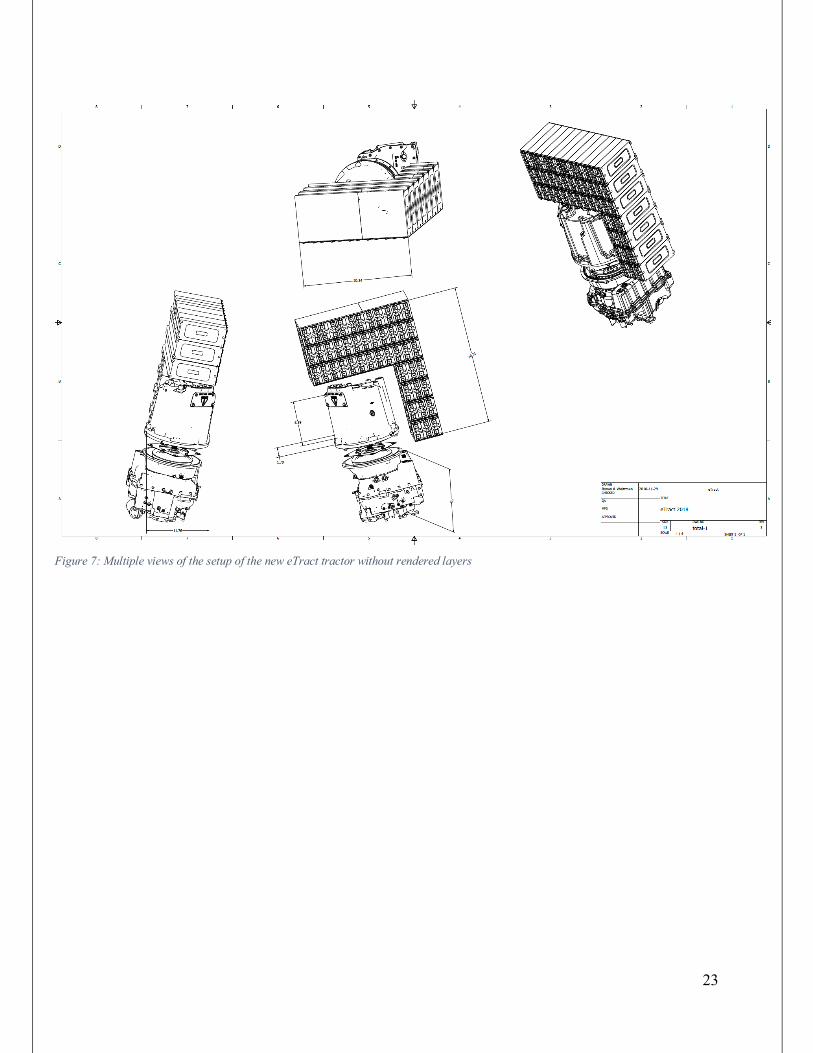
Figure 7: Multiple views of the setup of the new eTract tractor without rendered layers
24
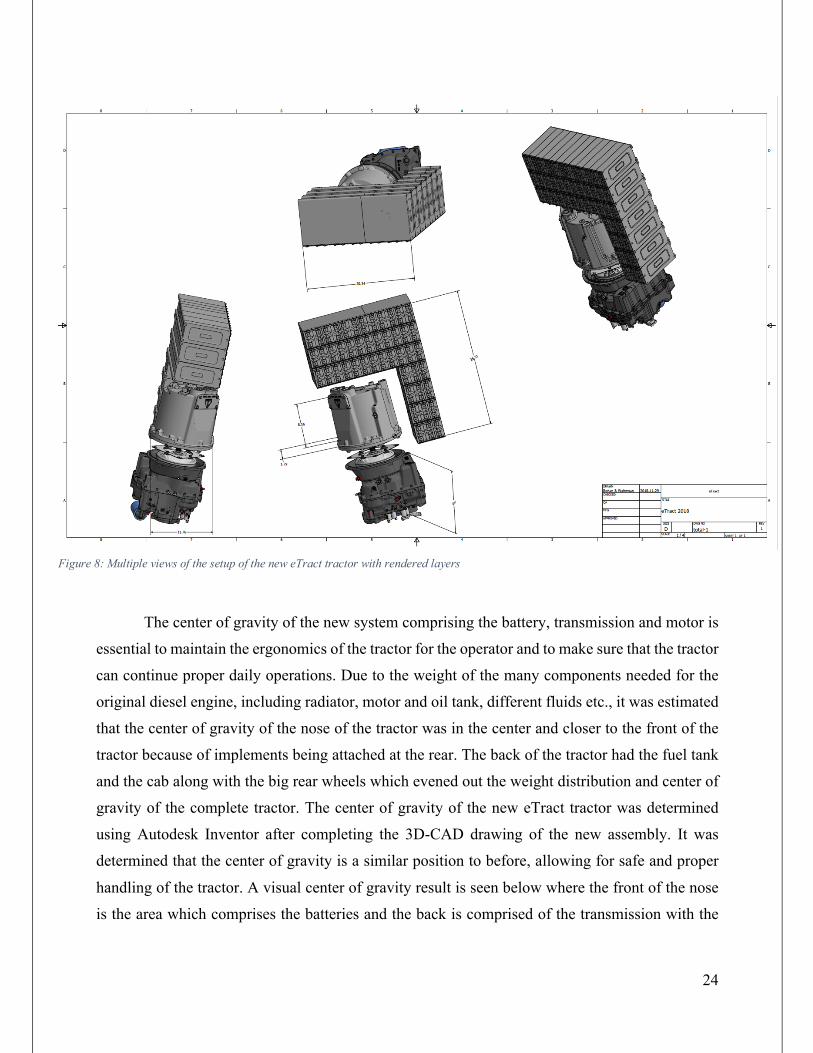
The center of gravity of the new system comprising the battery, transmission and motor is
essential to maintain the ergonomics of the tractor for the operator and to make sure that the tractor
can continue proper daily operations. Due to the weight of the many components needed for the
original diesel engine, including radiator, motor and oil tank, different fluids etc., it was estimated
that the center of gravity of the nose of the tractor was in the center and closer to the front of the
tractor because of implements being attached at the rear. The back of the tractor had the fuel tank
and the cab along with the big rear wheels which evened out the weight distribution and center of
gravity of the complete tractor. The center of gravity of the new eTract tractor was determined
using Autodesk Inventor after completing the 3D-CAD drawing of the new assembly. It was
determined that the center of gravity is a similar position to before, allowing for safe and proper
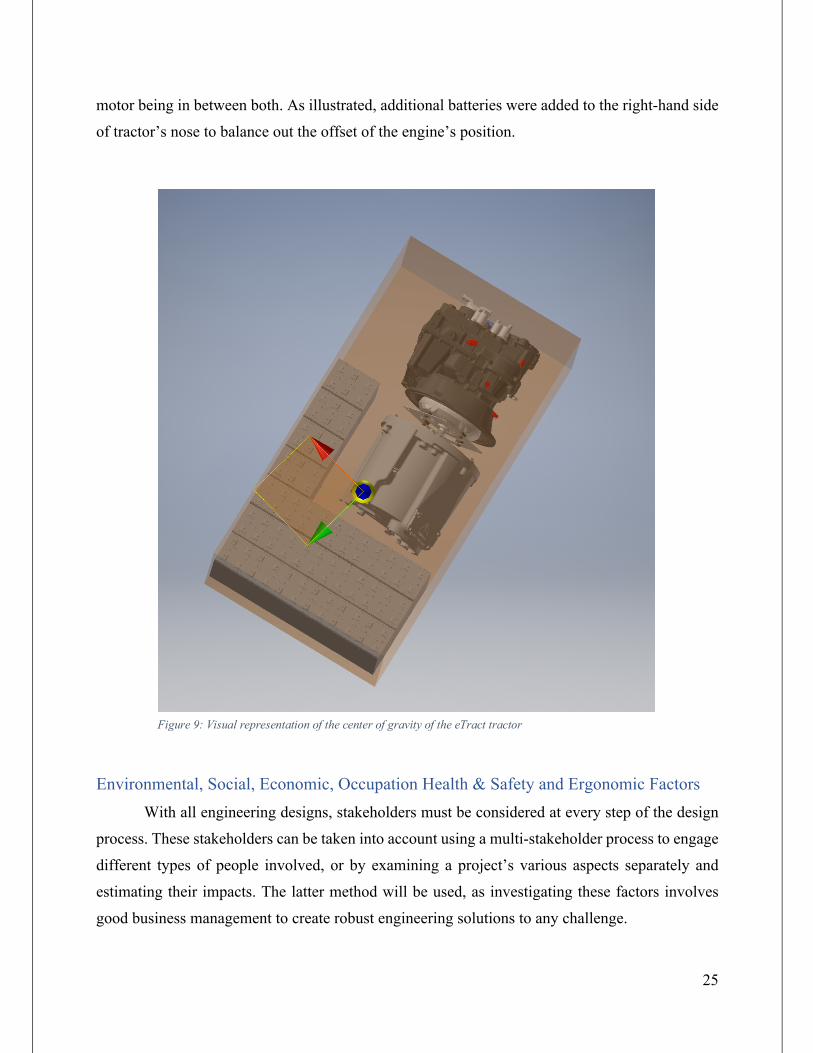
handling of the tractor. A visual center of gravity result is seen below where the front of the nose
is the area which comprises the batteries and the back is comprised of the transmission with the
Figure 8: Multiple views of the setup of the new eTract tractor with rendered layers
25
motor being in between both. As illustrated, additional batteries were added to the right-hand side
of tractor’s nose to balance out the offset of the engine’s position.
Environmental, Social, Economic, Occupation Health & Safety and Ergonomic Factors With all engineering designs, stakeholders must be considered at every step of the design
process. These stakeholders can be taken into account using a multi-stakeholder process to engage
different types of people involved, or by examining a project’s various aspects separately and
estimating their impacts. The latter method will be used, as investigating these factors involves
good business management to create robust engineering solutions to any challenge.
Figure 9: Visual representation of the center of gravity of the eTract tractor
26
Environmental Factors
The implementation of an electric tractor in Quebec involves mostly positive
environmental factors. The electric tractor will have lower emissions short-term and long-term, as
hydroelectricity in Quebec is an extremely sustainable way of producing electricity. This was seen
previously when comparing generation mechanisms with a lifecycle assessment. The converted
tractor will lead to a decreased carbon footprint for “Vergers Écologiques Philion”, in addition to
an improved living environment for surrounding flora and fauna. Negative environmental effects
are extant when batteries are disposed of improperly after their cells have lost capacity, however
eTract will recommend proper disposal, including taking advantage of the many recycling options
available in Canada.
Social Factors
Diesel engines are extremely loud, therefore implementing an electric tractor will cause a
major decrease in noise pollution. Although these lowered noise levels, coupled with cleaner air,
prompt a better environment for employees and patrons, electrification brings along social
ramifications. Farmers running electric tractors have less autonomy than those running diesel-
powered machinery. While relatively fast charging is possible at Mr. Philion’s orchard, recharge
time will nevertheless be greater than the time it takes to fill a tank of diesel. eTract worked
diligently to ensure runtime values are consistent with a full day’s worth of mowing and blowing,
however external factors such as drastic temperatures and extended power outages can abolish
these estimates. For the client of this project, the aforementioned considerations are not of great
concern. Since eTract aims to design a product that appeals to more farmers than just this client, a
future section will explore the options of a battery-powered back-up charger.
27
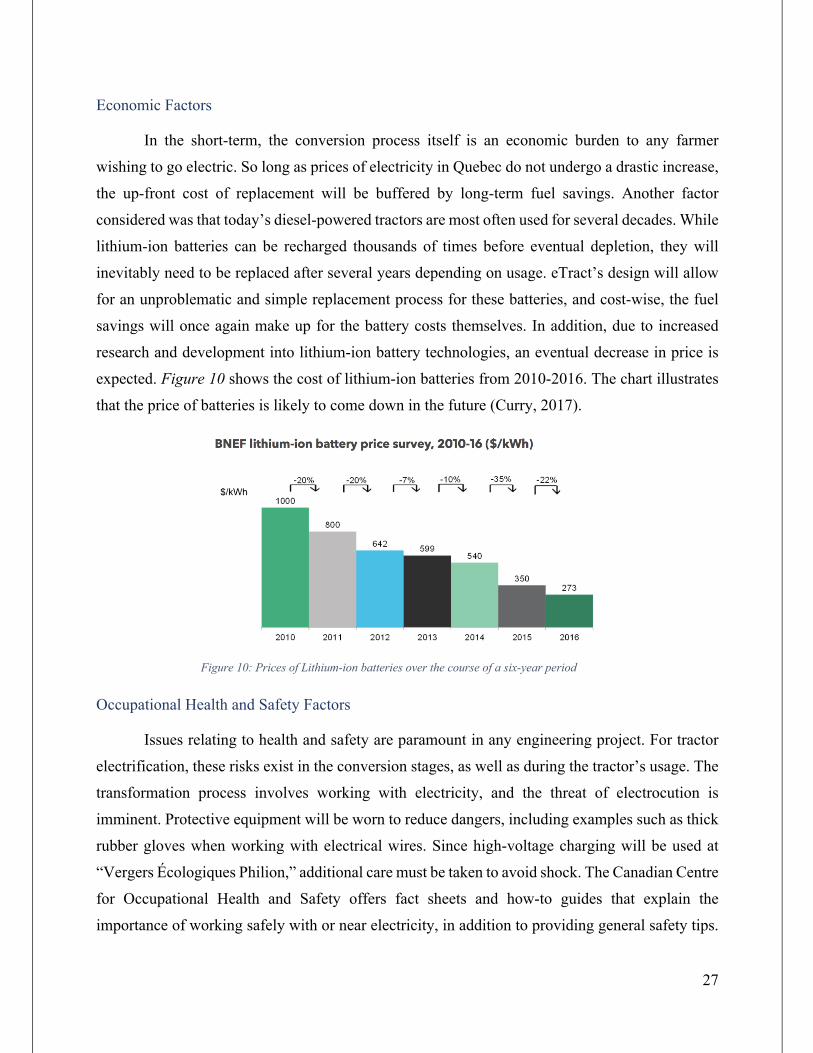
Economic Factors
In the short-term, the conversion process itself is an economic burden to any farmer
wishing to go electric. So long as prices of electricity in Quebec do not undergo a drastic increase,
the up-front cost of replacement will be buffered by long-term fuel savings. Another factor
considered was that today’s diesel-powered tractors are most often used for several decades. While
lithium-ion batteries can be recharged thousands of times before eventual depletion, they will
inevitably need to be replaced after several years depending on usage. eTract’s design will allow
for an unproblematic and simple replacement process for these batteries, and cost-wise, the fuel
savings will once again make up for the battery costs themselves. In addition, due to increased
research and development into lithium-ion battery technologies, an eventual decrease in price is
expected. Figure 10 shows the cost of lithium-ion batteries from 2010-2016. The chart illustrates
that the price of batteries is likely to come down in the future (Curry, 2017).
Occupational Health and Safety Factors
Issues relating to health and safety are paramount in any engineering project. For tractor
electrification, these risks exist in the conversion stages, as well as during the tractor’s usage. The
transformation process involves working with electricity, and the threat of electrocution is
imminent. Protective equipment will be worn to reduce dangers, including examples such as thick
rubber gloves when working with electrical wires. Since high-voltage charging will be used at
“Vergers Écologiques Philion,” additional care must be taken to avoid shock. The Canadian Centre
for Occupational Health and Safety offers fact sheets and how-to guides that explain the
importance of working safely with or near electricity, in addition to providing general safety tips.
Figure 10: Prices of Lithium-ion batteries over the course of a six-year period
28
Furthermore, the centre has a safety checklist for basic electrical safety (Canadian Centre for
Occupational Health and Safety, 2018). Conforming with the recommendations of the independent
corporation is essential to safeguard human health and safety.
In terms of operation, there exist differences when comparing electric tractors to traditional
tractors. The drivetrain and transmissions on electric tractors are different from their diesel-
powered counterparts, as in the case of electric vehicles, 100% of their torque is available at 0 rpm.
Individuals untrained and unfamiliar with the modified tractors pose a greater risk to themselves
and anyone nearby. Additionally, as with any moving vehicle, operating a tractor involves physical
hazards including possibility of injury or death to the operator or surrounding individuals. To
protect against untrained drivers in their discovery of electrification, eTract will recommend
inexpensive safety belts in case of accidental excessive speed.
Another consideration taken into account was the possibility of fire and electric problems.
In many electric cars today, marks are identified on the lithium-ion battery for first responders in
case of a fire. In Tesla vehicles, for example, there is a “first responder cup loop,” which is a low
voltage harness. Cutting the first responder loop shuts down the high voltage system outside of the
high voltage battery and disables the SRS and airbag components (Tesla, 2016). A similar device
will be implemented on eTract’s tractor to protect occupants and first responders in the event of a
fire or critical malfunction.
Ergonomic Factors
Throughout the entire design process, ergonomic factors were significantly considered. In
the case of eTract, it was originally thought that the new battery pack, motor, and transmission had
fit inside the current engine and transmission hold not to comprise the current ergonomics of the
tractor. It was eventually learned that not all batteries had to be fitted in the front of the tractor; the
fuel tank will be used to store an additional 12V battery for ancillary parts. The center of gravity
was ensured and designed using Autodesk’s Inventor software and specification sheets from the
manufacturers of the respective pieces. Additionally, the lithium-ion batteries and motor cannot
weigh considerably more than the current setup including a full fuel tank, so the tractor does not
sink on wet ground. Further, the charging process must be easy, fast and efficient. It is also
important to maintain the same driving dynamics of the diesel tractor. Should these change, the
maneuverability of the tractor will be altered, and it may become too difficult to operate in the
orchard. Further, the diesel motor along with the suspension of the tractor cause vibration which
29
are felt by the driver while sitting on the tractor. These vibrations are standardized by an ASABE
standard. The standard mentions that for a tractor up to 3600 kg, a frequency of vibration should
not exceed 11.22 Hz (ASABE/ISO, 2006). The regular allowable vibrations should be maintained
at 0.89 Hz (ASABE/ISO, 2006). However, with the removal of the diesel engine and keeping the
same suspension, the vibrations should be greatly reduced as electric motors do not vibrate nearly
as much as diesel engines if properly installed. eTract aims to reduce the vibration of the tractor to
below the recommended standards which will allow for a smoother ride for the farmer.
Battery Calculations: From previous calculations, the estimated battery capacity required to run for 9.44 hours (assuming
80% efficiency) is 2800 Ah. Implementing a safety factor of 1.15 for added power requirements
from other components, the desired capacity for a built battery bank is 3,220 Ah.
68𝐴ℎ𝑐𝑜𝑛𝑓𝑖𝑔𝑢𝑟𝑎𝑡𝑖𝑜𝑛[𝑝𝑎𝑐𝑘] ∗
(𝑥)𝑝𝑎𝑐𝑘𝑠 = 3220𝐴ℎ
𝑥 = 47.35𝑃𝑎𝑐𝑘𝑠 → 48𝑃𝑎𝑐𝑘𝑠
Charging time will affect the practicality of the tractor. If the charging time is too long and the
usage time too low, the tractor will be deemed useless. In the case of the eTract tractor, assuming
the use of the current Sun Country 240V charger (level 2 charging) already located at Vergers
Écologique Philion, the following charging time has been calculated. In this case, the efficiency
of charging is set to 60% (Electrical Technology Inc., 2013). In addition, the Sun Country level 2
charger installed, the Sun Country EV 40, has a power output of 7.7 kW (Sun Country Highway,
2017).
𝐶𝑎𝑙𝑐𝑢𝑙𝑎𝑡𝑖𝑛𝑔𝑝𝑜𝑤𝑒𝑟𝑜𝑓𝑏𝑎𝑡𝑡𝑒𝑟𝑦𝑓𝑜𝑟𝑐ℎ𝑎𝑟𝑔𝑖𝑛𝑔𝑡𝑖𝑚𝑒: 𝑃 = 𝑉𝐼 = (3.6𝑉)(3220𝐴ℎ)
= 11.592𝑘𝑊ℎ
𝐶𝑎𝑙𝑐𝑢𝑙𝑎𝑡𝑖𝑛𝑔𝑐ℎ𝑎𝑟𝑔𝑖𝑛𝑔𝑡𝑖𝑚𝑒𝑏𝑎𝑠𝑒𝑑𝑜𝑛𝑝𝑜𝑤𝑒𝑟𝑎𝑛𝑑60%𝑒𝑓𝑓𝑖𝑐𝑖𝑒𝑛𝑐𝑦 =𝑘𝑊ℎ𝑘𝑊 =
11.5927.7 ∗ 0.6
= 2.5ℎ𝑜𝑢𝑟𝑠
30
Tax Credits Many federal and provincial/state governments across the world, including the Quebec
Government, are adopting the idea of helping their populations make the transition to electric
vehicles. Quebec has implemented a purchase/lease rebate of up to $8000 for the purchase or lease
of an electric vehicle (Gouvernement du Quebec, 2017). This rebate varies on the type of vehicle
purchased or leased. For example, a hybrid vehicle will receive up to $500 whereas a fully electric
car, such as a Chevrolet Bolt, would receive the maximum amount of $8000 (Gouvernement du
Quebec, 2017). Used vehicles are also eligible for up to 50% of this credit. As these rebates are
regulated by provincial governments in Canada, the rebate varies by province. In Quebec, it is also
possible to receive a charging station installation incentive. The maximum amount of this incentive
is $600. This amount is broken up into two categories: purchase of the charging station and
installation of the station. The incentives are $350 and $250 respectively, a total of $600
(Gouvernement du Quebec, 2017). Together, these two incentives ease the financial burden
required to invest in an electric vehicle and charging station.
In the US, federal and state tax credits and incentives exist. These vary greatly by state. As
is the case with many federal incentives in the United States, these credits are dependent on the
governing political party. Electrification of the transportation network is highly partisan and can
change with changing governments. To illustrate, the State of California offers an additional rebate
on top of the USD 7500 federal tax credit. The state credits vary highly depending on the price of
the vehicle and the income of the individual purchasing the vehicle. Further, California offers
incentives for commercial electric vehicles. It was once the case that electric vehicle conversion
kits would also receive a federal tax credit, however this program has since been discontinued.
While it is not yet known if the implementation of an electric tractor would qualify a farm
owner for the incentives or tax credits mentioned above, there exist tax implications which a farmer
can take advantage of. Although it would be difficult to qualify the purchase of the DIY kit as a
capital expenditure, it could be declared as an operating expense by the farmer in their end-of-year
tax returns. An advantage of mentioning this in the operating expenses of the business is to reduce
the amount of taxes that the farm will pay for that year. As the conversion of the tractor will run
in the thousands of dollars, it could represent a significant reduction in the taxes that would need
to be paid by the business.
31
In terms of obtaining tax credits for eTract, Mr. Hubert Philion and his accountant have
explored various options. The first option was simply using the expenditures on the tractor as
expenses on the business, lowering business taxes overall. The second option was using a Quebec
Government R&D grant that allows for 30% of expenses to be reimbursed. Since using the R&D
grant would involve a lot of time and energy, and that the reimbursed expenditures could not be
allocated to business expenses, it was established that the first option would be implemented.
Life-cycle Assessment of Project and Overall Sustainability
Lifecycle Assessment - Revisited
Lifecycle assessment, or LCA, determines environmental impact by looking at every single stage
in a product’s lifecycle. A holistic tool that is best used in comparing two or more products, LCA
includes raw material extraction or sourcing, production, distribution, consumer use, and disposal
or recycling (International Organization for Standardization, 2006). Once all stages are assessed,
the results are compared and analyzed among different impact categories. For the scope of this
design project, categories will include the effects of electric tractors versus conventional tractors
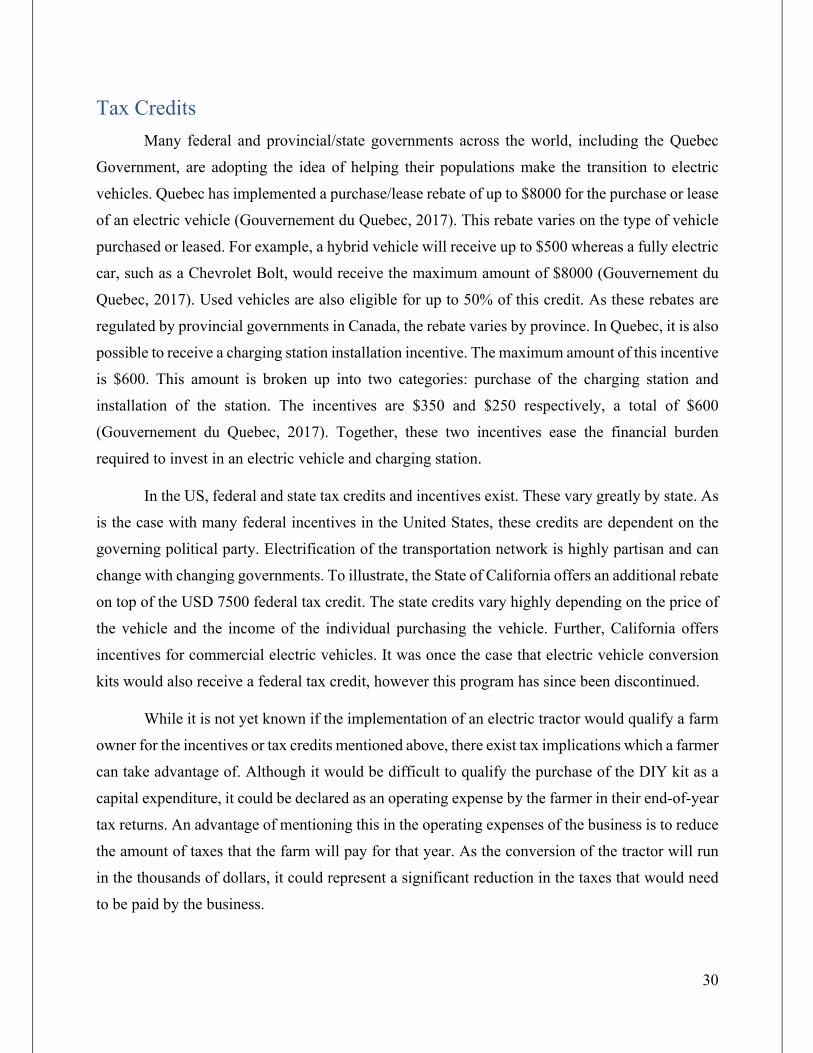
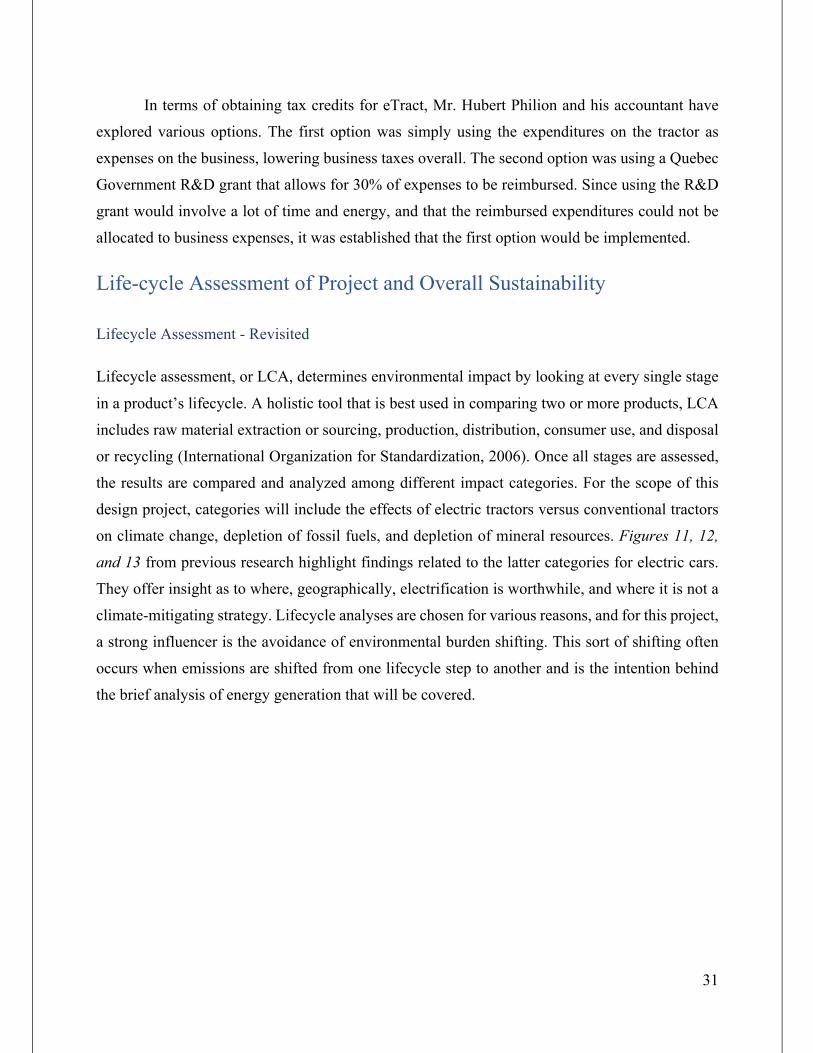
on climate change, depletion of fossil fuels, and depletion of mineral resources. Figures 11, 12,
and 13 from previous research highlight findings related to the latter categories for electric cars.
They offer insight as to where, geographically, electrification is worthwhile, and where it is not a
climate-mitigating strategy. Lifecycle analyses are chosen for various reasons, and for this project,
a strong influencer is the avoidance of environmental burden shifting. This sort of shifting often
occurs when emissions are shifted from one lifecycle step to another and is the intention behind
the brief analysis of energy generation that will be covered.
32
Figure 11: LCA Results for Electric Vehicles - Climate Change (Bonan, 2018)
Figure 12: LCA Results for Electric Vehicles - Fossil Resources (Bonan, 2018)
0 10000 20000 30000 40000 50000 60000
100% Wind Energy
US
China
India
Japan
Brazil
Germany
Italy
Russia
France
Canada
Conventional Vehicle
Climate Change (kg CO2)
0 100000 200000 300000 400000 500000 600000 700000
100% Wind Energy
US
China
India
Japan
Brazil
Germany
Italy
Russia
France
Canada
Conventional Vehicle
Fossil Resources (MJ)
33
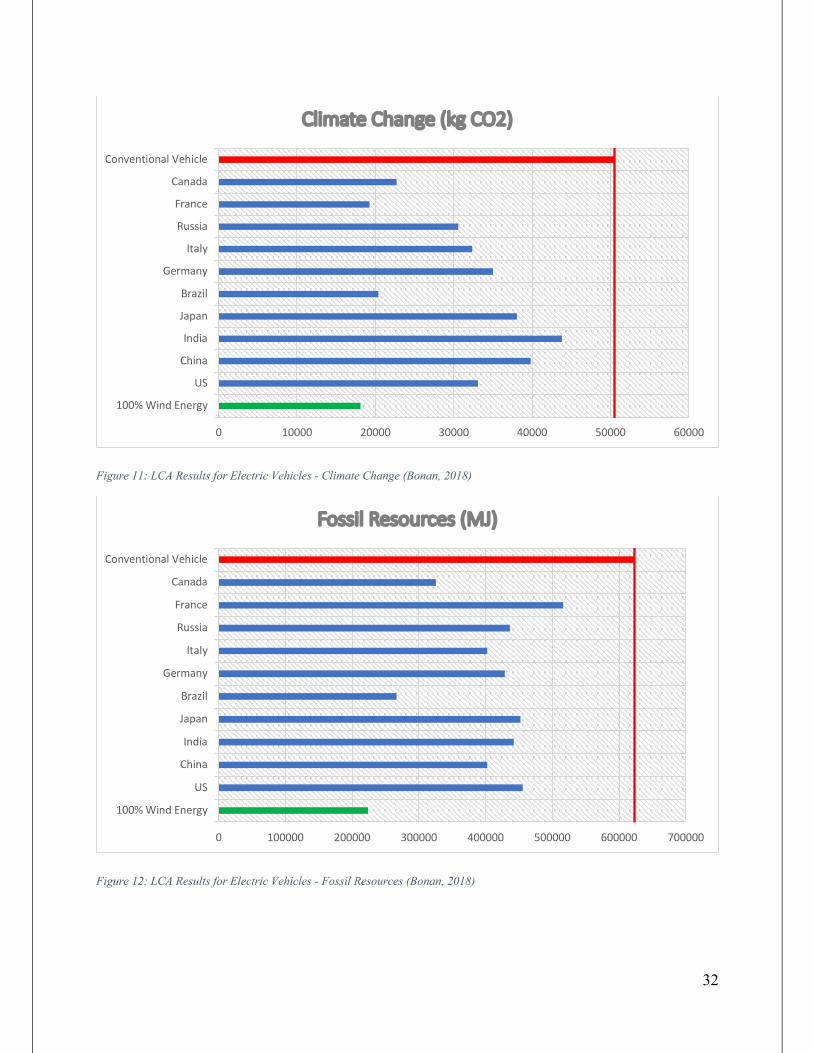
Figure 13: LCA Results for Electric Vehicles - Mineral Resources (Bonan, 2018)
Figures 11, 12, and 13 represent lifecycle analysis results for vehicle electrification in 10
countries. The red marker indicates where conventional cars fall in each impact category, whereas
the blue lines are the implementation of electric cars in each country. The green line simulates a
country whose electricity generation is entirely based on wind energy. It is observed that tractor
electrification could have worthwhile benefits in many countries on the scopes of climate change
and fossil resources, however mineral resources will be impacted regardless of the country because
of the heavy use of lithium-ion.
ISO14040 – 2006
The International Organization for Standardization develops and publishes international standards.
The ISO creates documents that provide requirements, specifications, guidelines or characteristics
that can be used consistently to ensure that materials, products, processes and services are fit for
their purpose (International Organization for Standardization, 2006). In terms of lifecycle
assessment, the international standard that exists is ISO 14040, titled “Environmental management
– Life cycle assessment – Principles and framework.”
The LCA technique outlined in the standard involves four phases:
0 200 400 600 800 1000 1200 1400 1600 1800 2000
100% Wind Energy
US
China
India
Japan
Brazil
Germany
Italy
Russia
France
Canada
Conventional Vehicle
Mineral Resources (kg)
34
i. The goal and scope definition phase
ii. The inventory analysis phase
iii. The impact assessment phase
iv. The interpretation phase
These standard phases must be respected in the elaboration of a Life cycle assessment to be in line
with ISO standards. With regards to the design of a life cycle assessment for converting a gas-
powered tractor to electric, the goal and scope definition phase involves outlining the lack of
current data related to the impact of tractor electrification on the environment. The “goal” for this
design project is to convert a tractor from diesel power to electric, described above. The “scope”
in this case includes all parts of the tractor other than the body itself. Since various pieces will be
acquired, the environmental impact of each piece, as well as the lowered emissions due to lack of
fuel also fall into the “scope” category. Figures 11, 12, and 13 refer to three scope categories. The
“inventory analysis” phase reviews current projects that involve vehicle electrification, and their
impacts on the environment. It also identifies contradictions in existing research and emphasizes
key findings. The “impact assessment” phase is the core of LCA data collection. It involves
analyzing the impacts converting a tractor to electric will have on the various categories described
in the “scope” section, in addition to the impacts associated with the manufacturing process of the
acquired parts. In the “interpretation” phase, the data collected is compared and contrasted with
conventional tractors to assess whether a true difference exists. Recommendations on the actual
electrification of tractors are made based on these results.
End-of-life Strategies From a mineral resources standpoint, it is evident that electrifying a gas-powered tractor
has negative consequences. It is inferred, especially due to the positive lifecycle analysis results of
Quebec’s Hydroelectricity, that the environmental benefits will outweigh the consequences.
Throughout the design plan, the end-of-life disposal of the tractor was considered. Firstly, it was
ensured that the battery packs are both easily accessible, and that individual packs can be replaced,
as well as the entire battery bank. This will ensure that once the batteries are depleted, the tractor
will not have to be disposed of. When it does come to disposing of Lithium-Ion, research remains
in progress. Recycling of automotive lithium-ion batteries is complicated and not yet established
because few end-of-life batteries will need recycling for another decade (Gaines, 2014).
35
Additionally, this conversion process allows for the repurposing of tractors which would
otherwise be sent to landfills. By removing the diesel engine and replacing it with a new electric
one, the tractor will be revived, offsetting a significant amount of waste. Further, engines made of
metal and other components of a tractor are recyclable. Taking apart an old tractor and converting
it to electrical power allows for these pieces to be recycled rather than sent to landfill or scrapyard.
Additional Considerations While removing the engine, gas tank, and exhaust system, and replacing them with electric
counterparts is the largest part of eTract’s design, it is not the entirety. For the final tractor to be
functional, additional steps must be taken. Firstly, as discussed previously, a potentiometer must
be installed to relay information from the gas pedal to the motor. This step is required with virtually
all electric vehicles (Brain, Electric Vehicle Specifications, 2002). Second, the steering pump must
be wired to the electric motor. In the case of Hubert Philion’s tractor, the hydraulic pump will not
be changed, however other farmers could intend on installing an electronic power steering system.
Another deliberation was the air conditioner, since the Landini tractor is equipped. While this was
a concern for eTract, many orchard tractors do not have air conditioning systems, and this step can
be skipped. Like many other ancillary systems, the air conditioner compressor will be run by the
electric motor. A final consideration is the brake system. Tractors and motorcars with internal
combustion engines have brake boosters that connect directly to the vacuum of the engine. Since
the engine is being replaced by an electric motor, there will be no vacuum for the brake system,
therefore a vacuum pump must be installed.
In terms of ergonomics and ease of use, a tablet will be installed inside the tractor’s cab to
display information such as speed, battery pack charge, and potential motor problems. While
EcoTuned uses a software to display the battery charge on the fuel gauge of their converted
vehicles, this process involves in-depth knowledge of coding, in addition to a vehicle with software
that can be changed. Since the Landini tractor is from 1994, it was decided that integrating an
android tablet would be a better alternative. The tablet will be waterproof and dustproof, meeting
IP68 requirements of “Protection from contact with harmful dust” and “Protected from immersion
in water with a depth of more than 1 meter for up to 30 minutes” (Parker, 2018).
36
Cost Analysis
Cost of Conversion
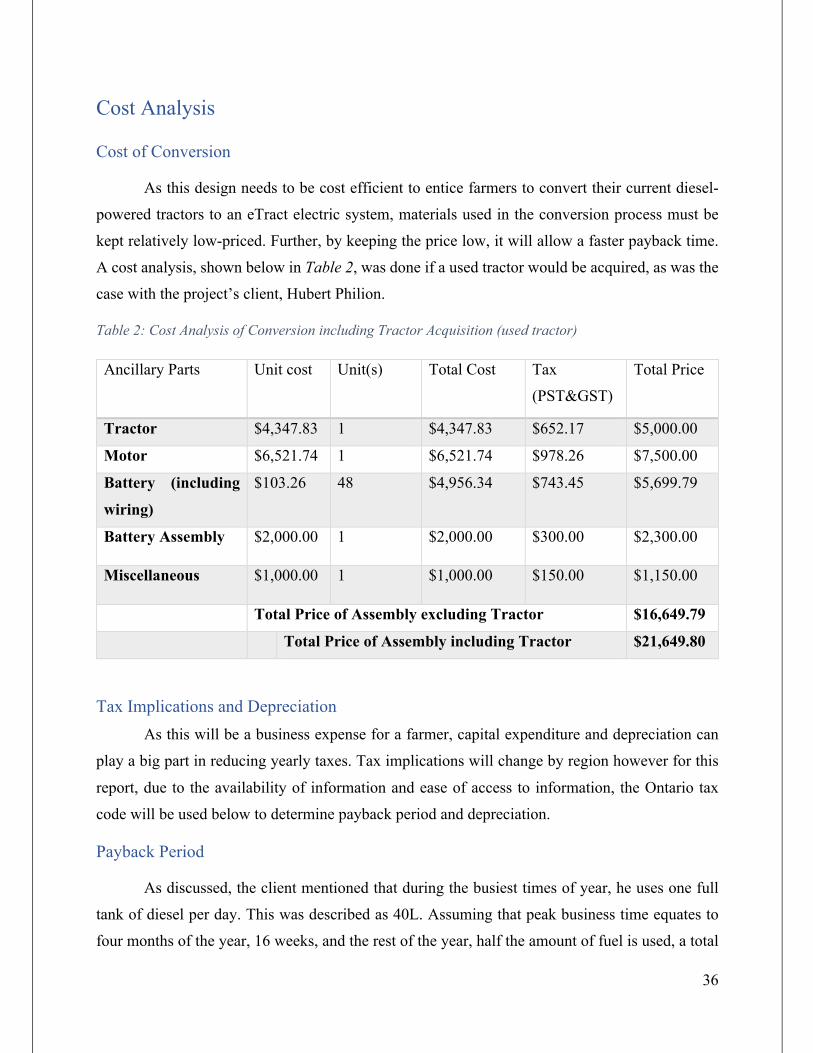
As this design needs to be cost efficient to entice farmers to convert their current diesel-
powered tractors to an eTract electric system, materials used in the conversion process must be
kept relatively low-priced. Further, by keeping the price low, it will allow a faster payback time.
A cost analysis, shown below in Table 2, was done if a used tractor would be acquired, as was the
case with the project’s client, Hubert Philion.
Table 2: Cost Analysis of Conversion including Tractor Acquisition (used tractor)
Ancillary Parts Unit cost Unit(s) Total Cost Tax
(PST&GST)
Total Price
Tractor $4,347.83 1 $4,347.83 $652.17 $5,000.00
Motor $6,521.74 1 $6,521.74 $978.26 $7,500.00
Battery (including
wiring)
$103.26 48 $4,956.34 $743.45 $5,699.79
Battery Assembly $2,000.00 1 $2,000.00 $300.00 $2,300.00
Miscellaneous $1,000.00 1 $1,000.00 $150.00 $1,150.00
Total Price of Assembly excluding Tractor $16,649.79
Total Price of Assembly including Tractor $21,649.80
Tax Implications and Depreciation As this will be a business expense for a farmer, capital expenditure and depreciation can
play a big part in reducing yearly taxes. Tax implications will change by region however for this
report, due to the availability of information and ease of access to information, the Ontario tax
code will be used below to determine payback period and depreciation.
Payback Period
As discussed, the client mentioned that during the busiest times of year, he uses one full
tank of diesel per day. This was described as 40L. Assuming that peak business time equates to
four months of the year, 16 weeks, and the rest of the year, half the amount of fuel is used, a total
37
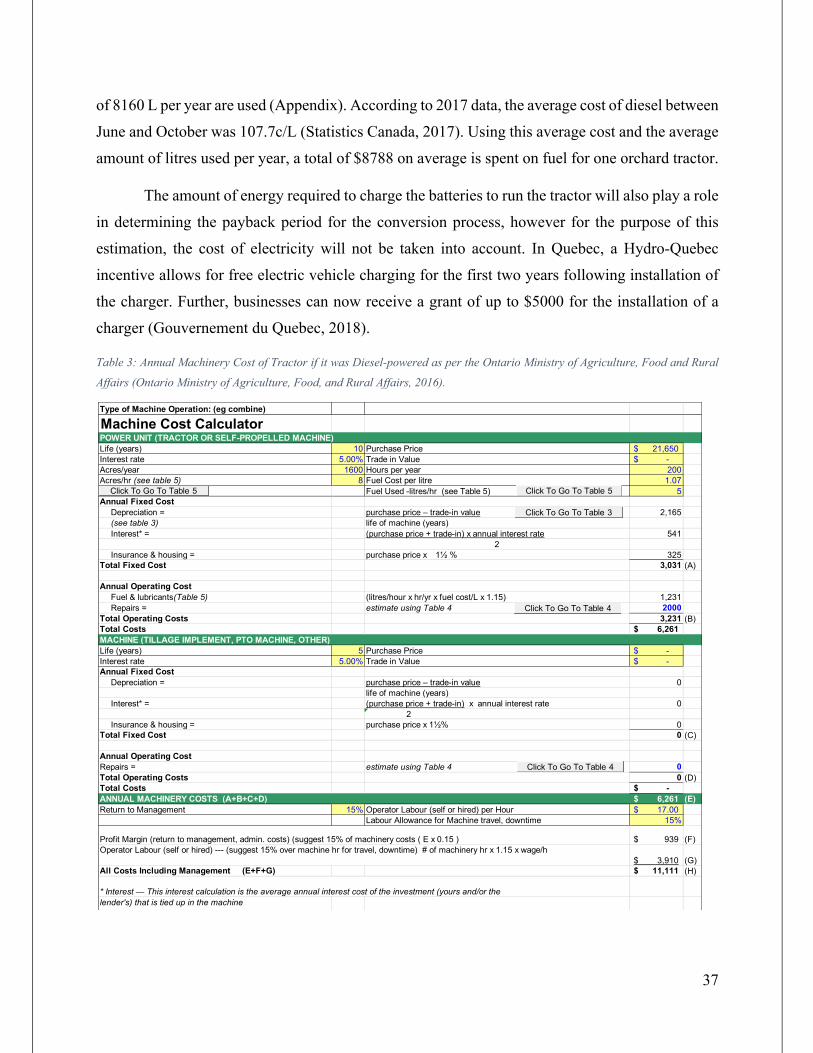
of 8160 L per year are used (Appendix). According to 2017 data, the average cost of diesel between
June and October was 107.7c/L (Statistics Canada, 2017). Using this average cost and the average
amount of litres used per year, a total of $8788 on average is spent on fuel for one orchard tractor.
The amount of energy required to charge the batteries to run the tractor will also play a role
in determining the payback period for the conversion process, however for the purpose of this
estimation, the cost of electricity will not be taken into account. In Quebec, a Hydro-Quebec
incentive allows for free electric vehicle charging for the first two years following installation of
the charger. Further, businesses can now receive a grant of up to $5000 for the installation of a
charger (Gouvernement du Quebec, 2018).
Table 3: Annual Machinery Cost of Tractor if it was Diesel-powered as per the Ontario Ministry of Agriculture, Food and Rural
Affairs (Ontario Ministry of Agriculture, Food, and Rural Affairs, 2016).
Type of Machine Operation: (eg combine)
Machine Cost CalculatorPOWER UNIT (TRACTOR OR SELF-PROPELLED MACHINE)Life (years) 10 Purchase Price 21,650$ Interest rate 5.00% Trade in Value -$ Acres/year 1600 Hours per year 200Acres/hr (see table 5) 8 Fuel Cost per litre 1.07
Fuel Used -litres/hr (see Table 5) 5Annual Fixed Cost
Depreciation = purchase price – trade-in value 2,165(see table 3) life of machine (years)Interest* = (purchase price + trade-in) x annual interest rate 541
2Insurance & housing = purchase price x 1½ % 325
Total Fixed Cost 3,031 (A)
Annual Operating CostFuel & lubricants(Table 5) (litres/hour x hr/yr x fuel cost/L x 1.15) 1,231Repairs = estimate using Table 4 2000
Total Operating Costs 3,231 (B)Total Costs 6,261$ MACHINE (TILLAGE IMPLEMENT, PTO MACHINE, OTHER)Life (years) 5 Purchase Price -$ Interest rate 5.00% Trade in Value -$ Annual Fixed Cost
Depreciation = purchase price – trade-in value 0life of machine (years)
Interest* = (purchase price + trade-in) x annual interest rate 0 2
Insurance & housing = purchase price x 1½% 0Total Fixed Cost 0 (C)
Annual Operating CostRepairs = estimate using Table 4 0Total Operating Costs 0 (D)Total Costs -$ ANNUAL MACHINERY COSTS (A+B+C+D) 6,261$ (E)Return to Management 15% Operator Labour (self or hired) per Hour 17.00$
Labour Allowance for Machine travel, downtime 15%
Profit Margin (return to management, admin. costs) (suggest 15% of machinery costs ( E x 0.15 ) 939$ (F)Operator Labour (self or hired) --- (suggest 15% over machine hr for travel, downtime) # of machinery hr x 1.15 x wage/h
3,910$ (G)All Costs Including Management (E+F+G) 11,111$ (H)
* Interest — This interest calculation is the average annual interest cost of the investment (yours and/or the lender's) that is tied up in the machine
Click To Go To Table 5Click To Go To Table 5
Click To Go To Table 4
Click To Go To Table 4
Click To Go To Table 3
38
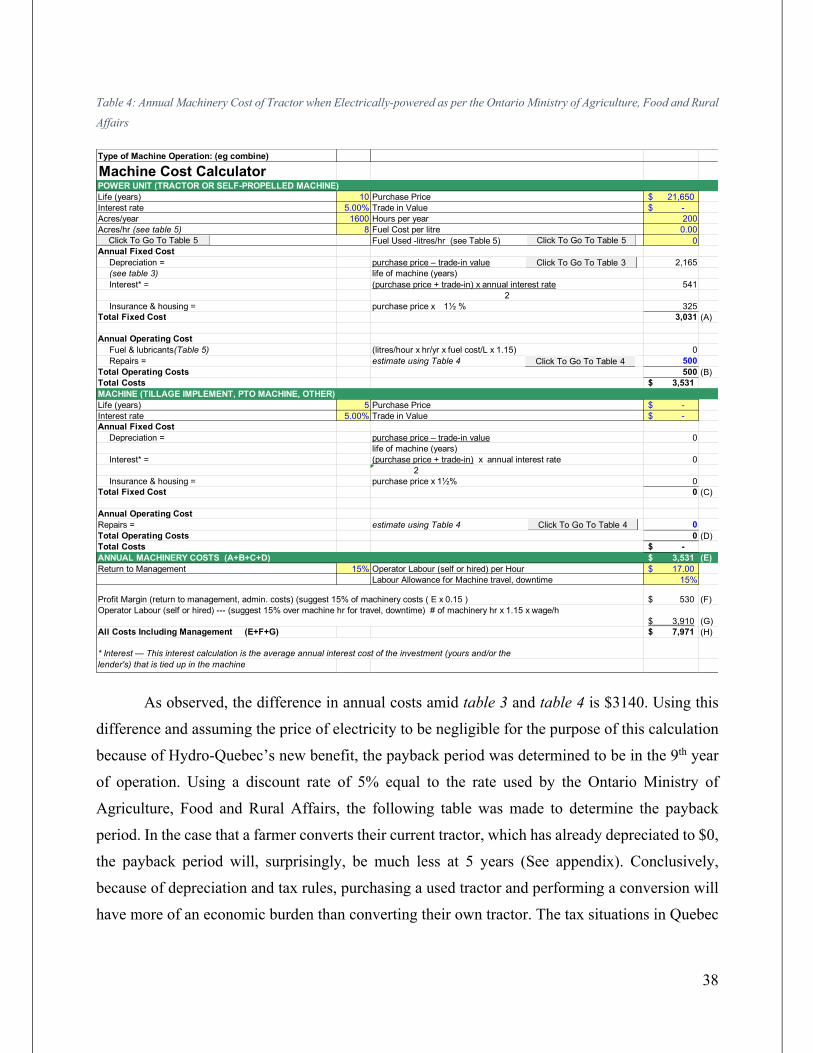
Table 4: Annual Machinery Cost of Tractor when Electrically-powered as per the Ontario Ministry of Agriculture, Food and Rural
Affairs
As observed, the difference in annual costs amid table 3 and table 4 is $3140. Using this
difference and assuming the price of electricity to be negligible for the purpose of this calculation
because of Hydro-Quebec’s new benefit, the payback period was determined to be in the 9th year
of operation. Using a discount rate of 5% equal to the rate used by the Ontario Ministry of
Agriculture, Food and Rural Affairs, the following table was made to determine the payback
period. In the case that a farmer converts their current tractor, which has already depreciated to $0,
the payback period will, surprisingly, be much less at 5 years (See appendix). Conclusively,
because of depreciation and tax rules, purchasing a used tractor and performing a conversion will
have more of an economic burden than converting their own tractor. The tax situations in Quebec
Type of Machine Operation: (eg combine)
Machine Cost CalculatorPOWER UNIT (TRACTOR OR SELF-PROPELLED MACHINE)Life (years) 10 Purchase Price 21,650$ Interest rate 5.00% Trade in Value -$ Acres/year 1600 Hours per year 200Acres/hr (see table 5) 8 Fuel Cost per litre 0.00
Fuel Used -litres/hr (see Table 5) 0Annual Fixed Cost
Depreciation = purchase price – trade-in value 2,165(see table 3) life of machine (years)Interest* = (purchase price + trade-in) x annual interest rate 541
2Insurance & housing = purchase price x 1½ % 325
Total Fixed Cost 3,031 (A)
Annual Operating CostFuel & lubricants(Table 5) (litres/hour x hr/yr x fuel cost/L x 1.15) 0Repairs = estimate using Table 4 500
Total Operating Costs 500 (B)Total Costs 3,531$ MACHINE (TILLAGE IMPLEMENT, PTO MACHINE, OTHER)Life (years) 5 Purchase Price -$ Interest rate 5.00% Trade in Value -$ Annual Fixed Cost
Depreciation = purchase price – trade-in value 0life of machine (years)
Interest* = (purchase price + trade-in) x annual interest rate 0 2
Insurance & housing = purchase price x 1½% 0Total Fixed Cost 0 (C)
Annual Operating CostRepairs = estimate using Table 4 0Total Operating Costs 0 (D)Total Costs -$ ANNUAL MACHINERY COSTS (A+B+C+D) 3,531$ (E)Return to Management 15% Operator Labour (self or hired) per Hour 17.00$
Labour Allowance for Machine travel, downtime 15%
Profit Margin (return to management, admin. costs) (suggest 15% of machinery costs ( E x 0.15 ) 530$ (F)Operator Labour (self or hired) --- (suggest 15% over machine hr for travel, downtime) # of machinery hr x 1.15 x wage/h
3,910$ (G)All Costs Including Management (E+F+G) 7,971$ (H)
* Interest — This interest calculation is the average annual interest cost of the investment (yours and/or the lender's) that is tied up in the machine
Click To Go To Table 5Click To Go To Table 5
Click To Go To Table 4
Click To Go To Table 4
Click To Go To Table 3
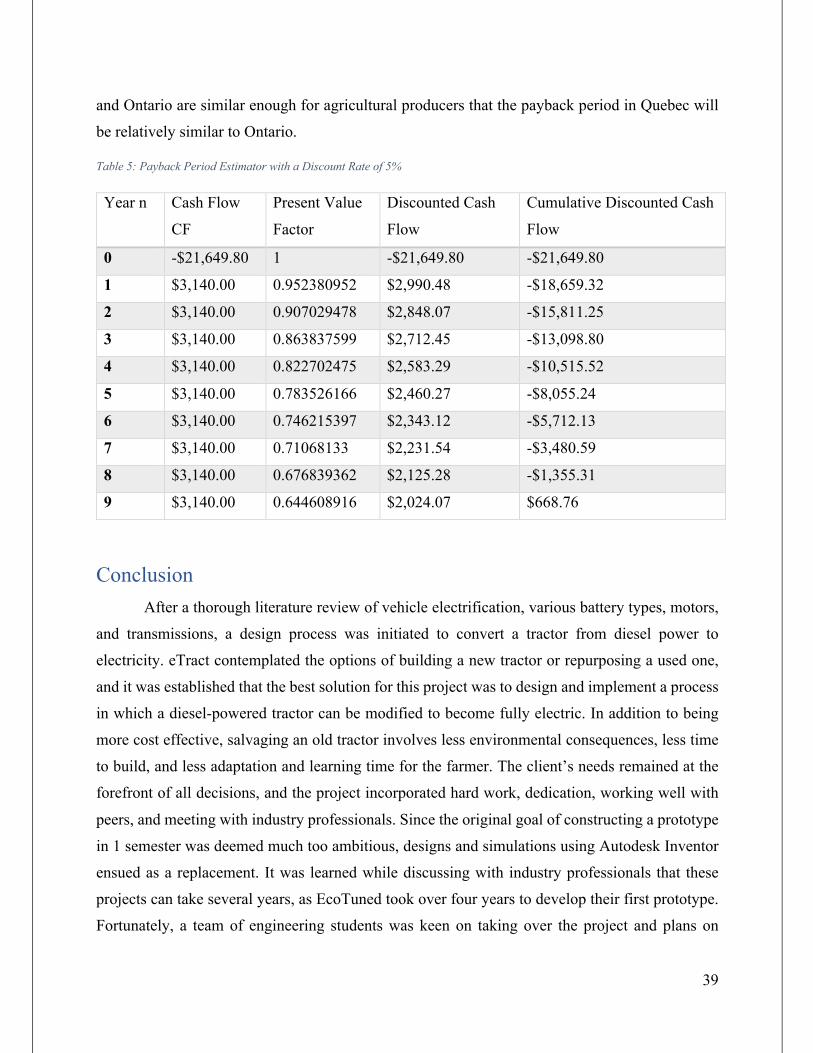
39
and Ontario are similar enough for agricultural producers that the payback period in Quebec will
be relatively similar to Ontario.
Table 5: Payback Period Estimator with a Discount Rate of 5%
Year n Cash Flow
CF
Present Value
Factor
Discounted Cash
Flow
Cumulative Discounted Cash
Flow
0 -$21,649.80 1 -$21,649.80 -$21,649.80
1 $3,140.00 0.952380952 $2,990.48 -$18,659.32
2 $3,140.00 0.907029478 $2,848.07 -$15,811.25
3 $3,140.00 0.863837599 $2,712.45 -$13,098.80
4 $3,140.00 0.822702475 $2,583.29 -$10,515.52
5 $3,140.00 0.783526166 $2,460.27 -$8,055.24
6 $3,140.00 0.746215397 $2,343.12 -$5,712.13
7 $3,140.00 0.71068133 $2,231.54 -$3,480.59
8 $3,140.00 0.676839362 $2,125.28 -$1,355.31
9 $3,140.00 0.644608916 $2,024.07 $668.76
Conclusion After a thorough literature review of vehicle electrification, various battery types, motors,
and transmissions, a design process was initiated to convert a tractor from diesel power to
electricity. eTract contemplated the options of building a new tractor or repurposing a used one,
and it was established that the best solution for this project was to design and implement a process
in which a diesel-powered tractor can be modified to become fully electric. In addition to being
more cost effective, salvaging an old tractor involves less environmental consequences, less time
to build, and less adaptation and learning time for the farmer. The client’s needs remained at the
forefront of all decisions, and the project incorporated hard work, dedication, working well with
peers, and meeting with industry professionals. Since the original goal of constructing a prototype
in 1 semester was deemed much too ambitious, designs and simulations using Autodesk Inventor
ensued as a replacement. It was learned while discussing with industry professionals that these
projects can take several years, as EcoTuned took over four years to develop their first prototype.
Fortunately, a team of engineering students was keen on taking over the project and plans on
40
bringing it to fruition in 2019. For a project to be sustainable and have reason for implementation,
many argue it should benefit people, the planet, and involve some sort of profit. All three of the
aforementioned characteristics were taken into account at various stages throughout this design
project. For people, eTract’s solution will lower long-term costs, in addition to reducing noise and
air pollution. In terms of the planet, lower greenhouse gas emissions will be observed from a
lifecycle analysis perspective, acting as a climate change mitigation strategy. Cost-wise, a full cost
analysis was presented, with a payback period much smaller than the life of the tractor. While
estimations put the project approximately $1500 over budget, it is possible that costs will change
upon procurement, however the payback period nonetheless assumes these increased costs and
deems the project worthwhile. To conclude, eTract’s vision statement made reference to lowering
greenhouse gases from the agricultural sector. The plan is to repurpose tractors that were once
declared fully depreciated; turning possible wastes into resources without causing financial strain.
The latter is inherent to pioneering a more sustainable future, one that safeguards the planet for
future generations.
41
Bibliography Adams, E. (2018, January 9). The Secrets of Electric Cars and Their Motors. Retrieved from
TheDrive: http://www.thedrive.com/tech/17505/the-secrets-of-electric-cars-and-their-motors-its-not-all-about-the-battery-folks
Ajanovic, A. (2011). Biofuels versus food production: does biofuels production increase food prices? Energy, 36(4), 2070-2076. Retrieved 10 12, 2017, from http://sciencedirect.com/science/article/pii/s0360544210002896
ASABE/ISO. (2006, May). Agricultural wheeled tractors — Operator’s seat — Laboratory measurement of transmitted vibration. ASABE/ISO 5007:2003 MAY2006 (R2016ED). St. Joseph, Michigan, United States of America: ASABE.
Bates, M. (2012, May 1). How Does a Battery Work? Retrieved from MIT - School of Engineering: https://engineering.mit.edu/engage/ask-an-engineer/how-does-a-battery-work/
Bonan, B. (2018). Climate “Change”: Are Electric Cars Really the Solution? Sainte-Anne-de-Bellevue.
BorgWarner. (2016). HVH250-115 Electric Motor. Pendleton, IN: BorgWarner Inc.
Brain, M. (2000, April 1). Horsepower Analyses. Retrieved from How Stuff Works: https://auto.howstuffworks.com/horsepower1.htm
Brain, M. (2002, March). Electric Vehicle Specifications. Retrieved from HowStuffWorks: https://auto.howstuffworks.com/electric-car7.htm
Buchmann, I. (2017). BU-201: How does the Lead Acid Battery Work? . Retrieved from Battery University: http://batteryuniversity.com/learn/article/lead_based_batteries
Canadian Centre for Occupational Health and Safety. (2018). OSH Answers Fact Sheets. Retrieved from Government of Canada: https://www.ccohs.ca/oshanswers/safety_haz/electrical.html
Co., A. A. (1991). United States of America Patent No. US 5419406 A.
Culshaw, D. (1988). Tractor Performance Testing on Axle Dynamometers. Journal of Terramechanics.
Curry, C. (2017, July 5). Lithium-ion Battery Costs and Market. Retrieved from Bloomberg New Energy Finance: https://data.bloomberglp.com/bnef/sites/14/2017/07/BNEF-Lithium-ion-battery-costs-and-market.pdf
Electrical Technology Inc. (2013, March). How to Calculate the Battery Charging Time & Battery Charging Current. Retrieved from electricaltechnology.org: https://www.electricaltechnology.org/2013/03/easy-charging-time-formula-for.html
Engineering Toolbox. (2017, November). Rolling Resistance. Retrieved from The Engineeing Toolbox: https://www.engineeringtoolbox.com/rolling-friction-resistance-d_1303.html
42
EPA. (2017, April 14). Overview of Greenhouse Gases. Retrieved from United Stest Environmental Protection Agency: https://www.epa.gov/ghgemissions/overview-greenhouse-gases#nitrous-oxide
Ferguson, K. (2017, July 4). Why is three phase better than single phase? Retrieved from Quora: https://www.quora.com/Why-is-three-phase-better-than-single-phase
Gaines, L. (2014). The future of automotive lithium-ion battery recycling: Charting a sustainable course. Sustainable Materials and Technologies, 2-7. Retrieved from https://www.sciencedirect.com/science/article/pii/S2214993714000037
Gouvernement du Quebec. (2017). Purchase or Lease Rebate Program. Retrieved from Transition Energetique Quebec: http://vehiculeselectriques.gouv.qc.ca/english/nous-joindre.asp
Gouvernement du Quebec. (2018, August 9). Plan d'action en électrification des transports. Retrieved from Gouvernement du Quebec: http://vehiculeselectriques.gouv.qc.ca/entreprises/entreprises.asp
Hydro Quebec. (2014, November). Comparison of Power Generation Options. Retrieved from Quebec Electricity; Clean Energy par Excellence: http://www.hydroquebec.com/data/developpement-durable/pdf/15094A.pdf
Hydro Quebec. (2017, April 1). A domestic rate for residential and farm customers with a power demand of at least 50 kW. Retrieved from Hydro Quebec: http://www.hydroquebec.com/residential/customer-space/account-and-billing/understanding-bill/residential-rates/rate-dp.html
IEEE Press. (2000). In Seventh (Ed.), The Authoritative Dictionary of IEEE Standards Terms (p. 588).
International Organization for Standardization. (2006). ISO 14040: 2006. Geneva: ISO.
International Organization for Standardization. (2006). ISO 14040: 2006. Retrieved from ISO: https://www.iso.org/standard/37456.html
Li, Y., & McLaughlin, N. (2005). FUEL EFFICIENCY AND EXHAUST EMISSIONS FOR BIODIESEL BLENDS. The Canadian Society of Agricultural and Bilogical Engineers, -5-067.
National Energy Board. (2016). Canada's Renewable Power Landscape. Government of Canada.
Nissan. (2017). Nissan Leaf - Charging and Range. Retrieved from Nissan USA: https://www.nissanusa.com/electric-cars/leaf/charging-range/battery/
Ontario Ministry of Agriculture, Food, and Rural Affairs. (2016, January 4). Machinery Cost Calculator. Retrieved from Ontario Ministry of Agriculture, Food, and Rural Affairs: http://www.omafra.gov.on.ca/english/busdev/download/calc_machine.htm
43
Parker, M. (2018, November 21). IP67 vs IP68: Waterproof IP ratings explained. Retrieved from TrustedReviews: https://www.trustedreviews.com/opinion/what-is-ip68-ip-ratings-explained-2947135
Peterson, S., & Apt, J. (2010). Lithium-ion battery cell degradation resulting from realistic vehicle and vehicle-to-grid utilization. Journal of Power Sources, 2385-2392.
Statistics Canada. (2017, November 17). Gasoline and fuel oil, average retail prices by urban centre (monthly). Retrieved from Statistics Canada: https://www.statcan.gc.ca/tables-tableaux/sum-som/l01/cst01/econ152e-eng.htm
Sun Country Highway. (2017). EV40 EV Charger. Retrieved from Sun Country Highway: https://suncountryhighway.ca/store/EV40-EV-Charger-p43196279
Swaraj. (2015). 724 XM ORCHARD NT Specifications. Retrieved from Swaraj: http://www.swarajtractors.com/product_specification/Swaraj-ORCH-NT-724XM
Tarascon, J.-M., & Armand, M. (2001). Issues and challenges facing rechargeable lithium batteries. Nature, 359-367.
Tesla. (2016). Emergency Response Guide. Retrieved from Tesla Motors: https://www.tesla.com/sites/default/files/downloads/2016_Model_S_Emergency_Response_Guide_en.pdf
Tesla Energy. (2018). A Home Powered by Tesla. Retrieved from Tesla: https://www.tesla.com/en_CA/energy
TractorData. (2018, August 23). Landini 85 Blizzard. Retrieved from TractorData: http://www.tractordata.com/farm-tractors/004/1/6/4164-landini-85-engine.html
Tro, N., Fridgen, T., & Shaw, L. (2016). In N. Tro, T. Fridgen, & L. Shaw, Chemistry: A Molecular Approach (pp. 3-4). Upper Saddle River, New Jersey: Pearson Education, Inc.
Westbrook, M. H. (2001). The Electric Car: Development and Future of Battery, Hybrid and Fuel cell Cars (198 ed.). IET. Retrieved from https://books.google.ca/books?hl=en&lr=&id=6EfS0jRFQTkC&oi=fnd&pg=PA1&dq=electric+car+transmission&ots=NdZ0-gRIJz&sig=tjK9DYfkY4rzMmkIu9fC38JN_rQ#v=onepage&q=electric%20car%20transmission&f=false
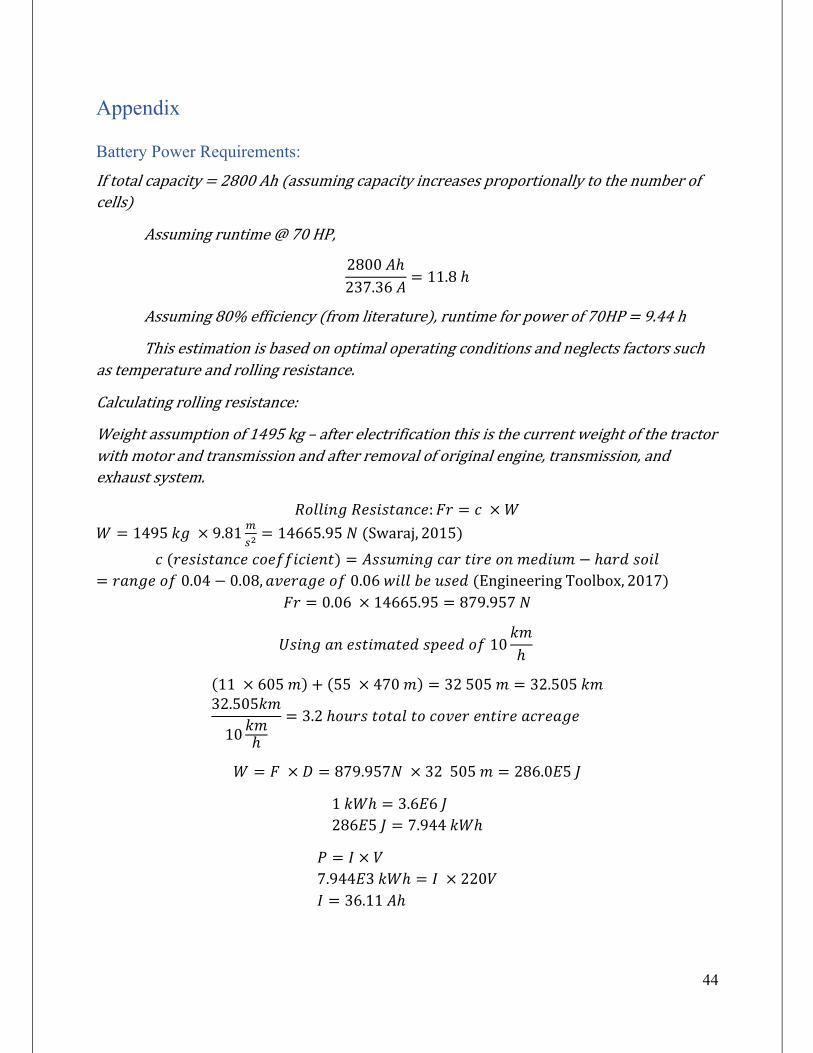
44
Appendix
Battery Power Requirements:
Iftotalcapacity=2800Ah(assumingcapacityincreasesproportionallytothenumberofcells)
Assumingruntime@70HP,
2800𝐴ℎ237.36𝐴 = 11.8ℎ
Assuming80%efficiency(fromliterature),runtimeforpowerof70HP=9.44h
Thisestimationisbasedonoptimaloperatingconditionsandneglectsfactorssuchastemperatureandrollingresistance.
Calculatingrollingresistance:
Weightassumptionof1495kg–afterelectrificationthisisthecurrentweightofthetractorwithmotorandtransmissionandafterremovaloforiginalengine,transmission,andexhaustsystem.
𝑅𝑜𝑙𝑙𝑖𝑛𝑔𝑅𝑒𝑠𝑖𝑠𝑡𝑎𝑛𝑐𝑒: 𝐹𝑟 = 𝑐 ×𝑊𝑊 = 1495𝑘𝑔 × 9.81 v
wx= 14665.95𝑁(Swaraj, 2015)
𝑐(𝑟𝑒𝑠𝑖𝑠𝑡𝑎𝑛𝑐𝑒𝑐𝑜𝑒𝑓𝑓𝑖𝑐𝑖𝑒𝑛𝑡) = 𝐴𝑠𝑠𝑢𝑚𝑖𝑛𝑔𝑐𝑎𝑟𝑡𝑖𝑟𝑒𝑜𝑛𝑚𝑒𝑑𝑖𝑢𝑚 − ℎ𝑎𝑟𝑑𝑠𝑜𝑖𝑙= 𝑟𝑎𝑛𝑔𝑒𝑜𝑓0.04 − 0.08, 𝑎𝑣𝑒𝑟𝑎𝑔𝑒𝑜𝑓0.06𝑤𝑖𝑙𝑙𝑏𝑒𝑢𝑠𝑒𝑑(EngineeringToolbox, 2017)
𝐹𝑟 = 0.06 × 14665.95 = 879.957𝑁
𝑈𝑠𝑖𝑛𝑔𝑎𝑛𝑒𝑠𝑡𝑖𝑚𝑎𝑡𝑒𝑑𝑠𝑝𝑒𝑒𝑑𝑜𝑓10𝑘𝑚ℎ
(11 × 605𝑚) + (55 × 470𝑚) = 32505𝑚 = 32.505𝑘𝑚32.505𝑘𝑚
10𝑘𝑚ℎ= 3.2ℎ𝑜𝑢𝑟𝑠𝑡𝑜𝑡𝑎𝑙𝑡𝑜𝑐𝑜𝑣𝑒𝑟𝑒𝑛𝑡𝑖𝑟𝑒𝑎𝑐𝑟𝑒𝑎𝑔𝑒
𝑊 = 𝐹 × 𝐷 = 879.957𝑁 × 32505𝑚 = 286.0𝐸5𝐽
1𝑘𝑊ℎ = 3.6𝐸6𝐽286𝐸5𝐽 = 7.944𝑘𝑊ℎ
𝑃 = 𝐼 × 𝑉7.944𝐸3𝑘𝑊ℎ = 𝐼 × 220𝑉𝐼 = 36.11𝐴ℎ
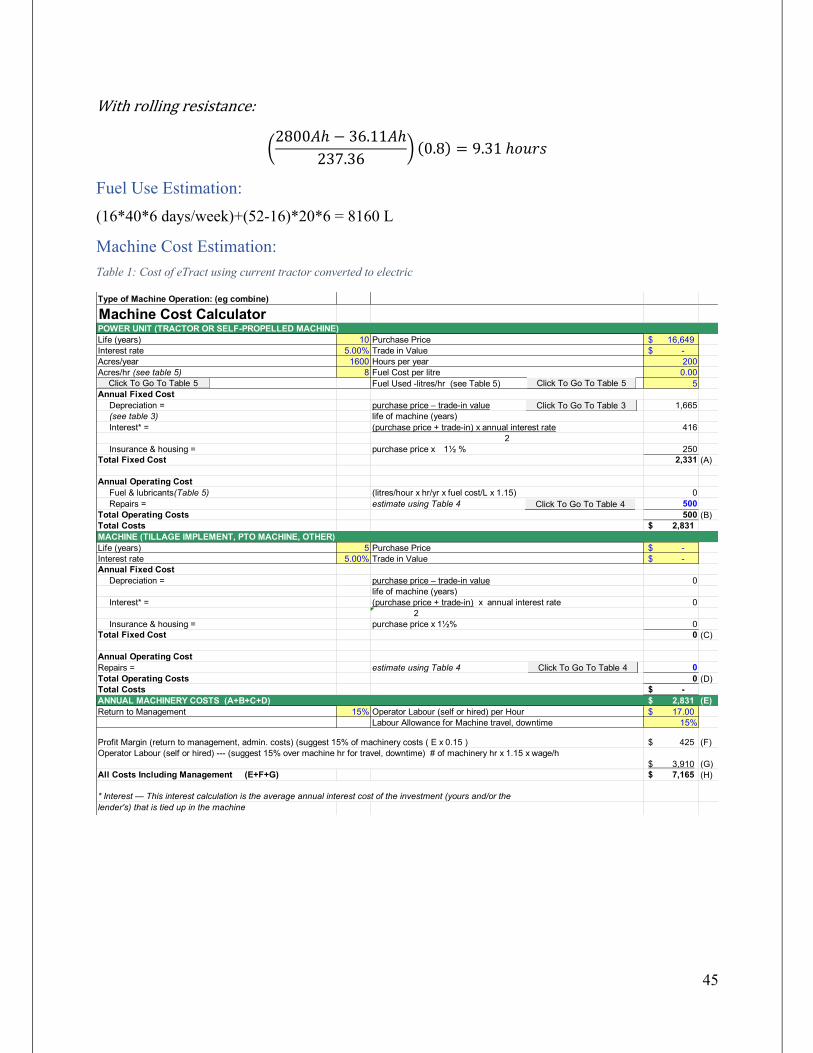
45
Withrollingresistance:
�2800𝐴ℎ − 36.11𝐴ℎ
237.36 � (0.8) = 9.31ℎ𝑜𝑢𝑟𝑠
Fuel Use Estimation: (16*40*6 days/week)+(52-16)*20*6 = 8160 L
Machine Cost Estimation: Table 1: Cost of eTract using current tractor converted to electric
Type of Machine Operation: (eg combine)
Machine Cost CalculatorPOWER UNIT (TRACTOR OR SELF-PROPELLED MACHINE)Life (years) 10 Purchase Price 16,649$ Interest rate 5.00% Trade in Value -$ Acres/year 1600 Hours per year 200Acres/hr (see table 5) 8 Fuel Cost per litre 0.00
Fuel Used -litres/hr (see Table 5) 5Annual Fixed Cost
Depreciation = purchase price – trade-in value 1,665(see table 3) life of machine (years)Interest* = (purchase price + trade-in) x annual interest rate 416
2Insurance & housing = purchase price x 1½ % 250
Total Fixed Cost 2,331 (A)
Annual Operating CostFuel & lubricants(Table 5) (litres/hour x hr/yr x fuel cost/L x 1.15) 0Repairs = estimate using Table 4 500
Total Operating Costs 500 (B)Total Costs 2,831$ MACHINE (TILLAGE IMPLEMENT, PTO MACHINE, OTHER)Life (years) 5 Purchase Price -$ Interest rate 5.00% Trade in Value -$ Annual Fixed Cost
Depreciation = purchase price – trade-in value 0life of machine (years)
Interest* = (purchase price + trade-in) x annual interest rate 0 2
Insurance & housing = purchase price x 1½% 0Total Fixed Cost 0 (C)
Annual Operating CostRepairs = estimate using Table 4 0Total Operating Costs 0 (D)Total Costs -$ ANNUAL MACHINERY COSTS (A+B+C+D) 2,831$ (E)Return to Management 15% Operator Labour (self or hired) per Hour 17.00$
Labour Allowance for Machine travel, downtime 15%
Profit Margin (return to management, admin. costs) (suggest 15% of machinery costs ( E x 0.15 ) 425$ (F)Operator Labour (self or hired) --- (suggest 15% over machine hr for travel, downtime) # of machinery hr x 1.15 x wage/h
3,910$ (G)All Costs Including Management (E+F+G) 7,165$ (H)
* Interest — This interest calculation is the average annual interest cost of the investment (yours and/or the lender's) that is tied up in the machine
Click To Go To Table 5Click To Go To Table 5
Click To Go To Table 4
Click To Go To Table 4
Click To Go To Table 3
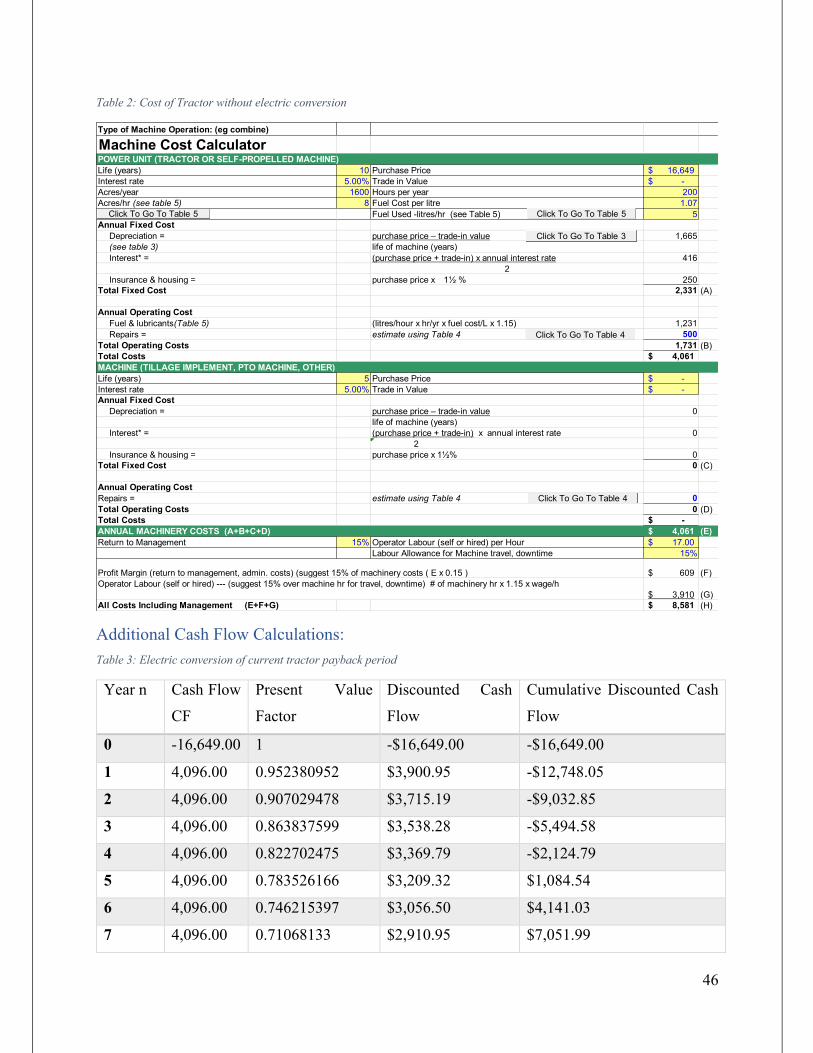
46
Table 2: Cost of Tractor without electric conversion
Additional Cash Flow Calculations: Table 3: Electric conversion of current tractor payback period
Year n Cash Flow
CF
Present Value
Factor
Discounted Cash
Flow
Cumulative Discounted Cash
Flow
0 -16,649.00 1 -$16,649.00 -$16,649.00
1 4,096.00 0.952380952 $3,900.95 -$12,748.05
2 4,096.00 0.907029478 $3,715.19 -$9,032.85
3 4,096.00 0.863837599 $3,538.28 -$5,494.58
4 4,096.00 0.822702475 $3,369.79 -$2,124.79
5 4,096.00 0.783526166 $3,209.32 $1,084.54
6 4,096.00 0.746215397 $3,056.50 $4,141.03
7 4,096.00 0.71068133 $2,910.95 $7,051.99
Type of Machine Operation: (eg combine)
Machine Cost CalculatorPOWER UNIT (TRACTOR OR SELF-PROPELLED MACHINE)Life (years) 10 Purchase Price 16,649$ Interest rate 5.00% Trade in Value -$ Acres/year 1600 Hours per year 200Acres/hr (see table 5) 8 Fuel Cost per litre 1.07
Fuel Used -litres/hr (see Table 5) 5Annual Fixed Cost
Depreciation = purchase price – trade-in value 1,665(see table 3) life of machine (years)Interest* = (purchase price + trade-in) x annual interest rate 416
2Insurance & housing = purchase price x 1½ % 250
Total Fixed Cost 2,331 (A)
Annual Operating CostFuel & lubricants(Table 5) (litres/hour x hr/yr x fuel cost/L x 1.15) 1,231Repairs = estimate using Table 4 500
Total Operating Costs 1,731 (B)Total Costs 4,061$ MACHINE (TILLAGE IMPLEMENT, PTO MACHINE, OTHER)Life (years) 5 Purchase Price -$ Interest rate 5.00% Trade in Value -$ Annual Fixed Cost
Depreciation = purchase price – trade-in value 0life of machine (years)
Interest* = (purchase price + trade-in) x annual interest rate 0 2
Insurance & housing = purchase price x 1½% 0Total Fixed Cost 0 (C)
Annual Operating CostRepairs = estimate using Table 4 0Total Operating Costs 0 (D)Total Costs -$ ANNUAL MACHINERY COSTS (A+B+C+D) 4,061$ (E)Return to Management 15% Operator Labour (self or hired) per Hour 17.00$
Labour Allowance for Machine travel, downtime 15%
Profit Margin (return to management, admin. costs) (suggest 15% of machinery costs ( E x 0.15 ) 609$ (F)Operator Labour (self or hired) --- (suggest 15% over machine hr for travel, downtime) # of machinery hr x 1.15 x wage/h
3,910$ (G)All Costs Including Management (E+F+G) 8,581$ (H)
Click To Go To Table 5Click To Go To Table 5
Click To Go To Table 4
Click To Go To Table 4
Click To Go To Table 3
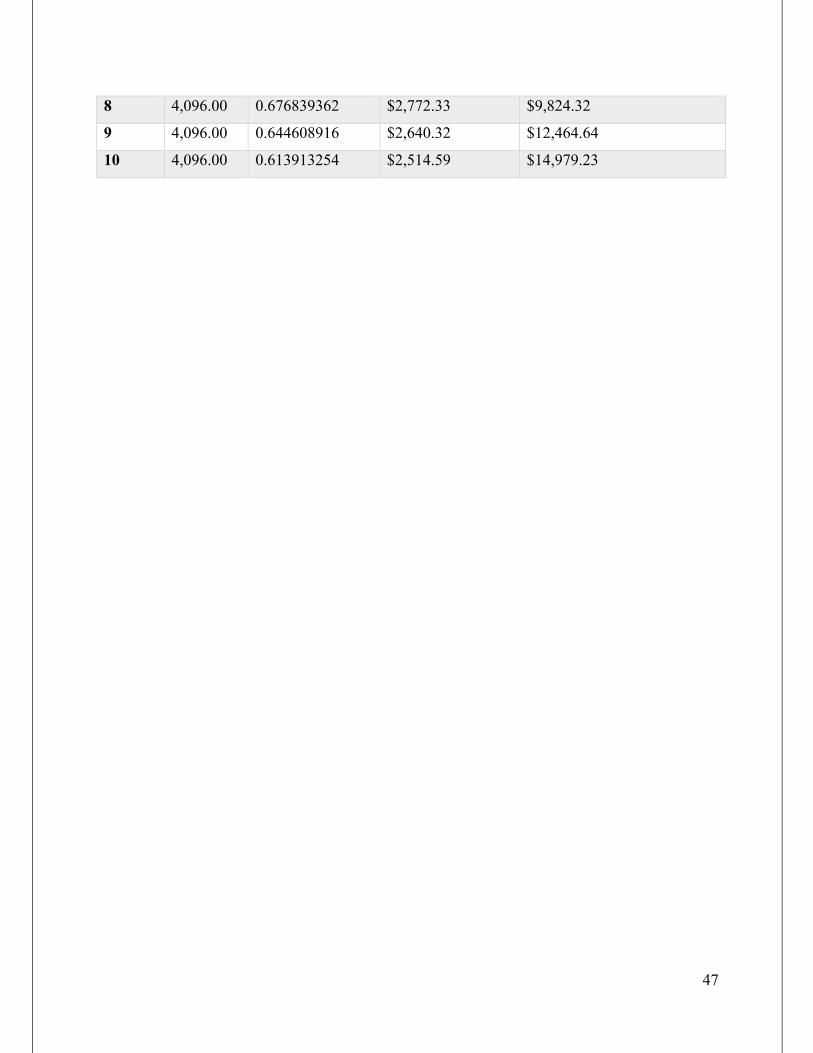
47
8 4,096.00 0.676839362 $2,772.33 $9,824.32
9 4,096.00 0.644608916 $2,640.32 $12,464.64
10 4,096.00 0.613913254 $2,514.59 $14,979.23