Delineation of genotype × environment interaction for ... - Nature
13
1 Vol.:(0123456789) Scientific Reports | (2021) 11:18649 | https://doi.org/10.1038/s41598-021-98002-y www.nature.com/scientificreports Delineation of genotype × environment interaction for identification of stable genotypes for tillering phase drought stress tolerance in sugarcane C. Mahadevaiah 1* , Prakash Hapase 2* , V. Sreenivasa 1 , Ramesh Hapase 2 , H. K. Mahadeva Swamy 1 , C. Anilkumar 3 , K. Mohanraj 1 , G. Hemaprabha 1 & Bakshi Ram 1 Sugarcane is a trans-seasonal long-duration crop and tillering phase (60–150 days) is the most sensitive phase for moisture stress, causing significant reduction in biomass accumulation. The study focussed to assess the Genotype × Environment Interaction (GEI) for tillering phase moisture stress and to identify the stable genotypes in sugarcane. The study dealt with 14 drought tolerant genotypes and two standards (Co 86032 and CoM 0265) which were evaluated in two plant and one ratoon trials at four locations in Maharashtra, India. The moisture stress was imposed for 60 days from 90 to 150 days after planting and corresponded to tillering phase by withholding the irrigation. The AMMI ANOVA showed significant GEI for cane and CCS yield accounting 18.33 and 19.45 percent of variability respectively. Drought and genotype main effects were highly significant accounting 49.08 and 32.59 percent variability for cane yield and, 52.45 and 28.10 percent variability for CCS yield respectively. The first two interactive principal component (IPCA) biplots of AMMI showed diverse nature of all four environments and the Discriminative vs Mean biplots of Genotype + genotype × environment interaction (GGE) model showed that ‘Pune’ as the highly discriminating environment. The genotype ranking biplots of GGE showed that Co 85019 was the most stable genotype followed by Co 98017. Similar results were also observed in Yield vs IPCA1 biplot of AMMI, which revealed Co 85019 and Co 98017 as high yielding stable varieties. Yield related environmental maximum (YREM) showed thirteen and nine percent loss due to crossover interactions in Co 85019 for cane yield and CCS yield respectively. The multi-environment BLUP and genotype stability index (GSI) has reaffirmed that Co 85019 as a drought proof and stable genotype with high yield under tillering phase drought stress. The results suggested using Co 85019 for cultivation in drought prone regions and the usefulness of the methodology for identifying more such sugarcane varieties for the benefit of resource poor famers in drought affected regions. Abbreviations CCS Commercial cane yield NMC Number of millable canes SL Millable stalk length ST Stalk thickness SCW Single cane weight AMMI Additive main effects and multiplicative interactive effects stability analysis model GGE Genotype + genotype × environment interaction OPEN 1 Division of Crop Improvement, ICAR-Sugarcane Breeding Institute, Coimbatore, India. 2 Vasantdada Sugar Institute, Pune, India. 3 ICAR-National Rice Research Institute, Cuttack, India. * email: [email protected]; hapase_prakash@rediffmail.com
-
Upload
khangminh22 -
Category
Documents
-
view
1 -
download
0
Transcript of Delineation of genotype × environment interaction for ... - Nature

1
Vol.:(0123456789)
Scientific Reports | (2021) 11:18649 | https://doi.org/10.1038/s41598-021-98002-y
www.nature.com/scientificreports
Delineation of genotype × environment interaction for identification of stable genotypes for tillering phase drought stress tolerance in sugarcaneC. Mahadevaiah1*, Prakash Hapase2*, V. Sreenivasa1, Ramesh Hapase2, H. K. Mahadeva Swamy1, C. Anilkumar3, K. Mohanraj1, G. Hemaprabha1 & Bakshi Ram1
Sugarcane is a trans-seasonal long-duration crop and tillering phase (60–150 days) is the most sensitive phase for moisture stress, causing significant reduction in biomass accumulation. The study focussed to assess the Genotype × Environment Interaction (GEI) for tillering phase moisture stress and to identify the stable genotypes in sugarcane. The study dealt with 14 drought tolerant genotypes and two standards (Co 86032 and CoM 0265) which were evaluated in two plant and one ratoon trials at four locations in Maharashtra, India. The moisture stress was imposed for 60 days from 90 to 150 days after planting and corresponded to tillering phase by withholding the irrigation. The AMMI ANOVA showed significant GEI for cane and CCS yield accounting 18.33 and 19.45 percent of variability respectively. Drought and genotype main effects were highly significant accounting 49.08 and 32.59 percent variability for cane yield and, 52.45 and 28.10 percent variability for CCS yield respectively. The first two interactive principal component (IPCA) biplots of AMMI showed diverse nature of all four environments and the Discriminative vs Mean biplots of Genotype + genotype × environment interaction (GGE) model showed that ‘Pune’ as the highly discriminating environment. The genotype ranking biplots of GGE showed that Co 85019 was the most stable genotype followed by Co 98017. Similar results were also observed in Yield vs IPCA1 biplot of AMMI, which revealed Co 85019 and Co 98017 as high yielding stable varieties. Yield related environmental maximum (YREM) showed thirteen and nine percent loss due to crossover interactions in Co 85019 for cane yield and CCS yield respectively. The multi-environment BLUP and genotype stability index (GSI) has reaffirmed that Co 85019 as a drought proof and stable genotype with high yield under tillering phase drought stress. The results suggested using Co 85019 for cultivation in drought prone regions and the usefulness of the methodology for identifying more such sugarcane varieties for the benefit of resource poor famers in drought affected regions.
AbbreviationsCCS Commercial cane yieldNMC Number of millable canesSL Millable stalk lengthST Stalk thicknessSCW Single cane weightAMMI Additive main effects and multiplicative interactive effects stability analysis modelGGE Genotype + genotype × environment interaction
OPEN
1Division of Crop Improvement, ICAR-Sugarcane Breeding Institute, Coimbatore, India. 2Vasantdada Sugar Institute, Pune, India. 3ICAR-National Rice Research Institute, Cuttack, India. *email: [email protected]; [email protected]

2
Vol:.(1234567890)
Scientific Reports | (2021) 11:18649 | https://doi.org/10.1038/s41598-021-98002-y
www.nature.com/scientificreports/
ANOVA Analysis of varianceGEI Genotype × environment interactionIPCA Interactive principal component axisASV AMMI stability valueGSI Genotypic selection indexYREM Yield related environmental Maximum,BLUP Best linear unbiased prediction
Sugarcane is a major agro-industry based crop serving as raw material for the production of sugar and has high potentiality for renewable energy production such as biofuel and cogeneration. The moisture stress or drought is a major constraint in rainfed sugarcane cultivation due to variation and quantum of rainfall caused by global climate change and El-Nino southern oscillations1–3. Moisture stress or drought is a recurrent phenomenon with high frequency in the world3,4. The rainfall distribution pattern shows variation and spring/summer season goes as dry spells in most of the sugarcane growing countries5–8. Therefore, rain dependent sugarcane crop generally suffers due to moisture stress during spring/summer seasons. The development of drought tolerant sugarcane varieties enhances the productivity and sustainability of rainfed sugarcane agriculture.
The tillering phase is the most sensitive stage for moisture stress in sugarcane9–14, causing significant reduction in cane yield upto 49% through the reduction in its attributing traits such as shortening of internodes (45.76%), reduction in stalk length (45.76%), cane weight (25.5%) and the number of millable cane (22.8%)15,16. Devel-opment of climate resilient varieties are essentially required for effective mitigation of drought stress and for sustainable sugarcane agriculture in drought prone area17. The multi-environment evaluation of drought tolerant genotypes helps to understand the GEI and help to select the drought tolerant stable genotypes16.
The AMMI and GGE biplots models are popularly used to understand the pattern of GEI and to assess the stability of genotypes18–26. AMMI, a multiplicative model estimates the GEI components based on multidimen-sional approaches and is highly discriminative to estimate GEI components23,25,26. GGE Biplot analysis helps in the identification of mega environments, stable ranking of genotypes, and identification of ideal stable varieties27,28. The multi-locational evaluation of genotypes under tillering phase drought stress helps to assess the pattern of GEI and to identify the stable genotypes. The sugarcane is a water loving crop29 and cane yield under drought is one of the accurate indicators of drought tolerance30.
ICAR-Sugarcane Breeding Institute, Coimbatore is a premier research institute actively involved in the devel-opment of sugarcane varieties for high biomass, superior juice quality, and biotic and abiotic stress tolerance suitable for various agro climatic zones31,32. In order to identify the drought tolerant clones based on cane yield, fourteen drought tolerant clones and two standards (Co 86032 and CoM 0265) were evaluated under tiller-ing phase drought stress in four locations of sugar factories research farms in collaboration with Vasantdada Sugar Institute, Pune. This programme was formulated based on recommendations of i) an Interface meeting between the Indian Council of Agriculture Research (ICAR), Ministry Agriculture and Cooperation, Govern-ment of India, and Vasantdada Sugar Institute, Pune to evaluate the drought tolerant genotypes identified10,15,33 at ICAR-Sugarcane Breeding Institute, Coimbatore, ii) Indian Parliamentary question on the impact of drought on sugarcane crop damage and farmers and, iii) VIII ICAR Regional Committee Meeting on development of drought tolerant and water efficient varieties. Our studies showed the significant GEI for cane and CCS yield and identified Co 85019 as the high yielding and stable variety under tillering phase drought stress for its cultivation in the water stressed regions of Maharashtra.
Material and methodsMaterial and experimental design. Fourteen drought tolerant sugarcane clones were identified at ICAR-Sugarcane Breeding Institute, Coimbatore, Co 86032 (notified variety for cultivation in Peninsular India) and CoM 0265 (notified variety for cultivation in Maharashtra)34 constituted the experimental material for the study. The fourteen testing clones namely Co 0238, Co 05001, Co 05007, Co 08020, Co 10017, Co 10024, Co 13003, Co 2000-10, Co 85019, Co 90003, Co 92020, Co 93009, Co 94005, Co 98017 were commercial type sugar-cane genotypes developed by selection in the biparental and general cross populations (Supplementary table 1). These clones were selected based on screening for various abiotic stress tolerances at ICAR-Sugarcane Breeding Institute, Coimbatore, and selected based on the criteria of improvement in comparison with standard varieties. Co 85019 was selected for traits such as high cane yield under formative phase drought stress15,33, high water use efficiency and water productivity35 and high physiological efficiency related traits such as canopy temperature deficient, chlorophyll efficiency, leaf rolling index36 under water limited conditions. Co 85019 was also identified as a salinity tolerant clone, recorded high biomass accumulation at formative phase stress, and produced the high cane yield under salinity stress37–39 and further also used for characterization of saline responsive genes40. Co 98017, Co 2000-10 and Co 90003 were selected based on their superior performance for cane yield under formative phase drought stress in Coimbatore15,33. Co 0238, a notified variety for North-West Zone in India, cultivated in 2.5 million hectares in sub-tropical regions (80 percent of sugarcane cultivated area in sub-tropical India) and benefiting the millions of farmers in India. Further details of clones used in the study are given in supplementary table 1.
The experiments were planted in Randomized Block Design with two replications at four locations in research farms of sugar factories (Supplementary table 2). Each clone was planted in six rows of six meter length with row-to-row spacing of 1.20 m. The recommended seed rate of 12 buds per meter was planted at all locations. All these four experimental locations are located in Deccan plateau regions of India having black cotton soil or Vertisol41. The chemical properties of soil are given in the supplementary table 3. The recommended doses of nitrogen (340 kg/ha), phosphorous (170 kg/ha), and potassium (170 kg/ha) were adopted in all four locations. The

3
Vol.:(0123456789)
Scientific Reports | (2021) 11:18649 | https://doi.org/10.1038/s41598-021-98002-y
www.nature.com/scientificreports/
complete dose of phosphorous was applied as basal at the time of planting, nitrogen and potassium were applied in two split doses on 45 days at the time of partial earthing-up and 90 days at the time of complete earthing-up operations42. All the recommended cultivation practices were adopted and trials were maintained by the respec-tive sugar factory officials in participatory mode and, monitored by the researchers of ICAR-Sugarcane Breeding Institute, Coimbatore, and Vasantdada Sugar Institute, Pune in various stages of crop growth. The experiments were conducted in compliance with relevant institutional, national, and international guidelines and legislations.
Imposition of moisture stress during tillering phase and weather data. The drought was imposed during tillering phase by withdrawing the irrigation from 90 to 150 days after planting/ratooning at all locations during 2018 and 2019. The weather data for all four locations was obtained from India Meteorological Depart-ment, Pune (https:// www. imdpu ne. gov. in). The weather parameters during the drought imposition period, grand growth period, and maturity phase were given in supplementary table 4. The nil or minimum rainfall of 1.21, 4.18, 4.79, 23.48 mm during 2018 and 6.26, 3.69, 2.45, 3.95 mm of rainfall during 2019 during the drought imposition period (April 01 to May 30 of both the years) combined with high temperature and low humidity was recorded at Kopargaon, Jalna, Pune, and Nanded respectively. The low or no rainfall during this period is clearly indicated the severity of drought and justifies the need of experimentation and development of drought tolerant varieties for these regions.
Recording of observations. Cane yield (t/ha) was estimated based on cane yield from the middle four rows of each plot. NMC was counted from middle four rows at the time of harvest. Randomly selected five canes were averaged for recording the SCW, SL and ST. The stalk length was measured from ground level to the first node of visible dewlab (Supplementary table 5). For juice analysis, five canes were randomly sampled from the clumps at 10th and 12th months and, used for recording the brix and sucrose content by using Brix Hydrometer and Polarimeter respectively. The CCS (%) and CCS yield (t/ha) were estimated as given below43–45.
Statistical analysis. The replication-wise data of plant and ratoon trials from each location were subjected to statistical analysis. The homogeneity of error mean variance was done by Levene’s test46 for all 10 experiments using SPSS 16 (IBM Corp. Released 2016). The non-significance of Levene’s statistics for all traits revealed the homogeneity of error mean variance across all locations for further statistical analysis.
BLUP estimation. The BLUP for each location and multi environment BLUP were estimated in restricted maxi-mum likelihood method using mixed linear model of lme4 package of meta-R47. The mixed linear model for Randomised Block Design with replications for each location is defined as
where Yij is response variables like cane yield and CCS yield, µ is overall mean effect, Ri is ith replicate effects, Gj is jth genotype effect and €ij the effect of variance associated with ith replicate and jth genotype.
The mixed linear model for multi-environment BLUP for Randomised Block Design47 with replications by the inclusion of new factor ‘Drought Environments is as follows
where Yijk is response variables like cane yield and CCS yield, µ is average effect of response variable, Lk is kth location effect, Ri is ith replication effect at kth location, Gj is jth genotype effect, €ijk is the unknown effect related to ith replication jth genotype kth drought environments.
The heritability (broad-sense) for a given trait47 for each drought location was estimated as
where H2 is broad-sense heritability for a given trait, σ2g is genotypic variance for trait of interest, σ2
€ is residual variance and nR is replication numbers.
The broad-sense heritability for a given traits for the combined drought environments47 was estimated as
Brix(%) =((
0.77× (temperature in ◦C − 27.5))
+ Observed brix)
Sucrose(%) =
(
(
pol value × 0.26)
−
(
pol value
1000× (brix − 1)
))
− 0.02
Purity(%) =Sucrose(%)
Brix(%)× 100
CCS(%) = (Sucrose%× 1.022)− (Brix%× 0.292)
CCS Yield(t/ha) =CCS(%)× Cane yield(t/ha)
100
Yij = µ+ Ri + Gj+ Cij
Yijk = µ+ Lk + RiLk + Gj+ Lk × Gj+ Cijk
H2=
σ2g
(σ2g +σ2
CnR )
4
Vol:.(1234567890)
Scientific Reports | (2021) 11:18649 | https://doi.org/10.1038/s41598-021-98002-y
www.nature.com/scientificreports/
where H2 is broad-sense heritability for a given trait, σ2g is genotypic variance for trait of interest, σ2
ge is genotypic variance due to GEI for trait of interest, nL is number of drought environments and nR is replication numbers.
The genetic correlations (ρgij) between traits ‘i’ and ‘j’ across drought environments47 by using the variance component was estimated as
where
where σ2gi, σ2
gj and σ2ij are ith and jth traits genetic variances and genetic covariances respectively.
The BLUP was calculated by meta-R47 by treating the genotypes as random effect and drought location as fixed effect.
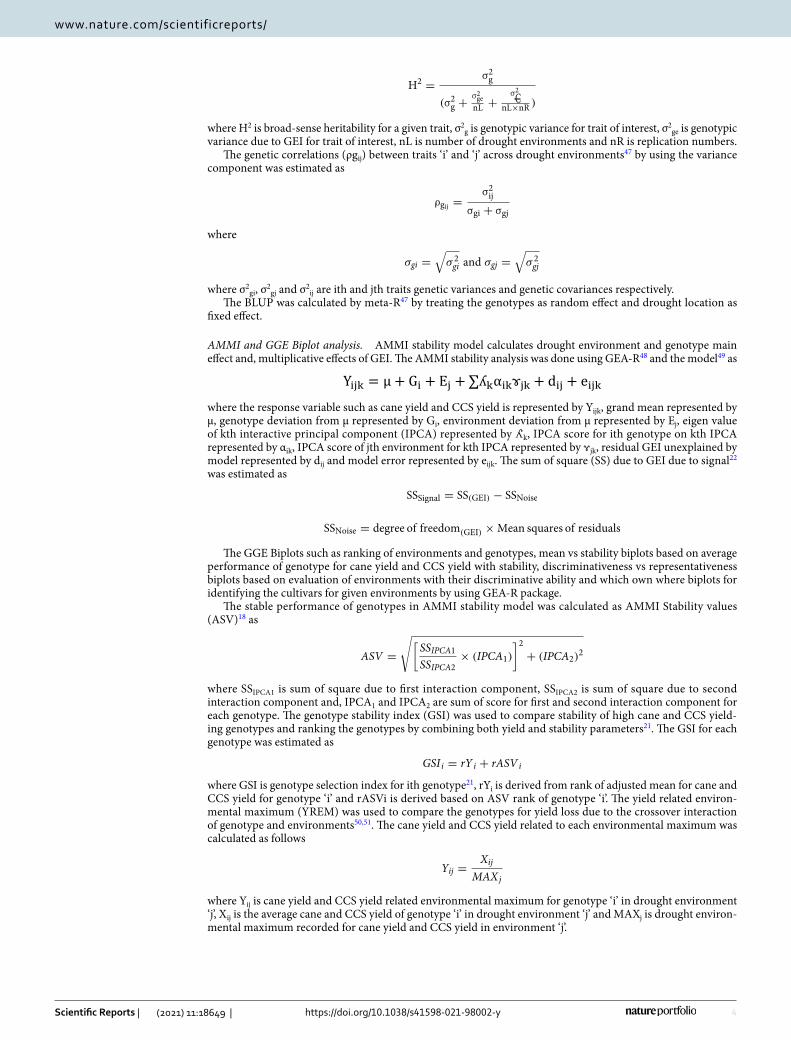
AMMI and GGE Biplot analysis. AMMI stability model calculates drought environment and genotype main effect and, multiplicative effects of GEI. The AMMI stability analysis was done using GEA-R48 and the model49 as
where the response variable such as cane yield and CCS yield is represented by Yijk, grand mean represented by µ, genotype deviation from µ represented by Gi, environment deviation from µ represented by Ej, eigen value of kth interactive principal component (IPCA) represented by ʎk, IPCA score for ith genotype on kth IPCA represented by αik, IPCA score of jth environment for kth IPCA represented by ɤjk, residual GEI unexplained by model represented by dij and model error represented by eijk. The sum of square (SS) due to GEI due to signal22 was estimated as
The GGE Biplots such as ranking of environments and genotypes, mean vs stability biplots based on average performance of genotype for cane yield and CCS yield with stability, discriminativeness vs representativeness biplots based on evaluation of environments with their discriminative ability and which own where biplots for identifying the cultivars for given environments by using GEA-R package.
The stable performance of genotypes in AMMI stability model was calculated as AMMI Stability values (ASV)18 as
where SSIPCA1 is sum of square due to first interaction component, SSIPCA2 is sum of square due to second interaction component and, IPCA1 and IPCA2 are sum of score for first and second interaction component for each genotype. The genotype stability index (GSI) was used to compare stability of high cane and CCS yield-ing genotypes and ranking the genotypes by combining both yield and stability parameters21. The GSI for each genotype was estimated as
where GSI is genotype selection index for ith genotype21, rYi is derived from rank of adjusted mean for cane and CCS yield for genotype ‘i’ and rASVi is derived based on ASV rank of genotype ‘i’. The yield related environ-mental maximum (YREM) was used to compare the genotypes for yield loss due to the crossover interaction of genotype and environments50,51. The cane yield and CCS yield related to each environmental maximum was calculated as follows
where Yij is cane yield and CCS yield related environmental maximum for genotype ‘i’ in drought environment ‘j’, Xij is the average cane and CCS yield of genotype ‘i’ in drought environment ‘j’ and MAXj is drought environ-mental maximum recorded for cane yield and CCS yield in environment ‘j’.
H2=
σ2g
(σ2g +σ2ge
nL +
σ2
CnL×nR )
ρgij =σ2ij
σgi + σgj
σgi =
√
σ 2gi and σgj =
√
σ 2gj
SSSignal = SS(GEI) − SSNoise
SSNoise = degree of freedom(GEI) ×Mean squares of residuals
ASV =
√
[
SSIPCA1
SSIPCA2× (IPCA1)
]2
+ (IPCA2)2
GSIi = rY i + rASVi
Yij =Xij
MAXj

5
Vol.:(0123456789)
Scientific Reports | (2021) 11:18649 | https://doi.org/10.1038/s41598-021-98002-y
www.nature.com/scientificreports/
ResultsBest linear unbiased prediction combined all locations for cane yield and CCS yield. The BLUP is the most accurate estimate of the random genetic effects in linear mixed models and has gained popularity in varietal testing in plant breeding52,53. The BLUP allows unbiased estimates of random genetic effects and enhances the reliability of estimated breeding value and heritability53. Comparing genotypes performance over years (time) and environments (space) with simultaneous correction of environmental effects and prediction of real genotypic effects is an advantage of BLUP approach54. In our studies, the estimates of multi-environment BLUP was highly significant for all traits. Heritability estimates ranged from 0.513 for sucrose content to 0.748 for cane yield, showing relatively high heritability for all traits (Table 1). The estimates of genetic correlation showed that both cane yield, and CCS yield had significant positive correlation with SL (0.969, 0.939), SCW (0.875, 0.796) and NMC (0.817, 0.868) respectively (Table 2). The estimates of genotypic and drought variances were greater than variance due to GEI for all the traits indicating that significant role of genotype, tillering phase drought, and GEI contributing to the trait expression.
Treating the BLUP estimated genotype as random effect and location as fixed effect revealed the highest multi-environment BLUP for cane yield (Table 3 and Fig. 1a) recorded by Co 85019 (99.41 t/ha) followed by Co 98017 (99.31 t/ha) and standard variety CoM 0265 (93.37 t/ha). Similarly, multi-environment BLUP has shown that Co 85019 (12.93 t/ha) was the best clone for CCS yield (Table 4 and Fig. 1b) followed by Co 98017 (12.92 t/ha), Co 05007 (11.39 t/ha) and the standard variety CoM 0265 (11.37 t/ha). The BLUP is reported to outperform in the selection of stable varieties52 and in our studies; Co 85019, Co 98017 and Co 05007 were identified as promising drought tolerant sugarcane clones.
AMMI stability analysis for cane and CSS yield. The AMMI ANOVA showed the significance of the mean sum of square due to drought environments, genotypes, and GEI for cane yield, CCS yield, SL, ST, SCW, and non-significance for NMC and sucrose content (Table 5). Main effects of drought environment and geno-type and GEI accounted 49.08, 32.59 and 18.33 percent of phenotypic variability for cane yield and 52.45, 28.10 and 19.45 percent of phenotypic variability for CCS yield respectively. With regards to yield component traits, drought environment, genotype and GEI accounted 69.91, 17.13 and 12.96 percent for SL, 63.51, 23.72 and 12.78 percent for SCW and 3.35, 66.39 and 30.26 percent of phenotypic variability for ST suggesting significant manipulative role of genotypes and tillering drought for trait expression.
The variance due to GEI was further partitioned into variance due to signal and noises (Table 6). The por-tion of variation due to signal occurs with known factors such as genotypes, tillering phase drought, while noise
Table 1. Estimates of genetic parameters from multi environment BLUPs for cane yield, CCS yield and components under tillering phase drought stress at ten test drought environments. BLUP best linear unbiased prediction, CY cane yield (t/ha), CCSY commercial cane sugar yield (t/ha), Suc sucrose percent at 12th month, SL stalk length (cm), ST stalk thickness (cm), SCW single cane weight (kg), NMC number of millable canes, LSD least square difference, CV coefficient of variation.
Statistic BLUP_CY BLUP_CCSY BLUP_Suc BLUP_NMC BLUP_SL BLUP_ST BLUP_SCW
Heritability 0.748 0.709 0.513 0.588 0.604 0.746 0.722
Genotype variance 172.431 2.784 0.202 33.710 160.864 0.023 0.024
GEI variance 111.593 2.351 0.118 19.491 97.940 0.007 0.009
Residual variance 241.881 4.784 0.917 102.563 646.314 0.049 0.056
Grand mean 80.488 10.834 18.373 62.258 203.623 2.824 1.320
LSD 16.286 2.387 0.794 8.851 18.646 0.169 0.188
CV 19.323 19.454 5.212 16.267 12.485 7.862 17.850
Genotype significance (p value) 0.000 0.000 0.024 0.003 0.001 0.000 0.000
G x E significance (p value) 0.000 0.000 0.110 0.011 0.007 0.023 0.005
Table 2. Estimates of genotypic correlation between cane yield, CCS yield and component traits across ten test drought environments under drought stress in sugarcane. **significant at 1% level; *significant at 5% level. CY cane yield (t/ha), CCSY commercial cane sugar yield (t/ha), Suc sucrose percent at 12th month, SL stalk length (cm), ST stalk thickness (cm), SCW single cane weight (kg), NMC number of millable canes.
Traits CY CCSY Suc SL ST SCW
CCSY 0.987**
Suc − 0.315 − 0.141
SL 0.969** 0.939** − 0.390
ST 0.420 0.315 − 0.674** 0.305
SCW 0.875** 0.796** − 0.632** 0.872** 0.771**
NMC 0.817** 0.868** − 0.246 0.540* − 0.026 0.323

6
Vol:.(1234567890)
Scientific Reports | (2021) 11:18649 | https://doi.org/10.1038/s41598-021-98002-y
www.nature.com/scientificreports/
variation was attributed to error associated with model’s unknown factors22. In our studies, cane yield and CCS yield recorded 69.68 and 66.31 percent of GEI due to signal and remaining due to noises. This suggests the adequacy of applying the AMMI stability model to understand the GEI.
The multiplicative component of AMMI models consists of singular value/multiplication factor of IPCA, eigenvector of genotype and environments49. The IPCA1 was highly significant for cane yield, CCS yield and non-significant for yield components such as SCW, SL and ST. The IPCA1 for cane yield and CCS yield accounted 52.09 and 55.33 percent of the GEI indicating significant contribution of drought at tillering phase on the per-formance of genotype and trait expression.
GGE biplots to visualize GEI for cane and CCS yield. The GGE Biplots were used to visualize the effects of drought, genotypes, and pattern of GEI. The graphical visualization of GGE on Biplots helps to visualize the mega environments, ranking of genotypes, and identification of stable environments27. The discriminativeness vs representative views of GGE Biplots helps to identify the ideal environments with the highest discrimina-tive power to discriminate the genotypes. The average environmental coordinates (AEC) and test environments are capable of visualizing the type-1 environments, type-2 environments and type-3 environments. The type-1 environments are represented by short vectors with average discriminative power indicating the average perfor-
Table 3. Comparative mean performance, BLUP, AMMI stability indices for cane yield (t/ha) under drought stress in sugarcane. BLUP best linear unbiased prediction, CY cane yield (t/ha), ASI AMMI stability index, rASI rank of AMMI stability index, rCY rank of cane yield, GSI genotype selection index, YREM yield related environmental maximum.
Genotypes Mean BLUP-CY AMMI adjusted mean ASI rASI rCY GSI YREM
Co 0238 57.93 61.72 57.42 0.3260 2 15 17 0.49
Co 05001 54.11 59.88 55.27 0.1580 1 16 17 0.47
Co 05007 87.75 86.59 88.50 1.0719 13 4 17 0.73
Co 08020 71.00 73.88 71.80 1.5289 15 13 28 0.63
Co 10017 79.90 78.94 78.35 0.5543 8 11 19 0.68
Co 10024 81.12 80.86 81.22 0.5953 9 8 17 0.67
Co 13003 84.06 83.07 83.86 0.3581 3 7 10 0.70
Co 2000-10 89.95 86.91 87.98 0.7750 11 5 16 0.77
Co 85019 104.26 99.41 103.74 0.4395 6 1 7 0.87
Co 86032 82.61 79.26 78.71 0.4459 7 10 17 0.68
Co 90003 66.71 64.92 61.49 0.3691 4 14 18 0.52
Co 92020 85.33 85.05 85.62 0.7428 10 6 16 0.74
Co 93009 76.17 74.39 73.19 1.1112 14 12 26 0.62
Co 94005 76.94 80.04 79.93 0.4120 5 9 14 0.68
Co 98017 101.06 99.31 102.05 1.8370 16 2 18 0.86
CoM 0265 98.73 93.37 95.69 0.9810 12 3 15 0.83
Figure 1. Box plot depicting the multi-environment BLUP based performance for cane yield and CCS yield under tillering phase drought stress of sugarcane genotypes across locations. (a) Multi-environment BLUP depicting the superior performance of Co 85019 for cane yield under tillering phase drought stress, (b) Multi-environment BLUP depicting the superior performance of Co 85019 for CCS yield (t/ha) under tillering phase drought stress.

7
Vol.:(0123456789)
Scientific Reports | (2021) 11:18649 | https://doi.org/10.1038/s41598-021-98002-y
www.nature.com/scientificreports/
Table 4. Comparative mean performance, BLUP, AMMI stability indices for CCS yield (t/ha) under drought stress in sugarcane. BLUP best linear unbiased prediction, CCSY commercial cane sugar yield (t/ha), ASI AMMI stability index, rASI rank of AMMI stability index, rCY rank of cane yield, GSI genotype selection index, YREM yield related environmental maximum.
Genotypes Mean BLUP-CCSY AMMI adjusted mean ASV rASV rTM rGSI YREM
Co 0238 8.38 8.82 8.37 0.594 8 13 21 0.54
Co 05001 7.26 7.93 7.19 0.135 1 15 16 0.48
Co 05007 11.70 11.39 11.73 1.051 13 4 17 0.77
Co 08020 9.92 9.78 9.48 1.584 16 11 27 0.65
Co 10017 10.49 10.32 10.24 0.448 6 9 15 0.70
Co 10024 10.54 10.47 10.52 0.548 7 7 14 0.68
Co 13003 10.85 10.69 10.79 0.433 5 6 11 0.70
Co 2000-10 11.70 11.17 11.31 0.727 10 5 15 0.78
Co 85019 13.85 12.93 13.66 0.715 9 1 10 0.91
Co 86032 10.53 10.37 10.32 0.215 2 8 10 0.69
Co 90003 7.75 8.29 7.66 0.267 3 14 17 0.51
Co 92020 11.89 11.3 11.45 0.739 11 3 14 0.77
Co 93009 9.60 9.72 9.52 1.219 14 12 26 0.63
Co 94005 10.21 10.1 9.96 0.404 4 10 14 0.68
Co 98017 13.54 12.92 13.80 1.539 15 2 17 0.89
CoM 0265 7.20 11.37 11.54 0.815 12 16 28 0.79
Table 5. Analysis of variance for cane yield, sucrose and component traits by using AMMI model under drought stress in sugarcane. **significant at 1% level; *significant at 5% level. MSS mean sum of squares, POV percent of variation explained by components, CY cane yield (t/ha), GEI genotype × environment interaction, IPCA Interactive principal component axis, CCSY commercial cane sugar yield (t/ha), Brix12: juice brix at 12th month, Pol10: sucrose percent at 12th month, SL stalk length (cm), ST stalk thickness (cm), SCW single cane weight (kg), NMC number of millable canes.
ParametersDegree of freedom
CY CCSY Sucrose NMC SL SCW ST
MSS POV MSS POV MSS POV MSS POV MSS POV MSS POV MSS POV
Drought Envi-ronment 3 32,072.01** 49.08 636.08** 52.45 51.25** 56.80 5278.84** 45.51 90,383.56** 69.91 7.67** 63.51 0.14** 3.35
Genotypes 15 4260.14** 32.59 68.16** 28.10 3.65** 20.23 606.16** 26.13 4428.58** 17.13 0.57** 23.72 0.54** 66.39
GEI 45 798.60** 18.33 15.73** 19.45 1.38 22.98 219.24 28.35 1116.78** 12.96 0.10** 12.78 0.08** 30.26
IPCA1 17 447.90* 52.09 9.13* 55.33 0.77 51.85 132.67 62.36 747.61 62.40 0.07 59.40 0.05 49.61
IPCA2 15 273.71 28.08 5.69 30.46 0.67 39.60 68.05 28.22 408.61 30.09 0.03 25.73 0.03 31.71
IPCA3 13 222.97 19.83 3.06 14.21 0.17 8.55 20.61 7.41 117.61 7.51 0.02 14.87 0.02 18.68
Residuals 320 242.17 5.30 1.14 179.64 654.26 0.57 0.05
Table 6. Estimates of sum of square due to signals and noises by using AMMI model for drought stress in sugarcane. GEI genotype × environment interaction, CY cane yield (t/ha), CCSY commercial cane sugar yield (t/ha), SL stalk length (cm), ST stalk thickness (cm), SCW single cane weight (kg), NMC number of millable canes.
Traits
Sum of square Percent variation
GEISignal GEINoise GEISignal GEINoise
CY 25,039.36 10,897.52 69.68 30.32
CCSY 469.35 238.50 66.31 33.69
SL 20,813.59 29,441.51 41.42 58.58
SCW 2.11 2.52 45.50 54.50
ST 1.48 2.21 40.12 59.88

8
Vol:.(1234567890)
Scientific Reports | (2021) 11:18649 | https://doi.org/10.1038/s41598-021-98002-y
www.nature.com/scientificreports/
mance of genotypes. The type-2 environments are shown as the longest vectors with the highest discriminative powers, capable to discriminate the performance of genotypes. Type-3 environments are represented as the longest vector with large angles, suitable to ill effects of environments. The ideal environments are those having the longest genotypic vector and located on or acute angles to the AEC28. In our studies for cane yield and CCS yield, ‘Pune’ has the longest environmental vector with narrow angles to AEC having the highest discriminative power and is considered as the ideal environment for cane yield (Fig. 2c, 3c). The shortest environmental vector observed at ‘Nanded’ indicating the average or similar performance of the genotypes.
The mean vs stability biplots helps to understand the mean performance of genotypes across drought environ-ments. The genotypes located or nearest and in the direction of AEC are considered as ideal and best performing genotypes28. The best performing genotype for cane yield (Fig. 2b), was Co 85019 as the most stable and better performing clone followed by Co 98017 and CoM 0265 (Co 85019 > Co 98017 > CoM 0265) and poor perform-ing genotypes were Co 05001, Co 0238 and Co 90003 (Co 0238 < Co 05001 < Co 90003). Similarly for CCS yield (Fig. 3b), Co 85019 was identified as better performing stable clone followed by Co 98017 and CoM 0265 (Co 85019 > Co 98017 > CoM 0265). The poor performing clones were Co 05001, Co 90003 and Co 0238 (Co 0238 < Co 90003 < Co 05001). From our studies, it showed that Co 85019 located on or near AEC and considered
-20 0 20 40 60
-20
020
40
Ranking Genotypes
AXIS1 69.05 %
AXIS
2 18
.14
%
Co 0238o 05001Co 05007
Co 08020
Co 10017
Co 10024Co 13003
Co 2000-10
Co 85019Co 86032
Co 90003
Co 92020Co 93009
Co 94005
Co 98017
CoM 0265
Jalna
Kopargaon
Nanded
Pune
-20 0 20 40 60
-20
020
40
Mean vs. Stability
AXIS1 69.05 %
AXIS
2 18
.14
%
Co 0238o 05001Co 05007
Co 08020
Co 10017
Co 10024Co 13003
Co 2000-10
Co 85019Co 86032
Co 90003
Co 92020Co 93009
Co 94005
Co 98017
CoM 0265
Jalna
Kopargaon
Nanded
Pune
-20 0 20 40 60
-20
020
40
Which Won Where/What
AXIS1 69.05 %
AXIS
2 18
.14
%
Co 0238o 05001Co 05007
Co 08020
Co 10017
Co 10024Co 13003
Co 2000-10
Co 85019Co 86032
Co 90003
Co 92020Co 93009
Co 94005
Co 98017
CoM 0265
Jalna
Kopargaon
Nanded
Pune
a b
c d
Figure 2. GGE Biplots of for cane yield (t/ha) under tillering phase in drought stress. The data is not transformed, not scaled, environments were centered (Centering = 2) and the biplots based on singular value partition by column metric preserving. The Biplots explained 87.19 percent of G + GE. (a) Ranking of genotype GGE biplot depicting the Co 85019 located in first concentric circle as ideal genotype for cane yield (t/ha), (b) mean vs stability GGE biplot depicting the Co 85019 located in the direction of the average environmental coordinates as best performing genotype for cane yield (t/ha), (c) discriminativeness vs representativeness GGE biplot depicting the longest environment vector and nearer to average environmental coordinates and identified Pune as highly discriminative environment, and (d) Which won where/what GGE biplot to visualise the mega environment and environment specific genotypes.
9
Vol.:(0123456789)
Scientific Reports | (2021) 11:18649 | https://doi.org/10.1038/s41598-021-98002-y
www.nature.com/scientificreports/
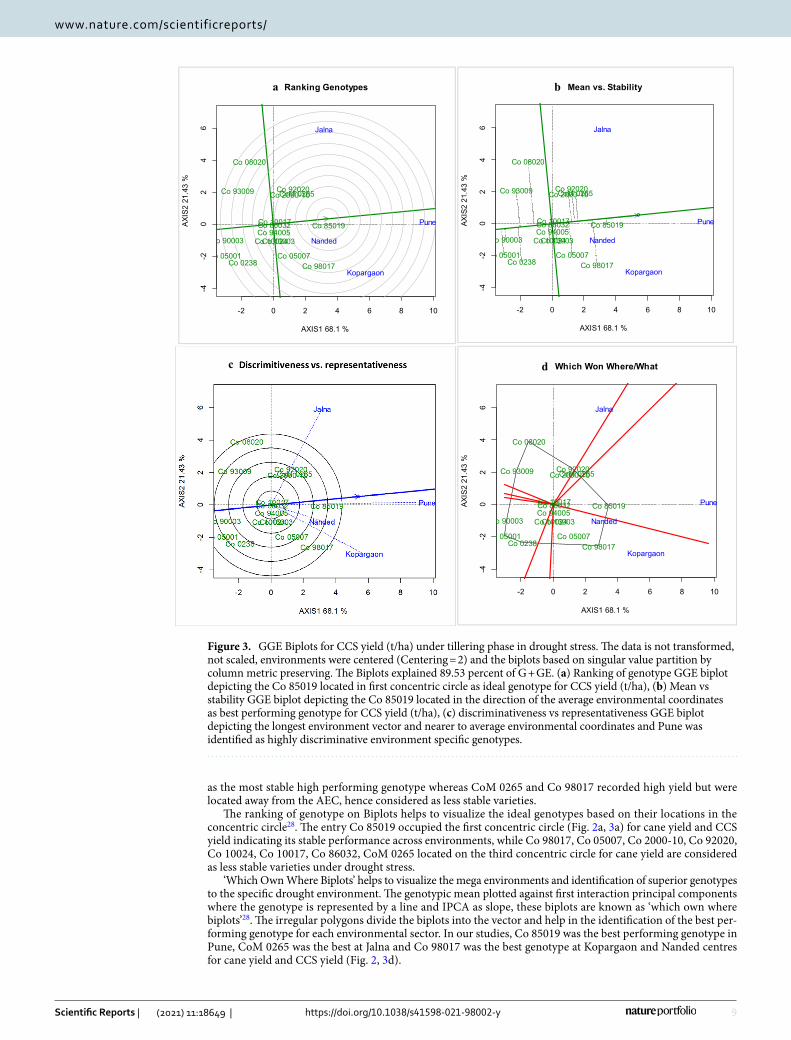
as the most stable high performing genotype whereas CoM 0265 and Co 98017 recorded high yield but were located away from the AEC, hence considered as less stable varieties.
The ranking of genotype on Biplots helps to visualize the ideal genotypes based on their locations in the concentric circle28. The entry Co 85019 occupied the first concentric circle (Fig. 2a, 3a) for cane yield and CCS yield indicating its stable performance across environments, while Co 98017, Co 05007, Co 2000-10, Co 92020, Co 10024, Co 10017, Co 86032, CoM 0265 located on the third concentric circle for cane yield are considered as less stable varieties under drought stress.
‘Which Own Where Biplots’ helps to visualize the mega environments and identification of superior genotypes to the specific drought environment. The genotypic mean plotted against first interaction principal components where the genotype is represented by a line and IPCA as slope, these biplots are known as ‘which own where biplots’28. The irregular polygons divide the biplots into the vector and help in the identification of the best per-forming genotype for each environmental sector. In our studies, Co 85019 was the best performing genotype in Pune, CoM 0265 was the best at Jalna and Co 98017 was the best genotype at Kopargaon and Nanded centres for cane yield and CCS yield (Fig. 2, 3d).
-2 0 2 4 6 8 10
-4-2
02
46
Ranking Genotypes
AXIS1 68.1 %
AXIS
2 21
.43
%
Co 0238o 05001 Co 05007
Co 08020
Co 10017
Co 10024Co 13003
Co 2000-10
Co 85019Co 86032
o 90003
Co 92020Co 93009
Co 94005
Co 98017
CoM 0265
Jalna
Kopargaon
Nanded
Pune
-2 0 2 4 6 8 10
-4-2
02
46
Mean vs. Stability
AXIS1 68.1 %
AXIS
2 21
.43
%
Co 0238o 05001 Co 05007
Co 08020
Co 10017
Co 10024Co 13003
Co 2000-10
Co 85019Co 86032
o 90003
Co 92020Co 93009
Co 94005
Co 98017
CoM 0265
Jalna
Kopargaon
Nanded
Pune
-2 0 2 4 6 8 10
-4-2
02
46
Which Won Where/What
AXIS1 68.1 %
AXIS
2 21
.43
%
Co 0238o 05001 Co 05007
Co 08020
Co 10017
Co 10024Co 13003
Co 2000-10
Co 85019Co 86032
o 90003
Co 92020Co 93009
Co 94005
Co 98017
CoM 0265
Jalna
Kopargaon
Nanded
Pune
a b
c d
Figure 3. GGE Biplots for CCS yield (t/ha) under tillering phase in drought stress. The data is not transformed, not scaled, environments were centered (Centering = 2) and the biplots based on singular value partition by column metric preserving. The Biplots explained 89.53 percent of G + GE. (a) Ranking of genotype GGE biplot depicting the Co 85019 located in first concentric circle as ideal genotype for CCS yield (t/ha), (b) Mean vs stability GGE biplot depicting the Co 85019 located in the direction of the average environmental coordinates as best performing genotype for CCS yield (t/ha), (c) discriminativeness vs representativeness GGE biplot depicting the longest environment vector and nearer to average environmental coordinates and Pune was identified as highly discriminative environment specific genotypes.

10
Vol:.(1234567890)
Scientific Reports | (2021) 11:18649 | https://doi.org/10.1038/s41598-021-98002-y
www.nature.com/scientificreports/
AMMI and YREM based stability indices for cultivar performance to cane yield and CCS yield in sugarcane. The lowest AMMI stability value (ASV) estimated from the IPCA axis and IPCA scores indi-cate the most stable variety18. The lowest ASV for cane yield was recorded by Co 05001, Co 0238, Co 13003 and recorded the lowest cane yield of 54.11, 57.93 and 84.06 t/ha respectively under acute tillering phase drought stress. The high cane yielding varieties such as Co 85019, Co 98017 and CoM 0265 recorded the ASV value of 0.4395, 1.8370 and 0.9810 respectively. For CCS yield, the lowest ASV was recorded by Co 05001, Co 86032 and Co 90003. The high CCS yielding clones Co 85019, Co 98017 and Co 05007 recorded the ASV of 0.715, 1.539 and 1.051 respectively. The high genotypic variability and high coefficient variability are normally observed under stressed experiments35. The performance of high yielding genotypes depends on genotype recovery status during the grand growth stage after the acute formative phase drought stress13.
The genotype selection indices (GSI) were estimated based on the sum of ranks of ASV and ranks of genotypes derived from cane yield and CCS yield. The lowest value of GSI indicates the most stable and high performing genotypes across environments21,51. For cane yield, the lowest GSI was recorded by Co 85019, Co 13003 and Co 94005, suggesting that these genotypes are combined with high stability and high cane yield across environments. For CCS yield Co 85019, Co 86032 and Co 13003 recorded the lowest GSI suggesting that these genotypes are combined with high stability and high CCS yield across environments. Based on GSI and trait mean for cane yield and CCS yield, Co 85019 recorded the highest cane and CCS yield of 104.26 t/ha and 13.85 t/ha with lowest GSI. Hence, Co 85019 is considered as the most stable high yielding variety under tillering phase drought stress.
The yield relative to the environmental maximum (YREM) is a simple, intuitive, cultivar independent factor which helps the breeders to select the cultivars in presence of unpredictable crossover G × E interactions. In the absence of G × E interaction crossover, the value of YREM is 1.0 indicating the most stable variety. The YREM is 0.9 implies 10 percent of yield loss due to the unpredictable G × E crossover interaction50. The clone Co 85019 recorded the highest YREM of 0.87 and 0.91 for cane yield and CCS yield respectively. Other clones such as Co 98017 recorded the superior YREM of 0.86 and 0.89 indicating that, 14 and 11 percent loss for cane yield and CCS yield due to G × E crossover interaction.
DiscussionSugarcane is a major agro industry-based cash crop and a major source of income for millions of farmers in the world. The global climatic changes and aberrations in weather parameters causes significant variation in quantum and frequency of rainfall in major sugarcane growing states1–3,55–57. The meteorological data analysis has shown the recurrence of drought with high frequency in many parts of the world4,5,58. The rainfall distribution across the world shows that maximum precipitation was received during monsoon seasons coinciding with June to September in the northern hemisphere and December to May in the southern hemisphere5–8. Hence, sugarcane crop inevitably gets exposed to drought stress due to its trans-seasonal long duration nature major sugarcane growing countries. Earlier research carried out at ICAR Sugarcane Breeding Institute identified several drought stress tolerant lines15,33,59 and we selected fourteen drought tolerant clones for multi-location evaluation in the prevailing drought stress affected regions to identify the drought tolerant clones suitable for cultivation in Peninsular India.
Tillering phase of sugarcane crop is the most sensitive phase to moisture stress causing significant reduction in cane yield through the reduction in its component traits9,11–13,30. Hence, the fourteen drought tolerant clones and two standard varieties were evaluated by imposing drought stress through withholding the irrigation from 90 to 150 days. The performance of the clones was compared with the widely grown wonder variety Co 86032 which covered over 50% area and the high biomass yielding local variety CoM 0265, notified for cultivation in Maharashtra state and cultivating in 18 percent of area34. The Co 85019 recorded the cane yield of 104.26 t/ha across locations with the improvement of 26.21 and 5.61 percent improvement over the two standards respec-tively. The clone Co 98017 recorded 101.06 t/ha with an improvement of 22.34% and 2.37% over Co 86032 and CoM 0265 respectively. The superior performance of Co 85019 and Co 98017 is in confirmation with the previ-ous report for cane yield and sucrose content under drought stress in Coimbatore15,33. Co 85019 was identified as salinity tolerant clone based on physiological and cane yield/biomass accumulation under salinity stress37–39 and further used for characterization of genes40. Among the thirty-three clones evaluated under water limited condition, Co 85019 was identified for high water use efficiency, water productivity35 and, high physiological efficiency for related traits such as canopy temperature deficient, chlorophyll efficiency, leaf rolling index36 .
BLUP is the standard method of estimating the random effects followed in both animal and plant breeding. The comparison of cultivar performance by both AMMI and BLUP in faba bean showed that BLUP outper-formed in the prediction of superior genotypes than AMMI52. The prediction of yield estimate by BLUP was found superior as compared to least square and BLUE methods in soybean60. Similar results were obtained for genetic values in maize multi-environmental traits61. In our studies, the estimate of multi-environment BLUP showed that Co 85019 recorded the highest BLUP mean for cane yield (99.41 t/ha) and CCS Yield (12.93 t/ha) followed by Co 98017 (99.31t/ha of cane yield and 12.92 t/ha of CCS yield) as compared to better standard CoM 0265, which recorded 93.37 t/ha of cane yield and 11.37 t/ha of CCS yield under tillering phase drought stress. The cane and CCS yield showed a significant positive genetic correlation with NMC, SL, ST, SCW and this is in confirmation with previous reports62.
AMMI stability model is widely used to understand the pattern of GEI and to identify the stable cultivars from target environments22. The AMMI ANOVA showed remarkable contributions from drought environments, genotypes, and GEI for cane yield, CCS yield and their components. Further, the mean sum of squares due to GEI were significant for cane yield and CCS yield, SL, ST and SCW, indicating the significance of tillering phase drought stress on genotypic expressions. The non-significant mean sum of squares was recorded for sucrose and NMC indicating that expression of these traits was not influenced by tillering phase drought stress. This is

11
Vol.:(0123456789)
Scientific Reports | (2021) 11:18649 | https://doi.org/10.1038/s41598-021-98002-y
www.nature.com/scientificreports/
in confirmation with previous reports for cane yield63 and CCS yield64–66. The sum of square due to GEISignal is larger than the GEINoise for cane and CCS yield, SL, ST and SCW due to larger contribution from additive main effect of genotype and tillering phase drought stress environments and reiterated the use of AMMI model for understanding the pattern of GEI.
The biplots of GGE helps to elucidate the interrelation among environments, ranking of genotypes and to identify the better performing genotype in a given environment27. From our studies, discriminativeness vs rep-resentative showed that ‘Pune’ as the ideal environment by virtue of its weather parameters. The relatively cooler climate in ‘Pune’ during the drought (daily average mean temperature of 29.45 °C and 29.41 °C during 2018 and 2019) and the drought recovery phase (daily average mean temperature of 25.37 °C and 26.01 °C) attributed appropriate environmental effect in crop expression. Further IPCA1 vs IPCA2 of AMMI biplots also displayed diverse nature of the four environments. The ranking of genotypes showed that Co 85019 was the most stable variety and Co 98017 was a high yielding variety with relatively lesser stability over Co 85019. The IPCA1 vs cane yield AMMI Biplot showed that Co 85019 and Co 98017 were high yielding with relatively less GEI for tillering phase drought stress and considered as stable varieties.
The parameters ASV, GSI and YREM are commonly used to identify the stable varieties in multi-environment trials18,19,50,67. The lower values of ASV indicate the most stable variety18 and the lowest GSI could be inferred as high performing stable genotypes21. YREM identified the stable genotypes and yield loss due to G × E crossover interactions50,51. In this study , Co 85019 was ranked sixth for ASV, ranked first for GSI and recorded the highest YREM of 0.87 for cane yield and 0.91 for CCS yield indicating that 13 percent of cane yield and nine percent of CCS yield were lost due to G × E crossover interaction. Similarly, Co 98017 recorded YREM of 0.86 and 0.89 suggesting loss of 14 and 11 percent of cane yield and CCS yield due to G × E crossover interactions respectively.
ConclusionsThe drought tolerant clones identified over years at ICAR-Sugarcane Breeding Institute, Coimbatore were evalu-ated under tillering phase drought stress by withholding the irrigation for 90-150 days at four locations experi-encing water deficit stress across Maharashtra, India. The weather data clearly showed nil rainfall, low relative humidity and high daily temperature during the drought imposition period. The AMMI biplots with interaction PCA1 and PCA2 and with yield revealed high discriminative environments. The multi-environment BLUP, AMMI, GGE Biplots and YERM analysis clearly showed the stable performance of Co 85019 and superior per-formance of Co 98017 for cane yield and CCS yield. The test clone Co 05007 also showed superior performance for CCS yield. These three genotypes could be deployed for the drought prone regions in Peninsular India, while could serve as parents in genetic improvement of drought tolerance in view of climate change.
Received: 2 May 2021; Accepted: 2 September 2021
References 1. Murphy, B. F., Power, S. B. & Mcgree, S. The varied impacts of El Niño-southern oscillation on pacific Island climates. J. Clim. 27,
4015–4036 (2014). 2. Loo, Y. Y., Billa, L. & Singh, A. Effect of climate change on seasonal monsoon in Asia and its impact on the variability of monsoon
rainfall in Southeast Asia. Geosci. Front. 6, 817–823 (2015). 3. Zhao, D. & Li, Y. R. Climate Change and Sugarcane Production: Potential Impact and Mitigation Strategies. Int. J. Agron. 2015,
(2015). 4. Lobell, D. B. et al. The shifting influence of drought and heat stress for crops in northeast Australia. Glob. Change Biol. 21,
4115–4127 (2015). 5. Santos, T. S. D. A. & Silva, C. M. S. E. Seasonality, Interannual variability, and linear tendency of wind speeds in the Northeast
Brazil from 1986 to 2011. Sci. World J. 2013 (2013). 6. O’Donnell, A. J. et al. Tree rings show recent high summer-autumn precipitation in northwest Australia is unprecedented within
the last two centuries. PLoS ONE 10, 1–18 (2015). 7. Swami, D., Dave, P. & Parthasarathy, D. Agricultural susceptibility to monsoon variability: A district level analysis of Maharashtra,
India. Sci. Total Environ. 619–620, 559–577 (2018). 8. Abiy, A. Z., Melesse, A. M., Abtew, W. & Whitman, D. Rainfall trend and variability in Southeast Florida: implications for freshwater
availability in the Everglades. PLoS ONE 14, 1–20 (2019). 9. Venkataramana, S., Gururaja Rao, P. N. & Naidu, K. M. The effects of water stress during the formative phase on stomatal resistance
and leaf water potential and its relationship with yield in ten sugarcane varieties. Field Crops Res. 13, 345–353 (1986). 10. Hemaprabha, G., Nagarajan, R. & Alarmelu, S. Response of sugarcane genotypes to water deficit stress. Sugar Tech. 6, 165–168
(2004). 11. Ramesh, P. & Mahadevaswamy, M. Effect of formative phase drought on different classes of shoots, shoot mortality, cane attributes,
yield and quality of four sugarcane cultivars. J. Agron. Crop Sci. 185, 249–258 (2000). 12. Zhao, D., Glaz, B. & Comstock, J. C. Sugarcane response to water-deficit stress during early growth on organic and sand soils. Am.
J. Agric. Biol. Sci. 5, 403–414 (2010). 13. Jangpromma, N., Thammasirirak, S., Jaisil, P. & Songsri, P. Effects of drought and recovery from drought stress on above ground
and root growth, and water use efficiency in sugarcane (Saccharum officinarum L.). Austral. J. Crop. Sci. 6, 1298–1304 (2012). 14. Reyes, J. A. O., Carpentero, A. S., Santos, P. J. A. & Delfin, E. F. Effects of water regime, genotype, and formative stages on the
agro-physiological response of sugarcane (Saccharum officinarum L.) to Drought. Plants 9, 1–20 (2020). 15. Hemaprabha, G., Swapna, S., Lavanya, D. L., Sajitha, B. & Venkataramana, S. Evaluation of drought tolerance potential of elite
genotypes and progenies of sugarcane (Saccharum sp. hybrids). Sugar Tech 15, 9–16 (2013). 16. Ribeiro, R. V. et al. Revealing drought-resistance and productive patterns in sugarcane genotypes by evaluating both physiological
responses and stalk yield. Exp. Agric. 49, 212–224 (2013). 17. Ferreira, T. H. S. et al. Sugarcane water stress tolerance mechanisms and its implications on developing biotechnology solutions.
Front. Plant Sci. 8, 1–18 (2017).

12
Vol:.(1234567890)
Scientific Reports | (2021) 11:18649 | https://doi.org/10.1038/s41598-021-98002-y
www.nature.com/scientificreports/
18. Purchase, J. L., Hatting, H. & van Deventer, C. S. Genotype × environment interaction of winter wheat (Triticum aestivum L.) in South Africa: II. Stability analysis of yield performance. South Afr. J. Plant Soil 17, 101–107 (2000).
19. Gauch, H. G. Statistical analysis of yield trials by AMMI and GGE. Crop Sci. 46, 1488–1500 (2006). 20. Gauch, H. G., Piepho, H. P. & Annicchiarico, P. Statistical analysis of yield trials by AMMI and GGE: Further considerations. Crop
Sci. 48, 866–889 (2008). 21. Farshadfar, E., Mahmodi, N. & Yaghotipoor, A. AMMI stability value and simultaneous estimation of yield and yield stability in
bread wheat (Triticum aestivum L.). Austral. J. Crop Sci. 5, 1837–1844 (2011). 22. Gauch, H. G. A simple protocol for AMMI analysis of yield trials. Crop Sci. 53, 1860–1869 (2013). 23. Elias, A. A., Robbins, K. R., Doerge, R. W. & Tuinstra, M. R. Half a century of studying genotype × environment interactions in
plant breeding experiments. Crop Sci. 56, 2090–2105 (2016). 24. Kebede, A. & Getahun, A. Adaptability and stability analysis of groundnut genotypes using AMMI model and GGE-biplot. J. Crop.
Sci. Biotechnol. 20, 343–349 (2017). 25. Bocianowski, J., Warzecha, T., Nowosad, K. & Bathelt, R. Genotype by environment interaction using AMMI model and estimation
of additive and epistasis gene effects for 1000-kernel weight in spring barley (Hordeum vulgare L.). J. Appl. Genet. https:// doi. org/ 10. 1007/ s13353- 019- 00490-2 (2019).
26. Bocianowski, J., Tratwal, A. & Nowosad, K. Genotype by environment interaction for main winter triticale varieties characteristics at two levels of technology using additive main effects and multiplicative interaction model. Euphytica 217, 1–30 (2021).
27. Yan, W. Singular-value partitioning in biplot analysis of multienvironment trial data. Agron. J. 94, 990–996 (2002). 28. Yan, W., Kang, M. S., Ma, B., Woods, S. & Cornelius, P. L. GGE biplot vs AMMI analysis of genotype-by-environment data. Crop
Sci. 47, 643–655 (2007). 29. Marli, S., Aparecida, F., da Graa, J. P., de Matos Pereira, L. & Vergnia, M. Sugarcane Responses at water deficit conditions. Water
Stress https:// doi. org/ 10. 5772/ 30986 (2012). 30. Silva, M. D. A., Da Silva, J. A. G., Enciso, J., Sharma, V. & Jifon, J. Yield components as indicators of drought tolerance of sugarcane.
Sci. Agricola 65, 620–627 (2008). 31. Nair, N. V. Sugarcane breeding institute, Coimbatore: a perspective. Sugar Tech. 10, 285–292 (2008). 32. Nair, N. V. Sugarcane varietal development programmes in India: an overview. Sugar Tech. 13, 275–280 (2011). 33. Hemaprabha, G., Nagarajan, R. & Alarmelu, S. Performance of elite cultivars of sugarcane (Saccharum spp.) under water deficit
conditions. Indian J. Genet. Plant Breed. 68, 90–92 (2008). 34. Shukla, S., K., Zubair, A., Awasthi, S. K. & Pathak, A. D. Sugarcane Varieties Identified By Aicrp (S ) in India. (All India Coordinated
Research Project on Sugarcane, ICAR-Indian Institute of Sugarcane Research, Lucknow, India, 2018). 35. Tayade, A. S., Vasantha, S., Anusha, S., Kumar, R. & Hemaprabha, G. Irrigation water use efficiency and water productivity of
commercial sugarcane hybrids under water-limited conditions. Trans. ASABE 63(1), 125–132 (2020). 36. Vasantha, S., Tayade, A. S., Anusha, S., Geetha, P. & Hemaprabha, G. Physiological efficiency of sugarcane clones under water-
limited conditions. Trans. ASABE 63(1), 133–140 (2020). 37. Vasantha, S., Venkataramana, S., Gururaja Rao, P. N. & Gomathi, R. Long term salinity effect on growth, photosynthesis and
osmotic characteristics in sugarcane. Sugar Tech https:// doi. org/ 10. 1007/ s12355- 010- 0002-z (2010). 38. Brindha, S., Arunkumar, R. & Vasantha, S. The response of sugarcane genotypes subjected to salinity stress at different growth
phases. J. Plant Stress Physiol. 5, 28–33 (2019). 39. Vasantha, S., Gomathi, R. & Brindha, C. Growth and nutrient composition of sugarcane genotypes subjected to salinity and drought
stresses. Commun. Soil Sci. Plant Anal. 48, 989–998 (2017). 40. Brindha, C., Vasantha, S., Raja, A. K. & Tayade, A. S. Characterization of the Salt Overly Sensitive pathway genes in sugarcane
under salinity stress. Physiol. Plantarum 171(4), 677–687. https:// doi. org/ 10. 1111/ ppl. 13245 (2021). 41. Lal, S., Deshpande, S. B. & Sehgal, J. L. Soil Series of India (ICAR-National Bureau of Soil Survey & Land Use Planning, Nagpur,
1994). 42. Sundara, B. Sugarcane cultivation (Vikas Publishing House Pvt Ltd., 1998). 43. Nair, N. V., Nagarajan, R., Mathew, M. D. & Sreenivasan, T. V. Components of yield and quality in intraspecific hybrids ofSaccharum
officinarum L. selected for ancillary uses. Sugar Tech 1, 124–127 (1999). 44. Sundara, B., Natarajan, V. & Hari, K. Influence of phosphorus solubilizing bacteria on the changes in soil available phosphorus
and sugarcane and sugar yields. Field Crop Res. 77, 43–49 (2002). 45. Ashwin, N. M. R. et al. Disease suppressive effects of resistance-inducing agents against red rot of sugarcane. Eur. J. Plant Pathol.
149, 285–297 (2017). 46. Levene, H. Contributions to probability and statistics. in Essays in honor of Harold Hotelling (ed. Olkin, I.) 278–292 (Stanford
University Press, Palo Alto, 1960). 47. Alvarado, G. et al. META-R: a software to analyze data from multi-environment plant breeding trials. Crop J. 8, 745–756 (2020). 48. Pacheco, Á. et al. GEA-R (Genotype x Environment Analysis with R for Windows) Version 4.1. https:// data. cimmyt. org/ datas et.
xhtml? persi stent Id (2015). 49. Zobel, R. W., Wright, M. J. & Gauch, H. G. Statistical analysis of a yield trial. Agron. J. 80, 388–393 (1988). 50. Yan, W. A study on the methodology of cultivar evaluation based on yield trial data with special reference to winter wheat in Ontario
(University of Guelph, 1999). 51. Ashwini, K. V. R., Ramesh, S. & Sunitha, N. C. Comparative BLUP, YREM-based performance and AMMI model-based stability
of horse gram [Macrotyloma uniflorum (Lam.) Verdc] genotypes differing in growth habit. Genet. Resour. Crop Evol. 68, 457–467 (2021).
52. Piepho, H. P. Best linear unbiased prediction (BLUP) for regional yield trials: a comparison to additive main effects and multiplica-tive interaction (AMMI) analysis. Theor. Appl. Genet. 89, 647–654 (1994).
53. Postma, E. Implications of the difference between true and predicted breeding values for the study of natural selection and micro-evolution. J. Evol. Biol. 19, 309–320 (2006).
54. Bernardo, R. Reinventing quantitative genetics for plant breeding: something old, something new, something borrowed, something BLUE. Heredity 125, 375–385 (2020).
55. Almagro, A., Oliveira, P. T. S., Nearing, M. A. & Hagemann, S. Projected climate change impacts in rainfall erosivity over Brazil. Sci. Rep. 7, 1–12 (2017).
56. Hanna, E. G. & McIver, L. J. Climate change: a brief overview of the science and health impacts for Australia. Med. J. Aust. 208, 311–315 (2018).
57. Ornes, S. How does climate change influence extreme weather? Impact attribution research seeks answers. Proc. Natl. Acad. Sci. U.S.A. 115, 8232–8235 (2018).
58. Gautam, R. C. & Bana, R. S. Drought in India: its impact and mitigation strategies—a review. Indian J. Agron. 59, 179–190 (2014). 59. Vasantha, S., Alarmelu, S., Hemaprabha, G. & Shanthi, R. M. Evaluation of promising sugarcane genotypes for drought. Sugar Tech
7, 82–83 (2005). 60. Panter, D. M. & Allen, F. L. Using best linear unbiased predictions to enhance breeding for yield in soybean: II. Selection of superior
crosses from a limited number of yield trials. Crop Sci. 35, 405–410 (1995). 61. Kleinknecht, K. et al. Comparison of the performance of best linear unbiased estimation and best linear unbiased prediction of
genotype effects from zoned Indian maize data. Crop Sci. 53, 1384–1391 (2013).

13
Vol.:(0123456789)
Scientific Reports | (2021) 11:18649 | https://doi.org/10.1038/s41598-021-98002-y
www.nature.com/scientificreports/
62. Natarajan, S., Basnayake, J., Lakshmanan, P. & Fukai, S. Limited contribution of water availability in genotype-by-environment interaction in sugarcane yield and yield components. J. Agron. Crop Sci. 206, 665–678 (2020).
63. Meena, M. R., Karuppiayan, R., Ram, B., Kumar, R. & Kulshreshtha, N. Genotypes x environment interactions and stability analysis of sugarcane clones (Saccharum spp.) by AMMI model in sub-tropical regions of India. Indian J. Genet. Plant Breed. 77, 540–546 (2017).
64. Guerra, E. P. et al. Stability and adaptability of early maturing sugarcane clones by AMMI analysis. Crop Breed. Appl. Biotechnol. 9, 260–267 (2009).
65. da Silveira, L. C. I. et al. AMMI analysis to evaluate the adaptability and phenotypic stability of sugarcane genotypes. Scientia Agricola 70, 27–32 (2013).
66. Mattos, P. H. C. D., Oliveira, R. A. D., Bespalhok Filho, J. C., Daros, E. & Veríssimo, M. A. A. Evaluation of sugarcane genotypes and production environments in Paraná by GGE biplot and AMMI analysis. Crop Breed. Appl. Biotechnol. 13, 83–90 (2013).
67 Bocianowski, J., Liersch, A. & Nowosad, K. Genotype by environment interaction for alkenyl glucosinolates content in winter oilseed rape (Brassica napus L.) using additive main effects and multiplicative interaction model. Current Plant Biol 21, 10–40 (2020).
AcknowledgementsWe thankfully acknowledge Dr Sheshakumar Goroshi, Scientist-E, India Meteorological Department, Pune for kind enough to providing the weather data of Kopargaon, Jalna, Pune and Nanded locations. We thankfully acknowledge Dr Ramesh S., Professor, Dept. of Genetics and Plant Breeding, University of Agriculture Sciences, Bangalore and Dr Sathosh Rathod, Scientist, ICAR-Indian Institute of Rice Research, Hyderabad for help in statistical analysis. We acknowledge the Vasantdada Sugar Institute, Pune for arranging the local transport and coordination of the various sugar factory officials. We acknowledge the sugar factories (i) M/s Sahakari Maha-rishi Shankararao Kolhe Sahakari Sakkara Sangha, Sanjivaninagar, Kopargaon, Ahmednagar District; (ii) M/s Karmayogi Ankushrao Tope Samarth Sahakari Sakkara Kharkana, Ankushnagar, Ambad Taluk, Jalna District; (iii) M/s Bhaurao Chavan Sahakari Sakkara Kharkana, Nanded for their kind support and maintenance of the experiments.
Author contributionsC.M., S.V., P.H. Equal contribution to the work, execution and monitoring of trials at different locations; G.H., B.R., R.H.: Planning and formulation of research programme; K.M.: Multiplication of drought tolerant varieties at Coimbatore; H.K.M., C.A., C.M.: Data analysis. C.M.: Drafted the manuscript. All authours read and approved the manuscript.
Competing interests The authors declare no competing interests.
Additional informationSupplementary Information The online version contains supplementary material available at https:// doi. org/ 10. 1038/ s41598- 021- 98002-y.
Correspondence and requests for materials should be addressed to C.M. or P.H.
Reprints and permissions information is available at www.nature.com/reprints.
Publisher’s note Springer Nature remains neutral with regard to jurisdictional claims in published maps and institutional affiliations.
Open Access This article is licensed under a Creative Commons Attribution 4.0 International License, which permits use, sharing, adaptation, distribution and reproduction in any medium or
format, as long as you give appropriate credit to the original author(s) and the source, provide a link to the Creative Commons licence, and indicate if changes were made. The images or other third party material in this article are included in the article’s Creative Commons licence, unless indicated otherwise in a credit line to the material. If material is not included in the article’s Creative Commons licence and your intended use is not permitted by statutory regulation or exceeds the permitted use, you will need to obtain permission directly from the copyright holder. To view a copy of this licence, visit http:// creat iveco mmons. org/ licen ses/ by/4. 0/.
© The Author(s) 2021