Microstructure and electrical resistivity of calcined magnesite
119
University of Wollongong University of Wollongong Research Online Research Online University of Wollongong Thesis Collection 1954-2016 University of Wollongong Thesis Collections 1990 Microstructure and electrical resistivity of calcined magnesite Microstructure and electrical resistivity of calcined magnesite Lena Elisabet Plambeck University of Wollongong Follow this and additional works at: https://ro.uow.edu.au/theses University of Wollongong University of Wollongong Copyright Warning Copyright Warning You may print or download ONE copy of this document for the purpose of your own research or study. The University does not authorise you to copy, communicate or otherwise make available electronically to any other person any copyright material contained on this site. You are reminded of the following: This work is copyright. Apart from any use permitted under the Copyright Act 1968, no part of this work may be reproduced by any process, nor may any other exclusive right be exercised, without the permission of the author. Copyright owners are entitled to take legal action against persons who infringe their copyright. A reproduction of material that is protected by copyright may be a copyright infringement. A court may impose penalties and award damages in relation to offences and infringements relating to copyright material. Higher penalties may apply, and higher damages may be awarded, for offences and infringements involving the conversion of material into digital or electronic form. Unless otherwise indicated, the views expressed in this thesis are those of the author and do not necessarily Unless otherwise indicated, the views expressed in this thesis are those of the author and do not necessarily represent the views of the University of Wollongong. represent the views of the University of Wollongong. Recommended Citation Recommended Citation Plambeck, Lena Elisabet, Microstructure and electrical resistivity of calcined magnesite, Master of Engineering (Hons.) thesis, Department of Materials Engineering, University of Wollongong, 1990. https://ro.uow.edu.au/theses/2493 Research Online is the open access institutional repository for the University of Wollongong. For further information contact the UOW Library: [email protected]
-
Upload
khangminh22 -
Category
Documents
-
view
0 -
download
0
Transcript of Microstructure and electrical resistivity of calcined magnesite

University of Wollongong University of Wollongong
Research Online Research Online
University of Wollongong Thesis Collection 1954-2016 University of Wollongong Thesis Collections
1990
Microstructure and electrical resistivity of calcined magnesite Microstructure and electrical resistivity of calcined magnesite
Lena Elisabet Plambeck University of Wollongong
Follow this and additional works at: https://ro.uow.edu.au/theses
University of Wollongong University of Wollongong
Copyright Warning Copyright Warning
You may print or download ONE copy of this document for the purpose of your own research or study. The University
does not authorise you to copy, communicate or otherwise make available electronically to any other person any
copyright material contained on this site.
You are reminded of the following: This work is copyright. Apart from any use permitted under the Copyright Act
1968, no part of this work may be reproduced by any process, nor may any other exclusive right be exercised,
without the permission of the author. Copyright owners are entitled to take legal action against persons who infringe
their copyright. A reproduction of material that is protected by copyright may be a copyright infringement. A court
may impose penalties and award damages in relation to offences and infringements relating to copyright material.
Higher penalties may apply, and higher damages may be awarded, for offences and infringements involving the
conversion of material into digital or electronic form.
Unless otherwise indicated, the views expressed in this thesis are those of the author and do not necessarily Unless otherwise indicated, the views expressed in this thesis are those of the author and do not necessarily
represent the views of the University of Wollongong. represent the views of the University of Wollongong.
Recommended Citation Recommended Citation Plambeck, Lena Elisabet, Microstructure and electrical resistivity of calcined magnesite, Master of Engineering (Hons.) thesis, Department of Materials Engineering, University of Wollongong, 1990. https://ro.uow.edu.au/theses/2493
Research Online is the open access institutional repository for the University of Wollongong. For further information contact the UOW Library: [email protected]
MICROSTRUCTURE AND ELECTRICAL RESISTIVITY OF CALCINED MAGNESITE
A thesis submitted in fulfilment of the requirements for the award of the degree
HONOURS MASTER OF ENGINEERING
from
THE UNIVERSITY OF WOLLONGONG
UNIVERSITY OF WOLLONGONG
LIBRARY
by
Lena Elisabet Plambeck, MSc (Mech Eng)
Department of Materials Engineering
1990

010322

SYNOPSIS
The high-temperature electrical resistivity of magnesia powders derived from
natural magnesite was investigated. These powders are currently used as electrical
insulation in mineral insulated cables, produced in Australia by Pyrotenax Australia
Pty Ltd. Heat Containment Industries Pty Ltd are the principal suppliers of
calcined magnesite to Pyrotenax Australia Pty Ltd.
The insulative characteristics of the calcined magnesite varies from source to
source and are dependent on mineralogical parameters and the industrial processing (i.e.
calcining conditions). Magnesite materials from two different mines proved to have
significantly different electrical resistivity as measured in short cable sections.
It was therefore of importance to establish a greater understanding of the
dominant factors affecting the electrical properties and to investigate the possibilities of
improving the electrical resistivity of a magnesite by altering the calcining conditions.
Magnesite ore from the Young mine was calcined under various conditions and it
was found that a calcining of 5 hours at 1800°C was necessary to achieve a
microstructure with distinct periclase crystals and crystal boundary phases similar to that
of the industrially calcined magnesite.
The electrical resistivity was measured during cooling from 1000°C to 500°C with
an applied voltage of 500V d.c. using the Fetterley sample configuration which simulates
the configuration of MI cables.
The effects of calcining conditions on resistivity were investigated and a
correlation between the electrical resistivity of the powders and the microstructure of
calcined ore is suggested.
The results emphasize the importance of a sufficient calcination such that the
phase separation of periclase and impurity compounds is complete. It is suggested that a
continuous crystal boundary phase lowers the electrical resistivity and the results also
indicate that a higher resistivity is obtained when the crystal size is such that direct contact
of adjacent crystals occur.

1
CONTENTS:PAGE:
SYNOPSIS
TERMINOLOGY AND ABBREVIATIONS................................................3
FOREWORD...................................................................................................... 4
1 . INTRODUCTION....................................................................................... 5
2. LITERATURE REVIEW............................................................................72.1 M agnesites...........................................................................................7
2.1.1 Crystal Growth in Periclase2.2 Electrical Properties of Ceramics..........................................132.2.1 Conductivity2.2.2 Resistivity
2.2.2.1 Test Methods2.22.2 Resistivity Measurements
2.3 Electrical Properties of Magnesia Materials........................... 192.3.1 Magnesia
2.3.1.1 Effect of Impurities2.3.1.2 Effect of Particle Size and Packing Fraction
2.3.2 Resistivity of Calcined Magnesite2.3.2.1 Effect of Impurities2.3.2.2 Effect of Particle Size and Packing Fraction2.3.2.3 Effect of Heat Treatment
3 . EXPERIMENTAL DETAILS............................................................... 243.1 Microstructural Examination......................................................... 24
3.1.1 Sample Preparation for SEM3.1.2 Crystal Size Measurements
3.2 Calcining Treatments...................................................................... 263.2.1 The Furnace3.2.2 Temperature Measurement3.2.3 Preparation of Ore and Calcining
3.3 Resistivity Measurements............................................................ 293.3.1 The Furnace3.3.2 The Frame for the Wires
3.3.3 The Wires and the Furnace Atmosphere3.3.4 Sample Preparation3.3.5 Measurement of Temperature3.3.6 Measuring Instruments3.3.7 Reading the Instruments, and the Measurements
3.4 Resistivity Measurements of MI Cable Sections................... 4 4

2
PAGE
4 . RESULTS AND DISCUSSION.............................................................4 54.1 Microstructural Examination.........................................................45
4.1.1 Examination of Clinkers from Young and Fifield4.1.1.1 Crystal Size4.1.1.2 Chemical Analysis4.1.1.3 Analysis using Energy Dispersive X-Ray Spectrometry (EDX)
4.1.2 Examination of Powders and Cable Cross-Sections
4.1.3 Effect of Calcining Conditions
4.2 Electrical R esistivity.......................................................................694.2.1 Correlation: Resistivity Measurements in Fetterley Cell and
MI Cable
4.2.2 Variation of Resistivity with Time
4.2.3 Variation of Resistivity with Temperature4.2.3.1 Fifield Magnesite4.2.3.2 Effect of Calcining Conditions on the Resistivity of Young Brick
Grade Magnesia4.2.3.2.1 Resistivity as a Function of Calcining Temperature4.2.3.2.2 Resistivity as a Function of Soaking Time4.2.3.2.3 Comparison with Calcination at Mine
4.2.3.3 Other Powders
5 . CO NCLUDING D ISC U SSIO N ....................................................... 90
A C K N O W L E D G E M E N T S ........................................................................ 94
REFERENCES....................................................................................................95
APPENDICES:A l. Phase DiagramsB l. Temperature Profiles of Resistivity Measurement Furnace
B l.l Vertical B1.2 Horizontal
C l. Previous ResultsC2. EDX Spectra of Clinkers from Fifield and Young Mines D l. Resistivity Data D2. Chemical Analysis

TERMTNOT.OGY:
Magnesite The mineral MgCC>3 (magnesium carbonate).
Calcined magnesite Magnesite that has been calcined: MgCC>3—»
MgO + CO2. The product is an impure refractory grade of magnesia, as opposed to the refined substance MgO.
Natural magnesite Naturally occurring magnesite ore.
Clinker Coarsely crushed pieces of calcined magnesite (approximately <4cm in size).
Dead-burning Calcination of magnesite at temperatures above ca 1600°C. The dead-burning results in a chemically inert calcined magnesite.
Crystal A crystal has a lattice displaying long range order and a predictable composition within a defined crystal boundary.
Particle A small discrete solid containing one or more phases (which may or may not be crystalline). Obtained by grinding, or other communition processes, of lump material.
Specific surface area The particle area exposed by lg of powder.
Resistivity / Specific resistance, The resistivity of a material is given by kR,
Rs where R is the electrical resistance and k is a volume factor dependent on the sample configuration.
ABBREVIATIONS:
XRD X-Ray Diffraction
SEM Scanning Electron Microscope
EDX Energy Dispersive X-Ray Spectrometer
MI Cable Mineral Insulant Cable
3 0009 02934 1596

4
FOREWORD
This thesis forms part of a project within the National Teaching Company Scheme
governed by the Department of Industry, Technology and Commerce
(DITAC) and was a joint project between Heat Containment Industries Pty Ltd,
U nanderra and the Department of Materials Engineering, the University of
Wollongong. The Teaching Company Scheme was introduced as an initiative by DITAC
to foster collaborative research between industry and university institutions. Heat
Containment Industries Pty Ltd is a member o f the M organite group and are
producers of an extensive range of industrial refractory materials and products.
5
1. INTRODUCTIONMagnesia is a refractory material used as an electrical insulant in so called mineral
insulated (MI) cables produced in Australia by Pyro tenax A ustra lia P ty L td ,
Melbourne.
The insulative characteristics of MI cables enable them to be used for applications
such as heating cables, thermocouples and power cables in industrial and commercial
installations.
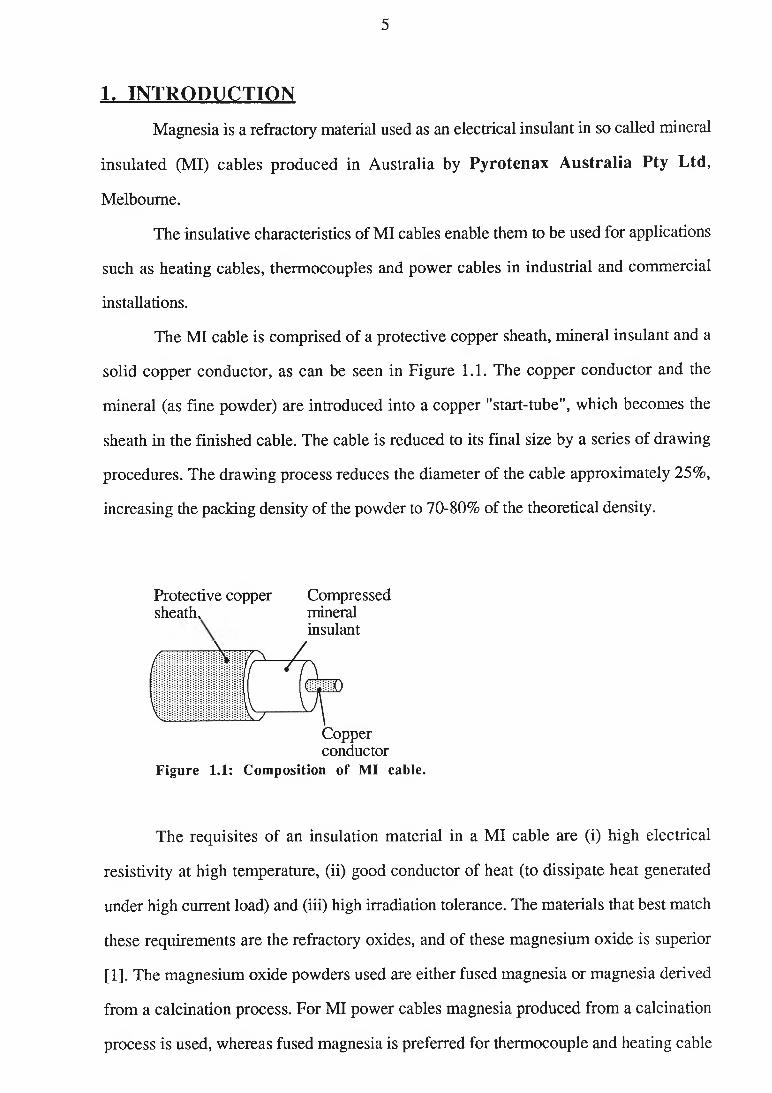
The MI cable is comprised of a protective copper sheath, mineral insulant and a
solid copper conductor, as can be seen in Figure 1.1. The copper conductor and the
mineral (as fine powder) are introduced into a copper "start-tube", which becomes the
sheath in the finished cable. The cable is reduced to its final size by a series of drawing
procedures. The drawing process reduces the diameter of the cable approximately 25%,
increasing the packing density of the powder to 70-80% of the theoretical density.
Protective copper sheath,
Compressedmineralinsulant
Copperconductor
Figure 1.1: Composition of MI cable.
The requisites of an insulation material in a MI cable are (i) high electrical
resistivity at high temperature, (ii) good conductor of heat (to dissipate heat generated
under high current load) and (iii) high irradiation tolerance. The materials that best match
these requirements are the refractory oxides, and of these magnesium oxide is superior
[1]. The magnesium oxide powders used are either fused magnesia or magnesia derived
from a calcination process. For MI power cables magnesia produced from a calcination
process is used, whereas fused magnesia is preferred for thermocouple and heating cable

6
applications where the operating temperature can be up to 1100°C. Magnesia produced by
calcination is derived either from the thermal decomposition of magnesium hydroxide
precipitated from sea-water to form magnesia and water vapour or by calcination of mined
natural magnesite ore (MgCC>3). This study is concerned with the magnesia produced
from natural magnesite.
The calcined magnesite is supplied from various sources. Heat Containment
Industries Pty Ltd in Unanderra supply Pyrotenax Australia Pty Ltd with
calcined magnesites (prepared as a powder mix) originating from two different deposits in
N.S.W., namely "Young" at Thuddungra and "Fifield". The calcining of the ores are in
accordance with the standard commercial processes. Although similar in chemical
composition, the electrical properties of the calcined magnesites from the two different
sources differ significantly. The Fifield material has a higher electrical resistivity than the
Young material. With the closure of the Fifield mine in 1989, the concern for the quality
of the MI cable has increased as alternative insulant material must be sought.
The electrical quality of a mineral insulant is determined is by comparison with a
standard. In Pyrotenax’s case the standard is the Fifield calcined magnesite. The
electrical resistivity is measured on specially prepared short sections (ca 0.5 metre long)
of cable. The cable is placed in a horizontal muffel-fumace and the electrical resistance (at
1000V) at various temperatures is measured across the mineral. By plotting the resistivity
as a function of temperature the material is compared with the standard.
The aim of this study was to investigate why the electrical properties of the Fifield
material are superior to that of the Young material. The following aspects were of interest:
(i) to study and interrelate the microstructure and chemical composition of the two
materials as supplied from the mines.
(ii) to study the effects of calcining conditions on the microstructure of the Young
material and to relate the microstructure to the electrical properties.
(iii) to determine whether an improvement of the electrical properties of the
inferior Young material is possible as a result of changed calcining conditions.

7
2. LITERATURE REVIEW
IN T R O D U C T IO N
The following literature review is divided into three main sections starting with the
basic concepts of magnesite materials in Section 2.1. The microstructural compositions
and changes during the calcining process are dealt with and, in particular, the effects of
the calcining process on the periclase-crystal size.
The two following sections, i.e. Sections 2.2 and 2.3, deal with electrical
properties of ceramic materials. Section 2.2 presents the fundamental theories of electrical
properties and test methods of ceramic materials in general.
The third section, i.e. Section 2.3, concentrates on the electrical properties of
magnesia, and more importantly, calcined magnesite. Studies on the effects of impurities,
particle size and packing fractions on the electrical properties of these materials are
reviewed.
2.1 M A G N ESITES
Prior to calcination, the ore needs to be crushed to a suitable size to allow for
uniform calcination, i.e. the size should be such that complete and unrestricted evolution
of carbon dioxide is allowed. Generally, for magnesite ore, a crushing size of -80+10mm
is used, and the crushing normally takes place in several stages with intermediate
screenings [4].
During the calcination, which takes place in rotary or shaft kilns, the magnesite
decomposes to form periclase (MgO) and carbon dioxide gas: MgCC>3-»M gO + CO2.
The industrial calcination process takes place in two distinct steps; (i) loss of CO2 and (ii)
recrystallization of periclase. The temperatures at which this occurs depends on particle
size, heating rate, atmosphere and impurities in the original magnesite [2-5]. In previous
studies decomposition temperatures ranging from 300°C up to 700°C have been noted.
Recrystallization has been found to start at temperatures above 900°C [6]. To give an
8
estimation of actual crystal sizes, Insley et al [7] found the periclase crystals to have
grown to a diameter of 5}im at about 1000°C and 20-40 |im at 1500°C.
Magnesite is called dead-burnt if the calcining temperature is high (1540°C to
2200°C) [3]. The process of dead-burning involves calcining the crushed ore at high
temperature causing growth of the crystals (and therefore a decrease in surface area of
crystals), resulting in a dense and chemically inert material which does not readily absorb
water vapour from the atmosphere. This process is accelerated by the presence of
impurities, which serve as dead-burning agents [3], [7],
The main impurities in the raw ore are lime, silica and iron oxide, and at
approximately 1000°C these will react with one another and with the magnesia to form
fo rste rite (2M gOSiC>2), m onticellite (C aO M gO SiC >2) and/or m erwinite
(3C aO M gO *2SiC)2) depending on the CaO/SiC>2 ratio (refer also phase diagrams,
Appendix A l). Alumina may also react to form calcium aluminates, spinel (M gO A l203)
or brownmillerite (4C aO A l203*Fe203) [7] (refer also phase diagrams, Appendix A l).
Rigby et al [9] established a method of calculating mineralogical compositions of calcined
magnesites based on the CaO/SiC>2 ratio. As can be seen in Table 2.1, if the ratio is
exactly 1:1 then all the lime and silica will combine with magnesia to form monticellite. If
the ratio is 1.5:1 then merwinite will form and if the ratio is exactly 2:1 dicalcium silicate
will form. Ratios in between these will result in mixtures. After these reactions, any
remaining magnesia will combine with alumina and ferric oxide and form spinel and
magnesioferrite (M gOFe2C>3).
If the CaO/SiC>2 ratio exceeds 2:1, then the amount of ferric oxide and alumina
must be taken into account. According to Rigby et al [9] the following reactions will take
place in this order: (i) First, all the silica will react with the lime to form dicalcium silicate,
(ii) Any remaining lime will then combine with alumina and ferric oxide to form
brownmillerite. If this reaction uses up all the lime, the remaining alumina and ferric
oxide will form spinel or magnesioferrite. (iii) If lime still remains after the formation of
brownmillerite then depending on the amounts of remaining lime, alumina and ferric

9
oxide various calcium aluminates, calcium ferrites and spinels may form as noted in Table
2 . 1.
TABLE 2.1: PHASE COMPOSITION IN MAGNESIA REFRACTORIES \S], [9].
Ca0 /Si02 MOLECULAR RATIO (Parts by weight noted beneath):
<1
<0.93
1
0.93
1-1.5
0.93
1.40
1.5
1.40
1.5-2
1.40
1.87
2
1.87
2-3
1.87
2.80
3
2.80
>3
>2.80
m 2s CMS CMS C3MS2 C3MS2 c2s c2s C3S C3S
CMS C3MS2 c 2s C3S c
MA
MF
P
c 4a f
pD e p e n d in g o n a m ou n ts o f C , F a n d A , f o r m a t io n o f th e fo l lo w in g :
MF, C2F, MA, CA, C3A3,
C3A
C=CaO, M=MgO, S=SiC>2, A=Al2Û3, F=Fe2Û3, P=Periclase
As can be seen in Table 2.2, the melting points of some compounds that may be
present in the magnesite are relatively low, resulting in a liquid phase during calcining.
Therefore, the CaO/SiC>2 ratio is of great importance in understanding the characteristics
of particular calcined magnesites. For compositions in which the CaO/SiC>2 ratio is less
than 2:1, a liquid phase may develop at a temperature as low as 1490°C (monticellite
melts), whereas minerals present in compositions with a Ca0/Si02 ratio of more than 2:1
would not form a liquid below 1790°C [8].

10
TABLE 2.2: MELTING POINTS OF COMPOUNDS [8],
COMPOUND FORMULA MELTING POINT [°C]
Lime CaO [C] -2570
Periclase MgO [M] -2825
Spinel Mg0 *Al203 [MA] 2105
Dicalcium Silicate 2Ca0 *Si02 [C2S] 2130
Forsterite 2MgO*Si02 [M2S] 1900
Tricalcium Silicate 3Ca0 *Si02 [C3S]Stable between 1250 and 1900. Above and below these temperatures, it dissociates into 2CaOSiC>2 and CaO
Magnesioferrite Mg0 *Fe203 [MF] Begins to melt at 1713
Monticellite Ca0 *Mg0 *Si02 [CMS]Melts incongruently at 1487 to form MgO + liquid. Melting complete at 1650.
Merwinite 3CaO*MgO*2Si02 [C3m s 2]Melts incongruently at 1577 to form 2CaO*Si02, MgO and liquid.
The colour of dead-burnt magnesia low in iron oxide varies from white to tan [8].
Iron oxide is the most effective dead-burning agent and is, in some cases, added to the
raw material, increasing the iron oxide content to 2-3%. The oxidation state of the iron is
dependent on the firing and cooling conditions. With increasing calcining temperatures
above 1400°C or in a reducing calcining atmosphere, an increasing amount of Fe2C>3 is
reduced to FeO. At high temperatures the FeO dissolves in the periclase and, upon
cooling in a reducing atmosphere, the FeO will remain in solution resulting in a material
bottle green in colour. Under normal oxidizing conditions in gas furnaces the iron oxide
reacts with magnesia to form magnesioferrite (Mg0 *Fe203), which dissolves in the
periclase at high temperatures. Depending on the cooling rate, the magnesioferrite may
remain in solution in the periclase, or precipitate as crystalline inclusions when cooled
slowly. A rapid cooling results in a material yellow to reddish brown in color. When
cooled slowly, the magnesioferrite will precipitate as lamellar inclusions in the periclase

11
grains, or if cooled more slowly, skeletal octahedra may form [7],[10]. Magnesites
containing less than 1% iron oxide show no precipitation of magnesioferrite.
2* 1.1 Crystal Growth in Periclase
To achieve a dead-burnt magnesite, the magnesite is calcined at a temperature
around or above 1600°C. The higher calcining temperature promotes growth of periclase
crystals and the result is a material with minimal tendency to hydrate. The process is
accompanied by an increase in the specific gravity (as determined by the conventional
bottle density method), which is often measured to determine the degree of dead-burning
which the magnesite has achieved. Higher calcining temperatures and longer calcining
times will increase the crystal size, which can also be achieved by additions of certain
impurities [11]. Daniels et al [12] studied the activation energy, derived from crystal
growth isotherms, of MgO during sintering. They found the activation energy was much
larger than published activation energies of crystal boundary migration.They contributed
the large activation energy to the impurity content. The rate of crystal growth varies from
magnesite to magnesite, depending on the impurities present. Numerous authors have
studied the effects of certain impurities on dead-burning and crystal growth of magnesites
[3],[7],[8],[11],[13-15]. In general, it has been shown that small additions of impurities
promote crystal growth, whereas once an optimum content is reached, the impurities
inhibit growth by forming secondary phases. In attempts to explain the mechanism by
which these impurities promote crystal growth, the most common theory suggested is that
it is the solubility of the impurity in the periclase that determines whether or not the
impurity will foster growth. A study by Nelson et al [15] on recrystallization during
sintering and subsequent crystal growth of pure magnesia as a function of different firing
temperatures showed that an increase in firing temperature from 1500°C to 1800°C did not
markedly increase the crystal size. Similar results were found by Guilliat et al [16] for
calcination of pure Mg(OH)2 powders over the temperature range 350°C to 1080°C. It
was found, on the other hand, that small amounts of impurities formed solid solutions
with the periclase and aided crystal growth by promoting lattice diffusion through an

12
increase in lattice defects [10]. The solubility of iron oxide is extensive in periclase at high
temperatures and creates a defect-rich structure [11] and is therefore considered to be the
best dead-burning agent. Previous work by Guilliat et al [16] showed this effect,
reporting increased crystal size as a result of Fe2C>3 additions. Kriek et al [13] found that
Fe2C>3, Ti0 2 , SiC>2 and AI2O 3 all promote crystal growth during sintering, whilst
additions of CaO inhibited sintering. Nelson et al [15] also found that additions of CaO
to MgO resulted in smaller crystals than found in pure MgO after sintering at 1800°C.

13
2.2 E L E C TR IC A L PR O PER TIES OF CERAM ICS
Ceramic materials display a wide range of electrical properties and can be used in
applications ranging from insulators and semi-conductors to conductors and capacitors.
2.2.1 C onductiv ity
There are essentially two main mechanisms of conduction in a ceramic: (a)
electronic as in semiconductors or (b) ionic as in insulators. The ability to conduct
electrons is usually described in terms of an electronic energy band structure. Each band
represents a large number of allowed energy levels or quantum states. Between these
bands are so called forbidden bands. The outer most electrons of the atoms form the
valence band of the solid and is the band, of those filled, that has the highest energy. For
conduction to occur, the electrons have to move from one energy level to another and, if
the valence band is full, have to be in the conduction band. Metals are good conductors as
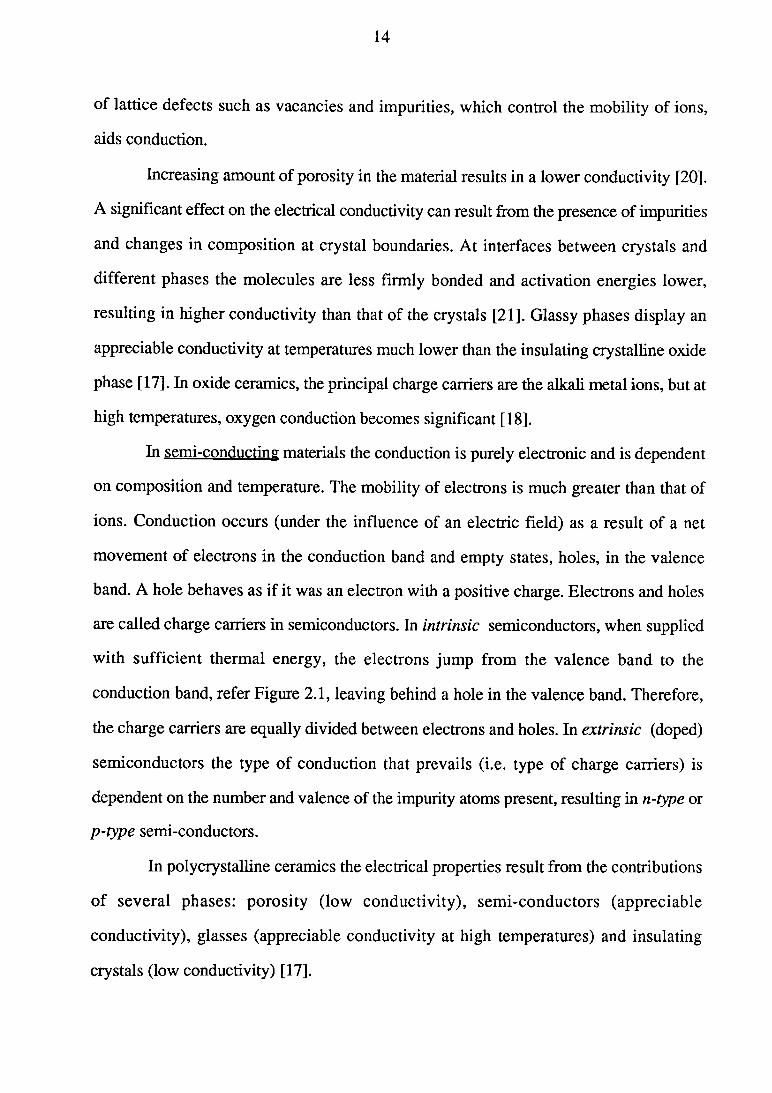
the conduction band overlaps with the valence band as can be seen in Figure 2.1.
&<L>CW
Unfilled bands Conduction Band
I Partly filled bands Valence Band
Filled bands
f l l i i i ! wmmrn
Conductor Semiconductor Insulator
Figure 2.1: Electron energy bands in conductors, semiconductors and
insulators [17].
As pictured in Figure 2.1, the forbidden band gap in insulators is large, resulting
in low electronic conduction [17-19]. Ionic conduction in insulators is low at room
temperature, but prevails in most ceramics at high temperatures when the energy barrier to
lattice diffusion of charged ions is overcome. In purely crystalline ceramics, the presence
14
of lattice defects such as vacancies and impurities, which control the mobility of ions,
aids conduction.
Increasing amount of porosity in the material results in a lower conductivity [20].
A significant effect on the electrical conductivity can result from the presence of impurities
and changes in composition at crystal boundaries. At interfaces between crystals and
different phases the molecules are less firmly bonded and activation energies lower,
resulting in higher conductivity than that of the crystals [21]. Glassy phases display an
appreciable conductivity at temperatures much lower than the insulating crystalline oxide
phase [17]. In oxide ceramics, the principal charge carriers are the alkali metal ions, but at
high temperatures, oxygen conduction becomes significant [18].
In semi-conducting materials the conduction is purely electronic and is dependent
on composition and temperature. The mobility of electrons is much greater than that of
ions. Conduction occurs (under the influence of an electric field) as a result of a net
movement of electrons in the conduction band and empty states, holes, in the valence
band. A hole behaves as if it was an electron with a positive charge. Electrons and holes
are called charge carriers in semiconductors. In intrinsic semiconductors, when supplied
with sufficient thermal energy, the electrons jump from the valence band to the
conduction band, refer Figure 2.1, leaving behind a hole in the valence band. Therefore,
the charge carriers are equally divided between electrons and holes. In extrinsic (doped)
semiconductors the type of conduction that prevails (i.e. type of charge carriers) is
dependent on the number and valence of the impurity atoms present, resulting in n-type or
p-type semi-conductors.
In polycrystalline ceramics the electrical properties result from the contributions
of several phases: porosity (low conductivity), semi-conductors (appreciable
conductivity), glasses (appreciable conductivity at high temperatures) and insulating
crystals (low conductivity) [17].

15
2,2,2 Electrical Resistivity
2.2.2.1 Experimental Methods
The measured value of the electrical resistance of a specimen of a insulation
material results from the composite effect of its volume and surface resistances. Various
sample configurations for resistivity measurements on insulating materials have been
standardized [22]. The standard method to measure volume resistivity in a solid is to use
a disc sample 25 to 75 mm in diameter and from 0.02 to 0.025 mm in thickness, with
electrodes on either disc face. The disc configuration is not appropriate for testing the
resistivity of materials for specific applications in the configuration of cable insulation as
the configuration of the insulation is not of disc geometry. Resistivity measurements have
been made on short sections of a variety of real cable for quality control purposes [23]
and for studies on the electrical phenomena which occur in MI cables [24]. Although the
results are representative of the in-service product, the results can only be used for
comparative testing as the testing conditions are empirical. Also, non-uniform heating of
the cable samples is a problem which can lead to errors in the measurements and good
reproducibility of the results would be difficult to obtain. For materials used in tubes and
cables the standard [22] uses a test method and a sample configuration similar to that of
the cable/tube. The volume resistivity (or specific resistance), pR [Qm], of a material is as
follows:
For Disc Samples:
; where the volume resistance Rv = j .
For Cable/Tube Samples:
(2 .1)
PR =2 7C L R v
(2 .2)
Rv = volume resistance in ohms;

16
E = the applied voltage;
I = the measured current;
A = the effective area of the measuring electrode;
t = the thickness of the specimen;
L is the length of the specimen;
Di and D2 are inner and outer diameters.
Surface conductivity is largely a property derived from the contamination that
occurs with handling of the sample. The conditions during testing, such as humidity, are
important and should fall within limits set by a standard. To avoid surface conduction, the
geometry of the sample must be such that conduction is easier through the bulk than along
the surface [18]. It is possible to measure the surface conduction and the volume
conduction separately by using a three-terminal electrode system, where the third
electrode is disposed so that it intercepts the surface-conductance component without
interfering with the bulk conduction [22],[25]. For tubular specimens the third electrode
consists of an encircling electrode at each end of the outer tube electrode at a sufficient
distance to the tube as not to interfere with bulk measurements. This configuration is only
suitable for solid materials.
Resistance measurements with alternating current are normally the more accurate
method because of the variation of current with time occurring with direct-current
measurements as described below, but measurements of resistance of insulating materials
with d.c. are preferred because of the difficulty in obtaining sensible results at high
resistivity levels with a.c. as the a.c. resistivity may be as much as two orders of
magnitude lower than d.c. measurements.
The decrease of current with time is due to dielectric absorption (interfacial
polarization, volume charge) and the sweep of mobile ions to the electrodes. In general,
the relation of current to time is of the form as expressed in Equation 2.3 after applying
the charge and until the current has decreased asymptotically towards its true (saturation)
value:
I(t) = A t m (2.3)

17
where I = current, t = time, m = a value between 0 and 1, and A is a constant.
Depending on the characteristics of the specimen material, the time required for
the current to decrease to within 1% of the saturation value may be from a few seconds to
many hours. To ensure that the measurements on a given material are comparable when
measuring with d.c., it is standard practice to measure the current one minute after
application of the test voltage. It is recommended in the standard [22] that a resistance
time or conductance-time curve should be obtained for a given material as a basis for
selection of a suitable time for electrification. In cable configurations, in particular, it is
found that the resistance of the specimen materials that display polarization are dependent
on the electrical polarity and the polarity should therefore be specified and kept constant.
The test voltage depends on the specifications, but the most frequently used test
voltages, according to the standard, are 100V and 500V. The applied voltage should be
within 1% of the specified voltage.
A quick and inexpensive method to measure the specific resistance of compressed
granular refractories at temperatures up to 1000°C was developed by Fetterley [26] to
enable the prediction of the performance of periclase as the insulating material in electric
heating elements. Fetterley [26] used a sample configuration consisting of a rod electrode
inside a tube electrode1. Measurements were made with both a.c. and d.c. and the
a.c./d.c. resistance ratio for pure periclase was found to be about 1:2. Also, in the case of
d.c. measurements at 1000V on periclase, a dielectric absorption phenomenon was
observed; the resistance decreasing (current increasing) rapidly when the potential is first
applied and gradually assuming a constant value. This effect is the opposite to the
observations by Lewis [27] on polycrystalline magnesium oxide and to what Goodings
[24] found when testing the d.c. resistance at 100-200V of a cable sample containing
magnesium oxide powder. Instead of an increase in current, Goodings [24] observed a
decrease in current with time with the curve flattening after 30 seconds, reaching a
constant value after 1000 seconds. Polarization reversal tests showed that the time
required for the current to settle was ten times shorter after reversing the polarity, ruling
out any possible capacitor effects. The phenomenon was explained by using the

18
semiconductor junction technique. Similar effects were observed on magnesia disc
samples at 1420°C by Osbum et al [28] but it was concluded that the cause was partial
blocking at the electrodes. Time dependent polarization effects were also observed in pure
polycrystalline AI2O3 by Moulson et al [25].
2.2.2.2 Resistivity Measurements
Following are some resistivity data of a few refractories and other insulators: 1
TABLE 2.3: RESISTIVITY DATA OF SOME REFRACTORY AND INSULATING
MATERIALS.
REFRACTORYSAM PLE
CONFIGURATIONTEMPERATURE
VOLTAGE p [£2cm] REFERENCEBasic(90-95% MgO)
disc:D = 2 .l5 c m ,t= 0 .4 c m
800°C10V , f= 9 6 5 c p s 1.5E7 29
8 8 % M g O tt tt 5.8E6 tt
99% AI2O3 ft tt 5.8E6 tt
9 8 % M g O
disc:D = 5 .0 8 c m ,t= 1 .2 7 c m
1000°C0 .5 V , f= 1 0 0 0 c p s ~2E5 30
94% MgO tt tt ~1E6 tt
99.4% AI2O3 tt tt -2.5E6 tt
M g O Room Temp. >1E14 19
AI2O3 tt >1E14 tt
M g O (O p tica l Q u ality P er ic la se) Fetterley Cell* 9770c ~3E7 26M g O (P o o rQ u alityC om m ercia lG rain)
tt tt ~4E5 tt
Fused MgO Fetterley Cell ~890°C 1E8 1
M g O Cable sample, 1ft100V d.c. 560°C 1E8 24
1 See Experimental Details, Section 3.3.4, for configuration.
19
As can be seen in Table 2.3, the measured resistivity for a particular material is
very much dependent on test method, testing conditions and quality of powder giving a
range of resistivity for magnesia from 2E5 to > IE 14 ! Previously, the sources of error on
resistivity such as surface conduction, humidity and polarization were mentioned.
Additional parameters to consider are number of electrodes, electrode material and gas
conduction [25]. It is suggested that at the metal electrode/oxide interface local voltage
gradients may lead to electrical breakdown at high temperature. This effect may also be
associated with the observed polarization effects.
Several authors have noted a hysteresis on the first heating-cooling cycle due to
contamination and moisture [1],[25],[31-33]. The measured resistivity is lower during
the first heating sequence. To avoid this error, resistivity measurements are taken during
cooling from a high temperature.
2.3 ELECTRICAL PROPERTIES OF MAGNESIA MATERIALS
2.3.1 _Magnesia
Magnesia is a mixed electronic and ionic conductor. The mechanism of
conduction is a function of temperature, partial pressure of oxygen and impurity content
[34],[35]. A study and review of conduction mechanisms in magnesia [1] showed that
ionic conduction, by magnesium cation vacancies, prevails up to at least 1100°C. The
concentration of these vacancies is extrinsically controlled by impurities. The activation
energy for high-temperature conduction, 3 eV, corresponds to that observed for diffusion
of Mg2+ ions.
2.3.1.1 Effect of Impurities
The resistivity of magnesia is determined by the impurity-controlled defects and
extensive studies have been conducted on the effects of various impurities. As iron is a
variable-valence cation, and is one of the most common impurities in magnesia, it has
attracted the most attention. The main role of the iron impurity is controlling the cation

20
concentration. The valence state of the Fe ions determines the effect on conductivity. Fe2+
ions do not contribute to the conductivity whereas Fe3+ do by forming associated cation
vacancies enhancing conductivity. Sempolinski et al [36] measured the ionic conductivity
of magnesia samples doped with Al, Sc and Fe. Their results show that the magnitude of
the ionic conductivity is directly proportional to the trivalent solute concentration (but
independent of the particular solute used). Fe2+ exists above 600-700°C or in reducing
atmospheres and slowly changes to Fe2+ below this temperature, but can be retained by
rapid cooling [1],[37],[38]. Wilson [1] found that the effect of impurities on the high-
temperature (1000°C) resistivity of fused magnesias for powders containing up to 0.1%
F e2Ü 3 and 1-2% of other refractory oxides was negligible compared with purer
magnesias. Table 2.4 summarizes published data on the effects of certain impurities on
the electrical resistivity of MgO.
TABLE 2.4: EFFECT OF IMPUREriES ON RESISTIVITY OF MGO.
Reference Fe2C>3 T i02 M 2 0 3
1Fe >0.15% I High Temp.
i NEG.!j
0.5% <1000°CNEG.
1.4% kl000°C,NEG. 4% kl800°C,NONE
0.05% kl500°C,NEG.
390.25mol% |1200-1800°C
| NEG.0.25mol% 1200-1800°C
NEG.<8-9mol% 1200-1800°C
j NONE
37Fe+++ | <700°C
1 NEG. j
26
-----------------1-----------------j <1000°C
[ POS.
402-10% [ll00-1550°C
\ NEG.2-10% 1100-1550°C
j POS.
Reference SÌO2 CaO O thers
10.5% \ <1000°C
[ NONE1.4% <1000°C
NONENaCl, KC1
0.4%<1000°C
NEG.
402-10% [1100-1550°C
[ POS.2-10% 1100-1400°C
POS.
As might be expected, limited amounts of closed porosity were found to increase
the resistivity of sintered compacts [1] and refractory samples [20].
21
2.3.1.2 Effect of Particle Size and Packing Fraction
Uehara et al [41] studied the effect of particle size on resistivity by testing the
resistivity of magnesia powders (prepared from Mg(OH)2) which had been sieved
through 50,100, 200 and 300 mesh sieves. The resistivity increased only very slightly, if
at all, with decreasing particle size (increased mesh size).
No effect of packing fractions between 2.0-3.0 g/cm^ on the electrical resistivity
of magnesia was found by Uehara et al [41] nor by Wilson [1] for solid packing fractions
ranging 0.7-0.8 (2.2-2.Ó g/cm^). These ranges cover the range typical of a MI cable.
2.3.2 Resistivity of Calcined Magnesite
Calcined magnesite is (currently) used as an electrical insulant in MI cables and
the electrical properties of calcined magnesite have been studied and reported by
numerous authors [1],[24],[29],[30],[40],[42],[43]. In the study by Wilson [1], it was
found that the activation energy below 1000°C was lower for compacted powders than
that for single crystals. This was attributed to the presence of particle surfaces and also
the interaction of surfaces with atmospheric gases. Furthermore, adsorption of water was
considered to affect the conductivity.
The conduction of magnesia is controlled by many factors, and it is not possible
to pin-point any one particular mechanism as being solely responsible.
2.3.2.1 Effect of Impurities
The effect of various impurities on the calcined magnesites high-temperature
resistivity is difficult to determine. It is not just the overall concentration of impurities,
given by analysis, that has an effect, but also the distribution and location of impurity
ions.
Studies of the effect of impurities on these particular materials for cable insulation
have shown that powders with an iron content greater than 0.15-0.20% (as Fe20 3) have
a lower high-temperature resistivity [42],[44],[45]. On the other hand there is no
evidence that the purest magnesias with less than 0.02% Fe show any improvement over

22
standard grades with 0.06-0.08% Fe. With the varying contents of CaO and S i02, no
correlation with resistivity was reported. It is believed that a chloride content greater than
0.005% will have an adverse effect on the high-temperature resistivity. Mined magnesias
usually have a lower chloride content than sea-water derived magnesias. A study by
Diepschlag et al [40] on the effect of the addition of pure oxides on the electrical
resistivity at 1100°C of calcined magnesite showed Fe2C>3 to be the most deleterious
followed by CaO and AI2O3 and finally SÌO2 having the least adverse effect on the
resistivity.
In comparison with calcined magnesite, sea-water derived magnesias have a
higher boron and vanadium content, while the content of nickel is higher in the mined
magnesias. However, neither nickel nor vanadium have any effect on the resistivity [42].
2.3.2.2 Effect of Particle Size and Packing Fraction
Diepschlag et al [40] studied the effects of particle size on the electrical resistivity
for calcined magnesite and found that the resistivity increased with increased particle size.
Although not mentioning the range of packing fractions tested, the effect of increased
pressure from 4.9 to 20 kN/cm2 during compaction of samples (i.e. increased packing
fraction) was found to lower the resistivity by 35% (at 1100°C) and an increase from 20
to 39 kN/cm2 reduced the resistivity by 7%.
The specific surface area1 of a powder is directly related to the particle size and
particle shape. The method used to determine the specific surface area is the BET nitrogen
adsorption test. Results show that the specific surface area of calcined magnesite
decreases (growth of crystals) with increasing calcining temperature and time. The
electrical resistivity increases also [39]. The specific surface area of a powders may differ
significantly although the packing density is the same, and it has been shown that the
packing fraction, within the normal range of MI cable density, has no effect on the
resistivity.
1 The particle area exposed by lg of powder is called the "specific surface area".

23
It is of importance to mention that the specific surface area increases, after
drawing of the cable, due to communition of the particles while drawing [1],[42],[44].
2.3.2.3 Effect of Heat Treatment
The resistivity increases with an increased calcining temperature (especially for
sea-water derived magnesias). The increase in resistivity is due to volatilization of
deleterious chloride impurities at higher temperatures. The results show that a heat
treatment to at least 900°C is necessary to remove undesirable impurities, such as
chloride, and obtain high resistivity. This is particularly important for sea-water derived
magnesias with lime additions [43].

24
3. EXPERIMENTAL DETAILS
Following is a description of the experimental details of the microstructural
examination procedure (Section 3.1), the calcining treatments (Section 3.2) and the
resistivity measurements (Section 3.3). All problems that arose during the preparation of
equipment and experiments are presented and discussed.
3.1 MICROSTRUCTURAL EXAMINATION
Microstructural studies of polished sections of clinkers, cables and powders were
conducted using a Hitachi S450 Scanning Electron Microscope, (SEM), and phase
identification was possible with a TRACOR NORTHERN 2000 Energy Dispersive X-
Ray Spectrometer, (EDX). The light optical microscope, a Nikon Optiphot metallurgical
upright microscope, was employed for routine examinations to establish polishing quality
prior to coating of samples for SEM study. The SEM produced images with a better
contrast (back scattered electron images) than the light optical microscope and phases
could be differentiated easily which was especially important for studies of crystal size
and crystal boundary compositions.
X-ray diffraction analyses of powders were performed in the Geology
Department, The University of Wollongong, using a PHILIPS X-ray diffractometer
(40kV, 30 mA Cu tube and a graphite monochromator). The JCPDS database was used
for mineral (phase) identification employing a JJ.PDSM Fein Marquart & Assoc. Inc.
computer software system.
The chemical compositions of the Fifield and Young Brick Grade powders were
determined by the following methods:
Atomic absorption Mg, Ca, Fe, Na, K and Mn
X-ray fluorescence Mg, Si, Ca, Fe, Al, K, Mn, Ti, Cr, Ni, S P and V
The results were compiled by the Department of Chemistry, The University of
Wollongong, and represent compounded results from atomic absorption plus X-ray
fluorescence methods.
25
The two methods showed good agreement for Fe, Mg, K and Mn, while the
values for Ca differed significantly. For the measurement of Ca with x-ray fluorescence
the equipment was calibrated against three different sample standards of calcium and was,
therefore, considered reliable.
3.1.1 Sample Preparation for SEM
The clinkers were mounted in cold setting resin. The mounted specimens were
polished on 240, 400, 600 and 1200 grade SiC paper with intermediate rinses in an ultra
sonic cleaner, and then polished on BUHLER TEXMET polishing cloth using 6pm, 3|im
and lfim diamond spray (aerosol applied). This polishing cloth (chemotextile material) is
suitable for hard materials such as ceramics where minimal inclusion and second phase
pull out is desired. In cases where surface relief was desired, the samples were polished
on a cotton cloth of medium nap with suspended gamma alumina. For studies in the SEM
with the EDX, the specimens were carbon coated. For EDX analysis, carbon film is more
appropriate than a gold coating, even though the image quality is somewhat less. The
reason for this is the location of the Au M a X-ray emission energy peaks which interfere
with the important spectrum between 1 and 10 keV where K a peaks of elements such as
Mg, Al, Si and Ca lie. The samples were carbon coated in a DYNAVAC High Vacuum
System evaporative coater.
The particle shapes of powders were studied by sprinkling powder on a SEM
specimen holder covered with double sided sticky tape. The powder was then gold coated
in a DYNAVAC SC100M Magnetron Sputter Coater. Cross-sections of particles were
studied by mounting powder in hot setting resin and polishing as above. The specimens
were carbon coated.
For studies of cable samples of longitudinal and transverse cross-sections the
cables were cut in a saw. After drying the samples in a drying oven and mounting them in
cold setting Araldite (Araldite M resin and HY51 hardener , 10:1) the surface of the
sample was impregnated by smearing low viscosity araldite over the surface whilst the
sample was heated on a hot plate (100°C). The samples were then polished as above. Re
26
impregnation was necessary in a few cases in between polishing steps where pull-out of
particles was observed. The samples were then carbon coated.
3,1.2 C rystal Size M easurem ents
Crystal size measurements were made using a graphics tablet connected to a Apple
HE computer. Four SEM micrographs per specimen were printed and enlarged (to A4-
size). The crystals were traced on the graphics tablet and a minimum of 100 crystals per
specimen were recorded.
3.2 CALCINING TREATM ENTS
The calcining treatments were conducted at H eat Containm ent Industries'
Unanderra plant.
1 .2 .1 Fprnaces
A gas kiln, type Bickley 3000-4 automatically controlled gas furnace, was used
for calcining at 1600°C and a Bickley 1800B High Temperature PCE gas furnace was
used for calcining above 1600°C.
3.2.2 T em peratu re M easurem ents
There are many methods for measurement of temperature, but only a few are
suitable for high temperature measurements. The thermocouple offers excellent accuracy
and precision over a wide range of temperatures and conditions. The most commonly
employed method, though, is optical pyrometry based on the monochromatic radiation
intensity [46].
Temperature measurements in the gas kiln were made with a sheathed R-type
thermocouple which was mounted through the top of the kiln, the bead located just above
the magnesite to be calcined.
For temperatures above 1600°C the R-type thermocouple could not be used and,
therefore, temperature measurements in the PCE furnace were made by using an optical
27
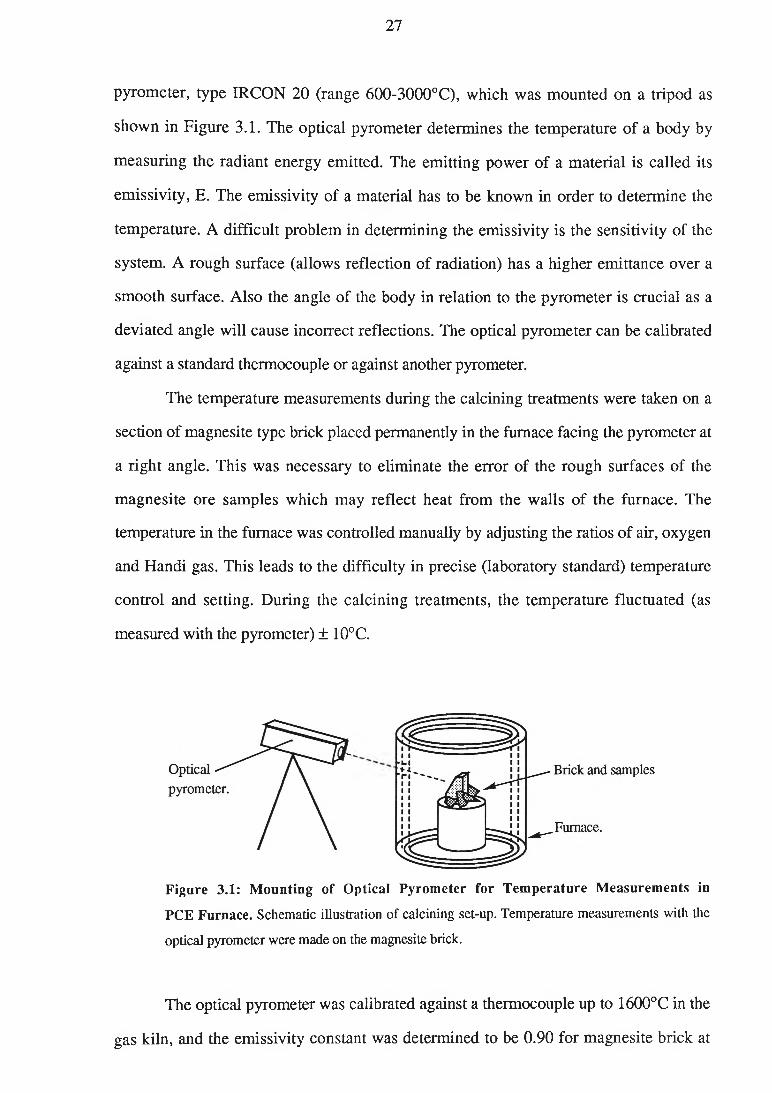
pyrometer, type IRCON 20 (range 600-3000°C), which was mounted on a tripod as
shown in Figure 3.1. The optical pyrometer determines the temperature of a body by
measuring the radiant energy emitted. The emitting power of a material is called its
emissivity, E. The emissivity of a material has to be known in order to determine the
temperature. A difficult problem in determining the emissivity is the sensitivity of the
system. A rough surface (allows reflection of radiation) has a higher emittance over a
smooth surface. Also the angle of the body in relation to the pyrometer is crucial as a
deviated angle will cause incorrect reflections. The optical pyrometer can be calibrated
against a standard thermocouple or against another pyrometer.
The temperature measurements during the calcining treatments were taken on a
section of magnesite type brick placed permanently in the furnace facing the pyrometer at
a right angle. This was necessary to eliminate the error of the rough surfaces of the
magnesite ore samples which may reflect heat from the walls of the furnace. The
temperature in the furnace was controlled manually by adjusting the ratios of air, oxygen
and Handi gas. This leads to the difficulty in precise (laboratory standard) temperature
control and setting. During the calcining treatments, the temperature fluctuated (as
measured with the pyrometer) ± 10°C.
Figure 3.1: Mounting of Optical Pyrometer for Temperature Measurements in
PCE Furnace. Schematic illustration of calcining set-up. Temperature measurements with the
optical pyrometer were made on the magnesite brick.
The optical pyrometer was calibrated against a thermocouple up to 1600°C in the
gas kiln, and the emissivity constant was determined to be 0.90 for magnesite brick at

28
1600°C, see Figure 3.2. The maximum operating temperature of the gas kiln is 1600°C
and it was therefore not possible to calibrate up to 1800°C, but as the results in Figure 3.2
suggest, the change of the emissivity constant is minor at higher temperature ranges, and
0.90 was used up to 1800°C.
3.2.3 P repara tion of O re and Calcining
The raw magnesite ore in the form of lumps (size 15-20 cm), supplied by the
Young and Fifield mines in N.S.W., was crushed to 2-4 cm pieces. In the PCE furnace
the pieces (maximum of 6) were placed in the middle of the furnace, next to the magnesite
brick which was used for temperature measurements with the optical pyrometer.
The heating and cooling rates were controlled manually by adjusting the gas
mixture. Temperature readings were taken every ten minutes while heating and until
stability was reached at the calcining temperature, after which readings were taken every
half hour. The temperature did not deviate more than ±10°C from the calcining
temperature.
The heating rate in the kiln was 5.3°C/min.. After the calcining treatment, the
calcined magnesite was left in the furnace to cool over night. Samples were taken for
microscopic observation and resistivity testing.

29
3.3 RESISTIVITY MEASUREMENTS
The electrical resistivity was measured using the method and sample configuration
developed by Fetterley [26].
The two wire leads for the current measurements were held in position in the
furnace by a holder as described below. Leakage of current between the leads and any
part of the furnace was measured using a MEGGER BM204 Insulation & Continuity
Tester and a set-up was developed which minimized or eliminated these leakages.
Leakage tests were measured at 1000°C and 1000V.
3.3.1 The Furnace
The first furnace used was a wire wound element furnace with a vertical
Pythagorus (silica-alumina) tube. To avoid the possibility of interference of inductive
fields or coil effects on the current measurements this furnace was discarded.
Furthermore, the inner diameter of the tube was too small (Di = 38mm) risking contact
between the sample and the tube wall. It was also found that the electrical resistance of the
Pythagorus material was low under testing conditions (1000V and 1000°C) and allowed
leakage of current via the furnace atmosphere to the Pythagorus tube to earth. Instead, an
existing high temperature tube furnace was modified and used for these experiments
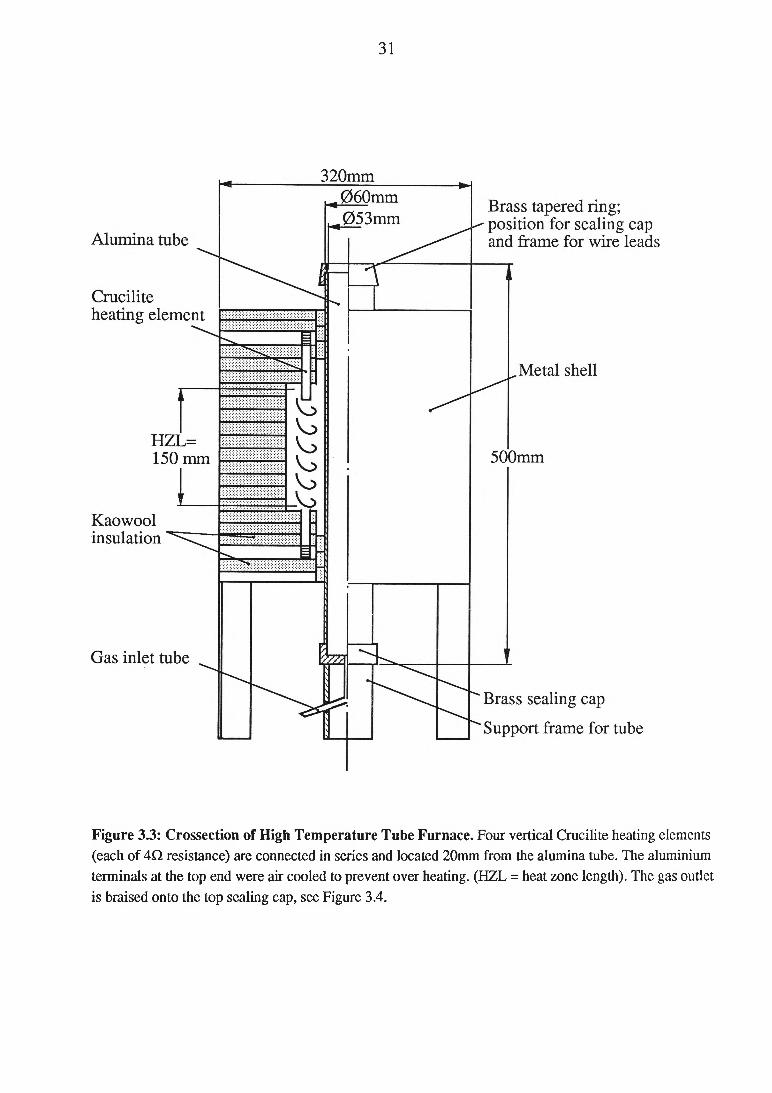
(Figure 3.3). The furnace consisted of a recrystallized alumina tube, L = 500mm and Di =
53mm , mounted vertically and centrally. A steel tube (part of the original furnace) was
removed and also the metal top and bottom casings were removed so that no metal was in
contact with or near the alumina tube. The alumina tube was held in position with rings of
Kaowool board at points above and below the furnace and was supported by a solid
frame under the furnace. Four vertical Crucilite (SiC) heating elements (heat zone length
= 150 mm, 4 Q resistance/element) connected in series were located on the outside of the
tube at a 20mm distance. The space between the elements and the outer shell of the
furnace was filled with insulating Kaowool boards. The terminals of the elements (made
of aluminium) at the top (the hot end) of the furnace were air cooled to prevent over
heating.

30
The temperature profile of the furnace was measured by using two K-type thermocouples;
one fixed which was connected to a WEST MC 30/3D temperature controller (accuracy
±1°C) and the other adjustable and connected to a voltmeter. As the experiments were
conducted in a non-oxidizing atmosphere (refer Section 3.3.3), the temperature profiles
were determined with a constant gas flow. The fixed thermocouple (controlling the
furnace temperature) was located on the outside of the alumina tube. The profile in the
vertical direction was recorded by mounting the adjustable thermocouple at the top and
gradually moving it downwards in the tube. This was done along the middle and along
the side of the tube. The horizontal profile was recorded in a similar manner with the
adjustable thermocouple positioned in the centre of the vertical hot zone and starting at
one side of the tube moving gradually across. The gas flow caused a vertical shift of the
hot zone and a fluctuation of the temperature. During the experiments (refer Section
3.3.5), though, the thermocouple mounted inside the tube was connected to the
temperature controller, which compensated for this fluctuation. The profiles are shown in
Appendix B l.
3.3.2 The Frame for the Wires
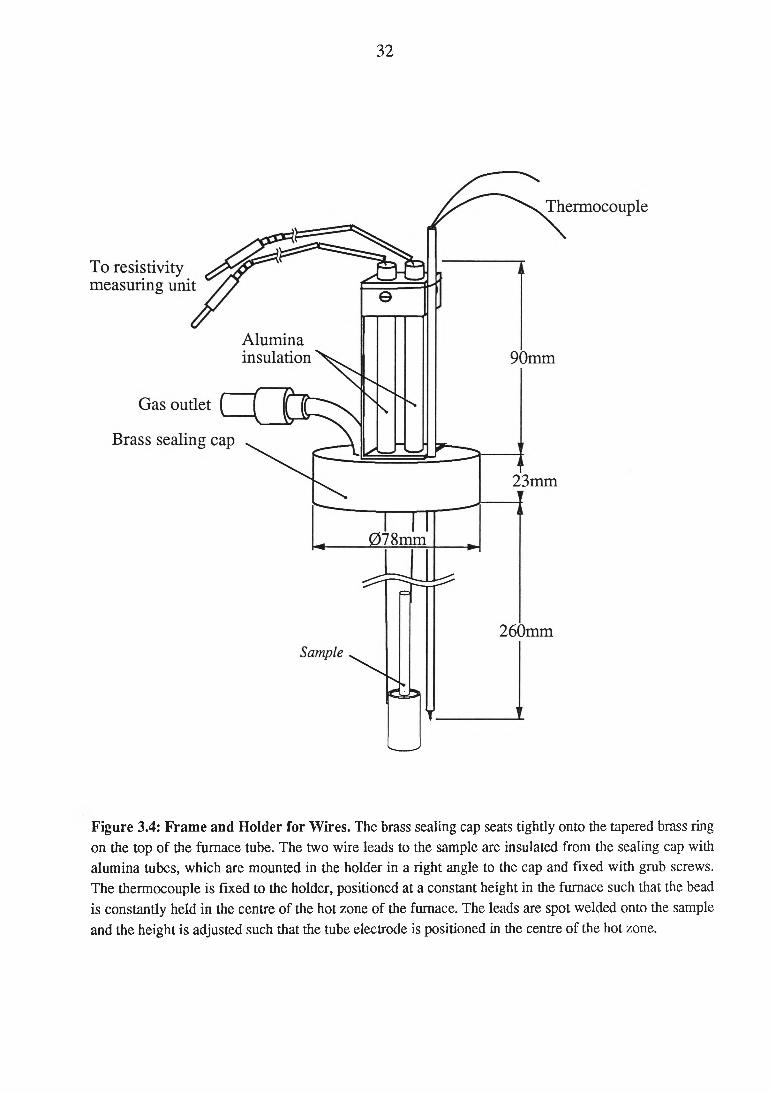
The two wire leads were inserted through the top of the furnace, which consisted
of a tapered brass ring fixed to the tube top onto which the brass sealing cap was tightly
seated (Figure 3.4). The wires were well insulated from the sealing cap with two
recrystallized alumina tubes, L = 100mm and Di = 5mm, which protruded approximately
10mm through the cap into the furnace. Thermocouple sheaths (silica-alumina) were used
initially but broke down electrically at high temperatures (>700°C) and permitted
conduction through the brass sealing cap. The two insulating tubes were positioned into a
frame parallel to and normal to the sealing cap and held by grub screws. The tubes were
sealed with silicon rubber at the top.
31
Figure 3.3: Crossection of High Temperature Tube Furnace. Four vertical Crucilite heating elements (each of 4H resistance) are connected in series and located 20mm from the alumina tube. The aluminium terminals at the top end were air cooled to prevent over heating. (HZL = heat zone length). The gas outlet is braised onto the top sealing cap, see Figure 3.4.
32
Figure 3.4: Frame and Holder for Wires. The brass sealing cap seats tightly onto the tapered brass ring on the top of the furnace tube. The two wire leads to the sample are insulated from the sealing cap with alumina tubes, which are mounted in the holder in a right angle to the cap and fixed with grub screws. The thermocouple is fixed to the holder, positioned at a constant height in the furnace such that the bead is constantly held in the centre of the hot zone of the furnace. The leads are spot welded onto the sample and the height is adjusted such that the tube electrode is positioned in the centre of the hot zone.
33
3t3.3 The Wires and the Furnace Atmosphere
The two wires for current measurements were Kanthal Nikrothal 80 element
wires. The resistance of the wires is 2.76 Q/m and, in comparison with the measured
resistances of the samples, is negligible. The length of the wires inside the furnace were
such that the sample was suspended in the centre of the hot zone. Outside the furnace the
wires were connected to the power supply and were insulated with ceramic beads and
kept well separated to prevent any leakage of current.
The tests by Fetterley [26] were conducted in air at temperatures up to 1000°C. It
was found in these experiments that testing at high temperatures in air caused the metal
cells to oxidize heavily with flaking in extreme cases, as can be seen in photograph a)
Figure 3.5. The contact resistance between the wire and the electrode would change and
increase dramatically in these cases and affect the resistivity reading, not to mention the
possibility of residue flakes falling into the cell and creating incorrect conduction paths.
Furthermore, the atmosphere of the furnace proved to be very important as some
gases became conductive under the test conditions. This was tested by suspending the
wires in the furnace at high temperature and measuring the space resistance between the
electrode wires (i.e. no sample attached to the leads). The resistance was measured using
the MEGGER tester and applying 1000V across the spacing between the leads. Results of
tests in different atmospheres can be seen in Table 3.1.
These tests were made with short lengths (approx. 6cm) of thermocouple
insulation attached to the ends of the leads to serve as weights. The surface area of the
insulation is larger than that of the bare wire and caused a higher conduction than without
the insulation. Nevertheless, as can be seen in Table 3.1, nitrogen and carbon dioxide
were the gases with the lowest conduction.

34
Figure 3.5: Photographs of
samples after heating to 1000°C.
a) In air.
b) In nitrogen.
35
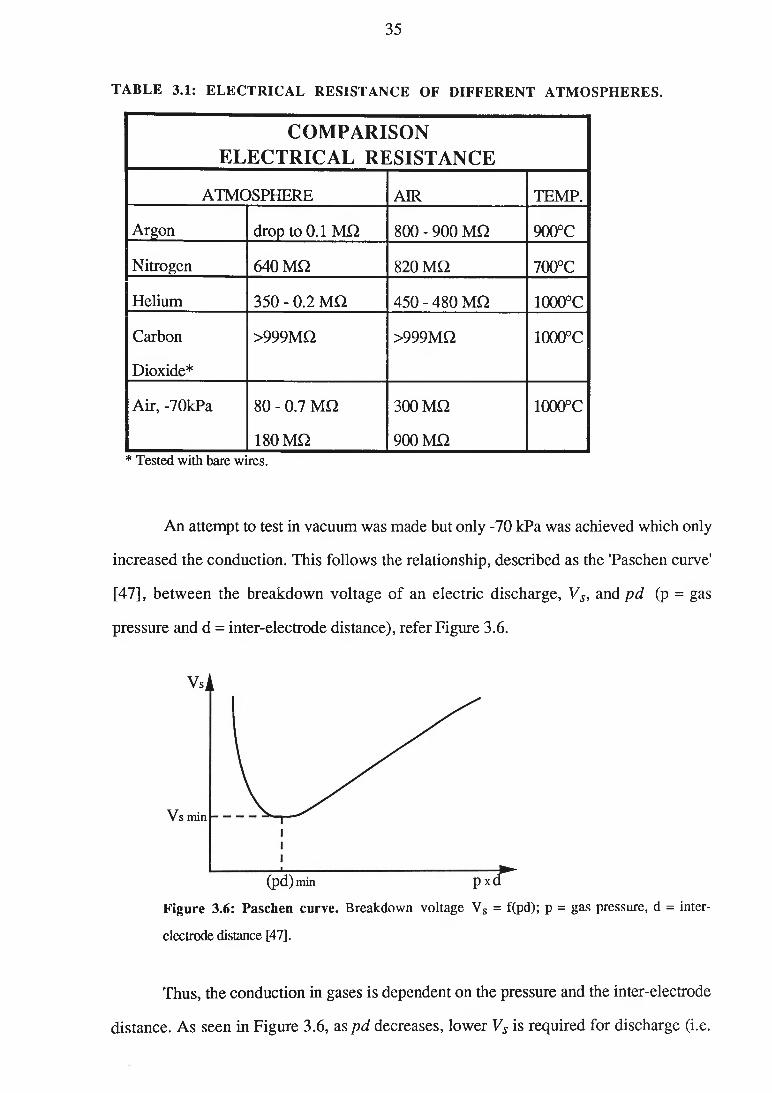
TABLE 3.1: ELECTRICAL RESISTANCE OF DIFFERENT ATMOSPHERES.
COMPARISON ELECTRICAL RESISTANCE
ATMOSPHERE AIR TEMP.
Argon drop to 0.1 MO 800 - 900 M H 900°C
Nitrogen 640 M O 820 M a 700°C
Helium 350 - 0.2 M O 4 5 0 -4 8 0 M O 1000°C
Carbon >999M Q > 999M a 1000°C
Dioxide*
Air, -70kPa 80 - 0.7 M£2 300 M O 1000°C
180 M O 900 M a* Tested with bare wires.
An attempt to test in vacuum was made but only -70 kPa was achieved which only
increased the conduction. This follows the relationship, described as the 'Paschen curve'
[47], between the breakdown voltage of an electric discharge, Vs, and p d (p = gas
pressure and d = inter-electrode distance), refer Figure 3.6.
Figure 3.6: Paschen curve. Breakdown voltage Vs = f(pd); p = gas pressure, d = inter
electrode distance [47].
Thus, the conduction in gases is dependent on the pressure and the inter-electrode
distance. As seen in Figure 3.6, as p d decreases, lower Vs is required for discharge (i.e.

36
conduction easier) until a minimum (pd)min is reached below which higher Vs is required
to initiate a discharge. In the case encountered, sufficient vacuum was not achieved and
as can be seen in Table 3.1, the conduction increased with the lowering of pressure, i.e.
p d > ( p d ) min . To reduce p d below ( p d ) min in order to reduce the conduction, a
significantly higher vacuum would have been necessary, but was not obtainable in this
furnace.
For the experiments in the main programme, nitrogen gas was used and the wires
were kept bare inside the furnace. This set-up gave maximum resistance as indicated on
the MEGGER tester (>999 MQ) measured at 1000°C. A photograph of a sample after
heated to 1000°C in a nitrogen atmosphere can be seen in Figure 3.5b). As can be seen no
flaking has occurred.
The nitrogen gas inlet tube was braised onto the bottom sealing cap of the furnace
and allowed a steady flow of gas through the furnace. The gas outlet was braised onto the
top sealing cap. To this a copper tube could be connected with and immersed
approximately 1 cm creating a positive pressure in the furnace (Figure 3.7). Sufficient
sealing of the furnace was achieved by applying a layer of ceramic adhesive (alumina
cement and waterglass) on the brass-ceramic interface.
Figure 3.7: Schematic Illustration of View of Sample in Position in Furnace.
The sample is suspended such that the tube electrode is positioned in the centre of the hot zone.
The bead of the thermocouple is positioned at the same height as the centre of the tube electrode.

37
3.3.4 Sample Preparation
Powder:
The powders that were tested were either tested as supplied (as in the case of
powders from Steetley, England and Muscle Shoals, USA) or prepared in the laboratory
as follows:
The clinkers (calcined magnesite, size l-3cm) were ground using an alumina
mortar and pestle and sieved to -250pm particle size. No consideration was taken of the
particle size distribution. The particle size distribution determines the flow characteristics,
start-tube packing density and the compaction of the powder. A wide particle size
distribution is required for high start-tube packing density and minimum compaction on
drawing, whereas good flow characteristics are achieved with elimination of fines
(<60|im particle size). Comminution occurs during drawing, which will change the
particle size distribution [48]. As so many factors are contributing, it is therefore difficult
to control the particle size distribution of the final cable. It is believed that the particle size
distribution is important only for physical properties such as paking density and flow
characteristics and has no effect on the electrical resistivity [49].
Free magnetic components were removed from the powder by running a magnet
through the powders. Removing magnetics is a standard procedure for all calcined
magnesite powders before introducing the powder into the cables. Prior to packing in the
cell (see below), all powders were dried overnight in a drying oven at 110°C.
Cells:
The Fetterley Cell configuration, which simulates that of the cable, consists of a
mild steel tube electrode and a mild steel rod electrode with the dimensions shown in
Figure 3.8. A modification to the design by Fetterley [26] was made on the rod electrode
to assist in the centering and stabilizing of the rod while filling the cell with powder.
Also, a plastic sleeve on the tube electrode was used when filling to avoid overflow of
powder. A ram of hardened tool steel, a base plate of key steel and a pressing rig were
utilized to compact the powder in the cells.

38
A new cell was used for each specimen. The dimensions of the cell were
measured prior to the introduction of the powder. The metal electrodes, including the ram
and base were polished with a piece of 600 grade SiC paper and were, with the plastic
piece, rinsed in acetone in an ultra sonic cleaner and dried in warm air.
Packing the Cell:
The procedure of filling and compacting of the powder in the cell is as described
by Fetterley. The filling is made in four steps to simulate the manufacturing process of the
cables. By knowing the dimensions of the cell (inner and outer diameter) and the desired
density, the mass of powder required for each step can easily be calculated: The final
height of the sample should be, according to Fetterley [26], 25.4 ± 0.5 mm (i.e. in each
step 6.35 mm).
m = p V ; V = 7tH (P4°2 ' D ‘2) (3.1)
where p = desired density,
V= volume,
H= height of powder,
D0= outer diameter and
Di= inner diameter of electrodes.
Maximum theoretical packing density is generally accepted as being 3.2 g/cm3. A
packing density, in the final cable, of 2.7g/cm3 (84% of max. packing density) can be
achieved consistently. To achieve 2.7g/cm3 in the Fetterley Cell, the applied load was
adjusted and for calcined magnesites the loads varied between 20 - 60kN. An ENERPAC
10 Tonne hydraulic press was utilized for for the compacting of the powders. The load
required for each sample was determined by trial and error. During the compacting of the
powder a pressing rig or mandrel was used to stabilize the sample.
The step by step procedure was as follows:
a) Weigh the tube and rod electrodes, call this mtr.
b) Place the tube and the rod on the base plate. Place the ram into the empty cell
and measure the height with a height gauge, call this Hq. Remove the ram.

39
c) Step 1: Weigh the first portion of powder (as calculated in Equation 3.1) and
pour it into the cell. Give the cell a few taps to ensure that the powder is evenly
distributed.
d) Place the ram into the cell and press. Measure the height, Hx (x= step 1,2,3,4),
of the ram and calculate the density, p, of the powder:
P = ; V = f (Do2-Di2) (Hx-Ho). (3.2)
Press and measure the height again (the load can be increased if the density is
low). Remove the ram.
e) Repeat c) and d) with two more portions of powder (step 2 and 3).
f) Before pouring in the last portion of powder, place the plastic sleeve on the
tube. Continue as before (step 4). The final height, H4 or Hf, should be 25.4 ± 0.5 mm.
g) After the cell has been filled, the base plate is removed with pliers and the cell
is again weighed, mtrp. The true density is then determined using (mtrp-mtr).
A cross-section of the furnace with the cell in position is shown in Figure 3.7.
The leads to the power supply were spot welded onto the cell. The rod electrode was
connected to the negative pole. The samples were suspended at the same height in the
furnace, locating the sample in the middle of the hot zone. The spot weld sometimes
broke during testing and therefore a wire was tied around each electrode to give the
junction a good mechanical connection as well as electrical.

40
d ‘c4 coi l l
Ram
Rodelectrode
Tubeelectrode
Base plate
c)
Figure 3.8: Fetterley Cell Configuration and Packing Tools, a) The rod and tube electrode are positioned onto the base plate and the powder is poured into the cell. The ram is used for pressing the powder, b) Dimensions of Fetterley cell with powder (base plate removed) c) Pressing rig used to stabilize the cell during pressing. The rig consists of two halves with two locking rings. The ram head transfers the load from the crosshead of the press to the ram.

41
3.3.5 Measurement of Temperature
The temperature was controlled using a K-type thermocouple (Chromel-Alumel)
connected to a WEST MC 30/3D temperature controller. The thermocouple was not
attached to the cell to avoid disturbances from the temperature controller on the current
readings of the sample. The thermocouple was mounted permanently into the top sealing
cap and positioned against the wall of the furnace with the bead at the same height as the
centre of the tube electrode.
3.3.6 Measuring Instruments
The Resistivity Measuring Unit, comprised of a variable high voltage d.c. power
supply with a digital voltmeter and ammeter, was made in the Department of Materials
Engineering, The University of Wollongong. The output voltage is variable within the
range 0 - 1500V. The ranges on the ammeter are 0 - 20.00 |iA, 0 - 200.0 (iA and 0 -
2000 (lA. The selected voltage is applied across the cell and the current through the cell is
measured by the ammeter. The Resistivity Measuring Unit was calibrated regularly by
using standard resistances (error < 1%) and the MEGGER tester.
3.3.7 Reading the Instruments, and the Measurements
All resistivity measurements were made in a nitrogen atmosphere with a constant
gas flow of 960 cm3/min.. Measurements were taken during heating at room temperature,
500°C, 800°C, 1000°C and during cooling at 900°C, 750°C and 500°C. These
temperatures were chosen to follow the procedure of previous testing in the Fetterley cell
made at BICC Research and Engineering Ltd in England [1]. The temperature was held
constant for 40 minutes to ensure stabilization before measuring. This was shown to be
sufficient time for the resistivity to stabilize to a constant value. The test voltage was
500V and the current was measured 1 minute after the voltage was applied. This was
necessary as the current varied with time, initially a large variation but within a minute the
current stabilized to a constant value. A typical current vs time curve can be observed in

42
Figure 3.9. With Ohms law, the resistance can be determined. The specific resistivity, Rs
[Ocm], is [26]:
rs= R 2 7t H f (3.3)
2.303 lo g ~6 n
where R = resistance [Q],
Hf = final height in cell [cm],
r0 and r\ = outer and inner radius of cell [cm].
The reproducibility of the resistivity measurements was assessed by testing four
specimens of the same powder. At 1000°C the average resistivity of a particular sample
(Young Specialty Grade calcined magnesite, 4 specimens) was 2.67E+7 and the standard
deviation was 0.32E+7. Only one specimen could be tested per day which limited the
number of specimens per powder sample, however a minimum of two specimens per
sample were tested.
The resistivity of the specimens during the first heating sequence differed
significantly from the resistivity during cooling. This was believed to be due to
contamination and moisture [1],[25],[31-33]. A test where the sample is re-heated and
cooled showed that the resistivity remained constant after the first heating sequence as can
be seen in Figure 3.10.

RE
SIST
IVIT
Y [
Hem
]
43
Figure 3.10: Resistivity In Fetterley Cell @ 500V. Young Brick Grade, calcined 5
hours at 1600°C. Effect of second cycle.

44
3.4 R E SIST IV IT Y M EASUREM ENTS O F M I CABLE SECTIO N S
The cables were cut to 89mm lengths and the sheaths of the cables were cut and
stripped in the lathe to bare 64mm of the conductor. Due to the difficulty in spot welding
the wire onto the copper, the lead to the conductor (rod electrode) was crimped into the
end of the rod and served as the load bearing connection. The lead to the sheath (tube
electrode) was spot welded, and secured with a wire to give added mechanical strength.
The cable samples were insulated with Young Brick Grade calcined magnesite; the same
material as was tested in the Fetterley Cell. The resistivity measurements of the cable
samples followed the same procedure as outlined for the Fetterley Cell samples. The
maximum temperature at which the resistivity was measured, though, was 900°C. A
higher temperature is not possible as the melting temperature of copper is 1083°C.

45
4. RESULTS AND DISCUSSION
4.1 M IC R O ST R U C T U R A L EX A M IN A TIO N
Section 4.1 incorporates a general characterization of clinkers, powders and cable
cross-sections and also an investigation of the effects of calcining conditions on the
microstructure. For a fundamental understanding of these materials, a comparative study
was made of the calcined magnesites from the Fifield and Young mines with respect to
their microstructures and chemical composition. The effect of different calcining
conditions on the microstructure of Young Brick Grade was studied and related to the
industrially calcined magnesite (i.e. calcined at the mine).
4.1.1 E xam ination of C linkers from the Young and Fifield M ines
The industrial calcining process takes place in two stages: (i) decomposition of
MgCC>3 to MgO and CO2 and (ii) recrystallization. The first stage follows the kinetic
thermal decomposition model of solid/solid reactions. The decomposition will start at the
surface of the solid and move inwards with the thermal profile. Two processes control the
progress of the reaction throughout a solid, the conduction of heat towards the centre and
the diffusion of gas out through the decomposed region.
The calcining of the magnesite from the Fifield and Young mines is performed at
the mine sites and the calcined magnesite is supplied to Heat Containm ent Industries
in the form of clinkers, up to 3-4 cm sized pieces. The various clinkers have different
structures and colours, depending on impurity content. Four different coloured clinkers
of the Fifield material and six of the Young material (Brick Grade) (refer Figure 4.1) were
chosen for a comparative study using the Scanning Electron Microscope (SEM). Of the
calcined magnesite from the Fifield and Young mines, the white clinkers (FI and Y2,
Figure 4.1) are the predominant type, representing approximately 80% of the total
volume. The dark-grey porous clinkers (F4 and Y6) constitute the smallest fraction.

46
Figure 4.1: Clinker samples of Fifield and Young Magnesite. (x0.5).
The microstructure of both the Fifield and Young material display typically
anhedral periclase (MgO) crystals and a boundary phase containing the impurity
compounds. Typical micrographs of the samples F1-F4 and Y1-Y6 can be seen in
Figures 4.2 and 4.3.
The precipitation of magnesioferrite (M gO Fe2 0 3 ) in magnesia crystals has been
investigated by many authors. Depending on the cooling rate and percentage ferric oxide
(Fe2 C>3 ), magnesioferrite may precipitate and form inclusions in the periclase crystals.
These inclusions are described as dark inclusions in the periclase crystals in optical
micrographs. Magnesioferrite under the electron microscope (back scattered electron
image) appears as lighter than the periclase crystals as magnesioferrite has a higher atomic
number than magnesia. As can be seen in the micrographs of F1-F4 and Y1-Y6 (Figures
4.2 and 4.3) no inclusions are visible. If there is any iron in the crystals it must be in
solid solution in the periclase. The EDX spectra do not indicate this however, but as the
content would be very small, the apparatus may not be able to detect this.
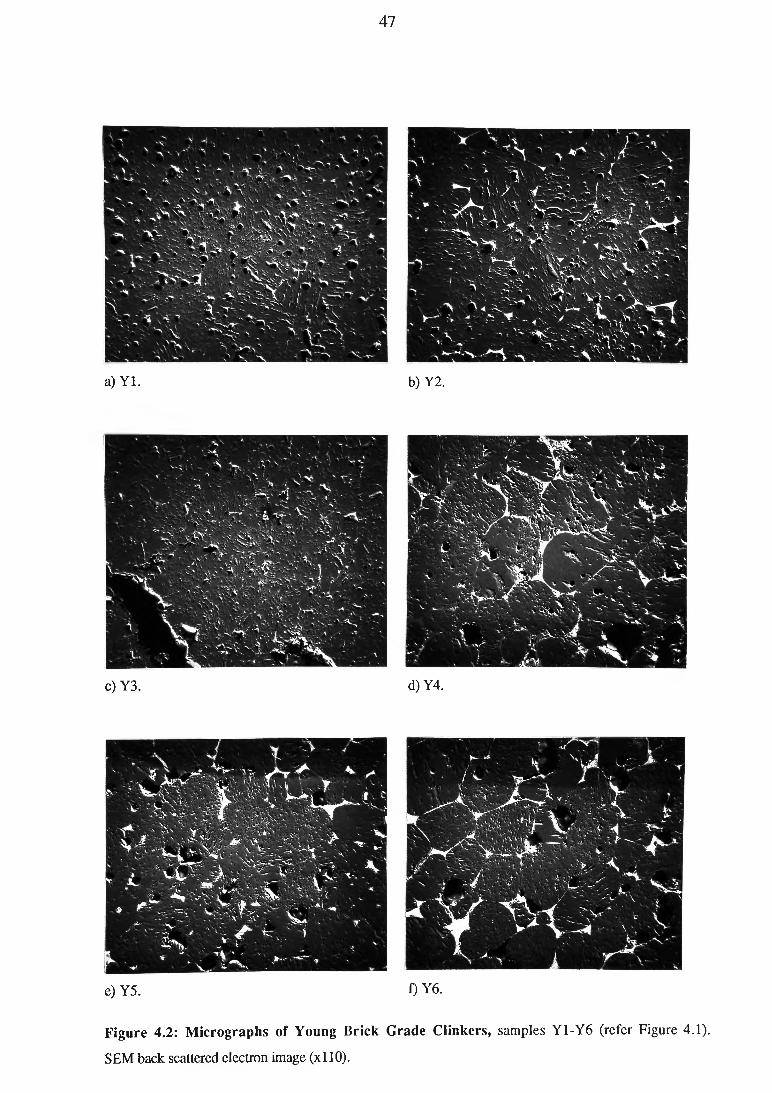
47
a) Yl. b) Y2.
c) Y3. d)Y4.
Figure 4.2: Micrographs of Young Brick Grade Clinkers, samples Y1-Y6 (refer Figure 4.1).
SEM back scattered electron image (xllO).
e) Y5. f) Y6.
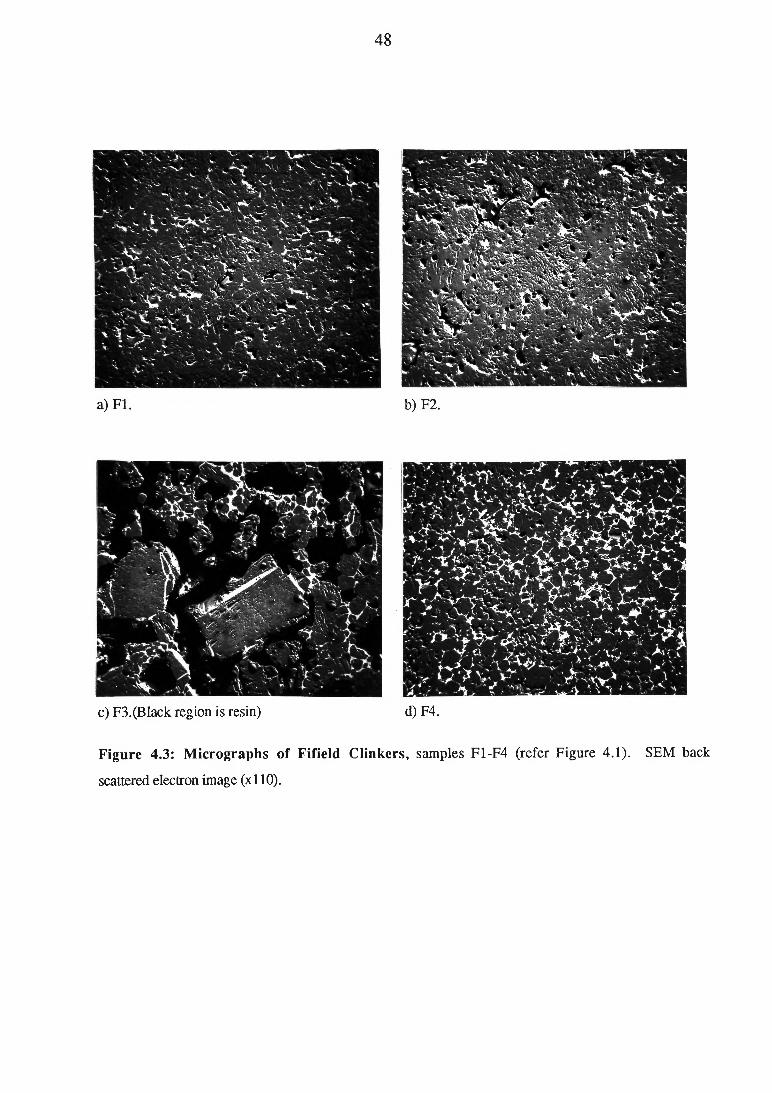
48
c) F3.(Black region is resin) d) F4.
Figure 4.3: Micrographs of Fifield Clinkers, samples F1-F4 (refer Figure 4.1). SEM back
scattered electron image (xllO).
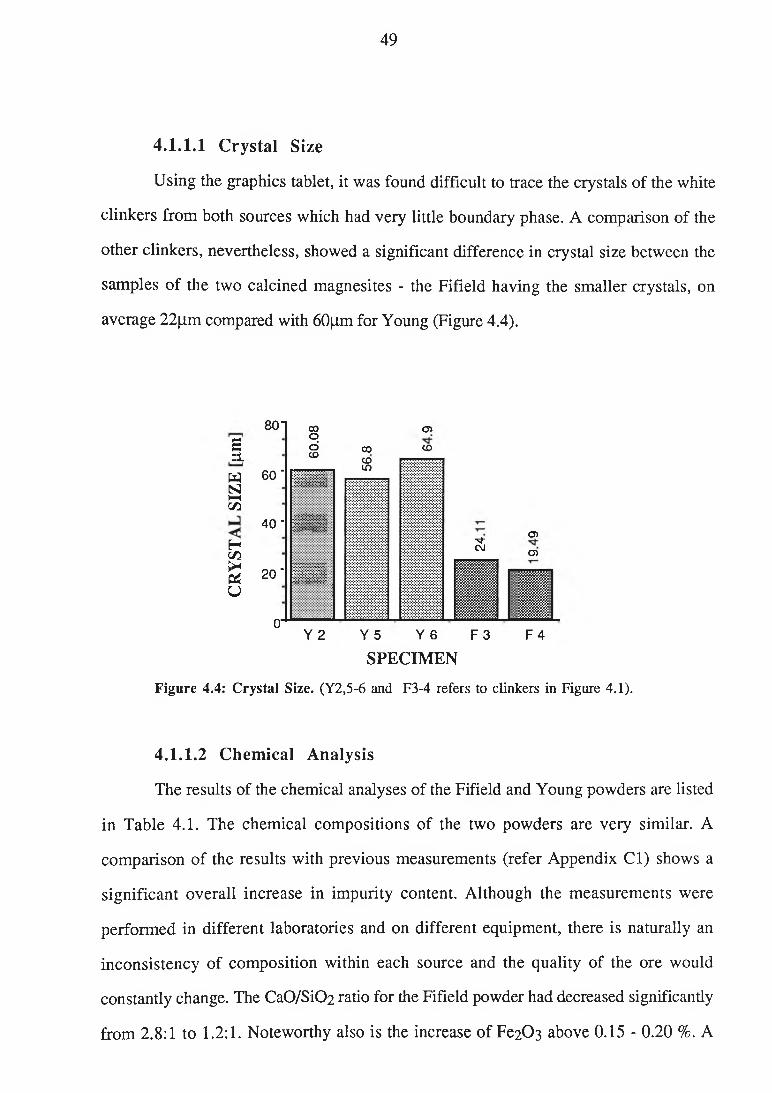
49
4.1.1.1 C ry sta l Size
Using the graphics tablet, it was found difficult to trace the crystals of the white
clinkers from both sources which had very little boundary phase. A comparison of the
other clinkers, nevertheless, showed a significant difference in crystal size between the
samples of the two calcined magnesites - the Fifield having the smaller crystals, on
average 22(im compared with 60jim for Young (Figure 4.4).
£=iWSJHHm
Hin¡hOsiU
801 oooòCD
60" p | | p
40" | l | i
20' ¡ ¡ ¡ ¡ I
or------Y 2
o>00 CO
Y 5 Y 6
■m-CM
F 3
O)CT>
F 4
SPECIM EN
Figure 4.4: Crystal Size. (Y2.5-6 and F3-4 refers to clinkers in Figure 4.1).
4.1.1.2 C hem ical A nalysis
The results of the chemical analyses of the Fifield and Young powders are listed
in Table 4.1. The chemical compositions of the two powders are very similar. A
comparison of the results with previous measurements (refer Appendix C l) shows a
significant overall increase in impurity content. Although the measurements were
performed in different laboratories and on different equipment, there is naturally an
inconsistency of composition within each source and the quality of the ore would
constantly change. The CaO/SiC>2 ratio for the Fifield powder had decreased significantly
from 2.8:1 to 1.2:1. Noteworthy also is the increase of Fe2 0 3 above 0.15 - 0.20 %. A

50
content of Fe2C>3 above this percentage is known to have deleterious effects on the high-
temperature resistivity [ 1 ],[42].
TABLE 4.1: CHEMICAL ANALYSIS OF MAGNESIA SAMPLES, (weight %)
SAMPLE MgO Si02 CaO Fe2C>3 A12C>3 k 2o Na20
Fifield 95.3 1.50 1.80 0.34 0.35 0.005 0.017
Young BG1 96.2 1.00 1.00 0.34 0.50 0.046 0.062
SAMPLE MnO TÌ02 Cr Ni S P V
Fifield 0.04 0.20 0.014 0.026 0.003 0.007 0.002
Young BG1 0.04 0.01 0.190 0.028 0.004 0.010 0.002
4.1.1.3 Analysis using Energy Dispersive X-Ray Spectrometry (EDX)
The composition as reflected in the microstructure in the boundary regions of the
different samples varied and the EDX analyses resulted in a defining of five different
phases, named here as I, II, III, IV and V. These will later be matched to possible
compounds. "Typical" EDX spectrum for each phase are displayed in Figures 4.5 and
4.6, and the EDX spectra for each sample are listed in Appendix C2. Quantitative
measurements of detected elements were computed, which were then recalculated and
converted into percentage oxides. The accuracy of the EDX apparatus is limited,
particularly with light elements, down to approximately 1% (weight). Table 4.2 shows
the listing of the results for all samples.
1 Young Brick Grade

51
The CaO/SiC>2 ratio of calcined magnesite indicates which phases can be expected
(refer Table 2.1). By comparing EDX spectra and taking into account the CaO/SiC>2 ratios
the phases can be identified.
SAMPLE PHASE MgO M 203 Si02 CaO Fe203 CaO/Si02
FI I 39.1 1.56 36.1 23.2 0.6
F2 I 32.9 1.21 36.8 28.9 0.8
Y1 I 30.7 1.22 40.2 27.9 0.7
Y4 I 30.3 1.16 38.7 29.7 0.8
Y2 II 16.6 0.550 36.5 46.6 1.3
Y3 II 28.8 0.961 30.4 39.9 1.3
F3 I 22.3 4.54 37.1 36.0 1.0
F3* HI 13.7 7.00 39.8 36.7 0.9
Y5 IV 1.21 32.6 66.1 2.0
F4 IV 0.562 27.2 72.3 2.6
Y6 IV 0.731 32.4 66.9 2.1
F4 V 8.17 11.0 5.63 59.1 16.1 10.5
Y6 V 5.54 18.4 6.68 61.1 8.24 9.1
* 1.5% no2Values above are values to the 3rd significant figure from computer generated results and do not reflect machine accuracy.
The crystal boundaries of samples F I, F2, Y1 and Y4 (refer Figure 4.1) all
contain the I-phase, which is a composition of mainly Ca, Si and Mg and traces of A1 (as
oxides) as seen in Figure 4.5a). The CaO/SiC>2 ratio for this phase is less than 1.0:1,
which indicates that the mineral is monticellite (CaOMgOSiC>2).
The EDX spectra for the crystal boundary phases in Y2 and Y3 showed the same
elements present as in the I-phase, but the increased amount of Ca (lime) (and reduced

52
percentage of magnesia), see Table 4.2, indicated a new phase, here named II (Figure
4.5b)). The CaO/SiC>2 ratio is 1.3:1 compared to 0.6-0.8 for the I-phase. This mineral is
most likely merwinite (3CaOM gO2Si02).
Sample Y5 showed a boundary of IV-phase (Figure 4.5c)), which consists of the
elements Ca and Si with a small amount of Al. The CaO/Si02 ratio for the IV-phase is
exactly 2.0:1 suggesting the mineral is dicalcium silicate (2CaOSi02).
a) b) c)
Figure 4.5: Typical EDX spectra of phases a) I-phase, b) II-phase and c) IV-
phase.
The boundary of F3 is comprised of two phases, I and III. The composition of
the I-phase is as mentioned above whilst the III-phase is composed mainly of Ca and Si,
with Mg, Al, Fe and Ti (by quantity), as can be seen in Figure 4.6a).
Ca
Al Fe
j £ _ __________
a) b)
Figure 4.6: Typical EDX spectrum of a) III-phase and b) V-phase.
Figure 4.7 shows a micrograph of a crystal boundary where the brighter phase
represents the III-phase and the darker the I-phase. The CaO/Si02 ratio for the III-phase
is less than 1.0:1 (0.9:1), which according to Rigby et al [9] would result in monticellite
or forsterite. Any ferric oxide and alumina present would form spinel (M gO A l2 C)3) or

53
magnesioferrite (M gO Fe2C)3). The EDX spectrum of the IE-phase does not match any of
these minerals, but as can be seen in Figure 4.7, the phase regions are small and the
electron beam may well have penetrated through the phase and detected elements from
phases below. The high percentage of alumina (7.0%) suggests that a spinel may be
present. Also, the traces of Fe could result from magnesioferrite.
Figure 4.7: Micrograph of F3 showing Crystal Boundary with I and Ill-phase.
SEM back scattered electron image (xl600).
F4 and Y6 contain a two-phase boundary as well; this time comprised of IV and
V-phase, the V-phase being a composition of mainly Ca, Fe and A1 but also significant
amounts of Mg and Si were detected as shown in Figure 4.6b). Figure 4.8a) and 4.8b)
show micrographs of the specimens. The CaO/SiC>2 ratio for the V-phase falls in the
range >2.0:1. If the C a0/Si02 ratio exceeds 2.0:1, according to Rigby et al [9], initially
all the lime will react with silica to form dicalcium silicate. Remaining lime will combine
with alumina and ferric oxide to form brownmillerite (4 C aO A l2 0 3 *Fe2 0 3 ). If any lime
remains after these reactions, then tricalcium silicate, various calcium aluminates, calcium
ferrites and spinels may form. In our case in samples F4 and Y6, dicalcium silicate (IV-
phase) was identified by EDX, and following the above preferred order of reactions the
V-phase is most likely brownmillerite. Also, the EDX spectrum for the V-phase aligns
well with brownmillerite.

54
In the case of crystal boundaries with two phases present, the iron-rich phases, IE
or V, tend to be located closest to the periclase crystals; in some cases like a film on the
crystals (as can be seen in the micrographs). Hubble et al [50] studied the microstructures
of commercial periclases and noted an uneven distribution of the different silicates
(forsterite and monticellite) present and also an uneven distribution of magnesia-crystal
sizes within the same sample. It was furthermore shown that the silicates occur not as
uniform films around the magnesia crystals but as concentrations in the spaces between
the crystals. Also, Jackson et al [51] showed that ferric oxide favoured the wetting of the
magnesia crystals. This agrees well with the observations made in this study. The iron-
rich phases may be located closest to the crystals due to the higher solubility in magnesia
of ferric oxide than silicates. Upon cooling the ferric oxide may remain longer in solution
than other compounds and therefore will form the most intimate phase with magnesia.
a) b)
Figure 4.8: Micrographs of Samples a) F4 and b) Y6 with IV and V-phases.
SEM back scattered electron image (x400).
Other impurities were detected in F4, such as K, S, and Cl though not in
significant amounts. Also, the chemical analysis (Table 4.1) of the Fifield powder shows
that the K and S content is less than 0.005 weight %.
The phases detected in the crystal boundaries of the samples were identified from
evidence collected using the SEM and EDX and are summarized in Table 4.3.. The

55
chemical composition of the powders and the microstructural composition of the clinkers
of the Fifield and Young materials are very similar. The chemical analysis and the EDX
study of the boundary phase compositions confirm this. The CaO/SiC>2 ratios for the two
powders are 1.2:1 and 1.0:1 for Fifield and Young respectively. With the uneven
distribution of silicate phases through out calcined magnesites, the mineralogical
composition of two powders with such similar chemical compositions would be expected
to be indistinguishable. The difference in crystal size, though, cannot be disregarded and
this variable may influence the electrical properties.
TABLE 4.3: IDENTIFICATION OF CRYSTAL BOUNDARY PHASES.
P h aseC a O /S i0 2
R atio Com pound
I <1 monticellite (CaOMgOSiC^)
II 1-1.5 merwinite (3CaO M g02Si02)
IV 2-3 dicalcium silicate (2CaOSi02)
V >3 brownmillerite (4CaOAl2C>3*Fe2C>3)
m <1 monticellite and ?
4,1,2 E xam ination of Pow ders and Cable Cross-Sections
Microstructural examination of powders and cable cross-sections was pursued
with the intention to gain a greater understanding of the powder morphology in situ. Light
optical and SEM inspection of these powders revealed limited information only. It would
be possible to do a study on the particle size distribution and alignment in cables (to
compare with size and shape distribution of feed powder), but this would justify a
complete study in its own right.
Micrographs of Young Brick Grade powder are shown in Figure 4.9a). This
sample was taken from the batch of powder prepared for manufacture of cable. The

56
particle shape is elongated, typical of calcined magnesite [52] and as is the experience
with these materials at H eat Containm ent Industries Pty L td [53].
Cross-sections of powder particles and cross-sections of cable containing Young
Brick Grade insulant were studied in the SEM and micrographs are shown Figure 4.9b)
and 4.9c). Noteworthy is the presence of crystal boundary phase in the larger particles.

57
Figure 4.9: M icrographs of
powders.
a) Powder particles of Young Brick Grade.
SEM secondary electron image (x 480).
b) Cross-section of Young Brick Grade
powder particles mounted in resin.
Crystal boundary phases (lighter) arc
visible in the larger particles. SEM back
scattered electron image (xl40).
c) Cross-section of Cable Sample
insulated with Young Brick Grade
powder. Crystal boundary phases (lighter)
are visible in the larger particles. SEM
back scattered electron image (x70).

58
4.1.3 E ffect of Calcining C onditions
The microstructural examination of the clinkers from the Fifield and Young mines
showed a significant difference in crystal size between the two (1:3). Crystal size is a
function of calcining conditions and chemical composition. Previous studies (refer
Section 2.1.1) on the effect of impurities on the crystal growth all indicate that Fe2C>3 has
a large effect on crystal growth, but also TiC>2, SiC>2 and AI2O3 promote crystal growth.
CaO, on the other hand, has little effect or damping effect on crystal growth. The
chemical analyses of the Fifield and Young Brick Grade powders (Section 4.1.1.2)
showed the Fe2C>3 content to be the same. The TiC>2, SiC>2 and the CaO content was
slightly higher in the Fifield material, but the AI2O3 content was lower. These chemical
results do not explain the larger crystals of the Young Brick Grade material. (On the
contrary, judging by the chemical analysis, one would expect the Fifield material to have
the larger crystals!)
As the results of the chemical analysis and the EDX study showed there was no
significant difference in chemical and microstructural (phase) composition, it is clear
th a t the calcining conditions m ust be the m ajo r con tribu ting factor to the
final c rystal size of the calcined m agnesites. It was therefore an aim of this
project to study the effects of calcining conditions on the microstructure of the Young
Brick Grade clinkers as well as electrical resistivity of the powders (Section 4.2.3.2) and,
if possible, to correlate the two. (Note: no Fifield ore was available).
The calcining conditions achieved in the kilns at the mine sites were unknown.
As a starting-point for this study, calcining treatments of lh r at 1600°C, 1700°C and
1800°C were recommended and adopted as 1600°C is presumed to be at the lower end of
the range of the industrial process [52]. A trial and error approach was adopted. The
calcining treatments were conducted with intermediate microstructural studies and
evaluation (micrographs are located at end of Section 4.1.3), and can be divided into three
series with respect to the calcining conditions. The temperature profiles of the calcining
treatments are shown in Figure 4.10.

59
Figure 4.10: Calcining Temperature Profiles, PCE Furnace.
Series I: Fast H eating Rate and Fast Cooling Rate
Four lumps (as supplied from mines, size 15-20cm) of each of the raw ores were
crushed and a piece of each lump was sampled for the calcining treatments. These
treatments were all conducted using the PCE furnace. The heating rate in the PCE furnace
is controlled manually by adjusting the different ratios of air, oxygen and Handi gas. The
temperature was measured with the optical pyrometer every 10 minutes. The heating rate
was 9.8°C/min and, by turning the gas off, the cooling rate was 12.3°C/min (down to
1000°C). Six runs were made:
- Young Brick Grade, Ihour at 1600°, 1700° and 1800°C.
- Young 98% Grade, Ihour at 1600°, 1700° and 1800°C.

60
(Work on the effects of calcining conditions on the Young 98% Grade magnesite
was discontinued due to the progression of the trial and error process on the Young Brick
Grade ore).
The microstructure of these samples did not show well defined crystals nor crystal
boundaries, e.g. as can be seen in Figure 4.11b), compared to that of the Young Brick
Grade calcined at the mine which shows distinct crystal definition (Figure 4.11a)). The
soaking time and/or temperature was obviously not sufficient for the liquid phase to form
in the crystal boundaries. The EDX spectra of these samples showed mainly Mg and a
small Ca peak.
Light optical microscopy studies were performed on all samples after being
polished using suspended y-alumina to introduce a surface relief (e.g. as in Figure
4.11c)). These micrographs showed a structure where the surface relief enhances the
crystal structure and individual crystals are visible.
The crystal size of the samples calcined at 1600°C and 1700°C were difficult to
measure quantitatively (by any visual methods) because of the lack of crystal boundary
definition compared to other samples. An estimation of the crystal sizes, though, would
suggest a crystal size of <5qm for the 1600°C sample. The 1700°C sample displayed a
marginal increase only in crystal size to 5-10jim. The crystals of the 1800°C sample were
comparably well defined, as can be seen in Figure 4.11c), and an increase of the crystal
size to approximately 25jim was determined.
This gives a confirmation that the higher calcining temperature does increase the
crystal size. To achieve a microstructure similar to that of the industrial product, though,
would necessitate an increase in the calcining temperature and/or time. Higher calcining
temperatures than 1800°C become impractical and therefore an increase in calcining time
would be the obvious alternative approach.
Series II: Fast Heating Rate and Slow Cooling Rate
By decreasing the heating and/or cooling rate, the time above 1000°C will increase
and will have a similar effect to as extending the soaking time. One run was made in the

61
PCE furnace to study the effects of a controlled slower cooling rate of 3°C/min down to
1000°C, after which the furnace was turned off. Four pieces from the same four lumps
above were again sampled:
- Young Brick Grade, lhour at 1600°C.
The SEM study of these samples showed limited indication of defined phases in
one of the pieces and, then, only in limited areas of the piece (Figure 4 .lid )). A light
optical micrograph of the same sample can be seen in Figure 4.1 le).
The graphics tablet facility for crystal size measurements was not available, and
therefore comparative study with previous crystal size measurements (Section 4.1.1.1)
would be subjective only. An estimation of the crystal size can be made by using the
intercept method on the micrographs. The crystal size was <5 pm (compared to 20 and
60pm of the Fifield and Young magnesites calcined at the mines). The crystal boundary
phase contained monticellite (CaOMgOSiC>2) as indicated by the EDX.
Series I lia : Slow Heating Rate and Slow Cooling Rate
The second test achieving some improvement from the first calcining test, a third
test was conducted in the PCE furnace with an extended soaking time and slower heating
rate of 4.2°C/min. The cooling rate was 3°C/min. (down to 1000°C). Again, another four
pieces from the same four lumps were sampled.
- Young Brick Grade, 2 hours at 1600°C.
No distinct separate phases in any of the pieces were observed in the SEM. Light
optical micrographs of this sample (Figure 4 .Ilf)) with an introduced surface relief
display crystals ranging 5-10pm in size. The crystal size of the samples had increased
marginally with the longer soaking time (time above 1000°C) compared to the samples
calcined for 1 hour (crystal size of <5pm). Similar EDX patterns to the samples in the
Series I test were recorded.
Final calcining tests were conducted with maximum practicable soaking time.
Long calcining times in the PCE furnace are impracticable as the gas ratios have to be
adjusted manually every 10 minutes. The gas kiln operates automatically and was

62
therefore used for the calcining tests at 1600°C, which is its maximum operating
temperature. However for the 1800°C tests, the PCE furnace had to be used. The heating
rate in the gas kiln is 5.3°C/min..
- Young Brick Grade, 5 hours at 1600°C.
- Young 98% Grade, 5 hours at 1600°C.
No separate phases were found in any of these samples indicating once again an
insufficient heat treatment. However, negligible microstructural change was achieved
with the longer soaking time. No increase in crystal size was measurable as the crystal
size of these samples fell within the same range, 5-10pm, as for the magnesite calcined
for 2 hours. The introduced Young 98% Grade displayed a similar microstructure to the
Young Brick Grade and indicates legitimacy of the Brick Grade results. Figures 4.11g)
and 4.11h) show the microstructures of these samples.
Series IHb: Fast Heating Rate and Fast Cooling Rate - Long
Soaking Time 1800°C
The calcining at 1800°C in the PCE furnace imposed a 11.4 °C/min. heating rate
and a cooling rate of 20°C/min. down to 1400°C.
- Young Brick Grade, 5 hours at 1800°C.
The SEM study of these samples show a microstructure similar to that achieved
industrially at the mine with defined crystals and crystal boundary phases (Figure 4.1 li)).
Light optical micrographs of these samples can be seen in Figures 4.1 lj) and 4.11k). As
can be seen, the crystal boundary phase is practically continuous throughout the
microstructure. EDX patterns of the boundary phase showed the composition of
monticellite. The estimated mean crystal size is 55p.m.
A comparison of x-ray diffraction patterns of Young Brick Grade calcined 5 hours
at 1600°C and at 1800°C show a marginally higher degree of crystallinity (higher long
range order) for the 1800°C sample. This can be measured by comparing the net area (i.e.
intensity of diffracted peaks) under the whole spectrum (60564 counts compared to
64710 counts). The relative intensity, though, of diffracted peaks is governed by, apart

63
from degree of crystallinity, particle size and degree of preferred orientation. Therefore,
the sample preparation as well as material characteristics do have a major influence on the
relative intensity. A sample of Young Brick Grade, which was calcined at the mine was
tested and the net area was 40% greater (93453 counts) than that of the 1800°C sample.
Even though the above mentioned variables cannot be dismissed, the 40% increase
recorded for this sample is indicative of increased degree of crystallinity compared to the
other samples.
This indicates that although an improvement (with respect to the resulting
microstructure) of the calcining treatment was achieved with the higher calcining
temperature, it was still, however, insufficient compared to the industrial process.
C o n c l u d i n g C o m m e n t s o n M i c r o s t r u c t u r a l e x a m i n a t i o n
As previously described (Section 2.1), the calcining process takes place in two
stages, (i) thermal decomposition at temperatures around 700°C and (ii) recrystallization
with subsequent crystal growth. The rate at which this second stage occurs is a function
of chemical composition and temperature. For any particular material it will take longer to
reach a certain crystal size at a lower temperature than it will at a higher temperature. This
was clearly demonstrated in the microstructural examinations.
For Young Brick Grade, at 1600°C an increase in soaking time from 1 hour to 2
hours to finally 5 hours resulted in a doubling of the crystal size - reaching a maximum
crystal size of approximately 10|im only. Whilst at 1800°C, on the other hand, an
increase of soaking time from 1 hour to 5 hours, also doubled the crystal size - but
attained a crystal size of 55fim (mean crystal size).
In terms of degree of crystallinity, a higher degree of crystallinity in a magnesia
would be a direct result of an improved calcination. The material would have larger
crystals with higher long range order, i.e. it would have had more time (or higher
temperature) for diffusion for crystal growth and separation of phases (diffusion of
impurities to crystal boundaries). As the periclase crystals continue to grow, reclaiming

64
MgO from the boundary phase minerals, the boundary phase may reduce to small pockets
as is evident in commercially calcined materials (refer Section 4.1.1.3).
Calcining 5 hours at 1800°C yields crystals approximately 5 times larger than
when calcining 5 hours at 1600°C, but more importantly, resulted in a separation of
phases to well defined crystals and crystal boundary compounds. The microstructural
composition and the crystal size of the Young Brick Grade magnesite calcined 5 hours at
1800°C is comparable to that of the industrially calcined magnesite (average crystal size
60[im), however the degree of crystallinity was significantly lower still for the laboratory
samples, as shown by the XRD results. Also, the crystal boundary phase of the
laboratory calcined material is more or less continuous, whereas it is limited to pockets in
the commercially calcined magnesite (i.e. in the predominant white clinkers).

65
Figure 4.11: M icrographs of
Calcined Magnesites.
a) Example of typical microstructure of
Young Brick Grade, calcined at the mine
site. Microstructure displays distinctly
defined anhedral periclase crystals and
crystal boundaries (discontinuous)
containing monticellite. SEM back
scattered electron image (xl40).
b) Series I: Young Brick Grade calcined
Ihr at 1600°C, fast heating rate and
fast cooling rate. Typical micrograph of
samples in Series I. No defined crystals - - i ’Vi. - , v •
. r* ■ *. ‘ i S p t f ' « f e V V; - \ .nor crystal boundaries are visible. SEM, 'V'‘ v ' ’V ' .'.v V ***«>• >back scattered electron image (xl40). - V,: . ■' .~ v '¿r\% &K.' -v s '
■ < • > > O- - - - v - . i■ - - ^ - . '. 'W -
c) Series I: Young Brick Grade calcined
Ihr at 1800°C, fast heating rate and
fast cooling rate. Sample polished with
suspended gamma-alumina to gain surface
relief effect. Light optical micrograph
(x300).

66
Figure 4.11 continued:
d) S er ie s I I : Young Brick Grade ore
calcined lhr at 1600°C, fast heating
rate and slow cooling rate. This region
shows defined crystals and crystal
boundaries. SEM back scattered electron
image (xl40).
e) Series II: Young Brick Grade ore
calcined lhr at 1600°C, fast heating
rate and slow cooling rate. Sample
polished with suspended gamma-alumina
to gain surface relief effect. This light
optical micrograph is of the same
specimen as d) (x580).
f) Series I l ia : Young Brick Grade ore
calcined 2hr at 1600°C, slow heating
rate and slow cooling rate. Sample
polished with suspended gamma-alumina
to gain surface relief effect. Light optical
micrograph (x580).

67
Figure 4.11 continued:
g) Series IH a : Young Brick Grade ore
calcined 5hr at 1600°C in gas kiln.
Sample polished with suspended gamma-
alumina to gain surface relief effect. Light
optical micrograph (x580).
h) Series IH a: Young 98% Grade ore
calcined 5hr at 1600°C in gas kiln.
Sample polished with suspended gamma-
alumina to gain surface relief effect. Light
optical micrograph (x580).
i) Series I l l b : Young Brick Grade ore
calcined 5hr at 1800°C in PCE
furnace. SEM back scattered electron
image (x280).

68
Figure 4.11 continued:
j) Series I I Ib : Young Brick Grade ore
calcined 5hr at 1800°C in PCE
furnace. Sample polished with suspended
gamma-alumina to gain surface relief
effect Light optical micrograph (xl50).
k) Same as j). (x580).

69
4.2 ELECTRICAL RESISTIVITY
The electrical resistivity was measured using the method and sample configuration
developed by Fetterley [26] (Section 3.3). This method and sample configuration were
chosen so that comparison could be made with previous results of resistivity
measurements on these materials [1],[42],[43]. For all samples, the electrical resistivity
measurements were made at an applied voltage of 500V d.c. - the current being recorded
after a 1 minute settling period. All experimental data of resistivity measurements are
listed in Appendix D l.
4.2.1 Correlation: Resistivity Measurements of Fetterlev Cell and_____MI .CableA correlation between the resistivity measured in the Fetterley Cell and that of the
cable was to be established. Unfortunately, no cables are made to the same dimensions as
those specified by Fetterley (i.e. principally, diameter of conductor and inner diameter of
sheath). Therefore, two different size cables (the smallest and largest single core MI
cables commercially available) were chosen to investigate any variation of resistivity with
Cell geometry. The cables were cut to the same length as the Fetterley Cell and therefore
differed only in cross-sectional geometry. The dimensions of the two cables were as
follows:
SAMPLE Di[mm] D0[mm] r02-ri2[mm2]
! o g J
1H35 6.8 9.4 42.1 0.14
1H70 9.2 12.3 66.6 0.13
Fetterley Cell 6.2 12.7 123 0.31
During manufacture the cables are reduced through a series of drawing processes.
The reduction of 1H35 and 1H70 was determined by the manufacturers to be 82% and
78% respectively [49]. The powder in the Fetterley Cell is compressed to a density of
2.7g/cm3, a final density commonly achieved in MI cables. The resistivity at different

70
temperatures is calculated from measured resistance (current) using Equation (3.3). The
electrical resistivity as measured in disc samples and tube samples (like the Fetterley Cell)
is dependent upon geometrical factors such as insulation thickness and also size and size
proportion of electrode areas.
The resistivity of the cable specimens was measured during cooling from 900°C.
As shown in Figure 4 .12a), there is a significant difference in measured resistivity for the
cable insulation of the two cables although the cables contained the same powder. The
resistivity of the 1H35 cable is higher at all temperatures.
Young Brick Grade powder from the same batch as was used to insulate the
cables was supplied by Pyrotenax A ustralia Pty L td and was tested in the Fetterley
Cell. The results from this test show that the resistivity as measured in the Fetterley Cell
is not in alignment (i.e. differing slope) with the resistivity of the cable samples (Figure
4.12b)). A correlation between the volume of insulation (Area = ^ (r02-ri2), constant
length) and resistance, at high or low temperature, is not apparent in these results. The
results show that a larger volume (irrespective of the size of the electrode areas) is not
equivalent to a higher resistance. Also, the slope of the resistivity curves for the cable
specimens are similar, however, the slope of the Fetterley Cell specimens showed a
steeper gradient. The gradient of the curves is dependent on conduction mechanisms and
activation energies, which are affected by specimen geometry and processing at
manufacture. A slope with a greater gradient shows a higher activation energy. (The
conductivity, a , varies exponentially with temperature, a ~ e_uAT. The activation energy1 1may be determined by plotting the log conductivity, 5 -, vs. ~ ).Ks 1
To gain a better understanding it was decided to, if possible, remove powder from
the cables and test it in the Fetterley Cell. If the resistivity of the cable insulation tested in
the Fetterley Cell then remained the same as when tested in the cable it would be safe to
assume that the resistivity is not dependent on the insulation volume and that the Fetterley
Cell shows good agreement with the "real thing" (i.e. cable). Any discrepancy in the
resistivity of the cables with the two different geometries may then be attributable to the
compaction characteristics derived from the reduction process.
71
Three methods were employed in attempts to remove the powder from the cables:
Firstly by stripping the sheaths using pipe cutters, secondly using grinding wheel and
finally using the milling machine. In each case copper particle contamination resulted
from each stripping technique; the mill giving the least contamination. Although all visible
copper was removed using tweezers under a stereo microscope, experiments yielded poor
resistivity and as can be seen in Figure 4.12c), indicate high impurity level. Other factors
may also contribute to the results. It has been proven that the powder undergoes
comminution during the drawing process. This increases the specific surface area of the
powder (Appendix Cl). Previous results show that an increase in specific surface area
lowers the resistivity slightly, especially at low temperatures (for an increase from 0.6 to
1.2m2/g the resistivity decreases approx. 30% at 700°C) [1]. This could contribute to the
lower measured resistivity of the cable powder at low temperatures, in particular, as the
particle surfaces would influence the conductivity more than at higher temperatures where
bulk conduction predominates.
Nevertheless, the probability of remaining copper contamination could not be
dismissed and hindered any further investigation of the correlation between the resistivity
as measured in the Fetterley Cell and the MI cable. Leaching methods to remove the
copper were considered, but abandoned as the leaching chemicals may well affect the
mineral insulant.
The resistivity as calculated with Equation (3.3) is a function of measured
resistance, size of electrodes and thickness of insulation. It is questionable whether the
resistivity can be comparable for samples with different geometries and configurations,
particularly where giving rise to such unknowns as insulation volume and electrode area
differences (i.e. surface area of rod and tube electrodes). A constant sample configuration
is necessary for comparison of different powders.
4.2.2 Variation of Resistivity with Time
The sample was stabilized (thermally) at the set measuring temperatures after
which a constant d.c. voltage (500V) was applied across the Cell. It was noted that the

72
current varied with time of electrification. This effect was more marked at higher
temperatures (and higher current readings). Figure 4.13 shows current, I, vs. time, t,
curves. For any given sample, the current vs. time curve varied depending upon
temperature. For a few samples, at 1000°C and 900°C, the current increased with time
(after an initial drop), whereas at 750°C and below, the current decreased with time. The
Young Brick Grade (laboratory calcined), in particular, displayed this behaviour. It is
obvious that different conduction mechanisms operate at different temperatures. The
variation of current with time was initially not an aspect of interest in this study, and
during the first resistivity measurements the current vs time relationship was not
recorded. However, for a few samples, data were obtained and are presented here
although a complete study of this "phenomenon" (on all samples) was not pursued.
4.2.3 V aria tion of Resistivity with T em peratu re
The resistivity measurements (recording of current) were made after 1 minute at
an applied voltage of 500V d.c. across the sample at various temperatures in a non
oxidizing atmosphere. The measurements were conducted during cooling from 1000°C.
Indicative measurements were recorded during the heating sequence, however the results
are not presented in the graphs. Contamination and moisture affect the resistivity during
the first heating sequence (refer Section 3.3.7).
4.2.3.1 C alcined Fifield M agnesite
Samples of Fifield magnesia (calcined magnesite, calcined at the mine) were tested
for comparison with previous results from BICC R& EL on the resistivity of Fifield
magnesia (calcined magnesite). Figure 4.14 shows that the Fifield magnesia tested at
BICC R&EL recorded a higher resistivity at 1000°C than the Fifield magnesia tested and
reported in this study. The results from B IC C R & E L are from 1985. The Fifield
magnesia tested here was sampled in 1989. The quality of the magnesia from the Fifield
mine was known to have deteriorated during 1989 (prior to closure of the mine) [49].

73
This is confirmed by the chemical analysis report (Section 4.1.1.2) in which the over-all
impurity content had markedly increased compared to earlier analyses.
4.2.3.2 Effect of Calcining Conditions on the Resistivity of Young
Brick Grade Magnesite
The effects of calcining conditions on the microstructure of laboratory calcined
Young Brick Grade magnesite were studied in Section 4.1.3. Samples were taken from
these calcining treatments and prepared for resistivity measurements.
4.2.3.2.1 Resistivity as a Function of Calcining Temperature
Raw Young Brick Grade ore was calcined 1 hour at 1600°C and 1 hour at
1800°C. Although the microstructures of these clinkers revealed no distinct crystals and
crystal boundary phases (refer Section 4.1.3), the resistivity of the specimens calcined at
1800°C was significantly higher (at 1000°C twice as high and at 500°C ten times) than that
of the specimens calcined at 1600°C, as can be seen in Figure 4.15a). The estimated mean
crystal sizes of these samples as measured on surfaces with the introduced surface relief
were <5|im for the 1600°C sample and 25pm for the 1800°C sample.
This test was repeated with an extended soaking time of 5 hours at 1600°C and 5
hours at 1800°C (refer Figure 4.15b)), the difference in resistivity between the two
calcining temperatures was negligible when compared to the previous test of specimens
with shorter calcining treatments. A break in the slope of the resistivity curve was noted at
low temperatures. The crystal size of these samples were 5-1 Opm for the 1600°C sample
and 55pm for the 1800°C sample. Also, the ore calcined 5 hours at 1800°C displayed a
microstructure where separation of phases had occurred such that the crystals and crystal
boundaries were optically distinguishable. The break in the slope could be a result of the
presence of continuous crystal boundary phases. This would decrease the resistivity of a
magnesia, especially at lower temperatures.

74
4.23.2.2 Resistivity as a Function of Soaking Time
A comparison of the resistivity of samples calcined for 1 hour and 5 hours at
1600 C can be seen in Figure 4.15c). An increase in resistivity was achieved with the
longer soaking time which increased the crystal size from <5(im for the 1 hour treatment
to 5-lOfim for the 5 hour treatment.
An increase in soaking time from 1 hour to 5 hours at 1800°C, on the other hand,
did not markedly increase the resistivity (Figure 4.15d)). On the contrary, the resistivity
at 500°C decreased with the longer soaking time. As mentioned in Section 4.23.2.1, the
microstructure of this sample displays a separation of phases with a continuous crystal
boundary phase of monticellite. Noteworthy is the difference in slope of the resistivity
curve for the 1 hour and 5 hour sample. The slope of the 1 hour sample is similar to that
of the 1600°C samples, whereas the slope of the 5 hour sample has a break at the lower
temperatures.
The resistivity in magnesia materials is dependent on impurity-controlled defects
and oxygen pressure [17][28]. During the calcining process, the magnesite decomposes
and recrystallizes into periclase. The impurities are maintained within the periclase crystal
and diffuse out to the crystal boundary if given sufficient time at temperature. The long
range order of the crystal structure will thus increase with a prolonged calcining
treatment.
Thus, the longer calcining treatment at 1600°C improved the resistivity of the
powder in all probability by reducing the lattice defects and increasing the degree of
crystallinity. This had occurred at 1800°C as well, however the longer soaking time had
furthermore resulted in a more advanced separation of phases, which had an adverse
effect on the electrical resistivity (Figure 4.15b)).
4 .23 .23 Comparison with Calcination at Mine
The resistivity of Young Brick Grade calcined at the mine was compared to the
resistivity of Young Brick Grade calcined under laboratory conditions. As can be seen in
Figure 4.15e) the resistivity of the sample calcined 5 hours at 1600°C lies closer to that of
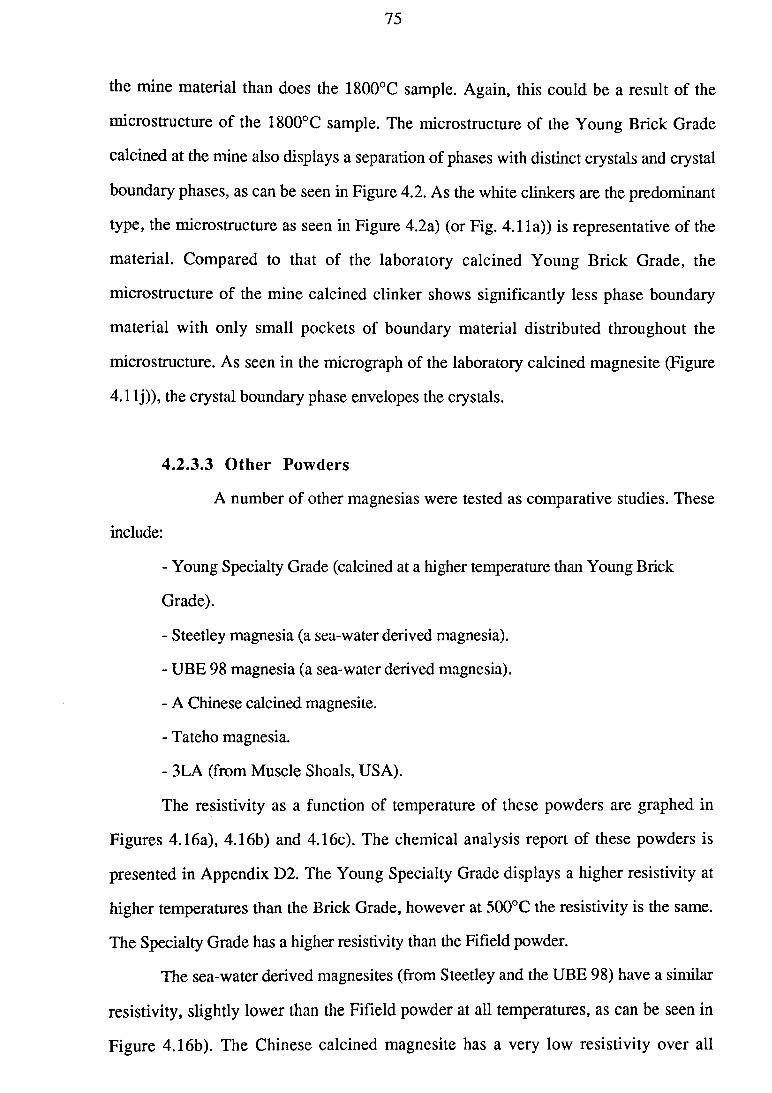
75
the mine material than does the 1800°C sample. Again, this could be a result of the
micro structure of the 1800°C sample. The microstructure of the Young Brick Grade
calcined at the mine also displays a separation of phases with distinct crystals and crystal
boundary phases, as can be seen in Figure 4.2. As the white clinkers are the predominant
type, the microstructure as seen in Figure 4.2a) (or Fig. 4.11a)) is representative of the
material. Compared to that of the laboratory calcined Young Brick Grade, the
microstructure of the mine calcined clinker shows significantly less phase boundary
material with only small pockets of boundary material distributed throughout the
microstructure. As seen in the micrograph of the laboratory calcined magnesite (Figure
4.1 lj)), the crystal boundary phase envelopes the crystals.
4.2.3.3 Other Powders
A number of other magnesias were tested as comparative studies. These
include:
- Young Specialty Grade (calcined at a higher temperature than Young Brick
Grade).
- Steetley magnesia (a sea-water derived magnesia).
- UBE 98 magnesia (a sea-water derived magnesia).
- A Chinese calcined magnesite.
- Tateho magnesia.
- 3LA (from Muscle Shoals, USA).
The resistivity as a function of temperature of these powders are graphed in
Figures 4.16a), 4.16b) and 4.16c). The chemical analysis report of these powders is
presented in Appendix D2. The Young Specialty Grade displays a higher resistivity at
higher temperatures than the Brick Grade, however at 500°C the resistivity is the same.
The Specialty Grade has a higher resistivity than the Fifield powder.
The sea-water derived magnesites (from Steetley and the UBE 98) have a similar
resistivity, slightly lower than the Fifield powder at all temperatures, as can be seen in
Figure 4.16b). The Chinese calcined magnesite has a very low resistivity over all

76
temperatures compared to the other powders. It was found that the Chinese magnesite, as
supplied, contained a high percentage of free magnetics (2%). These were removed prior
to testing, as according to the powder preparation procedure (the results are of the powder
after removal of magnetics), however the powder still displayed a low resistivity.
The slopes of the Tateho and 3LA powders are irregular (Figure 4.16c)), however
the Tateho powder displayed the highest resistivity over all temperatures.
Tests with pure magnesium oxide (polishing grade 0.5fim) were intended,
however the powder proved to be impossible to compress to required density. Attempts
to microwave sinter the powder were made, but no marked improvement on the quality of
the pressing characteristics was gained.

RE
SIST
IVIT
Y [
Qcm
]
77
12
Figure 4.12a). Resistivity of MI Cable Samples (8) 500V. Comparison of two different cable types, 1H35 and 1H70 (with different cross-sectional dimensions). Results of all specimens shown, including average value.

RE
SIST
IVIT
Y [
Qcm
]
78
0 -=
o -
MEASUREMENTS DURING COOLING
— T400 500
1 ---- T— I— 1------ F "600 700 800
TEMPERATURE [°C]
9001 ----- r000 00
0
0
Figure 4.12b). Resistivity in Fetterley Cell @ 500V. Comparison of MI Cable Samples with Fetterley Cell. All specimens contain same powder. Results of all specimens shown, including average value.

RE
SIST
IVIT
Y [;
Qcm
]
79
MEASUREMENTS DURING COOLING
~ 1— i— T— \— T— i— 1— i— 1— r
400 500 600 700 800 900
TEMPERATURE [°C]
n — r000 100
Figure 4.12c). Resistivity in Fetterley Cell @ 500V. Young Brick Grade powder removed from cable 1H35 and tested in Fetterley Cell (1 specimen). Comparison with Young Brick Grade (as supplied from Pyrotenax Pty Ltd) in Fetterley Cell (3 specimens).
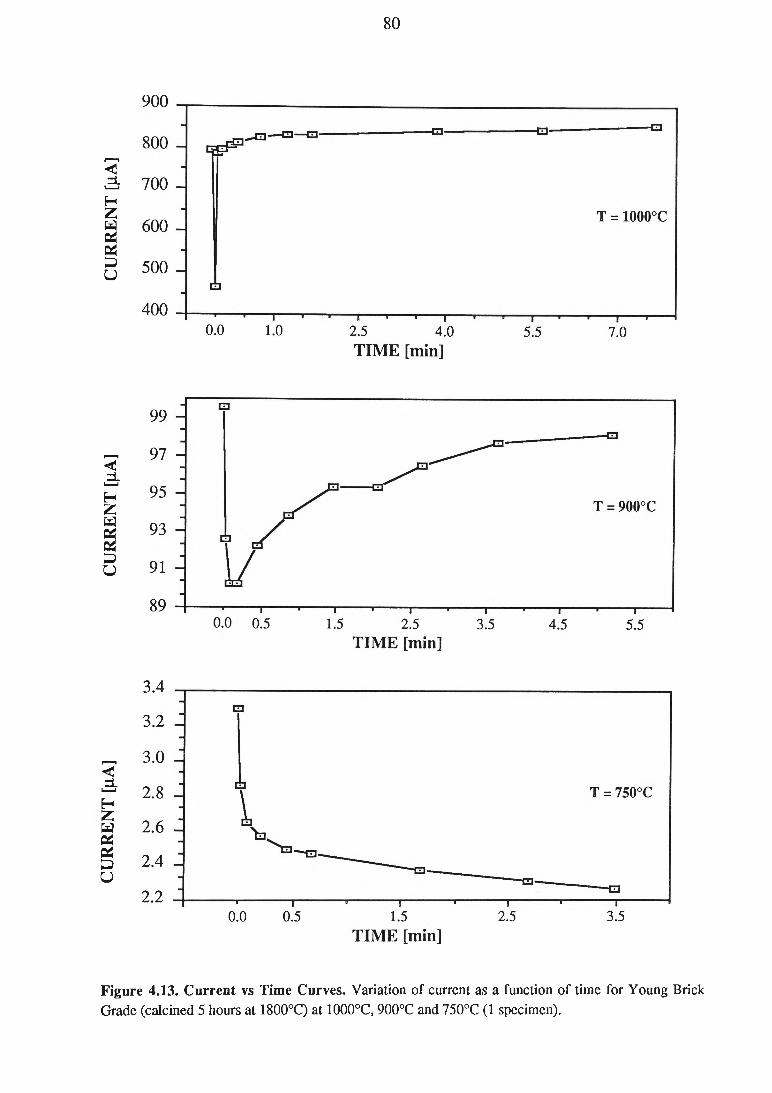
CU
RR
EN
T [
|jA]
CU
RR
EN
T [
jiA]
CU
RR
EN
T [
|lA]
80
Figure 4.13. Current vs Time Curves. Variation of current as a function of time for Young Brick Grade (calcined 5 hours at 1800°C) at 1000°C, 900°C and 750°C (1 specimen).

RE
SIST
IVIT
Y [
Qcm
]
81
MEASUREMENTS DURING COOLING
1 T I 1 1 1 I 1 I 1 I 1 T"400 500 600 700 800 900 1000
TEMPERATURE [°C]
100
Figure 4.14. Resistivity in Fetterley Cell @ 500V. Comparison of results (two specimens) with results from BICC Research & Engineering Ltd.Range bars represent maximum and minimum values.

82
TEMPERATURE [°C]
Figure 4.15a). Resistivity in Fetterley Cell @ 500V. Resistivity as a function of calcining temperature. Comparison of Young Brick Grade ore calcined 1 hour at 1600°C and with Young Brick Grade ore calcined 1 hour at 1800°C (2 specimens respectively).Range bars represent maximum and minimum values.

83
Eoq><HHHè :toHHmHPi
MEASUREMENTS DURING COOLING
11
~~1— T400 500
“ I------1------1------1------1------1------1------ r600 700 800 900 000 1100
TEM PERATURE [°C]
Figure 4.15b). Resistivity in Fetterely Cell @ 500V. Resistivity as a function of calcining temperature. Comparison of Young Brick Grade ore calcined 5 hours at 1600°C (3 specimens) with Young Brick Grade ore calcined 5 hours at 1800°C (3 specimens).Range bars represent experimental scatter (maximum and minimum values).

ga
TEMPERATURE [°C]
Figure 4.15c). Resistivity in Fetterley Cell @ 500V. Resistivity as a function of soaking time. Comparison of Young Brick Grade ore calcined 1 hour at 160Q°C (2 specimens) and Young Brick Grade ore calcined 5 hours at 1600°C (3 specimens).Range bars represent experimental scatter (maximum and minimum values).

85
£a><H
HccHHC/5w
1210
TEM PERATURE [°C]
Figure 4.15d). Resistivty in Fetterley Cell @ 500V as a Function of Soaking Time. Comparison of Young Brick Grade ore calcined 1 hour (2 specimens) and ore calcined 5 hours (3 specimens) at 1800°C.Range bars represent experimental scatter (maximum and minimum values).
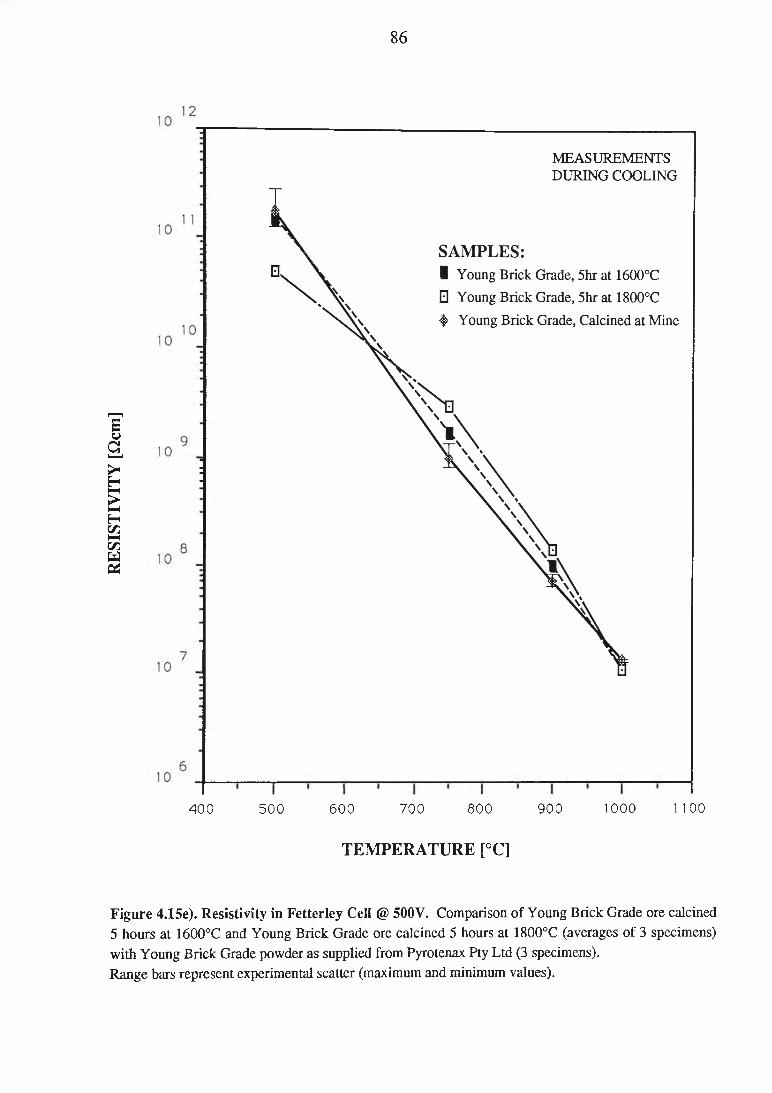
RE
SIST
IVIT
Y [
Qcm
]
86
MEASUREMENTS DURING COOLING
400 500 600 700 800 900 1000 1100
TEM PERATURE [°C]
Figure 4.15e). Resistivity in Fetterley Cell @ 500V. Comparison of Young Brick Grade ore calcined 5 hours at 1600°C and Young Brick Grade ore calcined 5 hours at 1800°C (averages of 3 specimens) with Young Brick Grade powder as supplied from Pyrotenax Pty Ltd (3 specimens).Range bars represent experimental scatter (maximum and minimum values).

RE
SIST
IVIT
Y [
Qcm
]
87
TEMPERATURE [°C]
Figure 4.16a). Resistivity in Fetterley Cell @ 500V. Comparison of other powders with Fifield powder.(Young Brick Grade - 3 specimens, Young Specialty Grade - 4 specimens, Fifield - 2 specimens)

RE
SIST
IVIT
Y [
Qcm
]
88
TEMPERATURE [°C]
Figure 4.16b). Resistivity in Fetterley Cell @ 500V. Comparison of other powders with Fifield powder. (1 specimen of Steetley, Chinese magnesite and UBE98 powders. 2 specimens of Fifield powder).
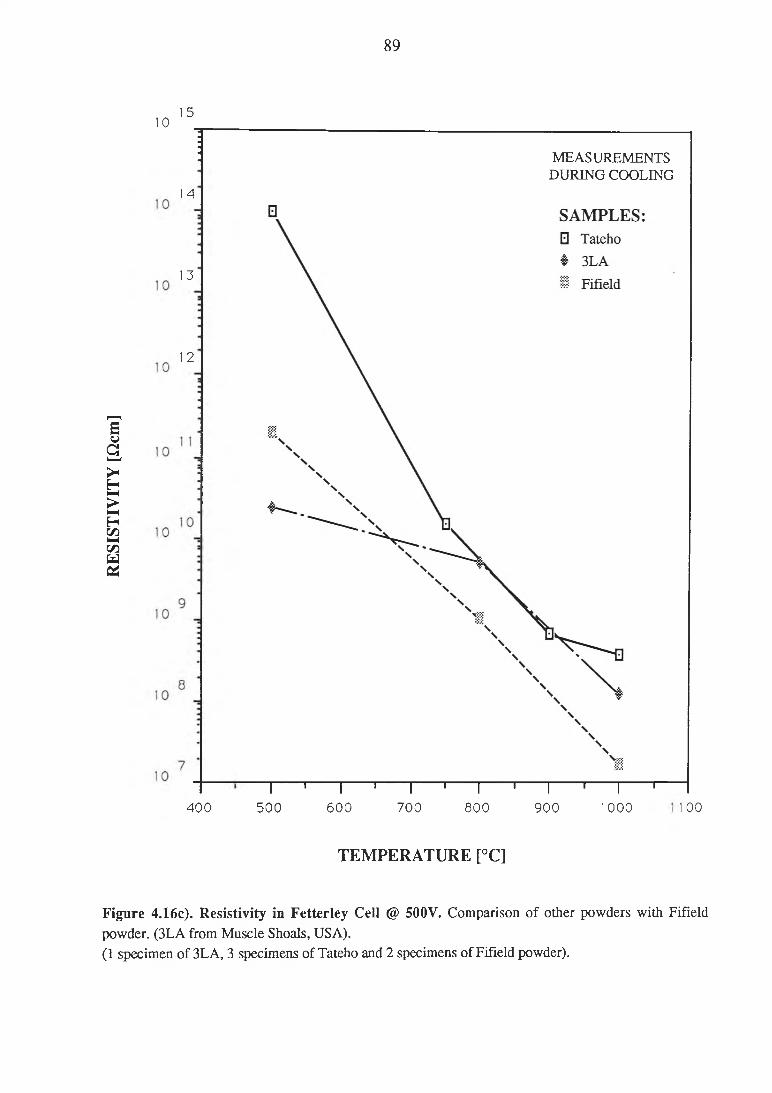
RE
SIST
IVIT
Y [
Clem
]
89
1015
14
13
12
400
MEASUREMENTS DURING COOLING
"1 ------- T------- Ï-------1------- !------- 1------- I------- T-------I------- T-------I------- T500 600 700 800 900 1000
TEM PERATURE [°C]
100
Figure 4.16c). Resistivity in Fetterley Cell @ 500V. Comparison of other powders with Fifield powder. (3LA from Muscle Shoals, USA).(1 specimen of 3LA, 3 specimens of Tateho and 2 specimens of Fifield powder).

90
5, CONCLUDING DISCUSSION
This study not only provides useful information for ongoing industrial processing
but also for future investigations of resistivity of calcined magnesites with respect to their
microstructure.
The study of the effects of calcining conditions on the microstructure and electrical
resistivity was made more complicated by not knowing the industrial calcining conditions
at the mine. A complete investigation, however, of the effects of calcining conditions on
the microstructure only would justify a study in its own right. There is scope for further
investigation of the effects of microstructure with respect to the electrical resistivity of
powders.
The development of equipment and the testing apparatus was a major part of this
study as reports on previous measurements with the Fetterley Cell configuration were
non-specific and supplied little only information on experimental details such as furnace
atmosphere, furnace insulation and electrics.
Following is a summary of the results and a few important comments on the
experimental methods employed with recommendations for future work.
S u m m a r y o f R e s u l t s :
The microstructural examination of the clinkers and the chemical analysis of the
powders of the magnesite from the Fifield and Young mines reveal that they are very
similar in chemical and microstructural composition. The difference in crystal size (3:1) is
most likely a result of the calcining treatment. The higher resistivity (as measured by
Pyrotenax Australia Pty Ltd) of the Fifield material cannot be explained by these results. A
controlled sampling would be necessary to determine the bulk characteristics of these
commercial ores.
Nevertheless, this part of the study provided an essential understanding of
microstructures of these materials and was a sound basis for the investigation of the
effects of calcining conditions on the microstructure and electrical resistivity.

91
The effects of calcining conditions on the electrical resistivity of Young Brick
Grade magnesite was investigated. A microstructure where a phase separation of periclase
and impurity compounds had occurred, similar to that of the industrially calcined Young
Brick Grade, was achieved after calcining the ore for 5 hours at 1800°C. Shorter soaking
times or lower calcining temperatures were not sufficient to allow for migration of
impurities to the crystal boundaries and formation of boundary compounds.
The effect of the longer calcining treatment at 1600°C improved the electrical
resistivity as the recrystallization of the microstructure had progressed and most likely
contained less conductivity enhancing lattice defects.
The resistivity of the Young Brick Grade calcined 5 hours at 1800°C showed no
improvement over the material with a shorter soaking time. The continuous boundary
phase has an adverse effect on the electrical resistivity.
Compared to the industrially calcined Young Brick Grade, although the periclase
crystal-size was approaching that of the industrially calcined material, less direct contact of
periclase crystals was noted in the laboratory calcined magnesite.
During calcining, following decomposition and recrystallization, crystal growth
occurs. The impurities migrate to the crystal boundary and form mineral compounds such
as forsterite (2MgOSiC>2), monticellite (CaOMgOSiC>2) and/or merwinite (3CaO
Mg02SiC>2). As the crystals grow, reclaiming MgO from the boundary phase minerals,
the amount of phase boundary material will decrease to pockets allowing direct contact of
adjacent periclase crystals. Thus the industrially calcined material would appear to have
been subjected to a more advanced calcining treatment and possesses a higher degree of
crystallinity. A schematic graph of the resistivity as a function of the calcining process is
suggested and can be seen in Figure 5.1.
It was proven that the electrical properties are dependent on the microstructure of
the material which is a direct result of the calcining conditions. A powder material with a
microstructure displaying direct contact of adjacent periclase crystals yields higher
resistivity than that of a material with a continuous boundary phase.
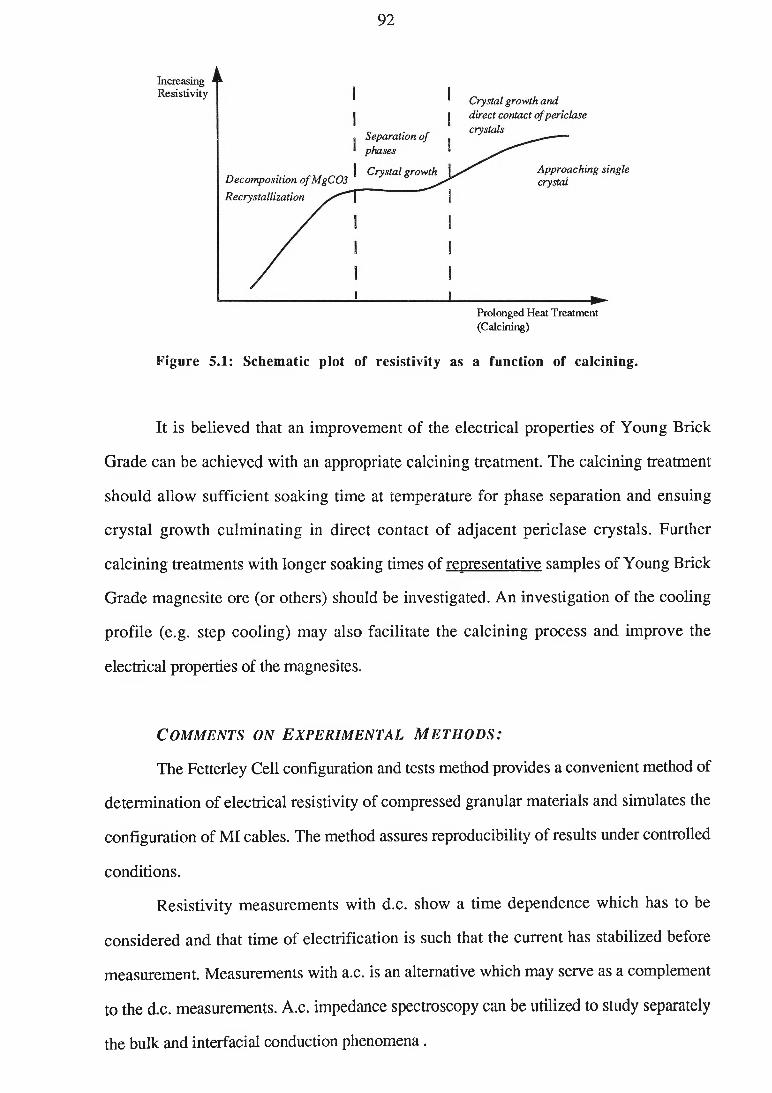
92
Prolonged Heat Treatment (Calcining)
Figure 5.1: Schematic plot of resistivity as a function of calcining.
It is believed that an improvement of the electrical properties of Young Brick
Grade can be achieved with an appropriate calcining treatment. The calcining treatment
should allow sufficient soaking time at temperature for phase separation and ensuing
crystal growth culminating in direct contact of adjacent periclase crystals. Further
calcining treatments with longer soaking times of representative samples of Young Brick
Grade magnesite ore (or others) should be investigated. An investigation of the cooling
profile (e.g. step cooling) may also facilitate the calcining process and improve the
electrical properties of the magnesites.
COMMENTS ON EXPERIMENTAL M ETH O D S :
The Fetterley Cell configuration and tests method provides a convenient method of
determination of electrical resistivity of compressed granular materials and simulates the
configuration of MI cables. The method assures reproducibility of results under controlled
conditions.
Resistivity measurements with d.c. show a time dependence which has to be
considered and that time of electrification is such that the current has stabilized before
measurement. Measurements with a.c. is an alternative which may serve as a complement
to the d.c. measurements. A.c. impedance spectroscopy can be utilized to study separately
the bulk and interfacial conduction phenomena.

93
Sampling is fundamental to the legitimacy of any study and for future work should
be controlled. It is important to sample the raw ore such that the sample is representative
of the industrial kiln feed. During this study, due to limited furnace facilities, larger
sample sizes were not practicable for calcining treatments at temperatures above 1600°C. It
is recommended that the calcining treatments be performed on larger samples which are
appropriately sampled such as to be representative of the ore.

94
ACKNOWLEDGEMENTS
I wish to express my gratitude to my supervisor and mentor Professor Bill
Plumbridge for his guidance and motivation during this project, and also for his ability to
dampen occasionally escalating hedonistic tendencies.
Thanks to co-supervisor Mrs Sharon Nightingale for invaluable discussions and
helpful comments and to Professor Nick Standish for guidance.
The technical input and kind co-operation from Mr Mike Pauline (HCI) and Mr
Graeme Hewish (PTX) is gratefully acknowledged.
Thanks are also due to numerous technical staff at HCI and in the Department, in
particular Mr Bob DeJong for his productive technical support in developing the
experimental apparatus for electrical resistivity measurements.
A special thanks to Mr Jeff Jones for inspiring discussions and especially for his
friendship and continuous encouragement during these years.
Last but not least, thanks to "Eyeballs" for continuous word processing supervision.

95
REFERENCES
1 . LO. Wilson, "Magnesium Oxide as a High-Temperature Insulant", IEEC PROC.,
Vol. 128, Pt.A, No.3, April 1981.
2 . J.H. Chesters, "Refractories, Production and Properties", THE IRON AND
STEEL INSTITUTE, 1973.
3 . E. Ryshkewitch, "Oxide Ceramics. Physical Chemistry and Technology.",
ACADEMIC PRESS INC., New York and London, 1960.
4 . J.H. Canterford, "Magnesia - A Significant Industrial Mineral. A Review of
Processing Options and Uses", MINERAL CHEMISTRY COMMUNICATION
MCC 537, CSIRO, 1984.
5 . R.I. Razouk, R.S Mikhail, "Surface Properties of Magnesium Oxide. II", Phys.
C h e m .y ol. 63, pp. 1050-1053, 1959.
6 . W.R. Eubank, "Calcination Studies of Magnesium Oxides", J. Am. Ceram. Soc.,
Vol. 34, No. 8, 1951.
7 . H. Insley, V. Frechette : "Microscopy of Ceramics and Cements." ACADEMIC
PRESS INC., New York, 1955.
8 . J. Spotts McDowell, R.K. Scott, C. Burton Clark, "The Mineral Composition of
Refractory Materials", The Refrac. J., pp. 438-456, Dec. 1962.
9 . G.R. Rigby, H.M. Richardson, F. Ball, "The Mineralogical Composition of
Magnesite Bricks", Trans. J. Br. Ceram. Soc., Vol. 46, pp. 313, 1947.
1 0 . W.S. Treffner, "Microstructure of Periclase", J. Am. Soc., Vol. 47, No. 8, pp.
401-409, 1967.

96
1 1 . E.B. Colegrave, H.M. Richardson, G.R. Rigby, "The Growth of Periclase
Crystals and its Importance in Basic Refractories", Discussions o f the Faraday
Society, No. 5, 1949.
1 2 . A.U. Daniels, Jr., R.C. Lowrie, Jr., R.L. Gibby, I.B. Cutler, "Observations on
Normal Grain Growth of Magnesia and Calcia", J. Am. Ceram. Soc., Vol. 45, No.
6, 1962.
1 3 . H.J.S. Knek, W.F. Ford, J. White, "The Effect of Additions on the Sintering and
Dead-Burning of Magnesia", Trans. Brit. Ceram. Soc., Vol. 58, No. 1, pp. 1-34,
1959.
1 4 . E.A. Abou-Saif, A.R. El-Dib, "Study of the Crystallization of Magnesium Oxide
Samples Prepared at Different Temperatures", Sprechsaal, Vol. 115, No. 11, 1982.
1 5 . J.W. Nelson, I.B. Cutler, "Effect of Oxide Additions on Sintering of Magnesia", J.
Am. Ceram. Soc., Vol. 41, No. 10, 1958.
1 6 . I.F. Guilliatt, N.H. Brett, "Crystal Growth in Mn-Doped MgO Powders", Chem.
Soc. J. Faraday Trans., Vol. 68, p. 429, 1972.
1 7 . W.D. Kingery, H.K. Bowen, D.R. Uhlmann, "Introduction to Ceramics", JOHN
WILEY & SONS, New York, 1976.
1 8 . R. Morrell, "Handbook of Properties of Technical & Engineering Ceramics, Part 1:
An Introduction for the Engineer and Designer", HER MAJESTY'S
STATIONARY OFFICE, London, 1985.
1 9 . D.W. Richerson, "Modern Ceramic Engineering", MARCEL DEKKER, INC,
New York, 1982.

97
2 0 . D. M. Shakhtin, E.V. Levintovich, T.L. Pivovar, G.G. Eliseeva, "Electrical
Conductivity of Refractory Oxides at High Temperature", Ogneupory, Vol. 1, No.
7, 1965.
2 1 . W.F. Ford, J. White, "The Electrical Properties of Oxide Mixtures as an Index of
Structural and Phase Changes at High Temperatures", Trans. J. Br. Ceram. Soc.,
Vol. 51, pp.1-79.
2 2 . ASTM D 257, Vol. 10.02, 1989.
2 3 . Pyrotenax, Australia Pty. Ltd.
2 4 . A. Goodings, "Some Electrical Phenomena which occur in Magnesia Insulated
Cables", United Kingdom Atomic Energy Authority, AEEW R 205, 1962.
2 5 . A.J. Moulson, P.Popper, "Problems Associated with the Measurement of the
Volume Resistivity of Insulating Ceramics at High Temperature", Proc. Brit.
Ceram. Soc., Vol. 10, pp. 41-50, 1968.
2 6 . G.H. Fetterley, "High-Temperature Resistivity Measurements on Compressed
Granular Refractory Materials", Trans. Electrochem. Soc., Vol. 83, p. 191, 1943.
2 7 . T.J. Lewis, A.J. Wright, "The Electrical Conductivity of Magnesium Oxide at Low
Temperatures", Brit. J. Appl. Phys., Vol. 1, No. 2, 1968.
2 8 . C.M. Osbum, R.W. Vest, "Electrical Properties of Single Crystals, Bicrystals, and
Polycrystals of MgO", J. Am. Ceram. Soc., Vol. 54, No. 9, 1971.
2 9 . V.E.J. Chiochetti, E.C. Henry, "Electrical Conductivity of Some Commercial
Refractories in the Temperature Range 600°C to 1500°C", J. Am. Ceram. Soc.,
Vol. 36, No. 6, 1953.

98
3 0 . R.W. Wallace, E. Ruh, "Electrical Resistivity of Refractories", J. Am. Ceram.
Soc.y Vol. 50, No. 7, pp. 358-364, 1967.
3 1 . F.K. Volynets, G.N. Dronova, L.V. Udalova, "Influence of Lithium Fluoride on
the Electrical Conductivity of Polycrystalline Magnesium Oxide", Inorganic
Materials, Vol. 8,1972.
3 2 . H. Kathrein, F. Freund, "Electrical Conductivity of Magnesium Oxide Single
Crystal Below 1200K", / . Phys. Chem. Solids, Vol. 44, No. 3, pp. 177-186,
1983.
3 3 . J.R. Hensler, E.C. Henry, "Electrical Resistance of Some Refractory Oxides and
Their Mixtures in the Temperature Range 600°C to 1500°C", J. Am. Ceram. Soc.,
Vol. 36, No. 3, 1953.
3 4 . P. Kofstad, "Nonstoichiometry, Diffusion and Electrical Conductivity in Binary
Metal Oxides", WILEY-INTERSCIENCE, 1972.
3 5 . M.O. Davies, "Transport Phenomena in Pure and Doped Magnesium Oxide", J.
Chem. Phys., Vol. 38, No. 9, 1963.
3 6 . D.R. Sempolinski, W.D. Kingery, "Ionic Conductivity and Magnesium Vacancy
Mobility in Magnesium Oxide", J. Am. Ceram. Soc., Vol. 63, No. 11-12, pp. 664
669, 1980.
3 7 . K.W. McMinn, R.A. Mauger, "Electrical Conductivity Mechanisms in Magnesium
Oxide Cable Insulants", IEEC Proc., Vol. 177, pp. 82-85, 1979.
3 8 . R.W. Davidge, "The Distribution of Iron Impurity in Single-Crystal Magnesium
Oxide and some Effects on Mechanical Properties", J. Mats. Sci., Vol. 2, pp. 339
346, 1967.
99
3 9 . D. M. Shakhtin, E.V. Levintovich, T.L. Pivovar, G.G. Eliseeva, "Influence of
Impurity Oxides on the Electrical Resistance of MgO at High Temperature", High
T em pera ture , Vol. 5, No. 1, 1967, A translation of Teplofizika Vysokikh
Temperatur, Vol. 5, No. 3, pp. 510-513, 1967.
4 0 . E. Diepschlag, F. Wulfestieg, "The Electrical Conductivity of Magnesite and some
other Refractory Materials in Relation to the Temperature and their other
Properties", / . Iron & Steel Inst., Vol. 120, No. 2, pp. 297-321, 1929.
4 1 . A. Uehara, E. Kyuno, R. Tsuschiya, "Effect of Some Metal Oxides on the Specific
Resistivities of Magnesium Oxide", Bull. Chem. Soc. Japan, Vol. 43, No. 7,
1970.
4 2 . BICC Research & Engineering Limited Report No. IM/T.32: "High-Temperature
Resistivity of BPTX Magnesia Powders." 22 Nov. 1985.
4 3 . BICC Research & Engineering Limited: "Effect of Calcination Conditions on
Physical and Electrical Properties of Magnesia.", 1987.
4 4 . BICC Research & Engineering Limited Report: Ref. R/AJB/IOW/13: "Specific
Surface Area of Magnesias." 4 Apr. 1985.
4 5 . I.O. Wilson: "Magnesium Oxide as a High-Temperature Insulant in Mineral-
Insulated Cables." IEE Conference on Dielectrics, Sept. 1979.
4 6 . W.D. Kingery, "Property Measurements at High Temperatures", JOHN WILEY &
SONS, INC., New York, 1959.
4 7 . A.von Engel, "Electric Plasmas; Their Nature and Uses", Chapter 7, TAYLOR &
FRANCIS, London, 1983.
4 8 . BICC Research and Engineering Ltd. Report No. CH/T.500: 'Flow and
Compaction of Powders used in MI Cables", April 1977.

100
4 9 . Private communication Mr G. Hewish, Pyrotenax Australia Pty Ltd.
5 0 . D.H. Hubble, N.B. Dodge, "A Study of Commercial Periclases", J. Am. Ceram.
Soc ., Vol. 43, No. 7, 1960.
5 1 . B. Jackson, W.F. Ford, J. White, "The Influence of 0*203 and Fe2Û3 on the
Wetting of Periclase Grains by Liquid Silicate", Trans. Brit. Ceram. Soc., Vol 62,
p. 577, 1963.
5 2 . C. Moorrees, W.G. Mumme, P. Rummel, "SEM Study of Particle Shapes in MgO
Supplied by Pyrotenax Australia Pty Ltd", MINERAL CHEMISTRY
COMMUNICATION MCC 765, CSIRO, 1987.
5 3 . Private communication Mr M. Pauline, Heat Containment Industries Pty Ltd.
ADDITIONAL READING:
a . Allen M. Alper, Editor, "High Temperature Oxides", Refractory Materials, Vol. 5,
Part 1, ACADEMIC PRESS INC., 1970.
b . H.J. Oel, "Crystal Growth in Ceramic Powders", Materials Science Research, Vol.
4, pp. 249-272, PLENUM PRESS, New York, 1969.
c . H.L. Tuller, "Electrical and Optical Properties of MgO and AI2O3: An Overview.",
Advances in Ceramics. Volume 10, Structure and Properties of MgO and AI2O3
Ceramics, THE AMERICAN CERAMIC SOC., INC., Columbus, Ohio, 1984.
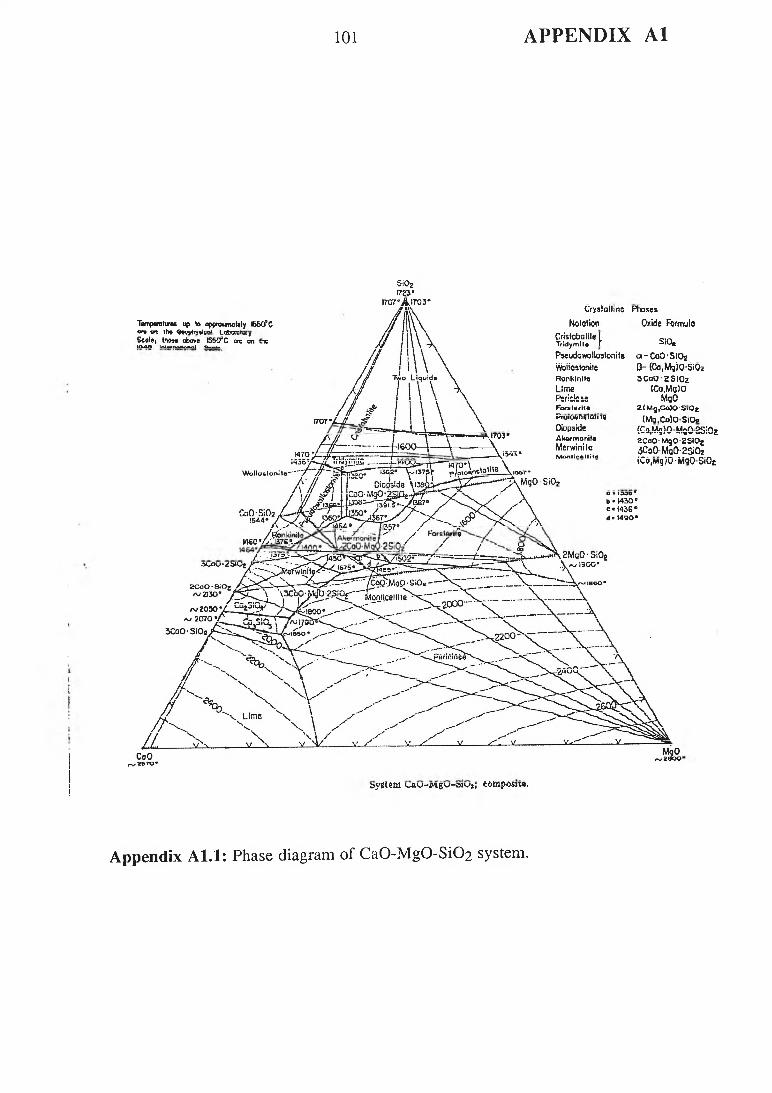
101 APPENDIX A l
5iOz1723*ircrrÄiT03*
Tempamtur« up te opprewmotely 650’CM on lh« ß *o n ^ v jJrnl LCb̂ Stw jSeal«i those above 1550sC ore on the|94f l Intarrvijloonj ftçnja
Crysiailme Phases Nolotion Oxide Formulo
ireJ7VLÌL .¡S”--t =r=—--tM703 •
IÇQ0— \ -----\ -------------- \---- \.iM38
Cris toba lite I Tridymîl« fPseudowollastoniteWoiiostoniieRanhlnileLimePerideîtForsts rit« PrgTQ9ñ«ianT9Dio ps ideAkermaniteMerwinitcM o n f lc f t l l it A
SiO,
a-CoO'SlOg 0 - iCo.MtjjO-SiQz 3 Co0 2 SlOz
(Co.Mg)Om5q2<Mg,CôK>-5>0e
(Ma.Ca)OS(Oe(Co,Mg}QM302SiÛ2ZÇaO- MgO'2SiC>£3Co0 Mo0 -2SiO2 _(Cö.MgiO-MgöSiUt
a = 1300 * b * W 3 0 ' e * I43S • d - 1490*
. . , ___T454* y f!35?“ y *
1460' / É r v i ! ! r _ - / F o / r‘ e / & x \
ôysxêin k -aw -iv igu -a iu j; composite.
Appendix A l.l : Phase diagram of C a0-M g0-Si02 system.

102 APPENDIX A l
2800
2400
2000
1600
1200
i— i— I— I— I— i— I— I— r
Uq.\\\\
\Magnesiowüstite \+ Liquid \\ Magnesioferrite'
\ V Liq.\ \M a g n e s io w ü stite
Magnesioferrite
nesioferrile +Hemat/
Magnesiowüstite +
Mognesioferrite1 i___ I___ I------- 1-------1— l
20 40 MgO- Fe20 3
MgO ^e2®3
System MgO-FejO, in air.
Appendix A1.2: Phase Diagram MgO-Fe2 Û3 system.

TE
MPE
RA
TU
RE
103 APPENDIX B1
APPENDIX B l . l : V ertical T em peratu re Profile of Furnace.
T=1000°C on thermocouple outside Flow rate = 960 cc/min.
Height

104 APPENDIX B1
A PPEN D IX B1.2: H orizontal T em peratu re Profile of Furnace, as measured in centre of vertical hot zone.
Temperature profile with no gas flow:
CF.NTRF, vs SIDE OF FURNACE
Room Temp. = 21°C, Flow Rate = 960 cc/min.
SF.T ON STDE CENTRE
800 °C 793 - 821 °C 785 - 822 °C
1000°C 9 9 2 - 1016 °C 991 - 1022°C

105 APPENDIX Cl
APPENDIX C l: Previous Results [BICC R&EL, Laboratory Report, April 1985].
C l . l Specific Surface Area.
spec. surf, area [m2/g]
magnesia powder cable
YOUNG FIFIELD UK,HMD-4
1.5*0.60.8
1.22.3
* Calcined 1 hour at 1700°C.
C1.2 Chem ical Analysis.
[weight %]
magnesia SÌ02 CaO Fe203 AI2O3
YOUNG Brick Grade
0.2 0.75 0.04 0.1
FIFIELD 0.3 0.84 0.14 0.15
UKH M D -4
0.4 2.2 0.16 0.2
[ppm]
B S Cl Ni V
<10 8 <20 200 <10
<10 2 <10 100 20
200 <2 <10 <10 20

106 APPENDIX C2
APPEND IX C2: EDX spectra of crysta l boundary phases detected in SEM of Young Brick G rade clinkers and Fifield clinkers, samples Y l-6 and F I -4 (refer Figure 4.1).
EDX spectra of a). FI, I-phase. b) F2,1-phase.
c) Y l, I-phase. d) Y4, I-phase.
e) Y3, E-phase. f) Y2, II-phase.

107 APPENDIX C2
g) F3 ,1-phase. h) F3, Dl-phase.
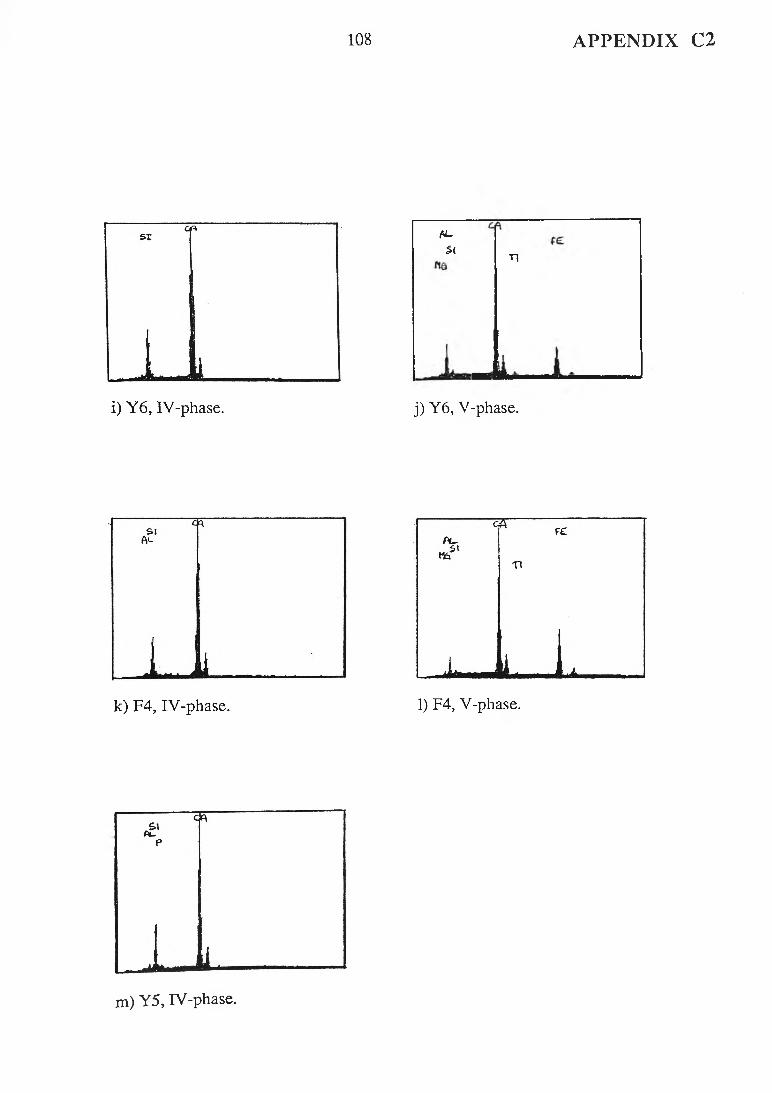
108 APPENDIX C2
fit-21 r \
i) Y6, IV-phase. j) Y6, V-phase.
k) F4, IV-phase. 1) F4, V-phase.
m) Y5, IV-phase.
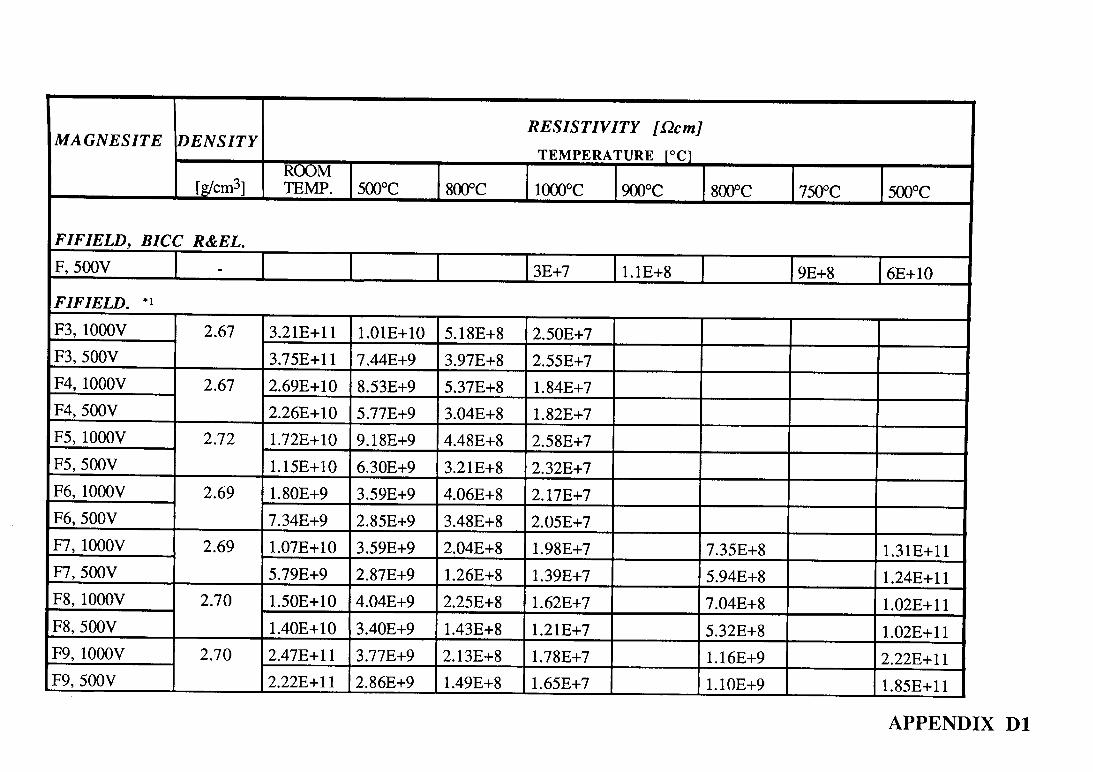
M A G N E SIT E D E N S IT YR E S IS T IV IT Y [Qcm]
TEMPERATURE r°Cl
[g/cm3lROOMTEMP. 500°C 800°C 1000°C 900°C 800°C 750°C 500°C
FIFIELD , BICC R&EL.F, 500V 1 - I3E+7 I 1.1E+8 I I9E+8 I6E+10
FIFIELD. *1
F3, 1000V 2.67 3.21E+11 1.01E+10 5.18E+8 2.50E+7F3, 500V 3.75E+11 7.44E+9 3.97E+8 2.55E+7F4, 1000V 2.67 2.69E+10 8.53E+9 5.37E+8 1.84E+7F4, 500V 2.26E+10 5.77E+9 3.04E+8 1.82E+7F5, 1000V 2.72 1.72E+10 9.18E+9 4.48E+8 2.58E+7F5, 500V 1.15E+10 6.30E+9 3.21E+8 2.32E+7F6, 1000V 2.69 1.80E+9 3.59E+9 4.06E+8 2.17E+7F6, 500V 7.34E+9 2.85E+9 3.48E+8 2.05E+7F7, 1000V 2.69 1.07E+10 3.59E+9 2.04E+8 1.98E+7 7.35E+8 1.31E+11F7, 500V 5.79E+9 2.87E+9 1.26E+8 1.39E+7 5.94E+8 1.24E+11F8, 1000V 2.70 1.50E+10 4.04E+9 2.25E+8 1.62E+7 7.04E+8 1.02E+11F8, 500V 1.40E+10 3.40E+9 1.43E+8 1.21E+7 5.32E+8 1.02E+11F9, 1000V 2.70 2.47E+11 3.77E+9 2.13E+8 1.78E+7 1.16E+9 2.22E+11F9, 500V 2.22E+11 2.86E+9 1.49E+8 1.65E+7 1.10E+9 1.85E+11
APPENDIX DI

MAGNESITE DENSITYRESISTIVITY [Qcm]
TEMPERATURE [°C]
[g/cm3]ROOMTEMP. 500°C 800°C 1000°C 900°C 800°C 750°C 500°C
FIO, 1000V 2.70 2.84E+10 7.56E+9 2.76E+8 1.64E+7 1.20E+9 2.46E+11FIO, 500V 3.08E+10 5.71E+9 1.92E+8 1.59E+7 1.06E+9 2.21E+11
YOUNG SPECIALTY GRADE.YSG1,1000V 2.66 3.23E+11 9.83E+10 1.44E+9 2.46E+6YSG1, 500V 3.77E+11 7.53E+10 1.20E+9 2.28E+6YSG2,1000V 2.68 9.78E+10 1.02E+11 1.62E+9 3.11E+7YSG2, 500V 4.89E+10 8.65E+10 1.22E+9 2.73E+7YSG3,1000V 2.68 1.02E+11 7.46E+10 1.48E+9 3.13E+7YSG3, 500V 2.68 6.22E+10 7.00E+10 1.19E+9 3.05E+7YSG4,1000V 2.70 9.68E+10 4.64E+10 9.13E+8 3.20E+7 1.43E+9 1.86E+11YSG4, 500V 2.17E+9 3.98E+10 8.17E+8 2.46E+7 1.15E+9 1.86E+11YSG5,1000V 2.70 1.36E+10 4.62E+10 1.09E+9 3.17E+7 1.62E+9 1.85E+11YSG5, 500V 7.35E+9 3.96E+10 8.00E+8 2.33E+7 1.17E+9 1.85E+11
STEETLEY, Sea-Water Derived Magnesia.SI, 500V 2.69 1.75E+10 2.73E+9 3.05E+8 1.05E+7 6.15E+8 1.12E+11
APPENDIX DI

MAGNESITE DENSITYRESISTIVITY [Qcm]
TEMPERATURE [°C]
[g/cm3lROOMTEMP. 500°C 800°C 1000°C 900°C 800°C 750°C 500°C
CHINESE MAGNESITE.C l, 500V 2.64 1.44E+9 1.57E+7 9.10E+5 9.10E+5 1.18E+7 8.16E+8
UBE 98y Sea-Water Derived Magnesia.UBE98-1, 500V 2.70 1.17E+9 2.23E+9 1.94E+8 4.46E+6 7.46E+8 1.39E+11
3LA, Muscle Shoals.3LA1, 500V 2.65 6.94E+9 3.83E+10 2.86E+9 1.20E+8 4.83E+9 2.45E+10
TATE HO.T l, 500V 2.69 8.03E+10 - 5.23E+9 9.66E+7 1.45E+9 2.39E+10 >1.13E+12T2, 500V 2.68 3.77E+10 6.69E+9 1.69E+9 7.06E+7 7.06E+8 1.64E+10 >1.13E+12T3, 500V 2.70 6.79E+10 1.28E+10 1.62E+9 6.81E+7 6.67E+8 1.46E+10 >1.13E+12
YOUNG BRICK GRADE, Calcined 1 Hour at 1600°C.YBG116-1,1000V 2.69 5.30E+10 2.51E+9 1.55E+8 4.45E+6 1.60E+8 2.68E+10YBG116-1,500V 3.37E+10 2.08E+9 1.50E+8 4.45E+6 1.75E+8 2.59E+10YBG116-2,1000V 2.69 1.68E+10 3.93E+9 1.86E+8 4.82E+6 2.06E+8 3.56E+10YBG116-2, 500V 1.20E+10 3.32E+9 1.84E+8 5.15E+6 2.28E+8 4.15E+10
APPENDIX D l

MAGNESITE DENSITYRESISTIVITY [Qcm]
TEMPERATURE [°C]
[g/cm3]ROOMTEMP. 500°C 800°C 1000°C 900°C 800°C 750°C 500°C
YOUNG BRICK GRADE, Calcined I Hour at 1800°C.YBG118-1,1000V 2.70 2.93E+9 2.97E+10 1.14E+9 1.36E+7 3.54E+9 2.03E+11
YBG118-1,500V 2.02E+9 2.72E+10 9.65E+8 9.97E+6 3.37E+9 2.23E+11
YBG118-2,1000V 2.11 1.75E+9 3.00E+10 1.28E+9 1.20E+7 2.91E+9 1.71E+11YBG118-2,500V 8.68E+8 2.92E+10 1.10E+9 9.74E+6 2.72E+9 1.85E+11
YOUNG BRICK GRADE, Calcined 5 Hours at 1600°C.YBG516-1,1000V 2.70 - 6.81E+9 9.94E+8 OR 8.38E+7 1.08E+9 1.24E+11
YBG516-1,500V - 6.73E+9 9.53E+8 9.16E+6 9.52E+7 1.14E+9 1.40E+11
YBG516-2,1000V 2.69 1.12E+12 1.20E+10 1.02E+9 OR 8.64E+7 1.19E+9 1.18E+11
YBG516-2,500V 1.12E+12 1.21E+10 9.52E+8 1.26E+7 9.38E+7 1.24E+9 1.25E+11
YBG516-3J000V*2 2.70 - 1.16E+10 8.13E+8 1.16E+7 1.20E+8 3.23E+9 2.49E+11
YBG516-3,500V*2 3.74E+11 1.16E+10 7.50E+8 1.25E+7 1.24E+8 2.96E+9 2.24E+11
YBG516-4,1000V 2.70 7.01E+10 1.44E+10 9.46E+8 OR 9.22E+7 1.28E+9 1.24E+11
YBG516-4,500V 6.23E+10 1.42E+10 8.88E+8 9.42E+6 9.80E+7 1.34E+9 1.24E+111.06E+7
1.07E+87.37E+8
1.65E+9 1.87E+11
APPENDIX DI

MAGNESITE DENSITYRESISTIVITY [Qcm]
TEMPERATURE [°C1
[g/cm3]ROOMTEMP. 500°C 800°C 1000°C 900°C 800°C 750°C 500°C
YOUNG BRICK GRADE, Calcined 5 Hours at 1800°C.YBG518-1,1000V 2.71 7.33E+9 1.71E+11 2.11E+9 2.08E+11 2.06E+9 7.96E+10YBG518-1,500V 4.25E+9 1.86E+11 1.90E+9 2.15E+7 1.74E+9 1.11E+11YBG518-2,1000V 2.69 3.21E+11 4.51E+9 2.41E+8 OR 1.34E+8 4.38E+9 7.25E+10YBG518-2,500V 3.75E+11 4.61E+9 1.54E+8 9.47E+6 1.27E+8 3.60E+9 7.03E+10YBG518-3,1000V 2.69 1.26E+10 6.16E+9 2.56E+8 OR 1.17E+8 3.21E+9 4.78E+10YBG518-3, 500V 7.20E+9 6.01E+9 2.00E+8 9.64E+6 1.20E+8 2.35E+9 4.88E+10YBG518-4,1000V 2.70 1.47E+10 6.95E+9 3.63E+8 1.37E+7 1.78E+8 - 3.20E+10YBG518-4,500V 1.08E+10 6.82E+9 2.84E+8 1.33E+7 1.82E+8 2.81E+9 3.39E+10YBG518-5J000V*2 2.70 1.50E+7 1.49E+10 5.55E+8 3.51E+7 2.77E+8 3.35E+9 4.30E+10YBG518-5, 500V*2 1.49E+7 1.47E+10 4.44E+8 3.33E+7 2.98E+8 3.00E+9 5.09E+10
YOUNG BRICK GRADE, Calcined at Mine (Supplied by Pyrotenax). *3YBGC-l, 1000V 2.70 1.12E+12 8.02E+10 8.38E+8 1.99E+7 1.34E+8 1.57E+9 2.50E+11YBGC-1, 500V 5.62E+11 7.02E+10 7.32E+8 1.37E+7 8.36E+7 1.35E+9 2.81E+11YBGC-3,1000V 2.69 - 3.20E+10 3.67E+8 1.87E+7 1.01E+8 1.10E+9YBGC-3,500V 5.61E+11 2.95E+10 3.08E+8 1.29E+7 6.30E+7 8.27E+8 1.25E+11
APPENDIX DI
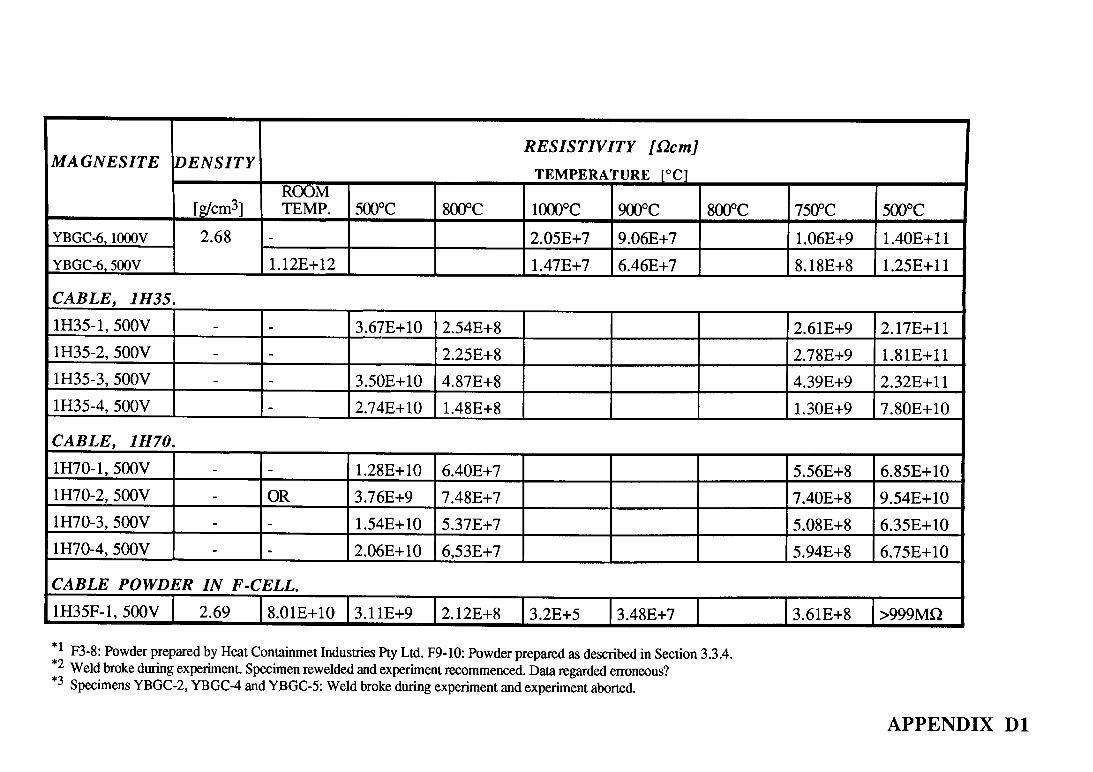
MAGNESITE DENSITYRESISTIVITY [Qcm]
TEMPERATURE [°C]
[g/cm3]ROOMTEMP. 500°C 800°C 1000°C 900°C 800°C 750°C 500°C
YBGC-6,1000V 2.68 - 2.05E+7 9.06E+7 1.06E+9 1.40E+11
YBGC-6, 500V 1.12E+12 1.47E+7 6.46E+7 8.18E+8 1.25E+11
CABLE, 1H35.1H35-1, 500V - - 3.67E+10 2.54E+8 2.61E+9 2.17E+111H35-2, 500V - - 2.25E+8 2.78E+9 1.81E+111H35-3, 500V - - 3.50E+10 4.87E+8 4.39E+9 2.32E+111H35-4, 500V - 2.74E+10 1.48E+8 1.30E+9 7.80E+10
CABLE, 1H70.1H70-1, 500V - - 1.28E+10 6.40E+7 5.56E+8 6.85E+101H70-2, 500V - OR 3.76E+9 7.48E+7 7.40E+8 9.54E+101H70-3, 500V - - 1.54E+10 5.37E+7 5.08E+8 6.35E+101H70-4, 500V - - 2.06E+10 6.53E+7 5.94E+8 6.75E+10
CABLE POWDER IN E-CELL.1H35F-1, 500V 2.69 8.01E+10 3.11E+9 2.12E+8 3.2E+5 3.48E+7 13.61E+8 >999MQ
* F3-8: Powder prepared by Heat Containmet Industries Pty Ltd. F9-10: Powder prepared as described in Section 3.3.4. * 2 Weld broke during experiment. Specimen rewelded and experiment recommenced. Data regarded erroneous?* 3 Specimens YBGC-2, YBGC-4 and YBGC-5: Weld broke during experiment and experiment aborted.
APPENDIX D1
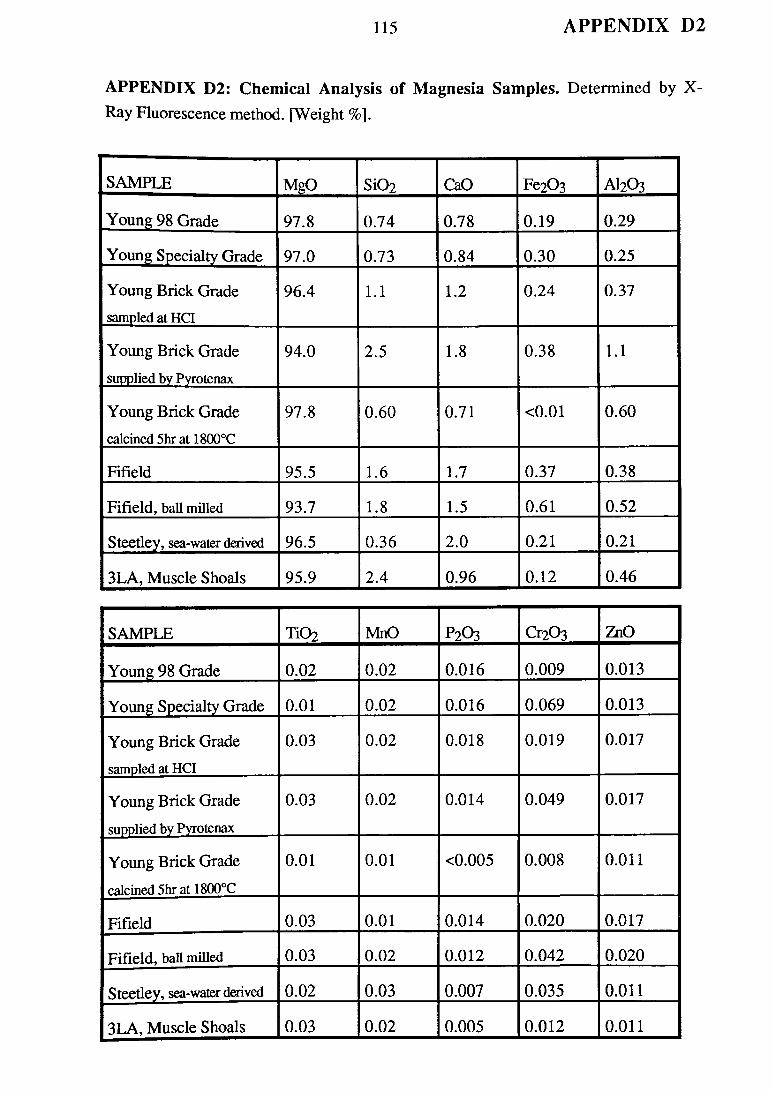
115 APPENDIX D2
APPENDIX D2: Chemical Analysis of M agnesia Samples. Determined by X- Ray Fluorescence method. [Weight %].
SAMPLE MgO Si02 CaO Fe203 A12C>3
Young 98 Grade 97.8 0.74 0.78 0.19 0.29
Young Specialty Grade 97.0 0.73 0.84 0.30 0.25
Young Brick Grade
sampled at HCI
96.4 1.1 1.2 0.24 0.37
Young Brick Grade
supplied by Pyrotenax
94.0 2.5 1.8 0.38 1.1
Young Brick Grade
calcined 5hr at 1800°C
97.8 0.60 0.71 <0.01 0.60
Fifield 95.5 1.6 1.7 0.37 0.38
Fifield, ball milled 93.7 1.8 1.5 0.61 0.52
Steedey, sea-water derived 96.5 0.36 2.0 0.21 0.21
3LA, Muscle Shoals 95.9 2.4 0.96 0.12 0.46
SAMPLE TiC>2 MnO P2O3 Cr2C>3 ZnO
Young 98 Grade 0.02 0.02 0.016 0.009 0.013
Young Specialty Grade 0.01 0.02 0.016 0.069 0.013
Young Brick Grade
sampled at HCI
0.03 0.02 0.018 0.019 0.017
Young Brick Grade
supplied by Pyrotenax
0.03 0.02 0.014 0.049 0.017
Young Brick Grade
calcined 5hr at 1800°C
0.01 0.01 <0.005 0.008 0.011
Fifield 0.03 0.01 0.014 0.020 0.017
Fifield, ball milled 0.03 0.02 0.012 0.042 0.020
Steetley, sea-water derived 0.02 0.03 0.007 0.035 0.011
3LA, Muscle Shoals 0.03 0.02 0.005 0.012 0.011