Urban archaeological investigations using surface 3D Ground Penetrating Radar and Electrical...
13
Urban archaeological investigations using surface 3D Ground Penetrating Radar and Electrical Resistivity Tomography methods Nikos Papadopoulos 1 Apostolos Sarris 2 Myeong-Jong Yi 1,3 Jung-Ho Kim 1 1 Korea Institute of Geoscience and Mineral Resources (KIGAM), Mineral Resources Research Division, Exploration Geophysics and Mining Engineering Department, 92 Gwahang-no, Yuseong-gu, Daejeon 305-350, South Korea. 2 Laboratory of Geophysical-Satellite Remote Sensing & Archaeo-environment, Institute for Mediterranean Studies, Foundation of Research and Technology-Hellas, P.O. Box 119, Rethymnon, 74100 Crete, Greece. 3 Corresponding author. Email: [email protected] Abstract. Ongoing and extensive urbanisation, which is frequently accompanied with careless construction works, may threaten important archaeological structures that are still buried in the urban areas. Ground Penetrating Radar (GPR) and Electrical Resistivity Tomography (ERT) methods are most promising alternatives for resolving buried archaeological structures in urban territories. In this work, three case studies are presented, each of which involves an integrated geophysical survey employing the surface three-dimensional (3D) ERT and GPR techniques, in order to archaeologically characterise the investigated areas. The test field sites are located at the historical centres of two of the most populated cities of the island of Crete, in Greece. The ERT and GPR data were collected along a dense network of parallel profiles. The subsurface resistivity structure was reconstructed by processing the apparent resistivity data with a 3D inversion algorithm. The GPR sections were processed with a systematic way, applying specific filters to the data in order to enhance their information content. Finally, horizontal depth slices representing the 3D variation of the physical properties were created. The GPR and ERT images significantly contributed in reconstructing the complex subsurface properties in these urban areas. Strong GPR reflections and high- resistivity anomalies were correlated with possible archaeological structures. Subsequent excavations in specific places at both sites verified the geophysical results. The specific case studies demonstrated the applicability of ERT and GPR techniques during the design and construction stages of urban infrastructure works, indicating areas of archaeological significance and guiding archaeological excavations before construction work. Key words: archaeological investigation, ground penetrating radar, 3D resistivity tomography, urban areas. Introduction Ongoing large-scale urbanisation is a feature of developing countries, but it offers a major social problem for developed nations as well. Many urban areas have a long historical background which characterises them, and has accompanied them from ancient to modern times. Visible evidence of this rich historical and archaeological background lies in the large number of archaeological monuments that can be observed in these urban centres. Apart from all these visible monuments, an even larger number of possible archaeological structures are still buried in the urban subsurface, and these, unfortunately, may be threatened by careless design and construction of modern infrastructure works. Nowadays, geophysical methods are well established techniques for approaching and successfully solving hydrogeological, geological, archaeological, and environmental problems (Dahlin and Owen, 1998; Atzemoglou et al., 2003; Ramirez et al., 1996). Furthermore, such techniques can significantly contribute to understanding the complex changes in the physical environment in urbanised regions. For the above reasons, the relatively new study field called ‘urban geophysics’ has emerged, focusing on the geophysical exploration of cities in order to investigate and characterise the subsurface properties of urbanised environments, and to provide effective solutions to specific problems. In this work, urban geophysics is used as a tool to explore archaeologically sensitive regions before or during construction works that are carried out within the historical centres of urban areas. Large-scale construction works (roads, bridges, buildings, pipelines) can have a serious impact on archaeological monuments that are still buried in the subsurface of urban regions. The need for early and effective detection of these cultural remains has motivated the use of geophysical techniques in the archaeological exploration of urban areas (Lück et al., 1997). Traditional geophysical exploration of archaeological sites involves the mapping of the subsurface geophysical properties using soil resistance, magnetic, and electromagnetic methods (Tsokas et al., 1994; Vafidis et al., 2005; Drahor, 2006; Sarris et al., 2007). The compilation of maps that transform the geophysical results into images that resemble the plan view of the buried relics is the ultimate goal of geophysical surveying in archaeological areas (Scollar et al., 1986). This is especially useful when dealing with large archaeological sites in rural environments, the exploration of which requires large human and financial resources. In contrast to conventional geophysical investigation of archaeological sites, a geophysical survey in an urban area may face some objective difficulties. First, because the archaeological remains are usually located at the upper layers of the ground, the highlyheterogeneousnatureoftheselayersinurbanareas,duetothe CSIRO PUBLISHING www.publish.csiro.au/journals/eg Copublished paper, please cite all three: Exploration Geophysics, 2009, 40, 56–68; Butsuri-Tansa, 2009, 62, 56–68; Mulli-Tamsa, 2009, 12, 56–68 Ó ASEG/SEGJ/KSEG 2009 10.1071/EG08107 0812-3985/09/010056
-
Upload
independent -
Category
Documents
-
view
0 -
download
0
Transcript of Urban archaeological investigations using surface 3D Ground Penetrating Radar and Electrical...

Urban archaeological investigations using surface 3DGround Penetrating Radar and Electrical ResistivityTomography methods
Nikos Papadopoulos1 Apostolos Sarris2 Myeong-Jong Yi1,3 Jung-Ho Kim1
1Korea Institute of Geoscience and Mineral Resources (KIGAM), Mineral Resources Research Division, ExplorationGeophysics and Mining Engineering Department, 92 Gwahang-no, Yuseong-gu, Daejeon 305-350, South Korea.
2Laboratory of Geophysical-Satellite Remote Sensing & Archaeo-environment, Institute for Mediterranean Studies,Foundation of Research and Technology-Hellas, P.O. Box 119, Rethymnon, 74100 Crete, Greece.
3Corresponding author. Email: [email protected]
Abstract. Ongoing and extensive urbanisation, which is frequently accompanied with careless construction works, maythreaten important archaeological structures that are still buried in the urban areas. Ground Penetrating Radar (GPR) andElectrical Resistivity Tomography (ERT) methods are most promising alternatives for resolving buried archaeologicalstructures in urban territories. In this work, three case studies are presented, each of which involves an integrated geophysicalsurvey employing the surface three-dimensional (3D) ERT andGPR techniques, in order to archaeologically characterise theinvestigated areas.
The test field sites are located at the historical centres of two of the most populated cities of the island of Crete, in Greece.The ERT and GPR data were collected along a dense network of parallel profiles. The subsurface resistivity structure wasreconstructed by processing the apparent resistivity data with a 3D inversion algorithm. The GPR sections were processedwith a systematic way, applying specific filters to the data in order to enhance their information content. Finally, horizontaldepth slices representing the 3D variation of the physical properties were created. The GPR and ERT images significantlycontributed in reconstructing the complex subsurface properties in these urban areas. Strong GPR reflections and high-resistivity anomalies were correlated with possible archaeological structures. Subsequent excavations in specific places atboth sites verified the geophysical results. The specific case studies demonstrated the applicability of ERT and GPRtechniques during the design and construction stages of urban infrastructure works, indicating areas of archaeologicalsignificance and guiding archaeological excavations before construction work.
Key words: archaeological investigation, ground penetrating radar, 3D resistivity tomography, urban areas.
Introduction
Ongoing large-scale urbanisation is a feature of developingcountries, but it offers a major social problem for developednations as well. Many urban areas have a long historicalbackground which characterises them, and has accompaniedthem from ancient to modern times. Visible evidence of thisrich historical and archaeological background lies in the largenumber of archaeological monuments that can be observed inthese urban centres. Apart from all these visible monuments, aneven larger number of possible archaeological structures are stillburied in the urban subsurface, and these, unfortunately, may bethreatened by careless design and construction of moderninfrastructure works.
Nowadays, geophysical methods are well establishedtechniques for approaching and successfully solvinghydrogeological, geological, archaeological, and environmentalproblems (Dahlin and Owen, 1998; Atzemoglou et al., 2003;Ramirez et al., 1996). Furthermore, such techniques cansignificantly contribute to understanding the complex changes inthe physical environment in urbanised regions. For the abovereasons, the relatively new study field called ‘urban geophysics’has emerged, focusing on the geophysical exploration of cities inorder to investigate and characterise the subsurface properties ofurbanised environments, and to provide effective solutions tospecific problems.
In this work, urban geophysics is used as a tool to explorearchaeologically sensitive regions before or during constructionworks that are carried out within the historical centres of urbanareas. Large-scale construction works (roads, bridges, buildings,pipelines) can have a serious impact on archaeologicalmonuments that are still buried in the subsurface of urban regions.The need for early and effective detection of these culturalremains has motivated the use of geophysical techniques in thearchaeological exploration of urban areas (Lück et al., 1997).
Traditional geophysical exploration of archaeological sitesinvolves the mapping of the subsurface geophysical propertiesusing soil resistance, magnetic, and electromagnetic methods(Tsokas et al., 1994; Vafidis et al., 2005; Drahor, 2006; Sarriset al., 2007). The compilation of maps that transform thegeophysical results into images that resemble the plan view ofthe buried relics is the ultimate goal of geophysical surveying inarchaeological areas (Scollar et al., 1986). This is especiallyuseful when dealing with large archaeological sites in ruralenvironments, the exploration of which requires large humanand financial resources.
In contrast to conventional geophysical investigation ofarchaeological sites, a geophysical survey in an urban area mayface some objective difficulties. First, because the archaeologicalremains are usually located at the upper layers of the ground, thehighlyheterogeneousnatureof theselayersinurbanareas,duetothe
CSIRO PUBLISHING www.publish.csiro.au/journals/eg Copublished paper, please cite all three:
Exploration Geophysics, 2009, 40, 56–68; Butsuri-Tansa, 2009, 62, 56–68; Mulli-Tamsa, 2009, 12, 56–68
� ASEG/SEGJ/KSEG 2009 10.1071/EG08107 0812-3985/09/010056

existence of many man-made objects, may hinder the accuratemapping of archaeological structures. Second, the ambient noisein cities caused by electrical currents and electromagneticradiation can have an undesirable influence on the geophysicalmeasurements. Finally, the need for a high-resolution geophysicalsurvey conducted in limited time, sometimes combined withrestricted site access that requires special regulations or trafficmanagement, imposes additional difficulties. All of the abovefactors show the necessity of developing innovative researchmethods in effectively approaching the archaeologicalexploration of urban sites.
Among the geophysical techniques, Ground Penetrating Radar(GPR) and Electrical Resistivity Tomography (ERT) appear to bethe most suitable techniques for reconstructing the complexsubsurface properties in urban areas. The development of newand fully automatedGPR andERTmeasuring systems, alongwithadvanced and sophisticated processing and interpretationalgorithms, have rendered these two techniques very attractive inarchaeological site characterisation (Vaughan, 1986; Goodman,1994; Goodman et al., 1995; Leckebusch, 2003; Conyers, 2006;Xu and Noel, 1993; Griffiths and Barker, 1994; Loke and Barker,1996; Tsourlos and Ogilvy, 1999; Stummer, 2003; Papadopouloset al., 2007).
These techniques can provide a rapid, economic, and non-invasive tool in the service of the archaeologists. Several casestudies have been reported in the international literatureindicating the successful application of these techniques inlocating buried antiquities in urban areas. Among them Chávezet al. (2001) used magnetic, GPR, and resistivity methods tocharacterise the archaeological zone of Teotihuacan in Mexico.Tsokas et al. (2008) used non-destructive ERT to investigate thearea around and inside a church. Leucci and Negri (2006)implemented the GPR method to map the subsurfacearchaeological features in an urban area. More recently, Negriet al. (2008) evaluated the effectiveness of the integration ofsurface GPR and ERT techniques in researching archaeologicalitems in a geologically complex subsurface.Othermethods such asgravity (Sarrisetal., 2007)orseismic refraction(Leucciet al.,2007)have not met wide application mainly because of the constraintsimposed in collecting such data in the urban territories.
In this work, three case studies are presented, representingthe successful results of geophysical investigation employingthe GPR and ERT methods, in two different urban regions. Thegeophysical survey designs employing these techniques, andthe various data processing stages, are described. Finally, thegeophysical anomalies detected in the ERT andGPRgeophysicalmaps were interpreted in terms of possible buried archaeologicalfeatures, some ofwhichwere verified by subsequent excavations.
Field methodology and data processing
Figure 1 shows the cities of Heraklion and Rethymno where thecase studies presented here were carried out. Heraklion and
Rethymno are two of the major cities of Crete, and capitals ofthe corresponding prefectures. Three different sites wereinvestigated: two of them were located at the centre of the oldtown of Rethymno and the third was located along the mainseaside avenue of the city of Heraklion.
Surface ERT and GPR methods were chosen as mostappropriate techniques for the particular test sites after takinginto account the surrounding surface features and the complexnature of the subsurface where possible archaeological remainscould be buried. An effort to follow a common field strategy ineach of the surveyed areas was made, and this was accomplishedto a certain degree.
Surface ERT was applied in all three test sites. The data werecollected along a dense grid of parallel two-dimensional(2D) sections. This specific survey mode combineseffectively the accurate three-dimensional (3D) mapping ofpossible buried sarchaeological structures and the minimumpossible fieldwork time. Bentonite contact electrodes(Athanasiou et al., 2007), illustrated in Figure 2b, were usedas current electrodes in the Heraklion site. The asphalt surfaceof the other areas forced the field crew to use metallicelectrodes that were inserted through small holes thatwere opened in the asphalt using a pneumatic drill, as can beseen in Figure 2a. A multichannel resistivity instrument(SYSCAL Pro Switch 96) was used to collect the apparentresistivity data.
A similar methodology was followed for the GPR surveys atthe three sites. The GPR measurements were collected alongparallel transects 0.5m apart, forming a specific grid. ANOGGINPLUS unit with 250MHz and 450MHz antennas wasused for the GPR survey.
A systematic workflowwas used to process the collected ERTand GPR data. First, the noisiest apparent resistivitymeasurements (mainly due to poor ground contact) wereremoved from all of the individual pseudosections, and a 3Dresistivity inversion algorithm (Loke and Barker, 1996) wasused to invert the data. The final 3D resistivity invertedmodels were visualised as horizontal slices at increasingdepths. A common strategy was followed to process theGPR sections (first peak estimation, application of automaticgain control, de-wow and DC shift, trace-to-traceaveraging filters). Finally, horizontal depth slices atdifferent depth levels were created from the original verticalsections assuming a velocity for the electromagnetic wavesof 0.1m/ns.
Controlled position measurements using a Global PositioningSystemunitweremade,which subsequentlywere used to overlaythe final geophysical maps on the topographic and satelliteimages of the surveyed areas. The integration of the data wasaccomplished through a Geographical Information System (GIS)platform and thefinal processing results were interpreted in termsof possible archaeological structures.
25 12.5 0 25 Kilometers
Fig. 1. Mapof the island ofCrete, which is located south ofGreece in the area enclosed by the rectangle. The locations of thecities of Heraklion and Rethymno on the north coast of the island are marked.
Urban archaeology using 3D GPR and ERT Exploration Geophysics 57

Case study 1: Bentenaki, Heraklion
Figure 3a shows the Bentenaki area, which is located along thenorth coast seaside in the central part of Heraklion city. Figure 3bis a viewof Saint Petros church from the north-east. This church islocated in an area that extends to thewest between Sof. Venizelouand Mistotaki Avenues. The monument was constructed duringVenetian times, and the Catholic part of the monastery wastransformed to the mosque of Sultan Ibrahim (Gerolla, 1905).During sidewalk construction work (along the seaside avenue)that was being carried out for better exhibition of the church, apalaeochristian church was found and was partially excavated.This church is believed to have been constructed during earlyByzantine times, and constitutes one of the very few survivingmonuments of that period. It has frescos and inscriptionfragments, and seems to comprise part of a more extensiveconstruction complex. The polygon in Figure 3a exhibits thelocation of this palaeochristian church.
In Bentenaki, the geophysical investigations were conductedalong Sof. VenizelouAvenue from the 18th English Square at theeast to the intersection of Sof. Venizelou and Mitsotaki Avenuesat thewest, as illustrated inFigures 3a and4a, respectively.Due tothe urgent construction works that were being carried out in theregion to restore the seaside avenue, the areawas initially coveredusing theGPR technique, butERTmeasurementswere takenonlywithin a section of the site to provide further verification of theGPR results. Sof. Venizelou Avenue is one of the most crowdedroads of the Heraklion city. The fieldwork had to be conductedduring the night to meet special requirements for trafficmanagement, and was finally completed in 12 h betweenthe afternoon of the 29th until the morning of the 30th May of
2008. The goal of this geophysical campaign was to investigatethe area of interest rapidly and efficiently and to providedetailed information about the subsurface. This would guidearchaeological excavation work in specific places, andaccelerate road restoration work.
Ground Penetrating Radar (GPR)
The total GPR area of more than 2000m2 is shown in Figure 4a.The area was divided into seven small individual grids(GRID0–GRID6). The individual grids were explored bycompleting parallel profiles. Similar data collection parameterswere used for all the profiles. The inter-line spacingwas 0.5mandthe sampling interval along each profile was 0.025m. The goalwas to cover asmuch of the area as possible, but surface obstacleslike ditches, pipelines, and parked cars limited coverage of thearea.
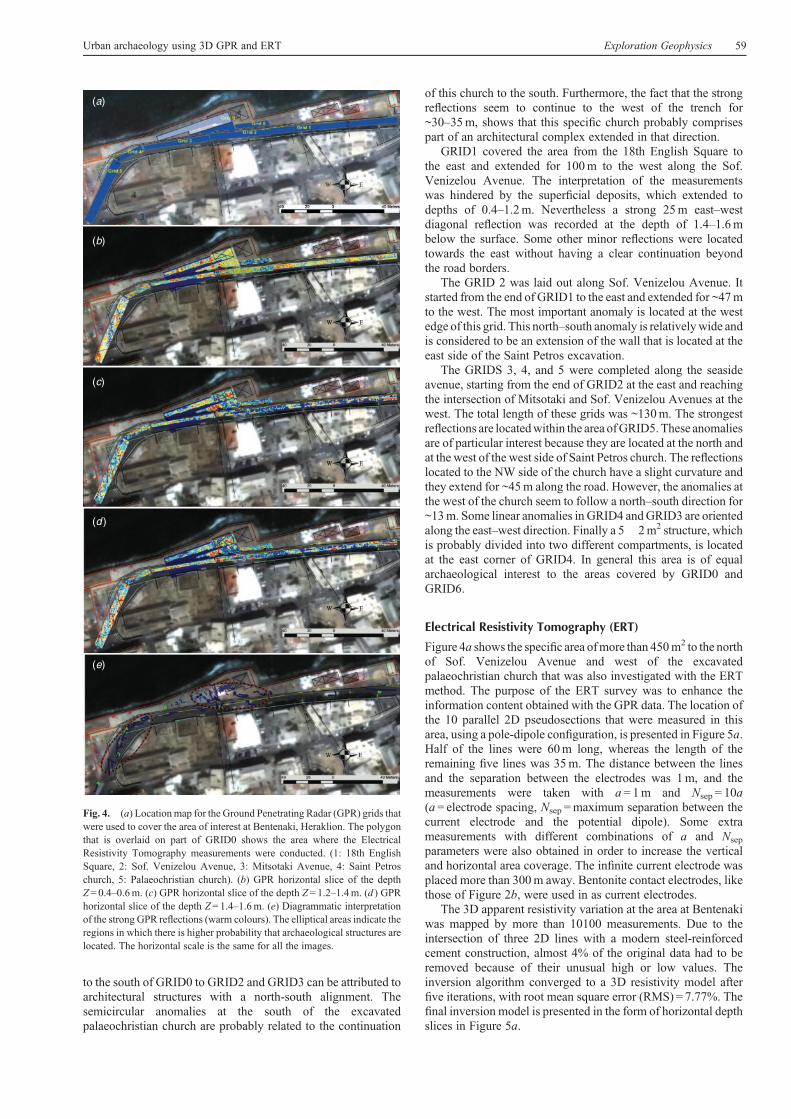
Figures 4b–d present the processed GPR data for eachdifferent grid in the form of horizontal slices at increasingdepth. The thickness of each slice is 0.2m and they wereoverlaid on the Quickbird satellite image (resolution 60 cm) ofthe area through a GIS platform. The ‘warm’ colours indicate thestrong subsurface reflectors that are related to buried structures.
The diagrammatic interpretation of the strong subsurfaceGPR reflections that are more likely to be correlated withburied archaeological structures is shown in Figure 4e. Thecentral part of the area, at the west and south of the excavatedpalaeochristian church (GRID0 and GRID6), is of particulararchaeological interest. Strong reflections start to appear fromthe depth of 0.4m below the ground surface at the east of theexcavation trench. A further continuation of these anomalies
(a) (b)
Fig. 2. (a) Field procedureat the areaofTurkishSchool inRethymnowhere apneumaticdrillwasused to open smallholes in order to insert metal stake electrodes in the ground. (b) Bentonite contact electrodes used in the Heraklioninvestigation.
(a) (b)
Fig.3. (a) Panoramicviewof theBentenaki areaat the centreofHeraklioncity.Thehatchedpolygonon thecoastlineshows the position of the excavated palaeochristian church. (b) Recent view of Saint Petros church, which is locatedalong the Sof. Venizelou Avenue.
58 Exploration Geophysics N. Papadopoulos et al.
to the south of GRID0 to GRID2 and GRID3 can be attributed toarchitectural structures with a north-south alignment. Thesemicircular anomalies at the south of the excavatedpalaeochristian church are probably related to the continuation
of this church to the south. Furthermore, the fact that the strongreflections seem to continue to the west of the trench for~30–35m, shows that this specific church probably comprisespart of an architectural complex extended in that direction.
GRID1 covered the area from the 18th English Square tothe east and extended for 100m to the west along the Sof.Venizelou Avenue. The interpretation of the measurementswas hindered by the superficial deposits, which extended todepths of 0.4–1.2m. Nevertheless a strong 25m east–westdiagonal reflection was recorded at the depth of 1.4–1.6mbelow the surface. Some other minor reflections were locatedtowards the east without having a clear continuation beyondthe road borders.
The GRID 2 was laid out along Sof. Venizelou Avenue. Itstarted from the end of GRID1 to the east and extended for ~47mto the west. The most important anomaly is located at the westedge of this grid. This north–south anomaly is relativelywide andis considered to be an extension of the wall that is located at theeast side of the Saint Petros excavation.
The GRIDS 3, 4, and 5 were completed along the seasideavenue, starting from the end of GRID2 at the east and reachingthe intersection of Mitsotaki and Sof. Venizelou Avenues at thewest. The total length of these grids was ~130m. The strongestreflections are locatedwithin the area ofGRID5. These anomaliesare of particular interest because they are located at the north andat the west of the west side of Saint Petros church. The reflectionslocated to the NW side of the church have a slight curvature andthey extend for ~45m along the road. However, the anomalies atthe west of the church seem to follow a north–south direction for~13m. Some linear anomalies in GRID4 andGRID3 are orientedalong the east–west direction. Finally a 5� 2m2 structure, whichis probably divided into two different compartments, is locatedat the east corner of GRID4. In general this area is of equalarchaeological interest to the areas covered by GRID0 andGRID6.
Electrical Resistivity Tomography (ERT)
Figure 4a shows the specific area ofmore than 450m2 to the northof Sof. Venizelou Avenue and west of the excavatedpalaeochristian church that was also investigated with the ERTmethod. The purpose of the ERT survey was to enhance theinformation content obtained with the GPR data. The location ofthe 10 parallel 2D pseudosections that were measured in thisarea, using a pole-dipole configuration, is presented in Figure 5a.Half of the lines were 60m long, whereas the length of theremaining five lines was 35m. The distance between the linesand the separation between the electrodes was 1m, and themeasurements were taken with a= 1m and Nsep = 10a(a= electrode spacing, Nsep =maximum separation between thecurrent electrode and the potential dipole). Some extrameasurements with different combinations of a and Nsep
parameters were also obtained in order to increase the verticaland horizontal area coverage. The infinite current electrode wasplaced more than 300m away. Bentonite contact electrodes, likethose of Figure 2b, were used in as current electrodes.
The 3D apparent resistivity variation at the area at Bentenakiwas mapped by more than 10100 measurements. Due to theintersection of three 2D lines with a modern steel-reinforcedcement construction, almost 4% of the original data had to beremoved because of their unusual high or low values. Theinversion algorithm converged to a 3D resistivity model afterfive iterations, with root mean square error (RMS) = 7.77%. Thefinal inversion model is presented in the form of horizontal depthslices in Figure 5a.
(a)
(b)
(c)
(d )
(e)
Fig. 4. (a) Locationmap for the Ground Penetrating Radar (GPR) grids thatwere used to cover the area of interest at Bentenaki, Heraklion. The polygonthat is overlaid on part of GRID0 shows the area where the ElectricalResistivity Tomography measurements were conducted. (1: 18th EnglishSquare, 2: Sof. Venizelou Avenue, 3: Mitsotaki Avenue, 4: Saint Petroschurch, 5: Palaeochristian church). (b) GPR horizontal slice of the depthZ= 0.4–0.6m. (c) GPR horizontal slice of the depth Z= 1.2–1.4m. (d ) GPRhorizontal slice of the depth Z= 1.4–1.6m. (e) Diagrammatic interpretationof the strong GPR reflections (warm colours). The elliptical areas indicate theregions in which there is higher probability that archaeological structures arelocated. The horizontal scale is the same for all the images.
Urban archaeology using 3D GPR and ERT Exploration Geophysics 59

Although the first depth slice (Z= 0.00–0.50m) shows areaswith strong resistivity variations due to the local inhomogeneityof the upper urban subsurface layers, the remaining depth layersare quite promising with respect to the presence of possiblearchaeological structures. It is obvious that the east part of thearea is of great archaeological interest, as the diagrammaticinterpretation map in Figure 5b indicates. The promising areascan be divided into two regions. Within the area HR2 that issurrounded by the dashed rectangle, the resistivity anomaliesshow a rectangular pattern but they do not have a constantdirectional continuity. However, the high resistivity anomalieswithin the area HR1 seem to form regular shapes. Consideringthe fact that these anomalies have a constant directionwithin all thedepth slices down to the depth of 2.5m below the ground surface,it can be suggested that they are caused by buried architecturalremains. Some minor linear features can also be observed at thenorth-west of the resistivity grid. Finally, the elliptical highresistivity anomaly, which is located at the north centre edge ofthe grid (X=25m, Y=1m) was caused by a local excavated ditchalmost3mthick.The3DsurfaceERTmeasurements enhancedandverified the data obtained by the GPR survey and both methodssuggested that the excavated palaeochristian church comprises partof an architectural complex that extends further to the west.
Case study 2: Old Turkish School, Rethymno
The location of the old Turkish School, which is located at thecentre of the old townofRethymno, is shown inFigure 6. It is near
the PaneNeratze (mosque) andSaint FrangiskosChurch as canbeseen in Figure 7a. Pane Neratze comprises one of the mostimportant sightseeing attractions in the old town of Rethymno.It was constructed in 1657 by Houssein Pasa from the formerSanta Maria church and an Augustinian monastery. The SaintFrangiskos church is a one-aisled basilica of the Venetian period.During the field geophysical experiments extensive restorationwork was being carried out within the church buildings.
The old Turkish School is located at the west of SaintFrangiskos church. In recent times it has functioned as aprimary education institute, and accommodates the 1stelementary school of Rethymno. An inscription at the westentry of the school reports that it was built in 1796, originallyas a school for girls. It has 11 teaching rooms and an impressiveTurkish style entry.
A room, which is nowadays used as the chemistry laboratoryof the elementary school, is attached to the west side of SaintFrangiskos church. It has a series of closed windows with archesthat seem to continue to the west. Parts of walls that project fromthe east entrance of the yard seem to follow the same direction, asindicated by the arrows in Figure 7b. The existence of severalbuilt-in alcoves in the courtyard wall at the west side of the yard,which are shown in Figure 7c, may suggest the continuation of abuilding to that direction.
A project involving the construction of a new cultural centre atthe north side of the Turkish School yard was recently initiatedand funded by the municipality of Rethymno. Because of the
Diagrammatic interpretation
Fig. 5. (a) Horizontal depth slices at increasing depths, extracted from the 3D resistivity inversion model of the Bentenaki area, Heraklion. (b) Diagrammaticinterpretation of the strong resistivity anomalies. The layout of the parallel 2D survey lines, conducted to the west of the excavated palaeochristian church, can beseen at the top of the figure.
60 Exploration Geophysics N. Papadopoulos et al.

visible historical and archaeological monuments in the areaaround the yard, geophysical exploration was undertaken tolocate possible subsurface continuation of these monuments inthe area of the yard.More than 2000m2 of the Turkish schoolyardat the north of the building facilities shown in Figure 7a wereinvestigated with both the GPR and the ERT techniques. Theultimate goal of this geophysical campaign was to reconstruct thearchaeological content of the area by detecting, mapping, andvisualising the 3D structure of the possible buried archaeologicaltargets, to guide the future excavation activities in selected placesand contribute to the construction of the new cultural centre.
ERT and GPR
Thefieldworkat theyardof theoldTurkishSchoolwascompletedin 4 days in August of 2006. Forty-four parallel 2D electricalpseudosections along the south-north direction were measured,using the dipole–dipole configuration. The maximum length ofeach line varied from 20 to 76m. The distance between lines, andthe electrode spacingalong line,was1m(a= 1).Acomplete set ofapparent resistivity data with a= 1m and maximum separationbetween the current andpotential dipolesNsep = 6mwas collectedalong each line. Some additional data were also gathered with 2aand 3a distances for the current and potential dipoles in order tomaximise the information content and the resolution of the finalresistivitymodel.Unfortunately, itwas not possible to use contactelectrodes, to minimise the time of data acquisition, because theschoolyard was covered with asphalt. For this reason, metallic
electrodes were fixed in the asphalt using a pneumatic drill. Inorder to ensure good contact of the electrodes with the ground,salty water was poured into each hole and eventually contactresistances of less than 3KOhm were attained.
The same area was also covered by GPR data acquisition on adense grid of parallel lines, spaced 0.5m apart. In all, 88 lines ofdata were collected at a sampling interval of 0.05m. The flatground of the investigated area contributed to gatheringGPRdataof high resolution. It has to be noted that due to the almost idealfield conditions at the yard the GPR survey was completedsuccessfully in less than 5 h of fieldwork. This means that inthis case the GPR field survey was almost eight times faster thanthe actual time needed to complete the surface 3D ERTmeasurements.
The ERT data were processed by following the same generalprocessing steps described earlier. Almost 3% of the morethan 33 700 apparent resistivity data that were collected fromthe yard of the old Turkish School were removed as outliers.The resistivity inversion model shown in Figure 8 consisted of27 104 parameters and eight layers, and the inversion algorithmconverged to this subsurface model after five iterations, withRMS=9.94%. The GPR data were enhanced through theapplication of specific filters (see the Data Processing section)and they are presented in Figure 9 in the form of horizontal depthslices every 0.2m.
The final ERT andGPRmaps of Figures 8 and 9, respectively,signify the high quality and spatial resolution of the original
Fig. 6. Panoramic Quickbird satellite view of Rethymno old town. The locations of the oldTurkish School and the Institute for Mediterranean Studies (IMS), where the urban geophysicalinvestigations were conducted, are shown.
(a) (c)(b)
Fig. 7. (a) The area of the yard of the old Turkish School which was investigated is delineated by the solid polygon. (1) old Turkish School, (2) Saint Fragiskoschurch, (3) Chemistry laboratory, (4)HikingClub, (5)Neratze Pane. (b) Details of the visible architectural remnants located at the east entrance of the school yard.(c) Filled-in alcoves at the courtyard wall (dashed line in a) at the west of the yard.
Urban archaeology using 3D GPR and ERT Exploration Geophysics 61
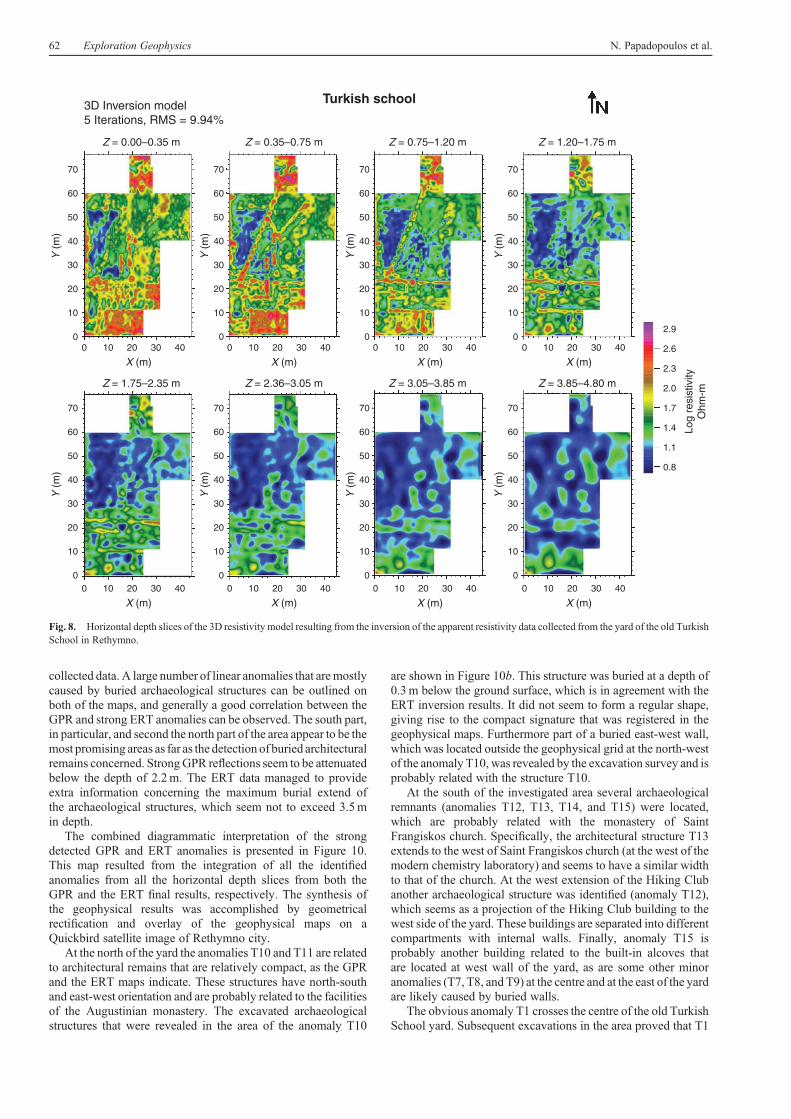
collected data. A large number of linear anomalies that aremostlycaused by buried archaeological structures can be outlined onboth of the maps, and generally a good correlation between theGPR and strong ERT anomalies can be observed. The south part,in particular, and second the north part of the area appear to be themost promising areas as far as the detection of buried architecturalremains concerned. StrongGPR reflections seem to be attenuatedbelow the depth of 2.2m. The ERT data managed to provideextra information concerning the maximum burial extend ofthe archaeological structures, which seem not to exceed 3.5min depth.
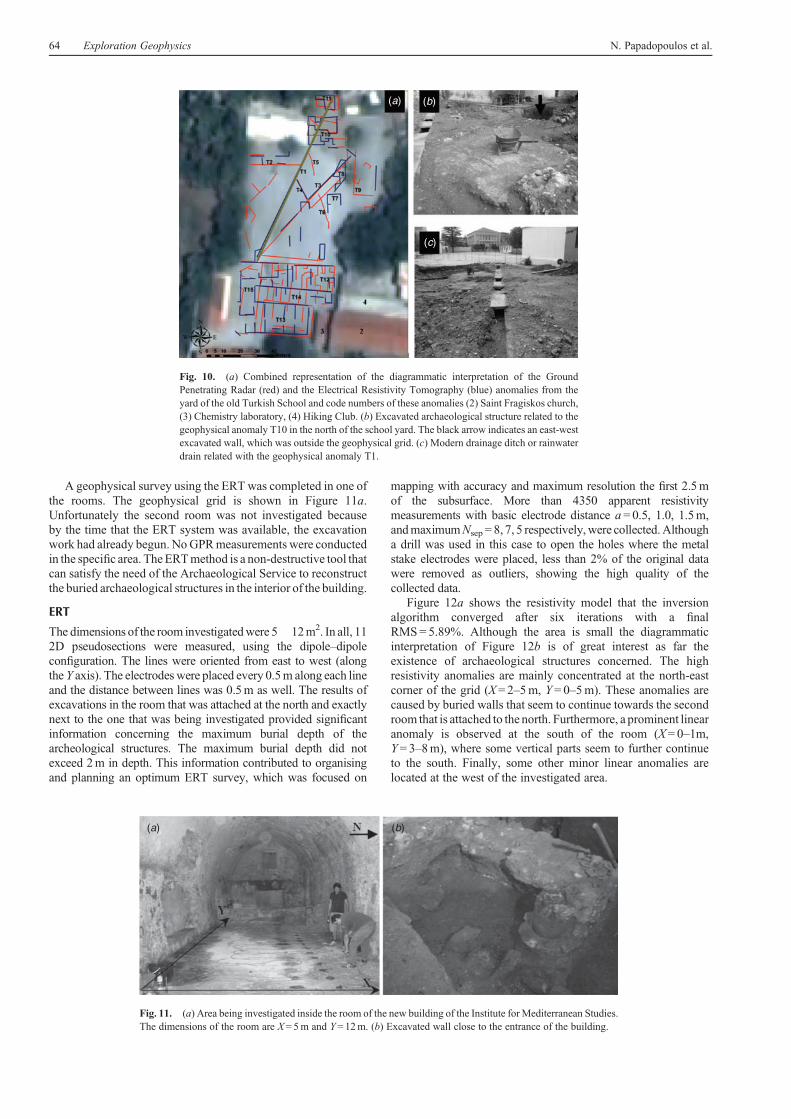
The combined diagrammatic interpretation of the strongdetected GPR and ERT anomalies is presented in Figure 10.This map resulted from the integration of all the identifiedanomalies from all the horizontal depth slices from both theGPR and the ERT final results, respectively. The synthesis ofthe geophysical results was accomplished by geometricalrectification and overlay of the geophysical maps on aQuickbird satellite image of Rethymno city.
At the north of the yard the anomalies T10 and T11 are relatedto architectural remains that are relatively compact, as the GPRand the ERT maps indicate. These structures have north-southand east-west orientation and are probably related to the facilitiesof the Augustinian monastery. The excavated archaeologicalstructures that were revealed in the area of the anomaly T10
are shown in Figure 10b. This structure was buried at a depth of0.3m below the ground surface, which is in agreement with theERT inversion results. It did not seem to form a regular shape,giving rise to the compact signature that was registered in thegeophysical maps. Furthermore part of a buried east-west wall,which was located outside the geophysical grid at the north-westof the anomaly T10, was revealed by the excavation survey and isprobably related with the structure T10.
At the south of the investigated area several archaeologicalremnants (anomalies T12, T13, T14, and T15) were located,which are probably related with the monastery of SaintFrangiskos church. Specifically, the architectural structure T13extends to the west of Saint Frangiskos church (at the west of themodern chemistry laboratory) and seems to have a similar widthto that of the church. At the west extension of the Hiking Clubanother archaeological structure was identified (anomaly T12),which seems as a projection of the Hiking Club building to thewest side of the yard. These buildings are separated into differentcompartments with internal walls. Finally, anomaly T15 isprobably another building related to the built-in alcoves thatare located at west wall of the yard, as are some other minoranomalies (T7, T8, and T9) at the centre and at the east of the yardare likely caused by buried walls.
The obvious anomaly T1 crosses the centre of the old TurkishSchool yard. Subsequent excavations in the area proved that T1
70
60
50
40
Y (
m)
Z = 0.00–0.35 m
3D Inversion model5 Iterations, RMS = 9.94%
Z = 0.35–0.75 m
Turkish school
Z = 0.75–1.20 m Z = 1.20–1.75 m
Z = 1.75–2.35 m Z = 2.36–3.05 m Z = 3.05–3.85 m Z = 3.85–4.80 m
Log
resi
stiv
ityO
hm-m
X (m)
30
20
10
00 10 20 30 40
X (m)0 10 20 30 40
X (m)0 10 20 30 40
X (m)0 10 20 30 40
X (m)0 10 20 30 40
X (m)0 10 20 30 40
X (m)0 10 20 30 40
X (m)0 10 20 30 40
70
60
50
40
Y (
m)
30
20
10
0
70
60
50
40
Y (
m)
30
20
10
0
70
60
50
40
Y (
m)
30
20
10
0
70
60
50
40
Y (
m)
30
20
10
0
70
60
50
40
Y (
m)
30
20
10
0
70
60
50
40
Y (
m)
30
20
10
0
70
60
0.8
1.1
1.4
1.7
2.0
2.3
2.6
2.9
50
40
Y (
m)
30
20
10
0
Fig. 8. Horizontal depth slices of the 3D resistivity model resulting from the inversion of the apparent resistivity data collected from the yard of the old TurkishSchool in Rethymno.
62 Exploration Geophysics N. Papadopoulos et al.

anomaly is related to a drainage ditch or rainwater channel, as isshown in Figure 10c. This channel is superficial, has a NE–SWdirection and is probably a modern construction. Anomalies T2,T3, andT4 seem to be relatedwith this specific pipe, and the linearanomalies T5 and T6 are probably related modern drainagestructures as well.
Case study 3: The new building of the Institutefor Mediterranean Studies, Rethymno
The Institute for Mediterranean Studies (IMS) is located atthe centre of the old town of Rethymno. It is located ~250mto the north-west of the old Turkish School. IMS belongs to theFoundation for Research and Technology Hellas, one of largest
national research institutes inGreece. The IMShas been hosted ina renovated building complex since 1996.
Recently, the building next to the existing IMS facilities wasbought in order to cover the increasing needs of the Institute.Because this building is located within the centre of the old townof Rethymno, it is fully protected by Greek archaeologicallaw, and any future restoration work must be approved bythe Archaeological Service. The historical importance of thisbuilding is significant as two of the ground floor rooms of thisbuilding were used as churches in the past. The ArchaeologicalService decided to carry out excavation work in these rooms inorder to recover the possible archaeological structures that wereburied beneath these rooms.
Average amplitude 0.10 to 0.20 m Average amplitude 0.30 to 0.40 m Average amplitude 0.50 to 0.60 m Average amplitude 0.70 to 0.80 m
Average amplitude 0.90 to 1.00 m Average amplitude 1.10 to 1.20 m Average amplitude 1.30 to 1.40 m Average amplitude 1.50 to 1.60 m
Average amplitude 1.70 to 1.80 m Average amplitude 1.90 to 2.00 m Average amplitude 2.10 to 2.20 m Average amplitude 2.10 to 2.20 m
75
63
50
38
25
Y P
ositi
on in
met
res
X Position in metres
Y P
ositi
on in
met
res
Y P
ositi
on in
met
res
Y P
ositi
on in
met
res
13
00 5 1015202530354045
X Position in metres0 5 1015202530354045
X Position in metres0 5 1015202530354045
X Position in metres0 5 1015202530354045
X Position in metres0 5 1015202530354045
X Position in metres0 5 1015202530354045
X Position in metres0 5 1015202530354045
X Position in metres0 5 1015202530354045
X Position in metres0 5 1015202530354045
X Position in metres0 5 1015202530354045
X Position in metres0 5 1015202530354045
X Position in metres0 5 1015202530354045
75
63
50
38
25
13
0
75
63
50
38
25
13
0
75
63
50
38
25
13
0
75
63
50
38
25
Y P
ositi
on in
met
res
Y P
ositi
on in
met
res
Y P
ositi
on in
met
res
Y P
ositi
on in
met
res
13
0
75
63
50
38
25
13
0
75
63
50
38
25
13
0
75
63
50
38
25
13
0
75
63
50
38
25
Y P
ositi
on in
met
res
Y P
ositi
on in
met
res
Y P
ositi
on in
met
res
Y P
ositi
on in
met
res
13
0
75
63
50
38
25
13
0
75
63
50
38
25
13
0
75
63
50
38
25
13
0
Fig. 9. Horizontal depth slices at every 0.2m, which represent the strong reflections of the electromagnetic waves from the archaeological structures that areburied in the subsurface of the old Turkish School yard.
Urban archaeology using 3D GPR and ERT Exploration Geophysics 63
A geophysical survey using the ERT was completed in one ofthe rooms. The geophysical grid is shown in Figure 11a.Unfortunately the second room was not investigated becauseby the time that the ERT system was available, the excavationwork had already begun. NoGPRmeasurements were conductedin the specific area. TheERTmethod is a non-destructive tool thatcan satisfy the need of the Archaeological Service to reconstructthe buried archaeological structures in the interior of the building.
ERT
The dimensions of the room investigatedwere 5� 12m2. In all, 112D pseudosections were measured, using the dipole–dipoleconfiguration. The lines were oriented from east to west (alongthe Y axis). The electrodes were placed every 0.5m along each lineand the distance between lines was 0.5m as well. The results ofexcavations in the room that was attached at the north and exactlynext to the one that was being investigated provided significantinformation concerning the maximum burial depth of thearcheological structures. The maximum burial depth did notexceed 2m in depth. This information contributed to organisingand planning an optimum ERT survey, which was focused on
mapping with accuracy and maximum resolution the first 2.5mof the subsurface. More than 4350 apparent resistivitymeasurements with basic electrode distance a=0.5, 1.0, 1.5m,andmaximumNsep = 8, 7, 5 respectively,were collected.Althougha drill was used in this case to open the holes where the metalstake electrodes were placed, less than 2% of the original datawere removed as outliers, showing the high quality of thecollected data.
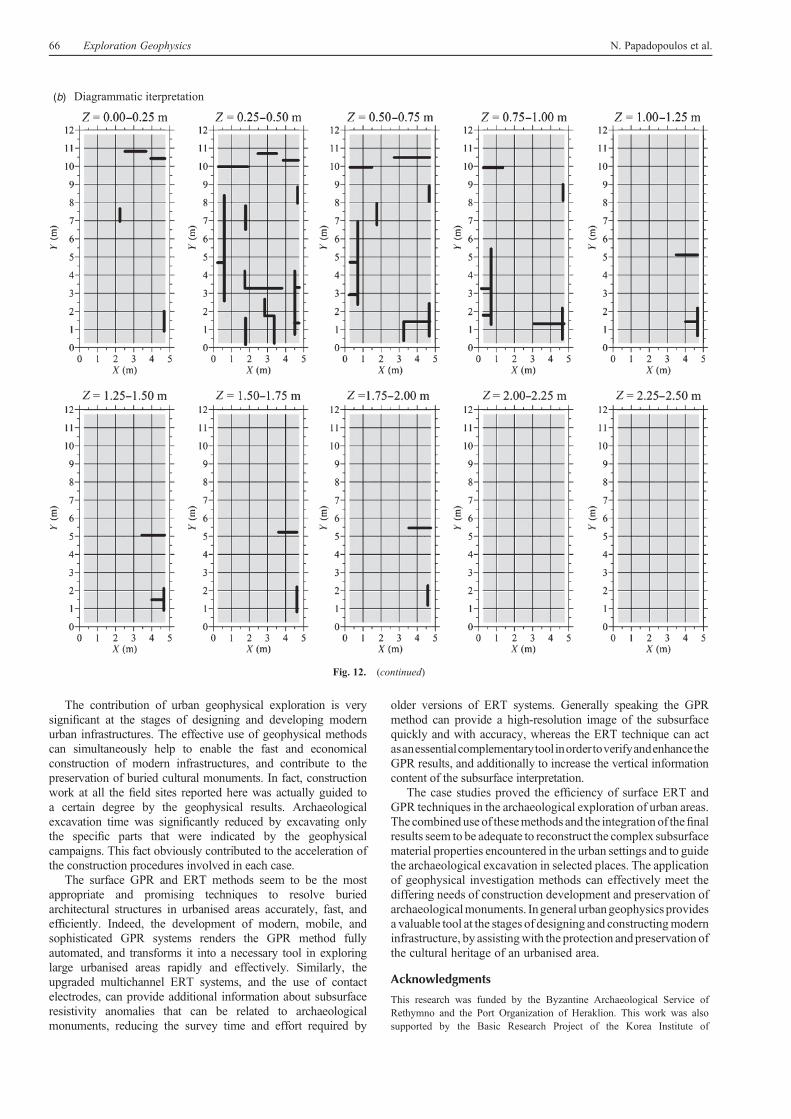
Figure 12a shows the resistivity model that the inversionalgorithm converged after six iterations with a finalRMS= 5.89%. Although the area is small the diagrammaticinterpretation of Figure 12b is of great interest as far theexistence of archaeological structures concerned. The highresistivity anomalies are mainly concentrated at the north-eastcorner of the grid (X= 2–5m, Y= 0–5m). These anomalies arecaused by buried walls that seem to continue towards the secondroom that is attached to the north. Furthermore, a prominent linearanomaly is observed at the south of the room (X= 0–1m,Y= 3–8m), where some vertical parts seem to further continueto the south. Finally, some other minor linear anomalies arelocated at the west of the investigated area.
(a) (b)
(c)
Fig. 10. (a) Combined representation of the diagrammatic interpretation of the GroundPenetrating Radar (red) and the Electrical Resistivity Tomography (blue) anomalies from theyard of the old Turkish School and code numbers of these anomalies (2) Saint Fragiskos church,(3) Chemistry laboratory, (4) Hiking Club. (b) Excavated archaeological structure related to thegeophysical anomaly T10 in the north of the school yard. The black arrow indicates an east-westexcavated wall, which was outside the geophysical grid. (c) Modern drainage ditch or rainwaterdrain related with the geophysical anomaly T1.
(a) (b)
Fig. 11. (a) Area being investigated inside the room of the new building of the Institute for Mediterranean Studies.The dimensions of the room are X= 5m and Y= 12m. (b) Excavated wall close to the entrance of the building.
64 Exploration Geophysics N. Papadopoulos et al.

Subsequent excavations revealed a cooking area belonging toa house of more recent (historical) times, which is shown inFigure 11b. This excavated house is located close to the entranceof the building (X= 3–5m, Y= 0–5m).
Conclusions
In this work three case studies are presented which involved theintegrated application of the surface GPR and the ERT methodsin order to archaeologically characterise specific urban areas. Asignificant number of strong GPR reflections in the central partof Bentenaki area indicated that the palaeochristian churchcomprises part of a broader architectural complex. The ERTsurvey, which overlapped part of the GPR grids, enhanced theinformation content obtained with the GPR data and providedadditional information regarding the depth extent of thearchaeological structures. Some very promising GPR anomaliesforming regular shapes were also identified at the west side ofSaint Petros church.
The ERT and the GPR surveys resulted in subsurface imagesof comparable accuracy in the case of the geophysical explorationin the yard of the old Turkish School in Rethymno. In the southpart of the area several archaeological remnants forming possiblebuildings, separated in different compartments,were registered in
the geophysical maps. To the north, excavation work verified thegeophysical results by revealing an archaeological structure thatdid not form a regular shape. Finally a modern drainage ditchcaused the linear anomaly that crosses the yard in a diagonaldirection.
Although thenewbuildingof the IMS inRethymnooccupiedarelatively small area the inversion model contributed inidentifying some linear resistivity anomalies that were causedby buried archaeological relics. The subsequent excavation at theentrance of this building revealed a cooking area belonging to ahouse of more recent times.
Generally these case studies can be regarded as successfulas far as the objectives and the final results of all the geophysicalsurveys concerned. The objectives of these geophysicalcampaigns were focused on reconstructing the complex urbansubsurface, locating with accuracy possible buried structures ofarchaeological interest, andfinally guiding theexcavationwork inselected places. Although measurements obtained in some areassuffered from increased levels of noise, the final images were ofhigh spatial resolution and revealed clear linear anomalies thatcould be attributed to buried archaeological structures. Thesubsequent excavation in the specific sites provided significantproof that verified the geophysical results.
3D inversion model5 IterationsRMS = 5.89%
(a)IMS N
300
260
220
180
140
100
60
20
Ohm-m
Fig. 12. (a) 3D resistivity inversionmodel from the roomof the new building of the Institute ofMediterranean Studies (IMS). (b) Diagrammatic interpretationof the strong resistivity anomalies.
Urban archaeology using 3D GPR and ERT Exploration Geophysics 65
The contribution of urban geophysical exploration is verysignificant at the stages of designing and developing modernurban infrastructures. The effective use of geophysical methodscan simultaneously help to enable the fast and economicalconstruction of modern infrastructures, and contribute to thepreservation of buried cultural monuments. In fact, constructionwork at all the field sites reported here was actually guided toa certain degree by the geophysical results. Archaeologicalexcavation time was significantly reduced by excavating onlythe specific parts that were indicated by the geophysicalcampaigns. This fact obviously contributed to the acceleration ofthe construction procedures involved in each case.
The surface GPR and ERT methods seem to be the mostappropriate and promising techniques to resolve buriedarchitectural structures in urbanised areas accurately, fast, andefficiently. Indeed, the development of modern, mobile, andsophisticated GPR systems renders the GPR method fullyautomated, and transforms it into a necessary tool in exploringlarge urbanised areas rapidly and effectively. Similarly, theupgraded multichannel ERT systems, and the use of contactelectrodes, can provide additional information about subsurfaceresistivity anomalies that can be related to archaeologicalmonuments, reducing the survey time and effort required by
older versions of ERT systems. Generally speaking the GPRmethod can provide a high-resolution image of the subsurfacequickly and with accuracy, whereas the ERT technique can actasanessentialcomplementarytoolinordertoverifyandenhancetheGPR results, and additionally to increase the vertical informationcontent of the subsurface interpretation.
The case studies proved the efficiency of surface ERT andGPR techniques in the archaeological exploration of urban areas.The combineduse of thesemethods and the integration of thefinalresults seem to be adequate to reconstruct the complex subsurfacematerial properties encountered in the urban settings and to guidethe archaeological excavation in selected places. The applicationof geophysical investigation methods can effectively meet thediffering needs of construction development and preservation ofarchaeologicalmonuments. Ingeneral urbangeophysics providesa valuable tool at the stages of designing and constructingmoderninfrastructure, by assistingwith the protection andpreservation ofthe cultural heritage of an urbanised area.
Acknowledgments
This research was funded by the Byzantine Archaeological Service ofRethymno and the Port Organization of Heraklion. This work was alsosupported by the Basic Research Project of the Korea Institute of
Diagrammatic iterpretation(b)
Fig. 12. (continued)
66 Exploration Geophysics N. Papadopoulos et al.

Geoscience and Mineral Resources funded by the Ministry of KnowledgeEconomy of Korea. The authors would like to thank Dr Lindsay Thomas andtwo anonymous reviewers for their comments that improved the quality of themanuscript significantly.
References
Athanasiou,E.,Tsourlos,P.,Vargemezis,G.,Papazachos,C.,andTsokas,G.N.,2007, Non-destructive DC resistivity surveying using flat-baseelectrodes: Near Surface Geophysics, 5, 263–272.
Atzemoglou, A., Tsourlos, P., and Pavlides, S., 2003, Investigation of theTectonic Structure of the NW Part of the Amynteon Basin (NW Greece)by means of a Vertical Electrical Sounding (VES) survey: Journal ofthe Balkan Geophysical Society, 4, 188–201.
Chávez,R. E., Cámara,M.E., Tejero,A., Barba, L., andManzanilla, L., 2001,Site Characterization by Geophysical Methods in the ArchaeologicalZone of Teotihuacan, Mexico: Journal of Archaeological Science, 28,1265–1276. doi: 10.1006/jasc.2000.0627
Conyers, L. B., 2006, Innovative ground-penetrating radar methods forarchaeological mapping: Archaeological Prospection, 13, 139–141.doi: 10.1002/arp.282
Dahlin, T., and Owen, R., 1998, Geophysical investigations of alluvialaquifers in Zimbabwe. Proceedings of the IV Meeting of theEnvironmental and Engineering Geophysical Society (EuropeanSection), Sept. 1998, Barcelona, Spain, 151–154.
Drahor,M.G., 2006, Integrated geophysical studies in the upper part of Sardisarchaeological site, Turkey: Journal of AppliedGeophysics, 59, 205–223.doi: 10.1016/j.jappgeo.2005.10.008
Gerolla, G., 1905, Monumenti Veneti nell’ isola di Creta, Venice, 2b,125–127.
Goodman, D., 1994, Ground-pentrating radar simulation in engineering andarchaeology: Geophysics, 59, 224–232. doi: 10.1190/1.1443584
Goodman, D., Nishimura, Y., and Rogers, J. D., 1995, GPR time slices inarchaeological prospection: Archaeological Prospection, 2, 85–89.
Griffiths, D. H., and Barker, R. D., 1994, Electrical Imaging in Archaeology:Journal of Archaeological Science, 21, 153–158. doi: 10.1006/jasc.1994.1017
Leckebusch, J., 2003, Ground-Penetrating Radar: A Modern Three-Dimensional Prospection Method: Archaeological Prospection, 10,213–240. doi: 10.1002/arp.211
Loke,M.H., andBarker, R. D., 1996, Practical Techniques for 3DResistivitySurveys and Data Inversion: Geophysical Prospecting, 44, 499–523.doi: 10.1111/j.1365-2478.1996.tb00162.x
Lück, E., Eisenreich, M., Spangenberg, U., and Christl, G., 1997, A Noteon Geophysical Prospection of Archaeological Structures in UrbanContexts in Potsdam (Germany): Archaeological Prospection, 4,231–238. doi: 10.1002/(SICI)1099-0763(199712)4 : 4<231::AID-ARP87>3.0.CO;2-6
Leucci,G.,Greco,F.,Giorgi,L.D., andMauceri,R., 2007,Three-dimensionalof seismic refraction tomography and electrical resistivity tomographysurvey in the castle of Occhiola (Sicily, Italy): Journal of ArchaeologicalScience, 34, 233–242. doi: 10.1016/j.jas.2006.04.010
Leucci, G., and Negri, S., 2006, Use of ground penetrating radar to mapsubsurface archaeological features in an urban area: Journal ofArchaeological Science, 33, 502–512. doi: 10.1016/j.jas.2005.09.006
Negri, S., Leucci, G., and Mazzone, F., 2008, High resolution 3D ERT tohelp GPR data interpretation for researching archaeological items in ageologically complex subsurface: Journal of Applied Geophysics, 65,111–120. doi: 10.1016/j.jappgeo.2008.06.004
Papadopoulos, N.G., Tsourlos, P., Tsokas, G.N., and Sarris, A., 2007,Efficient ERT Measuring and Inversion Strategies for 3D Imaging ofBuried Antiquities: Near Surface Geophysics, 6, 349–362.
Ramirez, A., Daily, W., Binley, A., and Labrecque, D., 1996, Tank leakdetection using electrical resistance methods. Symposium on theapplication of geophysics to engineering and environment, KeystoneCO, April 28–May 1, 1996.
Sarris, A., Dunn, R. K., Rife, J. L., Papadopoulos, N., Kokkinou, E., andMundigler, C., 2007, Geological and geophysical investigations in theRoman cemetery at Kenchreai (Korinthia), Greece: ArchaeologicalProspection, 14, 1–23. doi: 10.1002/arp.280
Scollar, I., Weinder, B., and Segeth, K., 1986, Display of archaeologicalmagnetic data: Geophysics, 51, 623–633. doi: 10.1190/1.1442116
Stummer, P., 2003, New Developments in Electrical Resistivity Imaging.Dissertation submitted to the Swiss Federal of Institute of Technology,Zurich.
Tsokas, G.N., Giannopoulos, A., Tsourlos, P., Vargemezis, G., Tealby, J.M.,Sarris, A., Papazachos, C.B., and Savopoulou, T., 1994, A Large ScaleGeophysical Survey in the Archaeological Site of Europos (northernGreece): Journal of Applied Geophysics, 32, 85–98. doi: 10.1016/0926-9851(94)90011-6
Tsokas, G. N., Tsourlos, P. I., Vargemezis, G., and Novack, M., 2008, Non-destructive Electrical Resistivity Tomography for Indoor Investigation:the Case of Kapnikarea Church in Athens: Archaeological Prospection,15, 47–61. doi: 10.1002/arp.321
Tsourlos, P., and Ogilvy, R., 1999, An algorithm for the 3-D Inversion ofTomographic Resistivity and Induced Polarization data: PreliminaryResults: Journal of the Balkan Geophysical Society, 2, 30–45.
Vafidis, A., Economou, N., Ganiatsos, Y., Manakou, M., Poulioudis, G.,Sourlas, G., Vrontaki, E., Sarris, A., Guy, M., and Kalpaxis, Th., 2005,Integrated archaeological studies at ancient Itanos (Greece):Archaeological Science, 32, 1023–1036. doi: 10.1016/j.jas.2005.02.007
Vaughan, C. J., 1986, Ground-penetrating radar surveys in archaeologicalinvestigations: Geophysics, 51, 595–604. doi: 10.1190/1.1442114
Xu, B., and Noel, M., 1993, On the Completeness of Data Sets withMultielectrode Systems for Electrical Resistivity Survey: GeophysicalProspecting, 41, 791–801. doi: 10.1111/j.1365-2478.1993.tb00885.x
Manuscript received 15 October 2008; revised manuscript received16 December 2008.
Urban archaeology using 3D GPR and ERT Exploration Geophysics 67

68 Exploration Geophysics N. Papadopoulos et al.
http://www.publish.csiro.au/journals/eg
Nikos Papadopoulos1, Apostolos Sarris2, 1, 1
1 2 Laboratory of Geophysical-Satellite Remote Sensing & Archaeo-environment, Institute for Mediterranean Studies. Foundation of Research and
Technology-Hellas
, .
, 3 3 3 .
. 3 3 . , 3
, . 3 , 3 . , ,
.
.
1 2
3 3
23
3