SC Temp Sensors Challenge Precision RTDs and Thermistors ...
Upload
khangminh22Category
view
0download
0
NUREG/CR-1200LA-8170-MSInformal Report
Accider.' Delineation and Evaluation
of the High-Temperature
Gas-Cooled Reactor System Concepts
0 031837 2 ANR8
PUgCDOCUMENTROOM
ASH GN DC 20555
.bE
$mO'ow._
b(D.2C
02270 @ )
LOS ALAMOS SCIENTIFIC LABORATORYPost Of fice Box 1663 Los Alamos, New Mexico 87545

An Affumative Action /I:qualOpportunity Employer
This report was not edited by the Technical Informationstaff.
NOTKl
Thai report wee pcrured as se saoem of work p neared by se gees, of the tweed SisicsGweenerat, Neshet Ihr(340884 $18488 beer 9meel nor gay apren'y alieftef. er say Of thett genpipyet, etsbes any eartsety.etpretted er empbed.er gatelurt Spy b$al behebty or resposaisbehty for any shed party's one. or the resarist of twk wee. of say enforsubstion.epperatina. prodert er process dissW pa that tcport or rcreeeects thLe Ms see by soth therd party woonid not enfrangepetuately Gened eghE%
The stret ettIF.4eEd W tilst feport are 400 Retetaardy thour of the L5 hockar Egisistory Commessoa.

NUR EG/ CR-1200L A-8170-MSInformal Report
R-d
Accident Delineation and Evaluation
of the High-Temperature
Gas-Cooled Reactor System Concepts
Beverly W. Washburn
Manuscript submitted: December 1979Date published: December 1979
Pr' pared forDivision of Reactor Safety ResearchUS Nuclear Regulatory Commission
Washington, DC 20555NRC FIN No. A7014
UNITED STATESDEPARTMENT OF ENERGYCONTR ACT W 7405-ENG. 36

CONTENTS
----------------------- -- - 1ABSTRACT
1I. INTRODUCTION - - ------------ -- - ---
II. THE HIGH-TEMPERATURE GAS-COOLED REACTOR -- - -- - 4
------ -------- -- - 4A. Introduction
B. Nuclear Steam Supply System (NSSS) -- - - -- 6
12C. Main Loop Cooling E stem -----------
D. Core Auxiliary Cooling System (CACS) - - --- 14
E. Core Design - - -------- ---- - -- 16
F. Reactivity Control and Shutdown Systems - -- - 22
G. Prestressed Concrete Reactor Vessel - - - - - - 23
H. Plant Control and Protection Systems -- --- 26
1. Plant Control Systems (OCS) --- ---- 26
2. Protection Systems - - - - - - - - - - - - 27
a. Plant Protection System - - - - - - - 27
b. Operational Protection System - - - - 27
III. HTGR ACCIDENT SEQUENCES --------- -- -- - 27
A. Introduction -- --------------- 27
B. Methodology - - - - - - - - - - - - - - - - - - 29
C. Initiating Events - - - - - - - - - - - - - - - 34
D. Event Sequences - - - - - - - - - - - - - - - - 34
E. System Fault Trees 35--------------
F. Probability of Accident Sequence --- ---- 37
G. System Models - - - - - - - - - - - - - - - - - 37
H. Consequence of Sequence - - - - - - - - - - - - 38
iv

CONTENTS (cont)
IV. ANALYSIS RESULTS - - - - - - - - - - - - - - - - 39--
A. Introduction ---- ---------- --- 39
B. Analyses by Shutdown Initiating EventCategory 51-------------------
1. Category I 51-------- --------
2. Category II 54---------------
3. Category III 59---------------
604. Category IV ------- --------
C. Analyses of Containment Systems - - - - - - - - 72
D. Latent Hazard Indices - - - - - 75-------
1. Slow Depressurization of the PCRV 76----
2. Rapid Depressurization of the PCRV - - - - 81
3. Loss of Forced Coolant - - 85--------
4. Importance of Containment Integrity --- 89
5. Importance of Containment Atmosphere90Cleanup Systems -------------
6. Importance of Containment IntegrityCombined with Containment Atmosphere
9lCleanup --- --------------
92V. CONCLUSIONS ---------- ----------
93REFERENCES -- -----------------------
FIGURES
1. Typical arrangement for the HTGR nucleargenerating unit. -- ----- ----------- 4
2. Illustration of the nuclear steam supply system. -- 6
3. Schematic of the primary and secondary cooling13systems. ----------------------
v

FIGURES (cont)
4. Schematic of the secondary cooling system. -- --- 13
5. Schematic diagram for one CACS loop. --- ----- 15
6. Core auxiliary cooling water system. --- - ---- 15
7. Elements of typical accident delineation. - ---- 30
8. HTGR secondary coolant system flow dia' ram. ---- 40
9a. Event sequ(nce for Category I initiating event,turbine trip - ystems function on demand. - - - - - 41
9b. Event sequence for Category I initiating event,turbine trip - systems function at 300 h followingevent. ------------- -- ---- ---- 42
10a. Even sequence for Category lia initiating event,loss of three main cooling loops -- systems func-
43tion on demand. ------------------
10b. Event sequence for Category IIB initiating event,loss of three main cooling loops - systems functionat 300 h following event. ------ - --- --- 44
lla. Event sequence for Category IIB initiating event,loss of main loop cooling - systems function on
45demand. ----------------------
llb. Event sequence for Category IIB initiating event,loss of main loop cooling - systems function at300 h following event. --- - - ---- -- ---- 46
12. Event sequence for Category IIIA initiatingevent, loss of one Class lE electrical bus -systems function on demand. - ------ ----- 47
13. Evcnt ceg' ence for Category IIIB initiatin g event,loss of class 1E ac electrical power -- systemsfunction on demand. ------ ------ ---- 48
14. Event sequence for Category IITB initiating event,loss of Class lE ac electrical power -- systems
49function on demand. ----------------
15. Event sequence for Category IVA initiating ef'nt,station blackout -- systems function on de:.iar4 --- 50
vi

FIGURES (cont)
16a. Event sequence for Category IVB initiating event,loss of off-site power with turbine trip -systems function on demand. 62------ -- -----
16b. Event sequence for Category IVB initiating event,loss of off-site power with power runback -systems function on demand. 64------ -- -----
17. Event sequence for Category IVB initiating event,loss of off-site power - systems function ondemand. - -- -- ------------------ 66
18. Event sequence for Category IVB initiating event,loss of off-site power - systems function followingevent. 67---- ----- -------- ------
19. Event sequence for Category IVC initiating event,PCRV depressurization - systems function followingevent. - ------ ----------------68
20. Containment event sequence diagram. - - -------74
21. Containment event sequence diagram -- slow depressur-ization of the PCRV. -----------------76
22. Containment event sequence diagram -- rapid depres-surization of the PCRV. -----81----------
23. Containment event sequence diagram -- loss-of-forced coolant. --- ----------------86
TABLES
I. Comparison of HTGR Specifications 5----------
II. Summary of Principal Design Data for the 1160 MW(e)High-Temeprature Gas-Cooled Reactor -- ------- 7
III. Reactor Core Design and Performance Characteristics - 18
IV. Reactivity Control Systems Design and PerformanceCharacteristics 24-------------------
vii

TABLES (cont)
V. Reactor Shutdown Initiating Event Categories - - - - 32
VI. Initiating Event Categories and InitiatingEvents - - - - - - - - - - - - - - - - - - - - - - - 54
VII. Latent Hazard Indices Slow Depressurization78of the PCRV - A = 0.1% per day ---- ------
g
VIII. Latent Hazard Indices Slow Depressurizationof the PCRV - A = 10.0% per day - - - - - - - - - - 79
g
IX. Latent Hazard Indices Slow Depressurizationof the PCRV - Massive containment failure
80A = 1.0 h-1 --------------------g
X. Latent Hazard Indices Rapid Depressurization82of the PCRV - A = 0.1% per day ----------
g
XI. Latent Hazard Indices Rapid Depressurization83of the PCRV - A 10.0% per day ----------
g
XII. Latent Hazard Indices Rapid Depressurizationof the PCRV - Massive containment failureA = 1.0 h-1 - - - - - - - - - - - - - - - - - - - - 84
g
XIII. Latent Hazard Indices Loss of Forced Coolant87A = 0.1% per day -----------------
g
XIV. Latent Hazard Indices Loss of Forced CoolantA = 10.0% per day - - - - - - - - - - - - - - - - - 88
g
XV. Latent Hazard Indices Loss of Forced ReactorCoolant - Massive containment failureA = 1.0 h-1 - - - - - - - - - - - - - - - - - - - - 89
g
viii

ACCIDENT DELINEATION A11D EVALUATION OF THE
HIGH-TEMPERATURE GAS-COOLED REACTOR SYSTEM CONCEPTS
by
Beverly W. Washburn
ABSTRACT
A methodology of accident delineation andanalysis is developed for application to anevaluation of the conceptual design of a high-temperature gas-cooled reactor (HTGR) . Theconceptual design of the 3000-MW(t) HTGR isstudied and probabilities of possible accidentsequences are provided. Latent hazard indicesare developed for the accident sequences ccidentify quantitatively the sequences havingthe greatest potential impact on the publicsafety.
I. INTRODUCTION
Safety of the public is a major concern of the nuclear power
industry. Quantitative risk assessments of nuclear power plant
safety have been performed for actual detailed light-water reactor
poter plant designs.1 Preliminary high-temperature gas-cooled re-
actor (HTGR) designs have been analyzed for the contribution of a
few selected initiating events to a specific, limited consequence.
This study establishes and demonstrates a method 61ogy for evaluating
conceptual designs of redundant and diverse systems. A generic,
1

first-order assessment of the 3000-MW(t) HTGR conceptual design is
presented. The emphasis of this assessment is to provide results
that are useful in determining the areas of the design concept that
have the greatest potential impact on public health and safety.
The method also may be used to evaluate detailed designs when they
are available.
This study is structured to establish a quantitative frame-
work in which to identify the relative importance of system con-
cepts and components to safety. This objective basis is needed to
assess safety issues and to provide guidance for safety research
and development. The method of this study differs from the pre-
viously cited studies in three significant respects. First, this
study establishes the relative importance of system failure modes
rather than absolute predictions of consequences and risk. Second-
ly, this study was organized to consider accident sequences associ-
ated with classes of initiating events rather than with specific
postulated initiating events. The third pri7cipal difference is
that this study has considered possible partial system failure
modes in the diverse and redundant systems.
The analysis in this study has been directed at the investiga-
tion of possible accident sequences associated with heat generation-
heat removal imbalances in the reactor core. While significant in-
ventories of radionuclides exist in other areas of the plant, the
potential accidents involving the core have been considered first
because the largest inventory of radionuclides is located in the
core of the reactor. If accident sequences can be found where
these nuclides may be released to the environment, these sequences
may result in potentially significant hazard to the health and
safety or the public. Potential releases from other areas of the
plant, while believed to have lesser hazard to the public, may
present greater risk to the public, because of a higher probability
of occurrence, and therefore, these should also be investigated.
Possible accident secuences have been developed at the plant
subsystem level. Subsystems that are essential or that may be
used for preventing or mitiaating the consequences of reactor core
heat generation-heat removal imbalances are considered in the
2

sequences and the sequences are constructed to account for major
systen interdependencies. Possible accident secuence initiating
events are considered to be all events or conditions that require
the reactor to be shut down. These initiating events range from
innocuous trips to events or plant conditions which affect the per-
formance of the core heat removal systems. For the analysis, these
possible shutdown initiating events are grouped into categories
according to their effect on the performance of the core heat re-
moval systems.
Quantitative assessments of the accident sequence branches are
made from consideration of the principal components (black boxes)
in the system conce taal design. Detail, adequate for the purpose
of this study, has not been documented in all areas of the plant
system conceptual design. Suitable assumptions, designated as
reference system design, are made to permit quantitative ascessment.
Component failure modes, demand failure probabilities, and operating
reliabilities from the Reactor Safety Study (RSS) have been usedin this study to estimate reliabilities at the black box level.
Fault trees for the subsystems are constructed and quantized using
these estimates of black box reliability. The outcomes of the
fault trees are the branch probabilities in the event sequences.
Latent hazard indices are developed for the possible accident
sequences. These indices, which quantify the relative potential of
the various radionuclides for producing l~ cnt fatalities in the
exposed population, are used to establish the relative importance
of the accidents. The evaluation of the consequencos of the pos-
sible accident sequences to the health and safety of the public was
not a part of this study. It was, however, necessary to provide
some criteria to quantitatively establish relative importance of
the possible accident sequences. Both the sequence probability and
the latent hazard index are considered in determining the import-
ance of the possible accidenc sequences.
3

II. THE HIGH-TEMPERATURE GAS-COOLED REACTOR
A. Introduction
General Atomic Company (formerly the Gulf General Atomic
Company) began development of the high-temperature gas-cooled re-
actor (HTGR) nuclear system in 1957. This system has progressed
through the design and operation of the 40-MW(e) prototype Peach
Bottom Atomic Power Station Unit 1 and the 330-MW(e) Fort St. VrainNuclear Generating Station. Work has been done on the design of
large HTGRs, [ 7 7 0 MW (e ) , 1160 MW(e), and 1500 MW(e) ] ; and the initi-
al safety and design analyses for the 1160 MW(c) [3000 MW(t)] nu-
clear steam system have been compiled in GASSAR-5. The Philadel-
phia Electric Company's Fulton Station HTGRs were the first in the
1 )00 MW(e) range ordered by an electric utility. The Stone and
Webster Engineering Corporation provided the balance-of-olant pre-
liminary design for the Fulton Generating Station Units 1 and 2
(FGS 1 & 2) Preliminary Safety Analysis Report (PSAR).
Figure 1 shows a typical arrangement for the HTGR nuclear gen-
erating unit. Table I compares general specifications for the Fort
St. Vrain, Summit and Fulton HTGR nuclear steam systems.
TV8Biht -''s
BJfLDING ,
,
CONTAIN*thi T~. .$+
, ..- *
- 'ij . J
.
,
3 c. - r w
| '. >t >
AUrill&RY AND PLANT.
4 h, CONTROL BUILDINGg
h i / : . [. h$ h h FQHg F i h h 4 --
h" REACTOR
_' ; SERVICEBUILDING
Fig. 1. Typical arrangement for the HTGR nuclear generating unit.4

TABLE I
COMPARISON OF HTGR SPECIFICATIONS
Pcactor Fort St. Vrain Sumit Fulton
Type FTIGR ITIGR frIGR
Output 330 fM(c) 770 FW(e) 1160 W(e)
Coolant He He He
Pressure, psi 686 (4.8 MPa) 725 (5 MPa) 725 (5 MPa)
Net efficiency, % 39.2 39 39
Pressure vessel sincir-cavity multicavity multicavity
PCRV PCRV PCRV
Vessel sizeo.d., ft 61 (1.8 m) 94 (2.8 m) 100 (30 m)
Height, ft 106 (32 m) 100 (30 m) 100 (30 m)
Boiler design once-through once-through once-throuch
No. of S-G 2 4 6
Main steam
Pressure, psia 2400 (17 MPa) 2400 (17 MPa) 2400 (17 MPa)
Tenperature, F 1005 (810 K) 950 (780 K) 950 (780 K)
Reheat steam
Pressure, psia 649 (4.5 MPa) 554 (3.9 MPa) 554 (3.9 fPa)
Temperature, F 1000 (810 K) 1000 (810 K) 1000 (810 K)
Main Circulator Type Single-stage Single-stage Single-stageaxial flow axial flow axial flow
No. 4 4 6
Circulator drive Direct-mupled Direct-mupled Direct-cDupledsteam turbine steam turbine steam turbine
Auxiliary
Circulators 2 2 3
Drive Water turbine Electric motor Electric bbtor
#Systan design and performance data are given in U.S. custanary units in allpertinent publications and references used in this study. The sare units areused throughout this report. However, values have been converted to approxi-mate, order of nagnitude SI units to conform.
5

This report section will briefly describe the aspects of the
3000 MW(t) plant that are of primary interest in this study.
B. Nuclear Steam Supply System (NSSS)
The prestressed concrete reactor vessel (PCRV), which encloses
the entire primary coolant system, and major system components
within the PCRV are shown in the cut-away schematic view of Fig. 2.
Table II is a summary cf the principal design data for the 1160
MW(e) high-temperature gas-cooled reactor.
M"g g DW4 PLAT (5 Avallitty
C1PCULATOR
(09 TROL #0)'
' 9 ,"STCoAct wuts 9 M '- P(st 15 A1104 COVE *54
'y,.D,' g' [\'# i N NEL'Ua.,
-[MM , M # ., gi PUR I F 6C AtlCh(04757 200 fA%3 P3 WL [ 1' k 46 g 14) (.,
\WELLS, g
IWAVaENTATION 4 ., , - ~/*. & h ) Q
' ', Q ND , d8O, LL y N%} { i -Y e *b4gu
g%%# Q W h*, C "q-
<
ga h,1 Wd$j
ji - a/<i acav an5m<
Ausilla4? \/ A(Liff $75IIMg I i
//f] al-' ' '"' A ' * " N :,
y
Mp ap 5 y' fIECLLAIO'"I
M ' fh]t h|, - %.c - n p 4 s, ,
h d eg !1'I)4 ~
f-
gg ? - --
{[ pf . 't h A5 (* (f D
C ''''C081 AgtlllA4f {*, '[ ( - M " % Q- L s % * l I,ME AT (ICHA%(q =# * ,'
.3 no"ct ~ p.i (jY g
%n !.-$ 1 Q 1e
d *'h 550lIBUV q % ,.''
'
j #" k-. STEAM
I$ dj > .| I 3p i
PRE S TRE SSE D '' i
m!= A | p!ryf!J, ,
WE SSE L -Qiq. $ ,.,
|e i. \'
E
}e;s-
Coal $UPPO4T ';$TRUCTURE /-
..
gj |% F $ a!$,gfc
$v5f(M
NN .,
PCTHf RMAL 94441[R $bppCqiAN3 P(RJ L|g[a $1py(fgp[
Fig. 2. Illustration of the nuclear steam supply system.
6

TABLE II
SUMMARY OF PRINCIPAL DESIGN DATA FOR THEa
116 0 MW (e) HIGH-TEMPERATURE GAS-COOLED REACTOR
CAPACITY
Net electrical output.................. 1160 MW(e)Gross generation....................... 1175 MW(e)Overall station net efficiency......... 38.6%
REACTOR CORE
Reactor output......................... 3000 MW(t)Core diameter.......................... 27.7 ft (8.41 m)
Active core height..................... 20.8 ft (6.30 m)
Number of fuel elements................ 3944
Fuel column pitch...................... 14.2 in. (361 nm)
FUEL
Fuel material (initial core)........... Th/ U (93% enriched)Total thorium quantity (initial core).. 37500 kg
Total uranium quantity (initial core).. 1725 kg
Fuel form.............................. Coated particles incylindrical rods
Number of fuel elements per refuelingregion................................. 56
Element................................ Hexagonal
Dimension across flats............ 14.17 in. (360 mm)
Length............................ 31.22 in. (793 mm)Fuel rod diameter...................... 0.615 in. (15.6 mm)
Coolant channel diameter............... 0.826 in. (21.0 mm)Burnup (U + Th)........................ 98000 mwd /t
CONTROL
Control rods........................... 73 pair
Active length.......................... 250 in. (6.35 m)
Absorber material...................... B C/ graphite4
canning materia1....................... Incoloy
Shape.................................. Hollow cylindrical
aSee note a, Table I.
7

TABLE II (cont)
Drive, normal.......................... Electrical motor
Trip.............................. Gravity
THERMAL DATA6Primary steam flow..................... 8.06 x 10 lb/h
(1018 kg/s)
Primary steam pressure................. 2400 psig (17 MPa)
Feedwater tempere:ure.................. 370 F (643 K)6Primary coolant flow................... 11.23 x 10 lb/h
(1418 kg/s)
Primary coolant pressure............... 725 psia (5 MPa)
Coolant temperature, core inlet........ 605 F (590 K)core 0ttlet....... 1366 F (1015 K)
Average heat flux...................... 65000 BTU /h-ft(205 kW/m2)
2Maximum heat flux...................... 185000 BTU /h-ft(584 kU/m2)
Maximum fuel temperature............... 2570 F (1685 K)Number of steam generators............. 6
REACTOR VESSEL
Type................................... Prestressed concrete
Main cavity dimensions, diameter....... 37 ft (11.3 m)
height......... 47.3 ft (14.4 m)
Maximum external dimensions, diameter.. 100.5 ft (30.5 m)
height.... 91.2 ft (27.8 m)
Normal working pressure................ 710 psig (5 MPa)
CIRCULATORS
Type................................... Axial flow compressorwith integral driver
Drive.................................. Single-stage steamturbine
Flow control........................... Variable speed
No. of circulators..................... 6 (1 per loop)6Rated steam flow....................... 1.32 x 10 lb/h/
circulator (167 kg/s)
Speed.................................. 6750 rpm
Compressor pressure rise (helium)...... 20.7 psi (190 kPa)
8
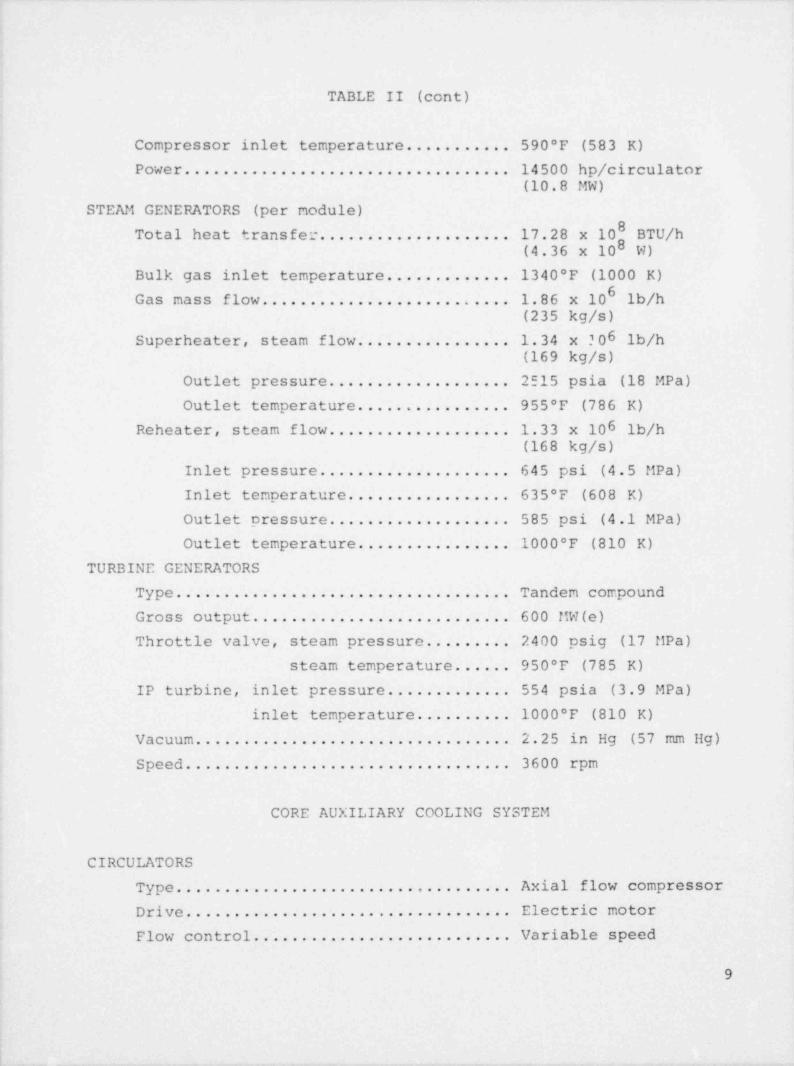
TABLE II (cont)
Compressor inlet temperature........... 590 F (583 K)
Power.................................. 14500 hp/ circulator(10.8 MW)
STEAM GENERATORS (por module)8Total heat transfer.................... 17.28 x 10 BTU /h8(4.36 x 10 g)
Bulk gas inlet temperature............. 1340 F (1000 K)6Gas mass flow.......................... 1.86 x 10 lb/h
(235 kg/s)
Superheater, steam flow................ 1.34 x .'06 lb/h(169 kg/s)
Outlet pressure................... 2515 psia (18 MPa)
Outlet temperature................ 955 F (786 K)Reheater, steam flow................... 1.33 x 10⁶ lb/h
(168 kg/s)
Inlet pressure.................... 645 psi (4.5 MPa)
Inlet temperature................. 635 F (608 K)
Outlet oressure................... 585 psi (4.1 MPa)
Outlet temperature................ 1000 F (810 K)
TURBINE GENERATORS
Type................................... Tandem compound
Gross output........................... 600 MW(e)Throttle valve, steam pressure......... 2400 psig (17 MPa)
steam temperature...... 950 F (785 K)
IP turbine, inlet pressure............. 554 psia (3.9 MPa)
inlet temperature.......... 1000 F (810 K)Vacuum................................. 2.25 in Hg (57 mm Hg)
Speed.................................. 3600 rpm
CORE AUXILIARY COOLING SYSTEM
CIRCULATORS
Type................................... Axial flow compressor
Drive.................................. Electric motor
Flow control........................... Variable speed
9

TABLE II (cont)
No. of circulators..................... 3
Speed.................................. 3550 rpm (maximum)
Compressor pressure rise (helium)...... Approximately 0.5 psi(3.5 Pa)
Compressor inlet temperature........... 568 F (570 K)Power............., 700 hp (522 kW)... ...............
Torque............... 1180 ft-lbs (maximum)...............
(1650 Nm)CORE AUXILIARY HEAT EXCHANGER
2 2Effective heat trasnfer area (per loop) 2060 ft (192 m )Water temperature, inlet............... 140 F (333 K)
outlet.............. 400 F (477 K)
Pressure, outlet.................. 500 psia (3.45 MPa)
Mass flow rate (pe r loop ) . . . . . . . . . 653000 lb/h (82.4 kg/s)
Heat removal capacity (per loop)..... 1.73 x 10⁸ BTU /h.
(5.1 x 10⁷ w)Helium flow (per loop)
5(PCRV pressurized)................ 1.43 x 10 lb/h (18 kg/s)
(PCRV depressurized).............. 6.3 x 10⁴ lb/h (7.95 kg/s)Temperature, inlet................ 1546 F (1060 K)
outlet............... 568 F (570 K)FLOW AVAILABLE FOR CORE COOLING
Fraction of total auxiliary circularflow:
PCRV pressu'rized
All main loop shutoff valvesclosed....................... 0.89
One main loop shutoff valveopen......................... 0.69
Two main loop shutoff valvesopen...- 0.48....................
PCRV depressurized
All main loop shutoff valvesclosed............... 0.89.......
One main loop shutoff valveopen......................... 0.60
Two main loop shutoff valvesopen......................... 0.42
10

The reactor core assembly is located in the central PCRV
cavity. The core coolant inlet plenum, at the top of the core as-
sembly, and the core coolant oxi' >1enum, at the bottom of the core_
assembly, are connected to the eam generator and core auxiliary
heat exchanger cavities by a system of separate ducts inside the
PCRV. The primary cooling ? em consists mainly of six independ-
ent steam generator and circulator assemblies located in separate
steam generator cavities inside the PCRV. Auxiliary capability for
heat removal from the reactor core is provided by three independ-
ent core auxiliary heat exchangers and associated auxiliary circu-
lators located in three separate cavities inside the PCRV. The
systems and components associated with these three core auxiliary
cooling systems (CACS) outside the PCRV may also have a high degree
of independence, depending on the detailed system design. The
main steam generator cooling loops, functi;nally diverse from the
CACS loops, have a limited independence, dependent on the detailed
design of the plant main steam system, outside the PCRV.
In normal operation, the hot helium coolant flow is downward
through the core to the exit plenum and through the cross ducts to
the steam generators. In the steam generator, the hot helium en-
ters near the bottom of the assembly above the reheater section,
flows through the reheater section and the superheater-evaporator-economizer section, exits at the top and enters the main circulator
inlet. Helium discharged from the main circulators, through isola-
tien valves, flows to the core inlet plenum through cross ducts.
The cold helium in the inlet plenum enters each refueling section
of the core through adjustable orifice valves.
In the auxiliary cooling loops, the hot helium flows from the
core exit plenum through three radial ducts to the core auxiliary
heat exchanger. Helium flow in the CACS loop is upward through the
auxiliary heat exchanger, the auxiliary loop isolation valve, and
the auxiliary circulator to the core inlet plenum. The CACS is
operated only when the reactor is tripped and the main circulators
are shut down. The auxiliary loop isolation valves remain shut to
prevent back-flow of helium during normal operation.
11

C. Main Loop Cooling System
Major components of the main loop cooling system are the steam
generators, the main helium circulators, the main loop isolation
valves, and the associated ducting. The steam generators are in-
dependent within the primary coolant boundary and each generator
can be shut down and isolated independently. Each steam generator
is a forced circulation, single pass, helically coiled unit. Fig-
ure 3 is a schematic representation of the primary and secondary
cooling systems. A simplified flow diagram of the secondary cool-
ant system is shown in Fig. 4.
The main helium circulator is a single-stage compressor that
is driven by a single-stage steam turbine. Exhaust steam from the
high-pressure turbine of the main turbine-generator set drives the
main circulators. The main helium circulator turbine exhaust steam
goes through the reheater section of the main steam generator.
The reheat steam drives the intermediate pressure turbine of the
main turbine-generator set. Water lubricated bearings are used in
the main circulators. The compressor is separated from the com-
pressor side journal bearing by a double-labyrinth seal and scaveng-
ing chamber. Helium buffer gas is introduced between the two
labyrinths to block the flow of primary coolant helium into the
bearing water and the flow of bearing water into the primary cool-
ant. The main circulators are designed to operate under conditions
of
1. normal plant operation from minimum to rated load,
2. plant start-up,
3. routine plant shutdown, and
4. depressurized PCRV.
The main loop isolation valves limit backflow through a
primary coolant loop when the loop is shut down. This valve con-
sists of a movable blocking ring in the annular space at the main
circulator diffuser exit, springs that hold the ring in the closed
12

PE4 EAT ---- - ------- - - -
STEAM I -- - - - - - - - - ' ' - - *
WalN STE AM ypisP
cENERLTOR,P, m g t.r
--ty -
c"d M 0cR , / COhcENSER
,:., _ :.J,_,-m- = f -
| f - FEEO PUMPj;;;q. Mrcrana _ y;-
} -- il
be __[[J-
r -
mcob . sTEAwcE,taAtcR
H uMQT MELIVM
Fig. 3. Schematic of the primary and secondary cooling systems.
p ua
RE HF AT b yPASSTO CONDE NSE R
DE SUPE R,
ENE ATOR*
WL- w Nyi' EPTCESUFER HPT spT
HEATER
STE AMIGENERATOR 9 8
JL MAINREHEATER 1FCONDE NSE R
FLASH .
T A r r.s
1HIM COND E NSA T E
k PUMPSVALVE ag
CONCENSER k AU"BLOCK QVALVE & S ^
P
\ / + CIRCULATORdL l'" ''
4 ORivE TUR8INE
F E E DW A T E RAux ROILE R AIR EJECTOH
p BUIL E R f E ED PUMP TUR8;NE
> 4 TO CONDE NSE R DE VINE R All2E Rcoit g a
f E E D PUMP
DEAERATOR
LP f EE DW ATE R HE AlERS
:: >AUXILIAR Y BOILE R
Fig. 4. Schematic of the secondary cooling system.
13

position and three positive, motor-driven actuators coupled to the
ring by a rod and bellows assembly. The bellows forms the primary
pressure boundary. Alternate means are provided to permit the
valve springs and gravity to close the valve.
D. Core Auxiliary Cooling System (CACS)
The CACS is an engineered safety feature for providing cool-
down and shutdown cooling of the core in the event that the main
loops are unavailable. Each loop is designed to remove approxi-
mately 50% of the design value residual heat. Each of the three
CACS loops consists of a core auxiliary heat exchanger (CAHE), an
auxiliary circulator, an auxiliary circulator service system, an
auxiliary loop isolation valve, and a core auxiliary cooling water
system (CACWS). Figure 5 shows a schematic diagram for one CACS
loop and a simplified flow diagram for the CACWS is shown in Fig. 6.
The CAHE heating surface consists of a helically coiled tube
bundle arranged in countercurrent flow with the primary helium
flow. The cooling water is recirculated through the CACWS and the
heat sink.
The auxiliary circulator is an electric motor-driven compres-
sor. A variable frequency ac power source provides speed control
for the auxiliary circulator. Oil is used as the bearing lubricant.
A helium buffered labyrinth seal is used on the shaft at the primary
coolant boundary. The motor is cooled by helium flow and this heat
is rejected from the motor cavity by a helium-water heat exchanger.
Water is used to cool the bearing oil.
The auxiliary loop isolation valve limits backflow through
the auxiliary cooling loop when the circulator is shut down. Thevalve, installed below the compressor, consists of two novable
plates. The force of gravity and a reverse flow condition close
this valve. Opening of this valve is by aerodynamic forces gener-
ated by the operation of the auxiliary circulator.
The auxiliary circulator service system provides cooling water
for the motor, removes oil vapor from the seal purge helium, and
provides the bearing lubricant.
14

PRESSURIZER
e% .
AUXILIARY LOOP COOLER TC
ySTOP VALVES
CIRCULATING P m o
g - PCRV
AUXIL5hRY ON!
AUXIUARY/j$ 0@COOLING PUMPCIRCULATOR .: h
CORE AUXILIARYHEAT EXCHANGER
Fig. 5. Schematic diagram for one CACS loop.
The CACWS, shown in Fig. 6, transfers heat from the CAHE to
the ultimate heat sink.
CONDE NSAT EMAKEUP LEGEND.
p [#STE E- 01 A, B, C = CORE AUXILIARY HEAT EXCHANGERe
WASTE SYST E M E- 02A, B,C = AUXILIARY LOOP COOLERSF- 01 A, B,C = F IL TE RS
SYST E M HEllUM HE LIUM P 01 A, B,C. = CIRCULATING PUMPSI P- 02A, B.C. = AUXILIARY COOLING PUMPS7 ,r CYLINDERL
CYLINDEpP- C3A 8,C = MAK E UP PUMPS
1
( T41AT-02 T 01 A, B,C - PR ESSURIZE RSLC T- 02 - WATER STOR AGE TANK
'L1
() (NOTE 3) PPS HADIOACTIVE1r
, ][ f ,
SYSTEM FROMLIQUID WASTE,,
--
a6 4 , g
d S[,,
Im CH E MICA
OHS INJECTION EC2AJ b (NOTE 2)ir FotA
LOOPS2 AND 3
(------------ 7-----
[ f|[ - h PLANT COOLING.L AUXILIARY WATER SYSTEM
T-018 ---''-- [- CIRCULATOR a>j 4: . cPF r n enNTnni .T ,.
'' ',
>{''_ <
P-038 __ ' '(NOTE 1) -;;O PCRV PENE TRATIONHS -
P 01 A FSt (T YPICAll (PRIMARY CLOSURE)TOIC p__
ST AR T/STOP 1P dLspP43C O P01A
M PO2A
' '''NOTES: P-02A
1. SECONDARY CONTAINMENT VESSEL E-01 A2. MAY BE AIR OR WATER COOLED3. CONTROL AIR F AN PITCH OR
THROTTLE SERVICE WATER
Fig. 6. Core auxiliary cooling water system.
15

E. Core Design
The active core consists of 493 vertical columns of hexagonal
graphite fuel and reflector elements arranged to approximate a
right circular cylinder. Each column is composed of eight fuel
elements and top and bottom graphite reflector elements. One-
hundred and fourteen vertical columns of replaceable hexagonal re-
flector elements surround the active core. The core is divided
into 85 refueling regions, each (except for the peripheral regions)
consisting of a central fuel element column and six adjacent col-
umns. The control rod and reserve shutdown channels are located in
the central fuel element column in each region. Core heat removal
is accomplished by the downward flow of helium coolant through the
core and reflector elements. A variable flow control assembly is
located at the inlet to each refueling region to provide adjustment
of the coolant flow.
The fissile and fertile fuel materials are, respectively, en-
riched (approximately 93% uranium-235) uranium carbide and thorium235oxide. Initia31y, U comprises the total fissile loading. How-
ever, the design of the reactor provides for the use of recycled233
U as a feed material. The uranium carbide particles are coated
with pyrolytic carbon and silicon carbide, and the thorium oxide
particles are coated with pyrolytic carbon. The particle coatings
provide the primary barrier for fission product retention.
Each fuel element contains a matrix of fuel and coolant holes.The fuel particles are bonded together with a graphitic binder to
form fuel rods, which are then stacked in the individual fuel holes
of each element. Each fuel stack is sealed into the hole by
graphite pluga. Each fuel element contains 132 fuel rod stacks,
except for the central element of each region, which contains 80
stacks. In each corner of the element, there is a hole that may
contain burnable poison, depending on the location in the core.
The poison is in the form of a rod the length of a fuel rod stack
and consisting of boron carbide granules dispersed in a graphite
matrix. The coolant channels extend through each element and are
aligned with coolant channels in the elements above and below by16

graphite dowels on the top face of each element that mate with
sockets in the bottom face of the element above. A grapple hole
in the center of each fuel and reflector element facilitates
handling.
The core is located and supported within the PCRV by three
structures: the core support structure, the permanent side reflec-
tor and boronated shield, and the core lateral restraint structure.
Each refueling region is supported by a single graphite core
support block, which in turn, is supported by three graphite posts.
The top and bottom ends of the posts have spherical seats to allow
for differential horizontal movement. The core support block
serves the additional function of collecting the primary coolant
flow from the outlet of the core region and distributing it into
the lower plenum between the core support structure and the bottom
head of the PCRV.
The permanent side reflector and boronated shield immediately
surround the hexagonal reflector columns on the periphery of the
reactor core. The permanent side reflector is composed of graphite
blocks shaped to make the transition from the removable hexagonal
reflector elements to an approximately circular shape concentric
with the PCRV. The function of the side reflector is to reduce core
neutron leakage and fast flux and gamma exposure of the PCRV and
liner. The boronated shield is a steel-clad, boronated graphite
assembly immediately surrounding the permanent side reflector.
The function of the boronated shield is to shield the PCRV and
liner from thermal neutron flux.
The core lateral restraint structure consists of 252 discrete
support assemblies that span the 1-ft-wide annulus between the
boronated shield and the liner. These support assemblies contain
coil springs and their function is to locate the core and the
permanent side reflector in the core cavity and to offer horizontal
constraint and support during normal operation and in the event of
an earthquake.
The reactor core design and performance characteristics are
shown in Table III.
17

TABLE III
REACTOR CORE DESIGN AND PERFORMANCE CHARACTERISTICS
Mechanical Characteristics (dimensions at 72 F) (295 K)
Fuel Element
Number required 3944 (including 12 C's listedbelow)b
Shape Hexagonal right prism
Material Graphite
Width across flats (in.) 14.17 (0.35 m)
Length (in.) 31.22 (0.78 m)Diameter of fuel holes(in.) 0.624 (15.6 mm)Number of interconriectingdowels 3
Fuel Control FuelElement Element
Number of fuel holes 132 80
Number of coolant holes 72 43
Diameter of coolant 0.826 (20.7 nm) 0.826 (20.7 mm)holes (in.) (6 are 0.717) (10 are 0.717)
(17.9 mm) (17.9 mm)Number of burnable poisonholes 6
Coolant channel flowarea per element, nominal
2 2(ft2) 0.262 (0.024 m ) 0.151 (0.014 m )Fuel Rods
Rod diameter (in.) 0.617 (15.4 mm)Fuel rod stack length(in.) 29.71 (0.74 m)
Rod composition Bonded fissile and fertileparticles in specified fuelcompositions
Hexagonal Reflector Elements
Number required 3267 (including 12 C's listedbelowb
18

TABLE III (cont)
Shape Hexagonal right prism
Material Graphite
Width across tlats (in.) 14.17 (0.35 m)
Length (in.) 31.22 (2041 elements) (0.78 m)15.61 (1129 elements) (0. 39 m)23.41 (97 elements) (0. 59 m)
Coolant channel flow areain top and bottom reflec-tor elements, nominal
2(ft ) 0.325 (0.029 m )Interconnecting dowels 3/ element
Top Reflector and PlenumElementsb
Number required 607 total (522 A's; 73 B's; 12 C's)
Shape Hexagonal right prism (A, B, C)
Material Steel (A, B); graphite (C)
Width across flats (in.) 14.08 (A, B); 14.17 (C)(0.35 m); (0.35 m)
Length (in.) 15.61 ( A) ; 23.41 (B, C)(0.39 m); (0.59 m)
Interconnecting dowels 3/ element (A, B, C)
Core Arrangement
Pitch of fuel columnswithin refuelling region(in.) 14.21 (0.36 m)Number of fuel columns 493
Number of hexagonal side-reflector columns 114
Number of large side-reflector block columns 36
Number of control rodchannels 146 (2 per fuel region)
Number of reserve shutdownchannels 73 (1 per fuel region)
Number of refuleingregions 85 (73 in active core; 12 in
reflector)
Refueling region pitchspacing (in.) 37.71 (0.94 m)
19

TABLE III (cont)
Effective active corediameter (ft) 27.7 (8.3 m)
Active core height (ft) 20.8 (6.2 m)
Equivalent side-reflectorthickness, includingshield (in.) 40.5 (1 m)
Top and bottom reflectorthickness, each withoutcore support (in.) 46.8 (1.2 m)
2Lattice cell area (in.2) 175 (0.11 m )
Nuclear Characteristics (initial core)
Core power density(kW/ liter) 8.4
Core specific power(kW/kg 235U) 1740Average neutron flux
(n/cm2 s)/
Fast (>0.18 MeV) Inermal (<2.38 eV)
13 14Beginning of cycle 5.08 x 10 1.05 x 10
13 14End of cycle 5.15 x 10 1.32 x 10
C/Th ratio 214
C/235U ratio 4350
Fuel loading (initial core)
Th (kg) 37487
U (kg) 1725
Average loading per fuelelement
Th (kg) 9.5
U (kg) 0.44
5 U enrichment (%) 93.15
Fuel element lifetime(yr) 4
Average conversion ratio,initial core 0.68
20

TABLE III (cont)
Average burnup of U andTh (mwd / ton) 98000Control rod system worth,initial core
Maximum worth of onepair, operating (Ak) 0.015
Total worth, operat-ing (Ak) 0.258
Maximum worth of onepair, subcritical(Ak) 0.066
Nominal reserve shutdownsystem worth, initialcore (Ak) 0.15
Prompt neutron lifetine,initial core, operating
_4(s) 4.1 x 10
Thermal and Hydraulic Paramete s at Reactor Design ConditionsGross reactor thermalpower [MW(t)] 3000Total coolant flow at
6core exit (1b/h) 10.936 x 10 (1378 kg/s)
Coolant inlet to core( F) 639 (610 K)Mixed-mean coolant tem-perature at core exit ( F) 1392 (1030 K)
Coolant channel frontalarea fraction, coreaverage (1) 20
Total core coolant chan-nel f flcw area
2)rontal(ft 121 (10.9 m )Average fuel rod tem-perature ( F) 1634 (1110 K)Average moderator teu-perature in active core( F) 1362 (1010 K)Average coolant channelsurface heat flux (BTU /h-
2ft2) 66000 (208 kW/m )
21

TABLE III (cont)
Average coolant Reynoldsnumber 59000
Average coolant surfaceheat transfer coefficient 22(BTU /h-ft - F) 285 (1.62 kW/m _g)
Core inlet pressure (psia) 725 (5.1 MPa)
Total core pressure drop,maximum (psi) ll.5c (80 kPa)
Volume of active core 3(ft3) 12500 (370 m )
aSee note a, Table I.
bA - top keyed reflector and plenun elenents; B- top controlplenum elements; C- top region center reflector elements.
c Includes drop of 1.5 psi (10. 5 kPa) across core support floor.
F. Reactivity Control and Shutdown Systems
Reactor control is provided by 146 control rods operated in
pairs by 73 control rod drives. The drives are in PCRV penetra-
tions located above the center column of a refueling region. The
control rod drives are electrically powered winches that raise and
lower the control rods by means of flexible steel cables. Gravi-
tational force acts to incert the control rods into the core during
a trip. Each control rod is composed of articulated segments and
each segment consists of a metal container filled with boron car-
bide dispersed in a graphite matrix.
A manually actuated reserve shutdown system utilizing boron-
ated graphite pellets is provided for backup shutdown capability.
The pellets, which are contained in hoppers located in the refuel-
ing penetrations,are released into a channel in the center column
of each refueling region by an electrically actuated gate. The
reserve shutdown system is sufficient by itself to achieve and
22

maintain reactor shutdown from hot operating conditions to room
temperature without the use of control rods.
The reactivity control systems design and performance charac-
teristics are shown in Table IV.
G. Prestressed Concreto Reactor Vessel
The PCRV is a thick-walled, multicavity cylindrical pre-
stressed concrete structure. The PCRV general arrangement is shown
in Fig. 2. The PCRV is cons' Jucted of high-strength concrete rein-
forced both vertically and circumferentially with reinforcing steel.
Prestressing of the vessel is accomplished by two independent sys-
tems: vartical prestress is achieved by unbonded internal longi-
tudinal tendons and circumferential prestressing consists of multi-
layered bands of strand wound under tension into channels precast
in the surface of the vessel walls. The PCRV is cast integrally
with the support structure. The central cavity of the PCRV contains
the reactor core, reflector, core cupport structures, and upper and
lower plenums. Steam generator cavities and auxiliary cooling loop
cavities surround the central core cavity. The steam generator
cavities contain the stean generators and the helium circulators;
the apper end of each steam generator cavity is closed by a compos-
ite steel and concrete closure. The auxiliary cooling loop cavities
contain the CAHEs and auxiliary circulators and are closed with
steel closures integral with the CAHEs and auxiliary circulators.
The steam generator and auxiliary cooling loop cavities are connec-
ted to the core cavity by cylindrical cross ducts. All cavities
and cross ducts are provided with carbon steel liners that contain
the primary coolant within the vessel.
In addition to major penetrations into the steam generator tnd
auxiliary cooling loop cavities, the PCRV top head contains one
refueling penetration into the core cavity for each fuel region.
There are also penetrations for primary coolant instrumentation and
process lines and helium purification system filter adsorbers.
The bottom head of the PCRV has five major penetrations to each
steam generator cavity and several minor instrumentation penetrations.
23
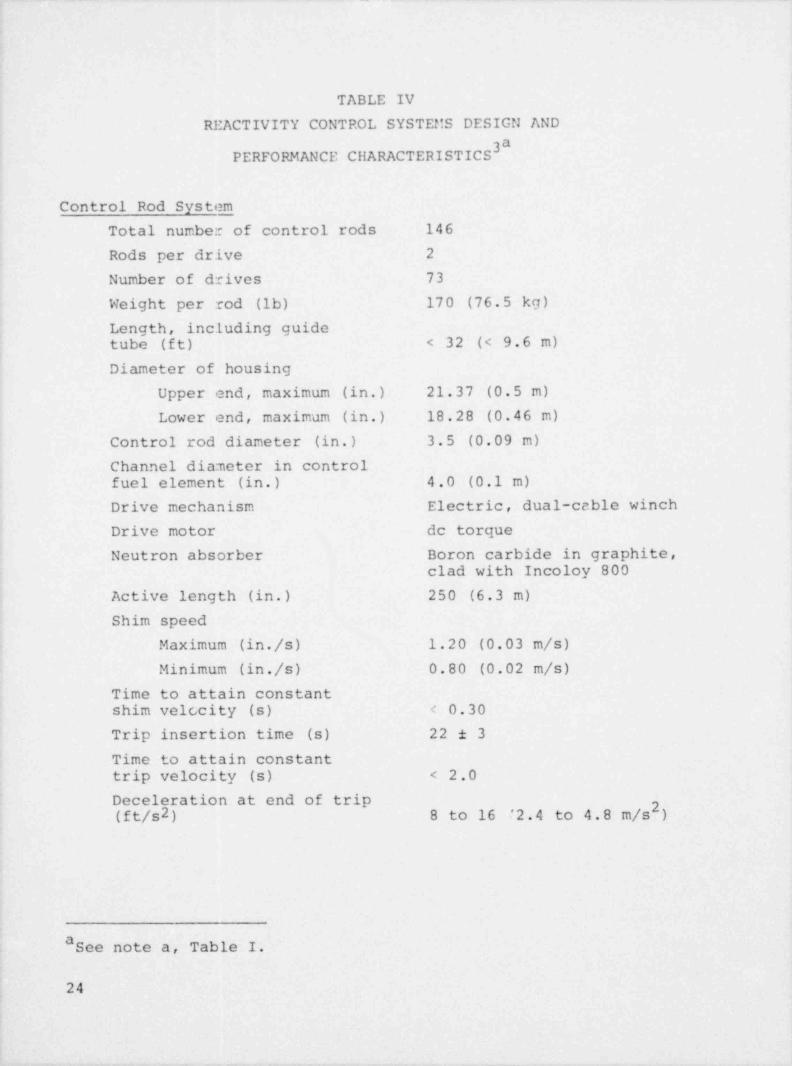
TABLE IV
REACTIVITY CONTROL SYSTEMS DESIGN AND
PERFORMANCE CHARACTERISTICS
Control Rod System
Total number of control rods 146
Rods per drive 2
Number of drives 73
Weight per rod (lb) 170 (76.5 kg)
Length, including guidetube (ft) < 32 (< 9.6 m)Diameter of housing
Upper end, maximum (in.) 21.37 (0.5 m)
Lower end, maximum (in.) 18.28 (0.46 m)Control rod diameter (in.) 3.5 (0.09 m)
Channel diameter in controlfuel element (in.) 4.0 (0.1 m)
Drive mechanism Electric, dual-cable winch
Drive motor de torque
Neutron absorber Boron carbide in graphite,clad with Incoloy 800
Active length (in.) 250 (6.3 m)
Shim speed
Maximum (in./s) 1.20 (0.03 m/s)Minimum (in./s) 0.80 (0.02 m/s)
Time to attain constantshim velccity (s) < 0.30
Trip insertion time (s) 22 3
Time to attain constanttrip velocity (s) < 2.0
Deceleration at end of trip(ft/s2) 8 to 16 ?2.4 to 4.8 m/s2)
See note a, Table I.
24

TABLE IV (cont)
Uorth (Ak)Hot Cold
Total 0.258 0.253
Maximum worth of onepair (all others in) 0.068 0.066
Minimum shutdown margin 0.181 0.123
Reserve Shutdown System
Type Pellets in hopper
Neutron absorber 40 wt% boron carbide ingraphite
Number of hoppers 73
Insertion mode Gravity
Release mode Electromechanical gate
Removal from core Vacuuming
Channel diameter in controlfuel elements (in.) 3.75 (0.09 m)Worth, no control rods in(Ak)
Hot ColdTotal 0.155 0.154
Shutdown margin (allhoppers in) 0.079 0.021
Penetrations are provided through the PCRV sidewall for core outletthermocouple penetration;. Each penetration is provided with a
metallic liner that is continuous with the cavity liner. The top
head of the PCRV also contains a number of wells for storage ofreflector blocks and control rod drives.
Except for the refueling penetrations, the auxiliary coolingloop cavities above the primary closure, and a few instrumentationpenetrations, the inside surfaces of the vessel liner and penetra-tions are lined with a thermal barrier to protect the PCRV from thehot helium primary coolant circulating within the vessel. The heat
25

that passes through the thermal barrier is removed by cooling watertubes that are welded to the concrete side of the PCRV liner.
H. Plant Control and Protection Systems
There are three major instrumentation and control systems.
1. The plant control system, which maintains reactor powerand turbine inlet steam conditions at required values.
2. The protection systems, which include the reactor trip,engineered safety features instrumentation, and systemsfor equipment protection.
3. The monitoring systems, which provide information dur-ing normal or abnorral operations.
1. Plant Control Systems (OCS). The overall automatic plant
control consists of three major closed loops that minirize devia-
tions of main steam pressure, main steam temperature, and reheat
stean temperature from programmed setpoints. One loop controls
the main steam pressure at the inlet of the high-pressure turbine
stop valves by regulating the feedwater flow. The second loop con--
trols the average of the main steam temperatures at the steam gen-
erator superheater outlets by varying helium flow through the steamgenerator loops. The helium flow is varied by controlling the
speed of each helium circulator. The third loop controls the aver-
age reheat steam temperature at the outlet of the steam generators
by adjustint reactor power. Changing turbine load is used in this
loop to cause the reactor power to follow the load.
Seventy-three rod drive assemblies are located in the top headof the PCRV. Each rod drive operates a pair of control rods. The
center rod pair controls reactor power level as required by the
average reheat steam temperature control. The remaining control
rod drives are divided into 6 sectors, each corresponding to a
steam generator, with 12 rod pairs per sector. Three rod pairs in
each sector are used to balance the core power distribution and
steam generator helium inlet temneratures. The remaining nine rod
pairs in each sector are for shimming.
26

2. Protection Systems. Two protection systems are incorpor-
ated in the design concept. A plant protection system (PPS) is
provided to prevent conditions that could affect the health and
safety of the public. The operational protection system (OPS)
protects major plant equipment and protects against conditions that
could reduce plant availability.
a. Plant Protection Systen. The PPS includes the fol-
lowing functions: reactor trip- operation of the core auxiliary
cooling system (CACS): operation of the containment isolation sys-
tem; operation of the steam generator isolation and dump feature:
operation of the reheater isolation feature; ooeration of the con-
tainment pressure protection system; and operation of the CACS heat
exchanger isolation system.
b. Operational Protection System. The OPS includes the
following, nonsafety-related functions: initiation of main helium
coolant circulator service system isolation and shutdown of primary
and secondary coolant loops for protection of equipment; limiting
of undesired increases in power by preventing control rod with-
drawal; and initiation of reactor power runback to avert reactor
trip.
III. IITGR ACCIDENT SEQUENCES
A. Introduction
The hazards from HTGR power plants involve the radioactivity
formed by the fission process. In normal operation, HTGR power
plants release minute amounts of this radioactivity undei controlledconditions. In the event of highly unlikely accidents, larger
amounts of radioactivity could be released and could cause signif-
icant hazards.
Most of the fragments of the fissile and fertile atoms that
remain in the fuel after fission and neutron capture are radio-
active. These radioactive atoms, called fission products, disinte-
grate further with the release of nuclear radiations. Many decay
quickly, in a matter of minutes or hours, to nonradioactive forns.27
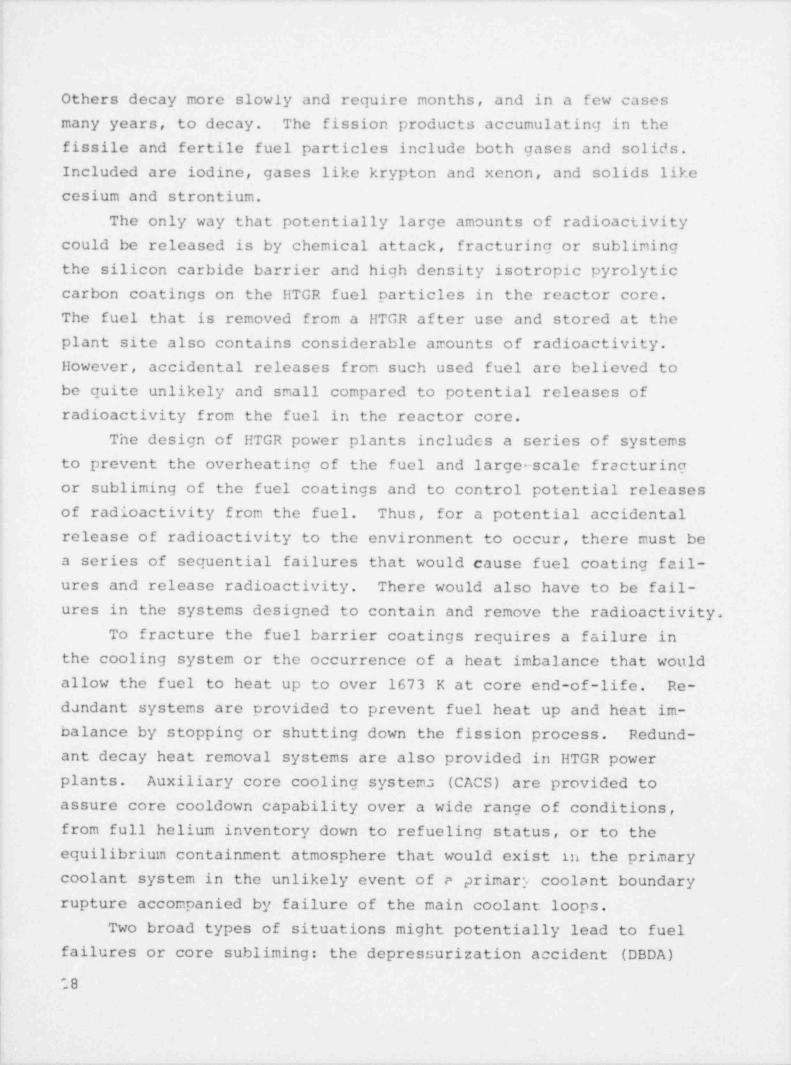
Others decay more slowly and require months, and in a few cases
many years, to decay. The fission products accumulating in the
fissile and fertile fuel particles include both gases and solids.
Included are iodine, gases like krypton and xenon, and solids like
cesium and strontium.
The only way that potentially large amounts of radioactivity
could be released is by chemical attack, fracturing or sublining
the silicon carbide barrier and high density isotropic pyrolytic
carbon coatings on the HTGR fuel particles in the reactor core.
The fuel that is removed from a HTGR after use and stored at the
plant site also contains considerable amounts of radioactivity.
However, accidental releases from such used fuel are believed to
be quite unlikely and small compared to potential releases of
radioactivity from the fuel in the reactor core.
The design of HTGR power plants includcs a series of systems
to prevent the overheating of the fuel and large-scale fracturing
or subliming of the fuel coatings and to control potential releases
of radioactivity from the fuel. Thus, for a potential accidental
release of radioactivity to the environnent to occur, there must be
a series of sequential failures that would cause fuel coating fail-
ures and release radioactivity. There would also have to be fail-
ures in the systems designed to contain and remove the radioactivity.
To fracture the fuel barrier coatings requires a failure in
the cooling system or the occurrence of a heat imbalance that would
allow the fuel to heat up to over 1673 K at core end-of-life. Re-
dandant systems are provided to prevent fuel heat up and heat im-
calance by stopping or shutting down the fission process. Redund-
ant decay heat removal systems are also provided in HTGR power
plants. Auxiliary core cooling systems (CACS) are provided to
assure core cooldown capability over a wide range of conditions,
from full helium inventory down to refueling status, or to the
equilibrium containment atmosphere that would exist in the primary
coolant system in the unlikely event of a primary coolant boundary
rupture accompanied by failure of the main coolant loops.
Two broad types of situations might potentially lead to fuel
failures or core subliming: the depressurization accident (DBDA)
'. 8

and transients. In the event of a potential depressurization, the
normal helium coolant would be depressurized and the coolant would
become the equili) :ium containment atmosphere. Fuel damage would
be prevented by the use of the main loops or core auxiliary coolingsystem to maintain forced circulation core cooling. However, fuel
damago, graphite oxidation, and subliming could occur following
depressurization if the main loops and the CACS were to fail to
operate.
Transient refers to any one of a number of conditions that
could occur in a plant and that require the reactor to be shut down.
Following shutdown, systems operate to remove the decay heat andto keep the core from overheating. Certain failures in either the
shutdown or systems removing the decay heat also have the potentialto cause fuel failure, graphite oxidation, or subliming of the core.
HTGR accidents that have the potential to release large arounts
of radioactivity may be classified into two general types: those
resulting from severe power generation to heat removal imbalances
following reactor shutdown and those resulting from severe power
generation to heat removal imbalances during power operation.The first type of accident may result from losses of either
adequate forced helium circulation or adecuate decay heat renovalfrom the helium following a reactor shutdown.
The second type of accident may result either from undercool-
ing by loss of either adequate helium circulation or cooling of
the helium without reactor shutdown or from reactor overpower
transients. Thcse accidents involve failure of the reactor to
shut down; due to the high reliability that is expected for the
reactor shutdown systems, these accidents will not be investicated
in detail here. It should be noted that failure of the reactor
shutdown systems does not automatically result in significant fuel
failure.
B. Methodology
The principal effort of this study is directed at the analysis
of potential HTGR accident secuences that may result in significant
29

fuel failure following reactor shut downs. Potential accident
sequences following failure of the reactor to shut down are not
analyzed in detail. Figurc 7 shows the principal elements of the
delineation method.
This study was structured to establish a quantitative frame-
work in which to identify the relative importance of system con-
cepts and components to safety. This objective basis is needed
for the assessment of safety issues and to provide guidance for
safety research. The possibility of accident initiating events
and the possible inability of system features to mitigate their
consequences, i.e., releases of radioactivity to the environment,
constitute a hazard to the public. The sum, over all possible
initiating events, of all possible consequen_es weighted by their
respective probabilities, forms the overall risk from potential
nuclear accidents. Thus, the full characterization of risk, in-
volving a very large number of initiating events and consequences,
is a formidable task. Determination of overall risk is believed
to be unnecessary for establishing a first-order assessment of the
relative importance of potential accident initiating events and
consequence mitigating functions. A latent hazard index, which is
proportional to the expected latent fatalities in the population
at risk will be defined in a later section to serve as the quanti-
tative consequence of possible accident sequences. Combination of
this index with its associated probability and frequency is a meas-
ure of the contribution of the initiating event to the overall risk.
Two quantities need to be developed to provide a measure of
the relative importance of system design features and accidents.
T -',m,.,
~~ , ~ , ,
' ',-
*[. n. e m, s .e %, . . . -. ,x_, e.
. . . . .
'x /o . . . .* "2c'_ . . . ~ . . . .
,,
''r? ' "7.
Fig. 7. Elements of typical accident delineation.
30

First, the determination and evaluation of hazard indices permits
ranking al.d selection of significant (in terms of consequence
magnitudei secuences for analysis. Secondly, the determination of
the sequence probabilities, including their frequency, and weight-
ing of the hazard indices by these probabilities, permits further
ranking and selection of the most significant (in terms of relative
contribution to overall risk) accidents for analysis.
In order to quantify the consequence (hazard index) of a se-
que~ a, it is necessary to know the potential initiating events
and _esulting s quences of mitigating actions, the associated
radioactivity releases to the environment, and the effects on the
health of the public. The hazard index, a measure of the signif-
icance of a sequence, depends only on the sequence of events lead-
ing to possible failure to remove heat fror the core in most of the
possible accidents. However, some possible initiating events are
responsible for direct releases of radionuclides that may add to
releases resulting from possible failure to adequately cool the
core to form the hazard index of the sequence.
In order to quantify the relative contribution to overall
risk of the possible accident sequences, it is necessary to deter-
mine additional system detail. In principle, it would appear
necessary to identify all accidents, particularly those that can
produce significant releases of radioactivity. This is clearly
impossible because of the very large number that can be perceived
and because all possible accidents or initiating events cannot be
imagined. This problem is made tractable by establishing general
initiating event categories (Table V) according to the effect of
the event on shutdown coolirq perfcrmance. This will be discussed
in the following section. It is believed that all possible initiat-
ing events may be assigned to one of the four categories. Operating
experience and fault tree analyses can be used to provide some
estimates of the frequency of specific events. However, the fre-
quency of the initiating event categories, required for overall
risk assessment, cannot be completely specified.
Determination of the event sequences is required for the
assessment of the importance of system design features and possible
31

TABLE V
REACTOR SHUTDOWN INITIATING EVENT CATEGORIES
C,.TEGORY I - Initiating Events Not Affecting the Performanceof Either Shutdown Cooling System
IA - Innocuous Trips
IB - Trips Initiated by Failures in Systems That AreUnrelated to the Shutdown Cooling Performance
CATEGORY II - Initiating Events Degrading the Main Loop Shut-down Cooling Performance
IIA - Initiating Events Affecting Only a Single MainCooling Loop
IIB - Initiating Events Affecting More Than One MainCooling Loop
CATEGORY III - Initiating Events Degrading the Performance ofthe Core Auxiliary Cooling System
IIIA - Initiating Events Affecting One Core AuxiliaryCooling Loop
IIIB - Initiating Events Affecting More Than One CoreAuxiliary Cooling Loop
CATEGORY IV - Initiating Events Degrading the Performance ofBoth Shutdown Cooling Systems
IVA - Initiating Events in Support Systems
IVB - External Initiating Events
IVC - Internal Initiating Events
initiating events to safety. Event sequence diagrams are construc-
ted to model the HTGR shutdown heat removal systems operations forthe reactor shutdown initiating event categories in Table V. Theevent sequence diagrams, a generalized modeling to account for
major system interdependencies in the hTGR shutdown operations,identify the various possible outcomes of a given category ofinitiating event. They also show the options of applicable system
availability and how the sequence outcomes may be affected by fail-ures in these major systems that are necessary for mitigation of
the effects of the initiating events One set of event sequence
diagrams is developed for the analysis of radionuclide releases to
32

the containment building from potential accidents involving the
core. A second event sequence diagram, the containment event se-
quence, is constructed to nodel the possible performance of major
containment system elements that are important to the release of
these radionuclides from the containment building to the environ-
ment. The combination of these two types of event sequence diagrams
describes the possible options of applicable system availability
from the initiating even*. to the possible releases of radioactivity
to the enivronment.
The system is modeled to reflect the shutdown heat removal
represented by each path of interest in the event sequence diagram
and to determine the magnitude and composition of the possible re-
lease of radioactivity to the environment. Differences in design
performance capabilities of the plant shutdown heat removal systems
with varying PCRV pressurization require separate shutdown cooling
systems modeling to determine the event sequence outcomes. Al-
though both the main loops and the CACS are capable of operation
from normal pressurized conditions to depressurized, containment
atmosphere equilibrium conditions in the PCRV, their performance
varies with these conditions. Therefore, two cases, pressurized
and depressurized PCRV, will be considered in the shutdown cooling
systems modeling. When the PCRV is depressurized, there is an
additional cooling performance dependence on the containment integ-
rity, which detcrmines the pressure history in the containment
building (i.e., circulator back pressure) and the composition of
the gas coolant.
Also needed for quantification of the relative contribution
to overall risk are the availabilities of the various system options
in the event sequences. A combination of system event and fault
trees is used to provide these probabilities. These trees will be
discussed in a later section of this report.
The addition of specific initiating events changes the shut-
down event sequences into accident sequences. Some initiating
events in a HTGR power plant, such as loss of integrity of the
primary pressure boundary, can potentially lead to a wide range of
accidents, each composed of a series of events called an accident
sequence.33

Each accident sequence depends not only on the particular
initiating event but also on the success or failure of the shutdown
heat removal systems and various systems installed in the plant
to perform mitigating functions. A broad spectrum of accident
sequences can occur, each with a probability and magnitude of
radioactivity release dependent on the operability state of these
systems.
C. Initiating Events
Adequate core cooling may still be maintained by the main
loops following certain initiating events that normally cause re-
actor shutdown but in which shut down fails. Thus, the probability
of significant fuel failures due to the failure of the reactor to
shutdown should be less than the failure probability of the reactor
shutdown systems. If it is conservatively assumed, however, that
failure of the reuctor to shutdown leads to significant fuel failure,
the possible accident initiating events are 11 events that can
initiate a reactor shutdown or that require te reactor to be shut
down. These events include innocuous shutdowns, shutdowns result-
ing from anticipated transients, and shutdowns resulting from var-
ious accident initiating events.
This large number of possible individual shutdown initiating
events will be divided into separate initiating event categories.
Since the HTGR has two shutdown cooling systems, it is logical to
group the initiating events according to their affect on either
shutdown cooling system, i.e., either the main loop or the CACS.
A category for those initiating events that do not affect the shut-
down cooling performance of either system is also considered. Table
V lists these categories and their major subcategories.
D. Event Sequences
The event tree methodology, as developed in the Reactor Safe-
ty Study,1 was aimed at describing system availabilities for deter-mining accident sequence probabilities to be used in a plant overall
risk evaluation. In subsystems where more than two states, available
34
and unavailable or success and failr.re, existed, a conservative
judgment had to be made. In some systems, this approach may ignore
partially successful operating states. In the HTGR there is a
strong dependence between overall core heat removal and the oper-
ating states of the main loops and the CACS. The six main loops
are identical and have a degree of independence. The three core
auxiliary cooling loops are identical and also have a degree of
independence. This study attempts to consider this independence
and the possible contribution of partial system function to safety.
Functional event trees or event sequences are developed to model
the plant responses to initiating events. The functional event
sequences help in the understanding of the basic modeling, in the
ordering of the functions, and in establishing general dependencies
among the major systems. These sequences also describe the overall
system success or failure and include detail of the different de-
grees of success or failure that exist in the HTGR; however, the
sequence is of limited usefulness in analyzing the detailed plant
operations. Detailed description of the systen capabilities and
consideration of the various successful operating states are re-
flected in the fault tree models having outcomes or top branches
that identify with the operating states of the system in the event
sequence.
E. System Fault Trees
In order to describe the operating or failed states of a sys-
tem, logical diagrams (Appendix A) of the system are constructed.
These formal logical diagrams show the conditions, i.e., functional
or failed, of the system components that are necessary in order for
the tree top condition or outcome to be achieved. The tree out-
come is a predetermined system state (condition) of interes In
this study, in addition to describing the failure state, we are
concerned with determining the paths and components that will per-
mit the operational or functional system states to exist. The
limit of resolution of the fault tree is determined by the lowest
level of component conditions modeled in the logical diagrams. In
35

this study, the fault tree logic starts at the black box level.
That is, we consider the demand and operational availability of
valves, pumps, pipes, motors, etc. In assigning probabilities to
the demand and operational availabilities, we include considera-
tions of fault subtrees that include estimates for command fail-
ures, wiring failures, failure of minor electrical and mechanical
components, circuit breaker malfunctions, etc., associated with
the function of the black boxes.
Initiating fault trees are constructed to delineate the causes
that result in the postulated initiating system condition or ini-
tiating event. These fault trees are evaluated to determine the
modes by which the initiating event can occur and to obtain the
probability of occurrence. System fault trees, constructed to
show the functioning states of a system, are similarly evaluated and
quantized to show the availability of the event sequence branches or
the probability that the system will be in the indicated functional
state at the time of occurrence of the initiating event. For some
event sequence branches, we consider the possibility that the sys-
tem will function properly upon denand but may subsequently fail
to function during the time period when it is required to function.
For some specific initiating events, we consider the possibility
of timely repair or restoration to operational status of systems
that were failed by the initiating event or whose failure was the
initiating event.
" AND , " "OR, " and "INIIIBIT" gates are used (Appendix A) in logic
space to represent the fault trees. Unique components in the fault
trees are assumed to be independent. Logic has been provided to
account for identifiable common mode conditions in logic space and
for system or component test and maintenance.
Equations representing the redundant or independent systems,
common mode elements, and test and maintenance conditions in logic
space are expressed in reduced forms (Appendix A) that show the
unique modes by which system function and failure can occur. These
sets can be automatically evaluated in probability space by computer
codes.
36
F. Probability of Accident Sequence
Combination of an initiating event and an event sequence in
event space forms an accident sequence. In general, many accidents
are possible when a specific initiating event exists.
To provide a basis for the ccmparison of the importance of
the possible accident sequences and of the possible accidents, it
is necessary to develop the probability of the sequences (Appendix
A). The product of frequency of the initiating event, in events
per unit time, and the probability of the event sequence is the
probability of the accident sequence in events per unit time. Ac-
cident sequences could be compared on the basis of this quantity.However, many possible sequences have significant probability of
occurrence but their con /equences have no impact on the health and
safety of the public. Other sequences having very small probability
of occurrence, but potentially significant public hazard, are pos-
sible. Thus, it is desirable to also develop consequences of the
sequences for use in conjunction with the probability of the se-
quence to obtain a measure of the importance of the accident. This
is done by system modeling and assessment of the system responseto the accident sequence.
G. System Models
The system is modeled by computer codes for each accident se-
quence of interest. Conditions delineated in the event sequence
are imposed on the model. The responses of the model are used to
determine the release of fission products and hazardous gases from
the primary system (Appendix C). Performance characteristics, ap-
propriate to the accident sequence under consideration, for the
containment engineered safety features are used in the containment
system model (Appendix B) to determine the radionuclide releases
to the environment. Generation of hazardous gases and the potential
for explosion and fire in the PCRV and containment building are
considered in the sequence consequences.
37

H. Consequence of Sequence
A latent hazard index was developed (Appendix D) to establish
a consequence of the sequences. This index and the probability of
the accident sequence were used to establish the relative import-
ance of the possible accidents and sequences. These latent hazard
indices quantify the relative potential of the various released
radionuclides for producing latent fatalities in the exposed
population.
The magnitude of these indices is determined by the following
parameters:
1. Inventory of the radionuclide released from the coreto the containment building atmosphere,
2. Radioactive decay, plate-out, and cleanup of theradionuclides inside the containment building,
3. Total radionuclide leakage from the containment build-ing to the environment,
4. Dose conversion factors for converting the cloudconcentrations into an organ dose (rem /Ci-s/m3) forimmersion in the cloud,
5. Dose conversion factors and breathing rates for con-verting cloud concentrations into an organ dose(rem /Ci-inhaled) for inhalation of the cloud, and
6. Dose-risk factors for converting organ dose intolatent fatalities (expected deaths /million-man atrisk-rem).
The magnitude of the expected latent fatalities in the population
at risk is proportional to the latent hazard index.
For these initial calculations, two exposure modes -- external
from immersion in contaminated air and internal from inhalation --
and two latent health effects -- leukemia and thyroid cancer --
were chosen as contributors to the latent hazard index. Thus, these
initial calculations do not include all possible hazards. An
initial list of 17 isotopes was selected for analysis from the
nuclide inventory for the HTGR (Table 11.1-5, Chapter 11 of
38

GASSAR ). The necessary dose conversion factors and dose-risk
correlations were taken from Appendix VI of the Reactor Safety
Study.1
IV. ANALYSIS RESULTS
A. Introduction
The analysis was organized and conducted with an objective of
producing results that have potentially broad application to quanti-
tative assessments of safety concerns. This objective has been
satisfied in one area of the first phase of the analysis by group-
ing potential accident initiating events into initiating event
categories (Table V) and constructing quantified event sequence
diagrams applicable to each of these categories. This approach
differs from other analyses that start with an initiating event,
which is postulated or derived by fault tree analysis,and continue
through the development of an associated event secuence. The event
sequence diagrams were quantified using fault tree analysis of the
conceptual system designs in Figs. 5, 6, and 8. These conceptual
designs do not necessarily reflect all redundancies and system fea-
tures that may contribute to system reliability and availability.
Event sequence diagrams (Figs. 9 through 15) associated with the
general initiating event categories contain qualitative estimates
of branch outcomes for sequences that have been modeled. These
estimates of outcome are based on the design values of shutdown and
decay heat removal performance in Sec. II of this report.
Additional analyses needed to complete the objective of this
task, a quantitative framework for accident delineation, decision
making, and analysis of the important safety concerns have been
precluded by termination of the task effort. These additional
analyses are outlined in the following paragraph to show the re-
lationship of the work that has been completed to that perceived
as being necessary to achieve the objective of the task.
The next phase of the work planned for this task was to
analyze each initiating event category to determine the relative
39

.cno
Vlt . ..vio
Crculator aAuxibery #yFOL@ Eboiler ..,
| eV25o H6gh preneure
V26e .. , V3 thV28b
*
4, Circulator' youp IMain%% ,L (typ of 2 groupe)(Typt
Vl8o Atm r -- Reheater '% | V22
'"M_ j p of 3) *T MFWPTurt (typ of Z) &f4Wg
E=5tv6 I"
-V21b 21e v23 3rI steem knehh Crculator Atmk ;
(typ of 3) seySuper-heater' Vl3 LV8e Veblever-ecen y V7 N e
le
(typ' 3 leapel sggi(typ of 2) i ,yp-%
VI ( %
V17 V20e 6,. y "
VM h wetw' youp I \ VIOegroup E (9,, ""
3 leapel VKb t, SV106' '
V14 eintermedetew Main feed-water
A pressure'I SG E + pump I (typ of 2) urhasFoup g 4 fp MFWP II .
fu ,,Flash tank I
\ / low preseureIPMot" turbee
To auxihery A,
I-- Mom
boiler 'I A 'e condenserV27e V
Auxiliary feed-water(purnp (typ of 2) yT ,
* Decerator 8 LFeed-water DominereWrer \jf**te purrpostorage tank heater
Fig. 8. HTGR secondary coolant system flow diagram.

tem.m 3"of400s av i. . met
eendiaTM 'e08 3 58e4 GW ME514 %'e'A6
crh %u
sta.cT.oe stie.v M.*.g vg<ea f ., svg?ew
4 ~e. .
m .. ,. ..- ... -, )
c=+3, " "Mhe -i Gee! 3 , m.5bM
, m===-A-e,e,-.q4 8 a t0 *
a 40-9 r3 (C . pt
200 e sa 8 6 pt . 0^ ' e teJ e 94
i LW
is . r,
* ' _ * " . " . ' . ' " .tv. 1.5 e
p_en_.. ._ .. . -
. . _ _ .., , , , . . .,-
eras.s*asa.i%..s.,., It. .. a,...... - <
0tw
. .<'rat ea sa ti
1)eO # * v. 4, <w== coem*si. . .e a e
g anI d
. .e + i ' <
r,
s. .a
, , , , , , > cca,.gi aa y
.. nassu'e n . .a *
sa t ea
. . io - is
g .. . , - -<
,
,..
e to *,s ' 4 vet
|
---+--..--4
..
iss . im>s., ee. - e ,s: . s
; .73
'is e
3 .64 F
1, v. . a .,,,3
-
umn =a . J
sos&g < |H
3 M s 'O '
s
..
.. v.&
. c ! co,? 5 .2.
.
.* | m2.s
Je
( 04 1a
,.. , ,
I
b ' y.'iI
3.f6 ew . c
I r.ai s
,
, xaxse s >
.
..c
.. .
..c' re n ei . . . ' . e
: ,
e.
A- - i ,.,,*< et a
$' 4& + OrDA uS *.
>..c-e i e..<,d
, 2 ,o
,
' '
. we .
ae esm*. i . ,ol'as- ( r
. , wwxsa..* e'
p .. esFig. 9a. 2"'e
Event sequence for Category I initiatingevent, turbine trip - systems functionon demand. , , " , , , , 1 'e x. '.'
* at
,Pas ty
COO. M * s
6 01 t
ts es
Ie ff * 1g
41

so me naa 48118%' At LJJ8 31A1414 Net
.g,* stas s a NX,6 *, stwe e han mete
gesg* St ACTO 4 plan t e $4* f e 98 mot .asn,e ved es* g m- 4 SS'f W
9 se,t e HP ' to e 9 '6etua..we ' = *
.i,,,,
%,. - - - - p - - -q3...
. . . . . , i m.
. . . . . i. a as . oA sr* -
...e .,n ..
6' % '#3 D=lp WBWrF9m
..u,. .ms e.,,.e_ ,
Q. . .e. , .a .w - e.n.
.
e,- c'
bc e s.ie *.
- .s
. . .e
Liv.:8
9 5 m 'O '
ss
: . ic -
jr e<bJ., - 3
- 1 1
,.
ew. .
.. .
A
Ie 91 '' t
je asLJ , . / /
s 49a* * , ,-
. . . |_ _ _ _ yEe. o -
L. . .. , , -,
24- ,s = ic
>
.n.
|,
e ei
! '
..
, s
A IJ s et
"t
. .x
, - , .
ae
J'
&
1m *t'
, , . .
l
...s.-
*
,
.. . . .
s i .: ' eu.a a e*
*Me C
.
a
er. a
|( re-a
: *
e' 0
%
a s m .e 4
:. 1
I \, L.
n.o
Fig. 9t
Event sequence for Cetegory I initiatingevent, turbine trip - systems f unct ion at300h following event.
|.w . m
...e*
?} a *C I@42

MAIN CORENON. LOOP AUXILIARY
INITIATING R E ACTO R ESSE NT I A L COOLING ESSE NTI A L COOLING
EVENT TRIP ac SYST E M POW E R SYST EM
TYPE (a) POW E R (b) IE Ic), , ,,
, i a i
- 1.0 9.99 x 10- ' O - -
LOSS OF 3 MAINON
COOLING LOOPS (3 LOOPS) , _ _ _ ___
(~ 1.3/yr ) 9 6 x 10 -
(Fall) ,- - - -{- -
4x10⁻²a) Turbine is triptwd
by the event (1 BUS)___ _______
b) Operating on 1 x 10auxihar y Miler COOL ON( (3 LOOPS) ,----b-~~-d MAIN LOOPSc) Reactor pressorued a i
9.6 x 10 ~ 'd) Supply of pour is
; :::,'',' ::: ; - - - - 4 - - - - -l''''",
"cooldown
(3 BUSl (3 LOOPS):u ,____8 93 x 10-' 9 98 x 10"
,
' '
1x 10 3(f 2 LOOPS) ,
" 18x 10-3'
11 LOOPn ,' p'41.1 x 10 COOL AT
*START OF
IF A ll.) ' COOLOOWN3 x 10-6 (
o '' ""5' -----I1.03 x 10-,
( (2 LOOPS) ,
N 988 x 10-''
'
\ (1 LOOP) i F All TO'
1.2 x 10⁻³ COOL AT" START OF
(F AIL) : COO LDOW N
3.4 x 10⁻⁶ '.
( 41 BUS 1(di____
3.95 x 10⁻³
z y _ _ _ _3'
\ (1 LOOP) I F All TO
9.994 x 10⁻¹ COOL AT" START OF
(F AI L) I COO LDOWN
6.03 x IO-' 's
(F AI L) (F A IL), ,Fall TO COOL, ,
5 x 10⁻⁵ 1.0
Fig. 10a. Event sequence for Category IIB initiating event, lossof three main cooling loops -- systems function ondemand.
43

esue. .e in, e. n...,.,.,c ...c.,3. = = = . .
.m. . ..
. , . . . act %... .. ax.. .c. .. .ve. . m-,
a. -se * * * * ' * * *
.m.e accel 6 as. ea ,,,c,,,
. - _ 4_ _ _ 4. . . io -
.. ,, , ,.m
u.e' ,e a.e . et '(*s
. n . .e'*ta,.-
..".ie-e,-
..I b Wef.D.e.. *'.m'
e. w ~ .: . ,| 2 , , , ,, .~e==~.. <
,'A.4. e
,
ae....i
a . ,, . e -
es-Ih '*M, .
i e-
-.
.so.
e w . . . -4..
....e
.. .
. . . . i.
,w.., , , ,
..." '' '" --- 4----4
ee..'. ,e4 , i.~.
s . .e - .. ..c'3 aMs.
n.e
1 :*9
a. . . ie
5.
...
Ag.rea..e.o'
1 tc-*
e , . .o -
.a.
....e-
.i
n. e
, , . .e s.- . .e<
4
w
| o w . ie ..
....e-
ea( .a L. , . . * ie
.., ..4 ,.,uv.-
s ., . .o * e s . ,o ' e se . .e -w. .-a. . . .
. m . ie"
vi.
...e>es a
..5
L I e':1
. . . .
2t.. .
...e*
* ;Nie
s e . ,oa
4..
,i. *
j 1,. . ..->>.. .Fig. 10b.
Event sequence for Category IIB initiatingevent. loss of three main cooling loops - ,m
systens function at 300h following event. .w..
. . . -...-4
.- @
e . ta'' t8

. _ . _ . -
__
Ettdices tes e av m aan
part s'in G $5(eti ab LilOS $5644' a6 COosemr,s
t v5 h? at aNOR en @Ot eG OED $vtit etv ert te s p unt s S vtt f u *g in
g 0$$ Os easies 18 9 89 * 'O'' 4
LOOP C00414G I nfYM a _ m m 4 em - _qe
es a g at s.S 99 (Nwg.
e8 9 et a SU'' 9 99 ee6 *
'l tfXM91 M@W85048$338 3
es bip= w se== a
smagpenee b as e 9 Y' I * 4 'OOLA9'Weg 9' Ws4BDe* ggg,qS'a8' 08, ,,,
,,g,w ,
(Of.LOOmhas8 ')3e1
r2 9' St
J' 03 , se *
t ? L '.YM
9 tse a 'e
5+ 9 a:tTGCCOL ag g , gg .staar ce
i ai COCs Doust
3a a
( 94 e# 3 95 sn9- '
. . . |
.w .a.,,
p Weeog ' ML Al'aa' as
'e m. C006 DcJag
t oJ sse *
fa ta
6 m *O * a4
("BM''6 0
t.~m* um m - e 4 emi, e men
o
1 }9 $ 3W
te e t' s'e* S te n *C
a to
' e s 'D ^
'r* ' sa ttoi
n SC ' ' vaa toTdsta
a coc, pan ge3s e ,
( 9.9
3 JS e to *
.? . y e
t een .H=c
Lt 3D #a tto
'2a IC - CCG *l'ar * oe
<a cos,; nag
3eitG * ')
".9*("
.
* sastE**e sEse t
> s'am' c4%DJa m
tus e J
*a a
e 5 e 10 * i
fa a yeg 3,,*,,
II O' i9 8 9) aW' ' 9 ep , 'O '
7 .m
1J G
" ' *
] 'sa . to, og * i.006 al'as' os
8a *pggg g
le Q )( '? 9 Md
i cJ . to '
-e
t tes e a
w en g Tc
4*eJe gi
, y' aa + ce
| a COC 00th
3. , io - >
g.,.. . . .
Fig. 11a.Event seq 2ence for Category IIB initi-ating event, loss of main loop cooling -
..3 .a
systems f unction on deund, m*'.e..e* , rm.t ' c.W'h5
6 0s a'6* s
I .a . .a... . . .. .
45
- . -
. .

IsDb COest%8 4Ea meet SW%*66 e a t.4e t
eg.t .3 * +% SS A{ TCS er EM M08 ht *Eg yg g1 1 949 BOm48 COut ca t, pg g yp pys
t vet es- e+ S*S'IU e %
LOS D. ana.e -ig e e se s 4 ' O
gp hg e (, g. e0m 3 , wwg
6
s 1.= s ms.
is oc e ss . es '1, % 9,
g. tm e .,, egg '#' 8
hNL '.)?
4+ h e somg, o
#1Gaarguee punter ageaaF (EW weere 9d
esey,4se one.e4 0#' b
S' 0819 ="W M $a54 7gg#wpas wemem e. a , ,
Iiye
4 0
,W
GS* O
$
2 i e 90 #
( .S
Ei tr
'#
9 w e 40 '
sa
d44 9
ea
90 9$
j( .'O1
.L so 49 10* . ' , YO%
=mee em- e.e hC
4 Jt4 #'.'+
& +-49 9 94 0
.m
. n . .c c.w
. .
9 0
b5 e.
e4
e e
.
e..a
1 C
Ig ,, e s ,
*.. t.
.
1w . .,
..
..
.. .
W % G /
. .. . .
a . , - -*, ,
< .. nae 2 .. e.s
, , . .
4
. ..e a
.i... ,
.., ,
- +, s.
, ,
=-e
4,-=..4 -
is'
..4
"3 ;a
Fig. lib.
Event sequence for Category IIB initiating,,
event, loss of main loop cooling - systems, , , , , ,function at 300h following event.
.
e.
5
J 8G
46

c...,- . . ..,m
.,c. u.u s..e u. . . . em. % o<......% . . .
in.. . m i.. . . ,
.. . . .. .- . -
. . . . . ...e,y.,,,,
en. - .- .
--- 4 - -ma< 4 . . . ... a
. .s s .*.
w. s .
..NM, , . , . . . . ,
. o.,.......<.
r hess.,pe w see
e wee . e ' s -- . .n
_w.e-
. . . 6<aes, , . . .
. ,
.-
% BBF.
. .,, .
p . .. .. 4
( b ,4 \
as O
g. .
. .
. .
.v. - . .-41. . oc ' - .
.
-i , *
..s.~.
...e a
s
.j "(''. s
1i-VM- - _s._-.y
a s
. , , <
Je9/ O
aa,
v.
! .
t r e. s'en. s-
g N.
---to ss . n
mit ) F. t
.? I m. .ii.s .
. aow ,.s
u . .e '.. e a
"tJa 0
o* . . ....
'i..ca . c.* ux . m .s
...e
. ..
s.o
. . o . .s , .3 y,
I . to ' s0 0
. ~
~.
..
,c,.., , . -
7tW
s ..
iw .
s . .e - '..,ou, .Stap' OF
#"
*JCDC6 Lvre%
Fig. 12. u.=
Event sequence for p',* ' .Category Illa initi- 's.*
ating event, loss ofone Class lE electricalbus - systems function tx*-
on demand. a=.**'1,,
cr. ar.a. r a.
*$ C00 4m
b e 1% *
ie . ..t
an'O86
I e .e # te
47

NON- MAIN COREESSENTIAL LOOP (a) AUXILIARY
INITI ATING ac COOLING ESSE NTI A L COO LINGEVENT REACTOR POWER SYST E M POWER SYST E MTYPE TRIP (2 BUSES) (6 LOOPS) 1E (b) (c)| | / / / /_
LOSS OF CLASS ~ 1.0 9.99 x 10-' 9.38 x 10-' O1E ac ELECTRICAL (F AIL) f f f r_ ,POWER f f f f 1
1.0
(F AIL) COOL ON,
i MAIN1.0 LOOPS
a) Operating on j( (3 LoopSi , , , f ,auxiliary boiler 43 -2 i / / / / 8
0b) CACS not operable
from non+ssential ac ( F All) , f f f f ,electrical buses # # # # '1.0
c) Reactor pressunied(F AIL} COOL ON,
'1.0 MAIN LOOPS
(F AI L) , , f j f ,'# # # # '2.06 x 10⁻² 0
(F AIL)f , j , ,
1.0 ' ' ' ' '
(F AI L) i F All TO'
1.0 COOL
/\ I' BUS) / / / /e | / / /t / / / /_nd ,.,k / / / / 5 / / / / i / / / ' *
(3 LOOPS) , j f j j ,a ' # # # # '9 8 x 10-' 0
(F AI L) f f f f ,# # # # *
1.0
(F AIL) COOL ON,
1.0 MAIN LOOPS3
(F AIL) , f f f f,
' # # # # '2 x 10⁻² 0
(F Af L) f f f f ,# # # # '1.0
(F All) s F All TO'
1.0 COOL
f / / / /t / / / /|
1m10-3 0 '# # # # ' ' ' ' # '
(F AI L) , f f f f.' # # # # '
1.0 0
(F AI L) , (F AIL) i Fall TOi i
1.0 1.0 COOL
Fig. 13. Event sequence for Category IIIB initiating event, lossof Class lE ac electrical power -- systems function ondemand.
48

MAIN CORENON- LOOP AUXILI AR Y
INtil ATING ESSE NTI A L COOLING ESSENTIAL COOLINGEVENT R E A CTOR ac SYSTEM POWE R SYSTEMTYPE TRIP POWER (a) CLASS I E (bi tcl- i i
e e > >g ii i i i
LOSS OF CLASS -10 9 99 m 10-i 9.38 a 10 1 0
1 E ac E LECTRI- er Ant) COOL ONCA L POW E R -- ~~ d MAIN LOOPS10
(3 LOOPS 1 ,
'
9 92 = 10' ' COOLal Owating e
( (2 LOOPS) CACS&Jashary borfer179m 10-3 5b) CACS se.tched from
Oas IE bus to ban si Loop,, ,
eon essentia: banet h e
t A feature that does 10?=10-5 COOL AT,
eot en st in present ST ART OFipg,k"
oest concepn) -H COO LDOWN
2 98 = 10 *c) Reactor pressurged
(3 LOOPS) , , , , fJ ' ' ' ' ' '
414 m 10-2 0
(F AILI L CL ON~~~-d MA N LOOPS
r3 LOOPSIi
'9 92 = 10-1 COCL
* ON( (2 LOOPS) CACSi
'
179m10-#
(1 LOOPS F Af L TO,
J i COOL At109 = 10.sST ART OF,
(FAIL) COO LDOA N,
8
2 98 m 10-6
(F AsL) , , , , ,,' # # # ' '
2 06 m 10-2 0
fFAlth F All TO---d COOL ON
t0MAIN LOOPS
(3 LOOPS) ,
'9 92 = 1c-1 COOL
* ON( (2 LOOPS $ CA CSi
179 m 10-3 5
ftLOOPi F AIL TOJ 109 m 10 -* COOL AT
> ST ART OFiF AIL) COO LDOA N,
'2 98 = 10-*
I IlI / / / /I / / / /t / / / I/ / / / 5 / / / / I / / / # 5,3
# f / / f / / / 1 |/ / 5 s / / / |
io
IF At L# f , , , ,/ / / /|
(F AIL) g F Art TO
8 COOLt0
Fig. 14. Event sequence for Category IIIB initiating events, lossof Class lE ac electrical power -- systems function ondemand.
49

MAIN LOOP ESSE NTI A L COREINtATING NON COOLING IN POW E R AUXILIARY
EVENT REACTOR ESSE NTI A L FLASH TANK CLASS COOLINGTYPE TRIP POWER MODE IE SYST E M, , , ,
4 4 4 5 4 4
* ' ' '' ' '1 / / / ; | | ,' i ;i i i, i
~ 1.0 0
STATION (FAlu , , , f , ,B LACKOUT '' ' ' ' '
1.0 9 994 x 10 " 04(P = 5 m 10 / yr)( F AIL) f j f f ,
/ / / / 6
(F AIL) , COOL FORa) Time hmat is bebeved to be ' 12 MINUTES (a)1.0
determined by depietson offeedwater in the Condensate IF AIL) e r i i /tstorage tink. (This contrasts ' ' ' ' ' 'to a limat of 12-15 hours fo, 6 x 10~4 0PWR's ) Supply of ma n
(FAIL) f f , ,icirculator bearing water is / ' ' ' '
also behewed to be a limitatson. 0
(F AIL) , IMMEDIATELOSS OF,oCOO LING
Fig. 15. Event sequence for Category IVA initiating event, stationbackout -- systems function on demand.
consequences and potential impact of each category on the public
health and safety. It is anticipated that these analyses would
produce results consistent with the objective of potentially broad
application to quantitative assessment because the consequence of
each category would apply to a large number of possible initiating
events. The third phase of the planned work was to estimate, using
fault tree methodology, the frequency of occurrence of each initiat-
ing event category. Completion of all three phases would provide
the quantitative framework in which to assess the relative import-
ance, in terms of the hazard index, of the initiating events and
the effectiveness of the system design cor.cepts in consequence
mitigation. This objective basis is of great value for decision
making and directing attention to those areas of the concepts and
designs that are of concern and significance.
Event sequence diagrams are also constructed for some specific
initiating events that are generally included in the Safety Analysis
Report, Chapter 15, Accident Analysis.5 These analyses were per-
formed to apply and illustrate the methodology because the neces-
sary data, core temperature histories or radionuclide releases,
50

. _ . . . . . _ . . . . . . . _ . . . . . . . . _ _ _ _ . - - . _ - - . - - - - - - - - - - . - - - - - - - -
were available for these initiating events. Had these historiesbeen available for other system conditions associated with theinitiating event categories, the analyses would have been per-formed in a manner consistent with providing results applicable toeach initiating event category. The analysis for specific initia-
ting even ts includes system modeling to determine the consequencesand the hazard indices for the sequences. Sequences showing the
system availabilities at the time of the initiating event and se-
quences considering system availabilities for the entire cooldown
period are presented.
The calculations of the event sequence branch probabilitiesare given in Appendix A. The analysis used median values of com-
ponent unavailability and failure probabilities as reported in thedata base in Ref. 1. System probabilities, given in terms of their
point values, were computed using the median values of componentprobabilities and the logic space equations of the fault trees.
System concepts and features considered in some of the analysesmay not be acceptable for nuclear power plant licensing. Possible
acceptability for licensing was r.ot a criteria in determining whatshould or should not be examined in a quantitative framework be-cause it is believed that overall improvement in safety can resultfrom the re-examination of old ideas in a new objective light andtrom consideration of new ideas.
B. Analyses by Shutdown Initiating Event Category
1. Category I. Shutdown initiating event Category I con-tains initiating events that do not affect the performance of theshutdown cooling systems. The event sequence diagram for CategoryI initiating events is shown in Fig. 9a. Failure to cool down
appears to be highly unlikely for these initiating events.
During the course of the analysis of the nonessential powersystem (Appendix A) it became apparent that increased reliabilitymight be desirable under some system conditions. Several potential-
ly relevant ideas were investigated in the analyses. None of the
ideas were entirely satisfactory in the sequences considered and"
i
, _.-- .. - -
.

the concern continues to exist. In particular, the stability of
the ac network and improvement in the availability of offsite
power following turbine trip need to be addressed. In addition to
the usual bus arrangement without bus tie breakers, a two-bus andtie breaker arrangement of the nonessential ac power distributionis assumed in Fig. 9a. This arrangement assumes that the capacityof the feeds to either bus will carry the connected loads of both
nonessential buses. Allowance is made for the potential for an
inadvertent open tie breaker between the two buses. If the capacity
of the bus feeds is inadequate, the existence of the bus tie breaker
is unimportant and the probability of having only one nonessential4
ac power bus is about 10 greater than that for the system with the
tie breaker. In the assumed arrangements of the nonessential ac
power system, the failure of both buses is more likely than the
failure of only one bus. This is due to the high reliability of
the bus hardware system compared to that of the power sources.
Consideration of the availability of only one nonessential power
bus is not particularly significant in this case. However, this
consideration is significant in some sequences to be presented
later. The presence of the tie breaker, in general, improves the
availability of both buses by reducing the inadvertent open breaker
contribution to bus unavailability. The loss of both buses con-
sidern the probability of the loss of offsite power due to the trip
of the turbine. The probability that offsite power will be lost
when these Category I initiating events occur is taken to be 10~ .
The predominant cause of the loss of bus feed to a single bus is~4
inadvertent open breakers whose probability is taken to be 10 .
When only one nonessential power bus is available, the analysis
of the essential ac power system considers only one offsite line
available. This follows 'com the logic that only one nonessential
ae bus can be energized if, and only if, one offsite line and the
bus rie Srcaker have failed. Tie breakers between the three essen-
tial power buses are not included in this analysis. Bus ties can
be properly included only when the capacity of every bus feed is
adequate to carry the connected loads of all three buses or when
the capacities of all feeds and connected loads are known. In an
52

analysis of the latter case, the fault logic can provide for specificinadequacies in capacity.
The fluid flow system configuration of the main cooling loopsprovides a degree of independence and diversity. In the reference
design, it is considered that such diversity and independence beextended to the supply of ac power for components in the main cool-ing system. Each of the two nonessential ac power buses suppliesthe components of one group of three main cooling loops. Fromthis configuration, it follows in the fault tree that the loss ofone nonessential ac bus results in the loss of one group of maincooling loops, i.e., three loops. Analysis for the main loop cool-
ing system availability is included in Appendix A.The fluid flow system configuration of the CACS loops provides
a similar degree of independence and diversity. This diversityand independence is extended to the source of essential electricalpower that supplies the CACS. Each CACS loop depends on power froma separate bus. The fault tree shows that the loss of an essentialpower bus results in the loss of a CACS loop. Durit.g the course of
the analysis, early quantitative results indicated that it might bedesirable, following certain initiating events, 'o have greater.
availability of the CACS. A reference system design to accomplishthis was assumed for analysis and comparison in connection withCategory III initiating events presented in a later section of thisreport. This reference design permits the connection of any CACSloop to any essential power bus.
The consequences of the event sequences following Category Iinitiating events are shown qualitatively in Fig. 9a for sequencesthat have been modeled.
The analysis of the Category I turbine trip event is extendedto examine the expectations for the cooldown operation to be func-tional at 300 h after onset of the initiating event. The event
sequence and probability estimates for the branches are shown in
Fig. 9b. This analysis assumes that the system, as indicated bythe branches, were functional at the onset of the initiating event.Repair of the nonessential and essential power systems was consid-ered (Appendix A) during the 300 h cooldown period. Repair of the
53

. . _ . . . _ - - - - - -_
main loop CACS cooling systems was not considered. Figure 9b in-
cludes consideration of two configurations of the nonessential ac
power systems:
1. a one-line-one-bus energized arrangement and
2. a one-line-both-buses energized (bus tie breaker)arrangement.
Modeling of the cooldown with consideration of the fault de-
tection and repair times needs to be performed to enable assessment
of the sequence consequences.
2. Category II. Category II shutdown initiating events are
those that degrade the main loop shutdown and cooldown cooling
performance. Events in this category may be further classified as
to affect on cooling performance. In order of increasing import-
ance, Category II initiating events are those that affect only a
single main cooling loop, a group of three main loops, or all main
loops. Possible events in this category are listed in Table VI.
Event sequences and fault trees were not developed for the events
in Category IIA because it is believed that the consequences are
relatively unimportant. Of greater importance are those events
in Category IIB that affect the performance of a group of three
main loops or all six main loops.
TABLE VI
T.NITIATING EVENT CATEGORIES AND II ITIATING EVENTS
CATEGORY I - Initiating Events Not Affecting the Performanceof Either Shutdown Cooling System
IA - Innocuous Trips Initiated by:
1. Reactor shutdown system malfunction
2. Operator error
3. Plant failures unrelated to the reactorcooling systems
IB - Trips Initiated by Failures in Systems Tha'. AreUnrelated to the Shutdown Cooling Performance:
1. Turbine trip
54
. . . _ _ . . . . . . . . . . . _ . . _ _ _ _ _ _ _ . _ _ _ - - - -

- _ _ _ _ _ _ _ _ . . _ .
1
TABLE VI (cont)
2. Inadvertent control rod withdrawal at power
3. Small helium leak
CATEGORY II - Initiating Events Degrading the Main Loop Shut-down Cooling Performance
IIA - Initiating Events Affecting Only a Single MainCocling Loop:
1. Malfunction of feedwater control valve
2. Malfunction of circulator turbine controlvalve
3. Malfunction of a secondary loop relief orsafety valve
4. Partial loss of normal feedwater flow
5. Malfunction of reheater attemperator controlvalve
6. Steam generator tube leak or rupture
7. Main circulator failure
8. Loop controller failure
9. Inadvertent loop isolation due to operatorerror or spurious protective system (PPS oror OPS) action
10. Loop steam line or loop feedwater line break
11. Jet pump delta-P, low
12. Circulator bearing delta-P, low
13. Bearing cavity delta-P, low
14. Circulator speed to feedwater flow ratio, low
15. Superheater outlet pressure, low .
16. Main steam loop outlet temperature, high
17. Main circulator helium outlet temperature,high
18. Reheat steam radiation, high
19. Moisture concentration, high
20. Malfunction of main circulator helium dryer
21. Malfunction of main circulator low-pressureseparator / helium compressor module
22. Malfunction of main circulator service system
IIB - Initiating Events Affecting More Than one MainCooling Loop:
55
. .

TABLE VI (cont)
1. Inadvertent shutdown or isolation of loopsdue to operator error or spurious protectivesystem action
2. Malfunction of common control system
3. Main feed pump suction or discharge linebreak
4. Total loss of normal feedwater flow
5. Total loss of normal reactor coolant flow
6. Malfunction of the hot reheat bypass desuper-heater control valve
7. Manual CACS start
8. Containment pressure, high, and primary cool-ant pressure, not low
9. Main circulator inlet average delta-P (plantflow), low, and not bypassed
10. Feedwater flow, low
*11. Malfunction of reactor plant cooling watersystem (RPCWS)
*12. Malfunction of compressed air system
*13. Malfunction of helium purification system
14. Loss of main condensers
15. Failure of common reheat steam line
16. Failure of superheat steam line
17. Loss of one main feed pump
CATEGORY III - Initiating Events Degrading the Performance of theCACS
IIIA - Initiating Events Affecting One CACS Loop:
1. Loss of one Class lE ac electrical bus
IIIB - Initiating Events Affecting U. ore Than One CACSLoop:
1. Loss of Class lE ac electrical power
**2. Malfunction of reactor plant cooling watersystem (RPCWS)
**3. Malfunction of the compressed air system
4. Loss of ultimate heat sink (loops may or maynot be independent, depending on design)
56
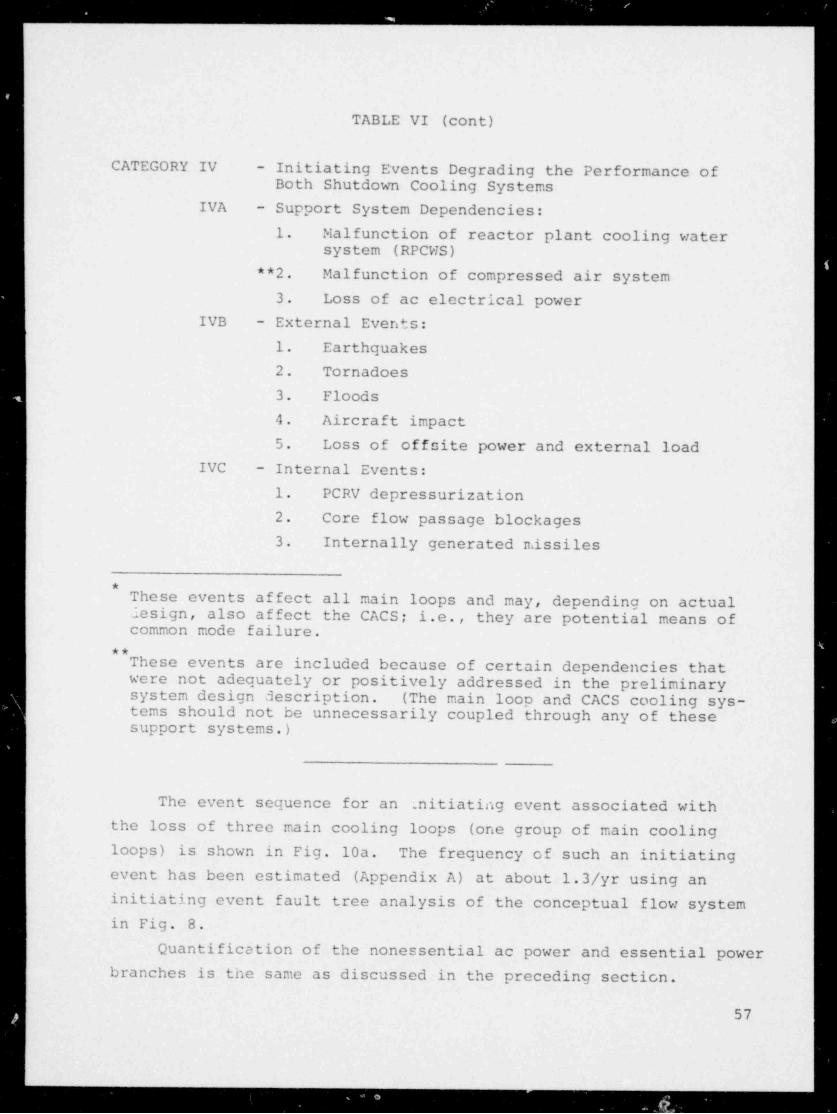
. . _ _ . _ _ _ . _
TABLE VI (cont)
CATEGORY IV - Initiating Events Degrading the Performance ofBoth Shutdown Cooling Systems
IVA - Support System Dependencies:
1. Malfunction of reactor plant cooling watersystem (RPCWS)
**2. Malfunction of compressed air system
3. Loss of ac electrical power
IVB - External Events:
1. Earthquakes
2. Tornadoes
3. Floods
4. Aircraft impact
5. Loss of offsite power and external load
IVC - Internal Events:
1. PCRV depressurization
2. Core flow passage blockages
3. Internally generated niissiles
*
These events affect all main loops and may, depending on actuallesign, also affect the CACS; i.e., they are potential means ofcommon mode failure.
**
These events are included because of certain dependencies thatwere not adequately or positively addressed in the preliminarysystem design description. (The main loop and CACS cooling sys-tems should not be unnecessarily coupled through any of thesesupport systems.)
The event sequence for an initiating event associated with
the loss of three main cooling loops (one group of main coolingloops) is shown in Fig. 10a. The frequency of such an initiating
event has been estimated (Appendix A) at about 1.3/yr using aninitiating event fault tree analysis of the conceptual flow systemin Fig. 8.
Quantification of the nonessential ac power and essential powerbranches is the same as discussed in the preceding section.
57
_ _ _ _ . . .

Qualitative estimtes of the sequence outcomes are shown in
Fig. 10a for sequences that have been modeled.
The analysis of the Category II, loss of three main cool.ag
loops, event has included investigation (Appendix A) of the expec-
tations for functional cooldtwn operation at 300 h after onset of
the event. The event sequence and estimates of the branch prob-
abilities are shown in Fig. 10b. The system functional status at
the time of the initiating event is indicated on the branches.
Repair of the nonessential and essential power systems is consid-ered (Appendix A) during the 300-h cooldown period. Main loop and
CACS cooldown systems repair was not considered. Two configurations,
one-line-one-bus energized and one-line-both-buses energized, of
the electrical power systems are considered in Fig. 10b.
The consequences of this Category II event over the 300-h
cooldown period have not been assessed. Modeling of this cooldown
with consideration of fault detection and repair times needs to be
performed to provide a basic for assessment.
The event sequence for initiating events associated with the
loss of main loop cooling is shown in Fig. lla. The frequency of
such an initiating event has been estimated (Appendix A at about
2.6/yr using an initiating event fault tree analysis of the con-
ceptual flow system in Fig. 8. Nuclear power plant operating ex-l
perience for 1972 shows three shutdowns per year due to inter-
ruptions of main feedwater. This value is comparable to that cal-
culated for the HTGR flow system in Fig. 8. As a check on the
methods and failure rate data used in this study, the frequency of
the loss of main loop cooling was also calculated for a typical
light-water reactor (4-loop plant) . This calculation predicted
2.9 failures per year, kbich is in good agreement with experience.
The failure of pumps is the predominant contributor to the calcu-
lated system failure frequency. Based on this study, it is be-
lieved that the availability of the HTGR main feedwater and power
conversion systems can be and probably should be improved.
Quantification of the nonessential ac power and essential
power branches is the same as discussed in Sec. I, above.
58
. _ _ _ _-
Estimates of the sequence consequences are shown qualitativelyin Fig. lla for sequences that have been modeled.
The event sequences and estimated probabilities (Appendix A)for functional cooling operations at 300 h after loss of main loopcooling, a Category II event, are given in Fig. llb. Repair of the
nonessential and essential power systems during the cooldown periodis considered (Appendix A). The branch probabilities for two con-
figurations of the nonessential power system, one-line-one-busenergized and one-line-both-buses (with but tie breaker) energized,are given in the event sequence.
Modeling of this cooldown, including fault detection and re-
pair times, must be performed to enable assessment of the sequences.3. Category III. Shutdown initiating events in Category III
are those that degrade the cooling performance of the CACS. Theloops of the CACS have a degree of diversity and independence thatpermits the initiating events in this category to be classifiedaccording to their affect on this diversity and independence.Table VI shows possible initiating events in this category.
Category IIIA events are those that affect the performance ofonly one CACS loop. An example of such an event is the loss ofone essential power bus. The event sequence for the loss of one
CACS loop, resulting from the loss of one essential electrical bus,is shown in Fig. 12. No estimates of the prcbability of frequencyof occurrence of such an initiating event havc been made.
Considerations for nonessential power are the same as forCategory I events.
Qualitative estimates of the sequence consequences are shownin Fig. 12. These event sequences indicate the estimated proba-bility of failure to start cooldown to be 2.9 x 10⁻⁵ per event.
The probability estimates for successful start of cooldown are~1 ~19.78 x 10 for main 1000 cooling and 9.987 x 10 for CACS.
Events that affect the cooldown performance of more than oneCACS loop are in Category IIIB. Some possible events in this cat-cgory are listed in Table VI.
Figure 13 shows the event sequence for the postulated loss ofessential ac power. The probability or frequency of this event has
59
_-
- . - . -

not been estimated. Considerations for the nonessential power are
the same as for Category I events. The CACS is assumed to be not
operable from nonessential ac electrical buses.
The sequence in Fig. 13 gives an estimated probability of-26.03 x 10 per event for failure to start cooldown on the main
loops. Cooldown on CACS is precluded by the loss of essential
power.
Consideration of this Category IIIB initiating event is ex-
tended in Fig. 14 where provision is made for switching the CACS
to both nonessentiai ac power buses, a feature believed not to ex-
ist in present design concepts. The estimated probability for-4failure to start cooldown is 1.75 x 10 per event, assuming that
the CACS is successfully switched to the nonessential power buses
upon loss of the essential power buses. This is an improvement by
a factor of 345 in the estimated probability c f failure to start
cooldown.
4. Category IV. Initiating events in this category are be-
lieved to potentially have the most serious consequences. Theseevents, which af fect the cooling performance of both shutdown cool-
ing systems, are classified into three subcategories: events in
common support systems, external events, and internal events. Pos-
sible events in this category are shown in Table VI.
Event sequenceu for three possible initiating events in this
category are given in Figs. 15-17. Station blackout or loss of acpower is considered in Fig. 15. This event has an estimated fro-
-5quency (Appendix A) of 5 x 10 per year. This frequency was de-
rived from consideration of the possible occurrence of two events,
loss of offsite power or unplanned trips of the plant,and the
accompanying sequences that could lead to loss of all ac power
60

(station blackout). The loss of offsite power (LOSP) event has a~1frequency of 2 x 10 per year (Ref. 1, Appendix V). It is assumed
that the plant must be tripped when LOSP occurs. It is also be-
lieved that automatic trip of the plant will likely occur upon
LOSP (even though the plant may be designed for power runback), but
no detailed operating experience has been found to quantify this
likelihood. Unplanned trips by the protection system have a fre-
quency of seven per year (Ref. 1, Appendix V). Although the fre-
quency of LOSP is considerably lower than that of unplanned trips,
the unavailability of offsite power during LOSP is the predominant
contributor to the resultant probability of station blackout. The
possibility of LOSP resulting from an unplanned trip (10~ ) wasconsidered in the calculation. However, blackouts involving un-
planned trips contribute only about 3% of the total expected black-
out frequency.
For comparison, the expected frequency of blackout was derived
for a plant with two diesel generators. For unplanned trips, the-5probability of blackout is 1.1 x 10 per trip. This value agrees
with that in Ref. 1, Appendix III, Sec. 6.3, p. III-72, for total
loss of ac power at the loss of coolant accident (LOCA). With seven-5unplanned trips per year, this gives 7.7 x 10 blackouts per year
initiated by unplanned trips. The probability of blackout accompany--1 -2ing LOSP (2 x 10 events por year) is 1.1 x 10 per event. This
-3gives an expected 2 x 10 blackouts per year for a plant with two-5diesel generators compared to 5 x 10 blackouts per year for a
plant with three diesel generators.
While the sequences in Fig. 15 indicate that this event likely
results in inadequate cooling with relatively small frequency, it
is suggested that this plant condition be considered for more
61

NON- MAIN CORE
ESSE NTI AL LOOP AUXitlARY
INITIATING REACTOR ac COO LING E SS E NTI AL COG LING
EVENT TRIP POWER SYST E M FN E R SYST E M
TYPE (a) (a) (6 LOOPS) 1E (bl, , , ,
i q s g , F All TO,
LOSS OF OFFSITE - 1.0 0 i 0 COOL ONMAIN LOOPSPOWER {~a2/yr) (3 LOOPS) _ _ __ _ _;_ ._ __ _ q,
, ,
0
(F AI L) (3 BUS) (3 LOOPSI Fall TO,
' COOL ON1.0
al bss of ofste power MAIN LOOPSes edrnay not trip the reactor,
however, it is assurnedthat reactor operate f( (1 BUS) , , , j, f , , ,, f , , f ,
i i i i e i i i i e i i i < swould not be gerntted LJ 9without offsite power
##b) Reactor pressurized
# '(F AIL) (F AIL) (3 BUS) (3 LOOP)' '
quate for early phase of ' 'cooldown 1.0 1.0 8 93 x 10'' 9 93 x 10-'
(2 LOOP) ,
'#1.8 s 10-3
( (1 LOOP) Fall TO,
4 ' COOL AT4 1.1 x 10 ,
START OF
IF AIL) COO LDOW N,
'"3 x 10 -"
f( (7 8US) , f f f iL. 4 # # # # '
1.03= 10"
( 12 LOOP) ,'
9 98 x 10-'(1 LOOP) ,'
'1.2 x 10⁻³ F All TO
COOL(FAIL),
'.43.4 x 10
( (1 BUS) , , , , ,# ' ' # # 34 ,jg-3gg)
]L(i/ f / ! ta a i < ,
(1 LOOP) ,'
9 994 x 10--' ' F All TO
(F AIL) ,
6.03x10⁻⁴ '-
(F All) (F AI L), ,' 85 x 10-6 1.0
Fig. 16a.
Event sequence for Category IVB initiating event, loss of offsite powerwith turbine trip - systems function On demand.
62

detailed analysis. For example, can main loop cooling in the flash
tank modo be extended to longcr periods of time by increasing fluid
storage capacities and using pulse cooling operations? Can a di-
verse heat removal system be devised using the proposed CAHE, an
alternate drive for the auxiliary circulator and the core decay
heat as the energy source?
The loss of offsite power (LOSP) initiating event has been
classified as Categrry IVB, External Events. This event was
initially considered to be in Category I. However, analysis shows
that it affects the probability of successful cooldown since both
cooldown systems depend on ac power for proper operation. Figure
16 shows the event sequences for the loss of offsite power event.
The estimated frequency of this event is 0.2 per year.1 Reactor
power operation without offsite power available may not be per-
missible and also turbine and reactor trip are possible, even if
not required, following LOSP. Therefore, two general conditions,
reactor-turbine trip and power run-back without turbine trip, are
considered.
The main loops are available for maintaining cooling in the
event of runback. The availability of nonessential power reflects
the possibility of turbine trip following LOSP when the reactor
trip is not required. In the event the main loops fail, the reac-
tor would be tripped and cooled by the CACS.
For the runback condition, the estimated probability of not-5cooling is 1.5 x 10 per event and for the reactor-turbine trip
condition, the estimated probability of not cooling is 4.39 x 10~
per event. The difference in expected cooling performance is
primarily attributable to the contribution of the main generator to
the availability of essential power. When the main generator
trips, the resulting decreased expectation for essential power
availability increases the probability of failing to cool by a
factor of 21.
The LOSP is believed to be an important initiating event. This
is particularly true if the reactor must be tripped upon LOSP or
if the turbine-reactor trips frequently acocmpany LOSP. Sequences
associated with LOSP accompanied by turbine-reactor trip were
63

NON MA'N CDAEE SE( NT J A L LOOP AUX 4lARY
$NITI AT ING pl A CTOA sc COOLING E SSE NTI AL COO LINGEVENT YpiP pomEm $ YSti u ponEn s vST E uTYPE asi tal It LOOPS) tE tta, ,
' ' ' '
5 e 10'3 9 b a 10-' 9 38 m 10- s COOL ONLCSS OF OF F $1TE
" ' * IPom E A 1-0 2/c) ( .3 (gope,, ,
a 414 a 10 ' '
ff Asti 13 9USi (3100 % ,
2 06 m 10-2 g gg , 9g- t ---'
al Asumes te.se we ( '2 LTW e
twesen a pemwrmd -
arrtNsut oNarte witLOOPi ,b) Roedor personrod g_ ,
El L.py ofDower 4
enemiaste be ewiv f 5 ail),
phone of cooedoorn --
}\ 42 BUS' , , , , ,
LJ5 a 10-d ' ' ' '
( (2 LOOPS' ,
__'
a t LOOP' ,
A_ '
IF AILI ,
_. e
( 0 BJSF f , , f,
J 2 m 10-4 ' ' ' '
k / / / /I/ / /3
fi LOnei ,
J _. I
(FAtti ,
IF AIL) (F A tLi, ,'
2 5 = 10~* --'
\M eusi , , , , ,, , , , f, , , , , ,
d Q $I i 1 0 / 1 / I | e i i E
iF A'll IF AILI (3 BUS) (3LOOPn, ,
8 '5a10-2 10 995 10'' 9 98 a 10'''
\ Q LOOP) ,
'18 a 10-3
H (OOPS ' F AIL TOd t 1 = 10'' 'CDOL AT
* StamT OF, , , ,
' LOOLDOW N3 a 10 -6 i_
( (2 8051 , , , ,,
i a 10'# # # # # '
( 12 LOOpi ,
9 98 a 10~ ' '
,,LOn. ,
'
1.2 m 10-3 F AIL TO
(F AILl ,
3 4 a 10'' 's
( 11 BUS' , ,," ' ' ' " ' " '
Fig. 16b.
Event sequence for Category IVB initiating O ' < ' <'event, loss of offsite power with power n m.,runback - systems function on demand. "9 m a iO" '
,
FAs To'
COOL(FAql
,
'
6 03 : 10-*
IF A8L) IT A ql, ,
'15 = 10- * to
64
considered with additional detail in Fig. 17. Main loop cooling
in the flash tank rede, restoration of nonessential ac power, and
restoration of essential power at several times following LOSP
are considered. The estimates of the sequence consequences are
based on assessment of modeling analyses performed by General2,3
Atomic and these should be regarded as preliminary. Additional
modeling must be performed before the sequences in Fig. 17 can be
interpreted.
Additional consideration is given in the LOSP event in Fig.
18. These sequences consider system operation to 300 h after onset
of LOSP, with and without repair of the electrical systems and
without repair of the main loops and the CACS. Again, the system
must be modeled to determine the consecuences of these sequences
and to permit assessment of the significance of the sequences.
Depressurization of the PCRV is considered to affect the
cooling performance of both the main loops and the CACS. The
event sequence for this Category IV initiating event is shown in
Fig. 19. The frequency of occurrence of this event has not been
estimated. The probability of failing to cool at the start of-5cooldown has been estimated to be 4 x 10 per event. This analy-
sis assumes that three or more main loops or three CACS loops will
provide adequate cooling at the start of cooldown. The adequacy
of this assumption needs to be verified by modeling the circulator,
including performance limits, and the core cooldown under all pos-
sible conditions of depressurization. The need for detailed
transient modeling of the main cooling loop performance, including
as-designed control system actions, during and following PCRV de-
pressurization cannot be overemphasized. Revicw of the proposed3control system indicates that feedwater flow will be automatically
ramped down following depressurization and reactor trip and that
the controls will also decrease the circulator speed in the same
manner as for plant load reduction under normal operating condi-
tions. These control actions accompanied by changing coolant gas
conditions are expected to automatically result in primary coolant
mass flow rates that are about one-third of those indicated in the
analysis in Sec. 15.4 of Ref. 3. Scoping analysis of the main
65
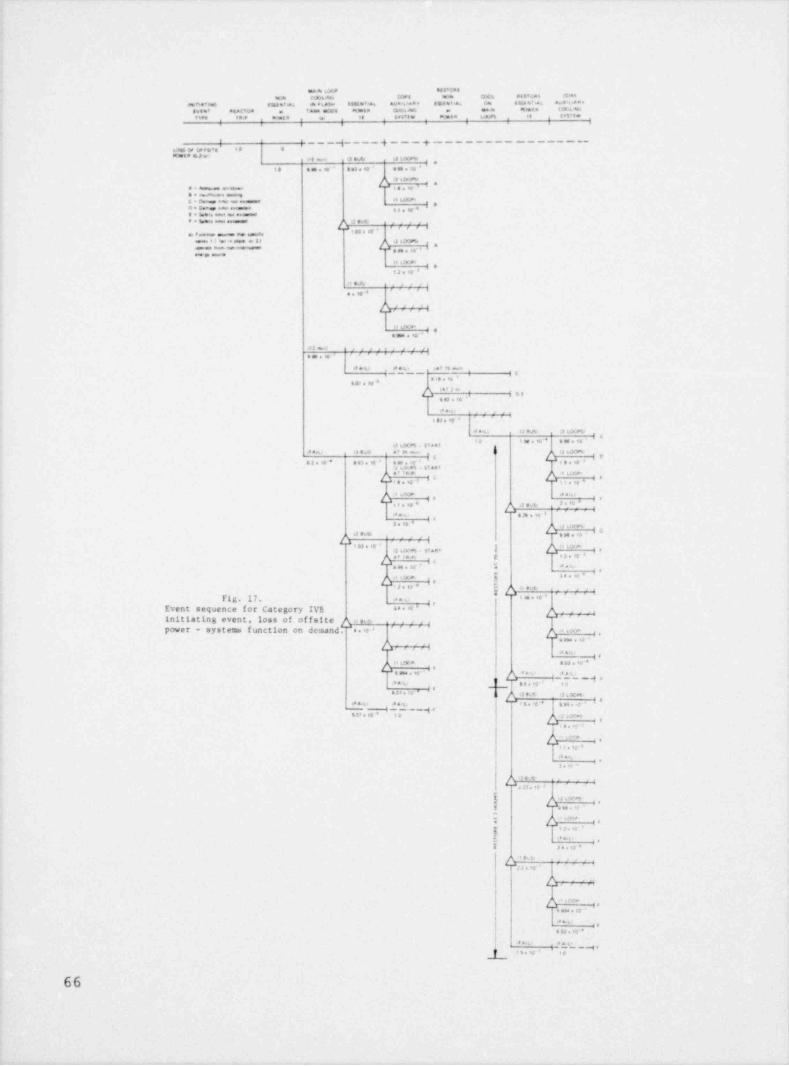
me,an tim # ma t* Cattu e (4934 est, Cop t egygp Qgeg $4 % et @tt
WWh 8 ' *8#s tw af4 sh Da A%se t$56 4' ag es>S * a8 f 69.f 41A use O the %' e av s 148 '
$44 4T ptMOS g f aans part as ete Qus>. stere a gA g plei n i t) g o t,u
9 v99 #7 eas e ter 64 SMT$e mese t.u arg 0 5 W 9 epg
,
i3
,; ___q__+-_-.+-______--____---
..,.,,,o.... .. .
**'*OE*' ,s y, } ms A. Ip t r u sF%*e
e3 e se ese ' O e4 e 80 ' 9 98 * 'O
7 ",e nA
&ahg pga.h* *Om oS * me.nN.ees embeg& * Dow eam aus encumans '"'##'
i ,O + W === e+cemme ,,,,e '
S * We ease er enamest...ee- p' 2 .-- ,
'. . > . -, , , , , , , _ , , _apses t Iwi e anse e a f 3 L >Ir%+ n
pas hem w Tgg, ,WW g ShwS
.t m e-|*
17m 0
06 g
^ne@
s ' , i |
Lv+ a ,e sma . e
O P wt i 1
8 9 e te
det , d oit , ofPt emat
$ *I e 64g
.,i..
9 G) s 16 '
a
1 SJ e 'O '
sa # e A. 1 .> rs
d I td oet * 9 es e t,, i m es s ,..,
.. ...,s .. .- .,om, ,
,.a.a e .i . ' ...e, c , 8
is.e- S' 4 1
. se,4 , , , -
I *, e . se ' e
,. ,, .
J- o... . . . p.5 >.. .a
a s ie ' .m , _
a .w ... c,' *
2 <2a> a , i >-
,. . ~ . .. , ., , . . . . . -. . io i 'a
,
n,.
>< .,
* a*i 1. $J r ( * e4 i,
' ' ' ' ' ' ' '*Fig. 17. .
,
* * ' *'Event sequence for Category IVSinitiating event, loss of offsite f( e-powe r - sy s t etam function on demand.''a * '' .
. e. .
I e
IAe i 6(#J e U
$ She s 40 ' . I( f I a ._ _ q ,-
ea a . in is4
4h 3e* 3 . y og
! r s . .c * s se . e ' *a s.v , --- q s I- M _e a_sw . io * ie 1 :.-
'Ie
#e
91
0
e 5.
t - 3
.3 -
9
a - v -iI .
eeI pne=
'Y@I
m -
4
E)e i
E*
,
3 G$
| r' * ,(
!
!. . .l. . it
| -.
. . . -
* _at__.{ s to ' ie
66

. _ _ _ _ ._ _ _ _ _
be ne GA9es t t r.4* Aus 6.asi
'te T e ' be 4%e 9' A f,1 N.6'9. G ht 9' & CC(h 'em.E v& hi et eC 3R S l'S' t w P Df B S r19 9 5' w99 9 9 Wies e # e$ a
4064 Cd '8 * *,
***#* * *
Of 8 5','t te D 82 = t . 1. tw M. a.,, _g_. _ qw 9 as e F 3. is *
~43* * '90e 3eg 9gweg.
e 6 e se *898e'9 g es e +e '* ''''Os tew
"e' O 8E * 88 '3 , w eg
pop .meaum8 'I'*''' 59 a W ' ## * *
ee * . ele umwe * 't04 ,, . **
* *'O '
e + he weaa e,e-
0g9- te
}( 79 * 1
LA'
e ' C e 't'
e e l e 'C ,,e
, ', et e 4" Dieoc 'go g
4 7 e 'O ' ,y,,
e e e 10 '
'S t
3jti14
e4j(mJ '4 s 60
ei 3 $ e *S *, s e ie * |
< n o e .o '4 4* s,
e to e 'O 'se
.e',.;.. . . .
.e ..
se
ee_.. teesIe7 e 't
( .g g 'o'-
t
o 4
m'. ,e J e to ',+1.W- e- - d e ----M,,
". ,> e se I .' '- , . , , , .,tw
, ,,,e, . . . . . ~. . . . .t tteof 'e 9 se' . to ' ( rr iorew $ 9. ip *
,,, ,e ~10
1(Te
4 * e te 'sa
'O t e IC
)( ?e1L .a
a * 3 e *0 '3s es . to +r tw
's e s' YE 3ieag *
4 eOe*Ip14 96 '3f8
9 5 e to -
( pa
2 t s IC #
f( 91m ,a
a e e SC '
h.,2,2 n te * - - 'Iog*a a s . ie- *+le * ,gg
9 94 e 'O '
e 6. s 95 *ra
- . - ,,,,,:e....
ea L *aL
WPt I e 'S 'gite ' ^ .
** 88 1 'it % it t w
e'O9 e te I w e se. ee 'w te le 4 93 e se ' B 48 a 89 '
,esa e e a 80' W t e e 50 'w ten 'e 8 le 6eoc 3 * JS e se 'e t o *C 8 4 9 J . *e '
,,w
si.'
..
see .e *
f( B__ ra
a , e n 'r,i.- er
M, t, S e 4 8, .. > *>'o,
* n. * ,.
. . . . '
ts a
31 e 10 *
( + es;5na
.a. . e .e - 3e
e..*e v . .e
.e, '.ese. s s . .m-e a,
o n e ioa
Fig. 18. ...',e->**
Event seqeunce for Category IVB initiatingevent. loss of of fsite power - systems **' ' * * '
function following event. w s.w , to
4
...
'
. . ..
.e.-- 67..
... .

ta m 2 84met LOrW aV4 'L *8=#
,g,tgem Stat e' et Cuo. nesG fMe n' 44 CDos %g yg epT 4 tar?O4 m l'1'Ge 8 ret e S c676 eties 99 9 free 8 w SG g.,
St.WW tt 9 m a te ' B N e 89 * #4 "ena >hDeret huAs 3 g ryneg
- - ). - -==y LMe . . to
el Ommesis op es***t *at <) 9 9 i rf6T"#3 45 e 99 9 SB e 19 * 0 007 e to '
t< meme asummaisse7 t F*-
es am.aw ism an esegag,g e m 'O81' sa g90u
.,y, CA6al' as - (w
''*'8' Qwatem=*s.
3 e to "
t *J C 'T
e 03 e +0 *
't t ME
S tep en8 * g. ,,
. g. Ox. atstaa t (,,e
83*** Cnt,01 ewi
ee#se a 99
( '9S i
J M e 16 *
i
4
> t NWea 6?
O 858 e 59 * coc at' svae+ os,,,
QXamh4 0) e 'O *
es en i
Sse9 * I8
...s,(...t.
s o'. is ' ' . - - - $ - .. d 1 CDos om'I ' W
esa en $M
ee
,1 g ,'t<ea g .t66e e
3 e it'' t s' a *o * 3 e02 e et
et tar A
isam* #a t 4% av
D* Staat 0sS e o to * C00m%
en i
3. to *ft 9 4(
4 3 Je s 50 -
9tW* A
0 0m e 10 'Cast 1)
i(are com at
S'am'ewh08,3,g.,
ECLu#e a t
ha s so *
( oe4d e 3 m 90 *
**LF*84 LTg ,Oe seae te
Ef ame os,,..gC00@m%
G 33 e to *
*e a i e te
i e e to te
saa L sea a st ets 3 ime,
a e e9 ' e6 8 5) e 38 ' teet e 18 'a two
te.m*s aitto
PLW COng at4 T'ae* ost , , og
CcomoIsa tJ u to '
j s ., * --9.
.. - )+7 lor *
e. , to
etyp aJOt atTgat og
i 2 e 'O ' g gg,
..
a. . a
p .. .1. . . .
II
Fig. 19.Event sequence for Category IVC initiatin, '" **tm
..,e* cevent. PCRV depressurization - systems s,oo.t.*o*ea
function following event. "'' "'* **s es . tea
ream en
' " ' ' "68
circulator operation indicates an additional concern that needs tobe resolved by transient modeling. The main circulator does notappear to be controlled in a manner that would ensure operation ata constant specific speed or within acceptable defined specificspeed limits during a depressurization event. It is believed thatthis transient operation should be investigated to establish thatthe main circulators will operate within acceptable limits underall imposed conditions. Review of the main circulator ope:. ation
indicates that direct control of circulator soecific speed may alsobe desirable for system stability considerations under steady stateor normal operating conditions.
Scoping analysis of the proposed CACS circulator system alsoindicates that the system may be incapable of providing adequatecoolant mass flow rates under some depressurized PCRV conditions.The ability of this system to provide adequate primary coolantcirculation under deprecsurized conditions depends on the systempressure, compositien and temperature of the cas being circulated,the maximum speed of the circulator, the maximum driving power andtorque available to the circulator, and the efficiency of the cir-culator. Within limits, trade-offs can be made among these param-eters to maximize flow rates when some of the parameters are fixedor imposed by system conditions. Incomplete detail concerning the
auxiliary circulator system and coolant conditions at the circula-tor inlet in Ref. 3 prevents more complete assessment of this sys-tem. However, supplementing the given data with some typicalvalues of performance permits some assessment of the system (seeAppendix A). Results showing possible marginal cooling perforranceby the CACS under depressurized conditions indicate that more de-tailed modeling of the plant must be performed. Approximate CACS
analyses, with atmospheric pressure in the PCRV and two CACS loopsfunctional, indicate that the ccciant mass flow rates used in Ref.3 can be achieved with essentially no margin (about 5%) in per-
formance during a time period starting prior to maximum fuel tem -perature and extending beyond 6 h following depressurization, in-dependent of possible main loop cooling for 10-12 min. in the flashtank mode. To achieve the mass flow rates used in Ref. 3 with
69

atmospheric pressure in the PCRV, the circulators must operate atmaximum shaft speed and at limiting specific speeds, the primary
coolant must consist of 80 or more volt helium, the loop pressure
drop cannot exceed that assumed in Ref. 3,and the coolant temper-atures at the auxiliary circulator inlet cannot exceed those values
in Ref. 3. It is also believed that all main loop shutoff valves
must be closed.
At the time of calculated maximum fuel temperature, the fol-
lowing relevant parameter values * have been provided in Ref. 3,
Tables 6.3-4 and 6.3-5:
System pressure 11 psia (76 kPa)
Loop 6P 0.75 psi (5.2 kPa)
Compressor inlet temperature 300 F (420 K)
Coolant flow rate (per circulator) 22.5 lb/s (10.2 kg/s)
Coolant molecular weight 8.77 (about 81 vol% helium)Mean-core outlet temperature 1950 F (134 0 K)CAHE AT (gas-side) 1480 F (1080 K)
In these values, there is an unaccounted temperature loss of 170 F
(350 K) between the mean-core outlet temperature and the circula-
tor inlet temperature. Some loss is expected, however this magni-
tude cannot be verified. Approximate analysis, using the parameter
values above, shows that the maximum available flow rate is 21.6
lb/s (9.8 kg/s) vs 22.5 lb/s (10.2 kg/s) used in the performance
analycis in Ref. 3. If the system pressure is assumed to be at-
mospheric, which increases the flou rate by 34%, and the circulator
inlet temperature is increased by the unaccounted temperature loss
of 170 F (350 K), which decreases the flow rate by 22%, the maximum
available circulator flow rate is 23.7 lb/s (10.8 kg/s) or 5%
*System design and performance data are given in U.S. customaryunits in all pertinent publicatons and references used in thisstudy. The same units are used throughout this report. However,values have been converted to approximate, order of magnitude SIunits to conform.
70

_
greater than that used in the Ref. 3 analysis. The circulator must
operate at maximum speed (3550 rpm). The power input to the circu-
lator would be 412 hp (307 kW) and the required torque would be
609 ft-lb (850 Nm). In order to perform this independent scoping
analysis it was necessary to assume a circulator efficiency. The
value chosen (0.75) is typical of that which can be achieved in a
compressor design but is not necessarily correct or conservative for
the unit in question. Since the circulator must operate at a rel-
atively low specific speed to deliver the required mass flow rates
under the calculated operating conditions, it is not inconceivable
that this a -umed efficiency exceeds the actual efficiency of the
circulator by over a factor of two. If the efficiency ir this low,
the available driving hp and torque will also become marg.nal or
inadequa'; under the conditions in Ref. 3. Analyses and evaluations
of the cooldown are needed to provide assurance that the CACS will
provide adequate coolant mass flow rates and that the CAHE will pro-vide adequate heat rejection under depressurized conditions. Main-
tenance of pressure inside the containment building for six or more
hours following depressurization of the PCRV will increase the per-
formance margin of the CACS.tuld stuuy concluaes tnar oack pressure must ce maintaineu
until such time that additional analyses and evaluations show that
adequate cooling performance can otherwise be attained. Contain-
ment pressures to 22 psia (150 kPa) may be necessary to accomplishadequate CACS heat removal fron the core under depressurized PCRVconditions using the CACS described in Ref. 3.
Additional investigation of system behavior related to the de-
pressurization of the PCRV is needed. The possibility of undesir-
able isolation of main loops by plant protection features or byoperator action during this accident is of concern. Review of the
proposed plant protection system (PPS) features shows that the
primary coolant pressure must reach its low set point before the
containment pressure reaches its high set point to prevent loopisolation by the PPS. Operation of this logic, as intended, de-
pends not only on relative set-point levels but also on the dynamicsof the pressure wave at the instrument locations and dynamic re-sponse of the instruments themselves. It is not obvious that these
71
-p

timing factors have been directly and posti"ely considered in the
proposed design of the logic. Also, at high helium temperatures,
low helium flow or low feedwater flow can isolate the main loops.
In this case, it is believed that the set point and sensing of the
helium flow, relative to the flew transient and final flow magni-
tudes that the main circulators and control system are capable
of producing, are important to maintaining main loop cooling. The
other area of concern associated with this accident involves pos-
sible operator actions. Review of the proposed system logic and
control features indicates provisions for 36 or more individual
operator actions that could directly affect main loop cooling under
conditions of this accident. These possibilities were not include
in the analysis of the availability of main loop cooling. However,
because of the relatively large number of possible actions, it is
believed that they may have potentially significant impact on the
availability of main loop cooling.
C. Analyses of Contain. ment Systems
In the unlikely event that initiating events considered in the
previous section result in a release of coolant, fission products,
or hazardous gases from the primary system, engineered safety fea-
tures are provided to mitigate the consequences.
For the reference design, the r eactor is enclosed in a steel
shell-lined concrete containment building. Lines penetrating the
containment have double isolation valves to minimize leakage.
These valves are closed when postaccident operations do not require
use of the lines. Estinates of the probability of failure to iso-
late the containment atmosphere from the environment are developed
for the reference containment design in Appendix B.
The probability of leakage from penetrations, lines, and
closures is considered for two internal pressure conditions, rapid
pressure decay (20-30 min.),and pressure not reduced. Assumed con-
tainment building leak rates from 0.001 per day to 1.0 per hour
have been used in the analyses. Detail of these considerations is
given in Appendix B. The following system relationships with
72

. . _ _ . _ " " - - - -
containment leakage must be considered in the event sequenceanalysis:
1. the effect of containment leakage on the performanceof the CACS and other engineered safety features,
2. the effect of removal, by leakage to the environment,of radioactivity in competition with the removalmechanisms inside the containment building, and
3. the dependence of leakage on the pressure existinginside the containment building during the accidentsequence.
The containment systems reference design also includes a con-tainment atmosphere cooler and atmosphere cleanup system. The con-tainment atmosphere cooler has two functions.
1. It reduces the temperature of the atmosphere enteringthe cleanup system, thus permitting earlier, effectiveoperation of the cleanup system.
2. It reduces the pressure inside the containment build-ing more rapidly than do the natural heat removalmechanisms.
Both of these functions are important to safety. The first directlyaffects the quantity of radioactivity removed from the containmentatmosphere or the quantity available for leakage and release tothe environment. The second " unction directly affects the quantityof radioactivity leaked to the ev'ironnent. For a fixed leakage
pa*h, reduction of the pressure is the only mechanism that will re-duce the release of gaseous fission products to the environment.It is important to minimize the amount of gaseous fission productsreleased to the environment because noble gases are significantcontributors to the latent hazard (Appendix D) of many HTGR acci-dont sequences.
The containment atmosphere cleanup system, along with otherremoval mechanisms, serves to reduce the quantity of a irborne radio-acitivty available for release to the environment.
73
_
__. _

A general, functional event sequence for the containment sys-
tems is given in Fig. 20. Two important considerations are not
specifically identified in this sequence. These are related to the
possible presence of energy sources, additional to the primary
RELEASECONT AINM E NTFROM
PR'M AR Y ESSENTI ALPR ESSUR E POA E R ATMOSPH E R E
BOUNDARY IE ISOLATION LE AK AGE CLEANUP, , , ,
i 8 | 4
YES AV AILAB LE YES NO (3 LOOPS) ,
~ 1.0 (a) 9.99 = 10-1 9.9 w 10 ''(b) - 1.0
(QUANTITA. \ (2 LOOPSI ,
3
TIVE BY 1.1s10-2PRIMARY RE-LEASE CATE. 41 LOOP) ,
J 'GO R Y) 4 x 10-b
(F AILI ,'45 x 10
YES (3 LOOPS),
'(a) 1.3 m 10- J 9 9 x 10-'(b) 1.4 x 10⁻⁴
\ (2 LOOPS) ,
'1.1 x 10~2
il LOOPl ,'
4 x 10⁻⁶
IF AIL) ,
'5m 10'8
NO , f f , , f , , , ,# # # # ' # # # # 3
(d b - 1r -6
_______.y10 -0
t
'- 1.0
NOTAVAILABLE j f j f , j jf , , f f f f ,
/ / o / | / / / / i o / / / |
al Primary depressar, zed withNOCACS coohng - (rsessure / / / / t i e / / i
' # # # ' # # # # 'must tx rna r:a:ned in (c) 3= 10-contaamnt for successfulCACS ortration - see YES , , , , ,
# # # # 'Append;n A) 10b) Reactor not aepressarized -
Irap d contammer t pressure
deca y 1.0
c) Operator must close maornumof 10 vanes to isotate containr,ent
di Aline otwrator to manually
C30se farled wane
Fig. 20. Containment event sequer.ce diagram.
74

coolant or steam released, that can raise the containment pressure
into the rupture range. Burning of combustible gases and the gen-
eration of noncondensible gases inside the containment are two such
additional energy sources. These factors, which are possible inter-
mediate consequences of accident sequences and which affect the
radiological consequences of the sequence, must be considered in
estimating the probability of containment building leakage and the
magnitude of the leakage for each accident sequence. In addition
to this consideration, there must exist a spectrum of containment
leakage rates with their associated probabilities. No attempt is
made in this study to provide such quantitative definition. The
analyses in this study (Appendix B) have assumed a spectrum of
containment leak rates combined with four levels of performance for
the containment atmosphere cleanup system in the calculation of the
magnitude of the releases of radionuclides to the environment.
Probabilities have not been estimated for the containment leak rates
used in this analysis.
D. Latent Hazard Indices
The evaluation of the consequences of the possible accident
sequences was not a part of this study, however, it was necessary
to develop some index in order to estimate the importance of the
accidents and to provide an objective basis for identifying areas
deserving of more detailed analysis. A latent hazard index, pro-
portional to the expected latent fatalities in the population at
risk, was chosen (Appendix D) to be the quantitative consequence of
the possible sequences. Combination of this index with its associ-
ated probability and frequency is a measure of the contribution of
the initiating event to the overall risk. Latent hazard indices
have been developed in Appendix D for those accidents for which coretemperature histories or radionuclide release data were available.
Relative latent hazard indices, which compare the consequences
(latent hazard indices) of possible accident sequences to those of
the slow PCRV depressurization accident sequence with all systems
functional, are included in the following analyses to show relative
importance of the possible sequences. 75

1. Slow Depressurization of the PCRV. The containment event
sequence and associated relative latent hazard indices for the slow
depressurization of the PCRV are shown in Fig. 21. All latent
hazard indices are normalized to the index value for the top branch
RELEASEFROM CONT AINME NT
PRIM AR Y E SSE NTI A L R E LATIVE
PR E SSUR E MOWER AT MOSPHE R E HAZARDBOUNCARY IE , ISOL ATION LE AK AGE CLE ANUP INDE X, , , ,
i s a i I
YES AV AIL AB LE YES NO (3 LOOPS) ,
di 1.0~1B ta) 9 99 m 10-' 9.9 m 10-'
<b) ~ 1 ~0SLOW DE- \ (2 LOOP 9 i d) 1.05PR E SSUR l2A. I.1x10-2TION OF THE
PCR V IRE. (1 Loop; ,d) 1.10LE ASE DESIGN a i
4 a 10-5VALUE OFTHE CIRCULA (F AIL)TING ACTiv. d) 3 82.
ITY TO THE 5m10-8
YES (3 LOOPS)E T ' f) 915'la) 1.3 m 10 ~ # g9 ,10-1(b) 1.4 x 10''
/( (2 LOOPS) ,fi 94.34, a ,
1.1 x 10 - 2
/( (1 LOOP) , f) 101a) Primary de- 4,, a i4pressonied w,te 4a10
CA CS coohng - ,pg,g(twessure must f) 288.,
te mamtained 5 x 10⁻⁸m cor tainrnent
tot successful / / / /! / / / / I' ' ' ' ' # # # # 'CACS operation ~ 10 *
See Appendia
^) ____qb) Rear +or not 1.0 ~0
de;aessunted -
rapid contain. ' 3
rnent pressure_
e) 5 4 m 10
decay NOTAVAIL AB L E f j f ,t) Operator must ,f ,f , ,f ,f ,f ,f i ,f ,f ,f, , , ,
close maximumof 10 valves to
NOisolate conta.n. , , f f , ,, f f f ,
2meet (c) 3m10
d) ), = 01% / day ypg , , , , ,
e) A - 1.O Nur # # # # 'g 1.0
f) h, * 10%/ day.e) 5 4 x 10³
f" AIL) ,''
1.0f) 288.
Fig. 21. Containment event sequence diagram -- slow depressuriza-tion of the PCRV.
76

of the sequence, no containment leakage (A 0.1%/ day) and three=7
functional loops of the containment atmosphere cleanup system ref-
erence design (A 1.314/h).=f
A containment leakage rate of 10%/ day is assumed for the se-
quence branch representing containment leakage with a functional
containment atmosphere cleanup system. The sequence branches in-
volving isolation failure show a relative latent hazard index that
reflects massive failure of the containment building integrity
(A 1.0/h) and an index resulting from a relatively large leakage=g
(A 10%/ day). In both of these cases, the containment atmosphere=g
cleanup system is assumed to have failed or to otherwise be inef-
fective in the removal of radionuclides.
Tables VII-IX show the most important radionuclides and their
relative contributions to the hazard of the slow PCRV depressuriza-
tion event. When the cleanup system is effective, the noble gases
are significant contributors to the hazard. As the performance of
the cleanup system degrades, the longer lived radionuclides become
increasingly more important in their con ribution to this hazard
index. In Table VII, the noble gas contribution to the hazard de-
creases from 93-24.3%, the contrioution of the iodines increases
from 4-53.5%, and other radionuclide contributions increase from
3-22% as the containnent cleanup system performance degrades.
Similar fractional contributions and changes in relative contribu-
tion are coserved in Table VIII where the assumed containment build-
ing leak rate is 100 times greater than that in Table VII. For the
massive leak, 1; 1.0/h, in Fig. 21 and Table IX, relative contri-=
butions to the hazard are: noble gases 61%, iodines 21.9%, and other
radionuclides 17.11. Analysis of data in Tables VII and VIII show
that the relative effectiveness of the cleanup system is not sig-
nificantly influenced bv the large variation in containment build-
ing leak rate. These tables also show that one functioning loop
of the reference design cleanup system makes a significant reduc-
tion in the sequence hazard that would be expected without any
cleanup.
Analysis of Fig. 21 and Tables VII and VIII shows that the
most probable sequence paths are expected to result in releases
77

TABLE VII
LATENT HAZARD INDICES
SLOW DEPRESSURIZATION OF THE PCRV
A = 0.1% per day
Ac = 1.314 h-1 Ag = 0.876 h-1 Ag = 0.438 h-1 A f = 0.0 h-1
88 8 13Kr 3.3 x 10 Kr 3.3 x 10 Kr 3.3 x 10 I 6.3 x 10133 5 133 5 133 5 131 5Xe 1.1 x 10 Xe 1.1 x 10 Xe 1.1 x 10 I 5.4 x 10135 4 135Xe 7.7 x 10 Xe 7.7 x 10 1 'Xe 7.7 x 10⁴ 132Te 4. 2 x 1087 4 87 4 133 4 88 5Kr 2.8 x 10 Kr 2.8 x 10 I 4.4 x 10 Kr 3.3 x 10
4 85m 7 4 133"Kr 2.7 x 10 Kr 2.7 x 10 Kr 2.8 x 10 Xe 1.1 x 101 4 133 4 85m 4 135 4I 1.6 x 10 I 2.3 x 10 Kr 2.7 x 10 I 8.2 x 10
133m 4 133m 4 133m 4 135 0Te 1.5 x 10 Te 1.9 x 10 Te 2.6 x 10 Xe 7.7 x 10135 3 135 4 135 4 131m 4I 6.0 x 10 I 1.6 x 10 I 1.6 x 10 Te 4.7 x 10¹² 3 132 3 132 3 133m 4Te 2.8 x 10 Te 8.3 x 10 Te 8.3 x 10 Te 4.0 x 101I 3 131 3 131 3 87 4I 1.5 x 10 I 2.2 x 10 I 4.4 x 10 Kr 2.8 x 10132 3 132 3 131m 3 85m 4I 1.0 x 10 I 1.4 x 10 Te 2.3 x 10 Kr 2.7 x 10
131m 2 131m 3 132 3 134 4Te 8.1 x 10 Te 1.2 x 10 I 2.2 x 10 Cs 1.1 x 10134 2 134 2 134 2 132 3I 3.3 x 10 I 4.2 x 10 I 5.7 x 10 I 5.4 x 10134Cs -- 134 134Cs -- 134 2Cs --
I 8.8.x 10
Overall Index
6.15 x 10⁵ 6.44 x 10⁵ 6.76 x 10⁵ 2.35 x 10⁶
Index relative to slow depressurization with full cleanup function
1.00 1.05 1.10 3.82
78

TABLE VIII
LATENT HAZARD INDICES
SLOW DEPRESSURIZATION OF THE PCRV
A = 10.0% per dayg
Ag = 1.314 h-1 f = 0.876 h-1 Af = 0.438 h-1 A f = 0.0 h-l_
7 88 7 88 7 133Kr 3.3 x 10 Kr 3.3 x 10 Kr 3.3 x 10 I 5.6 x 10135 6 135 6 135 6 88 7Xe 7.3 x 10 Xe 7.3 x 10 Xe 7.3 x 10 Kr 3.3 x 10
6 133 6 133 6 132Xe 6.3 x 10 Xe 6.3 x 10 Xe 6.3 x 10 Te 2.8 x 10⁶ 87 6 133 6 131 7
Kr 2.8 x 10 Kr 2.8 x 10 I 4.4 x 10 I 2.5 x 10⁶ 85m 6 87 6 135 0"Kr 2.6 x 10 Kr 2.6 x 10 Kr 2.8 x 10 I 7.8 x 10⁶ 133 6 85m 6 135 61 1.6 x 10 I 2.3 x 10 Kr 2.6 x 10 Xe 7.3 x 10
I 6 133 6 133m 6 133 6"Te 1.5 x 10 Te 1.9 x 10 Te 2.6 x 10 Xe 6.3 x 10135 5 135 5 135 6 133m 6I 5.9 x 10 I 8.6 x 10 1 1.5 x 10 Te 4.0 x 101 5 132 5 132 5 1 I"Te 4.0 x 100Te 2.8 x 10 Te 4.2 x 10 Te 8.2 x 101I 5 131 5 131 5 87 6
I 1.5 x 10 I 2.2 x 10 I 4.3 x 10 Kr 2.8 x 10132 5 132 5 131m 5 85m 6
I 1.0 x 10 I 1.4 x 10 Te 2.3 x 10 Kr 2.6 x 101 1"Te 8.1 x 10⁴ 131m 5 132 5 132 5Te 1.2 x 10 I 2.2 x 10 I 5.4 x 10
134 4 134 4 134 4 134 4I 3.3 x 10 I 4.2 x 10 1 5.7 x 10 I 8.8 x 10
134 1 134 2 134 2 134 4Cs 6.7 x 10 Cs 1.0 x 10 Cs 2.0 x 10 Cs 2.1 x 10
Overall Index
5.63 x 10⁷ 5.80 x 10⁷ 6.23 x 10⁷ 1.77 x 10⁸
Relative Index
1.0 1.03 1.11 3.15
Index relative to slow depressurization:
with same cleanup function -
91.5 90.1 92.2 75.3
with design value performance -
91.5 94.3 101.3 288.
79

TABLE IX
LATENT HAZARD INDICES
SLOW DEPRESSURIZAT*.ON OF THE PCRV-IMassive containment failure A = 1.0 hg
Af = 0.0 h-I
0 9Kr 1.6 x 10
133 8I 4.8 x 10
I Se 4.2 x 10Kr 2.4 x 10
135 81 1.8 x 10
8Xe 1.3 x 1085m 7
Kr 8.9 x 10¹² 7Te 8.8 x 10
II 4.6 x 10
132 7I 3.0 x 10
"I*Te 2.5 x 10⁷I 7Xe 1.4 x 10
6I 9.4 x 10
9Overall Index 3.4 x 10
where noble gaccs are the predominant contributor to the latent
hazard as defined. However, the relative importance of the pre-
dominant contributors varies among the possible accident sequences
associated with this initiating event. Comparison of the predom-
inant contributors in the accidents considered in this study shows
that their relative importance also varies with the initiating
event. In the next accident considered, for example, it is shown
that iodines and noble gases are almost equally important to the
hazard and that these two groups of radionuclides together contri-
bute about 90% of the expected hazard. This suggests that hazard
80

. . . _ . _.
analyses should consider the hazard from all released radionuclides,not from one group or from specific nuclides.a
2. Rapid Depressurization of the PCRV. Figure 22 shows the
containment event sequence and relative latent hazard indices for
rapid depressurization of the PCRV. The indices in this sequence
RELEASEFROM CONT AINM E NT
PR IM AR Y ESSE NTI A L R E LATIV E
PR E SSUR E POV. E R AT MOSPHE R E HAZARD
BOUNOARY 1E ISO L ATION LEAKAGE CLE ANUP INDEXs e i i 1
5 5 6 4 4
YES AVAILABLE YES NO 13 LOOPS) ,di 2.15,
4~10 al 0 09 x 10-1 9 9 a 10
' i LOOWPRE UR IZ A- d} 2.73TION OF THE 1.1 m10-2PCR V tRE-
((1LOOPl ,LE ASE TOT ALDESIGN VALUE 4 ,10~6OF CIRCULAT- ^ING ACTIVITY s d) 91.7
'
PLUS ALL 5= IO-"PLATEOUT TOTHE CONT AtN | YES (3 LOOPS) , 0 2063
aVEf.Tl al 1.3 = 10- 3 9 9 m 10-i
1.4 x 10'' /( (2 LOOPS)b)
,
L. 1 a
"4) pr ma,y de-
P'e5mr led j( (1 LOOP) ' f) 426*inCACS 4, ,3 a4 x 10 ' $
cooing -
(pressu e must ,,r' fl 6276.tv ma nta ned *
5=10-8in conta nmer
for successfe:raO
/ # / 1 / / / / tCACS pe r a' # # '# # # # '
t.on - See ~ 10~App vn At
b) Reactor not ----dde pressso re d 10 ~0rapid conta n-
ment pressu'e ', ,) 4.1, god
decay -10NOT
c) Or.eraw mst AV AILAB LE f , , , , , , ,,f, , , j,close rnau: j , , , 7 , , ,, , , , ,
mo m c f 10wa%es to isctate
, ' , ' ,' ,' | ,' ,' ,' ,' |cu~t a " mentkl 3 x10⁻²
d ) A , = 0.1 %. !da,
YESe) ), - 1.0Mour , , , , ,# # ' '
1.0f l ( = 10 './d a y
tFAf L) el 41 x 10'i'
1.0 <
f) 6276.,
Fig, Containment event sequence diagram -- rapid depressuriza-''
tion of the PCRV.
81
..

, . .___ _ _ _ _ _
are normalized to the value for slow depressurization of the PCRVwith essentially no containment building leakage (A
7 0.11/ day)=
and three cleanup loops functional (A = 1.314/h). Assumptionsg
and conditions associated with these indices are the same as thoseused in Fig. 21.
Tables X-XII s.iow the most important radionuclides that con-~
tribute to these hazard indices. When the cleanup system is
TABLE X
LATENT HAZARD INDICES
RAPID DEPRESSURIZATION OF THE PCRV
A = 0.1% per day
Ap = 1.314 h-1 Ag = 0.876 h-1 Ag = 0.438 h-1 Ag = 0.0 h-1
133 5 133 5 133 6 131I 4.6 x 10 I 6.8 x 10 I 1.3 x 10 I 2.1 x 1088 88 5 133 7Kr 3.3 x 10 Kr 3.3 x 10 Kr 3.3 x 10 I 1.9 x 10133 5 135 5 135 5 132Xe 1.1 x 10 I 1.6 x 10 I 2.9 x 10 Te 1.3 x 101 132 5 132 5 135 6I 1.1 x 10 Te 1.3 x 10 Te 2.6 x 10 I 1.5 x 10132 4 133 5 131 5 131m 6Te 8.7 x 10 Xe 1.1 x 10 I 1.7 x 10 Te 1.2 x 10135 4 131 4 133 5 88 5Xe 7.7 x 10 I ?.5 x 10 Xe 1.1 x 10 Kr 3.3 x 101I
I 5.7 x 10 1"Xe 7.7 x I 4 13310 Xe 7.7 x 10 Xe 1.1 x 1087Kr 2.8 x 10 1 1"Te 3.2 x 10⁴ 131m 4 132Te 6.2 x 10 I 7.8 x 1085m 4 87 132 4 135 4Kr 2.7 x 10 Kr 2.8 x 10 I 3.2 x 10 Xe 7.7 x 10131m 4 85m 87 4 87 4Te 2.2 x 10 Kr 2.7 x 10 Kr 2.8 x 10 Kr 2.8 x 10¹² 4 132 4 85m 4 85m 4I 1.5 x 10 I 2.0 x 10 Kr 2.7 x 10 Kr 2.7 x 10
Overall Index
i.32 x 106 1.68 x 10⁶ 2.69 x 10⁶ 5.64 x 10⁷Index relative to slow depretssurization:
with full cleanup -
2.15 2.73 4.37 91.7
with same cleanup -
2.15 2.61 3.98 24.082
.
. . .

- - . . . . . - - .--
TABLE XILATENT HAZARD INDICES
RAPID DEPRESSURIZATION OF THE PCRVA = 10.0% per dayg
Ag = 1.314 h-1 Af = 0.876 h-1 Af = 0.438 h-1 Af = 0.0 h-1
I 7 133 1 1 9I 4.6 x 10 I 6.8 x 10 I 1.3 x 10 I 1.7 x 10⁷ 88 7 88 7 131 8Kr 3.3 x 10 Kr 3.3 x 10 Kr 3.3 x 10 I 9.6 x 101"I 1.1 x 10 I 1.6 x 10 I 2.9 x 10 Te 8.8 x 10⁷ 135 7 135 7 132 86 132 7 132 7 135 8Te 8.7 x 10 Te 1.3 x 10 Te 2.5 x 10 I 1.5 x 10135 6 131 6 131 7 131m 8Xe 7.3 x 10 I 8.5 x 10 1 1. 7 x 10 Te 1.1 x 10
1 6 135 6 135 6 88 7Xe 6.3 x 10 Xe 7.3 x 10 Xe 7.3 x 10 Kr 3.3 x 10II 6 133 6 133I 5.7 x 10 Xe 6.3 x 10 Xe 6.3 x 10, 132 66I 7.7 x 10
6 131m 6 131m 6 135 6Kr 2.8 x 10 Te 3.2 x 10 Te 6.2 x 10 Xe 7.3 x 10"Kr 2.6 x 10⁶ 87 6 132 6 133 6Kr 2.8 x 10 I 3.2 x 10 Xe 6.3 x 10
1 I"Te 2.1 x 10⁶ 85m 6 87 6 87 6Kr 2.6 x 10 Kr 2.8 x 10 Kr 2.8 x 10132 6 132 6 85m 6 85m 6I 1.5 x 10 I 2.0 x 10 Kr 2.6 x 10 Kr 2.6 x 10
Overall Index
1.27 x 10⁸ 1.63 x 10⁸ 2.62 x 10⁸ 3.86 x 10⁹Relative Index
1.0 1.28 2.07 30.4
Index relative to slow depressurization:
with full cleanup -
2.26 2.90 4.65 68.6
with same cleanup -
2.26 2.81 4.21 21.8
with design value performance -
206.5 265.0 426.0 6276.0
83
--
_ _ . . .

TABLE XII
LATENT HAZARD INDICES
RAPID DEPRESSURIZATION OF THE PCRV
Massise containment failure A = 1.0 h-g
Af = 0.0 h-1
133 10I 1.4 x 10
135 9I 3.5 x 10
2 9Te 2.7 x 10
131 91 1.8 x 10
0 9Kr 1.6 x 10
131m 8Te 6.8 x 10132 8
I 4.4 x 10⁷ 0Kr 2.4 x 10
8Xe 1.3 x 1085m 7
Kr 8.9 x 10⁷Xe 1.4 x 10
10Overall Index 2.52 x 10
effective, the noble gases and the iodines are the major contribu-
tors to the hazard; together they contribute about 90% of the index
for both assumed containment leakage rates. When the cleanup fails,
the iodines form about 73% of the index, other radionuclides con-
tribute about 25%, and the noble gases represent about 1%. The
longer lived radionuclides become increasingly more important as
the performance of the cleanup system degrades. These tables also
show that one functioning loop of the reference design cleanup
system makes a significant reduction in the sequence hazard that
would be expected without any cleanup. Analysis also shows that
the containment building alone, with good integrity (A g = 0.1%/ day),reduces the index by a factor of 450 or more and when good containment
84
_ _ _ ___ ._-
_.
building integrity is combined with functional cleanup, the index4is reduced by approximately 2 x 10 compared to the index expected
for a system without a containment building. Comparisons of the
data in Tables X and XI show that the relative effectiveness ofthe cleanup system is not impaired by the containment leak rate.Although the hazard index, as defined, does not include all hazards,it appears that this accident, designated as the design basis ac-cident, is not particularly significant in terms of expected hazardfrom any of the possible sequences.
3. Loss of Forced Coolant. The containment event sequencefor the loss-of-forced coolant accident is given in Fig. 23. The
relative latent hazard indices are normalized to the index valuefor the top branch of the slow PCRV depressurization sequence.Assumptions and conditions associated with these indices are con-sistent with those for the two previous accidents.
Tables XIII-XV give the contributions of the most importantradionuclides to the indices. These data show that the noble gasesare the major contributor to the index when the cleanup system iseffective. As the containment integrity degrades, the iodines be-
important and the noble gases diminish in importance.come more
However, for massive containment failure, the effects of noblegases dominate the index. It is of interest to note the increase
90in importance of both Cs and Sr when the cleanup system fails
with a containment leakage rate of 0.11/ day compared to a signif-134icant increase in importance of only Cs when cleanup ft:.ls at a
containment leakage rate of 101/ day. When the containment leakrate is small, one functioning cleanup loop has a very significantaffect on the index relative to the index for the condition wherecleanup is failed. The containment integrity and the cleanup sys-tem function have significant and beneficial effects on the hazardindices for this possible accident. Comparison of the overall
indices in Tables XIII and XIV for constant cleanup performanceshows that the hazard from the leaking containment, A g= 10%/ day,is about 82-85 times greater than that for a containment with goodintegrity. Similar comparison for the two cases of cleanup systemfailure shows the hazard from the leaking containment to be about
85
___
_ _ _ - -

RELEASEFROM CONTAINMENT
PRIM A R Y ESSENTIAL R E LATIVE
PR ESSUR E POWER ATMOSPHER E HAZARD
BOUNDAstY 1E ISO LATION LEAKAGE CLEANUP INDEX, , , , ,
6 1 4 3 6
YES AV AILAB LE YES NO (3 LOOPS) 3,
d) 8.3 x 10~ 1.0 a) 9.99 x 10⁻⁸ 9.9 x 10- 3
LOSS OF FORCED b) ~ 1.0/( (2 LOOPS) , 3di 8.9 x 10COOLA NT Lg ,
1.1 x 10-,(RELEASE OF DE.SIGN CIRCULAT-
/ (1 LOOP) 4[(3,
d) 1.1 x 10ING ACTIVITY ,4 x 10-5PLUS GA F R ACT.
IONAL RELEASE6FROM CORE AND ' d) 1.5 x 10'
LIFTOF F OF 5 x 10⁻⁸PLATEOUT)
YES (3 LOOPS) 5| f) 6.78 x 10
a) 1.3 x 10⁻³ 9 9 x 10-'*
(2 LOOPS) 5| f) 7.41 x 10
1.1 x 10⁻²
5f) 9.15 x 10.4 x 10-
8(F AIL) i e) 1.0 x 10''
5 x 10-a 9) ,,3 3 , , y7
NO i / r /1 / / / r e' ' ' ' ' ''/'',39-6
--__y1.0 -0
8i e) 1.C x 10*' 7- 1.0 f) 1.11 x 10
NOT AVAILABLE/ / / /| / / / /t / / / / 1/ / / / 4 / / / / 5 I / / / 5
a) Primary depressurized ,
eth CACScooling
/ ,/ ,/ ,/ |/ /(pressure must be maintained / /
in containment for successful (c) 3 x 10⁻²CACS operation - see Appendix A)
YES y j i j ,b) Aeactor not depressurized rapid
f f f f scontainment pressure decay 1.0
8c) Operator must close maximum (F AI L) t ' e) 1.0 x 10of 10 valves to isolate containment '
1.0
d) A, = 0.1 % Af ay f) 1.11 x 10'e) A = 1.0/ hourg
f) A, = 10%/ day
Fig. 23. Contajnment event sequence diagram -- loss-of-forcedcoolari t .
Seven times that from the containment with good integrity. Some
decrease in containment building effectiveness with cleanup system
failure was observed in the two previously discussed accidents,
however, this decrease is most significant for the loss-of-forced
86

TABLE XIII
LATENT HAZARD INDICES
LOSS OF FORCED COOLANT
A = 0.1% per dayg
Af = 1.314 h-1 Ag = 0.876 h-1 Ag = 0.438 h-1 Af = 0.0 h-1
133 9 133 9 133 9 134 11Xe 2.2 x 10 Xe 2.2 x 10 Xe 2.2 x 10 Cs 8.4 x 10⁹ 88 9 88 9 131 10Kr 1.1 x 10 Kr 1.1 x 10 Kr 1.1 x 10 I 4.1 x 10
135 8 135 1 8 132 10Xe 7.7 x 10 Xe 7.7 x 10 I 8.7 x 10 Te 2.4 x 10I 8 133 8 135 90 10
I 3.0 x 10 I 4.5 x 10 Xe 7.7 x 10 Sr 1.8 x 10132 8 132 8 132 8 133 10Te 1.6 x 10 Te 2.4 x 10 Te 4.8 x 10 I 1.2 x 10
87 8 131 8 131 8 133 9Kr 1.2 x 10 I 1.7 x 10 1 3.4 x 10 Xe 2. 2 x 10131 8 87 8 135 8 131m 9I 1.1 x 10 Kr 1.2 x 10 I 2.2 x 10 Te 1.6 x 1085m 7 135 8 134 8 135 9Kr 8.8 x 10 I 1.2 x 10 Cs 1.5 x 10 I 1.1 x 10
133m 7 133m 8 133m 8 88 9Te 8.7 x 10 Te 1.1 x 10 Te 1.5 x 10 Kr 1.1 x 10135 7 85m 87 8 135 8I 8.3 x 10 Kr 8.8 x 10 Kr 1.2 x 10 Xe 7.7 x 10134 7 134 7 85m 7 89 8Cs 5.1 x 10 Cs 7.7 x 10 Kr 8.8 x 10 Sr 6.1 x 10
131m 7 131m 7 131m 7 133m 8Te 2.8 x 10 Te 4.2 x 10 Te 8.2 x 10 Te 2.3 x 10132 6 132 7 132 87 0I 9.4 x 10 I 1.3 x 10 I 2.0 x 10 Kr 1.2 x 10134 6 134 6 134 6 85m 7I 1.8 x 10 I 2.3 x 10 I 3.1 x 10 Kr 8.8 x 10
90 6 132 7Sr 1.8 x 10 I 5.0 x 10134 6
I 4.8 x 10
Overall Index
5.11 x 10⁹ 5.50 x 10⁹ 6.59 x 10⁹ 9.43 x 10¹¹
Index relative to slow depressurization:
with full cleanup -
8.3 x 10³ 8.9 x 10³ 1,1 x 10⁴ 1.5 x 10⁶
with same cleanup -
8.3 x 10³ 8.5 x 10³ 9.8 x 10³ 4.0 x 10⁵
87

TABLE XIV
LATENT HAZARD INDICES
LOSS OF FORCED COOLANT
A = 10.0% per day
Af = 1.314 h-1 Ag = 0.876 h-1 Af = 0.438 h-1 Ag = 0.0 h-1
133 11 133 11 133 11 131 12Xe 1.3 x 10 Xe 1.3 x 10 Xe 1.3 x 10 I 1.9 x 10¹¹ 88 11 88 11 134 12Kr 1.1 x 10 Kr 1.1 x 10 Kr 1.1 x 10 Cs 1.6 x 10
135 10 135 10 133 10 132 12Xe 7.3 x 10 Xe 7.3 x 10 I 8.6 x 10 Te 1.6 x 10133 10 133 10 135 10 133 121 3.0 x 10 I 4.5 x 10 Xe 7.3 x 10 1 1.1 x 101 10 132 10 132 10 132m 11Te 1.6 x 10 Te 2.4 x 10 Te 4.7 x 10 Te 1.4 x 1087 10 131 10 131 10 133 11Kr 1.2 x 10 I 1.7 x 10 1 3.4 x 10 Xe 1.3 x 10
131 10 135 10 135 10 135 111 1.1 x 10 I 1.2 x 10 I 2.2 x 10 I 1.1 x 10133m 9 87 10 133m 10 88 11Te 8.7 x 10 Kr 1.2 x 10 Te 1.5 x 10 Kr 1.1 x 1085m 9 133m 10 134 10 135 10Kr 8.6 x 10 Te 1.1 x 10 Cs 1.5 x 10 Xe 7.3 x 10135 9 85m 9 87 10 133m 10I 8.3 x 10 Kr 8.6 x 10 Kr 1.2 x 10 Te 2.3 x 10134 9 134 9 85m 9 90 10Cs 5.1 x 10 Cs 7.7 x 10 Kr 8.6 x 10 Sr 1.9 x 10
131m 9 131m 9 131m 9 87 10Te 2.8 x 10 Te 4.2 x 10 Te 8.1 x 10 Kr 1.2 x 10132 8 132 9 132 9 85m 91 9.5 x 10 I 1.3 x 10 I 2.1 x 10 Kr 8.6 x 10134 8 134 8 134 8 89 9I 1.8 x 10 I 2.3 x 10 I 3.1 x 10 Sr 7.9 x 10
12 9I 5.0 x 10
134 8I 4.8 x 10
Overall Index1211 11 11 6.81 x 104.17 x 10 4.56 x 10 5.63 x 10
Relative Index
1.0 1.09 1.35 16.3
Index relative to slow depressurization:
with full cicanup -
3 0 57.4 x 10 8.1 x 10 1.0 x 10 1.2 x 10
with same cicanup -3 37.4 x 10 7.9 10 9.0 x 10³ 43.8 x 10
with design value pertormance -5 5 5 76.78 x 10 7.41 x 10 9.15 x 10 1.11 x 10
88

. . . .. __ . . . . . . . . _ _ _ . . _ . _ _ _ _
TABLE XVLATENT HAZARD INDICES
LOSS OF FORCED REACTOR COOLANTMassive containment failure A = 1.0 h-1g
Af = 0.0 h-1
13Xe 2.9 x 10
133 12I 9.2 x 10
12Te 5.0 x 10¹²Kr 5.0 x 10¹²
I 3.4 x 101S 12
I 2.5 x 10
"Te 2.4 x 101212
Cs 1.6 x 10¹²Xe 1.3 x 10¹²
Kr 1.1 x 10
De 8.7 x 101185m 11
rc 2.9 x 10
13Overall Index 6.17 x 10
coolant accident. The presence of the long-lived radionuclides in
the release to the containment building causes the holdup in thecontainment building to become less effective for the loss-of-
forced coolant accident. The importance of the long-lived radio-
nuclides in the index increases as the performance of the cleanupsystem degrades.
4. Importance of Containment Integrity. A measure of the
relative importance of the containment building integrity can bedetermined from the data in Tables VII-XV and Appendix D. For a
containment building leak rate of 1.0/h, the latent hazard index is
essentially the same as if the containment building did not exist.
Comparison of the latent hazard indices obtained for the various
containment leak rates with the values related to massive contain-ment failure yields a measure of the relative importance or effec-
tiveness of the containment building. For example, a containment
89
--
.-._.. .,-

building with good integrity reduces the latent hazard indices as-
sociated with the loss-of-forced coolant, rapid depressurization
of the PCRV, and slow depressurization of the PCRV conditions by
factors of 65, 450, and 1450, r t. ectively. A containment building
with a leak rate of 10%/ day reduces these respective latent hazard
indices by factors of 9.1, 6.5, and 19.2. It is important that
the containment building have good integrity although the building
alone does not reduce the loss-of-forced coolant latent hazard
indices b; large factors.
5. Importance of Containment Atmosphere Cleanup Systems.
While fission products released into the containment space will
undergo removal from the internal atmosphere by a combination of
mechanisms, this study has accounted for removal only by the ref-
erence design containment atmosphere cleanup system (Appendix B).
The magnitude of the fission product source that escapes from the
containment building to the environment depends upon how effectively
the containment atmosphere cle:inup system competes with leakage
from the containment building. A measure of the importance of the
cleanup system can be determined from the data in Tables VII-XV
and Appendix D.
When the containment building has good integrity, the refer-
ence design cleanup system, operating at its design point, reduces
the latent hazard index by factors of 185, 42.7, and 3.8 for the
loss-of-forced coolant, rapid depressurization of the PCRV, and
slow depressurization of the PCRV conditions, respectively, com-
pared to the index obtained with cleanup inoperative. These re-
duction factors become 16.3, 30.4, and 3.1, respectively,when the
containment building has a leak rate of 10%/ day.
Cleanup system ef fectiveness has similar sensitivity to con-
tainment building integrity for both the slow and rapid depressur-
ization of the PCRV. These two accidents do not involve direct
releases from the fuel. In this respect they differ from the loss-
of-forced coolant accident, which has release components similar to
those of the rapid depressurization of the PCRV plus release from
the fuel. Latent hazard index reduction factors, attributable to
cleanup system performance, for the loss-of-forced coolant condition
are most affected by containment integrity.
90

. . - . - . - _ . -. _ _
When the cleanup system is effective, noble gases are signif-
icant contributors to the latent hazard index of all three acci-
dents considered in this report. When the cleanup fails, the io-
dines and other radionuclides predominate in the index but the
magnitude of the noble gas contribution does not change as it is
not affected by the cleanup system.
6. Importance of Containment Integrity Combined with Con-
tainment Atmosphere Cleanup. Based on the latent hazard indices,
the three accidents considered in this study, slow depressurization
of the PCRV, rapid depressurization of the PCRV, and loss-of-
forced coolant, have a relative significance of 1.0, 7.4, and 1.8 x410 respectively. Although this is not an index of the total,
hazard and risks have not been established, order of magnitude con-
siderations indicate:
1. that any system condition with a potential latenthazard index greater than 109 is deserving of moredetailed analysis and
2. that the function of the containment systems is im-portant to these accidents.
On this basis, all three of these accidents should be subjected to
additional analyses since the slow depressurization of the PCRV9has a potential latent hazard index of 3.4 x 10 and the other two
accidents are potentially more serious. Order of magnitude consid-
erations also indicate that all of these accidents may require some
degree of mitigation of the consequences by the containment systems.
The effect of the combined performance of the containment
building integrity and the cleanup system on the magnitude of the
latent hazard indices depends on the competition between these two
features. At the design point, the containment building integrity
and the containment atmosphere cleanup system, together, reduce the
hazard indices of the three accidents considered by factors of46 x 10 -2 x 10 These reductions make the significance of the.
loss-of-forced coolant accident in a plant with containment and
cleanup comparable to that of the slow depressurization accident
in a plant without a containment building.
91
- - - -
. _ . . .

V. CONCLUSIONS
A methodology of accident delineation for systems composed
of redundant and diverse subsystems has been developed. To the
extent that parameter histories were available from system model-
ing, a quantitative framework for accident delineation, deci non
making, and analysis of important safety concerns in the HTGh
system has been provided. These methods have been applied to an
evaluation of the conceptual design of a high-temperature gas-
cooled reactor system to identify initiating events and subsystems
that have significant potential impact, in terms of a latent haz-
ard index, on public health and safety. This evaluation was
limited by the availability of applicable core temperature histor-
ies or radi onuclide releases from system modeling.
All subsystems are of some importance to safety; however, re-
sults indicate that, in general, the availability of adequate ac
power and the performance of the containment systems are very im-
portant. Initiating events of greatest importance are, in decreas-
ing order, those that cause the loss of adequate ac power, the
loss of CACS shutdown heat removal, and the loss of main loop shut-
down heat removal. More detailed investigation of the availability
and performance of these important subsystems and of the possible
initiating event causes is needed. In addition, all events and
sequences that may give rise to an outcome having a latent hazard9index greater than 10 should be investigated in detail unless their
importance can be significantly diminished by improbability of
occurrence.
Although the work on estimating frequency of occurrence of
initiating events is incomplete, loss-of-forced coolant, either as
an accident or as a very real possibility subsequent to certain
initiating events, should be considered as a design basis event.
Following review of the draft of this report, it was requested
that the following information be included in the final report:
1. quantitative comparison between the failure prob.ibtl-2ities used in this study and those in the AIPA utudy,
92
. . . . _ . . _ _ _ _ _
-

and
2. comparison of subsystem reliabilities derived in thisstudy with those in the AIPA2 study, including explan-ation of any significant differences.
To the extent that the requested information is available in Ref.
2 and that the quantitative results are believed to be comparable,
the requested information has been included in Appendix E of this
report. This study used the data base of failure probabilities
developed in the Reactor Safety Study.1 Thus, the requested com-
parison amounts to comparing the data base in the AIPA study with
that in Ref. 1. The data base in Ref. 2 was not formally tabulated
and qualified, which restricts the degree of possible comparison.
Point est.imates of branch probabilities associated with PCRV
depressuriz'tirn and LOSP have been compared and generally good
agreement between the two studies has been found. Differences in
the likelihood of maintaining main loop cooling during the LOSP
event do exist, however, as a result of two considerations: this
study believes that the probability of turbine trip accompanying
LOSP is significantly higher than the value used in the AIPA study
and this study also believes that the possibility of failure to
establish and maintain main loop cooling (about 25% power operation)
during the LOSP event is significantly greater than that found in
the AIPA study. These are believed to be important differences.
REFERENCES
1. " Reactor Safety Study. An Assessment of Accident Risks inU.S. Commercial Nuclear Power Plants," U.S. Nuclear Regula-tory Commission report WASH-1400 (NUREG-7 5/014 ) (October 1975) .
2. "HTGR Accident Initiation and Progression Analysis StatusReport," General Atomic Company report GA-A13617 (January1976)
3. " General Atomic Standard Safety Analysis Report (GASSAR) , "General Atomic Company report GA-A13200 (undated).
4. "Fulton Generating Station Units 1 and 2 Preliminary SafetyAnalysis Report," Philadel hia Electric Company report(Docket 50-4 6 3 and 50-464 ) p(Movember 16, 1973).
93

5. " Standard Format and Content of Safety Analysis Reports forNuclear Power Plants, HTGR Edition," U.S. Atomic EnergyCommission (July 197 3 ) .
94
. . . . . _ _ . _ . _ _ -,--

- . . - - ---
APPENDIX A
CONTENTS
I. INTRODUCTION - - - -- -- ------------ - 99
II. LOGICAL DIAGRAMS AND EVENT SPACE - - - - - - - - - - 99
III. PROBABILITY SPACE -- ----------- ---- 1 01
A. Two Redundant Systems with Single CommonModel Element - - - - 102-------------
1. Event Sp_ce ----- ------ ---- 102
2. Probability Space -- ---- ------ 106
B. Three Redundant Systems with Single CommonMode Element ---------------- - 108
1. Event Space -- ------------- 108
2. Probability Space 108------------
C. Three Redundant Systems with Two CommonModel Elements 110----------------
1. Event Space 110---------------
2. Probability Space lll------------
D. System Maintenance or Test lll----------
IV. ANALYSIS OF NONESSENTIAL ac POWER 114---------
A. Turbine Tripped - - - - - - - - - - - - - - - - 114
B. Loss of Off-site Power Without Turbine Trip - - 116
C. Availability of Nonessential ac Power forTimes up to 300 h Following InitiatingEvents -------- -- ---- ------ 117
1. One-line-one-bus Energized Configuration - 118
2. One-line-both-buses EnergizedConfiguration 118--------------
3. Restoration of Off-site Power 119------
95
---
. _ _ _ . .

CONTENTS (cont)
V. ANALYSIS OF MAIN LOOP COOLING - - --- ------ - 120
A. Operation with the Auxiliary Boiler ---- - - 122
B. Operation in the Flash Tank Mode - - - - - - - - 130
C. Availability of Main Loop Cooling for TimesUp to 300 h Following Initiating Events ---- 135
VI. ANALYSIS OF ESSENTIAL POWER - CLASS lE ------- 136_
A. Summary - Class lE Electric Power EventSpace Relationships -- --- - - ------- 136
B. Availability of Essential ac Power at theTime of the Initiating Event - - - - ------ 139
C. Availability of Essential ac Power for Timesup to 300 h Following Initiating Events ---- 145
VII. ANALYSIS OF THE CORE AUXILIARY COOLING SYSTEM - - - - 155
------- - --- ------- 168VIII. STATION BLACKOUT
IX. DATA BASE - - - - - - - - - - - - - - - - - - - - - - 170
REFERENCES - - - - - - - ------- ---- -- ------ 180
FIGURES
A-1. Arrangement of system elements -- redundantsystems with common element. --- --------- 103
A-2. System configuration of Fig. A-1 in event104(logic) space. - -----------------
A-3. Overall function in event space of two redundant107systems with common element or system. -------
A-4. Overall function in event space of three redundant------ - 109systems with common element or system.
A-5. Model for two redundant systems with maintenance112or test. - - - - ------------------
A-6. Assumed configuration of nonessential ac power114system. -----------------------
96

. _ _ _ _ _ _
FIGURES (cont)
A-7a. HTGR secondary coolant system flow diagram --normal operation. --------------- - -- 121
A-7b. HTGR secondary coolant system flow diagram --auxiliary boiler operation. - -- - - -- -- -- - - 123
A-7c. HTGR secondary coolant system flow diagram --flash tank operation. 131----------------
A-8. Simplified Class lE electrical bus schematic. - - -- 137
A-9. Core auxiliary cooling system. - -- -- --- - - - 156
A-10. Alternate ac power feed for CACS. -- - - - - - - -- 1 61
TABLES
A-I. Auxiliary Boiler Operation - -- - - -- -- - - - - 124
A-II. Flash Tank Operation ------ - - -- -- - - - - 132
A-III. Demand Failure Probabilities and Failure Ratesfor Electric Power Systems - -- -- -- -- - - - - 140
A-IVa. Essential ac Power System Availability FollowingLoss of Off-Site Power Event - - - --- --- - -- 142
A-IVb. Essential ac Power System Availability FollowingLoss of Off-Site Power Event -- - - -- -- - - - - 143
A-ivc. Essential ac Power Availability Following Lossof Off-Site Power Event - -- -- - -- - - -- - - - 144
A-IVd. Essential ac Power System Availability FollowingLoss of One Essential ac Power Bus - - - - - - - -- 145
A-V. Probability of Restoring Systems to OCondition - - - - - - - - - - - - perational - --
-- --- 149
A-VI. Probabilities of Diesel Generators FunctioningAfter Trip --------------------- 150
A-VII. CACS Component Availability and Failure Rates - - - - 157
A-VIII. CACS Parameter Values from DBDA Cooldown Modeling - - 164
A-IX. Comparison of CACS Circulator PerformanceCapability with Cooldown Model Parameter Values - - - 167
97
- - _
_ _ _ .

.. -
__
TABLES (cont)
A-X. Summary of Assessments for Mechanical Hardware - - - 171
A-XI. Summary of Assessments for Electrical Equipment - - 175
A-XII. Summary of Postaccident Assessments - -- -- - - - 179
98
. . . . . . . . __ --
APPENDIX A
CALCULATION OF EVENT SEQUENCE BRANCII PROBABILITIES
I. INTRODUCTION
System elements and their logical interrelationships are first
considered as functional or failed in logic space. The resulting
logical expressions for the interrelationships are then used inprobability space to assign a probability to the functional or
failed state o' the overall systen.
II. LOGICAL DIAGRAMS AND EVENT SPACE
Logical diagrams or trees are constructed to describe the op-erating and failed states of a system. These formal logical dia-grams show the conditions, i.e., functional or failed, af the sys-
tem elements that are necessary in order for the top condition oroutcome of the tree to be achieved. The top condition or outcome
of the tree is a predetermined system state (condition) of inter-
est. In this study, we are interested in determining the pathsand elements necessary for achieving operational or functional sys-tem states as well as the failure stmte. The tree logic modeling
starts at the black box level. This determines the resolution ofthe tree. For analysis, the tree is represented in mathematical
form using Boolean equations and the evaluation is done by applyingthe laws of probability.
In the Boolean equation representation, the basic quantitiesare the system or component functions or failures. The state of
each system or component may be identified, for convenience, by aunique symbol in the Boolean representation. In addition, the
graphical logic symbols of AND, OR, and INHIBIT gates are used torepresent the Boolean operations on the various basic quantities.
The interconnection of these gates shows the system interdependen-cies necessary to produce the top condition or outcome of the tree
being modeled.
99

- __ _ . ._..._._____._ _ _.___ ____ ___._ _ _______ _ _
The OR gate is equivalent to the Boolean symbol "+" in,
engineering notation,and represents the union of system states thatare input to the gate. At least one of the input states must be
true in order for the gate output state to be true. The AND gate
is equivalent to the Boolean symbol ".", in engineering notation,and represents the intersection of system states that are input to
the gate. All input sts'.es must be true in order for the gate
output state to be true. These Boolean operations must not be
confused with the respective operations of addition and multiplica-tion in ordinary algebra. The INHIBIT gate is a symbolic represent-
ation that may be used as one means of incorporating the fundament-al Boolean algebra concept of the "NOT" function into the systemmodel. The "NOT" function, indicated by a line over a symbol, means
the negation of the symbol or state to which it is applied. For
example, O reans "not 0" and has the value of 1 because, if it isnot 0, the only other value it can have is 1 in a binary system.
Similarly, I has the value 0. In this study, if we let A represent
the functioning state of a component or system, E represents thefailed state. Using this representation for A and E, the intersec-tion of A with the states of other systems will permit the overall
function if the other system states are all functional and A is
functional. The intersection of E with the states of the othersystems will inhibit or prevent the overall function. If we inter-
change the above definition of A and E, and apply A to the inhibitinput of an intersection operation (INHIBIT gate), we can represent
the same overall function of the intersection as above. Thus, it
is only necessary to use one of the above methods to represent theinteraction of the system states. When considering conditions such
as common mode failure, system failure due to test, or system fail-
ure due to maintenance, it may be preferable to consistently use
all symbols in the same context and select the appropriate logicalrepresentation, the NOT function or the INHIBIT function, to makethis possible.
The basic rules of Boolean algebra are used to simplify and
rearrange the symbolic representation of the system. Care must be
exercised in manipulating the Boolean equations because some
100
.. . . . _ _ _ _ _ . _

transformations remove redundancies; one of the important featuresof the systems that we are trying to evaluate.
III. PROBABILITY SPACE
A system that has been described in event space by the equiv-alent Boolean equations can be quantitatively evaluated in proba-bility space by application of the laws of probability. The basic
relationships used to relate event space and logic space and thelaws used to combine probabilities are given below.
Union operation:*
In event (logic) space,
X=A+ B
and the associated relation in probability space,
P(X) P(A) + P(B) - P(A E)=
or the small probability approximation,
P(X) P(A) + P(B).=
Intersection operation:*
In event (logic) space,
X=AB
and the associated relation in probability space,
P(X) P ( A) P (B) ,=
for A and B independent and
P (X) P(A) P(B/A),=
101

. . . . _ _ _ _ . . _ _ _ _ _ . . . _ . _ . _ _ _ _ _ _ _ _ _ _
for A and B dependent.
The small probability approximation is applicable when P (A.B)is much smaller than P(A) and P (B) . If A and B are independent,
P(A B) = P(A) P(B). P(B/A) is the conditional probability of B
given that A has occurred. These operational probability laws may
be generalized to any number of events.
Several examples will be presented to demonstrate the methodsused to develop the event space logical representation of systems
in symbolic and Boolean equation forns. The probability space
representation of these sample systems will also be presented inthe following sections.
A. Two Redundant Systems with Single Common Mode Element
1. Event Space. The method may be illustrated by consider-
ing a configuration of elements as shown in Fig. A-1. We have two
similar, redundant systems, A and B, with a dependency upon a com-
mon element (or a third system) C. The system elements are desig-
nated a, b, d, and e. The overall function, X-X, [or failure,
(X-X)] of the configuration depends on the state of the systems A
and B and element C. The logic (event) space diagram for the system
is shown in Fig. A-2. If we consider the function and failure of
System A, we obtain the following relationships in logic space.
Symbols, a, b, etc., and a, b, etc., are chosen to represent func-
tional state and failed state, respectively.
System A is functional if abde is true. That is, System A is
functional if, an only if, elements a and b and d and e are
functional.
System A is failed if
a + b + d + e = abde
102
....__ _ __ _ _ _ _ _ .._ .._ _ _._ _ m

- - . - - - . . _ . -
-
X
C
r ,
a e'
b b'
SYSTEM A r SYSTEM BEE E S
d 'Ad'
e e'- s
X
Fig. A-l. Arrangement of system elements -- redundant systems withcommon element.
is true. That is, System A is failed if element a or b or d or e
is failed.
Similar expressions describe the states of System B and con-sideration of both System A and System B results in the followingpossible states.
Both systems are functional if
(abde ) (a ' b ' d ' e ' )
103
--
. . _ . . . . _ .

X OVERALL FUNCTIONPERFORMED BYSYSTEM A OR SYSTEMB OR BOTH
SYSTEM A PERFORMS SYSTEM B PERFORMS
OVER ALL FUNCTION OVERALL FUNCTION
AC BC
SYSTEM A SYSTEM (OR ELEMENT) CFUNCTIONAL F UNCTIO NAL SYSTEM B
FUNCTIONALA B
C
a b d e a' b' d' e'
X = OVERALL FUNCTION X = C( A B) + C(A+B)- (A+B)FAILED = AB+C (NOT IN MINIMAL FORM)
Fig. A-2. System configuration of Fig. A-1 in event (logic) space.
is true. Both systems are failed if
(abde) (a ' b ' d ' e ' )
is true and one system is failed if
(abde) (a ' b ' d ' e ' ) + (abde ) (a ' b 'd ' e ' )
104
. . , . . , . . . . . - - - _ _

. . . ___
is true.
We now consider the role of the common element (or system),c, and the function, x-x, of the overall configuration. In
logic space, System A is functional and performs the overall func-
tion if c (abde) is true and System A is failed and fails to per-form the overall function if c (abde) is true.
Similar relationships hold for System B. Both Systems A and
B are functional and perform the overall function if c (abde) (a ' b 'd 'e ' )is true,and both systems and the overall function are failed if
(abde) (a'b'd'e') +c= c abde) (a'b'd'e')
is true. At least one system is functional if
I (abde)c (abde) + c (a ' b ' d ' e ' ) =c + (a'b'd'e')
is true. Only one system is functional and performing the overallfunction if
(a'b'd'e')fc (abde) (a'b'd'e') + (abde)
is true.
If the elements of the systen are considered in the functional
state (represented by a, b, d, etc.) and the systems are consideredin functional states, i.e., in general, N functioning, N-1 func-
tioning, -- , the common element, c, is joined with the system
functioning states by the logical AND (intersection) operation. The
functioning element, c, is also joined with the failure states of
the individual systems by the logical AND operation.
The total failure state, (x - x), of the overall system func-
tion is represented by the intersection of the failure of all sys-
tems joined by the OR (union) operation with the failure state of
the common element, c.
105
--
_. _ _ _ . . . .
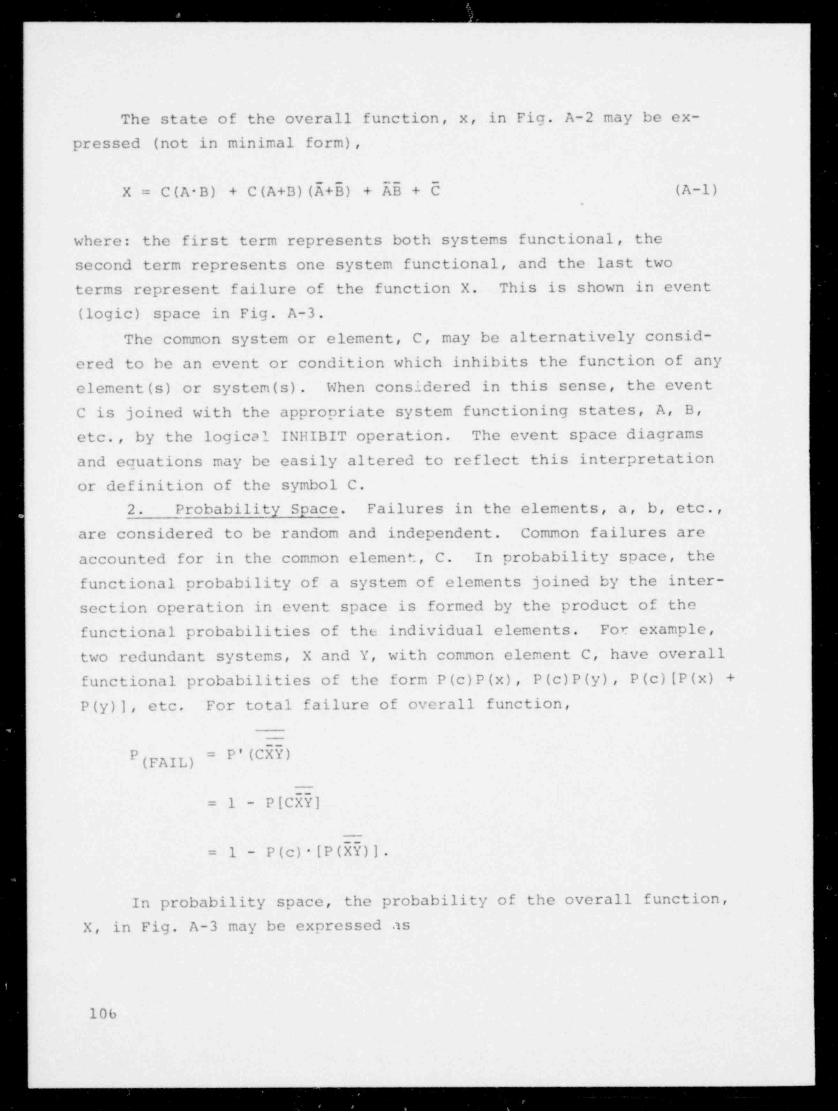
_ _ . . . .. ... __..._ _ _ ____ _
The state of the overall function, x, in Fig. A-2 may be ex-
pressed (not in minimal form),
X = C(A B) + C ( A+B) (E+5) + EE + C (A-1)
where: the first term represents both systems functional, the
second term represents one system functional, and the last two
terms represent failure of the function X. This is shown in event
(logic) space in Fig. A-3.
The common system or element, C, may be alternatively consid-
ered to be an event or condition which inhibits the function of any
element (s) or systen(s). When considered in this sense, the event
C is joined with the appropriate system functioning states, A, B,
etc., by the logical INHIBIT operation. The event space diagrams
and cauations may be easily altered to reflect this interpretation
or definition of the symbol C.
2. Probability Space. Failures in the elements, a, b, etc.,
are considered to be random and independent. Common failures are
accounted for in the common element, C. In probability space, the
functional probability of a system of elements joined by the inter-
section operation in event space is formed by the product of the
functional probabilities of the individual elements. For example,
two redundant systems, X and Y, with common element C, have overall
functional probabilities of the form P (c) P (x) , P (c) P (y) , P(c)[P(x) +P(y)], etc. For total failure of overall function,
::
P(FAIL)::
= 1 - P [CXY]
==1 - P(c)-[P(XY)].=
In probability space, the probability of the overall function,
X, in Fig. A-3 may be expressed as
106
. . ..........._ _ ___ _ . _-

..... - - -
X
/\/ \
BOTH FUNCTIONAL FAILURE
ONE FUNCTIONAL
/\
|A B C
/\ /\"
/ \ / \es: ,
. ,,
4 1
--
A B
Fig. A-3. Overall function in event space of two redundant systemswith common element or system.
P(X) = P (C) P (A) P (B) + P (C) P(A) + P(B) P(E) + P(5)
+ P (E) P (E) + P(C) (A-2)
where
107
- - - -
_ __

P (A) , P(B), etc., is the probability of system function and
P (E) , P (5) , etc., is the probability of system failure.
The respective terms in Eq. (A-2) are the probability space
counterparts of the event space terms in Eq. (A-1).
B. Three Redundant Systems with Single Common Mode Element
1. Event Space. For three independent or redundant systems,
A, B, and D, with common element or system C, the state of the
overall function, X, may be expressed in event space (in nonminimal
form) as
X = C (ABD) + C [ A (B5 + ED) + EBD]
+ C[E(ED + B5) + AB5] + E55 + 5 (A-3)
where the first term represents all systems func tional , the second
term represents two systems functional, the third term represents
one system functional, and the last two terms represent failure of
the fanction X. This relationship is shown in event space in Fig.
A-4.
2. Probability Space. Failures in the systems are considered
to be randon and independent. In probability space, the probability
of the overall function, X, in Fig. A-4 may be expressed as
P(X) = P (C) P (A) P (B) P (D) + P (C) (P ( A) (P (B) P (5) + P (s)P (D))
P (E) P (B) P (D) ] + P (C) [P (E) (P (E)P (D) + P (B) P (D) )+
+ P (A) P (E) P (D) + P(E)P (5)P(5) + P(C). (A-4)
The respective terms in Eq. (A-4) are the probability space counter-
parts of the event space terms in Eq. (A-3).Pault and event trees are constructed using these rules and
examples. Information in the fault and event trees is to be com-
bined by these rules to obtain the overall probability of a given
108

.. ____.___
X
/\/ \
/ \THREE NONE
TWO ONE
/ \-
:s,
ABCD
/ \ / \
AB D A A sb 4 4g6
/
/\ A
BD Bb
Fig. A-4. Overall function in event space of three redundant sys-tems with cormnon element or system,
branch of the tree. The event (logic) space equations are not re-
duced to minimal forn as this would, in general, remove redundancies
which are important to the overall probability of success and failure.
109
_ . . . _ _

a i
1. . . . . . . .... . . . . . . . . . . . . . . . . _ _ _ _ _ _ . _ . _ _ .
C. Three Redundant Systems with Two Common Mode Elements
1. Event Space. One additional case in event space is of
interest. We assume three independent or redundant systems with
two common mode failure possibilities. An example of this is en-
countered in the analysis of the function of a single electrical
bus where three possible sources of ac power, main generator, off-
site power (2 lines), and diesel generators (2),are expected to oe
functional and connected to the bus. The possibilities of common
mode failure of the off-site power sources and of the diesels
(failure to start and in-rush current trips) need to be considered
in the analysis. If proper system function is represnted by sym-
bols A, B, and D, common failure of system B is represented by CB'
common failure of system D is represented by C nd the existenceD,
of neither common mode failure is signified by C, we have the fol-
lowing event space expression for the overall function of the system.
X = ABDC + AB[U(C+CD) D (C + D} }+B
+ AE [D (C+C l+ ( ) +^ I D+ (C+CB)lB
+ EB[C + C+DCD B B( + D)]+ ^ + D[C+CB
+CB D[ (B+5D)] E5[C + (C+CB)] + BUC ^~+ '
D B
The terms of Eq. (A-5) represent the following system function-
al states and contributions to the overall function, X:
1. all systems functional and contributing to the over-all function, first term;
2. two systems functional and contributing to the over-all function, second through fourth terms;
3. one system functional and contributing to the over-all function, terms five through eight; and
4. failure of all systems and failure of overall func-tion, terms nine through eleven.
110
.
----um- - - - - - - - - - -
' - - '

, . _ . . .--
--
2. Probability Space. The representation of Eq. (A-5) in
probability space is derived by the same method used in the pre-vious sections. The resulting equation has been omitted in this
section. In deriving the probability space representation for a
specific application, it is necessary to consider if the two com-
mon mode failures are independent or dependent.
D. System Maintenance or Test
It is of interest to consider the effects of system mainten-
ance or test in event space on the availability of a system or
function. The event space diagram for two redundant systems with
maintenance or test is shown in Fig. A-5.
The notation and assumptions in Fig. A-5 are as follows:
-- Two redundant systems with maintenance and test --
A system A functional,=
A' system A failed by maintenance or test,=
E = system A failed due to random failures,
E' = system A not failed by maintenance or test, andA" = system A in maintenance or test status.
System cannot fail by random failure when in maintenance or
test status. Only one system can be in maintenance or test status
at a given time. The term A' = A"5" indicates system A, failed by
maintenance or test with system B not in test. The term A' + EE' =A'+E indicates system A failed by maintenance or test or by randomfailure and not test.
The overall system function is as follows:
-- Both systems are operational if --
A (E' ) B (E ' ) = A(E"A")B(E"B")
is true.
-- One system is operational if --
A (E') [B' +E] + B (E ' ) [ A ' +E] = A (E"A") [E (E"B") + E"B"]
111
- - - - .
_ _ . - ,
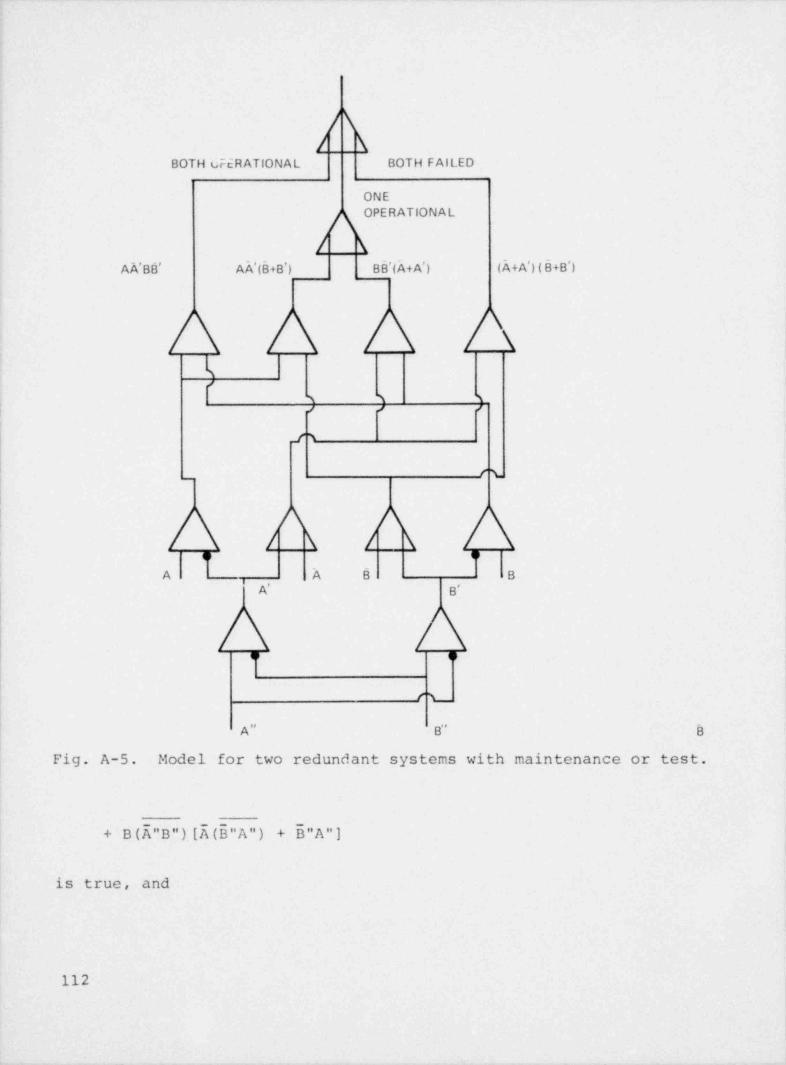
/\/ \
BOTH cFERATIONAL BOTH FAILED
ONEOPERATIONAL
/ \A A'B B' Ah'(B + B') B B'( + A') (d + A') ( B + B')
\\
(f s s s
/ / /
/N
r%
/\ /\/ \ / \
,, <>
A 4 B BA' B'
U o
fL
A" B" B
Fig. A-5. Model for two redundant systems with maintenance or test.
+ B (E"B") [E (E"A") E"A"]+
is true, and
112

-- Both systems are failed if --
[A'+E][B'+E] [E"A"+E] [E"B"+E]=
is true.
Numerical example:
1
A" = 0.07 A = 0.99
Assumed probabilities
B" = 0.06 B = 0.98
A (5" A") B (E"B") = 0.85578591* = both operational*
A (B" A") [B (Is"B") + A"B"] + B ( A"B") [ A (B"A") + B"A"]*
0.13860219=
= one operationa.~.
and
[E"A" + El[E"B" + E]*
-3= 5.61191 x 10
= both systems failed (Sum = 1.0)
The probability of the overall function being performed in this
example is 0.9943881. If test and maintenance probabilities are
assumed to be zero, th e probability of the overall function being
performed would be 0.9998.
*Calcula ted values in this report are shown to a precision neces-sary for developing meaningful check sums and they should notbe interpreted as significant digits in any other sense,
113

IV. ANALYSIS OF NONESSENTIAL ac POWER
The assumed configuration of the nonessential ac power system
is shown in Fig. A-6. In this block diagram, subscript 1 denotes
events that will affect the supply of power to both buses and sub-
script 2 denotes events that will af fect the supply of power to a
single bus.
A. Turbine Tripped
When the turbine is tripped, the following equations repre-
sent the system in Fig. A-6 in event space:
1. Both buses are energizea if
I(AA^b}(^1jCCy2 y 2}I^l^2C Cj) (C C C )A y y
is true,
2. One bus is energized if
m.g. B,
-- ) ) A i
LINE 2gN( ( C,
A B C A B C2 2 2
BUS "X" BUS "Y"
Fig. A-6. Assumed configuration of nonessential ac power system.
114

|I^1^2AjC__1) (A A Ajcf) (A C C Cj) (AjC Cy 2 b}_ _ _ _ _ _
1 2 y y 2
CEC1 y 2 j) (I C 0 Cf )~
^1 2^5 l}I^1'2^5 2}I g12
is true, and
3. Both buses are failed if
(A C ) (A C A Ah} ^l2__b}||__ _ __ _
y 2
is true. The probability * of a single line failure
Ey=Ey= 10 Ay=Cy=1- 10 .
The probability of inadvertent open breakers (predominant cause ofthe loss of bus feed to a single bus) :
-42" 5"2 j=10=
4A2=Aj = Cj = C2= (1 - 10 ).
-1The procability of both buses being energized = 9.989877327 x 10.
The probability of one bus being energized = 1.226664082 x 10⁻⁵,The probability of both buses being failed = 1.000000612 x 10 -3
,
If we assume a tie breaker between bus X and bus Y in Fio.A-6, the probability of both buses being energized = 9.989999982 x
-110 the probability of one bus being energized = 1.226664082 x,
10- and the probability of both buses being failed = 1.000000612,
-3x 10 ,
*
Tnese analyses use median values of system or component unavaila-bility and failure probabilities as reported in the data base inRef. 1; exceptions are noted. Computed system probabilities aregiven in terms of their point values.
115

These are the probability values for the event sequence
branches in Figs. 9a, 10a, lla, 12, 13, 14, and 19.
B. Loss of Off-sita Power Without Turbine Trip
Uhen off-site power is lost without intentional turbine trip,
the following equations represent the system in Fig A-6 in event
space:
1. Both buses are energized if
B B Bjy2
is true,
2. One bus is energized if
By(B2 b + 2 j)B
is true, and
3. Both buses are feiled if
__
_y+By(B Bj)B2
is true. The probability of the main generator tripping as a re-
sult of loss of off-site power:
E = 0.05 B = 0.95 (Values are from Ref. 2).1 y
The probability of inadvertent open breakers (predominant cause of
the loss of bus feed to a single bus):
~42 j=10 B2 = Bj = (1 - 10~ )5 = .
116

. . . . . _ _ _--
The probability of both buses being energized = 9.4981 x 10⁻¹ The'.
probability of one bus being energized = 1.89981 x 10 The-4.
probability of both buses being failed = 5.00 x 10 These are-2
.
.he values for Fig. 16.
C. Availability of Nonessential ac Power for Times up to 300 hFollowing Initiating Events
The availability of nonessential ac power following the ini-tiating event is examined for two assumed arrangements of bus con-nections, one-line-one-bus energized and one-line-both-buses ener-gized, and considering the possibility that the system may or maynot be repaired following the initiating event.
The probability of loss of a line without repair is
-AtP= 1-c
where A ir the failure rate.
-5A = 2.5 x 10 for the loss of two lines plus faults in thebus, transformers, etc.
-5i = 2.0 x 10 for the loss of two lines= 2.68 x 10⁻⁴ for the loss of one line.1
This gives, at 300 h,
- - _,A=C= 7.73 x 10 ~ = probability that a line is lost.
Considering repair of the line and restoration of power,
_(AT-1)
(1-C l}-t T_ _ ;7 1/TA=C= ET-1 /
where
) is the failure rate,
is the time to repair the line or restore power, andT
g is the time from the initiating event.117
--
. _ _ . . . _

1. One-line-one-bus Energized Configuration.
T =1h
ty = 300 h-4
) = 2.68 x 10 gives
E = 5 = 2.47 x 10- = probability of a line being in thefailed state.
For the one-line-one-bus energized configuration,
-- Both buses are energized if --
AC is true,
-- One bus is energized if --
AU + AU is true, and
-- Both buses are failed if --
EE is true.
At 300 h, this gives the probabilities of function:
Buses Energized Without Repair With Repair
2 8.5 x 10⁻¹ 9.995 x 10⁻¹¹ 1.4 x 10⁻¹ 4.9 x 10-40 6.0 x 10⁻³ 6.1 x 10⁻⁸
2. One-line-both-buses Energized Configuration.
-- Both buses are energized if
::(AC) is true,
-- Only one bus energized cannot exist, and
118

-- Both buses are failed if --
__
(AC) is true.
At 300 h, this ginos the following probabilities of function:
Buses Energized Without Repair With Repair
2 9.94 x 10⁻¹ - 1.0
1 0 0
0 6.0 x 10⁻³ 6.1 x 10⁻⁸
These are the probability values for the event sequence branches
in Figs. 9b, 10b, and llb.
3. Restoration of Off-site Power. When the initiating event
is the loss of off-site power or if off-site power is lost at the
time of the event, the probability of restoration of nonessential
power is of interest. We assume that the restoration of one line
restores off-site and nonessential ac power. If we designate the
lines by A and C in event space, power is restored if
AU + EC + AC = A+C = (Eh)
is true. The probability of not restoring one line at time t isy
' 1/Tg
where T is the repair time for one line. We obtain the following
probabilities:
(h ) = Power Restored (EU) = Power Not RestoredTime, t y~11h 8.647 x 10 1.353 x 10⁻¹
1.25 h 9.179 x 10⁻¹ 8.208 x 10-22.0 h 9.817 x 10⁻¹ 1.832 x 10⁻²
These values are used in the nonessential ac power branches of
the event sequence in Fig. 18.
119

At 300 h, assuming a one-line-both-buses energized configura-
tion, both buses are energized if
::(AC)
is true and both buses are failed if
(EC)
is true. With repair, the probability that a line will be in the
failed state at 300 h is
~4X=C= 2.47 x 10 .
At 300 h, with repair, the probability that both buses are ener-
gized is
-1( ) = 9.9999994 x 10
and that both are failed is
(EC) = 6.1 x 10~ .
These numbers are used in the nonessential ac power branches of
the event tree in Fig. 18.
V. ANALYSIS OF MAIN LOOP COOLING
The refernece design HTGR secondary coolant system is shown in
the simplified flow diagram in Fig. A-7a. In addition to the nor-
mal operating mode where steam is supplied to the main turbine-
generator, the main loop cooling system may operate in the flash
tank mode to remove decay heat from the core following shutdown.
In this mode, the evaporator and superheater sections of the main
steam generators are flooded and the superheater discharges heatedwater to the flash tank. The flash tank separates the steam / water
120

_ _.__
yb, , ,Via
Crculator .Aussbary f -v g.boeler .. O'O@ E ,'
V4i A L[l rM V2Sa High pressure
V266 V26a V3.;, turbee
stoom ;ened
Cerculatori group I(Typ) (typ of 2 groups)
VISO Atm r --! V22 Peheater
-
7* d V5 W o*P IIAtm4 V24d k ' '(typ of 3)( ,MF W P Turb (typ of 2)T d.
#
L+gt *-
O VI V6 0'09 IV21b V21e V23 'u
i V12 / + Reheat; Crculetor Atm 8N steem ime-
(typ of 3) Vf9a dSuper- heate' Vl3 'LV8e V8b"ir V7 \ r7% 29 P de vep -e con
typ (typ of 2) s0000, 'N'
Vs o ; .. ...r, -- '
Jk>|4 @VIOcV Ob i
To dump tank mim.' Vl7 V20e i* -, y r,
SG: '
group H V30 Steam generator group I \g, ,, , , y,
[h .(3 800061 Vl4b i,' I VIOb
Vl4eV16
Main feed water intermediatef SG * pump I (typ of 2) A P'''' W"
group II 4 f+ twbmeFlesh tank I MF WP II fu ,,
Dyp of 2) g y ,,, p, , ,,,,Of#To ousilia tur beneA
'-
- - -- 5V27o serAuxiliary feed woterpurnp (typ of 2)
_ T q- Decerotor 8 , Feed water Dominerolaer Condensate purgs,
storage tank heater
shJ .
H Fig. A-7a. IITGR secondary coolant system flow diagram -- normal operation.
- - . . _ _ _ _ . _ _ _ _ _ . _ . . . . . . .

mixture and provides auxiliary steam to drive the main circulator
turbines. Auxiliary boilers are also provided to supply auxiliary
steam for the cooldown operating mode of the main loops.
The configuration of the main loop cooling system is such that
failure events may be grouped into one of three fault categories
according to their af fect on the system. These three categories
contain faults that affect the function of:
1. a single main loop,
2. a group of three main loops, and
3. all main loops.
Only the last two categories of faults are considered in this study.
A. Operation With the Auxiliary Boiler
Figure A-7b shows th' secondary coolant system configuration
for operation with the auxiliary boiler. Table A-I shows the
events, demand failure probabilities, failure rates, and logical
relationships causing loss of main loop cooling capability in the
auxiliary boiler mode.
The failure logical relationships and demand failure probabil-
ities in Table A-I show that the elements affecting the function
of one group of main cooling loops (3 loups) will cause one group
of main loops to fail to respond to the demand for operation in the-2
auxiliary boiler mode with a probability of 2.16 x 10 per demand.
Elements that a f fect the function of both groups of main loops (6
loops) will fail to respond to the demand for operation in this-2
mode with a probability of 2.01 x 10 per demand. These values
are used to estimate the probabilities of the main loop cooling
function in the auxiliary boiler mode.
The probabilities that the main loop cooling function resonds
to the demand for operation in the auxiliary boiler mode are:
122

_ _ _ _ _ . . . _
Y--~Vlo
> ;
CuculatorAuxibory # y g
boiler ---I' "E
y4
V2So H89h P' essureV3 turbaneV26oV2g ;.
' Circulator = group I'Momsteam line (Typ) ' (typ of 2 groupel4
Vl80 Atm f~~ ReheaterV2,y T** U
[ ~ AIM >4 V5V24Jk (typ of 3) ,r ,
o 7 WFWPTurb (typ of 2) ,
?--t* II c,oup IV6 iVI
V2tb V21o V23 3r ge ne,ty .
b Crculator Atm steam 6me'_ X' s
- ,
'
,p 3 .) pgg,, ., ,
'Vl9c Q \ Reheater VIOc
7|4V Ob i
To dump tank *
VI, V20o \| , yV30 steam generotori group I \ Vloog pg (, p ,, (f yp' 2 groups) Vl4b3 loopal gr.q 7- g
VIOb, y
V14 e' *''""#'
Main f eed- waterA h*'''SG } pump I (typ of 2)1' b
Of0"PIi N ypwp g A ^Flash tonk I T +
\/ low pressure(typ of 2)
To auxilio A
L ; o_,.n.e,-r ,,oAuxiliary feed-waterpump (typ of 2) T I
'
Deserator 8 J, Feed - water Demaneralizer Condensate purgestorage tank heater
b Fig. A-7b. IITGR secondary coolant system flow diagram -- auxiliary boiler operation.w
-
. _ . _ . . . .

FABLE A-I
AUXILIARY BOILER OPERATION
Events causing loss of one group of main loop steam generators(3 loops):
Fail /h Fail / demand-4
1. V25b or V25a fail to open (b)=1 x 10 /D-3OR (a)=5 x 10 /D
2. V22 fails to close and-4remain closed 3 x 10 /D
OR
3. V24 fails to remain-4closed 7 x 10 /D
OR
4. a. Loss of auxiliaryheader 1 x 10_g/h
OR
b. V5 and V5' and V5"-3fail to open 5 x 10 /D
OR
c. V6 and V6' and V6"fail closed (c)
OR
d. V7 and V7' and V7"fail open (c)
OR
e. V8c and V8c' and V8c"fail open 1 x 10- /h
OR~4f. (V8a or V8b) and (a's)=1 x 10 /D
(V8a' and V8b') and -4(b's)=1 x 10 /D(V8a or V8b ) fall
to remain open
OR
g. Fail MFWP and V16fails closed / fails -5 ~4to remain open 3 x 10 /h 1 x 10 /D
OR
124

TABLE A-I (cont)
Fail /h Fail / demandh. (V14b or V14a) and V16
fail closed / fail to Each valve:remain open 1 x 10⁻⁴/D
OR
i. Steam generator group-10
F.W. header fails 1 x 10 /h
OR
j. Vl7 and V17' and V17" _4fail closed 1 x 10 /D
OR
k. (V20a and V20b) and(V20a' and V20b')and (V20a" and V20b")fail open/ fail to re- Each valve:main closed 1 x 10⁻⁸/h
OR
1. (V18 or V18a) and(V18' or V18a') and Each OR group:(V18" or V18a") fail 1 x 10⁻⁸/h +open/ leak -- rupture / 1 x 10⁻⁵/hpremature open
OR
m. V21a and V21a' and (MSL breakV21a" fail to close and fail to Valves:and (nain steam line close): 5 x 10⁻³/Dbreaks or Vla and V1b 10-10/h andfail to close) 5.4 x 10⁻⁶/h
OR
n. [Vl9a fails closedand (Vl9b failsclosed 19c fails toopen)] and [(Vl9a'fails closed and(Vl9b' fails closedor Vl9c' fails toopen)] and [Vl9a"fails closed and(Vl9b" fails closedor Vl9c" fails to Each valve:open)] 1 x 10⁻⁴/D
OR
125

TABLE A-I (cont)
Fail /h Fail / demando. V-31 fails premature
open and V-30 fails-5 -3to close 1 x 10 /h 5 x 10 /D
OR-8
3 x 10 /hp. Flash tank I(II) fails ~
OR
q. V23 fails closed / -3fails to open 5 x 10 /D
OR
r. V13 fails closed /fails to remainopen 5 x 10- /D
OR-10
s. Line breaks 10 /n
OR
5. Auxiliary feedwater pump-3fails to start and run 1 x 10 /D
OR-4
6. V27a fails to open 1 x 10 /DOR
-37. V27b fails to open 5 x 10 /D
The following elements are commor. to both steam generator groups:
8. Line break in Auxiliary-10Boiler Header 10 /h
OR~3 -4
9. V26b fails to open 1 x 10 /h 1 x 10 /DOR
-6 -310. V26a fails to open 5.4 x 10 /h 5 x 10 /DOR
-6 -311. a. V10c fails to open 5.4 x 10 /h 5 x 10 /DOR
b. V10A and V10b fail~ /h 3 x 10 /D-4
open/ fail to close 1 x 10
OR
126

. . . . . . - - -
TABLE A-I (cont)
Fail /h Fail / demandc. Main condenser fails (c)
OR
d. Both condensate pumps-5fail 3 x 10 /h
OR
e. Domineralizer fails (c)OR
f. Condensate pumps suc-tion line breaks orM.F.W. pumps suction
-10line breaks 10 /h
OR
g. Deaerator fails (c)OR
-8h. Deaerator tank fails 3 x 10 /hOR
12. Auxiliary Boiler fails t-2operate 1 x 10 /D
OR
13. Selective loss of power a
(NOTE: Values apply to each valve,etc., in the logical state-ment unless separate valuesare given.)
-6"open circuits = 4 x 10⁻⁶transformer shorts 1 x 10⁻⁷other shorts 7 x 10⁻⁹double faults 3 x 10
= 5.7 x 10⁻⁶ h-1
Both groups of main loops (6 loops) functional is of the*
form A B C in logic space which gives a probability of 9.38026 x-110 per demand that both groups are functional.
127
--
- . . .

One group of main loops (3 loops) functional is of the+
form (EB + AE)C in logic space which gives a probability of-9
4.1417335 x 10 ~ that one group is functional, and
The failure of all main loops to respond is of the form*
(EE + C) in logic space which gives a probability of 2.056656 x-210 per demand that main loop cooling fails to respond.
In considering Category IIB events, it is assumed that one
group of main loops is not available at the start of shutdown; i.e.,
one group of main steam generators was disabled by the Category II
event. The probability that the remaining group of main loops will~1respond is 9.583 x 10 per demand and the probability that the re-
maining group will fail to respond (main loop cooling will fail) is-2
4.17 x 10 per demand. These values are used for the general
Category IIB initiating event sequences.
The foregoing availabilities of the main loops for shutdown
cooling do not include consideration of the availability of common
ac power to the system. This is done to permit use of the values
in event sequences that detail the availability of electric power
and in which overall branch probabilities can be determined by the
previously given rules. The demand probabilities and failure rates
given in Table A-I include, where appropriate, power circuit de-
pendencies such as open circuits, short circuits, inadvertent open
breakers, and transformer failure for each active element of the
system.
The dependence of the main loop shutdown cooling operations on
the availability of ac power was considered for the following
conditions.
Both groups of steam generators operating:+
a. with loss of off-site power (LOSP)
When both nonessential ac buses are functional, the event
space relationship is of the form
( A+D) (C+D) = AC + D
is true whe re A represents incoming line 1 functional, C represents
incoming line 2 functional, and D represents the main generator
128

. ...._ -- - - -
functional. For LOSP, A=C=0 and both buses are operational onlyif D / 0. There exist unresolved questions about the probabilityof turbine trip accompanying LOSP. For example, Ref. 2 has used
two values for the probability of turbine trip, 0.1 and 0.05 with~1an occurrence rate of 0.1 yr for LOSP. Reference 1 assumes that
the turbine must be tripped when LOSP occurs and uses an occurrence~1rate of 0.2 yr for LOSP. The source of the turbine trip proba-
bility is not specified in Ref. 2 and no data have been found to
provide an independent value. Thus, this study has used 0.05 for2 ~1the probability of turine trip and 0.2 yr for the occurrence
rate of LOSP. However, it is doubtful that the probability of
turbine trip accompanying LOSP is as low as either of the two valuesgiven in Ref. 2. Although not known quantitatively, it is known
that other reactor plants designed for power runback have beenexperiencing turbine trip upon LOSP. With an occurrence rate of
~1 ~12 x 10 yr for LOSP and a probability of 5 x 10~ for turbine
trip resulting from LOSP, the expected frequency of occurrence ofturbine trips resulting from LOSP would be one in 100 reactor years.It is questionable that the existing operating experience can sub-
stantiata this rate.
The event space representation of both steam generator groupsoperational, including ac power dependence, is of the form
[ Power (Group 1) (Group 2) ] .
Using the previous values for the availability of the main loop'
cooling and the above values for the availability of nonessentialac power, the probability of both groups of steam generators oper-
~1ating with LOSP is 8.9112 x 10 .
b. with turbine trip
For turbine trip, the event space relationship for both non-
essential ac power buses functional is of the form AC is true, for
(EC + AC + AC) is true for aa one-line-one-bus arrangement, or
one-line-two-5us arrangement. From the previous section on non-
essential ac power,
129
__
, . _ - -
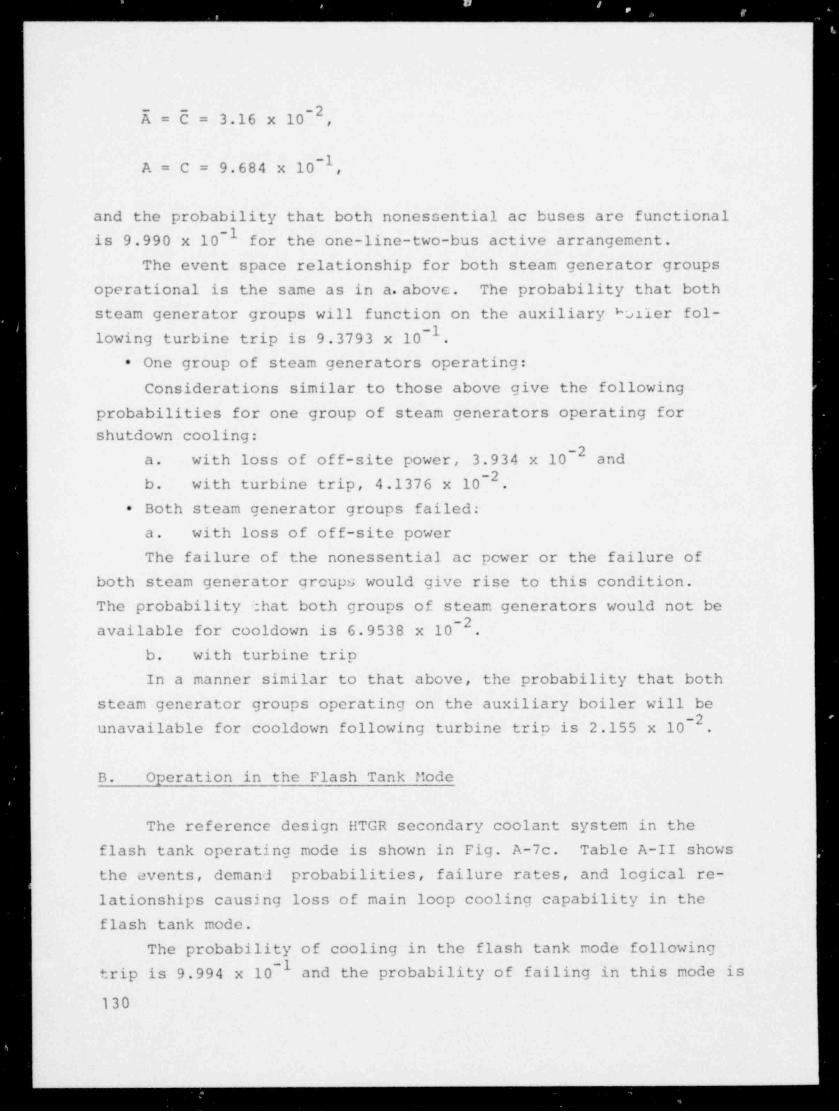
r. . . . _ . . . . _ . . . . . . .
A=C= 3.16 x 10- ,
~1A = C = 9.684 x 10 ,
and the probability that both nonessential ac buses are functional-1is 9.990 x 10 for the one-line-two-bus active arrangement.
The event space relationship for both steam generator groups
operational is the same as in a.above. The probability that both
steam generator groups will function on the auxiliary baller fol--1lowing turbine trip is 9.3793 x 10 .
* One group of steam generators operating:
Considerations similar to those above give the following
probabilities for one group of steam generators operating for
shutdown cooling:-2
a. with loss of off-site power, 3.934 x 10 and-2
b. with turbine trip, 4.1376 x 10 ,
Both steam generator groups failed:*
a. with loss of off-site power
The failure of the nonessential ac pcwer or the failure of
both steam generator groups would give rise to this condition.
The probability : hat both groups of steam generators would not be-2available for cooldown is 6.9538 x 10 ,
b. with turbine trip
In a manner similar to that above, the probability that both
steam generator groups operating on the auxiliary boiler will be-2unavailable for cooldown following turbine trip is 2.155 x 10 ,
B. Operation in the Flash Tank Mode
The reference design HTGR secondary coolant system in the
flash tank operating mode is shown in Fig. A-7c. Table A-II shows
the events, demand probabilities, failure rates, and logical re-
lationships causing loss of main loop cooling capability in the
flash tank mode.
The probability of cooling in the flash tank mode following~1
trip is 9.994 x 10 and the probability of failing in this mode is
130
. . - _ . . - - ---

. . . _ - . _ . . .
Vib, , ,Vic
::T: A.-,,
Aux!! or y Cwculatorx 3
boiler ...group H -4 '
V41A kfJ L
[l 7T V25o HIOh pressureV26c V3 tur WV26b -)
Circulator' group I'ste m kne F;L(Typ) (typ of 2 groups)
viso Atm j -- V22 Reheater,
d V5 , y*WP II*
AtmsC V24 z.1 (typ of 3) '
,7,MF W P Turb (typ of 2) #T d
t' -; +g *
0'0"P IO VI V6V21b V21e V23 -"y
Y Crculetor Atm I at lee4 )e
(typ of 3) Vf9a Super - hoot er y,3 g
I P 3 loops) lF
l Q 'g g ,g..,,,'Vl9c
dk ,| , V Ob VIO-
[ To dump forek *r,Vl7 V20e i,, { y 3, r,
group H V30 Steam generator' group I \ l Qy,gg,,, ,,(typ: 2 groups) 5, J kw3 loops) ,n m- ,
,
i i viobVl4e
Main feed water intermediat el' pump I (typ of 2) A P''''""SG -
group H y f- turbene
Flash tank I MF WP II fg__
,
IE ' ' \ / low pressureM* turbineTo auxilio A
V27a -- - - - - - - - ---
- condenserAuxiliary feed-water |pump (typ of 2)
_ Decerator 8 Feed water Demenerchzer Condensate pwweT y
nstorage tank hooter
-
C Fig. A-7c. IITGR secondary coolant system flow diagram -- flash tank operation.-
- - '
_ . -..- .

. . . _ . . . . . _ _ _ _ _ _ _ _ _ _ _ _ _ . _ _ _ _ _ _ __
TABLE A-II
FLASH TANK OPERAT10N
Elements that may cause the loss of one group of steam generators(loss of 3 loops):
(Values are for each elementunless otherwise specified)
Fail / demand Fail /h
1. Pipe system between flash _gtank I and V-24 - 1 x 10
OR
2. V24 fails to open/ remain-3 -6
open 5 x 10 5.4 x 10
OR
3. a. Loss of auxiliary _gheader - 1 x 10
OR
b. V5 and V5' and V5"-3 -6
fail to open 5 x 10 5.4 x 10
OR
c. V6 and V6' and V6" fail -8closed - 1 x 10
OR
d. V7 and V7' and V7" -8fail open - 1 x 10
OR
e. V8e and V8c' and V8c"-4 -5
fail to open 5 x 10 1 x 10
OR
f. (V8a or V8b) and(V8a' or V8b') and(V8a" or V8b") fail -4 -8to close 1 x 10 1 x 10
OR
g. Fail MFWP and V16 fails ~
3 x 10closed / fails to re- _4 _gmain open 1 x 10 1 x 10
OR
132
. . . . . . . _ _ _ _ _ _ - --

. . . . . . _ _ _ __
TABLE A-II (cont)
Fail / demand Fail /hh. (V14b or V14a) and V16
fail closed / fail t-4 -8remain open 1 x 10 1 x 10
OR
i. Steam generator group-10FW header fails - 1 x 10
OR
j. V17 and V17' and V17"-4 -8fail closed 1 x 10 1 x 10
OR
k. (V20a and V20b) and(V20a' and V20b') and(V20a" and V20b") failopen/ fail to remainclosed - 1 x 10⁻⁸
OR
1. (V18 or V18a) and Each OR(V18' or V18a') and group:(Vl8" or V18a") fail (1 x 10⁻⁸open/ leak-rupture / + 1 x 10⁻⁵)/hpremature open
OR
-3m. V21a and V21a' and 5 x 10V21a" fail to clos ~
and remain closed and line: 1 x 10(main stream line valves: 5.4 x 10⁻⁶breaks or Vla and Vlbfail to close andremain closed)
OR
n. p19a fails closed and(Vl9b fails closed orVl9c fails to open)]and [Vl9a' failsclosed and (Vl9b' failsclosed or Vl9c' failsto open)] and [Vl9a"fails closed and(Vl9b" fails closed or
-4 -8V19c" fails to open)] 1 x 10 1 x 10OR
133
~- M _ _ . . . .

TABLE A-II (cont)
Fail /denand Fail /ho. V31 fails premature
- 1 x 10~open and V30 fails t -3 -6close/ remain closed 5 x 10 5.4 x 10
OR-8
p. Flash tank I fails - 3 x 10
OR
q. V23 fails closed / -3 -6fails to open 5 x 10 5.4 x 10
OR
r. V13 fails closed / -3 -6fails to remain open 5 x 10 5.4 x 10
OR-10
s. Line breaks - 1 x 10
OR
4. Selective loss of power a a
Elements that are common to both groups of main loops:
5. Line break in I1FWP turbine -10header - 1 x 10
OR
6. V22 fails to open/ remain -4 -8open 3 x 10 1 x 10
OR
7. a. V10c fails open/t -4 -6remain closed 1 x 10 5.4 x 10
OR
b. (V10a and V10b failopen/ fail to close)and U8a and V3b andV8a' and V8b' andV8a" and V8b" fail _gto close/ remain closed) (c) 1 x 10
OR
8. Selective loss of power a a
See Table A-I.
134
. . . . . . -
- --

_._.___
6.0 x 10~ This result, in the absence of certain design detail,.
assumes that certain valves in Table A-II fail in-place and that
others, necessary to alter the system configuration from the normal
operating mode to the flash tank mode, are operable from an unin-
terruptible energy source in the event that normal power is lost.
C. Availability of teain Loop Cooling for Times Up to 300 h Follow-
ing Initiating Events
The availability of main loop cooling for 300 h following the
initiating event is examined for the system operating on theauxiliary boiler. The event dependenceis and failure rates in
Table A-I are used to develop the failure probabilities of the
main loop cooling system for the following assumed conditions of
the main cooling system.
1. All main cooling loops are functional at time t = 0,repair not allowed. At t = +300 h, the probabilitythat elements of one group of main cooling loops (3loops) produce failure of a group is 1.54 x 10⁻² andthe probability that elements common to both groupsof main cooling loops (6 loocooling failure is 5 x 10-3.ps) produce a main loopThe following probabil-ities of overall function are expected at +300 h:
Main LoopGroups Functional Probability
Both 9. 64 5 9 x 10~-2One 2.9945 x 10⁻³None 5.2360 x 10
2. One group of main loops is assumed to be failed at t =0, repair not allowed. At t = +300 h, the followingprobabilities are expected.
System Status Probabilit;y-1Remaining group functional 9.7968 x 10
-2Main loop cooling failed 2.032 x 10
These results are used in the event sequences in Figs. 9b,10b, llb, and 18.
135
- _ _ _ . . . _.

_ . _ . . . . . . _ _ _ . _ _ _ _ _ _ . . _ _ _ _
Analysis of the norral operation of the rain cooling loops
shows failure rates cf approximately one per year for one group
of loops and approximately 2.6 per year for the loss of main loop
cooling. Nuclear power plant operating experience for 1972 (Ref.
1, Appendix V) indicates three interruptions per year of main
feedwater.
VI. ANALYSIS OF ESSENTI AL POWER - CLASS lE
A simplified schematic of the essential power buses and their
feeds is shown in Fig. A-8. The related event space relationships
for system states of interest are given below.
A. Summary - Class lE Electric Power Event Space Relationships
Three buses are energized and+
a. All buses are fed by at least one source when
( A+B+C+D) ( A ' +B ' +C ' +D ' ) ( A"+B"+C "+D")
is true. When the major contribution to terms A and C is the loss
of a line or the incoming network (common mode) and the major con-
tribution to terms D, D', and D" is turbine trip (common mode),
this reduces to
A+C+D+BB'B" .
b. Two buses each have at least one source when
(XYZ) (a+Y ) + XYE(B+Y) + XYZ(a+B)
is true, where
X = A+B+C+D Z = A"+B"+C"+D"
X = KsC5 5 = X"s"C"5"
136
..... _ __ _ _

' - ' ' -. _ . _ _
b
a a
/% /N
$t s
2E m-
$t b
.$^GQ . 4J
N
e 22{ m 8=
$& E'
<
("na
/% /\
~E$t a8T29 mm
$t u
(~ ima aO
>
e :2( "n 'n
!5t -<
(e=
ac m am .s
jt A
s2$ ^ Cn
bt "
^sO
.
meE x
O<
137
-
- - . .

. - - . - . - . .__
Y = A'+B'+C'+D'
Y = X's'O'6'.
This reduces to the following under the assumption above.
K55 (sa's"(a+y) sa's"(s+y) + n s'a"(a+s))+ .
c. One bus has at least one source when
[ EYE + E5Z + X 2] [a(S+y) + Sy]
is true, where f(X,Y,Z) is defined above.
Under the assumption above, this reduces to
EUs [sn'ii" + ss'B" + B5's"] [a (3+y) + By] .
Two buses are energized and*
a. Two buses are fed by at least one source each when
XYZay__ + XYZby____ ___
+ XYZa/
is true where f (X,Y, Z) is defined above.
Under the assumption above, this reduces to
XE5 [sa'n"(G5) + en's"(Ei) + es's"(sE)] .
b. One bus is fed by at least one source when
EYE 5(SF + aE) + 5 Z3(Ey + F5) + X55E(sy a5)+
is true, where f (X , Y, Z) is defined above.
Under the assumption above, this reduces to
+ ss's"5(Ey + e5) + ns's"F(s': + a?)i.E55(se's"i(ss + a?)
138
______ _ _ _ - m
One bus energized and this bus is fed by at least one*
source when
EYEli + XEZ25 + XEEC5
is true, where f(X,Y,Z) is defined aF ove. Under the assumptionabove, this reduces to
K05(En's"s? + ss'n" ? + ns's" 7).
No bus is energized when no source is available and*
XEE
is true, where f(X,Y,Z) is defined above. Under the assumptionabove, this reduces to
EC6s5'5" .
B. Availability of Essential ac Power at the Time of the Initiating
Event
The den and failure probabilities and operational failure rates
are shown in Table A-III. These data were assembled from informa-tion in Ref. 1.
Analyses of the demand failure probabilities for the various
possible system configurations and initiating events have been
performed. Tables A-IVa-A-ivc show the probabilities of the pos-
sible states of the essential power system following the loss of
off-site power event with three conditions on the turbine trip.
From Tables A-IVa-A-ivc, it might be concluded that the addi-
tion of essential bus tie breakers may make a significant improve-ment in the availability of essential power. However, unless the
capacity of each source, mainly the diesel generator, will accom-
modate the connected loads to all buses, the arrangement with tie
139
-
.. __._

'-,.
-
.
TABLE A-III
DEMAND FAILURE PROBABILITIES AND FAIaURE RATES FOR -
ELECTRIC POWER SYSTEMS
,
-4A. Inadvertent open breaker Q = 10
-3Loss of line 2" = 10-3" '
Probability per demand 0 = 1.1 x 10⁻⁶
4 x 10Open circuits .\ =
-6*
Transformer shorts 1 x 10
Other shorts 7 x 10~-9
Double faults 3 x 10
Loss of line 2 x 10~
Failure rate (total) A= 3 x 10⁻⁵/h
-3A: 0 = 1.1 x 10 / demand
-53 x 10 /hA =
B. Diesel fails to start Q = 3.0 x 10~Battery ope.2, breaker cannot con- -3nect diesel generator to bus 1.0 x 10
-3Breaker fails to close 1.0 x 10
-3Diesel maintenance (45 h/yr) 5.2 x 10o
Probability per demand Q = 3.7 x 10⁻²Trip-out upon loading in-rush Q = 1.0 x 10⁻²
-3Diesel fails A = 3.0 x 10
-6Open circuits 2.0 x 10
Short circuits 4.0 x 10⁻⁷Double faults 3.4 x 10⁻⁹
Failure rate (total) A = 3.0 x 10⁻³
-25: 0 = 3.7 x 10 / demand
A = 3.0 x 10⁻³/h
140

_ _ . _ - - - . . ''
TABLE A-III (cont)
C. Same as A (except loss of line 1)
-3C: Q = 1.1 x 10 / demand"
3 x 10⁻⁵/hA =
-4D. Inadvertent open breaker O = 10
Probability per demand Q = 10-4(If turbine trips, 0 = 1.0a)
-6Open circuits A 2 x 10=
-6Auxiliary transformer shorts 1 x 10
Other short circuits 7 x 10⁻⁷Double faults 3 x 10⁻⁹Main generator fails ---
Failure rate (total) A= 3.7 x 10⁻⁶
~4D: 0 = 10 / demand
Q = 1.0
3.7 x 10⁻⁶/h1 =
-3E: Breaker fails to close Q = 1 x 10Battery open, breaker cannot
-3interconnect 1x 10Probability per demand Q = 2 x 10⁻³
-3$: 0 = 2 x 10 / demand
If initiating event is turbine trip, the network may be disturbedand lines 1 and 2 may be lost:
-2Oline 1 = Oline 2 = 3.16 x 10
141
- - -
_ . . .
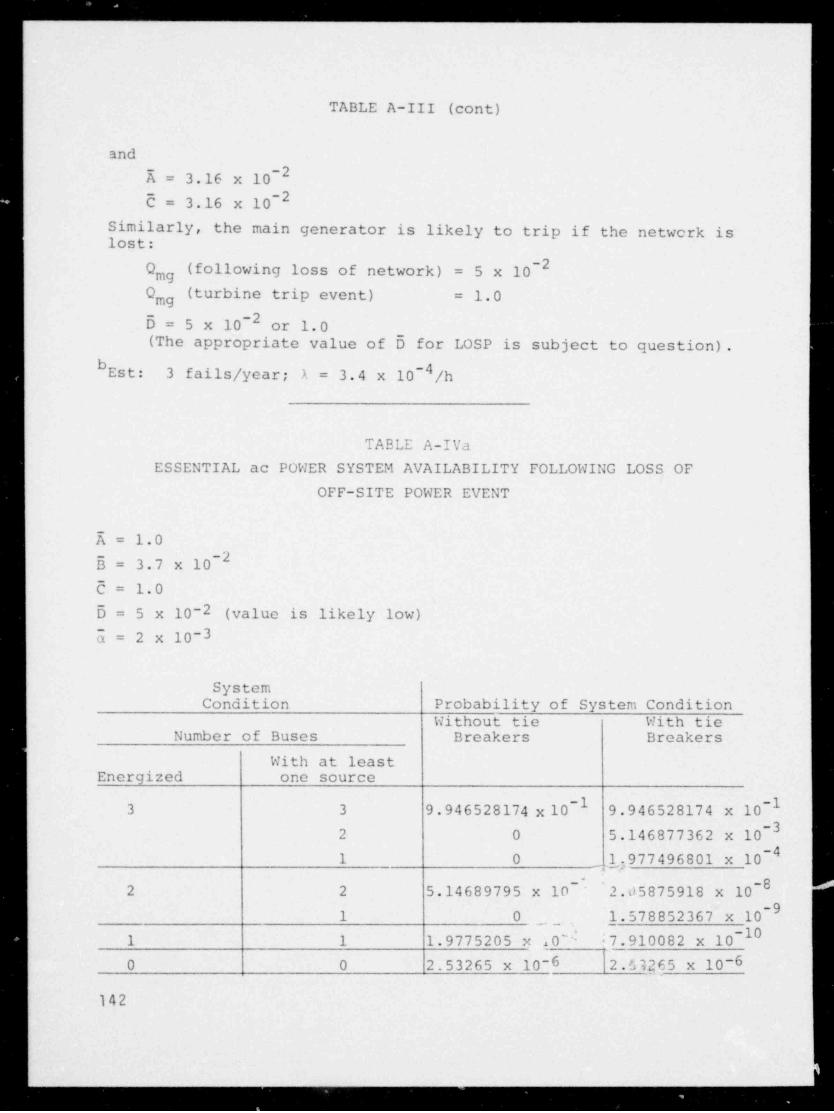
. . . . . _ .
TABLE A-III (cont)
and
E = 3.16 x 10--25 = 3.16 x 10
Similarly, the main generator is likely to trip if the network islost:
-2O (f 11 wing 1 ss of network) 5 x 10=mgO (turbine trip event) 1.0=mg
5 = 5 x 10⁻² or 1.0(The appropriate value of 5 for LOSP is subject to question).
b -4Est: 3 fails / year; A 3.4 x 10 /h=
TABLE A-IVa
ESSENTIAL ac POWER SYSTEM AVAILABILITY FOLLOWING LOSS OF
OFF-SITE POWER EVENT
E = 1.0-25 = 3.7 x 10
5 = 1.05 = 5 x 10⁻² (value is likely low)
5 = 2 x 10⁻³
SystemCondition Probability of System Condition
Without tie With tieNumber of Buses Breakers Breakers
With at leastEnergized one source
-1 -13 3 9. 94 6 528174 x 10 9.946528174 x 10
-32 0 5.146877362 x 10
-41 0 1;977496801 x 10
~02 2 5.14689795 x 10- 2.d5875918 x 10-9
1 0 'l.578852367 x 10-10
1 1 1.9775205 x 0' ;7.910082 x 10
0 0 2.53265 x 10⁻⁶ 2.63R65 x 10-6
142
. . .

. . _ _ . - . ._
TABLE A-IVb
ESSENTIAL ac POWER SYSTEM AVAILABILITY FOLLOWING LOSS OFO'F-SITE POWER EVENT
E = 1.0E = 3.7 x 10-25 = 1.05 = 5 x 10⁻¹ (value may be low)U = 2 x 10-
System Probability of System ConditionCondition (System with tie breakers)
Number of Buses
With at leastEnergized one source
3 3 9.465281835 x 10⁻¹² 5.146877362 x 10⁻²¹ 1.977496801 x 10⁻³
2 2 2.05875918 x 10-71 1.578852367 x 10⁻⁸
1 1 7.910082 x 10⁻⁹
0 0 2.53265 x 10⁻⁵
breakers may have a failure probability comparable to that of an
arrangement without ties under some failure conditions.
We now consider the loss of one essential, class lE, power bus
either as the initiating event or as a condition existing as a
direct result of an initiating event. This Category IIIA event
may be represented in event space as follows:
1. Both remaining essential buses function if
(EEUB) (K ' E ' 5 ' 5 ' )
is true.
143
-
_ _ . . . . .
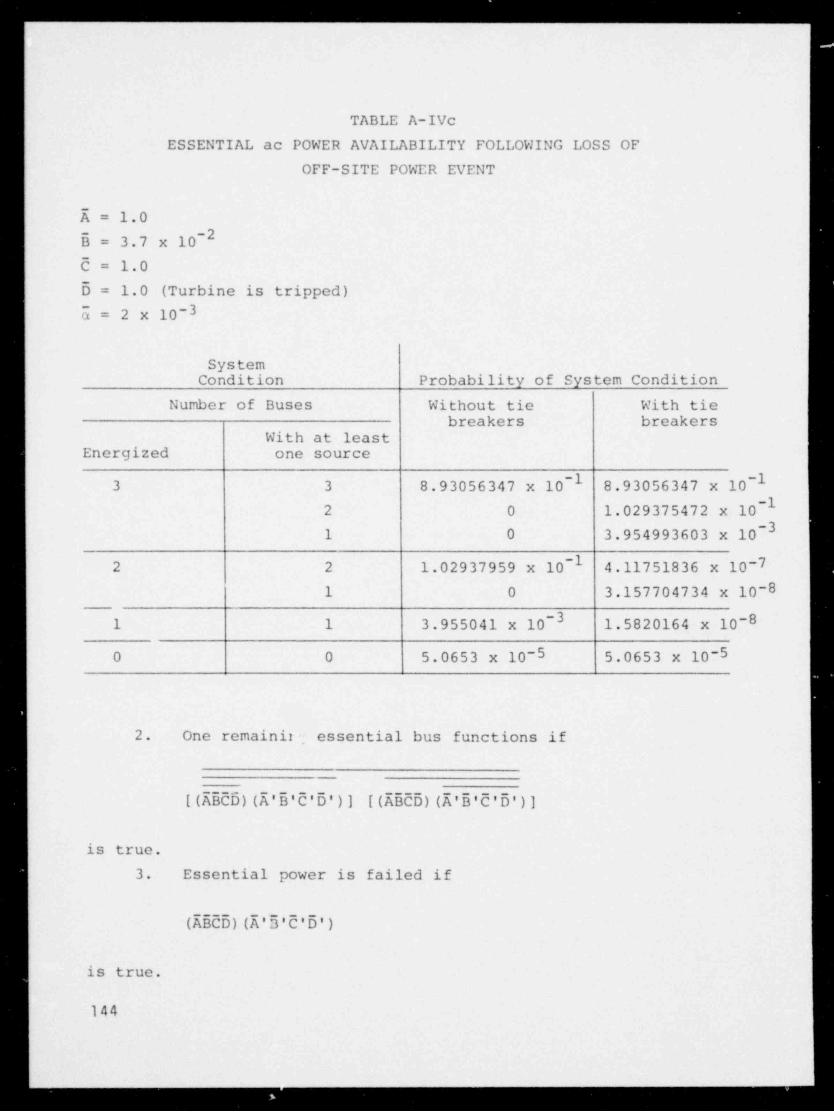
. . . _ _ . _ _ _ _ _ _ _ _ _
TABLE A-ivc
ESSENTIAL ac POWER AVAILABILITY FOLLOWING LOSS OF
OFF-SITE POWER EVENT
E = 1.0-2E = 3.7 x 10
5 = 1.06 = 1.0 (Turbine is tripped)
E = 2 x 10⁻³
SystemCondition Probability of System Condition
Number of Buses Without tic With tiebreakers breakers
With at leastEnergized one source
~1 -13 3 8.93056347 x 10 8.93056347 x 10
-12 0 1.029375472 x 10
-31 0 3.954993603 x 10
-12 2 1.02937959 x 10 4.11751836 x 10-71 0 3.157704734 x 10⁻⁸
-31 1 3.955041 x 10 1.5820164 x 10⁻⁸
0 0 5.0653 x 10⁻⁵ 5.0653 x 10⁻⁵
2. One remainii, essential bus functions if
__
[ (E556) (E ' E ' d ' 6 ' ) ] [ (E556) (E' 5 'd ' 6 ' ) ]
is true.
3. Essential power is failed if
(E556) (E ' 3 ' d ' 6 ' )
is true.
144
.. . - . . . _ _ . . . . _ _ _ _ _ - --

_...-__ _ -__.
Table A-IVd shows the probabilities of the possible states
of the essential power system following the loss of one essential
ac power bus. These values are used in the event sequence in Fig.
12.
C. Availability of Essential ac Power for Times up to 300 h
Following Init ting Events
The availability of essential ac power following the initiating
event is investigated for several assumed conditions of the non-
essential power system and considering that the system may or may
not be repaired following the initiating event. The availability
of essential ac power depends, in part, on the availability of off-
site power.
If off-site power is lost at the time of the initiating event,
restoration of one line constitutes restoration of off-site power
and the availability of of fsite power may be represented in event
space by
TABLE A-IVd
ESSENTIAL ac POWER SYSTEM AVAILABILITY FOLLOWING LOSS OF
ONE ESSENTIAL ac POWER BUS
-3E= 10
-2B= 3.7 x 10
-3C= 10
BusesEnergized 6 Probability of System Condition
~42 1 x 10 9.999999926 x 10⁻¹¹ 7.398 x 10-90 1.369 x 10⁻¹⁷
-12 1.0 9.999260014 x 10
1 7.3995892 x 10-50 1.369 x 10⁻⁹
145
--
_ _ . _ .

. . . . . . _ _ _ _ _ _
__
AU + EC + AC = (EU)
being true. The probability that off-site power is restored at
time t
1- [c-t/T)2=
where T = repair time for one line
1.0 h.=
The probability that a diesel generator is restored at time t
~! DG_ y_
where T = repair time for one diesel generatorDG
21 h.=
It is more probable that the off-site power would be restored be-
fore a diesel generator would be restored; therefore, we will first
investigate the restoration of off-site power, taking into account
the following factors.
1. Without off-site power, secondary feedwater is de-pleted in 15 min.; therefore, off-site power mustbe restored in 15 min. to continue cooldown on themain loops.
2. If the diesels fail to start, feedwater is depletedin 12 min. since the deaerator is serving as thebackup main circulator bearing water supply.
3. The CACS requires 5 min. to startup and begin coolingthe core (it is believed that cooling on the main loopsmust be terminated before the CACS is started; therefore,if main loop cooling stops at 15 min., the CACS startsto cool at 20 min. If main loop cooling stops at 12min., the CACS starts to cool at 17 min.).
4. Cooldown on the main loops in the flash tank node for15 min. reduces the core and primary coolant temperatures
146

.. . . . _
--
and increases the time when the CACS must start to(1) apprxoimately 75 min, from trip in order to avoiddamage to the top plenum thermal barrier (pressurizedprimary) and (2) approximately 2 h in order to preventexceeding the safety limit temperature at the topplenum thermal barrier.
5. Immediate, total loss of main loop cooling at poweroperation requires CACS activation within 20 min, ofthe event to prevent component damage.
The loss of off-site power is considered to be an externalinitiating event not causally related to any other event or condi-tion which would also impair or degrade the cooling system per-formance. We assume that main loop cooling in the flash tank modemay be available, except for possible independent random failures,at the at the time off-site power is lost. The following potential
sequences and system conditions are established for the analyses:
1. Main loop cooling is available in the flash tankmode (random failure probability)a. Diesels start (random failure probability)
i. Cool on main loops in flash tank mode for15 min. (random failure probability),
ii. Start any number of CACS loops at 70 min.from trip (start to cool at 75 min.,random probability), or
iii. Start all CACS loops at approximately 2 h(random probability),
b. Diesels fail to starti. Cool on main loops in flash tank mode
for 12 min. (random probability),ii. Restore off-site power at 75 min. or 2 h
from trip (and restart cooling by mainloops using auxiliary boiler or establishhot standby condition), or
iii. Repair diesels and start CACS at 70 min.from trip or repair diesels and start allCACS loops at 2 h from trip.
147
_ - -
___

- . . . - . . - . . . . - _ _ . - _ - _ . _ _ . _ . _ . _ - - _ _ _ _ _
2. Main loop cooling is not available in the flash tankmode (random failure probability of all main loops orflash tank mode configuration rather than a CategoryIIB event)
a. Diesels start (random probability)
i. Start 2 or 3 CACS loops at 35 min. fromtrip; must function for approximately 1-1-1/2 h to turn around rising coolanttemperature, or
ii. Start 2 CACS loops at trip; must functionapproximately 30 min. to turn around ris-ing coolant temperature,
b. Diesels fail to start (random probability)
i. Restore off-site power and start 2 or 3 CACSloops at 35 min. from trip; must functionfor approximately 1-1-1/2 h to turn aroundrising coolant temperature, or
ii. Repair 2 or 3 diesels and start 2 or 3 CACSloops at 35 min. from trip; must functionfor approximately 1-1-1/2 h to turn aroundrising coolant temperature.
Table A-V shows the probability of restoring nonessential
power and diesel generators to ope-ational conditions for criticaltimes after failure.
The cooldown period is estimated to be 300 h following trip.
The probability that a system has failed and not been repaired attime ty,
y/T -at-tP(t) =-c (1 - C y)y
a
where
A= failure rate,
T= repair time, and
_ AT-1,
T
The probability that the off-site power has failed and is not
148
.. ....... _......____ _ _. - - -
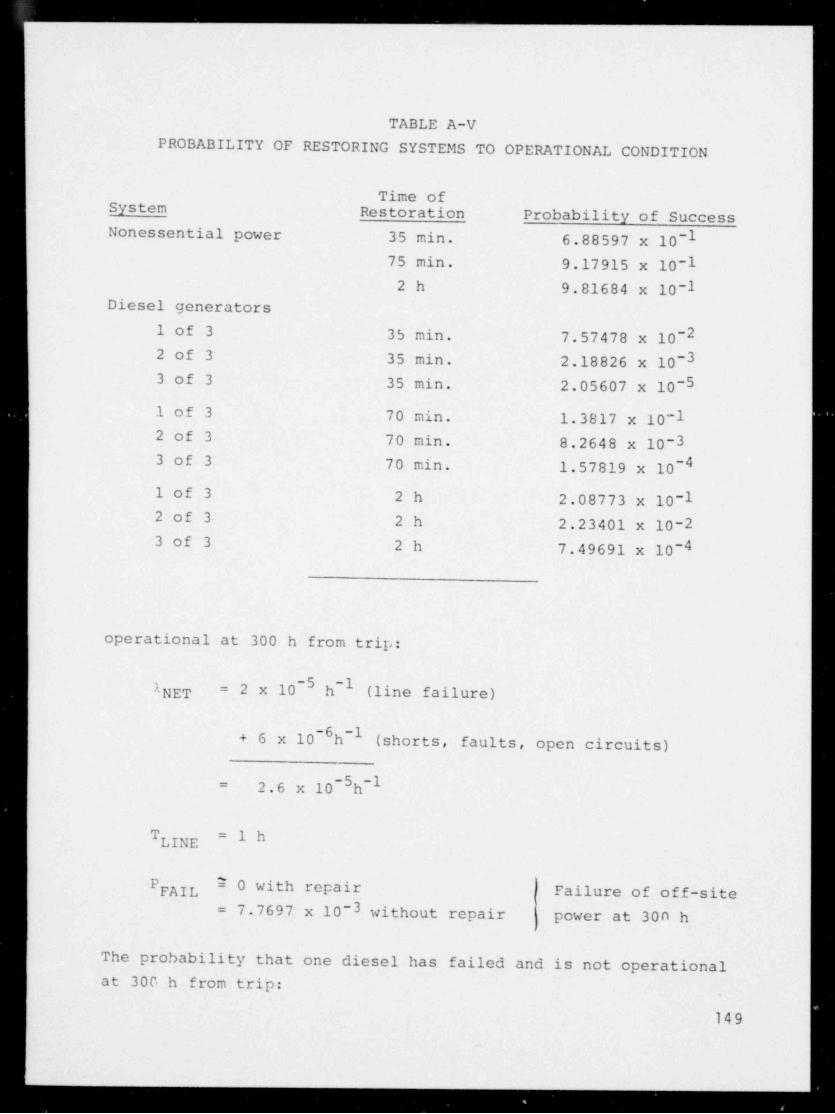
. - _.__
TABLE A-V
PROBABILITY OF RESTORING SYSTEMS TO OPERATIONAL CONDITION
Time ofSystem Restoration Probability of SuccessNonessential power 35 min. 6.88597 x 10⁻¹
75 min. 9.17915 x 10⁻¹²h 9.81684 x 10⁻¹
Diesel generators
1 of 3 35 min. 7.57478 x 10⁻²² of 3 35 min. 2.18826 x 10⁻³³ of 3 35 min. 2.05607 x 10-51 of 3 70 min. 1.3817 x 10⁻¹² of 3 70 min. 8.2648 x 10⁻³³ of 3 70 min. 1.57819 x 10 -4
1 of 3 2h 2.08773 x 10⁻¹² of 3 2h 2.23401 x 10⁻²³ of 3 2h 7.49691 x 10⁻⁴
operational at 300 h from trip:
-5 -1A NET 2 x 10 h (line failure)=
-6 -1+ 6 x 10 h (shorts, faults, open circuits)
-5 -12.6 x 10 h=
T 1h=LINE
P Epg7 0 with repair j Failure of off-site
7.7697 x 10⁻³ without repair j power at 300 h=
The probability that one diesel has failed and is not operationalat 300 h from trip:
149
._
.

-1A = 3 x 10- h (includes open circuits, short circuits,DG double faults)
T *DG
P = 2.7336 x 10~ with repairp
-1= 5.9343 x 10 without repair,
and the maximum probability that one diesel is failed and not re-stored, assuming repair is allowed, is
P = 5.231 x 10- ,
mX
occurring at t = 62 h a mer trip.
Using these values for a single diesel unit, the functionalprobabilities of the diesel generat.or system in Table A-VI are
de t< s cmined .
probability of the essential power system functioning isThe
de+ ermined for various conditions on nonessential power using thepreviously derived probabilities.
TABLE A-VI
PROBABILITIES OF DIESEL GENERATORS FUNCTIONING AFTER TRIP
Probabilities of Operational Status300 h 300 h
No. of Units 62 h w/ repair w/ repair w/o repair
-1 -1 -23 8.511 x 10 9.202 x 10 6.721 x 10
-1 7.759 x 10⁻² 2.943 x 10⁻¹² 1.409 x 10
1 7.781 x 10⁻³ 2.180 x 10⁻³ 4.295 x 10⁻¹
0 1.432 x 10⁻⁴ 2.043 x 10⁻⁵ 2.090 x 10⁻¹-1 9.727 x 10⁻¹ 4.066 x 10⁻¹
Single unit 9.477 x 10
150
. . . . . . - - , . . - -
- - -
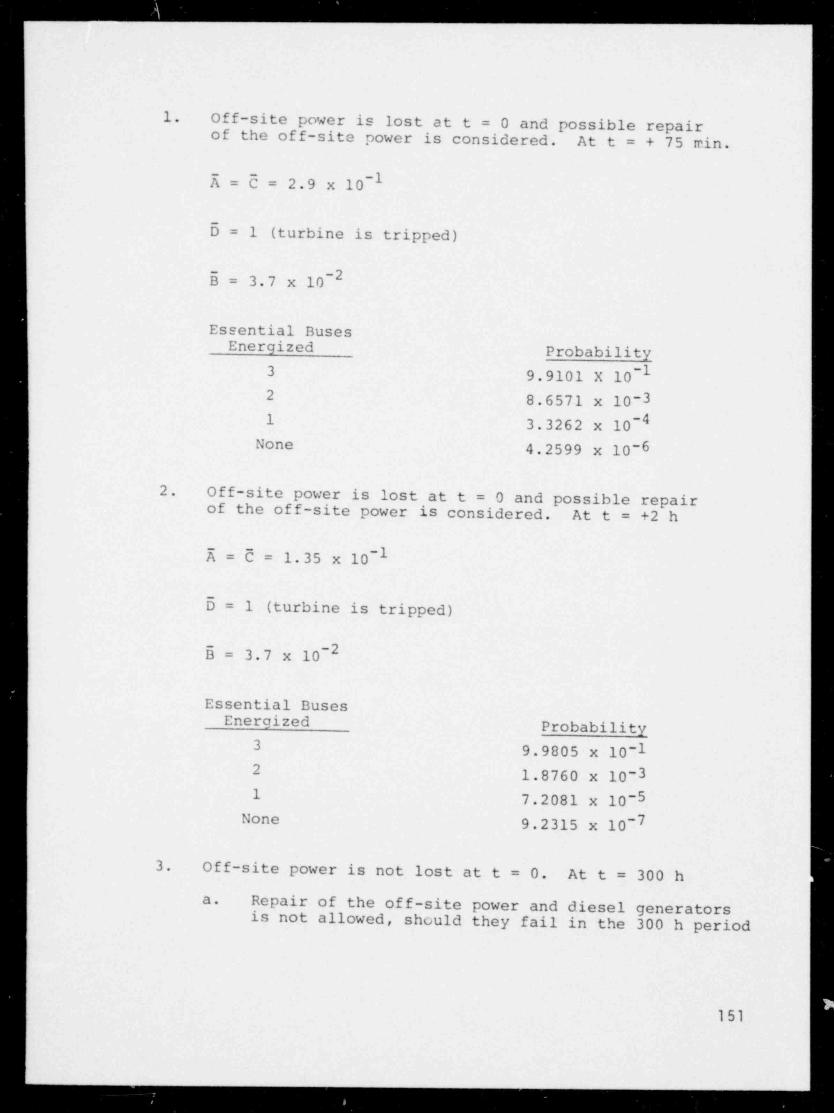
. . . . . . _ _ __
l. Off-site power is lost at t = 0 and possible repairof the off-site power is considered. At t = + 75 min.
E = U = 2.9 x 10⁻¹
6=1 (turbine is tripped)
E = 3.7 x 10⁻²
Essential BusesEnergized Probability
-13 9.9101 X 10² 8.6571 x 10⁻³
-41 3.3262 x 10None 4.2599 x 10⁻⁶
2. Off-site power is lost at t = 0 and possible repairof the off-site power is considered. At t = +2 h
E = U = 1.35 x 10⁻¹
0=1 (turbine is tripped)
5 = 3.7 x 10⁻²
Essential BusesEnergized Probability
3 9.9805 x 10⁻¹² 1.8760 x 10⁻³¹ 7.2081 x 10⁻⁵
None 9.2315 x 10⁻⁷
3. Off-site power is not lost at t = 0. At t = 300 h
Repair of the off-site power and diesel generatorsa.
is not allowed, should they fail in the 300 h period
151
_ _ . .

-2X = 5 = 7.773 x 106=15 = 5.93 x 10⁻¹
Essential BusesEnergized Probability
3 9.944 x 10⁻¹² 1.7622 x 10⁻³¹ 2.5676 x 10⁻³
None 2.247 x 10⁻³
b. Repair of the off-site power is not allowed and re-pair of the diesel generator is allowed, shouldeither of these sybsystems fail during the 300 hperiod
-2A = 5 = 7.73 x 10
6=1
5 = 2.73 x 10~
Essential BussesEnergized Probability
3 9.9952 x 10⁻¹² 4.6339 x 10-41 1.3005 x 10⁻⁵
None 1.2167 x 10⁻⁷
c. Repair of off-site power and of the diesel generatorsis allowed, should either of these subsystems fai]during the 300 h period
-4K = C = 2.47 x 10
6=1
s = 2.73 x 10⁻²
152

- . . - - - - - - - - -._
Essential BusesEnergized probability
3 9.99999995 x 10⁻¹² 4.7275 x 10-91 1.3268 x 10⁻¹⁰
None 1.241 x 10⁻¹²
4. Off-site power is failed at t = 0 and is not restored
a. At time t = 0
E=d=1I
5=1
E = 3.7 x 10⁻¹
Essential BusesEnergized probability
3 8.9306 x 10⁻¹² 1.0294 x 10⁻¹¹ 3.9550 x 10⁻³
None 5.0653 x 10⁻⁵
b. At time t = +75 min., considering diesel repair,should failure have occurred since t = 0,
E=C= 1
5=1
E = 3.63 x 10⁻³
Essential BusesEnergized probability
3 9.8915 x 10⁻¹² 1.0811 x 10⁻²¹ 3.9387 x 10⁻⁵
None 4.7832 x 10-8153
. _ _ _
__
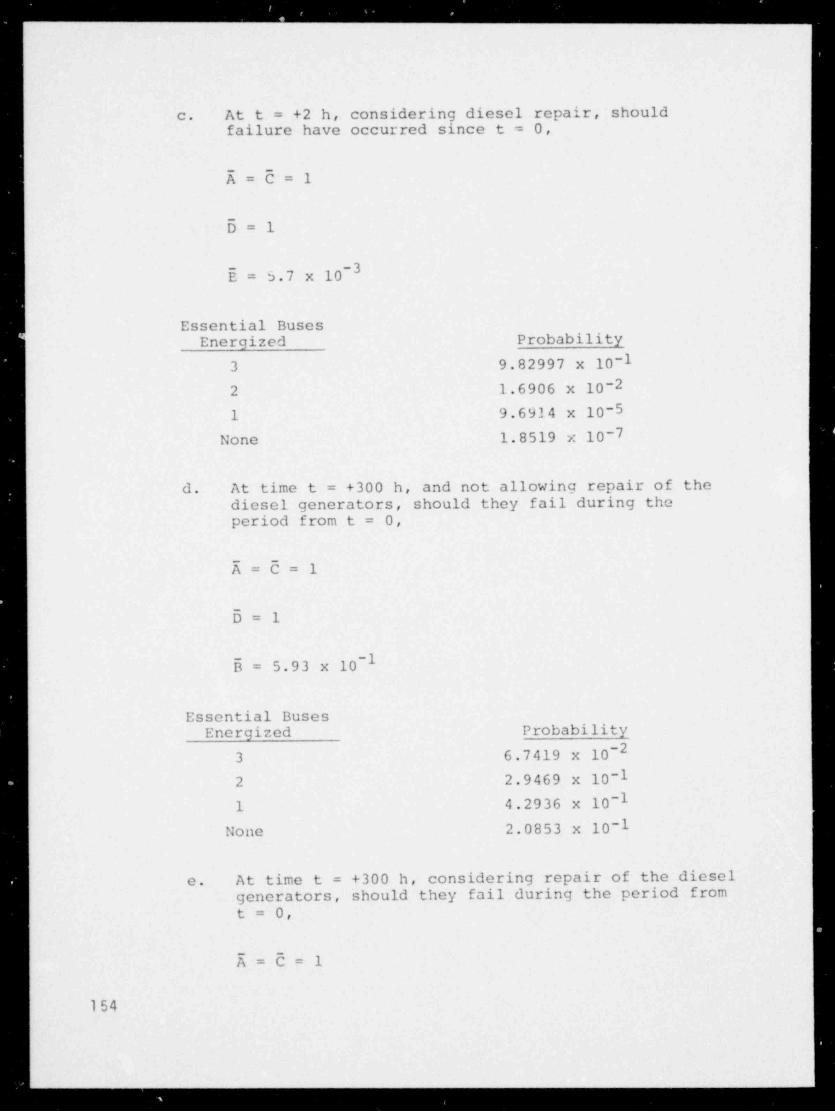
, - - - . . . . . . . - - . . - - -_
c. At t = +2 h, considering diesel repair, shouldfailure have occurred since t = 0,
E=E=1
6=1
-3E = 5.7 x 10
Essential BusesEnergized Probability
3 9.82997 x 10⁻¹² 1.6906 x 10⁻²¹ 9.6934 x 10⁻⁵
None 1.8519 x 10⁻⁷
d. At time t = +300 h, and not allowing repair of thediesel generators, should they fail during theperiod from t = 0,
E=C= 1
D= 1
~1E = 5.93 x 10
Essential BusesEnergized Probability
6.7419 x 10⁻²³
2 2.9469 x 10⁻¹¹ 4.2936 x 10⁻¹
2.0853 x 10⁻¹None
c. At time t = +300 h, considering repair of the dieselgenerators, should they fail during the period fromt= 0,
E=E=1
154

.- . . . - - - -
5=1E = 2.73 x 10⁻²
Essential BusesEnergized Probability
3 9.20316 x 10⁻¹-22 7.7489 x 10
1 2.178 x 10⁻³None 2.0346 x 10⁻⁵
These data were used to construct the event sequences in Figs. 17
and 18. This compilation is also useful in analyzing postulated
initiating events such as loss of off-site power or loss of diesel
generators without repair.
VII. ANALYSIS OF THE CORE AUXILIARY COOLING SYSTEM
The HTGR core auxiliary cooling system (CACS) is shown in
Fig. A-9. Availability and failure rate data for the CACS system
components were taken from Ref. 3. These data are presented in
Table VII.
The probability that one CACS leg fails to start and function,
~4O = 6 x 10
and the failure rate for oae CACS leg during operation,
-4A= 1.07 x 10 .
The probability that two or more main helium shutoff valves
fail to close,
-6O = 1.2 x 10
and that three or more fail to close,
155
-- -
._.

. . . -
_.
$ CONDENSATEcn MAKEUP
PCV PCV LEGEND:
h hASE- 01 A, B, C = CORE AUXILIARY HEAT EXCHANGERE- 02A, B.C. = AUXILIARY LOOP COOLERSm
WASTE SYSTEM 9 F- 01 A, B,C. = F I LT E R S
[ HELIUMF K P 01 A, B,C. = Cf RCU LATING PUMPSGAS m f PA HELIUM P- 02A, B,C. = AUXILIARY COOLING PUMPSSYSTEM +" CYLINDER CYLINDER1r P 03A, B,C. = MAKEUP PUMPSi
CTdA
T-02 T- 01 A, B,C. = PR ESSURIZERSLC T- 02 - WATER STORAGE TANKLC
'LJ~
( ,,,) (NOTE 3) PPS RADIOACTIV E
] p LIQUID WASTEr'' b '' / SYSTEM FROM'
~ ~
0, J k /
T- ~ ~'
CHEMICA-
INJECTION E-02AA -01A
'PF (NOTE 2)
LOOPS2 AND 3'
'' '
_ _ ..__ _ _ - _ _ _ _ _ _T"- - ~ ~ ~^ ,I
[ h h PLANT COOLING1 -
HS ' AUXILIARY WATER SYSTEM' I CIRCULATOR
~
T 018 --- g-- g! -p,l' 9PFFD CONTROI> N %, , ;r-
fw bu'
(NOTE 1) -;n: PCRV PENETRATIONP 038 ''
HS FS (TYPICAL) (PRIMARY CLOSURE)-
P-01 AT-01 C g_
~
4 START /STOP 1P d'37
P-03 C ts P-01 Ag .
N P-02A
P-02A +NOTES:
E 01 A1. SECONDARY CONTAINMENT VESSEL2. MAY BE AIR OR WATER COOLED3. CONTROL AIR FAN PITCH OR
THROTTLE SERVICE WATER
h g . A- 9 . Core auxiliary cooling system.
:
"
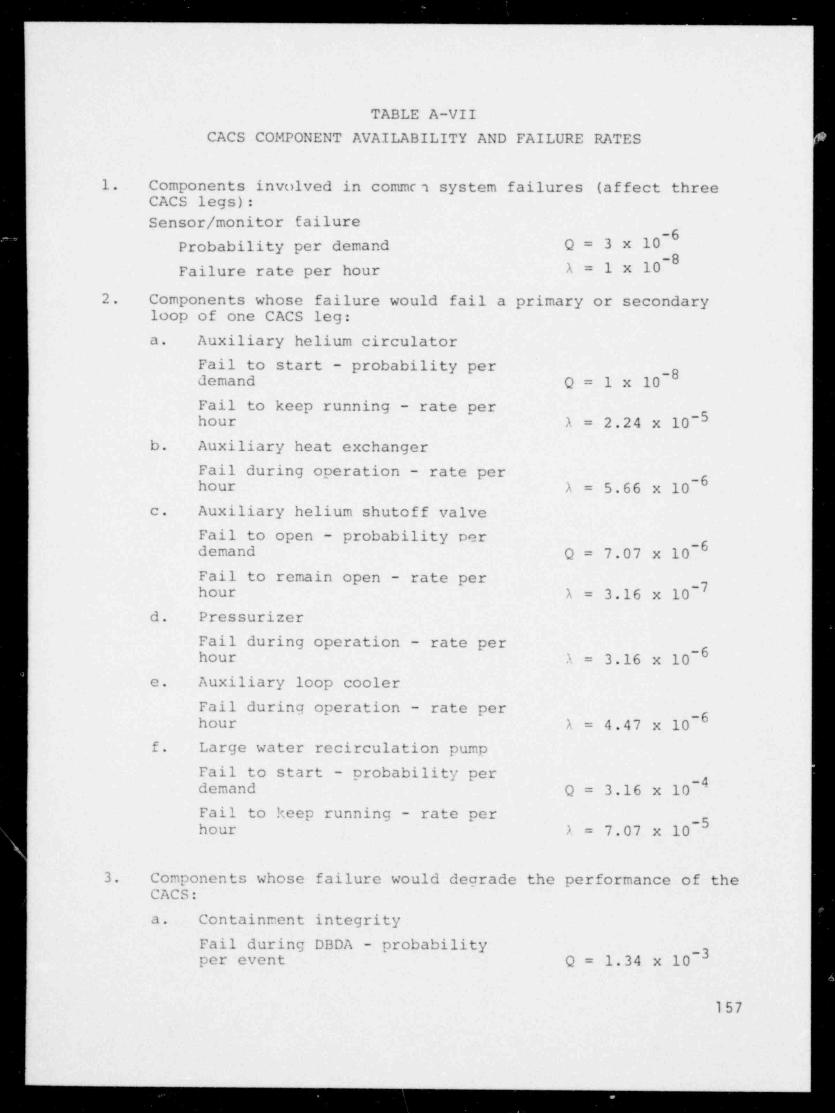
.. . . . . . . . _ _ _
TABLE A-VII
CACS COMPONENT AVAILABILITY AND FAILURE RATES
1. Components involved in commc7 system failures (affect threeCACS legs):
Sensor / monitor failure-6
Probability per demand Q = 3 x 10⁻⁸
Failure rate per hour A = 1 x 10
2. Components whose failure would fail a primary or secondaryloop of one CACS leg:
a. Auxiliary helium circulator
Fail to start - probability per-8demand Q = 1 x 10
Fail to keep running - rate perhour A = 2.24 x 10⁻⁵
b. Auxiliary heat exchanger
Fail during operation - rate per-6hour A= 5.66 x 10
c. Auxiliary helium shutoff valve
Fail to open probability per-6demand Q = 7.07 x 10
Fail to remain open - rate per_7hour A = 3.16 x 10
d. Pressurizer
Fail during operation - rate per-6hour A= 3.16 x 10
c. Auxiliary loop cooler
Fail during operation - rate per-6hour A = 4.47 x 10
f. Large water recirculation pump
Fail to start - probability per_4demand Q = 3.16 x 10
Fail to keep running - rate per-5hour A 7.07 x 10=
3. Components whose failure would degrade the performance of theCACS:
a. Containment integrity
Fail during DBDA - probability-3per event Q = 1.34 x 10
157
__

. . . . . . . . . . _ . _ . . _ . . . _ _
TABLE A-VII (cont)
b. Main helium shutoff valve
Fail to close - probability per _4demand Q = 2.83 x 10
Fail to remain closed - rate per-6hour A = 3.16 x 10
(In the event of a or b above, it is believed that all legs of theCACS must be activated. Failure of more than two main helium shut-off valves would fail the function of the CACS.)
-10Q = 4.53 x 10 ,
All three legs of the CACS are required to start and run under
conditions of the design basis depressurization accident (DBDA)
accompanied by the loss of main loop cooling (LOMLC) and contain-
ment integrity failure or condJtions of DBDA and LOMLC accompanied
by the failure of two main helium shutoff valves to close. Under
these conditions, CACS failure is represented in event space by
6(EBD + AED + AB6) + C(EED + A56 + EB6) + E56 + C
being true where
E = CACS leg A failed, etc.,
C = common system failure (in this case, sensor failure orthe failure of three or more main helium shutoff valves).
The probability of inadequate cooling under the above conditions-3is 1.8 x 10 This does not include possible dependencies on the.
availability of ac power.
The following probabilities associated with the CACS perform-
ance are derived from the data in Table A-VII.
158
. . . . . . . . . _ . - . _ _- - - .

CACS Legs Functionalon Demand Probability
3 9.982 x 10⁻¹² 1.7978 x 10⁻³¹ 1.0793 x 10⁻⁶
None 3.0002 x 10⁻⁶
With the reactor pressurized, it is believed that two CACS legs
are required at the start of the shutdown. The probability of in--6adequate cooling would be 4.1 x 10 ,
Considering the availability of CACS cooling with essential
ac power bus failures and with the reactor pressurized:
1. One essential ac power bus is assumed to be failed andas a result of this, one CACS leg is failed. Thefollowing probabilities are obtained:
CACS Legs Starting Probability
2 9.988 x 10⁻¹-3
1 1.199 x 10
None 3.36 x 10⁻⁶
2. Two essential ac power buses are assumed to be failedand as a result of this, two CACS legs are failed. Thefollowing probabilities are obtained:
CACS Legs Starting Probability
1 9.994 x 10⁻¹None 6.03 x 10⁻⁴
It is estimated that the CACS should remain operational for
300 h following trip. The probability that a leg of the CACS will-2
fail by 300 h is 4.6 x 10 ,
From this and the failure of a main helium shutoff valve to
remain closed during this interval, at +300 h, the following
probabilities are obtained:
159

CACS Legs Functional Probability
3 8.6825 x 10⁻¹² 1.2560 x 10⁻¹¹ 6.056 x 10⁻³
Pone 9.7336 x 10⁻⁵
If it is assumed that one CACS leg is failed at time t = 0
(possibly by the loss of an essential ac power bus or other causes),
at t = +300 h,
CACS Legs Functional Probability
2 9.1012 x 10⁻²¹ 8.7768 x 10⁻²
None 2.116 :: 10-3
The preceding considerations included a tacit assumption that
the CACS is operable only from the essential ac power buses as in-
dicated in the preliminary system design concepts. It was of inter-
est to assume a reference system design as indicated in Fig. A-10
which permits operation of the CACS from either the essential or the
nonessential ac power buses. When the essential power bus fails,
it is necessary for two sets of breakers to function in order to
switch the CACS feed from the essential bus to the nonessential
buses.
The following data are used to estimate the successful switch-
over of the CACS power feed:
Circuit breakers -
Fail to operate-probability per-3demand Q = 1 x 10
Premature transfer-rate per-6hour A = 1 x 10
Battery open -- cannot closeor cannot open-probability per
-3demand Q = 1 x 10
Inadvertent open-probability per _4demand Q = 1 x 10
160

.SCAC rof deef rewop ca etanretlA 01-A .giF
-
111 POOL !! POOL IPOOL
SCAC SCAC SCAC
li I
,,,D
E1 "Z" E1 "Y" E1 "X" SESUBE1
SSALC
"S" "R" "S" "R" "S" "R"\f r
lit 11 1 SPOOL llI 11 1 SPOOL
vuAC SCAC
'
.E .N "S" .E N "R" SESUBLAITNESSE
-NON
-2 52?5
1 $/ENIL
ETISFFO
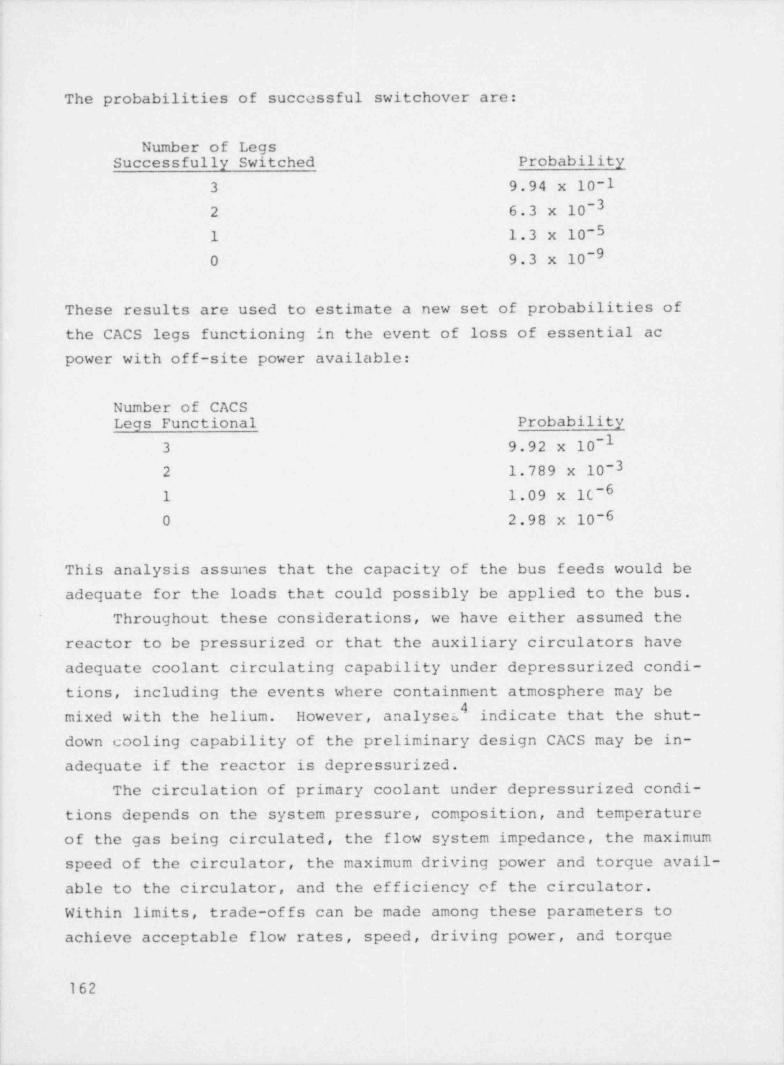
The probabilities of successful switchover are:
Number of LegsSuccessfully Switched Probability
3 9.94 x 10⁻¹² 6.3 x 10⁻³¹ 1.3 x 10-50 9.3 x 10⁻⁹
These results are used to estimate a new set of probabilities of
the CACS legs functioning in the event of loss of essential ac
power with off-site power available:
Number of CACSLegs Functional Probability
3 9.92 x 10⁻¹² 1.789 x 10⁻³¹ 1.09 x 1C-60 2.98 x 10⁻⁶
This analysis assunes that the capacity of the bus feeds would be
adequate for the loads that could possibly be applied to the bus.
Throughout these considerations, we have either assumed the
reactor to be pressurized or that the auxiliary circulators have
adequate coolant circulating capability under depressurized condi-
tions, including the events where containment atmosphere may be4
mixed with the helium. However, analyses indicate that the shut-
down cooling capability of the preliminary design CACS may be in-
adequate if the reactor is depressurized.
The circulation of primary coolant under depressurized condi-
tions depends on the system pressure, composition, and temperature
of the gas being circulated, the flow system impedance, the maximum
speed of the circulator, the maximum driving power and torque avail-
able to the circulator, and the efficiency of the circulator.
Within limits, trade-offs can be made among these parameters to
achieve acceptable flow rates, speed, driving power, and torque
162
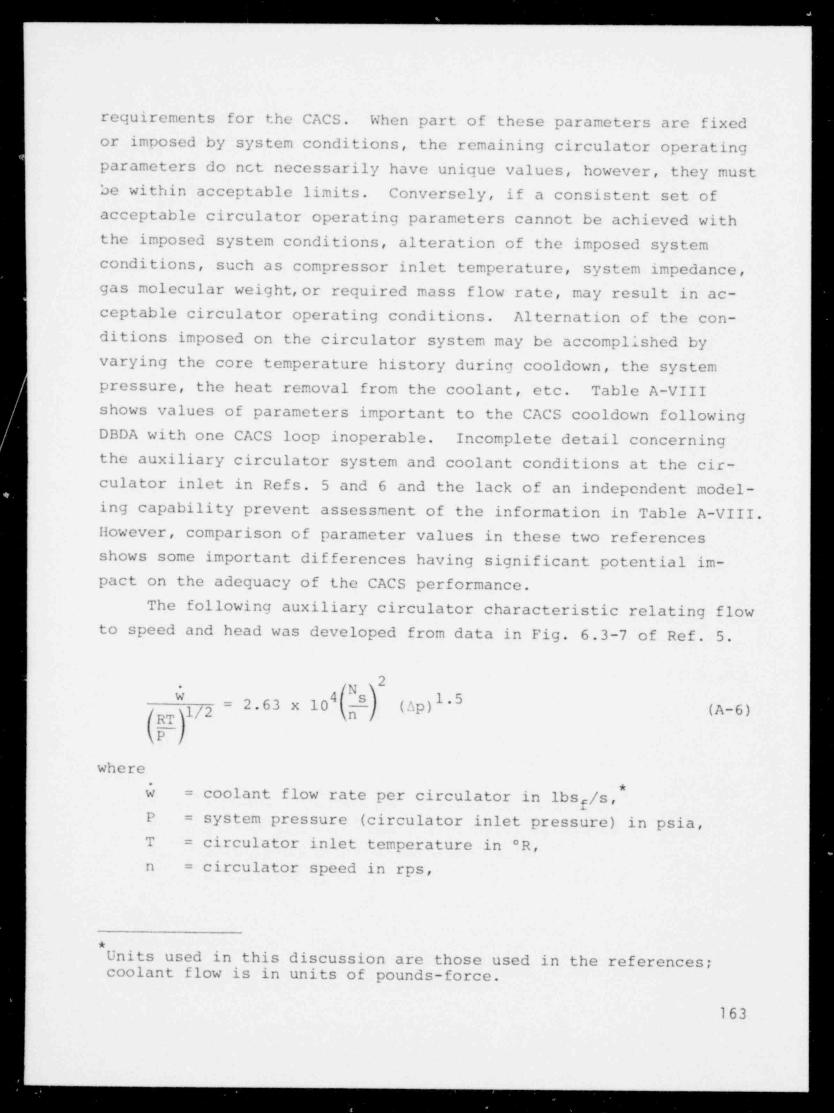
_ . . _ _ _-
requirements for the CACS. When part of these parameters are fixed
or imposed by system conditions, the remaining circulator operatingparameters do nct necessarily have unique values, however, they mustbe within acceptable limits. Conversely, if a consistent set of
acceptable circulator operating parameters cannot be achieved with
the imposed system conditions, alteration of the imposed systemconditions, such as compressor inlet temperature, system impedance,gas molecular weight,or required mass flow rate, may result in ac-ceptable circulator operating conditions. Alternation of the con-
ditions imposed on the circulator system may be accomplished byvarying the core temperature history during cooldown, the systempressure, the heat removal from the coolant, etc. Table A-VIII
shows values of parameters important to the CACS cooldown followingDBDA with one CACS loop inoperable. Incomplete detail concerning
the auxiliary circulator system and coolant conditions at the cir-
culator inlet in Refs. 5 and 6 and the lack of an independent model-ing capability prevent assessment of the information in Table A-VIII.
However, comparison of parameter values in these two references
shows some important differences having significant potential im-pact on the adequacy of the CACS performance.
The following auxiliary circulator characteristic relating flowto speed and head was developed from data in Fig. 6.3-7 of Ref. 5.
N.
.63 x 10 - (3p)l.5s=(A-6)
(R,T;1/2
where. *w = coolant flow rate per circulator in lbs /s,
fP = system pressure (circulator inlet pressure) in psia,T = circulator inlet temperature in R,
= circulator speed in rps,n
*
Units used in this discussion are those used in the references;coolant flow is in units of pounds-force.
163
__
-.

TABLE A-VIII
CACS PARAMETER VALUES FROM DBDA COOLDOWN MODELING
GASSAR LTR-1Cool with Cool with
Inmediate Flash tank Irmediate Flash TankParaneter IDIEC 10-12 min. IH4LC 10-12 min.
CACS Flow Rate (lb/s/ loop)
t = +5/17 min. - 18.3 22.2 18.8
t = max. T 22.5 22 37.5 19.2helt = +6 h - 28.3 42.2 20.1
CAIIE T(tmax. Tfuel) 1480 - 1450 1440
Circultator Inlet Temp.( R)
b(t max. Tg) 760 - 855 850
Syston Ap(psi)
(t= max. Tfuel) 0.75 - - -
Gas Molecular Weight
(R = 176.2) 8.77 - - -
Average Core OutletTanp. ( R)
t = +5/17 min. - 2050 1985 1760
t = max. T 2410 2403 2280 2040helt = +6 h - 2195 1610 1730
Maximum Fuel Tatp, ( R)
t = +5/17 min. - 2280 2430 2160
t = max. T 2910 2920 2800 2400Nelt = +6 h - 2530 2110 1950
System Pressure (psia) 11 11 31 31
164
TABLE A-VIII (cont)
Times of max. T -
fg5gg LTR-1
a. Inmediate LO4If - +2.1 hb. Cool with flash tank 10-12 min. +2.7 h +2.25 h
bReported value appears to be low by about 170 F.
N = circulator specific speed (dimensionless), ands
A = change in head.p
The reactor flow system characteristic for auxiliary cooling oper-
ation was also developed from data in Fig. 6.3-7 in Ref. 5.
w = 3.12 x 10 v5 (A-7).
The system characteristic is found by combining Eqs. (A-6) and ( A-7 ) :
3 /P I I nw= 1.07 x 10 I I y (A-8)I g/ \s.
A
The circulator input power is determined from
nPin = AP (A-9)
where
n = circulator efficiency,
P = input power in ft-lbs /sg f
and the driving torque is
165

_ 5250 (hp)p _ (A-10)60 n
where
f torque in ft-lbs and= g
hp = horsepower.
Development of the circulator and system flow characteristics in
terms of the circulator specific speed and coolant density in
graphical and equation form (A-8 to A-10) enables some evaluation
of the published parameter values and also shows the functional de-
pendence among the parameters. These equations were used to assess
the potential ability of the auxiliary circulator to provide the
coolant flow rates used in the cooldown analysis results presented
in Table A-VIII.
In Table A-VIII the unaccounted ?perature loss between the
core outlet and the circulator inlet v lies between 5 and 250 F
in an inconsistent manner among the cases presented. Some loss is
expected, however the magnitude cannot be verified. The circulator
inlet temperature (760 R) at the time of maximum fuel temperature
reported in Ref. 5 is believed to be low. A low value of this
temperature leads to a prediction of higher maximum CACS coolant
flow capability than may be possible. However, the expected CACS
flow capability appears to be marginal even at this low value of
inlet temperature.
Table A-IX compares the expected maximum CACS flow rate cap-
ability with the flow rates used in the cooldown models in Refs. 5
and 6 and shows the horsepower and torque required to deliver the
flow rates used in the cooldown models. Comparison of the expected
maximum flow capability of the CACS with the flow used in the model
of Ref. 5 shows marginal or deficient capability at times of the
order of 2-6 h following depressurization. The horsepower and
torque required to deliver the model flow rates are shown to be
within that available. However, a circulator efficiency of 0.75
was assumed in the calculation. This generic type of circulator
is capable of such efficiency at high specific speeds (N - 0.55)s
166

TABLE A-IX
COMPARISON OF CACS CIRCULATOR PERFORMANCE CAPABILITY
WITH COOLDOWN MODEL PARAMETER VALUES
Circulator Circulator Flow RateHorsepower C o downat CooldownTemperature Cooldown Maximum Model Flow"u
('R) Model Capability Model Flow (ft-lbs)GASSAR
ILOMLC (system pressure -11 psia)
t = ma x . T 760 22.5 21.7 498 737f elFlash tank (system pressure -11 psia)
t = +17 min. 600 18.3 27.4 320 474t = max. T 953 22 17.3 610 903fuelt= +6 h 745 28.3 22.1 614 909
6LTR-1
ILOMLC (system pressure - 31/14.7psia)
t= +5 min. 825 22.2 56.3/26.7 189/399 279/591t = max. T 855 37.5 54.3/25.7 330/699 489/1035fuelt = +6 h 825 42.2 56.3/26.7 359/759 531/1123
Flash tank (system pressure -31/14.7 psia)
t= +17 min. 840 18.8 55.3/26.2 163/344 241/510t = max. T 850 19.2 54.6/25.9 168/356 249/527fuelt = +6 h 810 20.1 57.3/27.2 168/355 249/525
Compressor efficiency assumed to be t 75.
a
ON

but the efficiency decreases with decreasing specific speed. Since
the auxiliary circulator is estimated to operate at a specific
speed of 0.24 (near stall) using the information in Refs. 5 and 6,
this generic consideration provides reason to believe that the ef-
ficienc'f of the FTGR CACS circulator may be of the order of one-
half the assumed value. Under these conditions, the model flow
rates could not be attained because of limitations in available
driving power and torque. Increasing the system pressure to the
order of 22 psia (140 kPa) would provide adequate maximum flow rate
capabilities and would result in horsepower and torque requirements,
at the reduced circulator efficiency, that are within those speci-
fied in the conceptual design. These comparisons assume that the
coolant gas is approximately 80 volt helium to conform with the
cooldown modeling. If the air ingress is greater than that repre-
sented by this fraction of helium, the circulator flow requirements
would be different from the modeling and the required driving power
and torque would increase.
The modeling in Ref. 6 for a system pressure of 31 psia (210
kPa) used coolant flow rates that are within the flow capability
of the circulators. In this modeling the system pressure could be
reduced to the order of 22 psia (140 kPa) if the circulator of-
ficiency is of the order of 0.75 as assumed. In the likely event
that the circulator efficiency is less than this value, the system
pressure would have to be approximately 31 psia (210 kPa) as used
in the Ref. 6 modeling. It is assumed that system pressur s above
atmospheric would be maintained by the containment building follow-
ing depressurization of the PCRV.
VIII. STATION BLACKOUT
The availability of ac power is believed to be very important
to plant safety. Because loss of off-site power (LOSP) and turbine
trip can occur with significant frequency and the loss of one of
these sources can cause loss of the other, it is of interest to
examine the possibilities of station blackout (loss of all ac
168

. . ---
power). First, we consider the contribution of the LOSP event tothe probability of station blackout.
Under the conditions that LOSP causes main generator trip withhigh probability or that the technical specifications require tripof the main generator immediately upon LOSP, station blackout couldbe produced by the failure of all three diesel generators to startand carry their loads. The predominant failures are diesel fail-
-2ing to start (P = 3 x 10 per demand) and in-rush trip of the
diesel generator breaker to the essential bus (P = 3.2 x 10 as-2
,
-2independent failure events; P= 10 as dependent failure events).
Considering the diesel generator breaker in-rush trips to be inde-pendent events (actual current in-rush is not necessarily the same
-4to all breakers) results in a nrobability of 2.2 x 10 per event
that station blackout will accompany LOSP. A LOSP frequency of-1 -1 -52 x 10 year results in a possible 4.5 x 10 blackouts per
year initiated by the LOSP event. If the diesel generator breaker
in-rush trips are considered to be dependent events, the expectedfrequency of station blackout initiated by LOSP is about 2 x 10'per year.
In addition, there is the possibility that LOSP and stationblackout can result from unplanned trips of the main generator.The probability of LOSP resulting from main generator trip is 10-per event and the frequency of unplanned main generator trips is7 per year. These values and the previous values for diesel fail-ure to start and diesel breaker in-rush trips give a station black-out probability of 2.2 x 10⁻⁷ per event and a station blackout fit -
-6quency of 1.6 x 10 per year resulting from unplanned main gener-ator trips. If the diesel generator breaker in-rush trips areconsidered to be dependent events, the expected blackout frequencyfrom unplanned trips is 7 x 10- per year.
The expected frequency of station blackout is about 5 x 10-per year, initiated predominantly by LOSP, when diesel generatorbreaker in-rush trips are considered to be independent events.
It is of interest to compare this expected station blackout
frequency for a plant incorporating three diesel generators withthat for a plant having two diesel generators. Using the same
169
_
_ . _ _ _ _ . ..

initiating event frequencies and failure probabilities, a two-
diesel generatot plant has an expected station blackout frequency~4of about 8 x 10 per year (considering in-rush trips of the diesel
-3gener.. tor breakers to be independent) or about 2x 10 per year
(considering in-rubh trips to be dependent events). The addition
of one diesel gei,arator system reduces the expected frequency of
station blackout by a factor of approximately 10 if the diesel
generatar breaker in-rush trips are considered to be independent
events. Ilowe er, if these in-rush-trips are regarded as dependent
events, the two- and three-diesel generator plants have essentially
the same expected frequency of station blackout and the possibility
of in-rush trips dominates the unavailability of ac power.
IX. DATA BASE
lTables A-X through A-XII present the data base utilized in
this study. Except for pumps, the applicable environment for these
tables consists of standard operational nuclear (light-water reac-
tor) power plant conditions. Assessed ranges cover variations that
can occur in these environments.
The tables contain the assessed ranges for the data, the
median value of the range used in this study to develop point esti-
mates of the branch probabilities, and the error factor. The range
represents a 901 probability (or " confidence level") associated
with the random variable approach. The median is a reference value
for the range; there is a 50-50 chance that the data value is
either higher or lower than the median value. The error factor is
the upper limit of the error range divided by the median value.
Units for the data are probability per demand, "q," or failures per
hour, "A".
170

_ .._
TABLE A-X"
SUMMARY OF ASSESSMENTS FOR MECHANICAL HARDWARE
Computational ErrorComponents Failure Mode Assessed Range Median Factor
Pumps
(includesdriver): Failure to start -4 -3 -3on Demand, Q :b 3 x 10 - 3 x 10 /d 1 x 10 /d 3
dFailure te run,
given start, Ao -6 -4 -5(nonnal environments): 3 x 10 - 3 x 10 /h 3 x 10 /h 10
Failure to run,
given start, Ao(extreme, post-accident environ-ments inside con- -4 -2 -3tainment): 1 x 10 - 1 x 10 /h 1 x 10 /h 10
Failure to run,given start, A o(postaccident,after environmental -5 -3 -4recovery): 3 x 10 - 3 x 10 /h 3 x 10 /h 10
ValvesMotorOperated: Failure to r erate,
Qd (include. -4 -3 -3driver):c 3 x 10 - 3 x 10 /d 1 x 10 /d 3
Failure to remain -5 -4 -4open, Qd (plug):d 3 x 10 - 3 x 10 /d 1 x 10 /d 3
A: 1 x 10 - 1 x 10 /h 3 x 10⁻⁷/h 3-7 -6
3 -9 -7 -8Rupture, A : 1 x 10 - 1 x 10 /h 1 x 10 /h 10_, 3N
-
_ _ . . . _ . . .

.
, -,
O TABLE A- X (cont)~
Computational ErrorComponents Failure Mode Assessed Range Median Factor
SolenoidOperated: Failure to opt te, a -3 -3
O :e 3 x 10 - 3 x 10 /d 1 x 10 /d 3d
Failure to remain -5 -4 _4open,Qd(plug): 3 x 10 - 3 x 10 /d 1 x 10 /d 3
-9 -7 -8Rupture, A : 1 x 10 - 1 x 10 /h 1 x 10 /h 10
s
Air-FluidOperated: Failure to operate, -4 -3 -4
Od:b 1 x 10 - 1 x 10 /d 3 x 10 /d 3
Failure to remain -5 -4 -4open,Qd(plug): 3 x 10 - 3 x 10 /d 1 x 10 /d 3
A: 1 x 10 - 1 x 10 /h 3 x 10⁻⁷/h 3-7 -6
-9 -7 -8Rutpure, A : 1 x 10 - 1 x 10 /h 1 x 10 /h 10
s
CheckValves: Failure to open, -5 -4 -4
Q' 3 x 10 - 3 x 10 /d 1 x 10 /d 3dInternal leak, A -7 -6 -7(severe): 1 x 10 - 1 x 10 /h 3 x 10 /h 3
-9 -7 -8Rupture, A : 1 x 10 - 1 x 10 /h 1 x 10 /h 10
s'
VacuumValve: Failure to operate, -5 -4 -5
Q: 1 x 10 - 1 x 10 /d 3 x 10 /d 3d
ManualValve: Failure to remain open' -5 -4 -4
Q (P ug): 3 x 10 - 3 x 10 /d 1 x 10 /d 3ld -9 -7 -8
Rupture, A : 1 x 10 - 1 x 10 /h 1 x 10 /h 10s
..- -

TABLE A-X (cont)
Computational ErrorComponents Failure Mode Assessed Range Median Factor
-6 -5 -5Relief Valves: Failure to open, Q : 3 x 10 - 3 x 10 /d 1 x 10 /d 3d -6 -5 -5Premature open, Ag: 3 x 10 - 3 x 10 /h 1 x 10 /h 3
Test Valves,Flow Meters,Orifices: Failure to remain open, -4 -3 -4Q (plug): 1 x 10 - 1 x 10 /d 3 x 10 /d 3d
-9 -7 -8Rupture, A . 1 x 10 - 1 x 10 /h 1 x 10 /h 10s
PipesPipe r 3"diam persection: Rupture / Plug,
-II -8 -9A'A: 3 x 10 - 3 x 10 /h 1 x 10 /h 30s o
Pipe > 3"diam persection: Rupture / Plug, -12 -9 -10A'A: 3 x 10 - 3 x 10 /h 1 x 10 /h 30s o
Clutchmechanical: Failure to operate, -4 -3 -4Q :e 1 x 10 - 1 x 10 /d 3 x 10 /d 3d
Scram Rods -5 -4 -4(Single): Failure to insert: 3 x 10 - 3 x 10 /d 1 x 10 /d 3
aTable A-X is reproduced from Ref. 1.bDemand probabilities are based on the presence of proper input control signals. For turbine driven pumps
C the effect of failures of valves, sensors, and other auxiliary hardware may result in significantly higheroverall failure rates for turbine driven pump systems."

cDemand probabilities are oaseu un presence of proper input control signals.dPlug probabilities are given in demand probability, and per hour rates, since phenomena are generallytime-dependent, but plugged condition may only be detected upon a demand of the system.
' Demand probabilities are based on presence of proper input control signals.

. . _ _ _ . .
TABLE A-XI "
SUMMARY OF ASSESSMENTS FOR ELECTRICAL EQUIPMENT
Computational ErrorComponents Failure Mode Assessed Range Median Factor
Clutch,
Electrical: Failure to operate, -4 -3 -4Q :b 1 x 10 - 1 x 10 /d 3 x 10 /d 3
dPremature disengage- -7 -5 -6ment, A : 1 x 10 - 1 x 10 /h 1 x 10 /h 10g
Motors,
Q:guretostart,FaiElectric: -4 -3 -41 x 10 - 1 x 10 /d 3 x 10 /d 3dFailure to run, givenstart, A (normalg -6 -5 -5environment): 3 x 10 - 3 x 10 /h 1 x 10 /h 3
Failure to run, givenstart, A (extremeg -4 -2 -3environment): 1 x 10 - 1 x 10 /h 1 x 10 /h 10
Relays: Failure to energize, -5 -4 -4Q :b 3 x 10 - 3 x 10 /d 1 x 10 /d 3
dFailure of N0 contactsto close, given ener- -7 -6 -7gized, A : 1 x 10 - 1 x 10 /h 3 x 10 /h 3o
Failure of NC contactsby Opening, given not -8 -7 -7energized, A : 3 x 10 - 3 x 10 /h 1 x 10 /h 3g
Short across N0/NC -9 -7 -8contact, A : 1 x 10 - 1 x 10 /h 1 x 10 /h 10g
-8 -6 -7Coil open, A : 1 x 10 - 1 x 10 /h 1 x 10 /h 10o_
$ Coil Short to power,
A: 1 x 10⁻⁹ -| x 10-7/h 1 x 10⁻⁸/h 10o
- - - - -
- -.....

_ . .
TABLE A-XI (cont);cn
Computational ErrorComponents Failure Mode Assessed Range Median Factor
CircuitBreakers: Failure to transfer,
Qd:b 3 x 10 - 3 x 10 /d 1 x 10⁻³/d 3-4 -3
-7 -6 -6Premature transfer, Ao: 3 x 10 - 3 x 10 /h 1 x 10 /h 3
Switches-4 -3 -4
Limit: Failure to operate, Q : 1 x 10 - 1 x 10 /d 3 x 10 /d 3d
Torque: Failure to operate, Q : 3 x 10 - 3 x 10 /d 1 x 10⁻⁴/d 3-5 -4d
-5 -4 -4Pressure: Failure to operate, Q : 3 x 10 - 3 x 10 /d 1 x 10 /d 3
d-6 -5 -5
Manual: Failure to transfer, Q : 3 x 10 - 3 x 10 /d 1 x 10 /d 3d
SwitchContacts: Failure of N0 con-
tacts to closegiven switch oper- -8 -6 -7ation, A : 1 x 10 - 1 x 10 /h 1 x 10 /h 10
g
Failure of NC byopening, given noswitch operation, -9 -7 -8A: 3 x 10 - 3 x 10 /h 3 x 10 /h 10
o
Short across N0/NC -9 -7 -8contact, A : 1 x 10 - 1 x 10 /h 1 x 10 /h 10
g
Battery PowerSystems (wetcell): Failure to provide -6 -5 -6
proper output, A : 1 x 10 - 1 x 10 /h 3 x 10 /h 3s
..

. . . .__.
TABLE A-XI (cont)
Computational ErrorComponents Failure Mode Assessed Range Median Factor
Transformers: Open Circuit pri-mary or secondary' -7 -6 -6A: 3 x 10 - 3 x 10 /h I x 10 /h 3g
Short primary to -7 -6 -6secondary, A : 3 x 10 - 3 x 10 /h 1 x 10 /h 3o
Solid StateDevices, Hipower Appli-cations (diodes,transistors,
etc.): Fails to function,-7 -5 -6A: 3 x 10 - 3 x 10 /h 3 x 10 /h 10o-7 -5 -6Fails shorted, A : 1 x 10 - 1 x 10 /h 1 x 10 /h 10o
Solid StateDevices, LowpowerApplications: Fails to function,
-7 -5 -6A. 1 x 10 - 1 x 10 /h 1 x 10 /h 10g-8 -6 -7Fails shorted: 1 x 10 - 1 x 10 /h 1 x 10 /h 10
Diesels(Complete
-2 -I -2plant ): Failure to start, Q : 1 x 10 - 1 x 10 /d 3 x 10 /d 3dFailure to run,
emergency conditions, -4 -2given start, A : 3 x 10 - 3 x 10 /h 3 x 10⁻³/h 10g
C~
- - - ' - -
_ _ _ _ _ . - . _ . . . _ . . . . . . -

_ . . .
TABLE A-XI (cont)-
won
Computational ErrorComponents Failure Mode Assesssed Range Median Factor
Diesels(Engine only): Failure to run,
emergency conditions, -5 -3 3 x 10 /h 10-4given start, Ao: 3 x 10 - 3 x 10 /h
Instrumentation -General (Includestransmitter,amplifier, andoutput device): Failure to operate, -7 -5 1 x 10 /h 10-6
0 - 1 x 10 /ho-Shift in calibra- -6 -4 -5tion, A 3 x 10 - 3 x 10 /h 3 x 10 /h 10
o.-0 -5 -5
Fuses: Failure to open, Q : 3 x 10 - 3 x 10 /d I x 10 /d 3d -7 -6 -6
Premature open, Ao: 3 x 10 - 3 x 10 /h 1 x 10 /h 3
Wires (Typicalcircuits, -6 -5 -6
1 x 10 - 1 x 10 /h 3 x 10 /h 3several joints): Open circuit, Ag:
-8 -6 -7Short to ground, A : 3 x 10 - 3 x 10 /h 3 x 10 /h 10
g-9 -7 -8
Short to power, Ao: 1 x 10 - 1 x 10 /h 1 x 10 /h 10
-8 -6 -71 x 10 - 1 x 10 /h 1 x 10 /h 10Terminal Boards: Open connection, Ag:
Short to adjacent -7 -8circuit, A : 1 x 10 - 1 x 10 A 1xM M M
o
aTable A- XI 's reproduced from Ref.1.
bDemand probabilities are based on pr _ence of proper input control signals.
__ - --

TABLE A-XII"
SUMMARY OF POSTACCIDENT ASSESSMENTS
b Computational ErrorComponent Failure Mode Assessed Range Median Factor
Welds (contain-ment quality): Leak, Ao (post- -10 -9accident, serious): 1 x 10 - 1 x 10⁻⁷/h 3 x 10 /h 30
Elbows, Flanges,Expansion joints
(containmentquality): Leak, Ao (post-
-8 -b -7accident, serious): 1 x 10 - 1 x 10 /h 3 x 10 /h 30
Gaskets (con-tainmentquality): Leak, Ao (post- -7 -4accident, serious): 1 x 10 - 1 x 10 /h 3 x 10⁻⁶/h 30
aTable A-XII is reproduced from Ref. 1.
bFor assessments of containment system rupture probabilities, see the special assessment section of thisappendix (Ref.1, Appendix III).
Ce

. - - . . . . - - - -
REFERENCES
1. " Reactor Safety Study. An Assessment of Accident Risks inU.S. Commercial Nuclear Power Plants," U.S. Nuclear RegulatoryCommission report WASH-1400 (NUREG-75/014 ) (October 197 5) .
2. "IITGR Accident Initiation and Progression Analysis StatusReport," General Atomic Company report GA-A13617 (January1976).
3. K. A. Solomon, " Reliability Techniques Applied to NuclearPower Plant Systems," Ph.D. Dissertation, University of Cali-fornia, Los Angeles, CA (1974).
4. B. W. Washburn to J. E. Foley, personal communications (August3 and 18, 1976).
5. " General Atomic Standard Safety Analysis Report (GASSAR) , "General Atomic Company report GA-A13200 (undated).
6. V. Joksimovic, G. J. Malck, E. J. Oakes, R. W. Schleicher,and L. L. Swanson, "An Analysis of HTGR Core Cooling Capabil-ity," Gulf General Atomic Company report Gulf-GA-A-12504(GA-LTR-1) (March 3 0, 1973).
180

. . . . _ . _-
APPENDIX B
CONTENTS
I. INTRODUCTION - - - ------------------ 183
II. CONTAINMENT RESPONSE TO THE DESIGN BASISDEPRESSURIZATION ACCIDENT (DBDA) IC2-----------
III. CONTAINMENT BUILDING ISOLATION 185-----------
IV. CONTAINMENT BUILDING LEAKAGE - 185------------
V.CONTAINMENT BUILDING ATMOSPHERE COOLING AND CLEANUPSYSTEM - - - - - - - - - 190---- -----------
REFERENCE ----------------------- -- 193
FIGURES
B-1. Reference containment response for rapid PCRVdepressurization. ----- ------------ 184
B-2. Reference containment atmosphere cooling andcleanup system. - --- - ------------ 191
TABLES
B-I. Conditions for Analysis of Containment Responseto Rapid PCRV Depressurization - - - - - - - - - - - - 185
B-II. Lines Penetrating Containment Building - - - - - - - - 186
B-III. Failures Producing Isolation Failure - - - - - - - - - 187
B-IV. Containment Building Leakage Paths with PotentialLeakage Areas Exceeding 50 in 2 Papid (20-30minute) Pressure ncf_;-ion - - - - - - - - - - - - - 188
181
-
. _ _ . .

,3 n
TABLES (cont)
B-V. Containment Building Leakage Patb- .th PotentialLeakage Areas Exceeding 50 in.2 Pressure Not
189Reduced ------------ ----------
B-VI. Containment Atmosphere Cooling and Cleanup192System - - - - - - - - - - - - - - - - - - - - - -
B-VII. Containment Atmosphere Cooling and Cleanup193System Failure Probabilities - - - - - - - - - -
- -
182
. . . . . . _ . _ _ _ _ _ _ . . . _ _ _.-

_ _ _ _ _ _
APPENDIX B
CONTAINMENT SYSTEMS
I. INTRODUCTION
The available containment system design concepts were not suf-ficiently detailed to permit analyses. Reference system designs,believed adequate for their intended function, are assumed through-out this section of the study.
For the reference design, the reactor is enclosed in a str.elshell-lined, concrete containment building having a net free volume
6of 2.4 x 10 cubic feet. Lines penetrating the containment build-
ing have double isolation valves to minimize leakage. These valvesare closed when postaccident operations do not require use of thelines. Penetration nozzles and hatchway frames are welded to thesteel shell.
The containment system reference design includes containmentatmosphere cooler and atmosph'ere cleanup systems. Cooling permits
earlier, effective operation of the cleanup system and reduces thepressure inside the containment building.
II.CONTAINMENT RESPONSE TO THE DESIGN BASIS DEPRESSURIZATIONACCIDENT (DBDA)
The reference containment response for a rapid depressuriza-tion of the prestressed concrete reactor vessel (PCRV) was calcu-lated and a typical result is shown in Fig. B-1. Conditions assumedfor this analysis are shown in Table B-I. In addition, the con-
tainment response analysis assumed that the temperature of the hel-ium in the PCRV remains constant during the period of blowdown,the containment wall temperature remains c6nstant during the periodof interest, and leakag, from the containment building is zero dur-ing the period of interest.
This containment response is used to establish a reasonablerange of containment leakage rates for the analyses when the rangeof possible leakage areas is established.
183
_
-

-. - m 4:Jt.
HZu.iE
<H >Z C:
1" H" a*w j '
-,
OaHMdN
- @ tatotoOWCL0C
>ctr=
0 4
'3
3 L.
_ uJ u2 o
*POto*
- 8,8.mO4
4- 5
ECe4dv
- 8 8" O
OOCO
~ >4
0%0%
(PdW) || |
*o3d , e e y, m N
, ,
d 6 6 o o o o m
| | | | I I $3mu o o .-
h k h O b 4
i i i i i _i<caniAtoiao o o
5g ,' n N -
184
. . . . . - . . . - . . . . _ _ _ _ _ _ -

. - . . . - . - - - - - - - - - --
TABLE B-I
CONDITIONS FOR ANALYSIS OF CONTAINMENT RESPONSE
TO RAPID PCRV DEPRESSURIZATION
1. PCRV
3Volume = 3174 m6Initial Pressure = 4.9 x 10 Pa
Average Temperature = 800 K
Effective Leak Area = 6.5 x 10⁻² 2m
2. CONTAINMENT4 3Net Free Volume 5.4 x 10 m=
5Initial Pressure 1.07 x 10 Pa=
Initial Temperature 322 K=
2Surface Area = 12077 m2h (walls) = 11.3 W/m g
III. CONTAINMENT BUILDING ISOLATION
Table B-II lists the lines that must be isolated to providecontainment isolation following an accident. Table B-III shows the
single, double, and triple failures that must occur to produce-3isolation failure. Using a demand failure probability of 5 x 10
for isolation valves and 3 x 10~ for operator failure to close a
failed valve, the probability of failing to isclate the containment-6building is approximately 1 x 10 per demand.
IV. CONTAINMENT BUILDING LEAKAGE
Possible leakage from the containment building is considered
for two conditions of pressure inside the containment, rapid pres-sure decay (or low pressure condition), and containment pressurenot reduced. Table B-IV lists the possible leakage paths havingpotential leakage areas greater than 50 in.2 and the estimated
185
.
_ _ _ _ _
_ _ _ _ _ _ - . . . . --

. . . . . . . _ . . . . . _ _ _ _
TABLE B-II
LINES PENETRATING CONTAI'.? MENT BUILDING
1. Containment cooler (CC) lines - 6
a. Suction lines (3) (6")
b. Discharge lines (3) (6")
(Isolated when CC operation is complete)
2. Sump pump suction lines - 2 (6")
(If required, isolate when containment draining is complete)
3. Containment purge lines - 2
a. Supply line (1) (36")
b. Exhaust line (1) (36")
4. Other active containment-penetrating lines - 60
(Arbitrary allowance)
5. Main steam lines - 2
(Isolate when cooldown is concluded, if main cooling loopsare used for cooldowa)
6. Feedwater lines - 2
(Isolate when cooldown is concluded, if main loops are usedfor cooldown)
7. Circulator turbine lines - 2
(Isolate when cooldown is concluded, if main loops are usedfor cooldown)
8. Reheat steam lines - 2
(Isolate when cooldown is concluded, if main loops are usedfor cooldown)
(In the event of reheater failure, primary coolant flow tothe environment is possible through the reheat steam lineand turbine or turbine bypass to the main condenser.)
9. Flash tank lines - 4
186

_ . _ _-
TABLE B-III
FAILURES PRODUCING ISOLATION FAILURE
A. Single Failures
Isolation valves fail to close upon demand
1. Containment cooler lines
2. Sump pump suction lines
3. Containment purge lines
4. Operator fails to close failed valve
B. Double Failures
1. Main steam line isolation failure and steam line breakoutside containment
2. Feedwater line isolation failure and feedwater line breakoutside containment (with leaking steam generator tubesin superheater/ evaporator-economizer section)
C. Trip Failures
Isolation valre failures and
1. Circulator turbine line break outside containment andreheater tube failure
2. Reheat steam line break outside containment and reheatertube failure
3. Flash tank line break outside containment and superheater/evaporator-economizer section tube leaking
4. Other active mechanical penetrations and boundary failures
probabilities of leakage when the containment building atmosphere-4pressure decays rapidly. A probability of 1.43 x 10 is assigned
to containment leakage trhough openings greater than 50 in.2 whenthe containment atmosphere pressure is reduced rapidly; in a timeof the order of 20-30 min. Table B-V lists possible leakage paths
having potential leakage areas greater than 50 in.2 and the esti-mated probabilities of leakage when the containment building at-
-3mosphere pressure is not reduced. A probability of 1.26 x 10
is assigned to containment leakage through openings greater than50 in.2 when the containment atmosphere pressure is not reduccd.
18;
-
. . _ _ _ . . ....

TABLE B-IV
CONTAINMENT BUILDING LEAKAGE PATHS WITH POTENTIAL
LEAKAGE AREAS EXCEEDING 50 in.2
RAPID (20-30 minute) PRESSURE REDUCTION
Possible Leakage Path Through Probability of Lc 1kage
1. Containment cooler pump suction-6lines 3 (2.8 x 10⁻⁶) 8.4 x 10
2. Containment cooler pump discharge-6lines 3 (2.8 x 10⁻⁶) 8.4 x 10
3. Sump pump suction lines-62 (3.6 x 10⁻⁶) 7.2 x 10
4. Containment purge supply line-61(9.3 x 10⁻⁶) 9.3 x 10
5. Containment purge exhaust lin-61(9.3 x 10⁻⁶) 9.3 x 10
6. Structural failure of contain-ment shell e
7. Weld failures; penetrationnozzles to shell (> 125 in.2) -624 (3 x 10⁻⁷) 7.2 x 10
8. Failure of penetration caps(> 4 in. i.d.)
-620 (3 x 10⁻⁷) 6.0 x 10
9. Fifteen-foot equipment hatch:welds - 3 x 10⁻⁷gasket - 7.2 x 10⁻⁵
-5cover plate failure - 7.2 x 10⁻⁶ 7.95 x 10
10. Weld failure; airlock-to--7shell 1(3 x 10⁻⁷) 3.0 x 10
11. Rupture of construction vent-6cover plate 1(7.2 x 10⁻⁶) 7.2 x 10
12. Weld failure; constructionvent nozzle to shell
-71(3 x 10⁻⁷) 3.0 x 10
188

TABLE B-V
CONTAINMENT BUILDING LEAKAGE PATHS WITH POTENTIAL LEAKAGE AREAS
EXCEEDING 50 in.2 PRESSURE NOT REDUCED
Possible Leakage Path Through Probability of Leakage
1. Strucutral failure of contain-ment shell e
2. Weld failures; penetration ,nozzles to shell (> 125 in.2)
-624(3 x 10⁻⁷) 7.2 x 10
3. Penetration cap failures-6(> 4 in. i.d.) 20(3 x 10⁻⁷) 6.0 x 10
-54. Equipment hatch failures 7.95 x 10
5. Weld failures; airlock to con--7tainment shell 3.0 x 10
6. Construction vent failures1 (7. 2 x 10⁻⁶)
-61(3.0 x 10⁻⁷) 7.5 x 10
' Containment cooler water linesisolation check valves (whenCC operation is complete)
-33(3.8 x 10⁻⁴) 1.14 x 10
8. Isolation valves in purge line(inadvertently opened) andhigh radiation interlocks fail
-52 (9. 3 x 10⁻⁶) 1.86 x 10
9. Inner pnye line isolation valve(leaking or failed) and oneouter isolation valve leaking
-102(3.4 x 10⁻¹⁰) 6.8 x 10
The current design concept of the HTGR requires a system
pressure greater than one atmosphere for CACS operation;I there-fore, we assign the following probabilities to the containment
building leakage event sequence branches:
1. for CACS cooldown with the primary depressurized,1.26 x 10-3 and
189

2. for cooldown with the primary pressurized,1.43 x 10-4
V. CONTAINMENT BUILDING ATMOSPHERE COOLING AND CLEANUP SYSTEM
The reference design containment atmosphere cooling and clean-
up system is shown in Fig. B-2. The containment atmosphere cooler
has two functions:
1. it reduces the temperature of the atmosphere enter-ing the cleanup system, thus permitting earlier,effective operation of the cleanup system and
2. it reduces the pressure inside the containmentbuilding more rapidly than the natural heat removalmechanisms acting alone.
Both of these functions are important to safety. The first directly
affects the quantity of radioactivity removed from the containment
atmosphere or the quantity available for leakage and release to
the environment. The second function directly affects the quantity
of radioactivity leaked to the environment. For a fixed leakage
path, reduction of the pressure is the only mechanism that will re-
duce the release of gaseous fission products to the environment.
Noble gases are significant contributors to the latent hazard of
HTGR accidents and it is important in certain accident sequences to
minimize their release to the environment. The necessity, under
some accident conditions, to use the containment building as alpressure vessel to aid the cooling performance of the CACS compro-
mises the contribution to public safety that could be gained from
quickly reducing the postaccident containment atmosphere pressure
unless the containment building integrity is excellent.
The containment atmosphere cleanup system, along with other
removal mechanisms, serves to reduce the quantity of airborne
radioactivity available for release to the environment.
Table B-VI gives the principal design parameters for the con-
tainment atmosphere cooling and cleanup system. The detail of the
cooler has not been investigated. However, the design might consider
190

. . . . . . _ - - . . .
COO L E R
MAKE UP2
WATER rCSTORAGE 353
$5E5E*f0V1' VI
CONT AINM E NT TOATMOSPHE R E LIQUID
^COLLECTOR
PROCESSSYSTEM V2,
n"\/ D VS
\/ [ ys.
V3 V4V3' V4'
\ \
MOTORD1
\ \
MOTORD2
\ \DAMPER DAMPER_
EVAPORATIVE PRE FILTE R HEPA CARBONMOTOR COOLE R FILTER FILTER
(15.000 cfm each)
Fig. B-2. Reference containment atmosphere cooling and cleanupsystem.
191
--
_ _. . . .

. . . _ . _ . _ . . - _ - _ _ _ _ _ _
TABLE B-VI
CONTAINMENT ATh0SPllERE COOLING AND CLEANUP SYSTEM
High-Efficiency Particulate Air Filter (IIEPA)
302*F (150 C)T =max
Delta P = 2 in, water
Efficiency = 99.97% (0.3 pDOP test)
Dimensions per element:
24 in. x 24 in. x 11-1/2 in.
Elements per train = 12
Flow capacity per train = 15620 cfm
Overall dimensions:
12 ft x 12 ft x 11-1/2 in.
Carbon Filter (Adsorber)
Efficiency (77*F, 90% RH) 25*C:
99.95% iodine
85.0% iodine compounds
Dimensions per eleroent:
24 in. x 40 in. x 7-3/4 in.
Elements per train = 20
Flow capacity per train = 15620 cfm
Overall dimensions:
27 ft x 16 ft x 7-3/4 in.
Blowers
30 hp each
15000 cfm each
Blower per train = 1
Profilter
Roughing filter of the renewable roll type
192
. . . . . . . . _ _ _ .
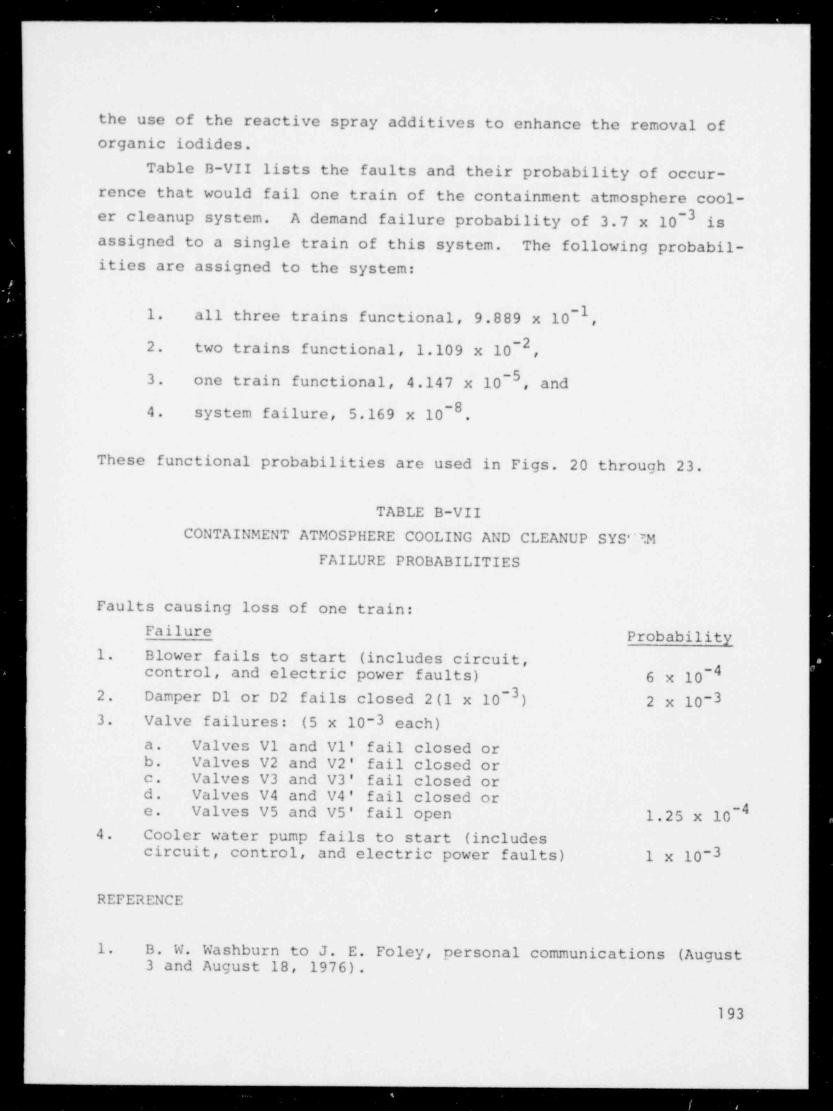
. _ . . . . _ _ _ _ - - - - - .
the use of the reactive spray additives to enhance the removal oforganic iodides.
Table B-VII lists the faults and their probability of occur-rence that would fail one train of the containment atmosphere cool-
-3er cleanup system. A demand failure probability of 3.7 x 10 gg
assigned to a single train of this system. The following probabil-ities are assigned to the system:
-11. all three trains functional, 9.889 x 10,
-22. two trains functional, 1.109 x 10 ,
-53. one train functional, 4.147 x 10 , and
-84. system failure, 5.169 x 10 ,
These functional probabilities are used in Figs. 20 through 23.
TABLE B-VII
CONTAINMENT ATMOSPHERE COOLING AND CLEANUP SYS'''.M
FAILURE PROBABILITIES
Faults causing loss of one train:
Failure Probability1. Blower fails to start (includes circuit,
_4control, and electric power faults) 6 x 10². Damper D1 or D2 fails closed 2 (1 x 10⁻³) 2 x 10-33. Valve failures: (5 x 10⁻³ each)
a. Valves V1 and V1' fail closed orb. Valves V2 and V2' fail closed orc. Valves V3 and V3' fail closed ord. Valves V4 and V4' fail closed or
_4e. Valves V5 and V5' fail open 1.25 x 10⁴. Cooler water pump fails to start (includes
circuit, control, and electric power faults) 1 x 10⁻³
REFERENCE
1. B. W. Washburn to J. E. Foley, personal communications (August3 and August 18, 1976).
193
_
. _ . . .

APPENDIX C
CONTENTS
195I. INTRODUCTION - - -------------------
196II. RELEASE OF FISSION PRODUCTS FROM THE CORE ------
---------- --- -- 196A. Core Release Model
B. Fission Product Release Rates from FuelParticles - - - - - - - - - - - - - - - - - - - - 198
200C. Fuel Particle Coating Failure Models ------
200D. Core Temperature Model ---- --- ------
III. RELEASE OF FISSION PRODUCTS TO THE CONTAINMENT - - - - 203
IV. RELEASE OF FISSION PRODUCTS TO THE ENVIRONMENT - - - 205
205A. Containment Building Model -----------
B. Fission Product Removal and Leakage - - - - - - - 206
208REFERENCES -------------------------
FIGURES
C-1. Fission product release rate vs temperature forintact and failed fuel particles during accident
199conditions. --- -- ----------------
C-2. TRISO fuel particle coating failure diagram. ----- 201
2 01C-3. BISO fuel particle coating failure diagram. -----
202C-4. Fraction of failed TRISO particles vs temperature. --
C-5. Fraction of failed BISO particles vs temport.ture. -- 202
C-6. Fuel particle failure vs temperature for 2.5-year-203old fuel (NRC fuel failure model). -------- --
C-7. General modeling of the fission product release to204the containment building. --------------
194

. . - - _ --
APPENDIX C
FISSION PRODUCT RELEASE
I. INTRODUCTION
Estimates of fission product releases f rom the rea ctor systemand containment building are needed to establish the consequencesand importance of the possible accident sequences. Although the
determination of consequences was not a part of this study, it wasnecessary to estimate a consequence of the delineated sequences inorder to identify initiating events, failures, and plant systemsof significant importance to the health and safety of the public.The consequence selected for establishing the relative importanceof the accident sequences is discussed in Appendix D.
Three sources of radionuclides are considered to possibly con-cribute to the release from the reactor system during accidentsequences:
1. circulating activity,
2. plateout activity, and
3. core inventory.
The specific events in the event sequence determine the source andmagnitude of the releases f rom the reactor system to the containmentbuilding atmosphere. In general, the radionuclide composition of
these releases and the relative contribution of a given radionuclideto the total release will vary for the various initiating events.:
Radionuclides released from the reactor system are available fortransport to the environment. Severel fission product removal
mechanisms inside the containment building compete with the contain-ment building leakage to reduce the release of radionuclides to theenvironment. These removal mechanisms vary in effectiveness forthe various radionuclides in the containment building. This results
in the variation of the relative contribution of a given radio-nuclide to the total release to the environment among the possible
195
_
_ . . . -
_.
event sequences. Also, if the individual radionuclides in a re-
lease are ranked in order of importance, the ranking for the re-
lease from the primary system will differ from that for the release
from the containment buildino for a given initiating event. Thus,
in general, the important radionuclides will vary with the initiat-
ing events and with the specific accident sequences.
The following sections of this appendix will address the re-
lease of radionuclides and the calculation of latent hazard indices.
II. RELEASE OF FISSION PRODUCTS FROM Tile CORE
The following paragraphs introduce the general elements that
are associated with the calculation of the release of fission
products from the core: core release model, fission product release
rates from failed fuel particles, fuel particle coating failure
models, and core temperature model.
A. Core Release Model
A simplified model was used to calculate fission product re-
leases from the core. It was assumed that there is no isotope
production from precursor decay. The model use is limited to the
release of volatile fission products that do not have long-lived
precursors.
The release rate of an isotope from the core at time t may be
expressed as
d~ "yr(t) N (t) (C-1)
where
Ar (t) is the release rate (or release constant) of theisotope from the fuel particles and
N(t) is the quantity of the isotope in the fuel particles.
In general, the release rate, Ar(t), is a function of the time.The integration of Eq. (C-1) is performed over short time intervalsduring which Ar(t) may be considered constant.196
- , . . - . . . . _ - - _ _ _ _ . . . , , ___

. .._ _ _i
The rate of change of the amount of the isotope in the fuelparticles may be expressed as:
dN(t)Ar(t) + A N(t) (C-2)
*~dt
where A is the radioactive decay constant of the isotope.The amount of the isotope in the fuel particles at time t
with A constant:=r
N(t) =N eg (C-3)
where N is the amount of the isotope in the fuel particles atg
time t = 0.
The amount of the isotope released from the fuel particlesthduring the i general time interval may be expressed as:
( )[A h ~l A + AIn t[.
r. r.1 ( j __
R i = N ,7 y . (C-4)1-eg ,
't ..
and the amount of the isotope remaining in the fuel particles atththe end of the i time interval is expressed as
St+ i- \ r.1 /"i i-1 (C-5)
* e
where
N. is the amount of the isotope in the fuel particles atl'1the end of the (i-1)st time interval and at the beginningof the ith time,
A is the average release rate of the isotope during the#ithi time interval, and
at is the width of the ith time interval.i
197
__

Equations (C-4) and (C-5) are used to calculate the release
from the fuel particles in the simplified model. This model can
be used with fuel particle coating failure models and fission
product release rate models, in conjunction with transient fuel
temperature models, to produce results of varying sophistication.These models will be mentioned in later sections of this appendix.
In order to calculate the isotope releases using Eqs. (C-4) and
(C-5), information about the release rates, A is required.r.,1
B. Fission Product Release Rates from Fuel Particles
Fission product fractional release rates from fuel particles
as a function of fuel temperature are shown in Fig. C-l. These
types of fission product release functions are used by GAC in theircalculations.1 Figure C-1 shows that the fractional release rate
of fission products from intact particles is at least two orders
of magnitude smaller than that from failed particles. The frac-
tional release rates for failed particles increase approximately-4 -1 -1
four orders of magnitude from 10 h to 1.0 h as the fuel tem-
perature increases from 1275-2273 K. The temperature range of
fuel particle coating failure is indicated at the top of the fig-
ure. Data on fractional release rates for intact particle coat-
ings have been extended well into this region of possible coating
failures. The bases for the information in Fig. C-1 have not been
reviewed. However, there is concern that the effects of moisture
on the release rates have not been considered. While this would
be of more importance for a moisture ingress accident, the assumed
release rates for the LOFC accident could also be enhanced by the
presence of allowable concentrations of moisture during normal
operation.
In order to apply the release rate information to the calcu-
lation of core releases, the fuel temperatures and information on
the failure of particle coatings with irradiation and temperature
are required. Particle coating failure models are discussed in
Sec. C below.
198
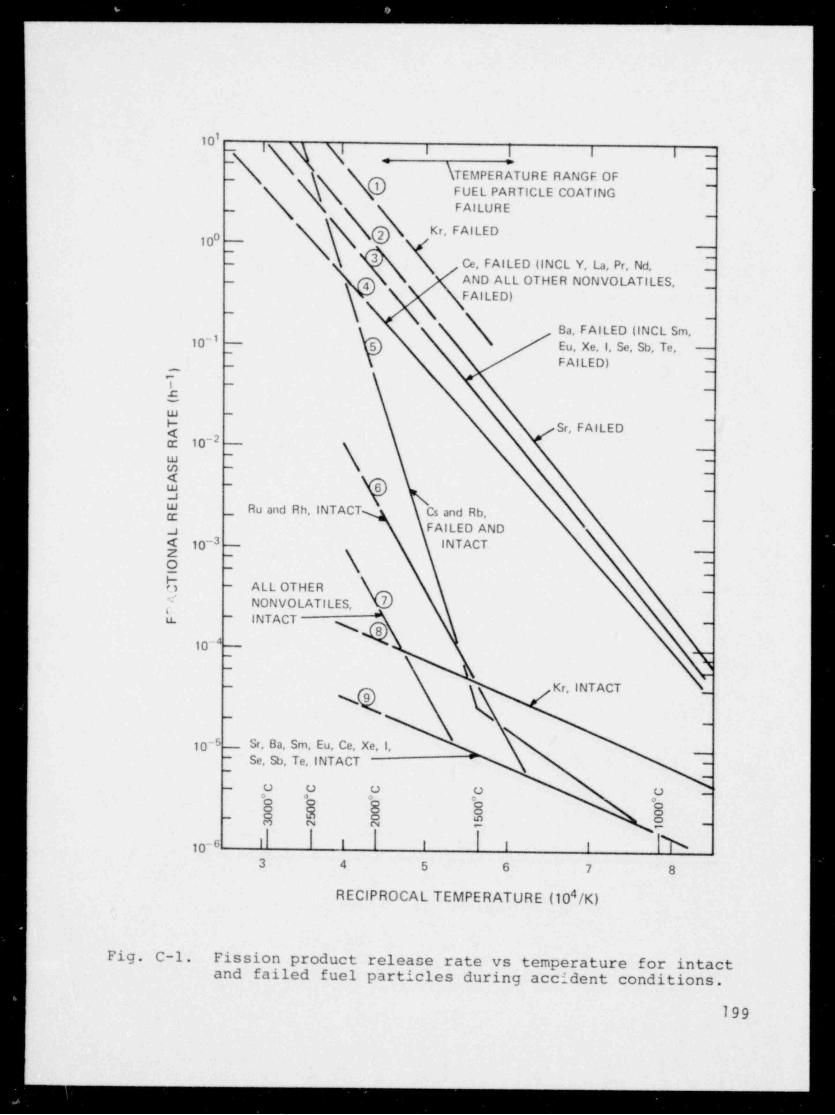
. . . _ _ _ . -__.
110_ g j g y , _
_\g
-
kTEMPERATURE RANGF OF_
FUEL PARTICLE COATING_
_ N FAILURE_
gN Kr, FAILED
'Ce, FAILED (INCL Y, La, Pr, Nd, 2
_ AND ALL OTHER NONVOLATILES,_
FAILED)
Ba, FAILED (INCL Sm,10-1 - Eu, Xe, I, Se, Sb, Te,
~
.:_ FAILED) [-
_
_
w -
Q Sr, FAILED_
cr 10-2w -
,,,,,,_
m - _-
J~
W _ Ru and Rh, INTACT Cs and Rb,g FAILED AND
_
j 10-3 -- INTACT
e - \_
__,,
$ - ALL OTHERNONVO LATI LES, M,/
u. - INTACT _
10 -
-
Kr, INTACT_
-
-
10-6_ Sr, Ba, Sm, Eu, Ce, Xe, I,
]Se, Sb, Te, INTACT '
__
-
-
- o o o o o _
N $ N N N- a a e e~
10-6 I I I I I h3 4 5 6 7 8
4RECIPROCAL TEMPERATURE (10 /K)
Fig. C-1. Fission product release rate vs temperature for intactand failed fuel particles during accident conditions.
199
-
. ..
C. Fuel Particle Coating Failure Models
Fuel particle coating failure models - have been evaluatedin Ref. 4, which contains detailed information on the various
models that have been proposed. Figures C-2 and C-3 (both f romRef. 1) show one set of coating failure models for the TRISO andBISO fuel particles. The failed fraction is approximated as a
linear function of temperature in the partially failed region.
Linear fuel failure is assumed with 10% failed fuel at 4 years.
This amount is added to the fraction that fails due to temperature.
Figures C-4 and C-5 (both from Ref. 5) show the fractions of failedBISO and TRISO particles as a function of temperature for 1 , 2,3, and 4-year-old fuel. These models were used in calculating
releases to be presented in a later section of this appendix.The NRC has proposed more conservative particle failure models
(Ref. 4, Figs. 28 and 29). Figure C-6, developed from these
models, shows the particle failures as a function of temperature
for 2.5-year-old fuel (the average core life).
The bases for these fuel particle coating failure models have
not been reviewed for this report. However, there is concern as
to how the effects of primary coolant impurities, including mois-
ture, present under normal reactor operating conditions, have beenincluded in the models.
Core temperature histories are needed to determine the failedfuel fractions and the release rates.
D. Core Temperature Model
Core temperature histories are determined by modeling analysesof the core heatup during the accident sequence. The CORCON code
calculates the maximum and average active core transient tempera-
ture histories for the various accident sequences.
200

. . . . . _ u_-__--
4 ysIM - | , | | -
2 v' -
100% COATING F A'LUR ES ~
1 yr --
~
PARTIAL F AILURE ~
R E ClON
100 -
s-
5g 50 -
925 20 - NO COATING FAILURES -
$s
10 -, -
5 --
1585* C
(1858* K )'- p1725*C
(1998* K)
2 --
'/)\ , , ,,800 1000 1200 1400 1600 1800 2000 ( * C)1073 1273 1473 1673 1873 20 73 2273 (*KI
FUEL TEMPERATURE
Fig. C-2. TRISO fuel particle coating failure diagram.
4 v'1=- I / I I I _
100% COATING FAILURES~
PARTIA L FAILURE -'
200 - REGION _
7? 100 -
v _
i-
/a - -
z9Eb M ~
NO COATING F AILURES -
|~
10 -_
5 -_,
1585* C 1725'C,
(1858 KP (1998* K)
2 ~_
! ! ! !i&X) 1000 1200 1400 1600 1800 2000 (* C)
1073 1273 1473 1673 1873 2073 2273 (* K)
F UEL TEVPERATURE
Fig. C-3. BISO fuel particle coating failure diagram.
201
- - - -
__.

1.0 , , , , ,
0.9 - -
g
Uo 0.8 - -
I( 0.7 - 4 3 2 1 AGE (yr) -
a.Q 0.6 -
wJ
R 0.5 - -
u.
$ 0.4 - -
z9 0.3 - -
F-
N 0.2 - -
x0.1 -
' ' I I I0.01200 1400 1600 1000 2000 2200 2400
TEMPERATURE (K)
Fig. C-4. Fraction of failed TRISO particles vs temperature.
1.0g g ,
0.9 - -m$o 0.8 - -
>@ 0.7 - -
1 4 3 2 1 AGE (yr)O 0.6 - -
d< 0.5 - -
u.
$ 0.4 -
zg 0.3 - -
b-
N 0.2 -
x0.1 -
' ' '0.01200 1400 1600 1800 2000 2200 2400
TEMPERATURE (K)
Fig. C-5. Fraction of failed BISO particles vs temperature.
202

. . . . _ -
-
'l I I
,o _.__
y so - -
33w
g 40 - -
f
20 - -
| 15% | n g3g '
o1273 1473 1673 1873 2073 2273 l* K)1000 1200 1400 1600 1800 2000 (*C)
FUEL TEMPERATURE
Fig. C-6. Fuel particle failure vs temperature for 2.5-year-oldfuel (NRC fuel failure model) .
III. RELEASE OF FISSION PRODUCTS TO THE CONTAINMENT
The general elements of the modeling of the fission productrelease to the containment is illustrated in Fig. C-7. Thesources contributing to the activity released to the containment
building will depend on the particular accident sequence.
The fission product release from the failed fuel to the cool-
ant is considered to consist of four main parts:
1. fuel particle coating failure,
2. release from fuel particles,
3. transport through graphite, and
4. release to the coolant.
203
--
. _ _ .

TRANSIENTCORE TEMPERATURE FUEL COATING
HISTORY AND AGEOF FUEL
v
FISSION PRODUCT RELEASE FROM FUEL PARTICLESDEPENDENT ON FUEL COATING FAILURE MODEL
\/
CORE TEMPER ATURE RELEASE RATEODE LSHISTORY
V
RELEASE FROM FUEL PARTICLE DEPENDENT ON COATINGFAILURE MODEL AND RELEASE RATE MODEL
V
TRANSPORTMODEL
V
CIRCU LATING LIFTOFF OF FISSION PolODUCT RELLASE FROMACTIVITY * PLATEOUT* FUEL PARTICLES TO COOLANT *
V V $
TRANSPORT MODELCOOLANT TO CONTAINMENT BUILDING ATMOSPHERE
V
TIME DEPENDENT FISSION PRODUCT RELEASE TOCONTAINMENT BUILDING ATMOSPHERE
" Sources of released actmt *
Fig. C-7. General modeling of the fission product release to thecontainment building.
This study assumes that releases from the failed fuel are trans-
ported without delay or reduction in magnitude to the coolant.
The following factors are considered to affect the time and
magnitude of the release from the coolant to the containment
204

_ ,, . _ _ . _ _- - - - -
building atmsophere:
1. operation of the PCRV overpressure relief valves,
2. circulating activity release,
3. liftoff of plateout in the PCRV, and
4. deposition on surfaces inside the PCRV.
While each of these factors may be represented by a model, thisstudy considers that the fission products in the coolant are
transported without delay or reduction in magnitude to the con-
tainment building atmosphere.
IV. RELEASE OF FISSION PRODUCTS TO THE ENVIRONMENT
A. Containment Building Model
The reactor containment building system is the final barrier
to prevent or minimize the escape of fission products to the en-
vironment. Fission products that are released to the inside of
the containment undergo removal from the internal containment
atmosphere by several mechanisms. Only containment atmosphere
cleanup system operation and leakage from the containment buildingto the environment will be considered in the single-volume contain-ment model.
The model assumes that the vapor phase in the containment con-
sists of one well-mixed compartment. For each fission productspecies:
dN'(t) A*N'(t) + R(t) (C-6)=-
where
A* = the rate constant for the isotope removal mechanisms,A*=A+Af+Ay+AjA = the radioactive decay constant of the isotope,
205
_ _ _ _ .
_..

Ag = the removal rate constant for the containment atmospherecleanup system,
Ay = the containment building leak rate constant,A. = the removal rate constant for mechanism j,
JR(t) = the rate at which the source is changing, and
N'(t) = the quantity of the isotope in the containment atmosphere.
thFor constant A* and R in the i time interval,
- -
R R - A * (t - t _y)f g f iN' = 77 + N, e (C-7)g_1 77 .
. -
The amount leaked from the containment building during the inter-
val t - t _1 = Ati,1 i
i\ / - A*(Atg ))| lR
' 1 I / ,
'
g = 77 Rg(Ati)R N _y 3,)\1-e (C-8)+f )
where
R is the rate at which the source is changing during inter-i
val i and A and A* are as previously defined and their values are1those applicable to interval i.
It is assumed that the release from the fuel goes immediately
to the containment and niixes with the containment atmosphere. That
is, there is no time delay in the drarsfer of the isotope from the
coolant to the containment building atmosphere and there is no
deposition of the isotope along the flow path. The time intervals,
i, are used for calculating the release from the core, R [Eq.f,
(C-4)] and the leakage from the containment building, Rf[Eq. (C-8)].Using these assumptions, the R in Eq. (C-8) are those calculated
i
in Eq. (C-4).
B. Fission Product Removal and Leakage
Fission products released into the containment building space
undergo removal from the containment atmosphere by a combination
206

. . . . . . _
__
of mechanisms, including radioactive decay, natural transport, and
deposition. Also, the containment atmosphere cleanup system (dis-
cussed in App. B) can operate to remove fission products from the
containment atmosphere. The quantity of fission products that
escapes to the environment depends on the competition between the
removal processes inside the containment and the leakage from the
containment. The cleanup system and containment leakage are the
only two removal mechanisms considered in this study.
The following cleanup rates and containment building leakage
rates have been considered in this study:
Cleanup system - (reference design)
3 loops Ag = 1.314 h--12 loops Af = 0.876 h-11 loop Af = 0.438 h
For the iodine isotopes, the following cleanup rates were
used:
3 loops 2 loops 1 loop
-1 -1 -1Inorganic I 1.8 h 1.2 h 0.6 h
-1 h-1 -1Organic I 0.6 h 0.4 0.2 h
It was assumed that 96 % of the total iodine is inorganic and 4%
is organic.
Containment Leakage -
-1Reference design A = 0.001 dg
-1Moderate leakage A = 0.100 dg
-1Massive failure A = 1.0 hg
207
-
. . . . .

The latent hazard indices in Figs. 21, 22, and 23 were de-
veloped using the above rates. The releases to the environment
during the accident sequences considered in this study are pre-
sented in App. D.
REFERENCES
1. M. H. Schwartz, D. B. Sedgley, and M. M. Mendonca, " SORS"Computer Programs for Analyzing Fission Product Release fromHTGR Cores During Transient Temperature Excursions," GeneralAtomic Co. report GA-A12462 (GA-LTR-10) ( April 15, 1974)and Amendment 1 (February 1975).
2. C. L. Smith, "In Support of LHTGR Fuel Performance Modelsfor MHFPR Studies," General Atomic Co. memorandum CLS:030:FMB:75 (October 21, 1975).
3. C. L. Smith, " Fuel Particle Behavior Under Normal and Trans-ient Conditions," General Atomic Co. report GA-Al2971 (GA-LTR-15) (OctoLer 21, 1974).
4. M. Tokar, " Evaluation of High Temperature Gas Cooled ReactorFuel Particle Coating Failure Models and Data," U.S. NuclearRegulatory Commission report NUREG-Olll (November 1976).
5. L. M. Carruthers and C. E. Lee, "LARC-1: A Los Alamos ReleaseCalculation Program for Fission Product Trancport in HTGRsDuring the LOFC Accident," Los Alamos Scienti fic Laboratoryreport LA-NUREG-6563-MS (November 1976).
6. K. E. Schwartztrauber and F. A. Silady, "CORCON: A Programfor Analysis of HTGR Core Heatup Transient," General AtomicCo. report GA-Al2868 (GA-LTR-13 ) (July 15, 1974).
208
.. . - _ _ _ _ _ -- - .

APPENDIX D
CONTENTS
I. INTRODUCTION - - - ------------------2ll
II. LATENT HAZARD INDEX ------ --- -- -------2ll
III. DOSE CONVERSION AND DOSE RISK CORRELATION FACTORS - - - 213
IV. SLOW DEPRESSURIZATION OF THE PCRV ----- - - - - - - 214
V. RAPID DEPRESSURIZ ATION OF THE PCRV - - - - - - - - - - 214
VI. LOSS OF FORCED COOLANT - - - --- ------- - - - - 217
VII. COMPARISON OF ACCIDENTS INVOLVING THE PRIMARYCOOLANT SYSTEM - - - - -----------------228
REFERENCES - -------------------------231
FIGURES
D-l. Relative latent hazard indices vs containmentfiltration (A = 0.1% d-4 . - - --------- - - - 229
1
D-2. Relative latent hazard indices vs containmentfiltration (Ay = 10 . 0 % d- M . - - - - - - - - - - - - - - 8 0
TABLES
D-I. Radionuclides Considered in the HTGR HazardIndice s Analysis - - - - - - - - - - - - - - - - - - - - 214
D-II. Dose Conversion and Risk Factors - - - - - - - - - - - - 215
- 216D-III. Slow Depressurization of the PCRV ----------
209

TABLES (cont)
D-IV. Rapid Depressurization of the PCRV - - - - - - - - - - 218
D-V. Release of All Circulating Activity and All219Plateout Activity to the Containment Building ----
D-VI. Design Basis Depressurization Iodine Leakageto the Environment - - - - - - ------ ---- -- 220
---------- -- 22lD-ciI. Loss of Forced Coolant - - - -
D-VIII. Release of Total Primary Inventory to theContainment Building - - - - - - - - - - - - - - - - - 222
D-IX. Loss-of-Forced Coolant Accident Iodine Leakage224to the Environment - - - - - -- ---- -------
D-X. Loss-of-Forced Coolant Accident Release of I
225to the Environment - - ------------ ---
D-XI. Loss-of-Forced Coolant Accident Iodine Leakage----------- - -- 226to the Environment at 2h
D-XII. Loss-of-Forced Ct71 ant Accident Comparison of227131I Leakage to the Environment ----- ------
210
APPENDIX D
LATENT HAZARD INDICES
I. INTRODUCTION
In order to identify areas deserving of more detailed analysis,it was necessary to develop an index by which the various possibleaccident sequences could be ranked. Although the determination of
the consequences of the possible accident sequences was not a partof this study, it was logical to consider that consequences andfrequency of occurrence are principal factors in establishing thesignificance of the sequences. A specific consequence of an ac-
cident sequence was selected for use as an index to rank the se-quences. This restricted consequence considers only two hazardsin the exposed population; latent deaths expected from leukemiaproduced by photon doses to total marrow during immersion in thecloud and latent deaths expected from thyroid cancer produced byconversion of the inhalation dose. The releases from the reactorsystem and containment building must be determined (see App. C)in order to establish this consequence of a sequence. Releases
and latent hazard indices for three initiating events are presentedin this appendix.
II. LATENT HAZARD INDEX
The latent hazard indices quantify the relative potential ofthe various released radionuclides for producing latent fatalitiesin the exposed popul,' ion. The magnitude of the latent fatalities
expected from an accident sequence is proportional to the latenthazard index. The latent hazard index used in this study considerstwo exposure modes -- external from immersion in contaminated air
and internal from inhalation -- and two latent health effects --leukemia and thyroid cancer. Thus, these indices do not include
all possible risks.
The magnitude of the latent hazard indices is determined bythe following parameters:
211

1. inventory of the radionuclide released from thereactor system to the containment building atmosphere,
2- radioactive decay, plateout, and cleanup of the radio-nuclides inside the containment building,
3. total radionuclide leakage from the containment build-ing to the environment,
4. dose conversion factors for converting th cloud con-3
centrations into an organ dose (rem /Ci-s/m ) for im-mersion in the cloud,
5. dose conversion factors and breathing rates for con-verting cloud concentrations into an organ dose (rem /Ci-inhaled) for inhalation of the cloud, and
6. dose-risk factors for converting organ dose into latentfatalities (expected deaths /million-man at risk-rem).
The latent hazard index is calculated as follows. The hazardthfrom the external dose of the j radionuclide, immersion only
in the noble gases,
AI tD R 3600 (D-1)E. = So
j {( A* -
A E E33 g g j
wherethSo. = source strength, Ci, of the j radionuclide released
3 to the containment building,
A = containment building leak rate,g
A = decay rate for the jth radionuclide,3
thD = dose conversion factor for the j radionuclide,E.
3thR = risk factor for the j radionuclide, and
E.3
ththe hazard from the inhalation dose of the j radionuclide,
A/ t i3600 (D-2)I3 = So3|\z, , 2, f)) 3 3
jB D R- - -
I. I.3
212

._--
wherethSo. = source strength, Ci, of the j radionuclide release3 to the containment building,
A = containment building leak rate,g
thA- = decay rate for the j radionuclide,J
A g3 = containment cleanup rate for the j radionuclide,
B = breathing rate,thD = dose conversion factor for the j radionuclide, and7,
JthR = risk factor for the j radionuclide.7,
J
The hazard index for the accident sequence is
H.I. (E) + Ij) (D-3)=
.
J
III. DOSE CONVERSION AND DOSE RISK CORRELATION FACTORS
An initial list, Table.D-I, of 32 isotopes was selected for
analysis from the nuclide inventory for the HTGR, Table 11.1-5,Chapter 11 of GASSAR. Fewer than 13 of these isotopes contribute
significantly to the latent hazard indices of the accident sequencesconsidered in this study. These important isotopes will be listed
in subsequent sections of this appendix. It should be noted that
lists of important isotopes in this study apply only to the latenthazard index, as defined, of specific HTGR accident sequences in-volving the active reactor system (core and primary coolant).Significantly different lists are expected for accidents involvingother systems, such as spent fuel and helium purification, or otherdefined hazards.
Table D-II lists the dose conversion and risk factors used inthis study. These factors were taken from App. VI of the Reactor
Safety Study.
213
.- _
. _ _ _ . . _ . . . . . __

TABLE D-I IV. SLOW DEPRESSURIZATION OF
RADIONUCLIDES CONSIDERED IN THE THE PCRV
HTGR HAZARD INDICES ANALYSISSequences resulting from
83 131 the slow depressurization ofBr 7
the PCRV were analyzed for83m 132
Kr Te latent hazards. Table D-III
"Kr I shows the most important radio-
85 133m nuclides, their inventories inKr Te
the reactor system, and the cal-87 3'33
Br I culated release to containment.Kr Xe The releases in Table D-III and
88 134 the conversion factors in TableKr 7
D-II were used to calculate the89 134
Sr Cs latent hazard indices in Tables
Sr I VII and VIII. Nuclide inven-
95 135 tories and release quantitiesZr Xe
in Table D-III are in units of95" 136
*curies.
103 137Ru Cs
106 140 V. RAPID DEPRESSURIZATION OFRu Ba
T" P129m 141
Te La
129 141I Ce The rapid depressurization
.
131m 144 f the PCRV (DBDA) is the designTe Ce
basis accident (DBA). The DBA
is intended to provide an upper
limit to the potential conse-
quences of any accidents that can be considered to have a plausiblechance of occurrence.
For the consequences of any accident to exceed those of the
DBA, the initiating event must be more severe than any consideredin the design evaluation, or it must be accompanied by the failure
of at least some of the engineered safety features (ESP). Plants
are provided with various engineered safety features, such as aux-iliary core cooling systems, containment system, and systems for
214

._ . _ . _ _ . . -
TABLE D-II
DOSE CONVERSION AND RISK FACTORS
Dose-Risk FactorDose Conversion Factor Thyroid
Isotope Total Marrow # Thyroid Leukemia Cancerc c
-2*Kr 5.5 x 10 - 28.4 -
-1Kr 1.92 x 10 - 28.4 -
-1Kr 4.83 x 10 - 28.4 -
131 61 - 1.0 x 10 1.34-
"Te - 8.7 x 10 412.9-
132 31 - 6.6 x 10 - 12.9132 4Te - 9.7 x 10 - 12.9133 5
- 12.91 - 1.8 10133m 4Te - 8.7 x 10 12.9-
-2Xe 1.59 x 10 - 28.4 -
134 3Cs - 7.9 x 10 - 12.9134 3I - 1.1 10 - 12.9135 4I - 4.4 10 12.9-
-2Xe 8.47 x 10 - 28.4 -
3Immersion - rem / (Ci-s/m ) ,
bInhalation (30 day) - rem /Ci-inhaled (breathing rate =2.32 x 10⁻⁴ m3/s).
6Expected deaths per 10 man-rem.
removing fission products from the containment atmosphere, thatperform accident consequence mitigating functions. With all
engineered safety features operating at their minimum design basis,the accident sequence resulting from a rapid depressurization ofthe PCRV is the design basis (depressurization) accident (DBDA).
215
- - - - - - -
__. _ . . .

rua
mTI.BLE D-III
SLOW DEPRESSURIZATION OF Tile FCRV
Equilibrium CirculatingEquilibrium Core Release Plateout Activity Total
Total Inventory Release from (GASSAR Liftoff (GASSAR Release toNuclide Inventory in Core Fraction Core Design) Fraction Liftoff Design) Containment
4 47 78% r 5.92 x 10 5.92 x 10 0 0 0 0 0 1.8 x 10 1.8 x 10
K
4 487 7 7
Kr 8.28 x 10 8.28 x 10 0 0 0 0 0 1.9 x 10 1.9 x 10⁴ 4
88 8 8Kr 1.26 x 10 1.26 x 10 0 0 0 0 0 3.9 x 10 3.9 x 10
489 8 85r 1.49 x 10 1.49 x 10 0 0 1.22 x 10 0 0 0.248 0.248
Sr 1.54 x 10 1.54 x 10 0 0 1.54 x 10 0 0 7.86 x 10⁻³ 7.86 x 10-3490 8 8
4129m 6 6Te 7.18 x 10 7.16 x 10 0 0 1.85 x 10 0 0 1.7 1.7
7 7 4I3I*Te 2.35 x 10 2.35 x 10 0 0 1.08 x 10 0 0 27. 27.
8 48 1.198 x 10 0 0 8.82 x 10 0 0 85. 85.132Te 1.20 x 10
4133m 8 8ie 1.12 x 10 1.12 x 10 0 0 1.04 x 10 0 0 803. 803.
5131 7 7I 7.71 x 10 7.70 x 10 0 0 1.20 x 10 0 0 41, 41.
I 8 8 5I 1.27 x 10 1.27 x 10 0 0 1.05 x 10 0 0 549. 549.
4133 8 81 1.26 x 10 1.26 x 10 0 0 8.40 x 10 0 0 258. 258.
8 8 4 3 3134 1.92 x 10 1.92 x 10 0 0 3.02 x 10 0 0 1.43 x 10 1.43 x 10
!4135 8 8
1 1.47 x 10 1.47 x 10 0 0 3.80 x 10 0 0 426. 426.
3 3I33 8 8
Xe 1.81 x 10 1.81 x 10 0 0 0 0 0 8.65 x 10 8.65 x 10⁴ 4
135 8 8xe 1.62 x 10 1.62 x 10 0 0 0 0 0 1.60 x 10 1.60 x 10
4134 7 7Cs 2.11 x 10 2.10 x 10 0 0 5.78 x 10 0 0 0.243 0.243

. . _ . _ _ _ . _ _ _ _ _ _ _ . _--
Latent hazard indices for the rapid depressurization of thePCRV were calculated using the releases to containment shown inTable D-IV. Also shown in Table D-IV are the inventories in thereactor system and the liftoff fractions used in determining therelease. Nuclide inventories and release quantities are in unitsof curies. Latent hazard indices calculated from the releases inTable D-IV are shown in Tables X, XI, a d XII.
Latent hazard indices for this accident were also calculatedassuming that all circulating activity and all plateout activityare released to the containment. These results, presented in TableD-V, are for comparison with the indices in Tables X and XI to showthe effect of the liftoff fraction on the latent hazard index andon the relative importance of the radionuclides. Such comparison
shows that the liftoff fractions in Table D-IV reduce the hazardindices by factors ranging from 13-92. This is a significant re-
duction and because of this significance, the plateout and liftofffractions should be justified if used in a safety evaluation.
The cumulative releases of iodine to the environment at 2 and8 h were determined for two sequences of the rapid depressurizationof the PCRV. These results are shown in Table D-VI. Analysis showsthat the iodine released to the environment results primarily fromliftoff of the plateout and that the magnitude of the release es-sentially varies directly with the plateout release fraction.
VI. LOSS OF FORCED COOLANT
Sequences following the loss of forced coolant were analyzedfor latent hazards. Table D-VII shows the most important radio-nuclides, the release from the core, the liftoff, and the calcu-lated total release to the containment. Nuclide inventories andrelease quantities are in units of ries. The calculated releasesin Table D-VII and the conversion f'. tors in Table D-II were usedto calculate the latent hazard indi;es in Tables XIII, XIV, and XV.
Latent hazard indices were also calculated assuming that thetotal primary inventory is released to the containment building.The resu]tc presented in Table D-VIII, are for comparison with the
217
____
_ _ _ _ _ . . ..

roa
co
TABLE D-IV
RAPID DEPRESSURIZATION OF THE PCRV
Equilibrium Liftoff Circulating
Equilibrium Core Release Plateout Fraction Activity TotalTotal Inventory Release from (GASSAR D'edian (G,SSAR Release to
Nuclide Inventory in Core Fraction Core Design) Release) Liftoff Asjn) Containment
4 485m 7 7
Kr 5.92 x 10 5.92 x 10 0 0 0 0 0 1.8 x 10 1.8 x 10⁴ 487 7 7
Kr 8.28 x 10 8.28 x 10 0 0 0 0 0 1.9 x 10 1.9 x 10⁴ 488 8 8
Kr 1.26 x 10 1.26 x 10 0 0 0 0 0 3.9 x 10 3.9 x 10
89 8 8 45r 1.49 x 10 1.49 x 10 0 0 1.22 x 10 0.0026 31.72 0.248 32.0
Sr 1.54 x 10 0 0 1.54 x 10 0.0005 7.7 7.86 x 10⁻³ 7,790 8 1.54 x 10⁸ 4
4129m 6 6Te 7.18 x 10 7.16 x 10 0 0 1.85 x 10 0.0036 66.6 1.7 68.3
7 7 4I3I*Te 2.35 x 10 2.35 x 10 0 0 1.08 x 10 0.066 712.8 27. 739.8
4132 8 8Te 1.20 x 10 1.198 x 10 0 0 8.82 x 10 0.028 2469.6 85. 2555.
133m 8 8 4 a aTe 1.12 x 10 1.12 x 10 0 0 1.04 x 10 0.10 1040 803. 1840.
131 7 7 51 7.71 x 10 7.70 x 10 0 0 1.20 x 10 0.013 1560. 41. 1601.
132 8 8 51 1.27 x 10 1.27 x 10 0 0 1.05 x 10 0.071 7455. 549. 8004.
133 8 8 41 1.26 x 10 1.26 x 10 0 0 8.40 x 10 0.089 7476. 258. 7734,
134 8 8 4 31 1.92 x 10 1.92 x 10 0 0 3.02 x 10 0.134a 4040.a 1.43 x 10 5470.
135 8 8 41 1.47 x 10 1.47 x 10 0 0 3.80 x 10 0.203 7714 "26. 8140.
3133 8 8xe 1.81 x 10 1.81 x 10 0 0 0 -- -- 8.65 x 10 8650.
4 4135 8 8Xe 1.62 x 10 1.62 x 10 0 0 0 -- -- 1.6 x 10 1.6 x 10
134 7 7 4Cs 2.11 x 10 2.10 x 10 0 0 5.78 x 10 0.0001 5.78 0.243 6.0
' Estimated value.
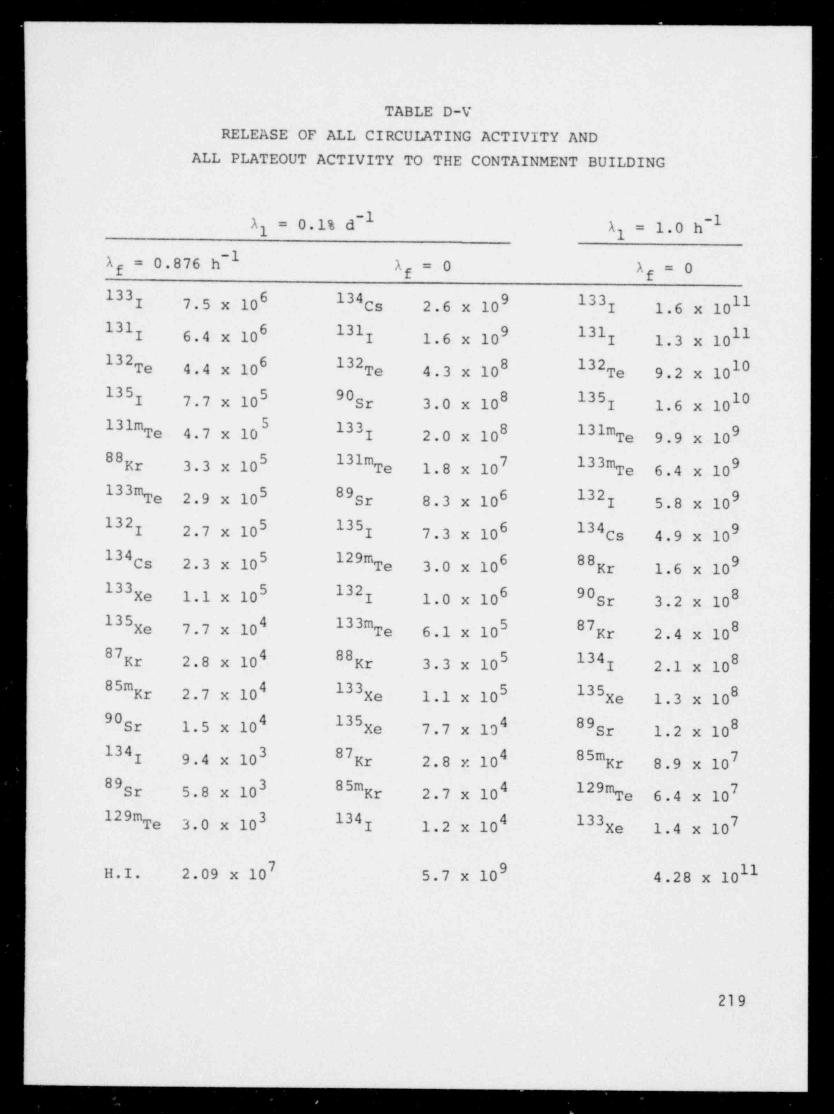
. . . . . . . . . _ - _- - -
TABLE D-V
RELEASE OF ALL CIRCULATING ACTIVITY AND
ALL PLATEOUT ACTIVITY TO THE CONTAINMENT BUILDING
-1 -11 = 0.1% d A1 = 1.0 h
-1Af = 0.876 h Af=0 Af=0
6 134 9 133 11I 7.5 x 10 Cs 2.6 x 10 I 1.6 x 101I 6 131 9 131 11I 6.4 x 10 I 1.6 x 10 I 1.3 x 10
6 132 8 132 10Te 4.4 x 10 Te 4.3 x 10 Te 9.2 x 10
5 90 8 135 10I 7.7 x 10 Sr 3.0 x 10 I 1.6 x 10131m 133 8 131m 9Te 4.7 x 10 I 2.0 x 10 Te 9.9 x 1088 5 131m 133mKr 3.3 x 10 Te 1.8 x 10 Te 6.4 x 10133m 5 89 6 132 9Te 2.9 x 10 sr 8.3 x 10 I 5.8 x 10132 5 135 6 134 9I 2.7 x 10 I 7.3 x 10 Cs 4.9 x 10134 5 129m 6 88 9Cs 2.3 x 10 Te 3.0 x 10 Kr 1.6 x 10¹³ 5 132 6 90 8Xe 1.1 x 10 I 1.0 x 10 Sr 3.2 x 101 4 133m 5 87 8Xe 7.7 x 10 Te 6.1 x 10 Kr 2.4 x 1087 4 88 5 134 8Kr 2.8 x 10 Kr 3.3 x 10 I 2.1 x 1085m 4 133 5 135 8Kr 2.7 x 10 Xe 1.1 x 10 Xe 1.3 x 10O 4 135 7 . 7 x l') 4 89 8Sr 1.5 x 10 Xe Sr 1.2 x 10
134 3 87 4 85m 7I 9.4 x 10 Kr 2.8 x 10 Kr 8.9 x 1089 3 85m 4 129mSr 5.8 x 10 Kr 2.7 x 10 Te 6.4 x 10129m 3 134 4 133 7Te 3.0 x 10 I 1.2 x 10 Xe 1.4 x 10
9 11H.I. 2.09 x 10 5.7 x 10 4.28 x 10
219
- - .
. - - - -

TABLE D-VI
DESIGN BASIS DEPRESSURIZATION ACCIDENT IODINE LEAKAGETO THE ENVIRONMENT
Cumulative Iodine Release (Ci) to the Environment"
j = 100% d'I A) = 0.25% d'IA
Af = (see note b) Af = (see note c)
Radio- Median Upper 95% Bound Median Upper 95% Boundnuclide 2h 8h 2h 8h 8h 8h
1 31 I 6.8 10.5 15.9 24.3 0.024 0.056
132 I 27.1 37.7 75.3 105.0 0.076 0.211
133 I 31.0 47.0 86.5 131.0 0.108 0.301
1341 9.9 12.4 27.0 33.8 0.027 0.075
135 I 28.2 41.7 79.6 118.0 0.094 0.267
TOTAL 103.0 149.0 284.0 412.0 0.33 0.91
4 Iodine released to the containment is primarily from liftoff of the plateout.Values of the release vary directly with the plateout release fraction.
bAf=0 0sts1h 96% inorganic
= 1.2 h-I (inorganic) organicIh$t58h
= 0.4 h-I (organic)c
Af=0 0sts1h 96% inorganic
= 0.9 h-I (ir. organic) 4% organicIhsts8h= 0.3 h-I (organic)
220
. . . . . _ _ . _

_ _ _ _ ..
TAB LE: D-VIILOSS OF FORCED COOLANT
Equilibrium Liftoff Circulatin9Equilibrium Core Plateout Fraction Activity Total
Total Inventory Release Release (GA55AR Chshan (GA55AR Release toNuclide inventory _ in Core Fraction from Core Design) Pelswe)_ Liftoff DejhnL Containment
7 4 785*Kr 5.92 x 10 5.92 x 10 1.0 5.92 x 10 0 0 0 1.8 x 10 5.92 x 10
87 7 7 7 4 7kr 8.28 x 10 8.28 x 10 1.0 8.28 x 10 0 0 0 1.9 x 10 8.28 x 10
88 0 8 8 4 8Ar 1.26 x 10 1.26 x 10 1.0 1.26 x 10 0 0 0 3.9 i 10 1.26 x 10
6 4 8 2 569 0 8 6 x 10⁻³ 8.94 x 10 1.22 x 10 1.01 1.22 x 10 0.248 8.94 x 10⁵r 1.49 x 10 1.49 x 10
90 8 8 -3 6 45r 1.54 x 10 1.54 x 10 6 x 10 9.22 x 10 1.54 x 10 0.0005 7.7 7.86 x 10'3 9.22 x 10⁶
6 6 b 4 I 5I29"Te 7.18 x 10 7.16 x 10 4 x 10⁻² 2.86 x 10 1.85 x 10 0.0036 6.66 x 10 1.7 2.86 x 10
5 4 2 6131m 7 7 4 x 10'2 9.4 x 10 1.08 x 10 0.066 7.13 x 10 27. 9.41 x 10Te 2.35 x 10 2.35 x 10⁶ 4 3 6132 8 8 4 x 10⁻² 4.73 x 10 8.82 x 10 0.028 2.47 x 10 85. 4.79 x 10Te 1.20 x 10 1.198 x 10
8 8 6 4 a 2 6I33*Te 1.12 x 10 1.12 x 10 4 x 10⁻² 4.48 x 10 1.04 x 10 0.06 6.24 x 10 803. 4.48 x 10
6 6 3 6131 7 7 4 x 10⁻² 3.08 x 10 1.20 x 10 0.013 1.56 x 10 41. 3.08 x 101 7.71 x 10 7.70 x 10⁶ 6 3 6I32 8 8 4 x 10⁻² 5.08 x 10 1.05 x 10 0.071 7.46 x 10 549. 5.09 x 101 1.27 x 10 1.27 x 10⁶ 4 3 6333 8 8 4 x 10⁻² 5.04 x 10 8.40 x 10 0.089 7.48 x 10 258. 5.05 x 101 1.26 x 10 1.26 x 10⁶ 4 3 3 6134 0 8 4 x 10'2 7.68 x 10 3.02 x 10 0.100 3.02 x 10 1.43 x 10 7.68 x 101 1.92 x 10 1.92 x 10⁶ 4 3 6135 8 8 4 x 10 2 5.88 x 10 3.80 x 10 0.203 7.71 x 10 426. 5.89 x 101 1.47 x 10 1.47 x 10
I33 8 8 8 3 8Xe 1.81 x 10 1.81 x 10 1.0 1.81 x 10 0 0 0 8.65 x 10 1.81 x 10
135 0 0 0 4 8xe 1.62 x 10 1.62 x 10 1.0 1.62 x 10 0 0 0 1.60 x 10 1.62 x 10
7 4 7I34 7 7 9 x 10'I 1.89 x 10 5.78 x 10 0.0001 5.78 0.243 1.89 x 10Cs 2.11 x 10 2.10 x 10
* Estimated value.
NN
a
- - - - - -
- - . . . ,-

TABLE D-VIII
RELEASE OF TOTAL PRIMARY INVENTORY TO THE
CONTAINMENT BUILDING-I -I
A) = 0.1% d A) = 1.0 h-l
A = 0.876 h Af=0 A =0f f
131 10 90 12 133 l4I 1.1 x 10 Sr 3.0 x 10 I 2.4 x 10
132 9 1 31 11 132 I4Te 5.9 x 10 1 9.9 x 10 Te 1.2 x 10
131 9 132 H 131 131 4.1 x 10 Te 5.9 x 10 I 8.6 x 10
135 9 133 11 135 13I 3.0 x 10 I 3.1 x 10 1 6.3 x 10133m 9 89 H 1 3m 13
Te 1.3 x 10 Sr 1.0 x 10 Te 2.9 x 10133 8 135 10 131m 12
Xe 8.6 x 10 I 2.8 x 10 Te 4.3 x 10135 8 131m 9 88 12
Xe 7.7 x 10 Te 7.8 x 10 Kr 3.1 x 1088 8 133m 9 90 12Kr 6.4 x 10 Te 2.7 x 10 Sr 3.1 x 10131m 8 129m 9 132 12Te 2.0 x 10 Te 1.2 x 10 I 2.5 x 1090 8 133 8 89 12Sr 1.5 x 10 Xe 8.6 x 10 Sr 1.5 x 10132 8 135 8 135 12I 1.2 x 10 7e 7.7 x 10 Xe 1.3 x 1089 7 88 8 134 llSr 7.0 x 10 Kr 6.4 x 10 I 5.4 x 1087 7 132 8 87 llKr 4.2 x 10 I 4.5 x 10 Kr 3.6 x 10134 7 87 7 133 IlI 2.4 x 10 Kr 4.2 x 10 Xe 1.1 x 1085m 7 134 7 85m 10Kr 2.4 x 10 I 3.1 x 10 Kr 7.7 x 10129m 6 85m 7 129m 10
Te 1.2 x 10 Kr 2.4 x 10 Te 2.5 x 10
10 12 I4H.I. 2.82 x 10 5.03 x 10 5.55 x 10
indices in Tables XIII, XIV, and XV to show the effect of the core
release and liftoff fractions on the latent hazard index and on therelative importance of the radionuclides. This comparison shows
that the core release and liftoff fractions in Table D-VII reduce
the hazard indices by factors of 5-9. Thus, these core release
222

fractions, plateout inventories, and liftoff fractions do not have
a large effect in reducing the latent hazard index of the loss-of-
forced coolant accident.
The release of iodine isotopes to the environment was deter-
mined for the loss-of-forced coolant condition using a range of
assumptions for the performance of the engineered safety features
and several release models. The following information was used to
calculate the releases in Tables D-IX through D-XI:
2.5-year-old fuel
60% BISO loading
Fraction of core volume above indicated temperature(Ref. 1, Vol. 2, Chapter 4, Fig. 4.4-8, July 1974)with 100 partitions of the core volume
Core temperature history (Ref. 3, Fig. 6-2)
Fuel particle failure vs temperature (Ref. 3, Figs.5-1 and 5-2)
Fission particle failure vs temperature (Ref. 3, Figs.Figs. 5-1 and 5-2)
Fission product release rate vs temperature (Ref. 3,
Fig. 5-3)
Initial nuclide inventories from Table D-III.
Table D-IX shows the time history of the cumulative release
of five iodine isotopes when engineered safety features are func-
tioning at the design point in the reference system design. Table131D-X shows the cumulative release of I, the predominant isotope
in the release, using the same information as Table D-IX, and dif-
forent containment building leakage and cleanup rates. Comparison
with the release in Table D-IX shows the importance of the contain-
ment building and containment integrity during the LOFC accident.
With good containment integrity and cleanup system performance,-3 131
about 4.6 x 10 % of the initial I inventory is released to the
environment compared with about 3.3% of the initial inventory when
the containment leak rate is large. Table D-XI shows the cumulative
223

TABLE D-IX
LOSS-OF-FOPCED COOLANT ACCIDENT IODINE LEAKAGE
TO THE E!NIRONMENT
#Cumulative Iodine Release (Ci) to the Environment
131 132 133 134 135Time ( h ', 7 7 7 7 7
1 5.1 0.3 0.5 0.4 0.5
2 15.6 2.4 5.0 1.8 3.9
3 39.1 12.1 32.7 6.0 24.0
4 112.5 42.7 145.9 14.3 100.9
5 293.0 97.0 401.0 23.6 264.0
6 635.0 156.0 763.0 30.0 479.0
7 1143.0 200.0 1107.0 33.2 672.0
8 1738.0 224.0 1347.0 34.3 797.0
9 2309.0 235.0 1482.0 34.6 863.0
10 2775.0 238.0 1547.0 34.6 893.0
11 3110.0 240.0 1577.0 905.0
12 3329.0 240.0 1589.0 910.0
13 3461.0 1595.0 912.0
14 3534.0 1597.0 913.0
15 3573.0 1597.0
16 3592.0
17 3601.0
18 3605.0
19 3606.0
20 3607.0
1 = 0.1% d-1 A* = 0.897 (effective containment atmosphere"A
cleanup system constant; systemstarts at t = 0).
release to the environment of five iodine isotopes at 2 h for three
containment leakage rates and four containment atmosphere cleanup
rates. The individual and collective importance of the containment
224
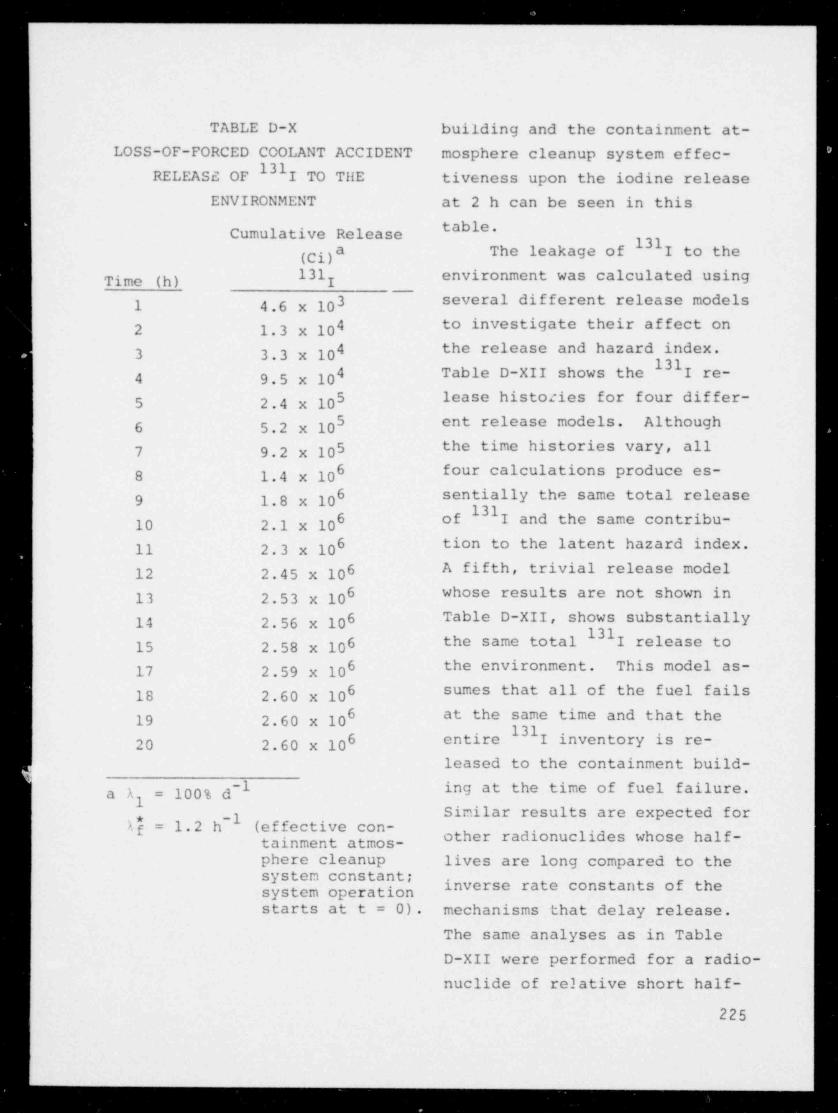
- - - - . . - - - - . . . . -..
TABLE D-X building and the containment at-
LOSS-OF-FORCED CCOLANT ACCIDENT mosphere cleanup system effec-
RELEASE OF I TO THE tiveness upon the iodine release
ENVIRONMENT at 2 h can be seen in this
table.Cumulative Release131
(Ci)a The leakage of I to the
131 environment was calculated usingTime (h) 7-
1 4.6 x 10³ several different release models
4 to investigate their affect on2 1.3 x 10⁴ the release and hazard index.3 3.3 x 10
314 Table D-XII shows the I re-4 9.5 x 10⁵ lease histories for four differ-5 2.4 x 10⁵ ent release models. Although6 5.2 x 10
7 9.2 x 10⁵ the time histories vary, all
8 1.4 x 10 four calculations produce es-6
9 1.8 x 10 sentially the same total release6131
6 of 1 and the same contribu-10 2.1 x 10⁶ tion to the latent hazard index.11 2.3 x 10
12 2.45 x 10⁶ A fifth, trivial release model
6 whose results are not shown in13 2.53 x 10
14 2.56 x 10⁶ . Table D-XII, shows substantially131
15 2.58 x 10⁶ the same total 1 release to
6 the environment. This model as-17 2.59 x 10⁶ sumes that all of the fuel fails18 2.60 x 10⁶ at the same time and that the19 2.60 x 10
. 1316 entire I inventory is re-20 2.60 x 10
leased to the containment build-
-l100% d ing at the time of fuel failure.a A =1
Similar results are expected for-1A*f = 1.2 h (effective con-other radionuclides whose half-tainment atmos-
phere cleanup lives are long compared to the
inv rse rate constants of thes m op r tstarts at t = 0). mechanisms that delay release.
The same analyses as in Table
D-XII were performed for a radio-
nuclide of relative short half-
225
- - -
. _ _ . .

$ TABLE D-XI
LOSS-OF-FORCED COOLANT ACCIDENT IODINE LEAKAGE
TO TIIE ENVIRONMENT AT 2 h
aContainmentAtmosphere ContainmentC L
Cumulative Iodine Releo:e (C_i)b at 2 ht Cons t Co a
(h-l) (d~l) I I I 134; 135;l
1.8 0.1% 10.6 1.9 3.8 1.4 3.0(3/3 loops) 0.25 26.4 4.7 9.4 3.4 11.7
4 3 3 3 3100. 1.04 x 10 1.77 x 10 3.72 x 10 1.35 x 10 2.93 x 10
1.2 0.1% 13.0 2.2 4.4 1.6 3.4(2/3 loops) 0.25 33.7 5.3 11.3 4.0 8.9
4 3 3 3 3100. 1.32 x 10 2.11 x 10 4.45 x 10 1.59 x 10 3.5 x 10
0.6 0.1% 18.2 2.6 5.6 2.0 4.4(1/3 loops) 0.25 45.5 6.5 13.9 4.9 11.0
4 3100. 1.78 x 10 2.58 x 10³ 5.48 x 10³ 1.93 x 10 4.31 x 10³
0.0 0.1% 27.1 3.4 7.2 2.5 5.6(0/3 loops) 0.25 66.5 8.4 18.0 6.2 14.0
4 3100. 2.55 x 10 3.29 x 10 7.03 x 10³ 3 32.42 x 10 5.52 x 10
aContainment atmosphere cooler and cleanup system starts at t = 0.3Release from fuel derived from Ref. 4, Fig. 40, and based on the SORS core temperature model.

. _ _ _ _
TABLE D-XII
LOSS-OF-FORCED COOLANT ACCIDENT COMPARISON OF I LEAKAGETO THE ENVIRONMENT
131Cumulative I Release to the Environment (Ci)"
Time Uniform Core T 'rature Models Partitioned Core Temperature Models(h) b c d e
0 0 0 0 01 26.2 0 5.1 0.012 35.4 0 15.6 0.433 191. 19.2 39.1 9.84 770. 103. 113. 65.65 1718. 319. 293. 229.6 2597. 703. 635. 559.7 3150. 1240. 1143. 1062.8 3398. 1866. 1738. 1637.9 3499. 2456. 2309. 2226.10 3539. 2909. 2775. 2689.11 3556. 3200. 3110. 3020.12 3563. 3361. 3329. 3234.13 3566. 3439. 3461. 3361.14 3567. 3473. 3534. 3431.15 3573. 3468.16 3493. 3592. 3586.17 3601. 3494.18 3496. 3605. 3498.19 3606. 3500.20 3568. 3496. 3607. 3500.RelativeTotalRelease 1.00 0.98 1.01 0.98
A) = 0.1% d'I Ap=0.9h-I (effective cleanup system constant)a
131 7initial 1 inventory = 7.79 x 10 Ci 40% TRISO particles2.5-year-old fuel BISO and TRISO particles generate60% BISO particles 57.5% and 42.5%, repsectively, ofthe total 1311.
227
----
_ . . . . .

TABLE D-XII (cont)
NRC fuel failure models (Ref. 5) and uniform core temperature model using SORScore temperature histories (Ref. 3, Fig. 6-2); instantaneous, 100% release of131 1 upon failure of fuel particles (release independent of release constants).
uniform core temperature model (Ref. 6, Table IV) using SORS core temperaturec
histories (Ref. 3, Fig. 6-2) and SORS release constants (Ref. 3, Fig. 5-3);all particles assumed to fail at +2 h.
Time-dependent fuel particle release constant based on SORS core tcmperaturehistories (Ref. 3, Fig. 6-2), the SORS fuel particle failure models (Ref. 3,Figs. 5-1 and 5-2) , and the LARC-1 core temperature nodel (Ref. 4, Fig. 5) .
" Release adapted from Ref. 4, Fig. 40.
135life, I. For this radionuclide, the relative total releases for
the first three models in Table D-XII are 1.0, 0.83, and 0.76. This
shows that the release modeling affects the calculated release mag-
nitudes when the half-life is short. However, these effects are
relatively small and the radionuclides that are the most important
contributors to the latent hazard indices have relatively long
half-lives. Thus, the release modeling is not expected to sig-
nificantly affect the hazard indices.
VII. COMPARISON OF ACCIDENTS INVOLVING THE PRIMARY COOLANT SYSTEM
Comparisons of the latent hazard indices for the slow de-
pressurization, rapid depressurization, and LOFC accidents are madeto show the effectiveness of the containment cleanup system. Fig-
ures D1 and D2 show the relative latent hazard indices vs contain-ment atmosphere cleanup rate for two leak rates of the containmentbuilding. These relative latent hazard indices are normalized tothe index for the slow depressurization accident with a cleanup
-1 -1rate of 1.314 h and a containment leak rate of 0.1% d Each.
curve shows the effectiveness of the cleanup system for a given
accident. Comparison of the two figures shows the effectiveness of
228

I I I610 r
,
Z.
_
_
--
510_
_
-I_
--
-
-
--
X4y 10 -- LOFC __
z I- -_
o --
m -.
k --
<C-
-I>-Z
3w 10 -
->- 2
5 : -
_ - -
) -
-
g --
5 -
w_
C213 - --
-
_
.
_
- -
- -
10' _- -
I~
R APID DEPRESSURl2ATION~
__
-
_ SLOW OEPRE55U A:l ATION _ _
I I I | |o,g _
0 0. 2 0.4 0.6 0. 8 1.0 1.2 1.4
A (h-1)9
lig. :-). Relative latent hazard indices vs containment filtration
(A1 = 0.1% d-1).
229
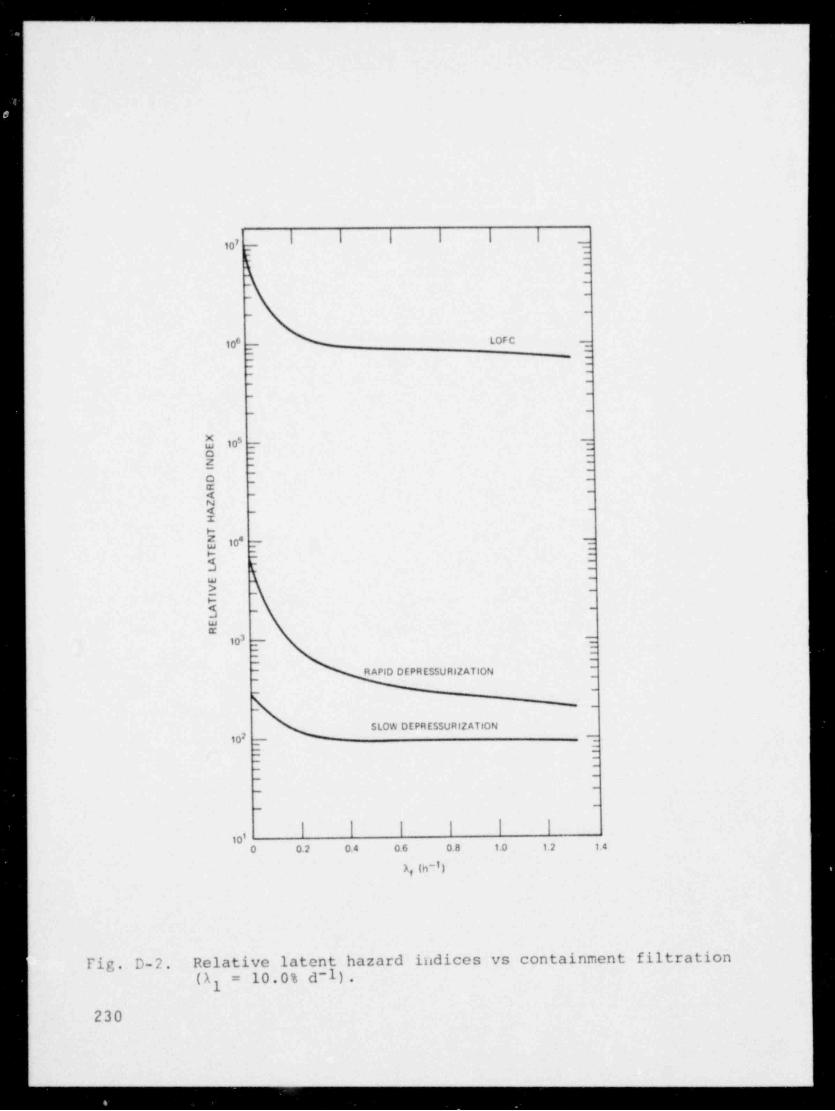
. . . _ . _ . . _ _ _..
710 - T_
-
--
--
--
10 -- LOFC --6
: __
--
-
--
--
--
U 105 -- 7O - EE : -
o-
-
C-
4 -
N-< _
I&
6 10 -- T8
Q-
:J -
w -
2 --
-3 -
-
we
310 -- 3: -
f R APID DEPRESSURl2ATION
_-
___
SLOW OEPRESSURIZATION7
-10 -~~
-:
-_
~_ -
--
_-
I I | I10,
0 0. 2 0.4 0.6 0.8 1.0 1.2 1.4
), (h~l)
Fig. D-2. Relative latent hazard indices vs containment filtration10.0% d-1).(X =
1
230

_ . _ . . . . . . . _ _ _ _ _-
good containment building integrity at all levels of cleanup sys-tem performance. The effectiveness of the containment building canbe seen by comparing the relative latent hazard indices when thecleanup system is failed (A f = 0).
For fixed containment leak rates, comparison of latent hazardindices normalized to the value of the index at the maximum per-formance of the cleanup system shows that, for a given accident,the relative effectiveness of the cleanup system is not significant-ly diminished by containment leakage variations from0.10-10.0% d -1
.
This normalization also shows that, when the cleanup fails, con-tainment leakage has a large affect on the hazard index for LOFCand a small affect on the hazard indices of the rapid and slowdepressurization.
REFERENCES
1. " General Atomic Standard Safety Analysis Report (GASSAR) , "General Atomic Company report GA-A13200 (undated).
2. " Reactor Safety Study. An Assessment of Accident Risks inU.S. Commercial Nuclear Power Plants," U.S. Atomic EnergyCommission report WASH-1400 (NUREG-75/014) (October 1975) .
3. M. H. Schwartz, D. B. Sedgley, and M. M. Mendonca, " SORS:Computer Programs for Analyzing Fission Product Release fromHTGR Cores During Transient Temperature Excursions," GeneralAtomic Company report GA-Al2462 (GA-LTR-10) (April 15, 1974).
4. L. M. Carruthers and C. E. Lee, "LARC-1: A Los Alamos Re-lease Calculation Program for Fission Product Transport inHTGRs During the LOFC Accident," Los Alamos Scientific Lab-oratory report LA-NUREG-6563-MS (November 1976).
5. M. Tokar, " Evaluation of High Temperature Gas Cooled ReactorFuel Particle Coating Failure Models and Data," U.S. NuclearRegulatory Commission report NUREG-Olll (November 1976).
"l316. J. E. Foley, I Release from an HTGR During the LOFC AC-cident," Los Alamos Scientific Laboratory report LA-5893-MS(March 1975).
231
_.

APPENDIX E
CONTENTS
233--- -------- ------I. INTRODUCTION - - - -
II. COMPARISON OF POINT ESTIMATES OF BRANCH PROBABILITIES- 246
252III. COMPARISON OF DATA BASES - - - - - - - - - - - - - - -
253REFERENCES --------------- ---------
TABLES
234E-I. Representative Initiating Events - - - - - - - - - - -
235E-II. AIPA Branch Probabilities ----------- --
237E-III. Washburn Branch Probabilities ---- ---- --
238E-IV. Comparison of Branch Probabilities - - - - - - - - - -
239E-V. Initiating Event Frequencies - - - - - - - - - - - - -
240E-VI. AIPA Component Failure Probabilities - - - - - - - - -
250E-VII. Recirculation Filtration System ------ ----
251E-VIII. Comparison of Median Failure Probabilities - - - - - -
232

. . . . . . . . . . _ _ _
-
APPENDIX E
COMPARISON OF RESULTS AND DATA BASES
I. INTRODUCTION
Following review of the draft of this report, it was requestedthat the following information be included in the final report:
1. quantitative comparison between the failure probabilitiesused in this study and those in the AIPAl study and
2. Comparison of subsystem reliabilities derived in thisstudy with those in the AIPAl study, including ex-planation of any significant differences.
To the extent that the requested information is available in Ref. 1and that the quantitative results are believed to be comparable,the requested information has been included in this appendix. This
study used the data base developed in the Reactor Safety Study.Thus, the requested comparison amounts to comparing the data basein the AIPA study 1 with that in Rer. 2.
The methodology and objectives of this study differ in import-ant respects from those of the AIPA study. The analysis in the
AIPA study began by postulating the 17 specific initiating eventsin Table E-I as being representative of the complete spectrum ofradioactive sources in the plant; each postulated event also wasbelieved to have potentially the highest occurrence probability(high frequency, not large consequence or contribution to risk)for a particular source of radioactivity. The study then tailored
the plant response event sequences to these specific initiatingevents and performed associated risk assessments. Ten of the 17
initiating events considered involve the reactor system. In 9 of
these 10 events, emphasis has been placed on isolation of the faultand cleanup (filtration) in the event sequences even though eightof these events have significant potential for degrading the cap-ability for cooldown of the core, which is believed to be a farmore serious consequence than failure to isolate and cleanup. Instriking contrast to the simple concerns of isolation and cleanup
233
._
. _ _ _ _ _ . .

. _ . _ _ _ _ _ _ _ _ _
TABLE E-I in these analyses, the tenth
REPRESENTATIVE INITIATING EVENTS" event, loss of of f-site power,
addresses in considerable detail
1. Helium instrumentation line the likelihood of system repair,break system restoration, depressuriz-
2. PCRV purge header break ing and pumping primary helium3. Rapid PCRV depressurization to storage, isolation, and clean-4. Slow PCRV depressurization up to mitigate the consequences5. Drop of spent fuel ship- f the event.
ping containerThis study, in contrast,
6. Gas waste surgt tankrupture has not concentrated on specific
7. Loss of off-site power initiating events but has ad-
8. Moisture inleakage into dressed the more important con-Primary coolant cern that given a broad spectrum
9. Reheater tube leak of possible events degrading the10. Rupture of neutron sourc heat removal performance, will11. Main steam pipe ruptur the degraded system function in
outside containment,
a manner that precludes conse-12. Liquid waste tank rupture
quences more severe than those13. Drop of solid waste
container attributable directly to the
14. Drop of irradiated hard- event. For example, does theware container situation possibly progress
15. Drop f recycle fuel from one where only some portion
f the circulating activity16. Safe shutdown earthquake
might have been involved in the17. PCRV structural failure
release as a direct consequence
of the event to one where radio-Ref* 1* nuclides may be released from
possible subsequent sublimation
of the core?
These differences in the concerns addressed by this stuay and
Ref. 1 have resulted in event sequences whose branches are dis-
similar in many cases and thus point estimates of the branch prob-abilities are not strictly or airectly comparable. Point estimates
of the branch probabilities used in Ref. 1 have been complied inTable E-II for six initiating events that may result in radionuclide
234
__ __

. . . . . . . . . - - - - . --
TABLE E-II
AIPA BRANCII PROBABILITIES"
Branch ProbabilitiesMain Loop CACS Containment ContainmentCooling Cooling Isolation Filtra tion
Initiating Event Fails Fails Fails Fails-3 -6Rapid PCRV Depressurization 3 x 10 5 x 10⁻⁴ 4 x 10 1 x 10⁻⁴-3 -6Slow PCRV Depressurization 3 x 10 5 x 10⁻⁴ 4 x 10 1 x 10⁻⁴
Loss of Offsite PowerVol. III" - - - 1 x 10 1 x 10⁻⁴-5
-5with flash tank mode 7 x 10 _ _ _
-5with power runback 5 x 10 _ _ _
-40 - 10 h - 3 x 10 - -
-3,0 - 720 h - 1 x 10 ,
-4Vol. IVa _ 2 x 10 - 8 x 10⁻⁵ 2 x 10⁻³-4
-Fail to start - 2 x 10 -
D0 - 10 h - 6 x 10⁻⁵ _ _
b10 - 100 h - 1 x 10⁻⁴ - -
D100 - 5000 h - 3 x 10⁻⁵ _ ,,
c -5_0 - 10 b - 3 x 10 _
c -0-10 - 5000 b - 2 x 10 -
-4 -5Moisture Ingress 8 x 10 ~0 1 x 10 N.A.
Reheater Tube Leak-5Large - 4 x 10 N.A. N.A.-6Intermediate - < 7 x 10 N.A. N.A.
Small - - N.A. N.A.Earthquake
SSE - - 1 x 10⁻⁵ 1 x 10⁻⁴-40 - 10 h - 5 x 10 - -
-310 - 720 h - 1 x 10 _ _
-4l.0 < a < l.2 - - 1 x 10 -
-4-Fail to start - 2 x 10 -
-4 -I0 - 10 h - 3 x 10 - 8.3 x 10-410 - 100 h - 6 x 10 - 1.9 x 10-
235
--
_ . . . . . .

. . . _ . _ _ . . . . .
TABLE E-II (cont)
-3 -3 d100 - 1000 h - 6 x 10 - 2 x 10⁻² -3 d1000 - 5000 h - 7 x 10 - 2 x 10
-I1.4 < a < l.6 - - 3.7 x 10 -
-3Fail to start - 6 x 10 _ _
-4 -I0 - 10 h - 3 x 10 - 8.3 x 10
-4 -I d10 - 100 h - 6 x 10 - 1.9 x 10⁻³ -3 d
100 - 1000 h - 6 x 10 - 2 x 10⁻³ d
1000 - 5000 h - 7 x 10⁻² - 2 x 10⁻¹
- - - 9.8 x 10
'h f. 1.borturbineonline,hotstandbyfailedbranch.cFor turbine tripped branch.
dFor the CACS " starts" branch.
UFor the CACS " fails to start" branch.
releases from the core. Table E-III shows point est imates of
branch probabilities developed in this study for PCCV depressuriza-tion and LOSP. Point estimates of the branch failure procabilities
for four systcms, main loops, CACS, containment isolation, and con-
tainment filtration, are given in Table E-IV. Table E-V shows the
frequency of initiating events and the probabilities of turbine
trip accompanying LOSP and of LOSP accompanying turbine trip Thedata base used for this study were given in App. A, Tables A-X and
A-XI, and the data base used in the AIPA study are reproduced di-
rectly in Table E-VI. Table E-VIII is a compilation of component
reliabilities from Tables E-VI, A-X, and A-XI to facilitate com-1parison of the AIPA values with those used in this study and in
the Reactor Safety Study.
236
. . . . . . . . . . . . . . . _ . . _ _ - - _. - - - - -

__ . . . . . . . . . . . _ _ - ---
TABLE E-III
WASHBURN BRANCH PROBABILITIES"
Branch ProbabilitiesMain loop CACS Containment ContainmentCooling Cooling Isolation Filtration
Initiating Event Fails Fails Fails Fails
PCRV Depressurization 2 x 10⁻² 1.8 x 10⁻³ 1 x 10⁻⁶ 4 x 10-51.3 x 0-3(b)
Loss of Offsite Power 1.0 4 x 10⁻³(c) 4x10-}(c) 4 x 10'3(c)
Flash tank mode 6 x 10⁻⁴(d) -- -- --
Auxiliary boiler mode 2 x 10⁻²(d)(e) -- -- --
At t = +300 h 5 x 10⁻³(f) 1 x 10⁻⁴(f) ----
With power runback 2 x 10⁻²(g) -- 1 x 10⁻⁶(h) 4 x 10⁻⁵
1.4 x 10⁻⁴(b)
Point values developed in this report.
Probability of containment building leakage through openingsgreater than 50 in.2 area (3.2 x 10⁻² m2),
cPrincipal contribution is the probability of failure of lE acpower.
dAssumes that specific main loop valves fail in place, open orclosed upon loss of ac power and that certain valves necessaryto realign the system operating configuration are operable fromuninterrupted power source.
ePrincipal single contribution is the estimated failure of theauxiliary boiler to start and come one line.
fNo repair allowed.
9 Includes the likelihood of planned runback being aborted by mainturbine trip caused by LOSP event. Principal contributor is thepossible loss of nonessential ac power.
hAllows operator action to close failed valve (s).
237
--
- . . .

---- . . . .
N TABLE E-IVw* COMPARISON OF BRANCH PROBABILITIES
Initiating Branch ProbabilitiesEvent Main Loop Cooling CACS Cooling Containment Isolation Containment Filtration
AIPA Washburn AIPA Washburn AIPA Washburn AIPA Washburn
PCRV 3 x 10 2 x 10 5 x 10 1.8 x 19'3 4 x 10⁻⁶ 1 x 10⁻⁶(a) 1 x 10 4 x 10⁻⁵-3 -2 ~4 -4
Depressurization 1.3 x 10⁻³(b)-3 8 x 10⁻⁵ 4 x 10 (1 x 10-I(d))4 x 10⁻³-3
Loss of Offsite 2 x 10'4(c) 4 x 10Power
Flash Tank 7 x 10⁻⁵ 6 x 10'4
Auxiliary -2Boiler 2 x 10
t = +300h 5 x 10⁻³ 1 x 10'4 1 x 10~4
Runback 2 x 10 * 2 x 10 1 x 10⁻⁶(a) 2 x 10Ne) 4 x 10⁻⁵~ -2
5 x 10⁻⁵ 1.4 x 10'4(b)
_ " Probability of isolation failure assuming that operator may close possible failed valves external to containment.Probability of containment leakage through leakage paths greater than 50 in2 (3.2 x 10⁻² 2m ) area.Failure probability f elieved to be low; component failure data for pumps and fan are a factor of 10 lower thanRSS2 and diesel generator failure probability is 15 times lower than RSS. Using data base in Ref. 2 andAIPAl method and fault tree, this value is S x 10-3, in good agreement with Washburn.Calculated from AIPA analysis; value is predominated by the availability of nonessential ac power.This value is 4 x 10⁻³ using data base in Ref. 2 and AIPA method and fault tree; predominant contributor is acpower availability because AIPA assumed that filtration is not a safety feature and operated system fromnonessential power.
__ _

' e,
. -,
TABLE E-V
INITIATING EVENT FREQUENCIES
I 2Initiating Event AIPA RSS This Study
Loss of offsite power (LOSP) 9.5 x 10⁻² -I(a) 2 x 10 yr-I -Iyr 2 x 10-l -I
yr
1 x 10-I -I(b)yr
Loss of main feedwater --- 3. yr-I 2.6 yr-I,
Station blackout --- 2 x 10⁻³ -I(c) 2 x 10⁻³ -1yr y7
5 x 10-S -I(d) 'yr
Vessel disruptive failure 1 x 10⁻⁷ -I(a) 1 x 10⁻⁷ -I(e)'
yr yr ---
'
-S -I(a)Slow depressurization 3 x 10 yr --- ---
1/2 - 2 in. dia. --- 1 x 10⁻³ -lyp ___
2 - 6 in. dia. 3 x 10⁻⁴ -lyr--- ---
Anticipated transients 5.4 yr-I 10. yr-I ---
Turbine trip accompanyingLOSP 5 x 10⁻³ to 2 x 10-l -I 2 x 10-)yr-)yr
-21 x 10 (1.0 event-I ) (1.0 event-l)(5x10⁻² -I(a))event
(1x10-levent -I(b))LOSP accompanying -2 -1 -2 -
turbine trip --- 1 x 10 yr 1 x 10 yr ](1 x 10-3 event-1) (1 x 10⁻³ event-1)
a Volume III, Ref. 1.D
9 Volume IV, Ref. 1.c Developed from data presented in the section on station blackout during LOCA
in Ref. 2.d Assumes that inrush trips of the diesel generator breakers are independent
events.
Ruptures large enough to be beyond the capability of the ECC systems.
239

TABLE E-VI
AIPA COMPONENT FAILURE PROBABILITIES
(Table Al-3 of Ref. 1)
Data and Sample Results for Event 2
(Leaking Reheater Identified by Automatic Isolation System)
Component Failure Probability Data
Median Value Error Factor
GM tube X(1) 1.1 x 10⁻³ 3
Amp X (2) 1.8 x 10⁻³ 3
Bistable X(3) 3.4 x 10⁻⁴ 3
UPS power supply X(4) 4 x 10⁻⁵ 10
Common mode factor X(5) 3.28 x 10⁻⁴ 3 (S = 10%)
Table E-VI is reproduced from Ref. 1.
240

. - - - . . - - .
TABLE VI (cont)
(Table Al-4 of Ref. 1)
Data for Large Leak Reheater Isolation
Fault Tree Failure ProbabilityDescription Description Upper Median Iower EF Remarks
Ioss of uninter- Z,Z 4 x 10⁻⁴ 4 x 10⁻⁵ 4 x 19-6 10y 6ruptible powersupply
-62/3 bistable fails Z'Z 1 x 10 /h 1 x 10 /h 1 x 10⁻⁷/h 10 Monthly test2 7to signal high interval used
-51/2 trip logic Z'Z 1 x 10 /h 1 x 10⁻⁶/h 1 x 10⁻⁷/h 10 Monthly test3 8failure interval used
b -5 -6Failure of manual Z,2 3.x 10-54 1 x 10 /D 3 x 10 /D 34 9
isolation switch
Operator fails to Z' 1 x 10⁻³ 305 10respond
Valve control sole- Y 1 x 10 M 3 x 10 M 1 x 10 $ 3l,6,ll,16noid fails tooperate
Valve body fails Y 3 x 10⁻⁴/D 1 x 10⁻⁴/D 3 x 10⁻⁵/D 32,7 J2,17to close
-5Valve control module Y 3 x 10⁻⁴/D 1 x 10⁻⁴/D 3 x 10 /D 3' 'I 'Ifails to pass
signal
lIydraulic line Y 3 x 10 M 3 x 10- % 3 x 10 M 104,9,74,ygrupture
ro
$ Accumulator not Y 1x10-% 1 x 10 M 1 x 10 M 10S,10,15,20charged
_ _ _ _ . . . . . .

N, TABLE E-VI (cont)m
Fault Tree Failure Probability
Description Description Upper bkxlian Lower EF_ Pernrks,
ComTon mode factor X 1.2 x 10⁻⁴ 10Oi
bD = denund.

. . . _ . . . _ _ . . .-
TABLE E-VI (cont)
(Table Al-6 of Ref. 1)Data Used for Event 7(Activity Contained in Reheater Steam System)
1/2(Lower
Item gUpperjFault Tree Sample Unavailability ErrorDescription Symbol Symbol Median Value FactorPower supply Z X (1) 4 x 10⁻⁵ 101
Valve solenoid Y X(2) 3 x 10⁻⁴ 31
Valve mechanical Y X(3) 1 x 10⁻⁴ 32
Control module Y X(4) 1 x 10⁻⁴ 33
Hydraulic line Y X(5) 3 x 10 10-8
4
Accumulator Y X(6) 1 x 10 10-6
5
CMFs X & X X (7 ) 1.17 x 10⁻⁴ 10CM CMy 2
Operator action 1 0 X(8) 1 x 10⁻² 51
Operator action 2 0 X(9) 1.5 x 10⁻³ 102
Operator action 3 0 X(10) 4.5 x 10⁻³ 103
243
. _ . . .

_
TABLE E-VI (cont)
(Table A2-3 of Ref. 1)
Failure Data for CACS Startup
CommonFail to Start Uncertainty Moded Uncertainty
Probability Factor for Fraction Factor forX O O
Equipment j j j j
Diesel- - If) 10 0.075 32 x 10generator
Aux. Cire. 3 x 10⁻⁴ 3 0.07 3
Shutoff Valve
Aux. Circ. -4 Ig)Motor and 3 x 10 10 0.04 3
Controls
Circ. Water -4 If}Pump 1 x 10 3 0.04 3
Motor CW -4 IfIPump 1 x 10 3 0.04 3
Air Blast -4 If)Fan 1 x 10 3 0.04 3
Credit for manual restart is considered for each item exceptshutoff valve, since sufficient time is available (20 min.).
See Table 4-3, Vol. II of Ref. 1.
e See BNWL-813, p. 18.
See WASH-1400, App. III, " Failure Data."
244
- _ . _ _ .-- --

- . - . . . . . - . . - - . - . . - - - -__
TABLE E-VI (cont)
(Table A2-7 of Ref. 1) .Input Data for Containment Isolation Failure
Median .
Symbol Description Value9 FactoX Ind. failure of radiation -21
channel 1.5 x 10 3
X CM failure of radiation -32channel 1.5 x 10 10
X Ind. failure of pressure -23channel 1.2 x 10 3
X CM failure of pressure -34channel 1.2 x 10 10
X Ind. failure of isolation -45valve 1.0 x 10 3
X Ind. failure of solenoid _46actuator 3.0 x 10 3
X Ind. failure of output trip -57channel 4 x 10 10
X CM failure of valve, sole-8-5noid and output trip 4 x 10 10
channel
X CM power supply failure 4 x 10⁻⁶ 109
9Median failure probabilities are computed as
BAT; common mode failureI
P=
|(1-S)AT; independent failure
where A is the failure rate, T is the half of the (monthly) periodictest interval, 3 is the common mode failure fraction, taken to beB = 0.10 for all equipment in this analysis.
245
'-
__ .

. . . . . . . _ _ . . _ _ _ _ __
TABLE E-VI (cont)
(Table A2-8 of Ref. 1)
Input Data for Recirculation System Failure
Median UncertaintySymbol Description Value Factor
X Ind. failure of pressure 2 x 10- 31 monitor
X Ind, f ilure f temperature -32 2 x 10 3
monitor
X Ind. failure of recire. fan -
33 5 x 10and motor
X Ind. failure of nonessential -34 1 x 10 3
buss-4
X Ind. failure of filter element 2 x 10 35
-4X CM failure of pressure monitor 1 x 10 10
6
X CM failure of temperatur -47 5 x 10 10
monitor
X " # "# " " " ' *8
X CM failure of nonessential -4g 1 x 10 10
buss
X CM failure of filter element 2 x 10⁻⁵ lo0
II. COMPARISON OF POINT ESTIMATES OF BRANCH PROBABILITIES
Point estimates of the failure probabilities for four systems
have been compared for two initiating events, PCRV depressurizationand LOSP, considered in both the AIPA study and this report.
These estimates are tabulated in Table E-IV. There is generally
good agreement between the two studies. Most of the differences
are not particularly significant and they appear to result fromminor differences (factors of 10) in the component failure rates
(data bases) discussed in the next section. There are, however, a
few significant differences which apparently result from assumed
246
. _ _ _ . . . _ . . . . _ . . . . . . . . . . . . . . . . . . . . . . . . . . . . . . . _ _ _ . . . . _ . . . . . . . _ . . . . _ _ _ _ _ _ _ . _ . _ . _ . _ . _ _ _ _ _ _ _ _ _ _ _ _ _ _ _ _ _ - - -

__ . . . . _ _ _ _ . _ _ . _ _ .
system design details and from major differences in component andsystem failure rates.
In the depressurization accidents, all of the branch pointprobabilities are comparable; however, it should be recognizedthat this study considered containment isolation in much greaterdetail than did the AIPA study and the low probability of failureto isolate is attributable to the assumption that the operator mayclose possible failed valves external to containment. Without thisconsideration, the failure probability would be higher. Whilethe containment isolation features may function, there still existsthe possibility that containment leakage will occur. It is not
known how this was considered in Ref. 1; however, in this report-3a probability of 1.3 x 10 was assigned for leakage through paths
greater than 50 in.2 (3.2 x 10 m) area. This results from the-2 2
fact that there are potential paths in addition to those in whichisolation or blocking features may be installed.
For the LOSP event, differences in five parameters or eventsin three systems are worthy of cc.nment. The study in Ref. 1 be-
lieves that there is small probability of main loop failure andthat there is high probability that the turbine remains online. As
a result, there is high probability of runback and maintaining hotstandby (defined in Ref. 1 as 25% power operation) during the outageof off-site power. This study does not agree with this because:
1. the low probability of turbine trip accompanying LOSPcannot be substantiated due to insufficient detail andlack of reference citation in Ref. 1 to experiencedata on which this conclusion was based and
2. the maintenance of hot standby during the LOSP isdependent on the system establishing the hot standbyconditions followed by the main turbine generatorremaining operational and supplying nonessentialpower.
The expected probability of failing to maintain hot standby, 2x~410 in Ref. 1, was determined only by the probability of no elec-trical power (turbine trip) to run the main loops for a 0.25 hperiod; the probability of mechanical failure of the main loops
247
_ . _ _ _ _
-- --
- . . . . _ - . _ _ . _ _ _ _
during this period is much less and does not contribute significant-
ly. These considerations did not include possible failures of the
system elements to respond to the demands to establish hot standby
conditions, a prerequisite to maintaining these conditions. A
somewhat smaller probability of failure to maintain hot standby,-5
5 x 10 was given in Vol. III of Ref. 1. The results in this,
study, using independent data base and method, indicate a probability-4
of 10 for failing to maintain hot standby over a 0.25 h period,
in good agreement with Ref. 1. Ilowever, this study believes that
the major contributor to failure of the main loop cooling with
LOSP (runback) is the possible failure of the system to establish
the hot standby conditions. Analysis in this study shows the
probability of failure to establish the hot standby operation to be-2about 2 x 10 This is considerably greater than the probability.
of failure to maintain the conditions once they are established.
Differences exist regarding failure to isolate the contain-
ment following LOSP. Several factors are believed to contribute
to this difference. The AIPA study considered the necessity to
isolate only two lines penetrating containment, purge supply and
purge exhaust, to accomplish isolation. In contrast, this study
has considered 61 paths having potential for leakage; however, the
principal contributor to failure leading to leakage is the expected
availability of essential power to perform the isolation functions.
In this study, the containment purge lines, considered to be the
largest lines penetrating the containment, have a failure to iso--5late probability of about 2 x 10 which is comparable to the AIPA
result. The AIPA study used a power supply failure probability of-64 x 10 (10) which is a small contribution to the failure to iso-
late. (With respect to this assumed power supply failure, it is
believed that even the most reliable power sources have a higher
failure probability. For example, a wet cell battery power system,-6 -1with a failure rate of 3 x 10 h and monthly test interval,
-3has a demand failure probability of about 1 x 10 This is con-.
siderably higher than the value used in the AIPA study.) In con-
trast, this study used the essential, 1E, power for the contain-
ment isolation feature and the probability of failure of this power
248
. . _ _ _

_ _ . _ _ . ... ..._. _ _ -
source is about 4 x 10~ with LOSP (two-out-of-three or three-out-of-three buses failed is regarded as failure).
For the LOSP event, differences in the probability of failureof the containment filtration system exist; the values in thisstudy are lower than those in the AIPA study. This study consider-
ed the containment filtration system to be a safety feature andconsequenctly, it is operated from the essential, lE, bus whilethe AIPA study assumed operation from the nonessential ac bus. In
addition, the component failure data used in the AIPA study doesnot agree well with that used in this study (many of the probabil-ities in Ref. 1 are significantly low) and furthermore, in theAIPA study, the failure probability of the pressure monitor systemis 10 times lower and the common mode fraction is 50% lower in thecontainment filtration analysis than in the containment isolationanalysis although it is the same systen exposed to the same environ-ment. No reason has been given for these differences which exceedthe range of the uncertainty factor. It is also noted in the recir-culation system failure analysis (Ref. 1, Table A2-8) that the com-
mon mode failure probability of the temperature monitor is 25% of theindependent failure probability compared to 10% for other instru-mentation used in the AIPA study. Although there are significant
differences between the component demand failure probabilities,,
using values from Ref. 2 in the AIPA method and fault tree resultsin recirculation filtration system failure probabilities that are
less than triple those in the AIPA study. Thus, it is believed
that the differences in the component demand failure probabilities,+
which individually appear to be large, do not significantly affectthe system failure probability. The principal cause of the highprobability of failure of the containment filtration system in theAIPA study is possible common mode failures of the eauipment trains.Consideration of common mode failures increases the overall fail-ure probability, based only on independent failures, by more thanan order of magnitude. If the common mode failure probabilitiesare as high as shown in Table E-VI (Table A2-8 of Ref. 1), it mightbe beneficial to reconsider the system configuration.
249
__
_ _ . _ . .

_ ___ . . _ _
The failure of function probabilities for five alternate
filtration system configurations are presented in Table E-VII.
These alternate systems consider three and two train configurations
of different relative capacities. The point values have been de-
termined from the median values of component and common mode failure
probabilities in Table E-VI. Table E-VII shows that if the trains
are properly sized, a three-train system does not offer significant-
ly greater availability than does a two-train system. The existence
of the third train may be misleading. For example, if one applies
the single failure criteria test to the filtration systems of two
and three trains, both will be acceptable. However, failure analy-
sis shows that when one train is arbitrarily failed in these two
configurations, the failure of function is almost twice as likely
in the three-train system as in the two-train system.
This study has not considered the possibility of failure to
SCRAM. A study of the Fort St. Vrain HTGR SCRAM Protective Sys-
tem found the maximum probability of failure to automatically re--6
lease the SCRAM brake power to be less than 4 x 10 for most of
the accident cases considered. Manual SCRAM and possible opera-
tion of the reserve shutdown system are not included in this prob-
ability. These features will improve the SCRAM success probability.
In this study, it was assumed that the large HTGR design should
TABLE E-VII
RECIRCULATION FILTRATION SYSTEM
Number of Trains. . Failure of Function Probability
MinimumRequired Independent Common Mode
Total for Success Failures Failures Included
-2 -23 3 1.6 x 10 1.6 x 10
-53 2 8.16 x 10 1.0 x 10-
-7 -43 1 1.4 x 10 9.2 x 10
-22 2 1.0 x 10- 1.1 x 10
-5 ~42 1 2.7 x 10 9.5 x 10
250
. - _ _ _ _ _ _ _ _ _ _ _ _ _ - _ _

_ _ . . . . _ _ . . . _ _ _ _ .__
TABLE E-VIII
COMPARISON OF MEDIAN FAILURE PROBABILITIES
Median Failure Probability
Description AIPA RSS
2/3 bistable fails to signal-6 -1 -6 -1high 1 x 10 h 1 x 10 h
1/2 trip logic failure 1 x 10⁻⁶ h-1 1 x 10⁻⁶ h-1Failure of manual isolation
switch 1 x 10⁻⁵ d-1 a 1 x 10⁻⁵ d-lOperator fails to respond 1 x 10⁻³ 1 x 10⁻³Valve control solenoid fails
-4 -I -3 -1to operate 3 x 10 d 1 x 10 d
|Valve body fails to close 1 x 10⁻⁴ d-l 1 x 10⁻⁴ d-lHydraulic line rupture 3 x 10⁻⁸ h-1 3 x 10⁻⁸ h-1Diesel generator 2 x 10⁻³ d-l 2 x 10⁻² d-lAuxiliary circulator shutoff
-4 -1valve 3 x 10 d 3 x 10~4 d'1Auxiliary circulator motor
-4 -1 -4 -1and controls 3 x 10 d 3 x 10 d
Circulating water pump 1 x 10⁻⁴ d'l 1 x 10⁻³ d-1
Motor CW pump 1 x 10⁻⁴ d-l 1 x 10⁻³ d-lAir blast fan 1 x 10⁻⁴ d-l 1 x 10⁻³ d-lRadiation channel 1.5 x 10⁻² d-1 b ___
,
Pressure channel:
(Table A2-7, Ref. 1) 1.2 x 10- d-l b ___
' - (Table A2-8, Ref. 1) 2 x 10⁻¹ d-l ---
Isolation valve 1 x 10⁻⁴ d-l b ---
Temperature channel 2 x 10⁻³ d-l ---
Recirculation fan and motor 5 x 10⁻³ d-l 3 x 10⁻⁴ d-l
251
_ . .

. . _._ _ _ _ _ _._ _ _
TABLE E-VIII (cont)
Fail nonessential bus
Independent failures 1 x 10~ ---
Dependent failures 1 x 10⁻⁴ c ___
-4Filter element 2 x 10 ---
ad = demand.
bFailure probability of typical instrumentation channel should beapproximately 1 x 10⁻² d-1 This is based on failure rate 2 of3 x 10-5 h-1, monthly periodic test interval and a common modefailure fraction of 0.10.
Independent failure is about the right order of magnitude; depend-ent value, however, is very low unless it is restricted to meanonly common mode hardware failures. As used in the AIPAl analysis,turbine trip would fail the nonessential bus and the probability of |turbine trip in this particular sequence is 1 x 10⁻¹ (see p. A2-2, |
Ref. 1).
have similar SCRAM reliability and that the small magnitude of
this failure probability makes failure to SCRAM of lesser interest
than the events that were considered. Thus, consideration of events
accompanied by failure to SCRAM was deferred for later investiga-
tion. The AIPA study produced median point estimates of 1 x 10~for failure to trip the reactor. The RSS used a median failure
probability of 3.6 x 10~ for failure of the PWR reactor protection
system to trip the control rods and terminate core power and a-6value of 1.3 x 10 for failure to achieve shutdown in the BWR.
III. COMPARISON OF DATA BASES
Table E-V shows frequencies of initiating events used in Ref.
1, Ref. 2, and this report. For the most part, magnitudes are com-
parable. However, the differences in opinion about turbine trip
accompanying LOSP are significant because of the strong dependence
on electrical power for successful cooldown. These differences are
252
.. . . _ . . . . _ _ . _ _ . _ _ _ _ _ _
__________
not resolved by this report. In addition, an important related
concern, the possiole loss of off-site power accompanying turbine
trip, has not been addressed in Ref. 1. Values for vessel dis-
ruptive failure are shown for information only as there are no
valid reasons to compare them. Data for LWR leaks (small LOCAs)are also shown only for information.
Table E-VIII is a compilation of component reliabilities from
Tables E-VI, A-X, and A-XI to facilitate comparison of the AIPA
data base with that used in this study and in the Reactor SafetyStudy.2 There is reasonably good agree'' at between these data
bases except for diesel generator, pumps, and fans which are some-
what more reliable in Ref. 1.Neither this study nor the AIPA study considered the potential
for rapid oxidation of the graphite during the PCRV depressurization
events. Rapid oxidation could occur when air enters the reactor
coolant system. There are no features in the design to prevent
this and the ability to remove heat from the core is limited by
the auxiliary circulator flow capacity and the system heat transfer
rates. Significantly greater consequences than shown in this studyare expected to result from rapid oxidation of the core. This
possibility should be considered if it cannot be demonstrated that
air will not enter the primary coolant system.
The very rapid ingress of large cuantities of water into the
core and the potential for explosions inside the PCRV should also
be analyzed in detail unless it can be demonstrated that these can-
not occur.
REFERENCES
1. "HTGR Accident Initiation and Progression Analysis Status Re-port," General Atomic Company report GA-A-13617 (January 1976) .Prepared under contract E(04-3)167, Project Agreement No. 51,for the San Francisco Operations Office US ERDA.
2. " Reactor Safety Study. An Assessment of Accident Risks in U.S.Commercial Nuclear Power Plants," US Nuclear Regulatory Commis-sion report NASH-1400 (NUREG-75/014) (October 1975).
253
-
_

. . . . . . . . . . _ . _ . _ __ _ .
3. N. J. Becar, G. B. Curtis, D. E. Wood, " Reliability Analysisof an HTGR SCRAM System Includ ng Human Interfaces," KamanSciences Corporation report KSC-1037-1 (March 1975).
I.
O
254

_ . . . . . . . - - - . - . - --
DISTRIBUTION
CopiesNuclear Regulatory Commission, R-8, Bethesda, Maryland 260Technical Information Center, Oak Ridge, Tennessee 2
Los Alamos Scientific Laboratory, Los Alamos, New Mexico 50
312
255
' U S. Government Prent.ng Of f me 1979 - 677-115/259:
---
__

i 1
-- - ..-_ _ _
Avedsbw feem Avenisbar fromL1 Nuteer Regelsios, Commenen ketenal Ten hem 31 laformaese Serest
tashington. (K 20315 SprogrerW. W4 !!I61
kWmhe 11.00
00t 423 4.00 126 150 7.25 258 275 10.75 176 400 I)AO $01-525 85.25026450 4.2 151-171 840 276 100 II A0 401 4 25 83.25 $ 26-550 15.50OSt47S 5.25 176 200 9A0 301 325 11.75 426490 14 A0 551 $75 46.2504100 6Ao 208 223 9.25 326 310 12 Ap 451 475 14.50 $ 76400 16.50101-12S 6.50 226 250 9.50 351 375 12.30 476 S00 15A0 tol e,
Nose A4412.$0 for east addamnes 10 Sense seswment from tot paes op.
^
. - _ . .
Copyright © 2022 FDOKUMEN