Hydrological data UK 1984 - CORE
196
l ii Hydrological data UK 1984 YEARBOOK I N S T I T U T E O F H Y D R O L O G Y • B R I T I S H G E O L O G I C A L S U R V E Y
-
Upload
khangminh22 -
Category
Documents
-
view
4 -
download
0
Transcript of Hydrological data UK 1984 - CORE

li i
Hydrologicaldata UK
1984YEARBOOK
I N S T I T U T E O F H Y D R O L O G Y • B R I T I S H G E O L O G I C A L S U R V E Y

á

HYDR OL OGICA L DA TAUNITED KIN GD OM
19 84
YEA RB OOK

á

HYDROLOGICAL DA TAUNITED KIN GD OM
19 8 4YEA RB OOK
An account ofrainfall, river fl ows and groundwater levels
January to December 1984
Institute of Hydrology British Geological Survey

6 . 1986 Natural Environment Research Council
Cover:
Published by the Institu te of Hydrology,Wallingford , Oxon OX IO 8BB.
ISBN 0 948540 06 0
A note for buyers of the loose-leaf version:-
So that this version can stand alone as a separate volume it has been necessary to repeat much of thebackground information which has already appeared in the 198 1, 1982 and 1983 volumes. Readers maywish to save space in the binder by discard ing some of the repe ated pages e.g. 163 to 177.
Dr illing at a site for appraisal of local groundwater sources in the Permian sandstone aquifer in the CreditonT rough, Devon, during 1984.
Photograph: Cliff Tubb

H Y D R O L O G I C A L D A T A : 19 8 4
FOREW ORD
In Apr il 1982, care of the United Kingdom nat ional archive of sur facewater data passed from the Department of the Environment's WaterData Unit (which was disbanded) to the Institu te of Hydrology ( IH ) .In a similar move, the Institute of Geological Sciences, subsequentlyrenamed the Brit ish Geological Survey (BGS), took over the nationalgroundwater ar chive. Both 1H and BGS are component bodies of theNatural Environment Research Council ( N ERC) . T he BGS hydro-geologists are located with IH at Wallingford and close cooperat ionbetween the two groups has led, among other things, to the decision topublish a single ser ies of yearbooks and repor ts dealing withnat ionally archived sur face and groundwater data and the use made ofthem. T he work is overseen by a steering commit tee with representa-tives of Government departments and the water industry fromEngland, Wales, Scotland and Northern Ireland .
T he published series - Hydrological data: UK - inclu des an annualyearbook and, every fi ve years, a catalogue of river fl ow gaugingstat ions and groundwater level recording sites together with statisticalsummar ies. T hese six volumes of the 5-year cycle will be availableindividually but are also designed to be inserted in a ring binder.Further details of these arrangements are given on page 180.
T he ser ies - but not the binder - also includes occasional reportsdealing with signifi cant hydrological events and analyses. T he fi rst ofthese reports provides a review of the 1984 drought .
I .S.G. McCullochDirector, Institute of Hy drolog y

-,
97 1 ;t- Lr,,,‘ ( 96, .
r " f - / ‘ .-, 95r•-.,
t1 ‘. 3
106 .,̂ 1.' , f) ' 'c....
' - - ) c\ )(clk
i.: A ) '-j ) 1 ) \ -../-,
,i r't iGi Nir-rw :6'.- ir riV ,-/ 7,11 \‘• --- -1
10 i [t., ,-, --_->93
8 110
/105 \- -"C)//
S) c—1
0 7- 12C__1
91n„ ,/--) 92 mi-r_ _ D / / / 13
15 (117 ' r \ - „,-- / 7 ' T AY R P B - -
16) '-- -HI-- i ' 1 .--- .4-4
..--),.. <Pc ' 18 "----:,
17104 ( 7 / 0/7/ 91 1'3: 85 Ci r fi lP
E.r - A.,U as \ \ r\ ' I - -a 19 20
/ ,,/ -7 2 C\ ?f ( ' Mk L. CLY D P R l ' B , 21
I( )4. [Il 'C -
,
83 PITT ED R P B1 ' ( c
{TT) \ , ,- -- -# ) 82 79 78 227 /- 204 ) i77
-202 A II30 - ' A Y Is I' FP , N OT PT A UNI Gh THIS t.',/ A
„ T Y .1L‘ 1 \TI 81 BO (------- , 23
i \C-, _ , ( - .... pt 201 . \
pt 203 C,.„....,„ \ \ 76 247r- 5
„ f ' -Pc- . NoW nrq RE I A N 2 0 5 c:: \ ): /,...3 .f. 25(..._6131, 235 .. pt 236 -V \ \ \ 74
73
1/ ,f \ #0,
1 103 ., / cor.
(._,/ \ /
pt226 •pt 206 ...
I
( \ \102 66
/ 65
64
63
1'jOP:11115 ; T2
69
6768
28
SEV ERN - T RENT W.A .
54
Y OR KSH I R E W. A .
27
- Wate r A ut ho rit y or River
Pur ificat ion Board bo u nd ary
Hyd ro met r ic a rea num b erand bou ndary
31
32
26 c
A NGL IA N T/ A
33,- ' 3562 55 36
i - ---- ,60
C 61 ' _,)38
IC 1---- Th-- - -.59 f-', . ...-)
: 39C.I r- ,- - , . ."
, ,- - 1 T HAM E S R 1. A .
51 -- , : _ ; '7.1--," 40
`7.. , 52 ' ' • - OUTH ERN W.A.,. 43
50 41 .---SR I.4 T H Hj _PT 4 5
: 44, 47 .-- -
46 1 \ i - Th.---11 0149 ,-;.1-' --,/ ft R I.1 \
34

H Y D R O L O G IC A L D A T A : 1984
CON TEN TS
Page
INT RODUCT ION
SCOPE AN D SOU RCES OF IN FORMAT ION 2
REVIEW OF T HE WEAT HER in relation to the hydrological cycle 3
REVIEW OF RUNOFF 13
REVIEW OF GROUNDWAT ER 27
RIVER FLOW DATA 37Computation and accuracy of gauged fl ows 37Scope of fl ow data tabulat ions 37Gauging station location map 42Daily fl ow tables 44Monthly fl ow tables 96
T HE SURFACE WAT ER DAT A RET RIEVAL SERVICE 137List of surface water ret rieval options 137Concise register of gauging stations 147Summary of archived dat a 153
GROUN DWAT ER LEVEL MEASUREM EN T 163Background 163T he observation borehole network 163Index borehole location map 165Register of selected groundwater observation wells 168
T HE GROUNDWAT ER RET RIEVAL SERVIC EList of groundwater ret rieval options
DIRECT ORY OF MEASURING AUT HORIT IES
PUBLICAT IONS
173173
178
180

á

T his volume is the fourth Yearbook published in theHydrological data: UK series .
Apart from summary informat ion, sur face waterand groundwater data on a nati onal basis werepublished separa tely prior to the int roduction of theHydrological data: UK series. In common with the198 1, 82 and 83 editions, the 1984 Yearbook bringstogether the principal data se ts relating to river flow,groundwater levels and rainfall throughout theUnited Kingdom. A description is also given of thesurface water and groundwater ar chiires togetherwith the data ret rieval facilities which complementthis volume.
Publication of river flow data for Great Britainstarted with the series of Sur face Water Yearbooks.T he fi rst edition, which was published in 1938 forthe water year (October- September) 1935- 36 alsoincluded selected data for the previous fi fteen years;the edition for 1936- 1937 followed in 1939. Boththese publications were prepared under the directionof the Inland Water Sur vey Committee which wasfounded in 1935. Assisted by the Scott ish Offi ce, theCommittee continued to publish hydrological dataafter the war , the Yearbook for the period 1937- 1945being published as a single volume in 1952.
Due to economic str ingency , the Sur vey wassuspended in 1952 for a per iod of two years but wasthen reformed as the Sur face Water Sur vey Centreof Great Britain. A Yearbook covering the years1945- 1953 was published in 1955.
In 1964 the Sur vey was transfer red to the WaterResources Board where it remained until 1974 whenthe work of collecting and publishing surface waterinformation in England and Wales was again tran s-ferred, this time to the Water Data Unit of theDepartment of the Environment. Yearbooks werepublished joint ly each year by these organisat ionsand the Scot tish Offi ce for the water years 1953- 54to 1965- 1966, but thereafter information for the fi vecalendar years 1966 to 1970 was published in onevolume in 1974. Following editions were ren amed'Surface Water : United Kingdom' to mark theinclusion of the fi rst records from Northern Ire landand in recognit ion of the move away from single yearvolumes. T wo volumes of Sur face Water : UnitedKingdom, covering the years 1971- 73 and 1974- 76were published jointly by the Water Data Unit , theScot tish Development Depar tment and the Depart-ment of the Environment for Northern Ireland.
Following the transfer of the surface water archive
I NTRODUCTI ON
to the Natural Environment Research Council in1982, the fi nal edition of Surface Water : UnitedKingdom, for the years 1977- 80 , was prepared bythe Institute of Hydrology at the request of theWater Directorate of the Department of the Envi-ronment, and publi shed in 1983.
T he 198 1 and 1982 Yearbooks were preparedconcurrently and were the fi rst Yearbooks publishedby the Natural Environment Research Council. T hispresent volume, prepared and published concur-ren tly with the 1983 edition, rep resents the twenty-fi fth edition in the series of surface water publica-tions which began with the 1935- 36 Sur face WaterYearbook. As a result of the incorporation ofgroundwater data in the Yearbook, this volume isalso the ninth edition in the series of groundwaterdata publicat ions which began with the 1964- 66Groundwater Yearbook.
A compilation of 'Groundwater levels in Englandduring 1963' which was produced by the GeologicalSur vey of Great Britain prior to its incorporationinto the Institu te of Geological Sciences, was theprecursor to the publication of groundwater leveldata on a national basis. T he more formalGroundwater Yearbook series was inst igated by theWater Resources Board which published the inaugu -ral ed ition, and a further volume for 1967, bothcover ing England and Wales. In 1975 a thirdYearbook , for 1968- 70, was published by the WaterData Unit. T he Groundwater : United Kingdomseries was int roduced in 1978 with the product ion ofthe 1971- 73 volume, also published by the WaterData Unit.
Following the tran sfer of the groundwater archiveto the Institu te of Geological Sciences (now theBrit ish Geological Sur vey) , the second edition ofGroundwater : United Kingdom, covering the period1974- 80, was prepared by the Institu te of Hydrologyat the req uest of the Water Directorate of theDepartmen t of the Environment .
T he 1984 Yearbook may be seen as part of theUnited Kingdom's contribut ion to UN ESCO's In -t er nat ional Hydrological Programme in continu ingthe exchange of hydrological information begun in1965 for the In ternational Hydrological Decade.
T he Natural Environment Research Council ac-knowledge and extend their appreciat ion to all whohave assisted in the collection of information for thispublicat ion.

S COPE A ND S OURCES OF INFORMA TION
T he format of the yearbooks in the Hydrological data :
U K series differs substantially from that of previous
yearbooks. A greater var iety of hydrological informa-
tion is provided and emphasis is placed upon ready
access to basic dat a both within the yearbook and
through the complementary data retrieval facilit ies.
T he content s have been abstracted primarily
from the surface water and groundwater archives.
Responsibility for the collect ion and init ial process-
ing of the data rest s mainly with the ten Water
Authorities in England and Wales , the seven River
Purifi cation Boards in Scot land and the Depar tment
of the Environment (N I) in Northern Ireland.
Add itional material has been provided by the
Greater London Council ( now abolished ), the De-
part ment of Agricultu re in Northern Ire land and by
research bodies and public undertakings. T he major-
ity of the rainfall data, and much of the material
incorporated in the review of the weather , has been
provided by the Meteorological Offi ce. For histor ical
comparisons of the rainfall over England and Wales
a data set based upon the homogeneous se ries
derived by the Climatic Research Unit of the
University of East Anglia has been used .
Most of the rainfall data published in the
Hydrological data: UK series ar e in the form of
monthly rainfall totals for catchment areas (see page
38) : • For • details of monthly and annual rainfalls
Rainfall and Cl imatological D ata
T he Meteorological Offi ce maintains the nat ional
archives of rainfall and climatological data at its
headquart ers at Bracknell. Specifi c items, such as
daily and hour ly rainfalls from gauges and radar
( from the PARAGON system) may be obtained by
applicat ion to the Advisory Services Branch Met 0
3. Summaries of the data are also published regu larly
and a list of cu rrent tit les is given below:
I . M onthly and A nn ual Totals of RAIN FALL 19_
f or the United K ingdom.T his contains the values for some 5000 rain-gauges and is available one year aft er the tit le
year at a cost of £ 6.00.
2. Snow Survey of Great Brita in 19_ 1_T his contains the daily and monthly reports ofsnow conditions from selected stations coveringthe winter and costs £ 3.00.
3. Monthly Weather ReportT his is published monthly and contains climato-logical means for more than 550 UK observing
associated with individual raingauge sites reference
should be made to the ' RAIN FALL' series published
regularly by the Meteorological Offi ce. Brief det ails
of the contents and avai lability of this publicat ion,
together with a short descript ion of other rainfall and
climatological data sets published by the Meteorolo-
gical Offi ce, ar e given below.Some slight variat ions from the contributors'
fi gures may occur; these may be due to different
methods of computation or to the need for uniformity
in presentat ion. Certain rainfall and river fl ow data
may diff er slightly from that published previously in
the rep ort on the 1984 drought ( see page 180). A
portion of the data presen ted in that publi cation was
of a provisional nature; where corresponding data se ts
have been included in this yearbook they should be
regarded as the more accurate.T he practice of publishing river water tempera-
ture data, followed in Surface Water : United
Kingdom publicat ions, and ear lier yearbooks, has
been discontinued. Monitoring of water quality,
including temperature, is the responsibility of water
authorities and river purifi cat ion boards. Some
temperature data are held by the Depar tment of the
Environment in association with the Harmonised
Monitoring Scheme (contact WQ5, Room A4.26,
Romney House, 43 M arsham Street , London, SW1P
3PY, tel. 0 1-212-6902) .
stations; in addition, an int roduction and annualsummary are produced year ly. T he publicationshould be available 6 to 9 months after themonth concerned; it costs around £ 2 and is onlyavailable from Her Majesty's Stationery Offi ce( HM SO) or their stockists .
4. M.O.R.E.C.S.T his is a weekly issue of maps of evaporation
and soil moistu re defi cit and the weather vari-ables Used to calculate them . T he dat a are usedto provide values for 40 km squares shown inmap form and the publication consists ofdifferent sets of maps according to customer
requ irements.
Further information about these and other publica-
t ions may be obtained from:Meteorological Offi ce Met 0 3London RoadBracknellBe rks RG 12 2SZ

Summary
Tbe 1984 rainfall tot al for the Unit ed Kingdom was1105 mm. T his is ver y close to the 194 1- 70 averageand Figure I serves to show that most regionsregistered 1984 rainfall totals within ten per cent ofthe mean although iso lated distr icts, notably in theLake Distr ict and to the sout h of Snowdonia,recorded less than 80 per cent of normal rainfall.Rainfall tot als greater than 120 per cent of averagewere recorded in a few ver y restr icted areas,throughout East Anglia and , more widely, in theeastern lowlands of Scotland north of the Fir th ofT ay. In absolute terms, the spatial variat ion inrain fall amounts was also somewhat more subduedthan normal ( Figure 2) . T he maximum recordedannual rain fall tot al for 1984 was 3754 mm atLlyndaw Mine in Snowdonia; this compares with aminimum of 50 1 nun registered for Foulness inEssex.
In contrast to the annual totals the distribution ofrainfall within the year was ver y uncharacteristic.T he tendency, in recent year s, for the contrastbetween winter and summer rainfall totals to beaccentuated at tained an extreme expression in 1984.Following a wet Januar y, a drought developed in thewest of England and Wales and, by April, had spreadto Nor thern Ireland and much of Scotland. T hedrought was broken in late August and Septemberand some notably high autumn rainfall tota ls wererecorded par ticularly in Scotland. T able 1 provides abreakdown of monthly rainfall in 1984 both on acountrywide basis and according to the majoradministr ative divisions within the water industr y(see frontispiece) .
For much of 1984, condit ions were conducive tohigh potential evaporation (PE) rat es throughou tthe United Kingdom. Annual potent ial evaporat ion
REVIEW OF THE W EA THER aimIN RELA TION TO THE HYDR OLOGICA L CYCLE
tot als were above average in all regions (Figure 3)with the greatest .depar ture from normal in the westand the north. T he rap id build-up of soil moisturedefi cits (SM Ds)in the spring and summer resulted inthe greater part of incident rain fall during th is periodbeing utilised to satisfy, or partially sat isfy, estab-lished defi cits. Consequently actual evaporat ion(AE) rates were substant ially lower than the corre-sponding potential values. In the T ay basin, theGlasgow area and in Dumfrieshire, PE exceeded AEby more than 100 mm ; a more typical fi gure wouldbe 40 mm in an average year . Diff erences greaterthan 100 mm were also common throughout much ofEngland especially in central and southern districts.In these regions, however, , AE values may beexpected to be considerably less than the PE valueseven in a normal year - a consequence of therelatively low rainfall and dry soil conditions whichcauses plants to be unable to capture enough water tomeet the atmospheric demand.
T he variation in soil moisture throughout theyear par alleled the regional diff erences in rainfalldefi cits as the drought developed although the effectof the very dry April par ticular ly was to produceseasonally high SMDs throughout the United King-dom. T he most notable, relative to normal condi- .tions, occu rred in the northern and western regionsof Great Britain. At Renfrew in Scotland, forinstance, the magnitude of the soil moisture defi citsover the March to October period were unpreceden-ted in a twenty-five year record . In the drier Englishlowlands SM Ds were generally well above averagethroughou t the drought and at some locations, forexample Wittering in Northamptonshir e, remainedso well into November.

4 H Y D R O L O G I C A L D A T A : 1 9 8 4
a
Figu re 1. 1984 A nnual rainf all as a po centage of the 1941- 70 av erage.
11 .
(%)
Above 120
110-120
1 00- 11 0
90- 100
Below 90

(w
009 molefl
008-009
0001-008
00v L -000
000? 00v L
008?-000Z
008? aAoqv
ct>
"fr861 •1(?llafupn lanutcv .z atn8:14
113HIF HA\HI 30 _11E1AR 3

H Y D R O L O G I C A L D A T A : 1 9 8 4
TABLE 1 1984 RAINFALL IN M M AND AS A PER CENT AG E O F TH E 1941-70 AVE RA G E
SI A M J I A S O N D YEAR
United mm 172 78 74 28 46 51 37 56 131 138 172 110 1093
Kingdom % 167 100 150 41 61 70 42 54 128 130 155 97 100
Ength nd and nun 144 57 59 II 59 43 27 57 116 100 145 80 898
Wales % 167 88 100 19 88 71 37 63 140 121 149 89 98
Scodand nmm 223 III 103 60 24 66 55 50 166 216 234 165 1473
% 163 107 112 67 26 72 49 39 121 145 165 106 103
Non hern mm 180 111 72 30 22 57 49 71 104 112 112 115 1035
hl dand % 173 148 103 44 30 72 53 69 97 105 110 101 95
N on h We st nnm 176 73 57 19 30 73 30 72 168 154 190 103 1145
Wate r % 157 90 79 25 37 88 29 58 137 131 157 86 94
N orthumbn an mm 123 47 85 14 26 56 30 58 110 71 178 49 847
Wa ter % 154 71 163 25 41 92 39 57 139 95 189 65 96
Severn T rent mm . 108 54 54 8 58 44 20 67 100 69 127 55 764
Water % 157 102 104 14 91 79 31 83 149 106 161 79 99
Vorksh Me ' nmm 143
,
52 69 13 44 43 18 61 118 84 134 48 827
Wate r % 186 81 130 23 72 74 26 68 164 122 151 65 99
Anglian a im 84 38 48 13 70 45 21 47 88 49 79 42 624
Wamr % 161 90 120 33 149 92 37 73 169 94 127 79 102
T hames ntm 104 39 63 5 81 36 19 39 93 77 106 64 726
Wamr % 168 83 137 II 145 69 32 56 150 120 145 97 103
Southern nnm 142 38 79 5 78 27 37 27 69 III 116 105 834.
Wamr % 187 67 152 10 142 54 63 37 97 142 123 130 105
Wessex mm 162 51 55 3 78 28 24 46 97 88 142 94 868
Wa mr •% 193 86 95 6 115 52 45 56 123 107 146 104 100
Sou th Wem mm 242 90 64 8 65 19 42 67 134 138 209 122 1200
Wamr % 188 100 76 II 77 29 50 66 129 122 156 90 101
We lsh num 213 88 50 12 53 45 30 74 171 178 215 153 1282
Water % 157 92 57 14 58 55 32 62 137 138 150 105 96
H ighlan d mm 235 130 103 102 24 73 61 57 200 262 219 215 1681
% 143 98 90 89 23 66 48 39 127 141 130 110 98
North Ea st mm 155 67 120 23 22 49 58 31 139 126 238 107 1135
R.P.B. % 170 91 193 38 31 70 63 29 160 130 231 105
' r ay nmm 214 103 135 28 30 50 39 25 140 173 288 134 1359
R.P.B. % 181 112 165 37 32 60 38 21 122 142 242 100 108
Forth nint 177 85 98 29 34 61 30 34 122 165 232 113 1180
R.P.I3 % 179 110 142 - 43 40 81 31 29 113 156 215 104 106
Clyde mm 269 138 88 64 18 78 61 70 189 276 244 197 1692
'U .S. % 167 122 84 62 19 76 47 49 108 151 146 106 102
T weed nnm 159 60 107 16 25 64 40 37 88 97 219 75 987
R.P.I3 % 1 71 87 184 26 33 94 45 32 95 110 211 83 98
Solway mm 235 116 69 37 18 64 37 58 141 218 212 153 1358
•R.P.13 % 168 125 76 42 20 71 34 45 93 151 146 101 95
Weste rn Isles inm 195 95 79 85 24 56 61 49 149 218 153 148 1312
Orkney and % 143 92 86 102 35 72 73 52 118 148 104 97 101
Shet land

R E V I E W O F T H E W E AT H E R
.90,2Of.! .
76, 6 51:
Figure 3. Potential evaporation in 1984— in m ni and as ap ercentage of the long term av erage.
T AB LE 2 LOWE ST R E COR D ED RA I NFALL T OTALS : FE B- AUG AN D AP R- AUG
T he 1984 D r ough t
Apar t from a few localities in t he south and east ofEngland, rainfall in the p eriod from February toAugu st was signifi cantly below average thr oughoutthe United K ingdom . Most of Wales and much ofScotland had appreciably less than 60 per cent ofnormal rainfall. Over the seven months starting inFebruary 1984 the United Kinadom drought rankssecond in severity to 1976 (T able 2) and issignifi cant ly drier than the same period in thedroughts of 1921 and 1955. T he drought was evenmore marked over the fi ve months start ing in Apr il(F igure 4) ; rainfall over the United Kingdom duringthis period was less than 60 per cent of average.T heaccumulated rainfall total for the fi ve months fromApr il 1984 is 207 millimetres. T able 2 confi rms thatthis represent s the driest April to August period overthe United Kingdom this century, approached onlyby 1976.
T he drought 's severit y in Scotland and Wales canbe broadly assessed by examination of Figure 4; lessthan half the average rainfall was experienced overthe larger par t of both countr ies between April andAugust , and some dist ricts had less than one third.Average rain fall fi gures for Scotland are availableback to 1869 and the fi ve months commencing Apr il1984 are, again , the driest on record with a moresevere rainfall defi cit than the notable drought of1955. A somewhat short er rainfall series exist s for
U N IT ED K I N G DO MD at a Series 190 0- 198 4
Feb - Aug Ap r- AugYear Ra infa ll Year Rai n fall
( m in) (m m)RAN K Yea r
EN G LAN D AN D W AL ESData Se ries 1766- 1984
b- Aug Ap r- AugRa in fall Year Rain fall( Inm ) ( m m)
1976 356 1984 2 18 1 1976 249 19 76 139198 4 370 1976 222 2 188 7 27 7 18 70 192192 1 38 8 192 1 275 3 192 1 282 182 6 1921955 40 6 1955 281 4 1870 3 10 1984 197192 9 4 14 1933 29 8 5 1984 313 188 7 20 31975 4 17 19 11 29 8 6 1785 3 17 186 4 2101959 4 17 19 19 30 1 7 1929 32 3 192 1 2 131944 432 1975 306 8 1959 33 3 1844 2 131949 435 1949 310 9 1854 335 1896 22819 11 44 3 19 13 3 10 10 194 9 337 19 11 234
534 379 Ave rage 477 352
SC OT LAN DDat a Se ries 1869- 198 4
F eb- Aug Ap r- AugYear Ra in fal l Year Rainf al l
( mm ) ( mm )RA N K
N O RT H ERN IRE L AN DData Se ries 1900 - 1984
Feb - Au g Apr- AugYea r Rain fa ll Yea r Rain fall
( rum ) ( m m)195 5 42 2 1984 25 5 1 1975 326 198 4 2291887 46 3 1955 28 0 2 1976 404 197 5 2381984 469 1869 280 3 1984 4 12 1983 2501870 470 1870 312 4 198 3 4 13 1978 26 81869 48 8 1887 323 5 195 2 4 16 1976 27 21878 508 1976 332 6 1939 422 1977 30019 19 517 1880 35 1 7 19 19 429 19 19 3041875 5 17 19 13 35 3 8 19 11 440 19 11 3061936 5 18 19 15 356 9 192 1 44 7 1959 3111975 519 1885 356 10 1968 44 9 1949 312
64 1 44 6 Aver age 538 389

8
0Op
o
70
H Y D R O L O G I C A L D A T A 1 9 8 4
Figure 4. Ap ril ta A ugust raitzf all 1984 as a percentage of the 1941- 70 average.
d°
10 80
Below 30
30- 40
40- 50
50- 60
60- 90
Above 90
to
(%)
to
S o urce : Me teoro logical Of fice

R E V I E W O F T H E W E A T H E R9
Northern Irelan d but the April to August rain fall ,totall ing only 199 mm, clear ly conforms to thegeneral pattern being marginally drier than 1975which was the previous driest such sequence thiscentury.
T aken in isolation these rainfall fi gures providecompelling evidence for a very severe drought . T hisis emphasised by Figure 5 which suggests that suchan exceptionally dry late spring and summer mightbe expect ed only once every 200 years or more. Sucha frequency estimate, particularly of this magnitude,should be t reated with caut ion since it assumes asensibly stable climate and is based upon therelatively short United Kingdom rainfall series.
T he most noticable feat ure of the drought was itsgreater severity in those upland regions normall yassociated with higher, and more reliable, rain fall.Such areas are comm only exploited within waterresources systems designed to augment supp lies inthe dr ier regions of the count ry. As a consequence,the potent ial scale of the drought 's effect was large.Cer tainly the drought 's im pact was considerable insome areas bu t, generally, was more limited than theprolonged drought of 1975/ 76. Primarily, thisrefl ects the relat ively short du ration of the 1984drought . However, the lessons learn t in 1976, alliedto the increasing integration of water resourcessystems, undoubtedly had a mit igating effect .
A general categorisat ion of the drought asembracing the spring and summer, which is reason-able for the United Kingdom as a whole, tends tomask important regional differences in theth ought 's durat ion . Broadly speaking the droughtbegan in February and M arch in the Welsh, theNorth West and the Sout h West Water Authorityareas. It had extended to the N orthumb rian , York-shire , Severn T rent and Wessex Water Authorit iesby April when th e drought also developed inScotland and Northern Ireland. M ay was relativelywet in the south and east of England and, as aresult , rainfall defi ciencies in the Anglian , T hamesand Southern Water Authorit ies were largely con-fi ned to the summer months.
Generally, examinat ions of drought intensityare, quite properly, conducted in terms of thedeparture from average rainfall conditions. It isint eresting though to consider th e absolute rainfallamou nts during a period of substantial rainfalldefi ciency. T hroughout the spring and summer of1984 the normal pattern of rainfall over Englandand Wales, which is influenced mainly by elevationand the predominance of a westerly airstream, wasvery little in evidence. A remarkable conformity inrainfall totals over England and Wales, for the fi vemonth drought period, could be recognised withtota ls in the ran ge of 180- 220 mm being typical ofmost regions. It will be appreciated, therefore, thata given precipitation tot al may represent a severedrought in some regions and adequate rainfall inothers.
Figu re 5. Return period assessment of Ap ril to A ugustrainf all f or the United K ingdom . Estimates ofthe f requency of occurrence of the 1984 and1976 ev ents may be obtained by locating theirordinates on the extrap olated probabiliv p lot(shown dotted f or 1984) .
The Weather in 1984
January witnessed the strongest and most persistentwesterly winds for many years in associat ion with aseries of depressions which crossed the British Isles.T otal monthly precipitat ion was more than 150 percent of the average throughout Great Britain;N orthern Ireland recorded its wettest January thiscentu ry . Blizzards caused large accumulations ofsnow in many northern regions, part icularly in theScot tish Highlands. A milder spell at the end of themonth was accompanied by a gradual snow- melt . Inearly February a low pressure area, cent red overIce land, deepened and a strong ridge of highpressur e developed from the Azores to France. T hissynoptic pattern resulted in a ver y variable dist ribu-tion of rainfall in the United Kingdom. M onthlyprecipitation was modest in southern England bu tabove average in western Scotland and in NorthernIreland which experienced excep tionally heavy rain-fall on the 19th and the 20th.
In the context of what was to follow, the winter(December- F ebr uary) rainfall in 1983/ 84 was ofpart icular imp ortance. T he winter was wet in allregions, except ionally so in Scotland which experi-enced its wet test winter since 1915, and in North-ern Ireland which has recorded no wetter Decemberto February period this century. Although severalstrategically import ant reservoired catchments, par-ticularly in Wales and in the Lake Distr ict , had onlyaverage rainfall, the United Kingdom was genera llywell placed to withstand a spring and summerdrought ; infi lu ation to aquifers and the replenish-ment of surface water reservoirs had been substan-t ial during the winter months.
T he relatively uncommon easterly and nor therlyairstreams, which strongly infl uenced weather pat -

10 H Y D R O L O G I C A L D A T A : 19 8 4
terns in the late winter, cont inued into M arch andhelped to establ ish the regional contrasts in rainfallthat were to characterise the early months of thedrought. M arch rainfall totals were above average insouthern and eastern England but below average inthe west and north. Pan s of Snowdonia and thesouth-west peninsular recorded less than one third ofnormal M arch rainfall whereas above average rain-fall assured ample infi lt ration into the importantChalk aqui fer to the east. T he drought became fi rmlyestabl ished as a consequence of the extremely lowrainf all totals in April and early M ay. Apart fromnorth-west Scotland, and the Sperrin mountains inNorthern I reland, dry, or very dry, condit ionsobtained throughout the United Kingdom. BothEngland and Wales recorded their lowest Apri lrainfall totals since 1938. Large areas were restrictedto less than 5 mm of rain over the thirty days and afew distr icts, notably near Cirencester in the Cot-swolds, had none at all.
With the prevail ing winds sti ll from the east , anoteworthy rain- free period extended well into M ay.Parts of East Anglia reported fi ve rainless weeks andtwenty, or more, consecut ive dry days were recordedat many local it ies across central England and south-ern Wales. T he combined April/ M ay rainfall inNorthern I reland was unprecedented. A new M ayminimum rainfall total was establ ished for Scot landwhere Galloway and the Clyde Valley were espe-cially dry. England and Wales were signifi cantlywetter; the drought 's development was slowed parti-cularly in the south-east by heavy rainfall, oftenthundery, after the middle of M ay. T he 21st was thewettest day of the year over England and Wales andvery local ised thunderstorms brought isolated rain-fall s to parts of Scotland on thc 24th.
Early June rainf all was followed by anotherprolonged dry spell which lasted up to ten weeks insome areas. Intense local droughts developed inregions wi th general rainfall defi cits, for instance, inCumbria, Snowdonia and on Dartmoor. However inmid-month the hot and humid conditions gave rise toa series of thunderstorms in the English lowlands,wi th Norfolk particularl y severely af fected; a fall of73 mm was measured at Bressingham on the 17th.Scotland remained dry, apart from the west coast andthe T weed basin, wi th the droughts in the T ay andClyde valleys becoming severe. April to June rainfallwas approximately 30 mm less than the previousminimum (232 mm) for Scotland, recorded in 1869.Oyer the same three months, rainfall in NorthernIreland was the lowest total on record.
July was the fi fth driest this century in Englandand Wales. Generally the l imi ted rainfall wasconcentrated at the end of the month and resultedeither f rbm weak troughs to the south and west orf rom thunderstorms. T he period 1 0- 13th was alsounsettled in some areas and at Woodburn, CountyAntrim, an intense fall of 55 mm in 4 hours occurredon the 1 1 th. In contrast, Gwynedd and Gwent
received only token rainfall in July and Yorkshirewas also part icularly dry.
A slight easing of the drought resulted fromwidespread rainfall at the beginning of August overEngland and Wales. T he rainfall was associated witha depression over the I rish Sea; this broughtmoderate to heavy falls to Cornwall , North Walesand northern England. Furt her thundery activi ty wasalso experienced, producing some of the most severestorms of the year; near Bristol two separate rainfallevents recorded a combined total of 87 mm on the2nd. T he period of unsettled weather continued as aseries of occluded fronts, with associated convectivestorms, crossed Great Britain. In one such episodealong the south coast on the night of the 24/ 25th Julyseveral part icular ly intense cells were reported withHayling Island recording more than 90 mm over anine hour period; such an event has an estimatedreturn period of approximately 500 years. Althoughless remarkable when considered over the ful lrainfall day the Hayling Island event is sti l l categor-ised as 'very rare' under the M eteorological Of fi ce's'Bilham' classifi cation of heavy falls T able 3 pro-vides a l isting of 'very rare' dail y rainfalls, and servesto emphasise the virtual absence of notable events, atthis t ime scale, during 1984. Despite the local impactof thunderstorms the July rainfall total for theUnited Kingdom was only marginally over 40 percent of the average.
In Scotland, August rainfall was locally var iableand sporadic in nature; all the river puri fi cat ionboard areas recorded 50 per cent, or less, of averagerainfall: Considering the three month summer per-iod, Scotland had its driest June- August on recordand lower summer rainfall totals have been recordedin only four years this century for England andWales; one such was the summer of 1983 whenNorthern I reland also experienced a somewhat drierJune- August than in 1984.
T he summer of 1984 was very hot as well asexcept ionall y dry. As a consequence evaporative lossesfrom reservoirs were the cause of some concern as thesummer progressed. Al though transpiration wasrestricted by the limited availabil ity of soil moisture,evaporation from reservoirs and lakes could , of course,proceed at the open water rate. In some areas PE ratesreached record levels in 1984. At Aberporth in Wales,for example, the accumulated potent ial evaporationover the period Apr il to September was unpreceden-ted, being marginally greater than the correspondingfi gure for 1976. Evaporation alone caused drops ofmore than 20 mm per week in some lakes and reservoirsin north-west England during July and August andimpoundments in Devon and Cornwall were estimatedto be losing between 2 and 5 per cent of capacityi nAugust for this reason.
Soil moisture defi cits remained high throughoutthe summer and in many regions had been well aboveaverage since the late spring. M aximum SM D values(see Figure 6), which generally occurred in late

R E V I E W O F T H E W ET\ H E R 1 1
August or ear ly Sept ember in 1954 , we re comparablewith th e highest record ed since 196 1 when the rou tinecompu tation of SM D s began az many of themoni toring sites in the nat iona l ne twork_ Peak deficitswere par ticu larly notewor thy in the wet ter regions ofthe Un ited Kingdom; throughou t much of the Eng lishlowlan ds lar ger defi cits were register ed in 1976 .
Ap ar t from N orthern Irel and , and a few areas insouthern Scot land, the drought was br oken bysustain ed and widespread Sept ember rainfall. T hemonth began with thundery cond itions and becamep rogressively more unsett led .
In the Clyde Valley and parts of South Wales,Sep tember rainfall was com parable with the accumu-la ted tot al for the previous fi ve m on ths . Sp at ialvar iab ilit y con tinued to character ise the rainfallpat ter n t hough; T hirlmere , for instance, had sl ightlybelow average Sept embe r rainfall.
Notwithstanding the effect of t he Sep tem berrain fall, the summer half -year ( Ap ril- Sep tem ber)was rem arkab ly dr y esp ecially in Scot lan d whereon ly in 1915 has a lower six -mon th rainf all total beenrecorded, and in Wales when on ly 1933 has beendrier th is cent ury.
Autu mn con t inued to featu re prolonged spells ofunsett led weather wit h heavy rainfall thr oughou tOctober and, par ticular ly, November . T he third weekof October was a pe riod of especially persis tentrainfall in the west er n hills of G reat Br itain; up to 200mm were recorded over the eigh t da ys from Octoberthe 17th on Dartmoor and Exmoor , the Welsh hills ,the Pennines and part s of the Scot tish Highlan ds .Scotland had its wettest Novembe r since gener alrainfall fi gu res were est ablished; east ern distr ict srepor ted very high monthly rainfall to ta ls with theNor th East , T ay, Forth and T weed River Purifi cationBoard areas regist er ing mor e tha n twice the av erage.
Extended per iods of rainfall defi cien cy have beensucceeded by very wet spells on several occasions in thepast , most notably followin g t he drou ghts of 1976 an d1929. In 1984 alm ost all water au tho rit y and riverpurifi cation board areas recor ded above aver age rain-
T ABLE 3 'VE RY RARE' DAI L Y R AINFA LL T OTAL S IN 1984
Number
24 .07 .84 3222 99 Hay li ng, Beach land s O ffi ce24.07.8 4 322335 Hav an t, Wat er W orks
fall for each of the autumn mon ths . T he accumul atedSeptembe r to N ovem ber rain fall to tal for GreatBritaM was the thir d highest on recor d continuin g therecent seq uence of remarkab ly wet au tu mns; both198 1 and 1982 were comp ar ab le with 1984.
After the first week, December was rather mor eset t led and dr ier cond it ions prevailed part icu lar ly incent ral an d nor thern England . Sleet and snowshowers were wid espread after the 25th bu t tot alpr ecipit ation for Decembe r was average, or less, inmost regions .
01,66
e>?'
E — rain fal l total estim ated .
' F lood St ud ies Rep or t 1975. N at ur al Env ironmen t Resear ch Cou nc il ( 5 Vuls) .
' Keers J .F . an d W estco tt P . 1977. A co mputer - ba sed model for de sign rainf al l in th e United K inPaper N o. 36.
0
Fnm re 6, Estintw ed m ax im um soil m oisture deficits in1984.
Pcferc. ,
SZ 7 169 88SU 711063
Atnouni
(ntm)
Return
Period
915 310
86 .5E 170
*Based on the metho ds and fi nd ings o f the F lood Studies Repo rt Vol If ( as imp lem en ted on the M eteo ro logica l O ffi ce computer ' )whe reby a ret ur n period ca n be assigne d to the ca tch at a pa rt icu lar ra ingau ge. T hose ex ceed ing a IOC year ret u rn p er iod are classi fied as
oni : M et eorolog ica l O ffice Scien tifi c

á

Summary
In a normal year, total runoff over Great Brita in isapproximately 620 mm; runoff from Scotland isabout twice that for England and Wales. Consideredover the year as a whole 1984 was un remarkable withrunoff close to the average. Figure 7 provides a guideto runoff expressed as a percen tage of the period ofrecord average. ' T he map is based upon - dischargedata for some 420 gauging stations and is leastprecise in northern Scot land and in the Welshmountains where the monitoring network is sparse .Figure 7 shows a large measure of spat ial uniformitywith most regions recording annual runoffs within 20per cent of the mean. However, the distribution ofrunoff throughout 1984 was very atypical and therange of fl ows expe rienced was except ionally large.Figure 8 (a- d) illustrat es the distribution of riverfl ows throughout 1984. Daily and monthly hydro-graphs are shown for individual gauging stations inEngland, Scot land, Wales and Northern Ireland; themonthly hydrograp hs are superimposed • upon thecorresponding maximum, min imum and mean valuesfor the period of record. Also shown are fl owdurat ion curves for the single year and the period ofrecord.
T he spring and summer witnessed extremelyrap id falls in runoff rat es in many areas, and byAugust even some of the low fl ows recorded duringthe great drought of 1975/ 76 had been superseded .River fl ows picked up strongly through the autumnand, although serious flooding was uncommon,runoff totals over the September to Novemberperiod were notably high. T he seasonal contrasts inrunoff resu lting from the greater hydrological effec-tiveness of winter rainfall were present to anexagger ated degree in 1984. F igure 9 illustr ates thedistribution of river flows for the Clyde throughoutthe year compared with the average sequence of
REVIEW OF R UNOFF
fl ows. Very high flows char acterised January andFebruary and the autumn of 1984 whilst ext remelylow discharges obtained throughout the late springand the summer . T he runoff pattern exhibited by theClyde was typical of many rivers throughout theUnited Kingdom although in southern and easternEngland runoff was not greatly diminished in thoserivers where groundwater contributes a substantialpropor tion of tot al streamflow.
A fur ther indication of the abnorin al ity of the1984 fl ow regime for a par ticular gauging sta tionmay be obtained by examining the flow durat ioncurves presented in Figure 8 which allow theproportion of time a river falls below a giventhreshold to be identifi ed. Whilst the flow exceededfor half the time in the River T ay at the Ballathiegauging station; for instance, was comparable forboth 1984 and the whole 25 year record, the fl owexceeded 95 per cent of the t ime in 1984 was littleover half the whole record fi gu re.
Because rainfall during 1984 was concentrat ed inthose par ts of the year when evaporat ion rates wereat their lowest, the proportion of rainfall lost toevaporat ion was signifi cant ly below average. Actualevaporat ion (AE) , for the year , fell below thepotential evaporation (PE) est imates by a substan-t ially wider margin than normal. The d ifferenceexceeded 100 mm over wide areas even in Scotlandwhere pOtential and actual evaporation rat es areoften comparable. Consequently, over the year as awhole, 1984 rainfall was more than usually hydrolo-gically eff ective. T able 4, which presents waterbalances for a network of catchment s throughoutGreat Britain, confi rms that the annual runoff for1984, expressed as a percent age of the catchmentrainfall, was generally higher than the period ofrecord average.

14 H Y D R O L O G I C A L D A T A 9 8 4
Figure 7. A guide to 1984 runoff exp ressed as a p ercentage of the long term av erage.
Above 140
120-140
100- 120
80 - 100
Below 80
(%)

R E V I E W O F R U N O F F 15
15006 TA Y A T BA LLA T H IE 1984
Pre H c us rnce rd : 19 5 3 -19 8 3
DA ILY MEAN FLOWS1000. w oo.
500.
LI)
50. 50.
1000.
500,
100.
10.
1000.
500.
100.
50.
\\
Figure 8a. River f low p atterns: Tay at Ballathie.(The 1984 trace is shown as a solid black line; the solid blue linerepresents the 30- day runn ing m ean f or the p eriod of record.)
Ca t c h m e n t a rea. 5 8 7 -1 Iini n
Tan Feb Mar Apr May Tun Tul Aug Sep Oct Nov Dec
MONTHLY MEAN FLOWS
Ton Feb Mor Apr May Tun Yu I Aug Sep Oct Nov Dec
FLOW DURAT ION CURVES
Pr evi ous r ecor d - - - -
1. 2 . 5 . 10. 20 . 30 . 40 . 50 . 80 . 70. 80 . 80 . 85 . 98 . 98 .
Percentage oP time Plow exceeded (Nor m' I pr obth I I t y s Co I e
500.
100.
1000.
100.
50.
10.
1000.
500.
100.
50.

16 H Y D R O L O G I C A L D A T A 9 8 4
39001
Previous record
T H A M ES AT T ED DIN GT ON/ K INGSTO N 1984(Natural ised)
883 -1 983 Catchment area: 9950 -0 km2
1 . 2 . 5 . 10 , 20 . 30 . 40 . 50 . 60 . 70 . 50 . 50 . 95 , 90 . 99 .
Per cent age oP t i me Pl ow exceeded %Nor ma l pr obob I l I t y sca l e )
Figure 8b. Riv er fl ow p atterns: Tham es at Teddington/K ingston.( The 1984 trace is shown as a solid black lin e; the solid blue linerep resents the 30-day running mean f or the period of record.)
500. DA ILY MEAN FLOWS500.
10 0 . 100.
30 50. 50.
10.Tan Feb Mar Apr May Tun Tu l Aug Sep Oct Nov Dec
10 .
500 . MONTHLY MEAN FLOWS500.
100. 100.
z
50. 50.
10. 10.
5. 5.
1. I.
0.5Tan Feb Mar Apr May Tun Tul Aug Sep Oct Nov Dec 0. 5

R E V I E W O F R U N O F F 17
56001 USK AT C HA IN BRIDGE 1984
Previous reco rd: 1958 -1983 Catch ment area: 911 7 kn
PO
30
10.
DA ILY MEAN FLOWS500. 500.
1 0 0 . 1 0 0 m
0
!ON 50. 50.
a
10. 10.
5. 5.
Tan Feb Mar Apr May Tut) Tu I Aug Sep Oct Nov Dec
MONTHLY MEAN FLOWS
100. 1 100.
50. 50.
a0Z: 10. 10.
5.
5.
Ton Feb Mar Apr May Tun Tu l Aug Sep Oct Noy Dec
FLOW DURATION CURVES
100.
50.•1/4.
I . 2 . 5 . 10. 20. 30. 40. SO. 80 . 70 . 80. 80 . 85 . 88 . 88.
Percentage or t ime Pl ow exceeded (Normol probobiliq sco e
Figure Sc. Riv er f low patterns: Usk at Chain Bridge.( The 1984 trace is shown as a solid black line; the solid blue linerepresents the 30- day running mean f or the p eriod of record.)
Previous record: 00.
50.
10.
5.

18 H Y D R O L O G I C A L D A T A 9 8 4
20100 5 CA M OW EN AT CA M OW EN T ERRA C E
Previous reco rd
1984
973-1983 Catchment area: 274 43 km'
1. 2. 3. 10. 20. 30. 40. 50. 80. 70. 80. 80. N . 88. 83.
Per eenboge oP P l ow * wen ded (Nor mal pr obob I I I t y sco I e )
Figure 8d. R iv er fl ow p atterns: Gamm en at Gamm en Terrace.( The 1984 trace is shown as a solid black lin e; the solid blue linerep resents the 30- day runn ing mean f or the p eriod of record.)
w 10 .
3
Ls
5.
100.
50.
1.
DA ILY MEAN FLOWS100. 100.
50. 50.
v) 10. 10.paNt 5. 5.3o
1. 1.
0.5 0.5
Tan Feb Mar Apr May Tun Tu l Aug Sep Oct Nov Dec
MONTHLY MEAN FLOWS50. 50.
1. 1.
0.5 Tan Feb Mar Apr Nay Tun Jul Aug Sep Oct Nov Dec 0.5
FLOW DURATION CURVES
Pr ev i ous r ecor d - - - - •
10. I
5.
100.
50.
vi 10. 10.' ... . .toC 5.
. ..5......
3 o E
0.5 0.5

R E V I E W O F R U N O F F 19
TA BLE 4 1984 WATER BALANCES FOR SELECTED CATCH MENTS IN GREAT BRIT AI N
Swoon Rm ir nal %u m Name
Number
7002 Findhorn F o n t% 1984 mm23 2 % of ha
12001 Dee Woodend 1984 mmas a % of Ita
15006 T ay Bal lathie 1984 ramas a % of lta
18001 Al lan Water Ki nbuck 1984 mmas a % of ha
1900 1 Almond Craigiehal l 1984 ramas a % of Ita
21012 T eviot Hawick 1984 minas a % of lta
24004 Bedburn Beck Bedburn 1984 mm13 2 % Of 112
27002 Whar fe Fl int M il l Weir 1984 mm33 2 % Of l l a
28008 Dove Rocester Weir 1984 mm25 2 % Of 112
30001 Witham Claypole M il l 1984 mm25 8 % Of 112
32001 Nene Orton 1984 mmas a % of Ita
33002 Bedford Ouse Bedford 1984 mmas a % of lta
34003 Bure Ingworth 1984 mm15 2 % of lta
36006 Stour Langham 1984 mm25 3 % Of Ita
3700 1 Boding Redbridge 1984 mmas a % of It&
38003 M imram Panshanger Park 1984 mmas a % of Ica
3900 1 Thames Ki ngston/ T eddington 1984 mm15 3 % Of Ita
39007 Blackwater Swal lowfi eld 1984 mmas a % of lta
40005 &cult Sti le Bridge 1984 mmas a % of Ita
44002 Piddle Baggs M il l 1984 mmas a % of lta
45001 Exe l l iorverton 1984 mm23 a % Of 112
50001 T aw li mberleigh 1984 mmas a % of lta
52005 T one Bishops Hul l 1984 mmas 2 % Of h a
54005 Severn Montford 1984 mmas a % of Ica
55008 Wye Cefn Brwyn 1984 mmas a % of l ta
57004 Cynon Abercynon 1984 mmas 2 % of Ita
6200 1 T eifi Clan T ei fi 1984 mm25 a % of Ica
6700 1 Dee Bala 1984 mm25 a % of ha
6800 1 Weaver Ashbrook 1984 mmas a % of ha
75002 Derwent Camerton 1984 mmas a % of Ica
84005 Clyde Blain ton 1984 mmas a % of ha
ha—long term aven ge • For an explanation of the code letters see page 40
• ainfall t ypa l U M Roa n /. is • %
al Rats:all
Aban cuifina•
Ilinchn es

20 H Y D R O L O G I C A L D A T A 9 8 4
200
150
100
-J
50
1984
Long term
0JA N FEB M A R A PR M AY JUNE JU LY AUG SEPT OCT
Figure 9 984 an d av erage daily f lows f or the River Cly de at Hahelbank .
The 1984 D ro ught
Consistent with the United Kingdom rainfall patternin 1984, rivers in Scot land, N orthern Ireland, Walesand the upland regions of England were the mostaffected by the drought . Genera lly these river s draincat chments which are characterised by relat ivelysteep slopes, thin soil cover and a very limitedgroundwater contribution to river fl ow. Conse-quently any rainfall defi ciency qu ickly results in adecrease of runoff. T o a limited degree, fl ows in thehighland regions of Scot land may be sustainedthrough the spring partly from snowmelt; theaccunmlat ion of snow in early 1984 was part iculalyheavy in the Cairngorms.
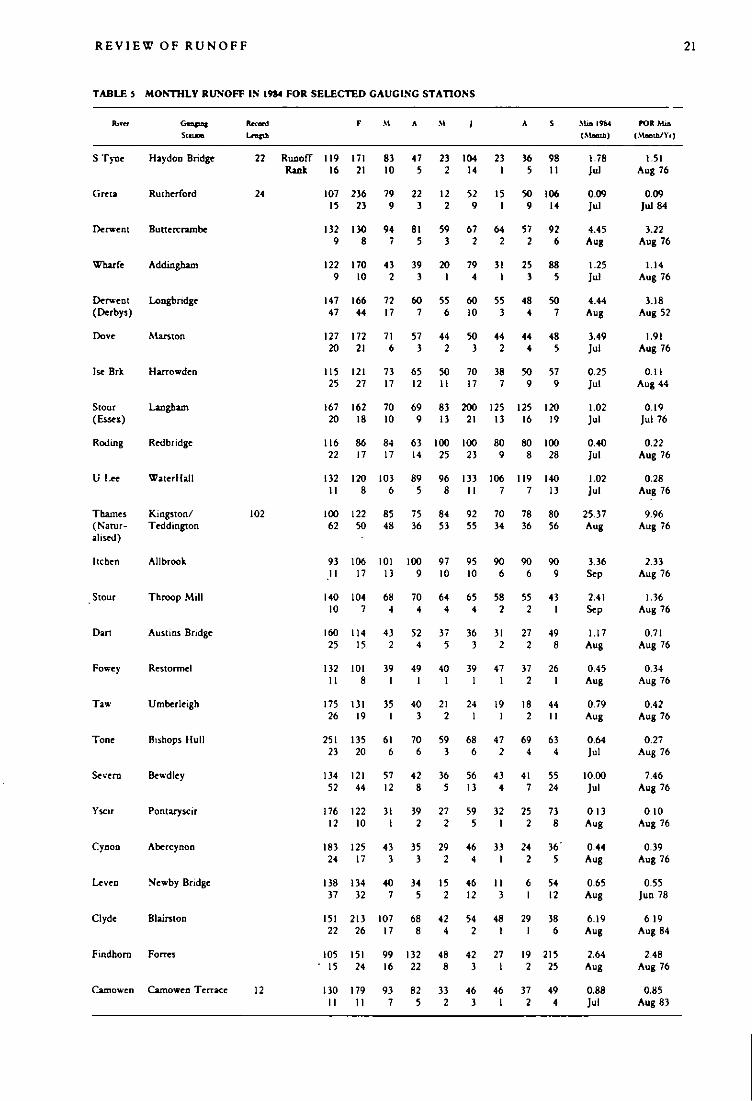
Monthly ranked runoff fi gures are presented inT able 5 for a select ion of catchm ent s throughout theUnited Kingdom. Exceptionally low runoff totalsoccurred widely in July and Augu st . T he Ju ly runoffwas the lowest on record for that month in manyup land catchments but , apart from Northern Ireland,the absolute min imum mon thly runoff, commonlyrecorded in 1976, remained unchallenged. Overmuch of southern and cen tral England where the1976 drought achieved its greatest intensity, springand summer fl ows in 1984 were not greatly belownormal. T he runoff defi cits, relat ive to the aver age,
NOV DEC
Source: Clyde APB
were greatest in central and southern Scotland, andthe uplands of England and Wales. T able 6 serves toshow that in such regions the 1984 drought wasnotable in term s of the accumulated spring andsummer runoff totals. Echoing the end of the 1976drought, heavy rainfall in late August , and inSeptember, brought a swift end to the drought , and arap id increase in river fl ows throughout the earlyweeks of the autumn .
How severe was the drought? T o help answer thisT able 5 provides a rough guide to the likelyfrequency of low river fl ows in part icular catch-ments. However, it is possible to examine ret urnperiods within a more rigorous stat ist ical framework.Analysis of rainfall data shows that the likelyfrequency of 1984 sequences depends on both thelocation and the durat ion being studied. T his is alsothe case with river fl ows although it is important tonote that , because of the natural and art ifi cial storageavailable in each river basin, the frequencies of lowfl ow events for comparable periods may differsubst ant ially from those established from rainfalldata. T he frequency associated with the runoffsequence may be considerably great er, part icularlyfor droughts of relat ively short durat ions.
R E V I E W O F R U N O F F 2 1
TABLE 5
R it a
MONT HLY RUNOFF I N 1954 FOR SELECTED GAUGING STATI ONS
Ca a V n g Record F Al A SI i
Sian La t th
A S A m 1984
0 88420
PDF A z
(Abma hr i o
S T y-ne Haydon Bridge 22 Runoff 119 171 83 47 23 104 23 16 98 1.78 1.51Rank 16 21 10 5 2 14 1 5 I I Jul Aug 76
Greta Rutherford 24 107 236 79 22 12 52 15 50 106 0.09 0.0915 23 9 3 2 9 I 9 14 Jul Jul 84
Derwent Buttercrambe 132 130 94 81 59 67 64 57 92 4.45 3.229 8 7 5 3 2 2 2 6 Aug Aug 76
Whar te Addingharn 122 170 43 39 20 79 3/ 25 88 1.25 1.149 10 2 3 1 4 I 3 5 Jul Aug 76
Derwent Longbrtdge 147 166 72 60 55 60 55 48 50 4.44 3.18( Derbys) 47 44 17 7 6 10 3 4 7 Aug Aug 52
Dove Marston 127 172 71 57 44 50 44 44 48 3.49 1.9120 21 6 3 2 3 2 4 5 Jul Aug 76
Ise Brk Har rowden 115 121 73 65 50 70 38 50 57 0.25 0.1125 27 17 12 I I 17 7 9 9 Jul Aug 44
Stour Langham 167 162 70 69 83 200 125 125 120 1.02 0.19( Essex) 20 18 10 9 13 21 13 16 19 Jul Jul 76
Roil ing Redbr idge 116 86 84 63 100 100 80 80 100 0.40 0.2222 17 17 14 25 23 9 8 28 Jul Aug 76
U Lee Waterl Ial l 132 120 103 89 96 133 106 119 140 1.02 0.2811 8 6 5 8 I I 7 7 13 Jul Aug 76
T hames Kingston/ 102 100 122 85 75 84 92 70 78 80 25.37 9.96( Nana -al ised)
l ichen
T eddington
All brook
62
93
50
106
48
101
36
100
53
97
55
95
34
90
36
90
56
90
Aug
3.36
Aug 76
2.33.11 17 13 9 10 10 6 6 9 Sep Aug 76
T hroop M il l 140 104 68 70 64 65 58 55 43 2.41 1.36.Stour10 7 4 4 4 4 2 2 1 Sep Aug 76
Dan Austins Bridge 160 114 43 52 37 36 31 27 49 1.17 0.7125 15 2 4 5 3 2 2 8 Aug Aug 76
Fowey Restormel 132 101 39 49 40 39 47 37 26 0.45 0.3411 8 I I 1 1 / 2 1 Aug Aug 76
T aw U mberleigh 175 131 35 40 21 24 19 18 44 0.79 0.4226 19 1 3 2 1 1 2 11 Aug Aug 76
T one Bishops Hull 251 135 61 70 59 68 47 69 63 0.64 0.2723 20 6 6 3 6 2 4 4 Jul Aug 76
Severn Bewdley 134 121 57 42 36 56 43 41 55 10.00 7.4652 44 12 8 5 13 4 7 24 Jul Aug 76
Yscir Pontaryscir 176 122 31 39 27 59 32 25 73 0.13 0.1012 10 1 2 2 5 1 2 8 Aug Aug 76
Cynon Abercynon 183 125 43 35 29 46 33 24 36 0.44 0.3924 17 3 3 2 4 I 2 5 Aug Aug 76
Leven Newby Bridge 138 134 40 34 15 46 I I 6 54 0.65 0.5537 32 7 5 2 12 3 1 12 Aug Jun 78
Clyde Blanston 151 213 107 68 42 54 48 29 38 6.19 6 1922 26 17 8 4 2 1 1 6 Aug Aug 84
Findhorn Font s 105 151 99 132 48 42 27 19 215 2.64 2.4815 24 16 22 8 3 1 2 25 Aug Aug 76
Camowen Camowen T errace 12 130 179 93 82 33 46 46 37 49 0.88 0.85I I I I 7 5 2 3 1 2 4 Jul Aug 83

22 H Y D R O L O G IC A L D A T A : 1 9 8 4
One method for assessing the severity of a lowfl ow sequence involves the use of a fl ow frequencydiagram. Figu re 10 shows a set of fl ow frequencycurves for the River Nith, in Dumfrieshire , for theperiod 1958 to 1984. T he curves show the averageinterval in years ( return period ) between which theflow falls below a given discharge. T he plots may bederived for the lowest daily discharge in each year orfrom fl ows averaged over longer durat ions. Five suchplot s are shown for durations of 10, 30, 60, 90 and180 days. T he procedure for producing such dia-grams is summarised in the 'T he 1984 Drought ' (see
page 180) and is described fully in the Low FlowStudies Report ' . T he return per iod axis allows thefrequency of any par ticular annual min imum to . beest imated. For instance, the 90 day minimum fl ow onthe River Nith in 1984 has a return period ofapproximately 50 years.
T he above analysis was repeated for a number ofrivers and T able 7 shows est imates of the returnperiod of the 1984 drought for each of fi ve durat ions.Return periods were generally 10 years or less for allstations in central and eastern England, whilst in thenort h and west of Great Britain the 1984 drought

R E V I E W O F R U N O F F 23
w as m or e severe . D ifferen ces in drought frequencyin the same river but for differen t durations weregenerally small . In south-western England andsouthern Wales the h ighest ret urn per iods are for the90 days duration; in nort h-western England andsouthern Scotland, ret urn periods are highest for thelongest duration . When consider ing the ret urn peri-ods presented in T able 7 it is important to bear inmind that few of the selected gauging stations arelocated within the areas where the drought was mostsevere (see Figure 4) . This arises because fewgauging stations with long river fl ow records -
20
0 0
° 0 00
• •
• —Z O —1.5 —1.0 —05 OM a 5Reduced Variate
Figure 10. Flow f requency diagram f or the Riv er N ith at Friars Curse.
necessary to assess return periods effectively - existin such areas. Stations which do gauge the up lands,whether such as Vyrnwy (N orth Wales), which is anupland gauge, N ewby Bridge (Cumbr ia) , or FriarsCarse (Dumfrieshire), which contain uplan ds in thecatchment, show return periods in excess of 50 year sfor the 180 day duration. M any highlan d rivers couldbe expected to have experienced fl ows of comparablesever ity to the above three examples during 1984. Amor e detailed examination of the drought 's intensityand impact is given in 'T he 1984 Drought ' .
• 11 y l w
A s T y ,"
• " li n WV •k A A A A A A A•
O .•
A A A A A A A A A . MIV
v
. . . . O 0 0 . • A A A •0 * * • • 4
PM
0
2 .5 1 0
L 25 2.0 2.5 5M 10 25 50 100 200Ret urn Period

24 H Y D R O L O G I C A L D A T A : 1 9 8 4
TABLE 7 RETURN PERI ODS OF 1984 ANNUAL MINI MA
Station
21009 ,
2300425006
27041
28010280 18
32004
3200836006
3700 138003
3900 14251043007
46003
'500015200553018
54001.54003
5601357004
660116800 172004
730107400679002
Runoff in 1984
Stat ion Name
Fruid Water at Fruid
Sout h T yne at Haydon Br idge
Greta at Rutherford Bridge
Derwent at Buttercrambe
Derwent at Longbri dge Weir
Dove at M arston on Dove
Ise Brook at Harrowden Old M il l
Nene at Dodford
Stour at Langham
Rodin at Redbr idge
M imn m at Pam hanger Park
Th ames at Kingston/ T eddington
I tchen at Highbridge
Stour at T hroop M il l
Dar t at Aust in, Bridge
T aw at Umberleigh
T one at Bishops Hull
Avon at Bathford
Severn at Bewdley
Vyrnwy at Vyrnwy Reservoir
Yscir at Pontaryscir
Cynon at Abercynon
Conwy at Cwm L lanei ch
Weaver at Ashbrook
Lune at Caton
Leven at Newby Bridge
Calder at Calder Hal l
N ith af Fri ars Cane
All retu rn periods have been rounded
-4 Return periods wel l in excess of 100 years.
At the beginning of the year rivers were in spatethroughou t the United Kin gdom especially in North-ern Ireland and the western hills of Great Britain .Rivers draining the mount ains of Sutherland were infl ood and new maximum Januar y runoff recordswere established on the T aw, in Devon, and theRive rs Agivey and Camowen in Northern Ireland; anabsolu te monthly maximum, in a thirty year record,was established for the Nunningham Stream inSussex. T he Agivey recorded a second monthly peakrunoff in February when unpreceden ted averagemonthly flows were also registered on the T aw inDevon and the Nith in Du mfrieshire . T his highrunoff fur ther improved reservoir stocks at a timewhen water levels were, anyway, near to capacity inmost regions of the United Kingdom. Most reser-voirs had indeed been close to capacity at the end of1983 although there were important exceptions forinst ance in the Lake District , at Stithians in Corn-wall and several small reservoirs in cent ral Scotlandwhich had, of necessity, to be held below capacity tofacilitate rep air work.
Exceptionally steep ear ly spring fl ow recessionsbecame established in February and cont inued intoMarch when runoff , generally, was in the ran ge50- 75 per cent of normal. Part icularly rapid de-creases in fl ow rate were experienced in the fl westwhere the rivers Fowey (Cornwall) , Yscir (Gwent),and the Conwy (Gwynedd) recorded new minimumrunoff tot als for M arch. Although the recessionswere interrupted at the end of March in response towidespread rain fall they quickly became re-estab-lished and in many areas were to con tinue, with onlyminor breaks, until well into September . As a resultof the limit ed ear ly spring runoff the drawdown inreservoir levels commenced extremely ear ly in 1984.Substantial deplet ions were recorded in February1984 for reservoirs in the southern Pennines and inthe south-west peninsular . Reservoirs are normallyfurther replenished in March but in 1984 drawdownsteepened in the Lake Dist rict and South Yorkshirereservoirs, and was part icularly rap id in Sout h Waleswhere Pontsticill, in the T af Fechan group, waslosing 4 per cent of its capacity each week. Deplet ion

R E V I E W O F R U N O F F 25
rat es increased generally through Apr il and sto ragewas reduced by 10 per cent of capacity at thestr ategically importan t reservoirs of Vyrnwy and theElan Valley system in Wales, and the DerwentValley group in Derbyshire. Water levels in LoughNeagh (Nor thern Ire land ) were already belownormal summer levels at the beginning of April. T hecontinuing decline through the month resu lted in apar tial closure of sluice gates at T oome on the RiverBann in an at tempt to maintain the level in LoughNeagh.
T he very dry April meant that responsive riverscontinued to recede, sometimes at unprecedentedrates. For instance, fl ows in . the Yorkshire Wharfewere only one quar ter of normal in April and runoffrates were decreasing rap idly in Scotland where theinit ial impact of the drought had been ameliorated,par ticular ly in the Highlands, by meltwaters fromsubstantial accumulat ions of snow. By May somewater quality problems were being experienced inparts of Scot land; fi sh kills were reported in theClyde River Purifi cation Board area as a result of thelarge diurnal fl uctuations in dissolved oxygen associ-ated with excessive weed growth. In England,basefl ow-fed rivers were less affected by the droughtand discharges were often close to normal in the latespr ing. T he river Mimram, in Hertfordshire , and theHampshire Itchen, for example, both draining chalkcatchments, remained at seasonally average levelsbut the River Derwent in Yorkshire, which drains theOolit ic Limestone, was 40 per cent below averagedischarge in May. Generally, the contrast between animmediate and decisive impact on fl ows in the lowbasefl ow rivers and a far more subdued, and longerdelayed, impact in areas characterised by substantialgroundwater support was to become an importantfeature of the 1984 drought especially throughoutEngland .
By May, reservoir stocks in northern and westernEngland were comparable to the 1976 situat ion but,in many areas, the rate of deplet ion was greater . T hedramatic fall in reservoir levels, in the droughtaffected areas, through the spring of 1984 isillustrat ed by the T af Fechan group in South Waleswhere the water level had declined from capacity tolitt le over half-full. Without the introduct ion ofconservation measures this would have maintainedsupplies only until the middle of August . Grossstor age at T hirlmere and Haweswater decreased bymore than 20,000 megalitres in May, equivalent toabout 16 per cent of total volume.
In Scotland the summer began with considerableevidence of shrinking river networks as headwatercontributions, and springs, progressively failed . ByJuly a number of small Scott ish rivers and tributarieswere dry and runoff in part s of the central lowlandswas down to 0.3 I s ' km 2; a remarkably low rat ecorresponding io southern England at the end of the1976 drought . Although some relief was afforded bythundery rainfal l at the beginn ing of June in England
- rivers in Suffolk and Essex responding par ticular lystrongly - the recoveries in fl ow were shor t lived andsome lengthy spells of new minimum monthly runofftotals were established. T he River Fowey (Corn-wall) successively established new minimum runofftotals for each month over the period March-JuneBy June, the T aw and the Conwy were belowprevious min imum fl ow rates for the time of year .An interesting divers ity within the pat tern of highbasefl ow rivers was provided by the difference inrunoff rates between the neighbouring Itchen andT est rivers in Hampshire. In common with mostspring-fed rivers on the Chalk, the Itchen was onlyabout 10 Per cent below the seasonal average by Julywhereas the T est was approaching it s 1976 minimumdischarge. Rivers draining catchments in the oldergeological provinces were everywhere close to re-corded min ima. For instance, the River Nith re -mained below previous minimum summer fl owsfrom mid-July into September.
M any Scottish riven have augmented low fl owsas a consequence of the development of hydro-electric power (HEP) schemes within the catchment.During July and August new absolute min imumfl ows, since the introduction of the HEP schemes,were established . In the T ay region, fl ows during the1955 drought were lower but , at that time, little or nosupport was available from HEP impoundments.M any rivers in the Clyde Valley recorded extendedsequences of daily fl ows below the 95 percentileexceedance flow; periods of eight weeks or morewere common. T he remarkably low July rainfall wasaccompanied by the drying-up of streams in Englandalso. A number of water courses on Dar tmoor weredry by mid-summer and the River Kent downstreamof Sedgewick, in Cumbr ia, was recording negligiblefl ows as a se ries of sink-holes intercepted the bu lk ofthe flow. Similar effects were reported elsewhere inthe limestone catchments of the Pennines.
It should be recognised that river fl ow measure-ments tend to become less precise at very lowdischarges. M inimal velocities and luxuriant weedgrowth lead ing to drowning of controls infer insensi-t ive or imprecise stage-d ischarge relations. In addi-t ion, it is at the lower fl ow rates that abstract ions andeffl uent returns have their greatest impact on thenatural fl ow regime. Drought fl ows, especially in the.more densely populated regions, need to be consi-dered against an evolving pat tern of water exploita-t ion within individual catchments. Increasingly,fl ows in riven used for water supply purposes maybe augmented by water transferred from beyondcatchment bou ndaries. Such factors complicate fl owcomparisons between drought periods and very lowfl ows are often subjected to later revision whenstage-discharge relations are changed to take accountof current *meter measurements undertaken dur ingthe drought.
Unprecedented runoff totals for July were re-corded at rivers as widely distributed as the Agivey,

26 H Y D R O L O G IC A L D A T A : 1984
the Clyde and the Whar fe; to emphasise the magn i-tude and extent of the overall recession , all threerivers had established record maximum runoff tota lsfor February. In runoff term s the drought remainedof limited signifi cance throughou t much of south-eastern England. Elsewhere , faced with a continuingdecline both in river flows and reservoir storagethroughou t the early summer, water author itiesintroduced measures to conserve, and augment ,stocks and to reduce water demand. In Scot land, apart icular diffi culty was posed by the markedincrease in water used for spray irrigation; this is
• largely uncontrolled and a signifi cant number ofsmall streams dried-up downstream of abst ractionsor became largely sustained by sewage effl uentdischarges . Broadly speaking, the drought achievedits greatest intensity during August when dischargerates were as low as 10 per cent of the monthlyaverage in a number of areas. T he rainfall . in thesecond hal f of the .month resulted in only a min imalflow response becau se it was mainly utilised tored uce the ver y high soil moisture defi cits thatexisted throughout most of the United Kingdom.
T he volat ility of rainfall and runoff patternsduring recen t years was well demonstrated in the latesummer and autumn of 1984. At the beginn ing ofSeptember river fl ows were genera lly at seasonallydepressed levels but by the end of the month mostrivers had attained above, or substant ially above,aver age autumn discharges. T he recover y cont inuedthroughou t the autumn and by November localisedflooding was widely rep orted . In Cumbria, forinstance, the River Calder overtopped its banks and
the Yorkshire Aire, at Kildwick , recorded its highestNovember runoff on record; a monthly min imumhad been registered in July. In Scot land, many riverswere in spate during November. Very high fl owswere recorded early in the month in rivers drainingthe T ay, Forth and T weed basins. Greater than 100mm of rain fall was recorded over 24 hour s (3-4November) in the North Esk catchment and in theheadwaters of the T weed; some two-day rainfalltotals in this region had return periods est imated atover 100 years. T he subsequent runoff resu lted inver y swift increases in river levels; the River Jedrecorded a maximum rat e of rise of 400 mm h- 1 and ,together with the Gala Water and Leader Water,fl ood levels substantially exceeded any prev iouslyrecorded. In the T ay basin, a further series of notabledischarges were .associated with rainfall on the 10th.Snowmelt also contributed to the runoff and a fl owof 465 m' s with an estimated return period of 20years, occur red on the Nor th Esk.
T he heavy autumn rain fall allied to diminishingrates of evaporation resu lted in a rapid improvementin reservoir stocks and increased infi ltrat ion to themajor aquifer s. Most reservoirs had reached , or wereapproaching, capacity by the end of the yearalthough a dry December postponed tot al rep lenish-ment in some areas; the Washburn Valley group ofreservoirs in South Yorkshire, for instance, was at 80per cent capacity entering 1985.
1 Low . Flow Studies Report 1980. Inst itute of Hydrology,Wal li ngford.

Summary
Since the drought of 1976 when unprecedented lowwater levels were recorded throughout both majorand minor aquifers, water tables have generally stoodat above average levels. T his reflects the recentsequence of wet winters. Each of the last eight haveregistered above average rain fall and, consequent ly,relatively high rat es of infi ltration have allowedample replenishment of groundwater reserve s. F ig-ure 11 shows water-year residual rainfall s (whichapproximate to infi ltr ation) for three catchmentareas with extensive Chalk outcrops in the south ofEngland. Infi ltr ation in 1983/ 84 was app reciably lessth an the preceding seven years but high infi ltrationrates following the December and January rainfallcontrast with the min imal aquifer recharge whichoccurred during the winter of 1975/ 76.
By the spring of 1984 groundwater levels weregenerally above, or well above, the season al aver age.T he ensuing drought was mild in the south and eastof England where grou ndwater is a major source ofpublic supply. Both these factors combined to ensurethat the 1984 drought, in terms of groundwaterstorage, was a relatively minor event. Groundwatersin 1984 stood at ver y low levels for only a shortlength of time and the water table recovered rapidlyfollowing the autumn rainfall . Figure 12 serves to
65
60
55
35
30
THE GROUND W A TER SI TUA TI ON UP TO THE END OF 1 9 8 4
REVIEW OF GROUND W A TER -
Aqu ifer : Chalk and Upper GreensandSite : Compt on House, ComptonNat ional Grid Reference: SU 77 55 1490
25 -- - -1983 1984
Ftgure 11 Groundwater levels in 1983- 84 and 1975- 76.
Max
Min
24
22
6 20
14
12
10
il1 l i chen Catchm entII
I 1
•
I A1E 590 I % / 1
--=' 2 1 / / Ii / % iE - -- Ip a) v t, .- 1>:i , • Iti l i 1/ 1 1
i . i1 Thames
1
60 0
300 i Cat chm ent
E.jEl'o 20 0
I
1 I
i
1 I .[ :
*6
i I
...• • •••. .. •••••,
Cr I I
To
•
I Il o o:i3 I
i
1983
Bedf ord Ouse Cat chm en t
01975 76 77 78 79 80 8 1 82 83 84 85
W. Year (Oct - Sept )
Figure 11. Residual rainf all (water-y ear totals) f orthree groundwater catchments.
Aquifer : Chalk and Upper GreensandSite : Dalton Estat e, Dalton HolmeNational Grid Reference : SE 965 1 4530
i :t hen
T r;: mas
Dedl oyd Out e
1984
Max
Min

28 H Y D R O L O G I C A L D A T A : 1 9 8 4
emphasise the limited nature of the 1984groundwater drought in compar ison with the ex-tended drought of 1975/ 76. However, a feature ofborehole and well hydrographs for 1984 is the largeran ge in levels recorded in many areas. Such
Gi oundwater Levels 198 1- 84
T he volume of groundwater stored in a. quifersrefl ects not only the infi ltr at ion taking place dur ingthe previous winter months but also that occurring inprevious year s. It is, therefore, unsafe to considerany single year wholly in isolation. In this presentpublicat ion, the 1984 groundwater situat ion is illus-trated in the context of groundwater level variat ionsover the per iod 198 1- 1984. Figu re 13 ( a- m) showsgroundwater level hydrograp hs for thir teen repre-sent ative sites in England and Wales (see map onpage 165) ; the 1981- 1984 levels are illustrat ed incomparison with the average and extreme monthlylevels for the period of record. Where the period ofrecord is less than terr year s, .only the hydrographconstructed from observed levels is shown. T he traceof observed water levels is discont inued where thereis a break between successive measurements of morethan eight weeks.
T he 1983/ 84 winter (October to March) rainfallin Scot land was generally above average save for theClyde and Forth River Purifi cation Board areaswhere it was near , or below, average. Iri England andWales, the winter rainfall was above average in thenort h, but was close to the mean for the area south ofthe Humber and the Mersey (T able 8) . In Norther nIreland, the winter rainfall was also appreciablyabove average.
In southern and central England, the aver agewinter rainfall for 1983/ 84 is refl ected in the wellhyd rographs for Compton, Rock ley, T her fi eld Rec-tory and Washp it Farm ( in the Chalk) where thepost -winter peaks were also close to the average,although Rockley peaked rat her higher than mighthave been expected . Similar ly, Bussels No. 7 in theT riassic sandstones of south-west England andAmpney Cr ucis in the Jurassic oolites showed nearaverage peaks. In northern England, in the Chalk at •Dalton Holme, and in the M agnesian Limestone atPeggy Eller ton Farm, the above average winter
• rainfall culminated in above average peaks in thewell hydrographs.
T he summer rainfall pattern has been describedin the rev iew of the weather but for those reading thegrou ndwater sect ion in isolat ion, it may be statedthat the April to September rainfall was belowaverage in almost all districts; a common feature inthe period since the 1976 drought . In Wales,Scot land, western England and in Northern Ireland,it was below 70 per cent of the mean. In easternEngland, summer rainfall exceeded 80 per cent of
substantial v ariability, relative to the normal seaso-nal cycle in groundwater levels, has been a persisten tfeature over the last decade, but in 1984 the overa llrange was unprecedented in many boreholes withshort records.
the mean only in the Anglian Water Authority area(92 per cent ). Even with most reservoirs full afterthe winter, water shortages were felt as ear ly as Aprilin the Welsh, Nort h West and South West WaterAuthority areas. By mid-summer, although some-what less severe than that of the summer of 1976,there was a general drought .
In groundwater terms, the 1984 drought was oflimited signifi cance. With the more important aqui-fers receiving their normal n atural rep lenishmentduring the previous winter , and with summerrecharge rar ely occurring in any case, thegroundwater resources were well up to the average,and in the north, above average. In the Chalk and inthe Permo-T riassic sandstones, the well hydrographsshow a near normal recession in groundwater levels,steepe ning a little after mid-summer to approach, ina few cases, the recorded minima; this increased rat eof recession is par tly due to a greater usage ofgroundwater (where available) to offset the shortagein surface resources. By November groundwaterlevels at Dalton Holme were approaching thoseregistered dur ing the drought yeari of 1905, 192 1,1949, 1959 and 1976. Very low autumn levels alsoobtained at Rockley but they are placed in a suitablecontext by comparison with 1976 when there was avirtual absence of standing water throughout theyear; the seventh occasion on which the well hasdr ied-up since 1933. In the lesser aquifers, theeffects of the low rainfall are somewhat more •marked; in the Jurassic limestones at Ampney Crucislevels fell close to the recorded minima ( in an areawhere rainfall was less than 70 per cent of . the mean)while levels at the New Red Lion fell only slight lybelow the mean ( the summer rainfall in this areabeing only slightly below average) . At the Dale Browsite in the Permo-T riassic sandstones of the NorthWest Water Authority, technical dif fi culties inmeasuring groundwater levels masked much of thehydrograph through the fi rst half of the year , butlevels had fallen to below average by late summer.The Magnesian Limestone, as shown by PeggyEllerton Farm, had benefi ted from two successivewinters of plent iful recharge, and groundwater levelsstayed above average through the year .
In those areas where surface water stocks wereseriously depleted during the drought, minor aqui-fers assumed a greater importance. T heir potential tomeet local or district water supply needs wasexploited in many areas. T ypically, groundwater

REV I EW O E G ROU N D W AT ER 29
levels in the less developed aquifers were about, orjust below, average in the winter of , 1983/ 84.M inimum levels recorded in the ensuing droughtwere generally well above those registered in 1976except in those few locali ties where recharge in 1984was delayed into late autumn.
During the last three months of 1984, rainfallwas very slightly above average in northern Englandand in the Anglian Water Authority distr ict . Else-where, it was well above average. Groundwaterlevels were ri sing through this period, and by the endof December the well hydrographs were generallyclose tà, or above, average levels. At Dalton Holme,
TABLE 8. WI NTE R AND SUMMER RAINFAL L IN TH EUNIT ED KINGDOM 1983- 4
Water Author ity Winter Rain fall Summer Rain fall Rain fallarr a 1983- 84 1984 Oc t- Dec 1984
levels were rising but had not yet reached the mean.At Eastwick Farm, there appears to have been aregional fall of about 0.5 metre through the wholeyear, with levels well below the mean in December;the record for future years wil l be needed to confi rmthis trend.
One noteworthy feature appears in the wellhydrographs for Espland Hil l, Dalton Holme, theNew Red Lion, Ampney Crucis, Rockley, Bussels No.7 and Compton. T he annual minima show a fallingtrend over the period 1981- 1984. As yet , there isinsuf fi cient informat ion to establish the cause of thistrend, but it will be monitored in future years.
Nor th West 714 mm 392 mm 447 mm
114% 66% 125%
Northumbr ian 492 mm 294 mm 298 mm
111% 67% 122%
Severn T rent 406 mm 29 7 mm 25 1 mm
105% 77% 117%
Yorkshire 527 mm 29 7 mm 266 mm
124% 73% 115%
Anglian 299 mm 284 mm 170 mm
99% 92% 102%
T hames 365 mm 273 mm 247 mm102% 79% 122%
Sou thern 457 mm 243 mm 332 mm
104% 68% 131%
Sou th West 738 mm 335 mm 469 mm108% 66% 123%
We lsh 745 mm 385 mm 546 mm10 1% 64% 131%
River Puri fi cation
Board area
Highland 1225 mm 517 mm 696 mm
127% .68% 126%
North East 597 mm 322 mm 47 1 mm
113% 65% 156%
fl. .
T ay 863 mm 312 mm 595 mm
129% 53% 159%
Forth 541 mm 310 mm 510 mm95% 56% 158%
Clyde 796 mm 480 mm 717 mm
87% 64% 134%
T w« d 588 mm 270 mm 391 mm
117% 54% 139%
Solway 869 mm 355 mm 583 mm114% 54% 133%
Northern 673 mm 333 mm 339 mmIreland 118% 64% 105% ,

30
Sit e name: Dalt on Estate, Dalt on Ho Ime
Nat ional g rid reference: SE 9651 4530 W el l number SE 94/ 5
A qu if er : Chalk and Upper Greensand M easur ing level : 34 57 m OD
24 I I I I I 1
r--
22 —
20
18
16
14
10 J F M A M J J A S O N D J F N A N J J A S O
1981 1982
Max, M in. and Mean values calculated from years 1889 to 1983
1 9 8 1
Max. Min. and Mean values calculated from years 1933 to 1983
Figure 13. Hy drographs of groundwater level f luctuations 1981- 84.
H Y D R O L O G IC A L D A T A : 19 84
J J A sin s O J F H A PI J J A S O
1983 1984
1982 1983 1984

R E V I E W O F G R O U N D W A T E R
0
65
so
55
5
4 5
2 5
3 5
30
Figure 13— (continued) .
Sit e name: Compt on House, ComptonNati onal g rid reference: SU 7755 1490Aq uif er : Chal k and Upper Greensand
We ll numb er: S11 71/23M easur ing level: 81-37 m OD
F A M J J A S O N D J F O A O J J A S O IN D J F W A O J J A J J AI S ,O N D
1981 1982 1983 1 984
Max. Min. and Mean valuee calculated from years 1894 to 1983
Sit elnarne: Watehpit FarmNat io nal gr id ref erence: TE 8138 1960A quif ec Chalk and Up per Greensand
41 J F PI A J A S 11 D J P/ J ./ A J F K A H J J A O N D J F J J A S O N D
8 1982 1983
Max,. Min . and Meanvalues calculated from years 1950 to 198 3
A break in thed ata line indicates a recording interval of greater than 8 Weeks
Wel l number: T F B1/2Measur ing levet 80-21 m 0 13
1984
31

32
Si t e nam e: T he rf ie ld Rec t or y , The rf iel dNat io na l g r id ref er ence: T L 3330 3720
A qu if er : Cha lk an d U ppe r Greensand
_i 1 1 1 1 1_t i_11 110 0
9 5 —
9 0
—
o H H
7 5 —
7 0
103
102 —
98 —
F ig ure I 3— (continued) .
I T I N x .1 10, 0
198 1 1982
Max. M in . and Mean values calc ulated f rom years 1883 10 1952 1956 to 1983
Sit e na me: A m pney C ruc isNat io na l g r id ref e renc e: S P 0595 0190 W ell number : S P 00/ 62A q ui f er : G reat Oo l it e Ser ies M easu r ing leve l : 110 -21 m OD
104 1 1 1 1 1 1 1 1 1 I 1 I 1 1 1 1_1 _1 i l l 1 1 1 1 1
Th c 07 7 1=-11 ! I .+ 0 u i r l a l s
1983
l .or lmi x lm, l s l H l l u n J;r i M ' 117 5 1Ai s l o l te 0 m 1)1 on S i c N o p i r N
198 1 1982 1983Max. M in . and Mean values calc ulated from years 1953 to 1983A break in the data line indicates a record ing inte rval o f greater than 8 w eeks
_
H Y D R O L O G I C A L D A T A 9 8 4
W el l nu m ber : T L 33/ 4
M easuring level : 154 -82 m OD
1_ 1
N fl
198 4
J 11, S I D ni l t
1984

R E V I E W O F G R O U N D W A T E R
r Th
Ftkure 13— (cont inued) .
Sit e nam e : New Red Lio n . A slackby tco nt inues O ld Red Lio n )Nat io na l a r id re f e rence: T F 0885 3034A q ui f er : Li nc o lns h i re Lim es t one
0 • l e
193 1 198 2 1983
M ax Min. and Mean va lues calculated i rom years 1964 to 1983
Sit e na me: Esp land Hi ll (n r . Br am pt on. A pp leb y)Nat io na l g r id ref er en ce: NY 6883 2301A qu if er : Per mo -T r iassic Sandst o ne
j I , I M I O M I
Sit e nam e: Eas t w ic k Farm , El lesm ereNat io na l g r id ref erenc e: SJ 3814 3831A qu if er : Bunt er Se r ies
69 0
tm L68 5 )4 ))
4
63 n —
19)31 198 2
A break in the data line I nd icates a recor ding int erval af greater than 8
Max M in. and Mean values calculated f rom years 1974 to 1983
Wel l num ber : I F 03 37M easu r ing lev e l : 33-45 ril O D
m i A I A I S 1 D
1 984
W el l nu mber : NY 62/ 4
M eas u ring level : 137 -69 m OD
: I I I I m . 1 1 m i I
e ln
1983 1934
W el l number : SJ 33/ 39
M easu r ing level : 74.57 m OD
1 r 1 1 ! I I L_L i I i n i I . i I r _it I I I , I ] n 1 , I i
Ln i , . -- -r i
,- - :
67 5 ! r -7 R)H Th aln1.4 s lul
1981 1982 1983 1984
33

34
99 5
99 0
98 5
98 0
97 .5
25 5
25 -0
24 5
24 0
23 -5
23 -0 —
22-5
Sit e nam e: Da le B row , M ac c lesf iel d
Nat io na l g r id re f er en ce: SJ 8969 7598
A q ui f er : Per mo -T r iassic Sa nd st o ne
I I
Figu re 13— (cont inued) .
T HLL_L
198 1 1982 1983
Max. M in. and Mean values calculated f rom years 1973 to 1983
A break in the data line indicat es a record ing int erval of greater than 8 w eeks
Sit e na m e: Busse ls N o .74, (Hex ham )
N at io na l g r id ref erenc e: SX 9528 9872
A q ui f e r: Per mo -T r iass ic Sand st one
1981 1982
Max. Min . and Mean values calc ulated f rom years 1971 to 1983
H Y D R O L O G I C A L D A T A 9 8 4
W el l num ber : SJ 87 / 32
M easu r ing leve l : 138.66 m OD
1984
W el l num ber : SX 99/ 37 8
M easu r ing leve l : 26 -07 rn
J I F I MI A I Ml i l i l A I S O M F M A M J J A S O N D J E M A M A S O N D _I F M A M J J A S O N D
1983 1984

R E V I E W O F G RO U N D W A T E R
38
32
81
78
76
74
70
68
66
64
Figure 13— (continued) .
Sit e name: Peggy El lert on Far m, Hazlew oodNat ional gr id ref erence: SE4535 3964A quif er M ag nesian Li mest one
I /
J F N A M J J A S O NIO J F N A tI J J A S 0
1981 1982
Max. Min. and Mean values calculated from years 1968 to 1983A break in the data line indicates a recording interval of greater than 8 weeks
Sit e name: Flushyford North East Great Chi lt onNat ional grid ref erent e: NZ 2876 2898Aquif er : Magnesian Limestone
Wel l num ber : SE 43/ 9M easuring level : 51-40 m OD
I
N A M 4 J A S CEN D J F
1983
Wel l nu mb er: NZ 22/ 22M easu ri ng level : 92,66 m O D
J F H A N J J A S 0 ft P i i a tI J J A S O N O J FI
1981 1-982
M ax. Min. and Mean values calculated f rom years 1967 to 1983
A S O N D J F N A J J 'A S O N D
i g8 3 19 84
35

á

Computation and Accuracy of GaugedFlows
Gauged fl ows are generally calculated by the conver-sion of the record of stage, or water level, using astage-discharge relation, often referred to as therating or calibration. Stage is measured and recordedagainst time by instruments usual ly actuated by afl oat in a still ing well. T he instrument records thelevel either continuously by pen and chart , ordigital ly on punched-tape or sol id-state logger,general ly. at regular (normal ly 15 minute) intervals.T his stage data is normal ly collected routinely,ty pical ly at weekly or monthly intervals, and taken toa regional centre for processing. At some gaugingstations provision is made for the rout ine transmis-sion of ri ver levels directly to the processing centre,by telephone l ine or, less commonly, by radio; onoccasions, satell ites have been used to receive and re-transmit the radio signal . Of ten, both digital andanalogue recording devices are deployed at gaugingstations to provide a measure of securi ty against lossof record caused by instrument malfunction.
T he stage-discharge relat ion is obtained either byinstalling a gauging structure, usual ly a weir or fl umewith known hydraul ic characteristics, or by measur-ing the stream velocity and cross-sect ional area atpoints throughout the range of fl ow at a sitecharacterised by its abil it y to maintain the relation-ship.
T he accuracy of the processed gauged fl owstherefore depends upon several factors:
i. accuracy and reliabil ity in measuring and re-cording water levels,accuracy and reliabil ity of the deri ved stage-discharge relation, andconcurrency of revised ratings and the stagerecord with respect to changes in the stationcontrol.
Flow data from ult rasonic gauging stations arecomputed on-site where the times are measured foracoustic pulses to traverse a river section along anoblique path in both direct ions. The mean rivervelocity is related to the dif ference in the twot imings and the fl ow is then assessed using the river'scross-sectional area. Accurate computed flows canbe expected for stable river secti ons and within arange in stage that permits good estimates of meanchannel velocity to be deri ved from a velocitytraverse set at a single depth, or at a series of fi xeddepths.
Flow data from electromagnetic gauging stat ionsmay also be computed on-site. T he techniquerequires the measurement of the electromotive force(ernf) induced in flowing water as it cuts a vert icalmagnetic fi eld generated by means of a large coil
RIVER FLOW DA TA
buried beneath the river bed, or constructed above it .This emf is . sensed by electrodes at each side of theri ver and is directl y proportional to the averageveloci ty in the cross-sect ion.
Bri tish and Internati onal Standards ar e followedas far as possible in the design, instal lation andoperation of gauging stations. Most of these Stan-dards include a section devoted to accuracy, whichresults in recommendat ions for reducing uncertain-ties in discharge measurements and for estimatingthe extent of the uncertainties which do ar ise.
T he national surface water archive exists toprovide not only a central database and retr ievalservice but also an extra level of hydrologicalvalidation. T o fun her this aim, project staff at theInsti tute li aise with their counterpar ts in the waterindustry on a regional basis and, by visiting gaugingstations and data processing centres, are acquiringthe necessary knowledge of local condit ions andproblems.
Scope of Flow Data Tabulations
River fl ow data are presented in two pan s. In thefi rst, daily mean gauged fl ows are.tabulated for 50gauging stations; dai ly natural ised fl ows (see p. 38)are also tabulated for the River T hames at K ingston.M onthly fl ow data for a further 160 gauging stationsare given in the second part . T he featured gaugingstations have been selected to give . a broad geo-graphical coverage and to typif y a wide range ofcatchment types found throughout the United King-dom. A map ( Fig. 14) is provided on page 42 toassist in locating the gauging stations featured in thissecti on.
For each gauging station, basic reference infor-mat ion is given together with comparative average,and extreme river fl ow and rainfal l fi gures basedupon the archived record.
Explanatory notes precede the two sets of tablesand wil l assist in the interpretation of particularitems. T he notes relating to the daily fl ow tables ar egiven below; those relating to the monthly data aregiven on page 95.
P art (i ) - the daily mean flowtabul ati ons
Station NumberT he gauging station number is a unique six digitreference number which serves as the primaryidentifi er of the station record on the surface waterarchive. T he fi rst digit is a regional ident ifi er being 0for mainl and Bri tain, 1 for the islands around Britainand 2 for I reland. T his is followed by the hydrome-tric area number given in the second and third digits.

38 H Y D R O L O G IC A L D A T A : 1984
Hydrometric areas are either int egral river catch-ment s having one or more outlets to the sea or tidalestuary, or , for convenience, they may includeseveral continguous river catchments having , topo-graphical similar ity with separate tidal outlets. InBritain they are numbe red 'from 1 to 97 in clockwiseorder around the coast line commencing in north-eastScotland: Ireland has a unifi ed numbering systemfrom 1 to 40, commencing with the River Foylecatchment and circu lat ing clockwise; not all Ir ishhydrometric areas, however, have an outlet directlyon the coast.
T he numbers and boundaries of the UnitedKingdom hydromet ric areas are shown in the front is-piece.
T he pract ice followed in the earlier Sur faceWater : United Kingdom publications of using thefourth digit to denote cei tain characteristics of agauging stat ion, or its fl ow record, has been discon-tinued. Normally this funciion is now performed bythe stat ion desc ription ( see below) .
T he fourth, fi fth and sixth digits comprise thenumber, usually allocated chronologically, of thegauging sta tion within the hydrometric area.
Where the lead ing d igit, Or digits, are zero theymay be omitt ed giving rise to apparent four or fi ve-digit re ference numbers.
Measuring A uthoriry .
An abbreviation referencing the organisation respon-sible for the operat ion of the gauging stat ion. A list ofmeasuring aut hor ity codes together with the corre-sponding names and addressses for all organ isationscurrently contribut ing data to the surface waterarchive appears on pages 178 and 179.
Grid Ref erence
Standard two- let ter and six fi gure map referenceusing the National G rid in Great Brit ain and theIrish Grid in Norther n Ireland. (T he Irish Grid hasonly one prefi x let ter but it is common pract ice toprecede it with the let ter I to mak e the identifi cationclear.)
Catchment A rea
T he surface catchment area in the horizontal planeof the gauging station in square kilometres. T hereare a few gauging stations where, because ofgeological considerat ions, the groundwater catch-ment area differ s appreciably from the sUrface watercatchment area and, in consequence, the basefl ow,whether augmented or diminished , may cause therunoff values to appear anomalous.
First Year
T he year in which the station started producing dailymean fl ow data, usually the fi rst year for which data
are held on the surface water archive. Earlier data,often of a sporad ic nature, or of poorer quality, mayoccasionally be available from the measuring author-it ies or other sources.
Lev el of Station
T he level of the station is, genera lly, the level of thegauge zero in metres above Ordnance Datum, orabove Malin Head Datum for stations in NorthernIre land. Although gauge zero is usually closelyrelated to zero discharge, it is the practice in someareas for an arb itrary height, typically one metre, tobe added to the level of the lowest crest of ameasuring structure to avoid the possibility of falserecord ing of negative values by some digital recor-ders.
M aximum A ltitude
T he level to the nearest metre of the highest point inthe catchment area.
Table of daily mean gauged (or naturalised)discharges
T he mean fl ow in cubic metres per second (cumecs)in a water-day, n ormally 0900 am to 0900 am. T henaturalised discharge is the gauged discharge ad-justed to take account of net abstrations anddischarges upstream of the gauging station.
Peak Flow: T he highest fl ow in cubic metres persecond for each month. T he day of peak generallyrefers to the water-day but the calendar day is alsoused, particularly in Scotland. Normally the peakflow corresponds to the highest fi fteen minute fl owwhere water levels ar e recorded d igitally, or thehighest instantaneous fl ow associated with maximumstage where analogue recorders are used.
Runoff : The notional dept h of water in millimet resover the catchment equivalent to the mean flow forthe month as measured at the gauging station. It iscomputed using the relat ionship:
Runoff in mm =Avera e Flow in Cumecs X 86.4 X n
Catchment Area (km )
where n is the number of days in the month. T herunoff tota l is rounded to the nearest millimet re.
Runoff is computed on the basis of naturalisedfl ows (see 'Factors affect ing the fl ow regime' ) for theminor ity of catchments where daily, or monthly,naturalised fl ows are available.
Rainf all: T he rain fall over the catchment in milli-metres for each month. It is derived by fi rstobt aining the long-pe riod ( 194 1- 70) average annual

R I V E R F L O W D A T A 39
rainfall for each catchment. T hen , for each of ase lected number of raingauges chosen to representthe catchment, the monthly rain fal l is expressed as apercentage of its ann ual average rainfall . Thepercentage values of rain fall for each raingauge aresummed and their mean obtained to give a catchmentpercentage value for the month, which is thenconverted to monthly mean rainfall . Accur acy there-fore depends largely on the reliability of the assess-ment of the ar eal annual average and on theadequacy of the network of raingauges used torep resent an area. Where, as for instance in somesmall mountainous catchments, raingauges are fewand their siting and exposure is not ideal, greatprecision in the areal rainfal l est imates cannot beexpected.
Statistics of monthly data f or p rev ious record
Only complete monthly records are used in thederivation of the average, low and high values ofriver fl ow, runoff and rainfall. T he rainfall andrunoff statistics are normally directly comparablebut full equivalence will not obtain where the patt ernof missing data differs between the archived rain falland runoff data se ts.
Where applicable, a guide to the amount ofmissing data is given following the sect ion heading.
Summary statistics
Current year fl ow sta tistics are tabulated alongsidethe corresponding values for the previous record.Where appropriate, the current year fi gures areexpressed as a percentage of the preceding average.
Mean Flow: T he average of all available daily meanfl ows during the term indicated.
Lowest Daily Mean: T he value and date ofoccurrence of the lowest mean fl ow in cubic metresper second in a water-day dur ing the term indicated .In a record in which the value recu rs, the date is thatof the last occasion.
It should be emphasised that river fl ow measure-ment tends to become more imprecise at very lowdischarges. Very low velocit ies, heavy weed growthand the insensitivity of stage-discharge relat ionscombine with the diffi culty of accurat ely measuringlimited water depths to reduce the accuracy ofcomputed fl ows.
T he reliability of both the lowest daily mean fl owand the 95 percentile fl ows (see below) as rep resen-tative measures of low fl ow must be consideredcarefully and the values used with caution in view ofthe increasing proport ional var iability between thenatural fl ow and the art ifi cial influences, such asabstractions, discharges, and storage changes as theriver fl ow diminishes.
Peak T he peak fl ow in cubic metres per seconddur ing the term indicated. T he date of occur rence,normally the water-day, is also ind icated. Generally,the peak fl ows are derived from the record ofmonthly instan taneous maximum fl ows stored on thesur face water archive. As a result of par ticular fl ow-measurement diffi culties in the fl ood range, this peakflow series is often incomplete. Consequentl y, insome cases, the peak flow from the previous periodof record has been abstracted from Volume IV of theFlood Studies Repor t' . Reference to this reportshould be made to check for historical fl ood event swhich may exceed the peak falling with in the gaugedfl ow record .
10 Percentil e T he fl ow in cubic metres per second*which was equalled or exceeded for 10 per cent ofthe specifi ed term - a high fl ow par ameter which,when compared with the mean may give a measure ofthe var iability, or ' fl ashiness', of the fl ow regime.T he 10 percentile is computed using daily fl ow dataonly for those years with ten days, or less, missing onthe surface water archive .
50 Percentil e T he fl ow in cubic metres per secondwi: ich was equalled or exceeded for 50 per cent ofthe specifi ed term - the median value. T he sameconditions for completeness of the annual recordsapply as for the 10 percentile fl ow.
95 Percenti le T he fl ow in cubic metres per secondwhich was equalled or exceeded for 95 per cent ofthe specifi ed term - a signifi cant low fl ow parameterrelevant in the asse ssment of river water qualityconsent conditions. T he same conditions for com-pleteness of the annual records apply as for the 10percent ile fl ow.
Factors aff ecting fl ow regime
An indicat ion of the various ' type s of abstractionsfrom, and discharges to, the river operat ing withinthe catchment which alter the natural fl ow is givenby a standard set of abbreviated descriptions. In Part( ii) the monthly fl ow data - each descript ion isshortened to a code letter . An explanation of theabbreviated descriptions and the code letters follows.With the exception of the induced loss in surfacefl ow resulting from under lying groundwater abstrac-tion, these codes and descriptions refer to quantifi a-ble variations and do not include the progressive, anddiffi cult to measure, modifi cat ions in the regimerelated to land-use changes.
'Flood Studies Report 1975. Natural Environment Research Council ( 5vol t )

40 H Y D R O L O G IC A L D A T A : 1984
COD E EXP LA NAT IO N
•
Natural , i.e., ther e are no abstractions anddischarges or the variation due to them is solimited that the gauged fl ow is within 10% ofthe natural flow at , or in excess of, the 95 .percentile fl ow.
Storage or impounding reservoir. Naturalriver fl ows will be affected by water stored ina reservoir situ ated in, and supp lied from, thecatchment above the gauging stat ion.
•
Regulated river . Under cer tain fl ow condi-t ions the river will be augmented fromsurface water and/ or groundwater storageupstream of the gauging station.
Public water supplies. Natural river fl ows arereduced by the qu ant ity abstracted from areservoir or by a river int ake if the water isconveyed outside the gauging station's catch-ment area.
Groundwater abstract ion. N atural river fl owmay be reduced or augmented bygroundwater abstrac tion or recharge. T hiscategory includes catchments where mine-water discharges infl uence the fl ow regime .
•
Effl uent return . Ou tfl ows from sewage treat-ment works will augment the river fl ow if theeffl uents originate from outside the catch-ment .
Industr ial and agricult ural abstr actions. Di-rect industrial and agricultural abst ractionsfrom surface water and from groundwatermay reduce the natural river flow.
•
Hydro-elect ric power. T he river flow isregu lated to suit the need for power genera-tion. .
Excep t for a smal l set of gauging stations for whichthe net var iation, i.e. the sum of abstractions anddischar ges, is assessed in order to derive the 'natural-ised ' fl ow from the gauged flow (see page 38) , therecord of ind ividual abstr act ions, discharges andchanges in storage as indicated in the code above isnot held centrally.
Station description
A concise descript ion of the gaUging stat ion. Whenappropriate, details of the sta tion history are in-
ABBREVIAT ED DESC RI PT ION
Natural within 10% at the 95 percentile fl ow.
Reservoirs in catchment.
Augmentat ion from surface waterand/ or groundwater .
Abstraction for public water supply.
Flows infl uenced by groundwater abstr act ionand/ or recharge.
Augmentat ion from effl uent returns.
Flow reduced by industr ial and/ oragricultural abstraction.
Regu lat ion for HEP.
cluded together with any factors limit ing the avail-ability or accuracy of the associated river fl owrecord.
Comment
A summary of any important factors influencing theaccuracy of the current year 's flow data specifi cally;for instance, the reconstruction of a gauging stationor the use of ext rapo lated stage-d ischarge relationsduring periods of very low or very high flows.

R I V E R F L O W D A T A 4 1
STATIONS FOR WHI CH DAILY OR MONT HLY DAT A ARE GIVE N INT HE RIVE R FLOW SE CTION
SI AT ION RIVER NAM E AN D ST ATI ON NAM E
NU M BER
SEE
PAGE
D 3( 03 OYK EL AT FA ST ER T URNAI G 44
400 1 CON ON AT M OY BRI DG E 96
7002 FI NDHORN AT FORRES 96
1) 8006 SPEY AT BOAT 0 BRI G 45
900 2 DEVERON AT M UIRESK 96
10002 UGI E AT I NV ERUGIE 96
11031 DON AT PARKH IL L 97
D 12001 DEE AT WOOD END 4613007 NORTH ESK AT LOG IF M I L L 97
13008 SO UT H ESK AT BRECHIN 97
14001 EDEN AT K EM BACK 97
D 15006 T AY AT BALL AT HIE 47
16003 RUCH IL L WAT ER AT CULT YBRAGGA N 98
16034 EA RN AT FORT EVI OT BRI DG E 98
17002 L EVEN AT L EVEN 98
17005 AVON AT POL M ONT H IL L 98
18003 TEIT H AT BRIDG E OF T EIT H 99
18005 ALLA N WAT ER AT BRIDG E OF AL LA N 99
D 1900 1 AL MON D AT CRA IG IEHAL I . 48
2030 1 T YN E AT FA ST L INT ON 99
21006 T WEED AT BOL ES1DE 99
D 21009 TW EED AT NO RHAM 49
21012 T EVIOT AT HA WI CK 100
21018 LYNE WAT ER AT LYN E ST AT ION 100
21022 WH I T EAD DER WAT ER AT HUTT ON
CAST L E 100
D 2200 1 COQUET AT M ORWICK 50
22006 BLYT H AT HART FORD BRI DGE 109
2300 1 T YNE AT BYW EL L 101
D 23006 SOUT H T YN E AT FEAT HERSTON E 51
23007 DERWEN T AT ROWL ANDS G IL I . 101
24004 BEDBU RN BECK AT REDBU RN 101
24009 WEAR AT CH EST ER L E ST REET 101
D 25001 T EES AT BROK EN SCAR 52
25006 GRET A AT RUT HERFORD BRI DG E 102
250 18 T EES AT M I DD L ETON IN T EESDA L E 102
250 19 L EVEN AT EASBY 102
25020 SKERN E AT PREST ON L E SKERN E 102
26003 FOST ON BECK AT ROST ON M I L L 103
26004 GY PSY RACE AT BRIDL INGT ON 103
D 27002 WH AREE AT FL I NT M IL L WEIR 53
27007 URE AT WESTWICK LOCK 103
D 27025 BOT HER AT WOODHOUSE M IL L 54
27030 DEA RN E AT ADW ICK 103
27031 COL NE AT COL N EBRIDG E 104
D 27035 AIRE AT K IL DW ICK BRIDG E 55
D 27041 DERWENT AT BUT FERCRA M BE 56
27042 DOVE AT KI RKBY M I L LS 104
27043 WHA RFE AT ADD INGHAM 104
D 27053 N IDD AT BIRST WITH 57
27059 LA VER AT RIPON 104
27071 SWA L E AT CRAK EHIL L 105
D 28009 T RENT AT COLW ICK seD 280 10 DERWEN T AT L ON GBRIDG E WEI R 59
28012 T REN T AT YOXA L L 105
ST ATI ON RIV ER NAM E AN D ST AT I ON NAM E
NU M BER
•280 18 DOVE AT MA RST ON ON DOVE
28024 WREA K E AT SYST ON M IL L
2803/ MA NI FOLD AT ILAM
28039 REA AT CAL T HO RPE PARK
28080 T AM E AT LE A MA RST ON LAKE S
28082 SOAR AT L IT TL ET HORPE
250 33 L UD AT LOU T H
D 30® 1 WI THAM AT CLA YPOL E M I L L
30034 PARTN Ey LYM N AT PART NEY M I L L
31002 GL EN AT KA T ES BRI DGE
31007 WEL LAN D AT BARROWD EN
D 32001 N EN E AT ORT ON
32003 HARPERS BROOK AT OL D M I LL
BRI DG E
32054 ISE BROOK AT HARROWD EN OL L)
M IL L
D 33032 BEDFORD OU SE AT BEDFORD
33(0 3 CAM AT BOT T ISHAM
33004 LA RK AT ISLEHAM
33012 K YM AT M EAGRE FA RM
33013 SAPIST ON AT RECT ORY BRIDG E
33024 CAM AT DERN FORD
3400 1 TA RE AT COL N EY
34002 T AS AT SHOT ESHAM
D 34006 WAV EN EY AT N EEDHAM M IL L
340 18 Sl I FFK EY AT WA RHAM AL L SAI NTS
35002 DEBEN AT NAUNT ON HA L L
D 36006 ST OUR AT L AN GI1AM
37001 RODI NG AT REDBRI DG E
37005 COL N E AT LEX DEN
37010 BLACK WAT ER AT APPLEFORI ) BRIDG E
37014 ROD 1NG AT H IG H ON GA R
38001 L EE AT FEIL DES WEI R
D 38003 M IM RA M AT PAN SHA NG ER PARK
38007 CA NO NS BROOK AT EL IZA BE I H WAY
38021 TU RK EY BROO K AT ALBAN Y PARK
D 3900 1 T H AM ES AT K I NGST ON1T EDDINGT ON
39002 T HAM ES AT DAYS WEIR
D 39007 BLA CK WAT ER AT SWALL OW FI EL D
39014 VER AT HA NST EA DS
390 16 KEN N ET AT T HEAL E
390 19 LAM BO URN AT SHAW
1) 39020 COL N AT BI BURY
39023 WY E AT I I EDSOR
39026 CH ERWEL L AT BAN BURY
39029 T IL L INGBOU RN E AT SHAL FORD
39049 SIL K ST R EAM AT COL INDEEP LA NE
39069 M OLE AT K IN N ERSLEY MA NOR
40003 M EDWA Y AT T EST ON
40034 BOTH ER AT UDIAM
D 40005 BEULT AT ST IL E BRI DG E
400 09 T EISE AT ST ONE BRIDG E
41001 N UN N1NGHAM ST REAM AT T ILL EY
BRI DG E
41005 .OU SE AT GOL D BRIDG E
SEE
PAG E
105
105
106
106
106
106
107
60
107
107
107
61
108
108
62
108
108
109
109
109
109
110
63
110
110
64
66
112
67
112
113
113
68
113
113
114
114
114
114
115
69
S
115
115
conanued on p. 43

42
pi- 226
Fzk ure 14. Gauging station locatzon map .
i -7, 202
ptp i ', 5 203
2014 -
p i 236
pt 206
2
( t&eA 5 I I
I 1
•
4 71-4 17'-'1
5
•' 6 737 12
711 ..., 414,Hi k „
\ , 3 (
654 66
i • 10 72
697,4 2
18 2 5. 2°
. 71 • 4 2
•
• Gauging Station for w hichdaily data are given
• Gauging Station for whichmonthly data are given
The l ol l ga ug in g ata ti o n re fe renc e nu mb eranal a nnes t he heel ro me tr ue a rea nu mb erf ol lo w ed by Ih e !az:av id oar s t 8 110 11 nu m be r
4,3
• 186/2 ?0 . ' a 9 ,16a
82 .. 1 2 2 0 8 0
1 3 3 • 2—
6
6 1A 26 1- 14:t - ' 13 ,•, 13
1• -,-
--- ‘
3 / 60 3• .• 3 -_ 38 i ' t -- 0 5
1, 14 0 iii 10 i
l i 5 7 ' 7 (
b8 a 6 53 i .- - i 2 . 4 9
-- -1 0 7 ‘ -- -J 6 ‘ -, 1' 6•251 .3
3 •
•.2, [4, 5° : 'LAT)). ; ). ) )6 )t 4-2 ' 2/ 4 25
lA - - 3 6 - 1AC-Ir t•
C11; ? 10 149 *V e ' 17 • -
t i e,43

R I V E R F L O W D A T A 4 3
A ' Ds indicates that the featured station ts in the dai ly fl ow section
ST ATION RIVER NAM E AND STATI ON NAME
NUMBER
SEE
PAGE
SEE
PAGE
STATI ON RIVER NAME AND STATI ON NAME
NUMBER
41006 UCK AT ISFI ELD 116 57008 RHY M N EY AT LLA NED ERYN 1261) 410 16 CUCKM ERE AT COW BEECH 70 58006 ME L LT E AT PO NT NEAT HV AUGHA N 126
41025 LOXWOOD STREAM AT DRUNGEWI CK 116 59001 T AWE AT YNY S T ANG L WS 1264 1027 ROTH ER AT PRINCES MA RSH 116 60003 T AF AT CL OG -Y -FRA N 126
42003 L YM 1NGT ON AT BROCK EN HURST PARK 116 61003 GWA UN AT CI L RI 1EDYN BRI DG E 127
42006 M EON AT M ISLI NGFORD 117 D 6200 1 T EIFI AT G IA N T EIFI 82
42008 CH ERIT ON STREAM AT SEWARDS 6300 1 YST WY T H AT PONT L L OL WYN 127
BRIDG E 117 64001 DO VEY AT DOVEY BRIDG E 127
D 420 10 IT CH EN AT H IG HBRI DG E AN D 64002 DYSYN N I AT PONT -Y-GARTH 177
AL LBROOK 71 D 6500 1 G IA SLYN AT BEDDG EL ERT 83
42012 ANT ON AT FUL L ERT ON 117 65005 ERCH AT PEN CAEN EWYD D 128
D 43005 AVON AT AM ES BURY 72 66006 EL WY AT PONT -Y -GWY DD EL 128
43006 NADDER AT WI LT ON PARK 117 670138 AL YN AT PONT -Y -CA PEL 128
43007 ST OU R A I T HROO P M I L L 118 D 67015 DEE AT MA N L EY HA LL 8444002 PIDD LE AT BAGG S M I L L 118 D 6800 1 WEAV ER AT ASHBROOK 85
D 45001 EX E AT T H ORVERT ON 73 68003 DAN E AT RUDHEA T H 12845003 M EM AT WOO DM I L L 118 69002 IRWEL L AT ADEL PHI WEIR 1294500 5 0 IT ER AT DOT TON 118 69006 BOL L IN AT DUNHAM MASSEY 1294600 2 EIG N AT PREST ON 119 12969015 ET H EROW AT COM PST ALL
46003 DART AT AUST INS BRI DGE 119 70004 YA RROW AT CROSTON M I LL 129
13 4700 1 T AM A R AT GUN NISLAK E 74 D 71001 RI BBL E AT SAM LESBU RY 8647007 YEAL M AT PUSL INCH 119 71004 CA L DER AT WHAL LEY Cli EIR 11047008 T HRUSH EL AT T1NHAY 119 72002 WY RE AT ST M ICHAEL S 13048004 WARL EGGA N AT T REGOFFE 120 72004 L UN E AT CAT ON 13048005 KEN WY N AT T RU RO 120 73005 K ENT AT SEDGWIC K 130
48011 FOWEY AT REST OM EL T WO 120 D 730 10 L EVEN AT NEWBY BRIDG E 874900 1 CAM EL AT DEN BY 120 74001 DU DDON AT DUDDON HA LL 1314900 2 I IAY L E AT ST ERT H 121 74002 IRT AT .GA L FS YK E 131
D 50001 T AW AT UM BERL EIGH 75 74005 EH EN AT BRAYST ON ES 131
50002 T ORRI DG E AT T ORRINGT ON 121 75002 DERWENT AT CAM ERTON 131
D 52005 T ON E AT BISHOPS HU L L 76 D 76007 ED EN AT SHEEPMOU NT 8852006 T EO AT PEN M IL L 121 76015 EAM ONT Kr POOL EY BRI DGE 132
. .52007 PARRET T AT CH ISEL BOROU GH 121 78003 AN NA N AT BRYD EK IRK . 132
53004 CHEW AT comr rON DA N DO 122 78004 K IN N EL WAT ER AT REDHA LI . 132
D 53006 FROM E (BRISI OL ) AT FRENCI IAY 77 D 79006 N 17 I1 AT DRUM LA NRIG 89 •
51007 FROM E (SOM ERSET ) AT T EL L ISFORD 122 8000 1 URR AT DA L BEAT T IE 132
53009 W EL LOW BROOK AT WEL LOW 122 8100 3 L UCE AT AI RYH EM M ING 133
530 18 AVON AT BAT HFORD 122 8200 1 GIRVAN AT ROBST ON E 133
D 541:0 1 SEVERN AT BEWDL EY 78 83003 AYR AT CAT RIN E 133D 54002 AVON Al EVES /1AM 79 1) 84005 CL YD E AT BL AIRST ON 90
54006 ST OU R AT K I DD ERM INSTE R 123 840 12 W HIT E CART WAT ER AT HAWKH EA D 133
54008 T EM E AT T EN BURY 123 840 16 L UGG IE WAT ER AT CON DORRAT 134
540 12 T ERN AT WA LCOT 123 85001 L EVE N AT LI N NBRAN E 134
540 19 AVON AT ST ARET ON 123 D 850133 FAI .LOCH AT G LEN FAL LOCH 91
54020 PERRY AT YEAT ON 124 9400 1 EW E AT POO LEWE 134
54022 SEVERN AT PL YN LIM ON FL UM E 124 9500 1 I NVER AT L IT T L E ASSYNT 134
55008 WY E AT CEFN BRWY N 124 9600 1 HA L LA DA L E AT HA L LADA LE 135
55013 ARROW Al T I TL EY M I L L 124 101002 M EDI NA AT UPPER SHI DE 135
55014 L UGG AT BYTON 125 D 20 1005 CAM OW EN AT CAM OWEN T ERRA CE 92
550 I 8 H OM E AT YA RK H IL L 125 20 1007 BU RN DEN N ET AT BURN DENN E7
55023 WY E AT REDBROO K 125 BRI DG E 135
D 55026 WY E AT 0 00 1. FARM 80 D 20 3010 BLACKWAT ER AT MA YDOWN BRIDG E 9 3
D 5600 1 USK AT CHA IN BRIDG E 8 1 205005 RAV ERN ET AT RA VERN ET 135

44 H Y D R O L O G I C A L D A T A : 19 8 4
0 03 003 Oy k e l at Eas t e r Tu rna lg
Stat ion desc ript ionVeloc ity -area station Flow contained under cableway 18 ) t o 3 .8
1984M ea Suri ng aut ho ri t y HRPB GridFir st y ear . 19 7 7 Level
D a i ly m e an gauged discharges (cubic me tr es per secon d )
DAY JAN . FEB MAR APR MAY52 540 11 3 70 26 2 10 4 0 26
reference- NC 40300 1si n (m OD) 15 62
A P I A lt92 7 0 6 14 2 25 1
AUG4 20 3
SEP5 88 7
Catchment area (so km). 330 .7Max alt . (m OD) 998
CCT NOV CC12 20 200 7 3 12
2 36 440 42.500 14 420 3 6 73 735 0 777 2 095 2 738 6 696578057 4
14 630 5 22 73 28 360 71 400 78 170 3 53 1 600 0 9 17 1 689 1 98 1 • 17 7 10 10 640 11 700 6 8544 16 760 55 290 70 60 3 3 2 77 520 2 8 19
1 341 646 6 962 17 990 7 529
5
6
76 200
76 140
26 86 0
18 130
2 7 090
2 7 290
3 152
3 130
420
25 3
2 188
1 29 5
1 145
1 0 17
1 568
2 156
• 054
2 732
12 700
14 20 0
6 26 7
4 890
191 083 101
19 5907 37 880 14 770 14 740 4 524 100 0 .98 2 1 00 5 2 50 1 2 168 22 660 4 8 73 5 1.1408 18 330 19 150 9 12 1 5 104 0 99 6 0 824 0 88 8 1 99 1 7 630 36 .680 12 800 28 5609 4 1 0 10 5 7 6 70 7 3 72 7 3 17 1 0 15 0 744 0 8 15 2 0 59 27 0 20 18 250 19 760 160 200
10 68 230 103 80 0 6 244 23 560 1 392 0 65 1 0 796 1 639 28 4 10 29 270 29 980 129 300
11 5 1 140 53 5 70 12 760 22 04 0 1 189 0 625 0 790 1 293 29 2 70 29 530 10 560 25.340
12 33 570 25 490 9.33 8 2 1 150 1 05 0 0 790 0 759 1 140 13 280 20 100 7 557 12 0 7013 12 400 29 780 7 0 39 53 430 0 95 8 1 166 0 734 1 0 15 11 430 25 990 5 409 7 59014 10 4 70 15 2 10 5 160 46 0 10 0 9 72 2 28 6 0 73 7 0 904 9 88 7 .14 290 4 2 17 5 75 115 8 250 8 705 4 229 4 7 020 17 1 98 4 0 8 13 0 83 3 6 6 58 13.6 20 6 993 4 772
16 6 906 11 800 5 7 17 38 . 150 30 8 80 0 1 16 7 0 790 13 040 8 92 1 9 .774 4. 10717 7 365 16 420 4 63 7 28 880 5 12 359
1 930 76 7 14 350 8 84 3 9 196 16 090
18 8 2 7 1 12 380 3 939 34 160 186 10 1 1 832 0 824 25 6 10 105 400 10 420 9 55319 7 904 .5 88 7 3 2 7 1 20 850 06 9 26 5 1 484 0 824 68 960 40 990 12.260 3 7.82020 15 550 4 434 2 734 13 6 10 103 95 1 1 24 8 0 822 2 7.4 10 30 330 2 1 170 33 220
2 1 22 3 10 4 200 2 .358 14 250 0 67 1 659 1 3 12 0 78 7 12 140 65 790 22 7 10 -49 39022 2 1.730 . 14 030 2 173 7 963 00 5 6 46 1 1.482 0 745 13 360 35 110 14 450 27 11013 20 4 10 13 0 50 2 00 3 5.359 0 94 4 5.356 1 38 5 0 66 2 25 500 26 080 1 92 2 59 9 1024 18 46 0 25 800 43 180 4 564 0 .898 10 2 70 1 270 0 648 22 100 26 760 3 7 640 310 8; 025 17 030 13 89 0 33 .940 4 23 7 0 899 13 730 1 090 0 620 12 050 8 1 930 18 860
5 0 3
26 16 780 9 700 26 160 4 0 17 0 943 12 0 70 1 0 73 0 58 8 7 540 38 360 11 160 7 3 7227 15 920 8 74 1 4 1 140 3 33 1 0 84 8 17 550 25 260 0 575 14.4 50 19 430 55 200 5.21628 13 390 15 480 22 190 2 8 7 1 0 794 1.988 271 006203 0 59 6 48 350 11.090 3 7 390 4 39429 13 2 70 26 230 12 350 2 58 1 0 760 4 102 0 656 15 0 70 13 890 20 960 .13 62030 11 630 7 574 2 30 5 0 726 2 7 10 9 83 2 16 890 29 68 0 13 0 10 9 99 8 16 3503 1 11 390
5 30 680 7 764 17 820 13 0 70 3 1.730
Av erage 25 680 25 .370 17 380 14 600 1 130 3 634 3 35 7 1 332 17 680 26 64 0 15 540 2 7 210902Low est 6 90 6 4 20 0 2 00 3 2 305 0 .680 0 6 14 0 734 0 .515 1 168 7 54 5
4 12 4
h ighest 76 200 10 3 800 78 170 53 430 1.921 17 550 25 160 17 820 68.960 10 5 400 55 200 160 .200
Peak fl o w 119 200 13 1 300 149 400 10 3 800 2 199 33 8 10 52 080 29 630 135 000 179 000 90 660 3 18 100Day of peak 12 10 4 14 1 25 28 3 1 19 18 28 10MontNy tot al .(minion cu m) 68 18 63 5 7 46 56 3 7 85 3 0 3 9 42 8 99 6 25 45 83 7 1 35 40 .29 73 09
Runoff ( nrnl 20 8 192 . 14 1 114 9 28 2 7 19 139 2 16 122 22 1Rainfall Imm) 30 1 14 1 150 117 29 89 76 52 209 275 154 22 6
Stat i st ics of mo nt hly dat a for pr ev iou s race r. d (Noy 1977 to trec 19831
Mean 'A vg 28 84 0 15 3 10 2 1 390 8 776 6 705 7 4 75 7.8 13 9 234 25 0 70 29 47009 032 5923 23 37770flo ws Low 18 030 9 .324 6 64 9 51944 5 11906 7 20 7952 2 87593 4 70 7 19 450 7 328 14 420 8 24 5
(year) 1980 1982 198090 90 19 19
1983 1983
19 19 19
1. 9h 43 980 22 6 10 40 740 17 720 14 380 1419140 15 62909 1719291 3 1.810 4 1 100 49 380 38 2 10(vey ) 1983 198 1 1983 19 79 ' 1982
90 19198 1 1980 . 198 1 - 1980
Runoff Avg 234 113 173 69 54 59 63 75 197 238 255 189Low 130 68 54 43 9 6 23 38 152 59 113 6 7Nigh 356 165 330 139 116 11 1 127 140 250 333 38 7 309
Ragnfal l Avg 252 99 193 8 1 at 112 10 1 126 254 2 76 308 2 16. Low 150 66 76 50 30 44 60 58 1 10 96 92 82Hpgh 40 8 162 30 8 129 154 176 169 244 326 40 1 45 8 36 1
Summary stat istics -
For 1984
Fact ors af fec t ing fl ow regi me1984
F0 1 record As % ofPI OCed in g 1984 are-1984 • Nat ura l 10 w it h in 10 % at 95 percenti le fl ow

R I V E R F L O W D A T A 45
008006 Spey at Boat o Br ig 1984Measuring authority : NERP8First year : 1952
Grid reference : NJ 3 185 18 Cat chment area Ng kink 28 6 11Level stn . (m OD) 43 .12 Max att . (m 0 0 ): 1309
Dai ly m ean gauged d ischarges (cubic mats per second)
Stat ion descript ionVeloci ty -area stat ion. 399 sq km Developed for hyd ro-electr ic pow er product ion

46 H Y D R O L O G I C A L D A T A : 1 9 8 4
0 1 2 0 0 1 De e a t W oo d e ndM ea suring aUthOr it y . NEA RSFir st year 19 2 9
Dai ly m ean gauged d isc harges (cubic m et res per see andl
Grid reference NO 63 5956Level stn (ni 00 ) 70 .49
Stat istic s of mo nthl y dat a for prev iou s record (Oct 1929 t o Dec 1983)
Stat ion descript ionVeloc ity -area station.The low est flow s prio r to 19 7 1 are considered to be of limited accuracy
1984Catc hme nt area (se km) 1370 0
Mat alt (rn 0 01:13 10
DAY • JAN FEB MAR APR MAY JUN JUL AUG SEP OCT NOV DECI 123 00 0 21 800 85 160 38 740 50 980 22 980 8 80 9 8 30 5 6 52 4 26 980 40 000 93 9 102 72 2 10 24 0 50 5 1.290 36 270 46 420 . 2 1 740 8 90 2 6 4 75 • 8 86 6 26 820 53 280 74 3503 46 740 • 28 0 90 46 460 34 720 44 930 29 10 0 9 6 78 5 998 4 1 540 30 770 148 20 0 75 0 804 48 .550 29 720 128 .50 0 3 2 60 0 42 130 35.660 8 552 6 09 7 18 500 44 260 150 703 64 3805 46 850 30 500 112 500 33 030 40 200 30 860 7 9 56 6 085 14 990 30 8 70 . 76 4 50 80 94 0
6 43 88 0 26 550 105 800 34 3 70 36 0 70 2 7 640 7.590 7 59 3 12 0 50 13 100 55 820 68 5907 4 1 830 22 630 10 1 500 38 200 29 8 70 22 830 7 4 16 6 8 14 10 190 20 930 53 9 70 68 130
34 2 70 23 2130 75 290 54 740 26 4 10 19 440 7 119 6 2 15 9 3 76 10 0 70 142 400 66 4909 , 3 1 7 10 21 750 62 950 68 090 25 693 16 790 6 8 10 5 8 10 15 400 17 8 10 180 50 3 56 50 0
10 6 7 830 30 700 69 640 108 700 29 490 15 2 10 6.78 8 5 53 8 35 860 16 460 29 5 500 49 3 70
I I 112 30 0 46 650 69 5 70 98 8 70 28 600 13 940 6 6 77 5 220 23 250 18 460 117 20 3 43 9 7012 65 38 0 56 410 53 200 72 800 26 750 13 900 7 89 7 5 0 19 16 920 16 790 127 50 3 40 0 3013 69 790 66 2 10 43 .890 . 17 1 100 26 980 16 7 10 11 280 4 890 15 180 17 840 BO 930 36 0 8014 49 990 5 1 640 38 6 70 194 000 28 700 13 500 9 4 79 4 783 14 9 10 22 940 9 7 630 35 11015 40 380 4 1 3 70 34 740 98 660 28 630 12 320 8 732 4 8 76 13 380 17 730 / 65 20 3 4 1 BOO
16 35 320 39 0 10 3 1 650 66 390 25 420 11 640 8 4 18 4 729 12 0 10 15 920 t 165 800 52 30017 3 1 8 70 76 640 28 590 54 0 70 22 430 13 040 7 833 4 685 11 770 15 200 146 200 80 68018 30 660 10 3 700 26 4 70 79 240 22 680 11 0 40 7 20 6 4 8 10 12 170 9 1 160 177 300 50 32019 25 490 63 33 0 24 920 133 200 22 760 . 10 430 6 866 4 880 10 730 59 1 70 185 900 45 96020 23 880 46 440 .2 3 550 138 400 12 800 9 9 72 6 4 72 4 706 9 89 5 44 330 152 200 6 1 960
2 1 16 760 4 7 540 22 690 185 400 12 480 9 6 78 6 09 7 4 40 4 9 96 3 36 96 0 128 300 4 1 50022 22 090 93 300 2 1 780 102 800 13 450 • 9 734 5 944 4 192 10 05 0 53 100 135 700 40 40023 27 6 10 68 9 70 2 1 56 0 83 780 32 0 50 12 320 5 83 1 4 0 83 85 5 10 34 720 86 190 70 96024 25 140 60 500 8 1 6 10 93 5 10 29 900 10 040 5 659 4 115 90 850 . 32 6 70 102 80 0 8 1 09 025 76 320 70 250 65 220 10 2 800 25 7 10 9 255 5 46 1 4 154 42 620 134 600 92 8 10 60 600
26 2 7 740 6 1 760 83 88 0 94 240 2 1 450 8 774 5 156 3 .996 35 0 10 71 750 65 750 4 7 6002 7 • • 25 7 10 48 040 85 560 8 7 650 18 260 8 50 5 5 6 11 3 88 7 26 190 4 7.990 244 70 3 34 79018 25 BOO 43 120 68 110 8 1 180 16 5 70 9 892 6 595 3 866 36 040 - 42 260 150 OCO 34 16029 30 860 5 7 860 60 860 .73 760 17 140 10 360 5 946 3 829 33 720 52 920 95 800 38 89030 2 7 700 5 1 160 62 170 16 94 0 9 498 5 5 78 3 920 33 100 4 7 330 99 3 70 44 3503 1 23 4 70 43 6 20 17 26 0 6 65 1 5 3 73 55 250 4 1 710
Average 43 580 48 400 58 720 85 120 18 04 0 15 56 0 7 258 5 14 1 13 890 38 330 117 500 55 220Low est 22 090 22 630 2 1 560 32 600 16 5 70 . 8 50 5 5 156 3 829 6 524 15 200 40 000 34 160N yhest 123 000 103 700 128 500 194 000 50 98 0 35 66 0 11 280 8 305 90 850 134 600 295 500 63 9 10
Pai r, flow 250 900 114 700 180 400 24 1 50 3 59 0 10 42 990 12 290 9 4 19 192 .50 0 177 700 49 1 800 • 114 700CIaty of peek 1 18 18 14 I 3 13 6 23 25 10 74MontNy to tal(rri l lron co m) 116 70 12 1 30 157 30 220 60 75 09 40 33 19 44 13 77 6 1 93 102 70 330 40 14 7 90
Runo ff ancm 85 89 115. 16 1 55 29 14 10 45 75 24 1 losRainfall onm) 180 89 • 175 17 2 1 54 56 35 14 1 130 320 112
Mean Avg 46 350 40 280 4 1 940 . 44 230 35 7 10 22 090 18 390 22 120 15 720 39 9 10 . 46 300 49 040flow s Low 15 450 13 420 15 160 I I 370 12 130 7 34 2 7 765 5 22 8 6 49 1 6 798 12 230 22 0 20
(year/ 1940 194 7 1973 1938 . 1446 1940 19 76 1955 1972 1972 1983 19 76Nigh 127 800 90 110 88 680 113 300 77 100 56 080 36 7 10 63 860 7 1 820 138 200 10 7.200 108 40 0Neer) 1937 1945 19 77 194 7 195 1 194 8 1958 194 8 1930 1982 195 1 1954
Runoff Avg 95 72 82 84 70 42 36 43 49 78 88 ssLow 30 24 30 21 24 14 15 10 12 13 23 43High 250 159 173 2 14 .15 1 106 72 125 .136 2 70 20 3 2 12
Ren let Avg 118 76 74 70 8 1 • 66 so 94 95 . 120 .112 110Low •313 10 . 16 12 . 28 16 24 13 8 21 43/t o 3 74 148 149 196 179 160 206 . 185 22 7 3 10 260 28 2
Sum m ary st at ist ics ,1984
Factors af fec ti ng flow reg ime
For 1984 Fee record As % ofPr eced . g 1984 Pr e-1984 • Natural to w ithin 10% at 95 percentile flow .

R I V E R F L O W D A T A 47
0 1500 6 Tay a t Ba l la t h ie
St a t is t ic s M m oo t h ly da t a far pr ev io us rec o rd (Oct 1962 to Doc 198 31
1984
Station desc ri pt io nV eloc it y -a rea sta t Ion . 198 0 sg km developed fo r hydro-electric p ow er p ro duct io n : 73 sg km lor w ater adopt,/ purp oses . Due to implementationof Hydro Board schem es , the riv er w as part ially regulated up to the end of 195 7. and to tally reg ulated al ter this dat e.

48 H Y D R O L O G i C A L D A T A : 1 9 8 4
019001 A lmond at Cr aigiehal l
St at is t ic s of m ont h ly da t a f or prev iou s reco rd (Jam 1957 to Dec 198 3)
1984Measur ing aut ho rity FRPBFirst year . 195 7
Da ily m ea n gauged d is charg es (cubic met res per
DAY FEB MAR
Grid reference . NT 165 75 2Level st n. (m OD) 22 90
second)
PR MAY Ju N JUL AUG SEP
Catchment area (so km ): 369.0Max all VI I 0 0)- 518
OCT NOV DEC1 35 260 29 06 0 5 00 2 7 14 726 4 458 1 198 1 186 2 260 2 334 9 926 14 5802 38 630 45 6 70 7 50 7 496 68 9 4 500 1 39 4 1 59 9 3 98 1 1 8 11 14 720 16 0903 18 760 39 190 5 620 852 804 3 82 7 / 4 56 1 084 2 6 19 1 58 7 110 900 9 9 774 9 65 1 60 0 20 13 300 253 788 3 3 77 1 36 1 0 .757 1 509 2 096 43 830 7.74 25 13 090 42 520 7 09 3 680 6 12 3 7 16 1 34 3 0 .692 1 038 1 452 15 150 7 63 7
6 12 420 39 780 5.53 6 6 10 55 1 7.820 1 232 1.073 0 .834 1 0 73 9 .706 7.2847 12. 790 19 540 4 686 69 7 58 5 3 574 1 232 1.180 0 756 0 .932 11 00 0 17 790
8 . 7 139 17 3 70 4 036 336 58 8 188 1 345 0 88 1 0 70 7 1 572 20 .300 11 8 10
9 5 64 7 13 230 3 652 195 580 720 1 3 22 0 .850 0 92 4 1 626 49 6 70 8 6 1110 9 326 28 06 0 3 504 498 5 14 54 1 1 285 0 724 0 788 44 7 43 840 7 160
11 27 430 16. 110 4 265 04 8 282 41 7 1 239 0 639 0 6 73 3 807 15 560 5 98912 4 1.630 11 140 5 494 2 77 296 34 6 2 04 2 0 736 0 66 7 2 771 12 6 70 4 99213 63 250 8.33 1 5 13 9 9 11 332 3 16 1 794 0 832 1.7 18 3 6 76 9 0 29 4 3 1314 17 540 .6 822 6 53 6 657 33 3 2 19 1 0 88 0 .78 1 3 278 3 489 7 00 3 3.976 •15 11 360 5 773 4 772 53 3 3 73 120 0 906 0 809 1 999 2 298 6 .23 5 3 584
16 10 56 0 5 173 3 806 423 49 8 0 58 0 9 19 0 796 463 1 6 17 8 04 1 3 27117 12. 1(0 5 76 1 3 3 70 320 564 08 0 0 .90 3 0 83 9 1 20 2 1.398 8 12 1 6 60918 12 750 5 089 3 25 7 69 4 520 14 2 0 90 3 0 754 0 956 16 140 7 48 8 5.62019 9 222 4 0 72 3 0 78 908 450 1151 0 95 1 0 82 1 0 858 7 7 19 8 334 10 66020 6 894 3 5 70 2 826 774 5 12 224 0 925 0 8E16 0 988 5 329 6 658 19 060
2 1 6 028 4 2 15 2 729 44 8 15 1 526 0 84 4 0 90 1 0 9 74 6 56 1 8 009 9.26422 5 48 5 6 00 1 2 740 23 1 175 13 6 0 8 20 0 .790 3 468 23 740 2 1 430 7 49423 5 5 17 5 176 3 8 75 109 550 4 10 0 898 0 809 5 223 8 494 13 740 10 2 10 .24 4 953 5 10 1 20 150 9 79 708 28 1 0 88 7 0 84 1 4 0 13 34 830 17 4 10 14.85025 4 622 5 3 79 18 90 0 960 2 389 300 0 8 75 0 7 13 2 134 38 340 18 380 10 050
26 6 35 7 4 8 76 42 860 9 12 2 858 259 0 884 0 66 3 1 3 71 11 0 10 10 440 7 1722 7 12 980 4 09 3 16 300 8 17 2 06 2 25 7 1.85 6 0 .934 ( 754 6 320 70 850 4 82 9
28 17 840 3 490 14 130 764 1 605 167 1 0 52 2 034 7 884 5 326 26 320 4 .08 729 28 560 3 398 11.970 792 1 40 9 2 16 0 .78 0 1 783 3 775 18 4 10 11 60 0 5 19030 2 1 9 10 11 40 0 770 1 354 182 0 8 75 1 35 1 2 63 7 20 070 8 954 6 939
3 1 15 64 0 8 86 1 39 3 1 6 B 1 1 465 14 610 5 744
Ayeag e 16 300 15 450 8 274 3 0 22 1 656 2 08 8 1 20 4 0 9 74 2 0 82 8 126 20 880 8 4 70Low est 4 622 3 39 8 2.72 9 1.764 1 282 1 05 8 0 780 0 639 0 .66 7 0 93 2 . 6 .235 3 .27 1wr est 63 250 60 020 42 860 6 714 1 858 7 820 2 68 1 2 034 7 884 38 340 110 900 19 060
Peak fl ow . .„ 177 400 94 160 58 2 10 7 5 13 4 39 3 10. 770 • 668 3 632 10 200 93 120 .199 600 29 .390Day o/ peak 12 4 26 I 16 6 3 1 28 28 24 3 1Month ly to talIrma* n co ml 43 6 7 33 7 1 22 16 7 93 4 44 5 4 1 3 23 2 6 1 5 40 2 1 76 54 11 22 69
Runoff (mm) 118 105 60 2 1 12 15 9 . 7 15 59 147 6 1Rainfal l (mm) 135 69 9 1 16 40 so 32 34 1 11 119 18 1 74
Mean Avg 8 .754 . 7 239 6 119 3 98 1 3 103 2 39 7 2 0 77 2 94 3 4 179 6 118 9 168 8 72 1flow s Low 3 5 74 . 1 782 1 9 18 1 409 1 09 1 0 8 17 0 95 1 0 86 9 0 66 8 0 668 1.86 2 3 0 16
(year) 196 3 1963 1973 1974 196 1 196 1 196 0 1983 1959 1971 1972 19 75High 16 1 10 13 740 14 300 8 374 1 1 170 8 5 72 9 224 8 43 4 12 680 15 120 2 1 660 16.2 80(year) 1982 197 7 1979 1972 196 8 1966 1958 1966 196 2 198 1 1983 19 74
Runoff Avg 64 48 44 28 23 17 15 2 1 29 44 64 63Low 26 12 14 10 8 6 7 6 5 5 13 22Hg h 117 90 104 59 81 60 6 7 6 1 89 110 152 118
Ronfall Avg 77 55 64 62 60 70 8 2 8 7 88 9 1 8 2Low 28 17 22
_508 113 24 23 19 14 23 19 2 1
High 145 10 7 127 813 123 136 165 14 2 159 177 190 154

R I V ER F L O W D A T A 49
02 10 0 9 T w e e d a t N o r ha m 1 9 8 4
St at is t ics of mon th ly da ta foe prev iou s recor d (Oct 1962 to Dec 1983)
Stat ion descr ipt ionVelocit y-area stat ion

50 H Y D R O L O G I C A L D A T A : 1 9 8 4
0 2 2 0 0 1 Co q u e t a t Mo r w ic k
Stat ion desc ript io nVelocit y-area stat ion Informal f iat V weir inst alled 19 76
Stat i st ics of mont hly dat a for prev iou s reco rd (Nov 19 83 t o Dec 19 8 3— In com plet e Of missing monttn total 0.1 yen )
1 9 8 4Measuring authority ' NW A GodFirst year 1966 Level
Dai ly m ean gauged d ischarges (cubic metres per sn ood)DAY JAN FEB M A R APR M • Y
1 12 180 20 290 8 969 16 630 12 te 190 5 1 120 9 46 1 12 580 23 19 2 10 59 800 7 889 10 530 24 10 530 73 3 10 13 240 9 239 25 10 2 / 0 59 480 I I 990 8 0 74 2
6 9 5 18 43 880 8 959 7 56 9 27 8 34 5 29 130 7 926 8 0 26 7
7 0 62 24 220 6 880 7 0 22 29 6 32 1 16 560 6 038 6 424 2
10 6 5 1/ 22 500 5 763 6 22 1 2
11 9 834 24 780 6 486 7 10 1 212 10 450 19 540 8 6 75 5 853 213 3 1 520 15 040 9 0 5 1 5 169 2 . 11414 14 440 11 8 10 8 9 18 5 049 215 10 790 10 390 7 3 72 4 93 1 2
16 15 230 8 92 7 6 4 35 4 33217 18 520 8 24 7 6 0 55 3 95618 13 3 10 8.473 5 762 3 83 119 9 59 5 7 282 5 36 2 3 8 7320 7 12 1 6.529 5 0 10 3 8 16
2 1 6 9 5 1 7 8 10 4 750 3 60 122 6 626 11 06 0 4 50 3 3 28 323 7 2 11 11 230 4 29 7 3 0 5624 6 0 5 1 8 449 38 530 2 88 625 6 83 7 7 694 29 890 2 769
26 10 240 7 04 3 105 20 0 2 64 42 7 33 650 6 92 6 4 5 00 ) 2 5 7728 39 800 6 435 25 990 2 53 329 48 450 6 224 28 50 0 2 42630 30 09 0 2 7 050 2 9833 1 23 0 90 17 900
Average 15 0 70 20 490 15 6 70 5 633l o w es t 6 05 1 6 2 74 4 29 7 2 426Fag he s t 46 450 73 3 10 10 5 200 16 630
Peek flo w . 5 7 480 14 1 400 135 300 18 630Day of peak 29 26 IMon thly to tallm Cion cu ml 40 35 5 1 34 4 1 98 14 60
Runo ff Onm) 71 90 74 26Rainfall (mml 125 44 I I I 12
referencestn
8653 7934438 7389
30 724 22 122 122 70
32424 2
06 558 2
2 0 101 26 21 8401 8631 863
1 90 72 (36 12 0 19
8 72775
80 183486 789 573566 1
2 0391 26 22 58 2
5 5 1415
5 46
1018
NU 2340 44OD) 5 .25
UN66917848 150 7023
3 773 1187 13 9 108 7
95686 88 198 197 75
68230 212 177963 1
54452 452 952 6493
40 834 832 732 333 2
2 16 71 3237 3 77
9 7996
5 62
1048
JUL33 23253 193 1126 7
24 7206159129122
122122131133133
3313312511508 8
0 780 780 / 80 78056
0200 732 1222 2209463
16807046 3
2 04 93 1
3 13
535
23
1142
2222
I
1
A u G
3 7560 18206808 75
2 750 9940 20 5673 5
55 143 135 73 1428 7
27 126423 9166155
14814414414 4
135
/ 330 840 780 821CO100
9 760 78820
1003
5 29
962
1
4
12
19 1
SEP118
1 5291 6641 63 21 544
1 1960 96 4
143155155
155145144144147
193790
4 24 22 6221 93 5
1 6581 58 84 6 3 4
9 90 25 0 75
3 49 92 7842 7393 6 793 43 8
7 4200 9649 902
93024
6 2 7
11
Catchment area (sq km)Max all (m OD)
OCT NO V3 334 3 7 192 77 1 3 4 102 40 7 93 0402 250 76 1802 090 29 990
1 8 74 16.9401.736 28 3501 6 75 29 06 01 625 2 7 9301 604 36 420
1 53 1 17 1201 489 26 8601 484 31 5701 484 28 6031 4 70 28 770
1 40 7 39 4 101 3 72 35 8501 53 4 69 0 504 36 4 43 7703 30 3 2 1 6 70
2 626 28 1402 26 7 4 1 7 107 693 3 7 0006 153 22 0 90
1 1 830 14 3 70
6 18 1 1 1 4 904 504 11 3003 715 18 2 103 3 7 1 11 8005 9 76 9 7754 423
3 2 11 29 8201 3 71 3 4 10
11 830 93 040 1
15 2 70 130 000 275 3
8 60 77 79
15 13658 2 14
569776
EC954150750440900
5507209 7634744 1
734244893826059
56 249 745099 7389
83 558 31880 57169
49 76 760 7 1117938882
1540 7 1900
1305
2 1 84
3846
Mean Avg 14 940 13 360 12 9 10 8 2 14 6 144 3 789 3 20 1 3 7/ 8 4 55 2 8 084 I I 980 13 240flo ws Low 5 42 1 2 6 73 1 / 30 2 92 8 2 155 1 14 1 1 549 1 23 2 1 4 18 1 0 83 1 926 4 56 3
(year) 1973 19 73 19 73 1974 1974 1970 1976 1983 19 72 1972 19 73 19 7 1Fegb 32 3 10 76 350 3 1 390 15 8 10 15 4 10 6.35 5 7 96 9 12 720 14 240 26 860 3 1 3 70 33 340N ea r) 1982 1978 19/ 9 1983 1983 1969 196 8 1966 1965 1976 1965 19 78
Runoff Avg 70 5 7 6 1 3 7 29 17 15 18 2 1 38 54 62Low 25 11 8 13 10 5 7 6 6 5 9 2 1High 152 112 148 72 72 29 37 60 65 126 143 15 7
Rainfall Avg 8 7 62 79 53 70 5 7 64 68 75 78 8 1 8511966 - Low 38 15 18 8 18 8 19 / 8 15 19 19 3 119831 M g h 14 0 120 144 118 127 129 10 1 132 2 15 176 165 25 1
Sum m ary st at i st i cs Fac tors affect ing fl ow regi me1984
For 1984 For No v A s % ofpreced ing 1984 rf e- I 98 4 • Nat ural to w ithin 10% at 95 percent ile flow .

R I V E R F L O W D A T A 5 1
0 2 3 0 0 6 So u t h Ty n e a t Fe a t he rs t o n e
St at ion desc ri p t ionCompo und Crump w eir . Tw o crests 15 .2 m and 29 6 fn broad
St at is t ics of m on t h ly dat a fo r prev io u s rec of d (Oct 1966 10 Dot 1983 - incomplet e or missing mont hs total 0 .2 years )
19 8 4Me asur ing aut hont ir NW A Grid referenc e. NY 6 72 6 1 1First year 1966 Level st n (rn OD) 13 1.70
Da ily m ea n gau ged d isc ha rg es (cubic metres par second)
Cai chm ent area (sq ki n) 32 1.9M ax all . (in OD). 8 93
DAY JAN 188 MAR APR MAY 1 171 AA MJG SEP OCT NOY CEO1 22 240 40 0 70 26 890 6 248 1 852 2 574 1 848 1.667 5 840 7 10 1 6 4 13 18 8407 28 750 52 850 ( 2 .480 5 658 1 838 2 .704 1.68 1 1.820 2.726 5 .596 29 430 15 3 703 12 .640 5 1 4 30 17. 740 5 3 73 1 796 6 561 1.5 19 15 4 70 2 1 740 11. 790 157 .500 13 8004 8 44 2 75 .770 38 .720 1 .8 77 1 780 11.2 70 1 4 10 10 . 180 13 100 9 .935 43 .890 10 6805 3 1 290 42 490 18 640 4 8 16 1 724 20 250 1.34 7 4 0 79 4 799 5 .695 14 4 70 19 430
6 18 .930 3 7.920 13. 190 5 0 45 1 7 10 11 800 1.30 9 8 92 1 3 144 • 54 1 13.9 60 12 3207 14 750 2 1 160 9 2 12 5 520 1 64 9 5 028 1 253 12 700 2 44 2 4 56 1 2 1 480 10 760
8 180 17.5 70 7.353 5 124 1 60 2 3 14 2 1.188 5 06 6 1 383 19 5 10 13.9 70 9 52 56 5 19 11 410 6 .28 7 6 0 11 1 56 8 2 468 1 173 3 190 12 390 8 157 2 7.7 70 8 40 1
10 29 540 30 460 6 550 9 10 1 1 6 72 2. 113 1 173 2 409 5 495 5 3 75 20 420 6 356
11 48 130 33 .540 7 59 1 13 900 1.65 7 1 8 7 1 1 173 92 1 6 9 50 • 60 3 13 .750 5 56912 53 4 10 18 040 7 667 6 44 6 1 527 1.77 1 1 16 1 692 4 1 70 3 99 8 4 1 6 10 4 98513 43.280 10 400 6 256 6 188 1 46 1 54 030 1 14 2 52 1 4 766 5 75 1 18 840 4 .60614 14 630 8 46 7 5.720 6 508 1.42 7 9 8 19 1.16 1 398 8 0 71 14 .560 10 .2 10 4 44 615 10 420 7 093 4 9 7 1 5 0 74 1 4 15 5 22 7 1 173 360 5 639 7.54 7 7 96 7 • 329
16 15 490 6 172 4 48 7 4 3 11 1.4 11 3 8 10 1.15 1 309 14 8 10 5 18 7 9 .203 3 9 1617 14 190 7.505 4 3 10 3 754 1 42 7 3 058 1.136 2 74 35 4 10 5 0 73 12 .280 5 918113 9 89 3 7 579 4 0 70 4 549 1 424 2 64 6 1 127 238 8 360 3 1 930 13 990 9 04 719 7 798 4 69 8 3 845 4 688 1 3 75 2 40 3 1 12 7 192 5.45 1 5 7 150 i t 460 33 98020 6 30 5 4 52 7 3 5 13 5 090 1 459 2 178 1.117 137 7 640 4 1 230 8 12 1 38 630
7 1 5 46 2 4.94 6 3 .288 4 153 1 775 2 277 1 0 96 114 28 400 18 680 17 480 15 45022 5 48 6 8 589 3 153 3 24 5 1 900 4 745 1 0 66 0 96 60 .800 53 29 0 34 06 0 10 06023 5 186 8 26 7 6 0 84 2 8 72 1 726 3 44 5 1 0 49 096 20 740 18.960 1 7 170 13 56024 4 969 6 119 18 230 2 655 3 38 1 3 054 1 0 12 096 11 2 70 2 1.550 13 . 180 13 3 1075 4 725 5 326 22 140 2 44 9 2.962 3 224 0 995 0 82 7 06 9 20 290 16 6 70 12 04 0
26 4 722 4 96 5 25 350 2 344 2 2 75 2 446 0 98 1 0 24 5 4 17 11.96 0 10 700 8 75927 7 850 4 6 5 7 11.900 2 244 2 044 2 326 1.04 1 0 / 0 9 173 8 3 75 53 450 6 16528 12 100 A 29 8 2 1.880 2 135 7 0 78 2 325 I 173 124 10 900 10 100 43 730 8 4 1729 28 560 9 534 12 6 70 2 00 9 1 848 2 256 1 439 86 7 7 6 59 16.6 20 16 920 13 19030 22 450 10 250 1 9 11 1 6 10 1 10 2 1 193 295 13 320 11 340 10 110 11 5503 1 14 &CO 7 666 1 533 2 458 2 84 1 7 924 8 70 1
Average 16 800 18 820 11 550 4 8 10 1 771 6 096 1 155 3 0 38 11 710 14.790 14 6 70 11 680Lowest 4 722 4 198 3 153 1 9 ( 1 1 3 75 1 77 1 0 9BI 1 0 10 2 383 3 99 8 6 4 13 3 9 16Highest 53 4 10 75 770 38 720 13 900 3 38 1 54 030 2 458 15 4 70 60 800 5 7 150 157 500 38 630
Peak f low 198 800 132 80 0 56 2 70 25 680 5 564 155 COO 3 40 2 4 1 400 114 800 10 2 100 309 900 89 0 10Day of N ei 11 4 I 11 24 13 3 1 6 16 19 3 20Monthly total
cu 45 00 4 7 16 30 94 11 4 7 4 74 15 80 3 36 8 14 30 34 39 6 1 63 95 3 1 29
Runoff ff nmji 140 146 96 39 15 49 10 25 94 123 199 9 7Rat t ail Ining 189 83 113 22 42 118 49 8 7 19 1 169 24 5 112
Mean Avg 16 0 50 11 69 0 13 480 8 7 10 6 55 1 5 03 5 4 60 2 5 9 54 8 90 6 12 5 70 15 650 14 600fl ow s Low t O 540 5 112 5 860 1 850 1 3 11 1 46 5 1 329 0 .960 1 46 7 1 18 1 6 6 16 5 110
(yew ) 1970 1968 19 75 1974 1980 1978 1976 1976 1972 1972 1983 197 1Hy " 15 5 10 19 760 30 2 10 16 1 10 13 850 12 740 9 38 5 13 140 17 780 30 330 22 890 28 8 10(yan ) 19 75 19 74 19 79 19 79 1983 1980 1968 196 7 1968 196 7 19 74 19 74
Runoff Avg 134 88 112 70 55 4 1 38 50 72 105 126 122Low 88 40 49 15 11 12 11 12 10 53 43nigh 1 12 148 75 1 13 1 115 10 3 78 109 143 252 180 240
Ren tal Avg 133 85 1 I ) 73 62 89 93 104 125 136 142 127Low 74 3 1 44 11 40 44 43 75 40 2 7 63 42
2 13 166 199 133 178 2 15 14 1 162 23 9 33 1 240 2 15
Su m m ary st at i st ics F e Ct Of s af f ect i ng fl ow reg im e1964
For 1984 For rocawd As % ofPrecocit y 1984 Pro. 1984 • Nat ural to w ithin 10 % at 9 5 percent ile fl ow .

52 H Y D R O L O G IC A L D A T A : 1984
025001 Tees at Broken ScarMeasuring authority NW AFirst year 1956
Dai ly m ean gauged disch arges (cubic rnel res Pee 44400d)
Grid reference NZ 259 13 7Level si n Irn OD) 3 7 20
1984Catchment area (so km) 8 18.4
Max alt an OD) 89 3
Stat ist ic s of mo nt hly dat a for prev iou s record (Oct 1956 to Dec 1983)
Stat io n desc ript ionCompound Crump w eir 64 m broad w it h tw o low sills each 4 .6 m broad Excess flow s from Cocker Beck (ft Skerne) diverted into catchment viaBaydale Beck See 0 250 10 Mow den Bridge
DAY JAN FEB MAR APR MAY JUN Ju t Au0 SEP 00 NOV :NC1 73 920 3 1 340 31 630 14 3 70 3 167 3 93 1 3 29 1 3 784 4 900 6 46 4 8 783 24 1102 78 26 0 105 400 30 5 10 12 250 2 840 4 23 7 3 483 3 784 3 8 10 3 88 1 13 160 29 6 103 42 40 0 142 700 13 820 10 4 50 3 083 7 98 5 3 58 1 18 290 9 480 6 494 108 800 3 1 3304 26 920 2 13 600 44 9 20 9 400 3 440 7 578 3 4 15 17 360 19 0 20 13 940 49 750 26 0805 39 .690 100 300 36 4 50 Ef 60 8 3 55 7 13 780 3 473 5 705 4 395 4 953 19 430 35 300
6 33 020 12 1 500 24 3 70 9 29 7 3 46 2 12 260 3 25 7 3 988 3 294 3 60 2 14 860 22 7407 30 59 0 50 940 18 680 8 59 8 3 352 5 .694 2 77 7 9 296 2 94 7 3 66 2 32 .840 16 6008 2 1 870 50 230 15 250 7 788 3 109 3 4 72 2 87 1 5 13 1 2 597 7 9 16 30 580 24 0 109 17 50 0 30 890 14 120 8 209 3 2 73 3 .380 r 3 0 73 3 460 3 200 7 220 44 100 20 990
10 22 59 0 35 590 14 56 0 9 445 5 38 2 3 3 79 3 040 3 .839 4 022 3 2 10 55 360 12 680
11 66 400 43 540 16 830 20 980 5 30 1 3 300 3 0 78 3 742 3 54 3 2 963 25 240 10 74012 43 230 30 950 15 150 12 590 3 553 3 3 12 3 193 3 38 1 3 .48 5 3 34 3 62 820 9 04 813 123 800 23 790 14 00 3 11 780 3 295 14 560 3 544 3 26 1 3 709 5 8 7 1 48 080 8 65714 37 740 17 450 13 500 13 2 70 3 2 74 10 020 3 282 3 14 1 6 958 6 90 7 24 390 9 36515 29 90 0 16 860 12 090 12 09 0 3 155 4 118 3 46 5 3 3 541 4 9 16 5 04 3 19 960 10 940
16 42 46 0 15 730 8 00 5 8 724 4 156 6 04 3 3 4 75 3 4 14 3 55 5 3 30 2 22 490 9 31617 48 100 15 650 7 85 7 7 148 3 796 4 6 16 3 192 3 28 7 34 9 70 3 116
3 1 600 4 1011418 30 200 18 250 7 112 5 556 3 76 1 3 35 5 1 800 3 24 9 8 186 39 480 4 1 930 499019 22 920 14 60 0 6 719 9 4 53 3 890 3 320 2 68 7 3 322 3 909 60 600 32.4 10 42 74020 18 570 13 300 6 184 13 500 3 94 7 3 25 8 2 999 3 224 3 26 8 44 620 2 1 540 4 1 940
2 1 17 620 13.380 5 84 8 10 930 4 09 1 3 28 5 2 962 3 119 7 177 23 6 10 44 890 25 53022 15 760 19 170 4 96 1 7 19 1 4 06 9 4 109 3 05 4 3 663 5 1 4 70 32 0 10 82 8 70 24123 15 950 18 730 5 139 4 8 14 3 36 8 3 852 2 788 3 704 19 620 20 540 97 380
2 715050
24 15 060 12 800 45 44 0 3 94 8 3 5 16 3 .379 2 732 3 64 6 9 778 28 120 49 250 2 1 94025 13 860 10 980 46 39 0 4 778 4 38 7 4 506 2 69 7 3 635 5 28 1 30 96 0 32 630 15 690
26 12 180 9 882 68 4 10 4 590 3 8 18 3 48 1 2 698 3 364 3 50 1 16 5 70 26 240 14 1902 7 25 1 10 9 160 36 9 70 3 8 11 3 624 3 18 1 2 843 3 386 3 0 75 9 882 43 04 0 7 90 828 34 730 8 623 29 580 3 74 1 3 8 72 3 4 18 3 02 2 3 524 5 115 8 162 59 3 10 6 29 829 41 930 9 90 8 23 .230 3 167 4 725 3 337 3 08 1 3 668 0 719 19 480 30 840 8 5 1730 36 38 0 19 860 3 163 5 40 8 3 2 18 2 9 76 2 966 11 660 20 3 70 19 990 15.6 703 1 28 430 17 340 3 744 3 190 3 2 13 12 2 70 • 13 220
Average 35 760 4 1 700 2 1 160 8 771 3 789 5 24 5 3 10 1 4 706 8 5 19 14 790 39 820 19 3 70Low est 12 180 8 623 4 96 1 3 163 2 840 3 18 1 1 68 7 1 96 6 2 59 7 2 963 8 783 6 298Highest 123 800 2 13 600 68 4 10 20 980 5 40 8 14 560 3 58 1 18 29 0 5 1 4 70 60 600 108 800 42 740
Peak flo w , 304 200 44 4 800 142 100 24 8 10 5 968 50 140 4 684 39 4 10 96 3 10 96 120 171 700 77 520Oay of peak 13 4 25 I I 30 13 13 3 22 19 3 20Monthly to talImieuan cu m) 95 78 104 50 56 68 22 74 10 15 13 60 8 30 12 6 1 22 08 39 62 103 20 5 1 88
Rumor/ (mm) 117 128 69 28 12 17 10 15 2 7 48 126 63Ramfall (nen ) 183 6 7 9 1 13 29 68 18 8 7 144 113 195 66
•Runoff Avg 94 68 76 57 34 20 20 3 1 34 59 70 90
_ Low 10 8 18 8 7 1 6 2 2 9 13 19High 164 152 22 5 193 88 48 49 8 1 77 177 163 164
Rainf all Avg 118 8 7 95 76 8 1 76 83 98 99 10 4 111 113Low 5 1 13 29 10 18 22 32 23 19 27 25 43High 183 175 224 150 16 7 182 150 190 222 226 22 1 26 8
Mean Avg 28 800 22 890 23 0 70 18 110 10 420 6 4 12 6 178 9 329 10 8 70 17 94 0 22 260 27 4 70flow s Low 2 936 1 80 4 5 487 2 539 2 00 8 0 502 1 794 0 458 0 638 2 70 7 4 06 0 5 778
(year) 1963 196 3 19 75 1957 1959 1957 1969 1959 1959 1969 1958 19 7 1. High 50 240 5 1 540 68 660 60 8 70 2 7 020 15 2 70 15 090 24 830 14 350 53 94 0 5 1 580 50 04 0
(yam) 1981 1966 1979 19 77 196 7 1972 196 1 195 7 1968 196 7 1963 1979
Sum m ary stat ist ics
For 1984 For recordpreced ing 1984
1984A s % ofpre- 198 4
Fact ors aff ect ing fl ow reg ime
• Reservoe (s) in catchment• Abst raction for public water supplies
Mean flow (rn' s - 17 110 16 960 10 1 • A ugmentat ion from surface water and/ orLow est yearly mean 9 38 3 19 73 groundwater.Highest yearly mean 23 220 1979Low est monthly mean 3 10 1 A A 0 458 Aug 1959Highest rno ntNy mean 4 1 700 Feb 68 66 0 Mar 1979Low est daily mean 2 59 7 8 Sap 0 023 16 Oct 1959Highest daily mean 1 13 600 4 Feb 39 1 SOO 3 Jan 1982Peak 44 4 BOO a Feb 6 79 30 0 23 Mar 196810 %do 42 100 4 2 8 70 9850 %de 8 69 6 7.836 11195 %de 3 0 32 1 276 238A nnual to tal (milla n cu m) 54 1 10 535 20 10 1Annual runoff Imm) 66 1
,654 10 1
Annual rainfall (mem 108 4 115 1 941

02 7 0 02 W h a rfe a t Fl in t Mil l W e ir
R I V E R F L O W D A T A 53
Stat ist ics of m ont h ly dat a for previo us recor d (Jan 193 7 to Dec 198 3- incem plete or missi ng M a t h s tota l 17.7 years)
19 8 4
Stat ion descript ionBroad crested w eir . 4 7.3 m broad, rat ed by current meter gaug ing fr o m a cablew ay 1.5 km up st ream of the stat ion Pre- I / 10/ 6 5 rating may beless re liable

54 H Y D R O L O G IC A L D A T A : 1984
02 70 2 5 R o t h e r a t W o o d h o u s e M il lM eas uring au t ho ri ty Y W AFir st y ea r 19 6 1
Da ily m ea n ga u g e d di sc ha r g e s (cubic m et res per seco nd)
Gr id ref erence SK 4 3 28 5 7Level si n en OD) 28 .72
Stat io n desc ript ionVeloc ity -arca st at io n rated by current meter gauging /rom a cablew ay 35rn dow nstream
Catc hment area (sq kni ) 352 2Max alt (m OD) 36 7
Stat ist ics of m ont hl y dat a for prev ious record (Oct 1961 t o Dec 1983— incemplets or missing mo nths t ota l 2.5 years i
1984
D A Y JAN MAR A PR M A Y J U N AA AUG SEP OCT NO V CEC1 14 830 23 030 3 94 7 4 44 7 1 95 8 2 453 3 78 I 538 1 3 19 2 0 50 1 699 4 20 12 15 370 21 850 5 765 4 04 1 1 980 1 875 435 9 288 1 22 5 1 748 4 85 1 3.8633 12 570 13 4 70 4 290 3 783 1 9 10 5 446 420 3 043 3 818 2 684 19 5 10 5 26 345 8 486 13 9 70 4 04 8 3 580 1 9 15 3 45 6 385 3 719 5 528 2 06 3 9 0 78 4 59 5
6 68 9 13 190 3 99 3 3 3 71 1 89 7 3 192 345 1 983 1 BOB 1 7 19 5 2 14 4 3 17
67 5 66 05 248
42 4 7030 960
3 5043 24 5
3 44 73 304
1 8 151 775
2 86 82 504
3493 16
1 9903 4 78
1 46 51 34 2
1 60 71 572
8 1396 885
3 7353 3 15
4 59 1 17 060 3 0 70 3 113 1 779 2 11 1 19 7 98 4 1 3 10 1 6 79 8 256 3 0879 3 953 11 5 10 2 9 75 3 187 1 82 1 2 004 280 55 1 1 499 1 580 9 769 3 112
10 3 736 8 39 7 3 456 3 0 74 2 53 9 852 2 711 439 1 40 7 1 500 10 180 3 789
I 1 3 796 7 180 4 30 8 3 09 0 2 10 7 776 26 8 356 1 30 7 1 457 6 20 2 2 89312 7 86 7 6 2 70 4 733 2 86 1 1 806 740 8 19 306 1 278 44 9 6 108 2 76513 14 1 10 5 623 4 1 77 2 654 1 759 744 6 70 29 6 1 39 1 1 3 72 7 2 14 90 114 16 780 5 0 16 4 556 2 656 1 776 6 70 535 56 6 1 8 75 1 40 7 5 366 3 36 115 9 750 4 6 14 3 956 2 80 7 1 753 619 480 495 1 48 8 1 4 11 4 490 2 90 3
16 2 7 0 40 4 355 3 594 7 654 1 759 55 1 5 13 36 7 1 386 I 364 3 895 6 36717 20 06 0 4 190 3 350 2 4 7 1 1 695 509 326 26 8 3 9 72 1 90 2 4 2 7 1 0 1318 11 780 3 950 3 70 8 2 3 76 1 675 54 8 34 8 2 19 1 80 7 3 99 2 5 8 79 5 98919 8 385 3 838 3 159 2 365 1 733 540 355 7 14 1 6 13 2 743 4 556 7 24 310 6 29 7 3 908 3 09 7 2 29 / 1 82 6 979 3313 26 5 3 198 2 94 6 6 2 73 6 124
2 1 5 305 4 765 1 9 76 2 14 9 3 33 5 624 354 3 18 5 55 9 2 7 10 8 68 6 5 5 1122 5 254 4 98 8 2 86 8 2 159 287 52 9 18 7 30 1 4 43 7 2 866 15 250 4 89 223 5 422 4 25 1 3 950 2 120 7 8 75 4 77 228 255 3 83 4 1 662 18 5 10 4 89 124 4 90 8 3 / 96 25 730 2 0 83 2 2 11 453 226 4 18 2 48 7 4 694 11 490 6 65825 4 2 16 3 60 1 18 110 2 0 6 1 4 04 8 499 1 11 2 78 1 89 6 5 244 7 240 5 4 71
26 5 6 71 3 84 7 13 290 2 055 2 789 44 7 238 232 1 6 74 3 12 5 5 459 4 75027 11 190 4 10 9 8 653 1 04 4 5 32 2 44 2 1 12 289 1 632 2 66 2 4 9 14 3 9 7828 18 4 10 4 .05 4 6 896 1 9 74 4 864 4 11 2 14 2 13 1 713 3 16 9 5 745 3 4 7329 33 640 3 84 2 5 842 2 00 2 2 96 6 . 43 9 165 23 1 2 588 2 761 4 68 9 3 80 330 28 830 5 59 2 1 94 8 2 353 38 7 206 25 5 2 92 3 3 183 4 082 3 89 13 1 22 560 4 93 7 2 125 222 26 3 3 229 3 7 12
Average 11 700 9 .763 5 657 2 743 2 53 1 2 006 345 84 9 2 29 3 2 395 7 528 4 43 4Low est 3 736 3 60 1 2 868 1 948 1 6 75 1 38 7 165 2 13 1 22 5 1 364 2 699 2 765Highest 33 640 4 2 4 70 25 730 4 44 7 8 28 7 5 44 6 8 19 288 5 559 5 244 19 5 10 7 24 3
Pea& flow 39 60 3 5 1 580 36 8 10 4 650 17 540 7 625 2 .58 7 18. 100 12 250 6 574 25 6 70 8 4 17Day of peak 16 6 24 22 3 12 2 3 25 3 19Month ly to talIme ro n Cu m/ 3 1 33 24 46 15 15 7 11 6 78 5 20 3 60 4 .95 5 94 6 42 19 5 1 11 88
Runo ff trro n ) 89 69 43 20 19 15 10 14 17 16 55 34Rainfall (mm) 128 65 63 11 62 3 7 17 68 107 63 111 49
Mean Avgfl ow s Low
6 32 51 18 7
6 9441 424
6 6841 830
5 0 741 400
3 93 21 56 9
2 9461 166
1 9 790 934
1 9890 750
2 2290 7 12
2 7540 69 3
5691 023
6 2032 39 3
(yow l 1963 1963 1976 1976 1976 1976 1976 19 76 196 4 19 72 1964 197 111 0 20 22 440 14 330 13 160 10 110 10 840 4 90 7 3 323 7 786 6 59 6 8 200 18 140
(yew ) 19 77 19 77 19 79 1966 1967 1982 1968 1966 1965 1966 1969 1965
Runoff Avg 48 48 5 1 37 30 22 15 15 16 2 1 34 4 7l ow 10 10 14 10 11 9 7 6 5 5 18High 9 1 154 109 97 77 SO 3 7 25 57 50 60 138
Ramfal Avg 6 7 6 1 66 60 63 60 5 7 6 1 6 7 59 74 72Low 20 18 13 13 15 11 10 18 17 33 13l gti 10 7 180 132 122 157 20 2 170 10 1 17 1 140 150 194
Sum ma ry st at ist ics
For 1984 FIX mea dpreced ing 1984
1984As % of
ore- 1984
Fact ors aff ect i ng flow reg im e
• Reservou(s) in cat chment .• Flow inf luenced by grou ndw ater ab st ract ion
Mean flow (m1s 4 50 1 4 78 9 10 5 and/ or rec harg e.l ow est yearly mean 2 540 1964 • A bst ract- 2n for publ ic w ater sup pl ies .Highest yearly mean 6 36 4 1966 • Flow redu ced by ind ust ria l and / orLow est mont hly mean 1 34 5 Jul 0 69 3 OM 19 72 agricult ura l abst ract ionsHighest M On t h ly mean 11 700 Jan 22 440 Feb 1977 • A ugment at ion fro m eff tuent ret urns .

R I V E R F L O W D A T A 55
02 703 5 A ir e a t K ild w ic it Br id ge 19 8 4
S t a t is t ic s Of mo nt hly dat a fox prev ious record (Dec 1968 to Doc 19 8 3 - al eOm pla t . or m issing mon ths to ta l 0 .2 years)
Stat ion descript io nVeloc ity -area stat ion w ith bridge inver t as c o nt ro l Cu rren t m et er ga ug in g f ro m cableway dow nstream Low flow con trol removed in 1969 Newrating used from 1970

56 H Y D R O L O G I C A L D A T A 19 8 4
02 7041 D er w ent at But ter cr am beMeasuring authority YW AFirm year . 19 73
Daily m ean gauged d ischarges (cubic metres per second)
Stat ist ic s of mont h ly dat a for pr ev ious reco rd (Oct 1973 to Dec 1983)
Stat ion descri pt ionCrump w eir 19 .98 7 m broaddiversions
Grid reference SE 73 1587Level stn (rn OD) 9 50
1984Catchmen t area (sq krn) 1586 0
Max alt (m OD) 454
Catchment area inc ludes 33 .2 so km 02 703 3 Sea Cut at Scarborough. but flow data do not include fl ood

R I V E R F L O W D A T A 57
02 7 0 5 3 N idd at Bir st w it h
Stat ist i cs of month ly dat a f or previou s reco rd (A pa 1975 t o Dec 19 8 3- i ncom plet e or m issing months total 0 1 years )
Stat ion desc rtpt ionVeloci(y -area station w it h na t ura l roc k c o ntr o l
19 8 4M ea t urtng au t ho ri ty Y W A Grid reference SE 23060 3Fu el y ea r 19 7 5 l evel stn (m OD) 6 7.40
Dai ly m• an gauged di sc harges (cubic me m per s•oondl
DAY JAN FEB MAR Apia MAY JUN A l . AUG SEP
Catchment area (sq km). 2 17.6Max al/ (in 0 0). 705
OCT NOV DEC1 13 7 10 26 170 4 23 1 2.459 1.125 0 988 0 8 15 0 829 0 68 7 1.444 5 826 7 1 122 36 060 34 660 3 683 2 3 13 1.128 0 983 0 .799 1 0 27 0 5 78 1.224 10 9 70 4 59 83 14 5 10 53 20 0 2.436 2.233 1.122 1 33 7 0 86 1 1.74 8 4 8 11 1.58 8 3 7. 180 4 .75 54 13 490 88 .790 2 .466 2.0 76 1.108 1.126 0 .724 1 099 2.953 1 6 13 15 680 5 7495 16 080 53 140 4 696 11 78 1 0 90 1 29 5 0 788 0 9 14 1 137 1.22 8 11 660 6 .70 2
6 14 00 0 56 860 3 199 2 0 19 3.062 1.112 0 .785 0 .904 1 0 12 1.10 2 11 260 5 .7387 13 .470 25.960 2 .4 79 98 7 1 048 1 02 1 0 8 11 0 94.4 0 93 7 1.060 11. 120 5.3848 11.670 20 .870 2 103 90 7 1 044 0 .95 7 0 7 16 0 89 6 0 90 3 2 196 7 964 5 2589 7 763 13 690 1 79 1 864 1 0 38 0 94 3 0 765 0 86 7 0 932 see 9 69 1 3 .59 5
10 8 463 12 8 10 1.86 1 899 1 0 86 0 9 19 0 77 7 0 90 4 0 884 320 10 890 2 .730
11 17 400 8.229 1 93 1 93 7 1 04 5 0 89 7 0 762 0 .140 0 868 50 2 9 663 2 63 611 4 1 230 6 963 1 8 72 745 1 0 24 0 92 3 0 .769 0 80 2 0 889 44 6 9 0 19 2 .58013 63 400 6 39 8 1.869 683 1 0 15 2 434 0 .773 0 6 14 0 956 260 7 84 3 2 .57914 20 380 6 06 9 1.893 666 I 00 5 1 483 0 .776 0 5 10 1.5 75 56 7 6 606 2 .68 715 11.530 5.84 9 1 80 5 6 73 0 988 1 06 8 0 768 0 4 19 1 1/ 8 29 8 6 13 1 2 533
16 33 180 5 60 9 1.70 1 60 / 1 00 4 0 9 79 0 8 10 0 43 6 1 029 185 6 033 2 .47617 24 4 10 3 5 11 1.65 3 569 1 00 1 0 9 73 0 8 74 0 43 8 2 299 30 7 6.59 6 3 52618 14 460 3 136 1 6 19 54 2 1 00 3 0 82 6 0 8 77 0 4 3 1 1 2 78 5 98 1 7 46 8 3 80 719 12 290 2 96 2 1 5 72 5 16 0 99 7 0 .86 1 0 880 0 424 1 0 28 • 08 7 6 145 12 17020 11 4 70 2 94 5 1 556 504 0 994 0 853 0 8 77 0 46 2 0 9 7 1 3 .48 3 5. 148 14 3 70
2 1 7 23 7 3 29 4 1 56 5 4 75 054 0 86 3 0 859 0 392 1 185 2 8 14 11 260 11 95022 4 32 7 3 40 8 1 534 452 44 7 0 90 4 0 853 0 427 2 4 11 6 52 7 23 860 7 84 323 3 873 3 09 3 I 708 432 088 0 88 5 0 83 5 0 424 2 229 5 99 3 4 7 600 6 6 1324 3 48 3 2 86 1 7 8 17 42 1 02 1 0 86 7 0 86 7 0 4 28 1 4 10 11 960 22 980 6 29 815 3 33 8 2 789 10 720 4 11 022 0 84 3 0 78 1 0 4 11 1 158 9 161 15 040 6 9 13
26 3 65 2 2 766 9 343 40 1 009 0 83 5 0 82 5 0 4 15 1 059 6 793 12.540 6 09 51 7 8 768 2 78 1 6 89 1 293 780 0 82 6 0 8 76 0 4 13 1 0 12 6 252 12 4 70 5 43 728 10 080 1 720 6 88 2 10 6 157 0 83 4 0 86 4 0 40 6 1 0 12 10 590 13 940 3 39029 15 39 0 2 73 1 4 4 74 135 036 0 83 1 0 83 4 0 4 16 1 24 1 7.56656 6 411 70 3 33 130 14 690 2 83 7 130 02 1 0 830 0 858 0 485 2 499 7 700
10 63 556
3 1 10 820 2 713 0 92 7 0 791 0 6 74 6 48 1 3 223
Average 15 960 16 0 10 3 3 19 1 68 1 1 064 1 0 17 0 8 14 0 655 1 40 7 3 859 12 830 5 34 6Lowest 3 33 8 2 720 1 53 4 I 10 6 0 92 7 0 82 6 0 716 0 392 0 578 1 06 0 5. 148 2 4 76Highest 63 400 88 790 10 720 2.459 1.44 7 2 434 0 880 1.748 4 8 1 1 I I 960 4 7 600 14 3 70
Peak flow 204 400 186 600 23 190 1 59 1 1 888 4 454 1 33 3 2 63 7 25 220 2 7 4 50 73 180 2 1 720Day of peak 13 4 25 1 21 13 20 3 3 24 23 20Montmy to tal(molon cu m) 42 74 40 11 8 89 4 36 2 85 2.64 2 18 1 75 3 65 10 33 33 24 14.3 2
RJnoff (nun) 196 184 4 1 - 20 13 12 10 8 17 4 7 153 66Rarnfal l (rnml 250 90 87 19 45 es 18 76 165 165 196 89
Mean Avg 9 38 4 7 58 0 9 98 3 3 66 1 3 790 2 09 0 1 24 8 1 523 2 09 7 5 4 27 6 9 55 . 1 1 030flow s Low 6 92 7 3 1 15 1 49 7 1 704 1 135 1 0 15 0 9 12 0 886 1 163 1 50 8 1 89 3 3 6 12
(year) 1980 1981 19 76 1982 1980 19 75 1976 1976 1977 1978 1975 1975High 12 8 10 14 520 2 1 140 7.24 7 7 06 1 3 13 1 1 556 2 493 3 920 15. 120 12 000 10 180(year) 1982 19 77 1979 1979 1983 1982 1982 19 79 1976 1976 1982 1979
Fttn oll Avg 116 85 123 44 40 25 15 19 25 6 7 83 136Low 85 36 3 1 20 I L 12 I I 11 15 19 23 44
158 16 1 260 86 07 3 7 19 3 1 4 7 186 143 250
Rarnfaa Avg 136 96 145 6 / 90 es 50 94 128 135 137 173( 19 76 . Low 106 5 7 75 2 7 16 34 22 80 36 62 801983) 1-19 01 193 182 243 14 4 149 105 68 147 25 3 22 3 20 8 258
Summ ar y st at ist ics
For 1984 Fa recordpreced ing 1984
1984As % of
ore-1984
F 8 C 10 f 11 aff ec ti ng fl ow reg ime
• Reservoir(s) in catchm ent• Abstraction for public water supplies
Mean flow (m1s - '1 5 28 3 5 357 99 • Augmentation from surface w ater and/ orLowest yearl y mean 4 9 15 19 78 groundwater

58
02 8 0 0 9 Tre n t a t Co lw ic hMeasur ing aut ho ri ty STW A Grid reference SK 6 20 399 Catchment area (so km ) 74 86 .0
Stat isti cs of m ont hly da ta f or prev ious reco rd (Oct 1958 to Dec 19831
Stat io n desc ript ionVeloc ity -area st at ion
H Y D R O L O G IC A L D A T A : 1984
19 84
First year 195 8 Leval st n (rn OD) 16 .00
Dai ly m ean gauged d ischarges (cubic met res per n a me)
DAY J AN F013 MA R APR MAY JU N JUL AUG
Max al l (nt OD) 626
SIP OCT NOV DEC1 118 300 34 5 BOO 77 160 8 7 880 44 320 46 3 70 3 t 550 2 7 2 10 26 490 44 400 58 68 0 105 2002 228 700 36 5 900 82 600 80 820 43 4 10 55 680 29 590 48 820 25 930 36 770 58 980 112 7033 29 6 90 3 430 900 8 1 8 10 75 140 42 890 74 980 3 1 100 dB 540 26 780 3 7 04 0 176 200 112 1034 259 200 38 5 300 75 640 7 1 890 43 390 77 980 30 630 5 7 920 50 2 70 4 1 490 229 200 108 5005 188 90 0 358 200 8 1 760 6 7 790 43 06 0 75 540 30 3 70 75 260 4 7 9 10 35 400 150 00 0 94 080
6 165 500 3 72 700 74 6 70 65 09 0 4 1 840 7 1 620 28 740 4 7 820 32 290 32 790 103 500 88 3907 142 700 4 75 700 70 660 64 59 0 40 3 10 6 1 260 28 540 56 2 10 28 770 30 590 96 5 70 79 4908 146 300 46 7 900 6 7 5 70 6 1 960 39 490 5 1 120 26 800 52 3 10 2 7 490 3 1 730 90 340 71 1209 129 60 0 34 2 100 64 4 70 60 4 10 40 160 46 29 0 25 950 38 590 2 7 3 10 33 750 128 600 66 550
10 109 600 22 2.300 63 090 59 800 46 100 4 1 860 26 110 33 250 30 700 3 1 4 10 163 500 65 640
11 110 000 183 700 66 920 6 1 440 4 7 680 40 840 2 7 100 3 1 2 10 33 860 29 / 70 125 200 63 5 7012 118 200 159 600 93 380 59 160 4 1 980 39 110 2 / 2 70 29 980 29 8 10 29 400 100 OCO 60 73013 176 800 142 900 83 290 56 590 39 130 38 730 3 7 680 29 160 78 630 29 0 10 154 100 60 04 014 195 30 0 122 600 82 3 70 56 440 38 3 10 38 650 36 190 35 110 43 480 28 650 133 400 6 7 88015 163 500 11 1 900 8 1 560 55 6 70 38 680 38 8 10 43 570 52 6 10 4 7 730 28 290 102 100 64 940
16 169 400 106 800 74 34 0 54 170 38 50 0 39 340 36 930 38 8 10 36 830 28 540 84 140 82 90017 232 600 100 000 66 830 53 29 0 39 660 36 780 3 1 190 33 500 40 .750 29 020 72 920 99 86018 169 100 94 020 63 260 5 1 600 3 7 920 34 900 29 WO 3 ! 200 5 1 740 36 860 6 7 880 95.0 1019 132 400 8 7 890 6 1 980 5 1 950 35 780 34 120 28 620 28 530 36 950 46 .5 70 6 7 360 92 60020 110 900 8 7 640 60 790 5 1 470 35 0 60 38 4 10 29 560 76 770 58 250 38 56 0 68 50 0 92 530
2 1 98 540 9 1 030 59 290 50 710 4 7 950 46 120 28 500 26 8 10 8 7 380 36 530 13 1 200 95 20022 96 8 10 9 1 790 58 200 49 230 10 1 00 0 40 590 26 430 26 350 75 280 4 2 490 174 700 0 10070023 114 600 92 300 59 350 48 00 3 88 0 70 3 7 44 0 26 .660 26 540 53 870 58 760 266 300
1914
24 134 800 83 330 185 800 46 480 5 1.360 38 360 25 760 26 080 43 530 53 .430 326 400 137 80025 103 100 77 720 23 9 600 46 06 0 5 1 540 35 660 26 060 26 350 3 7 420 66 260 304 700 168 300
26 118 800 75 .850 259 800 45 900 5 1 490 3 2 720 25 680 25 960 35 ' 20 59 450 2 16 603 13 1 1002 7 225 600 79 570 225 700 44 380 48 940 32 480 25 230 25 20 3 33 680 4 7 800 138 COO 103 60 328 298 20 3 80 730 165 700 45 460 64 40 0 3 1 680 25 320 23 740 32 550 43 790 13 1 500 8 7 65029 365 603 79 690 130 80 0 44 770 5 21 50 32 200 23 960 24 360 3 7 190 45 680 122 400 79 24030 369 800 1 14 00 0 4 4 620 43 5 10 32 380 23 920 24 400 44 2 10 5 1 700 110 700 89 8803 1 3 79 900 100 600
4 8290
25 740 24 9 70 75 930 94 570
Average 182 900 19 7 100 99 130 5 7 090 4 7 100 44 720 29 030 35 600 40 4 10 40 7 10 138 500 92 770Low est 96 8 10 75 850 58 700 44 380 35 060 3 1 680 23 920 23 740 75 930 28 790 58 680 60 04 0Highest 3 79 900 4 15 700 25 9 800 8 7 880 10 1 00 0 77 980 43 5 70 75 260 67 380 75 930 326 000 168 300
Peak flow 386 0 00 499 600 2 76 800 94 460 177 00 0 93 750 50 450 85 00 0 94 930 86 380 329 900 193 300Day of peak 29 7 26 1 22 3 15 5 2 1 3 1 24 24MontNy t otal( 4 11144, cu m) 48 9 80 493 90 26 5 50 148 00 126 20 115 90 77 75 95 35 104 70 10 9 00 358 90 248 50
Runoff Irnro l 65 66 35 20 17 15 10 13 14 15 48 33Rainfall lm m) 108 5 7 60 9 60 5 1 23 6 7 10 1 6 1 12 1 48
Mean Avg 135 90 0 130 900 110 300 86 980 7 1 3 10 5 1 250 42 760 44 0 70 48 680 65 0 70 86 000 122 900flo w s Low 45 980 49 730 4 7 180 35.240 32 250 24 690 19 450 18 450 20 270 22 110 32 920 46 26 0
(year) 1963 1963 19 76 19 76 1976 1976 1976 1976 1959 1959 1964 1975Hap 20 7 90 3 385 703 227 600 176 OW 175 100 8 7 720 99 980 73 030 114 600 177 30 3 226 80 7 353 700Near) 1959 197 7 198 1 1966 1969 1982 196 8 1966 1965 1960 1960 1965
Runo ff Avg 49 43 39 30 26 18 15 16 17 23 30 4 4Low 16 16 17 12 12 9 7 7 7 8 11 17mon 74 125 8 1 6 1 63 30 36 26 40 63 79 127
Rainfall Avg 7 1 55 60 5 6 1 59 5 7 70 69 64 72 78Low 13 13
18118 14 18 2 1 3 12 38 15
High 138 175 116 116 144 148 114 120 149 14 1 145 173
Sum m ary st at i st ic s Faci a , aff ect ing fl ow regi me1984
Fo r 198 4 For recowl As % of • Reserv oi r(s) in cat chm entpi eced ing 1984 pre- 1984 • Flow in f lue nced by groundw at er ab st ract ion
Mean flow len54- 11 83 280 82 8 10 10 1 and / or recharge .Low est ye arl y me an 4 7 020 1976 • A bstrac tion for public w ater sup pl iesHighes t yearly mean 119 300 1966 • Flow red uced by ind ust ria l and/ orLow est monthly mean 29 030 18 450 Aug 1976 agricult ural abst ract io nsHighest monthly mean 19 7 100 Feb 38 5 700 Feb 197 7 • A ugmentat ion f ro m surf ace w ater and / orLow est (l ady mean 23 740 28 A ug 14 700 23 Aug 1976 ground w ater .Highest daily mean 4 75 70 0 7 Feb 8 15 500 6 Dec 1960 • A ugment at ion f ro m eff luent returns

R I V E R F L O W D A T A 59
028010 Den vent at Longbr idge W eir
Stat ist ics of monthly dat a for pr evious record fl an 1938 to Dec 1983i- inseminate or min ing mont hs total 0 .5 ven al
Mean Avg 79 360flow s Low 9 75 1
Newt 196 3High 6 7 OCO(veal 193 9
Runoff Avg 75Low 25sig h 170
Flainfa Avg 102(193 5. l ow 3319831 Ho n 2 15
Summ ary st at ist ics
Mean flow Int% IILowest yearly meanHo liest yearly meanLowest monthly meanHrghest monthly meanLowest daf t/ meanPegnest (Tatty meanPeak10 %an50 %l e95 %deAnnual to tal frnimon cu mlAnnual runoff ImmlAnnual rainfall [mint
1194 1 70 rainfall average
1984
28 9 10 21 940 17 530 17 820 10 110 8 71 1 9 084 10 6 10 13 690 2 1 960 26 2608 086 9 110 7 6 77 5 5 17 4 530 4 2 11 3 176 3 399 3 782 4 30 2 8 4801963 19 76 1976 1956 1957 19 76 1952 1952 194 7 19 75 1975
76 780 69 460 39 59 0 26 4 10 18 0 10 . 28 660 33 930 33 150 35 130 54 360 88 693197 7 194 7 1966 196 7 196 9 1958 1956 1946 1960 1940 196 5
6 7 58 43 33 5 22 121 23 16 35 54 6 7219 13 19 14 8 8 10 11 22
176 177 9 7 6 7 44 73 86 82 89 134 215
80 75 65 70 69 78 83 83 89 107 1008 16 8 I s 15 16 10 3 17 16 10
236 185 131 163 188 158 185 199 178 23 2 246
l os 1984
16 2 10
4 44 4 Avg46 900 Feb
3 19 1 29 Aug143 100 6 Feb168 200 7 Fog35 950
9 93 83 770
5 12 60486
10 15
mew ling 198417 6 109 625
15 2003 176
BB 6901 133
334 200
36 16011 89 04 7 19
55 5 7052 7
1133 110 20 j
1984For record A s % of
19 761966
Aug 1952Dec 1965
72 Aov 195810 Dec 1965
Stat ion descript ionVelocit y-area station w ith a broad crest ed ho rseshoe w oir as contro l
Pre 198492
99
809 292
10 1
Factors aff ect ing flow reg ime
• Reservoir (s) in catc hm ent• Flow inf luenced by ground w ater abst ract ion
and / or recharge• A bstract ion fo r publ ic w ater sup plies• Flow red uced by indust ria l and / or
agricult ura l abst rac t ions• A ug ment at ion from sur face w at er and/ or
ground w at er• A ug ment at ion f rom ef fluent returns

60 H Y D R O L O G IC A L D A T A : 1984
030001 W itham at Cl aypole M il lM easur ing aut ho rit y . A W A Grid ref erenc e SK 84 24 80First year 1555 Level st n (m OD) 16 .90
Dai ly m ean gauged dischar ges (cubi c metres per seco nd)
DAY12345
67
910
1112131415
1617181920
2 112232425
262 72829303 1
AverageLow estHighest
Peek /lo w 1Day of peakMonthly to talm u on cu ng
Runoff ( em )Rainfall Imm)
Meanflow s
AvgLowWear/HighWean
Runoff AvgLowHigh
fl amfail AvgLowHugh
JAN1 59 83 1664 10 13 3292 685
2 2 702 04 5
75 760 259 6
63 758568911096 1
5220
117
9 1496 794 254 2384
2 1415334 23309 78
80638 269 10 205808 70
9 1158 50 20
2 76 70 6 731965
5 527196 1
256
50
Sum m ary st at ist ics
Mean flow On' s .1Lowest yearly meanHigeest yew ly moanLow est monthly meanhig hest mcenNy meanLow est dady meanHighest daily meanPeak10 %de50 %de95 %deAnn ual to tal Inn lliOn cu
EF118 2 188 30 16 3806 46 66 140
8 5699 6 707 5265 82 45 138
4 7824 44 14 23 54 04 23 826
3 73 13 5643 36 83 2503 162
3 04 82 8302 7092 55 82 49 1
2 49 82 56 32 6 192 700
4 64 32 49 19 6 70
2309 7
0 48 11 63
5 397 36
Stat i st ics of mon thly dat a foe previous record (May 19 59 to Dec 19 8 31
3 2540 49 11976
10 6901977
2 74
8 7
4 13
140
0 60 24 64 30 40 5
16 02010 2303.60 51 3350 54 358 75
MAR APR MAY2 58 7 1 938 2502 60 3 2 833 1947 40 9 2 739 2 192 22 7 2 58 2 17E12 370 2 396 256
2 1302 0 20
94 792 194 7
9569628829309 17
839753700686629
60 754 65 78
10 0 109 11 1
9 00 27 0304 6 754 0/333 8853 495
3 1091 54 6
10 0 10
2858
2 96 70 4 531976
6 99 519 79
2 74
63
488
92
2 5 172 3 772 2 7 12 2 122 29 2
2 2852 13 12 1162 0302 123
2 0 171.9 121 8251 7941 750
1 72 21 6641 5801 5261 42 7
1 4 2 11 30 51 3691.34 91 325
1 9941 30 52 938
8 33 5 17
137
2 24 50 36419 76
5 74 81979
203
50
5 110
103
3 8 191 00 00 32854 56
Anfluel runoff (m o.) 19 7 183Annual fa ntail Imm ) 64 1 62 1
1194 1-70 geni al average On m) 622)
St at io n desc ript ionCompound broad cres ted w eir . Range 0 .03 -42 .9 cu rn/ s
08502606 2
0 8800 90 2
0 8 170 7540 7380 7820 744
0 7360 7420 6 770 6 7 10 668
0 8502 7681 3261 0 161 064
1 06 71 8582 29 21 56 41 26 31 438
1 1250 66 82 768
3 0 )
1063
1 7440 3 1119 76
4 65 11983
163
42
5011130
UN6 1748 259 754 966 9
70380 3555180
0 8 70
0 80 10 7560 7830 7280 68 8
0 66 30 78 70 .8970 6300 960
2801 0 9 11 00 50 9 100 862
0 7900 7360 6970 72 50 704
I 0 500 6301 80 3
2 72
933
1 04 60 18419 76
2 9041983
92
25
523
148
JUL0 7420 70 10 68 20 6780 715
0 58 70 5940 5930 6 180 708
0 64 20 6 110 5050 6640 689
0 6200 6300 5530 45 10 658
0 5790 6 100 6350 6360 564
0 5 100 54 70 5 130 5 190 5 160 44 9
0 6020 4490 742
1 6 1 2 06
512
0 7730 06 219 76
1191968
7
19
529
132
1984For 1984 Foe record As % of
preced ing 1984 444- 1984I 858 I 729 107
0 594 19762 80 7 1979
Jul 0 06 2 Ad 1976Feb 10 69 0 Feb 1977
1 Aug 0 0 2 1 24 Jul 197629 Jan 3 1 600 11 Feb 197 729 Jan 3 7 540 11 Feb 1977
9413416510810810 3
AuG0 4061 03 70 9931 82 51 17 1
0 94 71 4860 9580 76 10 695
0 6 150 5 740 58 70 7490 895
0 6550 6520 7050 .7020 649
0 6690 63 10 63 50 6 170 637
0 6220 60 20 6040 6 160 59 90 585
0 7700 40 61 82 5
7
0 7860 13619 762 3 761980
2 1
6 15
127
SEP0 62 10 5770 57 70 94 90 6 15
0 56 70 58 10 56 20 45 40 44 5
0 4 7 10 4740 42 10 7580 573
0 48 50 96 90 68 30 5391 93 1
1 32 30 92 30 8 790 9060 685
0 59 90 6090 6780 68 20 772
0 7090 42 11 93 1
0 72 70 23 21959
2 88 61968
225
523
12 7
Catchment area (so km ): 29 7.9Max alt (m 0 0 ). 158
OCT0 69 10 64 70 7160 6890 772
0 63 70 54 20 65 70 68 10 59 3
0 6040 59 70 59 20 5300 548
0 5200 59 20 6800 66 10 60 8
0 5520 68 70 6 180 85 70 929
0 6990 6040 6 130 6240 8230 779
0 6560 5200 929
12 250 15 650 3 2 17 5 190 2 088 0 86 3 3 .736 3 85 1 1 6 1924 I 22 7 10 4 20 74
1 84 1 76
0 94 10 2 181959
3 9061960
235
495
137
t v0 7440 9 181 3 771.0 110 8 13
1 5091 7631 6 161 6 73
.1 506
1 20 71 1401 9691 89 11 5 10
1 2021 3231 5481 48 21 73 1
3 09 94 44 87.5528 00 83 790
2 6 732 2292 0581 8931 759
2 18 10 7448 098
6 6 19 1588 46 84 34
1 4 100 2 781959
6 5261960
122
5 7
5624
115
1984
DEC60 7594736692620
6 7963753944 7345
5 713
142
34 119626 72 17189
29 254663464 55 73
46 7573482726
3 080
2 2581 9461 6021.62 21 9942 149
1 6 701 1093 080
12 2 10 3 82 223 24
5.65 4 4 7
2 1780 3 1119647 8 79196 5
203
7 1
Fac tors affec ti ng fl ow reg im e
• Flo w inf luenc ed by gro undw ater abst ract ionand/ or rec harge
• A bst ract ion fo r publ ic w ater sup pl ies• Flow reduced by ind ustr ial and / or
ag ricult ura l ab st ract ions .• A ugment at io n f rom surface w ater and / or
groundw ater .

R I V E R F L O W D A T A 6 1
032001 Nene at Orton
Stat ist ics of mont hly dat a for prev ious recor d (Jan 193 9 to Doc 198 3- incomplete of rom ans months total 1.3 year. )
1984
Stat ion descr ipt ionGroup of w eirs and sluices w ith reg ulated by -pass channels High flow s measured at alt ernat ive st at io n W ensford 0 3 20 10 Some riv e r
regulat ion by slu ices Harw ell single pat h ul t rasonic gauging stat ion installed 2975

62 H Y D R O L O G IC A L D A T A : 1984
03 3 0 02 Be d fo r d Ou se a t Be d for d
Stat ist ics of m on th ly dat a for prev ious record (J an 19 33 t o Oec 19 63)
Stat ion desc ript ionThree broad crested w eirs , sup plem ented by three ver tic ally lif t ing s luice gates fo r hig h f low s
1 9 8 4M ea suring au t hOn t y A W A Grid referenc e' TL 0 5 549 5Fir st year 19 3 3 Level s in lin OD) 24 75
Dai ly mean gauged di scharges tcub ic m et res per secood)
DA Y JAN MAR APR M A Y JUN JUL AUG SEP
Catchment area (919 k in ) 14 6 0 0Max all (m OD) 24 7
OCT NO V Of C8 0 30 33 300 13 100 13 500 4 4 00 90 0 2 800 1 580 1 980 4 600 3 500 17 7E0
10 90 3 30 100 1 I 400 I I 700 4 600 800 2 700 1 740 1 820 4 100 3 600 16 7W29 000 29 00 0 10 100 9 BOO 4 60 0 700 2 80 3 1 820 1 900 3 900 5 000 20 50040 200 29 500 7 700 9 600 4 500 300 3 000 2 900 I 90 0 3 800 5 400 22 10024 900 38 000 8 700 9 300 4 403 200 3 000 5 000 2 300 4 000 5 20 3 19 200
19 600 42 700 20 0 8 700 4 300 BOO 3 I CO 5 300 2 600 3 800 5 900 19 10017 000 54 600 8 200 8 400 4 200 1 100 2 80 ) 4 303 2 240 3 400 11 400 22 BOO14 600 60 30 0 8 200 8 200 • 100 1 400 2 240 3 600 2 240 3.300 13 500 19 10012 OCO 55 400 8 100 8 300 4 000 500 2 400 3 100 2 300 3 100 8 700 15 50010 500 34 900 8 100 7 BOO 4 200 BOO 2 700 2 700 2 0 70 3 200 8 700 13 700
11 10 50 0 26 500 8 100 8 700 4 4110 30 0 2 60 3 2 150 2 0 70 3 100 8 200 17.30012 10 60 3 22 100 10 100 8 500 4 400 000 2 700 1 980 2 300 2 900 8 00 ) 11 40013 10 BOO 18 40 3 I I 700 7 500 4 200 800 2 50 3 1 900 2 3(X) 2 800 11 103 11 100
12 300 14 700 10 500 6 900 3 800 500 2 500 2 150 2 300 2 BCC 16 40 3 I I 10015 13 500 13 400 9 600 6 800 3 500 103 2 800 2 300 3 300 2 700 12 400 10 800
16 13 930 13 100 8 900 6 700 3 700 400 3 300 2 300 3 400 2 900 9 I CO 12 80017 23 80 0 1 1 700 8 400 6 200 4 100 800 3 400 2 400 3 500 1 900 7 600 20 10018 19 400 1 I 200 8 000 5 BOO 4 030 700 3 100 2 300 3 600 3 800 8 400 2 1 30019 13 300 10 700 7 600 8 000 4 000 900 2 800 2 240 4 000 5 90 3 8 600 18 00 020 11 703 10 400 7 100 5 80 0 3 80 0 800 2 50 3 2 150 5 700 5 100 8 COO 18 300
2 1 9 500 10 500 7 100 5 900 4 200 60 0 2 30 3 2 0 70 16 100 4 200 10 BOO 20 80022 9 BOO 12 BOO 7 100 5 800 8 30 3 300 2 240 2 150 12 800 4 300 25 60 3 17 10023 16 600 26 900 7 300 5 60 3 13 70 3 300 2 0 70 1 980 7 500 6 400 49 400 16 10024 39 100 24 200 18 800 5 400 6 700 500 1 900 1 900 6 800 9 50 0 62 103 18 83025 32 00 0 17 900 5 1 00 0 5 200 4 500 103 1 980 1 980 5 700 500 68 900 26 300
26 • 32 000 15 300 56 60 0 4 900 6 000 500 1 909 2 0 70 5 300 10 ECO 80 700 75 BOO77 53 10 :1 14 500 4 7 200 4 600 13 000 200 2 150 2 150 4 GOO 6 900 54 300 2 1 60028 60 80 3 13 100 33 900 4 600 19 100 000 I 980 2 0 70 4 200 5 700 2 7 40 ) 16 0 3019 43 50 3 13 400 25 700 4 600 14 900 900 1 900 2 150 IL 300 5 200 23 300 14 30030 31 900 17 600 4 300 8 COO 700 1 900 2 0 70 5 000 900 19 80 0 17 5003 1 33 900 15 700 6 500 500 2 0 70 4 300 23 500
Average 22 250 24 420 I S 140 7 170 6 05 2 5 59 7 2 50 2 2 4 70 4 204 4 600 19 600 17 790Low est 8 0 30 10 400 7 I CO 4 300 3 50 3 2 700 1 500 1 580 1 820 2 700 3 50 3 10 800No est 60 800 60 300 56 600 13 500 19 100 15 400 3 400 5 30 0 16 100 10 60 0 BO 700 26 30 3
Peak flow i . 57 10 3 62 100 58 500 16 100 19 700 18 300 3 600 6 400 2 1 20 3 11 700 84 500 2 7 600Day of peak 28 8 26 28 7 16 7 2 1 26 26 25Month ly to talo ndko n m i in t 59 59 6 1 18 40 56 18 58 16 2 1 14 5 1 6 70 6 62 10 90 12 32 50 80 4 7 64
Runoff On n• 4 1 42 28 13 1 1 10 5 5 7 8 35 33Ha nley (m m ) 82 49 50 8 75 44 15 5 1 34 60 10 2 4 7
Mean Avg 19 190 20 2 10 17 420 10 9 10 7 17 1 4 26 2 3 09 6 2 712 2 736 5 152 11 0 30 15 170(to w s Low 2 60 6 2 233 40 9 1 99 4 1 4 12 0 484 0 098 0 038 0 270 0 452 1 149 I 53 1
(year) 1934 196 5 19 4 4 19 76 1934 1934 1934 1934 1934 1934 1934 1964H ig h 55 190 53 300 62 0 10 3 1 460 28 29 0 1 1 950 19 080 14 400 18 0 00 26 420 43 800 40 400(yaw l 1939 197 7 194 7 195 1 1983 1954 196 8 1980 1968 196 6 196 0 1960
Runoff A v g 35 34 32 19 13 6 5 5 9 20 28Low 5 4 4 3 0 0 0 1 2 31k g h 10 1 88 114 56 52 2 1 35 26 37 48 78 74
Rai nf 40 A v g 57 42 49 45 55 52 53 62 54 59 64 6011934 - Low 15 3 5 3 10 8 5 3 3 4 ICI 13191331 Nigh 124 1 I I 140 96 113 119 120 138 1 10 137 178 128
Sum ma ry st at ist ics
For 1984 For recordprecedung 1984
1984As % of
Pr e- 1984
Fact ors aff ect i ng fl ow regim e
• Resenrcer(s) in catc hment• Flo w inf luenced by groundw ater abst ract ion
Mean flo w 1rn ' s- 10 930 9 8 73 I I I and/ or rec harg eLowest yearly mean 2 40 1 1934 • A bst ract ion for public w ater supp liesHig he s t yearly mean 18 890 193 7 • Flow red uced by ind ust rial and/ orLo w es t m o nt N y mean 1 4 70 Aug 0 038 Aug 1934 agncuhural abst ract ionsHig he s t m o n t hl y m oa n 24 4 20 Feb 62 0 10 Mar 1947 • A ugment at ion f rom eff luent ret urns

R I V E R F L O W D A T A 63
0 3 4 0 0 6 W a v e ne y a t Ne e d ham Mil lM ea suri ng au th ori ty : A W AFir st year : 19 6 3
Da i ly m ea n g a u g ed d is c ha rg es
DAN' JAN i t fl MAR APR1 0 93 9 7 38 7 1 230 2 5942 1.223 8 0 55 1 43 7 2 0 163 2.9 76 7.759 1.296 1.5434 2 30 5 8 0 38 1.10 7 1 5265 1 1362 10 690 1 127 1.38 1
6 2 05 4 12.750 1 10 2 2.6537 2 89 2 18.560 1 06 8 3.26 18 2 723 11 880 1 0 13 2 56 86 1.866 6 209 0 962 2 144
10 1.6 16 4 .396 1 03 1 2 0 98
I I1213
15
1617181920
2 122232425
26272829303 1
AverageLow estHighest
Peak fl owDay of peakMontNy to tallimhlion cu ml
Runof f (rnm)Ra da (mm)
St a t i st i c s o f m o nt hl y d at a fo r pr evi ou s re co rd (Dec 1963 to Oec 19 8 3)
Mean Avgflow s Low
In ertHigh(year)
li kn off AvgLowHigh
Rainfall AvgLowH gIi
1 8 792.0 352 6883 3 122 3 76
2 35 73 4 192 38 71 8 70I 49 2
1 26 71 49 52 2602 7 161 9 75
10 .86024 82024 82016 . 1309 2309 9 15
Su m m ary st at is t ic s
Mean fl ow 1m1s- 1)Low est yearry meanli g nast yeat ty meanLow est mon th ly ma nHighest mom* meanLow est daily mew,%ghost da y meanPan10 %de50 % la95 % laAnnual to tal (ma ce, cu rfi lAnex-W runoff (rnm)Arn ual rai nfall Mwn1
( 194 1-70 rainfall averege (mml
(cubic me tr es pet secon d)
3 584 1.139 1.94 53 0 17 1 093 1 64 7
732 1 0 14 1.389339 0 994 1.304098 0 939 1.29 1
989 0 90 9 1.118872 0 857 0 .9 12460 0 784 0 89 352 1 0 773 0 8 73534 0 774 0 858
69 7 0 774 0 8 1546 7 0 773 0 768269 0 74 1 0 698140 2 024 0 .63 9126 3 .702 0 633
20 9 8 179 0 .62023 1 5 253 0 .57423 8 3.999 0 556223 3 760 0 525
3 785 0 5363 .292
For 1984
1 84 2
0 33 74 83 10 25 2
24 82027 200
3 7830 9450 33058 2515763 3
AugJan
27 Aug2 7 Jan2 7 Jan
Grid reference; TM 2298 11Level stn . (rn OD) 16 .50
For recordpreceding 19841.75 10 53 72.7300 .26 1
10 6 700 189
89 760113 30 0
4. 1430 75 10 32 155 2614960 260 31
St a t ion d e sc r ip t io nCo m po und Crum p w ets in ma in c ha nne l p lu s s ing le Crest ed Crum p in m il l by pa ss
1 9 8 4Cat chment area (se km )- 3 70 0
Max alt 0 01: 65
11.44 Y -4114 A ll AUG SEP Ca NOV DEC0 .563 2 230 0 495 0 330 0 .269 0 50 9 0 564 1.29 10 .566 2 706 0 489 0 352 0 26 5 0 56 5 0 56 4 1.30 70 56 4 1.8 16 0 483 0 38 5 0 290 0 .564 0 .54 2 1.25 70 .568 1.363 0 480 0 36 1 0 38 7 0 .56 9 0 5 18 1 23 50 .598 1 239 0 .46 7 0 366 0 40 1 1.452 0 5 18 1.266
0 .578 1.117 0 .473 0 .35 2 0 3 7 1 2 172 0 569 • 2980 56 5 1 655 0 4 5 7 0 448 0 36 9 1 393 0 635 3 5 760 52 6 1 360 0 40 9 0 575 0 .34 7 1.129 0 632 2 06 60 .5 13 1.054 0 .462 0 492 0 34 5 1.114 0 623 0 98 10 54 4 0 .886 0 .540 0 .4 15 0 33 5 0 9 6 7 0 6 18 1.756
0 .530 0 .80 3 0 .520 0 36 5 0 33 2 0 8 2 1 0 59 9 1 5 720 496 0 .766 0 48 3 0 352 0 328 0 7 18 . 0 6 15 1.53 70 465 0 .704 0 46 8 0 344 0 32 7 0 630 . 0 640 1.5 110 46 7 0 664 0 4 73 0 34 2 0 .38 1 0 58 5 0 729 1 4 270 499 0 626 0 55 5 0 34 2 0 53 1 0 56 2 0 .83 5 0 83 9
0 4 75 0 .59 5 0 56 1 0 34 2 0 4 76 0 53 6 0 34 7 2 89 10 4 74 1 112 0 485 0 .34 2 0 434 0 .52 6 0 892 5.2 130 46 9 2 7 11 0 44 6 0 .334 0 453 0 5 29 1 0 7 1 3 8340 456 1 42 1 0 428 0 29 8 0 4 76 0 523 1 2 17 2 8550 56 5 1 060 0 40 2 0 .29 2 0 98 1 0 494 1 54 1 7.332
1.132 1 48 5 0 .39 1 0 29 5 1 9 7 1 0 466 3 40 1 7 78 14 746 1 158 0 380 0 3 12 1.2 78 0 6 13 5 396 3 .7982 093 0 99 8 0 4 15 0 .25 7 0 98 9 1 00 5 7 928 2 89 11 2 18 0 84 3 0 4 19 0 262 1 175 0 .863 13. 180 2 .983i 0 78 0 73 7 0 39 3 0 2 74 1.46 1 i 0 33 10 .190 4 20 2
1 06 8 0 664 0 39 0 0 26 1 1 10 9 0 9 86 4 .6 53 6.9644 275 0 603 0 38 7 0 251 0 8 13 0 746 2 776 4 482• 465 0 508 0 38 3 0 26 2 0 .673 0 640 2 2 79 3. 16 73 00 4 0 5 12 0 3 7 1 0 26 7 0 59 1 0 62 7 1 90 7 2.5091 72 5 0 509 0 35 7 0 .28 3 0 639 0 60 3 1 645 2.34 51 3A5 0 34 1 0 276 0 589 2 76 1
• 83 1 4 464 1.836 1.346 1 182 1 130 0 44 5 0 .33 7 0 62 7 0 79 1 2 254 2 9620 939 1 126 0 74 1 0 525 0 456 0 508 0 34 1 0 .25 2 0 26 5 0 4 66 0 34 7 0 839
24 820 18 560 8 179 3 26 1 4 746 2 7 11 0 56 1 0 575 1 9 7 1 2 172 13 180 7 78 1
2 7 200 20 200 9 16 1 3 59 6 6 094 3 560 0 600 0 600 2 59 1 1 59 1 13 66 0 10 5 102 7 7 26 6 2 7 18 15 22 2 1 6 24 20
12.94 11 19 4 9 2 3 49 3 17 2 93 1 19 0 90 1 62 2 11 5 84 7 93
35 30 13 9 9 8 3 2 4 6 16 2 190 39 42 15 66 58 30 2 7 92 55 69 50
3.608 3 5.83 2.643 1 9 74 1 156 0 6 12 0 495 0 486 0 9 17 0 8 73 1 865 2 9060 609 0 722 0 59 1 0 487 0 36 9 0 286 0 .28 5 0 26 2 0 16 1 0 352 0 39 7 0 4921973 1965 1973 19 74 19 74 19 74 1974 1973 1964 1964 1964 19647. 132 10 6 70 7 66 6 5 54 6 3 255 1 0 19 0 880 1 250 9 754 1 9 12 8 852 8 380196 9 19 79 198 1 1983 1969 197 1 196 9 1968 1968 19 74 19 74 1965
26 24 19 14 8 4 4 4 6 6 13 2 14 5 4 3 3 2 2 2 1 3 3 4
52 70 55 40 24 7 6 6 68 2 1 62 6 1
49 39 43 44 46 48 6111 48 55 50 65 5416 17 10 9 10 10 7 2 4 25 1878 72 96 86 9 7 104 364 10 1 16 1 116 150 100
1973196 9
Sep 1964Feb 1979
23 Aug 19 7316 Sep 196 816 541) 1968
1984As % of
Pr e-1984105
9 112610310 510 5105
Fa ct o rs a ff e ct i n g fl o w r eg im e
• Flo w re duced by industrial and / oragricultural abst rac tions
• A ug me nt ati on f ro m surf ac e w at er and / o rg ro undw at er .

64 H Y D RO L O G I C A L D A T A : 19 8 4
036006 St our at Langham
St at is t ic s of mo nt h ly d at a for pr ev io us re co rd (Om 1962 t o Ds< 198 3)
St at ion de sc r ip t io nTw in -t hro ate d t rap ezo ida l c ri t ica l dep t h f lum e . Flo w au guenen t ed as pan o f Ely -Ou se t ransfe r sc he me .
1984Me asuring aut ho r it y A W AFir st year . 19 6 2
Da i ly m ean gauged d isc ha rges (cub es m et l e • per
D A Y J A N FEB M A A
Grid nth :nonce TM 0 20 344Le vel sm (m OD) 6 .4 0
t ovon4)
PP M A Y JU N AA AUG
Cat chm en t
SEP
area (so km ) 5 78 .0M at al t (m OD) 12 8
OCT NOV DFC1 2 0 5 7 11 080 2 332 580 62 9 2 00 1 1 4 11 0 906 0 8 10 1 2 17 238 3 2642 2 643 10 450 2 378 273 38 3 1 828 1 2 76 1 04 2 0 940 1 190 230 2 8 723 8 459 12 1 10 2 4 11 692 60 5 2 135 1 32 8 1 0 77 1 0 27 1 24 6 3 75 2 3444 10 890 13 480 2 3 77 384 570 2 26 9 1 2 76 1 104 0 9 70 I 165 330 2 4635 6 886 17 5 10 1 2 75 28 7 52 1 2 423 0 99 8 1 160 0 998 4 719 365 2 36 1
6 6 496 16 360 2 26 3 6 55 725 2 485 1 025 1 3 19 1.500 4 .99 1 4 18 6 8027 6 9 18 73 560 2 20 2 32 7 538 3 978 0 93 7 1 59 1 0 85 1 2 263 76 7 8 0 138 7 176 37 750 2 348 173 865 3 894 0 920 1 824 0 75 0 78 7 635 4 3609 4 135 17 600 2 028 910 55 1 1 580 1 125 1 8 74 332 3 11 574 3 380
10 2 94 5 8 629 2 05 6 634 649 2 094 0 83 8 1 68 7 28 7 38 7 56 2 2 785 '
11 3 0 92 6 124 2 20 9 780 59 7 82 7 0 98 7 1 575 20 1 39 5 631 2 0 1512 3 6 16 4 9 76 7 629 651 6 17 853 I 113 1 2 12 0 32 304 34 7 2 16713 4 9 72 4 53 2 3 16 1 649 182 73 1 0 955 1 09 5 0 3 1 357 4 15 2 34 114 8 00 2 4 33 9 2 83 8 386 30 1 78 7 1 151 0 9 73 140 34 4 2 170 2 4 1015 4 75 7 3 62 1 2 66 3 276 4 71 78 1 1 181 1 30 3 26 1 356 4 44 1 2 44 9
16 5 158 3 32 7 2 39 0 24 8 108 80 7 1 06 6 0 8 78 248 3 74 2 545 5 10 117 7 64 8 3 2 7 1 2 2 78 104 22 2 08 1 1 0 16 1 283 518 282 2 828 10 12018 4 555 2 483 2 190 84 5 83 0 Off 1 0 14 0 863 25 2 2130 5 86 1 6 43919 3 173 3 00 2 2 0 28 0 68 404 863 1 0 77 1 0 79 239 279 3 178 4 77 120 2 904 2 923 2 115 0 5 1 526 50 1 0 948 1 098 308 2 73 1 4 75 5 34 5
2 1 1 632 3 05 3 2 08 7 953 236 1 090 1 03 1 0 880 435 38 7 5 54 2 8 14 122 3 09 7 3 034 2 126 988 137 422 0 99 5 0 896 499 474 9 432 5 34 223 7 119 1 6 / 5 2 0 / 4 939 92 3 718 1 230 0 80 1 19 7 85 7 17 3 70 4 60 924 14 820 2 33 7 4 37 1 869 786 58 1 0 96 3 0 83 7 46 5 735 18 440 5 6 7025 7 993 2 36 7 4 38 7 849 60 3 176 0 954 0 895 333 742 19 150 9 138
26 12 700 2 617 I I 04 0 / 99 8 14 66 5 0 96 4 0 9 16 56 5 65 4 8 49 8 11 7302 7 23 080 2 456 7 68 2 753 69 7 3 74 0 64 7 0 702 30 3
644126 4 7588977 350
28 3 7 870 2 388 6 6 79 756 6 88 6 48 7 0 8 70 0 740 138 3 4 50429 22 630 2 .3 10 6 9 76 720 4 68 7 46 6 0 89 4 0 768 137 187 3 688 3 34430 • 12 840 5 764 00 6 2 0 12 34 7 0 89 7 0 76 7 29 7 226 3 544 3 30 33 1 14 58 0 4 90 5 1 92 1 0 84 7 0 7 15 177 • 232
Average 8 52 7 7 94 7 3 396 2 354 2 256 2 6 75 1 030 1 092 1 380 6 12 4 548 4 8 12Low est 1 632 2 3 10 2 028 1 720 I 187 I 176 0 64 7 0 202 0 8 10 0 78 7 1 230 2 0 15Highest 3 7 8 70 3 7 750 I I 040 3 580 7 69 7 13 090 1 4 11 1 8 74 4 435 4 99 1 19 150 11 730
Peak flow 40 8 10 4 1 270 12 770 4 229 12 250 15 780 1 740 1 125 5 9 70 6 92 1 22 160 13 2 10Day of peak 28 8 26 1 27 2 1 I 17 2 1 5
25
26Monthly to tal(nin on cu n11 22 84 19 9 1 9 10 6 10 6 04 6 93 2 76 2 93 3 58 4 32 11 79 12 89
Runo ff (rnal ) 40 34 16 11 $0 12 5 5 6 7 20 22Rainfall (mm) 85 44 43 12 68 63 20 4 1 94 6 1 72 4 7
Mean Avg 5 0 80 5 05 3 4 8 72 3 580 2 536 1 34 5,
0 954 0 9 19 1 060 1 59 0 2 7 19 4 06 1flow s Low 1 398 0 884 1 59 7 1 2 18 0 758 0 453 0 190 0 209 0 395 0 509 0 5 78 0 69 3
(year) 196 5 1965 1976 19 74 1974 196 5 1976 19 76 1964 1970 1964 196 4lagn 9 05 3 12 980 9 776 9 335 7 253 2.8 10 1 655 2 0 80 4 955 6 237 11 340 10 550(year) 197 1 19 79 198 1 1983 1983 1983 1980 196 8 1968 1982 1974 196 5
Runo ff Avg 24 2 1 23 16 12 6 4 4 5 7 12 19Low 6 4 7 5 4 2
II 2 2 3 3
Hig h 42 54 45 42 34 13 8 10 12 29 5 1' 49
Rainfall Avg 46 35 46 46 48 48 dI A 50 52 48 6 1 52Low 15 16 12 11 12 10 8 11
13 20 13
N gh 70 63 93 99 100 100 8 7 105 118 128 155 10 7
Su m m ary st at is t ic s
For 1984 For recordIn cerltng 1984
1984A s % of
pre 1984
Fact ors af fect ing flow reg ime
• Flo w redu ced by ind us t ria l and / o rag ricult ura l ab st ract io ns
Mean flo w (m' s 3 453 2 804 123 • A ug m en ta t io n f ro m surface w at er an d / o rLow est yeanY mean 1 418 1973 g ro undw at erHighest yearly mean 4 0 77 19 79 • A ug m en ta t io n f ro m eff lue nt re tu rn s

R I V E R F L O W D A T A 65
038003 M im r am at Panshanger Par k
Stat ic. , descriptio nT rap ezo ida l cri t ical de p t h fl ume m ea sures up t o 11.3 cu rn / s
1984M aa su nn g aut hori ty TW A DndFir st y ea r : 19 5 2
Da i ty m ea n g aug ed d is ch arg es (cubi c met e s per sa ron g
DAY JAN FEB MAR APR
re f erenc e TL 28 2 133Level stn . (m 00 ) 4 7 10
MAY 1 .1/4 AA ALC SSP
Catc hm ent area i sq k m) . 133 .9Max alt (m OD). 193
OCT NOV CEC0 53 8 0 6 11 0 5 71 0 .592 0 505 0 60 7 0 408 0 355 0 33 7 0 39 5 0 .4 10 0 5 79
2 0 64 9 0 59 2 0 5 73 0 55 2 0 49 3 0 .598 0 346 0 35 1 0 33 2 0 425 0 429 0 .596
3 0 53 5 0 604 0 548 0 56 1 0 49 1 0 .585 0 398 0 33 7 0 386 0 44 7 0 4 26 0 59 7• 0 489 0 66 7 0 54 3 0 .54 5 0 49 9 0 5 10 0 40 2 0 6 7 1 0 35 6 0 .39 5 0 4 14 0 5 75
5 0 5 15 0 60 2 0 554 0 55 3 0 48 1 0 5 13 0 390 0 43 9 0 .374 0 564 0 .548 0 66 7
6 0 494 0 60 4 0 54 8 0 56 5 0 49 7 0 .624 0 .39 6 0 40 7 0 35 7 0 4 11 0 505 0 63 3
7 0 £139 0 703 0 54 6 0 .54 6 0 4 72 0 .575 0 38 7 0 50 2 0 .33 6 0 40 6 0 46 1 0 590
0 4 79 0 63 7 0 54 2 0 544 0 .482 0 50 8 0 3 79 0 4 13 0 .33 5 0 4 15 0 49 7 0 60 1
9 0 46 9 0 .575 0 .542 0 56 1 0 504 0 482 0 3 76 0 38 1 0 426 0 40 7 0 .46 6 0 .583
10 0 4 76 0 58 2 0 544 0 .550 0 49 5 0 .469 0 3 73 0 .380 0 .3 76 0 40 5 0 414 8 0 5132
I I 0 5 19 0 573 0 559 0 599 0 49 2 0 460 0 36 1 0 3 7 1 0 .339 0 40 1 0 460 0 5 78
12 0 525 0 558 0 .558 0 54 3 0 4 75 0 455 0 368 0 369 0 334 0 393 0 494 0 580
13 0 523 0 56 9 0 .55 5 0 53 3 0 .483 0 45 1 0 366 0 370 0 .338 0 390 0 5 16 0 6 12
14 0 5 73 0 5 70 0 529 0 533 0 .45 1 0 44 4 0 .500 0 376 0 88 1 0 38 7 0 486 0 6 14
15 0 48 7 0 56 9 0 52 7 0 53 3 0 4 76 0 438 0 409 0 44 2 0 425 0 38 7 0 463 0 632
16 0 726 0 573 0 52 6 0 .534 0 .472 0 433 0 39 1 0 380 0 3 79 0 .39 2 0 558 0 75 7
17 0 533 0 5 72 0 520 0 53 7 0 50 5 0 5 18 0 384 0 372 0 55 1 0 .39 2 0 522 0 64 1
18 0 5 10 0 56 7 0 5 17 0 53 7 0 464 0 46 2 0 3 74 0 36 7 0 39 3 0 432 0 490 0 622
19 0 50 3 0 569 0 536 0 .5 17 0 4 71 0 sit I 0 373 0 36 2 0 4 17 0 .45 2 0 4 78 0 .63 4
20 0 49 6 0 64 3 0 536 0 5 18 0 55 7 0 628 0 39 1 0 364 0 .82 3 0 39 7 0 568 0 66 7
2 1 0 493 0 6 12 0 .550 0 5 17 0 63 5 0 453 0 380 0 34 8 0 .58 4 0 4 16 0 628 0 6 16
22 0 58 7 0 65 1 0 55 2 0 5 12 0 769 0 49 1 0 3 75 0 34 3 0 .42 5 0 50 0 0 76 5 0 630
23 0 8 17 0 .60 5 0 69 1 0 506 0 53 1 0 5 10 0 3 74 0 350 0 574 0 .44 1 0 .93 5 0 63 2
24 0 584 0 .590 0 .896 0 52 1 0 48 7 0 452 0 .36 6 0 4 15 0 5 12 0 6 53 0 6 77 0 658
15 0 589 0 589 0 773 0 500 0 .544 0 442 0 36 3 0 36 1 0 430 0 .50 6 0 6 14 0 69 9
26 0 65 7 0 .599 0 668 0 496 0 824 0 424 0 36 5 0 35 1 0 4 10 0 44 8 0 .584 0 644
27 0 60 3 0 59 8 0 632 0 490 0 705 0 4 17 0 360 0 362 0 40 3 0 434 0 59 7 0 62 7
28 0 583 0 58 1 0 63 7 0 48 2 0 .594 0 4 17 0 34 1 0 380 0 4 15 0 468 0 6 17 0 622
29 0 58 2 0 .56 6 0 60 4 0 4 73 0 546 0 4 17 0 34 1 0 363 0 4 15 0 425 0 59 6 0 66 7
30 0 68 7 0 .6 0 477 0 50 2 0 4 16 0 34 5 0 34 1 0 4 15 0 4 17 0 .58 6 0 666
3 1 0 604 0 .594 0 488 0 329 0 .334 0 4 13 0 64 7
Average 0 55 8 0 59 8 0 58 3 0 53 1 0 .529 0 488 0 3 79 0 386 0 .43 6 0 433 0 54 1 0 62 7
Low ersi 0 469 0 .56 6 0 5 17 0 4 73 0 45 1 0 4 16 0 329 0 334 0 .332 0 38 7 0 .4 10 0 5 75
Naghest 0 8 17 0 700 0 .896 0 .599 0 824 0 628 0 50 0 0 6 7 1 0 88 1 0 653 0 .935 0 75 7
Peak fl ow 1 2 70 0 924 1 690 0 960 1 560 1 3 10 0 .738 I 240 1 440 0 94 9 1 4 70 1.170
Day ol Pea r 23 7 24 3 2 1 20 14 4 141 24 23 16
W o thly to talima on cu mi 1.50 1 50 1 56 1 38 1 42 1 2 7 1 0 2 1 03 ( 13 1.16 1 40 1 68
Runoff (nen)Rainfall enne ,13; 11 12
441011 1218
969
816
843
810 2
962
1098
1346
Stat is tic s of moo d i ly da ta for previo us reco rd (Doc 1952 to Dec 19 83)
Moan Avg 0 579 0 643 0 673 0 .66 3 0 62 2 0 .564 0 492 0 45 3 0 .42 5 0 4 )4 . 0 449 0 .50 5
fl ow s Low 0 245 0 .289 0 258 0 260 0 2 16 0 186 0 163 0 145 ' 0 195 0 . 175 0 176 0 189
& earl 1974 1973 1973 1973 1976 1976 1976 19 76 1973 1973 1973 1973
K oh 1 10 2 i 167 1 119 1 0 50 1 084 0 9 7 1 0 80 3 0 764 0 6 17 0 638 0 739 1 005
lyear) 196 1 196 1 196 1 19 79 1979 19 79 19 79 19 79 196 8 1968 1960 19130
Runoff Avg 12 12 13 13 12 I I 10 9 9 10
Low 5 5 5 5 4 4 3 3 • , 3 4
22 2 1 22 20 22 19 16 15 12 13 14 20
Ra nfall Avg 54 43 49 46 5 1 58 54 58 56 59 62 63
l ow 17 3 3 5 15 5 5 7 5 5 20 13
Hen 102 se 116 10 5 115 122 123 127 12 1 142 15 1 119
Sum ma ry st at ist ics
Fof 19134 For remotaoreceging 1984
1984As % ofpm •198 4
Fact ors af fect ing flo w regi me
• Flo w in fl uen ced by g rou ndw ate r ab st ract io nan d / o r reCharg e .
Mean flow lm 1s - 0 .507 0 540 94 • Flo w re d u c e d by ind ust ria l and / o r
Low esi yearly rnean 0 23 1 1973 ag ric ult ural ab st ract ion s .
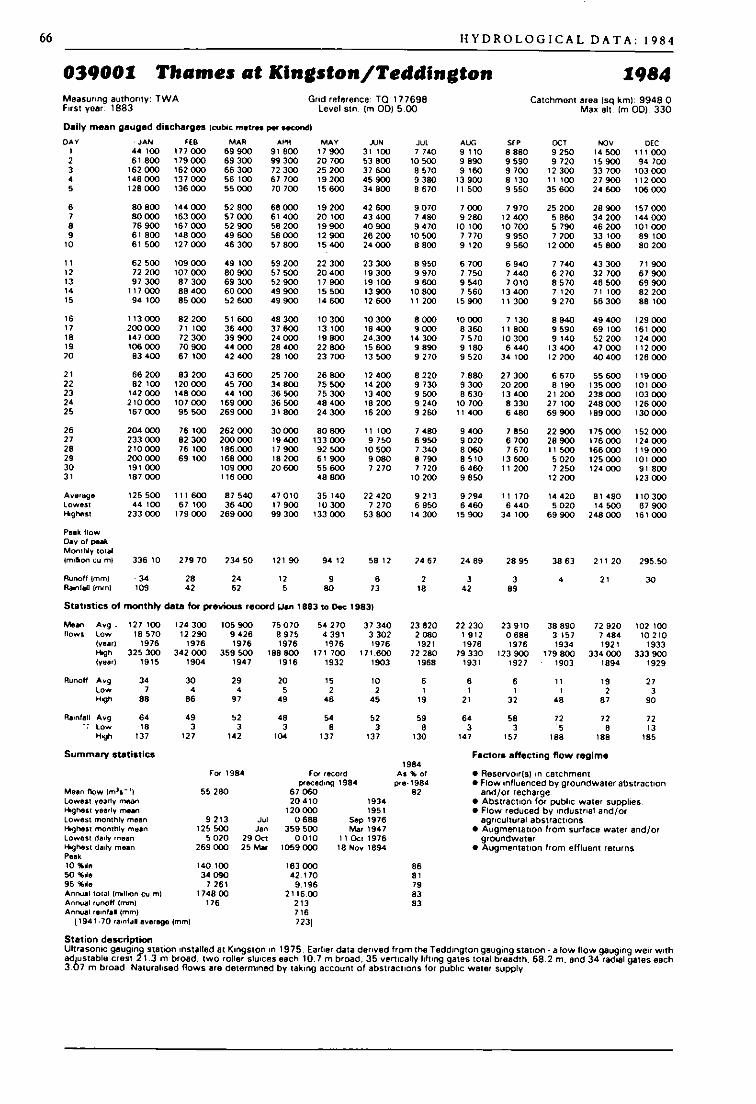
66 H Y D R O L O G I C A L D A T A : 1 9 8 4
03 9 00 1 Tha m e s a t Kin gs t o n/ Te d d in g t o n 1984
Stat ist ics of mon t hly da t a f ee pr evi o u S record fJan 1883 t o Oec 19 8 3)
St at ion desc ript ionUlt rasonic ga uging st at io n inst a lle d at King st o n in 1975 Earlier data derived from the Teddington gauging stat ion - a low fl o w ga ug ing w eir w it had fu sta b le crest 2 1.3 m broad, tw o roller sluices each 10 .7 m broad. 35 vertically lift ing gates total breadt h. 68 .2 rn, and 34 rad ial gates each3 .0 7 m broad Naturalised fl ow s are determined by taking account of abstract ions for public w ater supply.

R I V E R F L O W D A T A 67
03900 7 B lac k w a t er a t Sw a l lo w f ie ldM easurIng aut hori ty : TW AFust year 1952
Dai ly mean gau ged di schar ges (cubic met re s pp seamen
DAY
11121)1415
1617181920
2 122232425
26272819303 1
AverageLowest1. 9best
Peak fl owDay of peakMontNy to talund io n cu m)
JAN2 7707 4608 06 04 3304 220
3 7303 6 103 1402 9202 940
3 4 103 4 104 7505 0 703 720
11.6007 5304 7904 1303 620
3 4405 5 109 8 707 2706 440
14 OOD8 6206 4 105 6 105 8405 550
5 6052 770
14 OCO
18 100 8 19016 22
15 0 1
Moan Avg 4 60 7flow s Low 1 758
(yeag 1954H4 1 8 000N W ) 1975
Runof f Avg 35Low 13Hig h 60
Rainfall Avg 65Low 15K O 124
Sum mary stat ist ics
Moan flow OR' s- I1Lowest yearly meanFag/test yearly meanLo w e st monthly mean•• ottest monthly meanLowest Onl y meanH ott e st c1M y m ewPe ak10 %de50 %de95 %doAnnual tota l (mullion cu m)Annual tunoft Own)A n n ua l rainfall Imng
1194 1-70 rainfall average Imm)
FFB MAR5.980 3 1005 340 3 2004 4 70 2 9 104 3 10 2 .8704 330 2 860
5 1304 3 704 1903 5 103 300
3.2803 1803 1302 9502 900
2 8 102 7702 8002 8003 580
5 3007 1105 1204 2803 830
3 5903 4 103 2 103 190
3 9372 7707. 110
Runoff Unml 42 28Rainfall Imml 11 1 39
9 86
4 09 31 68 719657 29 21966
281250
2 .8 102 7802.7002 .7202 750
3 4 105 1303 4403 2202 980
2 8302 7 102 .6502 6802 580
2 5602 5 103 .980
19.20012 400
8 6 107 420
10 3008 1207 6607 110
4 84 52 5 10
19 200
3 782
3 8201 3231953
6 89 819 79
291052
APR MA Y6 50 0 2 0805 150 2 .8804 540 2 .650• 0 70 2.2503 .660 2 150
3 5403 2003 1903 1603 020
3 0202 8902 .7902 7402 700
2 .7602 6502 5402 4 102 350
2 2902 2602 2402 2 102 2 10
2 1202 1302 1102 1 102 130
2 9562 1106 500
23 100 7 3 1024
12 98 7 66
223
3 0 361 52 119 76
5 600196 6
22114 1
Gnd ref erence: SU 73 164 8Level st n. (In OD) 42 28
2. 1102 0001 9 701 96 02 650
2 .5502 3402 1202 .0 702.230
2 2902 5202. 1702 1302 330
2 5309 0 704 1503 1203 340
11 0 3013 3006 8504 8 103 8503 340
3 5751.960
13 300
JUN3.9003 3003 1902 .7902 900
2 .5403 3902.5802 3502 230
2 2302 1102 0 701.9501 900
1 8802 6402 200
990880
800820770900760
6306 105 705 70590
2 2351 5 703 900
16 300 4 5502 7
9 57 5 79
2 7 1610 2 28
Stat ist ics of mon t hly dat a for prev ious reco rd lOct 1952 t o Dec 1983)
2 5261 08 11956
5 9461978
1 98 70 76 71953
6 4 72197 1
19 158 6
45 4 7
For 1984 For recordpceced ing 1984
3 385 2 88 71 466 19533 777 1982
1 60 5 Jul 0 638 Sep 19595 60 5 Jan 8 0 19 Nov 19601 220 12 Sap 0 464 18 Aug 1953
19.200 24 Mar 39 200 16 Sep 196823 100 24 Mar 4 1 00 0 16 Sep 1968
6 0 75 5 5 0 42 745 2 0991 3 19 0 857
10 7 00 9 1 1130 2 25 778 1 714
7081
A t5 10540490
450
52045044 0440380
4 104508 10760540
4204303804 104 10
4003800 50580260
9206205903904 104 70
60 5380
3 .050
6 840 6 5 10 8 680 14 900 17 500 14 00023 4 2 1 24 23 16
4 30 4 32 5 .25 6 95 11 53
1230
1 4480 7 111953
2 3 16196 8
115
17
1984As % of
Pl e- 198 4117
11013 1154117117109
AUG1 4401 4 701 4904 6202 .340
1 83 01 8201.7301.6001.530
1 4301.3601 5 102 0801 990
1 6901 5901 4401 43 01.330
1 3201 3201 3801 3601 3 10
1 2701.2901 2901 2 701 2401 260
1 5 141 2404 620
1244
1.4850 7231953
2 6 22197 7
115
20
SLP1 2701.2401 2801 420I 320
1.2501 2501 2 701.2401.230
1 2301 2201.2302 40 01 900
I 4502 1003 .5401 83 05 14 0
6 2 702.8902 2302 06 01 850
1 7401 6902 2502 .7602 2 10
2 0 251 2206 2 70
1583
1 8200 63 81959
6 6091968
135
48
Catchm ent area (se km ) 3 54 .8Ma x alt . tm ODT 22 5
Ca1.9601.8802 6302 1602.750
2.3901 9201 86 01 8902 9 50
2 2301.9301.8001 7 101.700
1.7 101 6 702 05 02 9202 4 70
1 9902 6 702.8207 4 206 800
3 4802 .8402 7002 5502 3502.200
2 5941 6 707 420
2083
45 53 46 55 52 55 59 68 705 3 8 8 5 18 17 3 6
108 125 106 128 144 104 117 167 20 8
Stat ion descri pt ionCrili cal depth f lume a nd sid e w eir 9 m broad . 19 70 onw ard s 2 Crum p w eirs . ma n 4 .5 7 m broad . sid e 2 .7 m broad
NOV2 1203 2803 4 102 5702 4 70
3 0202 5 702 8 102 9202.700
2 49 03 0 204 6 703 2702.850
3 7404 2303 2602 .9603 . 190
4 53013.70015.5009 4 106 420
4 9204 2304 4404 5604 150
4 44 72 120
15 500
31100
2 5 15 3 3520 90 7 1 26 21959 196 47 6 13 8.0 191960 1960
19 247 9
57 59
7318
179
Factors af fect i ng f low reg im e
• A ug mentat ion f rom eff luent ret urns.
198 4
cEC4 1304 . 1204 7804 5705.580
9 09 05 4404.3904 COO3 590
3 2 703 2 103 9304 2 103 830
10 2007 3805 5507 59 07.230
5 38 05 20 05.3506 1505 560
5 0 704 1903 7603 8 104 8 704 500
5 1593 2 10
10 200
13 82
3976
4 0 171.29 819537 0221960
301053
7318
16 7
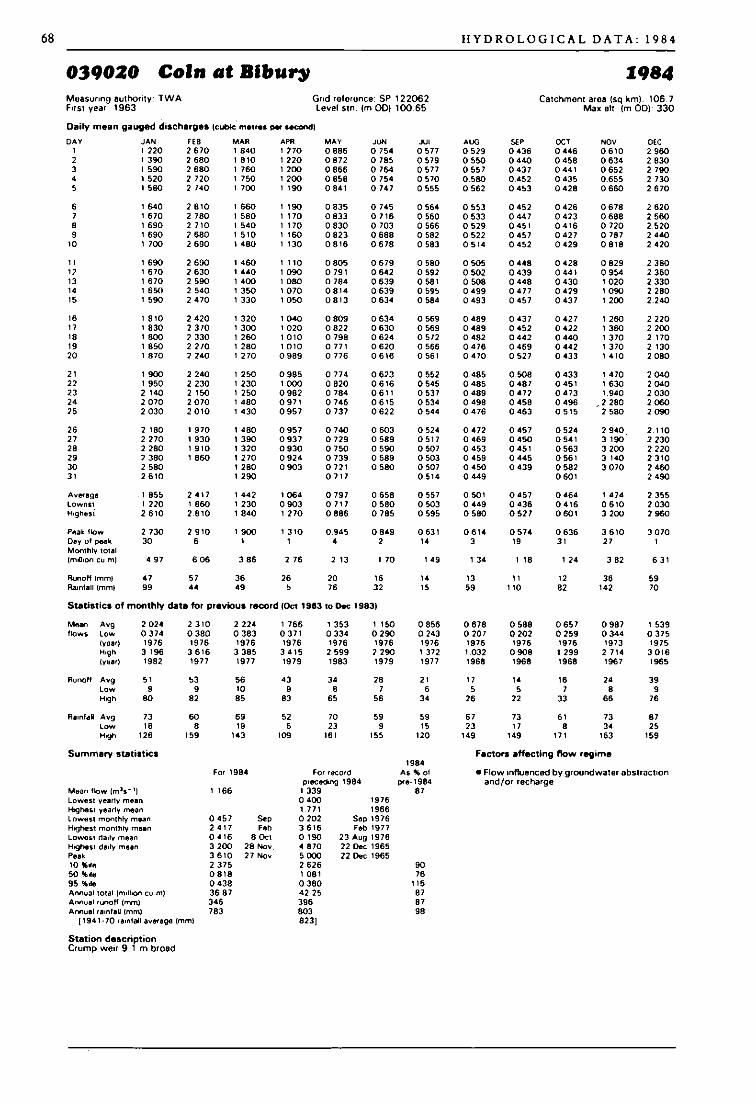
68 H Y D R O L O G I C A L D A T A : 19 8 4
039020 Col n at M a ry 1984
St at i st ics of m on t h ly da t a fo r prev io us rec o rd (Oct 1963 to Dec 1983)
Stat io n desc ri pt io nCrump weir 9 .1 rn broad
Measuring authorityFirst year 1963
Da i ly m ean gaug ed
DAY
TW A
d is char ges (cubic
JAN FEB120 2 6 70
metres oar
MAR840
Grid reference SP 12206 2Level stn (m OD) 100 65
w condl
APR MAY JuN Ji ll1 70 0 886 0 754 0 577
AUG0 529
Catchment
SEP0 436
area Isci km) 106 .7Max ett (m OD) 330
OCT NOV DEC0 446 0 6 10 2 960
2 390 2 680 8 10 220 0 8 72 0 785 0 579 0 550 0 440 0 458 0 634 2 8303 59 0 2 680 760 100 0 866 0 764 0 577 0 55 7 0 43 7 0 44 1 0 652 2 79045 520 2 720 750 200 0 85 8 0 754 0 570 0 .580 0 .45 2 0 43 5 0 .65 5 2 730
580 1 740 700 190 0 84 1 0 74 7 0 555 0 56 2 0 453 0 428 0 660 2 6 70
6 640 1 8 10 66 0 190 0 83 5 0 745 0 564 0 553 0 452 0 426 0 6 78 2 6207 6 70 2 780 58 0 170 0 83 3 0 7 16 0 560 0 53 3 0 44 7 0 423 0 688 2 5608 690 1 710 54 0 170 0 830 0 703 0 566 0 529 0 4 5 1 0 4 16 0 720 2 .5209 690 2 68 0 5 10 160 0 82 3 0 68 8 0 582 0 522 0 457 0 427 0 78 7 2 440
10 700 1 690 480 130 0 8 16 0 6 78 0 583 0 5 14 0 451 0 429 0 8 18 2 420
11 690 2 690 460 110 0 805 0 6 79 0 580 0 50 5 0 448 0 428 0 82 9 2 38012 6 70 2 630 440 090 0 79 1 0 64 2 0 592 0 50 2 0 43 9 0 44 1 0 954 2 36013 6 70 2 590 400 080 0 784 0 639 0 58 1 0 508 0 44 8 0 430 1 0 20 2.33014 650 2 540 350 0 70 0 8 14 0 639 0 595 0 499 0 4 77 0 419 1 090 2 28015 59 0 2 4 70 330 050 0 8 13 0 634 0 584 0 493 0 457 0 43 7 1 200 2.240
16 8 10 2 420 320 040 0 809 0 634 0 569 0 489 0 43 7 0 42 7 1 260 2 22017 830 2 3 70 300 0 20 0 822 0 630 0 569 0 489 0 452 0 412 1 360 2 20018 800 2 330 260 0 10 0 798 0 614 0 5 72 0 482 0 44 2 0 44 0 1 3 70 1 17019 850 2 2 / 0 280 0 10 0 77 1 0 620 0 566 0 4 76 0 469 0 442 1 3 70 2 13010 8 70 2 240 2 70 0 989 0 776 0 6 16 0 56 1 0 4 70 0 52 7 0 433 1 4 10 2 080
2 1 900 1 240 250 0 985 0 774 0 623 0 552 0 .48 5 0 .50 8 0 433 1 4 70 2 04012 950 2 230 230 1 00 0 0 820 0 6 16 0 545 0 485 0 48 7 0 45 1 1 630 2 04023 2 140 1 150 250 0 981 0 784 0 6 11 0 53 7 0 489 0 4 77 0 4 73 1 940 2 03024 2 0 70 2 0 70 480 0 9 7 1 0 746 0 6 15 0 534 0 49 8 0 458 0 496 , 2 280 2 06 025 2 030 2 0 10 430 0 95 7 0 73 7 0 622 0 544 0 4 76 0 463 0 5 15 1 580 2 090
26 2 180 1 9 70 480 0 95 7 0 740 0 60 3 0 524 0 472 0 45 7 0 524 2 940 2 . 1102 7 2 270 1 930 390 0 93 7 0 719 0 58 9 0 517 0 46 9 0 450 0 54 1 3 190 2 23028 1 280 1 9 10 320 0 930 0 750 0 590 0 50 7 0 453 0 45 1 0 56 3 3 200 2 12029 7 380 1 860 2 70 0 924 0 739 0 58 9 0 503 0 459 0 44 5 0 56 1 3 40 2 3 1030 2 580 280 0 90 3 0 72 1 0 580 0 50 7 0 450 0 439 0 58 2 3 0 70 2 4603 1 1 6 10 290 0 7 17 0 .514 0 44 9 0 60 1 2 49 0
Aver age 1 855 2 4 17 44 1 1 064 0 79 7 0 658 0 55 7 0 50 1 0 457 0 46 4 1 4 74 2 355Low esl 1 220 1 860 230 0 90 3 0 717 0 580 0 503 0 449 0 43 6 0 4 16 0 6 10 2 030Highest 2 6 10 2.8 10 840 1 2 70 0 886 0 785 0 595 0 580 0 52 7 0 60 1 3 200 1 960
Peak f lo w 2 730 1 9 10 900 1 3 10 0 .94 5 0 849 0 63 1 0 6 14 0 5 74 0 636 3 6 10 3 0 70Dey of peak 30 6 1 1 4 2 14 3 19 3 1 2 7 1Month ly to tal(In d ia n CU ri l l 4 97 6 06 3 86 2 76 2 13 1 70 1 49 1 34 1 18 1 24 3 82 6 3 1
Runoff lm rn1 4 7 5 7 36 26 10 16 14 13 11 12 36 59Rainfall (mm( 99 4 4 49 5 76 31 15 59 110 82 142 70
Mean Avg 2 021 2 3 10 2 124 1 766 1 353 1 150 0 856 0 678 0 588 0 65 7 0 987 1 539flow s Low 0 3 74 0 380 0 38 3 0 3 7 1 0 33 4 0 290 0 243 0 20 1 0 20 2 0 259 0 34 4 0 375
Near) 1976 1976 1976 19 76 19 76 1976 1976 19 76 1976 19 76 1973 1975High 3 196 3 6 16 3 38 5 3 4 15 2 59 9 2 290 1 372 1.032 0 90 8 1 29 9 2 714 3 0 16(year) 1982 1977 19 77 19 79 1983 1979 1977 1968 1968 1968 196 7 1965
Runoff Avg 5 1 53 56 43 34 28 2 1 17 14 16 24 39Low 9 9 10 9 8 7 6 5 5 7 8 9High BO 81 85 83 65 56 34 26 22 33 66 76
Rainfall Avg 73 60 69 52 70 59 59 6 7 73 6 1 73 8 7Low 18 8 19 5 23 9 15 13 17 8 34 25H g h 126 159 143 109 16 1 155 120 149 149 17 1 163 159
Sum m ary s tat i st ic s Fact on aff ec t ing fl o w reg im e1984
For 1984 For rec ord As % of • Flow influenced by groundwater abst ractionpreced ng 1984 Pr e - 19 8 4 and/ or recharge

R I V E R F L O W D A T A 69
04 000 5 Be u l t a t S t i le Bridge 1984
St at is t ic s of mont hly data for prev iou• record iOct 1968 to Dec 19 83 - incom plete of meet ing mont hs t ota l 0 .3 years )
Mean Avg 4 68 6 3 637 3.00 8 1 69 1 1 193 0 584 0 250 0 .3 14 0 58 7 1 940 3 382 4 135flow s Low 0 733 0 70 7 0 33 3 0 . 180 0 114 0 04 5 0 029 0 005 0 032 0 0 8 1 0 133 0 40 1
Nee / 1976 1959 1976 1976 1976 1976 1976 19 76 1959 1969 1978 197 1WO 8 972 9 24 1 8. 175 5 8 50 4 00 2 3 .72 7 1 6 78 1 60 7 3 504 9 .8 12 14 390 8 762Need 19 75 196 6 1975 1983 1983 1964 1980 1966 19 74 196 0 1960 1959
Runoff Avg 45 32 29 16 12 5 2 3 5 19 3 1 401 i 1
Low 7 8 3 2 o o 0 0 4
Hop 8 7 8 1 79 55 39 35 16 18 33 95 135 85
Rainfall . Avg 52 44 53 4 7 50 49 49 5 1 66 7 1 80 75l ow 13 1 0 10 13 5 12 16 3 5 14 24HO 120 103 116 106 103 119 107 119 14 1 185 183 157
Summ ary st at ist ic s Fact ors aff ect i ng fl ow reg im e1984
For 1994 For w oad As % of • Flo w red uced b y ind ustr ia l and / o rprececlarg 1984 pee- 1984 ag ric u lt ura l ab st ract io ns .
Mean flo w (sn' s - ' ) 2.06 5 2 108 98 • A ugm enta t io n fr o m effl ue nt re tu rn s .l ow est yearty mean 1.120 1962Hvghest yearly mean 3 .938 1960l ow est monthly mean 0 08 1 Av g 0 00 5 Avg 1976High est mom* mean 7 540 Jan 14 390 Nov 1960l ow est dat y mean 0 04 5 22 Aug 0 00 2 20 Aug 1976Highest daily mean 27.920 17 Dec 6 1 450 3 Nov 1960Peak 35 950 23 Jan 80 .990 • Nov 196010 %re 7.580 5.884 12950 %de 0 .36 2 0 526 6995 %il a 0 06 7 0 0 70 9 7Annual to tal (nelson cu in) 65.30 66 52 98Am uel runo ff Invnl 236 24 0 98Annual ra nfall Irnnt) 709 69 7 102
( 194 1 70 rai nfall overage (nun) 68 1)
Stat ion descri pt ionBroad crest ed w eir w it h low fl o w no tc h, an d al t erna t iv e veloc it y -ar ea st at io n fo r hig h f low s 4 5 m upst ream

70
041016 Cuchntere at Cow beech
H Y D R O L O G IC A L D A T A : 1984
St a t i st i c s Of month ly dat a f o r prev iou s record (J un 19 6 7 to Dec 19 83 — incomp let e ra m is t ing mont hs t ot al 0 .2 years)
1984
Stat ion descript io nCo m p o und Crum p w eir . crest breadt hs 2 13 m and 2 .97 m Structure operational from 196 7 Limited low how records , from April 1939 , areavailable from the measuring authority

R I V E R F L O W D A T A 71
Stat ist ics of mon th ly data fo r previou s recor d 10et 1958 to Dec 191331
St at io n descri pt io nVeloc ity-area st at ion unt il 197 1 when sim ple Crump w eir. 7 .75 m crest installed Comp lem entary rectang ular thin p late w eir at A llbroo t onform er li chen Navigat ion Canal
0 42 0 1 0 H a ie n a t Il ig h b ri d g e + A l l b r o o kM easuring author ity : SW A Grid referenc e : SU 46 72 13First year : 1958 Level st n. (171 OD) 17 .15Daily me an gauged discharges (cubic metres per second)
19 8 4Ca tchm ent area (SC1 kin ). 360 .0
Ma r al l OD5 20 8
D A Y JAN / Ul MAN APR MAY AM A l M1G SLP (S T NOY Ct C4 795 7.792 7.295 7. 188 5 55 8 5 360 3 .973 3 .573 3 090 3 188 3 83 6 5 293
2 5 522 7.6 16 7.229 7 0 26 5 6 77 5 47 2 3 8 18 3.82 7 2.97 1 3 2 / 2 4 06 1 5 40 53 6 .0 44 7.5 18 7. 155 1 0 52 5 884 5 28 5 3.9 11 3 84 6 3 130 3 62 1 4 23 9 6 0604 5 35 1 7.555 7. 126 6 .978 5 84 8 5 20 2 3.858 4 54 1 3 22 5 3 4 19 4 132 5 8 705 5 36 3 7 589 7 0 73 6 90 0 5 68 9 5 326 3 720 4 3 19 3 195 3 40 4 3 90 9 5 9 2 1
6 5 29 2 7.749 1.033 6 9 19 5 6 72 5 206 3.643 3 9 19 3 16 1 3.35 8 3 .955 6 3 127 5 26 9 7.72 7 6 94 8 6 968 5 53 6 5 283 3.590 3 89 3 3 135 3 30 7 3 825 5 9088 5 2 77 7 640 6 .980 6 .900 5 426 5 082 3 58 1 3 869 3 148 3 320 4 .18 1 5 .7629 5 039 7.544 6 .956 6 88 3 5 406 • 8 18 3.84 1 3 739 3.24 2 3.43 5 £ 2 12 5 .794
10 5.103 7.56 1 6 780 6 .95 2 5 492 4 .796 3 828 3 623 3 20 9 3 6 19 4 20 8 5.755
11 5.332 7 435 7 0 10 6 930 5 64 8 4 72 1 3.770 3 .55 5 3. 183 3 56 3 4 08 7 5 .76 712 5.534 7 404 7.422 6 .93 7 5 546 4 8 12 4 204 3 5 12 3 17 1 3 490 4 034 5 78 713 5 8 17 7 60 7 7 028 6 .809 5 3 72 4 .669 4 194 3 572 3 183 3 39 6 4 .306 5 8 1514 5.839 7 40 2 6 883 6 8 16 5 3 73 4 64 7 4 115 3 .59 5 3 28 3 3 364 4 28 8 6 00 915 5 68 3 7 483 6 740 6 .83 3 5 59 4 4 4 74 4 00 8 3 53 2 3 344 3.34 6 4 177 6 0 18
16 6 763 7 498 6 624 6 6 14 5 780 4 44 7 3.848 3 454 3 29 2 3 40 9 4 .224 6 7 1717 6 .594 7 45 7 6 694 6 .539 5 4 16 4 .570 3 76 7 3 39 1 3.56 5 3.56 2 4 2 16 6 6 7418 6 08 9 7 44 3 6 58 8 6 484 5 28 6 4 .384 3 72 1 3 34 5 3 66 7 3 844 4 2 10 6 4 1619 5 84 3 7 4 18 6 486 6 46 1 5 189 4 3 15 3 62 7 3 195 3 4 73 4 103 4 20 0 6 40 320 5 8 18 7 6 15 6 425 6 440 5 .20 7 4 .333 3 58 6 3 0 17 4 026 4 0 10 4 332 6 509
2 1 5 856 8.044 6.409 6 328 5 186 4 30 2 3 54 7 2 935 4 428 3 6 54 4 73 1 6 19 722 6 185 8 0 13 6 350 6 295 6 382 4 360 3 44 5 3.20 2 3.94 1 4 034 6 30 1 6 33023 / 238 7 785 6 99 9 6 2 15 5 626 4 .259 3 39 9 3 250 3 64 8 3 9 71 7 08 2 6 49024 6 844 7 556 9 30 3 6 0 76 5 180 4 256 3 40 7 3 29 9 3 4 15 4 7 13 6 39 1 6 55625 6 850 7 469 8 478 6 0 3 1 5 5 15 4 19 1 4. 10 1 3 76 3 3 36 1 5 029 5.856 6 69 6
26 7.720 7 42 1 7 58 3 5 9 10 6 609 4 100 4 023 3 204 3 2 7 1 4 459 5 435 7 1132 7 7 189 7 364 7 764 5 834 6 5 17 4 102 3 824 3 20 7 3 259 4 095 5 29 1 7 84 628 6 99 2 7 35 7 7 80 9 5 75 1 6 0 26 4 165 3.477 3 08 2 3 24 2 4 0 16 5 29 6 7 20 129 7 0 13 7 289 7 46 7 5 72 5 5 50 8 4 175 3 453 2 98 3 3 2 19 3 943 5 359 7 04 530 7 53 1 7 330 5 68 1 5 38 9 4 .048 3 37 1 3 12 1 3 358 3 92 2 5 289 7 26 13 1 7 80 8 7 170 5 29 4 3 554 3 09 1 3 94 7 7 199
A verage 6 116 7 564 7 132 6 549 5 6 11 4 63 7 3 74 7 3 48 1 3 36 1 3 736 4 655 6 330l owest 4 795 7 289 6 350 5 68 1 5 180 4 048 3 37 1 2 935 2 971 3 188 3 825 5 293Highest 7 80 8 8 044 9 30 3 7 188 6 609 5 42 2 4 204 4 54 1 4 42 8 5 029 7 0 82 7 84 6
Peak howDay of peakMonth ly to tal(million cu ml 16 38 18 95 19 10 16 98 15 03 12 02 10 04 9 32 8 7 1 10 0 1 12 0 7 16.95
Runoff pnre t 46 53 53 4 7 42 33 78 26 24 78 34 4 7Rar fel (rvnl 151 47 9 1 2 100 25 38 3 7 9 1
Mean Avg 6 558 7 167 7 06 0 6 535 5 762 4 90 1 4 192 3 87 1 3 748 4 20 1 4 924 5 764flo ws Low 4 2 11 4 162 3 644 3.20 3 3 09 3 2 58 2 2 4 74 2 33 1 1 66 9 2 702 2 84 0 3 136
(year) 19 76 196 4 1976 19 76 1976 1976 1976 1976 1973 1959 1973 1973High 10 520 10 850 9 92 3 8 52 1 7 3 12 6 .550 5 2 19 5 24 5 5 128 7 86 7 9 85 7 10 860Near) 1969 196 9 197 7 1969 1966 19 79 19 79 19 79 1968 1960 1960 1960
Runoff Avg 49 49 52 4 7 43 35 3 1 29 27 3 1 35 43Low 3 1 29 27 23 13 19 18 17 19 20 20 23High 78 73 74 6 1 54 4 7 39 39 3 7 59 7 1 8 1
Rainfall Avg 86 59 85 4 7 72 64 56 54 93 76 83 841197 1) Low 39 19 24 16 19 10 22 18 2 1 30 3 1 251983 1 Htgh 159 137 172 9 7 13 1 113 8 7 89 195 177 197 138
Summ ary sta tist ics
Foe 198 4 For recordpteced ing 1984
1984Ar % of
Pre. 1984
Fac to rs aff ect i ng fl ow reg im e
• Flo w inf luenced by gro undw at er abst ract ionand / or rec harge
Mean flow lm rs 5 23 5 5 380 9 7 • A bs tract ion fo r public w ater sup phesl owest yearly mean 3 708 19 73 • A ug ment at ion f ro m surface w ater and/ orHighest yearly mean 6 594 1960 ground w ater

72 H Y D R O L O G I C A L D A T A : 19 8 4
043 00 5 A v o n a t A m e s bu rY 1984M easu ri ng aut ho ri t y W W AFir st y ear 19 6 5
Dai ly m ean gauged d ischarges (cu bic me tr es per seeoncl)
DAY AN IT E4 MARI 533 8 556 5 44 22 74 7 8 64 3 5 3 183 204 7 8 7 1 5 0 894 492 7 560 5 0395 269 7 563 4 984
6789
10
I I12131415
16i 7181920
2 122232425
162 72829303 1
Av erageLoyvestHvOhesi
Peak / lowDay of peakMonth ly to talIrn il ion cu
144 7 8 79 4 966104 7 88 5 . 4 94299 7 7 439 4 9 19952 7 2 77 4 90 0954 7 156 4 8 75
0 26 7 0 99 4 8550 6 1 6 983 4 836666 6 835 4 7899 73 6 69 1 4 743795 6 60 9 4 696
649 6 55 1 4 8 110 38 6 46 9 4 8440 7 1 6 323 4 830753 6 244 4 86 65 78 6 42 7 4 85 7
4 10 6 90 9 4 854$739 6 920 4 75 760 2 6 702 5 0 7552 5 6 29 7 7 7269 17 6 119 6 9 15
76570030 8130179828
03653 3700
6 0 3 15 8325 7265 56 1
6 90 25 56 18 64 3
13 49 17 29
6 63 96 0 555 1944 84 14 72 2• 69 7
5 1644 6967 726
PR MAY JUN JUL AUG SEP GO NOV GEC666 3 120 2 84 3 759 2 15 0 54 24 7 1 284 1 72844 2 3 0 12 2 95 7 822 256 04 3 23 5 1 36 2 2.7004 70 3 00 7 3 009 690 260 04 9 2 18 1 457 2 69 730 2 3 03 1 2 824 796 2 77 0 87 22 2 1 46 9 2 77628 1 2 960 1 772 659 28 7 057 22 7 1 404 1 8 10
3 18 2 93 1 2 76829 3 2 8 76 2 77 1229 2 839 2 684224 2 8 11 2 5 60209 2 80 3 2 392
209 2 79 1 2 329133 2 745 2 29 2088 2 .72 7 2 26 506 4 2 685 2 23 104 5 2 73 1 2 195
96 4 2 935 2 187779 3. 132 2 16584 1 3 064 2 1698 11 1 885 1 17578 1 2 8 17 2 150
58 8 2 820 2 08 150 4 3 2 71 1 99 1442 3 599 2 0 784 14 3 049 2 00 3382 2 938 2 0 15
304 3 160 1 952239 3.38 1 1 8442 17 3 20 8 1.80 5179 2 94 5 1 79 112 1 2 8 12 1 76 1
2 724
3 8853 12 14 66 6
13 83 10 0 7
God re fe re nc e SU 15 14 13 Catchment area (sg km) 323 7l evel st n (rn 00 ) 6 7 06 Max alt lm ()L ) 294
2 9622 6853 599
2 30 21 76 13 00 9
7 93 5 9 7
6 125895635695 19
49458865858453 1
4894 1140236 1369
3383262863 16365
32828325924822 7188
4 72188822
480 9 0 79 8 44 7 4 7 10 3 898 3 063 1757 2 24 I 23 3 4
27728023 7238178
2 1115815616228 1
22719 1149122100
3 94 3 15
02502503 105 202 1
04 20 1400 5035138
0 7120 5390354544
182 1 4 76 3 086163 1 5 16 3 0 5316 1 1 599 2 906175 1 936 2 8 18200 2 088 2 754
2 12 1 84 1 2 7082 19 1.788 2 69618 1 2 38 8 2 72 1175 2 290 2 953156 995 2 99 4
164172244296426
799 3 70973 7 4 260676 3 7556 18 3 83870 1 4 39 4
05 5 2 04 4 456 1 14 3 4 06 106 5 1 732 506 3 324 3 92 6094 1 535 46 3 4 0 13 4 134140 1 404 64 1 3 932 4 19 1170 1 277 2 00 8 3 273 4 236
156 1 157 1 928 2 90 1 4 6 19148 1 759 1 584 2 766 6 38 8082 1 240 1 4 75 2 735 5 83 5083 1 2 18 1 455 2 732 5 49 10643 1 23 1 1 339 2 73 7 6 59 40 78 i 304 6 60 7
174 1 2 15 1.33 7 2 169 3 82 10 55 1 00 5 1 156 1 284 2 69628 7 2 04 4 2 00 8 4 0 13 6 60 7
488 2 204 2 133 4 89 7 7 32 50 20 25 23 3 1
3 15 3 58 5 62 10 23
Rumoff Onmf 42 53 43 31 25 18 12 10 10 1 1 17 32Rainfall (nuvi l 134 38 58 I 90 26 2 1 35 95 7 1 125 99
St at ist ics of mont hly dat a for prev iou s record (Feb 1965 to (Mc 1983)
Mean Avg 5 254 5 84 5 5 653 4 553 3 50 5 2 7061 158
2 04 2 1 7 19 1 6 19 11 9, 4593 21 0906753 19 75
O
2 311993887245
hew) 19 76flo w s Low 1 199 1 187
19761 039 0 834 01967166 0 475 4776 195 0 3776 76 192 019
197064 4
19 76 1976 1976H 8 55 5 9 686 8 352 7 5789 19 79 19 79 197 1 197 5 146 4 260 3 02 1 2 3769 19 74 196 61 2 528 3 52 1 7 160
°19
lye. 1981 197 7 19726 4401974
Runof f Avg 43 44 4 7 36 29 22 17 14 13 16 2 1 33Low I CI 9 10 8 7 5 4 3 5 10 9 I iNi gh 7 1 72 69 6 1 43 34 25 20 20 29 52 60
Rainfall Avg 76 56 69 4 7 6 1 58 50 62 72 6 7 74 86Low 18 6 14 8 24 3 15 22 I 1 4 3 1 26El fp 134 134 150 100 12 1 143 113 152 179 16 1 185 160
Sum m ary st at i st i cs Factors affect i ng flow regi me
For reca d1984
As % ofFor 1984preceding 1984 ore-1984 • Na t ural t o w it hin 10 % 819 5 Percent ile flow .
Mean flow On 1s - 11 3 10 7 3 4 19 76 90Low est yearly mean
41 4434746 19 771
Ii ighest yearly meanLowest memor y mean 1 174 Aug 0 3 72 Aug 1976Highest ruontNy mean 6 90 2 Feb 9 68 6 Feb 197 7Low est dasly mean 1 005 13 Sep 0 175 22 Aug 19 76h ighest clergy mean 10 700 2 7 Jan 15 540 25 Feb 197 7Peak 11 480 2 7 Jan 17 330 16 Mar 198210 %l e 6 26 5 6 622 9550 %Ile 1 756
1 0 839 7
95 %de1i 815044
94Annual to tal (mil lion ou m 108 70) 98 25 90Annual runoff frn ml 30 4 336 90Annual rainfall enrnf 793 778 101
1194 1-70 rainfall average 1mm) 7641
Stat io n desc ript io nCrump w eir 9 14 m b ro ad w it h a b ro ad c re st ed w orr o n bo t h s id es

R I V E R F L O W D A T A 73
045001 En at T hor ver ton
Station descr ipt ionVeloc ity -area station Modi fied in 1973 by the construc tion of a low level bed control
1984Measwi ng aut hority SW W A Grid reference : SS 9360 16First year: 1956 Level sm . (i n OD) 25.85
Daily mean gauged discharg es (cubic nw tr ee per seco nd)
DA Y JA N FEB MAR APR MA Y A M AA1 22 .680 53 .280 12.500 11.1 10 3 . 172 3 .164 1 6 74
AIJG1 394
SEP1.34 1
Cat cfvnent area (sq kin): 60 0 .9Max alt . ( n OD): 5 19
OCT HEW DEC9 .352 20 6 20 46 200
2 59 .350 46 720 11 800 9 635 3 089 3 58 3 1.734 1.52 1 1.33 7 8 48 5 26 .70 3 40 3503 65 .3 70 54 .890 10 0 50 9 192 3 .188 5 333 1 62 7 3 48 1 1 3 10 8 . 15 7 22 840 4 1.170• 48 440 53 8 10 9 2 74 10 340 3 20 7 3 848 1 6 11 • 646 2.26 9 7 23 7 20 . 130 14 2505 40 630 .6 5 420 8.620 9 246 3 08 3 4 05 3 1.60 1 2 49 2 2.30 5 6 .155 17.650 3 1.6 10
6 34 .360 135 .900 B 045 8 .566 2.963 • 095 1.555 1.93 1 1.704 5 393 15.720 26 .3307 30 9 10 110 00 0 7.582 8 06 6 2.89 3 3 .540 1.473 1.8 59 1.542 5_388 15.900 22 3008 25 .720 65 .980 7. 10 1 7 68 4 2 .775 3 32 3 1.394 1.694 1.550 6 .354 39.340 19 4 709 22.340 44 960 6 88 9 7.364 2 .724 3 054 1 6 13 1.56 1 1 759 10 . 100 36.250 17. 120
10 2 1 820 35 .530 6 490 7 0 5 7 2 .586 2 90 3 1 70 7 1.465 2 0 12 10 .090 32 .2 70 14 .990
11 24 780 29 560 6.34 7 6 883 2 54 3 2 80 9 1 828 1 46 6 1 9 76 8 822 28 480 13 .48012 44 8 70 24 040 6 334 8 45 1 2 44 9 2 .764 2 265 1 458 1.95 1 8 469 3 7 630 12.29013 118 500 19 900 5 882 8 046 2.364 2 .784 2.965 1 430 1.829 7 894 3 1 OOP 12.40014 8 1 060 16.940 5 8 16 5 83 1 2.404 2 783 2.538 1.39 7 4 458 7 187 33. 160 15 35015 56 6 10 14 840 5 3 15 5.6 16 2 54 1 2 729 2 .355 1 35 7 3 29 2 6 6 18 30 0 50 13 340
16 110 30 3 13 270 5 08 2 5 280 2 N I 2 50 1 2 066 1.33 1 2 85 6 6 .0 18 29 170 30 26017 78 .490 11 900 4 92 1
52 850 2 424 1 945 1 325 2.6 12 6 03 7 23 590 30 18018 53 80 0 10 .790 4 .779 4 854 2 838 2.352 1 8 16 1 29 8 2.530 12. 740 20 250 28 MIO19 4 1.590 10 480 4 .688 • 64 2 2 52 1 2 252 1 692 1 240 1 298 14 330 18 920 39 300
20 33 .240 17.600 4.53 7 4 46 9 2 4 17 2 260 1 68 31 58
10 . 160 15.6 90 24 .250 39 990
2 1 32.390 25 . 110 4 34 8 4.334 2 45 1 2 20 1 1 66 3 1 346 10 .250 23.2 70 4 7 740 34.09022 39 970 3 7 130 • 2 73 4 23 6 5 8 13 2 165 1.59 2 1 53 2 8 24 6 78 000 95 770 34 4 1023 134 5 10 3 1 350 11 940 4 055 5 356 2.35 5 1 439 1.526 8 06 2 SI 340 96 .220 3 1 63024 62.990 2 7 4 70 10 250 3.890 3 528 2 0 77 1 544 1.344 7.0 16 5 1 380 88 190 34 23025 7 1.620 23 .530 9 44 9 3 729 3 122 2 .0 74 I 709 1.260 6 .538 4 7.230 54 .400 36 33 0
26 103 0 30 20 530 8.3 11 3 5 78 4 290 1 9591 54.4 41
1 2 70 8 7 13 38 950 45 9 20 34 .1302 7 133 300 17.840 8.834 3.44 7 • 6 15 1 8 79 1 88 1 24 2 7 28 2 3 1 280 3 7.5 50 30 100282930
80 55060 25059 990
15 55013.830
8 2 167.5047 09 2
3.35 93 3 143 235
3 9 183 5 113. 160
II 8790341 796
1 30 51 3 171 3 76
1 2891 1971 26 5
8.0289 06 7
11 560
26 4802 1.62028 .5 10
33 28030 17028 650
25 68025.49023.800
3 1 49 .870 10 .260 3 08 8 1 433 1 46 4 23 .000 2 1.0 10
Average 5 7. 190 36 140 7 48 7 8 0 2 1 3 . 168 21..775 7 I 72 1 1 62 3 4 .52 2 19.340 36 260 27.730t ow n ' 2 1 820 10 410 4 .273 3 23 5 2 364
901.305
I 191.3 10 5.38 8 15 720 12 290
Highest 133 .300 135 .900 12.500 I I 1 10 5 .8 13 5 333 2 .96 5 4.646 11.560 78 0 00 96.220 46 200
Peak fl o w 198 80 3 162.400 22 .8 10 15 560 1 1 440 6 596 3 328 10 320 25 .380 9 1.640 110 200 52.250Day of Pe a k 27 7 2 7 I 23 3 13 4 20 23 13 IMonth/y to tal(me lon cu rn ) 153.20 90 56 20 0 5 15.6 1 8 .49 7 15 4 6 1 4 35 11.72 5 2 80 93.99 74 28
R.i no tt (nun ) 25 5 15 1 33 26 14 12 8 7 20 88 156 124% tate mvm 29 7 13 1 62 8 66 35 4 1 73 140 184 2 15 117
Stat ist ic s of m ont h ly dat a for prev ious record (Mar 1956 t o Dec 19 83 1
Mean Avg 28 5 10 25.930 19 400 12 600 9 22 1 5 6 75 4 644 61: 7163 9 16 60 0 2 1.900 30 80 0flo w s Low 5 438 8 45 1 6 3 76 4 340 32 5798 1 98 9
11917563 69 6
84081 991 56 157 5 9 12 60
lyear)High(yeet1
196342 750
196 1
1965• 7 220
/ 95 7
196 249 630
198 1
19 7428 BOO
196 6
19
29193813301975
015 857819 019 757819 17 15408191972
35 83 019 74
19
59 83 01960
: 9927787
44 00 0
0 1948 3
88 4401965
Runoff Avg 127 105 86 54 4 1 24 2 1 78 4 1 74 94 137Low 24 28 28 19 12 9 5 3 7 7 23 56Hig h 19 1 190 22 1 124 13 1 68 88 76 155 26 7 190 30 5
Rental Avg 14 1 103 103 73 80 72 8 1 96 114 12 1 129 155l ow 30 8 18 7 25 9 19 3 1 13 13 48 5 1High 24 8 196 22 2 163 175 160 174 157 254 300 23 9 32 1
Sum ma ry stat isti cs Fact ors affect ing fl o w reg im e1984
For 1984 For record As % o t • Flow infl uenced by groundw ater abstrac tionpreceding 1984 Pre- 1984 and/ or recherge.
Mean fl o w On ' s - 11 16 940 15 8 70 10 7 • Abst raction for public w ater supplies.Low est veer% meanno w t year% mean
9 69 8 196422 600 1960
• Flow reduced by industrial and/ oragricultural abstractions.
l ow est monthly maan . 1 62 3 Aug 0 .696 Aug 1976 • Augmentation from effl uent returns.

74 H Y D R O L O G I C A L D A T A : 1 9 8 4
047001 Tam ar at Gunnislake
St at ist i cs of m on t h ly dat a fo r pre v iou s rec oi d (Jul 1958 to Dec 1963— incom plete or rnissing month s total 3 .4 years)
St at io n des cr i pt io nVeloc ity -area st at ion Because of the presence o/ large bo ulders. low f low s are measured at a fo rd abo ut 1.6 km up st ream
1984Measuri ng autho rit y SW W A Grid ref erence: SX 4 2 6 72 5First year 1956 Level st n (m 00 ) 8 2 1
Da i ly m ean gauged d isc ha rges (cubic met res ow second)
DAY JAN 11 13 MAR APR MAY JUN Ju L23 080 75 720 13 820 18 3 10 3 983 3 16 1 1 346
AuG1 167
Catchment
SEP2 16
area (sq krn) 9 16 .9Ma x alt (in OD). 586
OCT NOV DEC12 250 30 700 112 300
2 63 650 62 990 13 080 13 700 3 892 3 139 1 30 3 1 84 6 173 9 7 14 5 7 2 70 10 1 7003 60 6 70 86 720 1I 950 12 630 4 622 3 957 1 26 8 2 29 4 199 10 950 59 700 82 8804 4 1 2 70 60 06 0 10 760 12 520 4 4 16 3 695 1 2 19 3 795 386 10 120 38 790 6 1 9 705 4 1 0 80 70 360 10 050 11 540 4 113 2 992 1 16 7 111 4 76 7 75 1 3 1 110 57 420
6 38 2E0 99 530 9 50 7 10 650 3 836 2 77 1 1 126 6 76 36 5 6 429 25 8 70 43 0507 4 1 230 82 580 9 04 7 9 9 15 3 6 11 2 6 15 1 10 3 48 7 25 1 5 622 22 780 36 0 70a 30 .820 54 250 8 523 9 23 2 3 40 1 2.53 7 1 0 76 36 4 209 5 646 42 4 10 30 7709 26 320 40 160 8 103 E03 1 3 3 15 2 38 7 1 2 14 30 3 30 7 7 958 38 140 26 960
10 25 730 33 00 0 7 938 8 464 3 24 7 2 26 3 354 253 483 10 660 33 760 23 260
11 33 180 28 4 10 8 06 0 8.200 3 098 174 I 536 250 43 7 8 536 3 1 980 20 86 012 56 0 80 24 5 10 11 140 7 942 2 9 77 13 1 2 288 224 380 7 24 1 105 200 19 10013 115 900 2 1 2 70 9 270 7 399 2 889 127 2 185 197 340 6 6 )4 70 100 19 43014 7 1 06 0 18 8 10 8 09 9 7 153 2 863 122 2 05 3 178 9 74 5 9 75 10 3 100 30 60015 64 940 17 0 10 7 58 1 7 0 23 3 05 5 125 174 148 06 3 5 480 6 1 020 24 130
16 16 1 600 15 760 7 18 1 6 630 3 53 6 04 2 68 9 100 5 73 5 124 49 80 3 76 59 017 91 2 10 14 530 6 786 6 18 7 3 8 77 956 44 8 06 5 390 5 3 10 38 130 56 92018 6 1 940 13 350 6 524 5 992 3 5 77 834 38 1 03 1 384 22 4 70 32 800 49 16019 53 390 12 8 70 6 34 1 5 804 3 0 7 1 769 325 982 323 24 790 27 260 70 13020 38 750 25 100 6 145 5 58 6 2 93 1 735 266 0 923 720 26 040 35 49 0 48 590
2 1 38 170 40 200 6 0 58 5 4 58 2 8 16 66 9 22 2 1 148 5 952 24 940 78 420 3 7 7 1022 48 050 49 730 5 96 8 5 2 76 9 05 5 6 13 186 2 53 6 4 082 79 5 70 170 400 5 1 8 1023 90 2 70 30 9 70 46 690 5 0 15 7 8 11 66 5 140 2 3 13 3 95 1 55 3 70 137 400 54 68024 68 300 25 160 33 450 4 784 4 40 6 64 5 22 5 8 19 3 110 84 110 96 90 0 68 06025 78 0 60 22 05 0 25 620 4 609 3 7 18 580 23 7 552 2 560 62 .990 72 650 5 1 99 0
26 14 1 600 19 780 20 660 4 465 3 89 2 5 19 164 758 5 159 4 1 9 70 5 1 430 55 5002 7 16 1 300 17 7 10 2 1 520 4 402 3 830 488 080 696 6 32 6 32 800 45 2 10 40 46028 78 7 10 16 030 16 950 4 250 3 300 42 1 024 32 5 24 4 10 28 640 46 170 33 22029 64 740 14 760 14 640 4 132 3 0 70 384 0 988 22 5 14 220 24 630 45 680 3 7 24030 73 360 13 650 4 0 59 2 893 3 73 1 00 7 24 8 14 290 49 0 10 53 05 0 42 4303 1 58 520 16 110 2 862 I 083 2 72 38 06 0 33 99 0
Average 65 880 3 7 700 11 940 7 6 74 3 80 5 2 182 1 35 1 525 3 75 7 21 .800 57 660 48 350Low esi 23 080 12 870 5.96 8 4 05 9 2 8 16 1 3 73 0 988 0 923 1 173 5 124 22 780 19 100High est 16 1 600 99 530 46 690 18 3 10 9 0 55 3 95 7 2 288 3 795 24 4 10 79 570 170 400 112 300
Peak flow J. 26 3 800 129 000 104 700 24 180 19 860 4 274 2 48 2 5 125 3 1 260 8 7 4 10 10 7 700 137 300Day Of peek 1 7 7 24 22 4 12 4 29 23 23 2Mont ,* to tal(minion cu ml 176 40 94 4 7 34 6 7 19 89 10 19 5 6 1 3 62 4 09 9 74 6 1 06 149 50 129 50
Runo ff (mm) 192 103 38 22 11 6 4 4181
6 7 163 14 1Rs nfaa Imml 24 7 95 69 7 64 19 50 79 15 152 22 1 138
Mean Avg 46 180 38 200 27 490 15 730 10 990 6 66 5 5 377 7 988 13 080 2 1 390 34 4 70 45 720flow s Low 8 476 9 16 1 11 250 6 420 3.488 1 99 5 1 18 1 0 75 7 1 118 1 540 4 2 13 18 350
(year( 196 4 1965 196 1 19 74 1976 1976 1976 1976 1959 1970 1978 1963Hvgh 89 4 10 84 .270 65 520 3 1 50 0 31 370 20 630 2 1 900 42 100 59 840 85 080 78 760 9 1 690(yeerI 1974 1974 198 1 1960 1983 1972 1965 1958 1974 198 1 1959 1959
Runoff Avg 135 102 80 44 31 19 16 23 37 62 9 7 134Low 25 24 33 18 10 6 3 2 3 5 12 54High 26 1 222 19 1 89 95 58 64 123 169 190 22 3 268
Rainfall Avg 143 100 99 6 7 75 7 1 83 9 1 108 119 135 145Low 23 3 14 a 25 11 13 18 10 12 58 4 1High 30 1 206 2 19 15 1 149 167 160 179 25 1 25 8 2 74 26 6
Sum ma ry s tat i st ic s
Fp 1984 Foe recordcceced ing 1984
1984As % of
Pr e- 1984
Fact ors aff ec t ing f lo w reg im e
• Reservo ir (s) in cat chment• Flow inf luenced by groundw ater abst ract ion
Mean flo w (m7s 22 100 22 7 10 9 7 and / or rec hargeLow est yearly mean 12 520 196 4 • A bst ract ion for public w ater suppl ies .Hig hest yearly M e a n 34 1390 1974 • Flow red uced by Indust ria l and / orLow es) nych tN y mean 1 35 1 Jul 0 75 7 Aug 1976 agricul tural abst ract io nsHighest mo nthly mean 65 880 Jan 9 1 690 Dec 1959 • A ugmen tat ion f rom surface w at or and / orLow est deity mean 0 923 20 Aug 0 580 23 Aug 1976 gro undw ater .
' Hrighest dedy mean 170 400 22 Nov 482 300 1 7 Dec 19 79 • A ugmentation from ef f luent ret urn s

R I V E R F L O W D A T A 75
0 5000 1 Ta w a t Um b e r le ig h
St at is t i cs of mon t h ly da ta for prev io us re cot d (Oct 1958 to Dec 198 31
St at io n de scr ip t io nVeloci ty .area stat ion
1984Measuring authority . SWW A Grid reference. SS 60 823 7Fast year 1958 Level stn. (m OD) 14 .14
Da ily m ea n gaug ed d ischa rg es (cubic metres per sew el)
JAN FEB M AR APR MAY Ayr AA AUG SEP
Catchment area (sq km) . 826 .2Max alt (in OD): 604
OCT 110 14 GEC22 760 53 96 0 12 060 17 3 70 2 27 1 1.899 0 750 0 640 0 653 10 350 23 930 84 .23078 830 48 860 11 240 11 050 2.203 1.7 15 0 703 0 844 0 .580 8 775 35.0 30 69 89079 040 72 400 9 794 9 734 2.780 2 150 0 66 8 1 0 53 0 62 5 8 5 70 33 7 10 55 0 1053 380 62 630 8 8 78 10 830 2 489 2 104 0 .644 2 5 19 0 984 8 22 7 2 7.9 70 4 1 43042 740 6 1.4 70 8 12 1 9 26 3 2 3 79 2 3 75 0 623 1 420 0 9 3 1 6 606 23 100 35 940
35 44 0 113 60 0 7.528 7.984 2 175 2 23 6 0 .595 0 923 0 80 1 5 324 19 550 29 BOO33 740 9 1 3 70 6 .968 7 152 2 006 1 83 9 0 5 70 0 .80 7 0 .677 4 9 52 18 0 20 24 09027 2 70 5 7.250 6 43 7 6 552 1.694 1 68 7 0 568 0 733 0 6 73 5 127 4 7 9 10 20 92023 380 40 3 10 5 950 6 170 1 81 7 1 55 1 0 .558 0 728 0 88 1 8 3 74 44 280 19. 19022 2 10 30 990 5 .692 5.822 1 78 1 1.425 0 59 5 0 69 7 1040 10 9 20 36 680 16 230
11 25 40 0 25 160 5 6 12 5 69 6 1 7 11 1 358 1 082 0 64 7 1 0 25 9 189 30 520 14.58012 53 450 20 500 5 550 5 53 5 1 6 19 1 3 16 I 499 0 628 1 0 8 7 8 4 18 8 1.5 10 13 3 7013 125 800 17 030 5 085 4 844 1 55 7 1 3 18 1 75 1 0 623 I 0 52 7 60 8 53 4 70 15 33014 82 990 14 530 4 80 8 4 64 5 1 53 6 1 30 1 1.569 0 6 15 2 68 1 6 .692 57 3 70 26 23015 60 960 12 790 • 54 2 4.56 6 1 63 7 1.280 1.270 0 .59 1 1 778 5 9 17 4 7 990 22 5 10
16 128 400 11 560 4 350 4 14 7 I 886 1 206 1 0 15 0 558 I 38 6 5 35 1 55 700 6 1 52017 8 1 280 10 500 4 130 3 963 2 752 1.16 1 0 89 7 0 54 2 1 340 5 24 6 3 7 120 50 9 7018 56 06 0 9 408 3 95 7 3 80 8 2 2 11 1 085 0 84 9 0 5 17 1 170 13 0 20 30 130 42 24019 44 340 9 393 . 3 832 3 632 1 764 1 02 1 0 799 0 4 77 1 044 16 170 25 300 52 19020 31 240 19 0 30 3 680 3 44 1 I 84 8 0 98 8 0 715 0 453 5 147 17 280 42 8 10 44 740
2 1 30 710 39 140 3 566 3 333 1 86 3 0 92 5 0 69 1 0 570 8 035 19 770 74 190 35 72022 46 880 62 .550 3 543 3 222 5 4 70 0 9 77 0 6 71 1 590 5 895 73 930 133 10 0 40 0 5023 78 250 4 1 5 10 12 320 3 039 5 102 1 0 73 0 635 1 0 63 5 22 7 59 750 120 500 39 33024 77 440 3 1 900 14 770 2 8 73 2 793 0 95 7 0 60 8 0 84 5 6 2 73 58 570 105 800 52 60025 83 250 25 4 10 10 58 0 2 745 2 183 0 896 0 66 7 0 828 6 06 1 57 340 76 500 48 350
26 136 100 2 1 140 9 2 11 2 605 2 177 0 86 1 0 722 0 72 1 8 665 46 990 53 40 0 44 43027 127 100 17 500 10 460 2 49 1 2 484 0 82 7 0 636 0 659 6 77 1 36 650 4 2 5 70 34 77028 70 750 15 230 8 530 2 4 17 2 184 0 789 0 5 79 0 6 15 10 39 0 30 0 30 38 520 28 72029 58 550 13 4 10 8 025 2 353 1 9 12 0 77 7 0 .529 0 600 12 06 0 23 960 34 840 30 85030 55 960 7 04 6 7 28 6 1 739 0 772 0 53 1 0 6 59 12 730 32 550 30 100 33 7203 1 50 4 70 14 660 1 682 0 600 0 70 7 28 110 29 830
Average 62 100 36 4 70 7 44 9 5 456 2 255 1 32 9 0 793 0 802 3 58 9 20 640 49.390 3 7 380l ow est 22 2 10 9 393 3 543 2 286 1.536 0 772 0 529 0 4 53 0 580 4 952 18 020 13 3 70Hig hest 136 100 113 60 0 14 770 17 3 70 5 4 70 2 375 1 / 5 1 2 5 19 12 730 73 930 133 100 84 23 0
Peak flow 187 . 100 134 300 3 7 110 3 1 830 9 59 5 3 35 2 2 56 7 3 248 16 2 10 84 96 0 15 1 90 0 10 1 700Oay of peak 13 7 24 I 13 6 12 4 29 22 23Mceuhfy to ts(mason cu rnl 166 30 9 1 38 19 95 14 14 6 04 3 4 5 2 13 2. 15 9 30 55 .28 128 00 100 10
Runoff ern e 20 1 111 24 17 7 4 3 3 6 7 155 12 1Rauff s, (nun) 24 2 103 54 8 6 1 2 1 4 7 68 152 14 2 20 8 118
Mean Avg 35 320 28 960 2 1 230 13 590 10 23 0 5 337 4 80 8 5 333 7 8 70 19 000 28 280 3 7 24 0Rows Low 6 65 7 3 244 7 9 18 3 889 2 0 73 1 434 0 796 0 4 23 0 86 1 1 043 3 653 13 2 10
lyearl 196 3 1959 196 2 1974 19 76 19 76 1976 1976 1959 1978 1978 1963High 50 890 54 760 52 140 32 800 37 000 16 630 23 390 14 4 4 0 4 7 670 77 360 58 500 73 6 70lyearl 196 5 1970 198 1 1966 1983 1972 1968 196 5 1974 1960 1963 1965
Runoff Avg 115 85 69 43 33 17 16 17 25 62 88 12 1Low 21 10 26 11 7 5 3 1 3 3 11 43H ig h 165 160 169 103 120 52 76 4 7 150 25 1 184 239
Rainfaff Av g 129 88 9 1 70 74 66 71 85 94 113 12 7 140Low 28 5 18 8 28 10 23 24 14 14 56 4 1High 2 16 173 183 145 146 164 152 140 24 7 278 239 2 7 1

76 H Y D R O L O G I C A L D A T A : 1 9 8 4
0 52 00 5 To n e a t Bis ho p s Hu l l
Stat ion desc ript io n, V olo cit y -a rea st at io n . im p ro v ed by Crum p w eir of bre ad t h 12 .2 m m 19 6 8
1984M easuring au t ho ri t y W W A Grid re f erence ST 2 0 6 2 50Fir s t year 19 6 1 Lev el st n (m OD) 16 .20
Dai ly mean gauged d ischarges (cubic met r es or second)
DAY JAN FEB MAA APR MAY JLN JUL AUG
Ca t chm ent area (sq k m). 20 2 .0Max alt . (m OD) 40 9
SEP OCT NOV DEC1 3 93 1 12 0 10 3 0 79 4 929 24 3 1 193 0 669 0 54 9 0 6 15 0 738 I 55 7 10 200
2 15 360 9 8 14 2 994 3 128 293 I 35 1 0 655 0 724 0 60 9 0 726 3 126 9 70 1
3 9 337 8 685 2 7 14 2 760 3 79 2 120 0 64 7 1 3 70 0 6 75 0 86 0 2 330 8 308
4 6 89 1 8 156 2 59 6 3 006 36 1 1 378 0 64 2 1 3 12 0 829 0 8 15 2 119 6 00 1
5 6 130 9 925 2 450 2 66 5 32 4 1 33 6 0 6 15 0 76 7 0 720 0 .69 3 89 5 5 679
6 5 738 39 520 7 3 77 1 4 79 305 1 27 2 0 6 10 0 68 8 0 650 0 649 I 858 5 157
7 5 54 6 2 1 530 2 392 2 322 26 0 1 150 0 6134 0 68 2 0 625 0 64 9 2 232 4 599
8 5 16 5 12 230 2 334 2 240 238 I 08 4 0 6 16 0 6 78 0 6 75 0 68 3 7 404 4 164
9 4 499 8 886 2 2 74 2 179 226 1 0 15 0 707 0 6 15 0 735 0 76 2 6 7 10 3 850
I D 4 08 1 7 506 2 26 7 2 100 239 1 124 0 759 0 643 0 657 0 12 4 4 71 3 54 5
11 4 135 6 4 7 1 2 2 13 2 0 2 7 230 0 993 0 663 0 64 7 0 637 0 79 7 3 620 3 2 70
12 8 20 2 5 6 75 2 185 945 199 0 9 77 0 81 1 0 64 6 0 667 0 753 5 4 78 3 135
13 20 350 5 084 2 083 9 23 167 0 973 0 983 0 637 0 712 0 7 18 4 . 14 1 3 22 7
14 10 54 0 4 837 2 0 13 904 17 1 0 960 0 765 0 60 2 0 985 0 68 5 6 762 3 356
15 9 0 2 7 4 565 1 99 5 83 6 244 0 90 3 0 711 0 6 16 0 649 0 69 6 4 4 10 3 086
16 40 900 4 37 1 1 9 18 749 250 0 88 1 0 6 77 0 6 15 0 634 0 6 74 3 89 3 5 03 1
17 14 340 4 0 73 1 895 7 17 256 0 86 1 0 639 0 6 5 1 0 688 0 743 3 290 4 654
18 10 700 3 93 3 1 855 70 8 176 0 828 0 594 0 .6 17 0 64 1 1 4 75 2 98 1 4 09 1
19 9 32 7 3 94 1 1 84 1 682 142 0 8 10 0 53 7 0 59 6 0 598 I 59 8 2 6 14 4 634
20 7 40 6 7 404 I 839 64 8 155 0 806 0 5 74 0 .560 1 4 19 1 3 76 4 169 4 746
2 1 7 33 6 7 825 1 7 / 9 624 156 0 760 0 553 0 695 1 26 2 1 392 8 86 8 4 20 5
22 10 650 8 928 1 73 2 5 77 2 00 3 0 825 0 570 0 7 17 0 784 2 50 2 17 350 4 48 3
23 17 700 5 67 1 7 950 50 7 1 42 1 0 762 0 565 0 .666 0 82 1 1 70 1 12 220 4 72 1
24 12 680 4 89 1 5 05 6 45 1 1 20 5 0 748 0 57 1 0 89 8 0 .754 I 94 3 10 OCO 4 719
25 24 450 4 40 1 6 62 1 4 19 1 196 0 7 11 0 73 1 0 .685 0 706 2 0 56 7 4 12 4.83 7
26 49 05 0 092 3 7 14 388 1 98 8 0 70 1 0 624 0 658 1 080 73 3 5 798 4 938
2 7 6 7 350 3 740 3 119 30 7 I 46 6 0 69 8 0 553 0 66 1 0 782 638 5 2 11 4 33 9
28 19 150 3 468 2 694 299 1.359 0 680 0 532 0 6 18 0 84 2 60 1 5 0 70 3 927
29 13 600 3 2 79 2 39 7 292 1 224 0 696 0 52 7 0 63 3 0 .896 50 3 5.252 4 3 11
30 16 700 2 26 9 286 1 15 1 0 683 0 566 0 63 1 0 996 780 5 9 76 4 6 30
3 1 11 130 4 85 1 1 14 1 0 575 0 624 63 0 4 176
Average 14 560 8 100 1 822 2 0 33 1 29 6 0 9 75 0 64 1 0 694 0 778 180 5 2 74 4 830
Low est 3 93 1 3 279 I 732 1 286 1 14 1 0 680 0 52 7 0 .549 0 59 8 0 .64 9 1 557 3 08 6
Highest 6 7 350 39 520 7 950 0 929 2 003 2 120 0 98 3 1 3 70 1 4 19 2 50 2 17 350 10 200
Peek (l ow 11 1 600 48 220 20 350 7 66 1 2 706 2 688 1.249 2 652 2 06 7 3 20 9 2 1 320 14 .900
Day of peak 2 7 6 23 1 21 3 12 3 2 1 22 22 2
Monthly to tallmi l inn cu 39 00 20 30 7.56 5 19 3.47 2 53 1 72 86 2 02 3 16 13 6 7 12.94
Runoff Imm l 193 100 3 7 26 17 13 8 9 10 16 68 eaRainfall invh ) 250 98 74 6 63 3 1 2 7 56 105 10 5 192 83
St at ist ics of mon thly dat a for prev iou s recor d (Feb 19431 to Dec 1983)
Mean Avg 5 79 1 6 175 60 1 2 8 78 2 2 14 I 464 1 24 1 0 .969 1.26 1 2 090 3 29 2 5 134
/ lo ws Low 1 246 1 746 I 552 1 177 0 735 0 455 0 326 0 266 0 50 1 0 .580 0 651 1 82 1
Near( 19 76 1965 196 2 1976 1976 1976 19 76 1976 196 4 1978 1978 1975
laug h 10 580 14 000 9 259 6 6 16 6 582 2 770 5 828 1 686 4 892 9 8 72 7 6 11 11.280
lyeerl 197 1 19 78 196 1 1966 1983 1972 196 8 1965 19 74 1976 1982 196 5
Runoff Avg 77 74 6 1 3 7 29 19 16 13 16 20 42 sel ow 17 2 1 2 1 15 10 6 4 4 6 8 24
R ob 140 168 123 85 8 7 36 75 22 63 131 98 150
Rainfall Avg 10 9 83 85 62 70 60 59 69 85 8 7 • 96 113
Low 25 6 5 8 25 8 16 19 8 8 4 1 40
Nigh 20 2 170 170 150 137 147 144 122 20 2 249 185 20 5
Sum m ary st at ist ics Fact ors af fect ing fl ow reg im e1984
For 1984 For record A s % of • Augmentation from surf ac e w at er and / o rpfaceding 1984 pro- 1984 g ro undw at er .

R I V E R F L O W D A T A 77
053006 Fr ome(Br istol ) at Frenchay
Stat ist ics of mco th ly dat a for grew :in s recot d (Oct 1981 to Dec 198 3)
St al l :II I descript ionTrapezoidal crit ical depth flume Range 0 028 / 56 6 cu m/ s
1984M easun ng atnho rny WW A Grid ref erence ST 63 7772Firs t year 19 6 1 Level stn (m OD) 19 .96
Dai ly m ean gauged discha rges (cubic main s per second)DAY JAN FEB MAR APR MAY JUN ..11A AUG SEP
Catclun ent area (so km ) 148 .9Ma x att . (m OD). 193
OCT NOV1 1 64 2 6 08 8 1 0 33 1 157 0 340 0 92 1 196 • 0 169 0 174 0 440 110 2 2 782 17 060 4 138 1 0 11 0 .990 0 43 7 0 6 79 169 3 .353 0 148 0 4 10 6 .780 1 9633 18. 130 2 930 0 .840 0 923 0 329 0 638 19 1 2 .844 0 .65 8 0 4 70 5 330 2 9584 7 063 3 .935 0 .88 8 0 .860 0 3 13 0 46 1 197 4 309 0 3 10 0 3 50 2.690 2 5 185 3 93 1 5 197 0 75 1 0 792 0 30 3 1 100 198 I 288 0 20 8 0 .290 1.830 2.26 5
6 2.898 7 04 7 0 .830 0 .76 2 0 29 5 0 746 193 0 605 0 177 0 2 70 2 260 2 1237 2 33 5 5 175 0 .74 7 0 735 0 26 7 0 .58 7 177 0 53 7 0 162 0 2130 2 240 1 69 28 1.8 17 3 26 1 0 .709 0 6 2 1 0 266 0 458 164 0 40 4 0 18 8 0 460 4 940 1 4 7 19 1 54 3 2 2 13 0 6 78 0 6 73 0 2 76 0 45 1 159 0 344 0 38 5 0 .450 6 6/ 9 1 3 7310 494 1 548 0 .706 0 66 1 0 324 0 32 1 197 0 303 0 .206 0 3 70 4 178 1.256' -
11 2 90 1 1 65 2 0 769 0 .683 0 29 4 0 306 34 1 0 272 0 . 183 0 .330 2.50 5 1 13012 • 092 1.470 0 832 0 6 14 0 25 6 0 288 48 8 0 256 0 183 0 30 0 4 43 5 1.10 713 5 4 14 1 325 0 74 1 0 5 78 0 249 0 .30 9 28 8 0 25 1 0 4 76 0 280 4 5 13 1 96 214 3 66 2 1 2 16 0 .701 0 56 5 0 260 0 40 1 3 15 0 244 0 64 9 0 260 2 792 3 09915 3 031 1 143 0 6 74 0 540 45 1 0 308 2 13 0 238 0 253 0 250 2 05 6 2 600
16 15.660 1 04 9 0 650 0 5 17
.0 ,
O BI O 0 292 185 0 232 0 2 16 0 250 1 632 • 84 617 7 959 0 .996 0 6 15 0 495 0 734 0 29 1 163 0 228 1 29 6 0 620 1 369 3 2 7318 3.69 7 0 934 0 582 0 4 82 0 .360 0 2 77 176 0 205 0 48 1 2 350 1 20 1 2 69 119 2 .599 0 90 2 0 5 74 0 4 50 0 30 2 0 2 70 166 0 104 I 005 3.020 1 05 1 5 28 320 1 93 3 1 69 6 0 .50 8 0 438 0 430 0 26 7 16 1 0 178 6 8 7 1 1.560 2 .789 a 809
2 1 1.79 2 3 4 72 0 56 9 0 424 0 5 11 0 25 7 18 1 0 186 2 5 14 1 480 8 0E16 2 92 122 2 253 4 764 0 56 6 0 538 4 110 0 25 1 168 0 199 1 500 7 110 14 4 70 2 493 .23 8 620 2 62 3 3 3 14 0 425 0 806 0 250 147 0 200 0 790 4 90 0 19 3 10 2 39 524 4 5 54 1 885 4 433 0 399 0 520 0 24 1 155 0 164 0 56 5 2 660 16 90 0 2 24 625 4 54 5 1 57 1 6 02 7 0 38 5 0 745 0 2 14 174 0 187 0 459 2 760 8 9 15 2 689
26 10 590 1 39 5 3 659 0 366 0 9 19 0 234 162 0 164 0 .39 2 1 840 4 420 2 96927 6 23 7 1 252 2 481 0 339 0 56 5 0 236 14 1 0 156 0 35 0 1.250 3 20 8 2 50426 a 269 1 174 1 855 0 332 0 49 8 0 225 146 0 151 0 .620 2 0 30 3 146 1 89 629 3 99 7 1 09 7 1 45 7 0 320 0 4 17 0 228 148 0 192 0 460 1 440 2 84 1 3 3 7430 4 9 75 1 30 8 0 33 7 0 365 0 2 15 173 0 26 7 0 590 1 3 70 2 33 2 5 7933 1 4 9 13 1.23 5 0 484 158 0 187 400 3 54 7
Average 5 34 9 2 53 3 1 34 7 0 580 0 558 0 413 20 0 0 59 7 0 750 1 33 1 4 866 2 695Low est 1 494 0 90 2 0 50 8 0 320 0 24 9 0 2 14 14 1 0 152 0 148 0 250 1 0 5 1 1 107hig hest 18 130 7 04 7 6 02 7 1.157 4 1 10 2 100 488 4 309 6 8 7 1 7 1 10 19 3 10 5 793
Peek fl o w 3 1 860 8 706 8 8 76 1 258 9 772 5 196 8 16 7 13 04 0 9 4 70 2 7.980 . 7 70 1Day o f peak 2 6 25 22 5 3 20 22 23 29Monthly to talIris Ihon cu m) 14 33 6 35 3 6 1 I 50 1 49 1 10 0 54 1 60 1 94 3 56 12 6 1 7 22
Runo ff Own) 96 43 24 10 10 7 4121
13 24 85 48Rainfall Imm) 130 46 42 5 79 2 7 2 1 9 115 86 130 71
Mean Avg 3 3 12 2 88 8 2 46 8 1 360 1.280 0 80 9 0 654 0 484 0 782 1 188 2 04 8 3 157fl ows Low 0 6 70 0 6 13 0 63 7 0 4 76 0 290 0 220 0 122 0 139 0 20 8 0 162 0 1 11 0 820
lyear) 1976 1965 1973 19 76 1976 1976 1976 1976 19 78 1978 1978 19 73K g,h ear)
6 1521962
6 04019 77
5 76 2198 1
3 4341966
5 0281983
2 9 73197 1
3 5 16196 8
I 19 119 7 1
5 1131974
4 69 1196 7
5 434196 3
9 80 71965
Runo ff Avg 60 4 7 44 24 23 . 12 9 14 2 1 - 36 5 7Low 12 10 11 5 4 2 3 3 4 1514Ig n 111 98 104 60 90 52 63 2 1 89 84 95 176
Rainfa ll Avg 73 54 66 50 63 54 6 7 78 65 75 8 7Low 18 3 2 1 9 19 6 12 26 2 1 5 35 25High 137 127 146 97 147 139 129 12 7 182 183 165 20 8
Sum ma ry st at ist ics
Fp 1984 Fcr recordpi eced ing 1984
1964As % of
Pre •1984
Factor s aff ec ti ng flow reg im e
• Flo w Inf luenced by gro und w ater abst ractionand / or recharge
Mean fl o w 1 766 1 698 104 • Flow reduced by industrial and/ orLow est yeasty mean 0 804 1973 agricultural abstract tonshighest yearly mean 2 158 19 74Lowest mond* / mean 0 20 0 A A 0 122 ../U1 1976 Comm entnp hest mon tNy mean 5 34 9 Jan 9 80 7 Dec 196 5 Flow s from 2 7/ 9/ 84 to 8/ 10 / 84 are derivedLow est On ly mean 0 14 1 2 7 Jul 0 0 75 10 * Leg 1976 from the back-up analogue chart recorder

78 H Y D R O L O G I C A L D A T A : 19 8 4
0 5 4 0 0 1 Se v e r n a t Be w d le yM ea suring au t ho ri t y STW A Gr id re fe re nc e SO 78 2 76 2 Ca t chme nt ervi x lireaa a(sq k(m 0 0m ) 4 ) 83 2 52 07Fi rs t year 197 1 Level st n (m OD) 17 00
Dai ly me an gauged discharges (cu bic met res per secon d)
Stat i st i cs of mo nt h ly da ta for pr ev ious record (Apr 1921 to Day 1983)
19 84
Stat ion desc ript ionVeloc ity -area stat ion The aqueduct sne (S0 776 783) recorder w as superseded in January 19 70 by the gauging section recorder Variat ionsusod to derive the na t ura l flow in clud e s to rag e chang es in Lak es V y rnw y an d Clyw edog and abst ract ions f o r pub lic w at er su p plies / ro m t he ri ver

R I V E R F L O W D A T A 79
0 5 4 0 02 A v o n a t Ev e s h a m
St at is t ic s of mo nt h ly dat a for prev iou s rec o rd (Dec 1936 to Dec 1983)
Stat ion de scri pt io nVeloci ty-area st at io n Gro und w ater cat chment ext ends in to TW A
1 9 8 4M easur in g author it y . STW A GndFast year 193 7
Da i ly m ea n gau ged d isch a rg es (mam met ivs per seccmd)
DAY JAN FEB MAR APR
reference SP 0 40 4 38Level sm (m 0 0 ) 19 .50
MA Y JUN A t AuG SEP
Cat chm ent area (so km): 22 10 .0Max alt . (rn OD): 320
OCT MICYV DEC12 0 50 50 340 15.8 70 26.8 50 6 8 73 8 9 73 • 826 4 030 3 922 5 2 10 5 6 77 16 89 0
2 28 130 53 540 16 . 180 14 9 20 6 840 9 238 • 863 • 723 3.950 4 .78 6 8 172 16 1503 69 3 70 45 830 14 260 13 150 6 7 15 I I 480 5. 276 8 0 99 4 .856 5.0 74 16 920 16 3204 53 390 45 490 13 2 70 12 3 70 6 6 18 10 230 4 .839 10 220 7 13 1 5.290 12 930 17 3805 33 380 52 270 13 3 70 11 320 6 4 77 11. 180 • 63 7 9 18 1 5 863 4 854 9 189 16 030
25.420 63 960 13 8 10 10 980 6 39 8 10 220 4 .569 6 44 8 4 60 4 4 189 10 .830 16. 1807 2 1.850 9 7.5 70 12 8 10 10 400 6 .35 1 8 983 • 54 2 8 85 1 • 158 4 243 12 890 15 250
19 640 88 6 70 12 2 10 10 0 10 6 3 12 7 73 7 4 326 7.93 3 4 .03 1 4 379 15.4 50 13 720• 9 16 820 50 820 11.66 0 9 9 36 6.26 1 6 694 4 .343 8 18 1 4 390 4 6 18 2 1 400 12 47010 14.820 33 690 11 5 70 9 9 28 6 .577 6 32 5 • 325 5.30 5 • 704 4 50 1 10 . 190 11.350
11 14.750 26 940 12.260 10 630 9 663 6 2 40 • 25 1 4 83 9 • 59 4 4.320 13. 180 10 46012 15.700 23 140 17. 140 10 .350 7 368 6 137 5. 11 1 4 577 • 29 3 4 2 77 2 1.180 9.98 113 18 220 20 930 15.750 9 5 11 6 35 1 5 99 9 5 94 3 4 5 70 4 2 7 1 4 19 1 33.640 10 25014 20 040 18 630 15 430 9 184 6 24 9 5 .840 5 499 4 074 5.684 3 92 7 2 1 040 13 40015 17 930 16 40 ) 14 080 9. 243 6 275 5 69 5 8 .96 7 4 880 5 6 72 3 964 15 230 12.860
16 20 540 15 330 12 860 8 9 53 6 690 5 257 5.695 4 82 7 4 806 4 236 11 460 24 92017 28 120 14 2 20 11.9 10 8.59 8 7 064 5 52 1 5 0 14 4.76 5 7.26 9 4 5 10 9 635 3 1 5001B 2 2.780 13 270 10 .890 8.325 6 53 8 5 711 4 76 1 4 463 8 .350 6 062 6 88 7 24.86019 18 260 12 940 10 720 8 26 5 6 25 4 5 130 4 4 17 4 .279 5 8 12 6 385 8. 156 24 6 1020 13 080 13 100 10 270 7 8 73 6 24 1 6 44 1 4 338 4.24 9 9.880 5 944 9 754 28 360
2 1 I 1 660 t 4 170 9 90 2 6 789 9 0 13 7.24 2 4.285 4 0 73 13 .380 5. 196 20 8 70 26 .48022 12 450 19 230 9 38 2 7 145 20 3 70 6 204 4.24 2 4.2 11 9 99 7 9. 109 39 0 10 23 56023 36 930 25 640 10 950 7 163 17.5 10 6 00 3 4 184 4.300 6 .54 2 11 740 10 7 30 0 24 9 7024 49 380 20 730 80 800 7 000 10 030 5 99 5 4.058 4 149 5 .554 299 16 1 200 32.48025 3 2.290 17.320 75. 130 7. 115 7 9 76 5 .933 4 034 4 14 6 5 183 9 084 98 .250 34 .590
26 56 430 16 .300 72 230 6 939 9 739 5 60 1 3 8 71 4.064 5 0 12 7 129 42.780 19 3202 7 9 7 920 17 100 56 530 7 064 9 .23 5 5 253 3 952 • 06 1 4 4 7 1 5.73 2 2 7.930 24 .50 028 94 .660 17 080 35 450 8 968 11 570 5 06 1 3 93 7 • 104 4 .4 9 4 5 40 7 22 730 18 53029 72 520 16 3 70 25 830 6 .777 9 54 6 • 99 1 3 808 4 06 0 4 623 5 25 1 18.9 90 16 42030 53 520 2 1 740 6 .773 7.9 14 4 96 9 3.896 • 038 5 118 5 62 1 16.730 19.7903 1 58 260 19 490 7 0 58 4 2 73 • 0 16 6 6 12 22 940
A yea age 34 0 70 3 1 760 2 1 4 10 9 347 8 196 6 876 4 6 12 5 177 5 754 5 6 17 28 0 50 19 890Low est I I 660 12 .940 9 382 6 773 6 24 1 4 969 3.808 • 0 16 3 922 3 92 7 5 677 9 98 1Highest 9 7 920 9 7 5 70 75 130 16 850 20 3 70 11 480 6 96 7 10 22 0 13 380 11 740 16 1 200 34 590
Peak flow 10 2 400 103 000 83 620 18 50 0 25 84 0 13 390 8. 17 1 13 5 70 14 830 13 690 I 77 800 3 7 640Day of pen 2 7 7 24 I 22 3 12 5 2 1 23 24 24Month ly to tal(malig n cu in) 9 1 2 7 19 58 57 35 24 23 2 1 95 17 82 12 35 13 8 7 14 9 1 15 05 72 70 53 2 7
k n o ll (mem 4 1 36 26 11 10 6 6 7 7 33 24Rag fall (nun) 83 4 7 4 7 6 6 1 36 19 53 79 58 112 45
Mean Avg 2 7.630 27 770 22 660 14 390 11.530 8 127 8 4 71 6 62 8 6 77 1 9 1 76 17 110 22 290flo ws Low 5 140 4 869 2 26 1 3 240 2 220 1.935 2 .253 2 038 1 9 70 1 484 2 6 77 3 548
(yew ) 1950 194 4 1944 1938 1944 1944 19 76 1943 1959 1959 194 3 194 3Ro l 73 520 77 930 75 60 0 35 160 3 7.680 27 380 42 230 16. 100 24 2 10 45 4 10 55 9 10 65 160NW ) 1939 1977 194 7 1986 1983 1977 1968 196 9 1960 196 0 1960 1985
Runoff . Avg 33 3 1 2 7 17 10 8 a 8 11 20 17Low 6 6 3 3 2 3 2 2 3 3 4Nigh 89 85 92 4 1 46 32 5 1 20 28 55 68 79
Rainfall Avg 60 43 48 43 56 52 5 7 7 1 56 5 7 64 601193 7- Low 13 3 5 5 15 10 a 5 3 a a 151983 1 Haan 127 122 140 94 130 115 122 130 127 150 163 12 1
Sum m ary st at ist ic s
Foe 1984 For teccvdPlaceOnag 1984
1984As % of
pte- 1984
Fact or s af f ec t ing fl o w reg im e
• Flow influenced by groundw ater abst ractionand/ or recharge
Mean fl ow Irnl s- ' ) 15 00 3 15 000 100 • Abstraction for public water supplies .l ow est yearly mean 6 .89 5 1944 • Flow reduced by indust rial and / orHaghest yearly mean 25 030 1960 agr icult ura l abst rac t ionsl ow est monthly mean 4 6 12 Jul I 935 J un 1944 • Augmentat ion from effl uent returns.
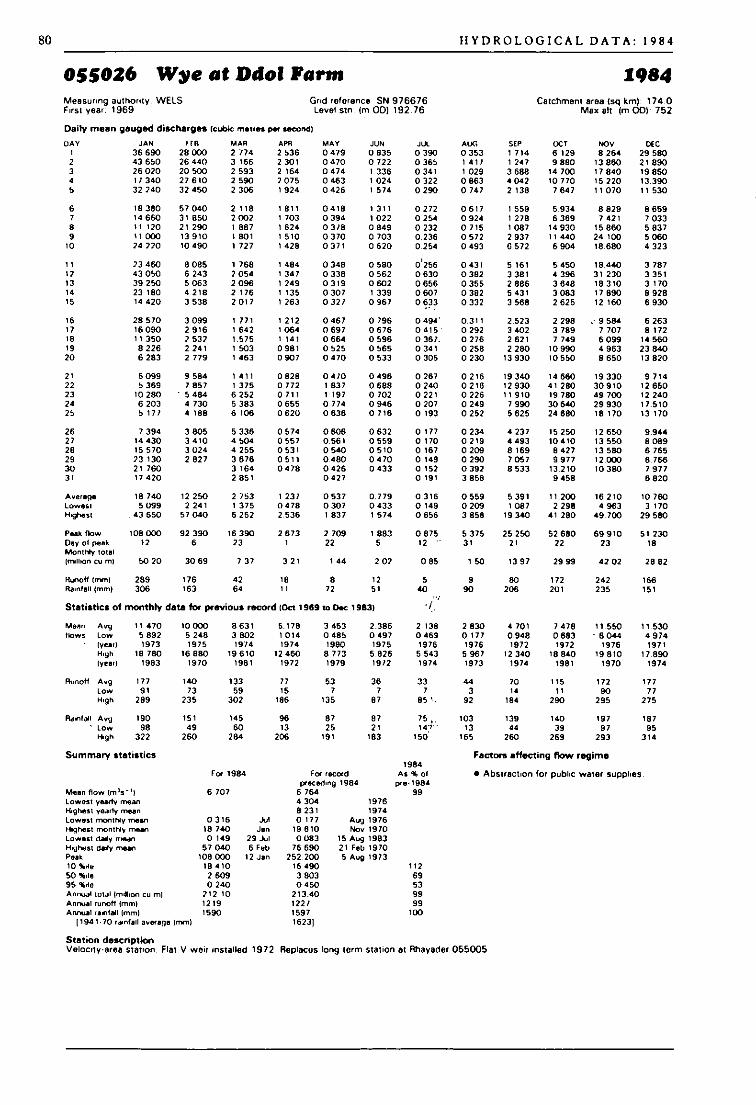
80 H Y D R O L O G I C A L D A T A : 19 8 4
055026 W y e a t Ddo l Farm
St at ion descript ionVelocit y-area station. Flat V w eir inst alled 1972 Rep laces long term stat ion at Rhayacler 05500 5
1984Measuring aut bo rit y . W ELS Gr id ref erence SN 9 76 6 76Firs t year . 1969 Level st n (rn OD) 192 .76
Dai ly m ean gauged di scharges (cubic mo res per second)
Catchment area (se km) 174 .0Max eh (m OD) 752

R I V E R F L O W D AT A 81
056001 Usk at Chain Bridge 1984Measuring authorrty . W ELSFest year 195 7
Grid reference. SO 34 505 6 Catch ment area (so km) : 9 11.7l evel stn . (m 00 ) 22 .63 Max alt . (m OD): 886
Dai ly m ean gauged discharge s (cubic ow n s pe second)
Stat ion descript ionVelocit y -area station. Intake to canal upst ream of gauge. Low flow s measured accurately at alternat ive station 0560 10 Trost rey w eir

.82 H Y D R O L O G IC A L D A T A : 1984
062 00 1 Ta f t a t Gl an Te if f
St at is t ic s of mo nt h ly da ta f or p rev io us reco rd 1.1u11959 to Ow 198 3— inewno kna a missing months tot al 0 .3 year s)
St at ion desc ri pt io nVelocit y -area station-
1984

R I V E R F L O W D AT A 83
065001 Glaslyn at Beddgeler t 1984M easun ng autho ri ty - W EISFir st y ea r . 19 6 1
St at io n de sc ri p t io nV e loon y -area st at io n
Gnd re f erenc e SH 5 9 2 4 78 Gat a r ne nt area (SCI In n) : 6 8 .6Lev el st n (rn OD) 3 2 9 5 Ma x al l . (m 0 0 ) - 10 9 0
Dai ly m ean ga u g ed d isc ha rg e s (cub e met res per seco nd/
S t at i st i c s of m o nt h ly da t a f o r p re v io u s re co rd M ee 19 6 1 to Dec 19 8 3- i nco mplet e of m issing mon t hs to ta l 1.7 yearal
DAY1
JAN8.60 7
FEB22 .9 10
M AR1.78 2
APR0 8 78
MA Y0 4 75
A IN0 48 2
A A0 646
ALIO0 .906 56"1.290
13CW
80
NOV4 .924
DEC7.490
2 16 630 11 6 10 2 22 7 0 798 0 455 0 43 9 0 .55 1 3 789 1.128 96 .8867 4 9 70 6 .1 133 8 540 10 770 2 . 117 0 785 0 455 1.112 0 52 2 4.244 10 5 70 10 660 5 996 8 .7744 6 880 17 900 4 622 0 783 0 444 0 85 3 0 50 5 3 0 97 9 .600 6 .7 13 7.533 9.29 75 17.390 11 380 3 43 1 0 76 7 0 4 19 0 79 1 0 493 2 .0 19 4 0 52 4 .7 16 • 858 16. 170
6 8 8 16 10 110 2 648 0 743 0 390 0 65 7 0 48 2 1.686 2.6 18 4 196 4 06 9 7 04 27 7.84 9 6.92 3 2 24 5 0 702 0 340 0 .53 7 0 44 3 2 0 53 2.0 55 5.9 12 • 0 13 8 . 104a 4.869 5 .5 15 1 89 7 0 65 1 0 322 0 44 2 0 392 1.500 1.683 10 760 5 089 4.7489 6 758 4 456 1.65 4 0 60 5 0 3 17 0 374 0 3 76 1.160 2 7 18 6 996 10 120 3.860
10 32.460 3 83 2 1.466 0 6 13 0 3 15 0 33 1 0 429 0 .90 8 3 .924 • 6 15 7.085 3 488
1 1 40 540 3 06 7 2 05 2 0 65 7 0 29 8 0 298 0 452 0 78 1 3 .96 1 3 707 7 238 3.50 312 2 1.20 3 2 3 16 2 173 0 659 0 284 0 329 0 .50 8 0 .70 8 3 89 6 3 .385 17.3 70 3 17013 13 440 1 96 1 2 0 74 0 650 0 2 70 3 688 0 582 0 .64 3 11.760 • 143 7.8 l • 2 7 111,1 8 246 1,793 1.889 0 695 0 259 5 126 1 00 3 0 58 8 13. 110 3 .622 7 16 1 5 4 76I s 5 155 1 635 1 695 0 829 0 26 5 2 60 2 1 0 15 0 554 5 60 1 2 960 5 590 8.63 6

84 H Y D R O L O G IC A L D A T A : 1984
067015 De e a t Manley Na l l
S t a t i s t i c s of mo nt hly dat a tor prev ious reco rd (Oct 1937 to Doc 1983)
1984
St at io n descri pt ionAsymmetrical com pound Crurnp weir. superseding Erbistock, 06700 2. 1 km dow nstream The two records Rave been combined (and correctedfor area) to give an extended data series for this stat ion

R I V E R F L O W D A T A 85
0 6 8 0 0 1 W e a v e r a t A s hb r o o kMeasuring aut hority : NWW A Gil d reference : SJ 6 70633 .
Stat ion descr ipt ionVeloc ity -area stat ion In 19 79 V shaped bed control of steel piles w ith capping installed
Catchment area (sq km) 622 .0
Stat i st ics of m ont h ly dat a for previo us record (Oct 1937 to Dec 1983— incomplete of min ing months total 1.8 yaws)
19 8 4
First year : 193 7 Level stn. (m OD) 16 .3 1
Dai ly m ean gau ged d isc harges lon e metres pet sn ood)
DAY JAN FFB MAR A PR MAY A IN A A AUG SLP
Mar all (m OD). 222
CC 1 NOV GEC1 7 137 2 1 630 3 6 18 3 182 1.88 1 2 150 233 0 9 76 0 83 4 1 6 10 1 35 1 11.3 102 10 0 20 2 7 390 4 4 75 3 100 1 856 5 130 266 2 459 0 75 1 1 745 4 709 16 .6003 12 170 17 9 70 3 745 2.99 2 1 8,16 • 492 235 1.85 1 2.0 24 1 74 7 19 930 13.3404 10 590 26 320 5 29 7 2 863 1 838 3 113 20 3 2 4 72 3 .334 1 49 5 17 490 10 9 705 9 5 71 20 04 0 5 178 2 6 74 1 788 3 05 8 169 1.753 1 49 2 1 3 16 8 44 3 8 296
6 7 54 1 16 600 a 082 2 60 8 1.76 9 80 4 159 1.5 12 1 0 73 1 19 1 5 3 72 6 58 27 8 .394 26 2 70 3 .852 2 574 1 738 36 7 116 2 72 / 0 990 1 2 15 a 108 5 4388 7 80 7 2 1 520 3 383 2 5 10 1 733 04 1 08 7 1 128 0 962 1.5 71 9 36 3 4 5089 5 .390 13.750 3 323 2 490 1 743 84 3 0 75 56 1 1 368 1 559 22 430 4 23 5
10 5 134 10 380 3 238 2 52 7 1 80 1 68 6 0 75 24 7 I 925 1 322 25 530 4 194
11 5 429 9 13 7 4 0 19 2 628 1.774 6 15 186 137 I 34 8 1243 13. 170 3 9 7712 6 59 1 7 58 1 4 4 14 2 459 1 6 79 56 9 4 17 09 1 1 162 1.238 20 8 70 3 8 1513 8 69 6 6 719 3 654 2 32 8 1 622 559 54 7 10 2 1.170 1 2 16 20 8 70 3 9 1214 9 86 7 5 88 8 3 624 2 29 1 1 60 2 5 14 120 I 862 1 154 11 650 6 04 715 6 99 7 5 324 3 44 7 2 3 10 1 63 2 5 13 998 262 1 589 1 163 8 337 4 830
16 12 790 4 .788 3 266 2 4 17 2 104 44 3 463 133 1 3 18 1 198 5 8 75 9 90017 13 000 4 557 3 0 32 2 2 72 2 06 1 439 32 1 122 2 5 16 1 560 5 109 9 62718 7 693 4 24 1 2 885 2 35 9 1 8 72 4 73 23 1 069 1 784 2 958 5 18 1 7 26 /19 5.2 75 3 96 1 2 834 2 353 1 7 19 420 172 05 7 1 40 7 3 04 1 5 0 29 5 99 520 4 24 7 3 788 2 80 2 2 28 5 2 09 3 4 78 I 11 0 98 7 2 163 2 0 12 7 953 7 23 1
2 1 3 760 4 145 2 80 0 2 2 15 2 2 16 596 0 71 0 9 76 2 135 1 899 13 50 0 8 12222 3 99 1 4 799 1 686 2 108 4 0 25 528 0 25 0 909 1 698 2.38 7 19 730 11 8 1023 7 493 4 86 3 3 112 2 0 50 2 490 5 13 0 98 7 0 938 1 56 8 I 94 4 26 480 15 63 024 7 6 17 44 2 6 534 2 0 10 1 90 5 4 75 0 953 0 863 1 36 7 3 20 8 24 350 22 95025 5 856 4 30 8 4 900 1 99 3 1 76 3 43 1 0 83 9 0 88 1 1 29 9 3 6 24 14 330 16 720
26 17 230 4 09 1 8 154 1 92 9 1 654 390 0 82 9 0 830 1 22 8 2 5 7 1 11 440 11 5 102 7 34 780 3 97 1 6 890 1 926 1 9 78 35 1 0 8 19 0 83 3 1 166 1 964 9 029 8 32828 2 7 6 10 3 594 5 3 72 1 880 2 2 18 253 0 8 18 0 82 5 1 29 7 I 990 10 260 6 42229 19 170 3 538 4 394 1 86 5 1 93 1 269 0 775 0 80 6 1 49 7 1 900 7 995 7 8 7630 15 5 10 3 848 1 8 78 1 75 1 209 0 799 0 8 14 1 9 10 2 54 1 6 850 10 1303 1 17 200 3 484 1 655 1 178 0 88 7 1 749 8 994
Average 10 4 70 10 540 4 0 76 2 36 9 1 92 7 I 926 1 151 1 26 9 1 54 1 I 88 2 12 260 8 9 15Lo w e st 3 760 3 538 2 686 1 86 5 1 60 2 1 209 0 775 0 80 6 0 75 1 I 154 2 35 1 3 8 15H ei he s t 34 780 2 7 390 8 154 3 182 4 025 5 130 1 99 8 2 72 7 3 33 4 3 624 26 480 12 950
Peak flow 36 890 32 5 10 8 95 / 3 24 2 4 932 6 064 2 80 3 3 40 5 6 8 78 4 805 3 1 440 24 250Day of peek 27 6 26 I 21 2 15 / 3 24 9 24Monthly to talIm ilkon cu ml 28 04 26 40 10 92 6 14 5. 16 4 99 3 08 3 40 4 00 5 04 3 1 77 23 88
Runoff prv n) 45 42 18 10 5 5 6 8 5 1 38Barden Mvn l 83 45 39 1 1 45 48 26 49 9 1 6 5 135 57
W an A v g 10 4 10 9 4 12 6 688 4 713 3 8 71 2 776 2 838 3 04 8 3 4 17 4 552 7 7 15 9 339fl o w s LOw 1 965 2 3 76 2 183 1 49 0 0 90 3 1 125 0 736 0 64 1 0 9 19 1 184 I 30 3 2 429
N ee r) 1964 196 5 1938 1938 1946 1962 1976 1976 1964 194 7 1942 194 7H ig h 2 1 950 19 860 18 580 10 36 0 22 720 6 99 5 12 750 8 404 16 990 15 9 70 22 540 22 250b ead 1939 1980 194 7 1983 1969 1954 196 8 19 7 1 195 7 t1954 1954 1965
Runo ff Avg 45 37 29 20 17 12 12 13 14 20 32 40Low 8 9 9 6 5 3 3 4 5 5 10High 95 80 80 43 98 29 55 36 / 1 69 94 96
Par dee Avg 68 5 1 5 1 49 62 58 69 72 88 68 76 7 1Low 18 8 18 7 18 13 16 6 5 15 13 10High 145 145 127 98 194 142 168 175 169 13 7 170 152
Sum ma ry stat ist ics
For 1984 For recordPracedelg 1984
1984As % of
pre . 1984
Fact ors aff ect ing fl ow reg im e
• Flo w influenced by gro undwater abstractionand/ or rechargo
Mean %ow Irn1s- 11 4 83 3 5 7 16 85 • Abstraction fo r public water suppliesLowest yearly mean 2 752 1964 • Augmentat ion from efl luem returns

86 H Y D R O L O G I C A L D A T A : 19 8 4
071001 Ribble at Samlesbury 1984
St at i st ics of m ont h ly da t a f or prev io us reco rd (May 1960 to Doc 1983)
St at io n desc ri p t io nOr ig inal a Yell:C it y -ar ea stat io n A co mpound w eir for more accura t e measurem ent of lo w and medium disc harg es w as completed in 19 70 w it hCrum p prof ile fla t V cent re sect ion and horizo ntal flan k w eirs of Cru mp prof ile Volocff y-area st at ion became the pr im ary gauging sae in 198 1 dueto vanda lism at the wer sit e

R I V E R F L O W D A T A 87
073010 Leven at New by Br idgeMea su nng aut hori ty ' NW W AFtrst y ea r ' 19 3 9
Da il y m e an ga u g ed d i sc ha rg es (a shic met es per seco nd)
God reference. SD 367863Level stn (i n OD) 37.28
Stat ist ics of mon thly da ta for prev ious reco rd (Jon 1939 to Cies 1983)
Catchment area (SC1 km ): 24 7.0Max alt. (m OD). 8 73
Stat io n descri pt ionCompound Cr um p w eir supersed es t he o rig ina l Sta t io n 0 7300 1 in 19 70 All flow records from 1939 combined in single sequence
19 8 4
DAY JAN30 30 0
FI B2 7 680
MAR4.63 8
APR3 43 1
mAY1 77 1 0 648
A S1.50 7
AuG0 .584
SEP0 48 11
OCT15 8 70
NOV30 460 30 .930
1 3 1.180 39 280 7 9 79 3 095 2.269 0 711 1 563 0 .68 1 0 .498 14 .7 10 2 7.230 29 06 03 33 .220 46 .370 7 88 7 1 79 1 1 884 0 .936 1 0 22 1 370 0 9 15 13 9 70 35.930 29 1304 30 06 0 50 140 9 18 1 2 64 6 2.834 1.152 0 .90 7 1.7 15 2 892 13 0 70 4 2.360 29 .8605 29 .940 5 2.850 10 240 2 42 7 1.793 1 2 28 0 80 2 1 249 3 185 11.450 35 450 30 620
6 29 290 54 180 9 .969 2 .53 7 1 89 1 1.420 0 758 0 830 2.5 12 9 .46 5 25 8 70 30 3207 28 0 70 50 . 170 9 359 26 9 1 59 7 1.590 0 73 1 1.13 2 1.98 7 8 34 1 23.730 2 7.480
15 420 45 590 8 .453 2.298 1.20 7 1.334 0 652 0 .749 1 • 5 1 11.770 19 830 24 4209 22 460 39 0 40 7 Mi l 2.09 7 2 13 1 0 98 7 0 69 9 0 63 7 4. 195 14 .700 19 330 20 830
10 22 780 3 1 840 6 .855 2 06 7 1.378 0 828 1 0 07 0 60 2 8.0 13 13. 170 23 3 70 17 4 70
11 33 600 26 580 6 5 12 2 46 9 1.264 0 769 1 0 20 0 .549 5 805 12 0 10 24 140 1• 6 8012 36 590 22 480 6 188 2 .354 2 00 3 0 .704 1 06 6 0 54 5 5 IBA 10 340 3 7 230 11 04013 49 .170 19 . 110 5 7 15 2 .282 0 808 5 68 1 1.18 1 0 53 4 A 928 9 88 7 38 600 9 884I A 4 7.840 16 150 4 944 2.372 0 .753 I I 880 1.264 0 529 7.285 11.970 34 2 70 8 .20415 4 1 8 70 13 590 4 289 2 64 1 0 785 10 .380 1.253 0 53 1 7 75 1 22.5 30 27.560 7.569
16 38 680 I I 520 3.909 2 .58 7 0 .765 8 .120 1 0 38 0 52 8 7.435 I I 380 23 0 10 6 6 7717 38 840 9 875 3 623 2 422 1.346 6 15 1 0 856 0 52 3 12 0 10 9.7 75 19 300 6 73 118 35 880 8 564 3 3 13 3 128 1 09 3 4 656 0 83 1 0 5 19 12 .550 12 920 16. 170 8 30 919 3 1 610 7 28 2 3 06 8 5 86 9 0 9 79 3.400 0 .86 5 0 5 17 11. 120 25 590 13 420 14.98020 25 130 6 36 9 2 894 8 9 75 1 06 1 2 4 10 0 .834 0 5 14 9 6 18 33 740 11.780 18.960
2 1 20 9 70 5 990 2 69 7 9 0 14 1 274 1 806 0 794 0 5 11 9 83 1 34 4 70 13 450 20 64021 18 430 6 438 2 56 5 8 33 8 1 4 13 3 04 1 0 .77 1 0 5 12 13 020 53 540 22 4 20 23 63023 16 6 10 6 24 9 1 52 7 7 2 16 0 73 7 3 7 12 0 .66 1 0 5 15 16 450 59 760 26 96 0 33 29024 14 100 6 75 7 3 22 8 6 338 0 .762 3 53 7 0 59 3 0 5 14 15.340 54 830 2 7 80 0 35 6 1025 12.340 6 034 3 80 7 5 44 0 0 93 2 3 13 7 0 54 2 0 50 3 13 120 54 640 25 59 0 33.340
26 10 740 5 528 3 68 5 4 8 14 0 954 2 .549 0 53 5 0 49 4 11 050 5 1 6 50 22 8 10 30 84027 10 2 70 5 0 29 3 83 9 3 988 0 922 2 5 14 0 53 1 0 48 8 9 820 45 020 26 190 28 23028 11 230 4 53 7 3 89 4 3 626 0 730 2 29 3 0 50 3 0 .474 11 650 40 480 38 14 0 12 20029 17 330 4 06 7 3 BM 3 200 0 624 1 890 0 4 79 0 46 2 12.540 40 04 0 3 7 630 18 90030 22 M O 4 00 7 2 894 0 623 650 0 54 7 0 44 9 15 540 42 540 33 540 18 7003 1 25 180 3 99 7 0 60 2 0 554 0 454 36 380 15 8 10
Average 27 140 2 1 650 5 3 13 3 850 1 193 3 040 0 85 1 0 652 7 8 72 25 .480 28 880 2 1.130Lowest 10 2 70 4 06 7 2 527 2.06 7 0 .602 0 64 8 0 4 79 0 44 9 0 488 8 34 1 11 780 6 8 77High est 49 170 54 180 10 240 9 0 14 2 77 1 11 880 1 56 3 1. 715 16 450 59 760 4 1 30 0 35 6 10
Peak f io w 50 99 0 54 790 10 680 9 58 7 3 34 5 12 . 120 2 34 4 2 03 1 17 0 10 63 530 44 500 3 7 110Day of peek 13 6 5 20 1 I d 2 4 23 22 4 23Monthly to tsundkon cu ml 72 70 54 24 14 23 9 .98 3 20 7 88 2 28 1 75 20 .40 68 .26 69 69 56 6 1
Runoff (n-rv nl 294 220 58 40 13 32 9 7 83 276 282 229Rae, faII Imen) 326 135 64 44 22 123 40 9 1 252 336 3 17 2 19
Mese. Avg 19 6 70 16 620 13 360 11 160 7 770 6 53 7 7 385 10 .3 10 14.560 17 130 20 340 20 8 70flow s Low I 935 0 9 74 3 699 t 796 0 64 1 0 54 5 0 775 0 .72 2 0 560 1 438 6 8 73 8 208
M arl 1963 196 3 1962 1974 1980 1978 194 1 1955 1959 19 72 1983 1963Eugh 38 0 20 3 1.030 29 9 70 2 1 640 16 940 18 730 16 990 25 580 33 .930 50 170 36 350 40 1101yeau 1975 194 5 198 1 194 9 196 4 1972 1953 196 2 1946 196 7 1954 2954
Runo ff Avg 2 13 164 145 117 84 69 80 112 153 187 2 23 226Low 2 1 10 40 19 6 8 6 16 72 89Nigh 4 12 304 32 5 22 7 184 197 184 2 77 358 544 38 1 435
Rainfall Avg 12 8 152 156 119 120 126 147 180 220 2 18 236 23 2Low 26 20 32 12 29 17 SI 7 29 30 17 90sig h 439 29 5 34 1 243 24 1 26 9 28 7 36 1 42 7 55 7 428 43 1

88 H Y D R O L O G IC A L D A T A : 1984
076007 Eden at Sheepmou ntM easuring aut ho rit y NW W A Grid ref erence NY 390 57 1 Catchme nt area (sg km ) 2286 .5First year 196 7 Level st n Irn OD) 6 .9 7 Max all (m 00 1' 950
Da i ly me an gauged d is cha rg es (cubic metr es par secand)
0 r J A N M A R APR M A Y JU N A A. ALX; sr P OCT NOV OECI t I 700 10 7 300 3 1 790 30 120 13 450 10 550 9 576 12 560 13 850 40 560 5 7 300 117 200173 300 179 700 53 09 0 26 920 13 320 13 3 70 9 3 15 9 52 7 13 0 10 3 1 960 60 170 136 400113 60 3 187 000 42 23 0 25 320 13 160 14 000 9 182 17 8 10 17 630 30 190 46 2 100 98 3208 1 00 0 157 700 110 500 13 640 12 980 16 660 9 ) 34 9 70 52 800 36 080 258 300 90 39093 370 164 600 77 0 70 21 9 10 12 860 19 5 10 8 787 16 910 2 1 980 28 8 10 120 800 113 10 3 .
83 930 19 1 90 0 55 34 0 2 1 520 12 640 3 7 800 8 64 9 13 040 14 580 23 130 8 7 34087 4 10 143 200 45 6 70 2 1 580 11 340 18 480 El 534 22 840 12 220 10 990 90 71062 7 10 136 000 40 120 2 1 110 12 100 13 590 8 30 7 17.990 11 6 70 34 8 70 76 96052 960 89 270 36 2 10 20 54 0 11 0 10 12 0 20 8 17 1 13 050 16 0 10 39 020 112 100
1 BO 160 80 370 33 6 70 7 1 300 12 150 10 760 8 409 11 190 15 290 25 340 178 900
i i 20 5 700 90 380 33 0 10 27 380 12 050 10 130 8 304 10 170 14 06 0 22 620 98 2 10 5 1 89012 135 500 . 82 280 33 480 25 330 11 680 10 0 E10 8 354 9 66 3 12 520 20 260 22 3 000 46 26013 335 400 54 .090 34 3 10 2 1 0 60 11 430 32 8 70 8 304 9 14 2 12 840 19 43 0 169 000 4 1 91014 157 300 53 720 30 0 50 20 490 11 240 32 910 8 588 8 93 6 18 380 27 59 0 10 3 000 39 06 015 10 7 700 48.240 27 9 10 20 110 11 0 70 17 5 10 8 664 8 904 2 1 430 29 5 10 78 7 10 36 660
16 180 000 43 360 25 690 19 2(X) 11 150 14 0 10 8 36 5 8 73 1 16 40 0 1 1 64 0 66 940 33 72017 183 30 0 39 98 0 13 960 18 200 11 220 12 640 8 0 / 4 8 .558 83 4 10 19 430 63 9 70 39 53018 10 7 800 3 7 620 22 480 17.760 10 940 I I 650 7 934 8 545 43 000 74 860 63 320 56 4 1019 79 00 0 34 120 2 1 420 20 450 10 850 11 330 7 8 19 8 3 15 23 870 174 900 59 5 10 103 CO D20 62 0 00 30 640 2 1 100 22 430 10 6 70 10 980 7 70 1 8 035 19 100 162 900 49 350 120 930
7 1 53 090 33 610 20 480 2 1 5 10 10 86 0 10 790 I 58 9 7 891 3 1 8 70 95 090 73 960 12 1 10022 48 860 45 280 19 580 18 640 11 06 0 11 420 7 4 75 7 762 104 000 195 100 174 400 86 66023 46 6 70 43 640 12 980 17 330 I 1 0 80 12 170 7 420 7 730 83 780 14 1 20 0 175 300 123 60024 42 510 3 7 550 73 740 16 680 10 690 11 680 7 380 7 7 11 45 030 10 7 100 118 800 114 50025 39 320 34 540 70 5 10 15 960 14 060 11 360 7 48 8 7 6 79 3 1 750 133 200 84 790 99 930
26 3 7 630 3 1 8 10 90 5 70 15 4 10 12 710 11 0 30 7 40 9 7 685 24 6 10 89 600 73 580 100 2007 7 64 180 29 730 58 900 15 060 I I 430 10 3 10 7 600 7 704 23 0 70 70 030 13 1 400 7 1 36028 92 5 70 18 510 57 290 14 730 10 9 10 10 230 8 196 8 133 44 0 80 63 540 24 5 800 65 15029 164 30 3 2 7 300 50 3 10 14 240 10 580 9 89 6 El 905 9 280 38 180 78.3 10 138 00 0 70 06 030 120 700 4 1 090 13 740 (0 30 0 9 68 9 8 52 7 8 856 44 96 0 95 290 96 170 7 1 8603 1 106 600 35 4 70 9 98 7 11 4 70 10 160 70 4 70 63 5 70
Average 106 900 78 420 43 23 0 10 320 11 7 10 14 650 8 3 70 7 6 797 11 280 30 850 65 26 0 126 400 8 1 2 10Low est 3 7 630 2 7 300 19 58 0 13 740 9 98 7 9 689
7 39 I I 6 70 19 430 49 350 33 720
Highest 335 400 19 1.900 110 50 0 30 120 14 06 0 3 7 800 I I 4 70 34 9 70 104 000 195 100 46 2 100 136 400
Peak flow - 4 70 000 2 13 500 122 30 0 32 280 16 170 73 340 14 680 44 160 131 20 0 29 8 500 63 4 700 175 900Day of peak 13 6 4 1 25 13 3 1 5 17 22 3 2Monthly to talIni ti a l cu rn) 286 40 196 50 115 80 57 68 3 1 36 3 7 9 7 22 44 30 2 1 79 95 74 80 32 7 60 2 17 50
Runo ff ( m n ) 125 86 5 1 23 14 17 10 13 35 76 143 95Ramfall imm ) 177 72 77 19 25 70 38 80 163 146 208 I I I
Stat is t ic s of m ont h ly da t a tot p rev io us rec o rd lOct 196 7 to Dec 198 3— incom plete or missi ng months tota l 3 .0 years)
Mean Avg 86 6 10 60 520 56 09 0 39 430 29 770 13 160 10 410 20 560 35 420 65 66409 731928430 69 360flow s l ow 42 850 3 7 540 24 360 13 0 70 11 0 50 10 4723 19760 9 732 7.026 91927128
7 9
19 73 1975 1976 19 7230 10 0 31 480
(year) 19 73 1974 197419
19 1Haan 15 1 200 100 OCO 119 700 63 960 69 4973 19 72 1968 197 1 190 50 380 36 990 54 790 8 7 3679 196 70 72 5 000 1231978992 139 2007Neer) 1975 19 74 1988 1970
1919 74
Runo ff Avg I C11 64 66 45 35 26 2141 24 40 77 83 8 1Low 50 40 29 15 13 12 8 10 9 34 38Ho 17 7 106 140 73 8 1 5 7 43 64 99 264 140 163
Rainfall Avg 129 74 9 7 59 70 78 78 89 10 / 114 135 11611968 Low 74 28 43 a 78 3 7 45 19 26 3 1 54 4319831 High 23 2 129 177 111 123 168 121 16 1 186 183 200 2 10
Sum m ary st at i st ic s
Mean flow (m3sTLow est yearly meanEnghest yearly meanLow est month ly meanFi rgbost m o n th ly meanLo w a s t d ai ly meanH y ne s ! gaily meanPoak10 %As50 %de95 %deA nn ua l to t al (rrul lto n c u In tA m ua l runoff ImmlAnnual rainfall (mm)
( 194 1-70 rainfall average frmT4
St at io n descri p t io nVeloc ity-area stat ion
Fp 1984
49 750
8.3 77126 400
7 38046 2 10063 4 700119 60027 3408 09 8
1573 0068 8
1186
S dNov
24 Ai3 Nov3 Nov
For mooedprecocit y 1984
48 3 1028 . 18060 790
7 0 2622 5 OM
5 46 8772 .900
135 7 00099 92030 350
9 6581524 00
66 711461240 )
19731982
Aug 19 76Oct 1967
7 Sep 19 7623 Mos 196 824 Mar 1968
1984A s % of
PNI • 19 84103
1209084
103103103
Fac t ors af f ec t i ng f lo w reg im e
• Reservoir(s) in catchment• A bstrac t ion for public w ater sup pl ios
19 84
10 7 30 089 33075 87071 1 7059 960

R I V E R F L O W D A T A 89
079006 N it h at Drumlanr igMeasuring authority . SRFI3 Grid reference . NX 858994First year 196 7 Level stn (m OD) 52 .20
Dai ly m ean gauged d ischarges (cubs me ss pa. saw ed)
Stat ist ics of mo nt hly dat a for prev ious record (Jun 1987 to Dec 1983)
St at io n d e scr ip t io nVeloci ty -area stat ion
Catchm ent area (sg kin ). 4 7 1.0Max at: (m OD) 725
1984

90 H Y D R O L O G I C A L D A T A : 19 8 4
084005 Cly de a t B lairsto n
Stat ist ics of mon th ly dat a f or prev iou s record (Oct 1958 to Dec 19831
1984M easur ing aut ho rit yFirst year 19 58
CRPB
gauged di scharges (cubi c metres per secondl —
JAN Et 8 MAR APR
Grid ref eren ceLevel si n
NS 704 5 79On OD) 17 60
JUN J LA M e
Catchme nt
oo
area (sq km ) 170 4 2Max all (m OD) 732
Dai ly m ean
DAY MAY Au G NOv DEC1 163 700 99 49 0 56 350 32 250 11 500 11 2 10 7 3 19 8 0 22 8 7 13 30 500 80 9 10 91 9502 192 600 199 100 75 990 25 9 10 11 380 11 140 7 07 1 B 438 10 830 20 000 114 400 10 7 8003 134 500 23 2 200 49 930 23 430 11 100 10 760 6 96 2 7 149 9 362 30 640 29 5 400 76 1804 / 6 640 332 100 106 300 2 1 050 11 150 10 820 6 88 / 6 869 7 795 55 380 257 600 70 7805 144 900 2 7 1 40 3 69 550 19 380 11 160 10010 6 859 6 80 3 7 149 28 780 104 700 75 450
6 124 500 229 703 55 820 19 3 50 10 800 i 1 330 6 876 7 04 5 6 454 19 0 60 72 660 8 1 3307 104 200 14 1 60 0 48 780 19 4 20 10 6 10 11 600 6 8 14 6 94 7 6 081 16 200 71 190 147 6008 66 790 12 1 200 42 980 18 940 10 3E10 730 6 65 1 6 644 6 8 76 18 100 86 2 70 10 7 3009 54 740 89 960 38 3 70 17 860 10 260 5 17 6 593 6 5 14 8 190 2 1 6 10 164 500 78 7 10
10 99 930 145 COO 33 9 20 18 2 10 10 260 09 3 6 456 6 34 9 8 6 10 19 800 2 18 900 65 30 3
11 158 600 13 7 500 39 550 22 920 10 101) 92 8 7 505 6 3 73 7 90 3 3 1 8 10 105 60 0 53 60 012 15 1 500 104 8130 45 0 60 2 1 660 9 99 7 980 7 713 6 0 15 7 239 23 030 125 000 45 42013 28 1 70 3 78 7 10 35 610 19 480 9 9 11 622 7 270 5 823 14 290 32 640 83 760 40 44014 127 800 63 8 70 3 1 800 18 600 10 630 6 16 7 03 5 5 699 22 340 30 0 10 63 120 36 33015 88 450 53 50 3 26 850 18 0 10 9 6 74 39 2 6 660 5 643 16 750 13 130 5 1 120 32 930
16 83 170 49 800 23 650 16 860 9 869 21 7 6 562 5 694 I I 930 18 400 42 8 70 28 78017 88 080 59 950 2 1 3 70 15 330 10 170 50 6 6 4 72 5 55 7 i o 04 0 17 160 38 820 38 8 1018 77 420 56 9 10 . 20 640 15 820 10 100 166 6 385 5 56 4 8 93 1 109 000 35 300 40 71019 60 30 0 43 170 19 170 42 6 10 9 668 00 4 6 345 5 694 8 652 BO 960 30 680 94 06 020 49 880 36 520 18 150 32 250 9 824 041 6 225 5 6 13 8 704 8 1 830 3 1 030 163 000
2 1 46 39 0 3 7 680 17 5 10 22 290 9 867 6 10 6 09 0 5 404 10 0 50 75 I RO 38 44 0 10 7 10 322 39 860 60 0 70 16 730 8 540 10 440 I 250 6 06 8 5 123 12 950 13 1 800 80 020 85 58023 45 130 50 740 28 220 16 390 10 05 0 1 220 5 904 4 99 1 19 780 73 3 10 59 530 10 7 00024 4 1 59 0 46 020 104 100 15 4 70 9 8 17 53 4 5 956 5 0 58 12 3 70 128 800 86 240 14 1 50025 38 4 70 49 560 98 0 20 M 630 10 5 10 8 12 5 965 5 0 59 15 5 70 167 COO 72 170 102 300
26 39 220 4 1 950 97 0 60 13 680 10 0 10 48 4 5 9 16 5 06 2 12 000 72 9 70 60 110 / 4 5302 7 39 880 35 190 6 7 780 13 190 9 777 93 2 6 35 1 5 085 12 290 5 1 3 70 2 74 60 3 52 60028 6 1 520 31 OCO 60 0 50 12 890 9 4 11 68 5 6 578 6 178 3 1 850 50 430 177 00 3 46 03 029 106 80 0 3 1 0 80 49 2 10 12 450 8 932 56 2 6 970 6 854 35 440 108 000 94 8 70 55 / 5030 99 620 4 7 300 11 900 9 020 3 78 7 09 3 7 340 29 9 70 10 6 300 8 1 0 50 57 8503 1 83 830 39 8 10 8 838 8 85 7 24 9 104 600 49 330
Average 95 860 10 1 100 4 7 760 20 030 10 170 9 089 6 70 1 6 186 13 30 0 5 7 34 0 103 300 76 000Low est 38 4 70 3 1 080 16 730 I I 900 8 838 7 3 78 5 90 4 4 99 1 6 08 2 16 200 30 680 28 780Highest . 78 1 700 332 10 3 106 30 0 42 6 10 11 50 3 11 60 3 8 185 13 43 8 35 44 0 16 7 000 29 5 40 0 163 COO
Peak f lo w 32 1 000 390 100 129 800 52 330 14 500 12 620 10 760 10 0 60 49 6 10 234 900 4 10 800 189 600Day of peek 13 4 4 19 14 17 2 29 25 20Monthly to tal(minion cu ml 25 6 BO 253 20 127 90 5 1 9 1 2 7 23 23 56 17 95 16 5 7 34 48 153 60 26 7 70 20 3 60
Runof f lm mlRainfall Imm1
15 1196
149100
7586
3029
16113
1453 1;3
103 7
20120
90173
157.196
119122
Mean Avg 63 580 49 160 44 700 29 160 23 950 17 3E0 14 720 22 380 34 88 0 5 1 020 64 680 62 300flow s Low I I 920 8 855 14 8 10 10 4 30 8 832 8 117 8 36 1 7 654 7 62 7 8 246 16 460 26 080
lyear) 1963 196 3 196 9 1974 1980 196 1 1976 19 76 19 72 1972 1983 1963High 134 300 BO 580 88 940 58 700 5 1 980 4 1 190 79 700 5 7 520 74 550 114 600 13 1 00 3 115 103lyear) 1975 196 2 19 79 1972 1967 1972 ' 96 5 1962 1962 1967 1982 1974
Run off Avg 100 70 70 44 38 26 23 35 53 80 98 98Low 19 13 23 16 14 12 13 12 12 13 25 4 1High 2 11 114 140 89 82 63 4 7 90 113 180 199 18 1
Rainfall Avg 110 73 88 65 75 74 78 94 115 12 1 126 112Low 25 23 28 9 23 43 36 24 16 33 24 38Hig h 13 7 127 163 125 12 7 157 125 20 1 196 13 1 22 1 209
Sum m ary st at ist i cs Fact ors aff ect ing flow regi me1984
Foe 1984 Fo. record As % of!Receding 1984 Pre- 1984 • Na t ura l to w it h in 10 % at9 5 percent ile /lo w

R I V E R F L O W D A T A 9 1
085003 Fa l loc h a t Gle n Fa l lo c h 1984
Stat ion descript ionVelocity-area stat ion Artif icial low flow control from 1975
S t at is t ic s of monthly dat a for previous record (Oct 19 70 t o Dec 19 8 3- inco mp let e or m issi ng mo nt hs tot a l 0 3 ye• rs)
Measurin g authon ty : CRPB & x i reference. NN 32 1197First year : 1970 l evel stn . (m OD) 9 .50
Dai ly m ean gauged discha rg es lcuoic metnts per (* condiDAV JA N FEB MAR AM Me e A IN A l
8 43 5 • 50 3 9 .63 5 0 .88 2 0 75 1 0 .96 2 0 .45312 830 11. 180 4 .805 1.04 5 0 63 3 1.0 76 0 .3703 60 8 11.920 6 114 0 86 6 0 64 7 3 258 0 29 2
AUG0 56 50 98 60 .53 7
SEP18.3 704 7 3 50
5 202
Cal civ nent area (so km): 80 .3Max ah . 00 ): 1130
OCT NOV DEC2 84 2 18.9 50 3 .6 181 9 70 . • 2 19 2 .30 52.3 7 1 7.099 4.86 9
4 52 1 16 620 11.6 10 0 906 0 .579 1 277 0 250 0 34 5 1.9 77 2.32 6 2 659 15 3209 866 9 29 6 7. 100 0 .95 5 0 5 14 0 .906 0 203 0 259 1 266 1.32 6 1 58 6 8 .170
11.890 4 88 0 5. 145 1.256 0 .42 4 0 648 0 170 0 4 72 0 984 1.3 10 290 48 8 10• 135 2 885 3 .763 1 22 7 0 33 9 0 439 0 . 284 0 40 2 0 773 2 .37 1 1 9 16 35.5402 104 1 9 75 2 460 1 64 5 0 3 14 0 29 1 0 146 0 28 2 7 880 5 428 14.960 9 38 74 703 3 890 2.08 1 2.0 28 0 324 0 236 0 129 0 22 7 5.350 2 .750 10 540 10 3 70
2 1 5 10 14 260 1.80 2 8 170 0 3 7 1 0 22 6 2.208 0 180 2 54 5 11.6 90 6 76 1 6 . 149
13 960 9 9 13 3.720 3.58 5 0 322 0 23 6 3 .533 0 148 1.5 75 3 .798 52.620 3 20 526 3 10 8 259 1.596 6 6 79 0 290 330 3 717 0 137 3 527 11 230 5 909 2 1821 10 9 10 9 8 12 1.26 5 11 0 50 0 34 3 2 038 1 4 16 0 123 8 092 15 6 10 2.764 726
2 853 4 72 7 1 09 7 16 430 0 34 5 0 860 1 26 2 D I I I 2.8 71 4 969 3 0 12 2 0 142. 125 2 460 0 943 2 776 0 40 7 0 56 1 0 829 0 . 10 3 1 48 1 3 0 15 2 723 1 633
1 800 8 00 3 0 834 1 78 1 0 436 0 42 1 0 526 0 09 7 1 385 3 28 1 3 68 5 2.3 731 1 76 1 8 700 0 8 19 3 28 8 0 4 72 0 379 0 444 0 09 1 1 144 16 680 3.656 3 4251 579 5 04 3 0 73 1 17 770 0 355 0 38 7 0 328 0 175 1 880 43 380 3 0 14 6 1861 60 1 2 580 0 705 7 85 7 0 .35 6 0 898 0 24 1 0 18 1 7.925 18 4 10 1 83 6 23 4902 00 5 1.722 0 63 8 8 328 0 34 7 3 324 0 190 0 123 8 600 8 464 1.398 7 42 1
2 1 1 196 2 600 0 620 7 928 0 3 13 7 600 0 157 0 10 1 5 824 24 . 170 13 160 9 .53822 1 280 3 885 0 .62 3 2 3 76 0 364 5 5 73 0 143 0 09 1 3 143 6.0 10 8 6 11 14 73023 1.163 2 623 8 364 1 920 0 334 1.987 0 129 0 086 I 775 7 145 17 0 70 19 20024 I 06 8 2 854 6 194 2.020 0 18 2 3 136 0 . 11 1 0 083 1.326 15 440 34 240 7 9 7825 0 989 3.573 4 553 1.95 8 0 33 6 2 04 8 0 09 7 0 0 77 2 08 6 8 795 10 900 13 420
26 2 00 3 1 58 6 4 809 1 40 5 0 24 4 4 56 7 0 09 1 0 06 8 0 .88 4 12.330 40 .780 2.42 32 7 1 09 8 1 940 2.580 1 42 7 0 20 2 2 69.4 0 56 3 0 0 68 11 090 12 0 80 45. 100 2 58 828 3 022 2 26 5 1.9 13 1 28 7 0 186 1 123 0 656 0 43 0 11 690 8 .548 14.2 10 2 36029 5 178 6 3 19 1.970 2 0 36 0 17 1 0 73 1 0 606 1 35 7 8 0 29 2 1.940 28 700 5 36030 4 9 11 1.449 0 9 11 0 166 0 54 1 0 54 7 18 640 6 . 103 6 2 18 9 946 4.5 143 1 2 .208 1 088 0 17 1 0 6 75 6 852 3 0 53 2 15 1
Average 5 523 5 90 3 3.259 4 0 26 0 36 6 1 758 0 634 1 0 77 6 0 35 9 3 2 1 12 440 9 0 79Low est 0 .989 1.722 0 .620 0 866 0 166 0 22 6 0 0 9 1 0 06 8 0 773 1.3 10 1.290 1.588Highest 26 3 10 16 620 11.6 10 17.770 0 .75 1 7 6CC 3 7 17 18 640 4 7 350 43 380 52 620 08.8 10
Real, flow 156 900 2 7 680 26 8 10 42.830 0 8 75 20 05 0 7 6 13 48 39 0 114 800 12 1.100 156. 100 120 700Day of peak 13 4 24 14 1 22 I I 30 2 18 -2 7 7Monthly tot alUn ger , cu mt 14 79 14 79 8 .73 20 4 4 0 98 4 56 1.70 2 89 15.64 24 9 7 32 25 24 32
Runoff from) 184 184 109 130 12 5 7 2 1 36 19 5 3 11 40 2 303Ran fail Inse l 440 225 115 127 19 130 . 83 118 26 4 435 48 5 3 79
Moan Avg 9.54 5 5 340 6 033 2 72 6 2 770 2 590 2 3 18 2.963 6 78 7 7 199 8 947 7 7 15flow s Low 3 698 1 840 0 854 0 40 8 0 133 0 328 0 924 0 339 0 75 1 1 362 3.326 1 4 16n ear) 1980 19 75 19 75 19 74 1980 1977 1983 1983 1972 1974 1983 198 1High 19 630 8 38 7 11 360 6 325 6 422 5 609 3 495 5 28 9 11 2 10 16 0 50 13.830 15 650n eon 1974 1982 1979 19 77 1976 1973 1980 1982 198 1 1983 1978 1974
Runoff AvgLow
3 18123
16255
20 128
8813
924
811 773 1 "I I
2 1924
24045
28910 7
2574 7
High 655 253 3 79 20 4 2 14 18 1 117 176 36 2 53 5 44 6 52 2
Reo lat Avg 3 70 202 24 8 119 14 1 150 157 163 3 12 313 370 329Low 172 79 100 15 20 6 7 66 42 so 100 117 I I IHigh 7 15 3 10 388 26 1 288 249 329 30 8 468 645 55 7 637
Summ aty st at ist i cs Factors aff ec t ing fl ow reg im e1984
For 1984 For reco rd As % ofpreced ing 1984 pre- I 984 • Natural to w ithin 10 % at 95 percent ile f low .

92 H Y D R O L O G I C A L D A T A : 19 8 4
201005 Camow en at Camow en Ter race 1984
•-
Stat ist i cs of mon th ly dat a for previ ous rec ord (May 1972 t o Dec 19 83)
1194 1:70 rainf all a v e r a g e a n n 0 920)
Stat ion desc ript ionVelo ci ty-area st at io n w ith cablew ay , w eir cont ro l

R I V E R F L O W D A T A 93
2 03 0 10 B l a e lt w a t e r a t Ma y d o w n B r id g eMeasuri ng authori ty ' DOEN Grid reference: 111 8205 19First year ' 19 70 Level stn. (m OD) 15.00
Dai ly me• n gauged disch arges lcubic moires pe r second)
Stat ist ics of mont hly data for pr evious reco rd lOct 1970 to Dec 19 83)
•
Stat ion descript iooVelocit y -area stat ion
1 9 8 4Catchment area (so km): 95 1.4
Ma x alt . (m OD): 36 2
D A Y J A N 11 8 MAft Met MAY AM I t AUG SEP OCT NOV Oct1 29 150 59 250 13 020 10 .540 2 43 7 0 960 0 63 6 0 8 19 2.356 17 250 20 . 170 37.3002 34 3 70 62 80 0 19 980 8.99 8 2.226 0 .864 0 60 1 1 803 10 730 8.38 7 2 1 9 70 27.4403 38 .900 63 940 16. 160 8.28 2 2 0 13 1.290 0 723 9 63 1 6 399 7 0 12 17 4 10 34 .240• 36 660 62 330 13 . 160 17 400 1.9 19 3 .280 0 7 14 8 58 3 7.24 7 5 50 2 15.3 20 3 7 4405 53 .340 66 490 11 450 16 580 I .64 I 3 0 22 0 700 4 785 4 96 1 • 28 3 13 .250 53 .850
6 53 0 10 75 920 10 530 12.5 10 1.794 2.38 2 0 .686 2.886 2.62 2 3 840 14 240 5 1.1707 50 0 10 83 3 10 9 .759 10 4 10 1.749 2.38 2 0 713 2. 174 1 659 3 26 3 23.990 39 .7008 43 .590 89 2 10 8 .756 8 94 6 1.602 2 ..38529 0 63 7 1.764 1 559 3 . 188 4 5 890 29 2909 35 170 76 .7 10 8 . 135 7.740 1.560
1 30 .572 1.399 1 566 4 3 78 60 06 0 23 690
10 29 46 0 64 4 70 7.590 7 085 1.5 19 1.0 98 0 .678 1.16 1 3 884 3.88 7 4 7. 130 19. 160
I I 48 2 70 52 .100 7.53 7 6 .579 1.468 0 99 1 1.077 1.244 3 9 11 3 36 8 3 7.990 16 11012 5 7 890 40 360 8 . 196 6.2 16
1:33541 0 13 2.277 0 .994 2.66 7 3.390 40 800 14 30 0
13 76 0 60 29 590 9 166 5 .566 1 10 1.05 7 3 154 0 772 2 548 • 5 17 30 890 13. 17014 79 89 0 2 1 BI O 10 090 5 .338 1.256 1.949 2 10 1 1.0 70 • 276 6 6 78 2 7.6 70 42 .0 7015 78 880 18 090 9 . 114 5 118 1 364 2 .346 4417 0 906 • 873 7 204 2 1.340 53 .600
16 88 360 15. 180 7.850 4 86 7 1 4 16 586 1 111 0 709 3 145 5 2 14 16 790 43 99017 96 780 13 0 50 7 14 7 4 .939 1 40 6 383 1 083 0 804 2 7 10 4 28 8 14 790 43 96018 9 7 540 11 490 6 49 2 8 96 1 1 356 189 1.023 0 .700 • 950 20 9 70 13 900 39 42019 78 720 26 660 5 856 11 0 60 1.28 5 20 3 0 820 0 730 4 44 3 25 0 20 12. 130 4 1.77020 6 1 600 53 750 5 16 1 8 .54 5 1 2 16 0 7 1 0 650 0 6 7 1 3 284 26 960 12 640 40 64 0
F2 1 54 460 6 1 040 5.2 15 6 734 1. 150 26 7 0 60 8 0 .53 5 3 352 22 100 36 090 39 .98022 63 490 58 720 6 .32 2 5 394 1 140 086 0 .474 0 499 6 60 1 25 .940 50 240 36 09013 64 0 10 SO 420 2 1 750 4 .56 5 1 08 7 0 944 0 394 0 484 7 99 1 30 380 4 1 770 36 53074 6 1 300 40 3 10 55 180 3 89 4 1 036 1 00 8 0 52 2 0 492 5 34 6 4 1 0 70 31 940 47 6 7025 52. 170 3 1 2 70 56 620 3 .33 2 0 .98 5 1 157 0 506 0 .377 4 209 58 760 23 800 46 .430
26 43 50 0 23 340 53 290 3 0 34 0 935 1 70 1 0 43 5 0 36 1 3 906 45 4 80 17 9 70 39 9802 7 39 460 17.950 43 290 2 809 0 886 1 144 0 42 1 0 294 6 43 1 30 940 25 720 29 3 1028 42 030 14 920 3 1.2 10 2.66 8 0 838 1 183 0 359 0 40 5 15.720 32 .750 3 7.2 10 22 92019 55.660 13 280 2 1 850 2 550 0 .746 0 698 0 329 0 .520 15 890 40 520 28. 140 34 .32030 58 250 15 700 2.4 25 0 .746 0 72 7 0 49 5 0 8 16 16 0 70 37 360 26.520 32.2503 1 56 150 12 420 0 746 0 688 0 827 26 590 23 930
Average . 56 720 44 750 16 .7 10 7 103 . 1.368 1 454 0 859 1.588 5.5 10 17 920 2 7 630 35.220Lowest 29 150 11 490 5 16 1 2 425 0 746 0 698 0 .329 0 .294 1.55 9 3 188 12 130 13. 170Highest 9 7 540 89 2 10 56 620 17 4C0 2 43 7 3 280 3 154 9 63 1 16 0 70 58 760 60 06 0 53.850
Peak flow 10 1.500 9 1 930 5 7 630 22 760 2 575 10 290 3 560 10 .980 19. 170 65 350 64 830 . 56 800Day of peak 18 8 25 5 I 8 13 3 29 25 9 15MontNy to tal i0 14 14 4 1 0 J n n 15 1.90 112 10 44 75 18 4 1 3 6 7 3 77 2 30 4 25 14 28 4 7 99 7 1 6 1 94 32
Runoff trtim) 160 118 4 7 19 4 4 2 4 15 50 75 99Rainfall (mml 185 10 7 55 34 26 43 49 55 8 7 104 100 104
M U M Avg 32.540 25 M O 22 140 10 950 8 68 1 5 886 3 208 5 174 9 008 16 700 2 7 7 10 30 170flow s Low 17 4 70 13 0 30 8 362 3 39 9 1 435 1 03 1 1 048 0 .686 1.94 5 2 00 3 8 85 7 10 2 70
(year) 197 1 19 79 1973 19 74 1980 19 75 1975 1975 1972 1972 1983 197 1High 4 7.630 52 550 42 850 29 0 50 19 .8 10 17 480 7 328 12 880 20 200 3 1 960 52 220 50 660Nem) 1975 19 77 198 1 1972 1983 198 1 1972 1979 1974 19 76 1970 1976
Runoft Avg 92 66 62 30•
24 16 9 15 25 4 7 75 85Low 49 33 24 9 4 3 3 2 5 6 24 29High 134 134 12 1 79 56 48 2 1 36 77 90 142 143
Rainfall Avg 10 7 78 85 49 64 59 62 68 93 92 103 95Low 64 28 33 ' 14 19 19 17 15 9 49 38 30High 146 158 142 84 124 11 1 115 124 153 168 146 164
Sum mary st at ist ics Fact ors ef fect i ng flo w regi me1984
For 1984 F or record As % of
Mean flo w tmFe- 18 0 10Prec eding 1984
16 450Pre •1984
109• Natural to w ithin 10 % at 95 percent ile flow ,

94 H Y D R O L O G IC A L D A T A : 1984
0 3 9 0 0 1 T ha m e s a t Kin gs t o n / Te d d in g t o n 19 8 4
St at is t ic s o f m o n t h ly d at a f or p re v io u s re c o rd (Jan 19 83 t o On 19 83)
S t a t ion d es cr i pt io nUlt raso nic ga ug ing st at io n inst a lled at K ing st o n in 19 75 Earl ier d at a deriv ed f ro m t he Ted d ingt o n gau ging st at io n - a lo w f lo w gauging w eir w ithadi usl ab le crest 2 1.3 m broad , tw o ro ller sluices each 10 .7 m broad . 3 5 v ert ically lift ing gat es t o ta l bread t h. 68 .2 m . and 34 radial ga t es eac h3 0 7 m broad Nat uralised /l ow s are det erm ined by t aktng ac c ou nt o f ab st ract oo ns to r pub lic w ate r su p ply

R I V E R F L O W D A T A 95
Part ( ii ) — the monthly fl ow data
T he introductory information (measuring author ityetc.) is as described in Part ( i) .
Hy drometric statistics f or the y ear
The monthly average, peak fl ow, runoff and rain fallfigures are equivalent to the summary informationfollowing the daily mean gauged discharges in Part(i). Because of the rou nding of monthly runoffvalues the runoff for the year may diff er slightlyfrom the sum of the individual monthly totals.
Monthly and y early statistics f or prev iousrecord
Monthly mean fl ows (Average, Low and High) andthe monthly rainfall and runoff fi gures are equiva-lent to those presented in Part (i). Again, due to therounding of monthly runoff values, the averagerunoff for the year derived from the previous recordmay differ slightly from the sum of the individualmonthly totals. T he peak fl ow is the highestdischarge, in cubic metres per second, for eachmonth. For many sta tions the archived series ofmonthly instantaneous maximum fl ows, from whichthe preceding record peak is abstrac ted, is incom-plete, part icularly for the ear lier years, and certain ofthe peak fl ows are known to be of limited accuracy.An examination of the quality of the peak fl owfi gu res is underway and significant rev ision may beexpected as this review proceeds. T he fi gu res are
published primarily to provide a guide to the range ofriver fl ows expe rienced throughout the year at th efeatured gauging stations.
Factors aff ecting f low regime
Code let ters ar e used as desc ribed in Part ( i)
Station ry pe
T he station ty pe is coded by the list of abbreviationsgiven below- two abbreviations may be applied toeach stat ion relating to the measurement of lower orhigher fl ows.
CB
CCEMEW
FLFVM IST PUSVAVN
Broad-crested weirCrump (t riangu lar profi le) single crest weirCompound broad-crested weir . T he com -pounding may include a mixture of typessuch as rectangular profi les, fl umes and fl atVs and with or without divide wallsCompound Crump weirElectromagnetic gauging stationEssex weir (simple Crump weir modifi edwith angled, sloping, triangular profi le fl ank-ing crests) in trapezoidal chan nelFlumeFlat V triangu lar profi le weirMiscellaneous methodRectangular thin-plate weirUltrasonic gauging stationVelocity-area gauging stat ionT riangular (V notch) thin-plate weir

96 H Y D R O L O G IC A L D A T A : 1984
0 0 4 0 0 1 Co n o n a t Mo y B r id g eMeasuri ng aut ho ri ty HRPB Grel ref erence NH 4 8 254 7First year 195 3 Level stn (rn OD) 10 0 3
Hy d rom etr ic s t at is t ic s for 19 8 4
J AN FEB M A R APR M A Y JUN J UL M X ; SEP GC 1 NOVFlow s A vg 102 200 86 660 66 8 10 3 1 750 38 680 11 330 I I 790 12 330 19 750 38 120 65 890
Im 's- ' ) Peak 694 00 116 40 123 40 139 70 5 7 78 16 10 22 90 I S 58 5 1 2 1 85 42 153 10Runo f f In iml 285 12 6 186 86 108 33 33 34 53 106 178FUEnfall Im m l 30 1 169 139 10 1 30 6 7 52 42 18 7 147 193
M ont h ly and year ly st at is t ic s for p rev io us rec ord (Oct 194 7 to Dec 19 8 3— In com plet e of ma t ing mo nt hs t ota l 5 7 years)
Mean Avg 65 3 10 56 80 0 54 / 30 4 1 0 20flow s Low 3 1 690 75 8 10 18 6 70 13 940
(rn i s - ' 1 High 138 300 12 1 000 127 900 75 730Peek now (m' s '1 409 60 46 7 10 36 2 90 203 90Runo ff (rnm) 182 144 152 i l lRainfal (nun)* 188 117 145 4041 1953 . 1983) .
Fact ors afr ect ing fl ow reg im e HStat ion ty pe V A
0 0 7 0 0 2 Fin d h o rn a t For r e sMe as uring aut ho ri ty HRP13First yea r 195 8
Hy dro m et ri c s tat i st ics for 19 8 0
3 1 10010 94053 05073 7 20
8 710 7
JA N • EB M AR APH MA T J UNFlow s A vg 7 5 9 20 78 6 60 2 2 110 2 7 40 0 7 59 3 4 098
Irn1s 11 Peak 16 7 70 83 23 109 20 96 95 19 58 9 16Runo ff Imml 89 92 16 9 1 26 14Rainfa ll gon g 134 76 7 1 29 22 49
M onth ly and y ea rly st at i st i cs f or prev io us rec ord (Oct 19 58 t o Dec 1983 )
M ea n A v g 24 700 19 4 70 2 2 6 10fl ow s Low 9 429 5 25 9 8 6 15
en ' s- ) High 5 1 190 44 700 54 3 20Peak now En Ts ' / 3 6 1 10 53 7 70 4 10 0 0Runo f f un mI 8 5 6 1 77Rainfal l Irn m / 102 6 3 8 2
Fact o rs af fecting flow reg im e NStat ion l ype VA
0 0 9 0 0 2 De v e r o n a t Mu ir e s kMeasuri ng aut ho ri ty NEM>E1Firs t year 1960
Hydrom etr ic s t at is t ic s for 19 84
JA N FEBFlow s A vg 2 6 890 3 2 8 40
lm 1s 1 Peak 8 2 7 1 60 86Runo ff grim l / 5 86Rainfall en tn ) 13 7 53
0 10 0 02 Ugie a t I n v e ru g ieMeasur ing aut ho rit y NERP8First year 19 7 1
Hy d ro m et ri c st at is t i cs for 1 9 84
Flow s A vglm s l Pe ak
Runo ff (m naRai nfall Imm l
J AN13 2 7056 71109119
FEB8 20518 04
6343
Mean A vg 7 BOO 6 529flo ws Low 2 28 5 1 99 9
unr s- ' ) Hrgh I I M O 14 320Peak flow Ini ts il 6 1 04 83 56Runo ff prim ) 64 49 .Rarit an enrn) 8 1 46
Fact o rs af fec t ing flo w regimeStat io n ty pe V A
M A R32 750143 40
9112 7
M A R
6 8352 6 / 7
56es
5 1831 59 39 29 16 7 86
4 365
APSI20 420
43 3 15524
APR3 668
6 4 12919
3 6 391 24 56 5 1630 50
2 94 8
M A Y7 82810 28
227 1
2 1 6 708 86 1
4 7 560165 20
58100
Grid ref erence NJ 0 185 8 3Level Inn (rn OD) 9 60
20 740 15 790 9 9 19 9 739 13 720 14 580 2 1 06 0 23 320 25 090 18 .40 05 560 3 836 3 32 1 2 750 2 4 78 2 86 3 3 54 7 9 30 0 8 332 11 994
54 170 4 1 9 90 4 1 900 14 650 58 840 3 7 870 49 540 39 7 10 6 1 550 2 5 4 82173 50 294 30 430 20 469 10 24 10 00 86 1 10 5 12 00 46 5 20 6 16 90 24 10 .00
69 54 33 33 47 48 72 77 • 86 74 364 74 1 7 8 4 103 99 112 1 16 106 10 82
19 84 runo ff is 10 8% of p re v io us m eanra in fall 104 %
Grid re fe rence NJ 70 549 8Level stn (m OD) 2 5 30
Juni5 72 714 3 1
1650
J UL
2 7433 83
965
J UL4 17 6
7 001262
M o nt h ly a n d y e arty s t at is t ic s for prev iou s re cord (Oct 19 60 to Dec 19 8 3)
Mew , Avg 25 710 20 140 19 730 16 9 70 13 990 8 345 7 75 7fio ws Low 5 726 5 3 76 6 735 7 460 5 3 73 3 935 2 738
(m/ s 11 Fhgh 4 5 260 38 800 37 190 3 7 99 0 46 250 2 1 7/ 0 18 950Peak fl ow en t e ' 1 2 14 50 135 20 187 10 13 1 30 506 60 254 40 7 77 50Runoff (nun/ 77 5 1 55 46 39 23 22Ren ton (mm) 82 56 6 7 63 70 6 1 74
Fact o rs af fec t ing flo w reg ime N
Stat ion Type V A
Grid re fe renc e NK 10 148 5Level st n (m OD) 8 50
M A Y2 0 12
2 4 11719
JUN1 6603 4 11356
M ont h ly and yearty st at is t i cs for pr ev io us re cord (Feb 19 71 to Dec 19 8 31
2 9801 54 25 69 127 50
155 1
2 0 340 9 134 3 7212 701652
20 720 26 9902 95 9 8 162
36 700 45 14024 7 40 254 90
58 75104 12 1
1 14 72 12
950
1 65 70 90 34 2 7423 79
1453
Au G2 64 210 60
94 1
A UG
3 69 19 521028
AuG0 8 8 7
1 387
14
1 7320 7643 796I / 9 1
1459
40 700 53 940 63 20012 5 10 23 090 24 09094 8 70 94 030 12 1 70022 3 70 324 80 4 11 80
108 150 170161 20 7 1 16
SI P3 1 15059 1 90
1032 16
SEP9 8 309 1 09
2 7135
SEP1 35 5
2 8011
100
2 0 6 30 79 13 94 03 8 80
1685
•OC T
30 4 804 13 90
104158
OCT16 39 0122 40
4 61 16
OCI3 10615 4 6
26103
1 9 8 4Catchm ent area Isci km ) 96 1 8
Ma s an (m OD ) 10 52
DEC Year84 9 70 4 7 60 7179 30 694 0 0
23 7 15 642 10 173 8
70 8 10 4 5 .50 127 9 70 29 .99 1
165 100 59 .2 3810 76 00 10 76 00
197 14 9 32 32 18 12
19 84 runo ff is 105 % of previou s meanrain fa ll 96 %
1 9 8 4Catchme nt area (so km) 78 1 9
Max art (m OD) 94 1
NOV36 480166 00
12 1174
NOV56 4 1013 6 80
153209
NO V18 35010 6 10
14622 4
OTC20 4 10
6 7 057093
OFC2 / 8 70' 3 9 90
78106
CEC10 7808 6 25
89118
4 2 16 5 965 8 24 60 86 9 1 94 2 1 4 738 0 75 10 390 13 2808 7 72 44 77 71 0035 48 6886 86 81
Year19.97459 1 90
80 41129
19 8 4Catchm ent area Is0 km ) 954 .9
Mar alt (m OD ) 77 5
Yee20 .40 2236 SO
6 7210 68
10 840 10 460 17 900 20 9 10 23 9 50 18 .38 72 578 2 90 7 2 706 6 32 2 5 184 8 .890
36 380 36 540 49 480 43 2 10 4 6 390 22 79 24 22 90 32 2 60 33 2 10 305 60 244 20 506 60
30 28 50 57 6 7 54289 8 1 94 94 86 9 1 7
19 84 runoff is 124 % of previous meanrai n/ all 116 %
19 8 4Cat chm ent area (so km) 325 0
Max al l Inn 0 0 1. 234
Y ear5.940
106.10576949
4.3303.00 36.122 .87 .7242 1793
19 84 runo ff is 13 7% of previou s meanrain fa ll 120 %
•

R I V E R F L O W D A T A 97
0 110 0 1 D o n a t Pa rk h i l lMeasuring authon t y NEW'SEwa year 196 9
Hydromet ric et et li t i es for 19 84
J A N FEB MA R APR MAY 1 1. 1Flow s Avg 28 940 46 .090 49 590 36 190 12 540 8 40 3
(rnFs ) Peak 72 43 68 49 14 1 90 63.96 18 .64 15.5 1Runoff (rnm) 6 1 9 1 10 4 74 26 17Ra ta Ov a) 142 55 137 19 19 46
M o nt h ly an d yea rly st at ist ics fo r previo us reco rd (Dec 19 69 to Dec 198 31
Mean Avgflow s l ow
lrnas - il 753hPeak flow en' s-Runoff tomeRa nfa ( a )
3 1 ) 009 453-
49 150185 90
6 798
Fact ors aff ect ing fl o w reg tmeStat ion t yp e V A
0 13 0 0 7 No r t h Es k a t Lo g ie Mil lMeasurin g aut ho ri ty TRP8First yeas 19 76
Hy dro m et ri c s tat is t i cs for 19 84
JAN FEB MAR APR MAY A MFlo ws Avg 73 8 70 36 350 38 680 34 750 8 598 4 82 2
Iml s ' ) Pea 76 89 88 3 1 169 10 10 2 20 19 93 22 88Runoff Irrirn) 813 125 142 123 32 17gao ler] en rol 20 E1 74 170 13 19 54
M ont h ly an d yea rly s t a t i s t i c s foe p rev iou s reco rd Wan 1976 to Dec 19831
Mean Avg 74 800 1 7 250 3 1 860 20 780 16 3 10 8 115flow s Low 13 770 9 795 19 130 9 0 7 1 6 179 3 684
enTs i 1 li c e 48 60 0 45 6 70 42 750 32 180 32 840 14 4 10Peak f low enTs ' 1 240 80 3 1 00 6 7 68 70 33 180 80 43 88Runoff w ine 9 1 9 1 117 74 60 29Rainfall Imm1 108 92 115 56 83 60
Fact ors aff ect ing flow reg ime NS P IStat io n ty pe CC
0 13 0 0 8 So u t h Es k a t Bre c hinMeasuring aut hor ity TRPBFirst year 198 3
Hy drom et ric st at i st ics foe 19 84
JAN FEBFlows Avg 16 430 2 1 550
lrn s l Peak 45 8 1 72 40Runoff tra m) 90 110Rainfall Ira ni) 227 10 3
M ont hly and yearly st a t i s t i c" for prev ious record (Jan 198 3 to Dec 198 3)
Mean Avgflow s Low
enf a ' ) NunPeak flow frn 3sRunoff onrraRainfall brine
22 32022 32022 320
6 7 60122106
Fac to rs aff ect ing flo w reg im e N ISta tion type V A
28 .7306 846
52 550165 . 10
5559
26 9 706 58 7
461 180159 80
5 770
9 230 16 4209 230 16 4209 230 16 47026 23 4 1 75
46 9054 76
23 9 709 3 17
4 7 270132 30
4963
17 5 709 .558
35 .460110 70
3 76 7
01400 1 Ed e n a t Ke m b ac kMeasuring aut ho rit y TRPBFirs t year 196 7
Hy dro m et ri c st at ist i cs fo r 1984
JAN FI B MAR APT)Flows Avg 8 739 9 864 7 580 3 77 1
Ira ' s .1 Peak 30 66 30 9 1 54 89 9 49Runof f ra ve) 76 80 66 32Rainfall Invn / 144 4 4 120 13
Grid re fe rence NJ 8 8 7 14 1Level stn (m OD) 32 441
11 940 10 1606 773 4 335
24 770 2 1 34057 00 119 .3024 2 156 66
Grid ref erence NO 6 99 640l eve l stn (m OD) 10 .60
Grid re ference NO 600 596Level st n (m OD) 18 00
MAR APR MAY JUN25 730 20 690 6 .529 3 576
98 9 1 44 39 14 46 15 1914 1 109 36 19185 15 24 46
Grid ref erence NO 4 15 158Level stn Im 0 0 1 6 .20
M on th ly and yea rly st at i st ics for prev io us rec ord (Oct 1967 to Dec 19 83)
Mean Avg 6 633 6 34 3flow s Low 2 546 2 170
en' s- ) fragh 10 890 19 460Peak flow (rn i sT I) 59 05 71 3 1Airmail (In n) 58 50Ra nfal l Imne BO 58
Factors aff ec ting flo w reg im e NS GEISta tion t ype V A
4 850408
8 09638 34
4260
3 3 13 3 13 11 199 1 4066 480 8 33 528 27
284 1
4 7 482768
2 19710 776 65 14 1 93
1952
A A6 65 111 53
1463
fi JL2 .994
4 901154
5 62 13 4 189 36 212 892 169
JUL1 7 122 70
9
1 40 20 9 142 026
8 001255
AVG SEP• 713 9 355
7 20 62 1610 192 7 130
11.7703 .346
4 2 32025 1 20
2571
AuG2 6 19
7 741024
8 53 32 54 8
24 2504 0 13 175
AUGI 40 32 96a
16
10 7404 194
18. 16012 1 20
2276
SEP4 76 928 86
17129
11 0404 748
2 1 66016 4939
118
SEP3 59 824 35
19133
OR15.32066 76
3299
2 1.5503 63 1
60 58034 7 20
45as
CCT11 46096 55
46128
32 7605 69 1
80 4 109 7 64120154
OCT8.92240 8 1
49135
MAY JUN JUL AuG SEP OCT2 009 1 9 11 1 0 79 0 954 1.290 3 250
3 8 7 5 25 1 49 1 26 1 93 13 6518 16 9 a I I 2842 52 35 17 96 10 7
I 4690 7992 98315 531356
I 58 70 7493 16529 73
1373
2 99 10 8336 88035 9 7
2675
Cat chm ent area (so km ) 12 73 .0Ma x all . (m 0 0 ) 8 72
NOV86 4202 15 90
176248
20 0506 542
3 5 260158 50
4 1BO
NOV9 1 170462 10
32434 9
NOV48 150172 00
25 53 13
NOv14 45030 3 1122185
4 3 710 8308 96239 373 772
DEC4 1 560134 70
8 710 1
29 1301 95 1
5 7.440198 30
6 183
198 4 runoff is 14 1% of prevva s meanra infa ll 124 %
Catc hment area la km) 73 0 0Ma x alt (m 0 E) 9 39
DEC33 170187 70
122119
7 1 780 32 7305 28 1 70 790
39 230 59 8807 49 83 9077 120 •89 138
DEC19 13048 1310 5117
DEC7 35014 68EA68
5 4 791 73 1
10 73043 22
4872
19 8 4
y ear28 .8142 15 .90
71210 86
20 .33410.62227.66 334 7.20
50 48 7 7
19 8 4
24 .521462 1010551341
20 .13015.31424 92 7240 .80
8701157
198 4 runof f is 12 1% of prev ious meanf an ta il 116%
19 8 4Catc lv nen t area (sq km ) 4 90 .0
M ax all (m 0 0 1 9 59
Yew14 785172 .00
94 9136 2
11 5 10 24 34 0 I I 860 3 327 2 100 3 800 9 552 3 9 11 17 730 11.3 9 511 5 10 24 340 I 1 860 3 322 2 100 3 800 9 552 3 9 11 17 730 11.39 711 5 10 24 340 11 860 3 .322 2 100 3 800 9 552 3 9 11 17 730 11.397
39 6 7 59 0 7 38 20 5 24 2 70 15 49 40 94 6 2 7 82 82 82 .826 1 133 63 18 11 20 52 2 1 9 7 73483 139 79 27 30 113 10 7 28 163 100 5
198 4 runo ff is 129 % of previ ous me anrain/ all 136 %
19 8 4Catch rnen t area Isq km) 30 7.4
Max all Ins 0 1) ) 52 2
Yew5.18 754 .8953 1923
3 63 61 44 65.17671 .31373762
1984 runof f is 142 % o f prev ious meanrain fa ll 12 1%

98 H Y D R O L O G I C A L D A T A : 1 9 8 4
0 16 0 03 Ru c hil l W ate r a t Cu l ty bragg a nMeasur ing aut horit y TRP8First year 19 70
Hy d ro m etr ic st at is t ics for 19 84
JAN FEB NEAR APR mAY a l A R. AUG SEP OCT NOvFlow s Avg 8 33 8 9 659 5 60 3 5 04 0 0 645 0 993 0 23 9 0 164 2 569 10 180 16 550
Im ' s- 5 Peak 105 60 36 54 17 60 17 64 1 64 8 5 1 0 71 0 4 7 33 35 136 60 14 1 50Runof f 5nne 224 24 3 15 1 ..3 1 17 26 6 4 6 7 2 74 43 1He rt a tnine 3 15 153 134 60 56 65 35 36 190 329 329
M onth ly an d yearly st at is t ic s fo r pre v io us record (Oct 1970 t o Dec 19 8 3— incom piat e or missing months t ota l 0 .2 years )
Mean Avg 7 982 5 83 6 6 325 2 60 8 2 7/ 2 1 960 1 549 1 9 16flew s Low 3 442 - 2 38 9 1 80 2 0 75 8 0 30 4 0 40 2 0 3 79 0 2 76
en ' s .1 High 15 240 9 99 5 11 10 0 4 690 7 0 75 4 56 2 2 800 4 5 12Peak f lo w (rn' s- ' ) 250 40 130 20 165 30 6 1 2 7 165 00 22 1 30 160 00 85 89Runoff tnvn) 7 15 143 170 68 75 . 5 1 42 52Rainfall Irnml 23 5 158 173 82 120 100 110 118
Fact or s aff ec ting flow reg ime NStat ion ty pe V A
0 16 004 Ea rn a t Fo r t e v io t Br id geMe as uring aut ho rit y TRPBFirst yea r 19 72
Hy dro m et ri c s tat ist i cs for 1 98 4
JAN FEBFlow s Av g 56 590 56 5 70
Im ' s - ' ) Peak 100 00 109 60Runo ff trrvn) 194 18 1Rainfall (min) 24 1 116
Moan Avg 46 030 36 78 0flow s Low 25 00 0 16 0 70
(m2s - ' ) Nigh 85 5 10 58 640Peak flo w Im' s 5 2 77 50 2 14 60Runoff Imm) 158 113Rainfall /rnm) 163 104
Fact o rs af fecting flow reg ime P HStat ion t ype V A
0 1 7002 Le v e n a t Le v e n
Flo ws Avgt m ' s • Peak
Runo ff Imm) -Rainfall Imm l
JAN15 9903 7 4910 1149
FEB16 18034 33
9660
Mean Avg 10 260 9 539 6 94 7lkow s Low 4 78 1 2 08 2 1 54 3
Imas- ' ) High 20 700 22 66 0 11 240Peak flew on ' s 5 5 1 59 128 00 36 54Runoff Imm ) 65 55 44Rainfall Imm) 89 6 1 71
Fac to rs af fec ti ng flow reg im e SFI ElStat io n ty po V A
0 170 0 5 A v o n a t Po lm o n t hil lMeasuri ng aut ho rit y FRPBFirs t year 19 72
Hydro m et ri c st at is t ics for 19 84
Flo ws Avgfrn' s - ' ) Peak
Runoff fmm)Rainfall Imm)
Mean Avgflow s l ow
tm' s .1 HighPeak flo w Im' sRunoff Imm)Rainfall Inun )
6 4263 56 6
10 86063 78
88103
Fact ors af fec ti ng flo w reg im e ElStat ion ty po V A
4 3 702 34 78 32 14 1 BO
5560
NEAR38 490119 30
132126
36 49012 3 1058 620194 10
125138
MAR9 5 7 139 19
60119
4 55 11 6658 49350 99
6286
APR26 5 70
06 108839
17 6 708 389
78 960104 50
5950
APR MAY5 74 3 2 66015 3 7 8 20
35 172 1 5 1
2 36 9 1 6230 96 2 0 .7394 945 2 48 13 1 63 23 56
3 1 224 7 6 1
Grid ref erence NN 76 4 20 4Level stn (rn OD) 6 2 29
God ref erenc e NO 04 3 184Level St n OD) 7.84
MAY JuN7 53 3 5 30014 2 1 17 39
26 1846 55
M o nt h ly and y ea rly st at is t ics fo r prev io us record (Oct 19 72 t o Dec 19 8 3)
14 3 704 906
33 520155 20
4984
10 0 504 09 5
20 0 70114 90
3371
M easuring aut ho ri ty FRPB Grel ref ere nce NO 36 900 6Firs t year 19 70 Level st n Im OD ) 4 05
Hydro m et r ic s t at i st ics for 1 9 84
M o nt hly and y ea rly st at is t ic s far pr ev io us rec ord (Aug 1969 to Dor 19831
Grid re fe rence NS 9 5 2 79 7Level stn (m OD) 4 2 7
JAN FEB MAR APR MAY Ju N9 632 9 09 1 4 034 1.52 1 0 8 10 0 95 185 34 58 52 2 7 3 1 3 .28 1 6 7 2 84132 117 55 20 I 1 13170 90 85 19 26 62
M o nt h ly and y ea rty st at is t ic s for p rev iou s re cor d (Oct 197 1 to Dec 1983)
1 34 60 6492 88423 94
1860
-AJL AuG SEP2 65 7 2 456 5 30 1
3 43 2 99 29 359 8 18
32 2 7 149
6 785 7 7 17 19 8203 8 78 3 54 5 6 93 8
1 1 05 0 16 530 36 70065 62 95 24 2 71 8023 26 6677 89 164
Ju N Jut. Au G SEP OCT2 56 5 I 40 7 1 710 1 90 8 5 1424 3 7 3 00 2 83 5 28 2 1 1716 9 I I 12 3253 3 7 3 1 116 144
JUL0 570
1 598
35
0 76 10 66 71 06912 3 7
1056
AUG0 635
I 279
43
0 9840 54 11 98612 4 7
137 1
OCT30 280200 GO
10422 7
SEP OCT1 59 5 6 8007 62 5 7 602 1 93
130 165
2 4480 6 195 5 7649 09
32100
Catclv nen t area (sq km ) 99 .5M ax alt (m 0 0 ) 98 5
NOV89 7503 14 20
29 732 7
29 770 40 1905 984 15 120
59 340 70 37023 5 90 326 BO
10 2 133143 164
DEC10 3 707 1 652 792 ' 6
4 9 17 5 885 7 35 1 7 134 4.6830 34 5 0 789 2 306 1 630 3 .28 1
10 260 12 130 11 360 11 660 8 .58 822 7 30 130 50 183 30 160 70 250 .40
128 158 19 1 197 148 520 6 199 24 1 225 1987
1984 runo ff is 125 % o f previous meanrain fa ll 98 %
DEC53 88015 1 70
184143
4 1 93015 0 6064 5507 19 80
144160
1984
Year5.863
141.5018551918
19 84Catchme nt area Is(' krn) 78 2 2
Max alt (m OD) 98 5
Year3 1.2 8 1314 .2012591528
25 55 116 50 834 .59 7328 6010 3 114 0 7
198 4 runoff is 122 % of previou s meanrain fall 109 %
Catchm ent area (so km) 4 24 0Max all fro OD) 522
NO V
26 5 1056 76162233
19 84
CEC Year15 430 8.7352 7 77 56 78
97 64892 1108
4 129 3 235 2 69 1 I 497 2 393 2 792 5 460 7 58 2 9 80 1 5.5101 4 13 2 0 12 1 166 0 90 2 0 82 2 0 9 70 0 795 0 9 72 3 46 2 2.2898 835 6 6 12 6 52 1 1 123 4 84 1 5 6 16 I 1 000 14 570 19 200 7 60626 4 1 13 6 7 26 93 5 34 24 7 1 25 39 40 00 39 76 62 69 128 .00
25 20 16 9 15 17 34 46 62 4 1045 62 62 58 66 86 84 94 89 86 7
19 84 runoff is 158 % of previo us meanrain fa ll 128 %
4 1380 6 708 10076 7557
100
Cal cIvn ent area (sO km) 195 .3Ma x alt Im OD) 3 12
NOV12 30090 2 7163197
5 E1841 3 70
10 6305 7 74
78112
1984
OCC Year6 35 1 4 52435 88 90 27
87 72994 1116
5 843 3 .39 22 300 2.060
10 120 4 .52868 95 78 .75
80 54 8105 98 1
1984 run of f es 133 % of prev ious meanrain fa ll 1 16%

R I V E R F L O W D A T A
018003 Te it h a t Br id ge o f Te it hMeasuri ng authoo ty FRFSFust year 195 7
Hy dm m ehi c st at i st ic s fo r 19 84
JAN FEB MAR APR rAAYRow s Avg 43 420 39 .620 17.770 15 930 4 99 7
On' s - 11 Peak 2 10 60 73 39 39 )4 38 33 8 0 4Runoff Unm4 22 4 192 92 80 26Ftso la tmenl 33 1 166 102 69 25
M o nt h ly an d year ly s tat ist ics for previo us recor d (Oct 1963 to
Mean Avg 34 6 10 16 0 10fl ows Low 14.360 (2 880
(rn ' s- t) (Ugh 72 430 4 1 340Peak now Im' s ) 30 3 90 20 7 40Run o ff enna 179 (2 1Ba n ta lawn) 21 5 140
Fact or s aff ec ting fl o w reg im e S P
Stal k' ', tYPe V A
018005 A l l a n W a t e r a t B rid g e o f A l la nM easuring aut ho ri ty FRP8First year 19 72
Hydrom et ri c st at is t ic s for 19 84
26 7606 8 13
60 190176 00
138166
M ont h ly and yea rly st at i st ics for pr ev io us re co rd (Jul 1971 t o Dec 1983 1
Mean Avg 10 610 7 89 7 8 26 1Bo ws l ow 6 4 7 1 4 793 3. 152
On' s ' ) mo n 18 550 12 960 13 3 10Peak flow W s ' Il 96 20 67 84 70 98Runo ff en ne 135 92 10 5Ranfall p n ni l 14 1 90 113
Fact ors aff ect ing fl ow reg irne N IStat ion ty pe VA
14 0505 6 12
25 0 3089 2 1
70se
J A N U R M A R A PRFlo w s Avg 15 330 16 6 10 7 3 76 4 0 15
(mTs ) Peak 84 59 56 10 39 8 7 10 8 7Ru no ff Imml 196 198 sat soRen tal (nen) 2 19 as 103 32
14 7704 0 17
33 160158 00
76125
mAY1 5885 4520
02 0 0 0 1 Ty n e a t Ea s t Lin t o n
02 1006 Tw e e d a t Bo le s id eMeasuring autho nt y TW RPFirst year 196 1
Hy drom et ri c s tat is t ic s for 19 84
J A N FEBFlo w s Avg 68 380 8 1 860
(ni Fs ) Peak 333 20 374 70Runoff Imml 122 137Ren tal (min ) 2 11 86
Mean Avg 54 3 10 43 320fio ws Low 14 300 10 480
(m1s- ' ) High 110 700 70 0 10Peak flow (mrs ) 6 78 60 483 90Runoff (rnm) 9 7 70Rainfall M IT ) 119 83
Factors aff ec ting flow reg im e S PStatio n ty pe V A
M A R48 740130 90
8 7122
A PR2 2 900
48 56ao2 1
Gn i referencer NN 7250 11Level stn (m OD) 14 .70
God ref erence 11.5 786980Level stn (rn OD) 11.20
M A Y
9 8 1717 52
1832
• tx55 00 5 3 780 3 136
8 43 6 .76 5 3215 10 1684 3 7 55
Dec 198 3— mco mplet e or mo s s
10 4 703 953
2 1 52016 1 70
52509
JUN1 4646 3 71857
j ft I8 92740 15
is6 7
M on th ly an d yea rly st at i st ics for prev io us re co rd (Oct 196 1 t o Dec 19 8 3)
8 5970 35 1
15 90074 1244
102
Jut0 726
0 969
23
9 83 83 2 18
18 46088 .35
5 1115
Measuring Ou l hOr it y FRPB Grid ref erenc e NT 59 176 8First yea r 196 1 Leve l st n (rn OD) 16 50
Hy dro m et r ic st at is t ic s for 19 84
J A N FEB M A R APR M A Y A JOI J UL Au G SEPFio ws Avg 5 193 6 770 7 778 3 799 1.729 I 522 0 49 2 0 48 7 0 624
1m5s- 1 1 Peak 3 1 23 30 60 43 1 8 1 2 28 2 14 1 6 82 0 78 0 79 I I IRuno ff (mm ) 45 55 68 32 15 13 4 4 5Reinfel (nun ) 108 33 120 15 33 64 34 2 7 72
M ont h ly and yea rly st at i st ic s fo r prev iou s rec o rd Wen 196 1 t o Dec 198 31
Me an Avg 4 58 2 3 792 3 84 8 2 50 1 2 5 77 I 524 1 104 I 599 1 638flow s Low 1 032 0 783 0 53 1 0 64 4 0 926 0 58 6 0 500 0 468 0 46 1
(m7s - il sig h I I 540 8 624 8 789 6 158 I I 600 6 142 4 39 3 9 855 6 7 11Peak Bow (rn1s 11 93.02 39 39 66 17 33 39 119 70 59 12 70 18 112 70 73 34Runoff (mml ao 30 34 2 1 22 13 I I 14 14Rent a l (mm) 62 42 55 45 62 52 58 77 69
Fact ors aff ect ing flow reg ime ElStat ion t ype VA
Grid reference NT 49 8334Leve l st n (m OD) 94 50
A R6 363
9 7 11137
AuG0 649
0 808
28
AUG5 798
9 7 11039
O P OCT NOV12 080 32 960 59 .34056 .74 180 30 236 80
60 170 29 7199 32 1 38 1
ng mo nths t otal 0 .1 years)
19 6 703 635
3 7 940184 10
se20 2
SEP1 58 87 0320
130
sEP40 7
2 1 3815
102
OCT8 45 576 33108230
2 1980 45 17 00082 7 12069
OCT26 320
98 044 7
137
Catch ment area (so km) 5 19 .0Ma x at . (In 0 0 )' 116 5
2 7 400 32 .9305 89 7 12 0 20
66 4 10 58 0 90142 60 24 5 10
142 1652 13 1 19
198 4 runo ff is 112% of previ ou s meanratnf all 106 %
Catch ment area (sq km) 2 10 0M ax alt (l n OD) 633
NOV17 760
70 562 19258
3 9 74 3 504 2 64 3 1 6 5 1 2 22 7 4 759 6 824 9 0 11 9 575 5 .9061 654 1 189 0 94 5 0 98 9 0 6 79 0 90 7 0 9 7 1 3 647 3 709 •. 4 .2706 6 18 7 435 5 423 2 320 5 92 1 9 2 18 12 420 13 710 10 060 v 7.4 5132 65 72 11 55 39 44 65 55 83 84 13 79 68 9 7 89 112 60 112 .80
49 45 33 1 1 28 59 8 7 I I I 122 WM56 80 72 72 80 13 1 125 139 14 1 1240
1984 runoff es 120 % of previou s meanrain fal l 109 %
Catchm ent area (so km ) 30 7 0Max all Im OD) 528
O CI NOV0 79 1 10 0 70
3 64 127 5085
64 18 1
3 5760 .52 4
11 2 50 .64 8 1
3070
NOv100 5003 7 1 70
174235
GEC4 7.720178 90
24 7253
30 .38011.79062 45024 1 10
15720 3
DFC Year9 952 7 12 840 23 84 .59127 10 6 7123 134 6
GEC3 69 619 90
3148
99
1984
Yeas23 8 1323 6 80144 920 23
2 1.27615 .0942 7.79530 3 .9012 9619 0 7
1984
1984
Yes3 .579
127.50388798
3 682 2 .7320 58 2 0 .7098 40 5 4 .14652 02 119.7032 28 160 72 1
19 84 runoff is 130 % of previou s meanrain f all 111%
1984Catchm ent area (so km ) 1500 0
Max al l IM O D / 939
DEC51 06 012 1 50
9310 6
Year38 6 73374 .70
7681195
43 620 28 690 25 0 20 16 380 13 5 10 19 310 28 94 0 4 1 500 49 8 10 50 460 34 .54 714 930 9 896 7 605 7 4 13 6 900 5 0 12 4 5 72 4 43 5 11 570 22 450 18.578
10 1 000 5 7 330 64 .330 32 820 3 1 960 44 750 63 090 96 720 119 80 0 86 540 44 .3234 70 10 24 8 90 182 80 126 00 342 60 .444 30 385 10 10 19 00 48 6 30 5 18 10 10 19 .00
78 50 45 28 24 35 50 74 86 90 72 79 7 69 88 76 83 100 12 1 122 113 113 1196
1984 runoff is 106 % of previou s meanrain fa ll 100 %

100 H Y D R O L O G IC A L D A T A : 1984
0 2 10 12 Te v io t a t Haw ic kMeasuring aut hor ity . TW RPFirs t year 196 3
Hy dro m et ric st at ist ics fo r 1984
Mean Avg 13. 180flow s Low 6 98 1
(rn' s- ' ) Nigh 28 .560Peak flow On 1s ' ) 185 90Runoff (mm) 109Raueal (nun)
Fact ors af fec ting flo w reg im e NSta t ion ty pe V A
Me asuring aut ho ri ty TW RPFir st year . 19 68
Hy dro me tr ic st at is t ic s for 1984
Mean A vg 4 765Bow s Low 1 682
(ref s ' ) M gt, 8.774Peak flow fm1s - ' I 4 7 50Runo ff (mm ) 73Rainf all (run ) 8 7
Fact o rs aff ect ing flow reg ime S PStat ion ty pe V A
Measuring aut hor ity TW FtPFirst year . 196 9
Hy dro m et ric st at i st ics fo r 19 84
Flow s Avg(m3s - ' ) Peek
Ru no ff Imre)Rawfall (min)
JA N10 16048 04
54129
10 3704 .234
18 5 10228 60
7877
3 98 52 1565 7 1328 83
5558
FEB18 8 10106 60
9434
9 8302.99 1
20 250142 00
8299
3 5821 35 77 32527 65
5578
MA R14 950110 20
BO13 1
Mean Avg 11 110 10 450 9 .4 4 7f low s Low 2 143 1.55 7 1.108
(mrs- ' ) High 25 .990 2 7 300 19 220Pea Row irni s il 26 5 90 160 90 133 .90Runo f f (rnm ) 59 5 1 50Ramfall (m m) 78 56 71
Fact ors af fecting Do w reg im e S P
Sta t ic° ty Pe CC
5 6662. 189
10 75086 0 3
4564
2 452127
5 0282 1 46
365 1
Moa n A vg 4 526 3 850 3 820 1 880flow s Low 0 587 0 39 6 0 .24 5 0 .359
Ou ts - 5 High 10 150 7 99 7 1 1 090 4 52 7Peat flo w en ' s - ) 146 60 59 52 150 20 33 00Runof f imm l 45 35 38 18Rainfa ll (mm ) 84 4 7 6 3 4 1
Fact ors af fec t ing fl ow reg im e EStat ion ty pe FV
APR MA Y7 258 2 5 1918 6 1 4 10
3 7 1314 23
Grid ref erence NT 52 2 159Level stn (m OD) 90 10
JA N FEB M AR APR M AY A INFlow . Avg 19 220 17 0 30 7 20 8 3 667 1 296 1 59 7
lm ' s- il Peak 169 40 143 . 10 25 34 8 73 8.90 23 03Runoff Ov a l 159 132 60 29 11 (3Rainf all Imm) 199 69 92 15 32 63
M ont h ly and yea rly st at ist ics fo r prev io us reco rd (Oct 1963 t o Dec 19 83)
5 7 101 3 19
17.34098 .3 1
9 1
02 1 0 1 8 Ly n e W a t e r a t Ly n e S t a t io nGrid ref erenc e NT 20 94 0 1Level stn (m OD) 168 00
JA N FEB MA R APR MA Y JUNFlow s Avg 6 306 0.69 7 4 9 79 2 28 9 1 143 1 056
(m3s- i) Peak 24 79 4 1 55 15 94 5 16 1 46 • 03Runo ff (mm) 9 7 125 76 34 18 18Remit° (min ) 153 80 108 22 3 1 59
M ont h ly and yea rly st at is t ic s for pr ev io u s record lOci 1988 t o Dec 1983)
I 8020 8824 10417 362865
4 1641 099
10 .5008 1.143381
1 4 100 78 72 65316 462 162
M ont h ly and yea r ly st at ist ics fo r prev iou s recor d (Sag 198 9 to Dec 198 3)
1 524 0 6880 2 12 0 17 74 9 4 8 1.89 538 86 3 1 54
15 760 54
JUL0 75 1
3 376
4 1
022 006 B ly t h a t Ha rtf o rd B rid g e
2 8670 9648 16399 33
2480
AA AUG SEP OCT0 1 14 0 62 7 0 / 63 1 632
1 10 1 0 8 2 36 (0 3 711 10 I I 2539 33 95 116
1 0 330 7241 624
. 11 901563
0 2 10 2 2 W hit e a d d e r W a t e r a t Hu tt o n Cast l eGrid ref erence NT 8 8 15 50
Level stn. (ro OD) 29 00
JUN JUL Au03 0 10 1 4 80 1 4 7935 74 3 08 3 ( 5
16 a 8se 43 38
6 .355 5.64 2 3.456 1 9 50 2.284 2 3 12 5 157 6 .550 8 53 3 8.08 71 325 2. 113 1 40 3 1 3 15 1.162 0 990 1 00 1 1.100 1 34 7 1.828
14 980 24 0 50 8 83 5 2 486 6 7 14 4 322 16 6 70 13 5 70 70 660 8.49476 65 226 20 64 98 25 70 79 00 43 20 190 00 186 00 108 . 10 26 5.90
33 30 18 10 12 12 2 7 34 45 382it Ei 68 57 53 62 68 74 68 72 775
198 4 ru nof f is 133 % of prev iou s meanram ie 1 14%
Me asuring aut ho rit y NW A Grid ref erenc e NZ 24 3 800F ir s t year 196 6 Level si n (m OD) 24 .50
Hy dro m etn c st at is t ic s for 1984
JA N FEB MA R APR MA Y A IN A A. AuG SEP OCT NOV CECFlow s Avg 5 325 5 132 4 26 8 1 277 0 .3 19 0 3 12 0 096 0 12 7 0 26 9 0 24 5 5.735 1 80 2
fin i s 11 Peak 23 96 30 22 44 4 2 5 23 0 50 1 69 0 24 0 73 1.75 0 99 29 46 4 73Runof f (m m) 53 48 4 2 12 3 3 1 1 3 2 55 18Rainfall (mm) 99 33 al 12 16 50 30 53 109 4 7 142 32
M ont h ly and yearly st at is t ics fcw pr ev io us reco rd (Oct 1966 t o Dec 1983 - incomplete or missing mon t hs t ota l 0 .3 oars)
0 3 780 1081 242
7 604
54
Au G0 763
2 126
33
3 83 90 .7349 0 75
178 603294
1 0 750 6052 44 8i 1 631668
0 5 160 0 6 72 54 339 6 1
564
SEP1 38 46 6 31 18 9
6 0 5 50 9 15
13 7 70(8 5 60
491 10
1 5300 59 13 13918 6 82393
SEP1 3 292 85
778
0 6 6 70 10 71 6 9 530 0 2
66 3
OCT8 9 4 38 2 98
74148
10 160 12 3300 8 16 2 .555
75 690 29 930273 40 188 60
84 99117 12 1
198 4 nanci ff is 104 % of prev iou s meanrain fal l 9 7%
2 8560 59 75 68 440 49
4 49 5
Catchme nt area (Sp km) 3 23 .0Max al t (m OD) 60 8
NOV26 640155 40
2 )424 5
Catchment area (so km) 175 .0Max alt (rn 0 0) 56 2
NOV7 98 553 60118185
4 2520 9 778 6 1150 8263
103
DEC12 76056 28106102
12 7204 52 2
2 1 9802 10 70
10 6116
1 9 8 4
Year8.438
189 .40822
1128
8.0684.18 3
10.959273.40
7881181
19 8 4
DEC Year4 0 16 3 35 1
9 79 53 .806 1 80 184 1005
4.190 2 7361 6 18 1 4288 374 3.64937 98 50 8264 49 383 90 3
198 4 runoff is 122 % of prev ious meanrain fal l 1 11%
OCT1 49 86 113
855
1.68 70 1 1 19 6 8056 84
1763
NOV1 7 6802 79 80
143227
2 32 50 1625 87369 20
2262
19 8 4Catc hm ent area (so (rn) 50 3 .0
M ax all (m OD) 533
DEC7 3 3913 98
394 7
Yew8.126
2 79.8 050688 7
1 9 8 4Catchmen t area (sq km ) 269
Ma x al/ Irn OD). 259
Year2.07644 .42242704
3 808 2.1340 .274 0 .537
12 500 3.410122 .30 150 .20
38 25066 702
1984 ru no ff is 9 7% of prev ious meanrain fa ll 100 %

R I V E R F L O W D A T A 10 1
0 2 3 0 0 1 Ty ne a t By w e l lM easun ng autho my NW AFirst y ear 195 6
Hy drom et r ic st ati st ics for 19 84
f lows AvgVw's - ') Peak
Runoff (nen)Paw l al Inan i
M o nt h ly and year ly st at i st i cs for
Mean Avg 3 64 9 3 778flow s Low 1.148 0 9 11
(rni s ' ) 169h 7 320 10 490Peak flo w On 54 99 34.46Rvnoff Ov id 40 38Rainfall (nim) 79 6 1
Fact ors aff ect ing flow reg ime PSta tio n ty pe CC
Measuring aut hor ity NW AFirs t year 19 77
Hy dro m et ri c st at i st ics for 19 84
• 8 190 749
13 .57093.73
5375
349 6080
3 1691.1496 56 153 73
3460
Gnd ref erence . NZ 038 6 17Level stn . (rn 0 0 ) Uri 00
JAN FEB MAR ANI M A Y A IN a AUG SEP OCT NW102 30 0 514 550 48 6 70 18 0 10 7 4 77 14 820 6 .928 9 .179 22.06 0 4 5 590 130 800894 60 7 14 .90 30 1.70 42 .53 11.74 189 .70 12. 18 45 9 2 182 00 28 9 .80 1268 00
126 109 60 2 1 9 18 9 11 26 se 156152 6 7 93 15 28 79 34 58 123 99 204
prev iou s recor d (Oc t 19 56 t o Oec 198 3- i no r tplet e or mi ssing mont hs fa ta l 0 .2 years )
M ean Avg 72 .240 56 .720 55 .9 20 3 7.590 28 360 18.3 10 17 840 27 9 10flow s Low 19 220 14 360 20 .250 8 46 1 7.24 6 4 .9 20 5 199 3 .40 3
OnTs ' fl High 150 80 0 98 140 150 900 75.6 20 60 650 50 0 10 48 .230 58 .0 70Peak flow On' s - ' ) 2525 00 922. 10 1472.00 852 .30 4 76 .30 440 30 758 .90 1282 00Runoff k w ) 89 64 69 45 32 22 22 34Ren tal tmen) 10 1 7 1 83 63 70 69 80 94
FaCt OI S aff ect ing fl o w regent, SStato n ty pe V A
02 3 00 7 De r w e nt a t R o w la nd s Gi l lM easuring aut ho rit y NW A Grid ref erenc e NZ 168 58 1First year 196 3 Level stn (m OD) 29 .30
Hy dro m et ri c st at ist ics for 19 84
J AN FEB mo t APR M A Y A l f J UL A UG SEP OCT NOYFlow s Avg 3 48 1 5.39 5 4 .3 22 2 422 1.116 1 148 0 864 0 905 1 036 1 008 5 0 24
(rni s- ' ) Peak 15. 15 3 1 28 18 40 6. 10 1 96 3 56 1 4 7 2 60 4 9 7 2 48 39 .29Run off lin ne 39 56 48 26 12 12 10 10 11 11 54Rainfall (mml 127 5 7 83 22 33 62 19 65 104 55 179
M on th ly an d yea rly SI B O STIO11 fo r prev io us rec o rd (Nov 19 62 t o Dec 19 8 3- Ln un ip)e t e Of missi ng months tot al 0 .1 year s)
2 4 770 9 737 85236 88
2 7
Mean Avg 23 700 2 1.280 30 0 10 15.860 12 790flow s Low 15 780 10 2 10 15 0 10 4 627
unl it - ' ) Mao 40 980 3 7 620 64 200 30 120 30 170Peak now o i l s ' ) 309 80 2 12 70 176 70 119 80Runo ff trivnl 63 52 4 1 34R4.4 1411 (no n 102) 82 60 50 70
Factors aff ec ting flow regi me GSta tio n ty pe FV
1 6980 8444 22 245 9 1
1866 63
02 4 004 Be d bu rn Be c k a t B e d b u rn
0 2 4 0 0 9 W e a r a t Che s t e r . le S t r e e tGrid ref erenc e NZ 283 5 12
Level stn trn 0 0 ) 5 50
J AN FEB M AR A PR M A Y JUNFlow s Avg 28 .290 36 850 18 530 8 684 4 385 5 0 2 1
( il i s- ll Peak 20 5.60 24 8.20 98.23 19 88 6 .59 15 95Runoff Onni ) 75 9 2 49 22 12 13Rainfall (mm) 125 56 74 14 30 62
M on t h ly an d yea rly st at is t ic s for prev iou s record ISep 1977 to Dec 198 3)
1 3 72 1 60 90 796 0 6564 08 7 4 66 719 10 60 69
15 1860 80
Measuring aut ho ri ty NW A Grid ref erenc e NI 1 183 22First yea r 195 9 Level s i n ff n OD) 109 00
Hy dro m et r ic st at is t ic s for 198 4
J A N FEB M AR A PR M A Y J UN J UL Au G SEP OCT NOVFlows Avg 2.275 3.800 1.46 9 0 66 3 0 269 0 3 19 0 152 0 188 0 42 6 0 60 4 2 883
On' s - ) Peak 14 6 7 39 16 11 12 1.50 0 33 2 39 0 19 0 73 5 0 7 3 23 9 13Runoff (aim) 81 127 53 23 10 11 5 7 15 22 100R4)&0 (nun) 162 60 73 10 22 63 19 6 1 112 6 7 150
M ont h ly and yearl y st at i st ics for pr ev io us reco rd lOct 1959 to Dec 198 3- incom plat o or min ing months tota l 0 .2 years)
A A2 94 94 58
820
1.7440 6267 26436 4 1
1974
AuG SEP3 664 6 11517 13 35 29
10 1668 115
Catchment run (So kng 2 275 .6M ax att . (m OD): 89 3
DEC Yeas48 2 10 45.71616 7.50 1188 00
59 66068 1018
33 640 47.1)0 6 1.7 10 6 7.3 10 43 .50 94 . 155 4 .72 7 18.0 90 23 .080 25.84 9
99 450 14 7 200 0 7.00 0 112 000 6 3 83 42189 0 0 1588 .00 1382 00 13 17.0 0 1586.00
40 58 74 83 6 3 19 1 94 10 2 10 2 10 20
198 4 runoff is 10 5% of pveviou s meanrain fa ll 100 %
OCT7 82335 74
2171
Catch rne nt area (so km ). 24 2 1Max alt Im OM ' 560
NOV35 8202 15 20
92173
CEC2 14 7
4 .50244 2
2 . 135 3 083 3 2550 79 1 0 .903 0 8828 971 11.780 7.82658.87 9 7.98 63 02
24 33 3668 85 78
DEC1 2332 354444
Mean Avg 2 00 3 1 71 7 1 8 70 1.292 0 946 0 570 0 424 0 53 5 0 58 1 1.194 1 489 1 794flow s Low 0 5 15 0 4 72 0 436 0 44 0 0 2 7 1 0 196 0 177 0 120 0 157 0 . 146 0 24 5 0 444
(in 1/4 - 11 Hpgh 4 34 1 4 0 11 5 128 2 750 2.23 1 2.52 4 1 0 56 1 465 1 790 • 34 6 3 .72 2 4 488Peak flow (rn i s - il 34 6 7 2 1 59 38 5 1 35 09 20 62 2 1 66 2 1 92 22 .99 32 30 38.06 34 .26 42 93Run off Prim) 75 56 6 7 45 34 20 15 19 20 43 52 64Rainfall Imml 8 7 65 74 59 66 60 63 76 73 80 89 87
CEC13 36030 99
3546
19 8 4
1 9 8 4
Year2.40539 29312M 8
2.7281.1195.5739 7.98356849
198 4 runoff is 88 % of prev ious meanrain fall 100 %
1 9 8 4Catchm en t area (so km) 74 .9
Ma x alt (n, OD) 53 1
Year1.19039.1649784 3
1.2080.66 71.63 342.93509879
Fact ors aff ect ing flow reg im e: N 198 4 runoff is 98 % of previou s meanStat io n ty pe CC rainf all 9 6 %
1 9 8 4Catchrnent area (sq km) : 100 8 .3
Ma s alt . (m OD) 74 7
Year14 .29 124 8 .20
444654
8 84 9 5 359 5.38 7 5 155 11 120 16 0 60 27.420 15.2463 945 3 780 3 335 3 .77 7 4 834 5.022 13 .230 13 .296
14 650 9.73 1 9 20 1 7 484 26 170 26 4 10 50 640 19.78 5200 80 82 .95 59 19 92 94 273 40 192 80 35 3 10 353.10
23 14 14 13 30 4 1 73 4 7776 48 7 1 68 83 8 7 117 914
1984 runoff is 93 % of prev ious meanrainf all 9 3 %

102 H Y D R O L O G I C A L D A T A : 1 9 8 4
02 50 06 Gr e t a a t R u t h e r f or d B r id geMeasur ing aut ho rit y NW AFirst year 19 60
Hy d ro m etr ic st at is t ic s tot 19 84
J AN F( B MA R APR MA Y JUNFlow s A vg 4 0 22 6 0 30 1 59 7 0 4 7 1 0 164 0 46 9
unf s ) Peak 72 3 7 86 63 38 35 1 14 0 2 7 11 49Runoff 1rnm/ 125 175 8 1 14 5 14Ra nlall fmm) 194 86 96 12 2 7 6 1
M ont h ly and year ly st at is t ics for pre v io us re cor d (Oct 1960 to On 1983)
M ean Avgf low s Low
en' s ' )Peak flow (m1s -Runo ff (m m lRen tal! (mm )
Fac to rs affec t ing flo w reg imeStat io n ty pe CC
Grid ref erence NZ 0 34 122Level si n (rn 0 0 ) 223 00
JUL0 092
0 143
23
AUG0 6 0014 38
1998
0 2 5 0 18 T e e s a t M id d le t o n i n T e e sd a leMeasur ing aut ho rit y NW AFirs t year 19 7 1
Hy d ro m etr ic st at is t ics for 19 84
Flow s A vgIm ' s 11 Peak
Runoff trn rn1Rainfal l (m m )
JA N13 35013 1 30
14824 4
r EB13 0 7014 5 00
13596
M AR9 4 7349 5510 5112
APR MAY5 590 4 29 618 90 6 2 7
60 4822 39
Grid re fe rence NY 9 50 2 50Level stn Irn OD) 2 11.20
A PI5 3 1949 46
57104
JUL4 273
684 738
AuG3 6 1130 22
4083
SEP OC T1 6 16 2 69 724 71 2 1 19
49 84138 116
SEP6 53784 98
70182
NOY5 6244 5 631692 19
M ont h ly and y ea rly st at ist ics for p rev io us reco rd (J ul 19 71 t o Dec 198 3— incomplata or missing mont hs to t al 0 3 years)
19 8 4Catchm ent area (so km) 86 1
Max alt Irn OD) 596
nr c y ear2 36 2 2.22919 57 86 .6373 8 1278 1148
3 765 2 6 19 3 2 73 2 15 1 1 39 5 0 9 11 0 656 1 232 1 528 2 528 3 320 3 5 72 2 2460 29 1 0 280 0 84 2 0 3 75 0 148 0 130 0 09 5 0 098 0 147 0 195 0 95 1 0 94 4 1 44 77 155 6 88 1 8 926 4 682 3 95 1 7 50 2 2 0 33 4 107 4 06 7 6 66 5 6 8 78 6 406 2.926
118 00 88 63 79 00 62 0 1 56 35 5 1 74 52 83 110 40 109 00 93 85 68 8 1 73 17 118 001 17 74 102 65 43 2 7 20 38 46 79 100 1 11 823117 84 99 77 80 74 7 1 92 9 7 10 3 111 118 1124
198 4 runoff is 99 % of prev ious meanrainf all 10 2%
1 9 8 4Catc hm ent area (so km) 24 2 1
Ma x alt (rn CDL 8 9 3
OCT NOV10 140 16 7606 7 84 96 45112 179205 28 1
DEC9 3 134 4 1 110 3125
Mean Avy 13 170 9 130 I 1 460 7 54 1 5 730 5 128 4 .5 13 5 55 5 6 34 9 8 658 I I 200 12 7 10flow s Low 7 0 78 1 62 1 3 955 2 6 19 2 30 7 3 186 3 119 3 09 1 2 967 4 499 5 39 5 3 80 5
W 5' ) High 19 420 16 53 0 23 880 17 8 10 10 700 10 420 5 9 18 10 440 9 590 15 0 20 19 480 24 103Peak fl o w On % 1 1 258 80 186 10 255 10 100 30 112 10 123 20 85 72 185 90 134 40 180 40 18 1 50 179 60Runoff lm m) 146 92 12 7 8 1 63 55 50 6 1 68 96 120 14 1Rainfaii (mm) 180 105 143 84 95 95 85 10 5 132 140 174 175
y ew8.478
145 .0011041531
8.4336 092
10 632258 8010991513
Fac to rs af fec ting flow reg im e SR 198 4 runoff is 100 % o f prev iou s meanStat ion t yPti V A rain fal l 10 1%
02 5 0 1 9 L e v e n a t Eas b yMeasuring aut ho ri ty NW AFirst y ua r 197 1
Hydro m et ri c st at is t i cs for 1984
JAN TER MA R APR MA YFlo w s Av g 0 33 7 0 273 0 30 5 0 168 0 124
(rn1s - .1 Peak 2 22 1 30 1 70 0 33 0 66Runo ff (nv n) 6 1 46 55 29 22Rainfa ll Imml 103 40 BB 18 59
Grid re fer ence NZ 58 508 7Level St n 1m OD) 10 1 30
JUN0 130
1 042346
M onth ly and yearly st at ist ics for pr ev io us re coed (May 1971 to Dee 1983)
Mean A vg 0 3 12 0 3 13flow s . l ow 0 115 0 100
(rn, s ' ) High 0 630 0 729Pea k flo w Im ' s - N 3 14 4 3 8Runof f trnm) 56 52Rainless Imm) 78 5 1
Fact ors aff ect ing f low reg im e NStat ion t ype FV
Mean Avg 1 483 1 35 7 1 484flo ws Low 0 486 0 48 1 0 293
en' s- if M g h 3 3 76 2 73 1 4 824Peak now an i s - i l 20 08 ' 12 93 26 58Runo ff (mm) 2 7 22 1 7Romf all (m m ) 58 39 58
Fact o rs af fec ti ng flow reg ime EStat ion t ype VA
02 502 0 S k e r n e a t Pre s t o n l e S k e r n eMe asuring au tho ri ty NW AFirst year 19 72
Hy dro m et ric st at is t ic s for 1984
0 30 2 0 2 19 0 192 0 1330 0 76 0 085 0 0 72 0 0 750 82 1 0 40 2 0 54 5 0 239
4 90 4 34 7 56 1 9955 38 35 7374 53 63 6 1
J AN FEB MA R APR MA YFlow s A vg 2 178 1 0 54 0 994 0 385 0 30 4
(m' s ' ) Peak 14 48 3 83 10 6 5 0 85 0 74RunoH (rnm) 40 18 18 7 6Re Mali (mi n) 80 18 53 10 2 7
M ont h ly and yea rly s t a t i s t i c s f or prev io u s re cor d (Dec 19 72 to
0 83 70 24 72 24519 20
154 1
Grid referencia NZ 29 2238Level st n (m OD) 6 7 50
0 7660 1992 10610 63
1455
JUL0 06 5
0 131230
AUG0 0 59
0 281159
0 112 0 120 0 113 0 185 0 182 0 28 3 0 20 60 044 0 0 39 0 0 59 0 06 3 0 092 0 132 0 .1430 189 0 365 0 53 2 0 55 6 0 324 0 54 3 0 .305
3 14 3 88 12 83 3 08 3 15 7 66 12 8320 22 22 34 37 5 1 43964 69 77 78 72 80 820
1984 ru noff is 9 7% of prev iou s meanrain fa ll 99 %
JUN JUL AUG0 24 6 0 12 1 0 195
0 78 0 26 1 774 2 4
41 19 58
Dee 1983 — ln eom p4et a of m issin g mont hs
0 5040 1121 00 416 54
956
0 38 10 1230 760
9 237
46
0 3630 0 860 732
7 957
56
SEP OCT hiCiv0 145 0 09 7 0 508
2 17 0 2 1 4 0 '25 18 89
12 7 58 14 1
SEP OCT NOV0 30 7 0 229 1 96 2
2 7 1 1 28 9 9 75 35
94 49 11 1
0 33 30 08 20 745
9 336
63
DSC0 19 1
0 32354 1
DEC0 59 5
1 5 11129
total 0 .3 yen )
0 929 0 75 7 1 5700 09 9 0 204 0 5534 290 1 6 12 4 6582 1 7 1 17 40 24 82
17 13 2958 53 64
1 9 8 4Catchm ent area (so km) 34 .8
Max alt (m OD) 3 3 5
Year0 .200
4 .014268 10
19 8 4Catchrne nt area (so km ) 14 7 0
Max alt (m OD) 22 2
Year0 .71414 .481536 10
0 .89 70 .5581 51026 .5819264 7
1984 runoff is 80 % of previo u s meanrain fa ll 94%

R I V E R F L O W D A T A 10 3
02 6 0 0 3 Fos t o n Be c k a t Pos t o n Mil lMeasur ing author ity YW AFfrst year 195 9
Hydro m etric st at i st ics for 19 84
JAN FEB MAR APR MAYFlow s Avg 0 96 1 1.765 1 26 4 0 90 0 0 775
(rrr's ' ) Peak 1.75 1.92 1.6 1 1.02 1.10Runoff Onng 45 77 59 4 1 36Rairtfat (mml 113 34 66 12 52
M onthly and yearly st at i sti cs fo r pr eviou s reco rd 10 ct 19 59
Me an Avg 0 69 5 1 155flow s Low 0 199 0 183
Righ 2 224 2.33 2Peak flow (mi s 2.89 3 3 )Runoff (nun) 42 49Rainfall (nun) 70 5 1
Fact ors af fec ting flo w reg im e NStat ion ty pe TP
0 2 6 0 0 4 Gy p se y R ac e a t B r id l in g to nMeasuring aut ho ri ty YW AFirs t yea r 19 7 1
Hydrom et ric st a t is t i c s for 1984
JAN FEB MAR APR MAY .A.. 1 JU . AUG SEP OCT NOVFlow s Avg 0 309 0 922 0 60 1 0 50 6 0 3 73 0 209 0 0 78 0 0 11 0 00 4 0 00 1 0 03 1
Imt s - ' I Peak 0 75 1 13 0 80 0 .55 0 46 0 3 1 0 14 0 17 0 11 0 0 1 C I IRunoff im m) 3 9 6 5 4 1 1 0 0 o oRanfall (mm) 124 35 7 1 12 49 30 2 1 58 131 6 1 106
M ont h ly and yearly st at ist ics far previo us record (a n 19 71 t o Dec 19 8 3— incom plet e or m issing mon ths t ota l 2 .9 years )Mean Avg 0 202 0 440flow s Low 0 0
(nos ') Fin n 0 82 7 2 04 3Peak f low (rn ts - I/ I 36 2 58Runoff Irrinn 2 4Rainfall (nv n) 72 4 7
Fact ors aff ec ting flow reg ime G ISta tio n ty pe C
02 7 0 0 7 Ure a t W e st w ic k Lo c kMeasuring aut ho ri ty YW AFirst yea r 195 8
Hydromet ric st at ist ics for 19 84
Flow > AvgOn2s- 11 Peak
Runoff ini rrnRain fall (mm)
flow s Low(ni ts ' ) High
Peas flow 1m' sRunoff Onm)Rainfall imm l
JAN48 540113 00
142224
Mean Avg 33 0204 0 39
59 59 053 7 90
9 7116
FEB48 5 10260 70
13377
Factor s affec ting flow reg im e S PSta tion ty pe B V A
02 70 3 0 D e a rn e a t A dw ic kMeasuring aut ho rit y YW AFirs t year 196 3
Hydrom etric st at i st ics foe 19 84
Mean Avg 4 6 14 5 434t ow s Low 1 94 6 I 648
(ml s ' il Nigh 7 684 14 340Peak flow im4s '1 5 1 76 56 31Runoff Imm) 40 43Ran ie ri imm) 58 57
Fac to rs aff ect ing flo w reg im e GE1Stat io n ty pe C V A
1 09 70 1741 242
2 695 156
0 7810 00 52 4 19
3 5 18
64
MAR20 5 1010 7 60
6085
0 .9840 1502 0 70
2 704552
0 7330 0 102 24 0
3 197
49
APR8 0 1815 98
2315
5 004 3 99 3 3 1301 433 1 12 3 1 30 3
10 750 8 86 6 7 3804 1 85 58 42 43 9 7
43 33 2 76 1 55 60
Gn0 re fe renc e. TA 0 9 3 54 8Level stn (m OD)
to Dec 19 83— inco mplet e or mo o
0 82 9 0 6530 174 0 1101.708 1 13 1
1.92 2 0 139 3054 53
Grid re fe rence TA 165 6 75Level stn (rn OD) 11 00
0 462 0 28 5
1 200 0 8461 56 0 985 3
54 56
A JN JU AUG0 6 16 0 4 70 0 390
0 70 0 5 / 0 5828 21 1812 24 77
0 5 180 1120 882
1 4 72456
0 146
0 4580 66
25 1
Grid ref erenc e SE 3 56 6 7 1Level s i n Im 0 0 1 14 19
MAY Jl /fr .1143 90 5 5 958 2 20 1
5 2 7 62 49 2 9411 17 639 52 18
Grid re fe rence SE 4 7 70 20Level st ri ( n CO ) 12 68
2 6 7 11 1067 29 955 58
2257
1 9 120 80 73 69 93 1 94
1650
0 40 50 10 50 6 75
0 .991964
0 0 78
0 18 40 43
162
AUG2 82 816 55
65
1 8880 .7653 0 5418 0 7
1662
SEP OCT NOV0 358 0 3 13 0 3 71
0 72 0 3 7 0 7516 15 17
116 59 10 5
ng mo nths t otal 0 .8 years )
0 33 70 10 10 56 7
0 801559
0 032 0 0 15 0 0 16
0 149 0 060 0 1080 2 1 0 13 0 17
6 1 70 60
SEP13 85014 1 60
3915 1
28 430 2 7 450 19 790 13 360 El 940 7 823 11 140 13 6903 88 6 10 250 5 6 74 3 83 1 3 024 1 42 1 1 18 7 1 450
84 770 60 330 40 980 29 500 2 1 400 16 180 3 1 600 33 03030 7 30 4 13 10 26 3 30 170 80 16 1 50 144 50 260 20 296 20
76 80 56 39 25 23 33 3983 96 79 76 73 76 88 98
1 94 10 8 735 65828 9 7
1662
OCT16 350126 40
77137
Catchm ent area (sq km ) 5 7.2Ma x att (m OD) : 164
0 328 0 4380 125 0 1480 6 12 1.84 5
1 22 2 4915 2068 74
NOV46 3 70173 40
13 1194
M ont h ly and yearly Stat i st i c s for prev ious recor d (Oct 19 58 t o Dec 19 8 3— inco mplete or m issing moo th s to t al 0 .4 ye• rs)
JAN FEB MAR APR MAY JUN JUL AUG SEP OCT NOVFlow s Avg 9 1 13 7 423 4 535 2 709 2 294 2 05 8 1 4 16 1 88 1 1 964 2 103 6 686
(m' s 11 Peet 30 .8 1 26 63 23 03 4 32 13 02 10 73 1 90 8 30 8 0 1 5 43 34 77Runoff frnm1 79 60 39 13 10 17 12 16 16 18 56Reagan 1mm) 134 54 56 12 53 36 I I 73 92 6 7 124
Mon thly and yearly st at ist ics for previous record (Nov 196 3 t o Dec 19 83 — incom plet e or missing montm total 0.7 rams)
2 46 7 3 504 4 45 70 922 1 0 29 1 24 55 171 7 63 2 10 98026 56 5 1 52 56 651 1 29 3855 72 68
1 9 8 4
DEC Year0 484 0 .7 22
0 6 7 1.9223 39 738 7 13
0 .625 0 .68 60 195 0 .15 52 .379 1.282
2 86 3.3 129 37877 734
19 84 runo ff is 105 % of previ ou s me anra infa ll 9 7%
Catchm e nt aree (so km) 2 53 .8Ma x aft (m OD) 2 1 1
DEC0 06 6
0 12
34
0 086 0 .2 720.00 2
0 36 3 0 0330 62 ' 3 .5 1
1 3479 725
1984 runo ff is 94 % of prev ious meanrain fa ll 10 1%
Catchm ent area (so km) 9 14 .6Ma x alt (m OD) 7 13
OCC24 49 0
86 3 17276
Ot C3.285
6 16283 7
1 9 8 4
Year0 .259
1.1332
73 3
1 9 8 4
Yeas20 .98 1280 .70
72 0113 3
2 1.770 18 720 37 20 3 20 .4985 856 7 0 78 11 330 12 .94 8
68 480 65 0 10 5 7 370 2 7 0 6626 6 50 208 80 28 3 20 53 7.90
64 8 1 94 70 7103 120 124 1132
19 84 runof f is 102 % of prev ious meanramf all 100 %
1 9 8 4Ca tc hm ent area (sq km) 3 10 8
Max alt (nt CO ) 3 8 1
Year3 .79 734 .7 738 574 9
3 .40 72 .10 45 .28458 4 23487 17
19 84 runof f is I I I % of prev iou s meanrain fa ll 104 %

104 H Y D R O L O G IC A L D A T A : 1984
0 2 7 03 1 Co In a a t Co ln e b r id geMeasuring aut ho rit y YW A Gm( re fe renc e SE 174 199Firs t year 196 4 l ev el stn (rn OD) 4 7 .95
Hy d rom et ri c st at i st i cs for 19 8 4
JAN FEB MAR APR MAY JUN JA AUG SEP OCT NOVFlow s Avg 13 990 11 040 2 774 1 3 7 1 0 966 1 146 0 72 3 0 83 2 1 44 8 3 0 75 10 320
1rnTs- ) Peak 70 23 82 84 14 86 2 75 4 0 1 3 .8 1 7.76 19.03 10 4 1 15.33 79 8 1Runoff 1mml 153 113 30 15 11 12 8 9 15 34 109Ren tal! Imm l 2 12 95 6 7 12 53 64 2 1 74 146 135 192
M on t h ly and yea rly st at i st i cs for
Mean Avg 6 75 7flow s Low 2 132
(mi s t ' ) Hugh 1 1 5 10Peak flow (ni ts ' f 127 00Runoff (mm) 74Rainfall (nwil ) 10 7
Fact ors eff ec t ing flo w reg im e S PG IStat ion ty pe C VA
6 74 7 6 7001 8 73 2 730
16 720 17.800124 .00 143 .00
6 7 7389 105
4 7 121 2 78
12 180155 50
50ai
02 7042 Do v e a t K ir k b y Mil l sMeasuring aut ho rit y YW A Grid ref erenc e SE 70 58 55Firs t year 19 72 l eve l stn (rn OD) 3 5 .60
Hy drom et ri c st at i st ic s for 19 8 4
JAN FEB MAR APR MAY JUN JUT AUG SEP
Flow s Avg 32 380 27 860 10 0 20 3 38 5 1 623 4 30 3 1 245 1 886 11 6 70 23 170 29 580(mi st ' ) Peak 206 40 182 70 58 84 6 38 2 90 98 99 1 84 2 1 96 197 70 118 .70 172 10
Runo ff Imm / 20 3 163 63 2 1 10 28 8 12 71 145 180Rainfall imm l 253 96 80 18 36 8 7 22 78 178 199 2 12
M on t h ly and yea rly s t at ist ic s for prev ious reco rd (Jan 1974 t o Dec 19 8 3- incom plal a or mi ssi ng mon t hs t ota l 0 .3 years)
Mean Avg 26 40 0 16 8 70Bow s Low 18 6 70 8 80 1
(mTs- i ) Ng . 32 590 28 4 10Peak flow (m1/4 1 509 00 34 2 00Runo ff (mem 166 96Ramfall Ow n) 162 89
Fact ors aRec t ing fl ow regim e S PStat ion t ype . C V A
23 3306 39 1
52.490552 .60
146140
8 .9302 453
17 50020 5 10
5466
0 2 7 0 5 9 La v e r a t Ripo n
Mean Avg 2 060flow s l Ow 1 5 19
1mTs- 11 High 2 86 3Peak flow Irn' s • ' ) 23 50Runof f frnml 63Rami s!! lmm)* 98*0 9 78. 1983 1
Fact ors eff ec ti ng flo w reg im e S PSta t ion ty pe C
1 5830 6592 20915. 76446 7
pr ev iou s rec ord (Jan 1964 t o Dec 19 83 - Incom plete or m issing mont hs t ota l 0 .4 y• n )
3 0 750 .8437 0 2493 45
348 1
8 10 31 766
16 10089 8 7
5 1S I
2 2340 6 775 5 786 7 06
2477
5 330740
9.55 )114 .70
3284
2 326 1 10 7 0 89 4 0 7 141 254 0 453 0 2 73 0 .28 33 850 1 84 3 1 88 1 1 26 422 65 15 17 11 40 16 75
7 1 33 2 7 2 1119 57 as 77
1 9 110 5986 42082 64
2 174
4 1682 0069.543
163 802672
2 1980 3695 79973 622492
0 279 0 3 790 . 189 0 1570 .480 0 84 1
6 29 11 489 12
40 8 1
2 99 10 80 7
13 7802 10 60
32105
7 570 13.3 801 143 7 9 78
17 080 23 460175 .60 24 4 90
4 7 8 1105 142
4 276 6 40 30 694 1 32 1
10 750 10 5002 72 10 12 1 50
4 7 6810 4 130
Measurin g aut ho rit y YW A Grid ref erence SE 30 17 10Firs t year 19 77 Level st n (m OD) 29 .60
Hy d rom et ri c st a t ist i cs f or 19 84
JAN FEB MAR APR MAY JUN JUL AUG SEP OCT NOVFlows Avg 3 265 3 090 1 25 9 0 54 3 0 320 0 24 7 0 098 0 09 6 0 239 0 600 2 2 74
OnTs - t) Peak 24 06 16 .85 12 0 2 1 17 0 85 1 0 2 0 15 0 4 1 4 .54 8 03 14 40Runo ff Imml 100 88 39 16 10 7 3 3 7 18 137Rainfall 1mm) 194 65 78 11 38 38 15 46 123 10 1 160
M ont h ly and yearly st at i st ics for pr ev io us rec or d (Nov 19 77 t o Doc 1983 - Incomplata or mi ssi ng mont hs to t al 0 .2 years)
0 3 100 2290 48210 2 1
977
Catch ment area (so km ) 24 5 0Ma x all (m OD) 58 2
1 9 8 4
DEC Year3 3 76 4 2 55
7 96 8 2 .8437 54 564 1135
7 7032 4 10
2 1 4 10168 00
84129
4 .6332 48 36 .6 76
2 72.1059 7
1174
198 4 runoff is 9 1% of prev iou s meanrain fal l 9 7%
Catchrne nt area (so km) 5 1.8Ma x alt (m OD) 42 9
OCT NOV
15 72084 77
9999
18 630 23 5 10 24 9906 422 8 .263 5.9 72
3 7 3 10 32 450 44 68 0370 00 40 0 00 320 30
117 143 157136 152 174
0 7520 1871 50613 Firt2389
1.22 50 4 192 40 015 0 13698
DEC
DEC0 902
3 982858
2.3050 .84 83 78639 .14
7 1144
19 8 4
Year
13.5 7020 6 .40100 01358
15 .1 1210 .48 719 .54 3552 .601 117140 3
19 84 ru no ff is 9 0 % of previ ous meanrain fal l 9 7%
19 8 4Catchme nt area (so km ) 8 7.5
Max alt (m OD)' 40 6
Year1.0 7824 .0638 792 7
1.1611.111i 13939 .144 18
1015
19 84 runo ff , es 92 % of prev ioo s meanram/all 9 1%

R I V E R F L O W D A T A 105
02 7 0 7 1 S w a l e a t Cra ke h i l l 1 9 8 4M easuring aut hon ry YW A Gr id ref erenc e SE 4 25 734 Catch men t area (sq km ) 136 3 .0Fest year . 1980 Level stn (rn OD) 12.00 Ma x alt . (m OD) 7 13Hydrometri c statrst ics for 19 84
JA N FEB MAR APR M AY JUN .RA AUG SEP OCT NOV OEC YeasFlows Avg 42 800 44 450 24 3 10 11 170 5 558 6 120 2 7 13 4 08 0 9 464 16. 110 44 280 20 .750 19 3 17(ruts 9 Peak 145 .30 187 .90 106 70 2 1.18 6 60 32 80 3.32 24 88 59 5 1 6 1 36 16 1 40 54 39 18 7.90Runo ff Own) 84 82 48 2 1 11 12 5 8 18 32 84 4 1 44 5An del (no n) 152 52 76 13 32 48 16 59 119 89 153 5 1 860M ont h ly and yea rly st at i sti ca for pr evious reco rd (-lu n 198 0 to Dec 1983)Mean Avg 38 280 19 660 38 260 2 1 2 10 17.6 70 14 180 7 430 8 28 1 9 851 24 140 25 920 32.380 2 1 4 9 1flow s t ow 25 2 10 16 4 70 24 140 7 8 19 6 468 11 790 5 .399 3 684 6 44 1 16 180 7 54 1 17 4 70 20 .292
W s ' I High 56 800 23 980 60 0 40 34 770 32 .370 17 1E10 11 130 16 2(X) 13 620 35 430 41 760 40 580 2 1.42 7Peak fl ow (m3s- ) 730 70 126 90 188 30 140 10 90 6 1 10 1 60 103 50 98.00 114 50 184 50 132 70 179 10 230 .70Runoff (nun) 75 35 75 40 35 2 7 15 16 19 4 / 49 64 4 9 7Hamra/ lov n)* 93 49 / 3 122 10 3 4 7 11 35 75 83 39 140 8 76• 1983 ontY1
Fact ors aff ect ing flow reg ime N 1984 runoff is 90 % of previous meanState n t yp e C rain fal l 98 %
02 8 0 12 Tre n t a t To ssa l l 19 8 4Measuring aut ho rit y : STW A Grid ref erenc e! SK 13 117 7 Catc hm ent are a (so km ): 122 9 .0First yea r 19 59 Level s i n (m OD) 56 40 Max alt ( n OD) 3 18
Hydrom et ric st at i st ics for 19 84
JA N FEB MA R APR M AY JUN JUL AOG SEP OCT NOv DEC YearFlow s Avg 22 23 0 25 110 12 620 8 9 16 8 146 6 75 7 5 06 5 6 44 1 6 999 7 173 22 480 15 500 12 .28 6(rn1/4 - 11 Peak 5 1 45 62 0 7 28 0 2 12 00 29 3 1 26 09 14 89 17 43 17 50 15 04 54 30 32 0 1 62 .07
Runol7 O wn) 4 8 5 1 28 19 le 14 i I 14 15 16 4 7 34 3 15Rainfa ll (no n) 88 5 1 49 8 58 52 30 5 7 E18 6 1 142 48 732M on thly and yea rly st at ist ics for previou s record (Oct 1959 t o Dec 19 83 — incom plet e or m issi ng mon t hs to ta l 0 .1 years )Mean A vg 17 9 90 17 600 14 160 I I 830 10 6 70 9 006 9 22 1 9 749 10 680 11 180 12 820 17 3 70 12 8 71fl ow s Low 6 16 8 5 88 6 6 640 4 950 5 258 4 827 3 6 11 2 48 2 4 8 74 5 62 1 5 89 8 6 424 7.404
)rn3s 1 No 33 150 48 650 33 900 24 530 25 530 12 9 10 15 520 20 230 21 650 25 893 34 800 50 310 18 1 98Peak flow (in 's ' ) 118 10 112 .70 79 18 72 31 75 20 4 7 60 52 75 115 30 77 02 66 26 83 25 126 60 12 6 .60Runoff (mm) 39 35 3 1 25 23 19 20 2 1 23 24 2 7 3H 32 5Rainlan M om / 0 54 58 56 66 6 1 58 70 74 63 71 76 778Fact ors aff ec ting flow reg im e SRPGEI 1984 runoff is 9 7% o f prev iou s mean
rain fall 94 %Sl ate r, ty 00 VA
02 8 0 1 8 D o v e a t Ma r s t o n o n D o v e 19 8 4Measuring aut hor ity - STW A Grid re fe rence SK 23 528 8 Catchme nt area (so km) 88 3 1First year 196 2 Level st n. (m OD) 4 7.20 Max alt . Im OD) 55 5Hydrom etr ic st at istics for 19 84
JA N FEB M AR APR MA Y AM JUL AUG SEP OC T NOV DEC YearFlow s Avg 2 9 520 35 380 12 7 10 8 09 7 5 747 4 862 3 48 7 3 534 4 552 6 089 2 1 54 0 14 180 12 .4 74
(m3s- -) Peak 109 10 186 10 35 82 12 2 7 9 80 9 00 5 48 7 30 14 6 1 16 56 / 3 15 39 39 18 8 .10Runof f Onng 90 100 39 24 17 14 I I I I 13 18 63 43 4 4 3Rainfa ll Kong 133 76 59 9 5 1- 5 7 2 7 68 110 75 146 58 8 69Mont h ly and yearly st at i st ics for prev ious reco rd (Oct 1961 t o Dec 1983— incomplete or m in i ng months to t al 0 1 years )Moon Avg 23 300 2 1 120 ! 8 200 14 390 12 730 9 583 8 234 8 . 160 9 134 I 1 380 16 6 70 22 130 14 560flow s Low 7 82 2 4 6 15 8 158 6 195 4 83 1 3 452 2 43 4 1 9 13 2 82 1 3 495 5 684 7 90 7 7 .65 5
on1s- ' ) Si gh 44 930 55 9 10 36 5 70 25 620 25 800 14 700 16 940 18 130 33 2 70 22 830 3 1 0 70 6 1 200 21.755Peak flow Im1s- il 18 7 60 194 60 129 70 100 30 12 1 40 7 1 64 . 111 10 10 1 90 113 90 128 00 130 80 20 2 80 202 80Runoff Imm) 7 1 58 55 42 39 28 25 25 2 7 35 49 ' .6 7 52 0Raintal (non) 90 7 1 76 6 7 78 73 66 80 85 78 94 95 953Factors af fect ing flow reg ime : SRPG 19 84 runo ff is 8 5 % of prev ious meanSta tion ty pe . FV rain fa ll 9 1%
02 8 02 4 W r e a k e a t Sy s t o n Mil l 19 8 4Measur ing aut ho rit y ST W A Grid ref erence SK 6 15 124 Catc hm ent area Isg km)ye4a1r3 8First yea r 196 7 Level stn (m OD) 4 7 70 Ma x alt (M OD)- 230Hydrom et ric st at is ti cs for 19 84
JA N FEB MA R APR MA Y JUN AA AUG SEP OCT NOV DECFlo w s A vg 7 88 1 5 771 4 .930 1 59 6 1 04 0 0 83 7 0 40 1 0 42 7 0 642 0 533 3 58 1
(m3s ) Peak 26 62 19 79 2 7 89 3 84 5 34 1 86 1 44 1 09 2 3 7 1 52 25 00Runoff )mm1 5 1 35 32 10 7 5 3 3 4 3 22Fla nlal l tro ml 88 40 59 I I 6 3 40 14 5 1 95 49 82 39 63 1M ont hly and yearly stat ist ics for prev ious recor d Niue 19 6 7 t o Dec 19 83 —incom plet e or missing mo o t hs to ta l 1.2 years )M ean A vg 5 38 1 6 108 5 130 3 .333 2.456 1 22 9 0 999 0 88 4 0 83 2 1 43 1 2 4 19 4 185 2 .85 1fiow s Low 0 959 0 6 19 0 494 0 358 0 186 0 222 0 137 0 121 0 254 0 164 0 4 18 0 745 0 92 3
(rnIs ) Ho 8 176 14 460 12 630 8 772 8 0 77 2 776 4 .54 7 3 230 5 36 7 6 89 7 7 08 7 11 850 4.396peak now (rn1s 11 39 17 50 4 1 99 82 97 0 7 5 1 83 39 17 26 88 30 44 2 1 6 1 3 1 68 50 25 52 95 99 .82Runol f Inv nl 35 36 33 2 1 16 8 6 6 5 9 15 2 7 2 / 7Ra nfall (mml ' 50 49 55 45 54 60 44 5 7 5 7 5 1 4 7 58 6 2 790 9 7 1.1983 )
Fact ors af fect ing flo w reg ime . GE 198 4 runo ff is % of prev ious meanSta t e n Pg . C V A rain fa ll 10 1%

106 H Y D R O L O G I C A L D A T A : 1 9 8 4
0 2 8 0 3 1 Ma n if o l d a t I l a mMeasur ing aut ho ri ty S I W AFirst year 1968
Hy drom et r ic st at is t ics tor 19 84
J A N FEBFlow s Avg 7 98 1 8 64 8
(m' s- ' ) Peak 38 78 74 53Runof f Inind 144 146Rad ial Irn rn) 169 100
Mean Avghew s
on, s - ' ) MyrPeak fl ow (m' s - 11Runo ff (rnm)Rainfall trnmi••11969- 1983 1
Fac to rs af f ect ing f low reg ime P EStat ion ty pe C
Measur ing aut ho ri ty . STW AFirst year 196 7
Hydrom et ric st at ist ics tor 19 84
J AN
Fio ws Avg 1 263lnl ' s l Peak 11 133
Runoff Imm ) 46Rad Vail (rnml 100
M onthly and year ly st at i s
Mean Avg 1 ' 85 1 139 I 127flow s Low 0 60 1 0 54 9 0 483
r r i s- ) Ro n 1 634 2 6 10Peak How OR ' S ' 1 24 EA 2 7 4 4
Runof f fmm ) 43 38Ran farl (may ' 76 66•( 1968 . 1983 1
Fact o rs af fec t ing flo w reg im e EStat io n ty pe C
Measuri ng aut ho rit y ST W AFirs t y e a r 198 1
Hy d ro m et ric st at i st ics fo r 1 984
M onthly and yearly st at istics for
Meal Avg 17 320 17 170fl o w s l ow 8 99 4 8 855
irri ts ' ) High 24 130 35 140Peak flo w Irrds ' ) 6 7 90 39 70Rii noff (r i m) 58 51Rainfall ( I 65 52
Fac to rs affect ing f low reg ime ElSta tion ty pe C
Meas uring aut ho ri ty ST W AFPS; year 198 2
Hydro m etr ic st at is t ic s for 19 84
Flow s Avg(m' s- 11 Peak
Ru no ff In n )
Ra in fa l (m m )
J A N3 32 714 12
4889
Fact o rs aff ec ti ng flo w reg im e EStat ion ty pe EM
FEB1 83 512 04
3943
MAR2 934
9 765365
2 10 128 64
4 1/ 0
APH M AY
1 689 0 8 / 12 82 1 3829 1610 48
M on th ly and year ly st at is t ic s for pr ev io u s reco rd (May 1958 t o On 19 8 3— MCOM plet e o f m issing mont hs to t al 0 1 ears)
6 79 8 5 388 4 9 19 3 575 2 6 13 1 835 I 5 19 1 720 1 8263 65 7 2 935 2 52 8 1 2 77 0 8 12 0 745 0 493 0 386 0 5358 52 2 12 7 10 9 455 5 62 8 5 713 3 44 3 3 48 1 4 5 7 4 14780 13 54 82 49 89 43 09 52 40 39 58 3 7 29 13 7 CO 45 69114 88 fi g 62 4 7 32 2 7 3 1 32124 92 96 74 79 76 7 1 73 90
0 2 8 0 3 9 Re a a t Ca l t h o rp e Pa rk
Fr El M A R A PR M A Y JUN J LA. AUG SAP OCT NOV
0 835 0 69 / 0 338 0 492 0 54 6 0 33 4 0 56 2 0 82 1 0 578 1 7536 43 12 16 0 05 14 90 8 3 1 8 45 18 25 9 85 7 0 3 22 5 728 25 12 18 19 12 20 29 2 1 6 15 1 54 4 65 48 4 1 68 109 66 104
t ics fo r prev io us reco rd (M ay 198 7 t o De g 19 83 — incompl* t . ot mi ssi ng mo nt hs t ota l 1.1 year s)
0 7570 3 161 48925 15
2 755
0 80 80 35 5' 78030 3 7
2971
0 2 8 0 82 So a r a t Lit t l e t ho rp e
Grid ref erenc e SK 140 50 7Lev el st n (rn OD) 13 1 00
A A J UL AUG ST P OCT NOV0 8 13 0 559 0 682 1 259 2 09 2 6 657
1 54 0 80 2 2 7 10 64 8 03 3 7 2414 10 12 22 38 1 1654 28 78 138 94 147
Grk l re fe renc e SP 0 7 184 7Level st n Im OD) 104 24
0 663 0 5230 28 7 0 2581 3 24 0 89037 44 46 8623 1963 53
02 8 0 8 0 Ta m e a t Le a Ma rs t o n La k esGrid ref erence SP 20 793 7
Level stn On OD) 6 6 23
0 63 30 36 71 3664 1 25
7371
0 6 73 -0 29 5
42 340 85
2476
3 00 10 7 166 69 775 78549 1
0 6650 3201 40 823 28
7456
- J A N FEB MAR A PR MAY J UN J UL ALAI SLP of 1
Flow s A v g 20 640 18 320 14 340 9 39 1 10 56 0 10 750 8 482 10 650 12 430 10 520en ' s ' ) Peak 58 86 66 0 1 54 35 12 79 65 5 7 32 24 36 23 6 1 18 67 09 43 59
k nof f (m 1H1 69 5 7 48 30 35 35 28 36 40 35Rainfall tr im ) 9 1 49 54 4 6 1 4 5 28 74 99 5 7
Catchme nt area (sq km ) 148 5Ma x alt OR OD) 5 13
4 9 72I 5558 1989 1 6 1
8 7123
0 8 150 49 3
48724 9 7
2966
NOV24 11012 7 60
78128
DEC3 85 116 5 7
6966
5 28 72 1358 74 I66 25951 I
DEC0 823
8 453055
1 1220 5301 93454 0 24 179
DI C14 5804 1 44
4946
1 9 8 4
Year3 .1 7074 .538 709 97
3 .5712 .24 14 .80 5
13 7 0 0759
1100
19 84 runo ff is 88% of previou s meanrain fa ll 9 1%
19 8 4Catchrne nt area (sq km) 74 0
M ax alt (m OD) 28 5
y ear0 .75322 .5732 180 5
0 .84 20 6021.05854 .02 ,359804
198 4 runoff is 90 % of p re v iOu s meanrain fal l 100 %
1 9 8 4Catchm ent area (sq km) 799 0
Max alt Im OD) 16 7
Year13 73112 7.60
54273 6
prev io us re co rd (Oct 1957 to Deo 198 3— incomplete or m iming mon th s to t al 0 3 years )
15 730 13 490 12 750 i I 120 10 270 10 80 0 I 1 36 0 12 0 70 13 890 16 560 13 .52 98 / 9 7 7 25 9 7 32 1 6 655 6 369 6 978 6 655 7 852 7.8 76 9 0 5 7 9.599
76 59 0 22 000 24 690 15 760 17 220 16 9 70 19 440 25 600 2 7 880 32 880 17.35586 2 7 90 46 80 09 72 2 ) 94 78 94 43 72 0 2 6 4 85 62 5 7 2 19 20 2 19 20
53 44 43 36 34 36 3 7 40 45 56 53455 53 6 1 5 7 56 70 66 58 63 72 728
1984 runo ff is 10 1% of prev ious meanrain fall 10 1%
M A R1 4 159 382 159
A PR
0 8341 74127
Catchm ent area (sci km) 18 3 9
Level st n (rn OD) 6 1 39 Max alt en OD) 15 1Ond ref erenc e SP 54 29 73
M A Y
0 6803 991054
Ju N0 700
3 851059
tut AUG SEP0 38 2
I 156
45 86
OCT0 50 3
1 027
5 1
NOV2 02516 32
1995
19 8 4 .
DEC Year1 4 74
0 72 138 54 5

R I V E R F L O W D A T A 107
0 2 9 0 03 Lu d a t Lo u t hM easun ng auth o nty : A W AFest year : 196 8
Hy d rom e t ri c s ta ti s ti c s f o r 1 9 84
JANFl ows Avg 0 6 77
(m ' s - ' I Peak 2 15Runof f Ow n) 33Rainfall We l 1134
FEB1 23 72 495648
M easur ing aut hon he: AW AFirst yew : 196 2
Hy d ro m et ri c st a t i st i c s for 19 84
Me asuring aut ho rit y A W AFirst year . 1960
Hy d rom e t r i c st a t i st i c s foe 19 84
JAN FEBFlo ws Avg 2 26 1 2 .788
Im' s - I) Pea k
Mean Avgfl ow s Low
Ifn1s- ' I 11.gePeak fio w an' s- SRunoff Irnm) 15 18Ran fall Imm) 50 42
Fect ors aff ect ing flo w regv ne GStat ion ty per FV
Measuring autho ri ty AW AFas t yew . 196 7
Hydrom et ri c st at i st ics f or 19 84
Mean Avg • 63 1 5 2 78flow s LOw 0 .5 17 0 425
Cm' s - 5 Noah 8 94 9 17 030Pea k flow on ' s ' ) 36 93 74 42Runoff (mem 3 1 32Rainfall (nun l 56 46
Fact ors aff ec ting flo w room & S ESta tio n ty pe. C
MAR0 78 1
1 6 13854
APR0 630
0 .783016
M on t hl y a nd yea dy st at i st ics foe prev iou s re co rd (Aug 19 68 to Dec 1983)
Mem Avg . 0 6 11 0 790 0 79 5 0 7 16fl ow s Low 0 139 0 157 0 . 162 0 . 150
UN's - 5 KO 1.279 1 428 13 38 1 289Peak fl ow (ro/s - ' ) ' 3 68 3 8 1Runoff Inv n) 30 35 39 34Rainfal l Inv n) 64 49 64 55
Fact oes aff ect ing fl ow reg im e PG ISta tio n ty pe C
0 3 10 02 Gle n a t Kat es Brid ge ( t o t a l)
Runoff Inen I 18 20 17 9 5 3Rainfall Ownl 96 3 7 54 11 59 28
M on t h ly and yea rly st at is t ics for prev iou s re co rd (Oct 1980 t o Dec 19 83)
1.935 2 499 2.43 4 1 860 1 486 0 7690 09 3 0 04 8 0 033 0 0 18 0 00 8 0 . 46.35 1 10 110 6 3 17 4 936 5 06 0 2 182
03 10 0 7 W e l l a n d a t B a rro w d e n
JAN FEB MAA APR MAYRow s Avg 5 765 5 450 3 8 78 1.323 1 02 1
(m14 - '1 Peak 23 .60 24 63 23 .29 3 34 4 25Runoff /nen) 39 34 26 9 7Rainfall Own) 84 42 56 9 58
M ont h ly and yea rly st at ist i cs for pr ev io u s rec or d (Feb 19 68 t o
4 58 10 3539 68 7
10 7 803 154
2.64 90 25 77 69979 43
17 :4 7
Grid ref eren ce . TF 33 78 79l ev el stn . (rn OD) 15 .4 2
MAY0 522
2 53254 3
in0 459
3 .272243
A /0 3 15
0 .621520
Gnd ref erence: TF 40 26 76Level s i n (m OD) 14 9 5
Grid re fe renc e' TF 106 149Level stn OD) 6 . 10
2 1020 .2327 3 1146 95
1456
1.13 70 1593 0952 7 44
758
112
0 45301 46 5
Grid re fer ence SF' 948 99 9Level s i n (rn OD) 34 90
MJG0 .288
0 .84145 1
0 3 0 0 0 4 Pa rt n e y Ly m n a t Pa rt n e y Mil l
MAR APR MAY i PI AA AuG2. 159 1.122 0 6 18 0 359 0 . 137 0 103
50
0 .3980 00 11 4 15
I AN JUL AUG0 634 0 3 72 0 364
1 37 0 97 1.554 3 2
• 1 12 39
Dec 19 8 3- 4nco mp let e or m
0 856 0 8400 09 2 0 1534.46 8 4 50 138 23 39 9 1
6 650 65
SEP0 .2 15
0 621083
0 584 0 .43 7 0 338 0 .283 0 .24 5 0 25 0 0 .32 1 0 405 0 .4 800 .156 0 . 13 1 0 .112 0 . 102 0 . 112 0 .130 0 . 132 0 125 0 .1 781.17 7 0 .68 7 0 .50 7 0 .4 14 0 625 0 .7 19 1.158 0 .9 12 0 .70 3
3 .5 1 3.23 3 40 3 . 10 3 .30 2.96 6 .77 3 10 6 .7 728 2 1 16 14 12 12 15 20 2 745 1 58 5 1 6 1 56 58 68 66 699
1984 no off . is 10 1% of v en ous me anrainf all 9 5 %
JAN FEB MAR APR MAY 11 8 A lt . Au G SEPFlow s Avg 1.185 1 0 78 0 596 0 38 2 0 425 0 3 19 0 . 179 0 28 8 0 250
On' s ' ' I- Peak 7.2 7 4 83 2 53 0 53 3 6 7 0 6 7 0 27 5 29 0 52Runoff 1mm) 52 44 26 16 18 13 8 13 11Rain fall (rnmj 100 52 4 7 le 80 38 17 74 76
M ont h ly and yea rly st at is t ics for pre v iou s rec or d (J un 19 6 2 t o Dec 19 83- in com ple t e or mi ssin g mo nt hs t otal 0 .4 years)
Mean Avg 0 786 0 786 0 732 0 626 0 458 0 32 8 0 2 78 0 .28 2 0 28 5 0 389 0 54 5 0 72 7 0 .517fl ow s Low 0 35 1 0 300 0 .278 0 228 0 200 0 116 0 088 0 10 7 0 15 1 0 . 190 0 . 193 0 2 10 0 .2 92
(m' s ' ' ) High 1 4 75 1 838 1 53 8 1.5 18 0 80 7 0 69 1 0 86 2 0 593 0 9 17 1.144 1.112 1 804 0 .7 54Peek flow Uri ' s ' ' I 8 44 12 59 7.7 1 13 34 8 56 8 13 13 .38 7 06 6 64 8 0 7 10 . 17 8 48 13 .38Runoff (own) 34 3 1 32 26 20 14 12 12 12 17 23 32 26 5Roo fs' (rnml 5 7 50 6 1 56 55 59 5 1 63 55 52 70 64 69 3
Fact ors aff ect ing flo w reg im e G I 198 4 ru nof f is 10 1% of preo ou s meanSta t io n typ e C rainfa ll 98 %
SEP CCT PC V DEC Yew0 0 95 0 06 3 0 983 0 868 0 .94 3
1 784 4 4 88
0 34 80 00 81.8 73
19 14 12 64 3 3 4 7 11 11549 54 50 54 47 62 53 50 56 5 7 624
198 4 ru no ff is 7 7% of prev iou s meanrainfal l 96 %
SEP0 40 7
0 793
76
0 7 120 27 14.32912 55
553
OCT0 153
0 757
42
OCT0 250
0 .6911
0 2480 .881278
OCT NOY0 458 2 09 1
1.16 20 .643 14
55 9 1
Wring mo nth s t otal 0 .2 years )
19 8 4Catch men t area (SO km ): 55 .2
Max al l . (rn OD) 159
14 C0 3 13 0.486
1 0 2 3 .2 715 2 7745 6 6 7
19 8 4Catchment area (so km) 6 1.6
Ma x al/ (rn OD) : 14 2
40110 703
3 0530
48 85
DEC You0 594 0.52 1
2 28 74 726 26646 679
19 8 4Catc hmen t area (scl km). 34 1 9
M ax alt (m OD) : 129
0 5 11 0 8940 0 24 0 .0202 26 7 5.55 2
1 4600 0 786 988
CC C2 742
7 371843
1.30 1 1.88 8 3 40 229 0 3 17 0 4 115 150 6 .430 6 52822.87 50 3 7 40 13
9 12 234 7 55 58
7 se3 7 602
1.2480.1542.336
1 9 8 4Catc hm ent area (so km) 39 8 9
Ma x alt (m OD). 2 28
Year2 04 2 .24 63161616
2.4 371.03 73.667
10 74 019 364 5
198 4 runo ff rs 134 % of previ ou s meanrainf all 96 % .

.108 H Y D R O L O G IC A L D A T A : 1984
0 3 2 0 0 3 Ha rp e rs B ro o k a t Ol d Mil l Br id geMeasur ing aut ho ri ty A W A Grid ref erenc e SP 98 3 799First year 193 8 Level s i n Irn OD) 30 30
Hydrom et ric st at ist ics for 19 84
JA N 11 11 M AN APR MA Y AAN SEP OCT M3V
Flo w s A vg 0 993 0 114 0 6 14 0 224 0 174 0 137 jOit 8 A4 0 083 0 09 1 0 090 0 380
Im' s- h Peak 5 60 5 56 El 28 0 58 1 32 0 38 0 13 0 42 0 53 0 56 8 79Runo lt Muni. 36 26 22 8 6 5 3 3 3 3 13Ranfaa 17r ni l 8 7 44 44 ' 0 65 42 12 38 7 1 49 94
M onth ly and yearly st at ist ics for pr ev iou s recor d (Dec 19 38 to Dec 19 8 3 — incom plete o r m issing mo nt hs to t al 0 .4 years)
Mean Av9 0 782flow s l ow 0 09 7
11 Hit 2 766Peak flow fm l s - II 16 06Runof f Irnrn) 28Rainta l Imm) 58
Fact ors af fec ting flo w reg im eSta tion ty pe CC
0 3 2 0 0 4 Is e B r o o k a t Ha r r o w d e n Ol d Mil lM eas uring aut ho ri ty A W AFirst year 194 3
Hydromet ric s t a t Is I te s for 19 84
J AN FEBFlow s A vg 2 83 7 3 200
le i l s ' I Peak 10 4 1 13 17Runo f f (meg 3 9 4 1Re nt al (rnel l 90 4 9
M ont hly and yearly st at ist ics for
Mean Avg 2 46 7 2 6 74 2 359 1 577 1 172how s Low 0 459 0 324 0 2 19 0 329 0 143
- Irn ' s II Fbgh 6 4 4 1 6 9 4 9 7 9 8 4 3 834 3 640Peak bow mi l s 11 11 10 17 5 1 28 39 ' 20 77 17 73fl ume , Imm 1 34 34 33 20 16Rair fal l rrern1 54 4 3 4 9 45 54
Fact o rs af fecting flow re g im e S EStat io n ty pe r y
M ean Avgfl ow s Low
In ' s 1 H9 hPeak flew Irn' s .1Runo ff Im eil 20 19Nen.all Imrn) 50 36
Fac to rs aff ec ting flow reg im e GE!Stat ion ty pe MIS
Measuring aut ho r i ty A W AFirst yea r 193 6
Hydrom et ric st at ist ics for 19 84
J AN PEB
0 3 3 0 0 3 Ca m a t B o t t is h a r tM easur ing aut ho rit y A W AFirst year 193 6
Hydrom et ric st at isti cs fo r 19 84
0 825 0 77 5 0 46 5 0 32 5 0 7 17 0 14 7 0 156 0 14 / 0 20 5 0 4280 0 80 0 0 76 0 0 65 0 05 6 0 04 8 0 053 0 04 8 0 04 9 0 Ob l 0 06 92 496 2 363 1 330 1 2 15 1 050 0 68 5 0 79 1 1 162 0 980 1 68 818 58 17 0 1 22 00 18 65 10 54 17 49 20 50 6 80 7 73 11 742 7 26 16 12 a 5 5 5 7 15
43 49 44 52 52 52 63 50 52 60
MA R APR MA Y A IN - AA. MX) SEP OCT Hey
1 727 0 959 0 60 2 0 5 19 0 25 2 0 2 73 0 3 13 0 29 5 1 29 97 74 1 69 3 54) 4 18 0 55 2 26 3 16 2 18 10 4324 13 8 7 3 4 4 4 1746 10 64 46 r5 46 73 5 1 93
prev iou s record (Der 194 3 t o Dec 19 83 — incom plet e of m issing mont hs t ota l 1.4 years )
2043
I S40
0 3 3 0 0 4 La rk a t Is i e ha m
God re fe rence SP 8 9 8 7 15Level stn (m 0 0 1 0 5 3 1
Grid ref erenc e I L 50 865 7Level st n (rn 0 0 ) 2 39
4 7
0 7640 1282 47 124 04
1055
4 7
0 5850 1663 0 18
9 548
51
6
Grid ref erenc e I L 6 4 8 760Level st n (rn 0 0 1 2 44
Flow s A vg 2 964 3 554Irn3s Peak
. Runof f Imm) 17 19 12 10 12 7Re n tal en rol 85 45 39 15 8 1 75 22
0 5540 1102 65525 10
a65
653 5 7
5
0 5090 1282 283
7 797
55
JA N FEB M AR M IN MAY JUN JUL AUG a p OCT NOV DEC Yea
Flow s A vg 5 79 9 6 20 2 3 194 2 93 1 3 196 3 5 13 1 864 1 63 1 2 56 2 2 38 1 6 943 6 04 7 3 .855tm 1s - .1 Peak
Runoff Imml 19 19 11 9 I I I I 6 5 8 e 2 2 20 15 1
li aintall hone 72 39 37 12 8 1 59 15 SO 102 55 8 7 40 849
M onthly and yearl y st at ist ics fo r prev ious record (Oct 19 36 to Dec 19 8 3— atco mplate or m issing mo nt hs to t al 0 .8 years)
5 9 17 6 74 2 5 94 7 4 633 3 38 1 2 327 1 9 18 / 30 1 6 73 2 111 3 3901 0 58 1 20 2 1 142 1 159 0 94 4 0 490 0 62 1 0 4 7 1 0 784 0 80 3 0 880
19 7 10 . 16 4 10 19 6 10 18 430 8 / 75 5 400 6 4 19 5 4 7 1 6 69 8 6 50 3 12 120
55 1
7d l 10 1
Mean Avg 2 579 2 90 7 3 0 0 1 2 423 1 90 7 1 294 ) 143 0 960 0 89 4flo ws Low 0 14 1 0 7 17 0 6 74 0 69 6 0 52 2 0 76 8 0 132 0 137 0 26 1
Im' s ' I K O ) 6 13 7 8 10 7 9 6 13 9 50 2 5 20 8 3 764 4 430 2 359 2 324Peak Now Ire ' s - ' I% mull ( M I TI) 15 I S 17 13 i l 7 7 6 5
Rainfall Imml 52 37 44 40 4 7 50 57 58 53
Fact o rs aff ec ting flo w regime GEI
198 4 runoff is 83 % of prev ious meanramf all 9 5%
0 / 4 7 • 3800 185 0 1/ 64 384 5 33 113 08 16 00
10 1852 59
198 4 runoff is 83 % of prev paus meanrain fa ll 9 9%
753
Catchme nt area (so krn) 74 3Max all Im 0 0 1 146
Catc hm ent area (so krn) 194 0Ma x alt Im OD) 19 7
Catchm en t area (se km) 80 3 0Max alt (rh OD) 168
59
1984 runo ff is 10 7% of previ ou s meanrain fa ll 111%
Catchme nt area (sq km) 4 6 6 .2Max all (rn 0 0 ) 125
MA R APR MA Y JUL AUC SEP OCT Na y DEC Year
2 0 5 1 9 72 1 80 3 2 105 1 142 0 92 7 1 198 1 197 2 49 8 7 35 7 1 98 1
7 14
M onth ly and yearly st at ist ics for prev iou s recor d (Oc t 19 36 to Dec 19 83 — m40411010h, or m issing mo nt hs t ot al 1 1 years)
1 06 30 4092 620
I 5 7 70 43 95 00 2
Stat ion ty pe M IS rain l ail 111%
0 5730 0 77I 77515 8 17 15 /
1 9300 6555 326
19 8 4
DEC Year0 48 7 0 344
2 68 8 .7919 14 646 60 2
0 4 140 .1 590 .69 222 .00176632
1 9 8 4
DEC Year1 560 1.1532 53 13 1722 18 748 63 1
1 933 1 38 30 2 19 0 .42 25 859 2 .33 716 99 28 .392 7 22 558 64 0
19 8 4
4 183 3 80 80 995 1 Q62
17 0 70 8.279
14 14 25 1 58 7
19 8 4
14 13450 77 44 6 75
1.8 0 10 .50 53.8 50
6 9 11 12 255 62 52 60 7
198 4 runoff is 1 10% of prev ious mean

R I V E R F L O W D A T A 10 9
0 3 3 0 12 Ky m a t Me a gr e Fa r mMeasurin g aut ho rit y A W A Grid re fe renc e. 11 155 63 1Fuss year . 1960 Level stn (m OD) 17 .22
Hydrom e tri c st at i s ti cs fo r 19 84
J• 14 FEB MA R APR MA Y M I AA AUG SEP CaFlow s Avg 1.638 1 65 7 0 952 0 185 0 14 7 0 75 7 0 0 16 0 0 30 0 0 53 0 04 3
Oa' s- 5 Peak 17 70 16 68 8 8 1 0 65 2 89 5 35 0 06 0 26 0 3 5 0 13Runoff (nr n) 32 30 19 3 5 5 0 1 1 1Ren tal (rrent / 6 47 46 I I 76 4 5 10 48 88 48
M ont hly an d yea rly st at i st i cs for pr evi ou s reco rd (May 1960 to Dec 19 83— incom plete or m issing mon t hs t ota l 0 .1 years)
Mean Avg 1 318 1 4 7 1flo ws Low 0 0 74 0 0 4 7
In ' s ' il li gh 3 296 5 577Peak flow (rn' s ' ' ) 25 26 22 / 0Runoff (nun) 16 26Ramfall (man) 49 40
Fact ors aff ec ting flo w reg ime ElStat io n ty pe CB ;7 -
M easuring aut ho rit y A W AFes t year 1960
Hydro m et ri c 5 / 8 5 11114 4 9 X 1 9 5 4
Flow s A vgIm ks - 11 Peak
Runo ff (mm l •- •Rain fall Imm )
Mean Avg 1 188 1 1 16flow s Low 0 26 / 0 22 1
Inif s- I) Ho 7 4 17 3 29 5Peak now ( M 3 1 . 1 9 93 10 90Runo ff (rnrn) 15 14Raire all Im ml 4 9 3 7
Facto rs aff ec ting flow reg im e GEIStatio n ty po TP
1 2 160 04 43 4 7430 24
244 7
0 3 3 02 4 Ca m a t D e n tf o rd
0 3 4 0 0 1 Yar e a t Co ln e yMeasuring autho ri ty A W AFirst year 19 59
Hydrom et ric st at is t ic s for 1984
Mean A vg 2 590 2 65 9f low s Low 0 779 0 94 7
/mks 1) High 5 18 1 4 9 3 1Peak flow In113- 11 18 9 7 18 63Runoff o w ) 30 28Rainfall Krim) 56 44
Factors aff ec ting flo w reg im e G IStatio n ty pe MIS
0 75 5 0 381 0 24 30 0 4 1 0 0 24 0 0092 0 55 1 46930 75 20 6 1 24 10
l a 7 5se 52 58
0 15 10 00 12 4 3816.68
349
0 3 3 0 13 Sap is t o n a t R e c t o r y Br id geGrid ref erenc e Tl 896 79 1
Level st n fnl OD) 15 6 2
M easuring aut hor ity AW A Grid ref erence TL 4 6 650 6Fast year 196 3 Level stn Im OD) 14 75
Hy drom et r ic s ta t is t i cs for 19 84
JA N FEB MA R APR MA Y JUN A A.Flow s A vg 1 5 36 1 54 8 1 157 0 9 5 5 0 939 0 9 18 0 6 75
In ' s ' ) Peak 8 18 7 0 3 3 60 1 25 2 86 2.26 1 16Runoff Imml 2 1 20 16 13 13 12 9Rainfa ll Im ml 75 35 40 12 / 9 49 15
Grid ref erence TG 18 20 8 2Level stn (nl OD) 8 18
JA N 1 E13 MA R APR MA Y A INFlow s A vg 2 730 2 93 3 1 50 7 1 119 0 9 16 1 013
Irri s - 11 Peek 7 78 8 69 2 35 1 89 2 84 2 66Runo ff enra l 31 31 17 13 11 11Ren tal Imml 98 39 4 4 14 6 1 70
M ont h ly and yea rfy st at is t ic s for pr ev iou s re co rd (Oct 1959 to Dec 1983)
AA0 433
0 565
36
0 1120 0041 05623 42
256
Mean Avg 1 38 5 1 560 1 4 17 1 2 79 1 0 66 0 779 0 6 10 0 60 2flo w s Low 0 448 0 400 0 56 2 0 466 0 40 8 0 3 18 0 184 0 248
(rnfs ' I High 2 308 1 702 2 60 8 2 43 1 2 144 1 33 7 0 960 1 4 5 7Peak f low Inl i s - 1) 9 66 14 0 9 10 22 9 94 13 63 6 91 3 60 4 79Runo ff /rura l / 9 20 10 I / 15 10 8 8Rent al Immr 48 40 4 7 4 7 46 4 7 53 591 1950 . 1983)
Fact ors af fecting flo w reg ime GE IStat ion ty pe TP
AUG0 44 2
0 9 15
48
0 05 20 0 170 158
1 341
4 9
0 3500 0 152 .20025 9 1
5 1
•JA N FEB MA R APR MA Y A IN Ju L AUG SEP OCT NOV1 58 2 1 769 0 93 7 0 736 0 703 0 650 0 33 8 0 25 5 0 35 5 0 36 2 0 99 19 63 7 19 3 3 1 1 27 2 82 1 78 0 49 0 39 0 67 6 0 42 1 22 12 9 ' 9 8 4 3 4 5 1292 44 40 13 7 1 68 28 32 9 7 49 76
M ont h ly and ye ar ly st at i st ic s for prev io us reco rd (Jan 1960 t o Dec 1983— lncomplete or m issing mont hs to ta l 0 .3 ye ars)
1.100 0 864 0 626 0 374 0 175 0 23 9 0 2 6 1 0 3390 244 0 75 1 0 193 0 133 0 06 5 0 04 5 0 0 5 12 49 1 1 9 4 1 1 801 0 790 0 469 0 734 1 68210 85 8 76 7 3 1 2 24 2 39 2 93 8 95
14 11 8 5 4 3 34 4 4 5 4 1 4 8 50 50 56
0 06 61 00 8
6 764
55
AUG SEP OCT NOV Lk C0 49 3 0 56 2 0 698 1 13 7 1 29 6
0 / 8 1 13 3 23 7 50 3 437 8 10 17 le
4 7 86 66 83 4 2
M on t h ly an d yea rty s tat is t ic s for prev ious re co rd (Mar 194 3 to Dec 198 3— incomplete o r missi ng months total 10 .6 years)
0 5840 155
96510 .99
54
SEP0 / 83
7 769
9 1
0 700 0 93 6 1 1540 3 14 0 36 1 0 3561 625 2 789 2 10 5
9 10 11 50 11 0610 13 1652 59 54
OCT0 765
I 289
48
Catc h n ent area (541 km ) 13 7.5M ax ah (m OD): 10 1
NOV0 90 116 90
1789
0 6280 0 723 7 1834 7 1
1253
0 6140 0 8 72 40 4
6 9 78
63
NOV1 68 66 5 71972
Cf C0 .846
1 221643
1 0 140 0503 32 833 .98
2056
0 9300 1392 39610 45
1256
1 9 8 4
Year0 .56956 .901306 2 7
0 .6380 . 10 31.04 834 7114 6608
198 4 ru no ff is 8 9% of rx esoou s meanfain f at 103 %
19 8 4Cat chm ent area (sr; km ) 205 9
Max aft (m OD) 9 7
DEC YearI 06 92 5514 12 446 6 56
0 .8 12
0 66 70 .2 191.0 7110 .9010 2600
198 4 runoff is 122 % of prev iou s meanrainf all 109 %
1 9 8 4Catc hm ent area (so km) 194 0
Max alt (m OD) 13 7
Y e a r
1 .00 18.18
183629
1.0030 .4 161.50 614 .0916 359 6
198 4 runo ff is 100 % of prev ious meanrainf al l 106 %
1 9 8 4Catc fr nen t area (sq km) 23 1 8
Ma x all (rn 0 0 1 6 9
DEC Year1 9 76 1.3603 7 1 7.7823 18 545 1388
2 09 8 1 74 1 1 138 0 6 79 0 5 75 0 556 0 684 0 9 12 1 50 7 2 2 17 1.44 10 842 0 623 0 462 0 18 5 0 189 0 200 0 272 0 330 0 440 0 7 14 0 .7 704 783 3 44 2 2 4 8 7 1 26 7 1 04 1 1 60 7 3 410 2 89 8 3 9 7 1 5 905 2 .23 016 90 20 5 1 10. 10 3 46 4 54 6 34 2 1 6 1 7 48 11 20 2 ) 15 2 1.8 124 19 13 8 1 6 8 11 17 26 19 64 6 4 9 4 8 4 8 5 4 56 56 60 70 64 6 5 1
198 4 runoff is 94 % of prev iou s meanra nfal l 10 2 %

110 H Y D R O L O G IC A L D A T A : 1984
0 3 4 0 02 T a s a t S h o t e s h a mMeasuring aut ho rit y A W AFirs t year 195 7
Hyd rom et ric st at ist ics for 19 84
JAN FEBFlow > Avg 1 759 0 90 5
Im' s- 1 Peak 7 94 3 09Runo ff Imm ) 32 l bRainfall (mml 93 37
M onth ly and yea rly st at isti cs f or
Mean Ayyflo ws Low
(m5s 1 %p .Peak flow Im ' s- 11Runoff I 1Rainf all Imin 1
1 4 760 28 73 10 714 162 /53
Fact ors af fecting flow reg im e G IStat ion ty pe FV
1 4 140 36 83 / 0913 5823
034 0 18 St if f ke y a t W a rha m M I S a in t sMeasu ring aut ho rit y A W AFas t year 19 72
Hydrom et ric st at ist ic s for 19 84
Flow s Av g(nOs ' ) Peak
Runoff (rnrreRainfall (rnm1
JAN0 735
2 0 72695
TER0 86 1
1 882838
Moan Avg 0 / 1/ 0 92 1flow s Low 0 5 72 0 454
On ' s - 11 Hg n 1 3 10 2 186Peak gow en1/4 .1 5 4 7 12 49Rune en ne 2 7 29Rainfall (mm) 62 49
Fact ors aff ec ting flow reg ime G IStat ion t ype FV
MAR APR MAY AlliN Aff AUG SEP0 38 6 0 375 0 060 0 436 0 266 0 72 9 0 28 3
0 9 7 0 85 1 42 1 17 ' 0 1 0 54 0 787 7 8 8 5 4 5
4 5 15 61 49 3 / 33 88
previo us record INov 19 57 to Dec 19 8 3— incomplet e or mi ssi ng mon th s
1 03 70 3022 435I 1 53
194 1
MAR0 73 7
1 322659
0 7630 3531 228
4 90266 2
0 7880 3091 666
5 691445
Gricl re fe rence I M 22 699 4Level si n (m OD) 9 60
0 5392 19
1 5396 65104 7
0 3 740 1/ 50 830
6 807
4 1
Grad re fef ence TF 94 44 14Level st n (nl OD) 5 .30
APR MAY0 583 0 60 4 0 657
0 92 2 56 2 0920 2 1 2220 94 52
M o n t h ly a n d yearty st at i st ics for prev iou s record (Jan 19 75 t o Dot 19 83 -
0 694 0 544 0 4 170 28 6 0 22 / 0 125
0 9 12 0 6 1710 55 1 55 1 5923 19 1448 52 49
03 5002 De be n a t Nau n to n Na l lMeasuri ng aut ho ri ty A W AFirst ynar 196 4
Hyd rom etric st at ist ics for 19 84
JAN rrnFlow s Avg 2 083 1 754
(rnF, ' 1 Peak 14 25 8 93Runoff (mm) 34 2 7Rarnfag (rnm) 90 44
M onth ly and yea rly st at ist ic s for
Mean Avg 1 6 76 1 523flow s Low 0 259 0 24 7
1m1s - N align 2 894 4 252Peak flo w Mt 's- '1 17 78 16 7 1Runoff (rrim) 28 23Rainfall Imm l 52 40
Fac to rs af fecting /l ow regime, R G I
Sta l 'u n W O cc
3 366 2 16214 80 16 10
18 124 3 43
03 70 0 1 B o d in g a t R e d b r id g eMeasur ing aut ho rit y . TW AFirst year 19 50
Hydrom et ric st a t is t ic s for 19 84
JAN FEB MAR APRFtow s Avg 4 2 18 2 9 16 2 38 1 1 120
en ts 1) Peak 16 20 9 43 13 70 3 44Runoff Ireng 3 / 25 2 1 10Rainfal Anne 82 30 49 8
Grid re fe rence TM 3 225 34Level Sl n ( 8 OD) 5 4 9
MAR APR MAY JUN A iL AUG SEP OCT NOV1 06 2 0 568 0 404 0 320 0 123 0 118 0 198 0 339 1 00 96 78 2 93 4 09 1 89 0 23 0 26 1 00 7 23 8 2217 9 7 5 2 2 3 6 165 1 17 65 36 30 28 E16 60 6 1
prev iou s reco rd (Aug 196 4 t o Dec 19 8 3— Incom plet e or m issin g mo nth s to t al 0 8 years)
1 0 8 7 0 75 7 0 424 0 1920 228 0 176 0 10 7 0 057
1 148 0 32612 80 1 SO
7 344 44
Grid re fe rence TO 4 158 84Level stn (ro OD) 5 72
MAY1 273
7 501174
A PI0 8 11
3 0 87
35
M onth ly and yearty st at ist ics for pr evi ous reco rd (Feb 19 50 to Dec 19 8 3)
Mean Avg 3 658 3 58 1 7 796 1 8 79 1 280flow s Low 0 6 75 0 608 0 53 7 0 482 0 323
trni s - 11 %on 7 28 2 10 6 70 6 858 6 768 4 04 5Peak flo w on' s 1 34 74 30 80 38 08 2 7 72 32 70Runoff (iren) 32 29 25 16 11Rainfall Imm l 50 43 46 44 49
Fact o rs af fecting flow reg im e S El -Stat ion ty pe EW
0 83 50 2262 9532 1 70
75 1
0 34 30 1200 96 2
6 5 16
5 1
0 4240 0591 2 16
5 761544
AA0 40 0
3 194
11
59 70 2801 9 7524 50
55 1
0 30 10 1260 764
3 5 76
54
0 4260 1583 42562 30
a54
OCT NOV0 3 17 0 80 5
0 75 5 746 15
50 7 1
to t al 0 7 yew s )
0 4 ) 1 0 80 2 1 1820 183 0 72 9 0 3001 422 2 94 6 3 239
7 84 I I 3 1 13 3 19 14 22
56 64 60
A iL AUG SEP OCT NOV0 32 1 0 294 0 39 6 0 35 1 0 59 2
0 80 0 64 0 79 0 45 2 5411 10 13 12 2039 4 7 118 35 71
incom plet e or m issing mo nt hs t otal 0 .4 ye ars)
0 39 60 0830 984
3 291464
0 166 0 166 0 33 5 0 39 / 0 924 1 284 0 .74 00 044 0 054 0 0 76 0 139 0 173 0 192 0 .54 50 40 5 0 484 2 825 1 22 2 3 113 3 58 5 1 0 60
3 39 2 6 1 29 45 8 24 16 86 16 11 29 .453 3 5 7 15 2 1 14 3
4 7 44 58 50 65 55 58 5
198 4 runoff is 109 % o/ prev iou s meanrain fa ll 106 %
AUG0 40 8
2 224
3 1
0 2 7 10 2060 339
0 849
52
SEP0 9 78
9 84
98
198 4 runoff is 78 % of prev iou s meanrain fa ll 103 %
0 3 73 0 44 4 0 6 130 24 5 0 285 0 4300 633 0 712 0 864
2 25 1 7/ 2 / 213 15 2 164 60 68
1984 runoff is 10 2 % of prev iou s meanrain fall 10 5%
OCT1 32 513 90
1273
Catchment area (sq km ) 146 5Max ah OD) 6 5
Cal chm ent area (aq km) 77 1Max all (rh OD) 9 5
D(C Year0 850 0 .59 3
2 29 7 9416 12 853 633
DEC0 609
0 9 /2 14 1
Catchm ent area (sO km ) 163 IMax alt Im OD) 6 2
NOV4 0 3218 30
3480
DEC1 6867 577852
DEC4 30 814 10
3854
1984
0 .7600 2801.29962 .301646 13
1984
Year0 .562
2 .5623070 9
0 .5 5 10 .3350 .7 1612 .491256 74
1984
Year0 .80 514 .2 5156620
1984Catchme nt area (sC1 km) 30 3 3
Max alt (m OD) 1 17
Year2.0 1918 302 106 36
0 604 0 88 5 1 3 15 2 15 7 2 929 1 8680 224 0 19 7 0 28 3 0 4 12 0 4 12 0 .80 11 3 15 4 0 12 6 834 10 340 9 454 2 .80919 8 1 25 62 35 60 62 4 1 36 40 82 .41
5 8 12 18 26 19456 60 55 63 5 / 62 5
198 4 runo ff is 10 8% of prev ious meanrain fa ll 102 %

R I V E R F L O W D A T A
03 70 0 5 Ca ine a t Le ad e nM easuong aul hoo ry AW AFast year 195 9
Hy d ro m et r ic Sta b sti CS for 1 9 84
JAN EFR MAR APR MAY AM1 low s Avg . 2 42 7 2 06 8 1.066 0 .74 4 0 623 0 508
fro' s 11 Peak 13 13 10 .50 4 28 1.72 3 84 2 65Ronan (rivn) 2 7 22 11 8 1 6Rao la (rnne 8 1 34 42 10 64 50
M on t hl y an d y ea rl y st a t i st i c s f or p re v iou s rec or d (Oct 19 59 t o Dec 198 3)
Mean Avg 1.933 1 83 1 1.7 11 1 2 10 0 830flow s Low 0 460 0 346 0 380 0 358 0 229
en ' s - ) Nigh 3 73 7 4 640 3 6 7 1 3 .344 2 353Peak flo w li rd s ' ) 13 92 72 02 23 80 13 34 12 56Runoff (rnrn) 22 19 19 13 9Rainfall (inm) 46 35 44 43 45
Fact ors aff ec ting flo w regim e R ElSta tion typo FL tr •
Measuring aut ho roy A W AFirs t yea r 196 2
Hy d ro m et ri c st at is t ic s f or 19 84
JAN FEB MAR APR MAY Ju NFlow s Avg 2 20 2 1 926 1 22 1 0 84 7 0 743 0 6 7 1
(ro1/4 ) Peak 10 6 7 8 73 4 00 1 95 2 28 1 78Rkn Ot1 (m rn) 74 20 13 9 8 1Rainfall Imml 78 32 42 10 69 54
M on t h ly an d y e ar ly s t a t is t ic s t oe p re v iou s re cor d (Oc t 19 62 to Dec 198 3)
Mean A v g 1 968 2 00 7fl ow s Low 0 53 2 0 460
(m,s I) High 3 9 16 4 6%Peak flow On' s- 4 / 4 10 19 00Runoef Imml 2 1 20Ro nfal i (mm) 45 36
Fact ors aff ect ing flo w reg im e R ElSta t ion WPC FL
1 99 40 4 793 58 32 1 7 1
224 /
0 3 70 14 R od in g a t Hig h On g a rMeasuring aut ho ri ty TW AFirs t yea r 196 3
Hy d ro m et ric st at is t i c s fo r 19 84
JAN U RFlo w s A v g 1 0 53 0 763
fril l s - il Peak 6 26 2 98Runoff (mm) 30 20Ronfaii (no n) 83 29
MAR0 58 2
4 751650
M o n t hly an d yea rty st at is t ic s for prev io us rec o rd (Dec 19 6 3 t o Dee 19 83)Mean Avg 1 122 1 039' low s Low 0 08 1 0 0 77
un ts - ii 1119 5 1 980 1 598Peak fl ow on, s .1 18 50 25 40Flueug linm) 32 2 7Rainfall Onm) 50 39
f ac to rs aff ec ting flow reg im e GSta t io n ty po EW
Measuring aut ho rit y TW AFirst year 193 6
Hy d ro m et r ic s t at is t ic s f o r 1984
0 8 760 06 61 98215 8 72550
03 8 0 0 1 Le e a t Fe ild e s W e ir
JAN FEB M A R A PR
Mean Avg 6 624 6 779 6 19 9flow s Low 1 05 3 0 959 0 46 1
(m ' s- ' ) Nigh 17 200 11 190 29 440Peak flow Irn1/4 - ' ) 3 7 2 1 23 98 36 79& Nal l IM IW) 17 15 16Rau fal (mm) 58 43 48
Fac to rs aff ect ing flo w reg im e PGk ISta tion ty pe MIS
1 49 10 4 793 84 312 3 1
1645
A PR
0 2901 15a
1 1
0 5230 06 52 19016 70144 7
4 5280 48 5
12 00 030 73
1344
Go d re fe renc e TL 96 226 1l ev el stn (rn OD) 8 .23
0 44 10 1460 85 7
6 265
43
Dri0 re fe renc e TL 84 5 158Level stn (rn OD) 14 55
1 0 780 34 12 86017 80
1248
0 69 20 35 61 27 1
7 757
49
Grid ref erence I L 56 104 0Lev el s i n (m OD) 4 1 00
M A Y0 26 3
2 347
76
AJN0 14 1
0 364
42
0 34 8 0 1700 034 0 0 151 4 71 0 29 125 60 3 79
10 350 49
0 3430 1000 68 7
4 004
45
AA0 666
1 647
27
Grid ref erenc e TL 39 00 92Level s i n (m OD) 2 7 70
3 6 700 30 2
12 26 020 16
135 1
2 506 1 77 10 224 0 08 17 6 18 4 99315 96 9 71
8 650 55
AUG0 2 71 0 24 7
0 96 0 583 3
2 7 3 7
0 3230 0 950 55 4
2 384
48
03 70 10 B l a c h w a te r a t A p p le f o rd B ri d g e
A UG0 490
1 3 15
44
0 500 0 4540 182 0 16 11 0 37 0 83 7
2 63 3 285 5
44 48
SEP0 425
2 415
90
0 38 20 1791 09810 50
453
SEP0 506
2 785
8 7
0 5 150 2 151 5381 1 4 4
552
J UL A UG SEP0 0 52 0 04 5 0 09 7
0 19 0 0 7 0 453
2 1 38
0 0 52 0 06 7 0 1540 00 2 0 004 0 0 130 09 7 0 29 7 1 320
0 75 12 20 20 0 21 2 4
45 53 53
43C10 .639
5 467
69
OCT0 740
5 74a
64
0 69 10 796I 95510 00
74 7
OCT0 167
0 925
63
M A Y J UN AA • uG SEP OCTI low s Avg 8 00 7 6 194 4 388 2 99 5 3 180 3 139 1 200 1 357 2 44 2 2 .70 7
(m ' s .1 PeakRunoP enni) 7 1 15 11 7 B 8 3 4 6 7Ran fai (mm) 84 39 48 10 80 5 7 17 46 106 73
NOV1.4698 0 71668
NO V1 7247 171875
I 1380 3254 53719 601260
NOV0 9 72
5 462683
19
M ont h ly and year ly st at i st ics fo r previou s re co rd M et 1936 to Dec 1983 — incom plete or mi ssi ng mont hs to ta l 1.9 yew s )
1 634 1 7340 0 85 0 13 13 84 1 7 06 313 17 49 56
6 660 54
Catchm ent area (so km ). 238 .2M ax an (m OD) . 1 14
DEC1 8 7 i6 262 149
0 659 1 159 1 54 30 22 1 0 28 8 0 3523 930 5 51 1 4 200
9 77 20 34 20 .587 13 17
52 60 55
198 4 runoff is 10 0 % of prev icv s meanrain fa ll 109 %
Catchm ent area (so km) 24 7.3Max al t Irn OD) 12 7
OFC2 0 39
7 532248
19 84 runo ff is 9 7% of prev io us meanrain fa ll 1 10 %
Catchm ent area (so km ) 9 5 1Max aft (in O D ) 113
0 334 0 5 72 0 8590 0 29 0 04 4 0 06 52 4 71 4 63 7 2 74 532 80 36 0 5 25 10
9 16 245 1 64 56
1 9 8 4
y ear1.03013 .1313662 1
1.02 70 .3621.73213 BO136569
1 9 8 4
Year1.14810 .6714 7630
1 6 74 1.1800 3 79 0 .8224 30 7 1.62 72 1 60 2 1 .71
18 15052 5 73
19 8 4
DEC Year1 20 8 0 .46 95 05 6 2634 15 654 64 9
0 .50 30 0 7 10 .92636 0616 760 7
198 4 runoff is 93 % of prev iou s meanrain fa ll 10 7%
1 9 8 4Catchm ent area (sq km) 103 6 0
Ma x alt Im OD) 22 9
NOV DEC Year7 39 3 7 225 4 .18 6
19 12 794 48 702
1 42 1 4 110 5 160 3.9230 30 2 0 4 18 1 100 0.865
10 420 13 8 70 13 2 10 7 18 125 47 33 90 4 1 04 49 .56
8 10 16 13 359 65 5 7 644
198 4 runo ff is 9 6 % of previo us meanrain fa ll 109 %

112 H Y D R O L O G I C A L D A T A : 19 8 4
0 3 8 0 0 7 Ca n o n s Br oo k a t El iza b e t h W ayMeasuring aut ho ri ty TW A Grxl ref erence TL 4 3 1 104Firs t year 195 0 Level stn Im OD) 3 7 54
Hy dro m etr ic st at is t i cs f or 19 8 4
JA N FEB MA H ApR MA N, JUN AA Au G SEP OCT NOY
Flo w s A vg 0 40 1 0 1 16 0 269 0 09 9 0 167 0 142 0 06 5 0 0 73 0 197 0 198 0 372
am's ' ) Peak 4 4 5 2 39 1 9 9 0 2 7 3 3 1 5 17 1 50 2 ) 2 6 42 10 10 3 8 4
Ru no ff (mm) 50 26 34 12 2 1 17 8 9 24 25 45
Rainfall (mm l 8 2 2 6 4 6 8 64 44 16 3 1 103 7 1 80
M on t h ly an d yearty st at ist ic s foe pr ev io us re cord (Oct 19 6 5 to Dec 19 8 3 — inc om ple t e or m iss ing mo nt hs t ot al 0 4 yea rs )
M ean A vg 0 30 1 0 304 0 76 1 0 20 8 0 195 0 129 0 I I I 0 120 0 123 0 158 0 2 18 0 26 6
flow s Low 0 0 59 0 067 0 0 54 0 0 74 0 0 73 0 06 7 0 0 60 0 0 34 0 05 6 0 04 3 0 05 7 0 092
MI' s- ) High 0 4 70 0 883 0 46 8 0 520 0 420 0 25 2 0 2 10 0 194 0 294 0 468 0 794 0 50 7
Peak ' low frO s T ' I 8 25 11 50 6 56 10 3 1 12 20 10 46 10 9 7 10 6 1 9 0(1 10 60 9 8 5 9 3 6
Runoff l -n ni l 38 35 33 25 74 16 14 15 15 20 26 33
Rai/d na 1m m ) 50 39 49 44 55 52 4 9 , 54 5 7 5 3 60 5 7
Fact o rs af fecting flow reg ime 19 84 ru nof f is 10 5 % of p re v iou s mean
Stat io n ty po FL rain fa ll 10 1%
0 3 8 02 1 Tu r k e y Br oo k a t A l ba n y Pa rkMe asuring aut ho ri ty TW AFirst yea r 19 7 1
Hydrom et r ic St a t is t i c , for 19 84
JA N FFBFl o w s A vg 0 506 0 7139
(rnTs ' ) Peak 3 8 2 3 3 2Runo f f ye n ) 3 2 17
Rainf all Ir01111 90 4 3
M ean A vg 0 392 0 389fio ws I ow 0 03 7 0 04 2
(m' s - ' ) H.gh 0 760 0 988Peak flow Im is - ll 10 5 1 9 74Runoff man) 25 22Rainfall im ml 5 7 4 5
Fact ors aff ec t ing fl ow reg im e GStat ion ty pe FV
M easuring aut ho ri ty 1W AFirs t y ear 193 8
Hy d ro m et ri c st at is t i cs fo r 19 8 4
JA N Fu rFlow s Av g 5 8 380 54 160
an ' s ' 1 PeakRunoff (Fi lm) 4 5 39Rainfal l im ml 103 4 1
M AR0 30 4
4 9 61956
APR0 0 4 4
0 1737
M A Y
0 09 5I 0 1
678
M ont h ly and yea rly s t at is t i cs for p rev io us re co rd mop19 71 to Dec 198 3)
0 3 74 0 2 13 0 2 19 0 09 20 0 24 0 020 0 0 14 0 02 10 8 11 0 626 0 626 0 240
5 14 7 77 20 69 15 3024 13 14 66 1 4 7 62 52
0 3 9 0 02 T ha m e s a t Day s W e ir
MA R APR M AY 21.111 Ju t.2 9 4 20 16 5 70 10 8 30 7 715 3 40 4
M ont h ly and yearly st at ist ic s for pre v io us reco rd (Oct 1938 to Dec 198 31
Mean Avg 55 29 0 5 7 100 4 7 160 30 740 2 1 190 14 500 6 6 22
flow s Low 6 250 5 554 5 620 4 25 3 2 855 . 1 50 2 0 3991911/4 '1 Ffi gh 133 600 120 80 0 163 200 85 0 70 6 1.140 4 1 56 0 4 8 8 20
Peak f low Im ' s ' IRuno ff (mm l 4 3 40 3 7 13 16 11 7
Rainfall (M in ) 66 48 54 4 7 59 so 54
Fact ors aff ec ting flow reg im e P ElStat ion ty pe MIS
0 3 9 0 1 4 Ve r a t K a nst e a d s
M ean A vg 0 4 90 0 5 54f low s I nw 0 126 0 190
On 1/2 - 11 High 0 98 1 1 33 6Peak flo w (m 25- ' 1 1 77 1 9 1Runo ff (men) 10 10Reun ite Irn m) 62 48
Fact ors af fec ti ng flo w reg ime GStat ion ty pe CC
Grid ref erenc e TO 3 5 9 9 8 5Lev el st n OD ) 16 6 0
AP10 06 1
0 6 14
56
p ricl ref ercence SU 568 93 5Level stn (rn OD) 46 02
Ju t. AUG SEP0 0 13 0 0 39 0 164
0 14 0 26 2 861 2 10
15 35 125
0 04 3 0 0 52 0 06 00 0 13 0 00 8 0 0 190 08 7 0 17 1 0 22 9
2 38 2 16 7 553 3 4
42 4 9 6 5
AUG SEP OCT3 120 4 588 5 770
23 12 8 6 3 2 3 44 6 4 74 28 15 44 96 65
7 300 8 95 5 15 4 800 2 96 , 1 74 1 2 7 18
18 6 90 38 6 30 74 5 70
6 768 6 2
Measur ing aut ho rit y TW A Gnd re fe rence TL 15 10 16First year 19 56 Level stn Irn OD) 6 1 34
Hy dro m et ri c st at is t ic s for 19 8 4
JA N FEB MA R APR MA Y JUN AA AuG SFP
Flo w s A vg 0 40 3 0 48 1 0 43 7 0 38 2 0 33 9 0 340 0 185 0 14 1 0 20 1trO s '1 Peak 0 82 0 93 1 0 1 0 50 0 70 0 70 0 30 0 44 0 58
Runof f (mei ) 8 9 9 8 7 7 4 3 4
R a in fal l (rnre l 9 8 4 9 6 4 7 84 60 1 3 55 10 8
M on th ly and y ea rly s t at is t ics foe pr ev iou s reco rd (Oct 1956 t o Dec 198 3)
0 594 0 56 9 0 50 7 0 4 38 0 3 74 0 3 30 0 29 60 138 0 114 0 0 69 0 04 5 0 0 28 0 0 16 0 0 25I 3 11 1 2 54 1 0 28 0 8 5 7 0 6 52 0 56 4 0 6 60
1 8 8 1 90 2 0 7 1 6 5 1 44 1 13 2 34
12 I 1 10 9 8 7 658 52 55 59 53 5 7 63
OCT0 248
8 141688
0 138 0 2300 0 16 0 0 190 524 1 158
I 65 12 759 14
5 7 6 1
CCT0 224
0 9 05
82
Catchme nt area (s g k m ) 2 1 4max al/ (m OD) 1 10
NOV0 5 88
5 753 69 6
NOY0 3 20
0 9 26
10 7
CIEC0 28 7
2 .2 8365 1
3 1 4 80 44 9 404 04 0 5 3 11
128 100 128 700
0 3 11 0 36 7 0 4 240 0 5 7 0 03 9 0 0 4 80 66 8 0 79 1 0 9 77
1 35 7 3 1 2 646 7 9
6 4 6 7 74
1 9 8 4
Year0.20810 1030 7624
0 .1990 .0950.25312.2029 38 19
19 8 4Catc hm ent area (se km) 42.2
Max alt OD) 127
01C Year0 398 0 229
¶ 99 8.1•25 17254 743
0 34 1 0 2110 086 0 .05 70 704 0.33910 5 1 20 .6922 15864 662
198 4 runof f is 109 % of prev iou s meanrainf all 1 12%
1 9 8 4Catch men t area (so km ) 3444 7
Max alt Irn OD) 3 30
NOV IN C Year4 5 000 48 2 10 23 93 1
3 7 219127 54 6 9 9
28 .42910 .09551.29 2
12 24 35 26063 7 1 68 714
19 8 4 ru no ff is 8 4 % o f p re v iou s m eanram fal g g %
1 9 8 4Catchmen t area ISO km ) 13 2 0
M ax alt (rn OD) 24 3
Cf C Year0 3 70 0 319
0 86 1.0 18 76
6 1 796
0 .43 70 .0950 752
2.64105712
19 8 4 ru no ff is 73 % of p i ev iou s me anra in fall 1 12 %

R I V E R F L O W D A T A 113
0 3 9 0 16 Ke n n e t a t The e leMea sur ing au thon ty TW AFors t year 196 1
Hy drom etr i c s ta ti s ti cs for 1984
JAN FEB M AR APR MAY A PIFlows Avg . 13 350 16 350 14 290 10 690 8 80 2 6 775
(m' s li . Peak 28 00 24 .00 32 CO 15.60 15.90 10 .20Runo ff Cm ) 35 AO 3 7 2 7 13 17Ran fal (ev e) 140 4 1 6 5 2 9 1 29
M om My and year ly st at i st ic s fo r p rev io u s rec ord (Oct 195 1 t o Dec 19 83)
Moan Avg 12 850 14 290 14 9 10 17 830 10 550 8 728Row s Low 4 144 4 40 1 • 190 3 429 2 739 2 04 1
(m3s ' I Hig h 72 680 22 720 22 0 10 19 / 90 15 430 18 600Peak flow On' s - II 48 30 44 80 44 30 3 1 70 30 10 70 80Runo ff Own) 33 34 39 32 2 7 22Remise (nv n) 71 5 1 7 1 52 63 6 1
Fac t ors aff ec ting flo w regv ne: R G IStation type - C I
03 9 0 1 9 La m b o u rn a t S ha wMe asuring aut ho ri ty TW AF li s t year 196 2
Hy drom et ri c st at ist ic s for 19 84
JA N FEB MA R APR MA Y Ju ti
Factors aff ect ing flo w reg ime G I
Sta10 0 ty pe C
03 9 02 6 Che r w e l l a t B a n b u ryMeasuring aut hor ity TW AFirs t year 196 6
Hy dro m et ric st at is t ic s for 198 4
JA N FEB MA R APH M AY JUNFlgw a A vg 2 596 2 725 1 763 0 555 0 78 2 0 144
In ' s ' ./ Peak 15 30 10 / 0 10 40 1 69 1 94 0 .16Runoff Imml 35 34 74 7 4 7Rain! all Irnanl 92 55 52 8 66 32
Mo nt hly and year ly st at is t ics for p rev io us reco rd (Doc 19156 to Doc 1983)
M ean Avg 2 42 7fiow s Low 0 0 74
(m' s ' ) High 5 0 19Pea& flow en' s 73 60Runoff Imml 33Rprifall (mml l 621 19 70 -1983 1
Factors aff ect ing flo w reg ime PStati on ty pe CC
2 35 30 04 95 32045 90
7945
2 1790 0 3 14 78 146 40
7965
0 9980 0 122 0 7612 00
134 1
GN3 re ference SU 649 70 8Level s i n. (ro OD) 4 3 3 7
Grid ref erence SU 4 706 82Level st n Im CO ) 75 59
0 90 10 0 107 6 7612 60
1258
0 46 70 00 81 4 3416 90
662
AA Auc Sao OCT NOV4 715 3 98 7 4 4 17 4 54 1 7 8 11
5 5 7 5 32 I I 90 9 27 2 1 6012 10 11 12 2018 38 10 1 68 126
6 56 41.620
11 12019 00
1748
AA
Gni] ref ere nce SP 4584 11Level s i n lin OD) 88 85
JUL0 030
0 480
22
0 2530 0041 8692 7 20
354
5 .7841 3 779 54 219 40I s6 7
AUG
AuC0 02 1
0 300
42
0 3800 00 9I 34317 20
570
5 4 2 12 .78 7
10 00033 40
1470
Sr -
SEP0 04 9
0 6 51
82
0 2520 0 161 532
7 753
60
6 1813 89 7
13 97029 40
1666
oc T
OCT0 0 75
0 481
65
0 4 770 0 13i 715
9 006
49
Catc lynen t area (SO EJT13 1033 .4Max ah Im OD). 29 7
7 9 743 94 3
17 7 1043 50
2075
1984 runo H is 9 2% of previ ou s mea nra nfaEl 104 %
Catchm ent area (so km) 234 1Max alt Inv OD) 26 1
NOV
1.13V1 2 1611 30
16109
0 8 150 0 182 82818 20
I I56
11.24022 10
298 7
10 1705 159
18 2404 7 30
26BO
19 8 4
Year8.91432 .00272806
9.6634 .056
12 88 270.8029 5775
19 8 4
CSC y ear
1984 runo ff is 89 % of prev io us meanrain fa ll 10 1%
Catc lv nent area N o km ) 199 .4Ma x aft (rn OD) 22 2
DEC1 1303 031545
1 86 10 0 563 96 754 10
2566
19 8 4
Year0 .88215.30139670
1.1100 2591.6 7254 ./ 0176688
1984 runo ff is 79 % of prev io us meanrain fa ll 9 7%

114 H Y D R O L O G I C A L D A T A : 1 9 8 4
039029 Til l ingbou rne at Shalfor dMeasur ing aut ho ri ty . TW AFirst year 196 8
Hyd romet ric st at ist ics for 19 84
J A N FEB MARFlow s Avg 0 / 20 0 635 0 720
Int 1s ' I Peak 1 48 1 10 2 58Runoff (mne 33 2 7 33Ran fax (mml 140 44 105
M onthly and yea rly st at ist ics for prev ious record (J un 19 68 to Dec 19 83)
Mean Avg 0 66 5 0 642flow s Lew 0 457 0 473
1 fiq r1 0 965 0 85 /Peak flow In 's - ' / 2 70 7 26Runo ff (mm) 30 26Ft:tint:a (mm) Fl 1 50
Fact ors aff ect ing f lo w reg im e G IStat ion ty pe C
039049 Sil k St ream at Col indeep LaneMeasuring aut ho ri ty GLCFirs t year 19 73
Hydrom et ric s l a t i l l t I CS tor 19 84
JAN FEBFlo ws Avg 0 484 0 244
(m ' s ) Peal)Runo ff Kern) 4 5 2 1Rai nf al l Imm) 9 7 31
Mo nt hly and yearty s t a t i s t i c s f a r
Mean Avg 0 336flow s l ow 0 200
Im' s I HO ) 0 564Peak flo w Im 's- .1 9 00Ru m* trier ) 3 1Rainfall ImmI 55
Fact o rs af fecting flow regimeStat io n ty pe FV
039069 Mol e at Kinnersley ManorMeasuri ng aut ho ri ty TW AFirs ) year 19 72
Hyd rom et ric s t a t i s t i c s toy 19 84
JA N FEB M A R A YH M A Y A IN JU I AUG SFP OC1 NOvHows Avg 5 483 2 35 7 3 079 1 0 99 1 136 0 523 0 33 2 0 3 / 5 0 49 1 1 792 3 854
(m>s- ' ) Peak 26 30 10 70 22 30 6 2 7 11 10 3 00 1 15 3 (0 5 79 11 40 27 60Runoff Imml 103 42 5 / 20 2 1 10 6 7 9 34 70Rainfall /min) 137 40 94 4 78 2 1 23 23 62 122 113
M o nt h ly a nd y e a rl y st at is t i c s fo r pr ev io u s r eco rd (Doc 19 72 to Dec 19 8 3 — inc omplete or m issing mon th s to t al 1.5 year sl
Mean Avgflow s Low
Im1s- ) RioPeak Hew en 3sRunof f ImmlRainfall (rnm)
3 19 11 3645 5764 1 30
6075
Fact o rs af fecting flow regimeStat io n ty pe M IS
2 98 40 8295 88 346 50
5 155
Measuri ng aut ho ri ty SW AFirs t year 19 56
Hyd rom et r ic st at i st i cs for 19 84
flow s Low 4 9 10 5 26 0(rn , s High 45 3 70 49 150
Peak flow im , s- ' ) 162 50 148.70Runoff Irnm) 46 38Rainfall (meg 69 52
Fac to rs af fec ting flow reg im e S PGStat io n ty pe M IS
APR
0 58 20 8026
4
0 645 0 60 8 0 5 79 0 527 0 4 76 0 47 1 0 50 1 0 5 19 0 5 / 5 0 625 0 .5690 398 0 398 0 3 76 0 353 0 340 0 37 6 0 35 7 0 36 7 0 354 0 39 2 0 .3890 90 ) 0 89 7 0 8 19 0 830 0 599 0 6 19 0 885 0 70 1 0 88 3 0 84 0 0 686
3 23 3 00 1 9 1 2 79 1 6 1 2 36 6 09 2 )0 3 65 3 25 8 .0919 2 7 26 23 22 1 1 21 14 15 18 30470 53 64 60 50 60 85 75 84 85 8 17
198 4 runoff is 9 7% of prev ious meanrain fal l 10 8 %
MAR A YH M A Y JU N A ft A UG SEP OCT NOv CA C Year0 378 0 0 9 1 0 234 0 148 0 10 7 0 0 / 8 0 363 0 46 3 0 39 7 0 3 17 0 2 71
30 8 22 13 10 7 37 43 356 7 7 83 52 26 3 / 119 83 92
pr ev io u s record (Dec 19 73 t o Dec 19 8 3— inco mp4et e Of m issing mont hs to t al 4 .0 years)
0 3 15 0 40 3 0 288 0 289 0 24 1 0 125 0 12 1 0 123 0 306 0 3 74 0 34 0 0 2 720 10 1 0 185 0 0 30 0 035 0 105 0 04 / 0 0 53 0 05 7 0 114 0 130 0 143 0 .2 150 4 / 4 0 6 / 7 0 573 0 584 0 64 0 0 2 13 0 700 0 776 0 50 7 1 086 0 659 0 3 14
4 85 8 89 10 26 I I 80 7 59 16 53 10 11 3 83 16 56 24 2 7 36 3 1 38 3 126 3 7 26 2 7 22 11 I I I I 28 33 3 1 29644 62 47 65 5 7 39 5 1 70 66 6 1 68 88 5
198 4 runof f is 1(0 % of prev ious meanrain fa ll 1 10 %
2 6390 8334 66810 10
5069
1 6 140 3883 6664 7 (X)
2946
N A Y0 5 71
1 142692
1 66 10 30 53 55 232 90
3 163
040003 Medw ay at Teston
Mean Avg 1 1 770 19 780 15 040 10 400 7 27 13 38 2 2 32 6 1 749
3 1 600 23 4 70 20 820169 30 105 90 6 7 20
31 2 1 1556 49 54
Grid re le rer.c iv TO 00 04 78Level st n Im OD) 3 1 70
J UN0 482
0 652 134
JUL0 42 1
0 541923
Grid re fe rence TO 7 178 95 Catchment area (sq km 1 29 0Level stn Int OD) 39 90 M ak alt Im CID) 14 6
Grid ref erence TO 2 624 62 Ca tc hmen t area (sq km ) 142 0Leve l stn Ins OD) 48 00 Ma. all Im OD) 178
1 00 50 12 11 8 7423 30
1859
0 5850 29 61 70914 901143
Grid ref erence TO 70 8530Level s l it (m OD) 7 0 1
AUG0 40 3
0 59la37
0 6 / 10 169I 76329 80
1355
SEP0 4 11
0 731875
1 1630 28 15 4 1940 70
2 18 7
J A N FEB M A R A PR M A Y J UN J UL A UG SFPf lo w s Avg 33 950 13 34 0 16 06 0 7 9 19 5 38 9 3 706 2 286 7 240 2 192
(m)s - I Peak 119 60 39 18 89 85 40 1 ) 26 0 1 11 0 1 7 58 4 19 5 44Runoff enm) 72 27 34 16 11 8 5 5 5Rainfall Imml 135 36 78 7 69 32 43 22 66
OCT0 489
1 3222
125
(XCT
6 0 7 13 1 19
131 I /
M ont hly and yearty st at ist ic s tor prev ious record Oct 19 58 t o Dec 19 8 3— incomplet e or m issing mon t hs to ta l 1 5 years)
1984Catc hmen t area (sq km) 59 0
Max alt (m OD) 29 4
May0 567
1 4525
116
1 836 2 180 3 7600 70 7 0 260 I 1006 06 1 5 66 8 5 4 7445 90 56 10 68 50
35 40 7 183 79 95
NOv15 960110 90
33103
DEC Year0 62 6 0 .5 52
1 20 2 .5878 29 694 88 4
1984
29 29858 75 3
DEC4 36 123 BO
829 7
DEC1 1 480
52 4 14689
1984
Year2 0 892 7.604 628 14
1 9380 .9502 .3 1368 .504 3080 9
198 4 runoH is 10 7% of prev ious meanrain fall 10 1%
1984Catchm ent area (sg km) 12 56 . 1
Max all Int OD) 26 7
Year10 .88 3118 60
2 7579 7
4 9 14 2 88 7 3 190 5 30 7 7 7 10 16 000 19 770 1 1.12 21 139 1 116 0 577 1 06 6 1 40 2 2 34 1 4 36 2 7.58 4
2 1 690 7 550 1 888 30 09 0 3 7 860 66 830 3 7 330 19 .32 7178 60 23 82 60 60 86 93 154 00 29 4 50 20 2 50 294 .50
10 6 7 11 16 33 42 2 7955 52 58 14 . 73 82 87 758
19 84 runoff is 9 8% of prev io us meanrainf all 105 %

R I V E R F L O W D AT A 115
0 4 0 0 0 4 R o t h e r a t Ud ia mM easuring aut hor it y SW AFirst year 1962
Hydror ne tn c SEB I Es Ele s for 19 84
JA N FER MA RFla ws A vg 5 86 1 3 04 9 2 90 5
k ni s ' ) PeakRunoff (nvn) 76 3 7 38 19Ravage unm) 17 1 46 88 5
M on th ly and y ea rly s E/111SU O11 far prev io us
Mean A v g 3 43 8 3 4 78 3 192flow s Low 0 94 5 0 792 0 65 7
Im ' s - Il HAP 6 957 10 3 70 6 .92 7Peak fl o w On ' s - 11 3 7 96 44 .74 49 84Runoff (n un) 45 4 1 4 1Rainfall (nv n) 78 63 7 1
Fact ors af fec ung fl ow reg vne 5 GEStat ion typ e V A
0 4 0 0 0 9 Te is e a t S t o n e Br id g eMeasu ring aut ho ri ty SW AFirs t yea r 196 1
Hy dro m et ri c st at is t ic s for 19 84
J A N FEB MAR APR MAY A iN J 111 A UG SEP OC T NOVFlows Avg 4 2 11 1 3 14 1 180 0 53 9 1 0 11 0 752 0 774 0 755 0 699 0 906 1 440
(m) 5- ' ) Peak 19 78 5 40 12 09 2 69 4 22 1 56 1 17 0 86 0 93 6 56 19 50Runoff (nun) 83 24 73 10 20 14 15 15 13 18 2 7Rainfall (min ). 156 40 79 6 73 33 53 20 60 129 11B
M on th ly and year ly st at is t ic s for prev io us re co rd (Oct 196 1 to Dec 1983 - - incernplete or missing months tot al 0 .2 yen )
Mean Avg 2 384 2 156flow s l ow 0 55 3 0 522
(m1s 11 Hig h 5 75 7 6 .24 1Peak how on1/2 - 1 4 1 63 48 2 7Runoff Imm) 4 7 39Rair fat (mm) 72 55
Fact ors aff ec ting flo w regim e PGFStat ion ty pe B VA
0 4 1 0 0 1 N u n n in g ha m S t re a m a t Ti l l e y B rid g eMeasuring aut ho rit y SW AFirs t year 19 50
Hydro m et ri c st at is t i cs for 19 84
Flo w s A v g1111' 4 1 .1 Peak
Runoff trnmlRainfall ( 111/ 11)
M ont hly and yea rly st at is t ics for prev ious record A pr 1950 to Dec 1983 — incomplete or missing months total 0 .1
Fa CIOr s aff ec ting flow reg ime NStat ion ty pe M IS
0 4 10 0 5 Ou s e a t Go ld B r id g eMeasuring aut ho rity SW AFirs t year 1960
Hydro m et ri c st at is t i cs for 19 84
1 94 90 4 133 91834 43
386 7
APR1.504
re cor d (Oct 1962 to Dec 1983— inco mple1i or missing months total 1.8 years(
2 1980 34 34 53 375 43
285 7
1 4 160 3 232 78 124 76
2 753
Gr. ] ref erence . TO 7 73 24 5 Catchmen t area (sq 11111) 20 6 .0l ev el s ln Cro OD) 1 9 4 M ax all (m OD) 19 7
MAY API .RA. AUG0 63 6 0 54 1 0 38 2 0 194
1716
1 46 70 .3382 8 1724 09
1960
7 5 433 62 2 2 70 143 135
1 0 700 1684 15723 08
1364
0 4900 23 10 83412 74
650
Grid ref ere nce TO 7 183 99 Catclv nent area (so km) 136 .2Level st n Cm OD) 24 50 Ma t alt Cm OD) 20 1
1 1290 23 92 30638 95
2259
0 7990 1302 61829 22
1558
0 5 130 23 10 9 7713 8 7
1047
Grid ref erenc e TO 6 62 129Level sm (rn OD) 3 80
J A N FEB M A R APR MAY AAN vll.A Aug SkP OCT1 105 0 699 0 29 7 0 111 0 04 7 0 029 0 0 14 0 0 13 0 0 13 0 04 31 90 1 90 1 89 0 83 0 23 0 12 0 08 0 0 2 0 03 0 3 1
175 104 4 7 17 7 5 2 2 2 716 1 44 BO 3 60 3 7 62 29 6 1 131
Mean Avg 4 08 1 3 55 1 3 09 2fl ow s Lo w 1 142 1 240 0 793
Im' s- ' ) High 7 762 8 2 14 6 888Peak flo w (m16 - ' I 46 80 71 85 29 86Runoff trnm) 60 48 46Rainfall (m i l 82 58 6 7
Factors aff ec ting flow reg ime SRPGE-- Sta tion t yp e CBV A
1984 runoff is 148 % of prem u s meanrain fa ll 10 7%
Gnd ref ere nce TO 429 2 14Leve l s i n lm OD ) 11.4 3
J A N FEB M AR A PR M A Y J UN A A AUG SEP OCT NOVFlow s Avg 6 4 78 3 4 11 3 155 2 0 19 1 276 0 729 0 5 14 0 56 8 0 845 1 06 1 3 150
Im1/4 - ' ) Peak 32 69 8 30 12 88 7 90 5 6 7 1 93 1 15 0 88 1 99 5 02 25 66Runoff onm) 96 47 48 29 19 10 8 8 12 16 4 5Rainfall (mml 159 4 1 86 4 77 26 28 26 62 137 122
M ont h ly and yea rly st at i st ic s fo r pr ev io u s reco rd (M ar 19 80 t o Dec 1983— incomp4et e or missing mon th s t ot al 0 .3 ye ars)
2 26 70 6 114 3 183 1 57
3160
1 7840 45 13 65 776 35
2663
1 0 760 78 33 82 927 9 1
1563
0 6220 2 171 90316 52
95 1
0 58 70 1871 82 314 36
a67
0 4960 1001 02 110 6 1
1058
0 68 80 1572 08833 15
1065
SEP OCT NOV DEC Year0 4 26 1 648 5 455 6 75 5 2 .430
5 2 1 69
0 .9280 24 53 95733 98
1284
0 6 800 170
35923 88
1378
1 09 70 2304 29649 0 1
1688
1 59 50 1795 70829 57
2 183
3 0430 184
12 36050 4338
100
198 4 :o m it is 1113% of previou s meanrain fa ll 114 %
1 008 1 80 30 128 0 2 763 173 6 34 429 17 4 7 12
20 3476 89
198 4 runo ff is 95 % of prom o s meanrain fall 109 %
Catchrnent area No km ) 16 9Ma x alt On OD) 13 7
NOV0 314
Et 7950
115
ears )
1 744 3 3 770 275 0 3846 602 12 0304 7 59 85 92
26 4886 10 2
19 8 4
8 1 373136 9 78
3 .406 2 067 .0 42 7 0.7569 .54 7 3 .32 25 1 82 5 1.82
3 1689 8 6 1
DEC1 86613 543 7
10 1
19 84
Year1.28 719 .7830 0868
2 04 2 1 36 10 4 71 0 .5 595 234 2. 10 148 29 48 .29
40 31584 796
19 8 4
DEC Yea,0 53 1 0 .269
Et 813 8.6084 502
126 910
19 84Catchm ent area (so km) 180 9
.M ax alt ( n OD) 20 3
DEC Year4 8 79 2 35016 54 32 .69
71 4 11113 88 1
3 553 2.2390 84 6 0 9347 65 7 3 .28 18 1 06 86 .92
53 39092 8 77
1984 runoff is 10 5% of previou s meanrain/ all 100 %

116 H Y D R O L O G I C A L D A T A : 1 9 8 4
0 4 1 0 0 6 Uc k a t I sf iel dMe asu ring aut ho ri ty SW AFirm year 196 4
Hydro m et ri c st at i st i cs for 19 8 4
JA N 1E8 MAR APR MA Y AMFlo w s A vg 4 154 1 494 1 3 79 0 753 0 5 19 0 389
(rn1/4 ' ) Pena 46 65 . 6 09 16 / 8 3 55 3 0 2 2 23Runoff 1mm) 127 43 47 22 16 11Rainfall (mm) 15 7 44 75 3 65 33
M ont h ly and y ea rly s t at is t ic s for p rev io us rec or d (Oct 196 4 to Dec 198 3)
M ean A vg 1 98 8f low s Low 0 5 79
Cm' s ' 1 High 4 0 30Peak f low Im 15 - ' 1 4 1 58Rano lf (m m l 6 1Rainfall (rnm) 78
Fac to rs aff ec ting flo w reg ime IStat ion ty pe C
I 86 20 6274 19 575 63
5262
0 4 1 0 2 5 Lo xw o o d St r e am a t Dr u n ge w ic kMeasur ing au thoci ty SW AFirst year • 19 72
Hy dro m et ri c st at is t ic s for 1 9 84
JA NFlow s A vg 3 74 5
Im ' s T 11 Peak 26 I IRuno ff (m m ) 110Rainfal l Inv i e 156
FEB1 36 110 50
3 744
M on th ly and yearly st at ist ics fo r pre v iou s reco rd (Jen 19 72 to Dec 198 3— incom plete re missi ng months total 0 3 years)
Mean Avg 2 0 76flo w s Low 0 266
Irn ' s ' 1 Il igh 4 76 4Peak f low MI ' s- ) 3 4 88Runoff gnm) 6 1Rain fal l In uM • 80119 71-1983 1
Fact o rs af fecting flow reg im e N
Sl eIwn hi pe CC
1 66 70 3 753 49 736 49
4453
Measuri ng aut ho ri ty SW AFirs t year 19 / 3 -
Hy d rom et r ic st at i st i cs for 19 84
JA NFlow s A vg 1 4 5 7
Im ' s T ' I Peak 8 75R oush (mm) 10 5Re nton (rnm ) 18 1
FEB0 7 10
1 78
50
119 73 198 3)
Fact ors aff ecu ng f low regim e GEStat ion t ype C
M easuring aut ho rit y SW AFirst WM' 1960Hydrom et ri c st at ist i cs for 19 8 4
M ean A vg 1 79 9 1 72 1flo w s Low 0 330 0 43 9
Im ' s ' 11 Flip 3 773 3 4 59Peak flo w Im Is ' I 9 9 1 13 6 2Runo f f Im m l 4 9 4 2Re n tal ! Imm) 86 60
Fact ors aff ec t ing flo w reg ime NSta t ion ty pe VN
I 39 40 4 133 3 1139 12
4364
MA R2 0 252 1 68
5990
1 70 10 1963 8373 1 33
5072
M AR0 682
4 6 14994
I 0 550 3242 18323 74
3 15 1
APR0 3 79
2 19I 1
0 98 10 1162 6 804 1 6 1
2849
APR0 4 12
I 3529
3
1 4 6 9 1 0 36 0 84 60 327 0 168 0 1283 089 2 169 1 56 9
8 64 8 32 13 9840 26 2369 ' 53 64
Grid re fer ence TO 4 59 190Level W I (rn OD) 11.2 8
0 80 50 25 21 85 428 9 7
2559
0 54 70 170I 65 729 59
1666
Grid ref erenc e TO 06 0 309Level st n 1m OD) 13 15
MA Y0 53 5
6 091683
JUN0 132
0 504
22
0 844 0 3 77 0 1070 0 78 0 04 1 0 0 322 799 1 334 0 22 732 73 36 90 5 66 1 1
25 362 63 4 /
0 4 1 02 7 Ro t h e r a t Prin c e s Ma r s hGrid ref erence SU 7 72 2 70
Leve l stn Irn OD) 56 40
MA Y0 35 7
1 4 126
107
M ont h ly and y ea rty s t at is t ic s for p rev io us rec o rd INov 1972 to Dec 198 3— incomplet e or m issing monte s t otal 0 2
AM0 22 7
0 34162 1
0 4 2 0 0 3 Ly m in g t o n a t Bro c k e n hu r s t Par kGr id reference SU 3 180 1 9
Level stn Im OD) 6 10
JA N FEB MA R APR MA Y A M A l l AuC SI P OCTFlo w s A vg 2 426 1 174 1 174 0 55 3 0 824 0 36 1 0 04 5 0 04 4 0 119 0 46 8
oh ' s ' ) Peak 7 95 5 3 7 7 95 7 95 7 95 2 45 0 12 0 16 1 2 1 5 65Rism e grim) 66 30 32 15 22 9 I 1 3 13Rainf all (m m) 135 3 8 7 1 1 8 7 33 25 24 68 10 1
Monthly and yearly stat ist ic s fo r pr ev io us recor d (Oct 1980 to Dee 198 3— Incomp lete of missing months total 0 .2
0 4800 04 21 24 7
7 9 51359
JUL0 242
I 027
44
0 3 450 142
48946 63
I 14 9
JLA.0 0 59
0 2 12
26
0 18 10 661346
0 2500 0 13I 60 3I i 38
743
A uG0 20 7
0 296
2 7
0 3 130 1060 82710 / 2106 1
AUG0 0 60
0 222
4 7
0 1840 0 180 68572 el fi
556
AUG SEP0 179 0 183
0 59 0 5913 134 1
0 26 80 0 140 84 7
8 167
62
SEP0 227 0 75 7
0 60 6 727 23
6 1 135
0 58 10 1702 86 836 40
1782
SEP0 1 13
0 4 43
76
0 4890 0842 30 8
8 4 7138 1
0 8 630 1602 5 7 /3 7 3 1
2678
198 4 runo ff is 125 % of prev iou s meanrain fa ll 10 7%
00 t0 60 4
6 3418
126
0 50 7 1 036 1 2980 04 3 0 0442 4 70 3 26 236 44 36 48
14 3082 79
1984 runoff is 106 % of prew ous meanrain fa ll 110%
OCT0 26 9
1 4 319
94 10 1
1 0 780 1284 84 111 282985
Catchmen t area (so km ) 8 7 8Max alt (re OD) 2 2 1
NOV2 72 74 9 24
8 1117
1 5 790 2 1 16 53 664 43
4 79 2
Catchmen t area (sg km ) 9 1 6Ma x all 1m OD) 260
NOV7 3 5524 75
6 /1 17
0 0 6 24 74834 58
3 771
Ca/ r.hrn ent area Isq km1 3 7 2Ma x alt (rn OD) 252
NOV0 700
9 13
138
ears )
MCW1 5 73
7 9 54 1
14 1
ears )
DEO3 65 144 12I I I128
DEC7 54 314 03
74104
2 43 10 6 184 53 656 75
7 19 3
1 39 9 1 5570 198 0 54 15 28 3 3 2 9413 5 4 14 9 13 7 4 292 9 1
1 9 8 4
Year1.3 7549 .2449 588 9
1 936 1.10 10 342 0 .48 04 034 1 94 555 58 75.63
59 39688 830
1 9 8 4
Year1 15926 .1 140 189 5
1.1000 3 111.50 956 75379813
1 9 8 4
nr c Yea r0 89 7 0 .52 1
3 49 9.1365 44 3
1 10 986
198 4 runoff is 9 7% of prev iou s meanrainf all 114 %
19 8 4Catc hm ent area (se km) 98 9
Mat alt (m OD) 114
DEC Year2 28 9 0 9 2 1
7 85 7.9 562 29 5
116 84 6
1.0270 40 71.34 014 .9132884 5
1984 runo ff is 90 % of twewou s m eanrain fa ll 100 %

R I V E R F L O W D A T A 117
042006 M eon at M islingf or dMeasuring authority . SW AFirs t year 1958
Hy drcvn et n c st a ti st i cs for 19 84
J AN FEB M AR APBFlows Avg 1.424 2 0 16 1.50 2 1 29 8
(O s ' ) Peak 2 68 2 38 2 .09 1 63Runo ff (nvn) 52 69 55 46Ramfal (n en) 172 5 1 82 2
Gra:1 ref erence SU 589 14 1Level st n. (m OD) 29 .33
MAY A ltf A IL0 950 0 .654 0 .392
I 19 0 138 0 6035 23 149 7 19 4 5
M on th ly and yea rly s ta t ist i cs fo r pre v io us rec o rd (Oct 1958 to Dec 198 3)
Mean Avg 1 525 1.763fl ow s Low 0 463 0 480
(m' s ' I High 3 4 70 3 300Peak flow (rn' s '1 3 5 1 4 0 2Runoff (torn) 56 59Raaeall Mien) 95 62
Factor s affecting flow regime Gstam p type FL
1 6 / 6 1 38 1 1 03 70 42 7 0 335 0 1642 020 1.988 1 738
3 26 2 83 2 0662 49 3875 59 68
042012 A nton at Fu l ler ton
Mean Avg 2 25 5 2 4 73flow s Low 1 30 1 1 2 15
tml s - ' ) High 3 132 3 69 1Peak flow (m ' s 11 3 55 1 89Runo ff (m r ) 33 33Ran fall enne 7 1 53
Factors aff ec ting flow reg im e NSta tion ty pe C
Measuring aut ho ri ty W W AFirs t yea r 1966
Hy dro m et ri c s ta t is t ic s for 1 9 84
Mean Avg 4 6 79 5 14 7 4 6 14 3 236 2 504f lo w s Lo w 1 0 11 1 26 3 1 339 1 048 0 99 3
(m1s 11 High 6 52 1 8 196 6 732 5 2 72 4 044Peek now (m3s - ' ) 22 71 17 5 7 18 80 14 27 28 13Runoff trnm) 5 7 5 7 56 38 30Rainfall (mm) 93 76 82 52 7 )
Fact ors aff ec ting flo w reg im e NStaucu type C
0 7580 1701 220
1 502 760
0 .5480 0 790 82 7
1 182053
Grid ref erenc e SU 3 793 93Level stn (rn OD) 40 5 1
Measuring aut ho ri ty SW AFirst year 19 73
Hy dro m et r ic st at i st ics for 19 84
JAN r FB M AR A PR
Flows Avg 1 98 / 2 542 2 2 17 2 04 2eras 11 Peak
Flanof f lmm l 29 34 32 29 16 1 1Rienfal (mm) 140 39 68 1 86 26
M ont h ly and y ea rfy st at is t ic s for prev io us rec o rd (Jan 19 75 to Osc 198 3)
043006 Nadder at W il ton Par kGrid reference SU 09 830 8
Level stn (m OD) 5 1 15
J A N FEB M A R APR M A Y JUNFio ws Avg 5 604 5 8 74 3 553 2 58 1 2 0 79 1 54 5
(m1s ' ) Peak 16 25 10 5 7 10 34 4 45 4 09 2 60Run off ff n m ) 68 6 7 43 30 25 18Rainfall im ml ( 75 56 74 2 9 7 35
Mo nt h ly and year ly st at is t ic s for pr ev iou s re cord Wan 196 6 to Dec 1983)
JU L1 1442 3 11426
AUG SEP OCT0 255 0 249 0 24 7
0 .77 0 35 0 .389 9 9
33 95 113
0 40 90 0680 65 7
1 081570
0 36 40 1020 88 2
0 961388
042008 Cher i ton St r eam at Sew ar ds Br idge
M A Y JUN JUL AuG SEP1 764 1 524 1 168 1 106 1 005
AUG0 9 73
1 781242
SEP0 968
1 461193
0 55 10 1102.309
1 50209 1
Catcl vnem area DA km ) 72 .8Max aft (rn OD) 233
NOV0 4 2 /
1 1715
140
0 .8650 1244 126
2 833 1
10 1
Measuring aut ho ri ty SW A Grid ref erenc e SU 5 74 3 23First year . 19 70 Level stn (rn OD) 55 80
Hy dro m et ri c st at is t ic s for 19 84
J A N FEB M A R A PR M A Y J UN JUL AUG SEP OCT NOVFlow s Avy 0 786 1 032 0 90 2 0 89 3 0 63 7 0 580 0 48 7 0 34 5 0 320 0 36? 0 48 6
MI' s ' II Peak 1 09 1 33 1 22 1 19 0 78 0 66 0 6 7 0 60 0 45 0 89 0 75Runoff Imml 18 34 32 3 1 23 10 17 17 11 13 17Ren ted, Invn) 16 1 48 9 1 2 104 22 4 2 38 98 114 132
1984
DEC Yeas1 i 69 08 82
1 77 2.6843 38 1
126 9 75
1.150 0 8 980 186 0 .3343 9 17 1.807
3 77 4 .0242 433
103 92 5
198 4 runol1 is 88% of prev ious meanrainf a ll 10 5%
1984Catchm ent area (so km) 75 )
Ma t alt (rn OD) 134
DEC Year0 773 0 .6340 98 1.3328 266
123 9 7 5
M ont hly an d year ty st at is t ic s for pr ev io us reco rd (J ul 1970 to Oec 198 3— incomplet e or miss ing mont hs tota l 0.1 years)
Mei n Avg 0 8 10 0 92 7 0 9 19 0 834 0 68 3 0 5 74 0 450 0 4 12 0 38 4 0 43 / 0 53 1 0 704 0 63 7flow s Low 0 52 1 0 495 0 409 0 320 0 1 7 1 0 2 18 0 183 0 . 165 0 20 7 0 2 79 0 2 78 0 3 20 0.408
h& c ' ) Mpg ,. 1 29 3 1 443 1 4 10 1 0 65 0 85 7 0 959 0 58 3 0 708 0 56 0 0 6 72 0 980 1 2 78 0 7131Peak flow lm ' s i l 1 69 1 83 1 68 1 39 1 26 2 02 1 25 1 28 0 77 0 9 1 1 23 1 85 2 .02Runo ff Worn) 29 30 33 19 24 20 16 15 13 16 18 25 268Rainfall ff n m ) 93 65 80 48 63 62 53 60 85 79 98 10 1 88 7
Fact ors aff ec t ing how regen e: N 198 4 runoff is 9 9 % of prev ious meanSta t ico Pa m C rain fa ll 1 10%
1984Catchment area (so km) 185 0
Max alt frn OD) 25 3
OCT NOv DEC Year1 05 9 1 40 7 1 822 1.637
17 16 14 15 20 26 2 7923 4 7 79 76 129 10 6 820
2 6 12 2 53 6 2 178 1 89 1 1 558 1 385 1 3 17 1 430 1 533 1.84 0 1 9141 04 7 0 94 8 0 .830 0 69 1 0 616 0 548 0 68 8 1 0 15 1 003 1 4 17 1.0 103 373 3 123 2 84 2 2 8 17 2 196 1 784 1 53 6 1 888 2 116 1 8 55 2.242
2 90 2 8 1 2 96 2 56 2 18 2 27 1 6 7 1.8 1 2 14 2 27 3 .5530 36 32 25 23 20 18 2 1 2 1 27 32 688 43 6 1 5 1 4 1 56 7i 74 63 10 1 773
1984 runof f is 86% of previous meanrainf all 106 %
Catchment area (sr' km) 220 6Max all (m OD) 277
OCT NOV1 124 2 3 143 5 1 8 3914 17
100 148
Cat4 2 15
8 6 15 1
122
1984
Yew2 .66516 2538 19 70
2 .00 5 1 54 5 1 3 73 1 40 2 1 893 2 63 4 3 833 2.8950 839 0 684 0 595 0 823 0 829 0 906 12 19 1.5353 183 2 23 4 2 040 3 09 3 3 537 6 4 13 7 0 30 3.82 1
8 83 13 39 6 6 1 16 68 10 99 22.90 47.88 47.8824 19 17 16 23 3 1 47 4 1463 52 70 83 82 88 10 1 913
198 4 runoff is 92% of prev ious meanrain fa ll 106 %

118 H Y D R O L O G IC A L D A T A : 1984
04 3 0 0 7 S t o u r a t T hr o op Mil l 19 84M easur ing aut ho ri ty . W W A Gred re fe rence SZ 1 139 58 Catchm en t area (sq km ) 10 73 0Firs t year 19 72 L ev el stn (m OD) 4 35 Ma x alt (rn ODI 2 77
Hydromet ric st at isti cs for 19 84
JAN FEB MAR APR MAY JUN JUI AUG SEP OCI NOV DEC YearFlo w s Avg 32 190 25 0 60 15 060 9 6 13 6 260 4 49 1 2 779 1 554 2 4 13 4 06 6 14 40 0 2 1 080 1 1.664
Irnl s - ' ) Peak 98 00 48 44 46 89 24 4 7 9 32 6 63 4 27 3 59 3 30 16 90 56 10 40 93 98 .00Runo ff enrre 80 59 38 23 16 11 7 6 6 10 35 53 34 3Rainfall (mml 159 48 64 3 76 30 10 38 8 1 95 139 104 8 5 7
M o n t h ly a n d y e arl y st at ist ics fo r prev ious record Han 19 73 t o Dec 19 8 31
Mean Avg 27 9 10 25 060 22 530 13 700 10 120 7 0 70 4 763 4 5 12 5 7 10 10 2 70 13 6 10 23 000 13 .558flow s Low 4 3 19 6 876 7 548 4 483 3 157 7 23 1 1 6 14 1 358 2 455 2 7 16 2 823 6 38 6 6 138
Im' s - ') H O 35 150 42 200 32 610 21 660 18 900 16 4 10 7 932 8 998 20 340 29 770 36 370 40 2 70 17.3 77Peak flow fin1s ) 116 60 13 1 50 110 70 6 1 56 16 1 20 159 20 4 1 60 32 4 1 90 33 10 1 90 133 40 190 70 19 0 70Runo ff Imrs I 5 7 5 7 56 33 25 17 ' 7 11 14 16 33 57 399Rainfall (min t 8 1 7 1 84 40 64 so 52 so 88 8 1 76 108 865Fact ors aff ec t ing flo w reg im e I
Sl al 'ac woe Cc
Fact o rs aff ect ing fl ow reg im e IStateo n ty pe FL
Fact o rs aff ec ting f lo w regim e PGEIStateo n ty pe V A
Fact o rs aff ect ing l low reg im e SRPGEIStat io n ty po V A
198 4 run of f is 8 6 % of prev io us meanrain fall 99 %
04 4 002 Pid d le a t Bag gs Mi l l 19 84Measuring aut ho ri ty W W A Gr id ref erenc e SY 9 13 8 76 Catchmen t area (so km ) 183 1First year 196 3 Level st n Im OD) 2 .06 Max all (rn OD) 2 75
Hyd rom et ric st at i st i cs for 19 84
JAN FFR MAR APR MAY AJN A R AUG SCP OCT raDv Ot C YearFlow s A vg 3 683 5 117 2 949 2 188 1 5 74 1 24 5 0 856 0 762 0 702 0 8 73 1 628 2 750 2 .02 7
enl s ' I Peak 1 4 7 6 86 3 84 3 82 2 0 7 1 88 1 28 0 99 1 02 1 64 5 75 4 5 1 7 4 7Runoff Imm t 54 70 43 3 1 23 Is 13 11 10 13 23 40 348Rainfall frnm) 188 54 69 4 72 18 2 1 40 90 114 170 13 1 98 1
M o nt h ly an d y e a rly st at i st ics for prev ious reco rd /Oct 19 63 t o Dec 1983— incomplete or messin g months t ota l 0 3 y e a r*
Mean Avg 3 456 4 333 4 084 3 0 26 2 21 / 1 7 18 1 280 1 116 1 14 1 1 434 2 132 2 883 2 .392fiow s Low 1 04 5 1 020 1 09 3 0 94 5 0 75 7 0 549 0 483 0 43 3 0 604 0 80 5 0 71 1 ct 853 1 32 7
(m7s 5 High 5 520 6 6 16 6 20 2 4 782 3 3 76 2 90 1 1 755 1 52 6 2 30 0 2 58 1 5 04 7 5 50 4 3 .233Peak How (m' s " .1 11 8 7 9 18 9 3 7 6 48 8 11 9 23 4 79 4 50 8 18 9 29 9 20 8 4 4 11.8 7Runof f im ml 5 1 58 60 43 33 24 19 16 16 7 1 30 42 4 12Rainfall (nun ) 10 4 84 8 7 5 1 72 62 50 6 1 9 1 9 1 105 110 968
198 4 runo ff is 85 % of prey ous meanrain fa ll 10 1%
04 5 003 Cu lm a t W o od Mil l 1984Me as uring aut ho ri ty SW W A Grid ref ere nce ST 0 2 105 8 Catchm ent area (sq km) 226 1First year 196 2 Level st n tm OD) 4 3 9 7 Ma x all Ire OD) 2 93
Hydrom et ric st at i st ics for 19 84
JAN FEB MAR APR MAY JUN JUL AuG SD , OCT NOV LA C YearElow s Avg 17 8 70 6 945 3 480 2 5 17 2 028 1 57 1 1 183 1 3 26 1 444 2 10 7 7 764 6 04 7 4 10 7
M O S - ' ) Peak 110 70 3 1 95 26 32 15 40 13 68 7 7 1 2 04 9 93 4 56 7 52 3 1 19 2 1 75 1 10 .70Runof f Immt 152 77 4 1 29 14 18 14 16 17 25 89 / 2 5 73Ran fall frnm) 22 4 79 66 7 66 29 3 1 68 94 84 18 1 84 10 13
M ont hly and yearly st at ist ics fo r prev ious record lOc t 1962 t o Dec 19 8 3)
Mean Avg 6 40 3 6 5 16 5 26 3 3 2 12 2 946 2 0 / 4 1 8 17 1 63 2 1 98 1 1 990 4 293 5 966 3 .74 7flo ws Low 1 930 2 25 1 2 392 1 3 18 1 085 0 80 3 0 650 0 569 0 9 7 1 0 9 71 1 28 7 2 4 79 2 .27 7
In .' s 5 High 10 740 11 820 9 184 6 64 9 6 33 7 4 44 9 5 20 0 2 787 7 32 8 11 430 8 19 1 11 880 4 84 0Peak flow (re' s - ) 78 23 100 10 50 11 4 1 63 33 82 30 58 20 7 20 58 62 94 16 45 8 7 134 50 142 80 20 2 .20Ranolf Min)) 76 70 62 3 7 35 24 22 19 23 35 49 71 523Po nta!! Mine 10 7 85 89 57 72 64 60 65 82 86 96 111 975
198 4 runo ff is 110% of prev ious moanrain fa ll 104 %
04 5 0 0 5 Otte r a t B at to n 19 84Me as uring aut ho ri ty SW W A Grecl re fe rence SY 0 8 78 8 5 Catchm ent area (so km ) 20 2 5First year 19 63 Level stn (m 0 0 ) 14 52 Max alt (m OD) 29 9
Hydrom et ric st at ist ics for- 19 84
JAN FEB MAR APR MAY JUN A e AVG SEP OCT MEW Cf C YearFlow s Avg 8 33 9 4 28 7 2 994 2 06 9 1 496 1 22 7 0 923 1 05 8 1 0 76 1 400 4 98 5 4 6 16 2 .872
(ra' s I1 Peak 72 6 7 19 12 32. 13 14 00 7 48 5 24 1 75 4 4 1 2 94 5 34 22 14 27 79 72 .6 7Runof f el l ne 110 53 40 26 20 16 12 14 14 19 64 6 1 448Ra nfall lim n 195 65 77 8 6 1 27 3 1 64 79 84 18 1 8 7 9 59
M onth ly and yearly st at ist ics for prev iou s record (Mar 1963 10 Dec 19 8 3)
Mean Avg 5 63 1 5 457 4 48 1 2 711 1 54 2 1 856 1 60 1 1 41 2 1 7 14 2 700 3 706 5 099 3.23 5flow s l ow 1 50 2 1 30 8 1 90 8 1 150 0 94 1 0 7 16 0 58 7 0 54 2 0 980 1 0 5 1 1 257 1 758 2 .071
On 1s - I ) Sig n 9 98 9 10 880 7 293 5 39 1 5 35 4 3 080 4 77 1 2 568 4 580 9 655 8 771 9 8 75 31 48Peak flow an1/4 - ' ) 100 80 73 08 65 25 69 66 BO 38 45 8 7 34 6 90 35 96 66 9 1 4 7 58 84 95 123 60 34 6.90Runoff (mml 74 66 59 35 34 24 2 1 19 22 36 4 7 6 7 504Ra ngel Prune 116 9 1 8 7 54 76 64 59 6 1 8 1 89 95 115 988
1984 runo ff is 8 9 % o f V IEW ous meanrain fa ll 9 7%

R I V E R F L O W D A T A 119
04 6002 Te ign a t Pre sto nM ea sun ng authori ty . SWW AFir st year 1956
Hy d ro m et ri c st a ti st i cs fo r 19 54
JA N FEBFlow s Avg 33 830 19.290
(rn' s " ) Peak 163 90 77 15& mol l grren) 238 127Rain(al erim) 28 8 100
Me an Avgflo ws Low
lin1/4 - 11 it chPeak flow (ill ' s ' s)Runoff (nvo)Rtenfa 11 (nun)
Fac to rs aff ect ing flo w reg im e SAK E!Stat ion ty pe V A
046 003 Da rt a t A u s t in s BridgeMe asuring aut ho rit y SW W AFirst year 195 8
Hy dro m et ri c stat ist ics for 19 84
JAN FEB MAR APR mAY Ju NFlows Avg 3 1 460 19 230 6 226 5 104 2 886 1 84 9
Irnts - 11 Peak 26 9 80 76 23 73 36 25 48 19 04 3 72Runof f Imml 34 0 195 6 7 53 3 1 19Rainfan (m m) 398 156 10 6 10 82 2 1
M ont hly and yea rly stat ist ics for prev ious record (Oct 19 58 t o Dec 19 8 31
Mean Avg 19 6 10 17 400 14 560 9 700 I 684 5 094flow s Low 5 435 4 2 70 5 73 1 3 566 2 220 1 456
Irn1s- ' ) hfi gn 36 680 3 7 760 33 520 22 770 14 530 14 260Peak flow 1rn' s t) 284 00 30 9 40 2 16 30 187 40 98 88 253 00Runoff (nun) 2 12 17 1 158 10 2 83 53Rain,all lin m) 22 7 163 166 1 1 4 I I I 97
Fact ors aff ec ting flo w reg im e SRPGEISw ope ty pe V A
04 700 7 r e a lm a t Pu s lin c hMeasuring aut ho rit y SW W AFirst year 19 62
Hydrom et ric st at ist ics for 19 80
JAN FEB MAR APRI low s Avg 4 8 14 2 64 0 0 708 0 636
(mi s- ' ) Peak 26 66 6 3 1 2 79 1 55Runoff (mm) 235 12 1 35 30Rair tall (r i m) 30 2 96 77 10
Mean Avg 2 9 11 1 935 1 255 1 794flow s Low 0 56 3 1 3 18 0 659 0 572
on1s ' ) K r 4 60 3 5 806 5 290 3 64 6Peak Bow trn 1s- ' ) 23 22 23 24 24 11 70 53Runoff (rnm) 142 (30 110 6 1Rainfte 1mmi 162 134 130 78
Factors aff ec ting flow reg im e Pa lSta tio n ty pe FLV A
04 7008 Thru s he l a t Tin hayMeasur ing aut ho rit y SW W AFirst yea r 196 9
Hy d ro m et ri c stat i st ics for 19 84
JAN FEB MAR APR MAY .A. 1Flows Avg 8 0 74 4 099 1 65 1 0 743 0 19 8 0 156
Irn' s I1 Peak 39 50 22 86 27 48 5 96 4 17 0 5 7Runoff 1mi n) 192 9 1 39 17 7 4Rainfall (mml 7 17 86 68 7 69 2 1
Mont h ly and yea rly st at ist ics for previou s reco rd (Nov 19 69 to Dec 19 8 3)
Mean Avg 5 180Row s Low 1 3 17
(rnts ) ENth 9 70 1Peak f low 1m1s- ) 53 32Runoff Imm) 123Rainfall Im m)* ( 5 11 19 70 - 1983)
Fact ors aff ec ting flo w reg ime GEStat ion ty po CC
4 30 81 8 798 8266 1 78
93(C6
MAR7 0 1548 4 7
4984
3 4391 4787 4 776 1 46
8210 6
APR6 16433 0 7
42I I
1 39 30 48 12 1402 7 72
3256
Gri d ref erenc e SX 8 56 74 6Level stn Em OD) 3 8 3
MAY3 2 1617 06
1376
A IN1 82 73 6 51214
1.1061.60
83 7
GrO ref erence SX 75 16 59Level stn OD) 22 4 3
Ju L1 74 12 6 11358
GrAl ref erence SX 5 74 5 11Leve l stn (m 0 0 ) 5 4 9
Grid ref erence S)1 3 98 8 56Level stn (m OD) 55 4 7
I 72 30 23 74 10919 161970
A A0 08 1
0 587
5 7
0 776 0 3890 110 0 0 282 49 1 1 09 55 7 13 9 89
18 975 66
AUG1 10 74 27
988
SEP1.8958 1113
116
M o nt h ly and yearly sta tist ics for prev ious recor d (May 19 56 st Dec 19 8 3— ov:o melets or m issing months to t al 0 .1 ye ars)
Au GI 1723 0 51388
AUG0 102
I 7 12
85
0 5310 0 191 38 62 7 33
138 1
SEP3 00032 84
3 1184
MAY JUN JUL AUG SEP OCT0 4 70 0 280 0 154 0 156 0 256 1 36 1
3 15 0 92 0 25 0 68 5 96 13 6213 13 8 8 12 6685 18 42 82 142 I BS
Mon thly and yea rly Stat i s t i c s far prev ious record (Ot t 1963 t o Dec 19 8 3— incom plet e or m issin g mo nths to ta l 0 .2 yea rs)
SEP0 5 7 110 75
13149
I 0 790 . 1166 6 7 175 1225
100
OCT6 24924 16
4,4154
OCT12 94059 4814026 3
OCT3 51919 45
8414 1
2 1330 06 96 87855 86
5310 7
Cat clo ne nt area (sg km ) 3 80 0M ax aft (m OD) 604
tro v2 1 660
6 2 8 714824 2
NOV23 14012 1 20
24 33 10
NOV3 50 327 12165144
NOV6 64 328 99153100
3 6 140 44 27 19557 0 783
13 1
DEC16 93057 8311999
DEC17 5 7044 781901/ 2
4 8322 4058 122
124 40115143
1984
Year10 .032163 .90
8 3313 09
19 100 18 680 13.560 8 133 5.78 7 3 .707 2.464 7 4 10 3 678 7 862 10 690 16 .950 9 .3 783 34 1 5 534 4 8 78 3 5 14 1 827 1 114 0 73 1 0 4 72 0 752 0 9 17 1 9 76 • 954 5 2 12
36 080 38 .750 29 940 2 1 960 17 2 70 9 522 7 334 5 .549 14 0 80 4 1 5 10 28 960 3 7.820 15 .68 1172 .70 198 .20 145 60 122 50 86 08 8 1.35 98 .87 72 .64 3 12 80 190 00 153 60 74 6 40 3 12 .80
135 120 96 55 4 1 25 17 17 25 55 73 119 7 79157 119 I I I 74 84 68 69 84 105 119 119 16 1 12 8 0
198 4 runoff is 10 7% of prewo us meanrain fa ll 102 %
19 84Catc hm ent area Isg krn) 24 7.6
Max alt Iro OD) 604
Year10 .4 93269 .8013 3 7184 8
3 852 4 460 6 037 10 740 14 540 19 520 11.0 780 99 6 0 713 0 90 5 1 119 5 04 8 8 650 7 304
10 930 8 490 26 290 28 CCO 32 960 35.540 15 .592206 50 190 30 327 60 168 20 3 17 80 54 9 70 549 .70
42 48 63 116 152 2 11 14 1292 116 140 17 1 19 7 23 5 18 24
198 4 runo ff is 9 5% of prev iou s meanrainf all 10 1%
1984Catchm ent area MCI km) 54 9
Ma x alt (m OD) 49 2
DEC Year2 762 1 4 7810 6 7 2 6 .66135 8 50157 144 3
1 0 6 1 0 834 0 59 1 0 60 5 0 83 1 1 4 8 2 140 2 906 1 .84 30 327 0 17 1 0 09 5 0 0 57 0 183 0 17 1 0 373 1 17 1 1.0 521 99 7 2 3 77 I 863 1 778 3 630 3 808 4 8 12 6 108 2 2 1017 53 23 4 / 25 22 23 79 2 1 33 22 29 76 52 74 94 28 .6252 39 29 30 39 69 10 1 142 94 499 9 1 82 96 118 127 156 171 14 4 5
19 84 runo ff is 90 % of prev ious meanrain fa ll 100 %
1984Catc hme nt area (so krn) 1 12 7
Max aft Iro OD) 299
DEC Year5 184 2 5942 1 56 39 .50123 72 7118 12 18
2 4 101.8403 .750
124 .406 75
1192
198 4 runo ff is 108 % of prev io us meanrain fal l 102 %

120 H Y D R O L O G IC A L D A T A : 1984
048004 W ar leggan at T r engoll eM easuring aut lx in ty SW W A Grid ref erenc e SX 159 6 74First year 19 69 Level st n lin OD) 70 .26
Hyd ro m etr ic st at ist ics for 1 9 84
JAN FEB MAR APR MAY Afi l JULFlow s Avg I 5 79 1 336 0 586 0 40 3 0 29 0 0 20 8 0 15 1
In ' s 5 Peak 3 29 2 66 1 9 7 0 77 0 80 0 4 1 0 22Runof f lrnml 167 132 67 4 1 3 1 2 1 16Rainfall lmm ) 26 0 109 82 8 74 23 53
M ont h ly an d yearly s t at is t ics for prev iou s re cor d (Oct 19 69 t o Dec 1983— Inca/opin e or missing mo nt h, t ota l 0 3 yearn
Mean Avg 1 49 1flow s Low 0 744
(rn' s ' I High 2 584Peak f lo w an' s 5 14 3 1Runoff Imin f 159Rainfall enrnp 187T 9 70 - 1983)
Fact o rs ef fec ti ng flow reg im e GStat io n ty po CC
1 4 7 10 75 12 90 614 85142129
048005 Kenw yn at Tr ur oMeasur ing aut ho ri ty . SW W AFirst year 196 8
Hy dro m et ri c st at is t ic s for 19 8 4
JAN ELB MAR APR MAY JuitiFlow s Av g 0 9 13 0 717 0 79 6 0 196 0 124 0 0 70
On ' s ' ) Peak 3 4 7 2 50 1 0 7 0 3 1 0 9 1 0 17Runoff imm l 128 94 42 2 / 17 9Rainfall fr iv ol 2 19 82 6 7 6 6 7 12
M on th ly and yearly st at is t ic s for prev iou s re cord Met 1988 to On 19 8 31
Fac to rs af fec t ing flo w reg im e GStat io n ty pe CC
048011 Fow ey at Restormel tw oMeasur ing a utho rit y . SW W AFirst year 19 72
Hy dro m et ri c st a t is t ic s for 19 8 4
Flow s AvgIrn)s - 11 Peak
Runoff awn)Rainfall In n )
JAN11 77025 3518678 3
M o nt h ly and yea rly st at is t ic s for pr ev io u s re co rd iNav 1972 to Dec 198 31
Mean Avg(tow s Low
In ' s '1 HighPeak flow 1m' sRunoff Imr eRainfall imm )f' 119 73 . 19831
Fac to rs aff ect ing flo w reg im e SRPGEIStat ion ty pe CC
049001 Cam el at DenbyMe as uring aut ho ri ty . SW W AFirst year 196 4
Hydro m et ri c st at ist ic s f or 19 84
JANFlo ws Avg 13 80 0 10 580
(rn' s - ' ) Peak 39 63 22 79Run off )rrim) 177 177Rainfall Inun ) 22 / 99
M ont h ly and yea rly s t at i st ics fo r prev io us rec or d (Sep 1984 to Dec 19 8 3)
Mean Avg 11 260 9 880(row s Low 4 833 4 249
(rn ' s- ti High 19 600 20 940Peak flow Im ' s ' ) 6 7.71 80 2 1Runof f frnml 144 115Ran fall lmm l 17 1 114
Fac to rs aff ect ing f low reg ime PGEStat ion ty pe V A
i 10 70 6001 588
5 2 7117132
0 69 20 48 91 0 68
4 597 166
FEB MAR APR9 05 3 2 72 7 1 80 870 57 9 80 3 60134 43 28116 76 10
MAR APR4 0 7 1 2 8 1114 43 5 9 1
52 357 1 8
0 5300 28 80 9 / 8
3 195683
8 880 9 20 2 6 998 3 73 7 2 7333 90 1 4 685 3 40 2 2 06 2 1 19 1
17 330 2 1 / 80 12 130 6 06 3 6 44 756 44 95 15 45 62 2 1 74 16 0014 1 132 I l l 5 7 43180 137 143 58 9 1
(14 230 2 160 904
5 964384
1 8500 7504 9 1619 0 72877
0 32 50 1690 68 8
4 36348 7
God ref erence SW 8204 50Level s i n (m OD) 7 16
Gr id reference SX 0 986 24Level stn (m OD) 9 24
1 1840 5751 85 7
7 0 71978
Grid ref ere nce SX 0 176 82Lev el stn Im 0 0 ) 4 6 1
AUG SEP GC E NOV0 134 0 111 0 39 5 1 40 2
0 28 I 50 1 23 2 5614 18 4 2 14479 17 1 159 250
0 33 50 1180 56 3
8 603596
1 2 100 34 32 3683 1 8 1
1989
0 44 6 0 6 74 0 9 720 196 0 20 8 0 23 31 6 77 1 557 1 / 7514 85 7 86 15 3846 7 1 100
132 137 162
A A. AGG ti r e OCT NOV0 0 50 0 054 0 0 6 1 0 118 0 6 71
0 2 7 2 29 0 72 0 45 3 707 8 8 17 9 1
54 6 7 112 112 188
MAY iruff JUL MAI St e OCT1 04 8 0 693 0 56 3 0 45 1 0 6 73 2 4962 76 1 62 1 05 1 04 5 70 7 3417 11 9 7 10 4073 23 6 1 77 172 169
2 4 720 723
10 49070 0238
152
5 25 70 6 17
I I 72035 0 7
83152
MAY JUN JUL AUG SEP OCT1 666 1 0 29 0 735 0 708 1 0 58 3 1389 40 2 48 1 29 2 25 7 70 8 462 1 13 9 9 13 4080 23 40 63 16 1 149
Catchment area (s0 kre) 25 3Max alt ( n OD) 30 8
NOV9 10618 14140248
6 02 10 92 1
15 4506 1 6092
149
NOV11 59028 43144226
1984
DEC Year1 49 7 0 8802 9 1 3.29
158 84 7169 1437
1 373 0 .8170 90 7 0 5241 949 1.22811 25 15 38145 101918 1 1476
1984 runo ff is 83 % of prev iou s meanrain fa ll 9 7%
Cai chm en t area (so km ) 19 1M ax alt (m OD) 152
LA C Year0 64 9 0 32 7
1 74 3 .709 1 539
114 1100
19 84 runo ff is 8 4 % of prev ious meanra inf all 96 %
Catchmen t area (so km ) 169 1Max alt (rn OD) 4 20
DEC Year8 63 8 4 08 618 40 25.35137 761162 1470
9 9325 796
14 260126 60157199
198 4 runo ff is 8 3% of prev iou s meanrain fa ll 9 8 %
Catc hm ent area (so km) 20 8 8M ax all (rn OD) 4 20
DEC12 72032 77163154
1984
1984
4 .9403.64 77.440
128 .60922
1 505
1984
Year5 32 539 .63804
13 0 1
7 36 2 4 175 3 390 2 40 5 2 246 2 73 2 2 902 5 3 11 7 360 11 120 5.7902 83 5 2 08 1 0 960 0 888 0 582 0 42 1 0 79 8 0 88 2 1 3 7 1 6 .552 4 .081
16 420 7 60 8 8 49 1 5 463 7 323 5 94 7 11 920 16 640 17 990 19 110 8.16 594 .75 35 42 23 98 40 0 2 40 59 45 14 125 80 92 14 79 29 22 7 90 227 .90
94 52 43 30 29 29 36 68 9 1 143 8 75120 71 8 7 86 95 96 122 13 1 15 1 169 14 13
198 4 runo ff is 9 2 % of prev ious meanrai nfall 92 %

R I V E R F L O W D A T A 12 1
049002 Hay le at St Er n sMeasunn g aut hon ty . SW W AFir st year 196 8
Hy drom et ri c sta t ist ics foe 19 84
JAN FEBFlow s Avg 2 489 2 148
(rn' s- ) Paak 4 .90 3 80Runoff Own) 136 110Reink e (nan) 724 70
M ont h ly and year ly st at ist i cs for
Mo n Avg 1.882 2 06 2flow s Low 0 746 0 863
tm' s - ) Hop 2 84 9 3 426Peak fl ow On' s- 11 6 20 6 .73Runoff (mm) 103 103Rauda a (riv al 178 10 5
Fact ors aff ect ing flo w reg ime G 19 84 runo ff is 8 7% of previou s me anStat ion ty pe CC rain fal l 9 2%
050002 Tor r idge at Torr ingt onMeasurtng aut ho ri ty SW W AFir st year 1962
Hy d rom et r ic st at is t ic s for 1984
Flows AvgIn I ' s ' '1 Peak
Rin o ff (rt wrgRainfall
J AN5 7 5 102 78 40
13 223 2
Fr a30 240180 20
1149 7
M on t h ly an d y earty st at ist ics for prev io us re cord (Oct 1962 to Dec 1983)
Mean Avg 28 800 14 640 19 340eow s Low 5 0 18 4 695 8 / 0 3
(m3s 11 Nigh 53 4 10 4 7 590 5 1 280Peak flow en1/4 - 11 39 1 10 294 40 53 5 60Runoff Imml 116 9 1 78Ran fall (mml 175 9 1 99
Fact ors af fec t ing flow reg ime SRPGE1Stat ion ty pe VA
052006 Yeo at Pen Mil lMeasuring aut hor ity . W W AFirs t year 196 2
Hy drom et r ic st at is t ic s for 198 4
M A R A PR MA Y JU N A A Au° SEP OCT NOV0 92 7 0 58 6 0 4-45 0 3 73 0 240 0 199 0 193 0 248 0 8 79
1.30 0 88 0 95 0 45 0 34 0 26 0 .33 0 4 1 1.125 1 3 1 24 20 13 11 10 14 4 759 10 8 1 6 39 4 1 119 112 17 1
p rev io u s reco rd (Oct 195 7 to Dec 198 3— incomMen or :meo w mo nth s to ta l 9 .3 ears)
1.689 10 29 0 6 75 0 5 10 0 4 13 0 34 8 0 363 0 48 1 0 90 10 .8 10 0 .573 0 4 75 0 33 5 0 23 7 0 167 0 208 0 179 0 18 12 .582 1 64 1 1.464 0 85 9 1 06 3 0 743 1 06 7 1.140 2 29 7
5 83 3 0 7 2 36 1.77 1 99 2 27 1 88 2 32 3.8 193 55 3 7 2 7 13 19 19 76 48
102 62 6 7 63 64 77 95 I I I 125
M A R5 1923 7 11
2353
A PN4 23 432 10
178
10 1003 081
28 120153 00
3965
God reference SW 54 934 2Level stn (rn OD) 7 0 0
Grod ref erenc e SS 500 185Leve l s i n (rn 0 0) 13.9 5
MAY1 8 7910 84
55
JUN1 09 32 53
42 1
9 0 15 5 0041 594 1 136
3 1 290 14 960205 70 18 1 30
36 2077 / 4
GrKI ref erenc e ST 5 73 162L ev el stn (m OD) 23 85
JAN PH M A R APR M A YFlow s A v g 6 9 15 3 384 2 24 1 1 355 0 / 8 7
trn1/4 - 11 PeakRunoff lmm) 8 7 ao 28 16 10 8Rogge onng 169 48 sa 3 8 1 33
M on t h ly an d yea rly st at is t ic s for prev io us re cord (Nov 1983 10 Dec 1983)Mean Avg 5 1/ 6 4 66 4 3 860 1 848 1 69 5 1 134flow s Low 0 485 1 168 0 90 9 0 53 2 0 356 0 229
(m' s - ' ) Hig h 8 6 12 10 06 0 7 0 60 4 223 4 88 7 2 49 8Peak flow On' s ' )Runoff 1mm) 65 53 49 22 2 1 14Ran fas (mm ) 94 73 80 48 7 1 62
Fac to rs aff ect ing flow reg im e RStat ion ty pe C VA
J UN J UL A UG0 62 6 0 323 0 363
0 6 780 1931 909
052007 Par ret t at Chiselbor ou ghMeasuring aut hor ity W W AFirst year 196 6
Hy drom et r ic st at is t ics for 1984
Flows Avgtrn1s- 11 Peak
Ronoff ( n m)Runfall (mni)
J AN4 90022 86175190
FEB1 2823 684344
Mean Avg 2 25 1 2 0 12fl ows Low 0 258 0 59 3
(m' s ) Nigh 4 0 19 3 865Peak how en' s ' ) 36 38 22 95Runoff (mm) 8 1 66Flasnfas (mm) 103 79
Fac to rs aff ect ing flow reg ime NStat ion ty pe C
MAR1 0 139 133665
APR0 654
3 9823
3
Gr.d ref erenc e ST 4 6 1 144Level stn (rn OD) 20 72
M A Y0 44 2
1 551684
Ju N0 36 4
1 831335
Mon t h ly an d ye ar ly st at is t ics for prev io us reco rd (Aug 1966 t o Dec 198 3)
AA Au 0 SFP0 635 0 652 3 775
2 44 5 89 48 943 3 15
75 167
4 6 7 1 4 4 79 7 20 20 44 3 0 253 0 95 4
2 1 540 14 260 45 9 103 10 60 228 50 4 15 00
19 18 2873 BO 98
4 523 as 83
J UL0 194
0 227
24
0 69 00 1661 60 7
Au G.0 2 11
0 44
54
5
0 99 70 3 165 174
SEP0 145
0 295
75
OCT25 750149 30
10415 1
Catch me nt area (so km ) 48 .9M ax alt (nn OD). 238
NOV52 9 7074.1 40
20 71 16
1.5320 .50 32 5 15
6 3 184
140
ot C38 59 0128 90
156134
14 3 10 24 99 0 30 7600 668 3 798 10 2 70
49 230 49 4 10 6 4 53022 5 00 3 13 20 730 00
58 98 114106 133 130
1984
DEC Y e a l
1 53 6 0 8 552 .38 4 .908 4 55 1
12 1 1053
0 .9860 .6531.2586.73
6361139
1984Catchment area (so km) 6 63 .0
Max alt (m OD) 62 1
Year18 .5932 70.40
88 51259
15 .2448 .968
21.038730 .00
725115 1
1984 runo ff is 122 % of prev iou s meanrain fa ll 10 9 %
1984Catchm ent area (sig km) 2 13 1
Max al t (rn OD) 2 52
SEP OCT NOY DEC Year0 426 1 0 77 4 774 4 715 2.249
I A 58 59 33498 153 9 7 900
2 1880 3 729 808
3 3820 455
12 800
OCT NO V0 2 73 2 0 11
0 8 1 12 1410 7094 165
4 462I 0 799 09 9
2 55 71.09 3 '3.594
9 9 12 1 7 4 1 56 37955 se 79 79 88 98 89 1
1984 runoff is 88 % of previ ous meanrain fa ll 10 1%
1984Catchm ent area (sg kn g 74 .8
Max a Irn OD) 2 19
DEC2 26411 0 5
8 195
Year1.14622 .86486928
1 684 0 .760 0 764 0 53 7 0 37 1 0 33 9 0 46 5 1 119 1 24 5 1 988 1 12 50 523 0 28 5 0 20 6 0 130 0 106 0 090 0 193 0 186 0 2 18 0 523 0 .5843 0 55 1 58 1 1 7 18 1 053 0 92 1 0 59 1 2 225 4 8 19 3 789 3 9 17 1.5342 7 46 12 34 2 1 73 12 8 1 16 14 7 92 15 29 2 7 22 29 12 44 94 44 94
60 16 2 7 19 13 12 16 40 43 71 4 7585 43 74 66 54 66 82 8 7 83 102 924
198 4 runo ff is 102 % of prev ious meanrainf all 100 %

122 H Y D R O L O G IC A L D A T A : 1984
0 53 0 0 4 C he w a t Co m p t o n D a n d o 1 9 8 4Me as uring aut ho rit y W W A Grid ref erenc e ST 6 48 64 7 Catc hm ent area (so km) 129 5First year 19 58 Level st n lin OD) 16 76 Max all Irn OD) 305
Hydrom et ri c st at is t ic s for 1 984
r u tJA N MA R APR MA Y JUN A A. OCT NOV DI C YearFlow s
AUG SFPA vy 3 9 3 5 2 4 44 0 9 5 1 0 6 56 0 6 13 0 46 1 0 35 5 0 34 5 0 456 0 65 7 2 22 1 1 83 7 1 244
lra ' s - 1 Peak 32 54 6 37 3 0 4 0 89 2 13 0 8 4 0 6 1 0 77 5 48 2 20 15 06 1 15 32 54Rur o ff fra r e 81 4 7 70 13 13 9 1 7 9 14 4 4 38 30 3
1Ra infall Un ne 198 60 54 3 9 7 3 2 38 54 164 1 15 162 13 10 90
M on th ly an d yea rl y s tat ist ic s for p rev io us rec ord (Oct 1958 to Dec 1983— incomplete o r missing months total 1.0 yen )
M aim Avg 1 786 1 680 1 43 8 0 98 6 0 8 30 0 60 9 0 4 6 7 0 4 32 0 56 1 0 8 19 1 176 1 70 5 1 038flo w s Low 0 4 44 0 5 5 7 0 4 16 0 46 9 0 0 5 7 0 78 8 0 25 1 0 195 0 2 32 0 30 2 0 2 72 0 62 6 0 54 5
hnl s 1 Flogo 3 76 5 4 166 4 2 10 2 185 2 493 1 2 11 0 8 11 0 63 8 2 135 3 25 1 3 89 8 5 0 17 1.16 7Peak f low Irri Fs 1 25 4 9 4 0 90 50 00 14 19 6 7 50 13 00 6 23 6 09 59 76 49 56 30 83 63 78 6 7.50Runo ff l rnm i 3 7 3 2 30 20 17 12 10 9 1 1 17 24 35 253
'Rainfell (rem) 9 7 / 1 8 1 6 2 72 7 1 70 83 9 5 88 10 3 13 100 6
Fact ors aff ect ing flow reg im e SRPGE1 198 4 runoff is 120 % of previou s meanStat ion ty pe FL rainf all 108 %
0 53 0 0 7 Fr o m e ( So m e r se t ) a t Te l l isf o rd 19 8 4M easu ri ng autho ri t y W W A Gr id ref erence ST 80 5 56 4 Cal chman t area (so km) 26 1 6First year 196 1 • Level stn . Im OD) 3 5 0 5 Max alt (rn OD) . 30 5
Hy d ro m et r ic s tat ist ics fo r 1980
JA N FEB MA R APR MA Y JUN JUL NOV AUG SEP OCT DEC Year
Peak f low (in ' s - I 77 99 64 75 68 83 5 7 5 1 98 80 3 7 52 108 10 8 2 49 7 1 0 3 40 24 84 58 83 64 108 10Runo ff Wore 66 59 60 36 29 19 15 15 18Ran dall (mm) 92 70 89 6 1 77 6 7 64 / 9 9 1
Fac to rs af fec ti ng flow reg im e RG EI
5 14 1in n wrm FL
Fac to rs affec ting flow reg im e PGEIStat ion ty ( e FL
198 4 runoff is 104 % of prev u us meanrain fall 10 2%
0 53 0 0 9 W al lo w Br oo k a t W al lo w 19 8 4Measuri ng aut ho ri ty W W A God re fe renc e ST 74 15 8 1 Catchment area (%0 km) 72 6Firs t year 19 66 Level stn en OD) 43 74 Max alt (m OD) 220
Hy d ro m etr ic s tat ist ics fo r 1984
JA N FEB MA R APR MA Y JUN JUL AUG SFP OCT NOV 04C YearFlow s A vg 4 128 2 3 9 9 1 16 7 0 8 14 0 56 5 0 40 0 0 79 3 0 23 3 0 38 5
onTs ' I Pear 1 I 6 7 5 24 2 90 ' 1 3 7 2 3 1 1 14 1 82 1 417 3 4 6Runo f f tmm 152 83 43 29 7 1 14 11 9 14
Ran ta:i enm) 20 3 66 58 2 95 28 38 4 8 148
M onth ly an d yea rl y s t at i st ic s for p rev io us recut () (Jan 1966 to Dec 198 3)
M ean A vg 2 199 2 3 30 1 9 15 1 2 35 0 98 4 0 6 73 0 4 82 0 3 9 1 0 5 15flow s l ow 0 6 4 1 0 895 0 688 0 600 0 328 0 24 4 0 157 0 119 0 199
(rn' s-1 ' High 3 142 4 429 3 708 2 111 1 90 7 1 30 6 1 680 0 72 7 2 00 8Peak f low On ' s - ' 1 15 1 1 2 2 36 13 7 1 1 1 0 8 23 16 6 8 4 19 b4 3 / 9 15 0 7Runo ff w i no . 8 1 711 73 4 4 36 24
18 14 18
Rara fall Imm l 10 3 8 7 93 6 1 8 1 73 62 76 9 7
19 8 4 ru no ff is 108 % of prev ious meanrain fall 104 %
0 53 0 18 A v o n a t B a t hf o rd 19 8 4M easuri ng aut ho ri ty W W A Grid ref erenc e ST 7866 7 1 Catc hm ent area (so km) 155 2 0Firs t year 19 69 Level stn . (m OD) 18 00 Max all (m OD) 30 5
Hyd ro m etr ic st at ist ics f or 1984
JA N TEO M AR APR MA Y JuN JUL AUG SFPFlow s A vg 5 1 2 70 29 240 15 0 80 9 8 70 7 35 1 5 446 3 4 13 2 9 77 4 54 5
on1s - 1) Pea k 166 90 79 20 4 / 33 16 34 7 1 34 9 9 1 5 0 5 9 28 22 14Runo f f Imm , 8 8 4 7 2 6 16 13 9 6 5 8Rara rall enn e 148 4 6 5 1 2 8 1 23 32 55 130
M onth ly and yearly st at is t ic s fo r prev iou s reco rd (Dec 1989 10 Dec 198 3)
M oanf low s
Avg 30 950 32 340 28 200 16 580 13 350 10 580 6 72 1 5 80 5 6 959Low 9 22 5 11 3 70 10 080 1 / 18 5 04 7 3 89 8 2 4 11 1 7 15 3 74 8
Inn ' s - .) High 45 300 64 340 54 220 77 690 3 1 0 20 30 110 9 955 10 600 25 450Peak f low uri Fs i 158 90 226 50 193 30 119 60 22 7 00 165 60 54 93 64 I I 19 1 90% fl u ff Imml 53 5 1 49 28 23 18 11 10 17Rai n fa ll Im m r 84 63 8 1 49 62 68 52 63 8 1119 70- 1983 1
Fact o rs af fec ting flow reg im e- RPGE 19 84 ru no ff is 99% of prev iou s meanStat io n ty pe VA rainf all 10 5%

R I V E R F L O W D A T A 123
0 54 00 6 Sto u r a t Kidde rm ins te rM easu ring a n laa rn y STW AFir st year . 19 53
Hy deo m et i c Sta ti sti cs f oe 19 84
J AN FEBFlow s Avg 3 928 3 30 5
(ne s 1) Peak 8 .72 8 53Runoff (nun) 32 26Ramie (mm) 84 38
Mean Avg 3 63 7 3 458flo ws l ow 1 703 1 52 7
trn' s - 11 WO 7 40 9 6 .53 7Peak fl ew (rn' s - ) 6 / 96 20 96Runo ff (nun) 30 26Rainfal l Imm l 62 49Fact ors af fec ting flow reg ime Gi lSta tion ty po V A
Mean Avg 2 7 6 10flow s t ow 6 28 1
OnFs Fig h 5 1 620Peak fio w (m1/4 - ' ) 256 60Runoff (mm) 65Rai n fa l (mm) 85
Fact ors aff ec ting (lo w reg im e N
St a t io n ty pe VA
MAR3 16712 58
2660
M onth ly and y e a r ly st at is ti cs for prev iou s rec ord (Oct 1953 to Dec 1983)
0 54 0 08 Te m e a t Te n bu ryM e a s u r in g aut ho rny STW AFirst year 195 6
Hy drom et ric St a t i s t i c s foe 19 84
JAN FEB M A R A PRFlo w s Avg 43 660 33 0 70 16 360 7 36 7
le l f s - ' 1 Pea k 1 18 20 117 00 68 56 18 15Runo ff (rnm) 103 73 39 17Rainfal (rnm) 133 60 60 7
M on t h ly and y ea rly s t at is t ics for pre v ious rec o rd (Oct 1956 to Dec 1983)
0 540 12 Te r n a t W alc o tM ea su r in g aut ho ri ty STW A Ca d re f e re n c e SJ 59 2 123Firs t yea r 1960 l evel stn Im OD) 44 60
Hydro m et ri c st at is t ic s foe 19 84
JAN FEB M A R A PR M A Y J UNFlo w s A v g 1 1 0 2 0 10 F14 0 6 6 10 4 652 3 53 7 3 78 7 2 064
trn3s - 11 Peat 25 95 26 45 15 6 1 7 50 6 4 7 11 49 3 5 /Runoff ( rim) 35 32 2 1 14 11 12 6Rainfrel (mm) 8 1 42 4 7 9 52 55 25
M on t h ly and yearly s tat is t ic s foe pre v ious reco rd (Oct 1960 10 Dec 198 3)Mean Avg 11 030 10 560 9 104
. flow s l ow 4 0 18 4 00 2 4 800) Ho h 20 320 22 280 17 8 10
peak flo w frn t s i l 45 3 1 4 5.98 40 53Runoff (mm) 35 30 29Rainfall (mm) 59 48 54
Fact ors af fecting flow reg ime GStat ion ty pe: FV
Me asuring aut ho ri ty . ST W AFirst year . 196 2
Hy d rom et ric st at ist ic s for 19 84
JAN FFBRows Avg 5 6 75 5 703
(rn' s- ' ) Peak 27 11 28 26Run off )mml 44 4 1Rainfall Anne 89 5 1
APR2 04 7
2 12165
24 900 22 190 13 960 11 400 6 165 4 22 28 009 7 433 4 69 2 2 5 71 1 558 1 00 8
56 000 5 1 940 28 630 35 380 13 090 2 1 92019 1 80 165 40 12 1 50 700 30 79 52 114 10
53 52 32 27 14 1065 70 59 66 57 58
0 54 0 19 A v o n a t S t ar e t o n
MAR3 72818 99
1954
7 1623 55 7
12 32040 73
225 1
A PR1 2833 1/106
Grid reference: SO 829 768Level stn . (i n OD) 30 .50
M A Y1 27713 13
1959
JU N2 363
8 401946
Grid ref erenc e SO 59 76 86Level stn (m OD) 48 00
M A Y4 0 8 71 1 92
1056
6 8522 9 17
22 39040 35
2266
JUN3 724
9 / 89
53
Grid ref erenc e SP 3 3 3 7 15Level stn (m OD) 54 7 1
M A Y
0 9334 4 7
760
J UN0 78 4
1 896
49M ont h ly and yea rly st at is t ic s for prev iou s record (Oct 1962 to Dec 19831
Mean Avg 4 28 1 4 554 4 34 6fio ws Low 0 798 0 777 0 54 5
(mTs 1) H uh 8 143 12 890 8 577Peak flow )rn' s ' g 38 23 59 60 55 89Runoff (ning 33 32 34Rai nf al l (m m ) 5 2 46 5 6
Fa c t o rs a ff e c t in g f lo w re g im e S ElSta t ion ty pe C
AA2.5236 962 122
A UG2 .56410 .732 173
3.349 2 .750 7 633 2 3 17 2 116 2 283 2 35 6 2 .454 2 9 11 3 39 7 2.8021.163 1 344 1.424 1.128 1 0 49 0 89 5 1 36 8 1 335 1 5 76 1 53 / 1.86 56 244 4 84.4 6 46 8 3 43 8 4 404 3 80 1 4 058 5 7 13 6 38 6 / 06 2 4 1368 1 55 16.90 20 94 18 52 19 20 34 50 19 40 22.95 15.0 1 45 46 81.55
28 22 22 19 17 19 19 20 23 28 27354 49 63 55 59 69 6 7 57 63 68 715
198 4 runo ff is 10 7% of previou s meanra inf all 10 1%
A IL1 84 61 53
472
4 656 4 04 52 199 1 39 39 06 9 14 0602 7 00 48 7 1
14 1355 55
JU L0 4 13
1 l b3
24
AUG1 59 13 7 )
476
4 1550 745
16 680158 00
1072
AUG2 640
3 968
55
3 8661 17 16 65538 53
1262
AUG0 555
2 114
56
St P2.566
9 772 199
SEP2 465
8 826
124
6 59 31 085
29 650196 20
1585
SEP1 9 18
4 259
89
4 0891 6809 49030 30
126 7
SEP0 629
1 785
79
OCT2 454
1 332059
OCT9 4 1729 03
2284
OCT3 1913
5 2611958
5 7952 22 7
16 9203 7 38l e59
OCT0 722
2 2 16
65
Cat chm en t area (se km ) 3 24 .0M ax ah . (t OD) 3 16
NOV5 56216 4 4
4 4128
DEC3 3 1411 06
2 750
1984
Year3.00616.44293723
1984C a t c h m e n t a re a (se km) 1134 4
Mat alt (m OD) 54 6
NOV40 380138 40
92152
11 640 15 950 24 6 501 34 7 3 0 85 5 56 5
43 130 50 140 5 7 290232 80 168 30 26 6 50
27 36 5872 8 1 9 2
NOV15 19044 54
46140
1 8542 538
2 1 8304 3 33
2468
ra3v3 60 125 28
2 710 5
C6 C30 0 70
84 66717 7
DEC10 0002 1 86
3 153
10 7903.56 3
24 9 5055 823468
GEC3 0 3 1
5 5 12345
Year16 189138 .40
44 9904
14.4 157.2 78
23.48 826 6.50
40 1862
1984 runof f is 1 12 % of v ev rous meanrain fa ll 105 %
1984Catchm ent area (so km) 8 52 0
Ma x al t (m OD) 3 66
Year6.37 144 .5423 5706
7 1383.757
10.26655 82264712
1984 runoff is 89 % of previ ous meanrain fa ll 99 %
1984Catchm ent area (so km) 34 7.0
M ax alt (rn OD) 2 10
Year2.25528 .26204683
2 703 2 34 1 1.274 1 04 4 1 09 3 1 0 76 1 558 2 168 3 885 2.5200 485 0 4 74 0 36 8 0 24 7 0 356 0 44 2 0 50 7 . 0 .549 0 66 7 1.0945 558 6 149 3 20 2 5 3 79 3 332 2 858 5 .274 5 3 11 10 400 3 .58 842 6 7 39 05 2 7 34 7 1 36 26 08 16 59 32 89 34 11 56 28 71.3616
10 18 10 8 8 8 12 30 22 949 59 57 54 69 56 49 55 6 1 663
1984 runo ff is 89 % of prev a us meanrain fa ll 10 3%

124 H Y D R O L O G IC A L D A T A : 1984
0 54 02 0 Pe rry a t Ye a t o nMeasuring aut hOf it y STW AFirst year 1963
Hydro m et r ic st at is t i cs for 19 8 4
J A N FEB M A R A PR M A Y .A INFlows Avy 3 82 1 2 865 1 48 4 1 04 0 0 730 0 58 3
In1 /3 ' 11 Peak 8 00 6 93 2 71 1 50 1 24 0 98Rona° (mi ff 5 7 40 22 15 11 8Rainfall Imm) 11 1 42 38 9 44 42
M ont h ly and yearfy st at i st ics for pre v iou s reco rd lOct 1963 to Ds< 1983 )
Mean Avg 1 83 8 2 778 2 487 1 668 1 529flow s 1 ow 0 90 1 0 859 1 25 7 0 742 0 583
fm' s- 1 High 4 777 6 50 7 4 265 3 04 1 4 232Peak flow (o17s ' I 11 50 11 29 11 12 8 5 7 10 4 1RJnoft MAN 42 3 1 3 7 24 73Rain fall (imn) 66 56 64 48 6 7
Fac to rs af fecting flow reg im e N GSta t io n ty pe C
Measur ing a u t h o r it y lHFirst year . 19 53
Hy dro m et r ic s t at is t ic s for 19 84
Muan Avg 0 748 0 584flow s Low 0 382 0 136
Im ' s ) MO 1 5 7 1 1 104Peak flow 0, 7s ' g 12 19 14 00Runoff from/ 230 16 3Rainfall fmm/ 283 179
Fredors aff ec t ing fl ow regime NSta tion ty pe FL
0 550 08 W y e a t Ce fn Brw y nMe asuring aut ho rit y WIFirst year 195 1
Hy dro m et ri c st at is t ics fo r 1 9 84
Flow s Avg1ro5s ' 11 Peak
Runoff Rnm1Rainfog loan)
M onth ly an d yearly st at i st i cs for prev io us reco rd (Aug 1951 to
Mean 4 vg 0 944 0 762 0 66 3flow s Low 0 5 19 0 158 0 79 0
( n ' s - ' ) H O 1 8 70 1 48 6 1 73 5Pea r f lo w I.A 1s .1 23 4 7 19 20 16 9 1Runoff RNA/ 24 3 178 17 1Rair fal (min) 257 17 1 194
0 5 50 13 A rr o w a t Tit le y Mi l lMeasuring a u t h o r it y W ELSFirs t year 1 9 66
Hydrom et r ic s tat is t ic s for 1 9 84
Flo ws AvgOnfs '1 Peak
Runoff 1mm)Rainfall (rnm)
J A N7 50525 8 7159206
FEB5 14828 7210275
0 6040 1891 56 714 531862 13
M A R1 6694 593562
0 32 1(J 0460 8 7811 6496
130
0 5240 0 641 3 1219 1213 1149
A N i1 004
1 832 1
7
Grid ref erenc e SJ 4 34 192Level St n Im OD) 6 1 2 7
0 2580 04 80 8 18
9 8680
143
0 4 180 0 541 14417 89108139
M A Y(/ 52 6
0 931160
0 993(13 792 04 6
8 4 9145 /
0 34 10 0 740 84425 4985
139
JUN0 4 17
0 9 19
44
M ont h ly and y ea r ly st at is t ic s fo r prev io us rec o rd (Oct 196 6 to Dec 1983)
Mean Avg 4 694 4 7 18 3 84 7 2 04 5 1 98 1 1 185f lo w s I o w 1 886 1 936 1 629 0 96 2 0 54 9
frn7s ' I High 9 00 3 7 6 77 8 93 3 4 176 5 00 1Peak flow (mIs ' '1 63 98 39 94 5 7 85 19 4 1 32 49Runoff (mrof 99 81 82 42 42Rainfall (mr o 10 6 84 90 57 79
Fact o rs aff ec t ing flow reg im e PStat io n ty pe V A
0 3322 55913 092465
J UL0 358
0 485
15
0 7770 2 / 12 735
7 871260
0 54 02 2 Se v e r n a t Ply n l im o n f lu m eGrid ro/ crenc o SN 8 53 8 72Level stn rn 0 1) ) 33 1 00
0 20 7 0 2850 045 0 0 600 455 0 754
6 / 8 6467 88
13 1 154
Grid ref erence SN 829 8 38Level stn en OD) 3 4 1 0 1
JAN FEB MAR A PR M A Y J UN J UL1 506 0 930 0 20 6 0 093 0 0 57 0 108 0 05 311 17 6 6 1 1 16 0 19 0 38 0 4 3 0 13388 224 53 23 15 2 7 144 18 209 7 1 19 63 87 4 1
De< 198 3— n complete
0 4420 0951 26419 11114164
Grid ref erenc e SO 3 28 585Level stn Im OD) 129 0 2
JUL0 24 3
0 4 15
2 7
AVG0 436
0 646
64
0 7490 2081 4 16
5 491162
0 38 20 03 70 89 924 991 18
180
0 56 70 0361 4 7848 8 7146192
AUG0 23 1
1 535
8 1
SEP0 49 7
1 147
103
0 7660 3501 785
7 32
7 1
0 52 50 0 731 09 212 9 115623 3
0 68 10 0 501 4 / 815 93170209
SFP0 353
1 227
147
OCT0 63 7
1 769
7 1
• 1840 4 123 30 8
7 251864
0 60 60 059I 46317 2218725 1
OCT1 55 86 0 333
113
C a t c h m e n t a n .11 (s r' km) 180 8Max aft (rn OD) 3 56
NOV3 10 3
8 5944
142
1 7760 42 72 88 610 022577
JAN N fl MAR A PR M A Y JUN A t AUG SEP OCT NOVFlow s Avg 1 0 75 0 739 0 17 1 0 088 0 048 0 06 6 0 0 54 0 0 / 7 0 5 19 0 859 0 9 14
(rnFs '1 Peak 9 88 6 16 0 9 7 0 13 0 46 0 25 0 14 1 65 3 45 5 93 8.20Huro n Irnm1 33 1 2 13 53 26 15 20 17 24 155 26 5 2 72Ra S all knnO 39 3 20 1 65 19 58 80 39 138 268 304 3 11
M ont h ly and yea r ly st at is t ic s fo r prev io us rec o rd (Oct 1953 to Dec 198 3— incomplete or miasma months tota l 10.8 years)
1984 runo ff is 90 % i lf prev ious meanrain fa ll 9 7%
Catchmen t area (s() km ) 8 7Max all (m OD) 74 0
0 7620 2681 30 717 7623 328 5
AUG SEP OC T NOV
0 119 0 EP 7 1 123 1 0642 11 5 43 9 33 8 543 1 704 28 9 26 5
143 29 8 3 15 3 12
or m issin g mo nt hs t otal 2 5 years)
0 796 1 0390 09 2 0 3 762 0 3 1 1 60024 32 29 15205 259238 2 70
nOy6 26 128 98128183
1984
111C Year2 642 1.5 16
6 06 8 .5939 26468 74 9
2 677 1.6810 84 8 0 8096 24 4 2 .33 512 5 7 12 .5740 293/ 9 771
1984
DEC Year0 7 12 0 44 3
5 42 9 .882 19 160824 1 211 7
0 73 7 0 .5030 174 0.3341 304 0 .64617 11 24 99227 182529 2 248 0
198 4 runoff is 8 8 % of prev io us meanrainf all 8 5%
19 84Catc hm ent area (so km) 10 4
M ax alt (m OD) 752
DEC Year0 99 7 0 .589
9 59 11 • 7257 1789246 2219
• 10 1 0.6900 198 0.44 72 655 0 99432 00 48 .8 7283 209 230 3 2425
Fact ors & f eel ing flow reg im e 1984 runo ff is 86 % of prev iou s mean
Steno ^ W e CC rain fa ll 9 2 %
DEC y ea4 083 2 .4 1712 29 28 .98
8 7 60 295 1 100
19 84Catchm ent area (sq km) 126 4
Ma x all Im OD) 54 2
0 788 0 60 1 0 9 14 2 032 2 88 9 4 30 6 2.4530 2 11 0 154 0 7 77 0 29 4 0 66 2 1 69 4 1.3093 842 1 182 2 459 6 9 16 5 68 2 7 56 6 3 4 1830 68 9 59 18 85 36 45 25 96 63 34 63 98
17 13 19 43 59 9 1 6125 1 73 98 87 95 I I I 99 6
1984 runoff us 98 % of prev ious meanrain fa ll 110 %

R I V E R F L O W D A T A 125
0 5 5 0 14 Lu g g a t By t o nMeasurin g aut hor it y . W EISFest year 1966
Hy dr om et ri c sta t i st i cs for 19 84
JAN FEB MAR APR MAY AJNFlows Avg 11.940 9 26 8 3 428 2 146 1.186 0 .899
(m 7s - I): Peak 25 .78 26 60 8 76 3 88 1 43 1.76Runof f (nen.) 157 114 45 27 16 11Rat ila (min/ 20 1 81 64 6 60 413M oM My and yea r%) st at is t ics fo r previ ous re co rd lOct 1968 to Dm 198 3)
Mean Avg 7 18 8 6 .950 6 289 3 852 3 48 1 2.073flow s Low 2 99 1 2.630 2.94 7 2 0 16 1.202 0 772
On1/4 - ' ) WO 11.2 70 12 .870 13 980 7 106 7 994 3 .989Peak Dow tm' s" ' I 54 2 7 3 7 53 33 24 17.6 1Ramon (nm ) 96 83 83 49% M al Na n/ 114 8 7 94 62
Factcus af fec tmg flo w regv neStand . ty pe FV V A
0 5 50 18 Fro m e a t Ya rk hi l lMeasuring aut ho ri ty W ELSFirs t yea r 1968
Hy dro m et ri c st at is t ics fo r 19 84
JAN FEB MAR APR ma yFlow s Avg 2 98 7 1 84 2 1 6 76 0 795 0 .54 1
MN ' ') Peak 15 96 7 26 10 2 1 1.59 1.22Runo ff Imm) 56 32 3 1 14 10Ra ntal (mm) 9 2 33 58 6 61
Mon th ly and yea rly s tat i st ic s for prev iou s reca d lOct 1988 t oMean Avg 2 633 2 637 2 432fl ows Low 0 1 14 0 389 0 560
(m7s- ' 1 S ae 4 660 5 456 5 176Peak f low (m' s- `) 23 .84 24 99 24 28Runoff enm) 49 45 05Ra nto (mm) 73 55 66
Fact ors aff ect ing flo w reg ime EStat ion t ype V A
M easuring aut ho ri ty W ELSFast year . 1969
Hy dro m et ri c s tat is t ic s fo r 19 84
1 1420 3592 29814 742 145
0 5502 3 W y e a t R e d b r o o k
God refetenct SO 36 46 4 7Level stn . (m 0 0 ) 124 0 7
45 56 10 .7226
84 63
Grid re fe rence SO 6 154 18Level stn (m OD) 5 5 .38
1.2030 2 743 9 7125 .89
2263
A IN AA AuG SEP0 366 0 196 0 150 0 174
1 0 1 0 .25 0 4 7 0 367 • 3 3
46 11 63 103
Dec 198 3 - in com plet e or messi ng mon ths
0 64 70 146I 34916 99
1255
Grid ref erence SO 528 1 10Level stn (m OD) 9 .10
JAN FEB 74AR APR ma y J UN AA AuG SEPFiow s Avg 20 2 90 3 135 500 44 350 28 .980 18 840 14 020 8 227 8 793 28 320
An l 4 - i I Peak 4 78 30 44 ( 00 119 60 4 7 8 7 27 15 22 45 12 43 22 92 96 72Runoff (mm) 136 85 30 17 13 9 5 6 18Ran tam (mm) 185 70 58 6 6 7 4 1 19 73 134
'M on t hly and yearly s t at ist ic s for prev io us re cor d (Oct 1969 10 Doc 1983)Mean Avg 130 200 125 800 108 200flow s Low 56 .630 46 880 3 7 490
lm35- '1 K oh 2 14 400 234 000 24 5 50 0Peek fl ow onl y - 1 4 4 7 40 423 30 6 7 1 20Runoff ( nm) 98 50 102Rao lal (rnm) 117 85 94
Fact ors aff ect ing flo w reg im e $ P EStat ion ty pe . V A
0 56 0 13 Ysc ir a t Pon t a ry sc irMe asuring aut ho ri ty W ELSFest year 19 72
Hy dro m et ri c st at is t ic s for 1 984JAN FEB
Flows Avg 5 79 5 3 29 2Peak 36 98 22 52
Runoff (rem) 24 7 13 1Rental (mm) 286 108
M on t h ly and year ly s tat is t ics fo r
Mean Avg 3 1 76flow s Low 1.146
(m7s- '1 lege 5 5 78Peak fl ow (7n74- ' ) 33.3 1Runoff (mm) 140% M all (rnm)• 156•( 19 71 1983)
Fact ors aff ect ing flo w reg ime NStat io n t yp e C
2 7741 8684 9593 1 7810 7112
2 7741 1706 30 340 .55118145
60 920 46 13025 450 16.4 70
100 200 125 00 3226 50 358 70
4 1 4959 74
7.142 1 1160 43 1 0 2692 357 3 04 112 19 14 8 15 1 4666 86
32.05010 96063 490( 78 00
266 5
0 6890 1 141 78874 331869
A ll0 60 3
0 778
25
Grid ref erence: SO 00 330 4Level stn . On OD) 16 1 18
AuG0 6 17
1 968
77
SEP0 .72 1
1 369
13 1
1.482 1.143 1 366 2 845 4 13 2 6 393 1 93 70 557 0 4 14 0 .678 0 657 1 7 19 2.9 78 2 32 15 253 1.992 3 0 79 7.96 2 8 636 10 350 4 .95426 16 9 .52 12 46 28 5 1 19.98 37 49 54 .27
19 15 17 37 54 84 81155 73 99 88 9 7 114 1030
1984 runo ff is 103 % o f prev iou s meanramfall 104 %
0 3620 0 9 10 630
5 967
46
10 9807 433
30 85053 37
1453
0 4540 1661 11737 06
1973
0 3330 06 30 538
6 046
66
23 5905. 178
40 11073 66
1277
0 56 10 1041 25028 8 1
2492
0 34 90 19 70 9 7015 68
66 7
3 1 14014 87074 49026 1 30
3 195
1 2240 2833 94 72 1 445 1
154
Catchment area 1s0 Simi ' 203 .3M ax alt . (rn CO ) 6 60
eX 11.89 7 8 .774• 88 2 7 2225 112
1 10 16 7
Catchm ent area (so krn( ' 144 .0Ma x alt . Irn OD) 144
OCT MOV0 222 2 26 5
0 72 18 5 34 4 1
76 130
t otal 0 .1 years)
0 .53 7 0 9000 155 0 17 12.405 2 20 910 34 (3 42
10 1653 60
. MAR APR 744.Y A M J UL AuG SEP OCT NOY0 852 0 .086 0 3 10 0 4 10 0 150 0 134 0 893 2 669 4 924
2.69 0 85 1.97 2 2 1 0 32 0 33 4 3 1 14 3 1 30 2936 20 13 17 " 6 6 3 7 114 20 360 8 83 55 32 94 173 182 264
prev io us re cor d (M ay 19 72 to Dm 1983 - incom plet s ow rei ssl og mont hs t otal 0 .2 year s)
DEC Y• ar7. 1) 7 4 .05016 46 27.2294 8 2 7
10 2 10 73
IN C2 130
6 9 74063
1 9 8 4
19 8 4
Year1. 11218.5124474 3
2 008 1.2 800 2 10 0 .8723 594 1.82825 14 25 893 7 27673 72 2
198 4 runof f is 8 8 % of prev ious meanrain fa ll 103 %
OCT77 820227 20
5212 1
Catchm ent area (an km ) 40 )0 0Ma x al l (m OD) 75 2
NOV177 50 049 8 80
115176
CEC137 200355 00
9289
53 110 85 80 0 119 60 012 230 33 90 0 46 890
133 800 ; 63 600 204 100353 90 4 ( 7 20 50 1 70
50 56 8 780 10 3 115
1 9 8 4
2.9521 4 754 90 230 35121153
3 5982 1966 32459 93153184
Year73.371498 .80
5771039
( .9980 2 144 18229.06
85133
89.56345 8699 14 02871.30
6151017
198 4 runof f is 94 % of prev ious meanrain fal l 102 %
1 9 8 4Catc hm ent area ISO kni r 62.8
Ma x alt (m OD) 4 74
CEC Year2 782 1 89 19 05 38 .98
119 950125 14 70
18 851.2862.46574.3394 7
142 3
1984 runoff is 100 % of prev ious me anrain fall 103 %

126 H Y D R O L O G IC A L D A T A : 19 84
057008 Rhy mney at LlanederynMeasuri ng aut ho ri ty W ELSFirs t year - 19 72
Hyd rom et ric st at ist i cs f or 19 84
JAN FER MAR APR MAY Ju Nfl ow s Av g 17 200 9 774 2 889 1 754 1 2 76 1 172
Im' s ' I Peak 9 7 13 5 1 98 14 36 2 66 3 22 6 70Runo ff Imm) 158 137 43 25 19 17Rainfall onm I 2 75 108 54 9 59 44
M onthly and yea rly st at isti cs for pr evio us record (Jan 1913 10 Dac 1983)
Mean AvgBow s Low
on, s ) HighPeak flo w On ' sRunoff Imen1Rainfall Imm l
Fact ors af fec t ing flo w regime POEStat ion ty pe FVV A
058006 M el i te at PontneathvaughanMeasur ing aut hori ty W EL SFirs t year 19 7 1
Hyd romet ric st at ist ic s for 1984
JAN FEB MARFlow s Avg 8 0 13 4 56 4 1 2 18
• Ari l s II Peak 76 52 29 9 7 16 B7Runof f anni l 3 26 174 56Rainfall Imml 390 176 83
M ont h ly and yearly st at ist ics for prev ious reco rd lOct 19 71 to Dec 1983— incom plete or messing months tot al 0 .3 years)
Mean Avg 4 794 3 8 15flow s l ow 1 922 2 0 73
trn' s- ' ) 11.gh 8 774 7 23 1Peak Row MI' s ' ) 82 30 66 12Runo ff (mm) 195 14 1Rainfal (min) 24 3 16 1
Fact ors aff ect ing fl ow reg im e S PStat ion ty pe FV V A
Measur ing aut ho ri ty W ELSFirst yea r 19 5 7
Hydrom et ric sta ti st ics for 19 84
JAN FEB MARFlow s Avg 28 530 14 550 0 182
en ' s '1 Peak 157 50 83 30 34 90Runoff Onrn) 336 160 49Rainfall 1mm) 3 18 125 4 7
M ont h ly and yearly st at is t i c s for
Mean Avg 18 6 10 13 880flo w s l ow 1 4 79 2 44 5
MI' s ' ) High 36 580 29 0 40Peak flo w trn 1s- 11 2 75 10 322 BORunoff (mm) 2 19 149Rainfall Imm ) 20 3 138
Fact o rs af fec t ing flo w reg im e GEIStah on ty Pe VA
Me as uring aut ho ri ty W ELSFirst year 1965
Hydrom et r ic st at istics for 19 84
8 58 8 7 90 8 7 804 3 60 73 3 13 3 199 3 06 4 1 84 1
15 3 10 15 620 20 960 5 105100 10 12 22 105 80 37 30
129 10 8 117 52153 116 135 60
3 960 1 8 751 44 2 0 49 7
10 6 70 3 8 1772 93 39 0 216 1 74196 95
APR2 280
3 1726
9
Mean Avg 13 0 20 11 3 70 8 775 5 38 3flo w s l ow 4 835 5 454 3 796 2 26 7
(m34- 1 N O 25 900 2 7 20 3 26 6 10 11 80 0Peak flo w (m' s - I) 73 43 73 .97 85 73 60 03& pion 1mrn/ 16 1 127 108 64Rainfall ( rim) 159 115 119 81Fact o rs af fec ting fl o w reg ime NStat io n ty pe V A '
Grid ref erence ST 2 2 58 2 1Level stn (rn OD) I I 78
3 1401 30 28 34026 0 5
4 785
Grid ref erence SN 9 150 82Level si n ( n OD) 2 9 10
APR mAY AJN JUL MX; SEP0 6 11 0 38 3 0 55 7 0 242 0 20 7 1 488
1 02 1 30 3 34 0 50 0 39 15 1524 16 22 10 8 5912 65 66 45 78 214
1 7 190 39 43 2332 1 45
7011 1
ma y1 60 39 491959
11 680 8 430 7 5 763 1/ 5 2 145 1 650
4 1 630 15 3 70 17 9807 70 70 188 60 14 1 50
137 96 89142 I I 1 119
060003 Taf at Clog-y -f ran
4 2 111 43 78 4 123 1 15
5288
1 9 110 8 734 60432 92
2863
1 0 760 3 2 23 55 932 5441
103
059001 Taw e at Yny s Tangl w sGod re fe rence SS 6 8599 8 Catchn ient area (so km) 2 2 7 7
Level stn (rn OD) 9 3 1 Ma x all On OD) 80 2
JUN1 22818 53
2554
4 98 71 354
I S 9602 14 10
5 7108
2 7520 8 148 82 145 11
3379
0 69 71 141022
1 3980 6022 33227 392 163
0 9280 3 182 60 839 14
3893
JuiL ALJC1 032 1 3053 05 6 8612 1552 9 1
'4 9 15 6 9 7 11 3 11 1 2809 480 14 200
13 1 90 76 1 8058 82
1 11 135
1 7530 52 75 33019 862270
AUG0 704
3 431152
1 88 20 57 13 8 1279 2 72893
1 3 790 2483 35 758 5256
139
sEP1 46810 26
2 1162
3 9560 9 14
11 50 310 1 60
57160
2 6440 56 26 8 768 1 0 1104192
SEP8 86271 6810 123 5
10 2500 5 74
16 29028 6 00
117175
OCT7 42483 82
2 18
5 8 700 748
13 700118 50
8813 1
OCT5 2835 1 452 1532 3
OCT22 250183 10
26 2306
NOv14 63010 6 50
2 12262
7 36 82 355
15 43092 6910 7143
NOV6 18438 1374432 1
3 150 4 7 160 .548 2 5496 30 5 7 8 7596 78 79 82128 186189 23 6
NOY23 230151 00
26 428 8
previous reco rd (Oct 1951 10 Dec 1983— incomplete or mussang months tot al 0 .7 years)
13 350 16 5702 58 7 8 35 8
43 030 33 3203 14 30 290 60
15 7 189190 204
JAN r Efl MAR APR ma y A liN JUL ALPG SEP OCT NOVFlo w s Avg 15 0 20 9 80 8 3 9 28 2 179 1 20 7 0 78 1 0 3 75 0 38 6 1 17 1 10 (80 17 160
lm ' s- ' ) Peak 40 63 30 64 ( 8 25 3 2 1 2 42 2 30 0 6 1 1 9 1 22 60 60 58 42 03Runoff (mml 185 113 48 26 15 9 5 5 15 125 20 5Rainfall lov a) 197 8 7 5 1 10 46 28 36 68 189 2 (0 230
M ont h ly and yearly st at i st ics for prev ious reco rd (Oct 1965 10 Dec 198 3— incomplet e or missing m Or d h s t ot a l 0 .8 yams)
2 160 3 9500 36 3 0 9834 785 15 34022 90 58 0 2
2 7 0 795 133
9 45535 14142146
8 99 63 2 18
15 730147 30
135163
5 14 12 64 18 739
127 6020924 8
DEC20 100
92 802362 15
17 9503 93 1
03 65046 1 30
2 112 17
15 64002 1519370 7
9 6 11 11 330 13 8001 0 18 3 75 7 9 0 27
22 3 10 22 690 25 52084 98 80 82 65 55118 135 17016 1 157 174
1984Catchm ent area (aq km) 178 7
Ma x aft On OD) 6 17
t ear5 704
106 .50100 71411
5.1932.9037.153
147.30917
136 5
198 4 runof f is 110% of prev ious meanrain fall 10 3%
1984Catchm ent area (so k in ) 65 8
Max aft On OD) 734
LA C Year4 06 5 2 74817 34 76.53165 13 19(9 4 19 77
2 9301 98 53.814
127.60140 520 16•1984 runoff Ls 94 % of prev ious mean
rain fa ll 98 %
1984
Year10 .846183.1015081 799
11.2587.613
15.158461.3015601853
19 84 runo ff is 9 7% of prev ious moanrain fa ll 9 7%
1984Gr id reference SN 238 160 Catch ment area (so km) 2 17 3
Love! sm (m OD) 7 0 1 Max alt Im OD) 3 8 5
Year6.49560 .58944
1359
7.3294 .6729 66285.73
1064142 6
198 4 runof f is 8 9 % of prev ious me anrain fa ll 9 5%

R I V E R F L O W D A T A 12 7
061003 Gw aun at Ci l r hedyn Br idgeMe asunn g a n hoo ry W ELSFast yea r. 196 8
Hydrom et ric stat i sti cs for 19 84
J AN FEBf low s Avg 2 06 7 1 488
en' s- ) Peak 7 19 5 33Runoff Inv n) 177 119Ren tal (rrun) 196 77
M ont h ly and yearly stat i st ics fo r
Mean Ave 1.92 1 1.7 18flow s Low
(en' s ' ) HAPPeak fl ow (m1s- ' )Runoff (rnm1Ba nta, Irm a'•119 70 19831
Fact ors aff ec ting fl o w reg vneStauco ty pe V A
063001 Ystw y t h at Pont L iolw ynMeasur ing autho ri ty W ELSFirst yea r 1963
Hydromet ric st at ist ics for 19 84
Mean Avg 9 38 3 7 25 1flow s l ow 2 26 8 2 78 3
(m1s ' I High 15 330 15 200Peak flow lm' s- ' ) I CIS 60 88 63Runo ff (rnrm 148 104Rainfall (rnne 157 10 5
Fac to rs aff ec ting flow reg imeStat ion ty pe V A
064001 Dovey at Dovey Br idgeMeasuring aut ho rit y W ELSFirst year 196 2
Hydrom et ric st at ist ics for 19 84
JAN F(B MAR APR MAY A MFlo w s Ave 48 2 10 28 500 5 789 2 .626 1 29 5 1 6 19
(m ' s ' ) Peak 24 5 00 173 90 13 78 4 6 1 3 9 7 5 70flum e (mm) 274 152 33 14 7 9Roane (mm) 30 1 14 2 56 14 42 64
Mont hly and yea rly st at ist ics for pr eviou s record (Oct 19 62 to Dec 198 3 - -
Mean Avg 33 780 23 340 28 550 17 480 13 860flow s Low 6 24 5 5 174 11 770 5 800 3 2 11
{rri1s il High 68 8 10 46 06 0 75 790 42 490 23 600Peak flow (rn l s - ' ) 350 20 340 00 360 70 2 7 1 30 33 1 20Runoff 1m m) 192 120 162 96 79Ren tal (mm) 194 130 157 1 11 115
Factor s aff ect ing flo w reg ime NSta tion ty pe VA
064002 Dysynni at Pont -y -gar thMeasuring autho ri ty W ELSFirst yea r 1966
Hydrom et ric s t a t is t ic s foe 19 84
M ont hly and yea rty stat i st ics foeMean Avg 5 660Bow s Low 3 3 7 1
(rn1s- ' ) Hon 11 040Peak flow (m1s- l) 6 1 40Runoff (mml 202Pa nfaii (mml 203
0 .859 0 75 13 89 8 4 10822 52 2 1 10164 134174 123
Fact ors aff ect ing flow reg im e NStat io n ty po VA
4 9692 6228 80 94 1 3416 1145
MAR Apli stAY A M A l AUG SLP OCT NOV0 .700 0 .399 0 25 5 0 . 178 0 108 0 . 144 0 360 1 56 7 2 438
4 8 7 0 72 1.57 0 45 0 20 0 59 3 89 7.26 7. 1760 33 22 15 9 12 30 134 20 26 1 17 56 28 34 8 7 179 20 2 222
pr evio us reco rd (Apr 196 9 t o Oec 19 83— in co mplet e or m issin g mont hs to t al 0 .1 years )
1 43 5 0 7720 5 76 0 3523 66 8 1 29 836 70 13 5 1123 sa134 82
6 7892 90 1
18 4 70126 70
as118
4 7792 159
14 78098 7 1170170
4 2200 96 1
10 08090 32
6584
3 24 50 6 777 10 933 40111114
Grid ref esenc e SN 00 5349Level stn (i n OD) 70 3 1
0 60 20 23 11 248
/ 135 182
3 62 10 583
10 10010 5 10
579 7
2 59 10 4307 60 776 3292
117
0 5060 19 11.60018 354284
0 30 10 1160 7 12
7 032676
Grid ref erence SN 5 9 1774Leve l stn (m OD) 1 1 98
2 45 90 6156 0 1129 703889
11 0802 5 18
2 1 77040 2 10
6 1106
2 24 50 5555 92 148 41
77132
8 3 152 9 10
14 09062 004 7
107
Grid re fer ence SH 6 320 66Level stn (m OD) 2 26
2 52 70 54 75 40 753 3590
131
0 49 60 0 731 36 623 4842
105
0 60 70 18 81 63015 6450
146
2 49 3 3 2 18 4 45 70 42 1 0 18 1 0 8825 46 1 6 934 10 6 7068 24 174 30 71 0 239 5 1 6894 10 7 134
11 44 01 8 19
24 05 02 10 00
65130
19 3706 59 5
34 110254 90
10 7172
1.3710 2 713 46716 13117173
2 864 3 82 2 5 5400 289 0 458 0 5565 137 7 28 5 12 3505 1 62 70 14 10 7 7010 7 132 198144 198 23 2
Ca tchmen t area (so km ) 3 1.3Max aft Ern 0 0 1' 4 613
1 7480 60 53 0 8020 0314 5175
JAN u s MAR APR mAY Ju N Ju t. Au G SEP UCT NOYFlow s Avg 12 4 10 8 4 78 2 8 16 1 173 0 5 78 0 69 9 0 439 0 424 5 504 9 238 12 740
(rn ' s- ) Peak 3 7 86 39 14 16 0 3 2 06 0 68 1 24 0 62 0 6 7 30 5 7 36 36 4 4 79Runo ff Imml 196 125 44 18 9 I I 7 7 84 146 195Rainfal l (mrn) 70 11 104 49 15 49 62 42 BO 228 189 23 6
M on t h ly a nd y e arl y st a t is t ic s f o r p re v io u s re co r d (Or t 1963 to Dec 19 8 3— incom plet e co m issing mon t hs to t al 0 .3 years )
A s. AUG SEP OCT NOv0 82 1 2 74 7 17 450 39 0 70 42 06 0
1 35 24 65 54 96 22 9 60 2 10 305 13 96 121 23 1
3 1 129 1 13 26 9 253
incom plet e or m issing mont hs to ta l 9 .8 years )
JAN FEB MAN APR mAY JUN AR Au G SEP OCT NOVFlows Avg 8 756 4 260 0 98 6 0 457 0 79 8 0 427 0 2 78 0 58 9 3 33 4 8 00 2 8 188
(rn1/4 - ' ) Peak 5 1 46 20 3 1 1 59 0 62 0 46 1 64 0 3 7 2 83 11 6 7 32 58 2 7 11Runoff (rnm) 3 12 142 35 16 11 15 10 2 1 115 285 183Rain fall (nen) 280 116 39 17 5 1 78 42 11 1 23 8 293 26 4
pr eviou s record (Jan 19 66 t o Dec 19 8 3— incomp4et e or m issing mo nths to te l 1.3 years )
IN C Year2 546 1.0 2 1
8 1 1 8 2 12 18 10 3 172 1 138 0
2 0 171 48 77 85 120 59173176
198 4 runo ff is 9 1% of previ ou s meanrain fal l 90 %
Catchm ent area (sci km ) 169 .6Ma x all (m 0 0 ) 6 1 1
6 69 13 0 11
10 75012 1 3023 123 5
tat10 45038 417165190
7 165 9 3 70 10 8300 53 5 4 06 9 2 2 19
19 800 18 320 22 600129 90 128 10 2 10 40
113 143 17 114 7 16 7 175
DEC30 780103 20
175189
30 830 34 34 0 42 76010 770 14 530 7 50 176 960 61 790 88 28034 4 CO 3 75 54) 580 50
175 189 24 3179 2 15 230
1984
1.12 20 .80 21.39 22 3.48
113215 30
1984
Year5 4 1244 .79
100 714 52
• 5 89 53 78 37 776
2 10 .4010 9 714 69
198 4 runoff is 9 2 % of prev io us meanrain fall 99 %
1984Grid re ferenc e SH 7450 19 Catclen ent area (se km) 4 71.3
Level stn (m OD) 5 89 Ma x alt (m OD) 9 0 5
Year18 .3 7224 5.0012 3 11 70 3
2 2 95 118 5882 5 .700580 501536184 6
198 4 runoff is 80 % of paev iou s meanrain fall 92 %
1984Catc hment area (se km ) 75 1
Ma x aft (m OD) 8 92
DEC Year7 743 3 6 1023 74 5 1.461 76 15 2 1258 1 79 7
6 520 4 .2862 770 3 .593
10 750 5 4 1684 70 12 1.3013 3 18 0 12 19 20 50
198 4 runof f is 84 % of prev io us meanrain fall 88 %

128 H Y D R O L O G IC A L D A T A : 1984
06 500 5 Erc h a t Pe n c a e n e w y d dMeasur ing aut ho ri ty W EISFirs t year 19 72
Hydrom et ric st at ist ics for 19 84
JANFlow s Avg 1 0 70
(rril s Peak 7 80Runoff anni l 158Rainfall Imm) 20 7
M ont hly and yea rly st at ist i cs for prev ious record (Jan 19 73 to Dec 1983)
Mean Avg 0 958flow s Low 0 619
ari l s 1 kfi gh 1 396Peak flow an' s 10 25Runo ff In-m l 147Rainfall unna 13 7
Fact o rs aff ec ting flow reg ime NStat ion w oe C
FFB0 7 13• 5 89
998 7
0 89 10 4 141 86 915 45120102
Me asuring aut hor ity W ELSFirst yea r 19 72
Hydrom et ric st at ist ic s for 19 84
Mo an Avg 8 74 0flow s Low 4 628
fal l s ' 1 Nigh 11 430Peak flow Un ' s ' .1 87 42Runoff anni l 114Rainfall (r im) 133
Fact o rs aff ec ting flow re g ime SRPStat io n ty po V A
M easuring aut ho rit y W ELSFirst year 196 5
Hydrom et ric st at ist ic s for 19 84
Mean Avgflow s Low
HigoPeak flow Ini ' sRunoff ImmlRainfall Imm l
Fact o rs af fec tIng flow regtrne ElStat ion ty pe CC
Mean Avg 7 2 16 5 780flow s Low 7 183 1 54 5
frn' s- 1 High 15 330 12 760Peak flo w Im 's- 1 34 50 • 65 24Runoff Irnnu 4 7 35Rainfall fmnU 78 60
Fact ors af fec trng flow regume S PGEIStat io n ty pe VA
MAR0 3 11
0 BO4652
0 7750 40 81 80419 78115123
APR0 180
0 302628
0 4 130 1770 89 2
8 73596 1
MAY0 120
0 281839
0 3500 1350 728
4 68528 1
0 6 6 0 0 6 Elw y a t Po n t -y -gw y d d e l
JAN FEB MAR APR MAY Al iNiFlo ws Avg 10 270 5 64 1 2 7 11 0 86 1 0 62 7 0 622
(im' s 1 Peak 63 0 7 22 30 6 99 I 5 7 6 68 3 00Runoff 0 1ml 142 73 3 7 12 9 8Rainfall fmm l 184 68 5 1 15 60 43
M onth ly and yea rly st at ist ics fa pr evio us recor d (Dec 19 73 to Dec 198 31
6 626 5 88 1 2 50 7 1 96 9 I 3 11 0 737 1 028 2 824 5 736 7 248 7 80 3 4 3 184 00 7 I 53 9 ' 0 82 3 0 4 79 0 359 0 3 18 0 24 2 0 630 1 733 2 263 4 8 79 2 90 8
12 0 50 11 9 50 4 722 5 9 18 3 300 1 40 7 4 35 1 7 450 11 530 11 850 14 450 5 .09450 82 76 59 25 0 1 2 1 66 18 00 2 7 05 35 15 58 5 7 143 00 10 1 60 75 42 14 3 0 0
83 8 1 33 2 7 18 10 14 38 79 9 7 108 70 294 108 56 77 75 69 84 14 2 130 14 7 14 1 12 58
0 6 7 0 0 8 A ly n a t Po nt -y -c ap e l
0 6 8 0 0 3 Dan e a t R u d he a t h
4 695 3 934 3 00 31 1 77 0 988 0 720
17 2 10 9 111 7 33 5134 00 6 2 8 1 63 60
3 1 25 206 2 58 65
Grid ref erenc e SR 400 404Level si n Im 0 0 1 5 6 13
JUN0 113
0 561655
0 1920 0890 53 9
6 992864
0 08 10 171237
0 1450 1040 230
3 8 72 1"
God re fe renc e 511 9 52 7 18Level stn (m OD) 8 7 90
JUL0 1 78
0 46. 4 426
Grid ref erence SJ 3 36 54 1Level s i n (m OD) 3 7 2 9
JAN FEB MAR APR MAY A AFlow s Avg 6 8 18 4 30 7 7 7 78 1.112 0 712 0 60 3
un, s- 1 Peak 17 06 11 00 9 25 7 22 2 59 2 14Runoff anm / 80 48 2 / 13 8 7non fat! (nth / 118 55 58 14 52 44
M onthly and yea rly st atis t ics for pr evio us record IJu n 19 6 5 10 Dec 1983)
2 46 4 1 7240 746 0 7346 864 8 0 124 1 96 82 83
16 1869 76
Au G SEP OCT0 09 7 0 276 0 8 78
0 6 1 6 70 8 9 114 40 13072 162 204
0 2 140 06 20 504
5 353799
AUG0 24 2
0 6 53
76
0 4 160 . 16 70 9 19
7 4260
144
JUL Au G SEP0 432 0 46 4 0 64 6
0 66 1 4 7 3 5 15 5 7
20 68 13 1
SEP OCT1 8 10 5 9 178 8 1 25 7814 82
153 14 1
0 80 7 1 0 12 1 00 90 236 0 264 0 60 01 736 1 8 16 1 6 1611 84 16 9 1 10 45119 145 149157 156 148
19 84 runoff is 9 3 % of prev ious meanrain fal l 10 1%
OCT1 26 18 701598
3 486 3 780 4 40 70 654 0 633 0 877
14 360 11 920 14 3506 7 96 84 20 66 26
23 14 2985 83 76
Catchment area (sci km ) 18 1Mat alt Im OD/ 564
NOV1 328
7 101901 18
M easuring auth ori ty . NW W A Grid ref erence 5.1 6 6 8 7 18Forst year 194 9 Level stn (nt OD) 13 19
Hydromet r ic st at is ti cs for 19 84
JAN FEB MAR APR MAY Afr i Jul AUG SI P OCT NOVFlow s Avy 11 050 10 930 4 49 7 2 2 72 1.6 18 1 59 3 0 935 0 86 8 2 185 2 56 5 10 820
an1/2 - 1 Peak 4 1 8 7 80 8 1 13 04 3 .68 4 9 7 5 4 1 4 9 7 3 0 1 14 7 1 9 32 10 3 90Runo ff Imm l 73 6 7 30 14 11 10 6 6 14 17 69Rainfall Imm) 112 59 4 7 11 42 45 28 4 7 112 80 137
M onth ly and yea rly st ati st ics for prev ious recot d (Oct 194 9 t o Dec 19 8 3— incom plete or m iss ing months t ota l 5 .3 years)
1 9 8 4
DEC Year1 453 0 .5516 49 8 .91
2 15 9 63197 1358
0 .59 70 .4 300 .73 419 .78
104 1134 1
19 8 4Catchm ent area (so km) 194 0
Max alt Irn OD) 5 18
NOV11 34053 0 11522 18
IT C Yost6 36 4 3 .89025 42 63 .07
88 83396 113 1
198 4 runo ff is 9 0 % of previous meanrain fa ll 90 %
19 8 4Catchme nt area (sg km) 22 7 1
Max nit (rn OD) 66 2
NOV6 16812 13
70179
Ot C3 15610 08
3 778
Year2 .33022 2 33239 15
4 337 4 148 3 40 1 2 4 29 1 9 18 1 196 0 923 0 868 1 04 5 2 0 66 3 002 4 504 2 .48 01 753 2 088 1 465 1 0 23 0 74 1 0 43 8 0 33 1 0 78 7 0 4 74 0 452 0 6 14 1 24 6 1 .2667 2 19 9 085 8 0 27 5 5 73 5 65 7 1 8 73 2 09 8 2 24 4 3 906 6 896 5 8 16 9 48 1 3 .02 727 53 28 52 26 1 I 2 1 09 26 86 18 34 23 13 18 0 7 59 11 2 1 90 28 7 1 35 92 59 .1 1
5 1 45 40 28 23 14 ' I I 10 12 24 34 53 34 586 70 76 59 74 64 62 68 8 7 83 104 99 932
198 4 runoff is 9 4 % of prev ious meanrain fa ll 98 %
Catc hme nt area (sg km) 40 7 1Ma x alt Irn OD) 54 7
DEC5 68220 10
3 752
19 84
Yea/4 .58 5
10 3 90354773
6 4 77 7 56 1 4 .62 4I 396 I 80 3 2 .33 3
16 290 22 920 8 .66210 2 90 92 78 134 50
4 1 50 35889 8 7 888
198 4 runo ff is 99 % of previou s meanrain fa ll 8 7%
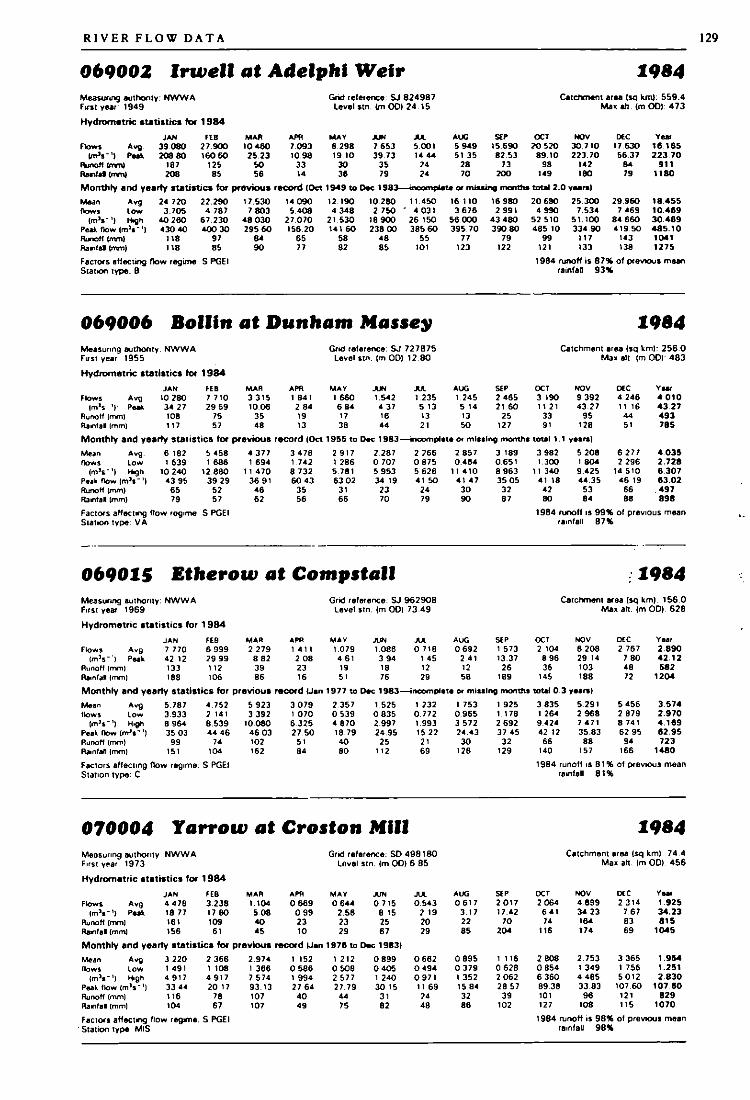
R I V E R F L O W D A T A 129
0 69002 Iran i , a t Ade lphi We irMeasuri ng aut hoo ty : NW W AFir st year: 194 9
Hy drom et ric s tat i st ic s fo r 19 84
JAN FEBFlaws Avg . 39 08 0 2 7.900
W s " ) : Peat 208 80 160 60Runo ff Wm / 18 7 125Rost ra Man) 20 8 85
M o nth ly a nd y ea rly st a t ist ics fo r
Mean Avgflow s t ow
OA • ) teghPeak flow (rnTs " )Runo ff Inns)Ren tal /m g
24 720 22.2903 .705 4 78 7
40 260 6 7.230430 40 400 30
118 9 7118 85
Factors aff ect ing no w reg ime S PGEISta tio n ty pe. Et
Me asunng authoo ty NW W Al ust year 195 5
Hy dr om et ric st at ist ics for 19 84
Mean Avg 6 182 5 458flow s Low 1 639 1 686
( n ' s " ) i egh 10 240 12.8 60Peak flow (m1s " ) 43 95 39 29Runaff (r im) 65 52Rainfall (nvn) 79 5 7
Factors af fec on g Row reg ime S PGE1Sta tio n ty pe V A
Measuring autho ri ty . NW W AFirst year 1973
Hydr om et ric st at is t ic s for 19 84
Mean Avg 3 220 2 36 6flow s Low 1 49 1 1 108
On' s " )) Mgh 4 9 17 4 9 17Peak how (m1/2 " ' l 33 44 20 17Runoff Own) 116 78Ren tal Imml 104 67
Factor s af fec ong flow rar e S PGEI' Sta tio n ty pe M IS
M AR APR MA Y JUN A t AUG SEP OCT NOV10 460 7 09 3 6 .298 7.653 5 00 1 5 94 9 55.690 20 570 30 .7 1025.23 10 .98 19. 10 39 .73 14 44 5 1 35 82.53 89 .10 223 .70
50 33 30 35 24 28 73 98 14 256 14 36 79 24 70 200 149 180
pr ev io u s record (Oct 194 9 to Doc 19 83- in com ple te co mi ssin g month s t otal 2.0 years)
17.5 30 14 090 12 . 1907 80 3 5.409 4 34 8
48 0 30 2 7.0 70 2 1.53029 5 60 156 .20 14 1 60
s. 65 se90 77 82
069006 Ba i l in a t Du n ham Ma sse y
JA N FEB MAR APR M A Y A M A A AUG SEP
Flow s Avg 10 280 7 7 10 3 3 15 1 84 1 1 660 1.542 1.235 1.24 5 2 465frn' s ) PeM 34 27 29 59 10 .06 2 64 6 84 4 3 7 5 13 5 14 2 1 60
Runoff (nv n) 108 75 35 19 17 16 13 13 25Ren fro' (num 117 57 48 13 38 44 2 1 50 127
M ont h ly and yea rly st at is t ic s foe pr ev io u s reco rd (Oct 1955 to Dm 1983- incomplete Or missing months
0690 15 Et he row a t Com pst al lMea sur ing autho ri ty NW W AFirst year 1969
Hy dro m et r ic st at is t ic s for 1 9 84
J A N FEB mAR APRFlows Aug 7 770 6 99 9 2 279 1 4 11
(rn1s - 11 Peak 42 12 29 99 8 82 2 08Runo ff arv n) 133 112 39 23Renfid InVn/ 188 106 86 16
Mean Avg 5.78 7 4 .752 5 923 3 0 79 2.35 7flow s Low 3.933 2 14 1 3 392 1 0 70 0 539
lin ' s ) FIM A 8 964 8 .539 10 .080 6.325 • 8 70Peak flow Irn1/4 ' i) 35 03 4 4 46 46 0 3Runoff (iiwn) 99 74 10 2Rainfall Irninn 15 1 104 162
Fact ors aff ec ting flo w reg im e S PGEIStat ion ty pe. C
• 3 77 3 4 78 2 9 17 2.28 7 2 766 2 85 7 3 189 3 98 2 5 20 8 6 2 77 4.03 51,694 1.74 2 1 28 6 0 70 7 0 8 75 0 .464 0 .65 1 1.300 1 804 2 296 2.728
11 4 70 8 73 2 5 78 1 5 953 5 626 11 4 10 8 963 11 340 9 .42 5 14 5 10 6 .30736 .9 1 60 .43 63 0 2 34 19 4 1 50 4 5 47 35 0 5 4 1 18 44 .35 46 19 63 0246 35 3 1 23 24 30 31 42 53 66 4 9 76 2 56 613 70 79 90 8 7 so 84 88 898
1984 runoff is 99 % of prev ious meanrain fa ll 87%
M on t h ly an d yead y st at i st ics for prev iou s recor d /Jan 1977 to Dec 1983 - Moom piste or missing months total 0 .3 years )
2 .9741 38 87 5 7493. 13107107
27.505 184
070004 Yarro w a t Crost o n Mil l
JAN FEB M A R A PR M A Y AMFlows Avg 4 4 78 3 .238 1,104 0 669 0 644 0 7 15
In ' s " ) Peak 18 77 17 80 5.08 0 99 2.58 8 15Runoff Imml 16 1 109 40 23 13 25Rainfall Imml 156 sl 45 10 29 6 7
M ont h ly an d ye arty st at ist ic s for pre v iou s record Men 19 76 to Dec 19 931
I 1510 58 61 99 42 7 64
4049
Grid ref erence : SJ 8 249 8 7 Catchm en t area (so kin) : 559 .4Level stn . ( n OD) 24 , 15 Ma x ah . (m OD): 4 73
10 .280 11.450 16 1102.750 " • 03 1 3 6 76
18 900 26 150 56 .000238 00 38 5 60 39 5,70
48 55 7785 10 1 123
Gnd ref erence SJ 72 78 75 Catchm ent area N O km): 256 ,0Level stn Int OD) 12 .80 M ax elt (m 0 0 1 4 8 3
Grid re fer ence, SJ 96 290 8Level stn. (m 00 1 73 .49
M A Y1 0 794 6 1195 1
18.794080
1 2 120 50 132 5772 7.79
4475
L t d1 0863 941876
1.5250 8352.99 724 .9525
112
A t0 718
1 451229
GrO ref erence: SD 49 8 180Level st n. (m OD) 6 85
0 8990 40 51 24030 15
3 182
1 23 2 1 7530 .772 0 .96 51.993 3 57215 22 24 .432 1 3069 126
JUL0 .54 3
2 192029
0 66 20 49 40 9 7 111 692448
AuG0 692
2 4 11258
AUG0 6 17
3 172285
0 89 50 3791 35215 843286
16 980 20 690 25.300 29 .9602 99 1 4 990 7.534 7 469
43 480 52 5 10 5 1.100 84 660390 80 485 10 33 4 .90 4 19.50
79 es 117 143122 111 133 138
SEP1 5 7313 .3726
(8 9
1 925I . 1782 69237 4532
129
SEP2 0 2717 42
70204
1 1160 6282 06 228 57
3910 2
1984 run off is 8 7% of prev iou s meanrain fan 93 %
OCT3 19011 2 1
339 1
t otal 2.1 years)
OCT2 104
8 9636
145
OCT2 064
6 4 174
116
NOV9 39 243 2 7
95128
Catchment area (sci krn) 155 .0Max alt . (m OD) 628
NOV8 20829 14103188
3 835 5.29 11 264 2 96 89.424 7 4 7 1
4 2 12 35 .8366 88
140 157
NOV4 69934 23184174
OEC17.63056 .37as79
CRC4 24 611 16445 1
2 1308 2 .753 3 36 50 854 1 349 1 7566 360 4 485 5 0 1269 .38 33 .83 10 7.6010 1 98 12 1127 108 115
1984
y ear16 .165223 .70
9111180
18 ,45 510 .46930 .4694 8 5.10104 112 75
1984
You4 0 104 3 274 9328 5
19 84
OCC Year2 76 7 2.890
7 80 42.1248 58272 1204
5 456 3.5742 879 2.9 708 74 1 4 .16 962 95 62 .9594 72 3
166 14 80
198 4 runoff is 8 1% of previou s me anrainf all 8 1%
1984Catchm ent w ee (so M A) 7 4 .4
Max alt . Mt 0 0 ) 4 56
CX C Yes2 3 14 1/ 25
7.67 34 .2383 8 1569 104 5
.9541.2 5 12 8 30
10 7 .60829
10 70
1984 runo ff is 98 % of prev iou s meanrain fa ll 9 8 %

130 H Y D R O L O G IC A L D A T A : 1984
0 7 10 0 4 Ca l d e r a t W ha l le y W e irMe asuring aut hor it y NW W AFirst yea r 196 1
Hy dro m et r ic st at ist ic s for 1 9 8 4
Flow s Avgon1/4 - ' I. Peek
Runoff (mmlRainfall Imen1
JA N FEB20 590 13 15010 7.30 128 .60
175 104198 84
M on th ly and yea rly st at ist ics for pre v io us recoed (Oct 196 3 t o Dec 198 3- incom oNt e or missing months total 2 .6 years)Moan Avg 12 9 10 9 717flo w s Low 5 766 3 320
(mf s - ' ) Nigh 19 0 20 17. 170Peak flow lm ' s - ' 1 183 20 146 10Runo ff (men) 109 75Rainf all (men) 1 19 8 1
Fact ors aff ect ing flo w reg im e ElStat ion ty pe FV
Me asu ring aut hor ity NW W AFirst yea r 196 2
Hy dro m et r ic st at ist ics fo r 1 9 84
Flow s A vglm ' s - '1 Peak
Runo ff (mnm)Rainfall Imm l
Fact ors aff ec ti ng flow reg im e S PGStat ion ty pe FV
Measur ing aut ho rit y . NW W AFirst year . 19 68
Hy d ro m et r ic st at ist ic s for 19 84
Mean A vg 52 660 36 6 50f low s Low 6 62 1 3 840
M iLs - h High 86 420 76 .630Peak flow On3s- 1 85 4 00 674 50Runo ff on ne 143 9 1RawCall onm) 146 9 1
Fact o rs aff ec ting f lo w reg im e SEIPStat ion ty pe C8
Measuring aut ho rit y NW W AFirs t year 196 8
Hydro m et ri c st at Ht ic s for 19 8 4
M AR APR MA Y AM JUL AUG SEP OCT5 58 6 3 115 2 739 4 566 1.8 53 2.40 3 7.738 11 6 1029 9 1 6 76 15 .26 105 60 10 82 18 08 46 0 7 6 1 80
4 7 26 23 3 7 16 20 63 9864 19 45 92 27 74 176 160
9 3093 989
25 32034 4 20
79100
0 72 0 02 W y re a t St Mic hae l s
JA N FEB M AR APR MA Y A M A A. Au0 SEP17 820 9 0 79 3 .48 6 1 24 1 0 74 7 2 183 0 43 1 1 10 8 7 30 3156 50 58 99 3 1 7 1 2 19 2 3 1 79 9 1 0 78 14 65 8 7 6 1
174 83 34 12 7 1 1 4 11 69194 69 48 13 36 10 1 28 95 196
M ont h ly and yearly st at is t ic s for p rev iou s
Me an A vg 9 4 78 7 1 13 7 173flo w > Low 3 983 1 746 2 2 70
itm1/2 - ) HighPeak flo w VT ' S- itRuno ff (numRainfall Inini )
15 9 70 16.0 30 25.920 12 090 10 450153 70 145 60 168 90 123 00 128 20
92 63 70 44 34119 74 98 71 8 1
0 72 0 04 Lu n e a t Ca t o n
J AN FFR M AR APR MA Y A M A A Au GFlow s A vg 7 7 8 60 46 2 30 15 840 7 499 3 244 10 6 10 1 08 2 3 09 1
lrn2s- G Peak 4 15 00 30 2 60 6 7 82 23 62 7 36 300 10 2 8 7 18 64Runoff im ml 2 12 123 4 3 20 9 28 5 8Rainfal l M un i 24 0 83 6 1 22 36 95 29 9 1
M ont h ly and yearly st at is t ic s for p rev io us reco rd (Jan 1959 to Dec 19 8 3 - i ncom plet e co m issi ng mo nths to ta l 4 .0 years )
35 69011 830
113 800650 20
9 7111
6 3 242 2 72
13 0 10108 40
5274
29 05 04 20 2
6 7 9 709 7 24
779 7
5 56 32 0 539 9 169 1 66
4 784
19 9402 56 5
39 6 70228 20
5493
0 7 3 0 0 5 K e n t a t Se d g w ic k
M ean Av g 12 6 60 9 709 9 64 8f low s Low 7 5 2 1 4 .529
ImEs- .1 High 20 820 16 BOO 22 750Peak flo w Un ' s- ' ) 197 .70 114.00 166 10Runoff own ) 16 2 113 124Rainfall imm l 193 1 12 153
Fact ors aff ect ing flo w reg im e N
Sta tion DI N CI3V A
6 .2 9 32 0 3 6
12 6201 1 1 10
168 7
Ca d ref erenc e. SD 729 360Level stn Im OD) 39 .85
4 2 751 8887 372
135 503584 83 102
Gri d ref erenc e SD 46 34 11Level st n Rn 0 0 ) 4 .36
recor d (Oct 19 83 to Dec 19 83 - i ncomp let e of m issi ng m on th s t ota l 0 .2 years )
4 70 1 3 50 4 2.90 2 2 8.47 4 39 1 6 485 9 2 7 1 10 2500 774 0 73 2 0 444 0 460 0 24 9 0 .90 2 0 6 17 4 859
7 09 6 5 690 16.240 13.290 25 50 0 15 820146 60 96 89 16 2 10 138 60 180 40 159 00
2 7 28 43 6 1 90 9 79 1 88 109 136 137 139
Gr id ref erenc e SD 52 96 53Level stn (m OD) 10 6 6
15 9403 38 7
4 9 1802 17 80
4293
Grid ref erence SD 50 9 8 74l eve l stn (m OD) 18 90
J A N FEB M AR APR MA Y JUNFlo ws Avg 18 180 12.2 10 ' 3 349 2 590 1 382 1 583
In ' s ' ) Peak 110 70 53 53 7 64 10 8 1 2 10 13.77Runo ff town) 23 3 146 43 32 18 20Rainfes onm) 30 5 96 52 35 18 85
M o nt hly and year ly et a b s t in s for p rev io us reco rd (Nov 19 88 to Dee 1983)
4 2 191 22 29 6 1239 62549 1
3 8850 8 72
13 0 1072 8648
104
3 732 5 7651 773 1 56 49 0 59 16 280
230 60 14 1 9032 09
18 3204 980
4 1 48028 1 40
50
24 830 33 1202.79 1
69 640 63 65038 2 20 39 5 10
68 8 7124 145
AA AuG SEP0 6 58 0 740 5 75 7
1.73 2.82 30 188 9 7 1
25 74 198
3 29 8 5.03 9 8.0 131 0 13 0 820 1 7538 29 1 10 920 15.3 1094 65 63.72 120 7042 65 99
104 12 1 182
7.6 19 11 150 13 2502 065 2.39 7 5 625
18 6 20 23 9 10 2 1 990206 .00 229 50 6 15 00
62 9 5 109120 122 135
19 84 runo ff is 9 7% of previ ous meanrain fa ll 99 %
OCT10 4 1056 9610 1166
OCT17 260
76 752 2 126 7
Catchm ent area (so km) 3 16 0Max alt (m OD) 5 58
SIOV18 250144 .50
150198
Catchmen t area (so km ) 2 75 0Ma x alt (rn OD) 560
NOV18 5 10163 10
1742 13
SEP OCT NOV39 620 6 7 9 10 77 64038 8 30 373 60 4 74 50
104 185 20 5223 2 13 23 4
43 0 80 5 1 5504 3 12 25 680
134 400 9 7 220536 .00 54 1 50
117 13614 2 16 1
NOv17 83069 5622 12 71
GEC Year8 36 1 8.33033 90 144 .60
7 1 83 176 1213
13 6604 886
25 6 10194 3011612 7
DE C Year8 127 6.70454 0 1 16 3 .10
79 76 99 5 12 54
10 6 102 58 1
19 400190 5010 3125
CEC4 7 4 2023 9 20
129130
5 3 49018 73093 7 705 17 30
146158
19 8 4
8 .60 66.19 7
11.41 5615.00
859123 1
1 9 8 4
6.56 13.186
10.329190 .50
7531258
198 4 ru no ff is 102 % of prev iou s meanrain fa ll 9 9 %
1 9 8 4Catchrnent area (so km) 9 8 3 0
Ma x eh (m OD) 73 6
Year33 4214 74 .5010 7214 5 7
34 .53324 69 64 5.50 1854 0 0110 814 72
198 4 runo ff es 9 7% of previ ous meanrain fa ll 99 %
1 9 8 4Catclsmen t area (sq km) 20 9 0
Ma x alt (rn OD) 8 20
Ge C Year12 550 7.84 142 08 110 .7016 1 118 4168 1594
10 0 60 14 040 12 5 10 8 .2 741 396 5 484 5 46 6 5.99 5
17 940 2 1 4 10 22 36 0 10 .3 18113 50 175 00 139 00 19 7.70129 174 - 160 12 4 9174 2 15 18 1 1717
198 4 runoff is 9 5% of previ ous meanrain fall 93 %

R I V E R F L O W D A T A 131
0 74 0 0 1 D u d d o n a t D u ddo n Ha l lMeasuring atn hon t y NW W AFast year 196 8
Hy d rcen et n c st a t i st i cs for 1984
JAN FEB MAR APR M AY A INFlo w s A v g 8 4 71 6 2 71 2 15 1 1.260 0 3 79 1.90 4
(mTs II Peak 48 35 56 .22 15 6 1 6 33 0 6.4 48 63Runoff Sorry 290 20 1 74 4 2 13 63Rainfal Sem) 29 5 133 83 49 26 160
M o nt h ly an d yearly stat i st i cs fo r pr eviou s reco rd (Mar 19 68 to Dec 198 3)
Mean Avgflow s Low
(rnts- ' ) HighPeak fl ow In ' s - )Runo ff (rem)Ramfa (nvn)
7 8963 92 1
14 2 10150 802 7026 3
Fact ors aff ect ing flo w regsme PStabon ty pe CH
5 3701 65 1
13 3909 7 11167104
0 74 0 02 l r t a t Ga le s y k eMe asuring autho ri ty NW W AFest year 196 7
Hydr om et ric stat ist ics for 1984
JAN f Ea MAR APR MAY JUNFlow s Avg 5 114 3 323 1 680 1 369 0 38 3 1 490
en' s '1 Peak 14 26 8 39 3 43 3 65 0 86 5 75Ru no ff (u r n) 3 10 188 102 BO 23 8 7Bar gee mine 423 15 1 132 76 30 163
0 7Mo nt hly and yearly sta ti sti cs fat poev iou s recopd (Dec 19457 to Dec 19 8 3)
Mean Avg 4 60 11 6908 24 23 1 7327932 8
fl ow s LowIni 1s ' ) Hi m
Peak flo w (rnlsRunoff Irmn)Ran fall im mff' 1196 8- 1983)
Fact ors aff ect ing flo w reg im e ISta tio n ty po VA
0 7 4 0 0 5 Ehe n at Bray s to n e sMe asuring aut ho rit y NW W AFirst yea r 19 73
Hydrom etr ic st at i st ic s foc 19 84
5 3831 70 1
10 480140 30
I BAt 93
3 082 3 0860 943 0 73 75 117 6 5 7518 6 7 16 14170 18 7193 24 7
JAN r ni M AR A PR M A Y J UN
Flo w s A vg 10 130 5 454 2 706 I 832 0 999 0 9 72(ni ts 1) Pe ak 53 4 7 25 78 25 92 7 52 I 34 4 8 1
Runoff lmml 2 16 109 58 38 7 1 20%areal 1mml 24 5 108 96 52 20 I I I
M ont h ly and yea rly st at ist ics for prev ious recor d (Jon 19 74 t o Dec 19 83 )
Meanflow s
Avg 8 2 12 6 35 1 5 86 1 2 009Low 4 88 1 2 0 11 2 22 5 0 99 3
(ff Or 1) Hig h 16 0 30 15 890 10 220 5 94 5Peak flow frn3s- '1 9 7 85 79 36 69 4 7 0 1 0 7Ru no ff (m m ) 17 5 123 115 58Pa nfel Imml 220 123 179 75
Fac to rs aff ect ing flow reg im e PSta tion ty pe V A
0 75002 De rw e n t a t Ca m e rto nMeasuring authori ty NW W AFirst year 1960
Hydromet ric st at ist ics for 1984
JAN Fr efl ow s Avg 48 850 33 760
(rn' sT' I Peak 142 80 84 98Rt.n olf (rrvn) 197 )28Rainfall 1mm) 249
Mean Avg 3 7 790flows Low 9 58 7
(m35 Nigh 84 550Peak flow (oi l s ' ) 2 19 20Fk.noft (rone 153Rainfall (mmff 1831( 196 1-19831
Facto rs aff ect ing f lo w reg im e S PStatio n t ype VA
M A R15 93058 89
6490
Mont hly and yearly st at i st ics fa' prev iou s rec ord (Sep 1960 t o Do c 19 8 3)
28 130 24 8804 83 7 7 466
56 570 5 1 550165 70 115 40
10 3 10 1)0 5 139
3 4360 49 79 09643 .5 71141 1 1
2 6650 4305 94 734 0415615 1
19 3204 359
38 940145 50
76
Gnd ref eren ce SD 196 89 6Lev el ste Ern 0 0 ) 14 79
1 13 70 .3244 49 743 3 1
73102
I 4880 25 72 5 72
6 1990
134
2 0360 54 75 8 1737 606 7
118
G o d ref erence . NY 136 0 38Level stn (nt OD) 54 17
1 70 10 45 75 2 1610 2 71130168
Grid re fe rence NY 00 90 6 1Level stn (m 0 17) 10 11
God ref erenc e NY 0 38 30 5Level stn (m OD) 16 70
APR M A Y
7 855 1 80 9 5 50012 14 4 8 7 11 66
3 1 11 2729 20 110
14 180 10 640 10 9202 753 2 04 1 3 58 2
36 280 34 800 20 400102 90 35 80 80 19
5 7 47 44106 110 11 1
A A AUG0 44 6 1 094
4 2 1 11.8915 3 765 100
2 45 10 6395 0 344 7 17
8413 1
J UL0 46 7
1 I 42884
2 18 10 79 74 14 1
2 7 2613218 1
S t0 790
3 431763
An2 50 3
4 75I CJ54
3 1480 35 36 .84 196 .58108154
AuC0 698
I 454299
1 4 100 28 65 144
8 4614620 5
AtiC0 820
3 0 718BO
AuG4 11810 33
17100
17 2002 38 4
43 4 707 )6 20
69140
SEP5 68 748 44188290
5 4240 .5608 57 1
123 4018022 2
SEP3 711
6 017 183 13
3 5570 4005 58217 8920918 7
SEP2 66915 15
5522 1
1 9 17 1 769 1 676 3 220 5 364 8 023 8 43 7 7 459 5 .0830 77 1 0 779 1 0 74 0 66 1 I 694 3 640 3 121 3 136 3 9834 60 5 4 3 7 1 2 83 5 7 699 8.92 ) 14 080 i 1 4 70 13 380 8 .32846 9 7 30 96 70 89 65 62 72 82 115 90 64 49 9 ) 4 7 1 15 .90
4 1 37 35 69 I 1) 17 t 174 159 12 7885 93 114 13 1 2 10 226 2 11 195 18 82
198 4 runo ff is 94 % of prev ious meanrain fa ll 96 %
SEP23 0 50
59 6890
2 14
24 7 102 885
39 79014 1 40
9 7186
OCT10 18062 2 134934 2
7 08 7 7 756 6 8 771 4 16 3 056 2 92 1
15 160 13 160 10 740165 30 129 20 34 3014 3 25 7 73624 4 260 229
198 4 nmoff is 9 2 % of previ ous meanrain fall 9 7%
OCT6 3821 1 1838 73 73
5520 5548 1742 7 792 763 15
198 4 ru no ff is 90 % of prevro u s meanrain fall 86 %
OCT10 85055 722323130
OC48 300134 50
19524 7
35 1201 755
10 7 K O264 70
142197
Catchm ent axes (so km ) 78 2Ma x 411 (m 0 0 ) 83 3
Nov8.43468 .73280306
Catchm ent area (Ell km ) 40 2Max al t tm OD) 9 78
NOV5 33014 843 13355
5 00 7I 8857 0942 1 85294340
Catchm ent area (SO km ) 125 5Max alt Iro OD) 89 9
NU V10 45058 131 162 76
Catchm ent area (so km) 663 0Ma x alt (m OD) 9 50
Ke y60 900196 30
23 8260
40 63014 57065 6202 11 30
159195
IN C7.82164 3 126826 7
1984
Year4 .50968 .73
18 202 116
4 .9163 3 516 .82 7
18 5.3019 842 1 71
1984
Ct C Year4 746 2 89 117 20 2 1 .1818 8 204 626 0 24 59
109 3.204I 80 7 2 .44 07 645 3 .9 5020 33 34 04249 228 730 ) 284 5
DEC9 4 7046 1620 21 12
GEC42 70CI
92 38172170
39 29014 74071 590
99 00159177
1984
Yew4 78 258 13
120 117 84
19 84
Year24 .89019 8 .30/ 17518 39
2 5.22914 82434 .23 5284 .7012 0 1174 5
1984 run off is 9 8 % of previous meanrain fa ll 94 %

132 H Y D R O L O G IC A L D A T A : 1984
0 76 0 1 5 /Clam a n t a t Po o le y Br id geMeasuri ng aut ho ri ty NW W AFirst year 19 70
Hydrom et r ic stat ist ics for 19 84
J A N rre MAR APRSo ws Avg 14 480 12 6 10 4 902 2 69 4
(mrs ' ) Peak 28 89 33 14 8 26 3 65Runoff 1mm) 26 7 2 18 9 1 eeRainfall Imm) 33 5 130 80 2 7
M onthly and yea rly st at ist ics for prev ious record 19 70 t o Dec 198 3)
Mean Avg 12 620 9 90 1 9 223flow s Low 5 96 7 2 8 13 3 165
lrn' s ' I High 24 100 2 1 430 17 180Peak flow lrn' s - 1) 63 40 50 55 42 39Runoff (-ran) 233 166 170Rainfall Orr .) 285 160 189
Fact ors aff ec ting flow reg im e PStat ion t ype CC
0 7 8 0 0 3 A n n a n a t B ry de ltirkMeasuring aut ho rit y SRPBFirs t year 196 7
Hydrom et ric st at ist ics for 19 84
J AN FEBFlo ws Avg 6 1 4 70 55 44 0
1m 1s - ' ) Peak 290 10 26 1 00Runo ff (mml 178 150Rainfall (rnm) 219 115
M ont h ly and yearly st at istic s for prev iou s record (Oct 196 7 to Dec 1983)
Mean . Avg 44 770flo ws l ow 23 490, K en 83 440
Peak now (mi s ' ) 405 40Runoff Imml 130Rainfall 1mm) 140
Fac to rs af fecting flow reg im eStammI type V A
0 7 8 0 0 4 /Lin n e t W a te r a t Re d ha l lMeasuri ng aut ho ri ty . SRP8 Grid ref erenc e. NY 0 77868First yoar . 196 3 . Level st n (in OD) 5 3 70
Hyd rom et ric st at i st i cs for 19 84
JAN FEB MAR APR MAY Jun JULFlow s Avg 5 4 1 1 5 363 1 490 0 82 6 0 19 1 0 123 0 048
(rn ' s - ' ) Peak 79 34 46 83 11 23 6 86 0 36 0 36 0 08Runo ff (nun) 190 177 57 28 7 4 2Ran fall onm) 256 116 74 38 13 56 35
M ont hly and yearly st at ist ics forMean Avgflow s Low
frn Fs 1 Hig hPeak flow lm ' sRuno ff (mm)Ran fon (m in )
4 09 01 6 10B 45678 68144145
Fact ors aff ec ti ng flow reg im e
Sl aho n wee VA
Measur ing aut hor ity SRP8First year 196 3
Hydrom et ric st at ist ics for 19 84
Mean Avg 9 480flow s Low 3 53 4
(mls i ) li gh 19 0 80Peek fl ow (rn35 - 1) 133 70Runoff Imm ) - 128Rainfall (rrin ) 130
Fact ors aff ec t ing flo w reg im eStat ion ty pn VA
MAR19 79074 57
5777
APR10 34030 29
2933
Grad ref erenc e NY 4 72 249Level st ra (rn OD) 144 17
MAY1 09 2
1 932078
JUN1 32 12 002489
5 2 70 4 149 3 44 4 1 704 3 6 15 6 165 9 33 7 13 260 12.600 7 .68 21 842 0 75 7 0 59 7 1 23 2 0 630 0 949 0 84 1 3 605 5 423 1 9 59
10 160 10 730 11.340 5 430 6 6 11 11 Ot O 19 690 2 1 230 23 550 9 .89 320 3 1 75 65 19 15 11 9 1 17 85 40 7 1 60 68 62 96 69 58 89 .58
94 77 62 so 6 7 110 171 23 7 23 3 18 7210 1 115 110 113 143 704 275 28 5 258 2 18 8
198 4 runoff is 90 % of prev ious meanrain fall 9 0 %
Grid re fe rence NY 19 1704Level si n Irn OD) 10 00
M A Y4 436
7 661319
JUN3 163
4 6 39
54
33 940 30 96 0 18 6 70 15 120 11 530 8 77512 930 8 .402 6 124 3 5 19 1 93 7 3 2535 1 490 53 770 40 600 30 590 32 150 16 18029 1 30 236 00 182 50 168 50 17 1 30 15 1 20
90 90 51 44 32 7593 115 65 89 , 84 8 7
prev ious recor d (Oct 1963 t o Dec 19 8 3— inco mple t e or mi ss ing mont hs t at tal 1 0 years)
2 920 2 69 7 I 54 6 1 5 17 1 1430 590 0 55 2 0 15 1 0 122 0 1115 132 5 124 4 16 1 3 7 15 3 28 277 68 59 1994 9598 17 1
0 8 0 0 0 1 U rr a t D a l be a t t le
7 69 5I 4 19
13 7509 1 45
9497
6 26 52 09 4
11 7809 5 03
84109
42 46 5 1 / 953 5675 103
3 3930 75 37 4856 1 69
4465
J UL0 663
1 081243
..PLA1 94 53 80
639
0 847 1 2700 128 0 0 981 763 4 363
36 09 5 7 7 1 52 3639 30 4392 88 10 2
Gr.31 ref erence NX 8 2 26 10Level st n (na OD) 4 0 1
J A N FEB M AR A PR MAY JUNFlow s Avg 13 960 17 020 3 35 7 1 5 15 0 38 2 0 35 5
eni s- ' ) Peak 74 89 60 3 1 22 80 8 00 0 68 1 95Ru no ff Ini m ) 188 15 1 45 20 5 5Rainfall (mml 23 1 11 1 6 7 34 113 57
M ont hly and yearfy st at ist ics fcw prev ious record (Nov 196 3 t o Dec 19 8 31
3 09 90 30 88 11965.95
4284
2 18 10 74 66 83 359 18
288 1
JUt0 140
0 . 182
3 1
1 20 70 1642 9 7366 15
1674
Au G0 686
I 38139 7
AUG2 00 7
3 106
43
12 1903 28 4
4 7 880254 50
359 1
AUG0 049
0 122
36
AuG0 149
0 382
5 7
2 0330 164
10 0806 1 69
2 789
SEPI 8956 0 134
234
SEP5 9 1144 66
17143
23 7503 36 2
47 4903 15 20
6 7136
SEP0 75 110 9 1
2614 2
SEP1 09 211 7 1
14135
5 0 100 319
11.54084 2865
136
OCT10 18027 5 118832 2
OCT4 1 1 / 0150 10
11910 1
OCT94 3
29 821742 18
OCT12 12059 6 1163223
Ca tc hment area (sg km) 145 0Ma x all Irn 00 ) 950
NOY17 70029 013 16382
Catc hm ent w en Isg km) 9 25 .0Max al l (m OD) 8 2 1
NOY1 1 7 10325 CO
20 1234
3 7 130 a I 7 10 40 5503 59 2 11 490 19 530
86 820 77 930 68 170499 10 3 10 40 35 5 40
108 117 11714 5 135 13 1
198 4 runo ff is 10 2% of prev iou s meanrain fa ll 10 1%
Catchment aroa k m ) 76 . 1Max alt (rn 00 ) 69 7
NOV6 74 377 1B23026 3
14 43024 I I26 7204
DEC48 620133 10
14 1140
2 70 7 3 55 2 3 938 3 8 170 099 0 20 7 0 740 1 08 14 985 7 288 7 53 5 7 0096 7 2 1 110 90 86 69 103 60
92 125 134 134153 154 148 147
NOV15 590129 70
20 3220
8 09 6 9 4 180 52 2 1 711
19 400 19 420161 20 95 58109 123141 142
DEC12 56033 0 216915 7
1 9 8 4
Yea,6 .8883 3 14
14 9819 71
1 9 8 4
Yew2 7 16 7325 .00
925132 7
26 56516 .40 23 5 4 2 74 99 .10
90 613 11
1 9 8 4
CCC Year4 329 2 52222 30 79 34152 10 43157 140 4
2 .50 31 .50 73.48 2
110 .9010 3814 26
198 4 runof f is 10 1% of prev ious meanrain fa ll 98 %
19 84Catchmen t area (so km) 199 0
Max alt (rn OD) 43 2
Year6 .10 3
12 9.709 8 7
13 4 1
9 4 133 36 9
15 770164 30
12 7 see13 3 12 77
5 .59 83 10 98 .358
184 .30
1984 runoff is 109 % of previ ou s moanra infa ll 10 5%

R I V E R F L O W D AT A 133
0 8 10 03 L u c e a t A ir y he m m in gMe asuring autho ri ty : SRPBFast year . 196 6
Hy drom etri c sta t i st i cs for 19 84
JAN YES MAR APR MAY .114Flow s Avg 13 .850 10 40 3 4 40 1 7 346 0 30 1 0 422
Ern Ts ) Peak 8 1 55 100 30 6 1 34 3 7 36 0 .54 1 45Runoff Semi 2 17 152 69 36 ' 5 6RainfaS (rem) 239 123 76 49 14 75
M on t h ly an d y ea rly st at ist ics for prev io us reoord (Jan 196 7 to Dee 1983)
Mean Avg 10 540 7 0 20flow s Low 5 438 3 943
In ' s ' ) fbgh 15 600 12 110Peak fl ow lm2s- )1 177 . 10 146 .10Runoff (rrim) 165 10 3REMO (rnm) 17 1 99
Fact ors aff ecung fl ow (er e S PStat ion ty pe VA
0 82 00 1 Gir v a n a t R o b s t o n eMeasuring aut ho ri ty . CRPBFirs t year . 196 3
Hydrom et ri c st at is t ics for 19 84
Flow s Avgoni s- '1 Peak
Runoff Imm)Rainfal (min)
JAN16 7 1010 1 00
117209
f EEI13 24079 9413510 5
M on/ h ly and yea rly st a t i s t i c s for prev io us rec or d (Oct 1963 t o Dec 19831
Mean Avg 10 3 70 7 26 1l ow s l ow 4 789 2 80 5
In ' s- ) High 19 370 12 990Peak f low On 's - ' I 95 68 84 94Runoff (mml 113 71Rainfall Imm) 138 82
Factor s aff ect ing flow regi me $Sta tion ty pe VA
0 83 0 03 A y r a t Ca t rin e
Moasuring aut ho rit y CRPBFirst year 196 3
Hy drom et ri c st at is t ic s f or 1 9 84
JAN FEB MARFio ws Avg 17 980 14 260 4 30 4
(m' s - ' ) Peak 16 1 10 99 10 14 7 1Runoff (rnm) 20 5 152 49Rainfall Imm) 2 13 112 6 7
M ont h ly an d yea rly st at is t ic s for prev io us rec o rd Met 1963 to Ose 198 3)
Mean Avg 10 580 7 3 70So ws Low 5 366 2.646
o il s '1 High 1 1 190 12 780Peak flow (m1s ll 18 7 40 ( 39 20Runoff (rnm) 12 1 76Ran fa l (min ) 120 76
Factors aff ec ting flo w reg im e SSta tion ty pe VA
5 9691 359
11 300197 30
93113
MAR4 16009 11
45
3 22 50 4548 28 9
197 604970
APR2 15 113 30
2366 38
Gnd ref el ence NX 180 599Level stn (m OD) 19 .00
2.5740 .2607.73263 64
40BO
Gm) ref erence NX 2 179 9 7Level stn (m 00 ) 9 13
mAY Ju N0 52 1 0 3 7 1
0 90 1 026 4
17 5 /
6 35 7 3 709 2 944 2 0 22 1 9 78 2 89 1 5 80 5 9 423 11 400 10 100 6 1891 59 5 0 92 4 0 786 0 482 0 52 1 0 554 0 546 1 19 1 1 155 2 894 4 .222
11 520 I 1 330 8 256 5 68 1 6 3 17 7 48 7 I I 880 17 380 20 230 19 450 7.05963 0 2 65 23 55 75 52 9 1 9 7 92 92 54 82 62 147 20 88 0 7 183 00 103 .00
69 40 31 2 1 22 32 6 1 103 120 110 79 5109 66 82 8 1 90 95 143 160 168 137 135 1
198 4 runo ff is I 11% of prev ious me anrainf all 100 %
Moasuring aut ho rit y CRPS Grid ref erence NS 52 52 59Firs t year 19 70 Level stn (m OD) 89 9 4
Hy dro m et r ic st a t is t ic s for 19 84
JAN FEB MAR APR MAY .70 N AA Air , SEPRows Avg 9 2 13 11 280 3 8 79 1 626 0 639 0 68 9 0 4 16 0 4 10 2 179
lin, s ' ) Peak I 17 90 96 54 35 02 14 6 1 0 73 1 57 0 58 0 98 25 90Runoff pnrn) 148 170 67 25 10 I I 7 7 34Rainfall (mm) 236 119 74 40 13 68 30 50 13 1
M ont h ly and yea rly st at is t ic s for prev io us rec ord (Sep 19 70 10 Dec 1983)
Mean Avg 9 146 5 165 5 53 7 2 748 2 040 1 94 6 1 68 1 2 356 5 09 1flow s Low 3 9 71 1 98 6 1 480 0 / 33 0 59 3 0 658 0 528 0 48 8 0 59 7
Im3s 1/ High 14 120 6 922 10 780 7 0 56 4 703 4 179 3 401 6 6 76 11 800Peak flow (mIs - '1 ( 78 50 93 52 92 30 6 7 0 2 75 55 60 69 4 1 28 72 00 143 40Runoff fr nm) 147 / 6 89 43 33 30 2 7 38 79Rao lat (mni ) 143 80 10 6 63 72 84 83 8 1 129
Factors af fec ti ng flow reg im e HSta tion ty pe VA
08 4 0 12 W h it e Ca rt W a t e r a t R a w l:he a d
7 0061 6 76
15 630I 17 00
8010 1
APR2 14310 63
2430
Grk l ref erence NS 4 99 62 9Leve l stn (m OD) 4 0 6
mAY JUN0 9 73 0 99 8
4 7 2 78I I 1116 48
3 93 4 3 50 1 2 63 21 113 0 995 1 23 48 52 2 7 652 6 54 282 46
4362
115 104082
I . 8880 225
58 764 .20
2982
65 132975
4 4 AUG SEP OCT0 19 1 0 2 78 4 5 76 12.460
0 44 2 20 50 06 76 263 4 69 195
43 78 178 2 18
1.8440 .3335 399
13 2.50298 7
AJL0 48 7
4 435
/ 4
AA.0 824
1 259
18
2 3440 2 776 80 617 1 80
3 794
AUG SEP OCT0 30 1 5 772 15 060
1 35 64 42 68 833 6 1 164
5 1 190 23 2
AuG0 88 5
13104 7
6 00 10 36 5
12 820192.40
9 1150
Cin ctur e/I t area (sg km) 17 1.0Max oh . Irn OD) 43 8
SEP OCT2 9 19 14 8 1024 9 7 83 12
32 169140 230
NOV12 6 70116 00
192200
8 .993 9 .935 8 6221.689 3 85 7 2 .445
16.750 15.940 23.44023 1 80 168 40 20 4 00
141 15 1 235163 163 139
198 4 runoff is 104 % of prev iou s meanrain fall 103 %
6 63 70 63 1
10 900162 60
10 7146
Catchm ent area (so km) 24 5 5M ax alt Irn OD) 6 59
NOV13 04 08 1 29138172
OCT NOV9 042 8 1866 7 09 62 49146 128199 163
8 82 12 14 7
13 630105 60
137162
NOV17 590123 00
19420 7
IN C ' Year10 0 10 5 .99 554 39 116 .00157 110816 1 1454
DEC10 9 7073 82120135
7 10 53 3 12
13 730119 20
114126
DEC13 60054 9 7155152
1 9 8 4
5.7423.69 17.625
23 1.8010601411
1 9 8 4
Year6 857
10 1.00881
1346
19 8 4Cal ch rnent area (so km) 266 .3
Max al t Irn OD) 54 8
DEC Year7 173 4 56 139 36 21 7.90116 883143 1266
4 .8563.6 135 .926
178 .5092 1
12 75
1984 runo ff is 94 % of prev ious meanrainf all 9 9 %
19 8 4Ca tchment area (sq km ) 234 .9
Max al t (rn OD) 3 75
Year7.607
161.1010221280
2 159 3 4 15 6 944 10 950 I 1 610 10 040 6.6791.084 1 0 36 1 14 1 1 2 12 3 259 3 2 11 4 .419
25 6 7 2 70 14 6 10 46 570 20 730 19 6 10 20 .94669 33 11 1 30 132 90 134 40 134 00 187 10 18 7.40
25 39 77 125 128 110 89 7/ 4 9 1 134 138 147 122 1222
1984 runo ff is I 14% of prev vaus meanrainf all 10 5%

134 H Y D R O L O G IC A L D A T A : 1984
0 8 4 0 1 6 D og g ie W a te r a t Co n d o rra tMeasuring aut ho ri ty CRPBFirst yew 196 8
Hydrom et ric st at i st ics for 1984
Flow s AvgIm ' s - 11 Peak
Runoff (nvn)Rainfall 1mml
JAN3 3 1238 9076 7163
M ont hly and yea rly st at ist ics foe
Mean . Avg 1 36 4 0 98 4flow s Low 0 758 0 39 5
tm ' s 1 High 2 15 1 1 94 4Peak flo w 1m3s 11 2 7 35 22 89Runoff 1mml 108 7 1Rainfall fnun ) 104 70
Fact o rs af fec t ing flo w reg im e NStat io n ty po V A
0 8 5 0 0 1 Le v e n a t Lin n bra n eMeasur ing au thorit y CRP8Firs t year 196 3
Hydromet ric st at ist ic s for 1984
JAN FEBFlow s Avg 8 7 780 73 500
find s '1 Peak 113 90 93 60Runoff Irnml 300 235Rainfall lm ne 34 1 171
M onthly and yea rly stat ist ics for
Mean Avgflow s Low
(in 's- II HoPeak How 1m3sRunof f Imm lFta.n1all
60 90029 4 10
119 10050 5020823 2
Fac to rs aff ec t ing f lo w regim e
Station Woe V A
0 9 4 0 0 1 Ew e a t Po o le w eMeasur ing aut ho rit y HRPBFirst year 19 70
Hyd rom et ric st at ist i cs for 1984
JAN FEB MAR APR MAY AAFlow s Avg 60 540 14 190 16 480 32 340 6 702 5 78 7
Irni s- ll Peak 1 17 10 52 70 54 7 1 73 59 19 93 17 23Runo ff frnm) 368 194 16 1 190 4 1 34Rainfall Imml 296 179 136 200 35 106
M onthly and yearly st at ist ics for prev ious reco rd (Oct 19 70 t o Doe 19 8 31
Mean Avgflo ws Low
treFs. ) HighPeak flow Im' s-Runoff Own)Rainfall (min)
40 9 7018 550E11 130147 6024 926 E1
Fact ors aff ect ing flow reg im e NStat ion ty pe V A
Mean Avg 11 6 70flo ws Low 6 94 9
im i s - ' ) Hig h 19 950Peak flow (rn Fs ' ) 55 24Runoff (mm) 22 7Rainfall (rnenl * 757T 9 78 . 1983)
Fact ors aff itc ting flow reg im e NStat io n ty pe V A
FEB1 7 1714 7617 7104
53 35018 6 10
102 100140 80
166142
28 88012 98046 880105 00159164
Measur ing au thorit y HRPBFirst year 19 7 7
Hyd rom et ric s t a t i st ic" for 1984
MAR0 6 78
4 425472
45 25016 63098 420122 20
155173
26 9408 84 2
54 440117 00
16420 1
JAN FEB MARFlow s A vg 17 9 70 9 23 5 7.52 1
trnFs ' 1 Peak 34 29 16 8 1 20 06Runoff (mml 25 3 168 14 7Rainfall (mm) 28 2 135 140
3 1 0 2 62 8213 1 196114 222
APR0 29 7
0 52232 1
3 1 8200 540
5 1 39083 1410 5100
22 06 04 53 7
38 27068 43130125
7 39 5 10 0 70 5 09 65 04 5 4 40 2 3 4 53
11 330 19 400 7 55213 159680
Grid re fe rence NS 73 9 725Level stn Im OD) 6 7 98
MAY0 ' 76
0 431414
JVN0 20 3
0 89' 653
previous reco rd (Oc t 1966 to Dec 19 8 3— incom plet e or mi ssi ng mo nt hs t ota l 0 .4 year sl
0 94 0 0 533 0 489 0 19 3 0 22 7 0 3 74 0 7 14 1 0 4 7 1 33 9 1 279 0 .79 80 3 70 0 2 74 0 166 0 13 7 0 146 0 123 0 125 0 129 0 356 0 59 2 0 .5391 59 1 1 0 30 1 199 0 6 73 0 364 0 98 1 1 956 2 148 2 163 1 230 1 0 2435 65 8 86 14 54 5 55 5 00 20 88 4 1 98 42 44 30 68 3 7 4 1 4 2 .44
74 4 1 39 22 18 30 55 83 102 10 1' 74 38 7 49 73 68 68 79 I I I 117 120 10 1 104 7
198 4 runoff Is 129 % o f prev ious meanra inf all 10 7%
Grid to l era nce NS 3 94 80 3Level s i n (m 0 0 ) 4 30
MAR APR MAY JUN36 820 18 190 10 780 11 2 10
5.4 84 45 65 19 5 7 18 6 7126 60 3 7 3 796 73 22 93
previo us record (Ju l 19 63 to Dec 19 83)
25 80 0 2 1 55010 620 9 7 165 1 100 5 1 860
7 1 90 66 5888 7 1
125 12 1
Grid re fe rence NG 8 5980 3Level stn (m OD) 4 6 1
15 43 0 14 3303 86 2 4 6 75
7 7 730 2 7 18065 63 64 4394 84
114 133
0 9 5 0 0 1 I n v e r a t Li t t l e A ssy n t
JUL155
0 7212 •23
Ju l8 12012 2049
10 3
14 0 307 884
26 18043 4 1
85136
Grid re fe rence NC 14 72 50Level stn Irn OD) BO 30
APR MAY JuN7 025 3 0 76 2 33014 93 5 30 4 80137 So 44158 26 98
M onthly and yearly st at ist ics fcw prev iou s record A ug 197 7 10 Dec 19 8 3)
3 8991 6607 13 120 24
7677
Ju L3 272 10 47
64109
3 4 29 5 1991 9 15 2 4324 80 5 10 34019 77 14 9065 10 1
126 132
AUG0 145
0 68
54
JUL AUG SEP6 706 3 9 74 8 19513 5 1 5 69 20 9 7
23 14 274 1 74 194
18 590 20 300 34 3 1010 320 7 104 9 41930 69 0 40 0 70 64 980
5 7 54 56 96 100 8063 69 113
118 •32 2 17
Au G6 23912 06
3884
15 1807 43 7
25 92082 2392
144
AUG3 680
9 797285
5 22 13 3948 03216 8 110 2156
SEP OCT0 3 12 1 86 4
2 4 1 25 9474 14 7
126 185
SEP3 1 5 70
57 751852 74
3 1 6508 046
5 7 270109 20186252
SEP9 14519 8017226 5
11 4 105 16 3
16 39 056 502 152 79
CCI42 540102 10
14533 1
54 57010 83090 150138 5018622 7
OLT45 560
63 562 7734 1
36 09013 16066 120119 002 19299
OCT15 69023 88306306
14 3706 22 7
2 1 18057 5 128079 9
Catchm ent area (so km) 33 9Max alt OD) 10 7
NOV7 25 525 58172187
Catchme nt area (so km ) 78 4 3max ah (m OD) 1 130
NOv90 9 10117 10
3130336
59 66024 54096 320130 00197232
1984 runo ff is 100 % of previous meanrain fa ll 99 %
Catchm ont area (so km) 4 4 1 1Max all (m OD) 10 14
NOv30 040
71 381772 19
49 48022 68017 6D3136 1029 1353
198 4 runo ff is 103 % of prev ious meanrain fa ll 9 3 %
Catchment area (SO km ) 13 7 5Max alt (m 00 ) 988
NOV8 98 818 82169198
15 5208 60 5
23 96050 06293349
Ot C Year1 23 5 1.02911 23 38 .90
98 9 5910 7 1119
DEC94 750125 00
32423 7
59 75036 2 709 1 24013 1 002042 11
nf c62 0 50134 003 77346
45 68016 5008 1 84 0179 80277296
DEC13 95039 4 72 722 78
1 CO34 63 1
17 58046 652 14249
19 8 4
1 9 8 4
Year4 0 44 612 5 .0016 2 7200 9
4 0 4 3 130 71249 .8 75150 .5016 2 720 3 1
1 98 4
Year29 .13 5177.10209 023 16
28.3 7519 .38 935 .54 9179 8020 3024 8 5
19 8 4
Year8 .07339 .4 7
18 5820 80
8 .6987.96 1
1a 7846 2.82
19 9 62340
19 84 runo ff is 9 3 % of prev ious meanrain fa ll 89 %

R I V E R F L O W D A T A 135
0 96 0 0 1 Ha l la d a le a t Ha l l a da leMeasuring aut hor ity HAPI3Firs t year . 1975
Hy drom et r ic st at ist ics fo r 19 84
JA N 7EBFlow s Avg 10 903 10 .570
tm' s - ti Peak 57 17 5 1.14Runo ff (rran) 143 129Ren al In n) 173 88
M ont h ty and yea rty st at ist i cs fog prev iou s reco rd (Jan 1976 to Dec 1983 )
Mean A vg 9 0 48 5 94 3 5 6 3 5flow s Low 5 333 1.6 24 2 90 /
(m ks ' ) High 11 90 0 10 .940 9 753Peak flo w (m ks- ' 1 8 3 60 64 .5 7 10 7 00Ru no ff (rang 1 18 7 1 74Rain fall (inn / 148 6 7 112
Fact ors aff ect ing fl ow reg ime NStapon t ype V A
10 1 0 0 2 Me d in a a t Up p e r S hid eMeasuring aut hor ity SW AFirst year 1960
Hy drom et r ic st at is t ics fo r 19 84
low s A vgIm ' s ' I Peak
Runof f (min)Rs nfal (min )
Flow s Avg(rn1s- 1 Peak
Ru no ff l ir m )Rainfall v ong
JA N0 58 7
5 3853
150
Factors aff ec ting flo w reg im e ESta tio n tyPe V A
FEB0 3 8
0 95274 7
Measuring aut ho ri ty DOENFirs t year 19 75
Hyd ro m et r ic st at ist i cs for 19 84
MA R5 3 3 73 3 6 3
7094
MA R0 330
3 323096
APR3 24 244 0 2
4 )54
2 .7400 62 46 44 253 18
3563
MA Y0 34 8
0 9 35
2 6
APR mA Y0 23 1 0 2 10
7 CO20 19
1 106
Gnd ref erence . NC 89 156 1Level sm (m OD) 23 17
2 54 10 7 795 4 34
10E10 0336 5
M I0 63 120 .8 3
858
1 56 20 2 7 13 52 84 6 8 9
206 2
God referenc e SZ 50 38 74Level stn (m OD) 10 40
M ont h ly and yea rly st at ist ics for prev io us re co rd (Oc t 19 6 5 to Dec 198 3— incom plet e o r mi n ing mo nth s to ta l 7.3 ye ars )
Me an A vg 0 4 30 0 44 9 0 36 8 0 25 8 0 7 14 0 . 149 0 143 0 120 0 176 0 23 1 0 355 0 400 0.274flow s Low 0 150 0 160 0 133 0 0 4 0 09 4 0 0 6 9 0 0 8 3 0 0 4 4 0 0 80 0 1 10 CI 120 0 116 0 .2 11
tml s- ' ) fop 0 623 0 760 0 903 0 52 2 0 356 0 2 13 0 199 0 I RO 0 36 5Peak flo w On ' s - II 5 8 6 6 00 7 28 5 4 4 4 90 1 79 3 72 1 7 4 3 74Runo ff (men) 3 9 3 7 3 3 2 2 19 13 13 1 1 15Rainfa ll gorn) 128 86 84 59 78 70 6 7 70 88
Fac t o rs aff ec ting flo w reg im eStaff an ty pe FL
2 0 1 0 0 7 B u rn B e n n e t a t B u rn d e n n e t B r id g eGrid ref erence IC 3 72 0 4 7
Level stn (m 00 ) 2 00
J AN FEB MA R APR MA Y JUN AA A U G SEP OCT M iv8 198 7 480 3 113 1 708 0 92 7 0 84 3 0 832 0 794 1 854 3 6 79 4 10 130 45 30 74 20 96 3 55 1 11 1 77 5 43 2 23 11 03 2 7 49 2 1 35151 129 5 / 30 17 15 15 15 33 68 732 19 115 95 37 2 7 6 1 / 1 66 112 128 124
2 0 5 0 0 5 R a v e r n e t a t R a v e r n e tM easu ri ng aut hor ity DOENFirs : year 19 72
Hy drom et ri c st at is t ics for 19 84
Flow s A vgOr ' s ' I Peak
Runof f Inu nlRa nfall (m m)
J AN3 74224 35144152
Fact ors aff ec ting (low reg im e IStat io n ty pe FV
FEB5 56 640 1 120 1104
M AR1 6 5 229 09
6480
APR0 3 56
1 241317
MA Y0 0 5 5
0 0 92
18
Ju N0 0 72
0 783
60
JUL0 230
0 523
3 5
1 5 720 2 154 9 4 3129 . 10
2 16 1
Grv l re fe renc e U 26 76 13Level sot (m OD) 3 1 00
JUL0 00 6
0 0 30
2 6
AUG0 2 2 7
0 443
2 7
1 54 70 1863 .34 676 3 1
206 8
AUG0 0 2 1
0 111
8 6
SEP5 54 3
12 7 60/ 0
162
4 77 12 18 17 88 6
189 106 1
125
SEP0 156
0 4 86
106
OCT12 6 40123 .90
1662 2 4
A A JUL Au G 541, OCT AC V0 116 0 0 8 6 0 09 2 0 106 0 196 0 3 79
0 19 0 13 0 15 0 2 8 4 73 2 8 310 8 8 9 113 3313 2 7 28 70 1 12 129
OCT0 59 7
2 152 374
1 9 8 4Cat chm e nt are a leg krn): 204 .6
M at aft (m 00 ) 580
NOV1 1 1®6 8 3814 1192
7 4 7 1 9 0 9 6 8 4 662 2 95 2 5 10 3 00 4
16 560 14 730 12 390126 00 163 20 1 15 40
98 115 I I I138 149 138
NOv2 3 78
9 9 989
109
CEC Y AM
6 5 3 1 5 6 0 89 7 0 1 12 7 60
8 5 86310 2 12 35
D( C3 20 5
8 9 5124109
5 .03 21 4206.4 18
189 .10776
1196
1984 runo ff is I I I % of pre ou s me anrainf al l 103 %
1 9 8 4Catchme nt area (n ) km ) 19 8
Ma x al l (rn OD) 16 7
DEC Yew0 385
1 0 135 269
117 89 6
0 253
0 4 13 0 769 0 663 ' 0 .3354 15 8 64 5 52 . 8 .842 1 3 1 36 29092 125 117 1064
198 4 runoff is 93 % of prev ious meanrain fall 84 %
1 9 8 4Catclv nen t area 14 14 km) 145 3
Max alt (m OD) 53 9
OCC Year5 798 3.27723 6 / 30 .4510 7 711114 1184
19 8 4Catchn ient area (sci km) 6 9 5
Max alt Im 00 ) 163
Year1.48440 .1166994 1

á

T he surface water archive comprises some 22000station-year s of daily river fl ows and incorporatesdata from over 1000 gauging stations throughout theUnited Kingdom. In addition to gauged fl ow data,naturalised data have been derived from the recordsof a small number of gauging stations. Catchmentareal rain fall and the highest in stan taneous fl ow,when available, ar e also archived on a monthly basis.
In order that the contents of the archive may bereadily accessible, a suite of programs has beendeveloped to provide a select ion of ret rieval options.Descript ions of these options are listed below, andexamples of the computer output are given on pages139 to 146. T he data retr ieval programs have beendesigned to al low fl exibility in the presentat ion ofthe options, par ticularly those producing graphicaloutput . Before fi nalising a data request it is rec-ommended that the concise register of gaugingsta tions on pages 147 to 152, and the summary ofarchived data given on pages 153 to 161, beconsulted to check the availability of suitable datasets.
In response to user requ irements the data re-trieval facilit ies arc being continually extended . Awide range of specialist analyses and presentations isnow available. Individuals having data requirementsnot catered for in the standard retrieval suite areinvited lo discuss their part icular needs - addressbelow.
Retrievals are normally available on line printerlistings or magnet ic tape, or as hydrograph plots.
Cost of Serv ice
T o cover the computing and handling cost s, amoderate charge will be made depending on theoutput opt ions selected. Estimates of these charges
OPT ION T IT L E
N UM BER
T able of daily mean gauged discharges
Yearbook dat a tabulat ion (daily)
THE S URFA CE W A TER DA TARETRIEVA L SER VICE
LIST OF SURFACE WATER RETR IEVAL OPTIONS
T able of da ly mean naturalised discharges
T able of monthly mean gauged discharges
may be obtained on request; the right to amend orwaive charges is reserved .
Requests f or retrieval op tions
Requests for ret rieval options shou ld include: thename and address to which output shou ld bedirected, the gauging stations for which data arerequired together with the period of record ofinterest and the title of the requ ired options. Wherepossible, a daytime telephone number should begiven.
Requests should be addressed to:
NOT ES
Surface Water ArchiveInstitu te of HydrologyMaclean BuildingCrowmarsh GiffordWALLING FORDOXFORDSHIRE OX 10 8BB
T elephone: Wallingford (049 1) 38800
Hy drological Dataat the Institute of Hy drology
Th e surface water archive is one of several majorsources of hydrological data held at Wallingford .Others include an archive of fl ood peaks from over600 catchments and a fl ood even t archive comprisingrain fall and river fl ows at short time intervals forover 3000 individual events. Data may be ret rievedfrom these sources in a variety of formats. Enquiriesconcerning the availability and use of such datashou ld be directed to the above address
Includes monthly and annual summary s t a l ls / ICS.
Flows in cubic metres per second.
Includes monthly and annual summary statistics.Flows in cubic metres per second.
River fl ow and catchment rainfall data for a specifi edyear with basic gauging station details and fl owstatistics derived from the historical record . Natural-ised fl ows (where available) - and the correspondingrunoff - may also be tabulated.
Includes monthly and annual summary statistics.Flows in cubic metres per second.

138 H Y D R O L O G IC A L D A T A : 1984
T able of mont hly mean natural ised dis-
charges
Yearbook data tabu lat ion (monthly)
T able of monthly ext reme fl ows
'T able of catchment mont hly rainfal l
T able of catchment monthly areal rain falland runoff
10 Hydrographs of daily mean fl ows
Hydrographs of monthly mean fl ows
Flow durat ion stat istics
T able of gauging station reference infor-mat ion
T able of hydrometric stat istics
Gauging stat ion descript ion
16 River fl ow pattern plot s
Exa mples of th ese sixteen op t ions foll ow.
Includes summary statistics. Flows in cubic metresper second.
Monthly river fl ow and catchment rainfall dat a for aspecifi ed year together with comparative sta tisticsderived from the historical record . Naturalised fl ows(when available ) - and the corresponding runoff -
may also be tabu lated.
T he lowest and highest daily mean fl ows, togetherwith the highest instantaneous fl ow (when avail-
able) . Flows in cubic metres per second. Includessummary stat istics.
Rain fall tota ls in millimetres and as a percentage of
the 194 1- 70 catchment average. Includes summarystatistics.
Runoff is normally derived from the monthly meangauged flow. An additional list ing is Provided forcatchments with naturalised fl ow records. A mont hlysummary is provided and all rainfall and runoff
totals are in millimetres.
Choices of scale, unit s, truncation level and overlaygrid pattern are available. T he period of recordmaximum and min imum fl ows, or the mean fl ow,
may be included . T he plots may be based on single orn-day means, or on n-day running mean flows.
Choices of scale, unit and overlay grid pat tern areavailable. T he per iod of record maximum, minimum
and mean fl ows may be included.
T abulat ion of the 1-99 percentile fl ows with op-tional plot of the fl ow durat ion curve. T he percen-t iles may be derived from daily fl ows or n-dayaver ages and the analysis may be rest ricted tonominated per iods within the year eg April-Septem-ber only. Choices of scales, grid marking and unitsare available and the percentiles may be expressed as
a percentage of the aver age flow or of a nominatedfl ow.
T abulation of selected gauging station details andcatchment characteristics for nominated gaugingstat ions.
Provides a comparison between summary statisticsfor a selected year , or a group of years, and thecor respond ing sta tistics for a nominated period of
record .
A brief summary of the gauging station, its historyand major infl uences on the flow regime.
T hree plot s on one sheet:a) daily mean flow hydrograph for a selected year .
b) maximum and minimum monthly fl ows, togetherwith the 30-day running mean , for the preceding
period of record .c) fl ow du rat ion curves for the specifi ed year and for
the period of record.

8 f
eA
rr
88
88
8 8
W8
8r
88
8z
; p
w7.-
7.:
Eg
!!.F
E?F4i
g F
cr
ts
47.1
”:
6:
08
8o
gg
Eg
gg
sti n
W
th .gn
.0; 1
1 F1
;7-t
;; ;
:“ 7?
.T.F t
7
ilk-
A
6
:*7F
E:7
:8 :7
E77
!2
..
J4
E
gc.
HR
H
§§
H§
?§
g§
§ H
§H
§
§§
§?
Vg
ii
Eo
00
08
8 li
p g
Ni
68
08
8t
tr
2 8
88
Z8
88
80
.8
88
06
i kH
g PF
c:4
:4 74
7-74
:5
:11F7
.;i
gE
° u
gh
g gg
ig
g g
gi
gg
gggg
g
r7U
- , e4
r
g8
g8
8 8
08
88
rt
rPr
r8
80
88
88
68
s.
88
pr
r f.
rt
r0
'Wgt
k
hh
g h
igg
r-
t .
..
..
. 4
-r
rE
t
lt
rg
tt
t:
8 t
tt
tt
8t
88
8 "
L: 0
88
o 0
88
00
8 8
88
08
88
80
8 8
80
80
80
08
8 8
80
08
?°,5
r-F
r-.
r7
Ft
rr
r-
p P
=t
?.=
p
gg
to
.8
88
8-0
0 6
00
8 0
00
8 8
08
08
08
00
8 0
08
88
W!
..
..
. W
88
88
8z
8r
t
to
80
80
0 8
88
88
82
.8
8 0
00
00
00
00
0 8
08
80
i n-
8'e
•.
..
..
p
.r
80
Zo
R8
88
8 8
08
88
88
00
8 8
80
08
see
H
; §§
tt
EW
P
88
iH
o 0
00
88
gig
Eg
ggi
gg
gggn
gg
ggg
mig
gEtt.F
4r
is
7;
F4
:7
; .1
:17
i n.
:Min
i g
M
gigi
;
:5E
, 8
r*
;..6
:-
88
80
8 8
g
.. .
. ..
. ..
. .
. ..
. !
Wp
rw
.t
00
08
0
ts
Figgg
i
'eggs
; se
er,:
77
771
P.
88
8'8
88
8 0
86
88
88
88
8 8
88
Z3
..
.
8
.0
0:1:
048
80
88
8 8
88
88
88
615
8
gigi
g En
gi
gEZ
E g
ilgg
; ;;1
0r
00
:-5
. ..
. xt
: zs
- 55g
8
5itZ-M
:gn
i g
i ngi
n
gg:I
gi:i i
l i g
hi5
.:.; zr
.81-,z
neaL
a t e
r s6
; tag
sS
88
66
-r
m.
"„
. .. .
. .. .
. _„
.. .
. .. .
. ,
P >
o -
8 it
::
:
5-
z
C0
V
>:
0
aEr.
0"8.
E8-
8
:
0cc
..
.r
r r
rr
rr
rr
rr
r r
rr
rr
rr
ri
0m1,
ncq
gg
:1Ei n
gi
gg;
E8
ro
88
c ;gg
H
igg
gg
ggg
gin
gEg
g5i
A> P:
1"
0 cnt71
6

140
O PT ION 3 YE ARBOO K DAT A T AB U LAT ION (DAILY)
$ TA T I ON 08 6 C8 I 17 I 0 5
Me l e d i t y - a r e. & t a t t o o
T a u • b e r l • I g h
H Y D RO L O G I C A L D A T A : 19 8 4
19 0 2FOR 13 5 2 Au lt ACCORD A S % OA • 1 0, 4 T V O I s ( s ) 1 0 C S [ 0 1 0 4 1 .
H U L L OI NG 1 9 8 2 PRL - . 9 8 2 • A b s t r e c t I o n t o r 5 5 5 1 1 4 V i t a l' S u
Km f l ow ( 6316 ) 2 1. 6 10 17 . 690 1 2 2 • A v g Ve t t s. 1 5. 0 1 f r om e t t l or at r e t u r n
L o me s t p o o r l y me a n 1 1 . 3 10 1 9 6 4
118 g Iums t y e A r l y moo n 1 7 . 1 9 2 19 6 0
L a m. . . mo n t h l y ma a n 2 . 462 ma y 0 . 4 2 ) 4 14 5 19 761 ( 5 6 1 0 0 8 0 0 1 4 1 7 V • S 0 15. 450 De , 77. 360 Oc t 196 0L ow s . t d a i l y mea n 1 . 16 1 1 7 .14ms 0 . 2 0 0 2 8 Awl 1 9 76
0 11 6 . 1 1 4 . 1 1 7 mea n 1 70 . 0 0 0 . 9 b o o 3 6 1 . 6 0 0 4 De o 1 9 6 0
Pe a l 2 4 1. 10 0 . 9 Lec 644 . 900 4 pr e 1960110 %I I . 5 9 . 7 30 4 5 . 9 10 1 30
5 0 2.1 1. 12 . 0 30 9 . 4 72 1 2 7
9 5 t I l e 1 . 6 12 1 . 2 10 1 2 9
00000 I t o s6 1 ( . 1 1 1 1 0 0 co 67 66 7. 80 1 6 4 . 6 0 112A ft o n I r u n o f f ( • m) 8 3 2 0 8 3 4 2 2
a a a a a I r . 1 5 8 . 1 1 8 mm) 12 19 1141 I on1194 1- 70 r a t s f a l l a m . . . . . 866) 118 31

T H E S U R F A C E W A T E R D A T A R E T R IE V A L S E R V IC E
OPT ION 4 T AB LE OF M O NT H LY M EAN GAU G ED DISCHARG ES
0 1110 01 7414 4 7 C351411.8 10 1 KA T. . 7 KW CA C I ) DI SC:W M CCI I C W I L D 11 1 SCUM
a lo N J AJOC OET SOW Ol t
1979 30 . 9 16 37. 90 5 44 . 4 10 11 . 10 4 11. 80 1 7. 4 79 1. 954 11. 910 5. 114 9 . 371 5.11. 0 7
19130 24. 179 4 3. 919 27 . 454 14 . 44 / 7. 4 13 1 . 44 0 1 . 2114 3. 6 10 11. 417 40 . 0 0 25 . 949 13. 352198 1 13 . 676 16. 61 7 32 . 14 1 1. 171 19. 15 1 9 . 113 7. 744 7 . 709 9 . 49 2 4 7. 732 74 . 2 12 44 . 14 71947 40 . 54 1 18 . 3 11 4 2. 171 4 .0 40 7 . 44 1 1. 127 4 . 04 3 7. 10 4 . 175 24 . 214 12 . 6 31 15. 410195 1 48 . 970 11. 140 14. 4 34 17 . 695 34 . 9943 4 . 0 1 1. 410 0 . 6 36 3. 745 14. 124 11 . 114 46 . 9041984 47 . 101 36. 469 7. 44 9 5 . 45 / 1 . 7) 3 1. 329 0 . 793 0 . 80 2 3. 509 20 . 4 04 49 . 310 37. 000
. •
40 . 114 27. 961 31. 344 11. 3 15 17. 747 1. 89 3 4 . 06 1 3. 99 0 6 . 297 74 . 131 33 . 767 0 . 10778 . 1/ 9 14. 417 7. 44 9 3 . 40 7 7 . 75 0 1. 329 0 . 71.1 0 . 80 7 3. 141 9 . 121 11 . 134 33. 31 742 . 101 4 1 411 52 . 14 1 12. 695 36. 998 9 . 440 8 . 764 11. 9 10 11. 4 21 47 . 107 5 7. 4 13 51 . 4 50
ol .104 .113 4ELA77 0 El O.CSI VE1.1 TO na DO S S 1.10 .)1.
OPT ION 5 T AB LE OF M ONT H LY M EAN NAT U RA LISE D DISC HARG ES
0 0900 1 7 14414 6 47 M CCA W 190 47341.7 444 4.47116.4/ 15811 0 100 4442 2 3 174 0 .4 1C W I LES 71.1. 11 0240
DZAJ I t S I LI PIt S AI I 8.40 2L71 i Ll , • DC 518 CC/ 90 4 CI E
11129 175 . 200 149 . 200 70 1. 200 16 5. 730 1 35. 403 10 4. 9 00 45 . 960 41 . 0 90 30 . 440 30 . 400 46 . 4 70 1415. 40 3
1980 140 . 160 142 . 200 i 37 . 603 i 06 . 700 49 . 340 4) , 8 40 . 3430 87. 400 18 .0 10 75. 420 75 . 340 90 . 420191 1 66 . 9 70 6( . 5) 0 199. 300 113 . 90 0 1 14 . 400 4 . 170 40 . 640 44 . t.:o 01.900 915. 110 78 . 220 142 . 20011 32 : 9 4 . 10 0 12 1. 70e : 4 7. 000 90 . 140 ¶1 . 4 10 45 . 9 20 14 . 490 11. 210 11. 14 7 49 . 343 179 . 903 12 2. 100194 3 174 . 500 113. 100 64 . 6 70 116 . 400 137. 400 62 . 6 60 4 3. 6 70 34. 343 13. 702 14 . 140 19. 100 76. 3101944 t 44 . 43 0 129 . 203 10 5 .00 13 4 7. 1441 4 1, 00 2 4 4 . 4 9 1 24 . 700 24 . 100 11. 903 43 . 110 04 . 900 126 . 100
. .
t U 134 .0 01 175. 8 71 151. 528 117 . 20 0 12 . 99 4 44 , 1 74 119 . 31 3 39. 0 2 2e. 542 61 . 372 79 . 00 5 126 . 70160 . 9 71 60 . 1 10 04 . 470 4 7. 04( 49 , 440 44 , 49 7 24 . 700 24. 0 0 39 . 100 74. 090
N J 196. 100 20 1. 210 161 . 700 : 12. 400 104 . 40 3 43 . 950 44 . 4 .0 1 1. 900 115. 010 179 . 400 1 / 7. 300
710 . $11044117 LLIA . LS LALI A15 .41.1.11 fl 7131. 0. 44 3 P PM ,
1 c 5
OPT ION 6 YEAR BOO K DAT A T ABU LAT IO N (MONT H LY)
46 , 3•314 • co no r lo y r el y r el et 31434 2 34 Y et • • • • 4• 1. 414 . 1
7 146 1 70• 4 1456 L• • • 1 s t a . ( • . . . IL • 14 . it • 02 ) 1 40 4
11110t WEETt I C 07747 : 3113C3 rot 1962
J o r o b /14 4 Ap r Mel ; Da 23.1 . 4 4 So p 0 54 No • 04 5 Do e1/1100 5 40 4 . 41 , 080 11. 140 42 . 370 4 , 04 1 2 . 44 2 1. 12 8 4 . 54 3 2 . 345 4 . 775 24 . 34E 57. 8 10 55 . 0 0 7 1. 230
0. 319 : . Poo 27. 80 05. 34 143 . 90 13 . 49 0. 04 12 . 4/1 142 . 21 7. 73 2 0. 40 72. 30 2 15. 20 14 1. 10 34 1. 10Itu o l I ( s o : 112 54 13 7 19 4 9 28 I I I 79 144 150 5 33Ls o t • 1 1 ( eo ) 114 l e 14 1 74 17 l i e e l 5 7 8 1 129 111 179 17 29
0 4 134 17 APO /ZAJ D 1 STATI ST I CS 304 77 19 10US 4I 0 40 ( Oct 1938 t o De c 193 1:
U • b • r l • I g b 1 9 11 7
ro t LV g . 04 . 490 29 . 440 13 . 6 20 13. 730 9 . 404 0 . 44 6 4 . 743 5. 646 4 . 220 16. 9 50 17. 960 34 . 030 17 . 61 111c9ts Low 4 . 43 7 3. 144 7. 9 )8 3. 04 9 1 . 0 73 1. . 33 0 . 794 0 . 47 3 0 . 441 1. 0. 3 3. 65 3 13 . 710 11 . 2 12
( . 314 11 4 149 50. 610 14 . 740 12 . 140 32 . 800 72 . 140 14 . 4 30 2 3. 390 . 4 . 4. 0 47 . 4 70 77. 360 56. 000 13 . 0 70 17 . 54 7Po t f l ow 1153 / 61 170 1. 44 774 . 40 131. 90 149. 40 13 1. 10 311 . 30 4 21. 10 249 . 70 444 . 91, 944 . 90L oco! ! ( a l 1. 1 05 4 7 4 3 33 17 l b 14 16 4 1 66 117 VDVa I n/ • I 1 ( a ) 127 9 1 59 73 12 Ot. 74 8 2 1 , 112 127 137 I I 4 5
Fo t o. W o l i n& 113. 448 144 5 4 1 1942 c. o . ?! 1.• DM 11 po • l oo eon5.4• 4 LOD t yp r VA 46 142. 11

142 H Y D R O L O G I C A L D A T A 9 8 4
0 5000 1 TM AT Lasutan kai 166 11 Cr 10 10 3iLY . 1570 7• 161.000 PU S 1, 1331 .4901 5 APO1110 3459 sofa LM L ST DA I L Y M AI GI ULI O DI SO LU OL S
19 0 510 M U S S KU SL0 :0 0
MA I JAM r ut KM API; KAY 3 0 1 J UL 42 3 SET DC, 509 DU
19 75 il l 19 2. 600 2 36 . 700 9 7. 5 10 5 1. 100 70 . 040 3. 504 9 . 96 7 16 . 4 13 1. 73 7 1. 3116 1 1. 9 00 94 . 700ND 116 . 900 186 . 00 0 8 7. 0 00 4 6. 0 13 37. 00 0 1 . 1737 5. 0 19 11 . 130 1. 69 9 1. 314 12 . 1740 71 . 94 0
113 15 . 510 6 . 162 13 . 49 2 5 . 92 3 1 . 752 3, 351 1. 6 56 1. 799 1. 0 15 0 . 85 9 0 . 5 5 1 3. 9 16
19 79 9r ; 95 . 3 10 170 . 800 125. 000 3(1. 700 55 . 4 30 20 . 5 10 5. 9 94 69 . 190 : 11. 7 13 6 1. 5 ) 3 9 5. 94 3 154 . 300
HD 66 . 4 20 11 1. 900 92 . 120 16 . 130 31 . 6 30 14 . 6 30 4 . 14 3 37 . 0 70 11 . 6 40 15. 4 90 0 . 0 10 20 6 . 400
13 12. 4 13 10 . 04 0 33. 390 5 . 75 7 6 . 746 1 . 749 1. 13 1 1. 31 1 2 . 799 3. 514 31 . 710 : 3 . 7 10
196 e N I 11 3. 400 170 . 10 0 31 7. 330 136 . 900 5 . 56 7 64 . 4 10 12 . 5 30 10 . 4 10 68 . 733 160 . 42 3, .. 7 1. 00 0 139 . 300
Ki; 55 . 4 20 12 3. 6133 0 7. 0 00 94 . 790 4 . 79 1 71 . 4 30 39 . 6 10 4 1. 46; 3. 9 . 2042 114 . 9 03 91 . 790
GO 33 . 6 30 13. 96 3 10 . 130 3. 16 5 1. 56 7 1. 133 4 . 90 2 1. 358 4 . 3 11 7 . 6 14 6 . 0 76 30 . 1 70
19131 131 149 . 700 60 . 9 90 119 . 930 31 . 160 50 . 860 74 . 120 14 . 0 110 11. 050 97 . 0 70 L21 . 900 90 . 34 0 77 6 . 0 20
AD 80 . 100 4 3 . 4 10 2 1 3. 40 .2 24 . 990 33 . 340 19 . 3 20 5 . 0 75 31. 361 4 1. 080 10 5. 23 0 50 . 5 10 316 . 10 0
LO 33 . 6 90 7. 799 3 5. 890 3. 120 5. 911 0. 0 31 ; . 1136 3 . 214 1. 0 76 1 1. 170 7. 1 35 : 6 . 110
. 198 2 AI 11 7. 6 00 55 . 180 14 .1. 900 1 3. 690 5. 0 39 12 . 460 162 . 10 0 7. 717 0 5. 40 3 77. 150 2 15 . 100 24 1 . . 0063 11 1, 00 36 . 160 10 1 . 090 17. 130 4 . 10 9 . 49 3 7 7. 330 9. 42 5 4 , 9 30 56 . 4 017 124 . 204 37 3 . 0 370
L O 10. 19C 1 1. 1 30 9 . 0 77 3, 74 7. . 77 1. 165 1 . 0 30 1. 69 1 1. 3. 6 9 . 14 e 3 . 100 12 . 130
.741 192 . 6 00 2 16 . 700 139 . 90 0 336 . 900 70 . 0 40 54 . 4 30 361 . 200 69 . 131 9 7. 0 74 . 60 . 402 / 11. 200 370 . 300
M c 113 116 . 900 16, 090 2 2 1. 400 94 . 700 2 7. 700 52 , 30 77 . 310 37 . 1 70 4 2 . 1 61. 119 . 701 324 . 10 0 4 0 5 . 6 0 0
. Ml a 3.0 10. 6 30 6 . 162 9 . 0 77 3 . 3 74 3. 4 77 1. 16 1 14 0 1 1. 224 1. 0 11 0 . 8 e9 1 . 5 e7 3. 97 a
/ I L U MW ° Itt A r l y M CLJ SU L LY TO TKL M a i
XI - S I CKEST l eSTAKTMI Lo in 3 15 0 1M 1363 - at at as, DA I LY ISM (A MI D 0 130 34m i G110 - 100 39 7 M I L L OEM 18 0( 7 3 0 130 44101
0 500 0 1 Cm • 7. umm xi m a i 4 51* 1. A62 5.n . E 5A 10.7 •1 0 11 10 01 3113 15 POI4 AS A 2 11CL4TA01 o r LOM : U M ?L AP
/T M KKR An i. M Y 2 03 J UL eL r 301 Nov DST
19 79 Ama m i (Ku 36; 146 114 11 4 9 6 3 9 5 4 1 39 14 el l 376
1 196 1- 70 K AP : 26 109 34 8 73 63 100 1 16 4 1 18 12 5 3 325
19 79 IM I NT AI .L 0 0 0 1 o l 72 364 ea W E 52 4 5 Lt e 4 9 100 31 2 192
1 394 3. 70 MGM 5 7 76 20 8 94 116 5 5 55 124 4 7 01 9 1 14 1
1900 L 4 1K/0 1 1. 0 0 0 99 1 33 I I I 14 4 3 364 6 5 09 30 . 1 75 10 7 115
t 19 4 1- 70 M AA 79 14 1 166 11 5 3 26 9 79 6 0 9 7 35 1so 8 1
198 1 134 110 *3 4 . 0 0 0 SO 76 110 . 7 126 4 1 76 35 15 1 200 17 37 3
1 I 94 1- 7D M AK 71 8 3 1 32 6 5 156 6 9 9 5 14 IGO 3 7/ e l 12 7
1981 M I W ALG 0 390 LUe 75I 19 4 1- 70 13t AI 8 3 115
PA I NT AL L ( le l)PU I 11 3 I CO 14 7 4 3 7 1 0 7 70 72 1/7. 124 1 15 16 74111 ao 72 1 14 24 37 4 2 35 39 14 6 0 11 5
1631 160 346 18 3 ea 126 164 9 5 126 15 3 30 0 192 19 1
Tit e 53101110 7 M A TES LI C3-1211 97.1 1 TO n il YEARS W a y
OPT ION 9 T AB LE OF CAT CHM ENT M ONT H LY AREAL RAINFA LL AN D RU NOFF0 5000 1 TM n 0 5i 1 511 10 1
M AI M I An t PA Y J UI. -JCL 0 30 SU 0 0 7 1:09 3 11
19 78 14 167 83.1NC793• 17
19 79 ILLI M AI I13 1031M
OPT ION 7 T ABL E OF M ONT H LY EXT REM E F LOWS
OPT IO N 8 T AB LE OF CAT C H M ENT M ONT H LY RAINFALL
343 14 37 1 16 6 7 5 .7 5 1 12 9 392 379
03 1 33 4 6 193 8 1 8 5 75 114 343 1 32
30 107103. 7 51 .190 01.1 9 30v uli c r r ( 078 ITU Fl o e GAVA C TOM S)1* 71 9. 101. 3 21. Pus 03 I 8 Th l CA1 0 19TLOT
160 146 316 5 3 49 6 3 9 5 4113 349 14 08 3 / 4I l l
314 1 I 0 5 33 10 11 9 7
110 72 364 es I 07 52 4 5 316 4 9 100 322 192I OU 96 344 49 4 2 2 5 6 19 17 30 11 3 3.6 7
1980 KA107 A.1.1. 99 110 13 1 14 4 3 6 6 5 69 101 177 I D/ 1 151
11.10 0 1.1 9 1 13 3 89 33 as 18 l e 1 31 9 1 108
198 1 RAI M ALL 90 76 35 3 8 7 126 4 7 78 35 15) 20 37 5 6 37 3
113 50 r r 9 7 4 9 1699
6 3 29 3 1 115 76 I SO
1951 11A 161 124 . 136 l a 14 3 2 37 116 6 7 II 7 6 1 119 192 1 79
Ity /C 1717 13204
137 28 5 3 79 164 160
. 5* 1100 1 1C I I I I I 100 14 7 4 1 71 8 7 70 71 5 1 124 1 15 16 7
KM 90 71 114 24 17 4 2 4 5 3 5 39 34 6 1 11 5360 146 I V 68 12e 144 9 5 126 151 20 3 193 191
. m a tM AX I I I 9 5 12 9 35 3 1 20 l e 1 7 20 50 9 1 140
KI N 6 9 II 9 19 , e 3 I I 9 7M X 193 : 143 I n
896 3 31 25 39 39 155 166 160
. I AM U
IG O95 9 5 SI 5 1 44 2 3 23 24 24 65 79 5 48 3 6 5 5 1 19 5 1 1 9 10 2 1 16 56
SI CO 3 100 9 6 >1 00 6 7 49 4 3 3 1 11 76 9 3 ) 100
i sa 1100101 1 M a r t s es.a ust vn a 10 124 11 • 1 3 SPAM .

T H E S U R F A C E W A T E R D A T A R E T R I E V A L S E R V I C E 143
OPT ION 10 HYD RO G RAPH OF DAI LY M EAN F LOWS
TAW AT UMBERLEIGH 1981050001Prevlous record 1958-1980 Cotchment (area 826,2 km
POP ma lt
POP 171in
D a il yM e V ,
DAILy MEAN FLOWS
OPT IO N 11 H YD RO G RAPH O F M ONT H LY M EAN FL OWS
15006 TAY AT BALLATHIE
500.
mean
30.
Previous record 1953-1980 Cotchmenb ore° 4587,1bm2
MONTHLY MEAN FLOWS1000. 1000.
max 500.
100. ffi n 100.
u_
-
50. 50.
10. JAN FEB MAR APR MAY JUN JUL AUG SEP OCT NOV OEC 10.
1981

144 H Y D R O L O G IC A L D A T A : 1984
0 30 00 3 T AG A T Lns t r - Et c a
OPT IO N 12 FLO W D URAT IO N ST AT IST ICS
6 7 M I D I: T A I L E
1 OA F NE AP. F LOW AE CIA DI D S T AT S C 6 80 : 6 2 EN 0 C mE C 3 F O R G I VE N 7 1 5 0 1 6 7.A 0 1 or T I S E
4
1 1 1 . 4 0 7 5 5 . 9 3 3 7 5 . : 1 1 7 0 . 8 2 7 6 4 . 4 4 7
4 7 . 4 7 4 4 4 . 1 7 6 4 1 . 9 6 7 3 9 . 8 6 4 3 7 . 9 6 6 3 6 . 2 0 1
2 0 7 5 . 8 7 5 2 7 . 6 1 0 Z6 . 10 0 1 5 . 3 0 6 2 4 . 3 0 2 . 1 3 . 3 1 5
1 0 1 9 . 0 5 1 1 5 . 2 9 4 I 7 . 5 9 7 : 6 . 9 7 5 1 6 . 4 5 0 1 5 . 8 3 0
4 0 1 3 . 2 5 4 1 1 . 5 4 7 1 7 . 3 4 0 1 1 . 9 1 4 1 1 . 5 1 9 1 1 . 1 1 9
5 0 9 . 3 6 6 9 . 0 2 0 5 . 6 7 8 5 . 3 9 0 6 . 0 7 3 1 . 5 0 1
6 0 6 . 4 1 4 6 . 1 8 7 3 . 9 7 1 3 . 7 5 5 5 . 5 7 7 5 . 3 1 3
7 0 4 . 1 9 7 4 . 1 0 1 1 . 9 1 6 3 . 7 3 4 3 . 5 6 4 3 . 3 9 6
8 0 2 . 6 5 9 7 . 3 3 4 . 2 . 4 1 5 1 . 2 8 7 2 . 1 7 5 2 . 0 7 1
9 0 1 . 6 4 7 1 . 1 6 7 1 . 4 9 1 1 . 3 9 1 1 . 2 6 5 1 . 1 4 1
MA X n ow- 36 3. 50 0 VI I ! LON - 0 . 2 : 0 156 4 31 F LOW- 1 8 . 1 6 0
I l lea r a o r Z E RO S - 0 6 8 9 5 1 11 Or v a Ltl E S L SA DA 9 4 9 7
F I R S T YEA R o S ED - 1 9 5 9 LA 5 T YEA R US E D- 1 9 8 4NU MBE R O r YEA R S U3 F 0 - 2 6
ON L Y TE AR S CO NTA I N I NG NOT S OI E T KAN 5 6 1 6 6 1 1 0 OA TS : RE D
F L C W O U R A T I O N .. U R V L
C5303 : TAv A J MI5LI LL 7C6 . AP E A 132 6 . 2 UU KM•
SC. I C. s o . s c . 7c . K .
20. 30. Ao . 3G. SO. 70 . I I . 9 2 . f f .
PERCE NTAGE OF ' I M1 FLOW Ex CEEDEO I NORMAL PROBABI L I TY SCALE ;
0 4 0 6 E U F Lo V S : s e e
3. 13 , 11 at STY . 'Ns h l ? I- . . 1. • • • M a I F HS I Ca S n a g a 33.111 4 3 • • l aa a l n
a 314 33 3 13 3 . 111 131.1 1. 11. 106.113J
• 311133 . 13113 U V la in s S . 113 Ca r a a III 3 3 11131• 3
IOC] .
SOC.

T H E S U R F A C E W A T E R D A T A R E T R I E V A L S E R V I C E 145
OPT ION 13 T ABLE OF GA UGIN G ST AT ION REFE REN CE IN FORMAT ION
. A.: 0 6 Cu e ! AT 0 7 0 9V* 1 6 c 1 t y - a c e s I A: : o n . 9 4 11 1 1 1 1r d n 1 9 7 7 b y t 2 a C o me t F a c t t o n e l l o w l a n e . b e d ( c a t, -
4 8. 0 0 7 6 1 1514A 1. 1 4 7 2 0 4 5 6 4 4 0 2 11
r o c. Cr . • 1 9 b r o a d
4 6 0 0 9 S T s LO T Al CR, . 1 c s M: L L d o o DC O 4 9 a 6 4 1 0 1 11 . e f t . , 4 : e • 2 1. 15 o u 1 : a u c r e s t b r o a d h
4 6 0 10 5 6 A1 3 S AT I RE OROWN3 R : MAL 4 4 9 , 4 1 9 f a r w it l f . 2 0 1 4 1 c t e a ! b r e a d t h L o u M o w w e s t b r g a d t h 3 . 4 A
4 8 0 1 1 7 0 6 1. 9 9 7 ' E S TO R I L '. 7 1 0Co e p o - n d 9 a p v e . 2 o t a l. m a : 6 9 9 0 9 1. 1 1 0 . 5 • Le w 1 1 1. • e l fl t. I I • a d t, 1 . 5 •

146 H Y D R O L O G IC A L D A T A : 1984
56001 USK AT CHAIN BRIDGE 1983Previous record 1958-1982 Catchment oreo 911.7km2
500. -
100. d
In50.
0e
10. _
5. =
S. -
50. ]
O PT IO N 16 R IVE R FLO W PA TT ER N P LO TS
DAILY MEAN FLOWS
• I on I Feb I Fla - I Apr May TLn • 1u : ' Aug ' Sep • Oc t Nov De c
MONTHLY MEAN FLOWS
Max
100 .
50.
1
I on I Feb I Mar I Ap r I May I un IT iT i Aug I Sep I Oc t Nov T Dec
FLOW DURATION CURVES
Pr ev ious r ecor d
I • I t t ' ' l • r r r n • I • I ' I • I • I " "I. 2. 5. 10. W. SO. 40. 50 . SO. 70. 80. 90. 95. N . 99.Pe r c e n t a ge oP t i me P 1 ow exce e de d (Nor ma l pr obab I I I t y s ca le )
500.
100.
-50.
10.
5.
10. -;

Concise Register of Gauging Stations 147
Sta tio nnum b er
Rrvername
Nat rona'Gri dref erence
M eesun ngas: th o rn y
Ares(64 8E8
Ste ts ,num b er
Reimnam e
Nat ion alGridrei t inm ce
M easur ing Areaauth o ri ty teg 1m 11
0 020 3 1 Heim sdal t NC 99 718 1 109 :11 55 1 • 190 06 W ater NT 228 / 32 M S 10 1.01900 7 Esk NT 339 723 FE B 330 0
CO300 1 Sem NC 511106 2 /C HF 494 6 190 08 South Est NT 325623 RFS 112.00030 02 Cm 0. 4 POI 49092 1 10 1113 24 1.1 19009 Bog Bra n N T 02659 1 V S 8 .50030 33 OM B NC 40 300 1 10V 13 330 7 190 10 li rastl Burn N I 2 / 3 / 0 1 M S (6 200 30 :34 Cassley NC 4 720 22 HM S (6 7 5 190 11 Nort h Esk NT 3336 78 RPB 137 0CO3005 SM. M 1 5749 74 HE S 5 75 0 190 12 W ater of te m% N I 2 12688 RFS 11 0
190 14 Bros Da n N T 114 737 RFS 34 1C0 400 1 Cano n M t 48754 7 Ff tPB 96 1 8 190 17 e ng ar Burn N I 161133 M S 38 6C0 400 3 Abet s NH 654695 Pe n 20 1.00 34004 /Backwater M t 455563 HM •B 336 7 700 0 1 Tyne NT 59 1168 Pa l 30 1 0
200 02 W est Peff p Bry n NT 4898 11 RFS 76 70 3500 1 ' Beauty M t 42640 5 189 4E 849 5 7000 3 Tyn e NT 45668 9 M S 161 0
2 4 East Pe er Burn NT 6 108 24 1:049 3 ( 1010 600 1 • Ne ss PM 6 394 10 NSKE ( 797 3 7000 5 Bu ns Water NT 45 7688 M S 93 000 500 3 Ma rston M I 4 16169 RI R 39 1 0 200 06 Del W att , NT 645 768 WS 5 1 8006006 • At D ear ac e, M P 377 168 ND< 7 7 5 70 30 7 CMInrd W m. . NT 5 117 1/ RFT 64 000 600 7 Ness 1. 1 64542 1 190'111 11139 1 1000 8 Bros Bwn NT 69 7776 RP9 19 7(106 008 b ec k MI 450 303 HRP9 10 5 9
2 100 1 • f lue] W ater NT 08 8205 LAW D 23 7(10 700 1 hne c on NH 82633 7 PA PB 4 (5 6 2 1002 • Wh tt adder Wale. NT 663633 LE WD 45 600 700 2 Fo cerw n NJ 0 18583 FI I1P13 78 1 9 2 100 3 Tweed NT 257400 W RP 694 000 700 3 Loss* NJ 198626 NUBS 2 16 0 2 1004 Watch W ater NT 664 566 BRW O 10 I00 7C0 4 Nam Pa l 98755 1 POU' ll 3 13 0 2 1005 Tweed NT 206 39 7 WV 3 73 000 700 5 Om * NJ 00 6480 PE 13 165 0 2 1006 Tweed NT 498334 WTIP 1503 0
2 10 3 7 D u c k W ater NT 4863 15 W RP 499 000 800 1 • SOW NJ 2 78439 HEMS 2654 7 2 1008 Terno t NT 702 280 W HP ( 110 0008002 Spey Pa l 98 1087 IS MS 10 11 7 2 100 9 Tweed NT 8984 77 WV 4 390 00080 03 • Spey NN 759996 NERPB 533 8 2 10 10 Tweed NT 588320 W RY' 2080 000 800 4 Avon NJ 188352 NFRP111 542 8 1 10 11 Yarrow W ater NT 4392 77 W RP 23 ( 000 800 5 5140 MI 946 19 1 NEWS 126 7 8 2 10 17 Tenor NT 522 159 W HP 323 000800 600 900 7
St et NJ 3 185 18 M PS 266 ( 2 2 10 13 Gala W o w NT 4 793 74 W RP 20 7 0SPeYTrorme
NV 68 796 2Ni l ' 789995
ED 'SEMS
400 4130 3
7 10 142 10 15
TweetLeader Water
NTNT
109285565388
W RP 139 0W RP 239 000 8008
00800 9 DOne n Nu 9 7774 7 DM A 7 72 7 7 10 16 Fy• W ater NT 942635 W M 119 00080 10 SP0 NJ 034268 EMS 1148 8 2 10 17 Enrc i Water NT 734 132 W RP 3 7 5
2 10 18 Lyn* W ater NT 20940 1 W HP 175 00090 0 1 Onveren NJ 532464 EPIRB 44 1 6 2 10 19 Manor Water NT 7 17369 W M 6 1 600 900 2 ()evert:. NJ 705 498 HIPS 954 9 2 10 20 Yarrow W ater N I 30924 7 W V 155 000 9(0 3 b p NJ 494506 EPPS 176 1 2 10 2 1 Tweed NT 752354 W RP 3330 0009 304 Bome NJ 5 193 73 FHPFI 179 0 2 10 22
2 10 23W hosadder W ale,Let t W E er
NINT
88 1550839396
WRY 50 3 0W RP 113 0
0 1000 1 Yttran NJ 974308 FIIPB 448 1 2 10 24 Jed W ater NT 6552 14 WV 139 00 ' 000 7 Ugon NK 10 1485 EA% 325 0 2 10 25 Ale W r et NT 634244 W RP ( 74 00 : 000 3 Vai n NJ 94 7303 1111:11 523 0 2 10 26 I rma W ater NT 2 / 8 138 W V 3 1 0
2 10 2 7 Docker:Wm Water NT 826530 W RP 159 00 1100 1 Don NJ 89 7 14 1 FRPII 1773 0 2 10 30 Magclet W ater Nt 13 1231 W V 56 20 1100 70 11(0 3
DmDon
NJNJ
75620 1566 170
A W L)( PPP
787 0499 0
27 ;00 3371 • ( Tci nio NTNT
97 73969 193 10
W A 60 3 0W A (98 9
2 10 34 Yar row W ater NT 288 744 W RP 116 00 1200 1 Deo NO 635956 FM B 1370 00 12032 Dee NO 798 983 IS M 1844 0 2103 1 Coquet NU 7340 44 NW A 569 80 17003 Dee NO 34 396 5 EAPB 690 0 7 70 0 7 ' Cogunt NT 8 / 00 83 NW A 59 50 12034 G moc k Bum NO 324956 IS PB 30 3 2100 3 ' Usw ay Bu n NT 8860 77 hrW A 2 1 40 1200 5 Mu ck NU 36494 7 UPS ( (0 0 22034 ' Ain MT 2 11129 NW A 20 5 00 120 36 Genn NO 3579 7 1 CRPF1 150 0 27006 li tyth NI 24380 0 NW A 269 40 120 3 7 Dee NU 098895 EPPS 289 0 2203 7 Wensbeck NT 175858 NW A 28 1 3
7200 8 Alvi n NT 92506 3 NW A 2 7 70 1303 t Berm. NO 826 733 0 E 8 123 0 2100 9 Cooruet NU 06 70 16 NW A 346 00 130 31 Luther Water NO 6606 68 RPB 138 00 13033 South Fsk NO 583593 RP8 48 7 0 2303 1 Tyne N7 0396 17 NW A 2 175 60 13005 Lunan W ater NO 65549 4 RPB 174 0 7300 2 Denn ent NI 04 150 8 Pi W A 118 00 1303 7 Nort h Fs. NO 699640 RP° 730 0 2300 3 Nort e Ti nt NY 906 737 NW A ioor 50 13008 South PE NO 600596 RPB 490 0 73004 South l ynn NY 8566 4 7 NW A 75 1 I
2300 5 Nun % Tr io NY 7768 6 1 NW A 284 90 1400 1 Edon NO 4 15158 RPB 30 7 4 73(0 6 Sourth Tyne NY 6 726 11 NW A 32 1 90 1400 2 Di En y W ater NO 4 77374 R111 126 9 2303 7 Otnw ent N7 161358 1 NW A 242 I0 14005 Mon ey W ater NO 44 1214 RFS 52 0 7300 8 Rene NY 8688 32 Nw A 343 8
2300 9 Sou th Tyne NY 7 16465 NW A ' 18 50 1500 1 We NO 18764 7 FIW S 70 7 230 10 ' Ta•set Burn NY 7898 79 NW A 96 00 15032 Nem o : Burn NO 730605 RW S 15 4 230 11 .ekk , Bun, - NY 644946 NW A 58 80 15033 T• y NO 081395 RFS 32 11 0 730 17 ' Fasi A lan NY 802583 NW A 88 00 15004 I, no . NO 7806 59 RW S 24 1 230 13 West M en NY 79 1583 %W A / 5 10 15035 W igan NO 2 / 5558 RW S 40 9 730 14 ' Nor t h Tyne NY 63 193 1 %W A 2 7 00 1930 6 Tay 50 147367 RPR 458 7 ' 230 15 • North Tyne NY 924 72 ' NOWC 10 43 80 1500 7 Tay NN 924534 RES 1' 49 40 15008 Dean W ater 50 3404 79 RPB 177 I 1400 1 Wear N2 2643 76 %W A 6 57 80 150 10 0 9 NO 295466 FE B 366 5 2400 2 Gam l en NZ 2 1530 6 NW A 93 00 150 11 Lyon NN 786486 RPB 39 1 I 0 7400 3 Wear NY 984 39 1 NW A 171 90 150 11 Turnmel i rN 9405 / 7 RPM 1649 0 0 24004 Bedbum Red , NT ' 18322 NW A 74 90 150 13 Aerrond 50 06 7258 RPB 174 8 0 74(10 5 D owney N2 15938 7 NW A 178 50 150 16 Tay NN 782467 RFS GOO 9 0 24036 Rookboot Ro n NY 952390 NW A 36 5
Bram NN 9 9406 RES 197 0 0 2400 7 Bro wnay NZ ' 65462 NW A 44 60 150 18 • Lyw r PrN 534 448 'SHE 161 4 0 2400 8 Wm , NZ 17430 9 %W A 455 00 150 23 Bram M / 0 14422 DS 2 10 0 0 7400 9 Wear NZ 1835 12 NW A 1008 30 15024 Oec nart NN 56 7310 FE B 239 00 150 25 S t et NO 1744 77 FE B 432 0 0 2500 1 Tees N7 759 13 / NW A 8 18 4
0 2500 2 • I n s NY 932260 N1N A 2 17 30 16130 1 Er n' NN 933 167 RPB 590 5 0 25033 • Trout Beck NY 759336 NW A 11 40 160 02 ' Fr n 'i N 754.216 RPB , 176 9 0 2500 4 Dor n* NZ 184 129 NW A 750 10 1600 3 Ho r b I Wake PPP 764 204 FE B 99 5 0 25005 Lever NZ 445 122 NW A 196 30 160 04 Er n NO 043 194 RFS 782 1 0 750 06 Coma NZ 034 122 NW A 86 1
0 2500 / ' Cww Beck N2 182 101 NW A 78 20 1700 1 Cano n NS 8 328 20 RPB 122 3 0 25008 Tees NT 04 7 166 NW A 509 20 1/ 00 2 Leven NO 369006 M S 474 0 0 250(19 Tees NZ 364 105 NIN A 1264 00 17003 Ro nny W arm NS 824804 RFS 50 5 0 250 10 ' Bayda e Back N2 260 : 56 NW A 3 1 I0 17004 Ore NT 3309 9 7 FE B 162 0 0 250 11 I an gdon Beck. NY 852309 NW A 13 00 1/ 00 5 Ar un NS 957 797 FMB 95 3 0 250 12 Harw ood Beck NY 849309 NW A 25 I0 170 12 F6 d Rum NS 788 780 RFS 22 0 0 250 13 ' ID i nghom Beck N7 40823 7 NW A GI 40 170 1 4 ' Uni on ST 172993 FE B 158 0 0 750 14 • Man ion Stet NZ 3231 74 NW A 2 5
0 250 15 ' Woodharn Burn NZ 185263 NW A 29 I0 1800 1 An n W c w MY 792053 RFS 161 () 0 250 18 Tem NY 950 250 NW A 242 10 1800 2 Om un NS 958960 RPI1 181 0 0 750 19 Leven NZ 58508 7 14W A 14 80 180 03 Te m NH 7250 11 RFS 5 18 0 0 25020 Dun ne NZ 291738 NW A 147 00 18005 Al an W at er NS 786980 WS 1 10 0 0 250 7 1 Me m* NZ 3 18285 NW A 70 10 1800 7 Devon NO 0 11018 FE B 69 5 0 25021 118 1d 0 1 NY 93 1182 NW A 20 40 18008 ( en1 NN 58509 6 RFS 190 0 0 25023 l ees NY 9 13288 NW A 58 20 180 10 Port !KS 1 149 53 FEB 39 7 0 0 750 74 Chap8 Beck NZ 599 163 %W A 13 40 180 11 Form NS 775955 M S 1036 0 0 25025 Hunderut ck NY 933 18 1 FBA 8 60 180 12 t u d OC h Bum 514 779008 RPB 48 0 0 25026 Thorn e NZ 04 7151 FBA 4 90 180 13 Dack Devo n NS 9 14924 FMB 6 / 0 0 7502 7 Can B e c k NY 945229 FBA 2 20 180 14 Bannockburn NS 8 12938 RFS 23 7 0 15028 Greater Eggleshop NY 98528 7 P8A 11 70 180 15 l as Ou trha n 914 60 21170 FE B 20 2 0
0 2600 1 West Beck TA 064560 YW A 192 00 190 0 1 Almond NT 165752 RFS 369 0 0 26.00 2 Hun I A 080498 YW A 3 78 I0 19002 Aiw und ST 03 4 652 RFS 43 8 0 26003 Fos:on Beck TA 093548 YW A 5 7 70 190 03 D em!) W ater ST 0 14639 FE B 5 1 8 0 2600 4 Os n ey Rime TA ' 656 75 YW A 253 80 : 900 4 No rm E l k NT 2526 16 FE B 8 1 6 0 26005 Gyosey Ric e I A ' 3 76 77 'FWA 240 00 190 05 Ai n ona ST 086686 RFS 229 0 0 2600 6 Flmsweil li eck TA 009 575 YW A 136 0

148
St • boonum ber
Rivername
Net iob blGodr• t• • oc•
M en uringma non ty
Areasq korb
Sm b onnum ber
H Y D R O L O G I C A L D A T A : 19 8 4
River Nm ilone l M an uri ng A reaim me God • ut hoo ty Mg km )
rebb emce
02 / ()(/ '0 2700 20 7 700 30 2 10 (14
fr idddW a e
A m• Caid•ir
StSESfSt
4285304 224 73534255365220
YW ATW ATW ATW A
484 3758 9
1932 '
818813 87
0 780 5 '0280 570 280 530 760 54
SowPetaSom .
SPSJSi)SP
55 19858832 / 0923 144566985
SI W A5 I WASi vv ASTW A
2: 60
2 0
3332 000
2465070 0
0 2 703 5 NKIJ SC /4 1683 TW A 0 280 55 f ix bu r r. SA 3204 4 7 SI W A0 7 7M160 2 / 00 /
Don()re
SASE
3909 103566 7 1
TW ATWA
3 23 1)9 14 6
0 780 560 28 0 58
RO I N OT Broo klOo trniv e Won t
SKSK
580 12 11118486
STW AS" IN A
24 004
0 2 700 80 7 700902 / 0 10
Sw aleOo ne
' Nob le Beck
SFSISE
4 1574856855462 79%
TWAYW ATW A
/ 34 5 633 ) 5 (1
18 9100 28059806 002006 1
Mo mDot e, Bec•Cho not
SKSKS I
5486236534 79983520
5 - W ASW JASI W A
1362998 008
02 70 1 • W asi t o in SC 2 19488 TW A 8 7 3 02806 6 Core SP • 838 74 S I WA
13
02 70 7 ' l i ntab n W ane 50 9 / 3309 TW A38 1)
0 7806 7 Derwent SK 4383 6 STW A 1177 502 / 0 ' 30 270 40 270 15
t w elo n Br i t• Rye' rbo went
SKSE51
28995 1743 77 11 1455 7
T W A
TW ATW A
16 46 79 0
16 34 3
0280 / 00280 770 280 73
o o Brun th tr ds& FreiA linoP
SKSKSK
759804/ 1154 11718%
STW A5 I W ASI W A
4622
02 / 0 16 I r t io Dori SA 253992 TW A 38 680
SK 492263 SI W A
002' 204
0 270 17 Lud ey SK 286906 TW A 43 5 002280 7254 Dom on / St 16995 ' SI W A I 1 U0 7 70 180 7 70 190 2 70200 2 702 10 7 7027
• rivt,, , ,on? M' B Dean C O
Scout Dike Si matoDon
' Don
SF5/StSESK
0 25 187033 1662360 4 /56934042 797 8
TW ATW ATW AYW ATW A
10 7
5 8111, 71256 2826 0
0 280 7/0 280 790 780 000 280 8 10 280 82
Sonneue I la IMem oTame1 armScar
SKSiSPSPSI'
39534;8 742 9 120 793 70 179585429 13
SI W ASTW ASI W AS •W AS' W A
79896 131
169 0183 9
0 2 / 023 Dr I r l e SI 3500 / 3 TW A 18 90 2 7024 ' Sierare NZ 14600 6 TW A 3 8 1 0 07900 1 Misane Reck TA 75 30 16 A W A 1(18 30 7 70 75 Ro' hor SA 43285 7 TW A 352 1 02900 2 Groat Eau I I 4 114/ 93 AW A 7 1 402 / 02602 702 7
Ito /lepW r' iad e
SASE
394 74411248 1
TIN ATW A 4' 4635 00
02900 3029004
LudAocnp me
I lii f
33 / 8 / 90 329 11
AW AAW A
55 254 7
02 7078 Aire SE 28 340 TW A 69 1 5 029005 Rase I F 0329 2 AW A 69 21)2 / 0 29 6 41:11I I SF 124 2 19 T W A 34 1 9 0 290 09 A - LI ti ma I li 0338 11 AW A 2 7 20 27030 Den Si- 4 17020 TW A 1 10 0 .0 7 70 3 Go no SE 174 / 99 Y W A 24 5 0 0300 0 1 W in am SK 1342480 AW A 29 1 902 / (132 114 b 0 4 11 Ba r k SF 025643 TW A 6 8 0 3000 2 Bar m ik Eau i f 066 / 66 AW A 0 12:9426168710 27033 Sea Cut I A 02/3908 TW A 33 2 0 30 00 3 R u in i F 24 16 11 Am/ A07 7034 t i ro SE 190 860 TW A 5 0 2 03000 4 Pail vm c enn I F 41226 / 6 AW A02 10350 77036
A ro• Or went
SFSt
0 13457/ 89 / / 5
TW AYW A
207 3142 1 0
0 300 050318206
W r a'rS oh
SKI I
97 733 5088485
AW AAW A
46:
0 7 / 0 38 Cciv a llo ck SE 7748 36 TW A 7 8 0 303 " Fl am ' F 246 795 AW A 62 50 2 703 9 • Ho me St ' 120 69 TW A 9 I 0 300 ' 2 S'ai- bo a Beck ' , 17 1 73 9 A W A 3 7 40 7 70 40 Do n 1 ea SK 4 4 3 74 6 TW A 6 7 9 0 300 ' 3 Heny v vn u n 8.8. . , 042696 A W A 2 1 20 2 704 1 Diewont SI 73 158 / YW A 158 110 OMM • 4 P CN' I o n I ti t . T r 120 3 13 A W A0 2 704 2 Do ne SE 705 855 TW A 5 1 8 003303 0017 5 Cz t tb oc li SK 92529 / AW A0 2 / 0 4 3 MW , . SI 09 2 4 94 TW A 47 7 0 SK 9 79746 AW A0 2 70.440 7 704 7
SMOd c m Boo timS renoinvo fl ee.
SESD
/ 254 75833883
TW ATW A
46 0' 0 2 03 00 1 Eye lb oo • SP 85394 1 CUWC
0 2 70480 7.704 9
U•irva veRi o
StSF
990 853696 79 1
TW Av WA
"2 / 0227 0
03 18)20 3 009
CannW e lona
I I
I f' 0 6 4 9
0950 78A W A
AW A07 / 0 50 Ed' St 86508 1 v u/ A 108 0 03 310 5 W ean % 5 4 9 70 99 7 A W A
4348 855: 71} 093591
02 705 1 mCr ob SI 284 5 19 TW A 8 1 03 1006 Gwasn I I 0 38 0 9 7 AW A
1/ 5111) 04
02 )0 57 W M / ing SA 3 76747 TW A 50 1 0 3 100 7 SP 948999 A•NA31336802 )0 53 N d d SE 2306 0 3 TW A 2 1/ 6 03 100 8 t am Gion I P 068 100 AW A
Web e r!23
07 7054 0n ot o Be a SC 65790 2 TW A 3 7 I 0 3 100 9 West 6 6 - i f 0 74 113 AW A 1/ 3 002 105 5 Rye St 560883 TW A 131 1 03 10 10 O w e/ SK 96 1030 AW A 6 8 90 7 70 56 Poi eo no Bec k SE 79 )8 19 TW A 6 8 6 0 3 10 1 1 W ev O ne Se 9 8 72 6 ' AW A 3 1 50 2 70 5 I Soy . - St 73 68 2 1 TW A 17 1 6 0 3 10 12 T1w n T F 0 6 179 AW A 24 90 27058 11•L ca l SE 66 18 10 TW A 5 ) 6 0 3 10 13 t am 6 en 3 - 0382 / 3 AW A 7 1 50 2 / 0590 2 70 60
l averK y e
SFSt
31117 11)509602
TW AYW A
8 7 516 / 6
0 3 10 403 10 ' 5
ui pe BG st b o n.C hM . ,
' 's K 209044690337 A44Wv AA 2 1 0
0 7 706 1 Cc h e SE 136 16 1 TW A 72 3 0 3 10 6 No d; II4 049t SK 95 / 089 AW A .108i 550 2 / 06 2 K00 :I s I 48256 1 TW A 5 15 0 0 3 10 ' 7 S' on •co Riona SP 7599 18 AW A 4 2 70 2 70 6 3 O bi) SE 0 57639 TW A 25 5 0 3 10 ' 8 Lany in n ti on • SP 755908 AW A 55 I0 7 706 4 W or i SI' 55 1163 yvv A 83 7 0 3 0 9 Meebutane !boo& SP 7989 39 AW A 2 1 90 2 706 5 eo rim St i 4 2 15 1 TW A 9 7 4 0 3 ' 0 23 M orco t t M N * S 9931990 AAW404A ' 9 60 7 7 60607 106 1
0602 7 8
Pl ack oia n 13440 ,S.-loa fPybub
SAti tSE
39 39 1415 786 30 35 188
TW ATW AYW A
4 2 849 I33 0
03 ' 02 103 07203 023
W u landJo ' conW ost G em
91,(,
SXSP
9 1185
740 86 7965258
A W A
AW A
722; 4402) i
1)2 706 9 W o ke SE 3 75/344 T W A 7 15 5 03 074 Il a 6 V/ II II 94 0 6 1t I P 0 26 148 AW A02 / 0 / I0 270 72
S W 4 In
Mirui t ;StSE
425 / 340 6440 8
TW ATW A
' 3673 (71 03 102b03 1026
O w a s h Sour Armt rib ton groa t
SKSK
8 750 5 18 780 / 3
AW AAW A
24 52 5
11:e 70 73 10 0 —p i ne (Inn Si 9 36 79 4 v W A 17 9 03 10 77 Bor e F4 V i f 10 7 199 AW A 10 602 / 0 / 4 St e n kleo t SE 2252 10 TW A 46 3 03 1028 (M ath SK 95 10 87 AW A 76 5
0 2 8 0 0 ' 0 d9 w On t S 4, 1110191899: 5 1 Sss 1 2 6 0 03200 1 Ver o i t 16 6 9 77 A W A 16 34 30 28 0 0 20 78 0 0 3
BI I 'v ru l 9„ 2, . rIi. WN AAAW
16 3 040 8 0
0 3 200 20 3 20 0 3
W lo w li roo4I . . ' De , ll ' oo k
I LSP
0 6 79 3 39 8 3 79 9
A W AA W A
8 9 674 3
0 2 80 0 4 1 arne SP 20 69 35 S' W A 79 5 0 0 3 20 0 4 Ise Snoo k SP 8 98 7 15 A W A 194 110 78 0 0 5 I v o @ SK 173 i 05 S ' W A 1475 0 03 2006 None/ K slinglavor SP 72 • 592 A yea 223 00 2800 6 I ron/ SJ 994 23 1 SI W A 325 0 0 3200 7 ferno i li mronto - SP 7476 17 AW A 237 50 2803 7 1 14 0 1 SK 448799 S1W A 4400 0 0 3700 8 haene/ Kisl n5l4n SD 62 760 7 AW A 10 7 00 2800 8 D o n . SK 11239 7 S/ W A 399 0 0 32009 W . low Brook SP 98 196 7 I :DW I: 6 7 70 28009 I rent SK 6 70399 SI W A 7485 0 0 320 ' 2 W oo tton Bruck SP / 36 5 / 1 AW A 53 30 780 10 Dent on/ SK 35636 3 S TW A 10 54 0 0 320 ' b W dow ak Conv a SP 898892 AW A0 280 11 Demmer SK 796586 STIN A 690 0 0 370 16 W illow Broo . Stn SP 90 1886 AW A 1 6
7 0 17 SK 13 11 / 7 SI W A 1229 0 0320 18 l im SP 86 183 1 AW A 62 40 280 14 ' Sow SJ 9 752 15 SI W A 59 1 0 0320 19 Sl ob Worm SP 0 / 3 / 63 AW A 56 30 280 15 ki k: SA 690895 SI W A 529 0 032020 W oir ins N ook I L 08 999 5 AW A 46 90 2130 ' 6 /l o o n SK 6 4 189 7 Si vv A 2 3 1 0 0 320 23 Gi endor tk ook SP 883633 AW A 4 7 50280 • 7 Dint . SA 2131486 SI W A 284 0 0 3 70 24 Seni then a Bi en I L 0 25 9 2 1 AW A 20 50 2 80 8 Dove SA 235288 SI W A 88 3 2 0 320 25 Nur o/ W ` r ron SP 670658 AW A 63 40280 19 I ' ont SK 739 704 IOW A 30 77 0 0370 76 Sec e/ Brairw roo SI' / 36 / 0 1 AW A 58 00 780 70 Croo ni t SK 10 3389 SI W A 236 0 03202 / N i no Brook i ( 1 794 9 AW A 29 30280 2 ' • Dorwenr SK 443327 SI W A 1175 0 0 32029 SP 66 06 10 AW A 7 00 280 22 ' rent SK 80 160 1 SI W A 873 1 0 0320 30 Cobra/ NI r Stream SP 669 7 14 AW A 6 50 280 73 ' W m: SA 182696 S' W A 154 0 0 320 3 ' W oc/ ton Hroo• SP 776 5 / 7 AW A 73 90 28 0 2 4 W in k.) Se 6 15 124 S' W A 4 13 8 0 280 25 Sono. SP 32 1996 STW A 169 4 0 3300 1 • ll onl ord Ouse " t 369 727 AvvA 3020 00 78026 A n t e. SK 263034 S I W A 368 0 0 3300 2 BecIord Ouse a 05 5495 AW A 1460 00 2802 / Lowm an SK 482364 STIN A 180 7 0 3300 3 Com I L 50865 7 AW A 803 00 780 78 So ar SK 603 109 STIN A 480 0 03300 4 i am I I 648 760 AW A 400 70 280 29 K ngs too B•ook SK 5032 77 5 TW A 5 1 0 033035 li ec' uNI On e SP 736 353 AW A 388 b0 280 30 8 l a B ook SK 466 1/ 1 SI W A 8 4 0 330 36 W in try I I 77 1965 AW A 7 74 50 71903 1 Irlani uki SI( 14050 7 SI VJ A / 48 5 03300 / Nur la 723 1•9 AW A 153 30 7130 32 Modon S K 558680 SI W A 67 8 033008 ' Lot e Ouse I L 860 832 AW A 699 00280 33 Dune SK 06 36613 SI W A 8 0 033009 B ed iol d Dom SP 95 1565 AW A 1320 00280 34 Med i SK 68 1 728 SI W A 16 1 0 0330 11 I it Pe I kno• I L 89280 1 AW A 128 10 2 80 3 50 280 360780 38
LeenPok lte iMani fold
SKSKSK
599 392/ 75200106 595
ST W ASI W ASI W A
I I 0128 246 0
0330 120330 130 3 3 0 14
K Y ,Snip stonLa b
T LT II L
19586 8739 :8758 730
AAW AAWAW A
137 510 5 92 72 0
0280 39 Rea SP 0 7 1847 SI W A 74 0 0 330 15 Ootel SP 88240 8 AW A 2 77 I0 780 40 SJ 89746 / SI W A 5 3 1 0 3 30 16 Carr i L 4 50 5 9 3 A W A 76 1 502804 1 Flamm SK 082502 STW A 39 6 0 330 18 l ona SP 7 ' 4488 AW A 138 10 2804 2 • CKumet Si 9 795 20 SI W A 136 0 0330 19 " net 11 880830 AW A 3 16 00 7809 3 Ch i Ft sc r4 SK 26 1583 S: W A 335 0 0 330 20 Akb o bury Wool, i i 708 7 17 AvvA 20 1 50 28044 Pod rer SK 563 7 4 S" W A 65 0 0 3307 1 Ibley I L 4 15523 AW A 30 3 00 2804 5 M oder SK 68 1737 S•W A 10 5 2 (1330 22 lyel 11. 153 509 AW A 59 1 30 281)46 Dove SK ' 46509 5" W A 8 3 0 0 33023 Lea b ook 7, 667 733 AW A 10 1 80 2804 / OhrIcnateit Di n SK 6 158 76 STW A 85 2 0 330 24 Carn I L 466 506 AW A 194 00 7804 8 Amber SA 3 705 70 S I W A 139 0 0 33025 • klon noly I F 696 256 AW A 39 60 2804 9 Ry/on SK 5 75 / 94 STIN A 7/ 0 0 33026 Bee'ord Ouse I L 2 16669 AW A 25 / 0 00 700 50 l oom 34 6460 12 SI W A 191 0 113 30 2 7 Rnse I L 3334 85 AW A

C O N C I S E R E G I S T E R O F G A U G I N G S T A T I O N S 149
Su tto n Rive r Hy m nal M easur ing An a G abo n River N. ti oes. I M easu rin g A re snum ber name Gnd 40th aterry km ) nev em nam e G e l au tho my knD
ref eren ce ref or *m e
0 330 28 FM i t 14 339 3 AW A 119 6 03130 11 Morga n I T 225 169 TW A 98 .10 330 29 Suemsc le I F 7 160 36 AW A 9 3 5 0 380 12 Surr eoem Ra c k i l 2742 11 TW A 36 003 303 1 Broughton Bruck SP 88940 8 AW A 66 6 0380 13 Upper l ee
am okI T 118 185 TW A / 0 7
0 330 32 Meacham I F 6853 75 AW A 89 3 TO 343 9 37 TW A 20 50 380 14 Salome)03130 15 ' Interceraung dr0 330 33 Ha I l 190 3 79 AW • 108 0 10 3559 32 TW A 7.4
0 330 34 Late Om. i l 85 1144 AW A 699 3 0 380 16 Surnamed Sm o gs i l 500 24 6 TW A0 330 35 f ly Orme I F 5880 10 AW A 34 30 0 0380 17 Marea rn I T 184 2 12 TW A 39 .203303 / tledl ord Ouse SP 8 77443 AW A BODO 0 380 18 UP PM l ee TI 2910 99 TW A 150 00 330 39 Redl two Ouse 11 1605 35 AW • 1660 0 0380 19 ' Seema n Broca 10 3549 32 TW A 33 9033040 Mem T1 26 740 1 AW A 10 0 3130 70 Contwm Brook TO 387999 TW A 38 A0 3304 4 That G. 9 57855 AW A 2 7 1 8 0330 1 1 Turkey Brook TO 359985 TW A 42 203304 5 W ade TM 0 7 7878 AW A 29 3 0 380 77 Pyrnerms Beno it TO 3409 75 TW A 4 2 60 3304 6 Thal f t 99 6913 AW A 145 3 0 380 13 l ee M o d rebel TO 3561380 TW A 1243 003304 9 • Stanfo u1 W ater Tt 0349 53 AW A 4 3 5 0380 74 Smell Or an I ea TO 3 709 88 TW A 4 1 50 33050 Sna rl TT 63 170 3 AW A 60 6 0 380 15 • Pyrer nea Brook TO 340925 TW A 4 1 40330 ' 1 Cam i l 501420 AW A 14 10 0380 26 Por gy BICO Ir I t 495 126 TW A 54 60 3305 7 Swarths. . l ode Tr. 553628 AW A 36 4 0 380 18 Stanahro Broo k TT 506 24 1 TW A 25 9033054 Bahemlay I F 680 252 AW A 4 7 7 038029 Gun I t 392248 TW A 50 40 330 55 Gom m TT 5 10 504 AW A 98 7 0 380 30 Beare TT 325 13 1 TW A T75 I0 330 56 Guy W ater I I 53 162 7 AW A 76 4 038 13 1 Flye Meads not tall TW A0 3305 7 Ourel SP 9 1724 1 AW A 119 003 305 9 Ouzel SP 883322 AW A 7 15 0 0390 0 1 T SA M e S TO 177698 TW A 9948 00 330 59 Cu: off Cha nner TT 719 757 AW A 0 3990 2 Thames
Su 576685970355 T WCA3444 /
0 33000 Kam a Gay 71 708 9 73 AW A 039CO3 W anal le r () GA 176 10 330 52 Gord en & m ar I L 4034 5 / AW A 0 390 04 W andk) I 0 2966 55 GLC 22 0033063 1 o le Orwo TT 95580 7 AW A 10 1 0 039005 Beverley Brook TO 2 167 17 GLC 4 3 60 3306 4 W ha Odo n B ro o k I L 3594 66 AW A 26 0 03900 6 W ake n s/1 SP 4020 19 TW A 362 6033065 H 7 TT 185790 AW A 6 8 0 3990 7 13Mckw ater SU 73 164 8 TW A 354 8033136 6 ( ll ama I L 5 70404 AW A 59 8 03900 8 Thames SP 4450 8 7 TW A 1616 20 330 6 7 New Owe, TT 608696 Av / A 19 6 0 390 09 Thames SU 909 79 7 TW A 69 15 303306 8 Chen ey Water i t 2964 11 AW A 5 0 0390 10 Co ins TO 057864 TW A 743 0
0 390 11 Inni T Su 8 74 4 3 3 TW A 396 303403 1 Tr . T 0 18208 7 AW A 73 1 8 0390 12 Ho estna TO 182688 TW A 69 10 340 37 T. T M 2 2 6 9 9 4 A W A 46 5 0390 13 Corm TO 11) 9 82 TW A 352 203400 3 kla n I I I 192296 AW A 164 7 0390 14 Vet i t 1510 16 TW A 137 00 340 34 W erew n TG 177 128 AW A 536 1 0390 15 W hi ew aler SU 73152 3 TW A 44 5034035 l un 10 170 113 AW A 73 7 0390 16 Kennet SU 8 TW A 1033 4034006 W an ner Ti n 2298 11 AW A 3 70 0 0390 1/
se : 4809770 1 I H18 6
03400 7 Dove I M 174 772 AW A 133 9 0390 18 • Oc. SU 48696 9 TW A 734 I0 34008 An t TG 33 1270 AW A 49 3 0390 19 LI M OW n SU 4 7018 2 TW A 234 10340 10 W nee . , y I M 108 787 AW A 149 4 039020 Coin SP 122062 TW A 106 70340 1i TF 9 19294 AW A 12 / 1 03901 1 Che r w e l
0390 77 ISP 482 183 I W A 55 1 7
0 340 12 Fk rn I I 8474280 340 13 W arteney TM 364 9 17
AW AA W A
80 06 70 0
SU 7706 57SU 89686 7
TW AI W A
164 513/ 3
w orm039013 W yr
0340 14 W om un TO 020 184 AW A 363 0 039024 • Gehnc k Shear- TO 28840 2 TW A 3 1 10340 18 Shrlkey TF 9444 14 A W A 7 7 1 039025 t ntroun e SU 568648 I W A 147 60340 19 0 .ao TO 20 71941 AW A 3 13 0 039026 C he rw e l ST 4584 ' T TW A 99 4
03901 / Pang SU 634 166 I W A 1/ 0 903500 1 Cyp e ml TM 15444 1 AW A 3 10 8 019028 Gm SU 37 168 5 TIN A 10 1 303500 2 Ort on TM 321534 AW A 163 1 039019 I adrp or ma TO 000 4 78 I W A 59 003500 3 Ad e I M 3000 0 1 AW A 07 9 039030 Game TO 0879 57 TW A 184 00 35004 Ore Thr 359583 AW A 54 9 03903 Lamtyh an SU 4 1' / 3 1 I W A 1/ 6 00 350 08 Co n 41 TM 05 9578 AW A 178 9 039037 t ant e/ran 59.1 390 745 T W A 154 0035009 • Gy m TM 425 765 AW A 96 4 039033 W r tor trow ne St SU 4536 94 I WA 49 20 350 10 ODOM TV 127465 AW A 298 0 039034 Fyen Od e SP 44809 9 Tyv A 430 00 350 11 Ba rth:ad Bro o k TV. 143420 AW A 40 4 039035 Churn SU 0 76963 I WA 124 30 350 3 8 yth TM 40 6 769 AW A 92 0 039036 l aw G ook TO 04 5468 TW A 16 0
03903 7 Ken- et SU 18 / 686 I W A 141 003600 1 Stow TV 04 7340 FW C 844 3 039038 Than e SP 6 790 55 Trom 44 3 0036002 I t. 13464 71 AW A 8 / 3 0 39 0 4 0 T M i m s SU 094942 TWA 195 (10360 03 Fro r i t 985378 AvvA 53 9 03904 2 l e a c h SV 22799 4 TW A 76 90360()4 Chad Brock I L 858459 AW A 4 / 4 039043 !t enant SU 795 7 10 TW A 29 5 110 3600 5 G etz TM 0 25419 AW A 156 0 0 390 44 mar SU 75559 3 TW A 84 001600 6 Stow I M 0 70344 AW A 5 78 0 0390 46 Than e. SU 5 16946 TW A 34 )4 003600 7 Beicherr y S UJO k TT 84842 1 AW A 58 6 0 39049 S R Sr eam TO 2 17895 G. 0 29 00360 08 Stow 11 87 7463 AW A 274 5 0 390 5 1 So , G oo. SP 4 75346 TW A 06 4036009 bum I L 9 14515 AW A 25 7 0 390 52 I he Cut SU 853 7 13 I W A 50 20360 10 Bun os teao N ook i t. 6894 8 AW A 28 3 0 390 53 M ule TO 2 71434 TW A 89 90360 11 Srou. G ook I L 69644 1 AW A 34 5 0 390 54 Mo le I I ) 260 399 I WA 3 1 80 360 12 G ov ' i t. 708 450 AW A 76 2 0 390 55 Year:my th Weat TO 08 3846 G.0 175 70 360 13 SI IM I M 0 32354 AW A 95 0 0 390 56 Fi r ve- show ne TO 3 77732 GI C 6 7 60360 15 Stow TT 89 7358 AW A 480 7 0 390 5 7 G am TO 1037 78 Gt.0 6 )6 50360 16 • Ram sey TM 706 798 AvvA 13 9 0 390 58 Pooi TO 3 71775 GI C 38 30360 17 t ly Orm e a u rae I L 68 1559 AW A 039068 PAD a 10 1/ 95412 I W A 3 )6 0
0 3906 9 Mo e TO 262462 TW A 42 00 3 730 1 Gra nd 10 4 : 5884 TW A 303 3 0 390 7 1 Tha n e% St. 00 79 73 I W A 63 70 3 700 2 G n awer G. 794090 AW A 53) 9 0 390 72 I hy mn SU 982773 TW A 7046 00 3 700 3 T er TI 796 107 A W A 77 8 0 390 73 Om - SP 0200 28 TW A 84 00 3790 4 • ekk kw ahr I L 8360 92 A W A 33 7 0 0390 74 An oney li roo r SU 10 5950 TW A 74 40 3700 5 Colne T I 96 776 1 A W A 238 2 0 390 75 Marston Siem er Il k Stl 128954 TW A 75 00 3 700 6 Can I T 690 0 77 AW A 228 4 0390 76 W ukar - an SP 199 10 / TW A 296 00 3703 7 Wu: TT 686060 AW A 36 3 0390 77 Ott SU 19496 7 TW A 59 20 3700 8 Cha rna• I T / 130 7 1 AW A 190 3 0390 78 W eylnoc hl SU 8 384 62 TW A 1)8 40 37031 Bra n TT. 8 18 4 7 AwrA 60 / 03908 1 0, k
47 86 6 970663STun W A234 0
0 370 10 81an wat or Tt 945 159 AW A 74 7 3 039085 W and le (T; I C 176 10 370 11 C h ei n e f TT 629133 AW A 72 6 03908 6 Gatwu k Stream TO 2854 17 TW A 33 60 370 12 Co ne TI 77 1354 AW A 65 1 0 390 8 7 FM , SJ 1719 35 TW A 8 4 I0 3 7013 Sando n Brook I L 755055 AW A 60 6 03908 8 Chess 10 06694 7 I W A 10 5 00 370 14 Ro d r- y T I 56 1040 TW A 95 1 0 390 89 Di ce TT 0530 77 TW A 48 203 7015 Cr pray S I OOk T I 5413035 TW A 61 2 03909 ' M O/ M u r i a SJ 9 75963 I W A 170 00 370 16 P a n t TI 6683 13 AW A 62 5 0 390 9 7 Themes SU 2309 8 1 TW A0 3 70 1 7 I:Backw ater I T 793243 AW A 139 703 70 18 m o roourne TO 553861 TW A 4 / 9 0400 3 1 Mec way TO 40 7353 SW A 26 90 370 :9 Beam TO 5 15853 TW A 49 7 0400 37 Da rr ell TO 77 2 7 3 SW A 9 603 7070 Cha rm er T. 6 70 193 AW A 132 1 04000 3 Mec emy I 0 708530 SW A 1256 10 3702 1 Roman TT 98520 5 AW A 52 6 09 0 0 34 130 ,he TO 773245 SIN A 206 00 3707 7 Ha rla nd 8 9) 0 k M e 1792 17 AW A 54 9 0401E 5 Saul t TO 7584 / 8 SW A 1 77 103 / 023 Rudd y TO 44 19550 37024 Colne i t 855298
I WAAW A
269 0154 2
C4 CO36 Burn ie134000 7 W awa),
27449 70 730 653, 05 S a v‘p ii A45 50 3755 1
0 3707 5 Bonn e fk ock I L 8272 76 AW A 32 1 040008 G ear Stour I R 0494 / 0 SW A 130 (103 / 016 I Ce ll er ' l l y G ook TM 0 / 920 7 AW A 29 0 0 40009 To se TO 7 18399 SW A 13 6 20 3702 7 S sp e m y B ro o k TM 0 542 4 AW A 5 I 0 400 10 Fries TO 5204 3 7 SW A 274 30 37078 13entruy Bra m I M 109 193 AvvA 17 1 0490 11 Gn a t Stour I R 116554 SW A 34 5 003 7019 St Osyth (k ook TM 134 159 AW A 8 0 0 400 17 Dau n t TO 55 17 18 TW A 19 1 403 7030 Hollare G oor TM 1712 7 AW A 4 9 6 0 400 • 3 Da nnt TO 525584 TW A 90 50 37033 Can to/ 00 6 & OM TO 85988803 / 034 M4myke TO 596 806
AW AAW A
10 490 7
0403 14 W . .,1-4en
Nyme Dr .
74 2 765 76TR 0 5560 6
SW AmrS A
3 7 73 1 8
03 7036 ( y Ok i * Outfall Tt 64635 1 AW A (0 414° 300 50 CWra TO 5 11740 I WA 1 9 703 703 7 l oPper fe to S I CIP It TT 6 / 53 / 7 AW A 0403 • 7 Oudwe ll TO 6 79140 SW A 2 7 503 7038 W et TT 6 7200 3 AW A 98 6 0 490 8 Da ent TO 530 643 TW A 118 203 7039 Illar kw ater Tt 83509 3 AW A 33 7 0 04 00 70 f hog. Sr eam 10 52736 7 SW A 53 7
0 490 1 1 Her der Channel TO 8 13290 SW A 32 403800 1 l ee Tt 3900 92 I W A 10) 6 0 040 322 Gr eat G r a TO 9 73473 SW A 77 50 3890 2 Ar h I L 393 148 TW A 78 7 040 073 F a st Stour 14 0 1540 7 AW A 58 80380 13 TT 182 33 TW A 133 9 0400 14 Bartley MJ St ' 0 63335 7 SW A 25 I03800 4 91, i t 360 74 I W A 136 50 3800 5 Am TT 380 • 38 TW A 85 7 04 100 1 N t.r ni ncr a m Stryam : 0 662 129 SW A 16 90380 06 Is O T I 335 58 TW A 46 ) 09 1002 Ash Bo u m TO 684 14 1 SW A 8 40380 0 7 Canon G ook I L 43 1' 04 I W A 2 1 4 04 1003 Cacr mere TO 5330 5 1 SW A ' 34 /

150
St at ion 119 ernum ber nam e
Nat ion&Gr i dref eren c•
M easuri ngma bontY
Ares
H Y D R O L O G IC A L D A T A : 1984
Stat ion R OW Hat dinal M easu ring • rsan u rn b a r 91111. 1111 On d bu thord y HO 10 0
f f f f f f
04 100 4 O ti s. 10 433 148 SWA 395 7 0 500 11 Tra ndp4 SS 500 1E15 SWW A 063 00 4 10 0 5 Ou se 10 4292 14 SWA (80 9 0 500 33 ' l aw SX 6349 38 SWW A 15 604 ' 60 6 Uc TO 059 190 SWA 8 7 8 0 500 34 • 9 0 14 W r en SS 705 3 73 SW W A 5 4
Rot e. 10 0 34 78 SWA 345 804 • 0 10 Adur W IPanch 10 1/ 8 197 SW A 10 9 1 0 5 100 1 Do ndurd Stream ST 0884 28 W W A 75 804 10 11 Rotho• SU 852229 SWA • 54 0 115 100 7 • k orner W aror SS 8984513 W W A 20 804 10 7 Ads , f Branch TO 2 19 190 SW A 93 304 10 3 14.9 1en s Stream •0 6 7 1138 SW A 14 2 05200 1 • Ar e ST 52 745 8 W W A • 8 204 10 14 40 04 7229 SW A 3 19 0 05 700 2 • Yon ST 556 116 W W A 30 304 10 15 km , SU 7550 74 SW A 58 3 0120 03 Rabe W ater SI 20 625 3 W W A 8 7 804 1(116 Cuckr e e 10 6 11150 SW A 18 7 0 52004 Isie ST 36 188 W W A 90 104 10 17 Curn ut h ave n TO 765 10 2 SWA 30 5 0 5710 5 Tone ST 706750 W W A 20 7 00 4 10 18 Kird TO 0 44 256 SWA 66 8 0 52606 Yen SI 5 73 62 W W A 2 13 104 11)19 Arun 10 11733 1 SWA 139 0 0 520 3 7 Pprreil ST 46 1 44 W W A 74 80 4 1020 Severn Sn ean TO 423 161 SWA 34 6 0 5700 8 ' Tone ST 04 43 13 W W A 18 10 4 • 0 7 1 (340 9 11St•erkm TO 408 153 SWA 7 1 0 520 89 Sheppey SI 4984 39 W W A 59 6(14 0 22 LW SU 93 1721 SWA 52 0 0 520 10 Bruo ST 590 3 8 W W 4 135 20 4 102 3 Lavi n, SU 8 7 1064 SWA 8 1 2 0670 1' Carr ST 49879 1 W W 4 82 404 1024 S10 1 B ro c k TO 335286 SW A 22 6 0 520 14 li v e SI 0 7820 2 W W 4 5 1 204 102 5 Lo r woo) eam 10 000 309 SW A 9 1 6 0520 15 • Lanal Yeu ST 4837 16 WW A 23 304 10 76 Coeldse se Brook TO 376262 SWA 36 1 0570 16 C u rr y 50 0 1 S 1•0 9 , ST 17 1382 W W A 15 /04 10 2 1 Pother SU 772 7 70 SW A 3 7 2 0520 17 • C Or p ro s l oi ry Yin SI 45263 ' W W A 66 604 10 28 CheSS S t re am TO 2 1/ 173 SW A 24 0 05 2020 • Calks., Sr earn S 57 100 W W A 16 404 10 79 80 TO 5 75 13 1 SW A 40 8
05 300 1 ' Av on S I 90 364 1 W W A 66 5 604 200 1 W alIn gion SU 58 / 0 75 SW A 111 0 0 5300 2 Ser ur gi on 130 0 ST 90 7605 W W A 157 704200 7 It chen SU 46 72 13 SWA 0 530 03 • Avon ST 753645 W W A 1595 1)04 2003 Lym n ip c n SU 3 910 19 SWA 98 9 0 5300-4 Cnow SI 64864 / W W A 129 50 47004 Tosr SU 354 188 SWA 104 0 0 0 530 35 M erord Broc k ST 7636 11 W W A 147 4
04 200 5 W al op 13. 0 0 k S U 3 1 3 3 0 SWA 53 6 0 5300 6 I rc rne:Br woo ST 63 / 772 W Oi rk 146 904 2006 Mets, 11.1 589 14 1 SWA 72 8 0 530 0 7 Fron olSo n eese t/ SI 801 564 W W A 26 1 60 4700 7 A irs SU 5 74326 SWA 5 7 0 0 50 0 8 A v On ST 966832 W 14/ 4 303 00 4700 8 Che o nn Stream SU 5 74323 SW A 75 1 0 530 09 W el ow l:500s SI 74 158 1 WIN A / 2 60 4200 9 Ca 'dov er Brook SU 568373 SWA 7 1 7 05 30 13 M a ro ur S I 955729 W W A 99 20 470 10 1111en0470 " Hant s.
SU 46 72 13SU 523 149
SWASW A
360 056 6
0530 14 • Spr ing Finn ,0530 15 • S P9 1. 9 Hon
ST 655464SI 90 2524
W W AW W A
04 20 2 Ao un SU 3 79393 SWA 85 0 0530 16 • Spo ng F-Ow ST 80 3399 W W A04 70 13 Test SU 355 189 SW A ' 040 0 0530 11 Boyd S" 08 098 W W /1 48 1)04 20 14 Bia- kw ater SU 378 174 SW A 104 7 05 30 18 Av on 5 1 7866 7 1 W W A ' 552 004 20 16 Ii r hon SU 5 12325 SW A 236 3 0530 • 9 W ood bridge & oink ST 949866 W W A 46 604 70 19 ' • wrers Brook St) 388 133 16 0 053020 Gaun i Broo k SI 93 0 40 W W A 28 204 20 2 1 Bj a nt,h n l I es SU 355 159 SW A 1050 0 053077 Avon ST 7386 5 1 W W A 1605 0
0 530 23 Sherston Av on SI 89 18 70 W W A 89 704390 1 ' Avon SO 1420 54 W W A 164 9 8 0 530 74 Tow ury Avo n ST 9 1489 3 W W A 73 60 43033 Avon SU 158 144 WW A 147/ 8 0 530 75 M on ST 75749 1 W W A 119 0
' 0 43034 Bo ..00 SU 15730 4 WW 1& 163 6 0 530 26 1 run e:Er r ut SY 66 782 2 W W A 18 5043005 Avon SU 15 14 13 WW A 323 1 0 510 78 Ry run°. ST 8 ' 5688 W W A 0 2 00 43130 6 gad der SU 0 98308 WW 4 220 60 4300 1 Sim ) ST 1139511 VIW A 10 73 0 0 540 0 1 Severn SO 782762 S" W A 4325 00 43008 W y ve Su 0 86 343 WW A 4 4 5 4 0540 112 Avon SI' 0404 38 S *W A 22 10 00 4300 9 Sto .$ ST 820 4 7 WW 4 571 • 05400 3 v ytnw r 5..1 0 19 191 5, 1N W A 94 30 430 0 Anon SU 036081 WW A 94 0 054004 Sow . SP 33773 1 STW A 762 00 430 1 • 19-19 • SU 167763 INW A 100 0 05400 5 Sor eni 53 4 12104 STW A 2025 004 30 2 W yb e SI 90 94 28 w vvn 112 4 054(836 S TOW 5 0 879 708 STW A 374 004 30 13 N ude S7 184936 W W A 17 4 05400 7 Arrow SP 086536 SI W A 3 19 004 30 14 East Avon SU ' 33559 W W A 86 2 0540 08 • erne SO 59 768 6 STW A 1 3 4 4
04 30 15 W ylve ST 8684 13 W W A 69 0 0540 0 Sun: SP 20850 7 SI W A 3 16 004 30 1/ W est Avo n St/ ' 33559 W W A 16 0 0 540 ' 1 Sa warp* SC 8686 18 STW A 184 004 30 18 A l en SU 00 800 7 WW A 76 5 0 540 12 SJ 592 123 SI W A 852 1)04 30 19 SI-0 er W ats: S I 80 17 / 8 W W A 29 1 0 5 4 0 13 ' Clywedo9 SN 944855 STW A 5 7 004 302 1 Avon 5 2 155943 WW A 1706 0 0 140 14 Sover n 50 164958 SI W A 580 1)
0 540 15 Row Broo k SO 92 746 3 STW A 156 00 4400 1 From e SY 86686 7 WW A 4 14 4 0 540 16 Ronan 54 5139 141 STW A 759 00 4400 2 P .9 (1141 SY 9 13876 WW A 183 ' 0 540 17 Leadue SO 777234 SYW A 293 00 4400 3 • Ast er SY 4 / 09 28 11/W A 49 1 0540 18 Rea arcink SJ 4660 97 STW A ' 78 00 440 04 f rom o 5S' 708903 Wv 0 4 206 0 0540 19 Avon SP 333 715 S 1WA 34 7 00 44006 Sy) W w w SY 63799 / WW A 17 4 054070 Pe-ry 5.1 434 192 STW A 80 804 400 8 Sni W nizedrourr e SY 62989 7 WW A 19 9 0540 22 Severn SN 8538 72 1. 1 8 704 400 9 W ey SY 806839 W W A 7 0 0540 73 Bath er, B•ook SP 06 3409 STW A 95 8
0540 24 W eid e SI) 74795 3 STW A 258 004 500 ' C•e SS 9360 16 SWW A 600 9 0540 25 Dub s SIS 950820 SI W A 52 7U4 540 2 SS 943 118 SWW A 47 1 1 0540 75 0 10 11 SO 892764 STW A 34 504 500 3 CLIm ST 0 2 10 58 SWW A 226 1 05402 / Prom. SC 83 104 7 SI W A 198 004 50 04 A re SY 782953 SWW A 768 5 054078 Vwnw y 5.1 252 19 5 STW A 778 004 5035 On er SY 08 788 5 SWW A 20 2 5 014029 Tema SO 73555 7 SI W A 1480 0a soas SS 9 19356 SW W A 70 4 0 540 32 Ser er" SO 86 3390 STW A 6850 004 59 / 8 Otun SY 1 59E16 SW W A 104 2 0 540 34 Dow ns 130 0 SO 768 754 STW A 40 80 4560 9 Ere SS 935260 SWW A 159 7 0 540 36 Is bO a ne S P 0 2340 8 Sf W A 90 7
0 540 38 T I N T SJ 757275 S" W A 229 004600 1 South I n un SX 6 7 844 SWW 4 9 9 0 54040 W en SJ 66020 5 S ' W A ' 6 7 510 060 0 2 Tesi r s x 856 746 svvvv A 350 0 05404 1 Te-n SJ 649 230 STW A 192 004 6003 Darr S x 75 1659 SWW A 24 7 6 05404 2 • Chrw edog SN 9 1486 1 IO W A 49 00 4600 4 Av on SX 68065 1 SWW A 17 0 05404 3 • Seven, SO 863399 SI W A 6990 1)04 600 5 ( • 0 Dart S X 65 ) 775 SWW A 2 1 5 05404 4 I ern SJ 6793 16 STW A 92 604 60( 36 t i m. S X 647537 SWW A 23 5 05404 5 ' P e rr y SJ 34 / 303 S I W A 49 104 600 7 • W est Dan SX 643 / 42 Svo N A 4 1 9 05404 6 W ort * SJ 78 104 6 STW A 54 90400 08 ' Avon S x 7 194 76 SWW A 10 2 3 05404 1 Puu y SJ 403223 S I W A 155 0
054048 Den t SP 2 735 56 STW A 102 004 ) (Ni l Tamar S X 4 26 725 SWW A 9 16 9 054049 SP 30 / 654 STW A 362 004 700 2 l ama, S X 343886 SW W A 137 1 0540 5 1 Cry wedno SN 9 486 7 SI W A 49 004 700 3 Taw, S X 4 746 50 SWW A 205 9 014053 C OP / a SO 5 10757 STW A 164 004 700 4 Lynhinr S X 361367 4 SWW A 135 5 0 54054 On ^y SO 455789 STW A 235 004 7130 5 ' Ov ery SX 336866 SWW A 120 7 0 540 55 Rea SO 664 774 S•HN A ' 29 004 760 6 • Lyd SX 388842 S W 1N A 2 18 I 0 54056 0 0 SO 393 786 S ' W A ' 95 004 700 7 v igo r, SX 5 745 11 SWW A 54 9 0540 5 7 Severn SO 8442 79 SI W A 9895 (104 700 8 Thrush& S X 398856 SWW A 112 7 05405 8 Stin e Pw k Brook 5.1 644 260 S I W A 14 30 4 700 9 Tiod y SX 343595 SWW A 3 7 2 0540 59 M ilord Bro ok SJ 654773 STW A 10 20 4 0 0 0 Tamar Sx 29099 1 SIN IN A 76 1 054060 Po d a o Brook SJ 6 34220 SI W A 25 004 70 1 Pl y rr i SX 5226 13 SWW A 79 2 0540 6 ' 11.09 110 1 Broo k SJ 628788 STW A 5 I0 4 10 3 W a bey Brook SX 744 763 SWW A (6 2 05406 5 F1cclen 5.1 56524 1 5 I W A 2 10 004 70 14 W aX sarn SX 5 13699 SWW A 43 1 05406 7 Sms wow W OOk SO 86 190 6 STW A 8 1 3
054068 li rI CII III B ro Ok S.I 3 / 9288 S I W A 2 1 204 600 1 Fow ey S X 72 7098 SWW A 36 8 054069 S 47 r913 9 Brook SJ 31377 9 7 STW A ' 0 •04 800 2 P o w a y SX ' 08 6 13 SWW A 17 1 2 054 0 80 Severn SN 99685 1 SI W A 187 004800 3 Pal SW 92 144 I SWW A 8 7 0 05408 1 Clywer/09 SN 9 3868 STW A 49 004 800 4 W arregga n S X 1598 74 SW W A 25 3 054083 Crow kl roo r SJ 6 78 141 STW A 16 704 80 05 K o n w y n . SW 8204 50 SWW A 19 1 054084 Cannop Brook SO 6 160 75 STW A 3 1 504 80 06 Con e, SW 654 273 SWW A 40 1 0 9 1085 Ca m op Br ook SO 609 115 STW A 10 404 80 0 7 Xenna I S W 762 3 77 SWW A 26 6 0 54086 Co w nw v Orve•sion SH 999 1/ 9 SI W A 13 704 8609 St Noo 5% 1134662 SWW A 12 7 05408 7 Acrurd arbor SJ 665233 STW A 4 70 0 10 10 Seaton SX 799596 SWW A 38 1 0540 813 I O a Avon S T 683986 W W A 134 004 80 11 Fun , S X 0 96624 SW W A 0540 90 I an t w y l h
05409 1 SevernSN 8448 / 6SH 8438 78
111
IN0 93 6
04900 1 Can er SX 8 17682 SWW A 208 8 05409 7 HO re SN 8418373 0 3 204 9 30 2 Rorie SW 549342 SWW A dB 9 054 11' Severn SO 7/ 6 783 STW A 4325 00 4900 3 De Lank S X 132 765 SWW A 2 1 7
SW 879593 SWW A 4 ' 0 05 500 ' W ye SO 531090 W EI S 404 0 00 4900 4 Carmel05 500 2 W m SO 485388 AI LS 1895 9
0 5CX)0 1 l aw 55 60823 7 SWW A 676 2 05 500 3 I ugg 50 548405 W I L S 885 8

C O N C I SE R E G I ST E R O F G A U G I N G ST A T I O N S 151
St at ion Rive rnum ber nam e
Nat iona lGo dref erence
Me asunngaut h ority
l u s oh e luo l
Sta ti on Rivernum b er mun e
Nat ionalGrtdreh eence
M ass unn gmnh on ty
Ansaleg km /
05 50 34 Mon StI 892460 VA SS 12 .8 06 600 3 AIM SR 95 770 3 W EIL 70 005 500 5 • W ye SR 9696 76 W EIS 156 8 0660 34 Wh eels. SJ 105 7 14 Wi t.S 62 .905500 6 B an SU 92664 5 S TW A 184 0 066130 5 etwycl SJ 122592 W ELS 9 5 305 50 37 W ye SO 0 7644 5 W ELS 1782 1 06 60 36 ENvy SH 9577 18 W EI S 194 0055008 W ye0 550 ) 9 • W a r s
574 879838 EH 10 4 0 66008 Aled SH 9 15598 W EIS 11 6SO 4 1925 1 W EI S 35 7 • 0 660 11 Comm SR 80 258 1 W ELS 344 5
0 550 10 W yn S74 84 387 5 W EI S 2 7 20 550 11 M o m SO 10568 3 W ELS I I I • 06 7C0 1 Dee Sit 94 735 7 W EI S 26 1 60 550 12 Won Ski 99 550 7 W EIS 244 2 06 7002 ' Dee SJ 35 74 13 W E S 1040 005 50 13 A f r OW S O 32858 5 M SS 126 • 06 700 3 h ong 9 4 9 745 39 W EI S 22 00 550 14 Logy SO 36 464 7 W EIS 203 3 0 6 7034 Atwen SH 95 752 8 W ELS 25 50 550 15 0 0 11C1d u SO 2 1729 4 w a s 25 1 06 7035 Cerro g S/ 7953 73 W EI S 113 70 550 16 l ih rm SO 0 245 78 W EIS 358 0 06 7036 Ahven 6.1 042436 W ELS 184 70 550 17 ' Om elru SN 99853 1 W ELS 29 0 06 700 7 ' Dee SJ 155428 W EIS 728 00 550 18 Nome SO 6 15428 W EI S 144 0 06 700 8 M yn 6./ 33654 1 W ELS 227 10 550 19 • Clamber h ook SO 529135 W EIS 30 3 0 67009 4 748 SJ 70666 7 M SS 71.80 55020 • Po etr y BrOOk SO 46 2598 W ELS 74 2 06 70 10 ' Ge m Sit 843420 W ELS 13 10 5502 1 I ugg SO 50 2589 W EIS 3 7 1 0 0 670 12 ' Tr ewelYn FR 838398 %/A LS 2 1 20 5502 2 Trol ly SO 50 3 112 W EIS 142 0 0 6 70 13 ' Ho nes t SH 946 349 W ELS 33 90 550 23 Wye SO 528 110 W ELS 40 10 0 06 70 15 Dee SJ 3484 15 W EIS 1019 30 55025 tl yne SO 166 373 W EIS 132 0 06 70 16 • W oetherstu ry (k ook SJ 4 18464 W ELS 14 2 10 55076 W ye SN 9 / 66 / 6 W ELS 174 0 06 70 17 T ry w eno Se 880 399 NIELS 59 90 5502 7 Rudhall h ook SO 64 175 7 W EI S 13 2 06 70 18 Dee SH 874308 W ELS 53 90 55078 Norm SO 66 148 9 W ELS 77 7 06 7025 Ch web og S I 396483 W ELS 98 60 55029 Monnow SO 4 15749 W EI S 3 54 0 0 6 7028 • Cochin SJ 0 343 1 1 W ELS 36 50 55030 • Clar eam Ski 9 10620 W ELS 95 3 06 7079 Tryszo n 6.1 06640 5 W ELS 12 3
7 am . h ook SO 49 24 15 W EI S 42 30 55032 Elan SN 934653 W ELS 184 0 06 800 1 W e• ver 6.1 6 10633 NW W A 622 0055033 Wye SN 874853 11-1 3 9 0 680 02 • Gow v S.1 443 7 14 NW W A 156 705503 4 Cyl l SN 82484 2 111 3 1 0 680 03 Dan e SJ 668 7 18 NW W A 40 7 1055035 140 7 St ' 876854 10 1 1 0 68004 W rstasron Brom S1 6 74552 NW W A 92 7
06 900 5 W eave/ SJ 65343 1 NW W A 10 7 005600 1 Usk SO 34 5056 W EI S 9 11 7 0 680 06 Dane S1 845644 N W W A 150 005600 2 Ebbw ST 259889 W ELS 2 16 5 06800 7 W elchem Stoo k SJ 69 715 7 NW W A 148 005600 3 Roo ckl a SO 0 5 129 7 NI LS 02 1 0 680 10 • Ven d er SJ 28 1880 NW W A 18 405600 4 Usk SO 12720 3 W ELS 543 9 0 680 11 ' A rl ey B r oo k SJ 696 799 NW W A 36 5135600 5 Em il ST 3309 24 W ELS 98 1 0 680 15 Go wv SI 49 7624 NW W A 49 0056006 SN 94 729 5 W ELS 183 8 06 80 18 Dac e SJ 86 1637 NW W A 14 5 005600 7 Senn . St, 978255 W I LS 19 9 06 80 19 W eaver Si 574 762 NW W A 1310 0056008 ' Monks Dam S T 3 728 85 W ELS 15 A 0 680 20 Go wv SJ 448 7 11 NW W A 156 00560 10 Usit SO 35804 7 W EI S 9 2 1 20560 11 Sono wy S I 206 9 12 W ELS 76 1 06900 1 Mersey SJ 728936 NW W A 0 79 005 6 0 12 Cew yne SO 24 1176 W EI S 82 2 0 6900 2 ton s SJ 8249 8 1 NW W A 559 40560 13 M ee So 00 3304 w a S 62 8 0 690 33 irk SJ 84 1992 NW W A 72 50560 14 Usk SN 840 290 W ELS 17 0 0 690 0 4 Ethr ow SK 0139 71 NW W A 78 20560 15 Oh m 81 oo k SO 3840 10 W ELS 105 1 0 6900 5 Gram Br OOk SJ 6859 39 NW W A 152 005 13016 Lear/ r a g b ag SO 104 206 W ELS 37 4
&Mel nSJ 12 18 15 NW W A 256 0
0560 17 • M on Lwyd SO 2 740 19 W ELS 42 5 g 66900 7 ain, SJ 7729 36 NW W A 660 00560 18 ' S rhow y SO 13 1114 W ELS 13 5 06 9008 Dean S I 846830 NW W A 5 1 8
0 690 11 MA ko h ook S I 855889 NW W A 6 1 305 700 1 Tar I om en SO 06 0 117 W ELS 33 7 0690 3 Smelartanl Brook S I / 26905 NW W A 44 80 7 1032 1 a, 4 .744 SO 0 12111 W EI S 43 0 06 90 15 Einc row 6.1 96290 8 WWW 4 156 005 7003 Tall S I 1318 18 W ELS 4 86 9 0 690 17 Gnyl 6 .1 964898 NW W A 183 006 / 004 Cr on ST 0 790 56 W EI S 105 0 0 691718 • Now too Bro o k SI 5859 33 NW W A 32 805 7005 Tag 51 0 / 989 7 W ELS 4 54 8 06 9070 Medloce S.1 8499 75 NW W 4 5 1 505 / 036 Kl io r xk la ST 0 5490 9 W EI S 1(1 15 0 6902 1 • S LA G Br o o k 60 8 7624 7 NW W A 0 305 700 7 Tarr S I 0 13995 1 W ELS 194 5 06 90 73 Roc SO 130 / 0 7/ NW W A 186 005 / 008 Allw rimey ST 22582 1 W EI S 178 1 0 69024 C oo SO 74306 8 NV/ W A 145 005 7009 l iy SI 12 1/ 0 W ELS 14 5 0 06 90 7 7 Tense S.1 906 9 18 7.W W 4 150 005 / 0 10 b y05 70 11 ' Bletes Tel l • w•
ST 0 3487 7SN 98 / 193
W EI Sw a S
39 45 I
06 91130 Sr key Bro o k0 690 3 1 D.,ron Amo k
zil 54858709 Z 25 Nl y wW WA, AA 15 4 04 1 9
05 / 0 12 • Gamm o n SO 004 179 W EI S 43 1 0 690 32 A il SJ 39 298 3 NW W A 90 105 70 14 • FOl ynw ey SI 156984 W ELS 63 2 0 690 33 ' A ll SG 3590 11 NW W A 100 005 / 0 15 l e SO 04 306 8 W EI S 104 1 06 90 34 Mm b- ry h ook SO 7752 13 1.14/W A 3 1
SO 060 115 W ELS 33 8 0690 35 ew eg S3 79 / • 09 NW W A 155 005 70 16 Ts. r em .0 69036 kag ey Brook SO 70 1 49 I .W W 4 16 8
05 800 1 (* nom SS 904 / 94 W ELS 158 0 0 69039 MedloM S I 86398 / NW W 4 55 905800 2 h u m SN 8 150 17 W EI S 190 9 06 90 40 !ewes SO 793 88 NW W A 10 5 005 800 3 ' Ewem y SS 9 14 / 80 AI LS 62 905 8005 Ogmore SS 904 844 W ELS 14 3 0 7000 1 Douglas SD 63 1119 NW W A 39 4058006 Met e SI) 9 1508 2 W EIS 65 8 0 7000 2 Dougg s SO 4 70 126 NW W A 198 005 900 / Ur i , SS 89 1855 W ELS 50 2 0 70003 Douglas SD 58 706 1 NW W A 55 305 8038 Dr ag S1) 77800 8 W EI S 43 0 0 700 34 Yarrow SO 498 • 80 NW W 4 74 405800 9 Ewenny SS 920 / 82 W ELS 62 5 0 70005 I oc tsek 53 49 7 ' 9 7 NW W A 56 005 110 10 Hog sle SN 969 134 W EI S 11 00 580 11 T h a w S I 0 1/ 116 AI LS 49 2 0 7 100 1 Ab ble 50 589304 WW W 4 1145 0
0 7 1002 SD 7 19546 NW W A 3 1 005 903 1 Tawe SS 68 5998 W EI S 22 1 7 0 71033 R u m b le SO 706 546 NW W A 10 405 9032 Lou" ' SY 6 23 12 / W ELS 45 4 0 7 1004 Calder SD 729 360 NVI W A 3 16 0
0 7 100 5 gutl ur a Seek SO 745 565 NVI W A 10 6060 0 0 1 Tr m SN 49 1104 W ELS 10 8 7 8 0 7 1006 Be n SO / 22391 NW W 4 456 0060001 Coin. 57. 508 225 W ELS 79 1 8 0 7 100 7 ' 16139. SD 709 3 79 ISWW 4 770 00600 33 T• r SN 738 160 WU S 2 17 3 0 / 1008 H OW . , St / 04399 roor N A 26 1 0060 00 4 Der l am SN 290 1/ 5 W ELS 40 1 0 7 10 10 Vend e W ats/ SD 83735 1 NW W A 108 0060 7115 Bran SN 77 1343 AI LS 06 8 0 7 10 1 fi g gle SO 839556 NW W 4 104 00600 36 Gwth Se. 43 1220 NI LS 129 5 0 7 10 3 Ottm en 50 6 77162 NW W .11 39 506000 / I yvn SN 76236 2 W ELS 23 1 8 0 7 10 14 Dama n SD 5657 78 NW W A 128 00600 38 Tv. ,060039 Saw ilde
Sk. 786 4 72SN / 12266SA. 48 5706
W EISW ELSAI LS
89 88 ' 1
1090 40 7700 1 ' L U MP
0 72002 W yre W93 64603346411 6.6i 'WV WW AA9 94 62 75 0060 0 10 I' yvn
0600 12 Ten th Si. 6 504 40 w a S 20 7 0 72004 t Law. SID 5296 53 NW W A 983 0060 0 13 • Cot t SN 53 730 1 W ELS 76 1 6 0 72005 Luna SO 62290 7 NW W A 2 9 0
m06 100 1 Wer e Car ideo SM 9 54 177 W ELS 197 60060 n yen i0 7722 l n oi SD 6 15778
SD 48844 7NW W ANW W .A
50 7 1l ' 4 0
06 100 2 Eastern Cledda, SIS 0 77 153 W EI S 183 1 0 7200 9 W erm so SO 6 1570 1 NW W A 142 006 1033 Gwe n) SN 00 534 9 W ELS 3 1 3 0 720 10 ' Luna NV 6 1304 1 NW W A 135 806 1004 M o ven Ch i ch i SM 94 2 154 W ELS 197 6 0 720 11 Etsw estry 93 6399 11 NW W A 20 ) 0
06 200 1 TeOr SN 2444 16 W ELS 89 3 6 0 7300 1 ' Leven SO 3 71863 NW W A 24 1 006 200 2 l e l . S1S 43340 6 W R S 540 5 0 7300 2 Cr ek • SD 294882 NW W A 73 0
0 7300 3 KENT SD 50 7956 14WW .A 13 606 300 1 Y a: Vr i t h 51‘ 59 1774 W ELS 169 6 0 73005 Kent Sr) 509 8 74 NW W A 209 006 3032 Rheg ol 61) 60 180 4 W EI S 181 1 0 7300 / R outh ack 10 4040) 7 NW W .A 23 606 3033 ' W W I' VS 54 269 8 W ELS 40 6 0 1300 8 Bela SD 496806 NW W A 13 1 0
0 73009 Sgme SU 5 1496 1 NW W A 34 606400 1 Dover SH 7450 19 NI LS 4 71 3 0 730 10 Lave. SO 36 786 3 NW W A 24 7 006 4032 N ame. SI I 6 37066 W ELS 75 1 0 730 11 Malt SO 524944 NW W A 65 806400 3 • Mavedd ach SH / 2913 3 W EI S 38 6 0 730 13 Hottu y NY 3 7 104 2 NW W A 54 0064130 6 Lb i SN 6 3588 2 W ELS 4 7 2 0 730 14 h aleav NY 360 034 NW W A 5 7 4
0 730 15 • K e e l SD 523 7 19 NW W A 48 006 580 1 GYag n SH 5914 78 AI LS 68 6065130 2 ' Om ni(' Ski 6 704 15 W ELS 78 2 0 7400 1 CluJdo n SO 196896 NW W A 76 20 650 34 Ow yde SH 48459 9 W ELS 4 7 9 0 74002 In NY 1360 38 NW W A . 4 4 2
065130 5 R th SH 4130 404 W ELS 18 1 0 7400 3 Ow n NY 08 4 154 NW W A 44 1065036 Serr i R I 493623 W ELS 74 4 0 74005 Uw e 144 00906 1 NW W A 125 50650 3 7 Dwr awr SH 499429 W ELS 57 4 0 14006 Ca cee NY 03504 5 NW W A 44 8
0 74 0 0 7 k s k SD 13 19 78 NW W A 70 206603 1 Clwyd & I 06 9 709 W ELS 404 0 0 7400 8 DuUdo n SO 209 94 ) NW W 4 4 7 906080 2 ' E wy SJ 02 1/ 134 W ELS 7 20 0

152
' — c lo sed
Re fer tu pag e 17 8 fo r k ey to me asu ring aut ho ri t ie s
5 1a1r0, ,num ber
Rwelnem*
Nat ions iGridref er• nc•
M easu ring• ut honty
Ar• aleg ri m )
Sta t ionnum ber
H Y D R O L O G IC A L D A T A : 1984
An ar Nat ional M easu ring Areanem• Grid au tho ri ty leg km )
OOOOO onc e
0 7580 1 Si _tor • . B u t It fo 309 • 9 1 NWW A 40 9 0840 ' 2 W INN Can W r er * NS 499619 OM B 234 90 7500 2 Deferent SY 0 79305 ‘1WW A 663 0 0840 3 C yds 5 5 6 726 16 CADS 190 3 10 7500 3 Deferent NY 19932 1 NWW AL 363 0 0840 4 Avon W ater ,d; 755 5 18 CAPI3 165 50 75004 Co888 NY 13129 ' NWW A 116 6 08 40 , 5 Kelvin NS 638 / 39 CMS 235 40 7500 5 Derw ent N Y 25 1239 NWW A 235 0 08 40 16 Letape W ater NS 739 725 CA PS 33 90 7500 6 Newland& Ben NY 240 219 NYVVYA 33 9 08 40 17 P er k Car W aler NS 4 11620 CMS 103 10 760 0 7 Glendefewaclun Mr 323248 P,W W A 69 0 0840 18 Clyde NS 89 1404 CRPB 9 32 60 750 09 Greta NY 286242 NIN W A 145 6 0 840 19 N0t15 Calder W u NS 68 625 0 398 ' 29 80 750 10 • M ay ne NY 0 74238 NW W A 77 7 0 840 20 Om er( W eir NS 61,6 703 CRPLI 5 , 90 750 16 Cor Ler N Y 1492 14 NWW A 64 0 08402 1 V e .U I Can W in e NS 58 / 59 / C19 13 9 1 60 / 50 17 Ellen y ) 0 96384 Nvo N A 96 0 084022 Uu • • NS 929259 CRDB 110 3
084023 Bo tN n e• •• '35 680 7 17 COPII 35 70 760 0 1 •law r ovaier Eler n NY 50 8 159 'on/W A 33 0 No•fe Caine, W t• NS 8286 78 CHP8 19 90 1000 1 &J eri NY 4 7056 7 NWW A , 366 1 084025 l aggts W ater NS 666 734 CF10 3 8 7 70 7600 3 E4 n , 3 , 1 NY 5 78306 NWW A 396 2 08 4026 M ender Water NS 558 738 COM 32 80 7 6 0 0 4 Ow t h, NY 52725 7 NWW A 158 5 08 40 27 • Mort Calder W u NS 165024 Cli Pli GO 60 7040 5 &cm NV 605 183 1,W W A 1116 4 0840 28 Mnrat arm Canal NS 765626 CRP8 50 60 7600 7 Ede, NY 3905 7 1 NWW A 2286 5 0 840 29 [ and er Water NS 7654 7 ' CP9 0 74 50 7600 8 k m ng NY 48658 1 NW W A 334 6 0 840 30 W % Iv Can W rdef NS 58 759 8 0 111:1 111 80 / 00 09 Ca r ew NY 3 784 69 NW W A 147 2 •0 760 10 Peg. • NY 4 12545 NW W A ' 00 0 08500 1 Leven NS 394803 CFCS 784 30 760 11 0 nal 9oi n NY 693 777 IN 1 5 085002 End' s . M ew " S 485866 CHP13 2 19 90 760 14 I dam SY 77309 7 NWW A 69 4 085003 ral nan 5N 31 119 / CAPS 80 30 / 60 15 Eo ..01, NY 4 77749 NWW A 141, 0 08 5034 M s& W ater NS 356929 OM B 35 3
0 7 700 1 t en NY 390 7 8 NWW A 64 1 7 08000 1 t tle r ac(a m NS 14382 1 OM B 30 80 / 7002 Es( NY 39 / 75 ' W M 49 5 0 08 600 2 f a c ' d e l NS 14084 3 CMS 139 90 7700 3 <Mel Watt ' NY 4 15759 Sin 3 9 00 7 1004 Kr * W ater NY 785693 W S 72 0 09000 1 ( even MY 10 260 2 BAC ' 70 70 7700 5 NY 4 12067 NWW A 19 ' (1 09130 0 2 • Cretan NN 0 19468 CRIS 66 1
0 900 03 Nen ( NN 116747 K UM 76 80 7800 • A -n an NY 175755 51390 730 30 780 02 Ae NY 06 8852 Sri 9B ' 43 1 09 100 1 Lea , NN ' 26 752 BAC / 79 60 780 01 Ann an NY 191704 SADII 925 0 09 10(12 %N *4 5805 P4I PB 1252 00 78034 ( tneel W ay. tNY 0 / 7868 Sl eb / 6 1 09 100 3 Mums ,* Cat NS ' 79843 MI PS 383 30 780 35 Ktm et M ow SY 0 9 845 SRPB 729 0
093019 Cano n NG 942429 8 9113 3 7 80 790 0 1 ' ANun W a l t ' NS 63 1050 SAPS 8 50 790 020 / 900 3
N thNe5
XIXNS
92385 1684 129
%MS514ID8
799 0155 0
0N400 , Lyre NG 959803 mi n 44 *
0 790040 79(10 5
Scat W att ,Clyc er W ai t*
NXNX
845940918 / 95
W ASRP8
142 0138 0
09 500 1 Hew NC 147254) Har ti ' 3 /
0 79006 N NX 858994 W V 4 7 , 0 09 600 1 i te lada NC 89 56 ' lows 20409600 2 Ha , .1/ NC 713568 1. 1•193 4 77 0
0800 3 1 W . NX 8126 10 SP9 13 199 0080 30 2 I NV NX 733 64 1 SRPR 80 9 0 0 9 700 1 Ca der Bufn NO 085596 i l +Cyv 24 5
09 7001 " Ne w 50 *3 1595 HRPB 4 1208 100 1 • N .H....le n Bum ID( 128694 DOWN , 8 20 9 1037 Cfee r3x 4 17653 SRPO 368 0 111• 0 0 1 l astern Yr Sz 5 778 5 / SW 5 7 50 8 , 003 Lma t %X 180 599 Sti eLl 11 1 0 10 •130 2 Med na 57 5030 74 SW 79 80 8 004
(18200 1
Elt aj a, o ,
G0 an
%X
Ns
382545
2 1799 7
SRPI3
CM'S
334 0
24 5 520 190 270 1005
( affy W ON ,Camowen
F• 406 758I i 460 730
DOE0( X
16 1 22 / 4 6
0 82001 fl own NS 338 160 OV A 323 8 20 1006 Drurn..KA H 458 721 DOE 324 6082110 3 Staler * tax ' 08832 GP O 34 • 0 20 110 7 Bum Den- et C 3 720 4 7 Do r ' 45 3
0830 3 1 0eat Warr NS 2455 14 51(CW 6 070 1008 Ontg 265842 00 , 73 / 3
08 300 208 300 1
Gan da&A yr
NSNS
29 3488575259
CRP8CADA
88 8' 66 3
2030 102030 11
Meckw ay,Man
H 820 5 190 052086
DO(DO
95 1 4228 8
083004 Lurie NS 508 1 17 CRPB ' 8 1 0 20 30 12 13‘ , C.LY , Y 0 926 799 DO 4 19 50 83035 trytme NS 145369 CPP13 180 7 2030 17 Uw e' Barn U 04 3509 DO 335 60 0380 6 Ayr f&S 36 1 16 CAPS 5 74 0 2030 18 Sor Mat Wr y O ' 4 6 8 6 7 DDE 2 7 7 30 8300 7 Lux e- W ater NS 3 15420 CAPP 54 6 203070 5,1097,1• 8 955905 DO( 30 60 E1300 9 (Lawn s& 55 30 / 424 CRPH 183 8 20302 * ( "Pk W ater 1069 71 DOE 2 7 00 830 10 fytne 5S 5323 72 CRPS 72 8 207025 Cab s I . 893574 nor 164 1
20302 / Brael o 02 70 14 DOE 1/ 7 20 8400 1 KaNg. MS 558 705 0 49 8 335 1 703028 Agerey C 883 193 nor 98 908400 2084003
Cal* ,Owl*
NSNS
309638835452
SPCW0 94 13
12 41092 9
2030 33 tapper Bane J 23334 1 se t ' 00 9
08 400 4 Clyde NS 9 27474 Ci daB 74 ' 8 204 00 1 C 942362 DC) 310 108400 5 ("lee• NS / 04 5 / 9 C9 113 1/ 04 20840 06 Kelvin NS 6 72749 CRIS 63 7 205 003 i acan LI 2996 79 10 1' 444 70 8400 7 S OW II Catt le. W it NS 75 1585 93 0 205004 Logan U 3296 93 DOE 490 40840013 Honer C.P.10 NS 6 7960 4 C9PB 5 1 3 20500 5 (Owen* , U 26 76 13 M I6 69 S0 94039 No han NS 809429 0 1813 66 0 20 5008 L IN I CI U 236515 DOE 85 1

Gauged daily fl ows, monthly peaks and monthly rainfall
KEY
Co mb s's/t o Inc om ple t e orra infa ll m is s ing ra infa ll
Com ple te da ily and com ple t e pea ks A •Co m ple te da ily a nd pa rti a l co oks B bCom Ple t e da ily an d no pe aks C cPa rt ia l da ily a nd oom ple t e pe a ks D dPa rt ia l da ily a nd pa rt ia l p ea ks E •Pa rt ia l da ily a nd no p eaks F INo flow da t a 1 -
Summary of Archived Data - 1 153
Sum m a ry is pres e nt edin de ca de blo cks
G a u ge d do e r glas s Csn Go ug e d da d s lb w s SP Ga ug e d do h Ov enna mes ena n n k pe a ks an d re n ta 8 nu m b s . me nd * m a ks an d ta 4 s ! nu m be r mo nth ly p ea ks an d ru nt s4
00 20 0 1 70 s AIW A 80 t • • • • • • 0 15 0 0 1 SO. •• 10 . t 0 1 00 35 60 s - t I t t u t t t 70 6 t r t t r IA A4470 s ON ON
0 0 30 3 1 0 1 50 0 2 SO. • 60 . I 0 1 00 0 6 70 s AA A* ON 0 31 00 2 80 s ** AA A. 70 s l i t t t t t t r i Bo s 0 20 0 3 7 60 . I r / Os D r I D A • AA0 0 30 3 3 70 4 AA 8 0 t • • • • • • 0 1 50 0 3 IN IcC SIN 130 . 0 0 1 00 4 70 s F 80 . AA • AA.• 60 s 70 6 0 2CO 38 80 s0 0 3 00 5 90 6 - n o n ON A110 1C
0 1 500 4 70 s CCC 30 s CGCCCO3 A4 - 0 2 100 1 SO. • 60 s • • • ALL• AL t0 04 00 1 40 s Id 50 $ can Al • M • 40 t u t 50 . W I t t t t t1 / 0 . D r u n t t :
6 0 . BAII• BA• • • • / Oa f t t I t rA A AA 60 s ( I 70 6 0 2 100 2 SO. t t a 60 . aliC8 AA A• 08 0 6 4 .44 144 .• 110 s / 0 . t t t : : t t t
00 40 0 3 80 , 0 15 0 0 5 70 CCC 30 s CCCCCCBAs 0 2 10 0 3 SO. • 60 s 0 04 0 04 BDs - .a ss 40 6 I D 50 , LL•l l i r r i F / O. 110 . 4 88 CC
60 . I 70. t t 0 2 100 4 60 s - AA* 70. 1 1 t00 50 0 1 50 s 60 s * 4 6 t 80 s 0 2 10 05 60 . 70 s
70 a i t t t 0 1 5 0 0 6 SO, 60 , BOs * ** BCC70 s 0 0 7 0 4 • 4 • 0 2 10 0 6 60 . 70s
00 80 0 1 30 s • • • • 6 AN 1116.408 88 4 • 0 1 50 0 7 SO. • • • 60 . 60 s 50 . I I I 6 13. AA AI n t t r t 70 s 00 s A ACCC 0 2 10 0 7 60 , 70 s 70 s i t t t 0 1 50 08 SO. FA 60 . 60 . AA OCC
00 60 0 3 ?O s t 30.. „ , „,.„ , 70 6 80 s 8 ACCC 0 2 10 0 6 60 . 70s • Os 1;44W 0 1 5 0 10 70 . BD. ACCCC 110 . AAMCC
0 0 6 0 0 6 SOs 6 0. 41A• 0 1 5 0 1 1 50 , cc 60 s co sco rce “ 0 2 10 0 9 60 s 70 s 0 0 600 7 70s 80 s / Os c•C 8Ds ACCCC BOs 0 0 80 0 8 70 s F 80 s 0 15 0 17 70 s 0 4 6 4 •• • 60 , AACCC 0 2 10 10 60 . 70 s
0 1 50 13 SO. cot . 60 . cCCCCCCCCC BOs A t m0 0 70 0 1 60 s 70 . 70 s CC 80 . AM ICC 0 2 10 1 1 6 0 s t t l 70 6
BO. 0 1 50 18 Rh RN AA CCC 80 s A • BCC00 70 0 2 SO, e .• 60 1 0 1 5 0 1 7 70 , •A AA A ON Al i 0 2 10 12 60 . i r 70 .
/ Os t t t t t A• A A A 80 1 A4 • 4 to 0 15 0 18 60 0 0 70 0 3 6 0 s 70s AA AB AA AA AA 0 1 50 2 3 BOs cc 0 2 10 13 ISIN t ! 70 .
I N • 4 4 * 1 0 1 5 0 2 4 BN - - ccc BOs AA CCC0 0 70 0 4 70, • 80 s 0 1 5 0 1 5 113t • 0 2 10 14 6 0, 6 70 . 00 70 0 5 TN tol 60 s AA BCC
0 16 00 1 40 . Cc SO. ct l* Ab b • • • • 0 2 10 15 6 66 AAAAA I A A* 70 s 00 80 0 1 30 s tc 40 s tra ccc ca c 60 . 70s BOs AA CCC
50 . be 60 s 80 , El • CCC 0 2 10 16 60 s 70 . 70 s • • 0 16 0 0 2 50 s 6 0 . 6 0 s AA CCC
0 0 10 0 2 50 s - 4A A MI A A A A 60 , 70 , I I 0 2 10 1 7 60 . t u rFA • A A 70 * 70, 80 . • AA A( 0 160 0 3 6 13s 70 s BOs AA BCC
00 10 0 3 50 a - 6A 4 A4 4 4 A4 60 t BOs 0 2 10 18 6 0s i A 70 . / Os • •• • • A A 1 AA 0 16 0 0 4 70, 80 s IIN
00 10 04 UN - - ( 4 .44 4 A• A 60 s AA AA AA A AA A 0 2 10 19 6 0. - AAAAA i rl • / Os • • A AA AA A• A/ Os A A AA AA 4 * • • 80 , AA A AF 0 1 70 0 1 60 I 70s BIN AA BCC
0 0 8 0 0 5 50 s - 6( AA AA AA A 60 , BN 4 • 4 • 4 0 2 10 20 60 s - 1 w i r68 .4 W s A• A AA AA A • A70s 80 . A4 • 4 7 0 1 70 0 2 60 s 6 70 s BN ** * BCC
00 8 0 0 6 50 , 60 s BOt 0 2 10 2 1 60 . k 70s • • •• • •1* • • •70 . 80 s 0 1 70 0 3 70 t MN BOs A4 6CC
00 6 00 7 SO. 60 s 0 1 70 0 4 70 . BO. ' 0 2 10 2 2 60 . AA : AAi r ri / Do 70 s 90 . AA • AF 0 1 70 0 5 70 , 110s 80 s
00 8 00 8 50 a 60 . 0 1 70 1 2 ON r 0 2 10 2 3 60 s Ws l 70 . so . A *A M, 0 1 70 14 BOs AA/K C
0 0 8 00 9 50 s - - ( ••• • • 111A 60 s 0 2 10 24 60 s 111111111 70s : 6 M s 80 . AA AAF 0 18 0 0 1 50 s AA 6 13s 110s AA CCC
0 0 8 0 10 SC. 60 . ?Os AN A• • • 0 2 10 2 5 60 . ?Os ! ! “ • • • • •
70. 80 . • 4 .7. 4 1 0 11100 2 50 s • 60 s AI flOs AA CCC70 , 6 o mi t A A • 407. • 80 , 4 4 • 0 1 0 2 10 2 6 60 s - m u m : / Os 9 11 4 • 4 074 .0.
00 90 0 1 50 , • 60 6 0 18 0 0 3 60 s 70 . 60 6 AA CCC70. 80 s AA • Ar Bth • • • • 0 2 10 2 7 6 0, ! / Os ! I D AA AA AA
00 90 0 2 60 s 70s 0 18 0 0 5 70 s I ON A4 • 4 • 8 0s AA CCC110 , 0 18 0 0 7 B0 , t 0 2 10 30 6 0s A ' 70 6 I
00 90 0 3 6 0s 70, 0 18 0 0 8 70 00 s A 4 • • • 813. • 4 8C CBO. F 0 16 0 10 BN t 0 2 10 3 1 50 s *A AA 60 9 Af
00 90 04 110 4 t ame 0 18 0 1 1 80 s - Ic A• 70 s • • • • A AA AA 6 so. •0 18 0 12 0 2 10 3 2 60 s • 4 4 4 70 s
0 10 00 1 60 , - 111114.* * * 70 . 0 18 0 1 3 80 . • 4 • 680 s ACCc 0 16 0 14 0 2 10 34 60 s - 111AAAAAA 70 . CCCCCE AA * *
0 10 0 0 2 60 s - 70 s t f • A11 AA AA A 0 16 0 15 SOs 80 s *** BCC80 s
0 10 0 0 3 ao. 0 19 0 0 1 SC. • • • 60 s 0 2 2 00 1 60 s fcebA AA 70, / Ds 80 s 80 .
0 1 10 0 1 60 s - fl ur ri i ik 70s A• A AA AA A AA 0 19 0 0 2 60 t I 70 s * 4 * 1 0 2 2 00 2 50 s s AA 60 s 64 6 ON 90 s / Os A• A* A AA AA A BO. •
0 1 10 0 2 60 . - AAAAAA 114 ?Os (33.• • • 4 4 A • A 0 19 00 3 6 0s - • 4 • 4 • 4 • 4 A / o , * AA A A AAA A A 0 2 2 00 3 50 a s AA 60 s BOs A A A At 80 s Ot t 70, BO. •
0 1 10 0 3 60 s 7N t t 0 19 0 04 60 s 70 7 AA * 0 2 2 0 0 4 60 6 t A• A 70s AA A A AA AA A 680 s • • • • J 50 . 80 s F l I l
0 19 00 5 ON 70. 0 2 2 00 6 60 s t O A• 70s 0 1 20 0 1 20 . • 30 s 8 118 18 11• • • • 80 s 80 s
40 s IIABOAABCCC 50 s CCCCCCCCCC 0 19 0 0 6 60 6 _ t t 70s 0 2 2 00 7 60 . F• 70s 60 . CCCCCOAA • A 70 o SC 60 . (10 s 110 . 0 19 0 0 7 60 a 70s 0 2 2 00 8 60 s 6 70 s
0 12 0 0 2 70s ON A • • • 6 80 4 60 t • AAI t0 1 20 0 3 70 a s ow 60 . • 4 4 • 1 0 19 0 0 11 60 , D r 70s 0 2 2 0 39 70 s 6 60 s 0 120 0 4 70* a ses saba s o 80 6 bI CCC 80 s 0 1 20 0 5 / Oa s u s BO. • • AM 0 19 0 09 ON 70 s 0 2 30 3 1 50 s • • ••• 6 0s • 4 .44 ( A AA AA0 1 20 0 6 70 a s s 80 s a 4 AO 80 a A4 A4 • 70 s C. • • AA AA A AA 60 . 4 • 4 4 A•0 120 0 7 80 a 0 19 0 10 60 6 • 70. AA A A AA AA AA 0 2 30 0 2 SOs T CCCI) 60 s
80 . / Os 4 • 4 13• 4 • 4 • 4 BO. • • • • • •0 130 0 1 70 6 • BOs • • A• F 0 1 90 1 1 70 s M a 80 s 4 • AA • 0 2 30 0 3 SO% • 60 s 0 11 0 0 2 so. 0 19 0 12 70 s 4 4 14.4 11• 4 4 • 17 SO D ( AF• • •0 1 30 3 3 70 s c ON cat 0 1 90 14 80 a t 0 2 30 04 60 s / 0s 0 13 0 0 5 80 s 0 19 0 1 7 80 , 4 4 4 AA40 1 300 7 70 s CCCC 60 4 CCC• • 0 2 30 0 5 60 s • 4 • 4 0 A0 I N 0 1 30 0 8 80 s 0 20 0 0 1 60 6 70 . 60 s
80 s 0 2 30 36 60 s • • 4 A 70 s 69 40 14 0 0 1 60 s - 1111• : I AA 70s 0 2 0 00 2 60 s t t I r t f • • •• 70 s 80 s
80 s 19 3s 0 2 100 7 60 s 70 s 0 140 0 2 60 4 - AAA I 70 s 744 4 714 •• 4 • 4 • 0 2 0 0 0 3 6 0 , I f t ' W I A A A , AA AA AA 80 s
80 6 ACCCC 80 s 0 1 3 00 1 60 , I A 70 4 0 14 0 0 5 80 a • 0 2 0 0 0 4 60 . - AAAAA! • • • 704 714 • 4 4 • 4 • •4 • 80 $ • 6 • 4 At
60 . • A• A•

154 H Y D R O L O G I C A L D AT A : 19 8 4
St n Go ug e d <lad y fl e et s . Si n Gaio a sel 04 .6 11o /vs . 5 16 Ga u pe d d ee r flOo •n um bly mo nt hly ps a lm an d ra infa ll num b« mo nth ly pe a ks so d ra rrfan num be r m on th ly pe t s a nd fo n ts .
0 2 30 0 9 60 s I 70 , • 4 • 0 0 4 4 Af • 0 2 70 2 0 50 s - • AA • 0 0s 68 AAA A A BAB 0 3 1 0 2 0 60 . •n s 70s •• • • 14 4 • • •1110 . I • 4 1. r 70 . 4 4 118 1.11CI Et 130 1. Illo • 1 BOs • • • • E
0 2 30 10 60 6 r 70 s 0 2 70 2 1 50 , • 60 s 1 0 2 80 2 7 6 0s f AEA* 70 * t r r80 s / Cs AA • A• AF o • 80 s t t • • • • BO. •1 4.. .
0 2 30 1 1 60 . I 70s I AA AA A A AA A 0 2 70 2 2 6 0 s • 4 4 4 • 4 • 134 4 70s FE AAA i .: A i I 0 2 80 2 8 70 s 130 s - t t80 s 80 s t t 0 2 8 0 2 9 80 s • • • • 70 . •• •5 • 4 4 4 1 4 •
0 2 3 0 12 70s BOs • i t 0 2 70 2 3 60 s 70 0 80 s 4 • 5 410 2 1 0 13 / Os 110 s 80 s • • • • • • 0 3 8 0 30 60 s see 70s oof 0 2 30 14 6 0 s fcca cc acce 70 . c8 41 EI t t o 0 2 70 24 60 s 70 s AA AA AA ( AA A 9 0s 4 4 4 • 10 2 30 1 5 • Os - t li f f 1FFFE SOs 1 4 1 4 14 88 8 . 130 s I : - I I 0 28 0 3 1 60 s at 70 . 4 • 4 4 4 * * * * *
0 2 70 2 5 60 s 70s 4 • 4 0 1• • • • 8 0 s 0 2 4 00 1 50 a K C 60 s CCCCCCB• * A 8 0s 0 2 5 0 3 2 00 . ( AA A * 70s AA AA A * FA A*
70s AA AA A 4 1 4 6 4 110s f AL A* . 0 2 70 2 13 60 s 70 . BOs 4 1.4 • E0 2 40 0 2 SOs • • 60 . • • • • AA AA AA 8 0. i m A. 0 2 80 3 3 60 s n • s• 70 s A
70 s 8 0 t • • • Et 0 2 70 2 7 6 0s AAAA A AM A 70 s l I l t och. A • F 1 10 24 00 3 50 s • 4 6 0 s 0 7 70 2 5 60 s 70 s t 0 2 8 0 34
70 s 80 s 80 . I r : • • • 0 2 8 0 3 5 8 0s t E•o •0 2 4 00 4 50 . S 6 0 s 0 2 70 2 9 60 . • • • A AA AA I 70. I 0 2 8 0 3 6 60 6 • 70 . se Ak AI i I r r
70 s BOs 80 s Ao r 110 2 4 00 5 50 6 60 6 0 2 70 30 60 s 70 s • • 4 48 ( 4 4 14 0 1 80 1 8 60 s • 70 s • • • ( • • ( * * *
70s 80 . • • • •A • 80 s 4 4 1) 4 4 • 110s AA ( i t0 2 40 0 6 50 s Ice 60 6 b AA a AA A A • A 0 2 70 3 1 W s - - - - 70 s I AEA 0 2 110 3 9 6 0 s . 4 1 70 s N EM 4 4 4 4 4,
70s 8 0 s • $ 0s BO. • • • • • •0 2 40 0 7 60 . 114 / 0s 0 2 70 3 1 60 , i 616 4 Ms 11 AA A 0 2 8 0 4 0 60 s •• 70 , A
8 0 6 AA AI I 90 a AI ADD• 90 1 0 2 4 0 0 8 70s 80 s AM 4 4 6 0 2 70 3 3 6 0s • • • 70s cca ccb• • • • 0 2 110 4 1 60 1 as 70 , ao 0 2 4 0 0 1 I ns • • • 8 0s AA 4 4 .4• BIl s 4 4 4 4 4 . 80 s • AC 1 1
0 2 70 34 60 s O A 701 0 2 8 04 2 70 s A
0 2 50 0 1 50 s 60 s 90 s 0 2 8 174 3 60 . • t 70, aa ?O s 8 4 4.4 6 • • • • BO, A • AA * . 0 1 70 3 5 60. I A 70 s 4 4 4 4 134 1 4 * A 80 s • • • • E•
0 2 5 00 2 50 s 60 , . 4 4 4 4 4 4 4 4 0 80 s I 0 1 80 4 4 00 s • 70. . 4 4 4 4 4 4 4 470 s 0 2 70 30 t Os 11 / Os 11 1111 . 1 110 6 AO • AI
0 2 50 0 3 50 . A • A 60 , 4 4 4 14 4 4 4 AA 0 2 70 38 70 s 14 4 4 4 4 4 4 A* 130 s I 4 4 0 11. 0 2 110 4 5 6 0s ma4 m 70s • • • • • • • • •70 6 • • • • • • • • • • 130 s • 0 2 70 3 9 60 s / Os • 4 4 1 AAA AA 110 . • • • • E
0 2 50 0 4 SO, • •• • A W s 4 4 4 4 • 4 4 AA A 80 s 1 0 2 1104 6 60 s • 70 s sa 70 s 4 4 4 • 4 4 4 4 4 0 130 s • AI AD. 0 2 70 4 0 70 s 130s BO. • • • • ••
0 2 5 0 0 5 50 s • GO* • • •• 4 • 4 4 4 4 4 0 2 70 4 1 / Os - - rk • • • • • A BO. • • • • • • 0 2 80 4 7 70 s su b AA AA AA 80 s • AEEE/ Us • AA A• A.M .. * BO, 4 4 4 4 4 . 0 2 70 4 2 701 t t E 80 4 0 1 80 4 11 M I sa SOs 4 4 4 1 4 .
0 2 5 0 06 GOt 70s AA AA A A 114 6 4 0 2 70 4 3 70s 110 . 1 • • • • • 0 2 80 4 9 70 . • • • •• • • • • • 80 6 • • • •ifSO. • • • •• • • 0 2 70 44 70 s 80 s 4 4 • 4 0 4 0 2 60 60 70, - n a • A• F AA 110 s • 4 4 4 1
0 2 50 0 7 60 s 70 s 0 2 70 4 7 70, •114 • 84 4 4, 80 . At • 0 4 . 0 2 8 0 5 1 70 4 8 0 4 4 4 4 4.660 . I 0 2 70 4 8 70, - t I 4 4 4 11 .4 4 80 1 0 2 8 0 5 2 70 6 BOs 4 4 4 • 1
0 2 50 0 8 60 1 EA8 * 70 s 0 2 70 4 9 70 s 444a m 8 0s 0 28 0 5 3 BOs • • • E •BOs AE• Et 0 1 70 50 70, Icc ltfl 80 a I 0 2 60 5 4 70s 130 s 4 4 4 ..0
0 2 50 0 1 60 . • 70 a • AA I E AA A AA 0 2 70 5 1 70. • •• ( * * Al 8 0 6 • EDAA • 0 2 8 0 5 5 70 s - • • • • ( • • • • 80 . An o80 s . 0 2 70 5 1 / Os O W 8 0 , 0 2 80 513 70s - - - • • • 4 41 4 80 s A4 4 4 6
0 2 50 10 00 , FL A 70. k E • Ak A ! A A 0 2 70 5 3 70s g AA A 80 s 0 2 6 0 5 11 BOs • • • 4 10 2 50 1 1 60 s I 70 s 0 2 70 54 70s Maas 10 s 0 2 80 5 9 60 s •• • • 70 s A
80 s 4 • 5 1 1 0 2 70 5 5 / Os 80 s 4 • 174 4 . sae AA AFF0 2 5 0 12 60 , I 70 s 0 2 70 5 8 70 . Yoga 80 0 0 2 80 6 0 70 a 110 , AA AEI
80 s 0 2 70 5 7 ?Os Hes s. ON • • • • • • 0 2 80 6 1 70 6 t ! RN 4 4 4 4 10 2 50 1 3 60 . k 70 s 16 4 11. r • I l i 0 2 70 5 8 70 , te em 80 s 0 2 8 04 8 70s 110 . 4 4 4 1 4 .0 2 50 14 6 0 . E 70s An t o t 0 2 70 5 9 70 s . 4 1 813. 1 0 28 0 8 7 70 s 8 0 s 0 2 6 0 1 5 6134 • 70 . • •• 0 2 70 60 70. • 80 6 0 2 60 70 60 . 0 0 1 / 0 1. n e w n es s0 2 50 1 8 70 s r r l 80 . 0 2 70 6 1 70 s ea 1316 . BOs 6 1,1 : 10 2 50 1 8 70 6 t I E 90 s Al E• Acr 0 2 70 4 2 / Os • &Os • I A,• • • 0 2 8 0 72 70s ( * AA A 90 s • • • f I0 2 50 19 70, IF 110 . • • • • • 0 2 70 6 3 MX •40 • 16 0 2 6 0 73 70 s te m 80 . sa w0 2 5 0 2 0 ?Os - - I A • Af AEA 80 6 0 2 70 6 4 70, BO, an d * . 0 2 80 74 70s oa 80 s is m0 2 5 0 2 1 70 . t t !I D AA AA A 80 . 0 2 70 6 5 / Os 60 s o tos * . 0 2 110 7 5 70 . • 1110 s r e
. 0 2 50 2 2 70 , 110, 0 2 70 6 8 80 s 0 2 80 7 7 BM a ss e s0 2 50 2 3 70 s - 1 • 11 • 4 1 4 • BOt • 4 I ET 0 2 70 8 7 60 s 4 • 0 2 8 0 790 2 50 2 4 701 so 0 2 70 6 9 00 s 0 2 80 80 50 a ICF 60 6 FCCFCCCCCC0 2 50 2 5 70s 6 BOs ern 0 2 70 6 9 80 s 70 s CCCCCCCCCC 8 0s C8 • AA*0 2 50 2 11 70 . II 80 s .111 0 2 70 7 1 80 t . . .M A. 0 28 0 8 10 2 50 2 7 70 s II 6 3s 9 01 0 1 70 72 80 s 0 2 110 6 2 70s - - - AAAAAAA BOB o l • F•0 2 50 2 8 70 6 et 80 . MIN 0 2 70 73 170 .
0 2 70 74 80 . 0 2 90 0 1 60 . • • 4 • 4 • 4 • 4 11 70 s • • • 4 4 4 4 4 • I0 2 8 00 1 50 4 6 0 6 68 88 13 • 134 98 00 s • 17• 4 • •
70 s 4 E5 8E • 9 11 80 6 132 8 0 0 1 30 s - c ac ha * • 40 . BCCCCCCCCB 0 2 6 00 2 60 s - - • 4 4 4 4 • 0 4 70 1 0 2 60 0 2 60 s - . 4 4 4 11181313 70s f AA AA AA ER, SO, • • 4 4 • 4 • • 4 4 60 t 80 .
SO. fOCC C / Os 4 4 4 4 4 5 174 4 4 00 , 0 2 9 00 3 00 s E• 70s • * * * • • • • • •0 2 60 0 3 50 s • 60 s AA 4 • • • 4 4 4 8 0 2 8 0 0 2 30 s • 4 • AOs 80 . 40 14 6 to
70 , • • • • 1 4 AA A BO. 4 4 4 • 4 • 50 t 00 s 4 4 • 4 4 4 4 .0 k 0 2 90 0 4 60 , A 70 6 0 2 60 0 4 70 s • 1 1 i ll k 1tn. so. • • • • • • 70 , - 7 • 4 • 4 1 8 4 6 0 80 s 4 4 • 4 1 110 6
0 2 60 0 5 BOs - de s et• 0 2 8 0 0 3 50 t A 4 4 • • 60 s • • • • A AA AA A 0 2 9 0 0 5 70 s E 80 s
0 2 60 0 8 80 s 70s 4 4 16 4 4 4 4 4 4 80 s * 4 ( 11 0 2 90 0 9 70s a 4 S4 130s 0 2 110 04 50 4 Ib * ( 8 0 6 EA
0 2 7 00 1 30 a *A l a i 4 0 s r16 46 11CC1 t 70s 110 s • AEt t 0 30 00 1 50 . 1 60 s • • • • 4 • • • • •50 s t t t 1 • • • • • 1 60 a 4 • 4 A AA A AA A 0 2 8 0 0 5 50 s It t b • 6 0s • • AA AA AA * * 70 s • • 4 • 4 • 4 4 • • 80 s 70, 4 • • • • • • • • • 80 s AE• : 1 70, 4 4 4 4 4 4 • • • • 60 . • 4 8 • 1 0 30 00 2 60 s 70 s
0 2 70 0 2 30 , EE? AO, • i i t l i t t • 0 2 110 06 50 s •• • 80 . • • • • E O t t I 80 1 EEEt t50 . r • • I t E * AA A 60 s • 4 4 4 4 114 8 4 4 / Os t o t • o l o 00 . 0 30 00 3 00 6 AK 70 , 70. BO. • 4 4 • 4 . 0 2 8 00 7 50 s • • • 60 • t o 80 .
0 2 700 3 50 s - 6 0 s 0* 70 s AAAA 80 s AA i AA 0 3 0 0 0 4 60 4 - - 41 4 134 4 4 8 / Os AAA AA 17* AM701 AA AA A 88 • 1 1 80 s A t * A A. 0 7 8 0 0 8 50 s 80 s SOS
0 2 70 04 60 t I 70 6 t t E* * *I t t t 70s 8 0s 0 30 0 05 60 S • 70 s 0 2 700 5 30 6 K f- 40 s A * AL A 0 1 8 00 9 50 s • 60 s 60 s
50 6 • RCCCCCCCI1 50 s 88 70s • AA A AA AA AA 80 s 0 30 0 00 70 s 819 • 11 • • •70 , • 4 191CCCCCC 80 s C iC FC 0 2 6 0 10 30 . ITFCC 4 0 6 CCC1CCCCCC 0 30 0 1 1 70 s f 110 s
0 2 70 0 6 60 * • 4 4 4 4 M s 50 6 CCCCFCCCCC 60 0 CCCCCCCCCC 0 1 0 0 11 ?Os 80 s DI E AE•*O s 70 s CCCCI AA AA • W s 0 30 0 1 3 70s w e 80 s ADAA • •
0 2 70 0 7 50 . • • 6 0 s 0 2 80 1 1 50 s e f 00 s 0 3 0 0 14 70 s 6 0 6 110 4 4 4 .70s 193DA AA AA I f 323 • • • • • • 70 s E6 110 s 0 30 0 15 70 6 w ee 10 .
0 2 70 0 8 50 a 0 14 4 1 60 . 033012 50 s • 60 • 0 30 0 1 7 70 . • • 8 0 s 4 04 4 4 .70 6 A AA AA EU Al 80 s AI DEE 70s 80 6
0 2 70 0 9 60 s - t t : AAAA : 1 70 6 88 0 31EADAE 0 2 130 14 60 s 64 • 4 11CIE• • 70 s I I 0 3 10 0 1 30 a K t90 s • 6 • 144 . 80 , : M r 50 s 60 0
0 2 70 10 30 s W e 4 0s 66 11716 0 2 8 0 1 5 60 s e g 1* 70 . ( W o o l 6 70 s 4 4 8 4 4 4 4 5 48 1131 8 4 4 4 44SOs cfe 60 s 114 4 6 80 . • 8 6• 0 3 10 0 2 80 . 4 8 70 . 116 4 • • 134 114 470 t 4 11• • • • I I AI 0 2 81718 90 s 70 . t 90 s * A AA *.
0 2 70 1 1 50 t GOs 80 s t o t 0 3 10 0 4 60 . 4 • 70 a 1 0118 88 8134 •70. • • • 11CC• I I I 0 2 6 3 1 7 ?Os n A( * * E4 Et 110 4 • • • •• • •
0 2 70 1 2 50 s 80 . 80 * A AAA 0 3 10 0 5 110 a70 6 4 4 5 ( A t 0 2 80 18 60 s 70 a 4 4 48 0 3 10 0 13 60 a 4 • 70s
0 2 70 1 3 50 6 60 a • • • • • • 4 4 4 4 80 s 60 s 70 6 4 • 4 11138 0 115 110 s b - - ' I 0 2 8 0 19 60 s • • • • • 70 6 A• AL A AA A AA 0 3 10 0 7 150 1 Ef 70 0 I BCCCIK BAA
0 2 70 14 50 . . 4 60 4 4 4 4 4 • 4 4 4 8 4 110 . • • • • • 110 1 4 4 4 4 4 .70, FF AAA i A i t • 0 2 8 0 2 0 BOs El AA AA AA I se 0 3 100 8 70 s, 0 E6 f f 14 11 110 . • Ff f F•
0 2 70 15 60 , 70 s t I l t 70 s ea 80 s 0 3 10 01 70 . 9 6 8i 11 1I E 80 1 I I 11 1.80 , 0 2 8 0 2 1 60 , 164 4 1 4 ?Os I H I 4 4 6 . t i 0 3 1 0 10 813. DA 70 a • BAABA• A AA
0 2 70 18 517s s• AA 60 s 110 . • • • • •70 s AI BBI IK EI E 90 s Bo y 0 2 8 0 2 2 60 s e a 701 •• • •• • • • • 0 3 10 1 1 60 s E 70 6 M EM EL(
0 2 70 1 7 50 s sa A • 60 s * AA A 4 4 4 4 • • 80 , 4 4 • 4 1 80 s I f ( a s70 s 44 6 111150 I 6 E 80 . F i r • I 0 2 8 0 2 3 70, aa I t 0 3 10 12 6 0 s E / Os FI EFI f f f f f
0 2 70 16 50 s ott .• A 60 s • 4 • 4 4 8 4 4 4 8 80 s I EE• • •70 s 0 2 8 0 2 4 60 1 . . . 70 s 0 3 10 13 50 4 k 70 . 60 8 811M • •
0 2 70 1 9 SOs • AA A 60 s • • 1134 4 4 4 EE SOs .4 116 1• 130 . C4 1 kk •10 . 0 2 8 0 2 5 60 s • • • • 70 . • • 4 4 .• 4 4 • 4 4 0 3 10 14 80 s E 70 , EI EBEEEEFE
BD, A AA AI 110 0 I I I • • •

S U M M A R Y O F A R C H IV E D D A T A - I 155
Stn Ga uped dash Sm. . Stn . Ga g ed Y es fa n . St n Cl ou 9s4 de* flow s,m a dam. month l y p eal s ar s cost a me nds e a u * pe a l and m od al r u n ts ne rth lv m aks And ens-48/1
0 3 10 15 / Os 4. 418 13111 / Ff 60 1 FFEeef 0 330 34 60 s I LA l Os 0 3 7004 30s 40 s OCCCC266 1 I0 3 10 16 €0 , 6 70. 80 s 4 A 4 4 30 50 . 4 134 4 4 6 4 6 41 60 s 4 114 4 884 4 4 1
80. 4 • 4 4 A.• 0 3 30 35 50s IC 613. Ca CCCCO CC / Os O M M I t0 3 10 1 7 70a I EBBOBI ELL BO. U f •• • / Os Il eCCCeC I I I ROs 1/ 111 0 3 70 05 50 . I 60 . CCCU 71• 46.00 3 10 11 / 0. - - M I M I RN FM . , 0 3 30 3 7 60 s l IN 701 SN . 4 4 4 4 440 3 10 19 70. ( M U M SIN ( ( Ew e 110 s 0 3 70 08 60s •CO 34 4 4 4 / 0 . 0 3 10 20 / 0. 44 111118 . O F 80 s M ew 0 330 31 70s I 4 4 4 4 64 4 110 . 4 .48214.• ON L I L L ..0 3 10 2 1 I N 41M I 8( 7A 8 60 . M U • 0 3 3040 70s : I RN sa• M le 0 3 70 3 7 60s 19 4 4 A A / Os 0 3 10 2 2 60 . I / 0. 118FFIRI FI F 0 3 3044 70s : AB AAAA A BO% M IA • Ae 80s 4 4 • 4 1.
RN FEE set 0 3 304 5 / 0' : 110 a 84 8 4 44 0 3 70 38 60 s 04 • 4 4 70 . 0 3 10 2 3 70s - - 61• 61311411 80% • 4 4 4 44 0 3304 6 704 1144 /14 4 8 • BOs 0• 4 4 44 . 110 s 4 •• 4 • 4 .0 3 10 24 70. FA M M U 60 s M aw 0 3 104 9 80 s • 0 3 70 39 60s K CBA AA • 70 s 0 3 10 25 706 • • BM 1• • 4 4.. 0 33 0 50 70s / FCCCC BOs K CBs* 8176 • • • • • •0 3 10 26 / Os - : : : FA 130 S • • • • A• 0 330 5 1 / Os ca ad d o bt o 0 3 70 10 60 ' ICC11• 4 4 • 70% 0 3 10 2 7 W I RN • • • •• Fa 80 6 4 4 4 4 4 ..0 3 10 28 MN lb w 0 3 30 52 70. - - - - 444 4 6 • 1. 0 . 4 • 4 01 a 0 3 70 11 C.N . - 1C11• 4 4 • 70s
0 33 0 54 70. K AA 60% • 4 8 4 4 . 80 s 0 32 0 0 1 8 413s •13 0 33 0 55 / Os SOL 0 3 70 12 60h. - • ICB• AA • 70s A AAAA A 144• 4
50 1. 4 174 4 4 4 4 • 4 8 60 . &BCC 0 33 0 56 70. fc•CC8 80 s • • 4 4 E• 80s • • • • Re70. R• • ARACC• A BOs 0 33 0 5 7 70s 18• 4 80s 4 4 4 • 1 • 0 3 70 13 60 s - - 10 3• 4 4 4 70 . 4 4 4 4 4 • 4 • 4 •
0 3 20 0 2 30 t AA 40 s • AR• RARARA 0 33 0 51 70s 11I 4 80 t • • 4 4 . SOs • • •. A.Ra50% 8M 14 118 14144 9 60s 4 4 08 4 4 • 4 8 • 0 33 0 59 80 0 3 70 14 601 - - 10 13• 4 4 4 70% / Os 110 s 0 33 0 80 CO s 1 70s cth cca cc 80 .
0 370 0 3 10% 40 1. 4 /184 4 1. 4 4 4 8 80 s cor r ic 0 3 70 15 70s - ON 66A 4 A•50 . AA A AA RARAR 513% 0114 11844 4 7/ • 0 33 0 62 0 3 70 16 60 . - 14 • 4 • 70% A AAAAA .44 • •70s 4 4 4 • 4 AAAA A 80% 8 6 4 4 • .. 0 33 0 83 80 ' Ow . 130 s 4 4 4 4 4 4
0 3 20 06 4N - - - r • ARA • • IN 0 330 64 80% r asa. 0 3 70 17 GOs - / 70% AAA AAAAA A A60s BBIBM I AAM / Os 1 4 • 4 03 30 85 ROs ' cu es 80s • 4 4 • 4 4BIN 4 AA • Aa 0 330 66 0 3 70 11 701 f 80s 4 4 4 4 44
0 3 200 6 I 40 . c. scca cc. 0 330 8 7 fl Os ea. 0 3 70 19 60 s 14 4 4 1 / 0. • 4 4.0 4 • RI F •50. .. . . ccr (c r e GOs ccoccccoth 03 30 68 80. - - h et, 80 $ 4 .• 4 • 8 s70% 84 4 4 4 4 4 4 4 4 801 4 • 4 4 4.a. 0 3 7020 60s I 70' F
0 3 200 7 I 40s ccu cca cc 03 40 0 1 50 s n 60 1. 80 s 4 4 • 4 11,50s c at ccc cc t c ea , cga cc , ,e 6 70h 80s 4 4 4 4 4 . 0 3 702 1 60. I 701 F ON 801. 4 4 4 4 4 , 0 1400 2 PO % . 8 4 6 0 , • 4 8 4 • . 8 4 / 4 • 80s 4 4 4 4 4 )
0 3 200 8 401 • 4 4 4 11 501 4 4 4 4 • 64 6414 / Os • 4 4 4 4 8A 4 4 4 SOs AU AA• 0 3 7022 60 .6 - - - - • - 70s F bOs 8888 8A 14 14 701. 0 34 00 3 50 60s 80 s 4 4 A 4 8•80s 4 4 4 4 4 . 70h 80 s AM ol et s 0 3 7023 / 0 s - 14 4 4 4 4 4 4 A 110, • 4 111
0 32 00 9 60s 0 3400 4 60 . s if 4 4 4 4 4 4 4 4 t os A AA AA AAA AR 0 3 70 74 70 s I 8 4 • 4 4 4 4 4 80 , 4 4 4 61150 3 20 12 60s I 70 1 M U U LLI BOs 4 64 4 4 • 0 3 7025 bOs CRAA F 70, I FFF: • :
60 , a l 0 340 0 5 60 , - 84 4 4 4 • 4 4 4 / Os AAA AA AAA AR 80%0 3 20 / 5 60 s 701 11116111181/ 11 80s ARAA • a 0 3 70 28 60s - el s.. 1.4. / Os a ssaw
BUs M a e 0 34 0 08 60 s / 17, 4 4 4 4 44 4 4 4 4 0 3 70 7 7 60, leet a• 04. 70n •••0 3 20 16 70s - 4( I I I I I I I 130 1 M . . RN 4 • 4 4 4 4 0 3 70 28 60, In s t. . / Os aw e.0 32 0 18 I N 11114 14 114 eth I 161 0 3400 7 60I • 4 4 9 / Us 4 4 4 4 8 8 8 4 4 4 0 3 7029 60 s w sastsca • 70 $ basn e.0 32 0 19 70s OPU U M 801 M ow ROs 4 4 .4• 44 0 3 70 30 60, - - 111118 4 4 8 / Os er0 32 0 20 / 0s 14 4 4 40, 0 4 8 60, • 8 8 1A • 0 34 00 1 60 s : 4 185 71h 4 4 4 118 4 4 4 1 0 3 70 33 70s Cl a a 80 4 4 4 4 4 4 .0 37 0 2 3 70s 888 0I I EEE 80. RN 11:81155 0 3 7034 / Us • 00 . h tepe0 32 0 24 R h - . 111114 14 ROs M e n 0 34 0 10 60 8 . 70 . . 4 4 4 • • 4 4 4 0 3 70 35 80 s0 32 0 2 5 70s I M U M 80s M os* ROs 0 4 R4 44. 03 7036 N s - • 4. bow s EIN 4. 4 .0 32 0 26 Oh an. I FF. e. 0 34 0 11 60 s • 4 4 4 Fo s Al 4 4 14 4 848 1 03 703 7 BO. . ..ix0 320 2 7 70s M U M . 80. 111. ... MN 4 114 4 4 e canna sth W I 4. 444.4. 40 32 0 29 10, 0 340 12 00 . • 5 A A 10 4 4 4 4 4 4 4 4 4 4 70, 3.t .ss0 32 0 30 70s 80 . 80s 0 3 7039 10. BOs w e+ 1 .0 32 0 3 1 80, 0 340 13 70, - - 1114 14 4 11 60, 4 0+ r A.
03 4 0 14 IN • 70s A84 4 4 4 4 4 4 4 0 310 0 1 30. -CU ' 401 CC( CCCCC0 33 00 1 70s • N I CCCCCCCCC 80s 4 610 4 . 50 $ CCCCCCCCCC 60 . CCCCCA AA 48
50 . FFCCCCCCLC 60 , CCP A : A 0 340 18 701 o t I AA AI 80 1. 4 4 4 4 4 . 70, RN CCU .11470h t . AAA ! • • 11 034 0 19 / 0 , Ro l 4 4 • 4 8 • 0 38 0 02 PO I A l l a ,
0 330 0 2 30s - - - 41fl U I R AN BRBILI CCCCC 0 35 00 3 50n 4 .6. 4 4 8 4 .4 8 60 . .1 8 4 8 5 5 4 5 8 5
50 % c c c u . c c c u l 6 0 6 84 4 4 4 4 • 4 4 8 0 35 00 1 60 s 70 , n o . 1 70s • A AAAA A AA • BO, 4 4 8 8 8470 s 04 4 4 4 4 4 4 4 11 W s HAARA• 80s 84I Bs 0 311004 70, 50 . ea • A e
0 330 0 3 30 ' K CC 40 1 CI: I CU ( ( ( I: 0 3 500 2 60s eA AAAA 706 4 4 4 0 4 4 I 4 4 0 0 36 0 05 60% . 4 4 4 4 1/ 4 14 4 4 / 0n 4 4 4 4 4 4 4 4 4 E50. RAE 4 81348CC 60 s 8 4 8 4 / 4 1:14 4 8 110 . A AAA• e 80 ,/ Os ACCCCCLCCC 80 s CCCCC' 0 3 500 3 60 , - nA AA 4 4 4 4 4 70s 8 14 A AAAAA A 0 36 00 6 50 . -
A I C C C 60 8 C8 4 4 4 4 4 4 11403 3004 301 AOs c c c c c c r r c c 80 . AN N -A. 70. 5 4 4 • 8 4 5 / 0 1 8 BOs EU
bOs CCCCCHARCI ti l s. CCCCLU CFC 0 3 500 4 60 s 5 AAA * 717. 4 4 4 4 4 4 4 4 4 8 0 31 0 0 7 W s 14 8 • 4 70, AA AAA As AAAN s CCCU CCCCL UN CI I CC. BOs 4 1184 • 11 801 4 4 • 4 4 e
0 33 00 5 50 s - IU CCCCCC 60 • HAAAA RBCCR 0 3 5008 60$ El l e 70 6 /1 5 0 4 4 4 4 4 5 5 0 360 11 501 CC ON L CCCU I88 81170s 60 38 00 08C8 80s 11! ! 1i RN A88 A* * 70. 0 408 660 4 4 4 80 s A AAAL
0 3 300 8 50 . cBCC 60 s 84 4 4 4 4 4 88 8 0 3 500 9 bth I . . 70, AAAAA • • • • 0 36 0 12 501 1 60 . ' • 1111, , ,to. 45 4 A64 4 84 8 80s 4 08 808 0 3 50 10 601 / Os 44 4 4 4 4 4 4 8 1 70 1 80s 4 4 4 • 4 •
0 3 30 0 / 50s 60* c c c c a ta8 70) 80 , 4 1384 4 . 03 60 13 SO% na.g. .d .a. , 70 . n e a te n ,70. 8114 4 4 4 114 4 4 RN 4 * 88 A. 0 350 11 80 s 80 8 4 4 4 4 4 4
0 3 300 6 504 a 60, . . 4. 444. 0 350 12 70s 0 180 14 50 1 r a t a 60% m ccm .0 3 30 09 50s 60 , P a 70 1 8 e / C e 0 3 5 0 7 3 00 1 70, I • 4 4 4 4 4 4 4 13 / Os c : ccc a6m a 80 s EAA AA .
70s 8A 8L 4 4 5 8 8 A 80s 64 /14 6• 80. 4 8 4 4 4 e 0 38 0 15 60s 70s 4 4 4 4 04 4 444 A0 3 30 11 bOs As• • • AAARA 71:4 04 4 4 4 4 4 4 4 4 BN AN
/47. , 134 4 4 4 . 0 360 0 1 20M CC 30 II CCI CU CC 0 38 0 16 50s 70h • A F A H RRA A
0 330 12 60s • 4 4 4 4 4 A M A 70 . 40 . CCCCCCCCCC SO. CCCCCCCCCC 90. se . ,80 * 4 4 4 4 4 , GOs CCCI.C8 4 4 4 0 / Os 1101311ABCCCC 0 38 0 1 7 / Os • 54 4 4 4 4 4 4 4 80 . A * AA A.
0 3 30 13 ON • 4 4 4 4 4 4 4 4 4 70. AA 4 4 4 4 4 4 4 A 80h CCM . 0 380 11 70s - • 4 4 4 4 04 4 4 80 s 4 4 4 4 A•fIN •• • • • R• 03 600 2 60, g Cu RA• RA 70% • • • AAA AA A• 0 33 0 19 70s 484 11 1- - 80 s o
0 33 0 14 60s . 4 4 4 4 4 4 4 4 • 701 4 84 4 4 4 4 4 4 4 80 s 4 4 4 0 4 e 0 31 0 20 70. - 14 4 4 4 4 4 4 4 BOs 4 4 1f • •ON 4 414 4 4 4 0 38 00 3 60s IFCCCOA AAA 70 . 4 4 4 4 4 4 44 4 4 0 1110 2 1 70. - e4 4 4 6 8 • 4 4 BOs
0 330 15 60 . - - A4 4 4 4 4 4 4 / Us • • •• A A A A A 138 80 1 4 4 4 4 4 a 0 38 0 22 / IA - - ICcCA AAA SOB AA AA A 101 AA AALS 0 36 004 60s 8CCI34 70 6 4 4 4 4 4 4 4 4 4 0 36 0 23 80 . n onaan
0 330 16 60s • 4 4 0 ( [ 7 ( 11 70, r r ' CI CCCC RN A8 4 4 A4 0 36 0 24 701 - • ( AAA AA A 130 . 4 4 4 4 4 0K s CCCI - 0 36 00 5 50 1 1CC8 A• A• 701. • • AA AAA AA A 0 36 0 75 50 s 60 . basbam444
0 33 0 17 70 . RN A AARA. 701 sat03 30 16 W s - - 14 4 AM / A 70s /1 /1 /1 1. 1, 1 4 A A P 0 3600 6 60 1 - - 11:13,14 • A• 70 4 4 4 4 4 4 4 4 4 4 0 3110 2 8 70h - - 14 4 4 .4 4 80s
SOs 8 4 4 4 44, BO. 4 4 4 4 4 . omuna 70. .... . .. on, 4 4 4 4 4 403 30 19 60s - - . 4 4 4 4 41 A 70s 4 84 4 4 4 4 4 4 8 0 38 00 7 60 s 1CCI LA AAA A / 0, 4 4 4 4 4 4 4 4 4 4 0 380 29 / 0s * a 80h 4 4 .44 4 4
80s 4 4 4 4 4. BOs A t o t A l e 0 180 30 70. • 110 . 4 4 4 4 4 .0 3 30 20 60 s - - - • A I ELI E / Os 1111418 4 • 4 • • 0 36 00 1 W s FCBCC8 47. 6 .9 I N 4 134 4 • 4 4 4 4 • 0 38 13 1 80 s • •
80 s 4 4 8 4 4 .4 80 $ AAAA N ,0 3 30 2 1 60 s - - 4A AAA M I 70s 6996 9 6 4 4 4 8 0 36 00 9 80s A 70. • 4 4 4 4 . ALA• A 0 39 00 1 BOs U CCCCC 90 . CCCCCCCCCC
80 , 0 4 4 134. PIO % on. caz cccct c •os occcoccccc0 3 30 22 60 $ f • • • • 70s 4 4 4 4 4 4 4 4 4 4 0 360 10 CO s. I A 701 • 4 4 4 4 4 4 4 4 4 7t5 LCC( CCLCCC 301 CCLCCCCCCC
80 s 80 . • • • AFA 40. CCU I I I 1:CC SCh CCCCCCCCCC0 3 30 23 GOs • 4 4 4 4 4 14 70. AM AA AA A AA 03 60 11 tiCh - • f • 70s 4 4 4 4 8 4 4 4 4 4, 60, ceat n-coc 701 CCCCC8 • 4 • •
80 s 4 4 • 4 4 4 00, A 4 4 4 4 . SOs 68 4 44 40 3 30 24 AN • l Os U.80 11, - - • 03 60 12 60 1 A 70 . 4 4 4 4 4 4 4 4 4 4 0 3900 2 70 . IC 401 CCCCr t:( a I:
bOs I I i sA .A• AA• / Os AB• AAAAAAA 80 . 4 8 4 4 44 50 . CCCCCCCCCC 60 . CCCCCCCCCC80 , 4 4 414 4 o 0 360 13 EN / N TFEEEM IF 706 CCCCCCCCCC 80 . CCCCCI
0 33 0 25 60 , / Os 4 4 . 1607 • • 1 BM 11111) 0 39 00 3 60 s - • AM EU I 70s • LI ALU U L0 31 0 26 / Os - 'CCLO CCC 11436 CC ( ( F. 0 36 0 15 70s - - ./ 4 84 4 4 6 4 RN 4 4 4 134 . aos M t n'0 33 0 2 7 60 , A M 70 . RP 4 4 4 4 4 4 • A 0 36 0 16 70s n it o n n 0 39 0 04 30. • EE A 40 8 A A/ 7 i / UM
801 ABBAA . 0 36 0 17 701 BOs ba• 50., 11,.1( 4 4 4 4 A oN • •• • • EAM E
0 330 28 601 70 . 4 14 4 4 4 4 4 4 4 70 1 I ( 8 W a g 80 s f f • I F&Os ABAA A. 0 3 700 1 50 . e 4 A 8 4 .4 714 4 A 60s .6. 4 • 4 4 4 4 • 8 ,1 0 390 05 30s
0 330 29 60 s . 4 4 1• 70$ 4 ( 11 4 4 / 118 4 70 . A A AAAAA A A• BOs 4 4 4 4 • • 50 % nOs • • •/14 14 1480 s • A AA Re 0 3 70 02 I )l s F I CCC.: LC 40, ( 48CCCU CC 70 , 6114 116• 16 f la s Ai 1 .c t
0 33 0 30 60 . 709 518, (.1111L CRI CRR fAh liRMI IFIRRA• 0 390 0 6 50 , • 4 4 4 4 4 4 A AA 60 s 4 4 4 414 4 4 4 4 4R ), 8 1 Ws 8 4 4 4 4 4 4 4 4 A MN 4 4 4 8 • • 70 , 4 84 4 4 4 4 4 4 4 80 . A 4 4 4 • •
0 33 03 1 70, - 64 4 114 4 114 4 80 . 4 4 4 4 1. 0 3 700 3 An . - - .CCCCCr r AN CCCCGCCC: c 03 90 0 7 %C. - - 6 11 8 / 0 1 A P A 60 , A4 4 4 4 4 4 4, 4 403 30 32 60s AAAA 70s 4 4 4 4 4 4 4 4 4 8 50. CCCCCCCCCC 60 CC: CC/ 14 4 4 4 / Os AAAAA 4 4 4 4 4 80 . 8 4 8 4 4 .
LIN 4 4 4 4 4 4 70o 4 4 4 4 4 4 4 4 4 4 60% 8 8 4 4 4 4 03 9006 50 8 1. . .. CCCCC 601 CCCCCCCCCC0 33 03 3 70. ROs • 4 4 4 4 8 70s C.CCCCCI CCC 80 , CCCCCI

156 H Y D R O L O G I C A L D A T A : 1 9 8 4
Si n O• uspad da dy Ansv s . 5 I n Gassg • d da ft Bow s . S In N u f& d 0 • 01y 19/ 4 -1-
n u mb . / mOn I m• Pesk y • nd ra•n/ O tn. enb e r mo n t hly 8.44414 an d ra tn Is4 nu mb s/ /mon th ly pa l s a nd ru nt all
0 3 9 00 9 60 s CCCCC9 A 4 4 1) 0 4 0 0 12 69' s - - - - A A A AA A 70 , 4 4 4 4 4 A A A AA 04 3 0 2 1 70 s - - 6 118 4.13 SN bbo -CC.
701 . Ct. ..:GCI ' • ! I 80 $ I I ! 80 s • • • • Ae
0 3 90 10 50 s - - • 4 4 4 A A • A 60 . 4 4 4 4 4 4 4 4 4 4 04 00 13 • 0 , •C 70., AA AA A A A A A A 04 4 0 0 1 6o47 -9• 4• 6cnne. 70h 4 4 4 4 134 4 4 4 4
70 , A A 4 • 4 4 • 4 4 4 80 , A A A 4 A. BO. A P A A • S 80 . A A A. . .-
0 3 90 1 1 50 1 . - - .-4 A A A A GOs 4 4 4 4.4 4 4 4 4 4 04 0 0 14 70 s r of I F AEI li th 04 LA I 04 40 0 2 700, 4 4 4 4 4 4 4 4 4 A
70 . 4 4 4 4 4 A 4 • A A pAl s AA A A A, 0 4 0 0 15 bl i s l 70 1. ( I. A • 4 • 4 4 4 1 60 s 4 4 4 8 • 4
0 3 9 0 12 50 s - - 14 4 4 60 s A A A A A A A A A A BUs M O E 04 4 0 0 3 60 , CA P P 70 s • 4 4 4 4 119 4 4 4
70 , 4 4 4 4 4 4 4 4 4 A 8.0 1. 4 44 • I n 04 0 0 16 60 1. l Os 4 4 4 4 4 4 • A A A 9 0 . •
0 3 90 1 3 40 ,. a n n . . Nth 4 4 4 4 4 . 04 4 0 34 / 0 1. 4.4 4 4 4 8 4 4 4 9
50 s oun .s4 4 4 • 4 60 s. A A A A A A A A A A 0 40 0 1 7 70s - -31 AU S8 OI 9 0, . 81 19 1 46 ) 814 4 4 . •
70 , 4 4 4 4 4 4 4 4 1 4 8 0s 4 4 4 4 4 . 04 00 1 8 60 s - ! I / / Os 46 4 4 4 4 4 4 8 6 0 4 4 00 6 t t I F / 0 4 4 4 4 4 8 4 4 4 4
0 39 0 14 640, 4 4 4 4 4 4 4 4 4 4 90 s t l i a r 80 4 4 4 4 4 1670 s 4 4 4 4 A A A A A A BOs 4 4 4 4 4 9 04 0 0 2 0 80 . FE 4 1- 1 0 44 0 0 8
0 3 9 0 15 60 • - - - . 4 4 4 4 4 4 70 1. 8 4 4 4 4 4 4 110 1 04 00 2 1 70 , M AI 94h :XX X 04 4 0 0 9 70 5 es+. 9O. . 34 4 E5
no, 8 4 4 4 4 9 04 0 0 2 2 MN i i i r •
0 3 90 16 60 $ e 4 4 4 4 4 4 4 4 73s. A A A A A AA A A A 0 40 0 2 3 n aa a 9 0 4 no n 0 4 50 0 1 !Os 44 4 4 6 0, A A A A A A A A A A
80 . 4 4 4 4 4 6 0 40 0 2 4 70 s a0, E I - 1 /0, 4 4 4 • 4 414 4 4 4 40 a. 4 4 4 4 4 4 .
0 3 90 1 7 60 , - t A 6 A A 6 6 : 70 . Cr .CCCCC( CC 0 4 50 0 2 60 4 r 4 4 4 4 4 4 4 6 70 1. 4 4 4 4 4 4 4 4 4 4
8 0 4 se . I I 04 10 0 1 SC. . 4 . 44 4 4 4 4 50 , 4 4 • 4 . 4 4 8 4 4 30 , 4 4 4 4 4 .
0 3 9 0 18 64) - - . 4 4 4 4 4 4 4 70 1. 4 4 4 4 4 4 4 4 11. 70s 4 4 4 8 4 4 4 4 1, 4 90 . 4 4 4 4 4 . 04 50 0 3 60 1. - 9 4 • 4 4 4 4 4 / N 4 4 4 4 4 4 4 4 4 4
60 . CI 04 100 2 50 , - r -1. 4 4 4 4 4 4 60 s 4 4 4 4 4 4 4 4 • 4 BOs • 4 4 4 4 /
0 3 90 19 60 , . 8 4 4 4 4 4 4 / 0 1 4 4 4 4 4 4 4 4 4 4 117, 4 4 4 114 4 4 4 4 • 809 4 0 40 4 5 04 50 0 4 60 s - - - • 4 4 4 4 4 / 4s 4 4 4 8 4 4 4 4 4 4
80 1 4 4 4 4 4 , 04 10 0 3 50 s 600, 4 4 4 4 4 4 4 4 4 4 440, AA A 4 4 1
0 3 90 2 0 60 s - - 94 4 4 • 4 4 / 0 . 4 4 4 4 4 4 4 4 4 4 7() 4.4 4 4 4 4 4 4 4 4 80 , 0 4 8 4 1) . 0 4 50 0 5 6<) - e 4 4 4 4 4 4 70 8 4 4 4 4 4 4 8 4 4
80 s • • • • • 04 10 0 4 Sth w • • • 6 0 $ 4. 4 44 4 4 4 4 4 60 s 4 4 4 4 4 .
0 3 9 0 2 1 nn s I A A A A 70 , 4 4 4 4 4 • 4 4 4 4 / 0 1 8 890 4 4 4 4 4 1. 90 1 9 GE C 0 4 50 0 6
40 , 4 4 4 4 4 4 04 10 05 ( 0 s 44 4 4 4 4 4 4 4 4 70 . 4 4 4 4 4 4 A 4 4 • 04 50 0 8 70 $ _ _ , • / 4 4 4 4 4 40 1 4 4 4 4 4 .
0 3 90 2 2 60 s e4 4 4 .4 / 0 s 8 4 4 4 8 4 4 4 5 4 110 . 4 4 00 4 • 04 50 0 9 80 * a s. .
Rth A AA A A. 0 4 10 0 4 60 s - e134 4 4 4 l a, 4 4 4 4 4 4 4 4 4 4
0 3 9 0 2 3 70' 4 4 4 4 4.4 4 4 4 4 130 , 4 4 4 8 4 . 04 4 0 0 1 60 s
80 s A A A A Ae 04 10 0 9 SDI I' ON cscom t ec Bo. 111• •
0 3 9 0 24 !..0 , - . r a .. 9.4 4 4 60 , A 4 4 6 4 4 4 4 4 4 / Us 0 7 7 0 0 0 81, • 0 4 40 0 2 50 . • 4 4 4 60 1 AA A A A A A A A A
/ O. 4 4 4 4 4 4 4 4 1 SO, - I I 04 10 10 60 * rt • F ADU A A 70 1. ARE D00 0 0 114 70 1. A • • 4 4 4 4.4.4 4 00 s 4 4 • 4 4 .
0 3 90 2 5 60 , • 4 4 70. 4 4 4 4 8 8 4 5 .54 80 % 0 1 / 4 0 .1 0 4 6 00 3 SOs . 4 60 s. 8 4 4 4 4 4 4 4 4 4
ROs • 8 .44 4 . 0 4 10 1 1 ON FA A A / 0.• 4 4 4 4 4 4 4 4 4 4 70-1. A A 4 4 4 4 4 4 4 A 84) 4 4 4 4 4 1
0 3 90 2 6 bt h w ea 70 $ • 4 4 4 4 4 4 4 4 4 Bth 04: 4 4 4 . 0 4 430 04 l Os • • I t i • • n t
BO, A A A A A• 04 10 12 1441 I CA 8 70 , 4 4 4 4 4 4 4 0 4 4
0 3 90 2 7 60 , . 8 / 0 , 4 • 4 • 4 4 • 4 4 4 80 s 7O • 4 0 • 04 4 00 5 60 s 84 4 4 4 4 70 4 4 4 4 4 4 4 4 • 4
*Q . 4 4 4 4 4 . 04 10 13 10 , .4 • • • • • • • • 60 1. .. .. . / .4 4 4 4 4 PA) 4 4 4 4 4 . -
0 3 9 0 2 8 CO * : A 70 , 4 4 4 4 4 4 4 4 4 A / Os 4 8 4 4 4 4 4 4 4 4 90 , 10 4 14 4 04 60 0 8 70 s - - - a n s . FICn . 4 4 4 4 9
410 , A A A A A . 04 10 14 70, . 4 4 4 4 4 4 0 4 0 0 0.6 4 4 4 4 4 . 04 8 0 0 7 70 . • n4 4 4 4 4 4 4 8 0. 4 /
0 3 90 2 9 I D * 4 4 4 4 4 . 4 4 4 4 04 10 1 5 70 , 4 4 4 (10 4 4 7 30 0 4 6 0 0 8 / 0 s - won -an i s 8 0s a/
SC• 4 4 4 4 4 . 40 s 0 4 • 4 4 ..
0 3 90 3 0 717, 1. 4 4 4 4 4 4 4 A • 90 .• A AA A A . 04 10 16 10 1 AN 0 4 70 0 1 541 w A A A 60 1. 4 4 • 4 4 4 11 11
0 3 90 3 1 60 s • a s 70 s an s aa n a • 50 , . 60 s 70 s A A A A A 4 .• • • • Wi t 4 4 4 4 4 9
80 . 4 4 4 1 1 70 , 4 4 4 4 4 4 4 4 4 0 130 s 4 4 4 4 4 . 0 4 70 0 2 544, • . a. 60 s 16 • • A , AAAA
0 3 9 0 3 2 / Us an n u m 04 10 1 7 a / Us • • 641 1444 1 10 . . . . .
SU. A A A I / so, 4 8 4 4 4 . 04 70 0 3 soh ..b. GOs -
0 3 90 3 3 50 1 - - • • • • • • ss 10 . a . m . . 041018 I D* . 4 6 4 4 4 1:14 • 4 704 Iw u rAmsc• 4 4 4 4 4 . 60 4 0 4 4 4 0 . 0 4 70 04 CO . - • 4 4 1 A I A 70 s 4 4 4 4 4 4 4 4 4 4
0 3 90 34 70 , n4 4 4 4 4 4 4 4 4 mos A A A A A r 04 10 19 I n a • • • • • • • • •• RN 4 4 4 0 4 . 800, 4 4 4 4 4 $
0 3 90 3 5 60 4 r ; 70 , A A A / . 4 4 • 4 4.4 0 4 1 0 2 0 60 s • 70 1. 44.94 • 4 4 4 4 4 0 4 / 0 0 5 GOs e 4 4 8 4 4 4 70 s AR M - FA
HO, 8 4 4 4 4 9 80 , 4 4 4 0 4 e .114 A I
0 3 9 0 3 6 60 4 70h . .. . . . . /4 . / .1 04 10 2 1 60 $ / 0 . oB AB A A RRI C 0 4 70 0 6 60 s • 4 4 1 44 1 / Las I l l - 14 • • (
1140, A A A A A • 110s 4 4 111) 8. Rth A I
0 3 90 3 7 70 s I A 4 4 4 • 4 4 80 * 4 4 4 4 4 a 0 4 10 2 2 70 , CAA A • • 0 0 0 :7 140 . A CIA A Ae 0 4 70 0 7 60 s • A A A RA A / th 4 4 11 4 4 4 4 4 4
0 3 9 0 38 t Cs. • • 70s ..14 .. 4. . • • • 0 4 10 2 3 70 , 18 11C 9 3470 8 3 80 , RRI FI r 80 , 4 4 4 4 4 0
EN 4 4 15 6,, 0 4 10 2 4 70 . - 14 4 4 • 4 9 9 4 4 0 s U A AA A • 0 4 70 0 8 60 s - - - s 70 . 4 4 4 4 4 4 4 4 4 4
0 39 0 4 0 70, - 0 4 4 4 4 4 4 4 80 5 4 8 4 4 4 . 0 4 10 2 5 70 1 1 4 4 4 4 4 4 3 4 80 , 0 4 4 4 4 , 80 s 4 4 4 4 4 .
0 3 9 04 2 / 4)s - - 1 4 4 4 4 4 4 4 80 $ 4 4 4 4 4 . 04 10 2 6 ,0 , - I 4 4 4 4 4 4 4 4 80 s 4 4 4 4 4 e 0 4 70 0 9 60 , 1 70 1. • 4 4 4 4 .44 4 4 9
0 3 9 04 3 SO, - - n. . . . 4 4 4 70 , A A A 4 4 4 4 4 4 4 0 4 10 2 7 /co - - • A A A AA DO FI th . 4 4 8 4 4 . an • 4 4 4 4 4 .
90 , 4 4 4 4 4 e 0 4 10 2 8 6 0. - - t n . . . I ON . 4 4 4 4 4 4 4 4 0 0 4 70 10 70, - 114 4 4 4 4 4 4 8 0s 4 4 4 4 1
0 3 90 44 / 0 • - - 0 4 4 4 4 • 4 4 4 0 , 4 4 4 4 18 90 s 0 8 0 0 0* 0 4 70 1 1 / 4) - 9. 4 4 4 4 4 8 8 8 80 , A I
0 3 90 4 6 : 0 , t ac t . .., 807 " 1 /Es 0 4 10 2 9 60 s e/ e 0 4 70 13 70s Sth 4 4 4 4 4 .
0 3 9 04 9 70 , 0 1 r • •1 80 s 4 130( 0 8 0 4 70 14 90 s N o.
0 3 90 5 1 GOs 44 70 . 4 4 4 4 4 4 4 4 4 4 04 2 00 1 50 , ft ocsccon 60 , OCCC7./ .C4 : t
EIN 4 4 18 4 , 70. . 1:111 0 81 4 4 4 00 s 4 804 4 , 04 800 1 50 5 60 s 4 4 4 4 74 • 818
0 390 52 Sa s 845/ 04 20 0 2 507 ' 651 . I I 70n 4 4 4 4 4 4 4 4 4 4 80 ,
70 1. • • • • • • • • • • 9 0, A A A A A. 0 4 8 0 0 2 60 , - #0 . 4 4 4 4 4 4 70, 4 4 4 4 44 !
0 39 0 6 3 be • - • • • • • • • • • 70, .. . an u s 0 4 2 00 3 60 8 ICCCCOCOCC M s CCCCCCII 4 4 4 0 4 8 0 0 3 8 4) - • 4 74 .
8 3s A A 5 4 4 8 BUs 0 4 4 4 4 e 0 4 8 00 4 • 70 , 4 4 4 4 4 4 4 4 4 (
0 3 9 0 5 4 6 0. - . 4 4 4 4 4 4 4 4 / O4 4 4 4 4 4 8 4 4 4 4 04 2 0 0 4 50 , Id : W s. C0 00 0 C6 0 7 0 90 . 4 4 4 • 4 3
90 , A 4 4 4 4 ./ 70 1. f../..:COI C/ CC( ' 00 1. 97 <7 84 04 60 0 5 60 s FA 70 , 4 4 4 4 4 4 4 4 4 4
0 3 90 5 5 90 s a AD 04 20 0 5 60 5 0 7C170 00 0C 801 4 • 4 4 4.:.
0 3 90 54 9 0 s t o - I 70, coccr l co 9 80 $ / CM 0 44 0 04 60 , A A A I A 70 % 4 4 4 4 • 4 6 4 4 4
0 3 9 0 5 7 80 s r e 04 2 00 8 544, IC ON : :C.: 4:CCO LC C 8 0s. 4 4 4 4 4 7
0 3 90 5 8 8 0 , r. - - ' / Os CCCCCOA• • • BO. 4 4 4 4 4 4 04 80 0 7 844) 04 70 s 4 • 4 4 4 4 4 4 4 A
0 39 08 8 711. - • 4 4 4 4 1 1( A 40 . 4 8 4 5 4 . 0 4 2 00 7 F 70 . 3C0 1 ' 7 4 4 4 4 SW 4 4 4 4 4 9
0 3 9 0 6 9 70% - - . .41 184 AA 0 15 4 4 4 4 4 9 BO, 8 3 4.4 4 . 04 8 00 9 70 . : 1 8 4 4 A A A A A 90 .
0 3 90 7 1 BOs • • • stet 04 2 0 0 8 70 s FM :0 9 4 4 4 D 8 0 , 4 4 4 4 4 n 0 4 60 1 0 70 , 1( 8 4 8 4 4 4 4 H ) 4 4 4 4 4 a
0 3 9 0 72 / Os 80 1. o r er 04 2 00 9 70 . 1/4 . sc b. .. / 8 01 8 4 4 8 4 4, 04 8 0 1 1 70 s . 4 4 4 4 4 4 4 40 4 4 .• 8 • 1
0 3 90 73 70 s • AN ... . . .. . 04 20 10 SO, Ic 60 s
0 3 9 0 74 8 0. N s cc< CCSba Se ROI :0C7Cc 0 4 9 00 1 OD * 70 s 4 8 4 4 4 4 4 8 4 4
0 3 90 75 8 0 s r au se 0 4 2 0 1 1 70 . - 1/4 : 1* * * * * 80 . A AA A A• 4 0 , 4 4 4 • 4 s
0 3 9 0 76 70, - - - . BO. • •• • • e 0 4 2 0 1 2 70 s 84 44 8 0 BO, CCCCC/ 0 4 9 00 2 50 , - I l l &Os I I I • • ! 11EA
0 3 9 0 7 7 Rth • • • • • • 0 4 2 0 1 3 8 0 , 70 s 4 4 4 4 • 4 4 4 4 4 4 0 , 4 4 4 4 4 a
0 3 90 78 70 1. 80 1. . .. . . .s. 0 4 2 0 14 I N 8 0. . 4 .11• 41 04 900 3 130 . 454 70. ABE
0 390 8 1 70 5 - • RN 4 4. 4 4 . 0 4 2 0 113 / 4s 4 11' 00 1 8 0, 4 4 4 4 4 1
0 3 9 0 8 5 30 s 0 4 2 0 1 9 70 . 0 4 90 0 4 60 - 1 70' 4 4 8 4 4 4 4 8 4 4
5 0 6 64) • 0 4 2 0 2 1 70 s BOs •• • 80 , 4 4 4 4 4 4
0 3 9 0 8 6 70, on s• BOs • • • • • •
0 3 9 0 8 7 70 s 80 • 14 • 4 4 . 04 30 0 1 40 -s • 4 4 4 4 4 • 111 70 , 0 5 00 0 1 SOs 4 60 s 4 4 4 4 4 4 4 4 4 8
0 3 90 88 / 0 s BOs • 4 4 8 4 4 04 300 3 60, 70, 4 4 4 4 4 4 13 4 4 4 70* 4 4 4 4 4 4 4 4 4 4 80 , 4 4 4 4 4 ..
0 3 90 8 9 ROs 8 1) 465064 0 50 0 0 2 60 - 94 4 8 4 4.4 4 70 s
0 3 9 0 9 1 RN 0 4 30 0 4 60 s 70 s 4 8 4 4 4 E4 4 4 4 80 , 4 4 4 4 4 .
0 3 90 9 7 Ig h 80 5 BEI M 05 0 00 3 60. I I I 70. AAAAA
04 30 0 5 60 s - ( * A A A ?Ps A A • 4 4 4 4 4 4 4 80 , 5. - 11
0 400 0 1 50s - - 14 4 4 4 4 4 60 s A A A A A A A L - I 801 4 4 8 • 4 4 0 5000 4 och ' A II 0 , A A A A A A I I . •
70 , 90 1 r • 0 4 3 0 0 6 60 s 70 4 4 4 4 4 4 4 4 4 4 4
04 00 0 2 4.0 1 94 4 4 60 , 4 4 4 4 4 4 4 4 ( A 80 s 4 8 4 4 4 .70 . 6 9 4 4 4 9 4 - • SI) I I 0 4 30 0 / 70 4 - •4 4 4 4 4 4 4 60 * 4 4 4 4 4 4 0 5 100 1 64). A A A 70 1. 4 4 8 4 4 A A A A A
0 4 0 00 3 50, 44 4 4 60 , 4 4 4 4 4 131 U 7 0 4 3 00 6 60 s A A A 70 1 4 4 9 4 4 4 4 4 4 4. 4 0, 4 4 4 14.
1th 1 / CFCCCCCO 80 5 BOBA A ! BOs 4.4 10 4 . 0 5 100 2 SOs
0 4 00 0 4 60 5 - - 4 4 4 • 0 4 8 / 0 s 4 4 4 4 4 1 4 4.4 8 04 10 09 60 I A 70 . 4 4 4 4 4 4 4 8 4 A
SU, 1 AA CCe ea 4 4 8 4 4 . 0 5 2 0 0 1 Sth • • • 60 s . .. .. ... 6 4 44 I
04 0 0 0 5 50 s - - • . 4 60 s 4 4 4 4 • 4 4 4 9 9 0 4 30 10 440 . 70-• 44 4 4 4 4 8 0 4 4
/ 0 s 4 4 ( 1 4) 4 4 4 7 80 $ 4.4 .4 4 4 0 5 2 00 2 sp• • 4 64) . 4 4 4 4 4 4 4 4 0-
0 4 00 0 6 50 s - 60 s • 4 4 4.4 4 4 9 8 13 0 4 3 0 1 1 / Os I.• / Us I I I
70 , 4 4 8 1 4 14 1( 1 80 $ 81 1 71 0 4 3 0 12 60 8 - I I l e f 414 • 4 8 4 94 4 0 6 20 0 3 6 0 s 64 4 4 4 4 4 0 4. / 0 s 4 4 4 4 4 A A A A A
0 4 0 00 7 60 * • 8 4 4 • 8 11 1.14 70 . 4 4 4 4 4 4 4 4 4 1 60 1 4 4 4 6 4 6 80 $ 44 4 4 4 .
RN ( ( 4 10 . 0 4 30 13 60 1 70 , 110 4 9 11114 4 4 0 5 2 00 4 60 $ - - . 4 4 4 4 4 4 4 I N 4 4 4 4 4 4 4 4 4 4
04 00 138 60 • of 4 4 4 4 0 4 70 , A A A A& 4 4 1 1 80 5 0 14 1 80 , 4 4 4 4 4 .
00 • 4 4 0 4 4 , 0 4 3 0 14 60 s I n t 70 . • ( 4 4 4 4 4 4 4 4 0 5 2 00 5 KOs - 1 4 4 4 4 4 4 4 4 70 , 4 4 4 4 4 4 4 4 4 4
04 0 0 0 9 60 , - . 4 6546 4 4 8 4 71). 4 4 4 4 ( 4 8 3 8 8 60 , 4 4 4 4 4 9 80 , 4 4 4 8 4 1
BO, 8 4 4 4 4 . 0 4 3 0 1 5 70, 0 5 2 00 6 60 t - - • • 4 4 .44 4 70s A A A A A A A A A A
0 4 00 10 60 . - .4 4 4 4 4 4 0 4 70 s 4 4 E8 ( 4 I 4 04 0 4 30 1 7 70 s 41 4 • 4 4 4 4 4 .4 80 * 4 8 8 8 4 •
80 s 00 4 8 4 9 80 , 8 4 4 1 4 . 0 5 2 00 7 60 s • 4 4 4 70 1 4 4 4 4 4 418 4 8 4
04 00 1 1 60 s 70 s 4 4 4 4 4 6 4 6 4 4 04 30 18 8 0. • 4 4 4 4 .. 90 s 4 4 4 4 4 9 .
RN F14 0 0 4 • 04 30 19 / Os - - 9. 4 8 4 4 4 4 60 . 4 4 9 4 4 7 0 5 2 00 3 bth • A A A AA A A 1 !

SU M M A R Y O F A R C H I V E D D A T A - 1 157
S in C r a p s? 6 S e Ae on .
n e t . . n a il * p s • k s rassd r ea lGau ge d & a y fl e w s .
N e e r ma n * pe a ks e nd Dr a wlSi n G oo s e da y /b e tnso nb e r erc a th 1v y ea s an d ra nt s
0 5 7 00 9 60 s 70 . 0 54 0 44 70 . I 80 s 0 5 6 0 10 W s • 70 . •• • • • • • • ••
80 6 ARBA A• 0 54 0 4 5 Rh - . - 74 4 • 4 4 1 40 . so
05 20 10 60 . 70 s 0 5 4 04 4 70 s ma m a 8 0 . • • • • 1 0 56 0 1 1 70 s 4 :6 4 . :). A 4A::K os 4 4 4 4 4 4 0 5 40 4 7 / Os - lb w
0 5 7 0 1 1 60 . • • • • • / Os 4 4 .11A 0 54 0 4 8 70 s sa w 1108° : - ” i • A.AWE'0 54 0 12 70 a AM 110 6 •0 5 6 0 13 70 s 80 . • • • • • ••
80 s 4 4 4 4 0 e 0 54 0 4 9 /O s - - - - - - • - - • 10 .
0 5 70 14 60 . 4 • 70s 4 4 4 .47117 1 : 0 54 0 5 1 70. •0 5 4 0 14 70 s • MT • • 410 5 6 0 15 70 s - - Ol EA• Af 4 0 . • .o. : ,
U80 . ' s . . 0 5 4 0 5 3 / Os - If • • • 1 - • 1) 13s
/a
0 5 40 14 70. • 110 s *a
0 5 20 1 5 70 a F 110 s t 0 54 0 54 70* F4 4 4 1 110 . i t 0 5 60 1 7 70 s •
0 5 20 1 8 70 s I 60 . • • • • • • 0 5 4 0 5 5 0 5 40 18 1110 0 • •
0 5 20 1 7 7170 - - - EFf 1111 0 54 0 56 70s • Ef f f 1
0 5 7 0 20 t O s Ico t 70 s cc c I l AA • A : 0 5 4 0 5 7 M s - rca t t ra ss 8 36 . . . . . . 0 5 700 1 30 4 n CEI W s • •
0 64 0 511 70 s - au gst a 50 s - - • • • • 11• • • 60 s F •
0 5 30 0 1 50 s fO s 0 54 05 9 / Os - - •• •5 4 E A 70 . • • • • o : I t :lAI•i i70 . • AAEA AA •0 5 .4040 70 . • • •0 • • •• 0 5 7P s Cr 0 0 2 30 s - • •• • •• • • •
40 50 g • • 0 13 • • 11• • • 60 •9 3:0 5 30 0 2 50 s 60 6 0 54 0 5 1 / 0 s 40 4 4?Os 110 . • • • •• • 0 5 40 6 5 70 s - - - FA• 131• 6 70 1. MI A... m i n
i i :0 5 30 0 3 40 . 50 s a cb • 0 54 0 6 7 • • • • • e°707. A A oA I : r r e
60 s / Os o t t i o u t 0 54 0 680 5 70 0 3 60 a
110 . : 1 0 54 0 6 90 3 20 04
Do • • • 60 . 4 ( 0
0 5 30 0 4 SOs 60 s 0 54 0 8 0 70 s 8 0 s •• • • 70 s
sit s U M
80 s AA ACC•
70 . 80 s 0 54 0 8 1 10 . I BA BO, 0 5 70 0 5 70.
0 5 30 3 5 6 0 s / O. 0 54 0 8 3 70 s 80 s •• •• 0 5 70 0 6 70 s 110 s • • • 13Cc110 . I O f f*
W s • • • • 0 5 40 114 70, •• 110 . •• • • 0 5 70 0 7 70 .• •0 5 3 00 8 60 4 / Os 0 54 C4 5 ?Os • 80 s n u 0 5 700 8 70 s
80 a • • • CC•
80 . • 80 a ta u • • • • •
110 . • • • • • •
0 5 40 8 4 70s 0 5 700 9 / Os 80 . • • • CC.
0 5 3 7 60 s - • • • 8 - - - - - / Os 0 5 4 0 8 7 80 s s ee 0 5 70 10 70 10 0 13.0s f • • CC•
60 s 54 0 8 8 70 . SOs e ra s W s •
0 5 3 00 8 60 s 70 . 'ea
54 0 9 0 7C• - et 14 14 . •ad . . 50 • 0 ° : " . . .
0 5 70 1 1 70 . • • • •0 5 70 12 70 s ea t 80 .
54 09 1 / Ds •80 s • • •
0 5 30 09 60 s • • • • / Os 5 40 9 2 70s fl a n s 110 s s u es0 5 70 14 70 4 0 5 70 15 70 s s o BO. a li • CC.•
110 . • • • • 4 4 8 0 s w e
110 . 54 1 1 1MAL V :. 0 5 70 16 70 4 • BM • • •C a
0 5 30 1 3 70 s 0 5 30 14 70. 5 50 0 1 30 s 0 5 8 00 1 60 s 70 s
0 5 3 0 1 5 70 s 50 s 6 0 . 80 . • 4 4 • 0 0•• • • b 80 s EBAFC.
0 50 5 3 0 18 717. 70 . A. • I t
3(11 7 70 s 0 5 50 0 2 30 s • •• • • 40 s 0 5 8 0 0 2 70 s 80 . • • • • • • : • :0 5 80 0 3 60 1 - - • • • E 1 t o 70 . 1: 1111:
0 5 3 0 18 60 . • 70. 50 . AA AA AA • • • • 6 0 s AA 0 5 80 0 5 70 s
0 6 50 0 380 1 70. CCCB A AA AA A SCR • AACCC o5t ooe 70 1
0 5 30 19 60 . • 70 s • 40 s 0 5 8 00 7 70 1 8: ii . I LEA AAA 8AACAF FCA: ssaw ada s •
80 . * AA A. . SA 60 s
0 5 50 0 4 3 0 t • • • 4 0s 0 58 0 10 70 . 0 5 30 2 0 60 6 • • 70 s n a cs au s . 70s • • • • B A AA AA 80 s AE• 0 5 60 0 9 70 1
0 58 00 8 70 . 1 80° 10 1 .4.148}4 CFL .
BO. • • • • •• • • • • •0 53 0 2 2 70 s SO. • • • • E SO. • • • • • • • • • 60 s 4 • 4 1 • u s 81tg 's se !. tf1Ct Cc
0 5 30 2 3 ?Os t an BOs a • • • • • / IN A A A A AA A AA A W s I f H l0 5 8 0 1 1 70 s
0 5 30 2 4 70 s a. 80 1 • 4 • 4 4 • 0 5 50 0 5 30 . • 8 4 4 0 s 0 5 90 0 1 50 1 O A W s
0 5 30 2 5 80 . • • • • • • So. AA A AA AA AA A 6 0s • • • 1 • A• • • • 70s • 1• MC • • • • • 130 . D• • • •6•
80 s 04 4 4 440 5 30 2 8 70 s - 70 s 0 5 6 00 2 60 . • AI 70. AM I E6 6 6 6
0 5 3 0 2 8 110s 0 5 5 0 0 0 00 . cc 10. cc . ? . . . . CC 80 . • I• ACC.
70 s CCCi CCCCCC 30 1 CCCCCII • • • •
0 54 00 1 70 s - . CCCCCCCC 30$ CCU I FCCCC 40 . 4 4 4 4 4 8 4 4 4 .. 50 . • • • • • • • • • 0 6 0 00 1 3 13s • • 60 . • • • • • • • • •
40 s CCCCCCCCCC 50 . CCCCCCCCCC 60 s • • • • • • • • • • W s A AA AA AA RCC 70 6 • • • • • • • • • • liDs A( •
6 0. CCCCCCCCCC 70. CCA• A ASA AA 80 1 ECU < AA 40 . 0 6 00 0 2 6 0 s - . AA • • • • E• 711s E• • • • • • Al l
130 s 0 5 50 0 7 30 s00 . EBAFCC0 5 4 0 0 2 301 5 * A 4 0 s • • • • • • • • BC 50 1 • • • • • AA AA A 60 1 A A• c • • • • A A 0 6 00 0 3 6 0 1 E• • • • 70s AFF• • • AAA .%
50 s CCCCA • • • • • 60 s * 4 4 • 4 4 4 4 • 4 701 CCCCCCCCCC 80 s CAACCc 80 s
70 1 80 3 • 13 • 0 • 4 • BOs • • • • • • 0 5 50 0 8 SO. - • • • • • EC•A 6 11. A AA E • • • 11 • 0 6 00 0 4 60 a 70s Ff • • • • • • •
0 5 40 0 3 20 s c i cc oc cri c ._ 30s cc i rcc i DA• 70s • • • • • 17• • • • 80 6 80 1
40 s BA A• • • • • AA 50 . • • • • • • 8 4 A A 0 5 50 0 9 AOs • • 5 0 s • • • • • • • • • • 0 80 0 0 5
50 ,
70 . F• • • • • • • • •
60 s 4 4 8/38 AA AA A 70s BCCCCCCA AL 6 0 . A AM / Us M i t r 1 1 r 110 . • • ACC•
130s 4 0 4 00 e 0 5 50 1030 3 • • •
• - • • • • • 60 s A AA( AA AA AA 0 80 0 0 6 130 . i f / Os U M.L * 4 4 4 .4
0 54 0 0 4 50 s fCB• • • • • 60 s 70 s AA AA A A Al • A I30 s EFF • iB° .
• • • CC•
470 s 8 1 • • • • • E 130 s • • • • •• 0 5 50 1 1 50 . • 6 0 . A AA AA • • • • • 0 6 0 0177 & D • 70 s AA A AA A • • • •
0 5 40 0 5 SOs 60 . • • • • • • • • • •
/ Os • • A • • • 11• • • BO. AB/ i A 80 . • • • CC•
70 s 8 1304 • 4 114 4 • 80 . • • • • • • 0 5 50 12 60 s • • • • / Os 0 6 0 00 8 8 0 s
0 54 0 0 6 50 s . - t11• • • • • 60 . AA A* AA AA A A 80 s 04 00 09 70 s
70$ FIC11• • • 11.13• 8 80 s • • • • • • 0 5 50 13 60 s 70 , 0 6 0 0 10 71) .
0 5 4 00 7 50 s • • • 60 . AA AA AA AAA • 130 s 0 6 0 0 1 2 70 s - • • 111. AL L• 81110) ,80 : F. Int El i tCa
704 K U • • • • 70 s 0 8 8 • • • 40 s • • • 4 1 0 5 5 0 14 60 s 0 6 00 1 3 70 o - I F A 1
0 5 50 15 60 .817. • • • • • •
• • • • 70 . oe l 60 . 70 RD. • • • •h• • • • 60 .
• •• ow • • EAE 8: 0 : l"0 5 4 00 S 50 . AAL i i
I • I I
0 5 40 10 50 . 60 s • • • • AA AA A A0 5 50 16 60 00 .1 EM I" • 70s LAE 0 8 10 0 2 670s OC4 • 118 • • 11 80 . AA/ I r 80 1 1 " " i 70 s
0 54 0 1 1 60 s 70 s CCOABBEIRAR0 5 50 1 7 6150° s. ABCCe c • 70 s 9 4 4 7 f A AA AA 0 8 100 3 Set ABCCe 80 6 • • • • • 70 . •
0 54 0 12 60 s 70 s 14• 0 • 4 11114 • 4 Rers 4 1 DM • • • • • •
110 . 0 5 50 18 60 s • • 70 . 0 4 10 04 / 0 s 80 s • a ct i
0 54 0 1 3 50 s - • 60 . AA AA A • • • 1?. • 8 0 . • • • • • •
/ Os A ABABI18 • Ii F 110 s c o i * 0 5 50 19 70s - - el f AAA : A 04 20 0 1 SOD F 60 e
0 5 40 14 60 s - - fb • • • • • 11 / Os 0 5 50 2 0 70s 70 4 (10s i A a 70 s 0 6 20 0 28 0 4 0 5 5 0 2 1 6 0 4 ?Os - •• • • • • 1 • 1 80 . Ef r
0 54 0 15 60 s C 70s EM EI • • • •6, . 0 . • s • .i t 0 5 50 2 2 : S A" ti c 11s • 70 o • • • • • • • • E 0 4 3 00 1 60 . 7Da 0 5 4 0 16 6 3
70 s s 0 5 50 2 3 A r •E ?Os CCCCCCCCCC
0 6 30 0 2 60 .4 0 . ( A• • • •• •EDa • • A 701 ffit " : " r i t
0 5 4 0 1 7 6 0. 70 s 8 8 AA AA AA A A BO. CA AL A. 8 0 6 * BCC,
BO% AA AA A 0 5 50 2 5 60 s i . t i / Os 0 8 3 00 3 70 .• • •• • • • F• • 1EA 80 s AA • CCI
0 5 50 2 6 60 . 70 4 SOs I t0 5 40 18 60 s e• / Os AA A AA AA A
80 s • •• • • 1 ° mow 6 0 s - - I • • • • EAA 70 4 • I t i F AA or A
0 54 0 19 60 s / Os 80 . 80 . : 11• 4 4 •
DOs 0 5 50 2 7 70s . S A AA AA E r 110 . i 0 64 0 0 2 6 0 e t AI E• 70 s
0 54 0 2 0 60 s 713. 0 5 50 2 8 70, SOs AA ACCC 80 . 4 8 • CCC
130 . 0 5 50 2 9 / Os - - E• AAs aa s 110s EA ACCe 0 84 00 3 6 0 s EI D 70 s W i t AA t
0 54 0 2 1 70. i i 7 t i ROs 0 5 50 30 20 s , CCC 30 s c i ct i e ci rc 0 6 4 00 8 70 1 E • F ! ABOs A • ACCc
0 54 0 2 2 617s AES W s ca c cs u cc 50 s •
70s 4 14 4 • 0 4 1 • 4 80 . • • • • • 6 0s 70 s 0 6 50 0 1 60 , - • • • BA• EAE 70 . 11 11 AAAA A A
0 5 40 2 3 6 0 s - - A A A A A • • 70s BBAE 1113• • • 0 5 50 3 1 70s . At ( A. • • • • • 190. • BCCC• 80 . • • • • • •
8 0 s • • • • r 0 5 50 3 2 BOs 0 4 5 0 0 2 60 1 • • • M s of ( EC U 1 t
0 54 0 24 60 s A 1 1 70s 0 5 50 3 3 6 0 s • / Os 40 •44 • •
04 50 0 4 70 s M E AAA A AA 110 s • • • CC•
8 0 s 60 s a y e 04 50 05 70 s DOI
0 5 4 0 2 5 60 s 70. MIA • • • • • • • 0 5 50 34 70s 1335 • •• • • 04 50 04 ?Os n es 8 0 1 • A • CC•
60 s 4 • 0 4 4 e 80 s sa ss• 0 6 50 0 7 ?Os
0 54 0 2 5 6 0. E / Os • 0 5 50 3 5 Ws 80 . AA ACC.1 4 4 1 4 4 4 4 4
00 . .. .ra t 0 5 6 00 1 50 s 6 0 s 0 6 60 0 1 5 0s 70 s • • • • • • 11A A A BOs 70, A
0, C"
• 60 . AA AA A tr • A • •
0 54 0 2 7 60 s - - - - A A A A A • / Os • • • 4 4 0 • • • A
BO. • • • •.1 0 5 6 00 2 50 s • • • 60 s 0 6 60 0 2 6 0 s - . AB AAA AAA 070, O• 1:11.: II: •0 54 0 2 8 60 s - - - A 70 1, 14 5 • • • • • • • 70 . AA A AA RN A* 80 s • • ACC. • If ( EU (0 4 60 73 6 0s - - - c • EIEA A 70s I I
80 . • • • • • • 0 5 60 173 6 0s 70 1 AA A AA 8 • • • • 80 . • ACO :
0 54 0 2 9 / Os 9 11)• • • • • 4 4 BOs 80 s 0 6 80 0 4 70 . • AAAAA AAA • Ras t i t
0 54 0 3 2 701 FOR• • • • • A A BOs 0 5 6 00 4 60 s • • • • • 70 s 0 8 80 0 5 W s - f AE• AA i t * BUB i I
0 54 0 3 3 70 s BOs i ROI BO. • • • • • •
0 54 0 3 4 70 1 - f A• A• • • • • Ro s 0 5 6 00 5 60 1 • 4 4 4 70 s 0 6 00 0 8 70 . a ss 110 . bo oed
0 54 0 3 6 70 s - * A A AA AA A mu • • • • • 110 . A ACCC*0 84 0 0 8 70 . 0 6 60 1 1 60 8 70 s A• F • • • • • • A
0 54 0 3 8 70 . - - it ABA• A • Ra s A • A Al • 0 5 60 0 6 trOs - - - • • • • • • • 70 . • • • • 4 4 8 • • • 80 s 4 114 CC?
0 54 0 4 0 70s K R 4 4 4 8 • •0 54 0 4 1 JCR - - EA AB• • • • so , AA A • A. 0 5 60 0 7 OM?. AA " ' / Os 1 A • • AA AA A • 04 70 0 1 5 0 s A• • 60 s AA AA A • AA A •
0 54 04 2 70. II AI A4 EF r • 60 . A A ACC< 70 s • • • • • A AA AA 80 1 A• ACC•
0 5 4 04 3 SO. 60 . c aeo w aee 0 5 110 38 / Us Ros
/ Os

158 H Y D R O L O G I C A L D A T A 19 8 4
St n Gau g ed da sly Ro w s S i n Gau p ed da dy Mo w s S tn
'1. 3166 1 '. .e. i S y pook• Ir a ... . fa m on t hsy os s k s en d ra .n7s11 nu nstn r0...96eda d,• -•W h Il• an d Fron tal !
0 0 70 0 7 30 s • A A 4 0, AA A A A A A A A A 0 7 10 0 5 GO, • A A A A A A • A A 70 , 4 4 14 8 , • 71 0 79 00 4 00 . I I FCBA A A A 70 , 40 , A A A A A A A A A A 6 0. A A A A A A A A A A 0 7 10 06 10 . 70 s I IA A A A A 6 0s • AA A AK/ Us A BO. AA A A A 0 79 0 0 5 GOs • 1I L A A A A A A / Os • A A • A A A A A A
0 0 70 0 3 20 t - - spA A A A A A A 313. • A A A A A A A A A 0 7 10 0 7 BOt t I i r 8 0 . 4 0s A • A • A A A A A A 50 . • A A A A A A A A A 0 7 10 0 8 70h 5 0 s • A A A A 0 7 9 00 6 GO, 70 1 A A A A A A AA A A6 0, AA AHRA A A AA 70 s A A A A A RCA • A 0 7 10 10 / IN 814 A AA A 60 , A A A A AO80 , A A A I I . 0 7 10 1 1 GOt I 70 . • • 13 I 1IFA F
0 8 70 0 4 30 , • A A• - 8 0s ( A A A A 0 8 00 0 1 GOs - I I I A A A A A A 70 , A A A A A A A A A Aso s 60 . • • . . . . . . . 0 7 10 1 3 RO. 'Kn ew 8 0, A • A A Aa/ 0 s r • •LA SS A A A BOs BBA r • 0 7 10 14 73s as s 80 s 0 8 00 0 2 / 0. • - CA. BO. •AAAA,
0 6 70 0 5 5 0 s • • I C AA A Kos • A A A A A A A A A/ 0 . A A A A A A • I T 80 , I I 0 72 0 0 1 50 . Gl i s : CCGCCGBCC 0 8 100 1 GOs / 0 .
0 6 70 0 6 6 0 . • A A A A A A A A • 70 s CAA A A A A A A A 70 . CA A A A • 13111 0 8 1 00 2 6 0 . I t FA A A A A A 70 s A A A A A A A A A A80 , A • A CCc 0 72 00 7 GO . 70 s A A • 11. :( A A AF 8 0, A AA A A.
0 6 70 0 7 til h I A A A A I Oh • . . . . . . . . . * Os A • A A A 0 8 100 3 60 . 701 • A A A A A A A AA06 70 0 8 6 0 . 70 , A A AA A A A A A A 0 72 00 4 SU, - - C ', Os .: (3CC0 0 0 C110 110 . A A • • Aa
8 0. A A A A A• 70 s CCCCCCR I I • 80 s 0 8 100 4 I D. da 00 1 • A A A A •0 6 700 9 hOs W EB 70s FIRRAFS I BA B 0 72 0 0 5 GOs - I 70 s
80 s 171110 80h •A A A A 0 8 2 00 1 00, ” F• A A A A A / 0 1 A A . . . . . . A A0 6 70 10 60 , I A A A 70 7 A A A A A A • I r 0 72 00 6 60 . / Os AD. A AA A A•
RO . i : 80 , 0 5 70 0 2 70 t 130. • A A A A4.0 6 70 12 60 s EU 70. 1 • 11: - 1 17 0 72 0 0 8 60 . 10* EA U CCA A A A 0 8 2 00 3 70 s • A A I • sa BO* A A A A A00 6 70 1 3 GOs 10 4 70 s A A A A A . . : . 80 . • A A A A0 6 70 1 5 10 . - ' cc 4 0 . cca c ccc ca 0 72 00 9 70 1 8 0 s •4 4 4 4 0 8 30 0 1 GOs 70, 17 111 111.
50 s 60 . Lc. c, (A CC( 0 72 0 10 RO, 7 80 s 7'70 s BA A A A A A A A A 130 1. A A A A A• 0 7 2 0 1 1 / Os en 80 s • A AFF 0 8 30 0 2 60 . 70 s AL A A A A A•
0 6 70 16 60 . - ( AL / Os 1! • 1( 11• • 1 0 8 30 0 3 GOs 70 * ( • A A A A A A A ABOt I I 0 7 3 00 1 / 0 .. 80 . • A • A Aa
0 6 70 1 7 GOs 0 1 70s A A A A A A A A A A 0 7 3 00 2 60 s - - - I A A A AOA 70 s LA I ! A A A A A • 0 6 30 0 4 / 0 . 80 s A A A A A.80 s A A A . C, 80 s A A A A A 0 8 30 0 5 70s - - I. A A A A A AA RO. A • A A A•
0 6 70 18 60 1 I F 70, A A A A A A A A • A 0 73 00 3 W s 0 6 3 0 06 70. SO• sa. . ...RO, A • ACC, 0 7 3 00 5 60 t FR 70 s 13114 114 4 0 8 4 4 0 8 30 0 7 / Os . . . . . - - ea BOs sas s .
0 437 0 2 3 70 , RO• A A A A A 0 6 3 00 9 70 , a 60 . sa aaa0 6 70 7 5 70 i Fl a 80 s • A A AF 0 7 30 0 7 W . 0 5 30 10 / 0 , ea* SO. sa w0 6 70 2 9 70 , HO . se 0 73 0 0 8 60 * 70, • AF• A A A • • 10 157 0 2 9 70 . 80h . . .Ks Ro l A A A A 0 8 4 0 0 1 40 . i t 5o . 55 571613111 ( 13
0 73 0 0 9 70 s 80 7 •A. AA A 60 . A A AA A A A A • • 70 . AA A A A A • A A A08 8 00 1 s AA 40 . A ARCB4 A A A A 0 730 10 30 t C 4 0. r , 1. ,...CCCCCC Re s A A A A As
50 0 A A A A A A A A A • 60 1 A A A A A A A $ AF 50 1 CC7333C4 4 CC 60 , CCU : al :COLT 0 8 4 0 0 2 SOs - - eA • I • M 60 . A A FF• FFFFC10 1 A • A A A I A A A ' 80 . ( .4 • A A 70 s C80 0 0 CC A A A 80 , • A • A A 70 , 4 4 10 FF- • 1
0 6 8 00 2 4 e 50 . A A A A AA A A A A 0 73 0 1 1 M . . . . . . . •A • t 8() . ! A AA A 0 5 4 0 0 3 50 • - . 30 4 KO. A • • • • A A A A A60 • A A A A A A AF A A 70 s • A A A A AI r • 0 73 0 I 3 130 s 70 . A A A A A AA • A A 8 0 s A AA A A.14( 4 • I 0 73 0 14 RO, l 7 0 8 4 0 0 4 171116 GO, A A A A A A AA A A
0 6 8 0 0 3 4 0 . e 50 . A A A A A A A A A A 0 73 0 1 5 / Us I I I 60 . I I 7(1. A A A AA A • A A A 80 . A A A • • ••60 • A A A A A A A) A A R h • A A A A I I I : • 0 8 4 0 0 5 50 s A GOs A A A A A A A A A A80 . • AA A A 0 74 00 1 0 0, I C / Ch CCRCCCR• A • / Os • A A AA A A A A A 80 . AA • • • •
0 6 8 0 0 4 50 s . A A 60 s A A A A A A AOA A BOs A A A A • 08 4 0 0 6 60 s - 8 4 4 8 8 4 8 70 s A A A AA A AF A A70 . A A A A A F A A r Ro . • • • A • 0 740 0 2 6 0s l e, • A • A ABBA AA RN 8 8 4 : 1
0 68 00 5 50 s - - - FA A A • • • 60 . A A A A A A A F A A 80 . A A A A A 0 8 4 0 0 7 60 . / 0. A AA • • • • RO•70 s A A A A A LL I A A RO• A A A A A 0 74 0 0 3 70 1. 80 s A A AA A 80 s 8 4 4 4 8 .
0 6 80 0 6 50 . - • A A A A A A 60 • A A A A • • • 36 A 0 74 0 0 5 / Os I RA A A A A Ku . A A A A • 0 8 40 0 8 GO. • A A A / 0. • AA • A A A A A A70 , A A A A A I I • 11 50 s • I t AA 0 74 0 015 60 . 70 s a l - 110 371A A SW A A A A A,
0 68 0 0 7 60 . eA A A A A A A / 0 . AA A A AFA AFA MOs • AL A A 08 4 00 9 60 . / :), A A A • A A A A A 480 , A A LI A 0 74 0 0 7 / Us " I F I , 80 s I t t AA BUs A A A 8 I
0 68 0 10 70, 0 74 0 0 8 70, ROs em s 08 4 0 1 1 60 s - 84 4 4 4 A A / 0 . A A A A A A AA A A0 68 0 1 1 / 0 . BO. A A A A • 40 58 0 15 8 0 , aa • 0 75 0 0 1 30 s I I L AL I AOs l l t • IZA A A A 0 8 4 0 12 60 s. - 1114 4 8 8 8 4 70 s A A A A A AA A A A0 6 80 18 / Us - • 50 . A A A A • A A A A • 60 , AA ARA A A A FE Ma x A • • • Aa0 138 0 19 80 t 70s 1. • : A A AI AA A BOs A A A A A 0 8 4 0 03 60 . 70 s 4 A A AA A . • 4.,0 8 8 0 2 0 8 0. CC A A 0 75 00 2 W s 1<130 18 9 347 A 70 , • • • A • A A A A A BO* A A A A A.
80 , A • A A A 0 8 4 0 14 GOs - - . A A A A A 10. • A A A A A AA A A0 6 90 0 1 30h - • .70 $0 313 4 0, 1636 1111RRRRR 0 75 00 3 60 . - • A / Os 13A A H• A R• A A KOs A A A A Aa
50 . A A A A A A AA R• GC. 17A A A AA A 8I A 80 s AA A A A 0 8 4 0 1 5 60 . . . : . . F• A • A / 0 1 A A A A AA • I A A70 . A 4 M 1AKA A A • Ben I AA A. 0 750 0 4 60 s T A 70 s BBA BAA CA A A 80 , A AA A A,
0 6 90 0 2 40 t • 50 . • • A A A A A A A A SOs aa A A 0 8 4 0 16 GOs - 111- 180 8 713s A A A A AHRA A AGO. • A A.A A Fu n AA / 0 . A A FF• • A A A A 0 75 00 5 70 , - A A ASCA AA mo s 8 8 84 8 8 0 6 A A A A A.ROs A A A A A 0 7 50 0 6 W A 111, A A AA A A A A AA 0 8 4 0 1 7 0 0, 70 * • A A A A A A A A A
0 6 90 0 3 30 , 4 0 . i r • I i : • "F 60 , 1 MO . • A • A Aa50 s A A A A A A • AA A GOt A A A A A A A FA A 0 7 50 0 7 60 . - - - - • / 0 . A AA A AA A • • • 0 6 4 0 18 KO. 70 , • • A AA A A A A A70 . A A A I I I A1 A F 8 0 , A A A A A 0 7 50 0 9 70 . - e• AA RRA A A 8 0 s A BA A A MN A AA A • a
0 6 90 04 40 , A A A A 50 . • A A A A A A AA A 0 7 50 10 70 1 0 5 40 19 6 0, 70 t A A A A A A A A A AW I A A A A A A A A L I / 0 . FF11• , ” • • 0 7 50 15 70 s 8 0 t A A • FA 80 . A A AA A .ROI l l t • 0 750 1 7 RO. a AA 0 6 4 0 7 0 GO, , 70 $ 8 A 4 4 4 0 8 L 8 8
0 6 90 0 5 SO• - • t A L• A A 60 s A A A A A A A FA • II :), A AA A As/ Os A A A FA • FFF A 80 . 1 8 8 1 • 0 76 0 0 1 50 . - - It A A A ( 11 60 . t A AA A A A A AA 0 5 40 2 1 60 ,
0 8 90 0 6 SO• . A A • A GOs A A AA AA A A A A 70 . 80 s A L AA A 0 5 40 2 2 60 . - t ees / 0 • sKs AA FA A F•l th 0 8 8 1 A l A A A A 80 , A A A A A 0 76 0 0 7 60 s 70 s • A BA KIK AA F 80 1 A A A A A.
0 1590 0 7 70 . - r • 11, 11 %Os 1 A A • A BO* A.LA A A 0 6 40 7 3 70 . 80 s A A A 4 4 .0 6 90 0 8 80 s I I I . ' 0 760 0 3 60 s • A A A A A AL A / 13. AA A A • A A A AA 0 6 4 0 7 4 70s BOs A ACA As0 4190 1 1 80 s ' 111 6O. A FFA • 0 64 0 7 5 70 s 00 s 4 8 4 4 8 40 6 90 13 80 $ e • 0 76 0 04 60 s - • . 8 4 4 8 0 8 4 / 0 • 8 8 A. AA A ' A • 0 84 0 2 6 70. a r a • M K sa wn0 6 9 0 1 5 70 t A FF 50 , KFA A A A 80 1 ! A A A A 0 8 4 0 2 7 / 0 . ECI I I • •0 6 9 0 1 7 M I Ra s I A A A A 0 76 0 0 5 60 s . A • ORR 70 s • 8 • 4 3.8 8 A AA 0 6 40 2 8 / 0 . 80 • sb a a .0 8 9 0 15 6 0 1 • 70. 111 11 1 BOs A A A A A 0 6 40 2 9 10, 80 5 on u s
50 , • 1 0 760 0 7 6 0 s / 0 . • • • A A A A A • • 0 64 0 3 0 80 s0 6 9 0 7 0 70 . a ss W s AA A A A Ro. I A A A A0 6 9 0 2 1 / 0 . t u r n i r 0 76 0 0 8 60 s - - - sa • 70. ! A A A • F F t • • 0 8 50 0 1 GO* 70, • A A A A A A A A A
80 s • 111 BA 1AA A A Foch A A • A A s0 6 9 0 2 3 80 ; • A A A * 0 76 0 0 9 60 , F 70 $ CAA A A AF 11 0 5 5 0 0 2 laU • • •F • • • • A A / LK AA A • A A A A A A0 6 9 0 2 4 RN •A A A A 50 s 16( 4 A 80 s A A A A A•08 9 0 2 7 R h 0 80, • • A A A 0 76 0 10 70 s C8 4 A 8 4 1 1: • 80 , ! A A A / . 0 8 5 00 3 60 s 70 , ( A A A AF• M E0 6 90 30 80 * 4 8 8 A 4 0 76 0 1 1 641s M s cc If ccc ccc 80 s A A A A A .0 6 90 3 1 ROs , [ 4: t 0 8 50 0 4 / 0 . aa • 8 0 . • as e . •0 6 90 3 7 70 , A ROt A A • A A 0 76 0 14 / Os F • • BO. I A A A I0 6 90 3 3 50 1 bOs r 0 76 0 1 5 W s F• ARA ARA • A 130 s A A A A A 0 8 60 3 1 60 • / Us A A A • • 131368
70 $ BO, 8 8 8 4 8 40 6 9 0 34 80 s 0 7 70 0 1 6 0-6 - - - • A AFF A l 70 s M BA A A A A • 08 60 0 7 60 s - 1• • 111114 70 • A A A A A RRA A A0 6 9 0 3 5 / Os BOs • A A A A 80 . I A A A A BOs • A A A tc.0 6 90 3 6 / Os 80 s • • 1 r 0 7 70 0 2 60 . - I • CCSA A A A / 0 . • A A A • A A A A A0 5 90 3 9 4 0, - - I 50 s ( A A I I I) A A A • 80 s A A A A A O 0 9 00 0 1 5( 4 70, ' M r
GOs - 70 s - - as s 0 7 70 0 3 70 s SOs • A • • • • 0 90 0 0 2 / Os n a HOs • •0 6 9 0 4 0 8 0, 0 7 70 0 4 70 s 00 s • 8 8 8 8 a 0 90 0 0 3 N) ,
0 7 70 0 5 70s Str ,0 70 00 1 SO. - • A A A A A A 8 A 6 0 . A AA RCBA • 138 0 9 10 0 1 60 s / 0 .
/ 0 . 19 8 ( 11• 111 80 , I I 0 76 0 0 1 5 0 . - - • A 60 s 09 ) 00 2 60 , • A A A A .0 70 0 0 2 8 0 . KA A BA / 0s 11119 0 9 10 0 3 50 . 60 s0 70 0 0 3 a 0 76 0 0 2 60 . - - - s A k ' , F I 70 s 11 1•1: :0 70 0 04 70 . A A A A 8 0 s A A A A A 0 780 0 3 60 s - 11• : 110 8 4 / Os • • • A AA A A AA 0 9 3 00 1 70 * a BO, • A AA A .0 70 0 0 5 70 , • 80 s • aat s 80 s A A • A A 3
0 78 00 4 GO, 11581 F• • • 70 s A A AA • A • A • A 09 4 0 0 1 60 s 11 70 , 6 A A A AA A A .0 7 10 0 1 GO, ' CCCLIA A A A A 70s 50 8 08 8 8 8 A A 80 , A • A • • .. BOs A 8 8 4 4
RCh • A A A A 0 78 0 0 5 70 . MO$ • A A A A,0 7 10 0 2 10 . 4 0s 0 9 5 0 0 1 M s • A A 804 • A A A A 3
50 . GOs ea A A A A A 0 79 0 0 1 bOs - I I : 9 8 61 1 711. I FCCU CC. cHA 8 4 4 40 18 130 8 0s RI F? LIOs 0 0 9 60 0 1 70, 4 • • • 80 s A A A AA •
0 7 10 0 3 50 s . 8 8 60 , • A A A A A A A A A 0 79 00 2 50 s - - A A 6 0 . • • • • • A A A AA 0 9 60 0 2 / Os * a RCN • A A A • •70 s • A • 00 - I i r 70 s . . . . . . A A A A 8 0 . AA A AA•
0 7 10 04 60 s / Us AF I •A I A A A A 0 790 0 3 50 , - s 60 9 AA A A A A • • • • 0 9 700 1 50 ' . . . . . . ' - - 60 s130 , A • A • A 70 s A A A A • A • A A A 80 s A A • A AK 70. 80 . 1 i - • I

SU M M A R Y O F A R C H I V E D D A T A - 1 159
S U% Ga ug e d d e lft 5394.4 . St n Ga m e d da Dy Own . S tn Gr o w l So h fkrers .re ds r e sat pr i m a ! Ime rta• min t s orc e 0 dy oa ks 4 . 1 n o t e rum ba. m oral* po st s a wl n in ta•
0 9 70 0 2 60 . - 3111 t
110 6 A • A • lla
Icno n 90 s - 14 17 0 11In s I t t u
10 10 0 2 SOs t t / /70 . 197 29 2 I F"
20 10 0 220 10 D5 70 s - 1 0 : 1512CIT20 10 31 70 s
70 s 11 2 0 10 0 7 70 . 1/ 11/1 CI CC20 10 0 8
70. Fa It C / 11 20 30 10 GO. - 1: 10 : 11:SOS CA A A A T
50 s / 111tI e4 0 20 30 1 1S U M AD 2 0 3 0 1 2
20 30 1 7 70 . a mm o =2 0 3 0 11
50. CCAA M 20 3 0 2 020 30 2 1 70 s •
Produc ed 3 rd .N ty 198 6 Ne w so mm an e s evadable o n req ue s t .
MX C A A A A
70 s 7433 3 5LOSIX
2 0 30 2 520 30 2 7 70e - 50 X 9 2CC 10 s CAAFI2 0 3 0 21 70 s - trCCES CCC 10 . CI :F120 30 3 3 11155
20 4 0 0 1 50 .
20 50 0 3 742 0 50 0 4 70 s 2 0 50 3 5 70 s - - 2• 0 20 CC2 0 50 0 9 10 .
SOs CAA 4 A t

160 Summary of Archived Data - 2
Naturalised daily and monthly fl ows
K E Y
Su . MM us. heed dr aynum bs. an d mo nth l y fl ow s
00 600 7 / Os - - - FR EW '
00 700 3 60s •FCR I90 %
00 8 00 1 N MbOs I FI FFI FFEE
00 8 00 5 70s F- 1.
0 / 200 2 70s - - I I - kith F0 1200 4 70$ i l l 80 s
0 140 0 1 70s 0 1400 2 70s
0 150 0 3 70s C 710 ,0 1500 6 N A 70s
80 . I0 1500 7 70 . F (10 ,0 150 08 110 ,0 150 10 70s BOs0 150 11 701. EI EL111 BOs0 150 12 70s SO,0 150 13 70s - - 11114 1F BOs0 150 16 70 . CM ! 1111,0 150 17 70s
0 1700 1 GOs0 1700 2 N A0 170 0 3 70s0 1700 40 1700 5
Com plete daily and complete mont hly APart ial daily and com plete month ly BPart ial daily and part ial mont hly cPart ial daily and no mont hly DNo daily and complete mont hly ENo daily and part ial monthly FNo naturalised flow data
th aw , 70s0 11300 7 60 . I FFI F0 1800 3 bes FU R L0 180 0 5 70s 0 18 0 08 70.
0 190 0 1 50 s . 70.
0 19 170 7 60 s -0 19 00 3 60 s FFECER EE0 190 0 4 60 s 1. 1. 111111FF0 190 0 5 611.0 1900 8 60 . - - - 1111FI E0 1900 7 60s0 19 00 80 1900 9 60s - - - CCU 1 I I0 190 100 190 11 70s
M . = M U
401 M ECU M60 , FI FFFs
0 1600 1 60 1 - - - U LM ( JIM FR EU EU I.80 .
0 160 0 4 70. - ELLI E 80.
70s El/ Os FF
60 s W A t t 1111
Summary is presentedin decade blocks
Stn 1444 orabssd S ay Sti r Nat u rel ls441 deitynum ber a id m an ti ses( fl ow s num ber • nd ma i i hly fl ow s
02 50 0 2 70s I I I . 0 3300 5 50 s - - M U I R 60s ELLI I I I RA•0 250 0 4 50s 1FF 60 s 111 l i 8 AACC Ws AC
M s : : 0 3300 6 50. M C 60. +111402 500 8 l o. 5Pkt ‘ 0 33 00 7 SO* - - - I LI I I I . 60 s M I 11LCC1
M s I F02 60 0 2 60 s W A S 70$ ' Fr r 0 330 1 1 60s - 1117
0 33 0 76 70. - CAAAM :02 / 00 1 30 s F. 40 s - I R E. - 03 30 3 5 50 s CA 60. • AAA8 AAAAA
SOs r EELIA 1 cos M U M - , / Os AAA • • CM s 1
02 700 2 50s 11111 60 s E11511 .14 1 03 6 00 1 30 s CAAA AA AA 40s AAAAAAAAA A70 . € brOs A• • • • • AAAA W s • AA• A• AAAA
02 70 0 3 60 , - - I FI R I FC 70s I I a i 70. AA AA AM02 700 4 60s " U M W , 03 60 02 101 CAA AAAA AAA 701 AAAAAC07 70 0 5 M N - - FU R 50 . FI R FFECU 03 600 3 60 t - C• • • A• AA A / a s AA• • • • C
609 EE11111111 036 00 4 60 s CAA• A 70 s AA AAA M :02 70 06 / Os f F 0360 0 5 trOs CAAAAA AA 701 A• AAAAC02 700 7 FE 601 I FI FI R M 0 3600 6 601 - - C• AA • AA A 70 . AAA • • AC
70s I F 0 36 00 7 70s AAAAAAC07 70 09 I Q, 1' 0 36 0 08 60, CAAA AA AAAA 70 . • • • • • • C02 70 11 50 t - 1111111 GOs 11.111111FF 0 36 0 09 601 CC 70s A AA AAA L
/ Os H U 0 360 10 60, / a s • AA AA AC02 70 12 50 % - - - - I FFFFE 60 s 1111FI EEEE 0 360 1 1 60 t CA ?Os AA AA A• C
70. Er 0 360 12 N • CA 70s 0 2 70 13 50 • - - FR EES 60 s FFFi EE :EI FE 0 360 15 70. - - CA• • C
70s I I0 2 70 15 604. - - CAAC Er: 0 3 700 1 Sas CA • A• AA AAA 60 . AA• • AAA AC-02 70 11 60 . FIR M ER 70s - CAM :
70 s Er 0 3 700 2 30 1 CAAA AA AA AOs ACCAA • • • • •02 70 1 7 • ' CU 60 , I f FR U EFL 50, A • A A• AAAA A 60. AAA AAAAAA A
70s OR / Os AA AAAAC02 70 18 514 - - Fl i t 60s H ER U t l l 03 700 3 301 - CAAAA AA A 40. • AA• AAAAAA
70s 1114 50 s AAAA AAA• AA 60 s AL - - CAA • AA02 70 19 50 s 1111 GDs I l r El l i Fi l• / i ts AAA AAA C
/ 17. 03 700 4 30 s - - CA• A• A AA th , A• • AACTF - -02 70 20 50 . 11FF 60. 11111111FF 50 , 7- - FU R * GOs EBU RAA AAC
70, 1FE7 0 3 70 0 5 W s • • • • AAAAAA02 70 2 1 60 . 1111110 1E 70 . 11 70, AAA AA AC02 70 22 GOs - 111111 70 s 1, 0 3 70 06 N A C• AAAA AA 70 $ A A• AAA C02 70 23 60s - - 111EI C / Os Fr 0 3 700 7 / Os AAA • A • C0 2 702 4 W . - M U 0 3 700 8 60s - - CAA AA 70s A AAAAAC0 2 70 25 60s - FEM M E 70, Fr 0 3 70 09 60 . - - CAA AAAA A /Os AAA • A AC0 2 702 6 60s - - - 111111 F 0 3 70 10 60s - - CA AAAAAA 70s A AACC• C0 2 702 7 bOs FI ER I ER / Os E U 0 3 70 11 6126 - C• AAAA A / Os AAA AA CC02 707 8 60 • - 11111FFEE 70 s 1, 0 3 70 17 60 1 - - - CAAAAA A 70, AA AA AAC0 2 702 9 liOs FR U ' l l i 0 3 70 13 N A CAAAAA A 70s AAA AA AC02 70 30 60, - - - M U ( 70 s i l• 0 3 70 14 60 s - - - C• AA• AA ru . AA AA AC02 703 1 60 $ 70s EF 0 3 70 16 70s AAAACA C02 70 32 60 s 03 70 17 •C AA AAAACAC02 703 9 60 s FFF 70s LI 03 70 11 70s CA AAC
0 3 70 19 60 s - - CAAAC Ws AAAAC02 50 0 1 30s ' FE 03 70 20 70s CA AAAAC
50s EM EEEEt t &Os EU EEBAAAA 03 702 1 70s CAA • AAC70. AAAAACAA 03 70 2 2 70, CA AA • AC
02 60 02 40 s I 1111 50 s E0 1.11111 1 03 70 23 / 0 s CA AC60 . I I I FFBA• CC / Ds CC CC 03 70 24 70 s - CA • AAC
0 700 0 1 60 . - 111114 1Ff 701 FR EW02 000 2 60s 70 s M EM 030 00 3 60, IT 0 38 00 1 30. - - C• A AAAAA 40 1, • • • AAAAAAA0 2000 3 60 . t - - - U M / Os FU M E 50 s AAAAAAA AA 0. 60, AA AAA AAAAA0 20 00 4 60 . 111 70s U n l i t 03 10 0 1 Ath FEFFI F- - - - 50. FU ER r 70 . • • AA AAC- CA FiOs AA• ADU0 200 0 5 70s I 60 s R IR RAAC• / Os Al li FFF‘ SFI0 200 06 70s F 90s CF 0 3900 1 RN AAAAA AA 90 s AA AA AA A AAA0 20 0 0 7 FOs 0 3 100 2 70s 00 . AA AAA• • • AA •Orr • • • • • • AAAA
0 3100 4 60s 11 70, r u t I 70s • AAAAA • • • • 30s AA AA A• • • • •0 2 1170 1 50 s I 50s ( U M W 0 3 100 6 M s FFFEEF 417. A AAAAAA AA A 50 . A• • • A AAA AA0 2 10 0 2 50 * I' 617. 114 FEEEEF 0 3100 7 60 s FF 70s 11- - 11 GOs AAAAAA A• • • 70, • • • • • • • • A0 2 100 3 50 . 1 GOs I C0 -11111 1 0 3100 9 70 , FM 60 .
706 EI EEEEEEEE SU, I F 0 3 10 10 70, - 11117 0 39 00 2 304 CA 40 . 0 2 100 4 60 . 0 310 1 1 701 - 1FF 50s AA AAAAA AA A 60s AAAAA A AA AA0 2 100 5 60 s - f CCEER. 14 HA ( CR I M E! 0 3 10 12 701 70s AAA AAA• • A A BOs
80s Er 03 10 13 70$ 03 90 0 6 60. CAAAA • A AA 60 s AAA • A AAAA A0 2 100 6 60 . - 111111111 70. M ECU M 0 3 10 15 70s - 11141 70 . • • • • AA• A A MS AA• AAD80 s F 031016 70s - FEU I 03 9 0 15 60 10 2 100 9 60 . FEEFFEEE 70s 110 10 114 0 310 1 7 70s FF1
80 . I 03 10 18 70, 0400 0 1 50s 60 s - 114 FFFF0 2 10 10 60 s - - - FU M E 70. 11- 14 - f l 03 10 19 70s 040 00 2 50 s - - FFL, ROs F1I FFFED
90 . F 0 310 20 Jos - 040 00 3 50s FFf F 60. EI FEEEFF02 10 14 60 s - 111111.1.11 70 . FFFFEEEEEI 03 10 2 1 70. - 0 114 04 0 004 60 s FI LM
BO* I' 03 10 22 70. - FFF 04 0 00 5 60 .0 2 10 18 60 % FF 70s ( EM I LIA, 0 40 00 6 50 s
130 s F 03 700 1 40 s R I-R l i f I f 50 s I CEI IR I l l 04 000 7 60s I M EI FF0 2 10 19 60s 70. t t I FI FFEEE 60 $ ( M U M ( / Os FR U 04 00 073 60 s FEE
BO. 1 03 200 2 I Ds 40. I I I F11FFI F 0 4000 9 60s0 2 10 2 1 60 s 1 10. EU EM U ( 50s 00s - FEM M E 04 0 0 10 60 .
80 . 1 706 EM U 04 00 11 60 s FEU0 2 10 2 2 60 s 1 / Os ( LEM M A 0 3200 3 Ws 14 FH E
60 . / 0 3200 4 40, - - - 1111114 501 M I M EO 04 30 03 60 .0 2 10 2 5 70s _ I I FFI FFF 80 s 1' 60s ( H U M & / Os 11119 0 4300 5 60 . ' FEU Ws F7
0 3200 6 60 2 7 70s ( I M F0 2 300 1 50s GOt I.LLI • RACA A 0 3200 7 60s 1 70. EM U 04 500 3 60 . ' M I R
70s CC 0 3200 8 40s 50 . I t t I l li f FE 04 50 04 00s CA / Os C0 2 300 2 60 . / Os AC 60 s M ECU M 703 (N u r 04 50 0 5 60s - r a t 7c • 706 C0 23 00 3 50 s - - - - ' 60. 1.1.1.I FFIA AA • 0 320 12 70s r i• FI F
/ Os • AAC 0 320 18 / Os 04 6 00 2 601 11 1.11 I FFF0 23 0 0 7 60 • 70. RC• C 03 20 19 70, . 1F7 04 60 0 3 60s 709 C0 2300 8 70s 03 20 20 Jos 1111140 23 0 15 40. II I s 11. 1 501 FEFEFFI ED 03 20 2 3 70s 04 700403 20 2 5 70, ' R I F 04 700 5
0 24 00 1 SOs A C • 70s AC 03 20 26 Jos - W EI0 24 00 3 SO• - E. 60 s U M BACA A 04 800 1 60 s - - 011ACR
70s AC CC 0 33 00 1 50, .1114 1F1 04 8 00 203 300 2 60. - - 1EF66 6 4 6 70s • A• AAAA 0 48 0 06 50s CC
0 2 500 1 50s 60 s LECI LIM A AA 0 330 0 3 50s FF FEFEF 04 800 7 60 . C70. • C- C• • AC 0 330 0 4 40s W EI 50 • FFI EFFI F

SU M M A R Y O F A RC H I V E D D A T A - 2 161
1119 / 49 14 • 4 = 6 4 Natsa f f se d 4 aDy St . Natunawe s ay. .. new awe moms, lb w s num be r an d 4 44, 124 , ll ow s me t e serd m ar = San s
0 760 0 1 SO.04 9 00 3 60 s CCC 0 S7C0 1 50 s - - 11/ 1 /.1.EF 60 s (l i li IIC f F 60s FELE/ CELE'05 700 2 40 s f U LLFU EL 70s F
0 50 0 0 1 60 s A 70 s C 0 7600 3 60 . - FEEELF50 s EFFEEM .1- 60 s - I t Li f (14 • A0 5= 2 60 s - 1EL 118 13( • 70 s C 70 . C 0 7600 4 60 s
C• • AC05 700 3 60s 0 7 700 2 (41s FEE 70s LF
0 5 10 02 (O s I FFEE8A AAC05 700 4
0 5 20 02 GOs EU EESIEF 0 580 0 1 / Os C 0 7800 4 70s05 70 35 50 s - 1= li f I E 70. E *FE f EEF
0 58 00 3 60s - - I LES
0 5 200 6 50s FI EFLEE 70% EL I FFI EF 0 7= 2 50 s F 60 s EU FI FFEEE05 70 0 8 60 s FS/ H OO F 05 90 0 1 50 s Ff 60 s ( LI ELBA CC 70 . I F0 5 20 14 150 s l i i 70. FLU FFY! 0 710 33 50 s 80 1 ( 1111I EU E
0 600 :71 50s Ff 60 1 ELM BAC 70. Ft f03 30 04 50s FE 60 s H I M ( El f 0 79 00 6 50 s FEE 70 s I f70s FfEEEEE• A• 110 . A 06 100 3 50 a FI ECEOCC
06 100 3 60 s FE 70 s I F0 540 0 1 20s 30s 06 70 0 1 50 e F 60s En Fil f F40s 504 06 70 0 1 60 6 - - - FU M E ?Os ( FGOs 70s 0 640 0 1 60 s Ff
0 5400 3 20. FI FI FFEFf F 30, F 06 4 0 0 1 ?Os FFFEF40 s 50. 0 8 80 02 60 s - FFEEEEFE 70 . I Ff 084 00 2 60 e FE 706 ( UM60 s 70s 06 60 0 3 50 s - - - 10 - F 1 05 40 33 60 % FEEEE 70% ( ( CI F170s 4 4 • AD 0 6 80 11 60 s - CA 70 . AC 08 4 0 04 50 s
70s FFEEFFEE 60 6 FEEEEELEEE0 540 0 5 60 s EFEEFE114 • C
70s • • 04 70 3 1 50 .70e M I 70s El EEFF
60, FFFEFEM E 0 84 00 5 50 s FE 60 s I I I I ( I FFFF0 540 100 54 0 13 60 s CAC• 70, C • • 0 6 700 2 50s - - - FLU FF( 0 8400 4 70, M U0 540 14 70 a C AA 06 70 0 3 60 s FF
6700: FFFIFEFEFEFEF1 0 8400 7 60 . FI E 70s FEEI F0 54 3 17 GOs CC 06 700 4 50 s 06 40 08 60s - FI F FEE 70e FEED
0 8 700 6 60 s H a l I a l l 0114 00 9 60 s FI I 70s EFEEF0 55 00 1 30 e FI F 40 . I I M I.FEI F 0 8 700 7 084 0 11 60 s - - - - I L H EE 704 ( M b
50 . FI FFFFFFFE 60 s FFEEEEM E 06 70 15 70 s 111 1 084 0 12 60 s - - - I M EEE M s FFEEF70s EF 0 6 70 17 60, 084 0 13 60 s F / Os FF FEE 70 s I CED0 5 500 2 30% FEE 40s I I FFFFFEEE 084 0 14 50. - - - - M if f 70 a FFEEF
50s ( = U M 60 s ELEFFEEM 0 680 0 1 60. - Ff f EM U 08 4 0 15 70s FEW701. 0 6800 3 401 F 50 s ( = U LU80 a • 4 13 08 40 16 70s FEW
0 55 0 06 309 - - FU EL 40s ( ( FI U M E 130% ! LEFF . 0 840 17 60 s Ff 70e M U50% LI LI I I FFEE 60 s ( ( M U FF( 06 800 4 61:9 l EFFI EEEI 70s - 11 01 40 16 60 . 1 70 . U H F70s EFEEELE1 0 66 0 05 604 - PI EFFEFI F 084 0 19 60 e FF 70e U FO
0 5500 7 30 s I F 40 1 ( ( M U FF( 06 800 6 60 . - FI EFFEFI I 06 40 20 70e R I FFSOB FI FEEEM I 60 s FEEFFEI EFF 084 02 1 70e FEF70s 80 i • D• 06 9 00 4 40s - - - U M GOs M EM I l l 084 0 22
05 50 23 60 s / Ds 60. ( ( M U FF
08 40 23= • AA 08 4 0 24
0 7 EF0 00 1 50. - 11 FF U FI70s CC
60% - FE AACC 0 840 2 70 540 0 1 50% f EE 50 a = H EM
70 % FEEI I EFI05 50 0 1 110* - - - 1( I FI EF 70e FEW
0 5400 2 502 FFf 60 e = EM U 0 710 0 1 60 s CC 08 50 0 2 60 e FEE 70s FFEEF70. M EE1 0 7100 2 60s - - - - 18.4.4.4.4 70. • • • • C 08 50 03 70e FI FI F
0 56 0 03 50.0 560 04 60 s 709 FI E= 0 7200 1 60 . - - FEE( 64 .4 4 HA CC• C 01 80 71 70 s FEED0 5 600 6 60. - - FI FFEEE 70. FM I FF 08 80 33 / Os I FI EF03 6 0 1 1 70s 11E7E15 1 0 7500 105 6 0 12 / Os - FEEEEF 0 750 02 60 . - FEU D 09 700 2 70s - - EM U
Produced 3rd July 1986 New surnmenes available on request .

á

GR OUND W A TER LEVEL MEA S UREMEN T
Background
Groundwater may be obtained from almost anystratum in the sedimentary succession in the Briti shIsles, as well as f rom metamorphic and igneousrocks. I n many, such as clays and shales, volcanicsand metamorphics, the permeable zone may well belimited to the depth to which weathering may reachwhich is unlikely to be more than some 50 metresbeneath the ground surface. In those strata which arenot general ly recognised to be aquifers, well -yieldstend to be small (of the order of only a few cubicmetres per day), uncertain as a continuous source( tending to fail in prolonged droughts), with anindi fferent groundwater qual ity, and with thesources vulnerable to pollution.
T he more generally recognised aquifers are li stedin T able 9, with the Chalk and Upper Greensand, theL incolnshire Limestone and the Permo-T riassicsandstones as the most important from the viewpointof public supply . From such aquifers as these, yieldsof 3000 to 4500 cubic metres a day are not unusual .For the next category, including the Lower Green-sand and the M agnesian L imestone, yields to indivi-dual wells of 1500 to 3000 cubic metres a day cangenerally be expected. In the other aquifers, whileoccasional sources suf fi cient for large supplies maybe developed, they tend to be important only locally.
T he groundwater resources of an aquifer arenaturally replenished from rainfall. During thesummer months, when the potential evapotranspira-tion is high and soil moisture defi cits are appreciable,l it tle infi lt ration takes place. T herc is a notableexception to this rule in the Eden valley of Cumbriawhere, enclosed between the massifs of Cross Felland the Lake District , suf fi ciently heavy and contin-uous summer rainfall occurs to maintain infi l trationthrough part at least of most summers. T he normalrecharge of an aquifer takes place during the wintermonths when the potential evapotranspiration is lowand soil moisture defi cits are negligible.
T here are few ar tifi cial reservoirs in the UnitedKingdom which are suffi ciently large to supportdemands through the driest summers, assuming thatthey were ful l at the start of the summer, withoutsome continuous contributions from ri ver intakes.Prolonged dry spells lead in many rivers to reducedfl ow, particularly where the natural groundwatercontr ibution (basefl ow) is limited. Consequently,while surface water droughts may be in part due to
the failure of runoff from winter rainfall to fi l l thereservoirs, they are more frequently caused by adecrease in the summer fl ows of streams and ri vers.Surface water droughts do, however, lead to in-creased consumption of groundwater (where avail -able). By way of contrast, a groundwater drought iscaused by a lack of winter rainfall. Potential ly,themost serious droughts occur when, as in 1975/ 6, adry summer succeeds a notably dry winter.
The Observati on Borehole Network
Groundwater level observation well s* are general lyused for one of two purposes, either to moni tor levelsregionall y and thus to est imate groundwater resourcefl uctuations, or to monitor the eff ect s locally ofgroundwater abstractions. T he number of observa-tion wells required in di ff erent areas var ies widely.Over the last two decades, a target density wassought of one well to 25 to 35 km' . During the lastfew years, it has become apparent in some districtsthat satisfactory information can be obtained withfewer wells, whi le in others the densities had to besubstantial ly increased.
T he observation well network was reviewed in1981 by the Institute of Geological Sciences (nowthe Brit ish Geological Survey) with the aim ofselecting 200 to 300 sites from the existing WaterData Unit archive, to be used for periodical assess-ments of the national groundwater situation. T heselection was based upon the hydrogeological unitsidentifi ed in an investigation of the groundwaterresources of the United Kingdom (M onkhouse andRichards, 1982); one site was chosen for each aquiferpresent within each unit. For Scot land and forNorthern I reland this was not possible due to thevery limited number of observation well s available.In England and Wales, the total nti mber fi nal lyselected was 175 (Monkhouse and Murti, 1981).Since that date, a number of changes have beenmade, and the register shown in this report li sts 173observation wells of which 50 per cent are in theChalk and Upper Greensand aqui fer and 21 per centin the Permo-T riassic sandstones. Further changesmay be expected from time to time.
T he Water Data Unit was offi cially disbanded in1982 and the archive was taken over by the BritishGeological Survey. The archive comprises a series ofpaper fi les containing original data and a series ofcomputer fi les; the latter have been transferred to aNERC computer. T he present situation is that thecomputer archive holding data from the 173 selectedwell s, l isted in the borehole register (see page 168),is being updated and validated, this process beingapproximately 50 per cent completed.T he remaini ngsites inherited from the Water Data Unit are held ona separate computer archive; the validation of this,the historic archive, will be undertaken in the future,but the information is complete only to about 1977.
• In dus context , a well Includes both shafts (const ructed by band-dtggtng)and boreholea (contructed by maclatnery)
Ref erences
M onkhouse, R. A. and Murti, P. K . ( 1981). T herationalisation of groundwater observation wellnetworks in England and Wales. Inst. Geol.Sciences, Report No. WD/8I / I , 18 pp.

164 H Y D R O L O G I C A L D A T A : 1 9 8 4
Monkhouse , R. A. and Richard s, H. J. ( 1982) .Groundwater Resources of the United K ingdom.Commission of the European Communities, pub .T h. Schaeffer Druckerei GmbH, Hannover , 252pp.
M easurement and recording of groundwaterlev els
T he m ajor it y of obse rvat ion wells are measured
manually either weekly or monthly. T he usualinstru ment is an electric probe suspended upon agraduated cable or tape, contact being made by thewater to complete a circuit which gives either anaudible or visual signal at the su rface. Measurementsare norm ally made to the nearest 10 millimet res.
Some obse rvat ion wells are equipped with con-t inuous water level recorders, almost invariab lyoperat ing by a fl oat on the water surface connectedby a cable to a sensing device. T hese recorders maybe driven by clockwork or by electric battery power.Levels are usually recorded on paper char ts or onpunched paper tapes, and expe riment s have beenmade recording directly onto magnetic tapes. Waterlevels are generally recorded to the nearest 10millimet res, although instruments may be accurat e to1 millimet re.
Pressure t ran sducers have also been consideredfor water -level measurement . However, availabletran sducers will measure accurately over only anarrow range of fl uctuation (up to 2 or 3 metres ), ormuch less accurat ely over a wide range. T hey arerarely used at the present time.
Register of Selected GroundwaterObservation Wells
Scop e
T he listed sites were selected so as to give areasonably rep resentative cover for aqu ifersthroughout England and Wales. T he wells aregrouped accord ing to the aquifers to which the waterlevel variat ions in the wells are attributed. Ageneralised list of aquifers is given on page 167.While the aquifer s are tabulated in strat igraphicalorder, most of the local names for individual strat aare omitted and the int ervening aquicludes are notshown.
T he fi ve columns of the register are :
Well Number
T he well numbering system is based on the Nat ionalG rid. Each 100 kilometre square is designated byprefi x char acters, e.g. SE, and is divided into 100squares of 10 kilometre sides designated by numbers00 to 99. T hus, the fi rst site given in the register,5E93/ 4, is located in the 10 kilometre square SE93,
while the number after the solidus denotes that thesite is the four th accessed in this square . A suffi xsuch as A, B, etc ., defi nes the par ticular well when
there are several at the same site.T wo asterisks following the Well Number ind i-
cates an index well for which hydrographs are shownon pages 30 to 35. T he locat ion of the index wellsand the outcrop areas of the pr incipal aquifers areshown on Figure 15.
Grid Ref erence
T he six or eight fi gure references given in theregister relate to the 100 kilometre Nat ional Gridsquare designated by the prefi x characters in the.Well Number . T he distribut ion of the 100 kilometresquares of the National Grid is shown on Figu re 16.
S ite
T he name by which the well or borehole is normallyreferenced.
T he locat ion of all the sites listed in the registerare shown on Figure 16.
Water A uthoriry
An abbrev iation referencing the water authorityresponsible for the groundwater level measurement .A full list of water aut hority codes together with thecorresponding names and addresses appe ars on pages178 and 179.
Records Commence
T he fi rst year for which records are held on thegroundwater archive.

G R O U N D W A T E R L E V E L M E A S U R E M E N T
Figure 15. Princip al aquifers and borehole location map .
Paged eileri ad t;
Ur !Ja ime
a . Weth itk-
Jurassic Urn esto , as
Parrno—Triassic Sandstones
Magnesian Limeetone
165

166
SV:1
NX
SN
NT
0
SY
0
•
0 0
0
0
•0
• 0v
o
V VV
77V
y v o
00 0
0
Figure 16. The rep resentativ e borehole network in England and Wales.
H Y D R O L O G I C A L D A T A 1 9 8 4
cocP
0
Cretace us 0
Jurassic A
Permo—Tria sic 0
Carbon ifer
Fri ? A 4 1AV . A
TV
0
U S '7
TG
TR

G R O U N D W A T E R L E V E L M E A SU R E M E N T 167
TABLE 9. GENERAL ISED U ST OF AQUIFERS I N T HE UNITED KLNGDOM
En
C.)0
0
Key to aquifer importance: • aquifer of minor importance only• '• aquifer producing small , but useful, local suppli es
• • • aquifer of local importance, often providing public supplies• • • • aqui fer of major importance
Symem Sobn un a Acria ta Imp an n n
Quaternary Holocene Superfi cial deposits
Pleistocene Upper and M iddle PleistoceneCrag
T ertiary Pliocene Cora Rine Crag • •
Ol igoceoe
Eocene Bagshot Beds
Lower London T erti ar iesBlackheath & Oldhaven BedsWoolwich & Reading BedsT hanet Beds • •
Cretaceous Upper Cretaceous Chalk and Upper Greensand • • • •
Lower Cretaceous Lower Greensand • • •
Hastings Beds • •
J UEaSSi C Upper Jurassic Port land & Purbeck Beds(Spilsby Sandstone) (• • ).
Cora Dian • •
M iddle Jurassic Great & Inferior Oolitic l imestones • •
( L incolnshire L imestone) ( •• ••)
Lower Jurassic Bridport & Yeovil Sands • •
Marlstone Rock
T riassic Keuper
Bunter
Permo:T nassic sandstones •• ••Permian
M agnesii n L imestone • • •
Carboniferous Upper Carboniferous Coal Measures ••
Mil lstone Gn t ••
Lower Carboni ferous Car boni ferous L imestone ••
Devonian Old Red Sandstone •

THE REGISTER
Well Grid Site Water Records
Number Reference Authori ty Commence
Aquifer : Chalk and Upper Gr eensand5E93/ 4 9212 3634 Dale Plantation YWA 1970
SE9415 * * 9651 4530 Dalton Holme YWA 1889
SE97131 9345 7079 Green Lane YWA 1972
SP90/ 26 9470 0875 Champneys T WA 1962
SP9I159 9380 1570 Pitstone Green Farm AWA 1970
ST 30/ 7 3763 0667 L ime K iln Way SWWA 1969
SUOI / 5 B 0160 1946 Woodyates WWA 1942
S0 04/ 2 0310 4883 T ilshead WWA 1966
SU 14/ 1 1690 4840 Netheravon WWA 1968
5U 17/ 57 * * 1655 7174 Rock ley TWA 1933
5U 32/ 3 3816 2745 Bailey's Down Farm SWA .1963
5U35/ 14 3318 5647 Woodside SWA 1963
51351/ 10 5877 1654 Hil l Place Farm SWA 1965
5U 53/ 94 5589 3497 Abbotstone SWA 1976
SU57/ 159 5628 7530 Calversleys Farm T WA 1973
513 61/ 28 B 6474 1772 West End House SWA 1953
513 61/ 46 6892 1524 Hinton M anor SWA 1953
5U64/ 28 6360 4048 Lower Wield Farm SWA 1961
513 68/ 49 6442 8525 Well Place Farm T WA 1976
513 71/ 23 * * 7755 1490 Compton. House SWA 1893
SU73/ 8 7048 3491 Far ingdon Station T WA 1961
513 76/ 46 7367 6251 Rise ley M ill T WA 1975
513 78/ 45 A 7419 8924 Stonor Park T WA 1961
513 81/ 1 8356 1440 Chilgrove House SWA 1836
5U87/ I 8336 7885 Farm Cottage, Coldharbour T WA 1950
513 89/ 7 8103 9417 Piddington T WA 1966
5Y68/ 34 662 881 Ashton Farm WWA 1977
T A06/ 16 0490 6120 Ni f ferton YWA 1964
T A07/ 28 0940 7740 Hunmanby Hall YWA 1976
T A 10/ 40 1375 0885 L itt le Brocklesby AWA 1926
T A21/ 14 2670 1890 Church Farm YWA 1971
T F72/ I I 7710 2330 Off Farm AWA 1971
T F74/ 1 A 7541 4087 Choseley Farm AWA 1950
T F80/ 33 8738 0526 Houghton Common AWA 1971
T F81/ 2 A" 8138 1960 Washpit Farm AWA 1950
T F94/ 1 9160 4135 Cuckoo Lodge AWA 1952
T G00/ 92 0440 0020 High Elm Farm, Deopham AWA 1971
T G02/ 3 0317 2476 M ain Street, Foulsham AWA 1952
T G03/ 25 B 0382 3583 T he hall , Brinton AWA 1952
T G I 1/ 5 1691 1101 T he Spinney, Costessey AWA 1952
T G 12/ 7 1126 2722 Heydon Pumping Station AWA 1974
T G21/ 9 2400 1657 Frettenham Depot AWA 1952
T G2 I / 10 2699 1140 Grange Farm AWA 1952
T G23/ 21 2932 3101 Melbourne House AWA 1974
T G32/ 67 3390 2020 School Road AWA 1975
T G33/ I 4 3428 3348 Eden Hall AWA 1961
T L 11/ 4 1560 1555 Mackerye End House T WA 1960
T L I 1/ 9 1692 1965 T he Holt T WA 1964
T L 13/ 24 1200 3026 West Hit chin AWA 1970
T L22/ I0 2978 2433 Box Hall T WA 1964
T L 33/ 4 * * 3330 3720 T herfield Rectory T WA 1883
T L42/ 6 4536 2676 Hixham Hall T WA 1964
T L42/ 8 4669 2955 Berden Hall T WA 1964

G R O U N D W AT E R L EV E L M E AS U R E M E N T 169
T L44/ 12 4522 4 182 Redlands Hall T WA 1964T L66/ 2 6 191 60 13 Hall Farm AWA 1964T L72/ 54 7982 2516 Rec tory Road AWA 1968T L84/ 6 8465 4 106 Smeetham Cottages,
BulmerAWA 1963
T L86/ 110 8850 6470 Catt ishall Farm AWA 1969T L89/ 37 8 131 900 1 Grimes Graves AWA 197 1T L92/ 1 9657 2562 Lei den Pumping Station AWA 1961T M 17/ I 1671 7903 Old Parsonage House AWA 1952T M 15/ 112 120 1 56 18 Dial Farm AWA 1968T M 18/ 2 1983 8600 Fu lham Market AWA 1952T M 19/ 2 1810 9270 Hill Farm AWA 1952T M26/ 46 246 1 6 109 Fairfields AWA 1974T M26/ 95 2786 6397 Strawberry Hill AWA 1974T QOI/ 133 0850 1170 Chantry Post, Sullington SWA 1977T Q2I/ 11 2850 1289 Old Rectory, Pyecombe SWA 1958T Q28/ 1I9 B 2996 8051 T rafalgar Square T WA 1845T Q31/ 50 3220 1180 North Bottom SWA 1979T Q35/ 5 3363 5924 Rose & Crown T WA 1876T Q38/ 9 A 3509 8536 Hackney Public Baths T WA 1953T Q50/ 7 5592 0380 Old Rectory, Folkington SWA 1965T Q56/ I9 5648 6124 West Kingsdown TWA 196 1T Q57/ 1I8 5880 7943 T hurrock A13 AWA 1979T Q58/ 2 B 5622 8408 Bush Pit Farm T WA 1967T Q66/ 48 6649 6873 Owlets SWA 1968T Q86/ 55 8528 6185 Stockbury Valley SWA 1963T Q99/ 11 947 97 1 Burnham AWA 1975T R05/ 6 0239 5995 Step Cot tage SWA 1970T R14/ 42 1065 4395 Kingsmill Down SWA 197 1T R 15/ 58 1281 5148 Cotterell Court SWA 1970T R24/ 13 2880 4937 Eythorne Green SWA 1953T R34/ 81 3173 4725 Church Farm SWA 1971T R36/ 62 3208 6634 Alland Grange SWA 1969TV59/ 7 C 5290 9920 Westdean 3 SWA 1904
Aquifer: Lowe r Greensandla.
SU72/ 47 7697 24 14 Westmark Farm SWA 1970SU84/ 8 A 8716 4087 T ilford PumpingiStat ion T WA 1971T L45/ 19 4110 5204 River Farm AWA 1973T Q41/ 79 47 14 127 1 Southover SWA 1970T Q75/ 72 7038 52 18 Marshall Cottages SWA 1969T Q75/ 86 7135 5652 Kiln Barn Farm SWA 1973T R I3/ 21 1132 388 1 Ashley House SWA 1972T R23/ 32 2075 3650 Morehall Depot SWA 1972
Aqu ife n Has tings BedsT Q22/ I 2348 2770 T he Bungalow SWA 1964T Q42/ 10 4684 2794 Greystones SWA 1966T Q43/ 16 4245 3145 Gard e Wych Cross SWA 1973T Q61 / 47 6894 1389 Old Kennels SWA 1966T Q62/ 89 6282 2348 Rose Lodge SWA 1973T Q7I/ 123 7969 1659 Red House SWA 1974
Aquifen Upper JurassicSE68/ I6 6890 8590 Kirkbymoorside YWA 1973SE77/ 76 7690 7300 Broughton YWA 1975SE98/ 8 99 10 8540 Seavegate Farm YWA 1971SU49/ 40 B 4117 9307 East Hanney TWA 1978

170
Aquifer Middle Jurass ic
H Y D R O L O G I C AL D AT A: 19 8 4
SP00/ 62 ** 0595 0 190 Ampney Crusis T WA 1958
SP20/ 113 2721 0634 Alvescot Road T WA 1975
ST 5I / 57 591 169 Over Compton WWA 1971
ST 77/ 8 7834 7682 T ormart in 1 WWA 1973
ST 89/ 32 8642 90 30 Westonbirt School WWA 1932
Aqui fe r Lincolnshire Limesto neSK97/ 25 9800 78 17 Gran ge de Lings AWA 1975
T F03/ 37 ** 0885 3034 New Red Lion AWA 1964
T F04/ 14 0429 4273 Silk Willoughby AWA 1972
—Aquife r Perm o-Tri assic sand stonesNY00/ 328 0511 0247 Browbank Layby NWWA 1974
N Y45/ 16 4947 5667 Corby Hill NWWA 1977
NY62/ 4 ** 6883 230 1 Espland Hill NWWA 1976
NZ4I / 34 4861 1835 Northern Dairies NWA 1974
SD27/ 8 2 172 7171 Furness Abbey NWWA 1972
SD4I / 32 4400 1164 Yew Tree Farm NWWA 1971
SD44/ 15 4396 4928 Moss Edge Farm NWWA 196 1
SE36/ 9 3590 6480 Newfi eld Farm YWA 1968
SE39/ 20 B 3004 9244 Scruton Village YWA 1969
SE44/ 4 B 4880 4850 Healaugh Pumping Stat ion YWA 1968
SE45/ 3 4470 5580 Cattal Malt ings YWA 1969
SE52/ 4 5473 2363 Southfi eld Lane YWA 1955
SE55/ 4 5829 5383 Clifton Hospital YW A 1967
SE60/ 24 6784 0709 Woodhouse Grange ST WA 1980
SE64/ 1 675 1 4463 Wheldrake Station YWA 1971
SE72/ 3 B 7047 2149 Rawcliffe Bridge YWA 1971
SE83/ 9 8040 3640 Holme-on-Spald ing Moor YWA 1972
SJ I5/ 15 1374 5556 Oaklands Bridge WELSH 1972
SJ33/ 39 ** 38 14 3831 Eastwick Farm WELSH 1974
SJ37/ 2 H 3805 7676 Bowater 6 NWWA 197 1
SJ56/ 45 E 5042 6953 Ashton 4 NWWA 1969
SJ69/ 138 6311 9620 Kenyon Lane NWWA 1968
SJ83/ 1 A 8969 3474 Stone STWA 1974
SJ87/ 32 • • 8969 7598 Dale Brow NWWA 1973
SJ96/ 4 I 9310 630 1 Rushton Spencer 1 NWWA 1969
SK00 / 41 067 0 12 Nuttall's Farm ST WA 1974
SK21/ 111 273 1 1419 Grange Wood ST WA 1967
SK24/ 22 2539 4431 Burtonshuts Far m ST WA 1972
SK56/ 53 5632 6440 Peafield Lane STWA 1969
SK68/ 2 I 6100 8374 Crossley Hill Wood ST WA 1970
SK73/ 50 7693 3228 Woodland Farm STWA 1980
S0 71/ 18 7170 1970 Stores Cottage STWA 1973
S0 87/ 28 8160 7970 Hillfields ST WA 196 1
ST I2/ 48 108 267 Milverton Bypass WWA 1972
SX99/ 37 B** 9528 9872 Busse Is 7A S WWA 1 972
SY09/ 21 A 0666 9235 Heath lands SWWA 195 1
Aq u ife r Magne sian LimestoneNZ22/ 22 *• 2875 2896 Rusheyford NE NWA 1967
NZ32/ I B 3780 2983 But terwick NWA 1967
NZ33/ 20 3349 350 1 Garmondsway NWA 1974
5E28/ 28 2460 8520 Bedale YWA 1972
SE35/ 4 3830 5830 Castle Far m YWA 1970
5E43/ 9 • 4535 3964 Peggy Ellerton Farm YWA 1968
SE43/ I4 4660 3550 Coldhill Farm 35 YWA 1971
SE51/ 2 52 10 1530 Westfi eld Farm YWA 197 1
SK46/ 71 4800 6030 Stanton Hill STWA 1973

G R O U N D W A T E R L EV E L M EA SU R E M EN T 171
SK 58/ 43 5248 80 18 Southeads Lane ST WA 1973
Aq uifer Co a l Meas uresSD62/ 35 6925 2945 Lion Brewery NWWA 1974SE23/ 4 2850 3414 Silver Blades Ice Rink YWA 1971SJ98/ 6 9394 8950 Chadkirk Marple NWWA 1982
Aquife r M ill stone Gr i tSD55/ 5 5820 5350 Abbeystead NWWA 1972SD75/ 6 7826 5962 Hen ley Farm NWWA 1973SD83/ 111 8803 3949 Red Scar Mill NWWA 1974SD92/ 8 9833 2660 Horsehold Farm YWA 197 1SE04/ 7 0295 4792 Lower Heights Farm YWA 197 1SE24/ 2 B 2067 40 53 Green Lane Dyeworks YW A 1971SE27/ 8 2120 7380 Kirkby Moor Farm YW A 1971
Aq uifer C a rbonifer ou s Lim es toneNT 95/ 21 9695 50 55 Midd le Ord NWA 1974SE06 / 1 0241 6 183 Jerry Laithe Far m YWA 1971SK 15/ 16 1292 5547 Alstonfield ST WA 1974SK 17/ 13 1778 7762 Huck low South STWA 1969ST 64/ 36 66 10 4460 Water lip Quar ry WWA 1975

á

A suite of retr ieval program s has been writt en inorder to facilitate data usage. At the present time,retr ievals using the options desc ribed below areavailable for most of the sites listed in the register ofselected groundwater observation wells, although notal l the data contained within this ar chive have beenvalidated.
Five options are available for retrieving data. Adescrip tion of each opt ion is• given below andexamples of the computer listings and graphicaloutput are given on pages 174 to 177. Opt ions I to 4give details of the well site, the period of recordavailable, and maximum and minimum recordedlevels in addition to the output specifi c to eachoption. Data may be ret rieved for a specifi c well orfor groups of wells by well reference numbers , byarea (using Nat ional Grid References) , by aquifer,by hydrometric ar ea, by water authority, or by anycombinat ion of these parameters.
Cost of Service
T o cover the computing and handling costs, amoderate charge will be made depending on the
LIST OF GROUNDWATER DATA RETRIEVAL OPTIONS
OPT ION T IT L E
N I ;M BER
1 T able of groundwater levels
T able of annual max mum and minimumgroundwater levels
T able of monthly maximum, min imum andmean groundwater levels
Hydrographs of groundwater levels
THE GR OUNDW A TER DA TARETRIEVA L SER VICE
output options selected. Estimates of these chargesmay be obtained on request ; the right to amend orwaive charges is reserved.
Requests f or retriev al op tions:
Requests for retr ieval opt ions shou ld include: thename and address to which the output should bedirected, the sites, or areas, for which dat a arerequired together with the period of record ofint erest (where appropriate) and the title of therequired option . Where possible, a dayt ime tele-phone number should be given.
Requests should be addressed to:
T he British Geological SurveyHydrogeological Research GroupMaclean BuildingCrowmarsh GiffordWALLIN G FORDOXFORDSH IRE OX IO 8BB
NOT ES
T elephone (0491) 38800
All recorded observat ions of groundwater level inmetres above Ordnance Datum, with dates ofobservation and maximum and minimu m levels foreach year . Specifi c years, or ranges of years, may berequested, otherwise the full period of record isgiven.
Annual maximum and minimum groundwater levelsin metres above Ordnance Datum with dates ofoccurrence. Specifi c years, or ranges of years, may berequested, otherwise the full period of record isgiven.
Monthly maximum , minimum and meangroundwater levels in metres above Ordnance Da-tum, together with the number of years contributingvalues to the calculat ion of each monthly mean. Aspecifi c period of years may be nominated, other wisethe full per iod of record is given.
Provides a well hydrograph for a number of specifi edyears. Caste llated annual p lots of monthly maxi-mum, min imum and mean groundwater levels calcu-lated from a nominated period of years are superim-posed upon the hydrograph, provided that thenominated period exceeds 10 years. T abulations of

174 H Y D R O L O G IC A L D A T A : 1984
Site details
Exam ples of these five options follow.
O PTION 1 TABLE OF GR OU NDWAT ER LEVELS
Station number T F0 3/ 37
Stat ion name NEW RED L IO N, ASLACK BY (CONT IN UES OLD RED LION )
Grid Reference T F 0885 3034
Water Authority AWA
Hydrometric Area 30
Aquifer Lmcolnshire L imestone
Aquifer Code 13
EEC Unit ANO3
Sur face Level (M OD) 3182
Datum Point (M OD) 33.45
Well Depth (M ) 50.00
M ax. Expected ( MOD) 33.45
M in . Expected ( MOD ) 5.00
Period of records in Archive:- 1964 to 1985
M aximum GW Level for per iod of records
Number of M axima 1
Date(s):-
14 03 1977
M inimum GW Level for period of records
Number of M inima 1
Date(s):-
23.69 , 7
3.29
nominated period exceeds 10 years. T abulations ofthe monthly maximum, min imum and mean valuesare also listed, together with the number of years ofrecord used in the calculat ions, and the number ofobservat ions used for each month.
T he output comprises the well reference number ofthe Brit ish Geological Sur vey, the or iginal (WaterData Unit ) station number (where applicable) , thehydrometric area, the aquifer name and code, thesite name and locat ion, the National Grid Refer -ence, the depth of the well, the datum point s (fromwhich measurements are made) , the alt itude of theground surface, the per iod of record and the waterauthority area in which the well or borehole islocated.

T H E G R O U N D W A T E R D A T A R ET R I EV A L SE R V I C E 175
Number of minima 1Dates 19 Dec
OP TION 2 TA BLE OF ANNU AL MAXIMUM AND MINIMUMGROU NDWATE R LEVE LS
Year M aa"M m l a vel( M n i” Dani s) No of c“ atroaa
OP TION 3 TABLE OF MONT HLY MAXIMUM, MINIMUM AND MEA NGROU NDWATER LEVE LS
Period maximum, minimum and mea n groundwater levels for yea rs 1964 to 1985
M ammon M M IT LIM M ean No of yean
Jan 22.58 7.85 14.75 21Feb 23.29 79 7 16.50 21
M ar 2349 6.14 171 7 21
Apr 22.97 54 1 17.17 22
M ay 22 00 4.80 16.52 21
Jun 21.28 4.11 15.40 21
Jul 194 9 3.42 14.03 21
Aug 1708 3.29 129 7 21
Sep 18.84 1 37 12.23 21
Oct 179 8 3.82 11.78 21
Nov 220 6 70 3 12.08 21
Dec 21.51 7.81 13.04 21

176 H Y D R O L O G IC A L D A T A : 1984-
O P T IO N 4 HYDROGRA P H S OF GROU NDWATE R LEVELS
Hydrograph of monthly m aximums, minimum s and means ca lculated from years 1964 to 1982
T herefore maximum number of years from which monthly maxs, mins and means may be calculated is 19
Hydrograph(s) plotted for year ranges:- 1973 to 1977
25
Site name: Neve Red L ion: & Webby (coo ti nuas Old Red L ion)Nati onal grid reference: TF 0885 3634Aquifer ; L incolnshire Limestone
ir
-
I C - 7 -LU
I I
•
I J J k i s
1973
i 1_1_ 1 • I I I
o
15 -
f i_.0
i i -
/ 9 74 1975
Mar Min and Mean values calculated I rom years 1964 to 1982
-1•
I l l 1 • 1 1 1 I I / I I I ' 1 1
- 1 i tv .1H \ In *
Im
Well number : TF 03/ 37Measur ing level . 33 45 m OD
1976 1977
t t I - k M J i / e n s o r r i l k I I S 0 1.4.11 nk l o JO-In AI.. j j I t S O N 0 -

T H E G R O U N D W A T E R D A T A R ET R I E V A L SE R V I C E 177
O P T IO N 5 sn t DETAILS
1973- 1984 NWW A PERMO-T RIASSIC, SAN DST ON ES

DIRECTORY OF MEA SURINGA UTHORITIES
Water Authorities
Anglian Water
Nor thumbrian Water
North West Water
Severn T ren t Water
Southern Water
South West Water
T hames Water
Welsh Water
Wessex Water
Yorkshire Water
River Purifi cation Boards
Clyde River Puri fi cationBoard
Forth River Purifi cationBoard
Highland River Purifi cat ionBoard
N orth East RiverPurifi cat ion Board
Solway RiverPuri fi cat ion Board
T ay River Puri fi cat ionBoard
T weed River Purifi cationBoard
Other measuring authorities
Borders Regional Council
Corby and District WaterCompany
Address
Amebury Road, HuntingdonPE 18 6N Z
Northumbr ia House, Regent Centre,Gosforth, Newcast le-upon-T yne,N E3 3PX
Dawson House, Liverpool Road,Great Sankey, Warr ington,WA5 3LW
Abelson House, 2297 Coventry Road ,Sheldon, Birmingham, B26 3PU
G uildbourne House, Chatsworth Road,Worthing BN 11 1LD
Peninsu la House, Rydon Lane,Exeter EX2 7HR
Nugent House , Vastern Road,Reading RG 1 8DB
Cambrian Way, Brecon, PowysLD3 7HP
Wessex House , Passage Street ,Bristol BS2 OJQ
West Rid ing House , 67 Albion Street,Leeds LS1 5AA
Rivers House, Murray Road,East Kilbride, Glasgow G75 OLA
Colinton Dell House, West M ill RoadColinton, Edinburgh, EH 13 OPH
Strathpeffer RoadDingwall IV 15 9QY
Woodside House, Persley,Aberdeen AB2 2UQ
River s House, Irongray RoadDumfries DG2 OJE
3, South StreetPerth PH2 8NJ
Burnbrae, Mossillee Road,Galashiels T D 1 IN F
West Grove, Waver ley Road,Melrose T 0 6 95J
Stanion Lane, CorbyN N 18 8ES
Code
AWA
N WA
NWWA
ST WA
SWA
SWWA
T WA
WELS(WELSH)
WWA
YWA
CRP B
FRPB
HRPB
N ERP B
SRPB
T RPB
T WRP B
BRWO
CDWC

D I R E C T O R Y O F M E A S U R I N G A U T H O R I T I E S 179
Depar tment of the Environment(Nor thern Ire land)
Dumfries and Gall owayRegional Council(Water Departm ent)
Essex Water Company
Grampian Regional Council(Water ServicesDepar tment)
Greater London Council(Abolished Apr il 1986)
Highland Regional Council(Water Depar tment )
Institute of Hydrology
Lothian Regional Council(Water Supply ServicesDepartment)
Newcast le and GatesheadWater Company
North of Scot landHydro-Electr ic Board
Str athclyde RegionalCouncil (WaterDepar tment )
T ayside Regional Council(Water ServicesDepar tment)
Stormont, BelfastBT 4 3SS
70 T erregles S t r ee t
Dumfries DG 2 9BB
342 South Str eetRomford RM 1 2AL
Wood hill House,Ashgrove Road West,
Public Health Engineering,Drury House,32, Vauxhall Bridge RoadLondon SW 1V 25A
Regional BuildingsGlenurquhart RoadInverness IV3 5N X
Maclean Building,Crowmarsh Gifford , Wallingford ,OX IO 8BB
6 Coc kburn Street ,Edinbu rgh
PO Box 10, Allendale Road,Newcast le-upon-T yneNE6 2SW
16 Rothesay T errace,Edinburgh EH 3 7SE
4 19 Balmore Road ,Glasgow G 22 6NU
Bullion House, Invergowrie,Dundee DD2 5BB
DOEN
DGRW
EWC
GRWD
G LC
HRCW
IH
LRWD
NGWC
NSHE
SRCW
T RWS

á

P UBLICA TIONS
Tide
I . Yearbook 19812. Yearbo ok 1982
3. T he 1984 Drought4. Yearbook 19835, Yearbook 1984
Publi shed Price ( inclusive ofsecond class postage
with in the UK)
Loose Leaf Bound1985 £10 £ 121985 £ 10 £ 12
1985 - - £ 121986 £ 12 £ 151986 £ 12 ( 15
The Yearbooks are available as bound volumes oras sets of pre-punched sheets for inser tion in a ringbinder designed to hold fi ve year books and the fi ve-yearly catalogue with summary statistics. T he ringbinder may be purchased for £ 42 to include the198 1, 1982, 1983 and 1984 yearbooks. Organisationsand individuals purchasing the ring binder will beentit led to receive free updates of the data sheets for
The 1984 Drought
A fuller treatment of the hydrological condit ionsduring 1984 is given in 'T he 1984 Drought ' anoccasional rep ort in the Hydrological data: UKseries. T he rep ort documents the drought of 1984 ina water resources framework. T he development ,durat ion and severity of the drought are examinedwith part icular reference to regional variations inintensity. Assessments ar e made of the likely fre-quency of occurrence of the drought and its magni-tude is considered both in the perspec tive providedby historical records of rainfall and runoff , and in thecontext of the recent somewhat errat ic climaticbehaviour. A specifi c compar ison is made with thegreat drought of 1975/ 76.
ind ividual Yearbooks when a significant revision tothe published data is made. T he revised data sheetswill normally be issued on an annual basis.
All the Hydrological data: UK publi cations andthe ring binder may be obtained from :-
Institute of HydrologyMaclean BuildingCrowmarsh Giff ordWALLINGFORDOXFORDSH IRE OX10 8BB
T elephone: Wallingford (049 1) 38800
Enquiries or comments regard ing the series, orind ividual publications ar e welcomed and shou ld bedirected to the Surface Water Archive Offi ce at theabove address.

á

á

á

á

3 E L
• r IF L P - 1
NaturalEnvironmentResearchCouncil
-.=,0 0-
H l H- fl o
L- I 1 Li
The Inst
c!,° Or
- I_ -
-• ',a_
- Ha-m° •
ute of Hydrology and the British Geological Surveyara component establishments of theNatural Environment Research Council
Design: P A Benoist
Graphics: J J Carr
Typeset by Burgess & Son (Abingdon) Ltd .
'