Integrated use of geophysical, hydrological and geographic information system (GIS) methods in...
11
1 23 Hydrogeology Journal Official Journal of the International Association of Hydrogeologists ISSN 1431-2174 Volume 20 Number 8 Hydrogeol J (2012) 20:1589-1597 DOI 10.1007/s10040-012-0898-3 Integrated use of geophysical, hydrological and geographic information system (GIS) methods in enhancing the groundwater quality in a fluoride-endemic terrain (Andhra Pradesh, India) Rolland Andrade
-
Upload
independent -
Category
Documents
-
view
5 -
download
0
Transcript of Integrated use of geophysical, hydrological and geographic information system (GIS) methods in...
1 23
Hydrogeology JournalOfficial Journal of the InternationalAssociation of Hydrogeologists ISSN 1431-2174Volume 20Number 8 Hydrogeol J (2012) 20:1589-1597DOI 10.1007/s10040-012-0898-3
Integrated use of geophysical, hydrologicaland geographic information system (GIS)methods in enhancing the groundwaterquality in a fluoride-endemic terrain(Andhra Pradesh, India)Rolland Andrade

1 23
Your article is protected by copyright and
all rights are held exclusively by Springer-
Verlag. This e-offprint is for personal use only
and shall not be self-archived in electronic
repositories. If you wish to self-archive your
work, please use the accepted author’s
version for posting to your own website or
your institution’s repository. You may further
deposit the accepted author’s version on a
funder’s repository at a funder’s request,
provided it is not made publicly available until
12 months after publication.
Integrated use of geophysical, hydrological and geographicinformation system (GIS) methods in enhancing the groundwaterquality in a fluoride-endemic terrain (Andhra Pradesh, India)
Rolland Andrade
Abstract The concept of groundwater recharge andquality improvement is often implemented in arid andsemi-arid areas with depleted aquifers. Nalgonda districtin Andhra Pradesh, India, has endemic fluoride, withconcentrations in drinking water varying between 3 and8mg/l. Numerous techniques adopted in the recent past fordefluoridizing groundwater proved to have limitations.The integrated approach of a geographic informationsystem (GIS) and an analytic hierarchy process (AHP),to identify suitable sites for recharge structures over anarea of ∼115km2, is highlighted. Further, to validate thedelineated sites, a micro-watershed basin (2km2) wasselected for detailed recharge assessment and site feasi-bility studies through geophysical and tracer tests.Groundwater velocity (7m/day) and flow directionthrough fractures in the shallow horizon were establishedthrough tracer experiments. The efficacy of the recom-mended recharge structures and their impact on ground-water quality were assessed over a period of 5years, from2002 to 2007, and the mean groundwater fluorideconcentration of>3.5mg/l over the study area was broughtdown to<1.5mg/l.
Keywords Artificial recharge . Tracer tests . Fluoride .Geographic information systems . India
Introduction
Although there has been tremendous progress inIndia’s rural water-supply infrastructure since settingup of the Rajiv Gandhi National Drinking WaterMission in 1986, the goal to provide safe drinkingwater to all is still to be achieved (Sharma 2003).
Excess fluoride in groundwater is a perennial problemin most of the semi-arid hard-rock regions of theIndian sub-continent, where the potable drinking-watersupply to the remote rural areas are dependent ongroundwater sources. Ever-increasing population andthe increased need for agriculture and industries haveresulted in water scarcity in several provinces. Variousstates of India have an endemic fluorosis problem, asconcluded in the survey carried out by the CentralGround Water Board (CGWB) in 1999; the totalnumber of persons affected through groundwaterhaving fluoride above 1.5 mg/l as a source of drinkingwater was estimated as 54.39 million. The number ofthose affected by fluorosis is estimated at 2.5–3.0million. There is no clear evidence of an increase influoride content in groundwater with increase ingroundwater exploitation. It is also not statisticallyproved that the deeper aquifers under exploitation areladen with high fluoride. Under these circumstances, itis prudent to understand the mobilization of fluoride inland and water and to make scientific effort inmitigating the excess fluoride problem in rural water-supply programs.
The state of Andhra Pradesh has more than 7,000villages affected with excess fluoride, and the worstaffected districts in the state are Nalgonda, Anantha-pur, Guntur, Prakasam and Kurnool, where fluorideconcentration in groundwater ranges between 2 and11 mg/l. The study area discussed in this report, thewatershed associated with Wailepalli village, Nalgondadistrict, is where there are neither fluoride-basedindustries nor active volcanoes and also the rain wateranalysis for fluoride has shown only a trace amount of0.03 mg/l (Rama Mohana Rao 1982). Occurrence ofgroundwater in crystalline rocks, especially alkalinegranites (deficient in calcium), makes the naturalsystem more susceptible to release of fluoride ions(Rama Mohana Rao 1993).
In this report the application of GIS and remotesensing was mainly to prepare different maps, whichwere used as an input parameter in analytic hierarchyprocess (AHP) analysis for delineating suitable sitesfor constructing recharge structures like check damsand percolation ponds in the entire study area. The site
Received: 17 October 2011 /Accepted: 18 July 2012Published online: 8 August 2012
* Springer-Verlag 2012
R. Andrade ())Groundwater Department National Geophysical Research Institute,Council of Scientific and Industrial Research,Room 214, GW Building Uppal Road, Hyderabad, 500 007, Indiae-mail: [email protected]
Hydrogeology Journal (2012) 20: 1589–1597 DOI 10.1007/s10040-012-0898-3
Author's personal copy
suitability and feasibility studies were carried out in a2-km2 micro-watershed situated near Pallagattu Tandavillage. Surface geophysical investigation and tracer
studies were carried out over the selected area tounderstand the sub-surface lithology and groundwaterbehaviour with time.
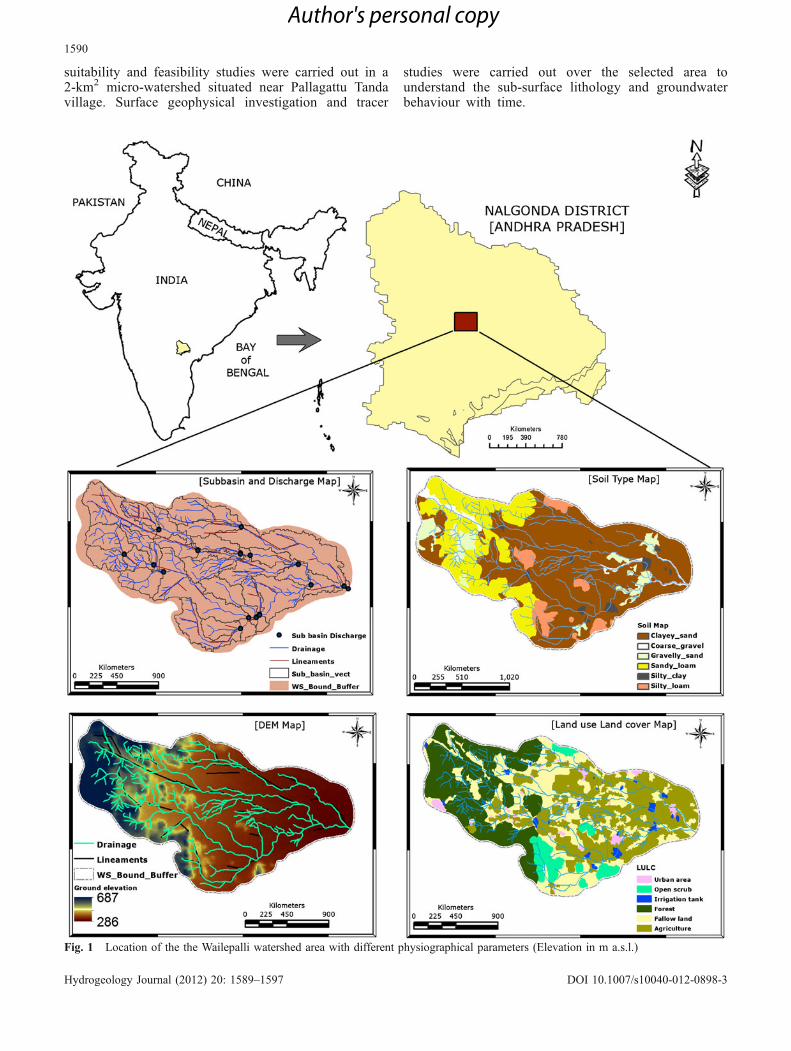
Fig. 1 Location of the the Wailepalli watershed area with different physiographical parameters (Elevation in m a.s.l.)
1590
Hydrogeology Journal (2012) 20: 1589–1597 DOI 10.1007/s10040-012-0898-3
Author's personal copy
Study area
The study area is located in Nalgonda district ofAndhra Pradesh; Wailepalli watershed has a spatialextent of 115 km2 and lies between the latitude 17and 17.15°N and longitude 78.8 and 79° E. It is locatedat a distance of about 75 km ESE of the city ofHyderabad. The study area forms part of Krishna Rivercatchment, with elevation ranging from 635 m abovesea level (asl) in the NW to 128 m asl in the SE,depicting highly rugged terrain with hills and plains.The watershed area mainly comprises Archean granitewith pegmatite veins in which locally some free fluoritemineralization and other fluoride bearing minerals, likeapatite, biotite and hornblende, are reportedly observed.The area experiences arid to semi-arid climate with anaverage annual rainfall of approximately 500 mm. Therocks in general belong to the Precambrian granitecomplex with numerous surficial fractures and joints.The Wailepalli watershed comprises a number of secondand third order streams having a drainage pattern of thenature parallel to sub-parallel in the western part andsub-dendritic to dendritic in the eastern part (Andrade2009). The area comprises a number of lineaments andstructures like dykes, trending NS and EW in direction.The entire Wailepalli watershed has been sub-dividedinto 31 micro-watersheds based on digital elevationmodel (DEM) analysis using the Arc Soil and WaterAssessment Tool (SWAT) in GIS. Several maps, likelineament/drainage, soil-type, Land use/Land cover(LULC) and the elevation map of the watershed, werededuced based on the integrated application of GISand remote sensing data as shown in Fig. 1. Thesemaps were used as input parameters in AHP foridentifying suitable recharge sites, as explainedpreviously.
Groundwater quality conditions: fluoride
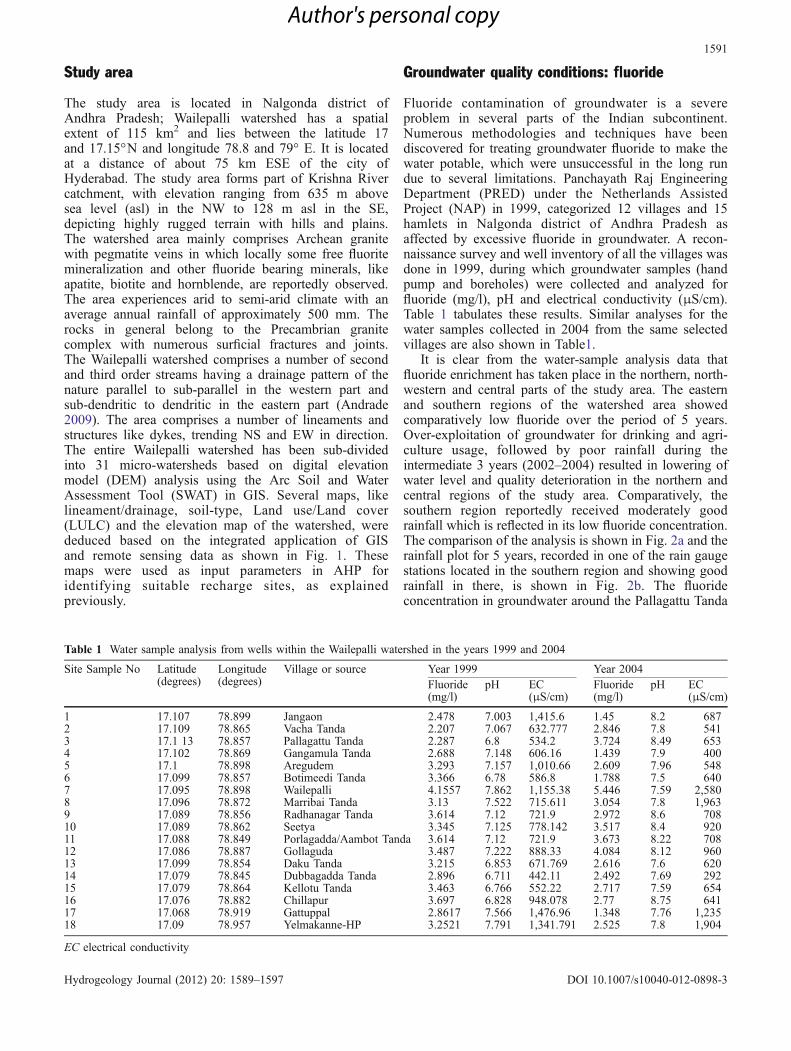
Fluoride contamination of groundwater is a severeproblem in several parts of the Indian subcontinent.Numerous methodologies and techniques have beendiscovered for treating groundwater fluoride to make thewater potable, which were unsuccessful in the long rundue to several limitations. Panchayath Raj EngineeringDepartment (PRED) under the Netherlands AssistedProject (NAP) in 1999, categorized 12 villages and 15hamlets in Nalgonda district of Andhra Pradesh asaffected by excessive fluoride in groundwater. A recon-naissance survey and well inventory of all the villages wasdone in 1999, during which groundwater samples (handpump and boreholes) were collected and analyzed forfluoride (mg/l), pH and electrical conductivity (μS/cm).Table 1 tabulates these results. Similar analyses for thewater samples collected in 2004 from the same selectedvillages are also shown in Table1.
It is clear from the water-sample analysis data thatfluoride enrichment has taken place in the northern, north-western and central parts of the study area. The easternand southern regions of the watershed area showedcomparatively low fluoride over the period of 5 years.Over-exploitation of groundwater for drinking and agri-culture usage, followed by poor rainfall during theintermediate 3 years (2002–2004) resulted in lowering ofwater level and quality deterioration in the northern andcentral regions of the study area. Comparatively, thesouthern region reportedly received moderately goodrainfall which is reflected in its low fluoride concentration.The comparison of the analysis is shown in Fig. 2a and therainfall plot for 5 years, recorded in one of the rain gaugestations located in the southern region and showing goodrainfall in there, is shown in Fig. 2b. The fluorideconcentration in groundwater around the Pallagattu Tanda
Table 1 Water sample analysis from wells within the Wailepalli watershed in the years 1999 and 2004
Site Sample No Latitude(degrees)
Longitude(degrees)
Village or source Year 1999 Year 2004Fluoride(mg/l)
pH EC(μS/cm)
Fluoride(mg/l)
pH EC(μS/cm)
1 17.107 78.899 Jangaon 2.478 7.003 1,415.6 1.45 8.2 6872 17.109 78.865 Vacha Tanda 2.207 7.067 632.777 2.846 7.8 5413 17.1 13 78.857 Pallagattu Tanda 2.287 6.8 534.2 3.724 8.49 6534 17.102 78.869 Gangamula Tanda 2.688 7.148 606.16 1.439 7.9 4005 17.1 78.898 Aregudem 3.293 7.157 1,010.66 2.609 7.96 5486 17.099 78.857 Botimeedi Tanda 3.366 6.78 586.8 1.788 7.5 6407 17.095 78.898 Wailepalli 4.1557 7.862 1,155.38 5.446 7.59 2,5808 17.096 78.872 Marribai Tanda 3.13 7.522 715.611 3.054 7.8 1,9639 17.089 78.856 Radhanagar Tanda 3.614 7.12 721.9 2.972 8.6 70810 17.089 78.862 Seetya 3.345 7.125 778.142 3.517 8.4 92011 17.088 78.849 Porlagadda/Aambot Tanda 3.614 7.12 721.9 3.673 8.22 70812 17.086 78.887 Gollaguda 3.487 7.222 888.33 4.084 8.12 96013 17.099 78.854 Daku Tanda 3.215 6.853 671.769 2.616 7.6 62014 17.079 78.845 Dubbagadda Tanda 2.896 6.711 442.11 2.492 7.69 29215 17.079 78.864 Kellotu Tanda 3.463 6.766 552.22 2.717 7.59 65416 17.076 78.882 Chillapur 3.697 6.828 948.078 2.77 8.75 64117 17.068 78.919 Gattuppal 2.8617 7.566 1,476.96 1.348 7.76 1,23518 17.09 78.957 Yelmakanne-HP 3.2521 7.791 1,341.791 2.525 7.8 1,904
EC electrical conductivity
1591
Hydrogeology Journal (2012) 20: 1589–1597 DOI 10.1007/s10040-012-0898-3
Author's personal copy
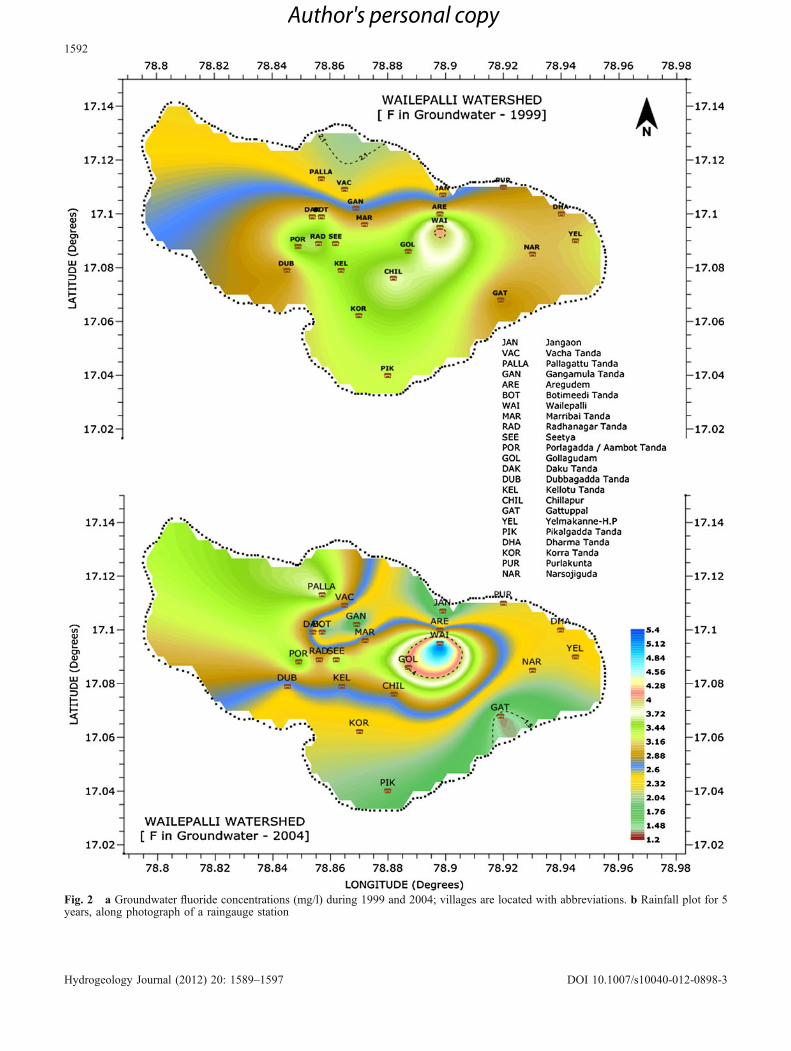
Fig. 2 a Groundwater fluoride concentrations (mg/l) during 1999 and 2004; villages are located with abbreviations. b Rainfall plot for 5years, along photograph of a raingauge station
1592
Hydrogeology Journal (2012) 20: 1589–1597 DOI 10.1007/s10040-012-0898-3
Author's personal copy
micro-watershed in particular has shown a significant rise,from 2.2 to 3.7 mg/l over the period of 5 years. Thismicro-watershed area (2 km2) was selected for validatingthe site suitability and also to monitor the impact of therecharge structures on groundwater quality and quantity,through geophysical and hydrological interventions.
Methodology: computation of suitable siteselection for water harvesting structures
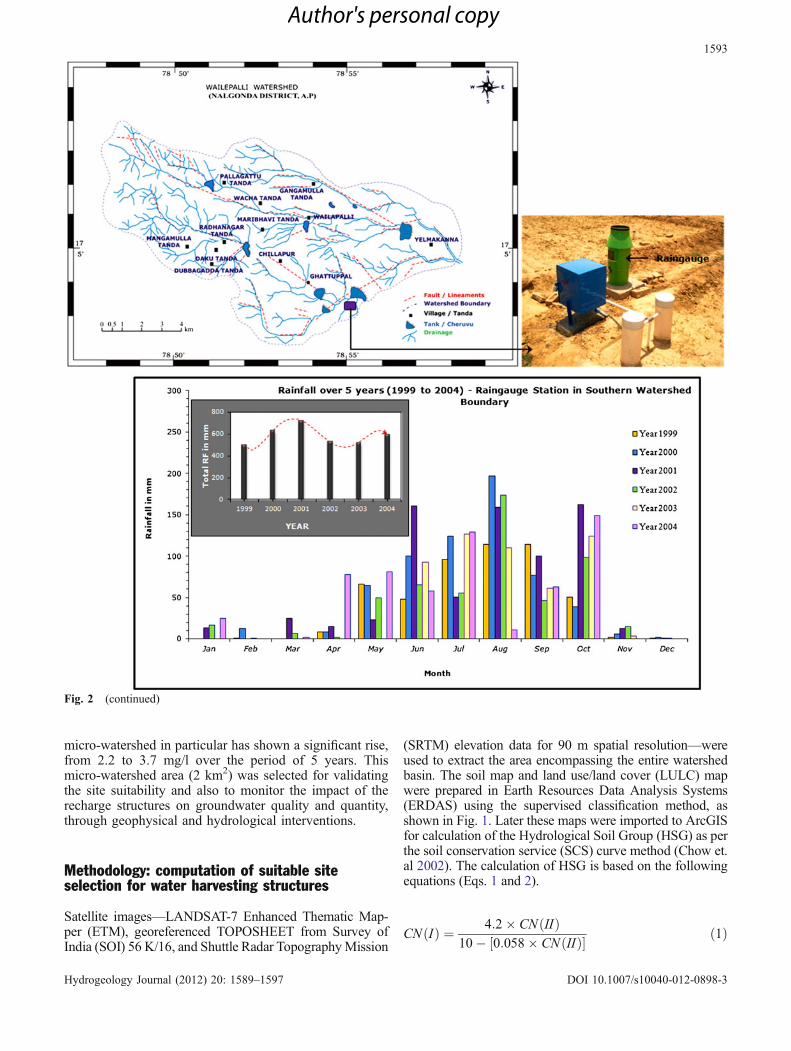
Satellite images—LANDSAT-7 Enhanced Thematic Map-per (ETM), georeferenced TOPOSHEET from Survey ofIndia (SOI) 56 K/16, and Shuttle Radar TopographyMission
(SRTM) elevation data for 90 m spatial resolution—wereused to extract the area encompassing the entire watershedbasin. The soil map and land use/land cover (LULC) mapwere prepared in Earth Resources Data Analysis Systems(ERDAS) using the supervised classification method, asshown in Fig. 1. Later these maps were imported to ArcGISfor calculation of the Hydrological Soil Group (HSG) as perthe soil conservation service (SCS) curve method (Chow et.al 2002). The calculation of HSG is based on the followingequations (Eqs. 1 and 2).
CNðIÞ ¼ 4:2� CN IIð Þ10� 0:058� CN IIð Þ½ � ð1Þ
Fig. 2 (continued)
1593
Hydrogeology Journal (2012) 20: 1589–1597 DOI 10.1007/s10040-012-0898-3
Author's personal copy
CN IIIð Þ ¼ 23� CN IIð Þ10þ 0:13� CN IIð Þ½ � ð2Þ
Where, CN(II) is the curve number for the normalcondition, CN(I) is the curve number for dry conditions,and CN(III) is the curve number for wet conditions.
The entire watershed area was classified into micro-watersheds using Arc-SWAT. Later the rainfall data forfive successive years (2002–2006) were analyzed and thedischarge calculation for individual micro-watershedbasins was done using the formulae in Eqs. (3) and (4).
Q ¼ P � Iað Þ2 P � Ia þ Sð Þ= ð3Þ
Q ¼ P � 0:2 Sð Þ2 P þ 0:8 S= P0:2 S ð4Þwhere Q is surface runoff (m3/s), P is the precipitation(mm), Ia is initial abstraction and S is the saturation index.
The correlation coefficient for surface runoff calculatedfor individual, and total watershed area for differentrainfall season was found to be 12–20 %. The analytichierarchy process (AHP), a decision-making method, wasadopted for the calculation of suitable site delineation forrecharge structures using the specification as given by
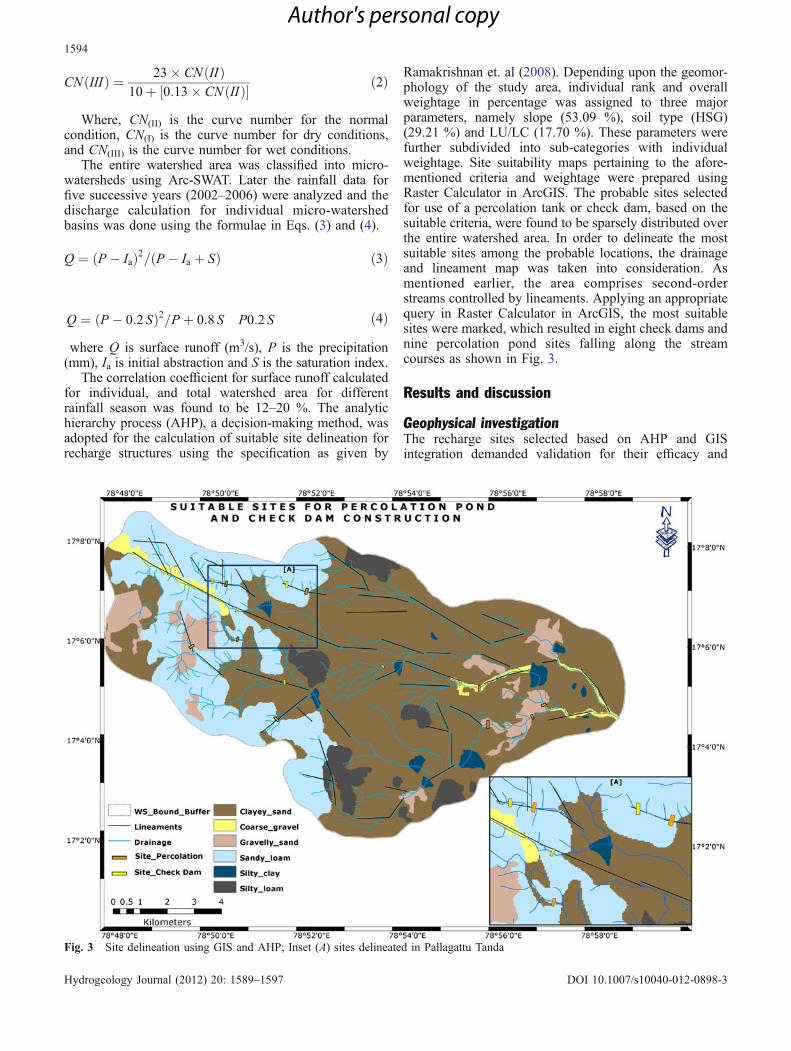
Ramakrishnan et. al (2008). Depending upon the geomor-phology of the study area, individual rank and overallweightage in percentage was assigned to three majorparameters, namely slope (53.09 %), soil type (HSG)(29.21 %) and LU/LC (17.70 %). These parameters werefurther subdivided into sub-categories with individualweightage. Site suitability maps pertaining to the afore-mentioned criteria and weightage were prepared usingRaster Calculator in ArcGIS. The probable sites selectedfor use of a percolation tank or check dam, based on thesuitable criteria, were found to be sparsely distributed overthe entire watershed area. In order to delineate the mostsuitable sites among the probable locations, the drainageand lineament map was taken into consideration. Asmentioned earlier, the area comprises second-orderstreams controlled by lineaments. Applying an appropriatequery in Raster Calculator in ArcGIS, the most suitablesites were marked, which resulted in eight check dams andnine percolation pond sites falling along the streamcourses as shown in Fig. 3.
Results and discussion
Geophysical investigationThe recharge sites selected based on AHP and GISintegration demanded validation for their efficacy and
Fig. 3 Site delineation using GIS and AHP; Inset (A) sites delineated in Pallagattu Tanda
1594
Hydrogeology Journal (2012) 20: 1589–1597 DOI 10.1007/s10040-012-0898-3
Author's personal copy
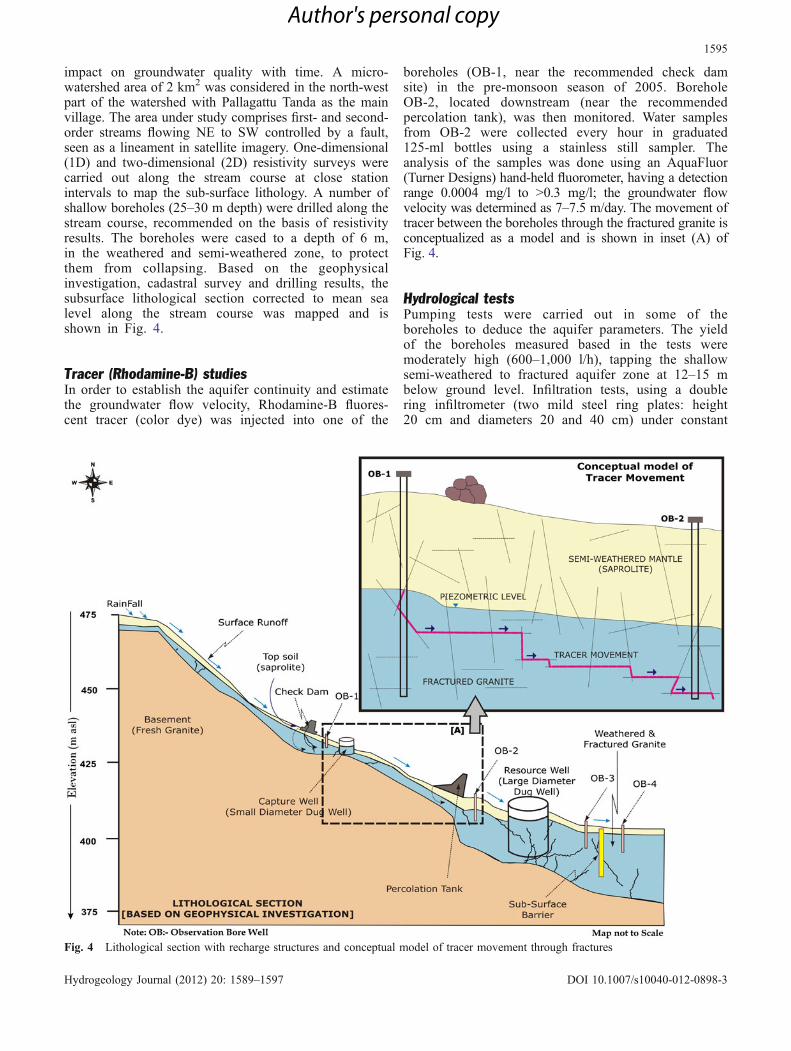
impact on groundwater quality with time. A micro-watershed area of 2 km2 was considered in the north-westpart of the watershed with Pallagattu Tanda as the mainvillage. The area under study comprises first- and second-order streams flowing NE to SW controlled by a fault,seen as a lineament in satellite imagery. One-dimensional(1D) and two-dimensional (2D) resistivity surveys werecarried out along the stream course at close stationintervals to map the sub-surface lithology. A number ofshallow boreholes (25–30 m depth) were drilled along thestream course, recommended on the basis of resistivityresults. The boreholes were cased to a depth of 6 m,in the weathered and semi-weathered zone, to protectthem from collapsing. Based on the geophysicalinvestigation, cadastral survey and drilling results, thesubsurface lithological section corrected to mean sealevel along the stream course was mapped and isshown in Fig. 4.
Tracer (Rhodamine-B) studiesIn order to establish the aquifer continuity and estimatethe groundwater flow velocity, Rhodamine-B fluores-cent tracer (color dye) was injected into one of the
boreholes (OB-1, near the recommended check damsite) in the pre-monsoon season of 2005. BoreholeOB-2, located downstream (near the recommendedpercolation tank), was then monitored. Water samplesfrom OB-2 were collected every hour in graduated125-ml bottles using a stainless still sampler. Theanalysis of the samples was done using an AquaFluor(Turner Designs) hand-held fluorometer, having a detectionrange 0.0004 mg/l to >0.3 mg/l; the groundwater flowvelocity was determined as 7–7.5 m/day. The movement oftracer between the boreholes through the fractured granite isconceptualized as a model and is shown in inset (A) ofFig. 4.
Hydrological testsPumping tests were carried out in some of theboreholes to deduce the aquifer parameters. The yieldof the boreholes measured based in the tests weremoderately high (600–1,000 l/h), tapping the shallowsemi-weathered to fractured aquifer zone at 12–15 mbelow ground level. Infiltration tests, using a doublering infiltrometer (two mild steel ring plates: height20 cm and diameters 20 and 40 cm) under constant
Fig. 4 Lithological section with recharge structures and conceptual model of tracer movement through fractures
1595
Hydrogeology Journal (2012) 20: 1589–1597 DOI 10.1007/s10040-012-0898-3
Author's personal copy
head conditions, were carried out at several locationswithin the impounding areas of the proposed checkdam and percolation tank. This hydrological study wasdone to estimate the infiltration capacity of the soil inthe impounding area of the proposed recharge sites.The infiltration rate was then calculated using theformula given below for various time intervals.
IR ¼ VI Ajð Þ � t2� t1 60jð Þ � 10 ð5Þwhere IR = infiltration rate in cm/h; VI = volume ofinfiltrated water (cm3); t2 – t1 = time between beginningand end (min); A = area occupied by inner ring (cm2).
Five sites on each tank-bed (check dam or percolationtank) area were investigated and the average infiltrationrates within the two tank-bed areas were found to be 870and 1000 mm/h, respectively. Soil samples were collectedfrom each infiltration test site and were subjected to
saturated permeability tests with a constant head methodusing a laboratory permeameter (Eijkelkamp - closedsystem). The calculation of hydraulic conductivity underconstant head (closed system) was done using:
K ¼ V � L Ajð Þ � t � h ð6Þwhere V = volume of water flowing through the sample(cm3); L = length of the soil sample (cm); A = surface areaof a cross section of the sample (cm2); T = time betweenbeginning and end of the measuring (t2 – t1) (d); and H =water level difference inside and outside ring holdersample cylinder (cm). Based on the preceding calculation,the hydraulic conductivity for the tank-bed soils wasestimated to be 600–750 mm/h.
Borehole OB-1 and the ‘capture well’ (small diameterdug well) on the downstream side of the check dam, andborehole OB-2 and the ‘resource well’ (large diameter dug
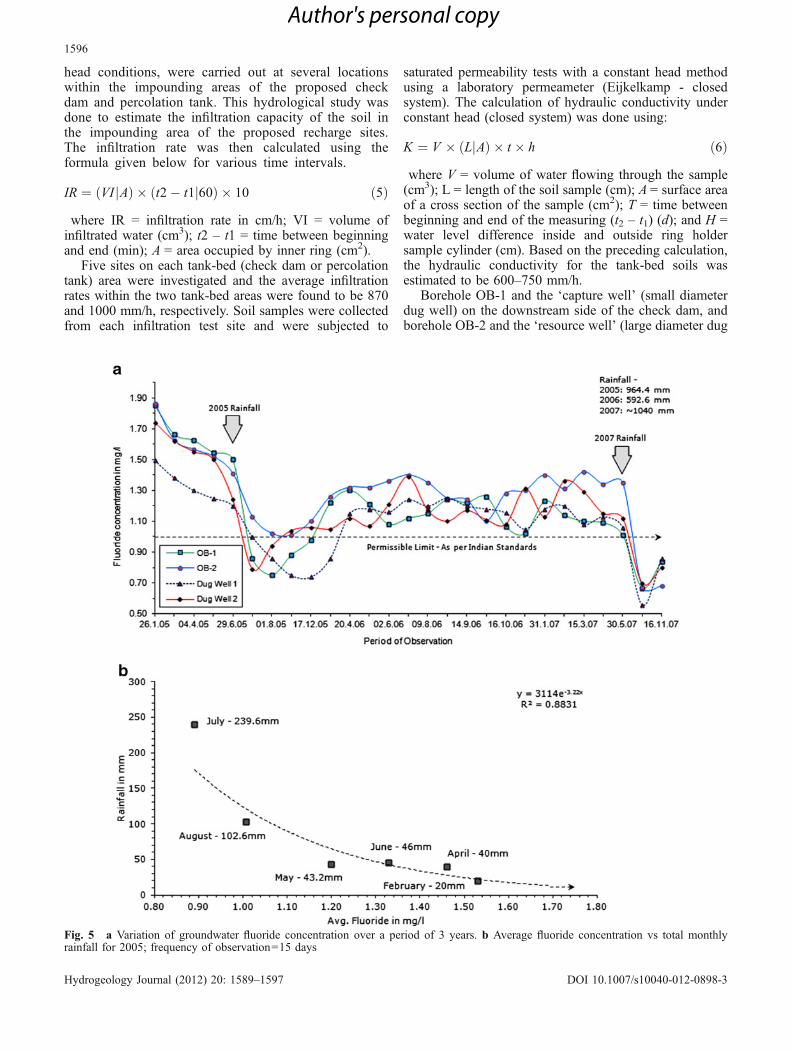
Fig. 5 a Variation of groundwater fluoride concentration over a period of 3 years. b Average fluoride concentration vs total monthlyrainfall for 2005; frequency of observation=15 days
1596
Hydrogeology Journal (2012) 20: 1589–1597 DOI 10.1007/s10040-012-0898-3
Author's personal copy
well) on the downstream side of the proposed percolationtank (Fig. 4) were monitored bimonthly for 3 years, from2005 to 2007, after commissioning of the structures. Theinitial fluoride concentration in groundwater had reducedfrom ∼2 to<0.9 mg/l over the micro-watershed, which isbelow the permissible limit as per Indian drinking waterstandards, over a period of three hydrological cycles asshown in Fig. 5a. Groundwater fluoride variation withrainfall over the single hydrological cycle of 2005 isplotted in Fig. 5b. The results showed an exponentialcorrelation between the two, depicting a rise in fluorideconcentration with lesser rainfall. These two observationsin terms of water quality revealed that the rechargestructures, used for harvesting surface runoff and inducingartificial recharge, had dual impact. Aquifer recharge wasfollowed by groundwater quality enhancement due toinducement of fresh water impoundment near the rechargestructures.
Water-level monitoring of the study area was donealong with quality analysis, using an automatic datalogger, in all the drilled boreholes. Groundwater qualityassessment and water-level variation revealed groundwa-ter outflow in the downstream region of the study area. Inorder to harvest the low fluoride groundwater outflow, ageophysical investigation (2D resistivity survey withcloser spacing) was done 100 m downstream of theresource well. Based on the 2D imaging results, asubsurface barrier was constructed across the width ofthe stream course as shown in Fig. 4. The effectiveness ofthe sub-surface barrier in restricting the outflow ofgroundwater was tested using potassium bromide (KBr)tracer between the two boreholes OB-3 and OB-4, oneither side of the barrier. The injected tracer behavior wasmonitored for 60 days in both the observation wells, bycollecting samples in bottles using two separate samplersand by on-site measurement of electrical conductivity. Theelectrical conductivity value in the injected borehole (OB-3)rose to 5,000 μS/cm and gradually descended to normality,over a period of 10–12 days. The borehole on the other sideof the sub-surface barrier (OB-4) did not show any indicationof tracer or increase in conductivity during the monitoringperiod.
The studies discussed in the previous were carriedover one micro-watershed area to validate the rechargesites (check dam and percolation tank) demarcatedbased on the GIS and AHP method over an entirewatershed in Nalgonda district. The resistivity investi-gation showed that there is sufficient thickness ofweathered formation below the proposed structures toaccommodate the impounded water. The existence ofinterconnectivity through the fractures in the aquiferwas revealed through the Rhodamine-B tracer test.Finally the infiltration test results and permeabilitymeasurements suggest that the sites proposed aresuitable for engineering intervention.
Conclusion
The past and present scenario of groundwater fluoride (F–)in the study area in Nalgonda district was assessed.Suitable recharge strategies, based on a GIS and AHPapproach, were recommended. In order to assess andvalidate the suitability of the recommended recharge sites,a micro-watershed area was selected for carrying outgeophysical and hydrological studies. Aquifer continuity,groundwater flow velocity and sub-surface litho-stratifica-tion were determined based on geophysical and boreholelitholog studies. Sites delineated for recharge structures,based on GIS for harvesting surface runoff and to induceartificial recharge, were selected for carrying out hydro-logical studies. Infiltration tests and soil core samples werecollected from within the proposed recharge sites forsuitable laboratory analysis. After installation of therecharge structures, groundwater quality analysis wascarried out, along with rainfall assessment, and depictedimprovement in groundwater quality standards of the area.The overall study before and after commissioning ofstructures highlights the suitability of the sites allocatedfor the recharge strategy. Hence, this study reveals that anintegral approach of GIS, AHP, geophysics and hydrolog-ical methods can decipher suitable sites for rechargemeasures. Also, the water-harvesting strategy could be aneffective tool in mitigating fluoride problems in semi-aridclimatic regions of peninsular India.
Acknowledgments The author is grateful for the encouragementgiven by Dr. R. Rangarajan to pursue my training at IIRS,Dehradun, and also grateful to fellow colleagues of the groundwaterreplenishment division for their constant support and guidancethroughout this scientific study. Further, I extend my gratitude to Dr.Y.J. Bhaskar Rao, Director of the National Geophysical ResearchInstitute (C.S.I.R), for promoting the publication of this work in theform of a research report.
References
Andrade R (2009) Sustainable groundwater development andquality management in Nalgonda District – Andhra Pradeshthrough integrated geohydrological and artificial rechargeapproach. PhD Thesis, Osmania University, India, 180 pp
Chow VT, Maidment DK, Mays LW (2002) Applied hydrology.McGraw-Hill, New York
Rama Mohana Rao NV (1982) “Geochemical Factors Influencingthe Distribution of Fluoride in Rocks, Soils and Water Sourcesof Nalgonda District, A.P. India. PhD Thesis, OsmaniaUniversity, 200 pp
Rama Mohana Rao NV, Suryaprakasa Rao K, Schuiling RD (1993)Fluorine distribution in waters of Nalgonda District, AndhraPradesh, India. Environ Geol 21:84–89
Ramakrishnan D, Durgarao HV, Tiwari KC (2008) Integratedapproach of remote sensing and GIS in delineation of sites forwater harvesting structures, Kali watershed, Dohad, Gujarat,India. Geocarto Int 23(2):95–108
Sharma SK (2003) High fluoride in groundwater cripples life inparts of India. Diffuse Pollution Conference Dublin 2003
1597
Hydrogeology Journal (2012) 20: 1589–1597 DOI 10.1007/s10040-012-0898-3
Author's personal copy