Salivary Fluoride Concentration Following the Application of ...
85
Salivary Fluoride Concentration Following the Application of Three Different 5% NaF Varnishes Danika J. Downey, DDS A thesis submitted in partial fulfillment of the requirements for the degree of Masters of Science in Restorative Dentistry Horace H. Rackham School of Graduate Studies The University of Michigan Ann Arbor, Michigan 2013 Thesis Committee Members: Carlos González-Cabezas, DDS, MSD, PhD (Chairman) Peter Yaman, DDS, MS Joseph B. Dennison, DDS, MS Gisele Neiva, DDS, MS
-
Upload
khangminh22 -
Category
Documents
-
view
2 -
download
0
Transcript of Salivary Fluoride Concentration Following the Application of ...

Salivary Fluoride Concentration Following the
Application of Three Different 5% NaF Varnishes
Danika J. Downey, DDS
A thesis submitted in partial fulfillment of the requirements for the degree of Masters of Science in Restorative Dentistry
Horace H. Rackham School of Graduate Studies The University of Michigan
Ann Arbor, Michigan 2013
Thesis Committee Members: Carlos González-Cabezas, DDS, MSD, PhD (Chairman) Peter Yaman, DDS, MS Joseph B. Dennison, DDS, MS Gisele Neiva, DDS, MS
i
Dedication
To my husband Brad and daughter Mia for their patience, encouragement, and inspiration.
To my parents Barry and Paula Thorpe for their guidance, support, and
ability to problem solve.

ii
Acknowledgements
To the members of my thesis committee for providing guidance in the design and completion of this research. To the United States Navy for providing me the opportunity to continue my professional development. To my fellow Navy Dental Officers for giving me the inspiration and mentorship that lead to the initiation and completion of this degree. To the staff and faculty of the Graduate Dentistry Clinic for their assistance and patience during my two years at University of Michigan. To Delta Dental Fund of Michigan for providing funding for this research. To Premier for creating a placebo varnish for use in this study. To Susan Flannigan for helping with the laboratory analysis. To George Eckert for the statistical analyses. To my classmates for their friendship and willingness to lend a helping hand.

iii
Table of Contents
Salivary Fluoride Concentration Following the Application of Three Different 5% NaF Varnishes .......................................................................... i
Dedication .................................................................................................... i Acknowledgements .................................................................................... ii Table of Contents ...................................................................................... iii List of Tables .............................................................................................. v List of Figures ........................................................................................... vi
Chapter 1 ........................................................................................................ 1 Background ................................................................................................ 1 Purpose ....................................................................................................... 4 Hypotheses .................................................................................................. 4 Specific Aims .............................................................................................. 5 Literature Review ...................................................................................... 5
Fluoride Varnish ...................................................................................... 5 History .................................................................................................. 5 Composition.......................................................................................... 9
Mechanism of Action ............................................................................. 11 Bacterial Inhibition ............................................................................. 12 Fluorapatite Production ...................................................................... 15 Demineralization/Remineralization .................................................... 19
Bioavailability ........................................................................................ 24 Release into Saliva ............................................................................. 26
Experimental Design .............................................................................. 35 Saliva Type ......................................................................................... 35 Collection and Handing ...................................................................... 40 Analytical Methods ............................................................................ 43
References ................................................................................................ 47

iv
Chapter 2 ...................................................................................................... 53
Abstract .................................................................................................... 53 Introduction ............................................................................................. 54 Hypotheses ................................................................................................ 56 Methods and Materials ........................................................................... 56
Subject Recruitment ............................................................................... 56 Varnish Selection ................................................................................... 57 Varnish Application ............................................................................... 58 Sample Collection .................................................................................. 61 Sample Preparation ................................................................................ 62 Creating a Standard Curve ..................................................................... 63 Sample Analysis ..................................................................................... 63
Statistical Analysis ................................................................................... 64 Results ....................................................................................................... 65 Discussion ................................................................................................. 69 Conclusions .............................................................................................. 75 References ................................................................................................ 76

v
List of Tables
Table 1 – Experimental Varnishes ................................................................ 58
Table 2 – Randomized Treatment Sequence ................................................ 59
Table 3 – Mean Amount of Varnish Applied ............................................... 66
Table 4 – Mean Concentration of Fluoride in Saliva ................................... 66
vi
List of Figures
Figure 1 – Concentration of Fluoride Over Time ......................................... 68
Figure 2 – Variation of Salivary Fluoride Concentration ............................. 68

1
Chapter 1
Background
Fluoride varnish production and use has had a dramatic increase in the
last decade following approval by the FDA in 1994 as a cavity liner and root
desensitizer.1 Despite its "off-label" use in caries prevention, research has
demonstrated varnishes to be a safe, effective, and efficient way to deliver
fluoride to patients at risk for dental caries.2,3 Accordingly, fluoride
varnishes are widely recommended for patients at high risk for dental caries
(ADA, CDC, AAPD). Although the FDA did not approve fluoride varnishes
until 1994, the first fluoride varnish was developed in the 1960's as a
possible mechanism to enhance the treatment duration and uptake of
fluoride.4 Most of the clinical research on fluoride varnishes has been
conducted using Duraphat (5% NaF), which was the first commercially
available product. Within the last few years, numerous varnishes with
similar sodium fluoride concentrations (5%), but with multiple variations in
carrier composition, have emerged and have taken a significant portion of
the market share. As the number of fluoride varnishes available has
increased, each company has created unique changes to the formula in order
to improve properties like handling, appearance (i.e., white), flavor, or in

2
some cases, potentially active ingredients (e.g., tricalcium phosphate,
amorphous calcium phosphate, calcium sodium phosphosilicate, xylitol,
etc.),5,6,7,8 leading to a claim of additional preventive benefits. Most of these
new varnishes have not been studied in vivo for their caries reduction,
efficacy, or safety.
Despite the similar 5% NaF concentration used in most of these
varnishes, in vitro data have suggested that some of these secondary
ingredients may affect the fluoride ion release of the product.9,10,11 Fluoride
release, and subsequent formation of calcium fluoride is thought to be an
essential part of the mechanism of action of fluoride varnishes to prevent
and remineralize carious lesions. Differences in fluoride release patterns can
potentially enhance or diminish the efficacy and safety of a varnish.
Therefore, understanding the differences in fluoride release pattern of
varnishes with different formulations in vivo will help us understand which
formula modifications have the potential to enhance or diminish the
anticariogenicity and safety of the varnish. Several studies have compared
fluoride varnishes to other delivery systems such as gels, foams, and pastes;
however, a void remains in the literature regarding the comparison of
efficacy and safety between the many different new fluoride varnish systems
containing 5% NaF widely available today in the US market.

3
The fluoride varnishes to be used in this study were chosen based on
their unique characteristics. Duraphat (Colgate-Palmolive) was chosen
because it has the largest body of laboratory and clinical research and it is
considered the gold standard. Vanish (3M ESPE) was chosen because it is
relatively new, has a large portion of the market share for varnishes, uses a
different resin formulation, and contains tri-calcium phosphate. The third
varnish, Enamel Pro (Premier) was selected because it is also very popular,
has amorphous calcium phosphate added, and in laboratory studies it has
shown to release significantly more fluoride than the other two
varnishes.9,10,11
Comparison of the material safety data sheets for each of these
different varnishes reveals three similar ingredients, namely rosin
(colophonium), ethanol, and sodium fluoride. However, according to the
Hazard Communication Standard 29 CFR 1910.1200 developed by OSHA,
only those ingredients that may be hazardous require documentation and
therefore many of the unique formulary ingredients of fluoride varnishes
remain undisclosed.12 These ingredients, called "trade secrets" by OSHA,
may be withheld from MSDS reports when they are deemed non-hazardous
and create some advantage to a company over other companies that do not
know of it or use it. Some early investigations have suggested that the
4
addition of calcium phosphate ingredients used in some dental products may
increase both fluoride release from products and subsequent uptake of
fluoride in enamel.13,14 By evaluating the fluoride release from these three
varnishes, each containing different calcium phosphate compounds and other
ingredients, some insight may be gained as to the complex interaction of
these trade secrets and the effect they may have on fluoride varnish efficacy.
Purpose
Determine and compare the fluoride concentration in unstimulated whole
saliva at five different time periods following the application of three
different 5% NaF varnishes.
Hypotheses
Ho1 - There will be no significant difference in the amount of fluoride
release into saliva among the 3 different varnishes.
Ha1 – There will be a significant difference in the amount of fluoride release
into saliva release among the 3 different varnishes.
Ho2 – There will be no significant difference in the timing of fluoride
release in to saliva among the 3 different varnishes.
Ha1 – There will be a significant difference in the timing of fluoride release
into saliva among the 3 different varnishes.

5
Specific Aims
1. Determine the concentration of fluoride available in whole saliva at
different time periods after the application of three different 5% NaF
varnishes as measured in unstimulated human saliva.
2. Compare the different patterns of fluoride release from each of the
varnishes by comparing the fluoride concentration in saliva at
corresponding time periods.
Literature Review
Fluoride Varnish
History
Fluorine is the 13th most prevalent element and is found in water air
and soil. Fluoride, which is the ionic form of the element fluorine, is a
negatively charged ion that frequently combines with positive ions to form
more stable compounds.15 The discovery of fluoride and its relevancy to
dentistry in t he United States, dates back to 1901.16 According to the
National Institute of Dental and Craniofacial Research (NIDCR), it began
when Dr. Frederick McKay discovered brown staining on the teeth of
Colorado Springs, CO natives. He could not find any mention of this
condition in the current literature in 1909, so with the collaborative help of

6
G.V. Black he was able to make two important discoveries. First, only
children with mottled deciduous teeth suffered from a similar mottled
appearance of their adult teeth, and second, individuals with mottled teeth
were very resistant to dental caries. In 1931, the connection between tooth
mottling and naturally occurring high fluoride concentration in water was
revealed. In 1945, Grand Rapids Michigan became the first community to
have its water fluoridated and after 11 years they reported a 60% decrease in
caries rate in children born after the fluoridation implementation began.
According to the 2001 Morbidity and Mortality Weekly Report1,
success following this water fluoridation initiation prompted the Public
Health Service (PHS) to develop recommendations in the late 1940’s and
1950’s regarding community water fluoridation, and later, the development
of fluoride-containing products. With the transition from water fluoridation
to fluoride containing topical preparations, scientists began to inquire and
study the difference between the systemic versus topical effects of fluoride.
According to a review by Limeback17 this question was still not
satisfactorily answered by the literature in the late 1990's. The initial thought
was that by evaluating the differences in the caries rate of adults that
received systemic fluoride before the age of six, an estimation of the
protective effects of systemic fluoride could be measured separately from

7
the topical effects seen in populations that did not receive systemic fluoride
but were later exposed to fluoride containing topical applications. Systemic
effects such as favorable changes in tooth morphology, and fluoride
incorporation into enamel have been hypothesized. As Limeback points out,
however, it is difficult to positively say that ingested fluoride is not also
acting topically if its introduction to the system is through an oral route as in
the case of water. The mechanism of action of topically applied fluorides is
not as clear cut either and is still the subject of numerous studies. To
accurately answer the question of how effective and by what mechanism do
topical and systemic fluorides work, additional controlled studies need to be
conducted. Currently, the prevailing evidence points to topical or post-
eruptive fluoride administration as the primary means of caries reduction. In
1954, fluoride containing dentifrices became available in the U.S. followed
by higher fluoride containing preparations of rinses, gels, and varnishes.18
The introduction of fluoride varnish in the dental literature came in
1964 as a report by a German researcher named Schmidt.4 The journal,
Stoma, introduced "Fluor-Lack" (fluoride lacquer) as a long-lasting fluoride.
Four years later Schmidt and Heuser19 published the first clinical trial on the
efficacy of this varnish and launched it as a commercial product under the
name Duraphat (Rhone-Poulenc Rorer, Rorer GmbH Köln, Germany).

8
Following clinical studies related to the efficacy and safety of Duraphat,
other varnishes for topical fluoride application started to become available.
Fluor Protector (0.7% F- at a low pH) was developed in 1975 by Arends and
Schuthof (changed to 0.1% F- in 1987).20 In 1984 Pharmascience Inc.
developed a 5% NaF Varnish called Duraflor/Durafluor (personal
communication 2012), and shortly after in 1986 VOCO developed a 6%
NaF, 6% CaF varnish called Bifluorid 12.21 Today Duraphat is marketed in
the USA by Colgate-Palmolive, Fluor Protector by Ivoclar/Vivadent and
Duraflor by Medicom. In 1994 the FDA approved fluoride varnishes for use
as a cavity liner and root desensitizer, however it is primarily been the "off-
label" use in caries prevention that has led to the development of the
numerous brand names available today.3
In 2006 evidence-based clinical recommendations for topical fluoride
were published by the American Dental Association (ADA)22. Following a
Cochrane Systematic Review on clinical studies involving fluoride gels,
foams, and varnishes, recommendations for topical fluoride application
accounting for caries risk level and age were published. The strongest
evidence was shown for topical varnish use in caries prevention in moderate
to high risk patients, ages < 6 and 6-18 years, to be applied at either 6
(moderate risk) or 3 (high risk) month intervals. These recommendations for

9
topically applied fluoride by the ADA are in agreement with the 2008
revised Guideline on Fluoride Therapy by the American Academy of
Pediatric Dentistry (AAPD).22
Composition
Interestingly, determining the exact composition of each fluoride
varnish is not possible because, according to the Hazard Communication
Standard 29 CFR 1910.1200 developed by OSHA12, only those ingredients
that may be hazardous require documentation. Therefore, many of the
unique proprietary components of fluoride varnishes remain undisclosed.
These ingredients, called "trade secrets" by OSHA, may be withheld from
Material Safety Data Sheets (MSDS) when they are deemed non-hazardous
and create some advantage to a company over other companies that do not
know of it, or use it.
Although the original formulations have changed over time, the
current MSDS of the first three commercially available fluoride varnishes in
the United States list the following active ingredients; both Duraphat
(Colgate -Palmolive) and Duraflor (Medicom) contain 5% NaF with a rosin
and ethanol carrier.5,6 Fluor Protector (Ivoclar-Vivadent), differs from the
others in the use of difluorosilane as the fluoride source. Fluor Protector,
according to the product information guide,20 and MSDS,7 contains 0.9%

10
difluorosilane in a polyurethane varnish base with ethyl acetate and
isoamylpropionate solvents.
Comparing the MSDS of several commercially available varnishes it
is apparent that, with only a few exceptions, the main constituents are quite
similar. The common constituents of most varnishes available today are
rosin, also referred to as colophony (either natural or synthetic), an alcohol,
and sodium fluoride. The amount of each product is estimated on the MSDS,
however most of the current top market varnishes advertise 5% neutral
sodium fluoride as the active ingredient. This percentage is likely based
upon the formulation of the first varnish, Duraphat, which has been
extensively studied and boasts a 38% caries reduction in permanent dentition
according to meta-analysis.23
Rosin, as defined by Merriam-Webster is "a translucent amber-
colored to almost black brittle friable resin that is obtained from the
oleoresin or deadwood of pine trees or from tall oil and used especially in
making varnish".24 Fluoride salts which are commonly referred to simply as
fluorides, according to the U.S. Department of Health and Human Services,
are naturally occurring components of rocks and soils.15 A 5% concentration
of sodium fluoride will contain 2.26% of the fluoride ion (22,600 ppm).
Therefore, in a typical single dose varnish preparation of 0.4 ml, there are

11
potentially 9 mg of fluoride available in the oral cavity after application.
Ethanol or other alcohols are used as solvents that are intended to evaporate
from the solution once exposed to air allowing for the varnish to be fluid
enough for application but then become adherent to enamel surfaces for
increased length of fluoride exposure.
In addition to these three main constituents, other additives may be
present such as an adhesion promoting agents, stabilizing agents, rheology
modifying agents, colorants, sweeteners, and flavoring agents.8 Recent
trends, in lieu of data that support the need for calcium and phosphate ions to
aid in remineralization and inhibit demineralization, have led to the addition
of calcium phosphate compounds to some fluoride varnishes. For example
enamel Pro (Premier Dental) markets the addition amorphous calcium
phosphate (ACP), while Vanish (3M ESPE) uses tri-calcium phosphate
(TCP) in its formulation. While theoretically these additions are included to
enhance the product efficacy, the addition of these secondary ingredients
may have profound influence on the amount, or pattern of fluoride ion
release.
Mechanism of Action
In order to understand how fluoride varnishes are utilized in caries
prevention, it is first important to review the mechanism of action of topical

12
fluoride in general. In 1999 Øgaard discussed possible mechanisms in h is
review, The Cariostatic Mechanism of Fluoride.25 Originally, it was
believed that the most important aspect of caries protection from fluoride
was the systemic ingestion that resulted in fluoride being built into the
structure of enamel during tooth formation causing reduced solubility of the
apatite crystal. However, it is now widely accepted that the main mechanism
of action of fluoride is to pical. Effects such as the inhibition of bacteria,
reduction of demineralization, and increased remineralization have been the
focus of current studies. According to Øgaard, available fluoride may
exchange F- for OH-, promote crystal growth of fluorapatite, or produce
calcium fluoride.
Bacterial Inhibition
In 2007, Jeevarathanet al.26 developed a study to t he see if Fluor
Protector (Ivoclar, Vivadent) varnish had an effect on the counts of
Streptococcus mutans in the plaque of caries free children. They used thirty
subjects that were separated into a study group of twenty and a control group
of ten. Plaque was obtained from similar surfaces of each subject’s teeth.
Baseline samples were obtained for both the study and control group. The
study group then had Fluor Protector applied to clean surfaces of all teeth.
After plaque collection 24 hours post varnish application, and incubation for

13
48 hours, the levels of S. mutans were determined using Dentocult SM Strip
Mutans (Orion Diagnostica, Espoo, Finland). They demonstrated a
significant reduction in plaque of the bacteria S. mutans (p=0.000). This
study supports the hypothesis that topical fluoride may have bactericidal or
bacteriostatic effects. The study did not address the potential that varnish
application simply blocked the adherence of S. mutans to the enamel
surfaces of the sampled areas.
Pandit et al.27 studied the influence of sodium fluoride on the
virulence and composition of S. mutans biofilms to determine if perhaps one
of the mechanisms of action of fluoride was directly on the bacteria. In this
study, they utilized S. mutans exclusively to determine what effects NaF at
10, 50, and 125 ppm would have on S. mutans biofilm cells. S. mutans
biofilms were formed on saliva coated hydroxyapatite discs, transferred to a
1% solution of sucrose and given 74 hours to grow and develop. The biofilm
discs were treated twice daily with a control (100% H2O) or NaF (2, 10, 50,
and 125 ppm). Following the experimental phase they evaluated glycolytic
pH drop, proton-permeability, F-ATPase activity, GTF activity, and biofilm
composition. They determined that NaF significantly reduced the initial rate
of pH drop at concentrations of 10, 50, and 125 ppm, and that the pH change
was NaF dose dependent. Additionally proton permeability was enhanced,

14
and F-ATPase activity was reduced in the S. mutans biofilm cells at 50 and
125 NaF ppm, which both serve to regulate pH homeostasis within the
bacterial cells. Despite some of their other findings, at the concentration of
NaF used in this study there were no bactericidal activity against S. mutans,
and the controls displayed similar amounts of CFU's indicating no growth
rate inhibition. Overall, this study provided evidence that sodium fluoride
may alter the acid production and acid tolerance of S. mutans in biofilms.
One of the major shortcomings of this experiment was the lack of diversity
within the experimental biofilm. It is possible that in vivo interactions
between different types of bacteria may significantly alter these results.
A study done by Zickert et al.28 supported the findings by Pandit, that
increased fluoride may not act by eliminating or reducing the actual amounts
of S. mutans, but rather the increased fluoride may inhibit metabolic
activities of the bacteria. This in vivo study used 40 children that were pair-
matched for baseline salivary levels of S. mutans. Each group participated in
the experimental and control arm of the study. The design consisted of two
experimental arms. In experiment one, participants had 0.5 ml of 5% NaF
(Duraphat) varnish applied to professionally cleaned teeth and were not able
to eat for 3 hours or brush for the remainder of the day. In the second arm,
participants had the same treatment varnish applied, however it was applied

15
to teeth without prior prophylaxis. Results showed that there was no
significant reduction in the proportion of S. mutans in the saliva of either
experimental group when compared to the control at 4, 10 or 21 days after
the treatment. They hypothesized that it may not have been an adequate
concentration to be bactericidal, since some other studies have been able to
show a reduction in total bacteria. They did not evaluate salivary bacteria
levels during the time frame in which the fluoride varnish concentration
would have been the highest in the saliva, however seeing a significant
reduction in a microorganism within hours of varnish application was
thought to be unlikely.
Fluorapatite Production
In 1984 Øgaard et al.29 investigated the retention of fluoride in sound
and demineralized dentin after treatment with Duraphat 5% NaF. Their aim
was to determine if the prophylactic effect of fluoride was in the formation
of fluorapatite (alkali insoluble fluoride) or in the formation of alkali soluble
CaF2. Using paired premolars indicated for extraction for orthodontics, they
evaluated the effect fluoride had on so und enamel (ten pairs), and
demineralized enamel (eight pairs). To create the demineralized enamel
group, individuals had orthodontic bands placed on the premolars that
allowed for plaque accumulation for 4 w eeks before the Duraphat

16
application. For the sound enamel samples, the premolar pairs had
immediate application of the Duraphat. All teeth were extracted two weeks
after the varnish was applied. Using an acid etch technique to r emove
enamel at 3 different layers, the samples were then exposed to KOH
removing all loosely bound fluoride (CaF2, or KOH s oluble fluoride),
leaving, presumably the KOH insoluble fluoride (fluorapatite). Using a
fluoride selective electrode to measure the amount of fluoride, and atomic
absorption spectroscopy to measure calcium in the samples, the control teeth
were compared to the experimental teeth for amounts of CaF2 vs.
fluorapatite. It was found that in the sound enamel, total fluoride content was
greatest in the most superficial layer, and that the majority of the fluoride
increase was accounted for by the formation of CaF2 (≥ 52%) as opposed to
fluorapatite (≤ 16.6%). Additionally, the demineralized samples retained
more fluoride in all three layers, and in the deeper layers, fluorapatite
contributed to as much as 75% increase in the fluoride content. This study
demonstrated two possible ways fluoride accumulates in high fluoride
environments, and how it is possible that different environments
(demineralized vs. sound enamel) may impact this interaction.
In 1992 Cruz et al.30 evaluated the uptake of KOH-soluble and KOH-
insoluble fluoride in enamel after the application of Duraphat or a 2% NaF

17
solution. The purpose of this study was to quantify the amount of apatitically
bound fluoride in contrast to the loosely bound fluoride after the use of two
neutral sodium fluoride preparations. Using surgically extracted impacted
third molars a 2.5 mm surface area of enamel was exposed to either a 2%
NaF solution, pH 7.5, for 5 minutes, a 5% NaF Duraphat varnish for 5
minutes, or left untreated. Both samples were rinsed of the fluoride after the
5-minute testing period. Samples were then subjected to removal of the
alkali-soluble fluoride by using 1M KOH which removed both calcium
fluoride like material, and adsorbed fluoride. Following the removal of
loosely bound fluoride, the KOH-insoluble or apatitically bound F was
removed by etching three successive layers and analyzing each layer for
fluoride. Results from this study showed that untreated samples showed
traces of alkali-soluble fluoride. The samples exposed to 2% NaF solution
had the greatest amount (13x) of loosely bound fluoride in comparison to the
5% NaF varnish. Neither groups showed any increase in apatitically bound
fluoride during the treatment period. The authors suggested that this type of
fluoride incorporation may only occur after pH cycling in plaque. This may
also support the hypothesis that it is the loosely bound calcium fluoride that
is of greatest importance in the mechanistic action of high fluoride rinses
and varnishes. It was interesting to find that impacted third molars had

18
soluble CaF2 present on t heir surfaces. This may indicate that teeth are
exposed topically to some amount of fluoride even before eruption.
Grobler and Kotze31 evaluated the difference in loosely bound alkali-
soluble fluoride and insoluble fluoride by observing the relative amounts of
each found in erupted and unerupted third molars. This study was novel
because the subjects used in this study had minimal levels (<0 .1 ppm) of
water fluoridation during ages 1-16, but did have exposure to daily tooth
brushing. They evaluated 32 erupted and 22 unerupted third molars removed
for various reasons. 19 of the erupted third molars, and 11 of the unerupted
third molars were unwashed, while 11 of erupted and 11 unerupted third
molars were alkali washed. After their respective treatments, five successive
acid-etch biopsies were obtained from specific cusp sites. Using a fluoride
ion-selective electrode, the fluoride concentration of a buffered solution
containing the etchings was determined. Additionally the Ca concentration
was determined using N2O/C2H2 flame atomic absorption spectrometry. The
results of this study indicated that for the first two etch depths, significant
differences between the mean enamel fluoride concentrations could be found
between unerupted unwashed versus washed teeth, and the erupted washed
versus unwashed teeth. In both erupted and unerupted teeth, the amount of
fluoride in enamel plateaued at about 20 µm into the tooth. In the erupted

19
tooth, there was an approximate 78% increase in fluoride content compared
to the unerupted tooth in the first 3 µm , 53% of which was alkali-soluble or
loosely bound, and 47% of which was in a firmly bound form. For the
unerupted tooth, no loosely bound fluoride was found. This study indicates
that fluoridated toothpaste does increase both the loosely bound and firmly
bound fluoride in vivo. Additionally, the fact that they did not find any
loosely bound fluoride in the unerupted teeth of this study population that
did not have fluoridated water, would support the theory that the unerupted
teeth in the study by Cruz, were somehow receiving topical fluoride from
systemically ingested fluoride.
Demineralization/Remineralization
According to Øgaard et al.,25 fluoride not only increases the rate of
remineralization, but can be reprecipitated with calcium and phosphate ions
onto the enamel surface. This benefit is mostly seen when there is a constant
low-dose fluoride interaction such as water fluoridation. For concentrated
fluoride agents such as varnishes, the mechanism may vary slightly. Øgaard
states that these higher fluoride containing agents may “form an intermediate
product of calcium fluoride on the tooth surface, in lesions, and in plaque.”
Sometimes referred to as phosphate-contaminated calcium fluoride, these
compounds can be seen under high magnification and may remain present

20
up to weeks after topical fluoride treatment. These globules which appear to
be stabilized by phosphate, may act as fluoride reservoirs that have the
ability to r elease fluoride when the pH is lowered. This fluoride released
helps prevent the dissolution of calcium and phosphate from enamel,
effectively enhancing the rate of remineralization and slowing
demineralization. When the pH returns to normal, phosphates once again
protect this calcium fluoride until the next drop in pH.
In 1988, Seppä32 was evaluating this theory of remineralization as the
primary mechanism of fluoride action by testing the ability of pre-softened
enamel to remineralize with different concentrations and number of
applications of sodium fluoride. In this study 5x5 mm slabs of noncarious
human enamel were divided into six experimental groups. The groups were
treated as follows; no treatment, 2.26% Duraphat on day 1, 2.26% Duraphat
on days 1, 4, and 7, 1.13% Duraphat on day 1, 1.13% Duraphat on days 1, 4,
and 7, or a 1 minute treatment with 0.1% NaF solution each of 9 days total.
After 24 hours, the varnish was removed and reapplied as dictated by the
different treatment groups. Samples were stored in artificial saliva that was
renewed daily. Once daily the slabs were immersed in a lactic acid-NaOH
buffer (ph 5.0) for 1 h our and then rinsed with water to simulate
demineralization. Finally, the acid resistance and fluoride uptake was

21
measured by immersing the slab in the lactic acid-NaOH solution leaving a
9.6mm2 area uncovered and determining the amount of dissolved calcium
and fluoride. Vickers hardness was evaluated after pre-softening, after the 9-
day study period, and after the 1 hour demineralization. Results showed that
all treatments were effective at preventing softening of enamel during the 9
day study period. The three treatments with 2.26% Duraphat were slightly
more effective than the rest of the varnish treatments, but not at a
statistically significant level. The 0.1% NaF solution was the least effective
at preventing softening of the enamel. Enamel treated three times with either
2.26% or 1.1% fluoride showed the greatest acid resistance. Because the
enamel remineralization was similar between the treatment groups receiving
2.26% Duraphat one or three times, and the group receiving 1.1% Duraphat
one or three times, the authors concluded that it is possibly not the
concentration of fluoride that is most important, but rather the number of
applications. In addition, because a single application of Duraphat 2.26%
was able to promote remineralization during the whole 9-day period, it is
possible that a formation of soluble CaF2 on the enamel surface was able to
act as a fluoride reservoir during acidic challenges. Seppä found that
although the higher varnish fluoride concentrations did result in an increased
uptake of fluoride in enamel, the number of applications did not increase this

22
uptake in enamel. Enamel solubility was not directly proportional to the
fluoride content of the enamel.
In order to elucidate the effect that CaF2 may have on the inhibition of
enamel demineralization, Tenuta et al.33 designed a double-blind, crossover,
in situ study that evaluated how newly formed CaF2 on enamel could be
released to an S. mutans test plaque fluid. Subsequently, this plaque fluid
was then used to see the effect it would have on enamel following an acidic
challenge. Distinct amounts of CaF2 were created on enamel slabs by either
not treating them (control) or treating them with acidulated 0.5M NaF
solution and aging the slabs in 6 ho urs, or 48 hours in artificial saliva. A
representative group of the enamel slabs were tested to determine the CaF2
from each treatment groups. The remaining enamel slabs were mounted in a
palatal appliance of ten subjects with the enamel surface facing a test plaque
prepared from S. mutans. The enamel slabs remained in contact with the test
plaque for 30 minutes, at which time plaque from two of each sample was
removed to test the amounts of fluoride, calcium, and inorganic phosphorus.
After this, the appliance was reinserted and subjects rinsed for 1 minute with
a 20% sucrose rinse. The appliance remained in the mouth for 45 minutes at
which time the appliance was removed and another plaque sample was
evaluated for fluoride, calcium and phosphorus. The results indicated that

23
the plaque fluid opposing the fluoride treated slabs had significantly higher
levels of fluoride than the control and that this was correlated to the initial
CaF2 concentration in the enamel slab. In addition, the surface micro
hardness before and after the sucrose challenge, supported the hypothesis
that this increase in plaque fluid fluoride inhibited demineralization. In this
experiment the importance of the CaF2, was demonstrated. An acidic
fluoride solution was used in this experiment, which may work in an
alternate way to a neutral fluoride compound.
To evaluate the remineralization effect of topical fluoride, Castellano
et al.34 compared how the application of fluoride on a caries-like lesion
would compare to the application of the fluoride around a caries-like lesion.
In this study, human molars were sectioned and used in pairs for a control
vs. experimental sample. Caries-like lesions were created (1x5mm) using an
artificial caries solution. A 5% NaF varnish (Duraflor) was used to cover
either the entire surface including the caries-like lesion, or the entire surface
except the caries-like-lesion. After 30 days, the lesions were photographed
under polarized light and compared to the baseline lesions. The mean
percentages of remineralization were 9.5% for the group with fluoride
surrounding the lesion and 10.8% for the group with the lesion covered with
varnish. There was not found to be any significant difference between the

24
different application techniques in regards to the remineralization potential.
These results support remineralization as one of the mechanisms of action of
fluoride. Furthermore, this study supports the theory that direct application
of varnish to a carious lesion is not necessary for the desired effect.
Fluoride Bioavailability
It was hypothesized early in the history of fluoride use that the
prophylactic effect of fluoride was positively correlated with the
concentration or amount of fluoride utilized. This protective effect was off-
set by the increasing evidence that fluoride, in high concentrations, may pose
both an esthetic risk (mottling) and toxic risk to humans. In contrast to the
1900's when the preventative effects of fluoride were discovered, the
different sources of fluoride available to people today has greatly expanded.
Fluoride is a vailable today in our dentifrice, water, food sources, and
professionally applied fluoride rinses, varnishes, and gels. This multi-source
availability, in addition to the varying possible mechanisms that these
fluorides work, has led to inquiries of how much, and of which types of
fluoride containing substances are actually necessary to prevent decay. The
initial step in answering this question depends on finding reliable ways to
determine the fluoride release and bioavailability from particular products.
From there, it may be possible to determine where the available fluoride is

25
incorporated, or if other fluoride containing compounds are formed that may
be crucial in the cariostatic or carioprotective mechanism of fluoride action.
In the case of fluoride varnish, it is not enough to simply rely on the
package label stating the ppm or percentage of fluoride that is contained in
the product. Interactions between the individual ingredients, the unique
environment of the oral cavity, and complex biochemical interactions may
have an effect on the bioavailability of fluoride from the product. Several
methods for determining the release of fluoride have been utilized. In
addition to many in vitro studies, in vivo studies have evaluated release and
subsequent storage of fluoride into saliva, oral mucosa, plaque, enamel,
blood, urine, etc. It is likely that the fluoride found in whole saliva following
fluoride varnish application represents the initial bioavailable fluoride from
the product which can be stored in plaque, soft tissue, incorporated into
enamel, or bound to other ions or proteins in saliva. Although outside the
scope of this review, the storage of fluoride in plaque, oral mucosa, or
through formation of fluoride containing compounds adsorbed onto the
surfaces of teeth after localized release into saliva is, undoubtedly, an
important aspect of fluoride bioavailability.

26
Fluoride Release into Saliva
Many of the early studies evaluating fluoride release into saliva aimed
to determine the exact amount of fluoride released from very different
fluoride containing products (gel, foam, dentifrice, varnish). However, using
this historical literature to make comparisons between similar products
(varnish vs. varnish); it becomes evident that even similar products types
and concentrations can release different amounts of fluoride. This
unexpected finding prompted studies that compared fluoride release to saliva
A 1983 study by Rytomaa and Meurman35 evaluated the amount of
fluoride in saliva after using different topical fluoride treatments. At the time
of this publication, the main cariostatic effect was believed to be the
reduction of enamel solubility and the direct action on dental plaque. The
aim of this study was to determine the ability of a 2% sodium fluoride
solution, an amine fluoride solution (Elmex sol), a sodium fluoride and
amine fluoride gel (Elmex gel), and a 5% sodium fluoride varnish
(Duraphat) to increase the ionic fluoride concentration in saliva and remain
at a significant level. Four subjects were utilized in a cross-over design with
a two month wash out period. The difference of amount of fluoride ion
applied varied from 9 mg to 63 mg based on the amount applied and the
concentration of the product. Stimulated salivary samples were taken at 2, 4,

27
6, and 8 days post treatment, and the samples were analyzed with a fluoride
specific electrode. The results of this study showed that Duraphat gave the
highest fluoride peak (10 ppm F- two hours after treatment), and that
although the Elmex gel and solution both produced a mean of 3 ppm of
fluoride in saliva 2 hours after treatment, the clearance of the fluoride from
the gel solution was slower than the solution. All treatments raised salivary
fluoride levels above the baseline levels, however only Duraphat was able to
keep this fluoride level above baseline until the next day. Elmex gel
contained seven times the amount of fluoride than the other solutions but did
not remain in saliva for an extended period of time which may indicate that
there was an undesirable amount of fluoride ingested. To investigate this
hypothesis further, it would be pertinent to evaluate blood levels of fluoride
following the application of these products. It is possible that although the
fluoride was not found in saliva the following day from some of these
products that it was either bound in plaque, oral soft tissue, or enamel.
Eakle et al.36 compared the fluoride levels found in saliva after the use
of a 5% NaF varnish (Duraphat), to that of a 0.05% NaF rinse (ACT). Their
hypothesis was that fluoride levels found in whole saliva represent the
fluoride that is available to interact with plaque and enamel and therefore is
a logical place to begin measuring the efficacy of fluoride releasing

28
substances. This study was a two-treatment cross-over design using sixteen
subjects. Following pilot study results, they determined that they would test
saliva at the following intervals: 5 and15 minutes, and, 1, 2, 4, 8, 12, 24, 32,
48, 56, 72, 80, 96, 104 hours. Although they anticipated that the fluoride
rinse group would return to baseline fluoride saliva levels much sooner than
104 hours, they wanted to make a direct comparison to the fluoride varnish
group. For the varnish group an unspecified amount of varnish was applied
to both the buccal and lingual surfaces of 20 teeth, and for the fluoride rinse
group subjects rinsed with 10ml of the 0.05% solution for 30 seconds. Saliva
samples were collected in a stimulated fashion by having subjects chew on a
piece of Parafilm for 2 m inutes. After the baseline saliva collection, all
future collections were done by the subjects themselves and labeled with the
time of collection. The fluoride assays were performed blinded to treatment
groups and were analyzed with the micro-diffusion method. This study was
able to demonstrate that the 5% NaF varnish resulted in higher and more
sustained levels of fluoride in saliva than the 0.05% NaF rinse. Salivary
fluoride levels remained above baseline for up to 24 hours after the varnish
application and for 2 hours after the rinse. For both groups the salivary
fluoride levels peaked within 5 to 15 minutes. There was no carry over effect
found in this study, and all subjects returned to baseline after a maximum of

29
32 hours. However, for both groups, a period effect was observed in the
Area Under the Curve (AUC) data. Regardless of the order of treatments, the
second period AUC's were higher for both the varnish and the rinse. This
finding may indicate that some portion of fluoride remained in an un-
measurable form, but then was released upon the application of more
fluoride.
The amount of fluoride applied to each subject should have been
included in the methods for direct comparisons. It is feasible that the
collection of stimulated saliva with the Parafilm prematurely removed
varnish and increased flow rate, which may have impacted the results. In
addition the heavy reliance of subject compliance may have introduced
errors.
A study conducted by Seppä et al.,37 evaluated not only the fluoride
concentration in saliva, but in that of the parotid saliva after the application
of Fluor Protector and Duraphat fluoride varnishes. This study aimed to not
only evaluate the amount of fluoride release into whole saliva, but to
evaluate the amount of ingested fluoride that is present when using these
slow releasing fluoride agents. Parotid salivary fluoride levels can be used as
rough estimate of fluoride plasma values, and are less invasive to obtain.
Forty-one participants were randomly divided into the Fluor Protector or

30
Duraphat group, and each had 0.5 ml of the varnish applied to the teeth
according to manufacturer's instructions. Samples of stimulated parotid
saliva were obtained at 0.5, 1, 2, 3, 4, 5, 6, 24, 27, and 30 hours after
application, while whole resting saliva was obtained at 1, 2, 3, 6, 12, 24, 27,
30 and 48 hours after application. Samples were centrifuged, shaken and
then fluoride concentration was determined using a fluoride-specific
electrode. For whole saliva, the largest amount of fluoride in the saliva was
seen at hour one, where a mean 12.77 µg/ml (SD 4.34) was seen in the
Duraphat group, and 3.84 µg/ml (SD 2.12) was seen in the Fluor Protector
group. By 24 hours the whole saliva fluoride levels were still elevated
significantly above baseline, but there were no differences between the two
varnishes. Baseline fluoride values were observed at 24 h, 27 h, and 30 h
after application. In parotid gland saliva, the peak fluoride levels were
observed 30 minutes after application for both varnishes. Fluoride values
were significantly higher in parotid gland saliva after treatment with
Duraphat during the first 5 h ours. Baseline fluoride values were observed
between 24 hours and 30 hours for parotid saliva in b oth varnish groups.
This study effectively showed that differences can exist between two
fluoride varnishes, however, it is hard to make a direct comparison because

31
these varnishes contain very different amounts of fluoride in their
formulations (0.1% Fluor Protector, 2.26% Duraphat).
In 1999, Twetman et al.38 performed a crossover study with eight
subjects that evaluated the fluoride concentration in unstimulated whole
saliva and paraffin-stimulated whole saliva after the application of Bifluorid
12 (6% F-, 6% Ca 2+), Duraphat (2.26 % F-), and Fluor Protector (0.1 % F-).
They applied the varnish to the buccal and lingual surfaces of all teeth and
the occlusal surfaces of the molars and premolars. For Bifluorid and Fluor
Protector they used 0.5 ml, and for Duraphat 0.75 ml. Whole unstimulated
saliva was obtained by the passive drooling technique, and stimulated saliva
was collected by means of chewing paraffin wax. Samples were centrifuged
and the concentration of fluoride was determined using a fluoride sensitive
electrode at baseline and 1, 6, 12, and 24 hours after fluoride application. A
6 week washout period was observed between test periods. Within the
limitations of their study, they were able to determine that salivary fluoride
levels did correlate with the different amounts of fluoride in the varnishes,
however the correlation was not linear which indicated that the amount of
fluoride availability could not be adequately predicted by simply knowing
the amount of fluoride applied. Additionally, their results showed a trend of
decreased amount of fluoride found in the unstimulated saliva compared to

32
the stimulated samples for both Duraphat and Fluor Protector. They
hypothesized that chewing paraffin-wax dislodges varnish leading to higher
levels of salivary fluoride levels in stimulated saliva. Because this study
used varnishes with varying concentrations of fluoride, and they applied a
different amount of Duraphat, a direct comparison of fluoride release
differences among the three varnishes cannot be made.
Ritwik et al.9 decided that although several studies were available
regarding the release of fluoride over an extended time period, there was a
lack of literature describing the immediate release of the fluoride from
varnishes which they hypothesized to be the most important aspect from a
clinical standpoint. In 2012 they designed an in vitro study to evaluate the
fluoride release from Enamel Pro (Premier), PreviDent (Colgate), Vanish
(Omni), and Vanish XT (Omni) that happened over a 48 hour time period.
The first three products are varnishes while Omni Vanish XT is a light cured
resin-modified glass ionomer. The products, described as having the exact
same fluoride concentrations (5% NaF), were applied to a 5X5 enamel
surface window of extracted teeth. The amount of varnish applied was
accounted for by weighing the sample before and after varnish placement.
Vanish XT wa s light cured for 20 s econds after placement per
manufacturer's instructions. The teeth were immersed in artificial saliva after

33
treatment, and at intervals of 1, 2, 4, 8, 12, 24, and 48 hours, they were
transferred to a new container of fresh artificial saliva. Each vial of artificial
saliva was tested using a fluoride specific electrode. From their results, they
were able to conclude that despite the similar fluoride concentrations found
in each product, there were significant differences regarding their pattern,
and amount of fluoride release. Enamel Pro showed the greatest amount of
release within the first eight hours compared to the other varnishes, while
Vanish XT showed low release in the first 4 hours but maintained the
highest fluoride release after the 4 hour time period. They hypothesized that
the carrier component of the varnish was responsible for the difference in
this fluoride release.
This study was well designed and controlled, however the researchers
did not state how they determined the concentration of fluoride in the Vanish
XT. The product information guide does not state this is a 5% NaF
concentration which has the potential to make direct comparisons with this
product invalid.
In a recent study, Jablonowski et al.10 evaluated in vitro fluoride
release of four different fluoride containing products including three
varnishes; Enamel Pro, Vanish, and Duraphat, as well as the light-cured
resin-modified glass ionomer material, Vanish XT. Using twenty-five third

34
molars sectioned into four blocks, samples were divided into five different
groups, one group for each varnish, plus a control group. Each varnish was
applied to only the enamel portion of the tooth sections, a total of 3 mg was
applied to each sample, except the control group. Samples were dried for 24
hours and then immersed in 30 ml of artificial saliva. Using a fluoride
combination ion-selective electrode, the artificial saliva was tested to
determine the concentration of fluoride after 30 minutes, daily, and then
weekly until the concentration was below the electrode detection level. By
comparing the fluoride concentrations of the different varnish-saliva
solutions between specific time periods, a significant difference in fluoride
release was found between the varnishes evaluated. It was determined that,
for all the varnishes, the greatest rate of fluoride release was from baseline
up to three weeks. The differences in rate of fluoride release at each time
interval between the products was significant (Enamel Pro > Vanish >
Duraphat > Vanish XT). The rate of overall fluoride release was
significantly more for Enamel Pro than Duraphat; however Vanish and
Vanish XT were not significantly different. Additionally, Enamel Pro
displayed a greater cumulative amount of fluoride release than the other
products. This study, although in vitro, was well designed demonstrated that
there may be complex interactions between fluoride and the carrier

35
formulations that affect the overall fluoride release. Unfortunately they did
not state the fluoride concentration in Vanish XT therefore it is hard to
determine if the data from this product can be compared directly to the other
products.
Experimental Design
Currently, the literature regarding fluoride release and bioavailability
contains large variations in experimental design, limiting the possibility of
comparing their results. Some of these experimental design components that
will be discussed below include the type of saliva, collection and handling
method, and analytical techniques used to determine the fluoride
concentration in sa liva. These methods, for various reasons, have the
greatest potential to affect variability in the study results.
Saliva Type
In his publication Clinical Aspects of Salivary Biology for the Dental
Clinician, 39 Walsh describes up to eight major functions of human saliva
important to oral health, one of which is to serve as a reservoir for ions
involved in remineralization. He states that salivary flow, which can range
from 0.03 ml/min up to ≥ 1 ml/min, is affected by stimulation and the time
of day it i s measured. The components of saliva are a combination of the
minor and major salivary glands, and they may be considered a

36
representative of the blood serum. Whole saliva is 99% water, and is made
up of mucinous saliva from the submandibular gland, serous saliva from the
parotid gland, with minor contributions from both the sublingual and other
minor salivary glands.
Saliva can be classified by either glandular or whole, and by either
resting or stimulated. In many cases, analytes of interest to a researcher are
produced in different concentrations by the different salivary glands. In this
case, there may be a particular reason to sample the saliva coming from only
one gland. For example, Seppä et al.37 evaluated both whole saliva and
parotid gland saliva fluoride levels in order to determine what percentage of
the fluoride ion calculated came from release directly into saliva from the
product, compared to that amount that was coming from the serum or blood
represented by in the parotid gland saliva. Studies involving the
quantification of systemic or ingested fluoride will commonly evaluate
parotid saliva as a less invasive representation of blood fluoride levels.
Whole saliva, which represents a mixture of all the saliva available in the
oral cavity, is commonly used when calculating the fluoride release directly
from a material into the oral cavity; because it represents the fluoride that
would be available to act topically, which is fluoride's principal mechanism
action. A shortcoming of this method is that in addition to measuring

37
fluoride released directly into saliva from the product, you may inadvertently
be measuring fluoride currently in the blood stream that is released from the
salivary glands. If the data collected happens within the first hour, this
amount is thought to be negligible because serum fluoride levels peak 20-60
minutes after ingestion and then is excreted from the kidneys within 3-6
hours.40
In one study, conducted by Fukushima et al.40 the differences between
parotid duct saliva and whole saliva were examined. The aim of this study
was to determine which saliva type, ductal or whole, would be a better
indicator of exposure levels to fluoride. Using 300 subjects from five
communities with different water fluoridation levels (0.0-1.68 mg/L),
unstimulated whole saliva and parotid duct saliva were collected. The
amount of fluoride found in each sample was then compared to the known
amount of fluoride found in the community’s drinking water. Age, gender,
and geographical locations of the subjects were also analyzed to determine if
any influence of these factors on salivary fluoride levels could be seen.
Salivary fluoride levels were determined using an inverted ion-specific
electrode. The results showed that the water fluoride concentration was the
main factor influencing fluoride levels in parotid duct saliva, but not whole
saliva. The authors concluded that parotid duct saliva is a better indicator of

38
systemic fluoride and can be considered a good biomarker for exposure to
fluoride in above-optimum levels from water. This research supports the use
of whole saliva rather than parotid saliva to detect fluoride bioavailability
from direct release of high fluoride containing products. Ductal saliva
analysis would reflect systemic fluoride levels which are not believed to be
the main mechanism of action fluoride in caries prevention.
In support of Fukushima's findings, Olivby et al.42 demonstrated that
the concentration of excreted fluoride ion from the
submandibular/sublingual, and parotid glands closely reflects the serum
fluoride levels and can be a good predictor of systemic fluoride levels. This
study also verified that glandular salivary fluoride concentration is
independent of the glandular flow rate. This characteristic differs from
fluoride analysis done from whole saliva.
The influence of flow rate on the bioavailability of fluoride in whole
saliva was examined by Naumova et al.43 In this study the whole saliva of
ten different test subjects was analyzed to determine the concentration of the
fluoride ion after delivery of either a 1450 µg/g NaF tablet (DENTTABS) or
use of 1400 µg/g amine fluoride (EMLEX) dentifrice. Subjects were
identified as either normal or fast salivary secretors based a five minute
collection period. Subjects producing 0.3g-0.6 g/min were classified as

39
normal secretors, and those producing > 0.6 g/min were described as fast
secretors. Subject baseline saliva was taken in a ddition to their saliva
immediately after the use of the fluoride containing products. Using a cross-
over study design all subjects repeated the two study arms five different
times with a three day washout period in between. The result showed that
salivary flow rate had a significant effect on the total amount of fluoride ion
present in the saliva sample. Individuals with higher salivary flow rates
tended to have saliva with a lower amount of fluoride.
Studies conducted by Zero et al.44 and Brunn et al.45 demonstrated the
same negative correlation between salivary flow rate and fluoride ion
concentration in whole saliva following the use of high fluoride products.
Clinically, this may have implications in getting the desired amount of
fluoride to stay around the oral cavity of individuals that have high salivary
secretion rates. Experimentally, this c omplicates the ability to adequately
determine the amount of fluoride release into saliva from different fluoride
containing products due to possible flow rate differences among subjects.
For this reason, cross-over study designs using this methodology of fluoride
concentration analyses are indicated.
Finally, determining the preference for stimulated versus unstimulated
saliva for sampling, there are several considerations. According to Walsh,39

40
the majority (60%) of resting saliva is derived from the submandibular gland
which produces mostly mucinous saliva high in mucin proteins and calcium.
Parotid saliva, in contrast, comprises only 20% of resting saliva, is high in
bicarbonate and amylase and termed serous saliva. Submandibular salivary
secretion rate increases by stimulation of chemoreceptors, while parotid
gland secretion is mainly influenced by mechanoreceptor stimulation. Walsh
contends that the protein content found in s ubmandibular saliva has the
potential to interfere or bind to free ions in saliva. For fluoride varnish,
which is intended to adhere to tooth surfaces for prolonged fluoride release,
the use of stimulation by chewing has the potential to prematurely dislodge
the varnish, and increase salivary flow rates thereby leading to altered
results. Stimulated saliva collection is advantageous in some cases because
of the ability to rapidly collect larger amounts of saliva.
Collection and Handling
The method of saliva collection can play a large part in the acquisition
and subsequent analysis of an analyte of interest. Salimetrics,46 a corporation
based in Pennsylvania, offers one of the most extensive, research supported
literature for determining methods to obtain clean salivary samples for
analysis of several different analytes. In their handbook Saliva Collection
and Handling Advice, they outline proper ways to collect saliva, avoid

41
contaminants, and store samples for future use. For some analytes, variations
can be seen based on diurnal cycle, stress levels, or salivary flow rates.
Additionally, contaminants such as alcohol, food, caffeine, nicotine,
medications or blood, must be considered. They recommend avoidance of
food 60 minutes prior to sample collection and documentation of the
subject’s use of alcohol, caffeine, nicotine, or medications. They indicate
that the passive drool technique is a cost effective way to obtain whole saliva
that can be used for almost all analytes. In this method, the subject tilts his
head forward and allows for unstimulated saliva to pool before letting the
saliva flow into a collection vial. Saliva samples are then stored at -20ºC to
-80ºC until analyzed.
Recently the handling techniques used in salivary fluoride analysis
studies have been an area of interest. Historically, many studies centrifuged
the salivary samples and analyzed the supernatant alone as a way to
eliminate interference from fluorides found in salivary sediment which Gron
et al.47 hypothesized to reflect levels more similar to that found in plaque.
Additionally, analysis of the supernatant has the advantage of creating clean
samples with minimal interference from mucin protein globules which tend
to become suspended in saliva creating a non-homogeneous solution.

42
Naumova et al.48 conducted a study to determine if differences existed
between the analyses of fluoride in the different phases of saliva. They
hypothesized that the sediment, which contains cellular, proteins, and food
debris, may be an important source of fluoride bioavailability, despite the
fact that several studies examine the supernatant alone. Their specific aim
was to assess the fluoride content found in t he sediment and supernatant
phases of saliva after centrifugation. In this cross-over study design, seven
subjects either brushed with an amine fluoride dentifrice (EMLEX)
containing 1400 ppm F-, or chewed a sodium fluoride tablet (DENTABS)
containing 1450 ppm F- at least 10 times and then brush with the particulate.
All subjects completed both experimental arms twice and had a minimum
seven day washout period between. Saliva samples were obtained at
baseline, 3, 30, 120, and 360 minutes after brushing. 1.5 ml of saliva was
centrifuged for 10 min at 3024 x g, and 1 ml of supernatant was removed
from the sample, leaving 0.5ml of sediment. For analysis, equal parts of
TISAB II were added to the samples. The samples of sediment and
supernatant were analyzed with a fluoride-sensitive electrode. The results
indicated three main things. First of all, there were significant differences
between the amine and fluoride group in the total amount of fluoride found
in both phases of saliva. Secondly, the dispersion of fluoride found in the

43
different phases was significantly different, with the amine fluoride group
having more fluoride recovery from the sediment than the supernatant.
Lastly, the overall amount of fluoride found in the different phases was
significant for both groups, and the ratio of the mean sediment to supernatant
fluoride ranged from 0.07-31.6 across the time periods. In general, the
amount of fluoride found in the sediment was greater than that found in the
supernatant for all time periods, for both fluoride groups. This study
indicates that centrifugation prior to fluoride analysis may be missing an
important portion of the total fluoride available from products.
Analytical Methods
Several methods exist to analyze trace levels of fluorides in materials.
Well established methods include the potentiometric, gas chromatography,
and the rapid diffusion techniques.
Evaluation of the literature suggests that for biological samples, the
most common method is the potentiometric technique using an ion selective
electrode (ISE). In this method, a lanthanum fluoride plate doped with
europium++ is used at the base of a probe to quantify fluoride activity in a
solution. This method is commonly used because of its rapid analytical
capabilities, relative accuracy and ease of use. Frant and Ross49 first
described the use of this probe for evaluation of fluoride ion activity in 1966.

44
They described that the lanthium fluoride plate is impermeable to other ions
and therefore the resulting relationship of fluoride ion activity to
millivoltage readings follows Nernstian behavior from 1- 105 M. Aside from
the hydroxide ion, which can be adjusted for by changing the pH of the
solution, other ions do not appreciably interfere with the electrode. The
method of pH adjustment used today is by use of a Total Ionic Strength
Adjustment Buffer (TISAB) as described by Frant and Ross50 two years later
in 1968.
Frant and Ross were experimentally looking for a solution that would
have three main purposes for its use in fluoride ion analysis. First they
wanted a solution to buffer the solution to a pH less than 8.5 to a void
hydroxide ion interference. Second they needed to increase the ionic
strength of the water by adding more ions than were normally present in the
solution. Finally they needed citrate present in order to complex Fe3+ and
Al3+ to displace any bound fluoride to these ions. Their TISAB reagent
consisted of 57 ml Acetic Acid, 58 g of NaCl, 0.30 g sodium citrate, and 500
ml H2O. Experimentally, Frant and Ross were able to determine that the
addition of this TISAB in a 1:1 ratio with their samples allowed for the
lower direct determination of concentration in water to + .005 ppm. Without
the use of TISAB, 25% of their lower limit samples fell below the best fit

45
standard curve line. At the time they hypothesized that this solution would
allow direct readings for low fluoride concentrations in a variety of aqueous
solutions. The TISAB reagent is currently still used for both the direct and
indirect analysis of low fluoride ion detection in solution, including saliva.
According to t he Department of Health and Human Services1, the
most accurate technique in fluoride analysis is the microdiffusion technique.
In 1968 Taves50 described this method using hexamethydisiloxane saturated
acid as a way to speed up the process of diffusion. Although very accurate,
this method is technique sensitive and requires more time than the direct
method. According to Taves, greater than 97% recovery in one hour at room
temperature is possible. Following diffusion of the fluoride ion into a
sodium hydroxide trap, further analysis is required to determine the amount
of fluoride trapped. This can be done with one of the other techniques of
fluoride analysis such as the direct technique using a fluoride ion specific
probe.
In an attempt to standardize the most common methods of fluoride ion
analysis, Martinez-Mier et al.52 conducted an experiment which evaluated a
total of nine different labs analytical techniques and results from a set of
standardized fluoride samples. These labs were all using either the direct
technique, or the microdiffusion technique. Broken down into three phases,

46
labs were first instructed to describe their current technique and provide
results for a set of biological and non-biological samples. After this,
inconsistencies between the different techniques were identified and labs
reanalyzed the samples using the various techniques documenting the
results. Finally these results from the various techniques were distributed to
the nine labs and a plan was made to standardize the techniques providing
the most accurate results. After the technique was agreed upon, each lab re-
analyzed the biological and non-biological samples and the intraclass
correlation coefficient (ICC) was found to be 0.93 for the direct analysis and
0.90 for the microdiffusion technique. The specific recommendations for
each technique were further outlined in this paper, which also concluded that
samples below 0.0105 µmol F/g could be analyzed either with a blank
correction or two-term polynomial regression equation. The authors
concluded that ion-selective potentiometric methods were the technique of
choice due to the ubiquitous use, ease of accessibility, and acceptable lower
detection limit.

47
References
1. Recommendations for using fluoride to prevent and control dental caries in the United States. Centers for Disease Control and Prevention. MMWR.Recommendations and reports : Morbidity and mortality weekly report.Recommendations and reports / Centers for Disease Control. 2001;50(RR-14):1.
2. American Dental Association Council on Scientific Affairs.
Professionally applied topical fluoride: evidence-based clinical recommendations. J Am Dent Assoc. 2006;137(8): 1151-1159.
3. Schmidt HFM. Ein neues Tauchierungsmittel mit besonders lang
anhaltendem intensivem Fluoridierungseffekt. Stoma. 1964;17:14-20. 4. United States Food and Drug Administration. Off-Label and
Investigational Use of Marketed Drugs, Biologics, and Medical Devices [Internet]. Silver Spring (MD): U.S. Department of Health and Human Services; [Updated 10 Aug 2011; cited 28 July 2012]. Available from: http://www.fda.gov/RegulatoryInformation /Guidances/ucm126486.htm
5. Material Safety Data Sheet. Colgate Duraphat Infosafe No. LPXXP
[Internet]. [place unknown; ACOHS Pty Ltd]; c2008 [cited 15Nov 2012]. Available from: http://www.colgate.com.au/Colgate/AU/Corp/MSDS/ pdfs/duraphat.pdf
6. Material Safety Data Sheet. Duraflor [Internet]. Greenville (NC):
Practicon. [cited 23 Feb 2013]. Available from: http://practicon.com/docs/Duraflor.pdf
7. Material Safety Data Sheet. Fluor Protector [Internet]. Schann
(Germany): Ivoclar Vivadent. [revised 21 March 2011, cited 23 Feb 2013]. Available from: [email protected].
8. Kennard RG, Wagner JA, Kawamoto AT. Fluoride varnish
compositions including an organo phosporic acid adhesion promoting agent. United States patent US 0191279 A1.2009.

48
9. Ritwik P, Aubel J, Xu X, Fan Y, Hagan J. Evaluation of short term
fluoride release from fluoride varnishes. J Clin Pediatr Dent. 2012;36(3):275.
10. Jablonowski BL, Bartoloni JA, Hensley DM, Vandewalle KS.
Fluoride release from newly marketed fluoride varnishes. Quintessence International (Berlin, Germany : 1985). 2012; 43(3):221.
11. González-Cabezas C, Flannagan SE, Krell R., Uekihara M, Niquette CC. Fluoride Release from Fluoride Varnishes is Affected by Incubation Conditions. Unpublished work presented at AADR/CADR Annual Meeting 2012.
12. Occupational Safety & Health Administration . Toxic and Hazardous
Substances 29 CFR 1910.1200 App E [Internet]. Washingtion DC: U.S. Department of Labor; c1939 [revised 26 Mar 2012, cited 25Aug 2012] Available from: http://www.osha.gov/pls/oshaweb/owadisp.show_document?p_table=STANDARDS&p_id=10104
13. Reynolds E. Calcium phosphate-based remineralization systems:
Scientific evidence? Australian Dental Journal 2008;53(3):268. 14. Schemehorn B, Orban J, Wood G, Fischer G, Winston A.
Remineralization by fluoride enhanced with calcium and phosphate ingredients. Journal of Clinical Dentistry. 1999;10(1):13.
15. Tylenda CA, Jones D, Ingerman L, Sage G, Chappell L. 2003.
Toxicological Profile for Fluorides, Hydrogen Fluoride, and Fluorine. Atlanta, GA. U.S. Department of Health and Human Services. [cited 2012 June 20] Available from: http://www.atsdr.cdc.gov/toxprofiles/tp11-p.pdf
16. National Institute of Dental and Craniofacial Research. [Internet]. The
Story of Fluoridation. Bethesda: National Institue of Health; c2011 [cited 2012 Jul 25]. Available from: http://www.nidcr.nih.gov/OralHealth/Topics/Fluoride/ TheStoryofFluoridation.htm.

49
17. Limeback H. A re-examination of the pre-eruptive and post-eruptive
mechanism of the anti-caries effects of fluoride: is there any anti-caries benefit from swallowing fluoride? Community Dent Oral Epidemiol. 1999;27: 62-71.
18. Collins F. The development and utilization of fluoride varnish. RDH.
2011:S1. 19. Heuser H, Schmidt HFM. Zahnkariesprophylaxe durch
Tiefenimprägnierung des Zahnschmelzes mit Fluor-Lack. Stoma. 1968;21: 91–100. German.
20. Todd JC, Fischer K. Fluor Protector; Scientific Documentation
[Internet]. Liechtenstein: Ivoclar Vivadent; c2010 [cited 08 Aug 2012] Available from: http://www.ivoclarvivadent.com/en/dental-professional/download-center/scientific-documentations/Saggio Paul, personal communication, July 9, 2012.
21. VOCO. Innovations for Dental Health. Cuxhaven: Voco GmbH;
2010. p. 2. 22. American Academy of Pediatric Dentistry. Guideline on fluoride
therapy. Pediatr Dent. 2009;31(6):128. 23. Helfenstein U, Steiner M. Fluoride varnishes (Duraphat): a
metaanalysis. Community Dent Oral Epidemiol. 1994;22:1±5. 24. Merriam-Webster Online. “Rosin” [Internet]. Springfield (MA).
Merriam-Webster Inc.; c2013 [cited 2012 June 28]. Available from http://www.merriam-webster.com/dictionary/rosin
25. Øgaard B. The Cariostatic Mechanism of Fluoride. Compendium
1999;20 (1): 1-17. 26. Jeevarathan J, Deepti A, Muthu MS, Rathna Prabhu V,
Chamundeeswari GS. Effect of fluoride varnish on streptococcus mutans counts in plaque of caries-free children using dentocult SM strip mutans test: A randomized controlled triple blind study. J Indian Soc Pedod Prev Dent. 2007;25(4):157.

50
27. Pandit S, Kim J, Jung K, Chang K, Jeon J. Effect of sodium fluoride
on the virulence factors and composition of streptococcus mutans biofilms. Arch Oral Biol. 2011;56(7):643.
28. Zickert I, Emilson CG. Effect of a fluoride-containing varnish on
streptococcus mutans in plaque and saliva. Eur J Oral Sci. 1982;90(6):423-8.
29. Øgaard B, Rölla G, Helgeland K. Fluoride retention in sound and
demineralized enamel in vivo after treatment with a fluoride varnish (duraphat). Scandinavian Journal of Dental Research. 1984;92(3):190.
30. Cruz R, Øgaard B, Rolla G. Uptake of KOH-soluble and KOH-
insoluble fluoride in sound human enamel after topical application of a fluoride varnish (Duraphat) or a neutral 2% NaF solution in vitro. Scand J Dent Res. 1992;100:154-8.
31. Grobler SR, Kotze TJ. Alkali-soluble and insoluble fluoride in erupted
and unerupted sound enamel of human third molars in vivo. Arch oral Biol. 1990;35(10):795-800.
32. Seppä L. Effects of a sodium fluoride solution and a varnish with
different fluoride concentratoins on enamel remineralization in vitro. Scad J Dent Res. 1988;96:304-9.
33. Tenuta LMA, Cerezetti RV, Del Bel Cury AA, Tabchoury CPM, Cury
JA. Fluoride release from CaF^sub 2^ and enamel demineralization. J Dent Res. 2008;87(11):1032.
34. Castellano JB, Donly KJ. Potential remineralization of demineralized
enamel after application of fluoride varnish. Am J Dent. 2004; 17(6):462-4.
35. Rytömaa I, Meurman JH. Fluoride in saliva after various topical
treatments. Proc Finn Dent Soc. 1983;79(4):172-7. 36. Eakle WS, Featherstone JDB, Weintraub JA, Shain SG, Gansky SA.
Salivary fluoride levels following application of fluoride varnish or fluoride rinse. Community Dent Oral Epidemiol. 2004;32(6):462.

51
37. Seppä L, Hanhijarvi H. Fluoride Concentration in Whole and Parotid
Saliva after Application of Fluoride Varnishes. Caries Res. 1983;17:476-480.
38. Twetman S, Sköld-Larsson K, Modéer T. Fluoride concentration in
whole saliva and separate gland secretions after topical treatment with three different fluoride varnishes. Acta Odontol Scand. 1999;57(5):263.
39. Walsh LJ. Clinical aspects of salivary biology for the dental clinician.
J Minim Interv Dent. 2008;1(1):7-24. 40. American Dental Association. Fluoridation facts [Internet]. [place
unknown; American Dental Association]; c2005 [cited 22 March 2013]. Available from: http://www.ada.org/sections/newsAndEvents/pdfs/fluoridation _facts.pdf
41. Fukushima R, Pessan JP, Sampaio FC, Buzalaf MAR. Factors
Associated with Fluoride Concentrations in Whole and Parotid Ductal Saliva. Caries Res 2011;45:568-573.
42. Oliveby A, Lagerlof J, Estrand J, Dawes C. Studies on Fluoride
Concentrations in Human Submandibular/Sublingual Saliva and their Relation to Flow Rate and Plasma Fluoride Levels. J Dent Res. 1989;68(2):146-149.
43. Naumova EA, Gaengler P, Zimmer S, Arnold WH. Influence of
Individual Saliva Secretion on Fluoride Bioavailability. The Open Dentistry Journal. 2010;4, 185-190.
44. Zero DT, Fu J, Espeland MA, Featherstone JD. Comparison of Fluoride Concentrations in Unstimulated Whole Saliva Following the Use of Fluoride Dentifrice and a Fluoride Rinse. J Dent Res. 1988;67(10):1257-1262.

52
45. Bruun C, Qvist V, Thylstrup A. Effect of flavour and detergent on fluoride availability in whole saliva after use of NaF and MFP dentifrices. Caries Res. 1987;21:427-434.
46. Salimetrics. 2009. Saliva Collection and Handling Advice 47. Gron P, McCann HG, Budevold F. The direct determination of
fluoride in human saliva by a fluoride electrode: Fluoride levels in parotid saliva after ingestion of single doses of sodium fluoride. Arch Oral Bio. 1968;13(2)203-213.
48. Naumova EA, Sandulescu T, Bochnig C, Gaengler P, Zimmer S,
Arnold WH. Kinetics of fluoride bioavailability in supernatant saliva and salivary sediment. Archives of Oral Biology. 2012;57(7):870-876.
49. Frant MS, Ross JW. Electrode for Sensing Fluoride Ion Activity in
Solution. Science. 1966;154:1553-1555. 50. Frant MS, Ross JW. Use of a Total Ionic Strength Adjustment Buffer
for Electrode Determination of Fluoride in Water Supplies. Analytical Chemistry. 1968;40(7):1169-1170.
51. Taves, D. Separation of Fluoride by Rapid Diffusion Using
Hexamethyldisiloxane. Talanta. 1968;15(9)969-974. 52. Martínez –Mier EA, Cury JA, Heilman JR, Katz BP, Levy SM, Li Y,
et al. Development of Gold Standard Ion-Selective Electrode-Based Methods for Fluoride Analysis. Caries Res. 2011;45:3–12.

53
Chapter 2
Abstract Objective: To compare the release of fluoride into unstimulated whole saliva in vivo after the application of three different 5% NaF varnishes: Enamel Pro, Vanish, and Duraphat. Experimental Methods: Following IRB approval, 15 subjects were recruited and consented based upon the inclusion/exclusion criteria of the study. A four-treatment randomized cross over study design with a 2-week washout period between treatments was used. Treatment consisted of the application of 0.4 ml of either a 5% NaF varnish, or a placebo (no fluoride) varnish applied to the buccal surfaces of all the teeth. After a minimum of 2 weeks washout period, the next randomly assigned treatment was given. All subjects received the 4 different treatments and during each treatment unstimulated whole saliva was obtained at baseline and 1, 4, 6, 26, and 50 hours. Following storage, saliva samples were centrifuged and the supernatant salivary fluoride was measured using a fluoride ion specific electrode to compare unknown values with a standard curve. Mixed linear effects models were used to evaluate the effects of varnish and time on salivary fluoride concentration. Significance was determined at 5% level for all tests. Results: For time periods 1, 4, 6, and 26 hours, treatment with Duraphat and Vanish resulted in significantly higher mean concentrations of salivary fluoride than Enamel Pro, but were not different from each other. 50 hours after treatment, mean salivary fluoride levels for Duraphat were greater than all other treatments. For all the fluoride containing varnishes, the maximum amount of fluoride was measured at the 1 hour time point [D (18.94±9.95), V(19.78±14.57), EP (6.19±4)] and the fluoride concentration decreased at each time point thereafter. When treated with Enamel Pro and Vanish, mean baseline salivary fluoride concentrations were reached by 26 hours. Mean salivary fluoride concentrations with Duraphat treatment was still above baseline at the 26 hour collection point. Conclusions: Salivary fluoride concentrations after treatment with Duraphat and Vanish are similar over 26 hours. Treatment with Enamel Pro resulted in significantly less fluoride in saliva over 26 hours. Despite the similar fluoride concentrations, the fluoride release into saliva from these varnishes over time differs. The reasons for this difference warrant further investigation.

54
Introduction
Fluoride varnish production and use has had a dramatic increase in the
last decade following approval by the FDA in 1994 as a cavity liner and root
desensitizer.1 Despite its "off-label" use in caries prevention, research has
demonstrated varnishes to be a safe, effective, and efficient way to deliver
fluoride to patients at risk for dental caries.2,3 Accordingly, fluoride
varnishes are widely recommended for patients at high risk for dental caries
(ADA, CDC, AAPD). Although the FDA did not approve fluoride varnishes
until 1994, the first fluoride varnish was developed in the 1960's as a
possible mechanism to enhance the treatment duration and uptake of
fluoride.4 Most of the clinical research on fluoride varnishes has been
conducted using Duraphat (5% NaF), which was the first commercially
available product.
Within the last few years, numerous varnishes with similar sodium
fluoride concentrations (5%), but with multiple variations in carrier
composition, have emerged and have taken a significant portion of the
market share. As the number of fluoride varnishes available has increased,
each company has created unique changes to the formula in order to improve
properties like handling, appearance (i.e., white), flavor, or in some cases,

55
potentially active ingredients (e.g., tricalcium phosphate, amorphous calcium
phosphate, calcium sodium phosphosilicate, xylitol, etc.),5-8 leading to a
claim of additional preventive benefits. Most of these new varnishes have
not been studied in vivo for their caries reduction, efficacy, or safety.
Despite the similar 5% NaF concentration used in most of these
varnishes, in vitro data have suggested that some of these secondary
ingredients may affect the fluoride ion release of the product.9,10,11 Fluoride
release, and subsequent formation of calcium fluoride is thought to be an
essential part of the mechanism of action of fluoride varnishes to prevent
and remineralize carious lesions. Differences in fluoride release patterns can
potentially enhance or diminish the efficacy and safety of a varnish.
Therefore, understanding the differences in fluoride release pattern of
varnishes with different formulations in vivo will help us understand which
formula modifications have the potential to enhance or diminish the
anticariogenicity and safety of the varnish. Several studies have compared
fluoride varnishes to other delivery systems such as gels, foams, and
pastes,12,13 however, a void remains in the literature regarding the
comparison of efficacy and safety between the many different new fluoride
varnish systems containing 5% NaF widely available today.

56
The aim of this study was to evaluate the fluoride release from three
different 5% NaF varnishes. By comparing the fluoride release as measured
by concentration of fluoride in whole unstimulated saliva of participants, we
wanted to gain some insight to the complex interaction of these trade secrets
in vivo and the potential effect they may have on fluoride varnish efficacy.
Hypotheses
Ho1 - There will be no significant difference in the amount of fluoride
release into saliva among the 3 different varnishes.
Ha1 – There will be a significant difference in the amount of fluoride release
into saliva release among the 3 different varnishes.
Ho2 – There will be no significant difference in the timing of fluoride
release in to saliva among the 3 different varnishes.
Ha1 – There will be a significant difference in the timing of fluoride release
into saliva among the 3 different varnishes.
Methods and Materials
Subject Recruitment
Prior to subject recruitment, approval was obtained from the
Institutional Review Board, University of Michigan Medical School
(HUM00062943). The clinical trial was registered at ClinicalTrials.gov.

57
(NCT01629290). Subjects were subsequently recruited at the University of
Michigan School of Dentistry primarily by word of mouth. Individuals who
had signed the informed consent qualified for participation in the study
unless they met any of the following criteria for exclusion: having less than
20 teeth, having significant untreated medical conditions, being pregnant or
lactating, requiring pre-medication prior to dental treatment, having known
allergies to fluoride varnishes, and having no history or current carious
lesions. Additionally, subjects that stated they would not be available for
each cycle of the study did not qualify for participation. Subjects meeting the
inclusion criteria were further screened for adequate salivary production.
Those subjects able to produce 2 ml of unstimulated saliva in a two minute
time period were included in the study and given a subject number based on
their order of consent.
A total of seventeen subjects were included in the study. Fifteen were
given a number 1-15 and the remaining two served as back-ups. There were
no drop outs during the study period, and the original fifteen subjects
completed the 4 experimental arms.
Varnish Selection
The different fluoride varnishes were chosen for this study based on
their identical concentration of sodium fluoride (5%), commercial

58
availability, presumed popularity, and clear use of different carrier materials
and clinical appearance (Table 1). Although all subjects lived in fluoridated
communities and reported using fluoridated toothpaste, a placebo varnish,
made by the Premier Dental Company, with no sodium fluoride was utilized
as a means for comparison of background salivary fluoride concentrations.
The placebo varnish was tested and the absence of fluoride in the
formulation was verified. Like the other varnishes, the placebo varnish had
unknown amounts of other ingredients but was presumed to be similar to the
components found in the experimental varnish Enamel Pro.
Table 1. Experimental Varnishes
Varnish Company Active Ingredient Marketed Additives
Vanish 3M ESPE (St.Paul, MN) 5% NaF Tri-Calcium Phosphate
(TCP)
Enamel Pro Premier (Plymouth Meeting, PA) 5% NaF
Amorphous Calcium Phosphate
(ACP) Duraphat Colgate-Palmolive
(New York, NY) 5% NaF None
Placebo Premier (Plymouth Meeting, PA) N/A N/A
Varnish Application
Using the unique subject number and the different varnishes to be
applied, a randomized table was created using a random number generator
service (www.random.org) to determine the order of application for each

59
subject (Table 2). The subjects were blinded to the order of varnish
application and to the name of the varnish, however because of the
uniqueness of each varnish (flavor, color, adherence etc.) the subjects had
the potential to d iscriminate between the varnishes. Varnish application,
saliva collection, and saliva analysis was carried out by the same person who
was not blinded to varnish application, but was blinded to sample analysis.
Table 2. Randomized Treatment Sequence
Each active varnish (3) and the placebo varnish (1) was applied one
time to each subject and saliva was collected over a total of 50 hours after
application. Between different varnish applications a minimum of two weeks
was allowed for wash-out from prior varnish applications, this protocol
Subject Treatment 1 Treatment 2 Treatment 3 Treatment 4 1 Placebo Enamel Pro Duraphat Vanish 2 Enamel Pro Duraphat Placebo Vanish 3 Duraphat Enamel Pro Vanish Placebo 4 Duraphat Enamel Pro Placebo Vanish 5 Enamel Pro Vanish Placebo Duraphat 6 Vanish Enamel Pro Duraphat Placebo 7 Enamel Pro Duraphat Vanish Placebo 8 Duraphat Enamel Pro Vanish Placebo 9 Duraphat Vanish Placebo Enamel Pro 10 Vanish Enamel Pro Placebo Duraphat 11 Duraphat Placebo Enamel Pro Vanish 12 Enamel Pro Placebo Vanish Duraphat 13 Vanish Duraphat Placebo Enamel Pro 14 Enamel Pro Placebo Duraphat Vanish 15 Enamel Pro Placebo Vanish Duraphat

60
applied to the placebo as well. In total, all subjects completed four rounds of
varnish application and saliva collection. Varnish containers and brushes
were weighed prior to the application and afterward for determination of the
actual amount of varnish applied.
On the morning of varnish application, subjects were instructed to
refrain from brushing. Subjects were given a new toothbrush when they
presented to the clinic between 8 am and 10 am and were instructed to brush
with a non-fluoridated toothpaste (Fruit Splash Training Toothpaste, Orajel
Toddler, Chrurch & Dwight Inc. Princeton, NJ) for a total of 1 minute.
Health history was reviewed and updated as necessary and each subject was
given a soft tissue exam noting any pre-existing lesions or deviations from
normal. Following the exam, subjects provided 2 ml of unstimulated, whole
saliva using the drooling technique to serve as a baseline comparison
(Heintze et al., 1983). In this technique subjects were seated in a quiet
operatory and told to allow saliva to pool at the base of their mouth without
sucking or stimulating flow. Saliva was then allowed to passively flow from
their mouth into a medicine cup. This technique was used for all saliva
collection times.
Using a soft tissue retractor (Optragate®, Ivoclar Vivadent, Amherst,
NY) for isolation, teeth were lightly air dried with an air water syringe tip,

61
and 0.4 ml (actual amount determined later) of varnish was applied to the
buccal surface of each tooth. In cases where varnish was leftover in the
container after initial layer, another layer was applied over the first layer
until no more was available for application. Following application, the
Optragate® was removed, and the remaining varnish container, plus the
application brush was saved for determining the actual amount applied.
Subjects were given instructions to avoid hard foods, alcohol, or warm
liquids for 24 hours. These instructions were a combination of post
application instructions provided by the different varnish companies.
Additionally, aside from water, subjects were instructed to refrain from
eating or drinking 1 hour prior to a ny of the saliva collection times, and
subjects were given a list of foods potentially high in fluoride to avoid
throughout the three day study period (i.e., sardines, green tea). All oral
hygiene procedures were forbidden during the first 26 hours. After the 26
hour collection time, subjects were allowed to brush and floss with the non-
fluoridated products provided. Each subject was provided with a new
fluoride free toothbrush at the 26 hour collection period to avoid the use of
their personal fluoride contaminated toothbrushes.
Sample Collection
At time periods of 1h, 4h, 6h, 26h, and 50h after varnish application,

62
subjects returned for saliva collection. At each collection period, a minimum
of 2 m l of unstimulated, whole saliva was obtained by the drooling
technique over a 5 minute time period. In total, subjects provided six 2 ml
samples at each of the following time periods; baseline, 1 h, 4h, 6h, 26h, and
50h. Following a two week or greater wash out period, subjects returned for
the application of a different varnish. All treatments were randomized and
each subject participated in four study arms (three experimental, and one
placebo) in which each subject ultimately received all treatments. Saliva was
collected in a medicine cup and transferred to an eppendorph tube where it
was stored within an hour of collection to a -18ºC freezer. At the end of the
day all samples were transferred to a -80ºC freezer for future analysis. All
known deviations from the time periods or protocol were recorded.
Sample Preparation
Saliva samples were removed from freezer and thawed at room
temperature (24 ºC) for one hour. After thawing, samples were loaded into a
centrifuge machine (Spectrafuge 16M, Labnet, Edison NJ) and centrifuged
at 10,000 x g for 10 minutes. After removal, 0.7 ml of the supernatant was
removed and added to a scintillation vial containing 0.7 ml of TSAB II
(Orion TISAB II with CDTA, Thermo Scientific, Waltham, MA) for a total
volume of 1.4 ml.

63
Creating a Fluoride Standard Curve
Prior to sample analysis, serial dilutions of a 0.1M fluoride standard
(Orion Ionplus® Fluoride Standard, Thermo Scientific, Waltham, PA) were
made to produce nine samples of known fluoride concentrations (0.02-10.0
ppm) The mV readings were obtained using the fluoride specific ion probe
(Orion 4 Star pH ISE Benchtop, Thermo Scientific, Waltham, MA). The mV
was then used to create a fluoride standard curve where determination of the
fluoride concentration of the unknown samples could be compared. For the
unknown samples that fell below 0.02 ppm based on the linear standard
curve, a second two term polynomial regression curve was constructed to
closer approximate the fluoride concentrations. This curve was remade each
day prior to sample analysis, and was re-checked after every 2 hours of
sample analysis to check for electrode sensitivity changes (drift). According
to manufacture directions, drift of less than 3% is acceptable. There was no
drift greater than 2% during the analysis of the samples.
Sample Analysis
To the 1.4 ml samples, a magnetic stir bar was added and they were
placed on a magnetic stirrer (2 Mag Mix 15 Eco, Scragenhofstr, Muchen
Germany) for a minimum of fifteen minutes before analyzing. The fluoride
specific electrode (Orion 4 S tar pH ISE Benchtop, Thermo Scientific,

64
Waltham, MA) was submerged into the mix while the mix was being
continuously stirred and the mV reading was recorded. This mV reading was
compared to the fluoride standard curve made that day for the determination
of ppm F- in the sample. All samples were analyzed with this technique. All
analyses were carried out at room temperature of 24 ºC.
Statistical Analysis
To determine if there was a significant difference in the amount of
varnish applied to the subjects , a Kruskal-Wallis One Way Analysis of
Variance on Ranks followed by a Pairwise Multiple Caparison Procedure
(Tukey Test) was performed using a 5% significance level (p<0.05).
To evaluate the effects of varnish and time on salivary fluoride
concentration, linear mixed effects models were used. The models included
the order of varnish application as a covariate, random effects for subject,
and an unstructured variance/covariance matrix for the repeated
measurements within each study period. The analyses were repeated using
amount of varnish applied as a covariate. A natural logarithm transformation
(not displayed) of the saliva fluoride measurements was used in the analyses.
No adjustments were made for multiple comparisons, and a 5% significance
level was used for each test.
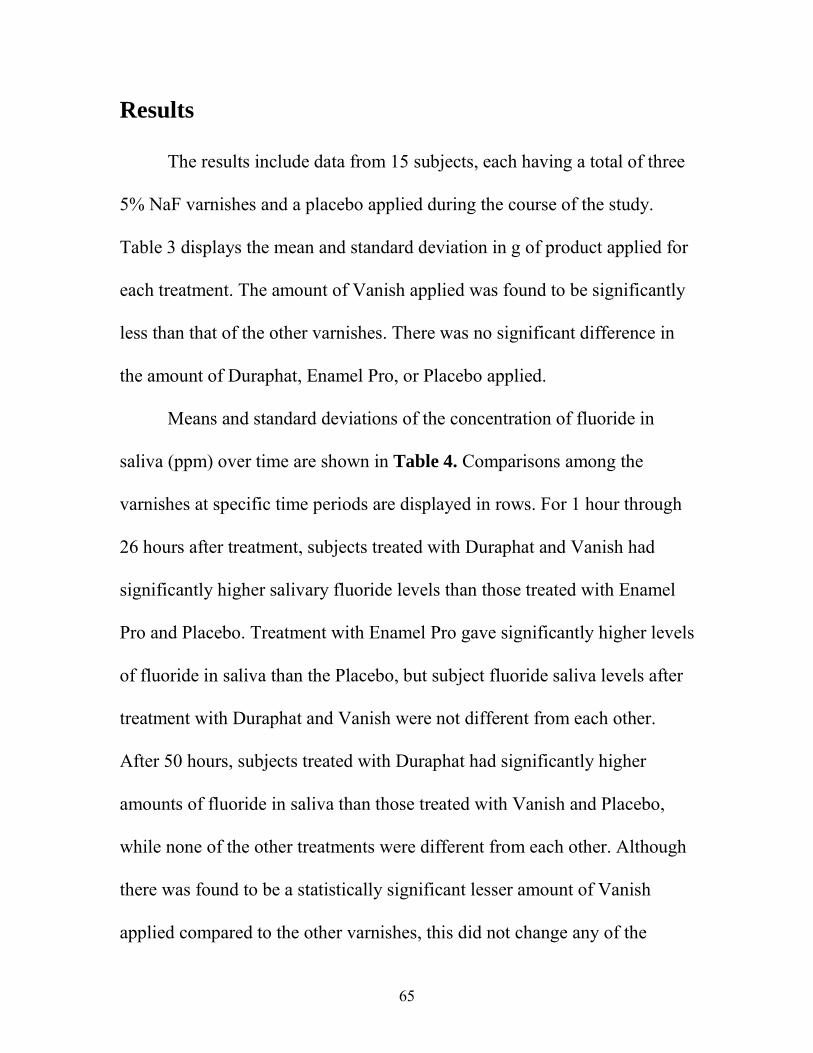
65
Results
The results include data from 15 subjects, each having a total of three
5% NaF varnishes and a placebo applied during the course of the study.
Table 3 displays the mean and standard deviation in g of product applied for
each treatment. The amount of Vanish applied was found to be significantly
less than that of the other varnishes. There was no significant difference in
the amount of Duraphat, Enamel Pro, or Placebo applied.
Means and standard deviations of the concentration of fluoride in
saliva (ppm) over time are shown in Table 4. Comparisons among the
varnishes at specific time periods are displayed in rows. For 1 hour through
26 hours after treatment, subjects treated with Duraphat and Vanish had
significantly higher salivary fluoride levels than those treated with Enamel
Pro and Placebo. Treatment with Enamel Pro gave significantly higher levels
of fluoride in saliva than the Placebo, but subject fluoride saliva levels after
treatment with Duraphat and Vanish were not different from each other.
After 50 hours, subjects treated with Duraphat had significantly higher
amounts of fluoride in saliva than those treated with Vanish and Placebo,
while none of the other treatments were different from each other. Although
there was found to be a statistically significant lesser amount of Vanish
applied compared to the other varnishes, this did not change any of the

66
results when taken into account in the analyses.
Table 3. Actual amount of product applied (± SD; in g)
Table 4. Mean concentration (± SD; in ppm) of fluoride in saliva over time
Time point comparisons for each varnish are also shown in Table 4
displayed by column. For Duraphat, the fluoride concentration in saliva was
significantly higher than baseline for 1 hour through 26 hours after treatment
Varnish Mean (SD)
Duraphat 0.30 (0.07)a
Vanish 0.25 (0.04)b
EnamelPro 0.29 (0.04)a
Placebo 0.26 (0.05)a Groups with same letters superscripts were not significantly different (p<0.05)
Time Duraphat Vanish Enamel Pro Placebo
B 0.07(0.04)a1
0.09(0.07)a1
0.09(0.07)a1
0.09(0.08)a1
1 HR 18.94(9.95)a2
19.78(14.57)a2
6.19(4.09)b2
0.02(0.02)c2
4 HR 3.39(4.83)a3
4.12(3.80)a3
0.67(0.36)b3
0.01(0.01)c2
6 HR 1.82(1.98)a4
1.15(0.79)a4
0.37(0.20)b4
0.03(0.04)c2
26 HR 0.19(0.15)a5
0.20(0.33)a1
0.04(0.02)b5
0.02(0.04)b2
50 HR 0.04(0.03)a6
0.02(0.03)b5
0.02(0.03)ab6
0.01(0.01)b2
Data in rows with the same letter superscript are not significantly different (p< 0.05) Data in columns with the same numeric superscripts are significantly different (p<0.05)

67
but was lower than baseline 50 hours after treatment, and decreased
significantly between each time point after treatment. For Vanish, the
fluoride concentration in saliva was significantly higher than baseline for 1
hour through 6 hours after treatment, was not different from baseline 26
hours after treatment, was lower than baseline 50 hours after treatment, and
decreased significantly between each time point after treatment. For Enamel
Pro, the fluoride concentration in saliva was significantly higher than
baseline for 1 hour through 6 hours after treatment, was lower than baseline
26 and 50 hours after treatment, and decreased significantly between each
time point after treatment except for no significant change between 26 and
50 hours. For Placebo, the concentration of fluoride in saliva was
significantly higher at baseline than at any time point after treatment, and
there were no significant differences among any time points after treatment.
The differences in the concentration of fluoride in saliva are displayed
graphically in figures 1 and 2. Figure 1 displays the mean and standard
deviation of the entire sample for each varnish (n=15). Figure 2 displays the
individual variation in salivary fluoride concentration of the subjects for
each of the different varnishes applied.

68
Figure 1. Mean concentration of fluoride in saliva varnish over time
Figure 2. Subject variation in treatment response

69
Discussion
Saliva is the initial medium into which fluoride that is released from
dental products is able to achieve the desired effect intra-orally. This study
evaluated saliva in order to make comparisons between different brands of
topical fluoride varnishes with similar fluoride concentrations in order to
observe potential differences in their in vivo fluoride release. The primary
null hypothesis was rejected based on the statistical analysis indicating a
significant difference between the fluoride concentrations found in saliva
after treatment with the different 5% NaF varnishes. The primary alternate
hypothesis failed to be rejected because subjects had significantly less
fluoride in saliva when treated with Enamel Pro compared to the other
products. These findings, although different than the findings in several in
vitro studies 9,10,11 in which Enamel Pro released more fluoride, still support
the notion that factors other than the concentration of fluoride may play a
role in the overall fluoride release of a varnish.
Unlike many of the previous studies evaluating fluoride release into
saliva,12,14,15 a conscious effort was made to apply equal amounts of the
fluoride product to each subject in order to determine if properties other than
the total amount of fluoride applied affected the fluoride concentration found
in saliva. Despite this effort, statistical analysis showed that the amount of

70
Vanish applied was significantly less than that of the other products. This
finding was not a surprise to the operator as it was noted in some early trial
runs that in addition to color and odor differences, the high viscosity of
Vanish made it more difficult to remove from the product container and
application brush in comparison to the other varnishes. When the difference
in amount of varnish applied was used as a covariate in the analysis of
varnish and time effects on salivary fluoride levels, it was not found to have
a significant influence on the results.
Although differences in previous study designs make direct
comparisons to the current study difficult, the studies conducted by Seppä14
and Twetman15 allow for some comparisons. In both these studies, Duraphat
5% NaF was used, whole unstimulated saliva was collected at various time
intervals, and the samples were centrifuged prior to analysis. While the one
hour time period mean salivary fluoride in the current study was found to be
18.94 (±9.95) ppm, Twetman and Seppä's were 13.37(±4.70), and 12.37
(±4.34) respectively at the same time period. While this difference may not
appear large, Twetman applied nearly twice as much (0.75 ml) Duraphat
than in the current study (0.4 ml). It would seem reasonable that Twetman
should have recorded significantly higher one hour time period salivary
fluoride levels than in the current study, however study design differences,

71
such as the application technique, post application instructions, and
population, may explain these differences. Twetman applied fluoride to all
surfaces of the teeth, including the occlusal. He did not dictate any pre or
post application avoidance of food or drink, and his population consisted of
school aged children. In contrast, the current study dictated that subjects
refrain from eating or drinking one hour prior to collection times, which
meant that after initial application subjects did not have any food or drink
before the 1 hour collection time period. Additionally, in the current study,
the varnish was only applied to the buccal surfaces of teeth in adults. By
applying varnish to the occlusal surfaces of school aged children and
allowing for post application eating and drinking, a large portion of the
varnish may have abraded or dissolved away by the one hour time period
accounting for the unexpectedly lower fluoride levels (considering the
relatively high amount of product application) at the one hour time period of
Twetman’s study. Seppä reported applying nearly similar amounts of
Duraphat as the current study (0.5 ml vs. 0.4 ml), however she did not report
using any form of isolation during application. As a result, the lower amount
of fluoride in saliva at the 1 hour time period may have been from early
ingestion or inadvertent application of varnish on the soft tissues.

72
The mean ppm of fluoride in saliva for the individual varnishes over
time demonstrates that the overall pattern of fluoride release among the
products was very similar. The highest fluoride concentration in saliva was
seen for all the products in the first collection period after application (1
hour) and the fluoride concentration in saliva began to decline after this at
each subsequent collection period. This finding, which supports the
secondary null hypothesis, is consistent with the findings by other authors
that have found a peak in salivary fluoride levels within minutes of
application followed by a steady decrease.12,14,15 Although the logistics of
this study prevented saliva collection minutes after application, it is likely,
based on the study by Eakle et al.,12 that the 1 hour salivary fluoride
concentration in this study represents a point on the declination of the ppm
curve. Eakle et al. measured peak levels of fluoride in saliva five to fifteen
minutes after fluoride application, which was not evaluated in this study.
Although it has been demonstrated that fluoride can be stored in soft
and hard oral tissues as well as dental plaque,16,17 it is presumed that saliva
represents the initial medium into which fluoride is released. The relative
ease of collection and measurement make saliva a great candidate for in vivo
fluoride release studies; however fluoride activity likely continues long after
the 50 hours it was measurable in saliva. One assumption that has been made
73
when conducting salivary fluoride concentration studies is that the
distribution of fluoride released in saliva to other oral tissues and plaque is
similar. As future studies begin to demonstrate the complexity of these
products and their reactions in biological systems, we may find that the
distribution of fluoride to enamel, soft tissue, plaque, etc. differs among
varnishes.
In addition to the portion of fluoride that potentially becomes bound
to other oral structures or plaque, in vivo studies involving saliva also are
complicated by the fact that the medium is constantly being ingested. In
vitro, it is possible to evaluate total fluoride release from the products
because the fluoride is released into a closed system (artificial saliva).
Because the total fluoride release in vivo cannot be accounted for, we cannot
conclude that Enamel Pro releases less fluoride, we can only conclude
within the limitations of this study that the amount of fluoride released into
saliva is less for subjects treated with Enamel Pro. If the distribution of
fluoride to other oral tissues and plaque are directly related to salivary
fluoride levels, this lesser amount of release from Enamel Pro may diminish
its potential efficacy as a topical fluoride agent, however this requires further
evaluation.

74
Differences in viscosity, which was a subjective finding in this study,
may be one of many differences in physical properties of interest when
evaluating fluoride release from varnishes in vivo. Abrasion resistance,
solubility, adhesion, etc. may also account for differences between the in
vivo and in vitro results. Teeth are undoubtedly subjected to many
mechanical forces unaccounted for in laboratory studies that may affect the
retention and subsequent release of fluoride into saliva. It is possible that
although Enamel Pro has the potential to release more fluoride as
demonstrated in vitro, it was mechanically unable to withstand the oral
environment as well as the other varnishes and therefore was dissociated
from the teeth and swallowed before reaching this potential.
It is important to appreciate that before any conclusions regarding the
efficacy between different fluoride varnishes can be made, several future
investigations must be considered. Only by accounting for the total amount
of fluoride released in vivo, by both systemic fluoride measurements after
varnish application and measurements of levels in soft tissue, hard tissue,
plaque etc., can true comparisons of fluoride release between products be
made. Chemical, physical, and mechanical properties studies may also help
to determine if there is a link between the total fluoride release and particular
properties of the varnish. These types of studies, paired with studies further

75
evaluating the mechanism of action of topical fluoride, may advance our
understanding of varnish efficacy.
Conclusions
From this study which evaluated the fluoride concentration of saliva after the application of three different 5% NaF varnishes, the following conclusions can be made:
1. Despite similar concentrations of fluoride, the amount of fluoride released into saliva from Enamel Pro is significantly less than that of Vanish or Duraphat up to 26 hours after application.
2. Vanish and Duraphat release similar amounts of fluoride up to 26 hours, but Duraphat sustains a higher release than Vanish up to 50 hours after application.
3. All three varnishes maintain above baseline salivary fluoride levels up to 6 hours.
4. Duraphat and Vanish maintain above baseline salivary fluoride levels up to 26 hours, although Vanish was not significant due to a higher standard deviation.
5. Enamel Pro, Vanish, and Duraphat release the maximum amount of
fluoride into saliva after application and the levels decrease at each time period thereafter.

76
References
1. Recommendations for using fluoride to prevent and control dental
caries in the United States. Centers for Disease Control and Prevention. MMWR.Recommendations and reports : Morbidity and mortality weekly report.Recommendations and reports / Centers for Disease Control. 2001;50(RR-14):1.
2. American Dental Association Council on Scientific Affairs.
Professionally applied topical fluoride: evidence-based clinical recommendations. J Am Dent Assoc. 2006;137(8): 1151-1159
3. United States Food and Drug Administration. Off-Label and
Investigational Use of Marketed Drugs, Biologics, and Medical Devices [Internet]. Silver Spring (MD): U.S. Department of Health and Human Services; [Updated 10 Aug 2011; cited 28 July 2012]. Available from: http://www.fda.gov/RegulatoryInformation /Guidances/ucm126486.htm
4. Schmidt HFM. Ein neues Tauchierungsmittel mit besonders lang anhaltendem intensivem Fluoridierungseffekt. Stoma. 1964;17:14-20.
5. Material Safety Data Sheet. Colgate Duraphat Infosafe No. LPXXP
[Internet]. [place unknown; ACOHS Pty Ltd]; c2008 [cited 15Nov 2012]. Available from: http://www.colgate.com.au/Colgate/AU/Corp/MSDS/ pdfs/duraphat.pdf
6. Material Safety Data Sheet. Duraflor [Internet]. Greenville (NC):
Practicon. [cited 23 Feb 2013]. Available from: http://practicon.com/docs/Duraflor.pdf
7. Material Safety Data Sheet. Fluor Protector [Internet]. Schann
(Germany): Ivoclar Vivadent. [revised 21 March 2011, cited 23 Feb 2013]. Available from: [email protected].

77
8. Kennard RG, Wagner JA, Kawamoto AT. Fluoride varnish compositions including an organo phosporic acid adhesion promoting agent. United States patent US 0191279 A1.2009
9. González-Cabezas C, Flannagan SE, Krell R., Uekihara M, Niquette
CC. Fluoride Release from Fluoride Varnishes is Affected by Incubation Conditions. Unpublished work presented at AADR/CADR Annual Meeting 2012.
10. Ritwik P, Aubel J, Xu X, Fan Y, Hagan J. Evaluation of short term
fluoride release from fluoride varnishes. J Clin Pediatr Dent. 2012;36(3):275.
11. Jablonowski BL, Bartoloni JA, Hensley DM, Vandewalle KS. Fluoride release from newly marketed fluoride varnishes. Quintessence International (Berlin, Germany : 1985). 2012; 43(3):221
12. Eakle WS, Featherstone JDB, Weintraub JA, Shain SG, Gansky SA. Salivary fluoride levels following application of fluoride varnish or fluoride rinse. Community Dent Oral Epidemiol. 2004;32(6):462.
13. Rytömaa I, Meurman JH. Fluoride in saliva after various topical
treatments. Proc Finn Dent Soc. 1983;79(4):172-7.
14. Seppä L, Hanhijarvi H. Fluoride Concentration in Whole and Parotid Saliva after Application of Fluoride Varnishes. Caries Res. 1983;17:476-480.
15. Twetman S, Sköld-Larsson K, Modéer T. Fluoride concentration in
whole saliva and separate gland secretions after topical treatment with three different fluoride varnishes. Acta Odontol Scand. 1999;57(5):263.
16. Zero DT, Raubertas RF, Pedersen AM, Fu J, Hayes AL, Featherstone
JB.Studies of fluoride retention by oral soft tissues after the application of home-use topical fluorides. Journal of Dental Research. 1992;74:1546.

78
17. Skold-Larsson K, Modeer T, Twetman S. Fluoride concentration in plaque in adolescents after topical fluoride application of different fluoride varnishes. Clincal Oral Investigation. 2000;4:31-34.