Suitability for drinking, agriculture and fluoride exposure risk
14
J. Earth Syst. Sci. (2019) 128:24 c Indian Academy of Sciences https://doi.org/10.1007/s12040-018-1049-6 Groundwater quality in a semi-arid region of India: Suitability for drinking, agriculture and fluoride exposure risk Tirumalesh Keesari 1, * , Uday Kumar Sinha 1 , Pradeep Kamaraj 2 and Diana Anoubam Sharma 3 1 Isotope and Radiation Application Division, Bhabha Atomic Research Centre, Mumbai 400 085, India. 2 Department of Earth Sciences, Annamalai University, Annamalai Nagar, Chidambaram 608 002, TN, India. 3 Department of Environment Studies, Panjab University, Chandigarh 160 014, India. *Corresponding author. e-mail: [email protected] MS received 6 November 2017; revised 16 March 2018; accepted 26 April 2018; published online 19 January 2019 Fluoride exposure through consumption of drinking water was studied in a heavily industrialised area and suitable measures were suggested to control the fluorosis risk to residents. Groundwater quality conforms to World Health Organization (WHO) criterion for drinking except for fluoride and is also suitable for irrigation. Fluoride concentration ranges from 0.1 to 4.4 mg/l and 39% of the total samples measured were found to be contaminated as per WHO limits (1.5 mg/l). The fluoride intake through drinking water was calculated to be 0.10 mg/kg/d for infants, 0.09 mg/kg/d for children and 0.05 mg/kg/d for adults with a corresponding exposure dose exceeding 2.1, 1.9 and 1.1 times for infants, children and adults, respectively, compared to the minimum risk value of 0.05 mg/kg/d. The fluorosis risk map indicates that with a few exceptions of some western and northwestern parts, the entire study area is prone to fluorosis and the highest being in the south central part. The fluoride exposure dose suggests the risk of mottled enamel among residents if untreated groundwater is provided for drinking for a long time. Considering the hydrogeological setup of this region, various amelioration methods to help mitigate the ill effects of high fluoride were evaluated and better nutrition containing calcium and vitamin C was found to be the most effective and viable option. Keywords. Fluorosis risk zone; exposure dose; amelioration; Odisha. 1. Introduction Groundwater is a major contributor to water supply in most rural communities in India. It is commonly believed that groundwater is a safe source of potable water as it is relatively free from microbiological and inorganic chemicals’ con- tamination and requires minimal treatment. How- ever, in contrast, recent reports suggest that the contamination of groundwater by both geogenic and anthropogenic sources has been increasing significantly. Fluoride is one of the widespread inorganic contaminants impacting the health of people globally (Frencken 1992; Dean 1993; NRC 1993; Genxu and Guodong 2001; Chae et al. 2007; SubbaRao 2011; Jagtap et al. 2012). In humans, F − ingestion normally is through drinking water, food (Malde et al. 2011) and polluted air (Batra et al. 1995). The F − content of cultivated plants is generally low (except for tea) and contains up to 1 0123456789().,--: vol V
-
Upload
khangminh22 -
Category
Documents
-
view
1 -
download
0
Transcript of Suitability for drinking, agriculture and fluoride exposure risk

J. Earth Syst. Sci. (2019) 128:24 c© Indian Academy of Scienceshttps://doi.org/10.1007/s12040-018-1049-6
Groundwater quality in a semi-arid region of India:Suitability for drinking, agriculture andfluoride exposure risk
Tirumalesh Keesari1,* , Uday Kumar Sinha1, Pradeep Kamaraj2
and Diana Anoubam Sharma3
1Isotope and Radiation Application Division, Bhabha Atomic Research Centre, Mumbai 400 085, India.2Department of Earth Sciences, Annamalai University, Annamalai Nagar, Chidambaram 608 002, TN, India.3Department of Environment Studies, Panjab University, Chandigarh 160 014, India.*Corresponding author. e-mail: [email protected]
MS received 6 November 2017; revised 16 March 2018; accepted 26 April 2018;published online 19 January 2019
Fluoride exposure through consumption of drinking water was studied in a heavily industrialised area andsuitable measures were suggested to control the fluorosis risk to residents. Groundwater quality conformsto World Health Organization (WHO) criterion for drinking except for fluoride and is also suitable forirrigation. Fluoride concentration ranges from 0.1 to 4.4 mg/l and 39% of the total samples measuredwere found to be contaminated as per WHO limits (1.5 mg/l). The fluoride intake through drinking waterwas calculated to be 0.10 mg/kg/d for infants, 0.09 mg/kg/d for children and 0.05 mg/kg/d for adultswith a corresponding exposure dose exceeding 2.1, 1.9 and 1.1 times for infants, children and adults,respectively, compared to the minimum risk value of 0.05 mg/kg/d. The fluorosis risk map indicates thatwith a few exceptions of some western and northwestern parts, the entire study area is prone to fluorosisand the highest being in the south central part. The fluoride exposure dose suggests the risk of mottledenamel among residents if untreated groundwater is provided for drinking for a long time. Consideringthe hydrogeological setup of this region, various amelioration methods to help mitigate the ill effects ofhigh fluoride were evaluated and better nutrition containing calcium and vitamin C was found to be themost effective and viable option.
Keywords. Fluorosis risk zone; exposure dose; amelioration; Odisha.
1. Introduction
Groundwater is a major contributor to watersupply in most rural communities in India. Itis commonly believed that groundwater is a safesource of potable water as it is relatively freefrom microbiological and inorganic chemicals’ con-tamination and requires minimal treatment. How-ever, in contrast, recent reports suggest that thecontamination of groundwater by both geogenic
and anthropogenic sources has been increasingsignificantly. Fluoride is one of the widespreadinorganic contaminants impacting the health ofpeople globally (Frencken 1992; Dean 1993; NRC1993; Genxu and Guodong 2001; Chae et al. 2007;SubbaRao 2011; Jagtap et al. 2012). In humans,F− ingestion normally is through drinking water,food (Malde et al. 2011) and polluted air (Batraet al. 1995). The F− content of cultivated plants isgenerally low (except for tea) and contains up to
1
0123456789().,--: vol V
24 Page 2 of 14 J. Earth Syst. Sci. (2019) 128:24
600 mg/l (Cao et al. 2006). However, thebioavailability of the F− in food materials is gen-erally influenced by the mineral content of thefood, e.g., certain ions can form insoluble com-plexes limiting the F− bioavailability (Malde et al.2004). Studies suggest that elevated levels of fluo-ride in drinking water is an important factor thatcauses dental and skeletal fluorosis in parts of theworld including India (Frencken 1992; Jacks et al.2005; Rao et al. 2013; Bretzler and Johnson 2015;Choubisa and Choubisa 2016). It is believed thatthe number of persons affected by fluorosis in Asianand African countries exceeds 70 million (WHO2006). Based on the ill effects of high fluorideon human health, the World Health Organization(WHO) has established a fluoride standard fordrinking water of 1.5 mg/l (WHO 2011). Consump-tion of drinking water with high fluoride above theWHO limit is deemed to impact humans throughdental and skeletal fluorosis. These ailments seemto be more detrimental in children as dental enameland skeletal formation are most active during theearly childhood.
There are reports that 27 out of the 30 districtsof Odisha state of India are contaminated by flu-oride in drinking water and this has led to acutehealth disorders (CGWB 2010; Nanda et al. 2011).Recent studies suggest that industrial and munic-ipal pollution coupled with high F− in drinkingwater led to increasing rates of tuberculosis, cancerand other ailments in habitants of Angul districtof Odisha state (Dhadse et al. 2008; Dhakate andRao 2010; Moharana et al. 2013). It is reportedthat children are being affected by poor mentalgrowth and learning disabilities apart from increas-ing incidences of both skeletal and dental fluorosis.The residents of the study area mostly dependon groundwater resources for drinking, which arepoor in quality and causes water-borne diseases(Sahu et al. 1991). Investigations on water qualityof this region reported high fluoride content (Pra-haraj et al. 2003; Tiwary et al. 2009; Keesari et al.2016) and some of these studies also emphasiseon the need to pre-treat the water before drinking(Moharana et al. 2013). A hydrogeochemical studywas conducted by our group on the geochemistryof groundwater and the fluoride release mechanism(Keesari et al. 2016). The study inferred that Fis mostly derived from weathered rocks and thatthe contribution from effluents from thermal powerplants is less.
Several studies addressing water quality issuesin this region were conducted; however, there
are no detailed studies on the estimation offluoride exposure to the residents through drink-ing water and the potential fluorosis risk zoneshave also not demarcated. This information isvery critical to strategise effective plans for con-trolling the negative impacts of consumption ofhigh fluoride on human health. The suitability ofthe water for irrigation was also not attempted.The major objectives of this paper are to: (i)estimate the fluoride exposure through drinkingwater and compare this with the allowed limits,(ii) demarcate the fluorosis risk zones and (iii)assess the water quality for drinking and irriga-tion in the Talchir industrial area of Angul District,Odisha.
2. Materials and methods
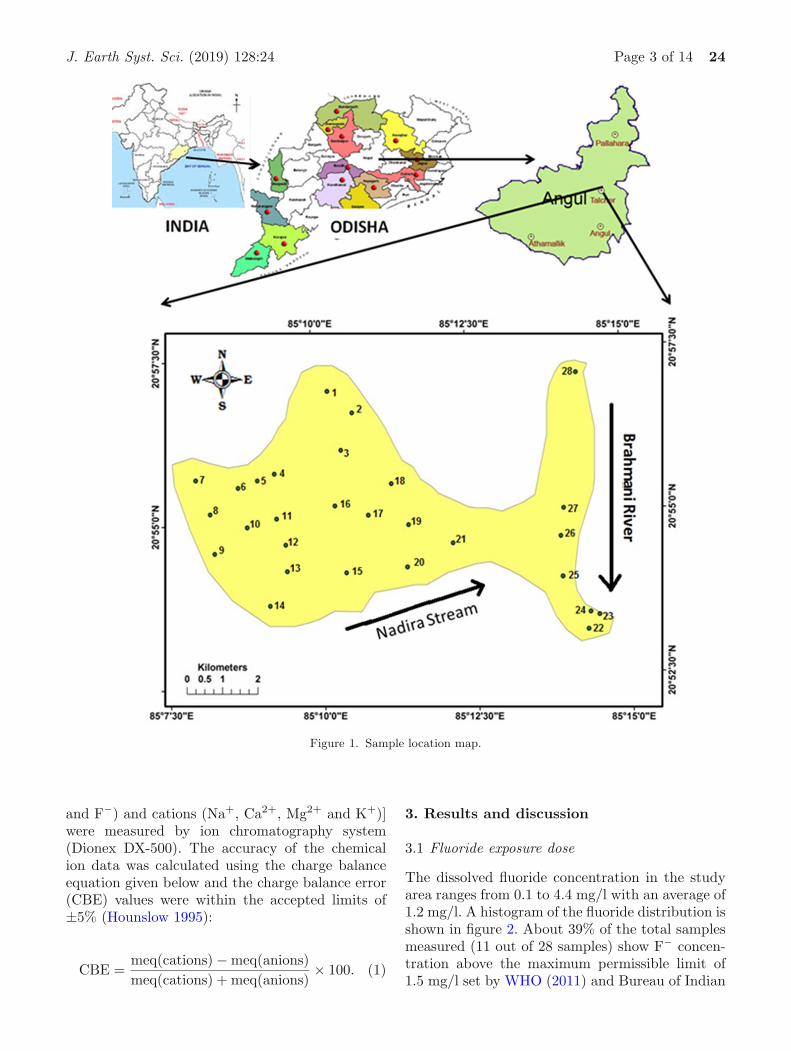
The study site falls between 20◦52′30′′−20◦57′30′′Nlatitudes and 85◦08′30′′−85◦14′30′′E longitudescovering an area of 150 km2 (figure 1). Waterlevel depth varies from 1.26 to 13.69 m belowground level (bgl) and the seasonal fluctuationis 0.6 to 1.5 m bgl (Tiwary et al. 2009). Theriver Mahanadi flows towards the east–southeastdirection and the river Brahmani flows towardsthe southeast direction. The area has an averageannual rainfall of 1370 mm and falls under the sub-tropic monsoon climate. The temperature typicallyvaries between 11.9◦ and 44.4◦C with an averageof 26.9◦C. The groundwater is extracted from therecent alluvium deposited along the river coursesand at few places from deeper depths tappingweathered and fractured rocks. Dug wells extendup to 10 m bgl while the tube wells and borewells tap deeper groundwater (up to 300 m bgl)and mostly concentrated in the Gondwana forma-tion.
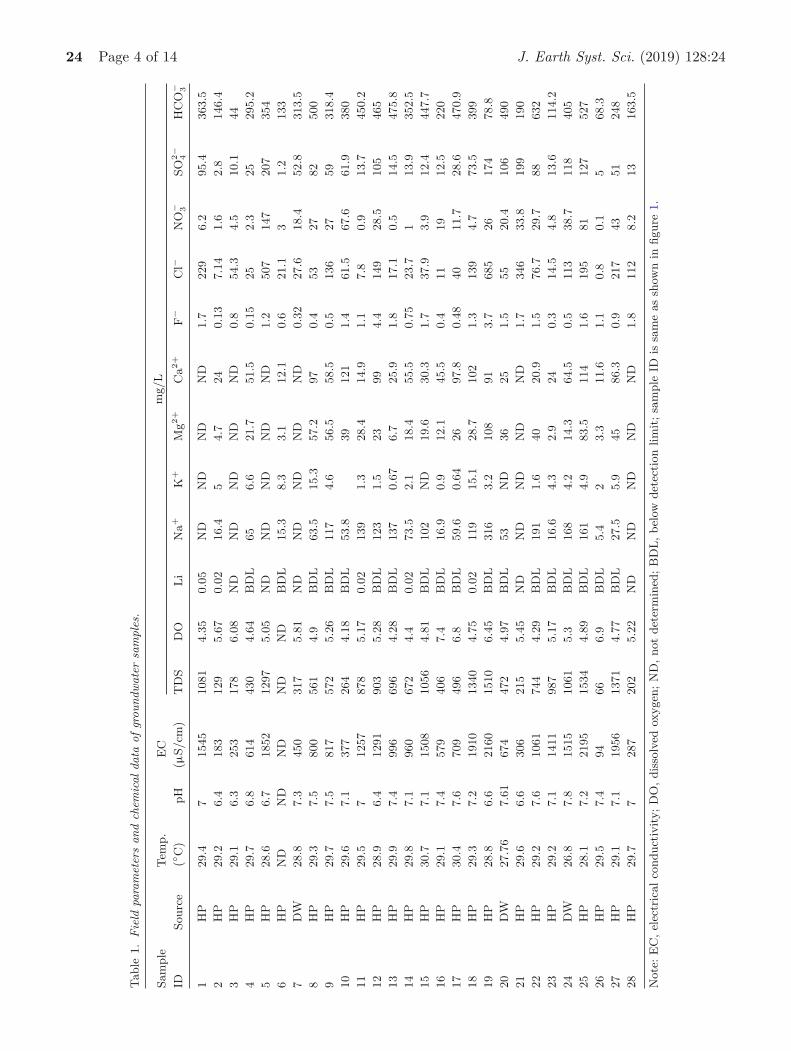
Twenty-eight groundwater samples were col-lected from available sources (bore wells, handpumps and dug wells) as shown in figure 1. Thesample details are given in table 1. Water sampleswere filtered through 0.45 µm pore size membranefilters before storing in a clean polythene bottle.Samples were acidified using conc. HNO3 to pH = 2for cation measurements while unacidified sampleswere used for anion measurements. In situ parame-ters (temperature, pH, dissolved oxygen (DO) andelectrical conductivity (EC)) were measured bywater quality kits (Corning model 313 and Orionmodel 130). Alkalinity was measured by Gran titra-tion. Chemical species [anions (Cl−, SO2−
4 , NO−3
J. Earth Syst. Sci. (2019) 128:24 Page 3 of 14 24
Figure 1. Sample location map.
and F−) and cations (Na+, Ca2+, Mg2+ and K+)]were measured by ion chromatography system(Dionex DX-500). The accuracy of the chemicalion data was calculated using the charge balanceequation given below and the charge balance error(CBE) values were within the accepted limits of±5% (Hounslow 1995):
CBE =meq(cations) − meq(anions)meq(cations) + meq(anions)
× 100. (1)
3. Results and discussion
3.1 Fluoride exposure dose
The dissolved fluoride concentration in the studyarea ranges from 0.1 to 4.4 mg/l with an average of1.2 mg/l. A histogram of the fluoride distribution isshown in figure 2. About 39% of the total samplesmeasured (11 out of 28 samples) show F− concen-tration above the maximum permissible limit of1.5 mg/l set by WHO (2011) and Bureau of Indian
24 Page 4 of 14 J. Earth Syst. Sci. (2019) 128:24
Table
1.
Fie
ldpa
ram
eter
sand
chem
icaldata
ofgr
oundwate
rsa
mples.
Sam
ple
Tem
p.
EC
mg/L
IDSourc
e(◦ C
)pH
(µS/cm
)T
DS
DO
Li
Na+
K+
Mg2+
Ca2+
F−
Cl−
NO
− 3SO
2−
4H
CO
− 3
1H
P29.4
71545
1081
4.3
50.0
5N
DN
DN
DN
D1.7
229
6.2
95.4
363.5
2H
P29.2
6.4
183
129
5.6
70.0
216.4
54.7
24
0.1
37.1
41.6
2.8
146.4
3H
P29.1
6.3
253
178
6.0
8N
DN
DN
DN
DN
D0.8
54.3
4.5
10.1
44
4H
P29.7
6.8
614
430
4.6
4B
DL
65
6.6
21.7
51.5
0.1
525
2.3
25
295.2
5H
P28.6
6.7
1852
1297
5.0
5N
DN
DN
DN
DN
D1.2
507
147
207
354
6H
PN
DN
DN
DN
DN
DB
DL
15.3
8.3
3.1
12.1
0.6
21.1
31.2
133
7D
W28.8
7.3
450
317
5.8
1N
DN
DN
DN
DN
D0.3
227.6
18.4
52.8
313.5
8H
P29.3
7.5
800
561
4.9
BD
L63.5
15.3
57.2
97
0.4
53
27
82
500
9H
P29.7
7.5
817
572
5.2
6B
DL
117
4.6
56.5
58.5
0.5
136
27
59
318.4
10
HP
29.6
7.1
377
264
4.1
8B
DL
53.8
39
121
1.4
61.5
67.6
61.9
380
11
HP
29.5
71257
878
5.1
70.0
2139
1.3
28.4
14.9
1.1
7.8
0.9
13.7
450.2
12
HP
28.9
6.4
1291
903
5.2
8B
DL
123
1.5
23
99
4.4
149
28.5
105
465
13
HP
29.9
7.4
996
696
4.2
8B
DL
137
0.6
76.7
25.9
1.8
17.1
0.5
14.5
475.8
14
HP
29.8
7.1
960
672
4.4
0.0
273.5
2.1
18.4
55.5
0.7
523.7
113.9
352.5
15
HP
30.7
7.1
1508
1056
4.8
1B
DL
102
ND
19.6
30.3
1.7
37.9
3.9
12.4
447.7
16
HP
29.1
7.4
579
406
7.4
BD
L16.9
0.9
12.1
45.5
0.4
11
19
12.5
220
17
HP
30.4
7.6
709
496
6.8
BD
L59.6
0.6
426
97.8
0.4
840
11.7
28.6
470.9
18
HP
29.3
7.2
1910
1340
4.7
50.0
2119
15.1
28.7
102
1.3
139
4.7
73.5
399
19
HP
28.8
6.6
2160
1510
6.4
5B
DL
316
3.2
108
91
3.7
685
26
174
78.8
20
DW
27.7
67.6
1674
472
4.9
7B
DL
53
ND
36
25
1.5
55
20.4
106
490
21
HP
29.6
6.6
306
215
5.4
5N
DN
DN
DN
DN
D1.7
346
33.8
199
190
22
HP
29.2
7.6
1061
744
4.2
9B
DL
191
1.6
40
20.9
1.5
76.7
29.7
88
632
23
HP
29.2
7.1
1411
987
5.1
7B
DL
16.6
4.3
2.9
24
0.3
14.5
4.8
13.6
114.2
24
DW
26.8
7.8
1515
1061
5.3
BD
L168
4.2
14.3
64.5
0.5
113
38.7
118
405
25
HP
28.1
7.2
2195
1534
4.8
9B
DL
161
4.9
83.5
114
1.6
195
81
127
527
26
HP
29.5
7.4
94
66
6.9
BD
L5.4
23.3
11.6
1.1
0.8
0.1
568.3
27
HP
29.1
7.1
1956
1371
4.7
7B
DL
27.5
5.9
45
86.3
0.9
217
43
51
248
28
HP
29.7
7287
202
5.2
2N
DN
DN
DN
DN
D1.8
112
8.2
13
163.5
Note
:E
C,el
ectr
icalco
nduct
ivity;D
O,dis
solv
edox
ygen
;N
D,not
det
erm
ined
;B
DL,bel
owdet
ecti
on
lim
it;sa
mple
IDis
sam
eas
show
nin
figure
1.

J. Earth Syst. Sci. (2019) 128:24 Page 5 of 14 24
Figure 2. Histogram of the F− concentration (inset pie chartof % sample exceeding WHO limit).
Standards (BIS 2012) as shown in figure 2 (inset).Fluoride concentration up to 1.0 mg/l in potablewater is considered good for skeletal and dentalgrowth, but higher amount beyond 1.5 mg/l canresult in health ailments (WHO 2011). The con-centration of fluoride between 1.5 and 3.0 mg/lin drinking water results in browning and mot-tling of teeth, which is an initial manifestationof dental fluorosis and this further leads to hardand brittle teeth. F− level between 4 and 8 mg/lresults in skeletal fluorosis, which further devel-ops into crippling fluorosis when the F− level risesabove 10 mg/l. Excessive F− ingestion has otherhealth effects such as urinary tract malfunction,muscle fibre degeneration, gastrointestinal prob-lems, red blood cell deformities, reduced immunityand neurological manifestations (Lian-Fang andJian-Zhong 1995; Fordyce et al. 2007; Shailaja andJohnson 2007; Davies 2008; WHO 2011; Chen et al.2012).
The fluoride exposure dose was calculated forhumans (infants, children and adults) based on thefollowing equation (Jha et al. 2009):
Exposure dose =C × WI
BW, (2)
where C is the total bioavailable fluoride concentra-tion (mg/l) in groundwater, WI is the water intake(l/d) and BW is the body weight (kg). In this case,the dose was calculated by assuming exposure ischronic and the total dissolved fluoride representsthe total bioavailable fluoride (Jackson et al. 2002).It was also assumed that groundwater is the only
Figure 3. Fluoride exposure dose to residents of this region.
source of drinking for the residents of this area;however, packaged water is also used for drinkingin some instances. Water intake for different agesof humans was taken as 0.25, 1.5 and 3 l/d forinfants (6 kg body weight), children (20 kg bodyweight) and adults (70 kg body weight), respec-tively (Brindha et al. 2016). The concentration offluoride was doubled in the case of infants takinginto account boiling of water for milk preparation(Grimaldo et al. 1995).
A Box–Whisker plot of the exposure doses of flu-oride for three age groups, adults, children andinfants, is given in figure 3. An estimated levelfor minimum risk (0.05 mg/kg/d) by Agency forToxic Substances and Diseases Registry (Levy1994; ATSDR 2003) was also given in figure 3.The median value of the exposure dose for adultswas at par with the minimum risk level whilefor children and infants the median values exceedthat of the minimum risk level. Even though thedaily ingested total F− through food is not con-sidered in this study, the exposure dose of F−
based on water intake alone shows that ground-water consumption by residents in this area canlead to fluorosis. The risk exposure is found to beabout two times higher for infant and children com-pared to the adults (table 2). The true estimateconsidering the fluoride ingestion through vegeta-bles, fruits and prepared food would be higherthan the calculated one. On the other hand, othersources of drinking water such as packaged wateror treated groundwater by conventional techniquessuch as osmosis or filtration reduce the fluorideexposure.
The maximum values of exposure doses for differ-ent age groups in this area are comparable to otherfluorosis affected regions such as Nalgonda, India
24 Page 6 of 14 J. Earth Syst. Sci. (2019) 128:24
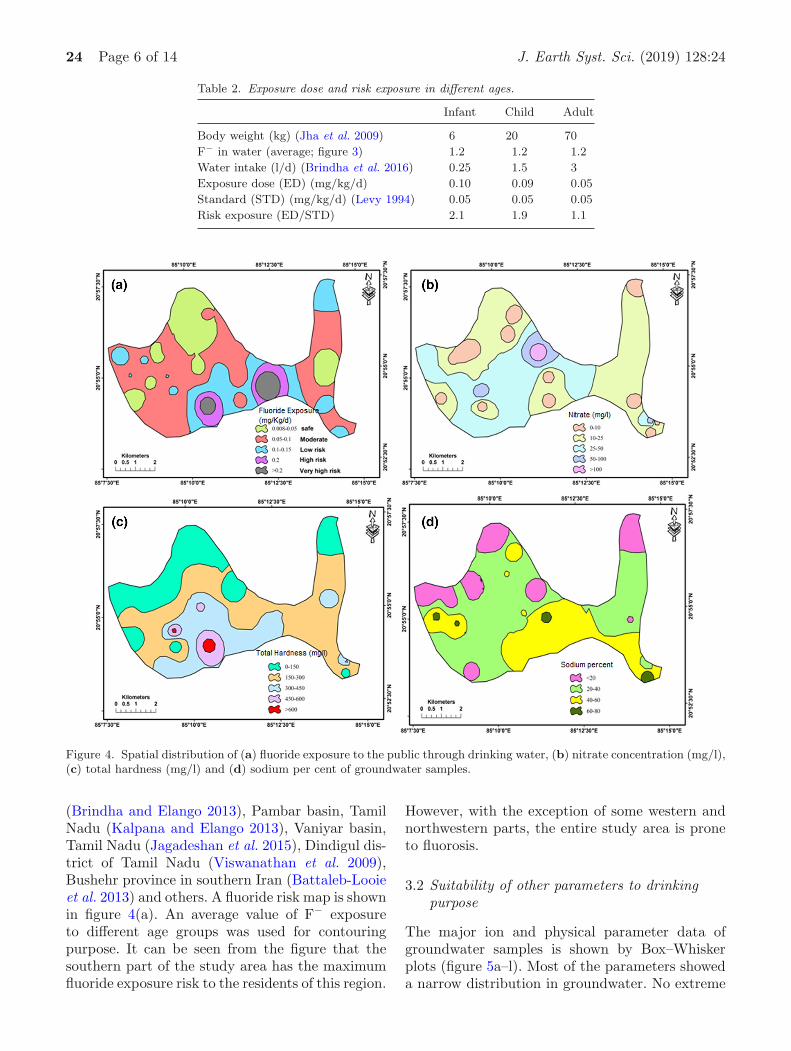
Table 2. Exposure dose and risk exposure in different ages.
Infant Child Adult
Body weight (kg) (Jha et al. 2009) 6 20 70
F− in water (average; figure 3) 1.2 1.2 1.2
Water intake (l/d) (Brindha et al. 2016) 0.25 1.5 3
Exposure dose (ED) (mg/kg/d) 0.10 0.09 0.05
Standard (STD) (mg/kg/d) (Levy 1994) 0.05 0.05 0.05
Risk exposure (ED/STD) 2.1 1.9 1.1
Figure 4. Spatial distribution of (a) fluoride exposure to the public through drinking water, (b) nitrate concentration (mg/l),(c) total hardness (mg/l) and (d) sodium per cent of groundwater samples.
(Brindha and Elango 2013), Pambar basin, TamilNadu (Kalpana and Elango 2013), Vaniyar basin,Tamil Nadu (Jagadeshan et al. 2015), Dindigul dis-trict of Tamil Nadu (Viswanathan et al. 2009),Bushehr province in southern Iran (Battaleb-Looieet al. 2013) and others. A fluoride risk map is shownin figure 4(a). An average value of F− exposureto different age groups was used for contouringpurpose. It can be seen from the figure that thesouthern part of the study area has the maximumfluoride exposure risk to the residents of this region.
However, with the exception of some western andnorthwestern parts, the entire study area is proneto fluorosis.
3.2 Suitability of other parameters to drinkingpurpose
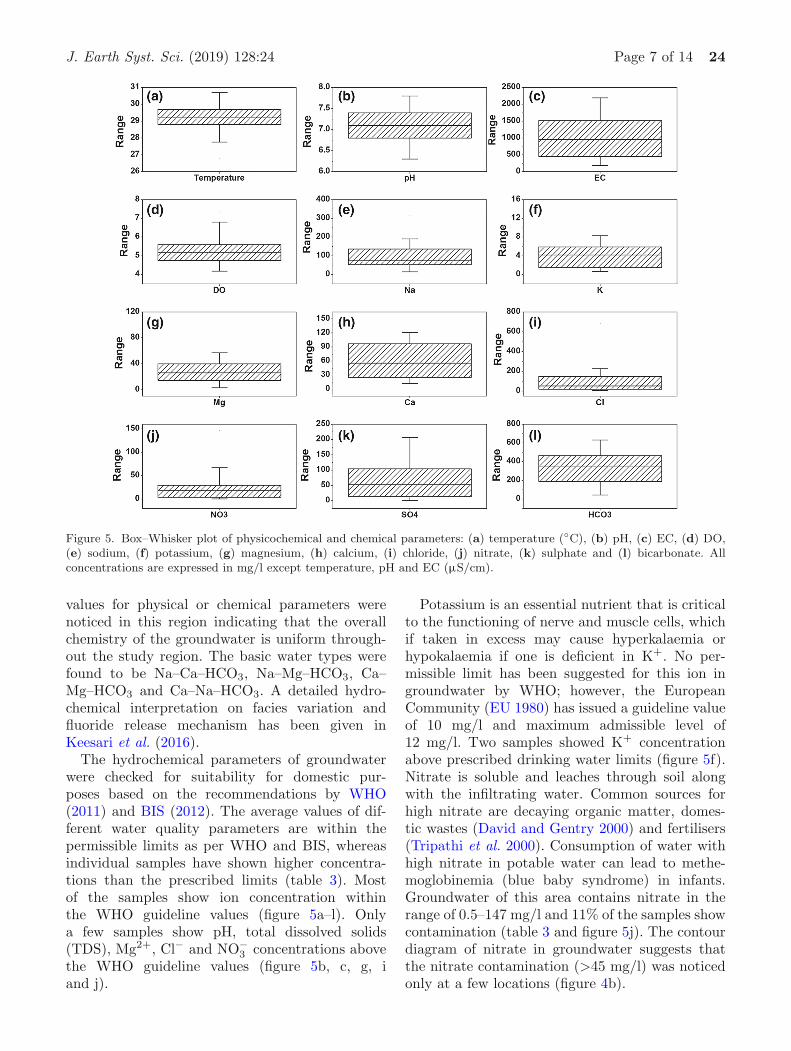
The major ion and physical parameter data ofgroundwater samples is shown by Box–Whiskerplots (figure 5a–l). Most of the parameters showeda narrow distribution in groundwater. No extreme
J. Earth Syst. Sci. (2019) 128:24 Page 7 of 14 24
Figure 5. Box–Whisker plot of physicochemical and chemical parameters: (a) temperature (◦C), (b) pH, (c) EC, (d) DO,(e) sodium, (f) potassium, (g) magnesium, (h) calcium, (i) chloride, (j) nitrate, (k) sulphate and (l) bicarbonate. Allconcentrations are expressed in mg/l except temperature, pH and EC (µS/cm).
values for physical or chemical parameters werenoticed in this region indicating that the overallchemistry of the groundwater is uniform through-out the study region. The basic water types werefound to be Na–Ca–HCO3, Na–Mg–HCO3, Ca–Mg–HCO3 and Ca–Na–HCO3. A detailed hydro-chemical interpretation on facies variation andfluoride release mechanism has been given inKeesari et al. (2016).
The hydrochemical parameters of groundwaterwere checked for suitability for domestic pur-poses based on the recommendations by WHO(2011) and BIS (2012). The average values of dif-ferent water quality parameters are within thepermissible limits as per WHO and BIS, whereasindividual samples have shown higher concentra-tions than the prescribed limits (table 3). Mostof the samples show ion concentration withinthe WHO guideline values (figure 5a–l). Onlya few samples show pH, total dissolved solids(TDS), Mg2+, Cl− and NO−
3 concentrations abovethe WHO guideline values (figure 5b, c, g, iand j).
Potassium is an essential nutrient that is criticalto the functioning of nerve and muscle cells, whichif taken in excess may cause hyperkalaemia orhypokalaemia if one is deficient in K+. No per-missible limit has been suggested for this ion ingroundwater by WHO; however, the EuropeanCommunity (EU 1980) has issued a guideline valueof 10 mg/l and maximum admissible level of12 mg/l. Two samples showed K+ concentrationabove prescribed drinking water limits (figure 5f).Nitrate is soluble and leaches through soil alongwith the infiltrating water. Common sources forhigh nitrate are decaying organic matter, domes-tic wastes (David and Gentry 2000) and fertilisers(Tripathi et al. 2000). Consumption of water withhigh nitrate in potable water can lead to methe-moglobinemia (blue baby syndrome) in infants.Groundwater of this area contains nitrate in therange of 0.5–147 mg/l and 11% of the samples showcontamination (table 3 and figure 5j). The contourdiagram of nitrate in groundwater suggests thatthe nitrate contamination (>45 mg/l) was noticedonly at a few locations (figure 4b).
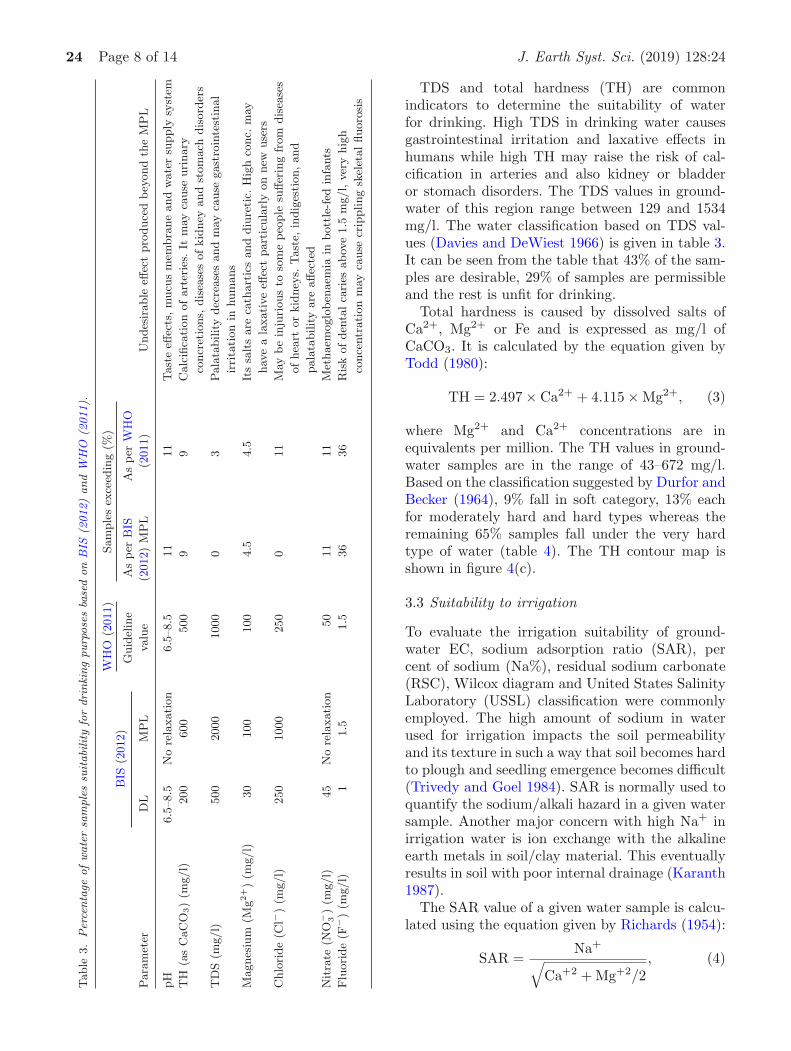
24 Page 8 of 14 J. Earth Syst. Sci. (2019) 128:24
Table
3.
Per
centa
geofwate
rsa
mple
ssu
itabi
lity
for
dri
nki
ng
purp
ose
sba
sed
on
BIS
(2012)
and
WH
O(2
011).
BIS
(2012)
WH
O(2
011)
Sam
ple
sex
ceed
ing
(%)
Para
met
erD
LM
PL
Guid
elin
e
valu
e
As
per
BIS
(2012)
MP
L
As
per
WH
O
(2011)
Undes
irable
effec
tpro
duce
dbey
ond
the
MP
L
pH
6.5
–8.5
No
rela
xati
on
6.5
–8.5
11
11
Tast
eeff
ects
,m
ucu
sm
embra
ne
and
wate
rsu
pply
syst
em
TH
(as
CaC
O3)
(mg/l)
200
600
500
99
Calc
ifica
tion
ofart
erie
s.It
may
cause
uri
nary
concr
etio
ns,
dis
ease
sofkid
ney
and
stom
ach
dis
ord
ers
TD
S(m
g/l)
500
2000
1000
03
Pala
tability
dec
rease
sand
may
cause
gast
roin
test
inal
irri
tati
on
inhum
ans
Magnes
ium
(Mg2+)
(mg/l)
30
100
100
4.5
4.5
Its
salt
sare
cath
art
ics
and
diu
reti
c.H
igh
conc.
may
hav
ea
laxati
ve
effec
tpart
icula
rly
on
new
use
rs
Chlo
ride
(Cl−
)(m
g/l)
250
1000
250
011
May
be
inju
rious
toso
me
peo
ple
suffer
ing
from
dis
ease
s
ofhea
rtor
kid
ney
s.Tast
e,in
dig
esti
on,and
pala
tability
are
affec
ted
Nit
rate
(NO
− 3)
(mg/l)
45
No
rela
xati
on
50
11
11
Met
haem
oglo
ben
aem
iain
bott
le-fed
infa
nts
Flu
ori
de
(F−
)(m
g/l)
11.5
1.5
36
36
Ris
kofden
talca
ries
abov
e1.5
mg/l,
ver
yhig
h
conce
ntr
ati
on
may
cause
crip
pling
skel
etalfluoro
sis
TDS and total hardness (TH) are commonindicators to determine the suitability of waterfor drinking. High TDS in drinking water causesgastrointestinal irritation and laxative effects inhumans while high TH may raise the risk of cal-cification in arteries and also kidney or bladderor stomach disorders. The TDS values in ground-water of this region range between 129 and 1534mg/l. The water classification based on TDS val-ues (Davies and DeWiest 1966) is given in table 3.It can be seen from the table that 43% of the sam-ples are desirable, 29% of samples are permissibleand the rest is unfit for drinking.
Total hardness is caused by dissolved salts ofCa2+, Mg2+ or Fe and is expressed as mg/l ofCaCO3. It is calculated by the equation given byTodd (1980):
TH = 2.497 × Ca2+ + 4.115 × Mg2+, (3)
where Mg2+ and Ca2+ concentrations are inequivalents per million. The TH values in ground-water samples are in the range of 43–672 mg/l.Based on the classification suggested by Durfor andBecker (1964), 9% fall in soft category, 13% eachfor moderately hard and hard types whereas theremaining 65% samples fall under the very hardtype of water (table 4). The TH contour map isshown in figure 4(c).
3.3 Suitability to irrigation
To evaluate the irrigation suitability of ground-water EC, sodium adsorption ratio (SAR), percent of sodium (Na%), residual sodium carbonate(RSC), Wilcox diagram and United States SalinityLaboratory (USSL) classification were commonlyemployed. The high amount of sodium in waterused for irrigation impacts the soil permeabilityand its texture in such a way that soil becomes hardto plough and seedling emergence becomes difficult(Trivedy and Goel 1984). SAR is normally used toquantify the sodium/alkali hazard in a given watersample. Another major concern with high Na+ inirrigation water is ion exchange with the alkalineearth metals in soil/clay material. This eventuallyresults in soil with poor internal drainage (Karanth1987).
The SAR value of a given water sample is calcu-lated using the equation given by Richards (1954):
SAR =Na+√
Ca+2 + Mg+2/2, (4)
J. Earth Syst. Sci. (2019) 128:24 Page 9 of 14 24
Table 4. Water classification based on TDS and TH.
TDS Water classification
Samples
(%)
Total
hardness
Water
classification
Samples
(%)
Up to 500 Desirable for drinking 43 Up to 60 Soft 9
500–1000 Permissible for drinking 29 60–120 Moderately hard 13
1000–3000 Useful for irrigation 29 120–180 Hard 13
>3000 Unfit for drinking and irrigation 0 >180 Very hard 65
Table 5. Water class based on irrigation suitability.
EC (µS/cm) Water class Samples (%)
<250 Excellent 6.90
250–750 Good 37.93
750–2000 Permissible 48.28
2000–3000 Doubtful 6.90
>3000 Unsuitable 0.00
Alkalinity hazard (SAR)
<10 Excellent 100
10–18 Good −18–26 Doubtful −>26 Unsuitable −Per cent sodium
<20 Excellent 13.79
20–40 Good 37.93
40–60 Permissible 34.48
60–80 Doubtful 13.79
>80 Unsafe −Residual sodium carbonate
<1.25 Good 51.72
1.25–2.5 Doubtful 24.14
>2.5 Unsuitable 24.14
where the concentrations are in equivalents permillion. The SAR values of the groundwater sam-ples of the study area range from 0.5 to 6.2 andbelong to low sodium hazard class (table 5).
Na% is another parameter used for assessing thesuitability of water for irrigation (Wilcox 1948).Sodium ions present in water samples complexeswith HCO−
3 and CO2−3 to form alkaline soils, and
combine with chloride to form saline soils. Boththese soils are not favourable for plant growth. Na%is calculated using the following equation:
Na% =(Na+ + K+) × 100
Ca2+ + Mg2+ + Na+ + K+ . (5)
All the concentrations are in milliequivalents perlitre. Na% up to 60 is allowed for agricultural pur-poses (Ramakrishna 1998). Groundwater of this
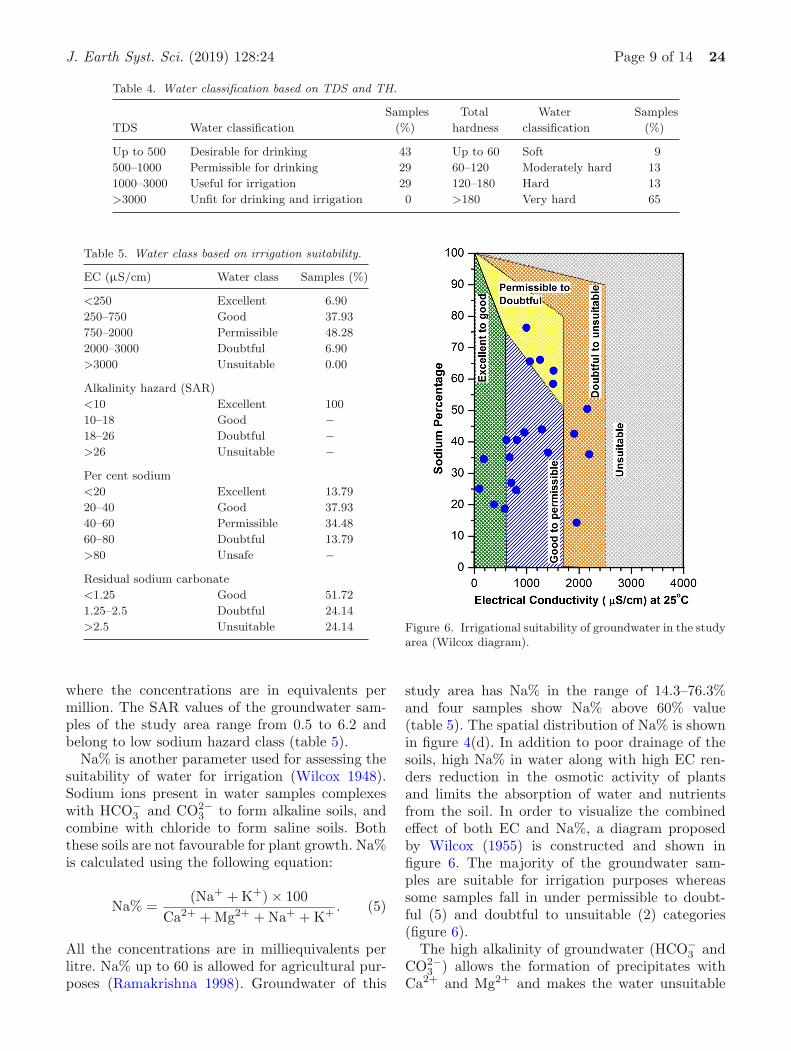
Figure 6. Irrigational suitability of groundwater in the studyarea (Wilcox diagram).
study area has Na% in the range of 14.3–76.3%and four samples show Na% above 60% value(table 5). The spatial distribution of Na% is shownin figure 4(d). In addition to poor drainage of thesoils, high Na% in water along with high EC ren-ders reduction in the osmotic activity of plantsand limits the absorption of water and nutrientsfrom the soil. In order to visualize the combinedeffect of both EC and Na%, a diagram proposedby Wilcox (1955) is constructed and shown infigure 6. The majority of the groundwater sam-ples are suitable for irrigation purposes whereassome samples fall in under permissible to doubt-ful (5) and doubtful to unsuitable (2) categories(figure 6).
The high alkalinity of groundwater (HCO−3 and
CO2−3 ) allows the formation of precipitates with
Ca2+ and Mg2+ and makes the water unsuitable

24 Page 10 of 14 J. Earth Syst. Sci. (2019) 128:24
Figure 7. USSL classification of groundwater in the study area.
for irrigation. RSC is used to quantify this effectand is calculated by the equation given by Eaton(1950):
RSC =(HCO−
3 + CO2−3
) − (Ca2+ + Mg2+
). (6)
Water containing RSC less than 1.25 is suitable forirrigation whereas marginally suitable with RSCup to 2.5 and not suitable for irrigation above2.5 (Lloyd and Heathcote 1985). The RSC val-ues of the groundwater samples of this area rangefrom −12.3 to 6.0. Groundwater samples fall undergood category (51%) and an equal per cent ofsamples (49%) also fall in doubtful and unsuit-able categories (table 5). USSL diagram (USSL1954) was employed to further evaluate the irriga-tional suitability of the groundwater. As per USSLclassification, low-salinity water (<250 µS/cm)can be used for all types of soils. In the studyarea, the majority of the groundwater samplesfall into two zones, C2S1 and C3S1, representingmedium-to-high salinity and low alkalinity water,respectively (figure 7). These zones indicate thatwater can be used for irrigation on almost alltypes of soils with little danger of exchangeablesodium.
3.4 Possible remedial measures
Inorganic ions such as arsenic, fluoride, lead,nitrate, selenium and uranium are considered asthe key chemicals responsible for large-scale healtheffects through drinking water exposure, therefore
providing guidance on identifying local prioritiesand implementing proper management is veryessential for tackling these chemicals in drinkingwater (WHO 2004, 2011). There are four broadapproaches suggested by WHO to limit the nega-tive effects of F− on public health (WHO 2002).These approaches were evaluated for the currentstudy area considering the hydrogeological con-straints (figure 8).
The first approach is the identification of analternative source of potable water with low fluo-ride content. In this area, the groundwater is beingpumped from the semi-consolidated and consoli-dated formations and the well yields are less than100 m3/d signifying moderate-to-low yielding wells(http://www.indiawaterportal.org) and the fluo-ride content is also higher in these formations (upto 1.5–5 mg/l) (Nanda et al. 2011; NEERI 2016).Nearby river and other surface water bodies arealso moderately contaminated by fluoride (Keesariet al. 2016), hence providing an alternate watersource for drinking is not a viable option in thiscase.
The second approach is to dilute high fluo-ride water with low fluoride water to attain amass balance of within 1.5 mg/l. The groundwaterresources capacity in the study area fell below3000 HaM, which is very low (http://www.indiawaterportal.org); in addition, the amount of thelow F− groundwater available is not sufficient andalso contains high nitrate concentration (figure 4b).The overall groundwater yields are quite low(∼5 lps). The rainfall in the study area is low

J. Earth Syst. Sci. (2019) 128:24 Page 11 of 14 24
Figure 8. Flowchart depicting the suitable strategies for amelioration of fluoride toxicity.
and erratic and therefore frequently results indrought conditions (http://www.angul.nic.in/atlas of development trends angul.pdf). Due to com-plex subsurface and geomorphological constraints,the rainfall recharge to groundwater is also low(http://www.indiawaterportal.org). These factorsreflect that dilution of high F− waters would be achallenging and difficult task.
The third approach involves improving thedietary condition of the residents. This aspectmostly takes into consideration the socioeconomicstatus of the residents. Good nutrition is suggestedto combat the impact of fluorosis on the residentsas it helps in reducing the absorption of F− in thebody tissues (http://www.medindia.net/patients/patientinfo/fluorosis.htm). Studies on nutritionalinterventions for fluorosis mitigation have shownthat a diet containing low Ca2+ increases theretention of F− in the body (http://www.inrem.in/fluorosis/pdf/nutrition.pdf). On the other hand,Mg2+ helps in the excretion of F through urine.Consumption of vitamin C was found to increasethe ejection of F− and reduce the severity of flu-orosis. A closer examination of the total hardnesscontour (Ca2+ + Mg2+) of this region (figure 4c)shows that high fluorosis risk zones typically coin-cide with the high TH zones. This can be a positiveindication, as nutritional studies have shown thatCa2+ and Mg2+ help in reducing the risk of flu-orosis to the residents. Supplementing the dietwith vitamin C, which is very widely available
in the area, can further help in reducing theincidences of fluorosis (Mehta Dhaval and Shah2013). The fourth approach is fluoride removalusing various ion exchange and adsorption tech-niques. This needs initiation from the govern-mental and non-governmental institutions so thathouseholds are supplied with F− removal filtersdepending on the amount of the F− present in thegroundwater at a location. A combination of propernutrition and installation of fluoride removal kitscan together effectively improve the health condi-tion of the residents of this region and other similarregions elsewhere.
4. Summary and conclusions
Groundwater quality and its suitability for drink-ing with a special emphasis on F− exposure tohumans was evaluated in the Talcher Area, Odisha.An assessment of groundwater suitability for irri-gation purposes was also presented in this paper.This study is significant as the water resourcesare being polluted by mining and other indus-trial activities in this region and groundwater isimpacted by geogenic contamination like high flu-oride concentration. Results indicate that mostof the hydrochemical parameters are well withinthe WHO guideline values except fluoride. Indi-cators such as SAR, RSC and Na% that qualifythe water for irrigation suitability are found to be

24 Page 12 of 14 J. Earth Syst. Sci. (2019) 128:24
under low sodium hazard and permissible category.There are also cases of water samples falling underdoubtful to unfit category due to the presence ofhigh sodium concentrations.
The F− concentration in the study is found to bein the range of 0.1–4.4 mg/l. About 39% of the sam-ples show fluoride concentration above the WHOand BIS permissible limit of 1.5 mg/l. The exposuredose for F− due to drinking water was found to bein the range of 0.01–0.37, 0.01–0.33 and 0.01–0.19mg/kg/d for infants, children and adults, respec-tively. The F− exposure values fall close to or abovethe minimum risk level for fluorosis. The spatialtrends of the F− exposure estimates indicate thatthe western and northwestern parts of the studyarea show no or less risk of fluorosis, while in restof the study area, the fluorosis risk is moderate tohigh. The presence of higher concentrations of dis-solved Ca2+ and Mg2+ in zones of high fluoride riskpresent a favourable case to prevent the severity ofthe fluorosis. However, incorporation of vitamin Cin the diet as well as use of F− removal kits caneffectively reduce the risk of fluorosis among theresidents of this area.
Acknowledgements
The authors sincerely thank the Talcher PowerPlant authorities and colleagues from IsotopeHydrology Section, BARC, for their support dur-ing sampling. Shri K S S Sarma, Head, Isotope andRadiation Application Division, BARC, is grate-fully acknowledged.
References
ATSDR 2003 Toxicological profile for fluorides, hydrogen flu-oride, and fluorine; US Department of Health and HumanServices, Public Health Service, Agency for Toxic Sub-stances and Disease Registry, Atlanta, GA, 404p.
Batra J, Vispute J B, Deshmukh A N and Vali S 1995 Contri-bution from rock, soil and ground water to fluoride contentof food stuffs grown in some selected villages of Bhadra-vati Tehsil, Chandrapur District, Maharashtra; FluorideEnviron. Nagpur, India: Gondwana Geol. Soc. 9 81–90.
Battaleb-Looie S, Moore F, Malde M K and Jacks G 2013Fluoride in groundwater, dates and wheat: Estimatedexposure dose in the population of Bushehr, Iran; FoodCompos. Anal. 29(2) 94–99.
BIS 2012 Bureau of Indian Standards, drinking water speci-fication (2nd revision) ICS 13.060.20, IS 10500:2012.
Bretzler A and Johnson C A 2015 The geogenic contam-ination handbook: Addressing arsenic and fluoride indrinking water; Appl. Geochem. 63 642–646.
Brindha K and Elango L 2013 Geochemistry of fluoriderich groundwater in a weathered granitic rock region,Southern India; Water Qual. Expo. Health 5(3) 127–138.
Brindha K, Jagadeshan G, Kalpana L and Elango L 2016Fluoride in weathered rock aquifers of southern India:Managed aquifer recharge for mitigation; Environ. Sci.Pollut. Res. 23(9) 8302–8316.
Cao J, Zhao Y, Li Y, Deng H J, Yi J and Liu J W 2006 Fluo-ride levels in various black tea commodities: Measurementand safety evaluation; Food Chem. Toxicol. 44(7) 1131–1137.
CGWB 2010 Ground water quality in shallow aquifersof India; Central Ground Water Board, Ministryof Water Resources, Government of India, Farid-abad (http://admin.indiaenvironmentportal.org.in/files/GW Quality in shallow aquifers.pdf).
Chae G T, Yun S T, Mayer B, Kim K H, Kim S Y, KwonJ S, Kim K and Koh Y K 2007 Fluorine geochemistry inbedrock groundwater of South Korea; Sci. Total Environ.385(1) 272–283.
Chen Q, Song Z, Lu Q, Wang M, Feng J, Tian H,Liu J, Li X and Zhang R 2012 Fluorine contents andits characteristics of groundwater in fluorosis area inLaizhou Bay, China; Toxicol. Environ. Chem. 94(8) 1490–1501.
Choubisa S L and Choubisa D 2016 Status of industrial fluo-ride pollution and its diverse adverse health effects in manand domestic animals in India; Environ. Sci. Pollut. Res.23(8) 7244–7254.
David M B and Gentry L E 2000 Anthropogenic inputs ofnitrogen and phosphorus and riverine export for Illinois,USA; J. Environ. Qual. 29(2) 494–508.
Davies T C 2008 Environmental health impacts of EastAfrican Rift volcanism; Environ. Geochem. Health 30(4)325–338.
Davies S N and DeWiest R J M 1966 Hydrogeology ; Wiley,New York.
Dean 1993 Health effects of ingested fluoride; NationalAcademy of Sciences, Washington, USA, 169p.
Dhadse S, Kumari P and Bhagia L J 2008 Fly ash charac-terization, utilization and Government initiatives in India– A review; J. Sci. Ind. Res. 67 11–18.
Dhakate R and Rao T G 2010 Assessment of groundwa-ter quality in Talcher coalfield area, Orissa, India; Int.J. Earth Sci. Eng. 3(1) 43–55.
Durfor C N and Becker E 1964 Public water supplies of the100 largest cities in the United States, 1962 (No. 1812);US Government Printing Office, pp. 343–346.
Eaton F M 1950 Significance of carbonates in irrigationwaters; Soil Sci. 69(2) 123–134.
EU Directive C 1980 European union council directive80/778/EEC of 15 July 1980 relating to the quality ofwater intended for human consumption; Off. J. Eur. Com-mun. L229 11–29.
Fordyce F M, Vrana K, Zhovinsky E, Povoroznuk V, TothG, Hope B C, Iljinsky U and Baker J 2007 A healthrisk assessment for fluoride in Central Europe; Environ.Geochem. Health 29(2) 83–102.
Frencken J E 1992 Endemic fluorosis in developing countries:Causes, effects and possible solutions; TNO Institute forPreventive Health Care. Publ. No. 91.082, Leiden.
J. Earth Syst. Sci. (2019) 128:24 Page 13 of 14 24
Genxu W and Guodong C 2001 Fluoride distribution inwater and the governing factors of environment in aridnorth-west China; J. Arid Environ. 49(3) 601–614.
Grimaldo M, Borja-Aburto V H, Ramırez A L, Ponce M,Rosas M and Dıaz-Barriga F 1995 Endemic fluorosis inSan Luis Potosı, Mexico; Environ. Res. 68 25–30.
Hounslow A W 1995 Water quality data analysis and inter-pretation; CRC Press, Florida.
Jacks G, Bhattacharya P, Chaudhary V and Singh K P 2005Controls on the genesis of some high-fluoride groundwa-ters in India; Appl. Geochem. 20(2) 221–228.
Jackson P J, Harvey P W and Young W F 2002 Chemistryand bioavailability aspects of fluoride in drinking water;Report No.: CO 5037 (http://americanfluoridationsociety.org/wp-content/uploads/2016/05/Jackson-lead-corrosive-wrcreport.pdf).
Jagadeshan G, Kalpana L and Elango L 2015 Major ion sig-natures for identification of geochemical reactions respon-sible for release of fluoride from geogenic sources togroundwater and associated risk in Vaniyar River basin,Dharmapuri district, Tamil Nadu, India; Environ. EarthSci. 74(3) 2439–2450.
Jagtap S, Yenkie M K, Labhsetwar N and Rayalu S 2012Fluoride in drinking water and defluoridation of water;Chem. Rev. 112(4) 2454–2466.
Jha S K, Nayak A K and Sharma Y K 2009 Fluorideoccurrence and assessment of exposure dose of fluoride inshallow aquifers of Makur, Unnao district, Uttar Pradesh,India; Environ. Monit. Assess. 156(1–4) 561–566.
Kalpana L and Elango L 2013 Assessment of groundwaterquality for drinking and irrigation purposes in Pambarriver sub-basin, Tamil Nadu; Indian J. Environ. Prot.33(1) 1–8.
Karanth K R 1987 Groundwater assessment, developmentand management ; Tata-McGraw-Hill, New Delhi.
Keesari T, Sinha U K, Deodhar A, Krishna S H, Ansari A,Mohokar H and Dash A 2016 High fluoride in groundwa-ter of an industrialized area of Eastern India (Odisha):Inferences from geochemical and isotopic investigation;Environ. Earth Sci. 75(14) 1–17.
Levy S M 1994 Review of fluoride exposures and ingestion;Commun. Dent. Oral Epidemiol. 22(3) 173–180.
Lian-Fang W and Jian-Zhong H 1995 Outline of control prac-tice of endemic fluorosis in China; Social Sci. Med. 41(8)1191–1195.
Lloyd J W and Heathcote J A A 1985 Natural inorganichydrochemistry in relation to ground water ; Clarendon,Oxford, 294p.
Malde M K, Zerihun L, Julshamn K and Bjorvatn K 2004Fluoride, calcium and magnesium intake in children livingin a high-fluoride area in Ethiopia. Intake through food;Int. J. Paediat. Dent. 14(3) 167–174.
Malde M K, Scheidegger R, Julshamn K and Bader H P2011 Substance flow analysis: A case study of fluorideexposure through food and beverages in young childrenliving in Ethiopia; Environ. Health Perspect. 119(4) 579–584.
Mehta Dhaval N and Shah J 2013 Reversal of dental fluorosis:A clinical study; J. Nat. Sci. Biol. Med. 4(1) 138–144.
Moharana J K, Nanda P M and Garnaik B K 2013 Eutrofi-cation due to industrialization in Angul-Talcher industrialcomplex of Odisha; Int. J. Sci. Environ. Technol. 2 20–27.
Nanda P M, Garnaik B K and Panda S 2011 Studies onFluoride pollution in ground water of Angul-Talcherindustrial complex of Odisha; Asian J. Chem. Environ.Res. 4(1) 13–16.
NEERI 2016 Integrated hydrogeological, geophysical, hydro-chemical and groundwater flow and solute transportmodelling studies around the ash filled South BalandaMine voids in Angul district, Odisha (Undertaken During2012–2016), http://environmentclearance.nic.in/writereaddata/modification/Extension/Attach file/23112016FCAY0QHUAnnexure-HydrogeologyReport-NEERI.pdf.
NRC 1993 Health effects of ingested fluoride; NationalResearch Council, National Academy Press, WashingtonDC.
Praharaj T, Tripathy S, Powell M A and Hart B R 2003Geochemical studies to delineate topsoil contaminationaround an ash pond of a coal-based thermal power plantin India; Environ. Geol. 45(1) 86–97.
Ramakrishna 1998 Groundwater ; Handbook, India.Richards L A 1954 Diagnosis and improvement of saline and
alkali soils; In: US Department of Agriculture, Agri. Handbook 60, Washington 78(2) 154.
Sahu B K, Panda R B, Sinha B K and Nayak A 1991 Waterquality index of the River Brahmani at Rourkela indus-trial complex of Orissa; J. Ecotoxicol. Environ. Monit.1(3) 169–175.
Shailaja K and Johnson M E C 2007 Fluorides in groundwa-ter and its impact on health; J. Environ. Biol. 28 331–332.
SubbaRao N 2011 High-fluoride groundwater; Environ.Monit. Assess. 176(1) 637–645.
Rao N S, Subrahmanyam A and Rao G B 2013 Fluoride-bearing groundwater in Gummanampadu sub-basin, Gun-tur district, Andhra Pradesh, India; Environ. Earth Sci.70(2) 575–586.
Tiwary R K, Dhakate R, Sinha A and Singh V S 2009 Eval-uation of impact of mining on groundwater resources inTalcher Coalfield, India; Int. J. Earth Sci. Eng. 2(3) 238–252.
Todd D K 1980 Ground water hydrology ; Wiley, New York.Tripathi S D, Aravindakshan P K, Ayyappan S, Jena J K,
Muduli H K, Chandra S and Pani K C I 2000 New highin crop production in India through intensive polyculture;J. Aquat. Trop. 15(2) 119–128.
Trivedy R K and Goel P K 1984 Chemical and biologicalmethods for water pollution studies; Environmental Pub-lication, Karad.
USSL 1954 Diagnosis and improvement of saline and alkalinesoils; United States Salinity Laboratory, U.S. Departmentof Agriculture, Washington.
Viswanathan G, Jaswanth A and Gopalakrishnan S 2009Mapping of fluoride endemic areas and assessment offluoride exposure; Sci. Tot. Environ. 407(5) 1579–1587.
WHO 2002 Fluorides, environmental health criteria 227 ;International Programme on Chemical Safety, Geneva.
WHO 2004 Guidelines for drinking water quality (3rd edn);World Health Organization, Geneva.
WHO 2006 Guidelines for drinking-water quality (3rd edn),1st addendum to Vol. 1, Recommendations, Geneva,595p.
WHO 2011 Guidelines for drinking water quality ; 4th edn,WHO Press, 20 Avenue Appia, Geneva, Switzerland.

24 Page 14 of 14 J. Earth Syst. Sci. (2019) 128:24
Wilcox L V 1948 The quality of water for irrigation use; Vol.962, U.S. Dept. of Agriculture, Tech, Bull, Washington,DC, 40p.
Wilcox L V 1955 Classification and use of irrigationwater ; Vol. 969, U.S. Geological department, Agri. Arc.,Washington, DC, 19p.
Corresponding editor: Abhijit Mukherjee