Suitability of Tube-Wells Water for Drinking at Lalpur Upazila ...
18
International Journal of Scientific and Research Publications, Volume 9, Issue 6, June 2019 362 ISSN 2250-3153 http://dx.doi.org/10.29322/IJSRP.9.06.2019.p9056 www.ijsrp.org Suitability of Tube-Wells Water for Drinking at Lalpur Upazila in Natore District, Rajshahi, Bangladesh Badhon Ahmmed, Khandoker Qudrata Kibria Soil, Water and Environment Discipline, Khulna University, Khulna-9208, Bangladesh DOI: 10.29322/IJSRP.9.06.2019.p9056 http://dx.doi.org/10.29322/IJSRP.9.06.2019.p9056 Abstract- The aim of the study was to observe the suitability of tube-wells water consumed by people of Lalpur upazila in Natore district for drinking purpose in comparison to standard of World Health Organization (WHO) and the standard of Bangladesh. In this study, it was tried to find out the physical and chemical conditions of the drinkable tube-wells water used in the studied region and to observe the presence or absence of total coliform & Escherichia coli bacteria. Therefore, a total of 30 tube-well water samples were randomly collected from different households under 10 unions and 1 municipality of the studied upazila. The depths of the tube-wells ranging between 16 to 55 meter (shallow tube-wells). These samples were tested with about 23 parameters including physical: Color, Odor, Taste, Temperature, Total dissolved solids (TDS), and Total suspended solids (TSS); chemical: Acidity/Alkalinity (pH), Arsenic, Bicarbonate, Calcium, Chloride, Dissolved oxygen, Electrical conductivity, Iron, Magnesium, Manganese, Nitrogen, Phosphate, Potassium, Sodium, Sulfate, and bacteriological: Presence or absence of total coliforms and E. coli bacteria. All parameters were conducted 2-3 times (replications) for each sample. The found results were compared with the acceptable limits by World Health Organization (WHO) and Department of Public Health and Engineering (DPHE) & Environmental Conservation Rules (1997) in Bangladesh. Especially, Arsenic exceeded the acceptable limit by WHO (0.01 mgl -1 ) and 1 sample exceeded even the acceptable limit in Bangladesh (0.05 mgl -1 ). Besides, about 57% water samples are found without coliforms and with the total coliforms are found into the rest 43% of total samples; 13% water samples are found with E. coli bacteria. The suitability of the water samples is found for drinking with Water Quality Index (WQI) in terms of 15 parameters viz., Acidity/Alkalinity (pH), Bicarbonate, Calcium, Chloride, Dissolved oxygen, Electrical conductivity, Iron, Magnesium, Nitrate, Phosphate, Potassium, Sodium, Sulfate, Total dissolved solids and Total suspended solids. From the obtained value of WQI it is found that, only 3% of the water samples are good, about 57% samples are poor, 17% water are very poor quality and 23% samples are unsuitable for drinking in the studied region. Index Terms- Tube-wells, Water quality, Drinking purpose, Physico-chemicals, Bacterial presence, Water Quality Index (WQI), Lalpur upazila, Bangladesh I. INTRODUCTION ater is essential for the survival of all living organisms and also essential for our health and our economy. Fresh water is the major need of human life. Drinking water quality is a vital concern for mankind since it is directly linked with public health. Drinking water quality has always been a major issue in many countries, especially in developing countries like Bangladesh (Moe and Rheingans, 2006). Although safe drinking water is a basic demand for the people of all over the world, a huge percentage of people of the world are deprived from the pure drinking water including Bangladesh (Chowdhury et al., 2014). Ground water is depleting day by day prominently in Asia, South America, North America and ecosystems are threatened (Gleeson et al., 2012). In Bangladesh most of the people think that ground water or water from tube wells is free from contamination. For this reason hand pumped tube-well water is used as primarily source of safe drinking water in Bangladesh. Almost 90% of the households use this hand pumped tube-well technology in Bangladesh (Emch et al., 2010). Since the early 1970s, there has been an enormous effort in Bangladesh by UNICEF and other international donor organizations to install tube wells throughout much of Bangladesh, to reduce exposure of the population to infectious disease transmission via contaminated surface waters. As a result, there are now about 10 million shallow wells, accessed by hand pumps, located in many regions of the country. In some areas, which have saline water in the upper layers of groundwater, there are deeper wells that required much more extensive drilling operations to install. W
-
Upload
khangminh22 -
Category
Documents
-
view
2 -
download
0
Transcript of Suitability of Tube-Wells Water for Drinking at Lalpur Upazila ...
International Journal of Scientific and Research Publications, Volume 9, Issue 6, June 2019 362 ISSN 2250-3153
http://dx.doi.org/10.29322/IJSRP.9.06.2019.p9056 www.ijsrp.org
Suitability of Tube-Wells Water for Drinking at
Lalpur Upazila in Natore District, Rajshahi, Bangladesh
Badhon Ahmmed, Khandoker Qudrata Kibria
Soil, Water and Environment Discipline, Khulna University, Khulna-9208, Bangladesh
DOI: 10.29322/IJSRP.9.06.2019.p9056
http://dx.doi.org/10.29322/IJSRP.9.06.2019.p9056
Abstract- The aim of the study was to observe the suitability of tube-wells water consumed by people of Lalpur upazila in Natore
district for drinking purpose in comparison to standard of World Health Organization (WHO) and the standard of Bangladesh. In this
study, it was tried to find out the physical and chemical conditions of the drinkable tube-wells water used in the studied region and to
observe the presence or absence of total coliform & Escherichia coli bacteria. Therefore, a total of 30 tube-well water samples were
randomly collected from different households under 10 unions and 1 municipality of the studied upazila. The depths of the tube-wells
ranging between 16 to 55 meter (shallow tube-wells). These samples were tested with about 23 parameters including physical: Color,
Odor, Taste, Temperature, Total dissolved solids (TDS), and Total suspended solids (TSS); chemical: Acidity/Alkalinity (pH),
Arsenic, Bicarbonate, Calcium, Chloride, Dissolved oxygen, Electrical conductivity, Iron, Magnesium, Manganese, Nitrogen,
Phosphate, Potassium, Sodium, Sulfate, and bacteriological: Presence or absence of total coliforms and E. coli bacteria. All
parameters were conducted 2-3 times (replications) for each sample. The found results were compared with the acceptable limits by
World Health Organization (WHO) and Department of Public Health and Engineering (DPHE) & Environmental Conservation Rules
(1997) in Bangladesh. Especially, Arsenic exceeded the acceptable limit by WHO (0.01 mgl-1
) and 1 sample exceeded even the
acceptable limit in Bangladesh (0.05 mgl-1
). Besides, about 57% water samples are found without coliforms and with the total
coliforms are found into the rest 43% of total samples; 13% water samples are found with E. coli bacteria. The suitability of the water
samples is found for drinking with Water Quality Index (WQI) in terms of 15 parameters viz., Acidity/Alkalinity (pH), Bicarbonate,
Calcium, Chloride, Dissolved oxygen, Electrical conductivity, Iron, Magnesium, Nitrate, Phosphate, Potassium, Sodium, Sulfate,
Total dissolved solids and Total suspended solids. From the obtained value of WQI it is found that, only 3% of the water samples are
good, about 57% samples are poor, 17% water are very poor quality and 23% samples are unsuitable for drinking in the studied
region.
Index Terms- Tube-wells, Water quality, Drinking purpose, Physico-chemicals, Bacterial presence, Water Quality Index (WQI),
Lalpur upazila, Bangladesh
I. INTRODUCTION
ater is essential for the survival of all living organisms and also essential for our health and our economy. Fresh water is the
major need of human life. Drinking water quality is a vital concern for mankind since it is directly linked with public health.
Drinking water quality has always been a major issue in many countries, especially in developing countries like Bangladesh (Moe and
Rheingans, 2006). Although safe drinking water is a basic demand for the people of all over the world, a huge percentage of people of
the world are deprived from the pure drinking water including Bangladesh (Chowdhury et al., 2014). Ground water is depleting day
by day prominently in Asia, South America, North America and ecosystems are threatened (Gleeson et al., 2012).
In Bangladesh most of the people think that ground water or water from tube wells is free from contamination. For this reason
hand pumped tube-well water is used as primarily source of safe drinking water in Bangladesh. Almost 90% of the households use this
hand pumped tube-well technology in Bangladesh (Emch et al., 2010).
Since the early 1970s, there has been an enormous effort in Bangladesh by UNICEF and other international donor organizations
to install tube wells throughout much of Bangladesh, to reduce exposure of the population to infectious disease transmission via
contaminated surface waters. As a result, there are now about 10 million shallow wells, accessed by hand pumps, located in many
regions of the country. In some areas, which have saline water in the upper layers of groundwater, there are deeper wells that required
much more extensive drilling operations to install.
W
International Journal of Scientific and Research Publications, Volume 9, Issue 6, June 2019 363
ISSN 2250-3153
http://dx.doi.org/10.29322/IJSRP.9.06.2019.p9056 www.ijsrp.org
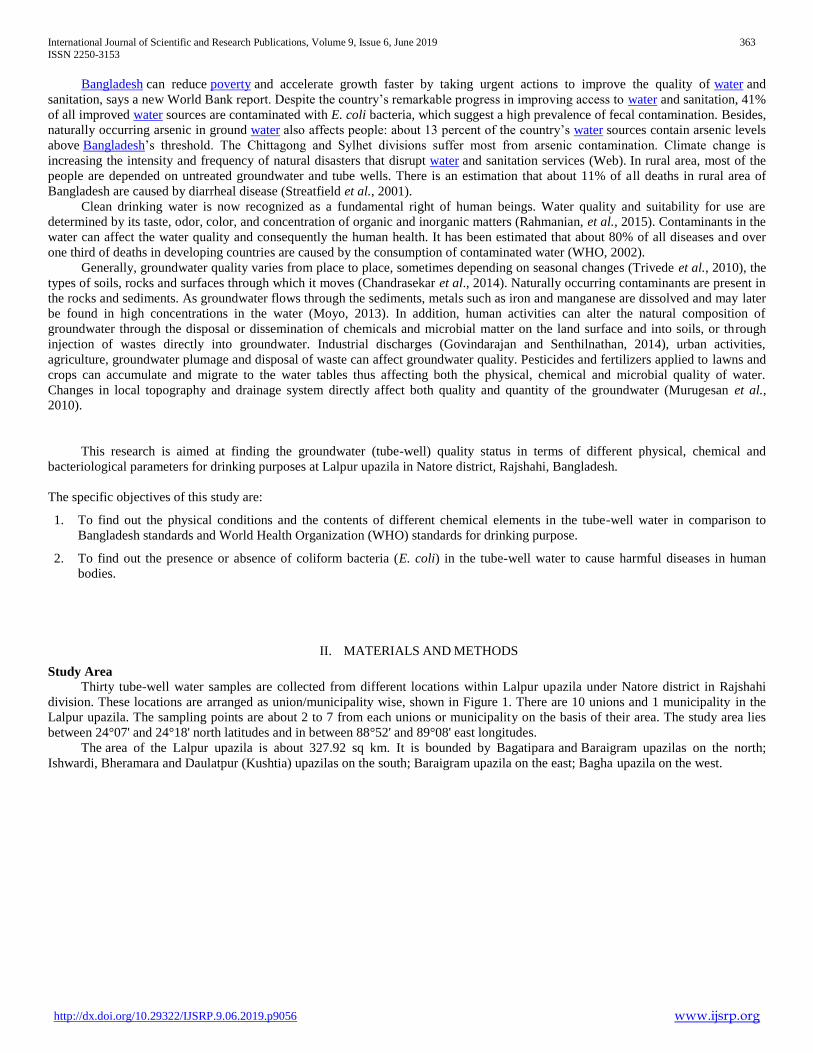
Bangladesh can reduce poverty and accelerate growth faster by taking urgent actions to improve the quality of water and
sanitation, says a new World Bank report. Despite the country’s remarkable progress in improving access to water and sanitation, 41%
of all improved water sources are contaminated with E. coli bacteria, which suggest a high prevalence of fecal contamination. Besides,
naturally occurring arsenic in ground water also affects people: about 13 percent of the country’s water sources contain arsenic levels
above Bangladesh’s threshold. The Chittagong and Sylhet divisions suffer most from arsenic contamination. Climate change is
increasing the intensity and frequency of natural disasters that disrupt water and sanitation services (Web). In rural area, most of the
people are depended on untreated groundwater and tube wells. There is an estimation that about 11% of all deaths in rural area of
Bangladesh are caused by diarrheal disease (Streatfield et al., 2001).
Clean drinking water is now recognized as a fundamental right of human beings. Water quality and suitability for use are
determined by its taste, odor, color, and concentration of organic and inorganic matters (Rahmanian, et al., 2015). Contaminants in the
water can affect the water quality and consequently the human health. It has been estimated that about 80% of all diseases and over
one third of deaths in developing countries are caused by the consumption of contaminated water (WHO, 2002).
Generally, groundwater quality varies from place to place, sometimes depending on seasonal changes (Trivede et al., 2010), the
types of soils, rocks and surfaces through which it moves (Chandrasekar et al., 2014). Naturally occurring contaminants are present in
the rocks and sediments. As groundwater flows through the sediments, metals such as iron and manganese are dissolved and may later
be found in high concentrations in the water (Moyo, 2013). In addition, human activities can alter the natural composition of
groundwater through the disposal or dissemination of chemicals and microbial matter on the land surface and into soils, or through
injection of wastes directly into groundwater. Industrial discharges (Govindarajan and Senthilnathan, 2014), urban activities,
agriculture, groundwater plumage and disposal of waste can affect groundwater quality. Pesticides and fertilizers applied to lawns and
crops can accumulate and migrate to the water tables thus affecting both the physical, chemical and microbial quality of water.
Changes in local topography and drainage system directly affect both quality and quantity of the groundwater (Murugesan et al.,
2010).
This research is aimed at finding the groundwater (tube-well) quality status in terms of different physical, chemical and
bacteriological parameters for drinking purposes at Lalpur upazila in Natore district, Rajshahi, Bangladesh.
The specific objectives of this study are:
1. To find out the physical conditions and the contents of different chemical elements in the tube-well water in comparison to
Bangladesh standards and World Health Organization (WHO) standards for drinking purpose.
2. To find out the presence or absence of coliform bacteria (E. coli) in the tube-well water to cause harmful diseases in human
bodies.
II. MATERIALS AND METHODS
Study Area
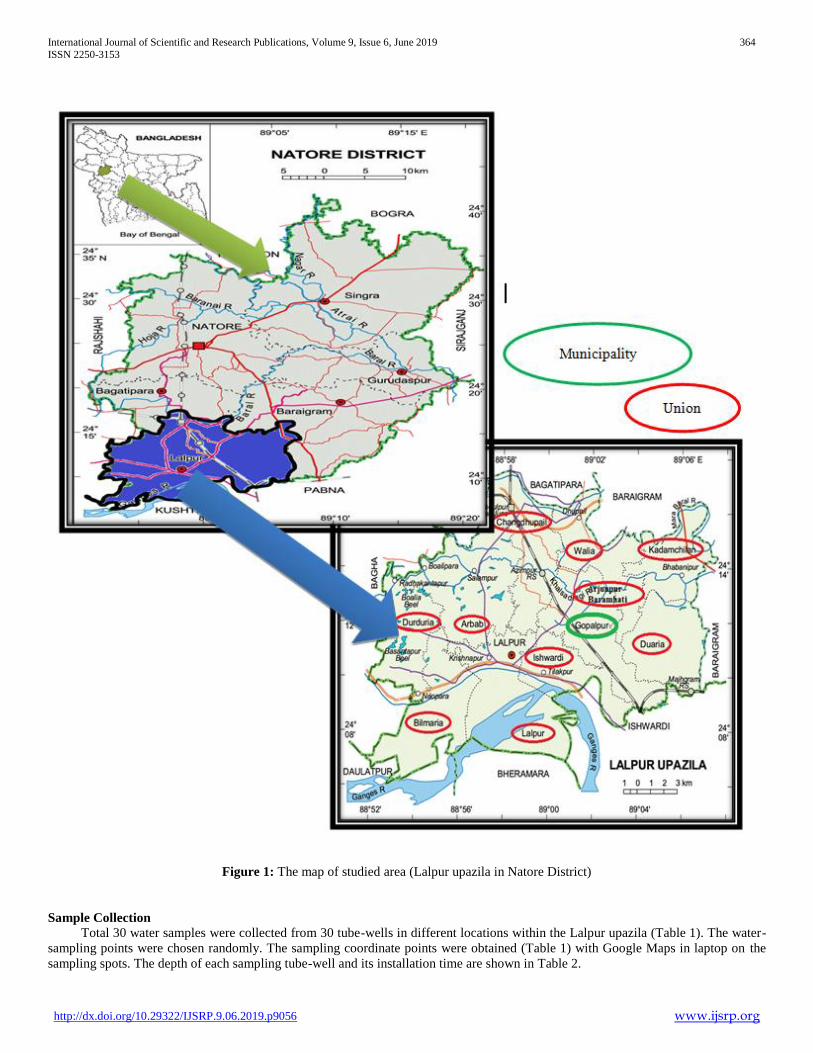
Thirty tube-well water samples are collected from different locations within Lalpur upazila under Natore district in Rajshahi
division. These locations are arranged as union/municipality wise, shown in Figure 1. There are 10 unions and 1 municipality in the
Lalpur upazila. The sampling points are about 2 to 7 from each unions or municipality on the basis of their area. The study area lies
between 24°07' and 24°18' north latitudes and in between 88°52' and 89°08' east longitudes.
The area of the Lalpur upazila is about 327.92 sq km. It is bounded by Bagatipara and Baraigram upazilas on the north;
Ishwardi, Bheramara and Daulatpur (Kushtia) upazilas on the south; Baraigram upazila on the east; Bagha upazila on the west.
International Journal of Scientific and Research Publications, Volume 9, Issue 6, June 2019 364
ISSN 2250-3153
http://dx.doi.org/10.29322/IJSRP.9.06.2019.p9056 www.ijsrp.org
Figure 1: The map of studied area (Lalpur upazila in Natore District)
Sample Collection
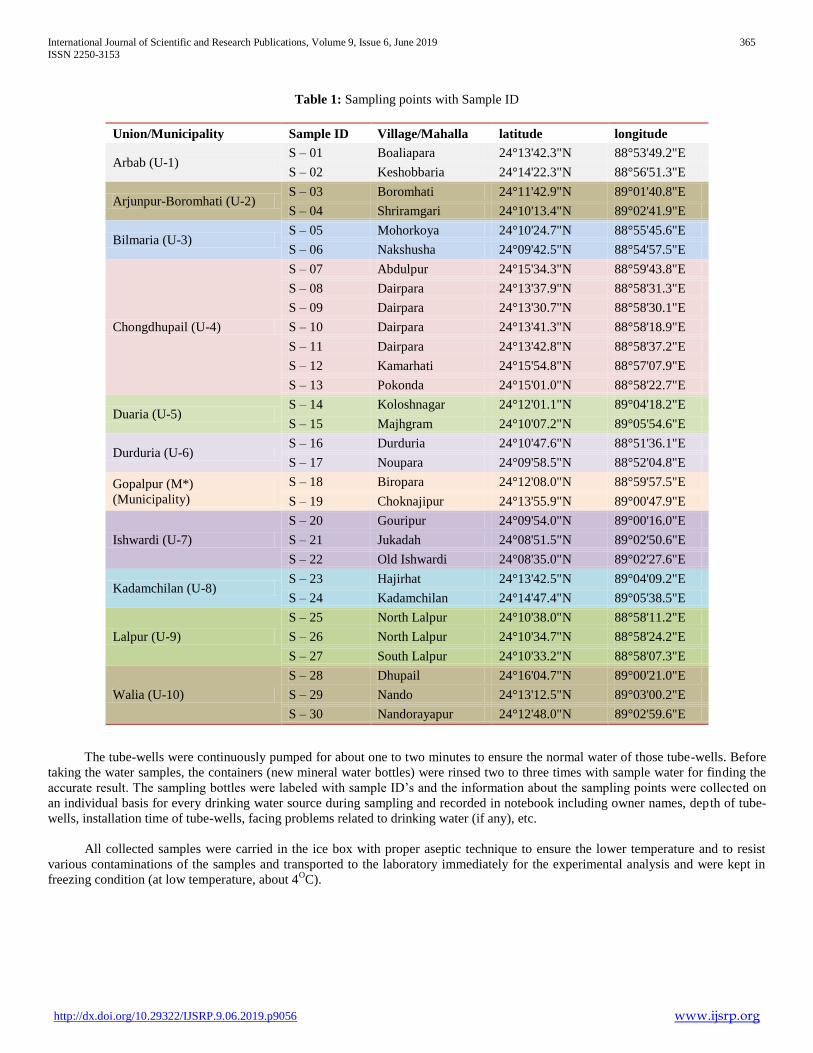
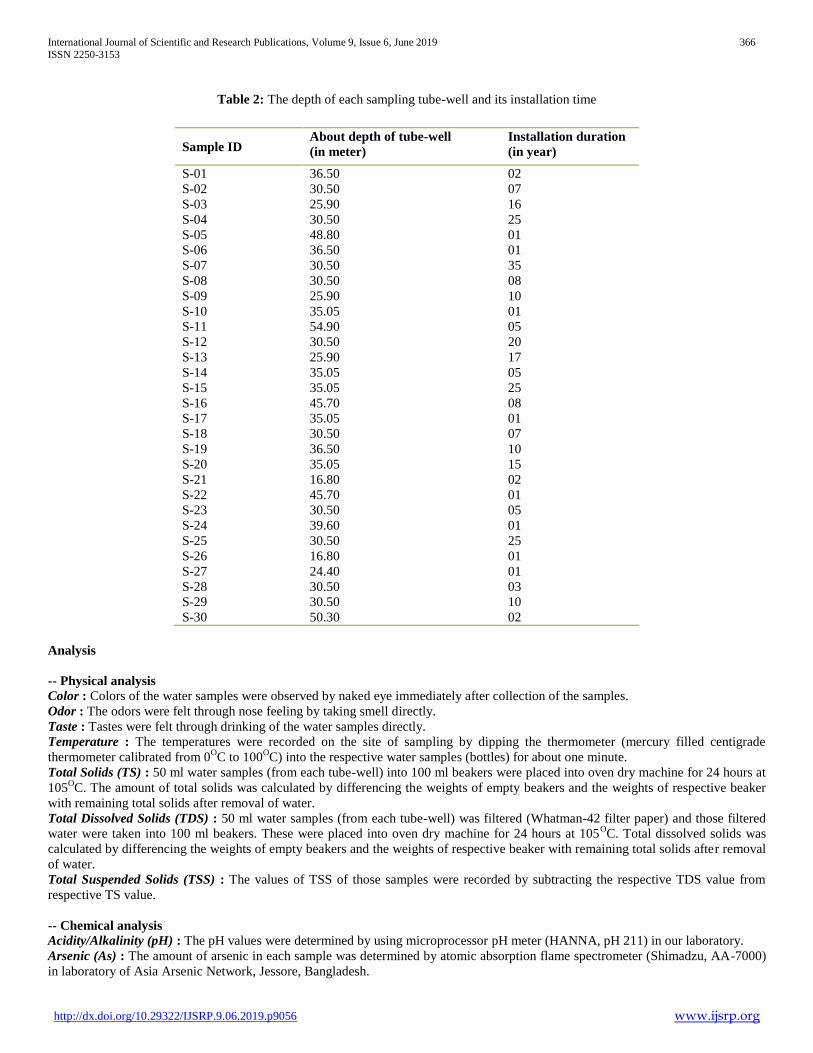
Total 30 water samples were collected from 30 tube-wells in different locations within the Lalpur upazila (Table 1). The water-
sampling points were chosen randomly. The sampling coordinate points were obtained (Table 1) with Google Maps in laptop on the
sampling spots. The depth of each sampling tube-well and its installation time are shown in Table 2.
International Journal of Scientific and Research Publications, Volume 9, Issue 6, June 2019 365
ISSN 2250-3153
http://dx.doi.org/10.29322/IJSRP.9.06.2019.p9056 www.ijsrp.org
Table 1: Sampling points with Sample ID
The tube-wells were continuously pumped for about one to two minutes to ensure the normal water of those tube-wells. Before
taking the water samples, the containers (new mineral water bottles) were rinsed two to three times with sample water for finding the
accurate result. The sampling bottles were labeled with sample ID’s and the information about the sampling points were collected on
an individual basis for every drinking water source during sampling and recorded in notebook including owner names, depth of tube-
wells, installation time of tube-wells, facing problems related to drinking water (if any), etc.
All collected samples were carried in the ice box with proper aseptic technique to ensure the lower temperature and to resist
various contaminations of the samples and transported to the laboratory immediately for the experimental analysis and were kept in
freezing condition (at low temperature, about 4OC).
Union/Municipality Sample ID Village/Mahalla latitude longitude
Arbab (U-1) S – 01 Boaliapara 24°13'42.3"N 88°53'49.2"E
S – 02 Keshobbaria 24°14'22.3"N 88°56'51.3"E
Arjunpur-Boromhati (U-2) S – 03 Boromhati 24°11'42.9"N 89°01'40.8"E
S – 04 Shriramgari 24°10'13.4"N 89°02'41.9"E
Bilmaria (U-3) S – 05 Mohorkoya 24°10'24.7"N 88°55'45.6"E
S – 06 Nakshusha 24°09'42.5"N 88°54'57.5"E
Chongdhupail (U-4)
S – 07 Abdulpur 24°15'34.3"N 88°59'43.8"E
S – 08 Dairpara 24°13'37.9"N 88°58'31.3"E
S – 09 Dairpara 24°13'30.7"N 88°58'30.1"E
S – 10 Dairpara 24°13'41.3"N 88°58'18.9"E
S – 11 Dairpara 24°13'42.8"N 88°58'37.2"E
S – 12 Kamarhati 24°15'54.8"N 88°57'07.9"E
S – 13 Pokonda 24°15'01.0"N 88°58'22.7"E
Duaria (U-5) S – 14 Koloshnagar 24°12'01.1"N 89°04'18.2"E
S – 15 Majhgram 24°10'07.2"N 89°05'54.6"E
Durduria (U-6) S – 16 Durduria 24°10'47.6"N 88°51'36.1"E
S – 17 Noupara 24°09'58.5"N 88°52'04.8"E
Gopalpur (M*)
(Municipality)
S – 18 Biropara 24°12'08.0"N 88°59'57.5"E
S – 19 Choknajipur 24°13'55.9"N 89°00'47.9"E
Ishwardi (U-7)
S – 20 Gouripur 24°09'54.0"N 89°00'16.0"E
S – 21 Jukadah 24°08'51.5"N 89°02'50.6"E
S – 22 Old Ishwardi 24°08'35.0"N 89°02'27.6"E
Kadamchilan (U-8) S – 23 Hajirhat 24°13'42.5"N 89°04'09.2"E
S – 24 Kadamchilan 24°14'47.4"N 89°05'38.5"E
Lalpur (U-9)
S – 25 North Lalpur 24°10'38.0"N 88°58'11.2"E
S – 26 North Lalpur 24°10'34.7"N 88°58'24.2"E
S – 27 South Lalpur 24°10'33.2"N 88°58'07.3"E
Walia (U-10)
S – 28 Dhupail 24°16'04.7"N 89°00'21.0"E
S – 29 Nando 24°13'12.5"N 89°03'00.2"E
S – 30 Nandorayapur 24°12'48.0"N 89°02'59.6"E
International Journal of Scientific and Research Publications, Volume 9, Issue 6, June 2019 366
ISSN 2250-3153
http://dx.doi.org/10.29322/IJSRP.9.06.2019.p9056 www.ijsrp.org
Table 2: The depth of each sampling tube-well and its installation time
Analysis
-- Physical analysis
Color : Colors of the water samples were observed by naked eye immediately after collection of the samples.
Odor : The odors were felt through nose feeling by taking smell directly.
Taste : Tastes were felt through drinking of the water samples directly.
Temperature : The temperatures were recorded on the site of sampling by dipping the thermometer (mercury filled centigrade
thermometer calibrated from 0OC to 100
OC) into the respective water samples (bottles) for about one minute.
Total Solids (TS) : 50 ml water samples (from each tube-well) into 100 ml beakers were placed into oven dry machine for 24 hours at
105OC. The amount of total solids was calculated by differencing the weights of empty beakers and the weights of respective beaker
with remaining total solids after removal of water.
Total Dissolved Solids (TDS) : 50 ml water samples (from each tube-well) was filtered (Whatman-42 filter paper) and those filtered
water were taken into 100 ml beakers. These were placed into oven dry machine for 24 hours at 105OC. Total dissolved solids was
calculated by differencing the weights of empty beakers and the weights of respective beaker with remaining total solids after removal
of water.
Total Suspended Solids (TSS) : The values of TSS of those samples were recorded by subtracting the respective TDS value from
respective TS value.
-- Chemical analysis
Acidity/Alkalinity (pH) : The pH values were determined by using microprocessor pH meter (HANNA, pH 211) in our laboratory.
Arsenic (As) : The amount of arsenic in each sample was determined by atomic absorption flame spectrometer (Shimadzu, AA-7000)
in laboratory of Asia Arsenic Network, Jessore, Bangladesh.
Sample ID About depth of tube-well
(in meter)
Installation duration
(in year)
S-01 36.50 02
S-02 30.50 07
S-03 25.90 16
S-04 30.50 25
S-05 48.80 01
S-06 36.50 01
S-07 30.50 35
S-08 30.50 08
S-09 25.90 10
S-10 35.05 01
S-11 54.90 05
S-12 30.50 20
S-13 25.90 17
S-14 35.05 05
S-15 35.05 25
S-16 45.70 08
S-17 35.05 01
S-18 30.50 07
S-19 36.50 10
S-20 35.05 15
S-21 16.80 02
S-22 45.70 01
S-23 30.50 05
S-24 39.60 01
S-25 30.50 25
S-26 16.80 01
S-27 24.40 01
S-28 30.50 03
S-29 30.50 10
S-30 50.30 02
International Journal of Scientific and Research Publications, Volume 9, Issue 6, June 2019 367
ISSN 2250-3153
http://dx.doi.org/10.29322/IJSRP.9.06.2019.p9056 www.ijsrp.org
Bicarbonates (HCO3−
) and Carbonates (CO32−
) : The bicarbonate and carbonate contents were determined by titrimetric method
with standardized 0.086N H2SO4 solution in our laboratory as mentioned by Jackson (1973).
Calcium (Ca2+
) : The calcium contents were determined by titrimetric method with standardized 0.01N EDTA solution as mentioned
by Schwartzenbach et al. (1946).
Chloride (Cl−) : The contents of chloride were determined by titrimetric method with standardized 0.05N AgNO3
− solution in our
laboratory as mentioned by Jackson (1973).
Dissolved Oxygen (DO) : Dissolved oxygen in the samples was measured by digital DO meter (HANNA, HI98193) in our laboratory.
Electrical Conductivity (EC) : The electrical conductivity values were determined by using conductivity meter (HANNA, EC 214) in
our laboratory.
Iron (Fe) : The iron contents were determined by colorimetric method with spectrophotometer (APEL, PD–303 UV) at 510 nm
wavelength.
Magnesium (Mg2+
) : The calcium + magnesium contents were determined by titrimetric method with standardized 0.01N EDTA
solution as mentioned by Schwartzenbach et al. (1946). Then, the magnesium contents were determined by subtracting the calcium
contents of each sample from the calcium + magnesium contents of the respective samples.
Manganese (Mn) : The manganese contents were determined by Atomic absorption flame spectrometer (Shimadzu, AA-7000) in
laboratory of Asia Arsenic Network, Jessore, Bangladesh.
Nitrogen (N) :
Ammonium (NH4+) The ammonium contents of the water samples are determined by distillation (kjeldahl) method.
Nitrate (NO3−) + Nitrite (NO2
−) The ammonium + nitrate + nitrite contents were determined by distillation (kjeldahl) method with
davarda’s alloy (reducing agent). Then, the nitrate + nitrite contents were determined by subtracting the ammonium contents of each
sample from the ammonium + nitrate + nitrite contents of the respective samples.
Phosphate (PO43–
) : The phosphate contents were determined by colorimetric (molybdophosphoric blue color) method with
spectrophotometer (APEL, PD–303 UV) at 882 nm wavelength as mentioned by Jackson (1967).
Potassium (K+) : The potassium contents were determined by flame photometer (JENWAY, PFP7).
Sodium (Na+) : The sodium contents were determined by flame photometer (JENWAY, PFP7).
Sulfate (SO43–
) : Sulfate contents were determined by turbidimetric method with spectrophotometer (APEL, PD–303UV) at 420 nm
wavelength as mentioned by Hunt (1980).
-- Bacteriological analysis
Spread plate technique is performed for observing the presence or absence of coliform bacteria in the water samples (APHA, 2003).
The eosin methylene blue agar (EMB) is used a selective and differential medium to observe the presence of coliform bacteria (gram-
negative bacteria). This experiment is conducted with two replications for each sample.
Total coliforms : Each 1 ml of water (from each sample) was transferred by the sterilized pipette and spread on the EMB agar plates.
All the plates were inoculated at 37°C for 24 hours. The agar plates were transferred to laminar air flow chamber. The red or pink
colored colonies on the agar plates indicated the presence of total coliforms in the respective water samples.
Fecal coliform (Escherichia coli bacteria) : Each 1 ml of water (from each sample) was transferred by the sterilized pipette and spread
on the EMB agar plates. All the plates were inoculated at 44.5°C for 24 hours. The agar plates were transferred to laminar air flow
chamber. The blue black with green metallic sheen colored colonies on the agar plates indicated the presence of E. coli (fecal
coliforms) in the respective water samples.
All analyses were conducted with 3 replications for each sample.
III. RESULTS AND DISCUSSIONS
The findings of the experiment are mentioned with relative discussions in the below.
---- Physical parameters
The physical parameters for the experiment are color, odor, taste, temperature, total solids (TS), total dissolved solids (TDS) and total
suspended solids (TSS). Summary of these findings are shown in Table 3.
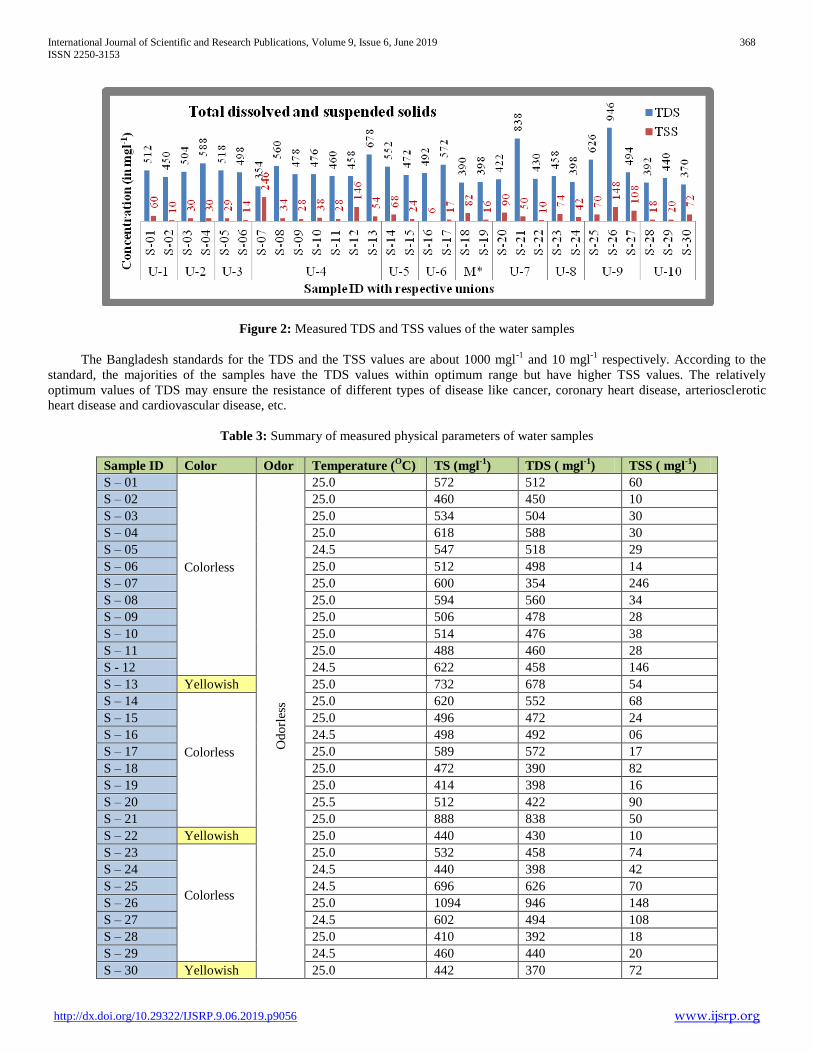
Color
It is found that, 3 samples (S-13, S-22, and S-30) among 30 are relatively yellowish, shown in Table 3. It may cause due to excessive
amount of iron (Fe) as found in their determination.
Odor and Taste The tube-well waters collected from various locations have no bad odor and its tastes are favorable in all samples, shown in Table 3.
Temperature
The measured temperatures of the water samples range in 24-26OC at the time of collection, shown in Table 3. This range shows that
the found temperatures of water samples are valid under standard value for drinking water which is recommended by WHO and
Bangladesh standard (ECR, 1997).
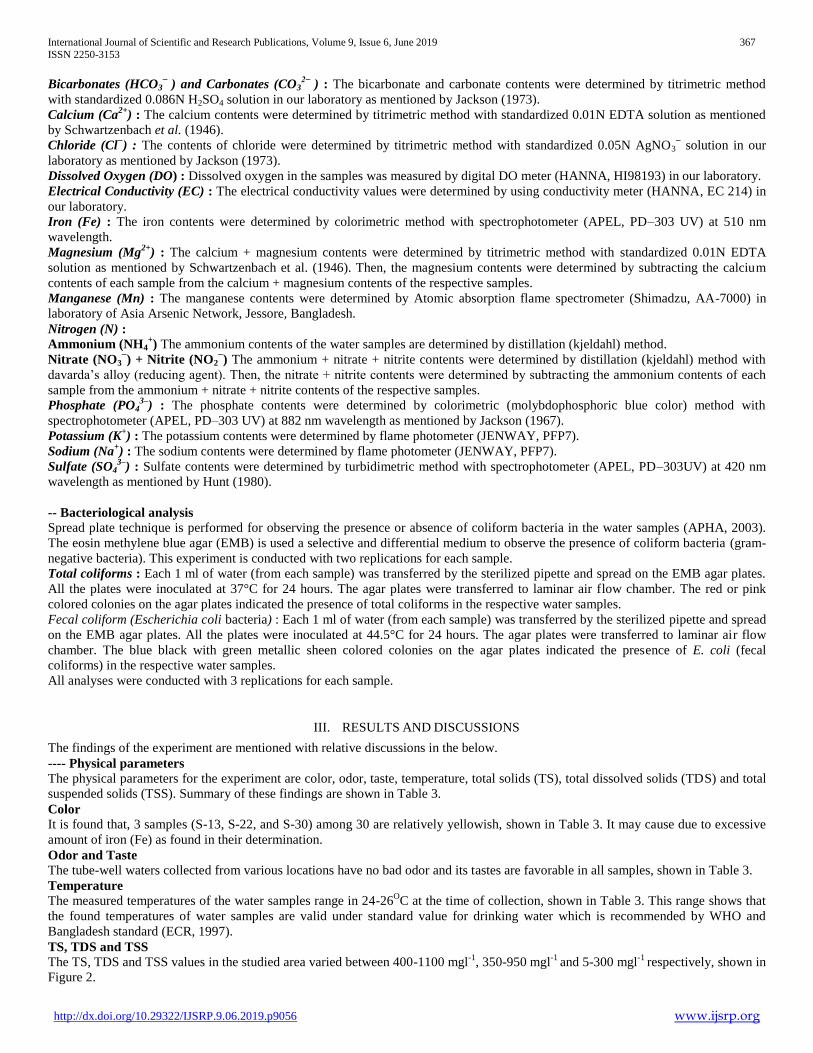
TS, TDS and TSS
The TS, TDS and TSS values in the studied area varied between 400-1100 mgl-1
, 350-950 mgl-1
and 5-300 mgl-1
respectively, shown in
Figure 2.
International Journal of Scientific and Research Publications, Volume 9, Issue 6, June 2019 368
ISSN 2250-3153
http://dx.doi.org/10.29322/IJSRP.9.06.2019.p9056 www.ijsrp.org
Figure 2: Measured TDS and TSS values of the water samples
The Bangladesh standards for the TDS and the TSS values are about 1000 mgl-1
and 10 mgl-1
respectively. According to the
standard, the majorities of the samples have the TDS values within optimum range but have higher TSS values. The relatively
optimum values of TDS may ensure the resistance of different types of disease like cancer, coronary heart disease, arteriosclerotic
heart disease and cardiovascular disease, etc.
Table 3: Summary of measured physical parameters of water samples
Sample ID Color Odor Temperature (O
C) TS (mgl-1
) TDS ( mgl-1
) TSS ( mgl-1
)
S – 01
Colorless
Od
orl
ess
25.0 572 512 60
S – 02 25.0 460 450 10
S – 03 25.0 534 504 30
S – 04 25.0 618 588 30
S – 05 24.5 547 518 29
S – 06 25.0 512 498 14
S – 07 25.0 600 354 246
S – 08 25.0 594 560 34
S – 09 25.0 506 478 28
S – 10 25.0 514 476 38
S – 11 25.0 488 460 28
S - 12 24.5 622 458 146
S – 13 Yellowish 25.0 732 678 54
S – 14
Colorless
25.0 620 552 68
S – 15 25.0 496 472 24
S – 16 24.5 498 492 06
S – 17 25.0 589 572 17
S – 18 25.0 472 390 82
S – 19 25.0 414 398 16
S – 20 25.5 512 422 90
S – 21 25.0 888 838 50
S – 22 Yellowish 25.0 440 430 10
S – 23
Colorless
25.0 532 458 74
S – 24 24.5 440 398 42
S – 25 24.5 696 626 70
S – 26 25.0 1094 946 148
S – 27 24.5 602 494 108
S – 28 25.0 410 392 18
S – 29 24.5 460 440 20
S – 30 Yellowish 25.0 442 370 72
International Journal of Scientific and Research Publications, Volume 9, Issue 6, June 2019 369
ISSN 2250-3153
http://dx.doi.org/10.29322/IJSRP.9.06.2019.p9056 www.ijsrp.org
---- Chemical parameters
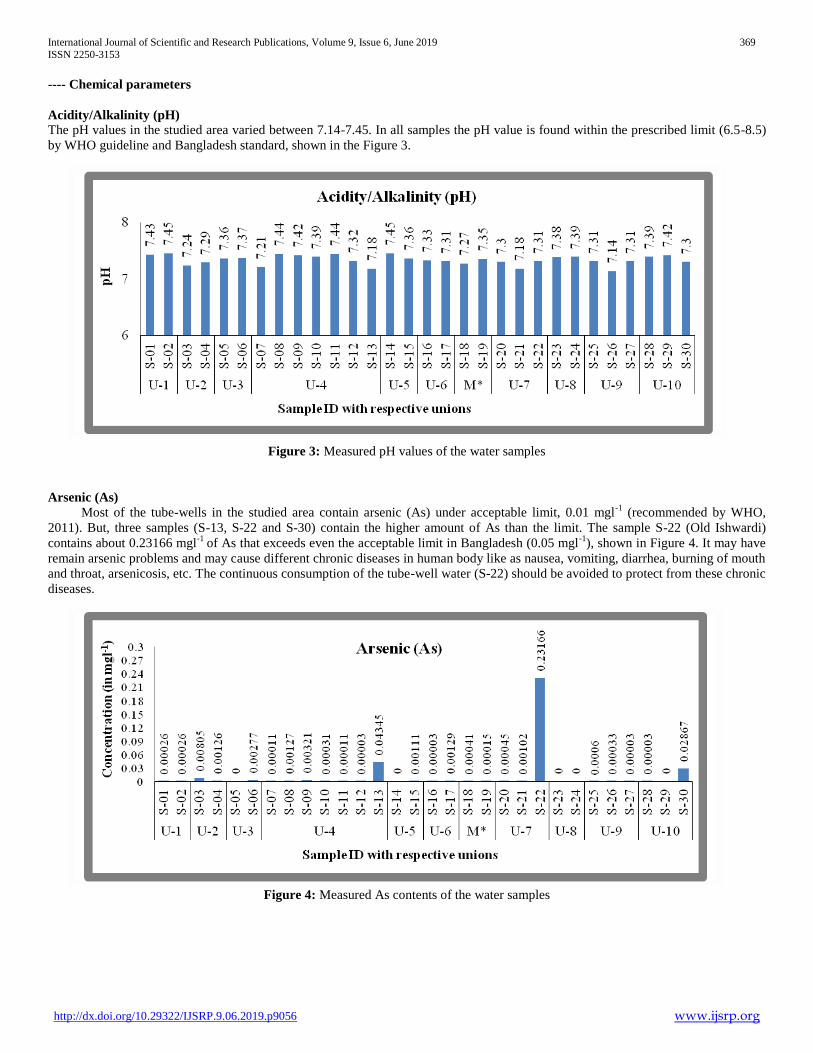
Acidity/Alkalinity (pH) The pH values in the studied area varied between 7.14-7.45. In all samples the pH value is found within the prescribed limit (6.5-8.5)
by WHO guideline and Bangladesh standard, shown in the Figure 3.
Figure 3: Measured pH values of the water samples
Arsenic (As)
Most of the tube-wells in the studied area contain arsenic (As) under acceptable limit, 0.01 mgl-1
(recommended by WHO,
2011). But, three samples (S-13, S-22 and S-30) contain the higher amount of As than the limit. The sample S-22 (Old Ishwardi)
contains about 0.23166 mgl-1
of As that exceeds even the acceptable limit in Bangladesh (0.05 mgl-1
), shown in Figure 4. It may have
remain arsenic problems and may cause different chronic diseases in human body like as nausea, vomiting, diarrhea, burning of mouth
and throat, arsenicosis, etc. The continuous consumption of the tube-well water (S-22) should be avoided to protect from these chronic
diseases.
Figure 4: Measured As contents of the water samples
International Journal of Scientific and Research Publications, Volume 9, Issue 6, June 2019 370
ISSN 2250-3153
http://dx.doi.org/10.29322/IJSRP.9.06.2019.p9056 www.ijsrp.org
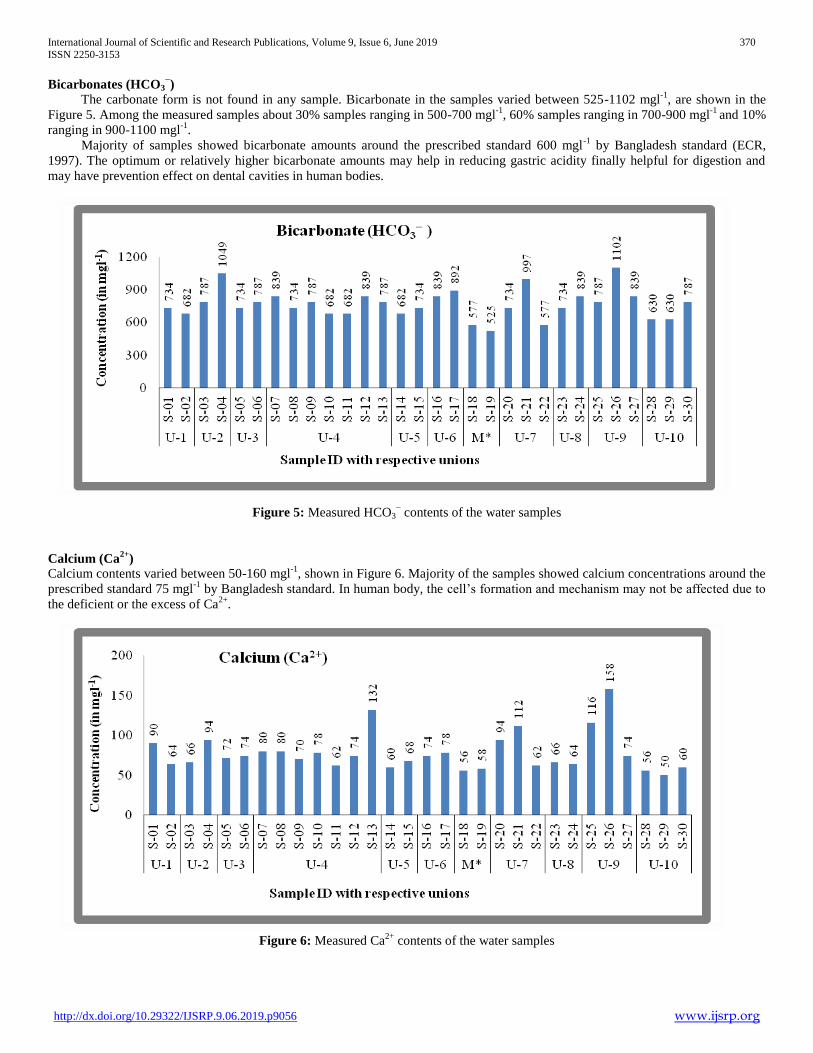
Bicarbonates (HCO3−)
The carbonate form is not found in any sample. Bicarbonate in the samples varied between 525-1102 mgl-1
, are shown in the
Figure 5. Among the measured samples about 30% samples ranging in 500-700 mgl-1
, 60% samples ranging in 700-900 mgl-1
and 10%
ranging in 900-1100 mgl-1
.
Majority of samples showed bicarbonate amounts around the prescribed standard 600 mgl-1
by Bangladesh standard (ECR,
1997). The optimum or relatively higher bicarbonate amounts may help in reducing gastric acidity finally helpful for digestion and
may have prevention effect on dental cavities in human bodies.
Figure 5: Measured HCO3− contents of the water samples
Calcium (Ca2+
) Calcium contents varied between 50-160 mgl
-1, shown in Figure 6. Majority of the samples showed calcium concentrations around the
prescribed standard 75 mgl-1
by Bangladesh standard. In human body, the cell’s formation and mechanism may not be affected due to
the deficient or the excess of Ca2+
.
Figure 6: Measured Ca2+
contents of the water samples
International Journal of Scientific and Research Publications, Volume 9, Issue 6, June 2019 371
ISSN 2250-3153
http://dx.doi.org/10.29322/IJSRP.9.06.2019.p9056 www.ijsrp.org
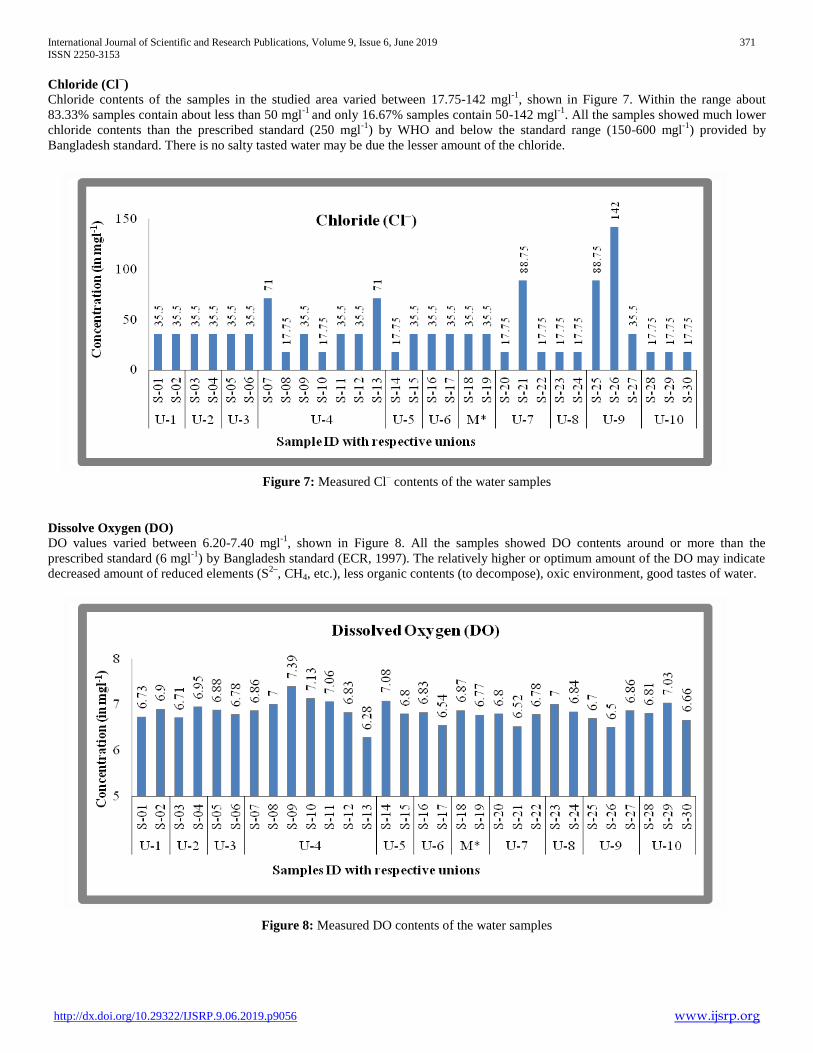
Chloride (Cl−)
Chloride contents of the samples in the studied area varied between 17.75-142 mgl-1
, shown in Figure 7. Within the range about
83.33% samples contain about less than 50 mgl-1
and only 16.67% samples contain 50-142 mgl-1
. All the samples showed much lower
chloride contents than the prescribed standard (250 mgl-1
) by WHO and below the standard range (150-600 mgl-1
) provided by
Bangladesh standard. There is no salty tasted water may be due the lesser amount of the chloride.
Figure 7: Measured Cl– contents of the water samples
Dissolve Oxygen (DO) DO values varied between 6.20-7.40 mgl
-1, shown in Figure 8. All the samples showed DO contents around or more than the
prescribed standard (6 mgl-1
) by Bangladesh standard (ECR, 1997). The relatively higher or optimum amount of the DO may indicate
decreased amount of reduced elements (S2–
, CH4, etc.), less organic contents (to decompose), oxic environment, good tastes of water.
Figure 8: Measured DO contents of the water samples
International Journal of Scientific and Research Publications, Volume 9, Issue 6, June 2019 372
ISSN 2250-3153
http://dx.doi.org/10.29322/IJSRP.9.06.2019.p9056 www.ijsrp.org
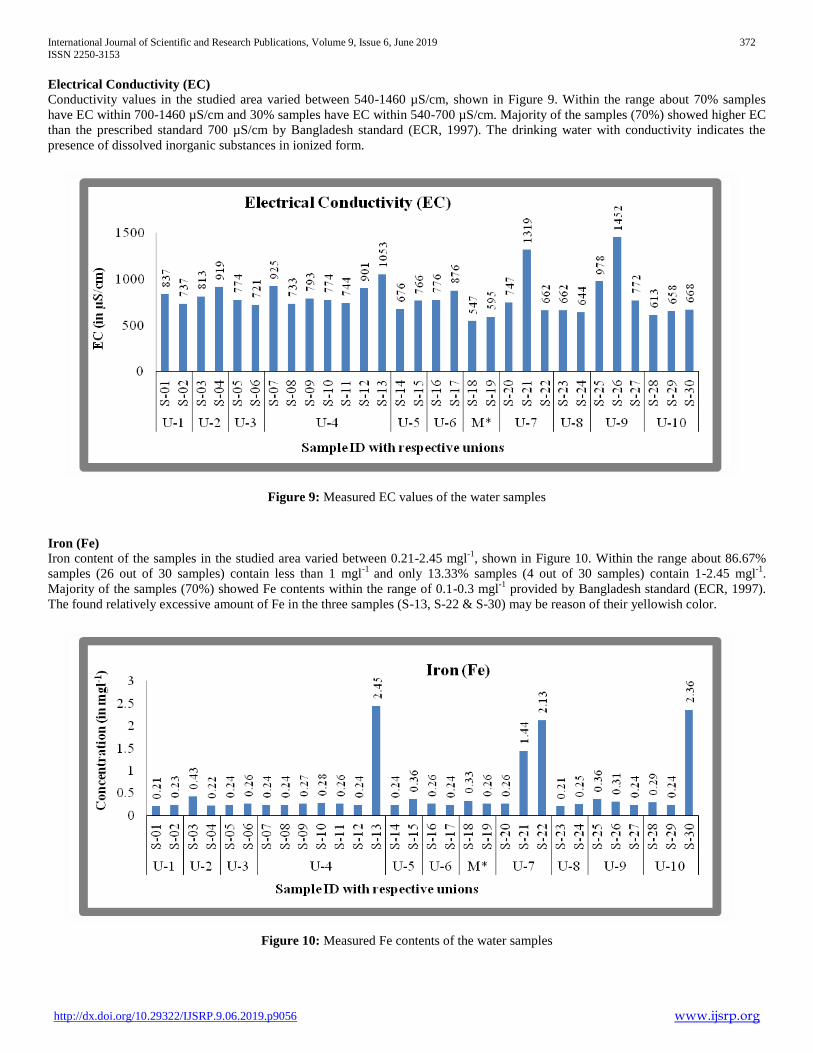
Electrical Conductivity (EC)
Conductivity values in the studied area varied between 540-1460 µS/cm, shown in Figure 9. Within the range about 70% samples
have EC within 700-1460 µS/cm and 30% samples have EC within 540-700 µS/cm. Majority of the samples (70%) showed higher EC
than the prescribed standard 700 µS/cm by Bangladesh standard (ECR, 1997). The drinking water with conductivity indicates the
presence of dissolved inorganic substances in ionized form.
Figure 9: Measured EC values of the water samples
Iron (Fe)
Iron content of the samples in the studied area varied between 0.21-2.45 mgl-1
, shown in Figure 10. Within the range about 86.67%
samples (26 out of 30 samples) contain less than 1 mgl-1
and only 13.33% samples (4 out of 30 samples) contain 1-2.45 mgl-1
.
Majority of the samples (70%) showed Fe contents within the range of 0.1-0.3 mgl-1
provided by Bangladesh standard (ECR, 1997).
The found relatively excessive amount of Fe in the three samples (S-13, S-22 & S-30) may be reason of their yellowish color.
Figure 10: Measured Fe contents of the water samples
International Journal of Scientific and Research Publications, Volume 9, Issue 6, June 2019 373
ISSN 2250-3153
http://dx.doi.org/10.29322/IJSRP.9.06.2019.p9056 www.ijsrp.org
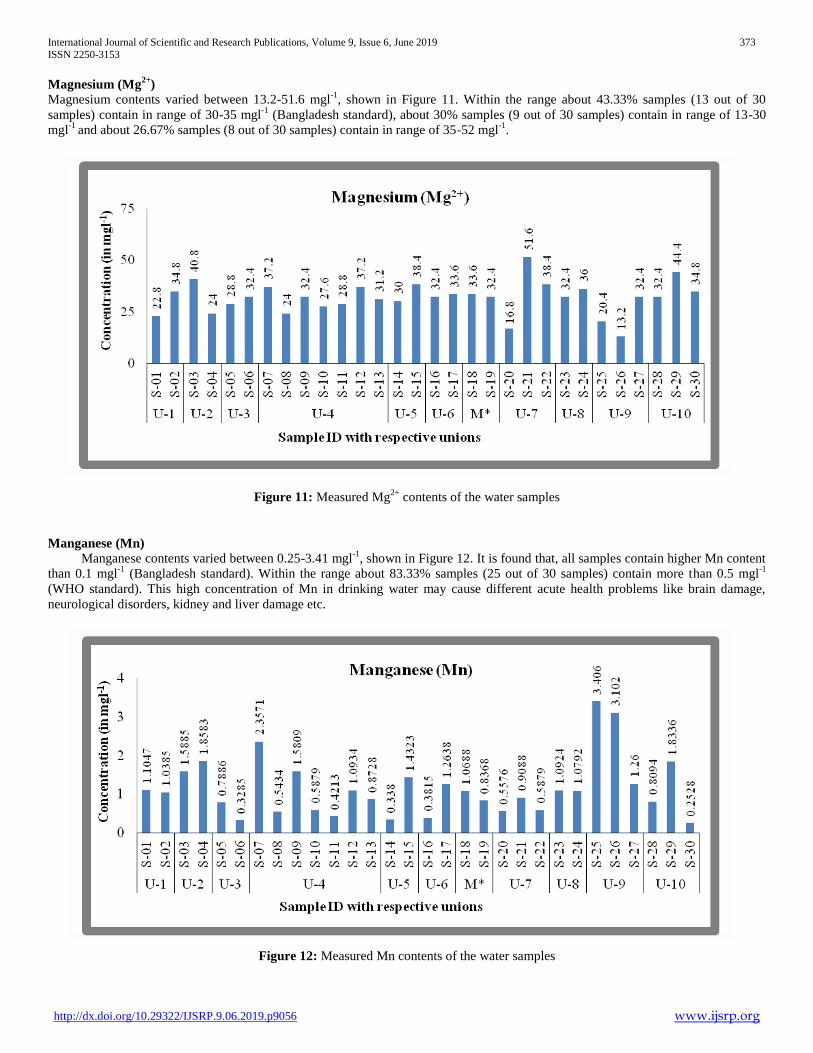
Magnesium (Mg2+
) Magnesium contents varied between 13.2-51.6 mgl
-1, shown in Figure 11. Within the range about 43.33% samples (13 out of 30
samples) contain in range of 30-35 mgl-1
(Bangladesh standard), about 30% samples (9 out of 30 samples) contain in range of 13-30
mgl-1
and about 26.67% samples (8 out of 30 samples) contain in range of 35-52 mgl-1
.
Figure 11: Measured Mg2+
contents of the water samples
Manganese (Mn)
Manganese contents varied between 0.25-3.41 mgl-1
, shown in Figure 12. It is found that, all samples contain higher Mn content
than 0.1 mgl-1
(Bangladesh standard). Within the range about 83.33% samples (25 out of 30 samples) contain more than 0.5 mgl-1
(WHO standard). This high concentration of Mn in drinking water may cause different acute health problems like brain damage,
neurological disorders, kidney and liver damage etc.
Figure 12: Measured Mn contents of the water samples
International Journal of Scientific and Research Publications, Volume 9, Issue 6, June 2019 374
ISSN 2250-3153
http://dx.doi.org/10.29322/IJSRP.9.06.2019.p9056 www.ijsrp.org
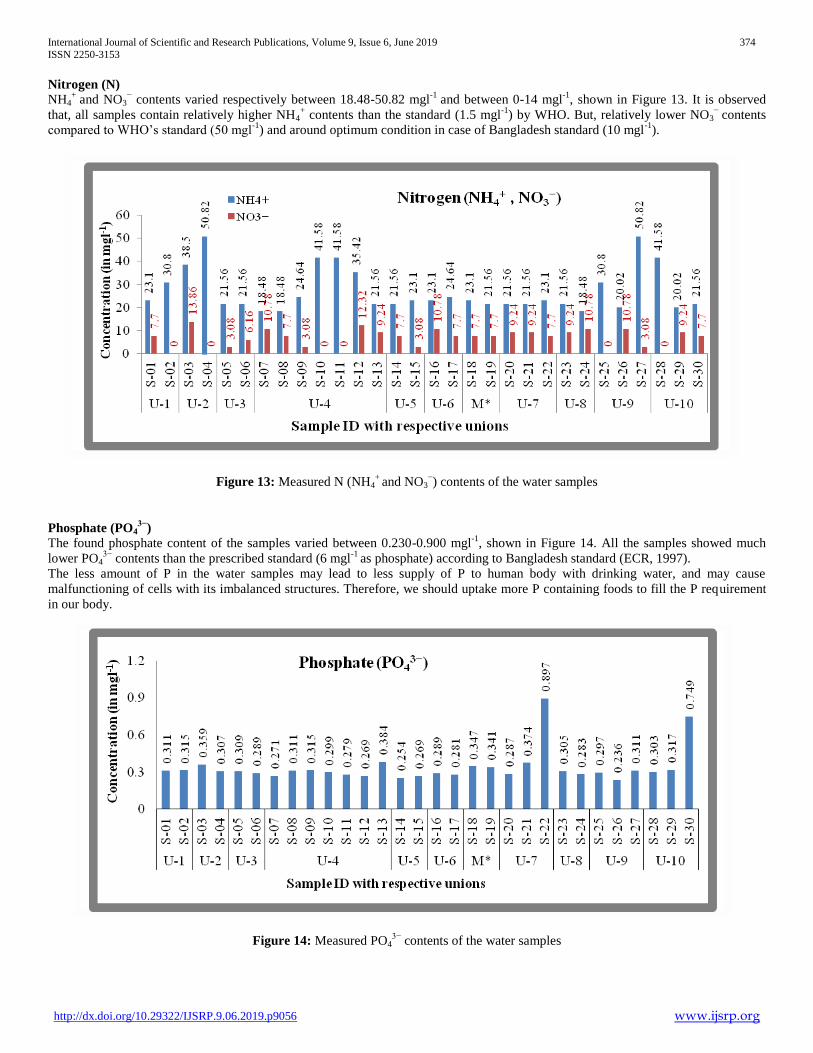
Nitrogen (N)
NH4+
and NO3− contents varied respectively between 18.48-50.82 mgl
-1 and between 0-14 mgl
-1, shown in Figure 13. It is observed
that, all samples contain relatively higher NH4+ contents than the standard (1.5 mgl
-1) by WHO. But, relatively lower NO3
− contents
compared to WHO’s standard (50 mgl-1
) and around optimum condition in case of Bangladesh standard (10 mgl-1
).
Figure 13: Measured N (NH4+
and NO3−) contents of the water samples
Phosphate (PO43−
)
The found phosphate content of the samples varied between 0.230-0.900 mgl-1
, shown in Figure 14. All the samples showed much
lower PO43−
contents than the prescribed standard (6 mgl-1
as phosphate) according to Bangladesh standard (ECR, 1997).
The less amount of P in the water samples may lead to less supply of P to human body with drinking water, and may cause
malfunctioning of cells with its imbalanced structures. Therefore, we should uptake more P containing foods to fill the P requirement
in our body.
Figure 14: Measured PO43−
contents of the water samples
International Journal of Scientific and Research Publications, Volume 9, Issue 6, June 2019 375
ISSN 2250-3153
http://dx.doi.org/10.29322/IJSRP.9.06.2019.p9056 www.ijsrp.org
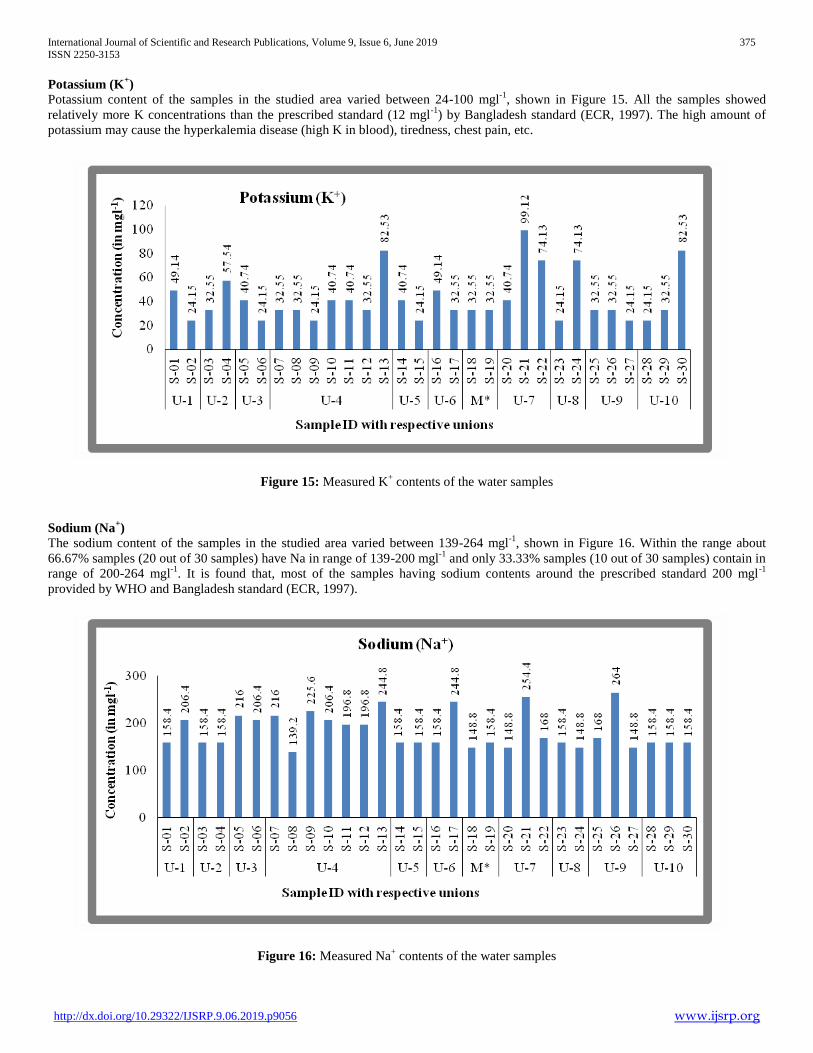
Potassium (K+)
Potassium content of the samples in the studied area varied between 24-100 mgl-1
, shown in Figure 15. All the samples showed
relatively more K concentrations than the prescribed standard (12 mgl-1
) by Bangladesh standard (ECR, 1997). The high amount of
potassium may cause the hyperkalemia disease (high K in blood), tiredness, chest pain, etc.
Figure 15: Measured K+ contents of the water samples
Sodium (Na+)
The sodium content of the samples in the studied area varied between 139-264 mgl-1
, shown in Figure 16. Within the range about
66.67% samples (20 out of 30 samples) have Na in range of 139-200 mgl-1
and only 33.33% samples (10 out of 30 samples) contain in
range of 200-264 mgl-1
. It is found that, most of the samples having sodium contents around the prescribed standard 200 mgl-1
provided by WHO and Bangladesh standard (ECR, 1997).
Figure 16: Measured Na+ contents of the water samples
International Journal of Scientific and Research Publications, Volume 9, Issue 6, June 2019 376
ISSN 2250-3153
http://dx.doi.org/10.29322/IJSRP.9.06.2019.p9056 www.ijsrp.org
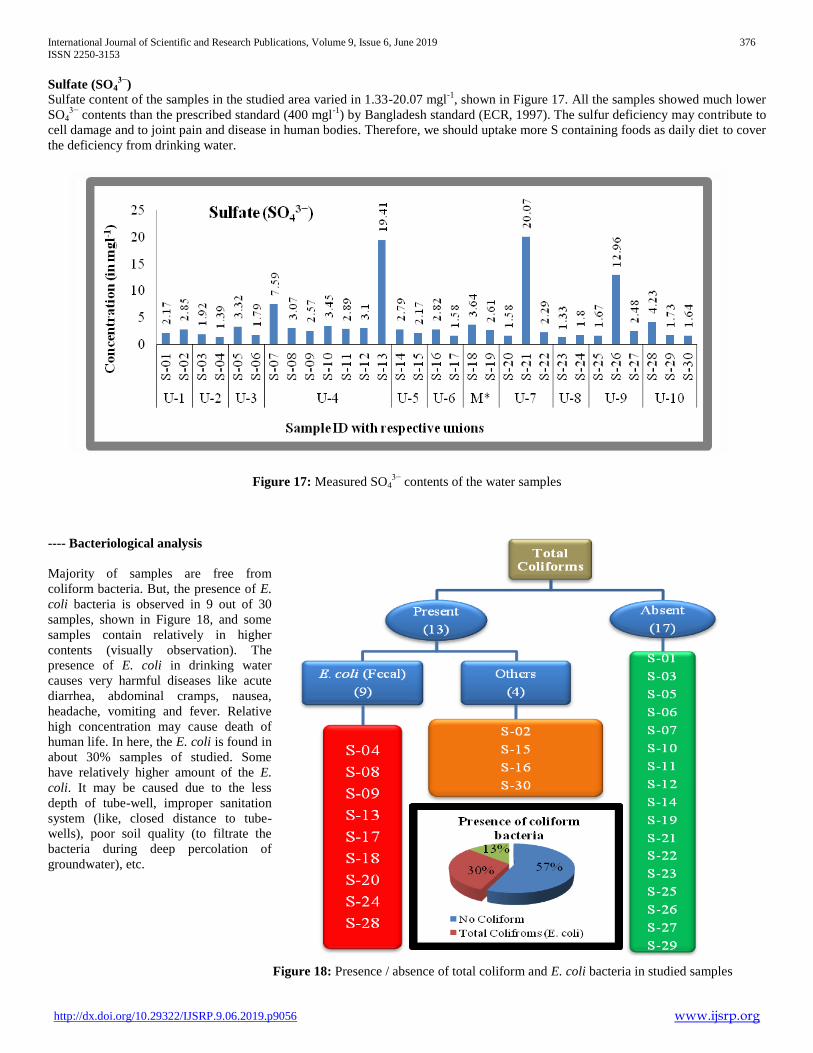
Sulfate (SO43−
) Sulfate content of the samples in the studied area varied in 1.33-20.07 mgl
-1, shown in Figure 17. All the samples showed much lower
SO43−
contents than the prescribed standard (400 mgl-1
) by Bangladesh standard (ECR, 1997). The sulfur deficiency may contribute to
cell damage and to joint pain and disease in human bodies. Therefore, we should uptake more S containing foods as daily diet to cover
the deficiency from drinking water.
Figure 17: Measured SO43−
contents of the water samples
---- Bacteriological analysis
Majority of samples are free from
coliform bacteria. But, the presence of E.
coli bacteria is observed in 9 out of 30
samples, shown in Figure 18, and some
samples contain relatively in higher
contents (visually observation). The
presence of E. coli in drinking water
causes very harmful diseases like acute
diarrhea, abdominal cramps, nausea,
headache, vomiting and fever. Relative
high concentration may cause death of
human life. In here, the E. coli is found in
about 30% samples of studied. Some
have relatively higher amount of the E.
coli. It may be caused due to the less
depth of tube-well, improper sanitation
system (like, closed distance to tube-
wells), poor soil quality (to filtrate the
bacteria during deep percolation of
groundwater), etc.
Figure 18: Presence / absence of total coliform and E. coli bacteria in studied samples
International Journal of Scientific and Research Publications, Volume 9, Issue 6, June 2019 377
ISSN 2250-3153
http://dx.doi.org/10.29322/IJSRP.9.06.2019.p9056 www.ijsrp.org
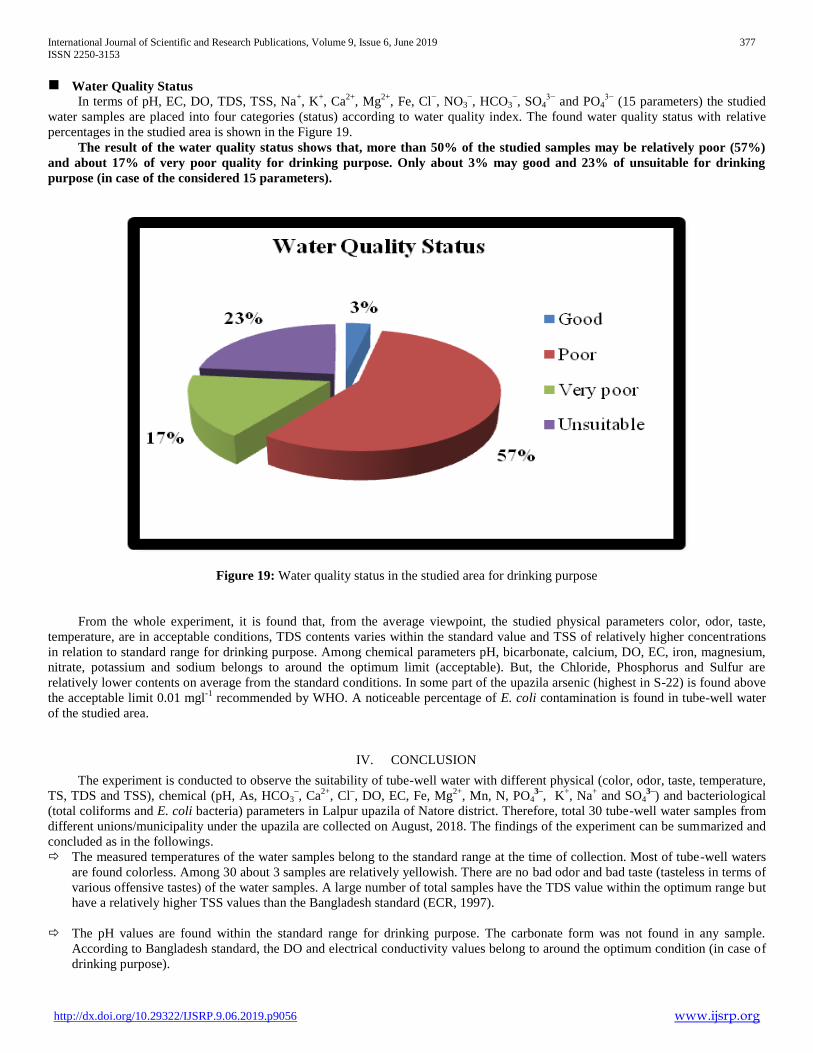
Water Quality Status
In terms of pH, EC, DO, TDS, TSS, Na+, K
+, Ca
2+, Mg
2+, Fe, Cl
−, NO3
−, HCO3
−, SO4
3− and PO4
3− (15 parameters) the studied
water samples are placed into four categories (status) according to water quality index. The found water quality status with relative
percentages in the studied area is shown in the Figure 19.
The result of the water quality status shows that, more than 50% of the studied samples may be relatively poor (57%)
and about 17% of very poor quality for drinking purpose. Only about 3% may good and 23% of unsuitable for drinking
purpose (in case of the considered 15 parameters).
Figure 19: Water quality status in the studied area for drinking purpose
From the whole experiment, it is found that, from the average viewpoint, the studied physical parameters color, odor, taste,
temperature, are in acceptable conditions, TDS contents varies within the standard value and TSS of relatively higher concentrations
in relation to standard range for drinking purpose. Among chemical parameters pH, bicarbonate, calcium, DO, EC, iron, magnesium,
nitrate, potassium and sodium belongs to around the optimum limit (acceptable). But, the Chloride, Phosphorus and Sulfur are
relatively lower contents on average from the standard conditions. In some part of the upazila arsenic (highest in S-22) is found above
the acceptable limit 0.01 mgl-1
recommended by WHO. A noticeable percentage of E. coli contamination is found in tube-well water
of the studied area.
IV. CONCLUSION
The experiment is conducted to observe the suitability of tube-well water with different physical (color, odor, taste, temperature,
TS, TDS and TSS), chemical (pH, As, HCO3–, Ca
2+, Cl
–, DO, EC, Fe, Mg
2+, Mn, N, PO4
3–, K
+, Na
+ and SO4
3–) and bacteriological
(total coliforms and E. coli bacteria) parameters in Lalpur upazila of Natore district. Therefore, total 30 tube-well water samples from
different unions/municipality under the upazila are collected on August, 2018. The findings of the experiment can be summarized and
concluded as in the followings.
The measured temperatures of the water samples belong to the standard range at the time of collection. Most of tube-well waters
are found colorless. Among 30 about 3 samples are relatively yellowish. There are no bad odor and bad taste (tasteless in terms of
various offensive tastes) of the water samples. A large number of total samples have the TDS value within the optimum range but
have a relatively higher TSS values than the Bangladesh standard (ECR, 1997).
The pH values are found within the standard range for drinking purpose. The carbonate form was not found in any sample.
According to Bangladesh standard, the DO and electrical conductivity values belong to around the optimum condition (in case of
drinking purpose).
International Journal of Scientific and Research Publications, Volume 9, Issue 6, June 2019 378
ISSN 2250-3153
http://dx.doi.org/10.29322/IJSRP.9.06.2019.p9056 www.ijsrp.org
Most samples don’t contain arsenic in such amount to cause different acute disease (problems). But, from old Ishwardi (under the
Lalpur upazila), a water sample show much higher concentration of As than the acceptable limit according to WHO guidelines
and Bangladesh standard (ECR, 1997). Most of the samples have optimum and relatively higher concentration of bicarbonate with
reference to Bangladesh standard. About 3-4 samples (S-13, S-21, S-25, S-26) contain relatively higher amount of calcium than
that of Bangladesh standard. Chloride contents are much lower than the standard. About 70% of the studied samples have iron
within the standard range (ECR, 1997), but S-13, S-21, S-22 and S-30 contain higher iron content. Magnesium ions remain in
around optimum concentrations in the studied water samples. Most of the samples contain much higher content of manganese
than the acceptable limit by Bangladesh standard (ECR, 1997) and WHO guidelines. Relatively higher amount of NH4+
and lower
amount of NO3− are found in these water samples from the standard values, it may be caused due to the depletion of dissolved
oxygen after pumping from tube-wells. Much lower amount of phosphates is found in all samples in relation to the standard
value. The potassium ion is found in higher concentrations in the different samples. Sodium ion has in around optimum range in
these water samples. There is much lower concentration of sulfur is found in all the water samples.
About 57% of studied samples don’t contain coliform bacteria. But, 30% of E. coli and 13% of other coliform bacteria in respect
to total samples are found.
In case of pH, EC, DO, TDS, TSS, Na+, K
+, Ca
2+, Mg
2+, Fe, Cl
−, NO3
−, HCO3
−, SO4
3− and PO4
3− (15 parameters) more than 50% of the
studied samples may be relatively poor (58%) and about 17% are of very poor quality for drinking purpose.
It should be used the relatively deep tube-well water for drinking purpose in the region in terms of coliform (E. coli) bacteria
problems. Otherwise, the various fetal diseases may occur acutely for the consumption of the contaminated water. Even, it may cause
the death of human beings. Besides, it should a further experiment for As at the old ishwardi (part of Lalpur upazila) to identify the
levels As problems for human life and should be stopped the use of those tube-wells water. It can be found other arsenic-free deep
aquifers for human consumption in this place.
There are some limitations to conduct the experiment completely and properly. Some important limitations are –
1. All parameters (trace and toxic elements like Cu, Zn, Pd, Cd, etc.) are not studied in this analysis.
2. Limited facilities in laboratories to conduct the experiment properly to get the more accurate results in case of some elements.
3. The nitrate determination is delayed about 5 days from the prescribed holding time due to over loaded pressure in
laboratories through poor facilities.
ACKNOWLEDGMENT
First of all, I would like to express gratefulness to Almighty ALLAH who has enabled me to accomplish this thesis work and to
complete this paper successfully in due time.
It is a genuine pleasure to express my deep sense of thanks and gratitude to my honorable supervisor Khandoker Qudrata Kibria,
Professor, Soil, Water and Environment Discipline, Khulna University, for his valuable comments, enthusiastic guideline and co-
operation at all stages of this work. I am also grateful to him for giving his most valuable time to me and for his sincerity. I wish to
express my sincere thanks to Dr. Shaikh Motasim Billah, Professor, Head of Soil, Water and Environment Discipline, Khulna
University, for providing me with all the necessary facilities for this project work. Special thanks are extended to Md. Sanaul Islam,
Professor; Dr. Jagadish Chandra Joardar, Associate Professor and Md. Tareq Bin Salam, Lecturer, faculty members of Soil, Water and
Environment Discipline, Khulna University, for their constructive guidance and valuable suggestions throughout the period of study.
Special appreciation goes to my brothers Md. Rafi Nawaz Himel, Md. Shamim Hossen and Md. Akash Ahmed Shovon for their great
co-operations during sampling for this work. I am acknowledging to my friends Md. Helal Uddin and S.M. Tanzim Hossen along with
Sk. Md. Abdullah, Assistant Registrar (Lab); Md. Mahfuzur Rahman, Lab attendant; and Sabina Yeasmin, Lab attendant, Soil, Water
and Environment Discipline, Khulna University for helping me during my works in laboratory. A special gratefulness goes to Md.
Abu Shamim Khan, Chemist, PEER Project, Asia Arsenic Network, Pulerhat, Jessore, Bangladesh, for supporting to determine arsenic
and manganese contents in the all tube-well water samples.
Finally, but most importantly the praise and thanks must go to my beloved parents for their nonreturnable support for completion
of my higher education and without whose blessing this work would not have been possible.
International Journal of Scientific and Research Publications, Volume 9, Issue 6, June 2019 379
ISSN 2250-3153
http://dx.doi.org/10.29322/IJSRP.9.06.2019.p9056 www.ijsrp.org
REFERENCES
[1] Chandrasekar, T.; Sabarathinam, C.; Rajendiran, T.; Nepolian, M. and Adithya, V.S. 2014. Evaluation of drinking water quality index (DWQI) and its seasonal variations in hard rock aquifers of Madurai district, Tamilnadu. International Journal of Advanced Geosciences, 2(2): 48-52.
[2] Chowdhury, M.M.H.; Kubra, K. and Amin, M.R. 2014. Microbiological Water Pollution in Chittagong Hill Tracts in Bangladesh. Journal of Medical Sciences and Public Health, 2(2): 37-42.
[3] Emch, M.; Yunus, M.; Escamilla, V.; Feldacker, C. and Ali, M. 2010. Local population and regional environmental drivers of cholera in Bangladesh. Environmental Health, 9(1): 1-12.
[4] Gleeson, T.; Wada, Y.; Bierkens, M.F.P. and van-Beek, L.P.H. 2012. Water balance of global aquifers revealed by groundwater footprint. Nature, 488(7410): 197-200.
[5] Govindarajan, M. and Senthilnathan, T. 2014. Groundwater quality and its health impact analysis in an industrial area. International Journal of Current Microbiology and Applied Sciences, 3(7): 1028-1034.
[6] Hunt, J. 1980. Determination of total sulfur in small amounts of plant material. Analyst, 105: 83-53.
[7] Jackson, M.L. 1967. Soil Chemical Analysis. 2nd edition. Prentice Hall of India Private Limited, New Delhi.
[8] Jackson, M.L. 1973. Soil Chemical Analysis: Advanced Course. Prentice Hall of India Private Limited, New Delhi.
[9] Moe, C.L. and Rheingans, R.D. 2006. Global Challenges in Water, Sanitation and Health. Journal of Water and Health, 4(1): 41-57.
[10] Moyo, N.A.G. 2013. An analysis of the chemical and microbiological quality of ground water from boreholes and shallow wells in Zimbabwe. Physics and Chemistry of the Earth, 66: 27-32.
[11] Murugesan, V.; Krishnaraj, S.; Vijayaragavan, K.; Ganthi, R.R.; Sabarathinam, C.; Anandhan, P.; Manivannan, R. and Vasudevan, S. 2010. Application of water quality index for groundwater quality assessment: Thirumanimuttar sub-basin, Tamilnadu, India. In: Environmental Monitoring and Assessment. Springer, 171(1-4): 595-609.
[12] Rahmanian, N.; Ali, S.H.B.; Homayoonfard, M.; Ali, N.J.; Rehan, M.; Sadef, Y. and Nizami, A.S. 2015. Analysis of Physicochemical Parameters to Evaluate the Drinking Water Quality in the State of Perak, Malaysia. BioMed Research International, Hindawi Publishing Corporation, Article ID 716125. 2015:1-10.
[13] Schwarzenbach, G.; Biedermann, W. and Bangerter, F. 1946. New, Simple Titration Methods for Determining the Hardness of Water. Helvetica Chimmica Acta, 29: 811-829.
[14] Streatfield, K.; Persson, L.A.; Chowdhury, H.R. and Saha, K.K. 2001. Disease Patterns in Bangladesh: Present and Future Needs. Dhaka: International Centre for Diarrhoeal Disease Research, Bangladesh.
[15] Trivede, P.; Bajpai, A. and Thareja, S. 2010. Comparative Study of Seasonal Variation in Physico-Chemical Characteristics in Drinking Water Quality of Kanpur, India With Reference To 200 MLD Filteration Plant and Ground Water. Nature and Science, 8(4): 11-17.
[16] Web Bangladesh: Access to Clean Water Will Reduce Poverty Faster. The World Bank (WB), Published on October 11, 2018. Online document, Retrieved on December 14, 2018. Web address (URL: https://www.worldbank.org/en/news/press-release/2018/10/11/bangladesh-access-to-clean-water-will-reducepoverty-faster).
[17] WHO, 2002. Managing Water in the Home: Accelerated Health Gains from Improved Water Sources. 2002. Geneva, World Health Organization (WHO/SDE/WSH/02.07). pp. 3-7.
AUTHORS
First Author – Badhon Ahmmed, MS student of Soil, Water & Environment Discipline, Khulna University.
Email: [email protected]
Second Author – Khandoker Qudrata Kibria, Professor of Soil, Water & Environment Discipline, Khulna University.
Email: [email protected]