Survey on fluoride, bromide and chloride contents in public drinking water supplies in Sicily...
11
Survey on fluoride, bromide and chloride contents in public drinking water supplies in Sicily (Italy) Walter D’Alessandro & Sergio Bellomo & Francesco Parello & Lorenzo Brusca & Manfredi Longo Received: 20 April 2007 / Accepted: 30 October 2007 / Published online: 7 December 2007 # Springer Science + Business Media B.V. 2007 Abstract Six hundred and sixty-seven water samples were collected from public drinking water supplies in Sicily and analysed for electric conductivity and for their Cl − , Br − and F − contents. The samples were, as far as possible, collected evenly over the entire territory with an average sampling density of about one sample for every 7,600 inhabitants. The contents of Cl − and Br − , ranging between 5.53 and 1,302 mg/l and between <0.025 and 4.76 mg/l respectively, correlated well with the electric conductivity, a parameter used as a proxy for water salinity. The highest values were found both along the NW and SE coasts, which we attributed to seawater contamination, and in the central part of Sicily, which we attributed to evapo- ritic rock dissolution. The fluoride concentrations ranged from 0.023 to 3.28 mg/l, while the highest values (only three exceeding the maximum admissible concentration of 1.5 mg/l) generally correlated either with the presence in the area of crystalline (volcanic or metamorphic) or evaporitic rocks or with contam- ination from hydrothermal activity. Apart from these limited cases of exceeding F − levels, the waters of public drinking water supplies in Sicily can be considered safe for human consumption for the analysed parameters. Some limited concern could arise from the intake of bromide-rich waters (about 3% exceeding 1 mg/l) because of the potential formation of dangerous disinfection by-products. Keywords Drinking water quality . Fluoride . Bromide . Chloride Introduction One of the greatest challenges of the twenty-first century is to provide an adequate supply of safe water for household consumption to everyone, everywhere. But, whereas water demand is constantly on the rise, the quality of the water resources, which are unevenly distributed over the earth’ s surface, is deteriorating due to anthropogenic activities. Therefore, even countries with vast water resources could suffer from scarcity of water in the future. Sicily, the biggest island in the Mediterranean, has, at present, more than 5 million inhabitants being one of the most densely populated in the area (193 inhabitants/km 2 ). This region has a rather distinct climate (i.e. Mediterranean), characterized by long, hot, dry summer periods (May to September) and a Environ Monit Assess (2008) 145:303–313 DOI 10.1007/s10661-007-0039-y W. D’Alessandro (*) : S. Bellomo : L. Brusca : M. Longo Istituto Nazionale di Geofisica e Vulcanologia, Sezione di Palermo, via La Malfa 153, 90146 Palermo, Italy e-mail: [email protected] F. Parello Dipartimento CFTA, Università di Palermo, via Archirafi 36, 90123 Palermo, Italy
Transcript of Survey on fluoride, bromide and chloride contents in public drinking water supplies in Sicily...

Survey on fluoride, bromide and chloride contents in publicdrinking water supplies in Sicily (Italy)
Walter D’Alessandro & Sergio Bellomo &
Francesco Parello & Lorenzo Brusca &
Manfredi Longo
Received: 20 April 2007 /Accepted: 30 October 2007 /Published online: 7 December 2007# Springer Science + Business Media B.V. 2007
Abstract Six hundred and sixty-seven water sampleswere collected from public drinking water supplies inSicily and analysed for electric conductivity and fortheir Cl−, Br− and F− contents. The samples were, asfar as possible, collected evenly over the entire territorywith an average sampling density of about one samplefor every 7,600 inhabitants. The contents of Cl− andBr−, ranging between 5.53 and 1,302 mg/l andbetween <0.025 and 4.76 mg/l respectively, correlatedwell with the electric conductivity, a parameter usedas a proxy for water salinity. The highest values werefound both along the NW and SE coasts, which weattributed to seawater contamination, and in thecentral part of Sicily, which we attributed to evapo-ritic rock dissolution. The fluoride concentrationsranged from 0.023 to 3.28 mg/l, while the highestvalues (only three exceeding the maximum admissibleconcentration of 1.5 mg/l) generally correlated eitherwith the presence in the area of crystalline (volcanicor metamorphic) or evaporitic rocks or with contam-
ination from hydrothermal activity. Apart from theselimited cases of exceeding F− levels, the waters ofpublic drinking water supplies in Sicily can beconsidered safe for human consumption for theanalysed parameters. Some limited concern couldarise from the intake of bromide-rich waters (about3% exceeding 1 mg/l) because of the potentialformation of dangerous disinfection by-products.
Keywords Drinking water quality . Fluoride .
Bromide . Chloride
Introduction
One of the greatest challenges of the twenty-firstcentury is to provide an adequate supply of safe waterfor household consumption to everyone, everywhere.But, whereas water demand is constantly on the rise,the quality of the water resources, which are unevenlydistributed over the earth’s surface, is deterioratingdue to anthropogenic activities. Therefore, evencountries with vast water resources could suffer fromscarcity of water in the future.
Sicily, the biggest island in the Mediterranean, has,at present, more than 5 million inhabitants being oneof the most densely populated in the area (193inhabitants/km2). This region has a rather distinctclimate (i.e. Mediterranean), characterized by long,hot, dry summer periods (May to September) and a
Environ Monit Assess (2008) 145:303–313DOI 10.1007/s10661-007-0039-y
W. D’Alessandro (*) : S. Bellomo : L. Brusca :M. LongoIstituto Nazionale di Geofisica e Vulcanologia,Sezione di Palermo,via La Malfa 153,90146 Palermo, Italye-mail: [email protected]
F. ParelloDipartimento CFTA, Università di Palermo,via Archirafi 36,90123 Palermo, Italy

mild rainy winter season. Thirty-year (1965–1994)average precipitation values range from 380 to1200 mm with a mean value of 600 mm for theentire island (Regione Siciliana 1998). Althoughsome studies have evidenced a declining trend in theprecipitation values (Brunetti et al. 2004), the effec-tive meteoric recharge is still higher than total waterdemand. But the uneven distribution of the resourcesand their very bad management over the last decadeshas brought to sometimes severe water shortages inmany parts of the island. The main problems arisefrom the distribution networks that lose up to morethan 50% of the water transported (38% on average),while other problems are connected to water qualityissues on account of the salinization and contamina-tion of some of the aquifers (Ferrara 1991; Aiuppaet al. 2003). These problems have caused about 40%of the families in Sicily to suffer from irregularities inwater distribution against an Italian national averageof about 16%. Furthermore, more than 63% of thesefamilies have concerns regarding the quality of tap water(national average ≈ 45%) (ISTAT 2003). This has inturn caused an increase in the consumption of bottledwater, although this remains somewhat lower that thenational average. In fact, about 82% of the people inSicily declare that they drink bottled water, at leastsometimes (national average ≈ 87%) (ISTAT 2003).
Using this as a starting point, we decided to test thequality of the drinking water distributed by publiccompanies in Sicily. In this paper, we report on thecontent of three chemical parameters, F−, Br− and Cl−,measured in 667 samples collected from all over Sicily.
Fluoride is a minor component of natural watersthe optimal range of which for human health isconsidered to be between 0.5 and 1.5 mg/l. Fluorideconcentrations above 0.5 mg/l are able to preventdental caries (WHO 1994), therefore in manycountries of the world artificial fluoridation of publicsupplied waters has been used to obtain such anoptimal range, although this has never been effectedin Sicily. However, F−concentrations higher than1.5 mg/l are correlated to a series of diseases calledfluorosis whose severity is roughly proportional to theconcentration of F−. The medical community distin-guishes between dental fluorosis and skeletal fluorosis.The former, also known as “mottled teeth syndrome,”is correlated to high fluorine exposure during child-hood, when permanent teeth grow, and has differentdegrees (WHO 1994). The milder forms give only
limited esthetical problems whereas in the worst casesit may cause tooth decay. Skeletal fluorosis, which isgenerally correlated to the intake of water having ahigh F− content (>5 mg/l) for long periods (decades),is a much more severe disease. It leads to thecalcification of ligaments, increased mineralizationof bones (osteosclerosis), abnormal outgrowths ofnew bone (exostoses) and neurological complications.In severe forms, it is a crippling disease for which, atpresent, there is no effective therapy once it sets in(Krishnamachari 1986).
Fluorosis is considered as being one of the mostwidespread, environmentally driven, diseases. It isendemic in many countries around the world; dentalfluorosis affects over 70 million people while skeletalfluorosis affects about 3 million people (Fawell et al.2006). Fluorosis is not widespread in Italy and it isconsidered as being endemic in only a very limitedarea in Sicily (Fradà et al. 1969).
The World Heath Organization (WHO) establisheda guideline value of 1.5 mg/l for F− (WHO 2004); thisvalue is considered as being the maximum admissiblecontent by Italian law.
Bromide is also a minor component of naturalwaters. Its concentration in freshwater is nearly alwaysconsidered to be below levels that could have anyadverse effect on human health. Therefore, until now,neither has the WHO set a guideline value nor hasItalian law set a maximum admissible level. However,a groundwater quality criterion of 1 mg/l has beenestablished in literature (Flury and Papritz 1993) basedon toxicity data.
Natural sources of Br− are seawater, both throughmeteoric recharge and direct intrusion in coastal areas,and dissolution of evaporitic rocks. Major anthropo-genic sources are potassium ore mining, production offire retardant agents and the use of fertilizers andpesticides in agriculture (Flury and Papritz 1993).
Recent studies have revealed that a substantialpercentage of Br− could be converted to bromate BrO�
3
or brominated organic molecules (trihalomethanes,bromoacetic acid, bromoacetonitriles, etc.) by drinking-water disinfection processes (Bätjer et al. 1980;Richardson et al. 2003). In this way, the slightly toxicBr− ion in water can be transformed into highly toxicand carcinogenic disinfection by-products (DBPs) withvery low guideline values ranging from 0.0004 mg/l(1,2 Dibromoethane) to 0.1 mg/l (Bromoform) (WHO2000, 2004).
304 Environ Monit Assess (2008) 145:303–313
Chloride is a major constituent of natural watersand is generally a good tracer of salinity-increasesources. As for Br−, natural sources are seawater andthe dissolution of evaporitic rocks. The main anthro-pogenic sources are urban, industrial and agriculturalwaste-waters. The different origins of these contam-inants have often been distinguished on the basis oftheir Br/Cl ratio (Davis et al. 1998). However, nohealth-based guideline value has so far been proposedby WHO for Cl− in drinking-water (WHO 2004).Nevertheless, Cl− concentrations in excess of about250 mg/l can give rise to a noticeable taste and Italianlaw considers this level as a guideline value.
Study area and methods
The island of Sicily has a total surface of 25,708 km2
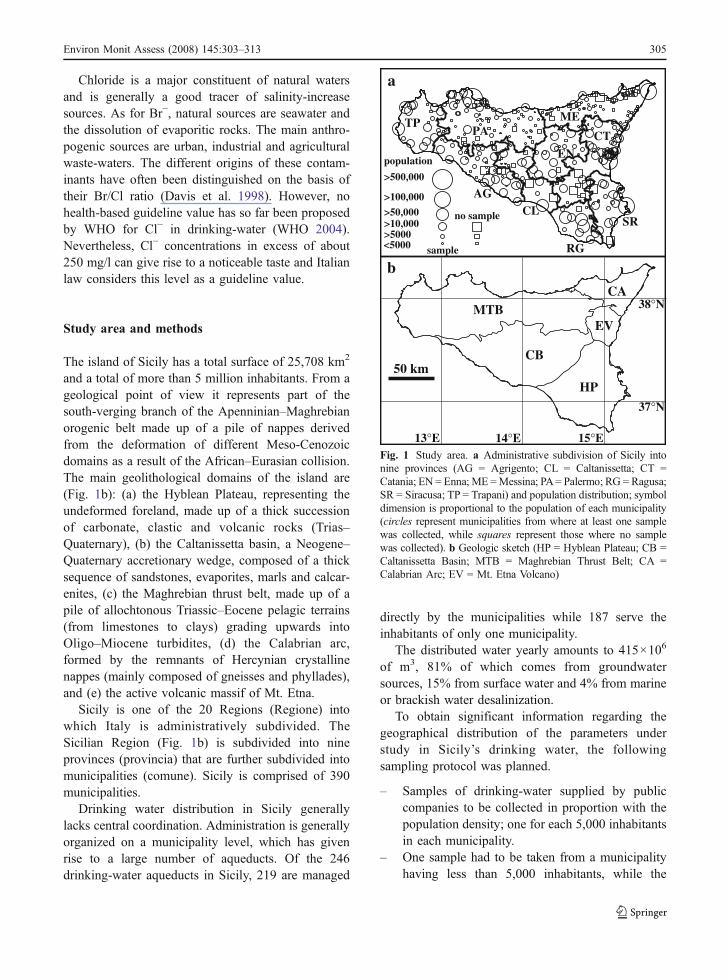
and a total of more than 5 million inhabitants. From ageological point of view it represents part of thesouth-verging branch of the Apenninian–Maghrebianorogenic belt made up of a pile of nappes derivedfrom the deformation of different Meso-Cenozoicdomains as a result of the African–Eurasian collision.The main geolithological domains of the island are(Fig. 1b): (a) the Hyblean Plateau, representing theundeformed foreland, made up of a thick successionof carbonate, clastic and volcanic rocks (Trias–Quaternary), (b) the Caltanissetta basin, a Neogene–Quaternary accretionary wedge, composed of a thicksequence of sandstones, evaporites, marls and calcar-enites, (c) the Maghrebian thrust belt, made up of apile of allochtonous Triassic–Eocene pelagic terrains(from limestones to clays) grading upwards intoOligo–Miocene turbidites, (d) the Calabrian arc,formed by the remnants of Hercynian crystallinenappes (mainly composed of gneisses and phyllades),and (e) the active volcanic massif of Mt. Etna.
Sicily is one of the 20 Regions (Regione) intowhich Italy is administratively subdivided. TheSicilian Region (Fig. 1b) is subdivided into nineprovinces (provincia) that are further subdivided intomunicipalities (comune). Sicily is comprised of 390municipalities.
Drinking water distribution in Sicily generallylacks central coordination. Administration is generallyorganized on a municipality level, which has givenrise to a large number of aqueducts. Of the 246drinking-water aqueducts in Sicily, 219 are managed
directly by the municipalities while 187 serve theinhabitants of only one municipality.
The distributed water yearly amounts to 415×106
of m3, 81% of which comes from groundwatersources, 15% from surface water and 4% from marineor brackish water desalinization.
To obtain significant information regarding thegeographical distribution of the parameters understudy in Sicily’s drinking water, the followingsampling protocol was planned.
– Samples of drinking-water supplied by publiccompanies to be collected in proportion with thepopulation density; one for each 5,000 inhabitantsin each municipality.
– One sample had to be taken from a municipalityhaving less than 5,000 inhabitants, while the
AGCL
13°E 14°E 15°E
37°N
38°N
CT
MEPA
a
b
HP50 km
CB
EV
CAMTB
EN
RG
SR
population
sample
no sample
>500,000
>100,000
>50,000>10,000>5000<5000
TP
Fig. 1 Study area. a Administrative subdivision of Sicily intonine provinces (AG = Agrigento; CL = Caltanissetta; CT =Catania; EN = Enna; ME =Messina; PA= Palermo; RG = Ragusa;SR = Siracusa; TP = Trapani) and population distribution; symboldimension is proportional to the population of each municipality(circles represent municipalities from where at least one samplewas collected, while squares represent those where no samplewas collected). b Geologic sketch (HP = Hyblean Plateau; CB =Caltanissetta Basin; MTB = Maghrebian Thrust Belt; CA =Calabrian Arc; EV = Mt. Etna Volcano)
Environ Monit Assess (2008) 145:303–313 305
number of samples was reduced for the biggestcities.
– Thirty-six municipalities were excluded, eitherbecause they had less then 1,000 inhabitants orbecause of logistical difficulties (i.e. long distancefrom the main roads; minor islands around Sicily).
Following these criteria, the collection of 960samples from 354 municipalities was planned, but inactual fact only 667 were collected from 251municipalities. The overall final sampling densitywas one sample for every 7,635 inhabitants, rangingfrom one every 5,449 in the province of Enna to oneevery 9,896 in the province Trapani. Of the 103municipalities where water samples were not collected,10 exceeded 10,000 inhabitants (maximum ≈ 30,000)and 35 exceeded 5,000 inhabitants. The samplescollected are representative of 87% of the total numberof inhabitants and 76% of the total surface of theSicilian Region.
Samples were mainly collected from public fountainsfrom April 2004 to June 2005. Some of the sampleswere collected from the inlet of the public aqueduct ofprivate houses.
The unfiltered water samples were stored in LDPEbottles and analysed in the laboratory. Electric conduc-tivity was measured with a laboratory conductimeterand referred to the temperature of 20°C. Fluoride, Br−
and Cl− were analysed by a Dionex DX120 ionchromatograph with suppressor and conductivity de-tector. A Dionex AS14 column and 1 mM sodiumbicarbonate 3.5 mM sodium carbonate solution aseluent (1.2 ml/min) were used. To minimise the “waterdip” and its interference with the F− peak, the sampleswere mixed with an appropriate amount of concentratedsodium carbonate and bicarbonate solution to match theeluent matrix. Calibration standards were prepared withthe same eluent matrix from concentrated standardsolutions (1,000 mg/l). With a 25 µl introductionsystem, the detection limits (mg/l) were 0.005 for F,0.025 for Br and 0.01 for Cl with a precision of ≤3%.
Results
The analytical results are synthesised in Table 1 andshown in Fig. 2 as probability plots. Electricconductivity values range from 199 to 4,620 µS/cm(20°C). Sixteen samples exceed the guideline value of
2,500 µS/cm set by the Italian law. The median valuesof the various provinces fall in the range of 487 (RG)to 699 (TP) µS/cm except for the province of Catania(975 µS/cm). The fluoride contents fall in the range of0.023–3.28 mg/l. Only three samples display valueshigher than the maximum admissible content (1.5 mg/l).The median values of the various provinces fall in therange of 0.21 (EN) to 0.36 (ME) mg/l and again theprovince of Catania displays the highest median value(0.47 mg/l). The bromide contents range from <0.025 to4.76 mg/l. Twenty-three samples exceed the qualitycriterion of 1 mg/l. The median values of the differentprovinces range from 0.04 (ME) to 0.3 (TP) mg/l. Thechloride values range from 5.53 to 1302 mg/l, 31 ofwhich exceed the guideline value of 250 mg/l. Themedian values of the various provinces fall in the rangeof 25.2 (ME) to 86.5 (TP) mg/l.
Correlation coefficients between variables areshown in Table 2. Electric conductivity is significantlycorrelated with both Cl− and Br−, whereas it displaysno significant correlation with F−.
The geographic distribution of the measuredparameters was inspected averaging values at themunicipality level. Averaging of the values wasnecessary due to the sometimes large variation ofthe single samples. Variability within each municipalitydepends mainly on the number and size of differentexploited water resources. For example the municipal-ity of Catania that exploits the large water resources ofMt. Etna displays low C.V.s (coefficient of variation =standard deviation/average) with values between 0.13and 0.27 for all parameters. On the contrary munici-palities located in the most arid part of the island andfar from large water resources display very large C.V.sFor example the towns of Licata and Naro, on thesouthern coast display values up to 1.2.
Figure 3 shows the distribution of the 251 averagevalues regarding those municipalities where at leastone sample was collected.
Discussion
Geographic distribution
Electric conductivity is positively related to the totaldissolved ionic content of water. Due to the fact thatmost of the dissolved material is in ionic form, electricconductivity is often used to estimate the salinity of
306 Environ Monit Assess (2008) 145:303–313

Table 1 Statistical distribution of the analytical results
Minimum Percentiles Maximum
10 25 50 75 90
Agrigento (76)Cond. μS/cm 350 413 461 562 643 796 1,701F mg/l 0.070 0.17 0.24 0.34 0.40 0.47 1.49Br mg/l <0.025 0.030 0.040 0.070 0.13 0.24 0.86Cl mg/l 12.8 20.5 28.2 39.9 58.6 87.2 265Caltanissetta (30)Cond. μS/cm 282 347 482 576 705 869 1,499F mg/l 0.060 0.12 0.17 0.29 0.43 0.59 3.28Br mg/l <0.025 <0.025 0.030 0.12 0.18 0.37 0.87Cl mg/l 13.4 24.3 29.9 46.0 62.3 90.7 148Catania (165)Cond. μS/cm 249 529 768 975 1,165 1,492 2,140F mg/l 0.11 0.27 0.35 0.47 0.52 0.62 1.04Br mg/l <0.025 0.10 0.15 0.20 0.30 0.40 0.74Cl mg/l 12.7 34.5 47.7 72.2 90.4 118 212Enna (36)Cond. μS/cm 228 306 363 549 798 1,208 2,510F mg/l 0.07 0.08 0.11 0.21 0.32 0.54 0.65Br mg/l <0.025 <0.025 <0.025 0.052 0.32 0.50 1.75Cl mg/l 10.5 12.4 16.0 28.3 93.8 156 498Messina (71)Cond. μS/cm 199 309 371 549 696 789 1,294F mg/l 0.073 0.15 0.21 0.36 0.67 0.82 1.13Br mg/l <0.025 <0.025 <0.025 0.040 0.11 0.15 0.33Cl mg/l 9.83 12.9 15.6 25.2 34.0 46.8 92.8Palermo (157)Cond. μS/cm 280 368 453 656 903 1,250 4,620F mg/l 0.035 0.11 0.17 0.27 0.36 0.58 1.96Br mg/l <0.025 <0.025 0.060 0.12 0.40 0.77 4.76Cl mg/l 5.53 15.4 22.3 51.3 120 224 1,302Ragusa (34)Cond. μS/cm 279 302 389 487 580 678 901F mg/l 0.11 0.15 0.19 0.23 0.31 0.35 0.38Br mg/l 0.033 0.033 0.065 0.11 0.14 0.21 0.44Cl mg/l 21.1 22.5 29.0 35.6 43.2 87.0 107Siracusa (54)Cond. μS/cm 269 364 412 523 1,270 2,640 3,610F mg/l 0.11 0.13 0.18 0.29 0.35 0.59 0.85Br mg/l <0.025 0.050 0.060 0.12 0.75 2.38 3.64Cl mg/l 15.1 16.8 23.1 29.6 252 718 1,018Trapani (44)Cond. μS/cm 336 512 570 699 819 973 1,078F mg/l 0.023 0.12 0.19 0.29 0.35 0.70 0.85Br mg/l 0.060 0.12 0.15 0.30 0.48 0.64 0.76Cl mg/l 12.4 36.9 51.9 86.5 142 180 212Sicily (667)Cond. μS/cm 199 369 467 656 964 1,280 4,620F mg/l 0.023 0.13 0.21 0.32 0.48 0.62 3.28Br mg/l <0.025 <0.025 0.060 0.13 0.30 0.49 4.76Cl mg/l 5.53 16.8 27.3 47.7 87.2 148 1,302
Data are shown for the whole Sicily and also subdivided per provinces (number of samples are indicated in parenthesis). Cond =Electric conductivity
Environ Monit Assess (2008) 145:303–313 307

water. The total dissolved solids (TDS), or better thetotal dissolved ions (TDI), are often determined usingelectric conductimeters, by simply multiplying theelectric conductivity value by a conversion constant.This is, of course, only a rough assumption becauseelectric conductivity depends on the ionic compositionof the water (McNeil and Cox 2000). Conversionconstants vary greatly (0.54–0.96), but in most cases a
more limited range is used (0.55–0.75) (Hem 1985),but the most adopted values are 0.64 and 0.67.
Due to the fact that the water samples were notanalysed for all major dissolved ions, for the purposeof this study electric conductivity has been adopted asa proxy for the salinity of the analysed samples.
Figure 3a shows that the most saline waters weregenerally found along the coast, where direct (intrusion)and indirect (sea spray deposition) seawater contamina-tion can be expected. Seawater intrusion is wellevidenced in the three municipalities where the highestvalues of electric conductivity were measured: Capaciand Cefalù on the north coast and Syracuse on the south-eastern coast. In these areas the drinking water demandis satisfied by groundwater, which is extracted fromcarbonate aquifers, which are hydraulically connected tothe sea. In recent years, overexploitation of these
100
1000
10000
0.01
0.1
1
10
1
10
100
1000
10000
0.1 1 5 10 2030 50 7080 90 95 99 99.90.1 1 5 10 2030 50 7080 90 95 99 99.9
0.1 1 5 10 2030 50 7080 90 95 99 99.9 0.1 1 5 10 2030 50 7080 90 95 99 99.9
0.01
0.1
1
10
Chl
orid
e m
g/l
Flu
orid
e m
g/l
Bro
mid
e m
g/l
Ele
ctri
c co
nduc
tivi
ty µ
S/cm
(20
˚C)
Cumulative Frequency (%) Cumulative Frequency (%)
Cumulative Frequency (%) Cumulative Frequency (%)
GV
GV
GV
MAC
Fig. 2 Cumulative distribution of electric conductivity, fluoride, chloride and bromide in the sampled waters (all samples). GV =guideline value; MAC = maximum admissible concentration
Table 2 Correlation matrix (r2) of the whole data (El. cond =electric conductivity)
El. cond. F− Cl− Br−
El. Cond. 1F− 0.08 1Cl− 0.75 0.01 1Br− 0.74 0.01 0.97 1
308 Environ Monit Assess (2008) 145:303–313

aquifers has facilitated their contamination throughseawater intrusion. Similar hydrologic situations canbe recognized all along the north-western and the south-eastern coasts, although the consequences are lessserious. The sea-water intrusion has been documentedin most of the areas where we found high electricconductivity values. Aureli and Silluzio (2002), forexample, analysing groundwaters along the 120 kmlong south-eastern coastal area between Syracuse andGela found that in at least three stretches (representingabout 20% of the total) the 500 mg/l isoline reacheddistances from the coast of up to 6 km. The sea-waterintrusion is related to the lowering of the piezometriclevel down to 40 m below sea level both in the freeshallow aquifer and in the lower confined aquifer oncefeeding abundant underwater discharge. Similar sit-uations have been documented also at Cefalù (Aureliet al. 2001) and along 40 km of the northern coastextending from Palermo to the west (Calvi et al. 2000).
In the inner part of the island, two other highsalinity areas can be recognised: The first is a verylarge area, roughly corresponding to the provinces ofEnna and Caltanissetta and part of the province
of Agrigento, while the second is the southern flankof the Mt. Etna massif. The former displays highersalinity values as a result of the influence of its aridclimate and the widespread presence of evaporiticrocks in the water resources of the area. The mainwater resources in the latter are the volcanic aquifersof the Mt. Etna massif. The waters circulating in thisactive volcano increase their dissolved ionic contentthrough water-rock interaction processes favoured bythe dissolution of huge quantities of CO2 of magmaticorigin (Aiuppa et al. 2003).
The geographic distribution of Cl− and Br− (Fig. 3b,c)closely resembles that of electric conductivity as couldhave been foreseen from their significant positivecorrelation. This fact further confirms that both ionsare often good predictors of salinity in water. Thehighest values of Cl− and Br− were measured alongthe coast, certainly caused by seawater contamination.The few high values (outlyers) measured inland can beexplained by the same causes of electric conductivity,i.e. arid climate and evaporitic rock dissolution.
The lower than average Chloride/conductivity ratioof the waters in the Etnean area can be explained by
2496
1838
1357
806
573426
199
Electric
conductivity
µS/cm (20°C) a
583
213
14370.936.522.36.9
Chloride
mg/l b
2.39
0.77
0.570.230.100.040.025
Bromide
mg/l c
3.28
1.16
0.850
0.4600.3110.182
0.023
Fluoride
mg/l d
Fig. 3 Geographic distribution of electric conductivity (a),chloride (b), bromide (c) and fluoride (d) in the sampled waters(average values on a municipality level). Symbols are drawn onthe basis of the box and whiskers diagram in which the thickline is the median value, the box is the interquartile range, the
lower whisker is the minimum value and the upper whisker isthe maximum non outlyer value; the grey circles are outlyers(>upper quartile+1.5 times the interquartile range), and thecrosses are extremes (>upper quartile+3 times the interquartilerange)
Environ Monit Assess (2008) 145:303–313 309

the high bicarbonate contents deriving from magmaticCO2 dissolution.
By looking at the geographic distribution of F−,some areas of increased content can be recognised(Fig. 3d). These can be related either to lithology or togeologic processes occurring in these zones. Evaporiticand crystalline rocks (both magmatic and metamor-phic) are often enriched in fluorine. Therefore, thehigher than average values measured in the Etnean areaare justified by the volcanic rocks of the aquifers, whilethose measured in the province of Messina derive fromthe presence of gneissic and granitic rocks. The largeanomalous area in the central part of Sicily, asmentioned before, is characterised by evaporitic rocks.Finally, the anomalous area along the central part of thenorthern coast can be explained by the presence ofhydrothermal activity. Thermal waters are often highlyenriched in F− (Nordstrom and Jenne 1977) andgeothermal fluids probably contaminate the ground-waters of the area. Thermalism in the area must havebeen widespread in the past and clues of its activity arethe mineral veins rich in fluorite that can still be foundthere (Bellanca et al. 1990). Furthermore, the isolatedoutlyer found in Eastern Sicily can be explained bycontamination with geothermal fluids that feed athermal spring in the area.
The study of geographic distribution of thestudied parameter is important to individuate areadisplaying anomalous values that exceed drinkingwater limits. The obtained distribution maps are veryuseful for policy makers to focalize interventions inthese areas.
Chloride/bromide ratio
Chloride/bromide ratios are widely used as naturaltracers of groundwater history, due to their generallyconservative behaviour in this environment. In otherparts of their geochemical cycles, however, multiplephysical and chemical processes lead to differing ratesof transformation and transport and subsequentfractionation of Cl/Br ratios. These include burstingbubbles at the ocean surface, partitioning between gasand particulate phases in the atmosphere, partitioningbetween organic and inorganic atmospheric com-pounds, photo-dissociation, aerosol acidification, pre-cipitation scavenging, sorption onto organic andinorganic surfaces, plant uptake, and precipitation ofsalts from brines (Fabryka-Martin 2005).
Cl/Br ratios can be used beneficially in thereconstruction of the origin and movements of ground-waters due to the different ratios of the contaminatingsolutions (Davis et al. 1998). Seawater has a weightratio of 292, whereas rainwater has a ratio of between50 and that of seawater, the lower values of which havebeen measured in urban environments, on account ofcontamination by bromine deriving from the decom-position of brominated additives of leaded gasoline.This source of contamination is diminishing in theEuropean Union, to which Italy belongs, because ofthe ban on leaded gasoline, but its influence isprobably still to be found in groundwater systems thathave been recharged in the last 50 years. Agriculturalwastewaters also have Cl/Br ratios that are lower thanthose of seawater (100–200) while domestic waste-waters display higher values (300–800) (Davis et al.1998; Vengosh and Pankratov 1998; Hudak 2003).Waters affected by dissolution of halite show very highvalues in the range of 1,000–10,000.
The waters analysed in this study display a widerange of Cl/Br values, between 106 and 9056. Byplotting this ratio vs. Cl concentrations some groups
100
1000
10000
1 10
Halite
dissolution
Urban
wastewater
Agricultural
wastewater
SW
contaminationSW
ratio
100 1000 10000Cl mg/l
Cl/Br
AG
EN
RG
CL
ME
SR
CT
PA
TP
Cl/Br >800Cl/Br 370-800Cl/Br 250-370; Cl >150 mg/lCl/Br ; Cl <150250-370 mg/l
Cl/Br <250; Cl <20 mg/lCl/Br <250; Cl >20 mg/l b
a
Fig. 4 a Chloride/bromide ratio vs. chloride binary diagram.b Geographic distribution of Chloride/bromide ratio (averagevalues on a municipality level)
310 Environ Monit Assess (2008) 145:303–313

of samples can be recognised (Fig. 4a). The watersaffected by seawater contamination describe a lineartrend of increasing Cl− content, with Cl/Br ratiosvery close to that of seawater, thereby furtherconfirming the origin of the high salinity of thethree municipalities that display the highest electricconductivity values. In addition to these very salinewaters, most of the waters display a Cl/Br ratiosimilar to that of seawater. In fact, about 51% of thesamples have ratios that range between 250 and 370.These waters probably retain an imprint of seawaterthrough sea spray deposition or circulation withinrocks of recent (Quaternary) marine origin. Thosehaving also high Cl− contents suffer probably fromdirect sea-water contamination. Most municipalitieswith average values of Cl/Br ratio within the 250–370 range and Cl− values higher then 150 mg/l are,in fact, on the coast (Fig. 4b). Only a few samplesdisplay Cl/Br ratios that are significantly lower thanthose of seawater (less than 10% have values lowerthan 250 while less than 3% are lower than 200).Some of these waters have very low Cl− contents(<25 mg/l) and probably derive their low Cl/Br ratiofrom meteoric recharge with a low ratio. A fewothers display higher Cl− contents (60–200 mg/l) andprobably derive their low ratio from agriculturalwastewater contamination or from dissolution ofevaporitic potassium salts. A group of samples, inwhich halite dissolution plays a significant role,define a trend with both increasing Cl− and Cl/Brratios. It is worth noting that these samples were allcollected in areas where outcrops of evaporitic rocksare widespread, mainly in the provinces of Agri-gento, Caltanissetta and Enna (Fig. 4b). The remain-ing samples form a large group whose Cl− valuesrange from about 10 to 200 mg/l and whose Cl/Brratio ranges from about 370 to 800. The compositionof these waters probably originates from differentmixing processes involving many of the abovedescribed end-members. These waters could also bethe result of urban wastewater contamination or theycould originate from urban water treatment plants.The municipality of Palermo, for example, satisfies apart of its water demand by using treated water fromthe Oreto River that is heavily contaminated byurban wastewater. Previous studies have demonstrat-ed that conventional wastewater treatment plants donot significantly alter the Cl/Br ratio (Vengosh andPankratov 1998).
Furthermore we also wish to highlight theimportance of the direct determination of Br−
concentrations. With present-day technology, thisanalysis is easy, cheap and precise. Alternativemethods, like the estimation from other measuredparameters considering constant ratios (i.e. Br/Cl orBr/TDS – Magazinovic et al. 2004), apart frombeing imprecise, are also unnecessary. For exampleusing the Br/Cl ratio of 410 reported in Magazinovicet al. (2004) only 16 samples of our dataset wouldresult in Br− levels of above 1 mg/l.
Health issues
Only 134 samples (20% of the analysed waters) fallwithin the optimal range for F− concentrations (0.5–1.5 mg/l). Fortunately, only three samples (~0.4%)exceed the maximum admissible concentration. Thecommencement of a fluoridation program for thoseaqueducts that distribute water having a value of lessthan 0.5 mg/l would probably be meaningless for thefollowing reasons. It would be partially useless due tothe considerable consumption of bottled water inSicily and many medical studies have highlighted thatthe incidence of caries in developed countries isdiminishing, even in areas with low drinking-waterF−, due to enhanced hygienic conditions and to theuse of fluoridated toothpaste and mouthwashes.Lastly, water fluoridation sometimes encounters theirrational opposition of people, although concernsabout this technique are mainly based on pseudo-scientific theories (Weinstein and Davison 2004).
As previously stated, elevated Br− levels in watercontribute to the formation of many brominated dis-infection by-products (DBPs). Most halogenated DBPsare toxic and carcinogenic but bromine-containingcompounds are generally more carcinogenic than theirchlorinated analogues (Richardson et al. 2003). Fur-thermore, current research is continuously discoveringtens of new halogenated DBPs the toxicity andcarcinogenity of which have still to be tested, althoughmany have been found to be dangerous (Richardson etal. 2000, 2003). The generally low Br− content of mostof the water exploited for drinking purposes limits theproduction of brominated DPBs. Many studies haveshown that water whose Br− concentration, whichcomes from both natural (Richardson et al. 2003) andanthropogenic sources (Bätjer et al. 1980), is in excessof about 1 mg/l, contain a large variety of DPBs some
Environ Monit Assess (2008) 145:303–313 311

of which are above the allowed maximum admissiblecontent.
Twenty-three of the studied drinking water sampleshave Br− values that are higher than 1 mg/l and aretherefore a major potential source of brominatedDBPs. The formation of these DPBs also stronglydepends on the type of disinfection process, and wecannot exclude that some of the waters with Br−
levels close to 1 mg/l have not lost a part of the Br−
through transformation into brominated DBPs.The areas where bromide-rich waters have been
found, should be targeted for further studies aimed atanalysing Br− levels and the main chemico-physicalparameters in the source waters before disinfectionprocesses occur and the resulting DBPs after theprocesses have been completed; this with the objec-tive of better constraining health hazards connected tothe consumption of these waters. The surveyed watersources have to be chosen on the basis of the size ofthe served population and on type of disinfectionprocesses. For example it would be very important tosurvey those feeding the aqueducts of Syracuse wheremost of the highest Br− concentrations were measuredand where the Aretusa spring, one of the main waterresources since ancient times made famous by afascinating Greek legend, is at present stronglycontaminated by sea-water.
Conclusions
The Cl−, Br− and F− contents of the water distributedby public water companies in Sicily are generallysuitable for human consumption. Some issues maydevelop regarding the salinity of the water, which issometimes contaminated either by seawater intrusionalong some parts of the north-western and the south-eastern coasts or by evaporitic rock dissolution in thecentral part of the island. Of the 667 samples analysed,31 exceeded the guideline value of 250 mg/l for Cl−
and 16 exceed the guideline value of 2,500 µS/cm forelectric conductivity. Although these waters only giveraise to organoleptic problems, they are also asymptom of important seawater intrusion processescaused by overexploitation. This problem, which ismainly ascribable to agricultural exploitation of thegroundwater along the coastal plains, highlights theneed of a better management of the Sicilian waterresources. These saline waters also often display
enhanced levels of Br−. Although neither the Italianlaw nor the WHO set a limit for Br−, previous literaturehas highlighted that elevated Br− contents lead to theformation of toxic and/or carcinogenic halogenatedDBPs. Twenty-three samples exceeded the 1 mg/l level,which, on the basis of these studies, could beconsidered an upper limit. Finally, only three samplesexceeded the maximum admissible concentration forF−, and two of them were collected in an area wherefluorosis was previously endemic.
Acknowledgements This study would not have been possiblewithout the help of many students and colleagues. Among them,the greatest help in collecting samples came from Pietro Bonfanti,Andrea Cannizzaro, Carmelo Di Franco, Roberto Di Paola,Roberto Maugeri, Giuseppe Natoli and Francesco Rubino.Furthermore Andrea Cannizzaro, Carmelo Di Franco andGiuseppe Natoli are also kindly acknowledged for their help inthe laboratory.
References
Aiuppa, A., Bellomo, S., Brusca, L., D’Alessandro, W., &Federico, C. (2003). Natural and anthropogenic factorsaffecting groundwater quality of an active volcano (Mt.Etna, Italy). Applied Geochemistry, 18, 863–882.
Aureli, A., Contino, A., Cusimano, G., Fazio, F., & Silluzio, C.(2001). Groundwater vulnerability of the MadonieMountains. Proc. 7th Conference Limestone Hydrologyand fissured media, Besançon (France), September 20–22,2001, pp. 23–26.
Aureli, A., & Silluzio, C. (2002). Coastal overexploitation andsea water intrusion. In E. Bocanegra, D. Martinez & H.Massone (Eds.), Groundwater and human development,Proc. XXXII. IAH and VI ALHSUD Congress, Mar delPlata, Argentina (21–25 October, 2002), pp. 761–774.
Bätjer, K., Gabel, B., Koschorrek, M., Lahl, U., Lierse, K. W.,Stachel, B., & Thiemann, W. (1980). Drinking water inBremen: Trihalomethanes and social costs. A case study ofbromoform formation during chlorination of river waterhighly contaminated with bromide ions. The Science of theTotal Environment, 14, 287–291.
Bellanca, A., Dongarrà, G., Neri, R., & Parello, F. (1990).Geochemistry of ground waters in carbonate rocks hostingfluorite mineralizations, north-western Sicily. AcqueSotterranee, IV, 47–53.
Brunetti, M., Buffoni, L., Mangianti, F., Maugeri, M., & Nanni, T.(2004). Temperature, precipitation and extreme events duringthe last century in Italy. Global Planetary Changes, 40,141–149.
Calvi, F., Contino, A., Cusimano, G., Di Cara, A., Frias Forcada, A.,Hauser, S., et al. (2000). Hydrostructures related to the Piana diPalermo aquifers and their hydrogeochemical characteristics.Memorie della Società Geologica Italiana, 55, 473–481.
Davis, S. N., Whittemore, D. O., & Fabryka-Martin, J. (1998).Uses of chloride/bromide ratios in studies of potable water.Ground Water, 36, 338–350.
312 Environ Monit Assess (2008) 145:303–313

Fabryka-Martin, J. T. (2005). Divergent behaviors in globalgeochemical cycling of bromine and chlorine. Geochimicaet Cosmochimica Acta, 69(Suppl. 10), A710.
Fawell, J., Bailey, K., Chilton, J., Dahi, E., Fewtrell, L., & Magara,Y. (2006). Fluoride in drinking-water. In WHO Drinking-water Quality Series. London: IWA Publishing, 134 pp.
Ferrara, V. (1991). Modificazioni indotte dallo sfruttamentodelle acque sotterranee sull’equilibrio idrodinamico eidrochimico dell’acquifero vulcanico dell’Etna. Memoriedella Società Geologica Italiana, 47, 619–630.
Flury, M., & Papritz, A. (1993). Bromide in the natural environ-ment: Occurrence and toxicity. Journal of EnvironmentalQuality, 22, 747–758.
Fradà, G.,Mentesana, G., &Guaijani, U. (1969). Thyroid functionin endemic hydrofluorosis in Sicily. Fluoride, 2(4), 195–200.
Hem, J. D. (1985). Study and interpretation of the chemicalcharacteristics of natural water. In USGS Water SupplyPaper 2254 (3rd edn, pp. 66–69) . Washington, DC: USGovernment Printing Office.
Hudak, P. (2003). Chloride/bromide ratios in leachate derived fromfarm-animal waste. Environmental Pollution, 121, 23–25.
ISTAT (2003). Italian National Institute for Statistics, IndagineMultiscopo – Aspetti della vita quotidiana.
Magazinovic, R. S., Nicholson, B. C., Mulcahy, D. E., &Davey, D. E. (2004). Bromide levels in natural waters: itsrelationship to levels of both chloride and total dissolvedsolids and the implications for water treatment.Chemosphere,57, 329–335.
McNeil, V. H., & Cox, M. E. (2000). Relationship betweenconductivity and analysed composition in a large set ofnatural surface-water samples, Queensland, Australia.Environmental Geology, 39(12), 1325–1333.
Krishnamachari, K. A. (1986). Skeletal fluorosis in humans:A review of recent progress in the understanding of the
disease. Progress in Food and Nutrition Science, 10,279–314.
Nordstrom, D. K., & Jenne, A. J. (1977). Fluorite solubilityequilibria in selected geothermal waters. Geochimica etCosmochimica Acta, 41, 175–188.
Regione Siciliana (1998). Climatologia della Sicilia. 5 Volumes,Palermo, Tipografia Priulla.
Richardson, S. D., Thruston, A. D., Caughran, T. V., Chen, P. H.,Collette, T. W., Schenck, K. M., et al. (2000). Identificationof new drinking water disinfection by-products from ozone,chlorine dioxide, chloramines and chlorine. Water Air andSoil Pollution, 123, 95–102.
Richardson, S. D., Thruston, A. D., Rav-Acha, C., Groisman,L., Popilevsky, I., Juraev, O., et al. (2003). Tribromopyr-role, brominated acids, and other disinfection by-productsproduced by disinfection of drinking water rich inbromide. Environmental Science and Technology, 37(17),3782–3793.
Vengosh, A., & Pankratow, I. (1998). Chloride/bromide andchloride/fluoride ratios of domestic sewage effluents andassociated contaminated ground water. Ground Water, 36(5), 815–824.
Weinstein, L.H., & Davison, A. (2004). Fluoride in theEnvironment. Wallingford, Oxon, UK: CABI Publishing.
WHO (1994). Fluorides and oral health. Report of a WHOexpert committee on oral health status and fluoride use.Technical Report Series 846. Geneva: World HealthOrganization.
WHO (2000). Disinfectant and disinfectant by-products. Envi-ronmental Health Criteria 216. Geneva: World HealthOrganization.
WHO (2004). Guidelines for drinking-water quality. Volume 1:Recommendations (3rd ed.). Geneva: World HealthOrganization.
Environ Monit Assess (2008) 145:303–313 313