Synthesis of Fe-MFI zeolites in fluoride-containing media
16
Synthesis of Fe-MFI zeolites in fluoride-containing media Flaviano Testa a , Luigi Pasqua a , Fortunato Crea a , Rosario Aiello a, * , K aroly L az ar b ,P al Fejes c , Patrick Lentz d , Janos B. Nagy d a Dipartimento di Ingegneria Chimica e dei Materiali, Universit a della Calabria, Via P. Bucci, 87030 Rende (CS), Italy b Institute of Isotope and Surface Chemistry, P.O. Box 77, 1525 Budapest, Hungary c Department of Applied Chemistry, University of Szeged, Rerrich B ela t er 1, 6720 Szeged, Hungary d Laboratoire de RMN, Facult es Universitaires Notre-Dame de la Paix, 61 Rue de Bruxelles, 5000 Namur, Belgium Received 19 March 2001; received in revised form 29 April 2002; accepted 22 July 2002 Abstract As many as three Fe/u.c. were introduced into the MFI framework in a fluoride-containing medium. Initial gels of the composition 10SiO 2 :xFeðNO 3 Þ 3 9H 2 O:y MF:1:25TPABr:300H 2 O (where M ¼ NH 4 , Na, K, Cs, x ¼ 0:1, 0.2 and 0.3, and y ¼ 3, 6, 9, 12, 15, 18, 21 and 24, TPABr ¼ tetrapropylammonium bromide) were heated under hydrothermal conditions at 170 °C. NH 4 - and Cs-containing systems are most effective in the incorporation of Fe into the framework. The location of iron on tetrahedral framework positions is indicated by both the white color of the samples and the isomer shift in the M€ ossbauer spectra (IS < 0:3 mm/s). During calcination, some framework Fe atoms leave the framework. The crystallization patterns and crystal morphologies are influenced by the fluoride salt added to the re- action mixture. Kinetic data show that the cations exert specific forces on the stabilization of the crystals under de- velopment. Ó 2002 Elsevier Science Inc. All rights reserved. Keywords: Fe-MFI; F-containing synthesis; M€ ossbauer spectroscopy 1. Introduction The isomorphous substitution of elements like B, Ti, and Ga into tetrahedral positions of high- silica zeolites has attracted great interest, because it generates acidity different from that associated with Al sites [1–10]. In addition, the transition metal ions show a promising catalytic behavior in the oxidation of organic compounds [11] and in the removal of NO x from automotive exhausts [12]. These materials could replace toxic and cor- rosive catalysts such as sulphuric and hydrofluoric acid, BF 3 , and AlCl 3 used in industrial processes [13]. The differences in the catalytic activity of iron- containing and iron-supported zeolites are very interesting, and several methods of preparation have been developed [9,14,15]. Fe-silicates with MFI [3,8], MOR [16], BEA [17], MTT [18], TON [6] and MWW [19] structures have been synthe- sized in alkaline media. However, despite the fact that isomorphous substitution seems to be easier in fluoride-containing media [20], only Fe-ZSM-5 * Corresponding author. Tel.: +39-0984-492029; fax: +39- 0984-492058. E-mail address: [email protected] (R. Aiello). 1387-1811/02/$ - see front matter Ó 2002 Elsevier Science Inc. All rights reserved. PII:S1387-1811(02)00480-8 Microporous and Mesoporous Materials 57 (2003) 57–72 www.elsevier.com/locate/micromeso
-
Upload
independent -
Category
Documents
-
view
0 -
download
0
Transcript of Synthesis of Fe-MFI zeolites in fluoride-containing media
Synthesis of Fe-MFI zeolites in fluoride-containing media
Flaviano Testa a, Luigi Pasqua a, Fortunato Crea a, Rosario Aiello a,*,K�aaroly L�aaz�aar b, P�aal Fejes c, Patrick Lentz d, Janos B. Nagy d
a Dipartimento di Ingegneria Chimica e dei Materiali, Universit�aa della Calabria, Via P. Bucci, 87030 Rende (CS), Italyb Institute of Isotope and Surface Chemistry, P.O. Box 77, 1525 Budapest, Hungary
c Department of Applied Chemistry, University of Szeged, Rerrich B�eela t�eer 1, 6720 Szeged, Hungaryd Laboratoire de RMN, Facult�ees Universitaires Notre-Dame de la Paix, 61 Rue de Bruxelles, 5000 Namur, Belgium
Received 19 March 2001; received in revised form 29 April 2002; accepted 22 July 2002
Abstract
As many as three Fe/u.c. were introduced into the MFI framework in a fluoride-containing medium. Initial gels of
the composition 10SiO2:xFeðNO3Þ39H2O:yMF:1:25TPABr:300H2O (where M ¼ NH4, Na, K, Cs, x ¼ 0:1, 0.2 and 0.3,and y ¼ 3, 6, 9, 12, 15, 18, 21 and 24, TPABr ¼ tetrapropylammonium bromide) were heated under hydrothermal
conditions at 170 �C. NH4- and Cs-containing systems are most effective in the incorporation of Fe into the framework.
The location of iron on tetrahedral framework positions is indicated by both the white color of the samples and the
isomer shift in the M€oossbauer spectra (IS < 0:3 mm/s). During calcination, some framework Fe atoms leave theframework. The crystallization patterns and crystal morphologies are influenced by the fluoride salt added to the re-
action mixture. Kinetic data show that the cations exert specific forces on the stabilization of the crystals under de-
velopment.
� 2002 Elsevier Science Inc. All rights reserved.
Keywords: Fe-MFI; F-containing synthesis; M€oossbauer spectroscopy
1. Introduction
The isomorphous substitution of elements likeB, Ti, and Ga into tetrahedral positions of high-
silica zeolites has attracted great interest, because
it generates acidity different from that associated
with Al sites [1–10]. In addition, the transition
metal ions show a promising catalytic behavior in
the oxidation of organic compounds [11] and in
the removal of NOx from automotive exhausts
[12]. These materials could replace toxic and cor-
rosive catalysts such as sulphuric and hydrofluoricacid, BF3, and AlCl3 used in industrial processes
[13].
The differences in the catalytic activity of iron-
containing and iron-supported zeolites are very
interesting, and several methods of preparation
have been developed [9,14,15]. Fe-silicates with
MFI [3,8], MOR [16], BEA [17], MTT [18], TON
[6] and MWW [19] structures have been synthe-sized in alkaline media. However, despite the fact
that isomorphous substitution seems to be easier
in fluoride-containing media [20], only Fe-ZSM-5
*Corresponding author. Tel.: +39-0984-492029; fax: +39-
0984-492058.
E-mail address: [email protected] (R. Aiello).
1387-1811/02/$ - see front matter � 2002 Elsevier Science Inc. All rights reserved.
PII: S1387-1811 (02 )00480-8
Microporous and Mesoporous Materials 57 (2003) 57–72
www.elsevier.com/locate/micromeso
has been synthesized so far in the presence of
NH4F as a mineralizing agent [21].
After a preliminary introduction [13], we report
here on the synthesis of Fe-ZSM-5 zeolites in the
presence of various inorganic fluoride salts as
mineralizing agents. The properties of the end-products will be examined by various physico-
chemical techniques (XRD, thermal analysis,
scanning electron microscope (SEM), and multi-
nuclear NMR and M€oossbauer spectroscopies), andan explanation will be searched so as to under-
stand the influence of the various inorganic ca-
tions, i.e. NHþ4 , Na
þ, Kþ and Csþ.
2. Experimental
The reactants were ammonium fluoride (Carlo
Erba, RPE), sodium fluoride (Carlo Erba, RPE),
potassium fluoride (Carlo Erba, RPE), cesium
fluoride (Aldrich, purum), tetrapropyl ammonium
bromide (TPABr, Fluka, purum), iron nitrate(FeðNO3Þ � 39H2O, Merck, purum), fumed silica
(Sigma) and distilled water. The molar composi-
tion of the starting mixture was:
10SiO2:xFeðNO3Þ39H2O:yMF:1:25TPABr:300H2O
where 0:16 x6 0:3, y ¼ 3–24 and M ¼ NH4, Na,
K or Cs.
The starting mixtures were prepared by adding
to distilled water the fluoride salt, iron nitrate,TPABr and fumed silica, in that order. The re-
sulting gels, after complete homogenization, were
put into PTFE-lined 25 cm3 stainless-steel auto-
claves. The samples were obtained by hydrother-
mal synthesis at 170 �C for prefixed times. Afterquenching of the autoclaves the products were
recovered, filtered, washed with distilled water and
finally dried at 80 �C overnight. The crystallizationtime was �7 days for the lowest crystallizationrate.
The powder X-ray diffraction patterns were
collected using CuKa radiation (Philips Model
PW 1730/10 generator equipped with a PW 1050/
70 vertical goniometer). The amount of iron in the
crystals was determined by atomic absorption
spectrometry (Shimadzu AA-660). The amount of
the various elements (Fe, Si, F, Na, K and Cs) was
determined by proton induced X-ray emission and
proton induced c-ray emission (PIGE) [22]. Theamount of TPA occluded in the crystals and the
mechanism of decomposition of the organic mol-
ecule was deduced by TG and DSC analyses, re-spectively. The measurements were carried out
with a Netzsch STA 409 instrument between 20 �Cand 650 �C at a ramp of 10 K/min in N2 atmo-
sphere with a flow rate of 10 ml/min. The micro-
graphs were collected by a SEM, Jeol JSTM 330A.
M€oossbauer spectra were recorded at room
temperature. The template was removed in a sep-
arate equipment by ‘‘caring’’ calcination prior tothe measurements (heating to 450 �C in Ar at aramp of 2 K/s, calcination in 5 % O2/He mixture at
500 �C, 1 h). Evacuations were performed down to4� 10�1 Pa pressure at 350 �C for 2.5 h (spectrawere recorded in the same vacuum afterwards).
Reducing treatments were carried out in a flow of
CO at 350 �C for 1.5 h (spectra were obtained inCO atmosphere). The spectra were fitted by as-suming Lorentzian line-shape; no positional pa-
rameters were constrained. The estimated accuracy
of data is 0.03 mm/s.The NMR spectra were recorded either on a
Bruker MSL400 or on a CXP200 spectrometer.
For 29Si (39.7 MHz), a 6 ls (h ¼ p=6) pulse wasused with a repetition time of 6.0 s.
3. Results and discussion
The gels with the composition 10SiO2:xFe-ðNO3Þ39H2O:yMF:1:25TPABr:300H2O with x ¼0:1, 0.2 and 0.3, y ¼ 3, 6, 9, 12, 15, 18, 21 and 24and M ¼ NH4, Na, K and Cs all led to crystalline
MFI structures at 170 �C, except for x ¼ 0:1, y ¼ 3and M ¼ Cs, where the gels remained amorphous.All the prepared gels were white before heating,
because the iron species were not precipitated as
hydroxides, but they formed soluble complexes
with fluoride ions. Note, that this is not the case for
gels prepared in alkaline media, which were gen-
erally pale yellow, or even ‘‘rusty’’ [3,7]. The as-
synthesized products were all white powders, witha light greenish hue, only in some cases could
58 F. Testa et al. / Microporous and Mesoporous Materials 57 (2003) 57–72

brownish crystals be detected, the presence of
which is indicated in Table 1.
Table 1 shows the results of the chemical (Fe/
u.c.) and thermal analysis (TPA/u.c.) for all as-
synthesized Fe-silicalite-1 samples. The M/u.c.
values were also determined for some selectedsamples.
Fe/u.c. increases steadily, in most cases, as
amount of Fe(NO3)3 in the gel increases. The in-
crease of Fe/u.c. in the final samples could be due
to the ease of solubilization of FeFð3�xÞþx complexes
and their transport to the nucleation and crystal
growth sites. Note also, that the Fe/u.c. values do
not depend on the amount of CsF used in the gel.For NH4F and KF, either an independence or a
slight increase is observed as a function of in-
creasing MF, while for NaF, a slight decrease was
registered (Table 2).
NH4F and CsF are the most efficient salts for
the introduction of Fe into the tetrahedral posi-
tions of the structure. Indeed, the Si/Fe ratios of
the final crystalline samples are always lower thanor equal to the Si/Fe ratios of the corresponding
gels (Table 2). KF is less effective, as, in most
cases, the Si/Fe ratios of the final crystalline sam-
ples are higher than those of the corresponding
gels. Finally, NaF is the least effective, leading
sometimes to three times higher Si/Fe values in the
final samples than in the initial gels.
The TPA/u.c. values determined by TG are closeto 4, when the amount of Fe/u.c. is low (Table 1
and Fig. 1). As the amount of tetrahedrally incor-
porated Fe increases, TPA/u.c. decreases starting
from approximately 2.5 Fe/u.c. for (NH4, Fe)-
silicalite-1 and 1.5 Fe/u.c. for (Cs, Fe)-silicalite-1.
As similar decrease of TPA/u.c. values as a func-
tion of increasing tetrahedrally incorporated atoms
has already been observed for (Al, TPA)-ZSM-5[23,24], (B, TPA)-silicalite-1 [25] and (Ga, TPA)-
silicalite-1 [26].
The DSC curves of (Cs, Fe)-silicalite-1 samples
are illustrated in Fig. 2. Similar curves were ob-
tained for the other (M, Fe)-silicalite-1 samples
[13]. At low Fe/u.c. content, two endothermic
peaks are observed at �400–420 �C and at 440–460 �C. Note, that the high-temperature peak islocated at a lower temperature than that reported
for Al-ZSM-5 [20,23,24], B-silicalite-1 [25] or Ga-
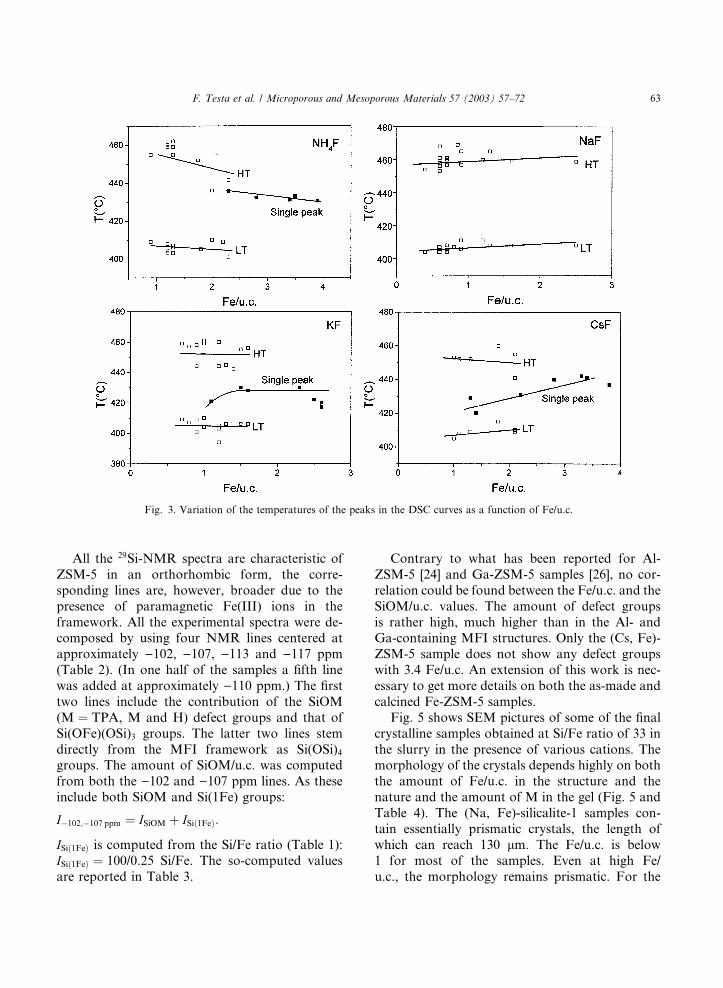
silicalite-1 [26]. The variation of the temperature of
both the high- and low-temperature DSC peaks as
a function of Fe/u.c. leads to interesting observa-
tions (Fig. 3). For the (NH4, Fe)-silicalite-1 sam-
ples both the high- and low-temperature peaks
decrease slightly with increasing Fe/u.c. On theother hand, for the (Na, Fe)-silicalite-1 samples
both the low-temperature peak and the high-
temperature peak remain quasi constant with in-
creasing Fe/u.c. For NHþ4 and Na
þ cations the
interaction of TPAþ with the framework is con-
stant and is not much influenced by the presence of
cations. This suggests that the M/u.c. is low for
both NHþ4 and Na
þ cations. Indeed, some 1.5 Na/u.c. were determined by the PIGE technique and
by wet chemical analysis (Table 1, panel B). The
low-temperature peak was previously explained as
being due to TPAþ cations neutralizing the SiO�
defect groups in the structure [23,24,27,28]. The
behavior of the high-temperature peak is more
controversial. It might be due to the decomposi-
tion of TPAþ ions neutralizing the negative frame-work charges introduced by the presence of
tetrahedral Fe(III) or other trivalent atoms. This is
the case for the Al-ZSM-5 samples [20,23,27,28].
However, for silicalite-1 or for boro- and gallo-
silicalite-1, this peak also includes the products of
decomposition stemming from the low-tempera-
ture peak (tripropylamine, dipropylamine, etc.)
[20,23–29].The (K, Fe)- and (Cs, Fe)-silicalite-1 samples
exhibit a different behavior (Fig. 3). At low Fe/u.c.
values both the high-temperature peak and the
low-temperature peak remain quasi constant as Fe/
u.c increases. At higher Fe/u.c. values, however,
only a single peak at intermediate temperature is
detected (Table 1 and Fig. 3). As there is some
overlap between the Fe/u.c. values for the two DSCpeaks and the single DSC decomposition of TPA,
this suggests that not only the Fe/u.c. values are
important, but also the M/u.c. values, which
greatly influence the decomposition temperature.
The influence of the Mþ cations has already been
shown for the Al-ZSM-5 [13,23,24,27,28] and the
borosilicalite-1 [13,20] samples. In the case of the
large Kþ and Csþ cations, due also to their higheramount in the samples, their influence can clearly
be detected (Fig. 3). Their amount rises to�3.0 u.c.
F. Testa et al. / Microporous and Mesoporous Materials 57 (2003) 57–72 59

Table 1
Chemical and thermal analysis of the final crystalline Fe-silicalite-1 samples synthesized from the gel 10SiO2:xFe(NO3)39H2O:
yMF:1.25TPABr:300H2O
x y Fe/u.c.a TPA/u.c. LTb peak HTb peak
T (�C) TPA/u.c. T (�C) TPA/u.c.
Panel A: NH4F
0.1 3 0.9 3.9 409.2 1.6 454.8 2.3
6 1.2 3.8 407.5 1.8 460.5 2.0
9 1.3 3.9 406.3 1.5 459.7 2.4
12 1.3 3.8 402.6 1.8 455.2 2.0
15 1.2 4.0 403.8 1.9 460.0 2.1
18 1.3 3.8 407.7 1.8 462.0 2.0
21 1.2 3.9 403.2 1.5 460.0 2.4
24 1.2 3.8 405.8 1.6 460.0 2.2
0.2 6 2.0c 3.8 410.0 1.8 435.9 2.0
9 1.8 3.4 405.3 1.3 452.4 2.1
12 2.1 3.8 409.7 1.7 457.0 2.1
15 1.9 3.8 402.5 1.8 452.0 2.0
18 2.3 3.8 –d – 441.6d –
21 2.3 3.2 – – 435.8d –
24 2.8 3.5 – – 432.3d –
0.3 18 3.9c 3.3 – – 430.7d –
21 3.4c 3.3 – – 431.2d –
24 3.5c 3.3 – – 435.0d –
Panel B: NaF
0.1 3 1.3 3.8 407.5 2.2 465.0 1.6
6 0.7 3.8 405.0 2.2 460.8 1.6
9 0.6e 4.1 406.0 2.1 460.8 2.0
12 0.9 3.8 405.5 2.2 457.2 1.6
15 0.7f 3.3 404.7 1.7 460.0 1.6
18 0.6 3.8 404.6 2.2 457.4 1.6
21 0.6 3.8 404.4 2.0 452.8 1.8
24 0.4 3.8 404.6 2.2 453.9 1.6
0.2 3 1.2 3.8 410.9 2.2 460.0 1.6
6 0.9g 4.2 410.2 2.2 464.8 2.0
9 0.6 3.7 407.2 2.2 468.5 1.6
12 0.8 4.2 407.5 2.1 469.2 2.1
15 0.7 3.8 404.9 1.9 456.8 1.9
18 0.7 4.0 405.3 2.1 457.3 1.9
21 0.7 3.6 405.0 1.6 457.5 2.0
24 0.6 3.5 404.8 1.8 455.2 1.7
0.3 18 1.6c 3.8 408.0 2.1 458.8 1.7
21 2.5c 3.2 408.0 1.2 459.0 2.0
24 2.7c 3.6 408.4 1.6 459.9 2.0
Panel C: KF
0.1 3 1.2 3.8 405.3 1.9 460.0 1.9
6 1.2h 3.8 403.2 1.6 460.0 2.2
9 1.2 4.0 393.7 1.6 443.9 2.4
12 1.0 3.8 410.2 1.7 458.6 2.1
15 0.7i 4.2 409.7 1.8 459.5 2.4
18 0.8 3.8 407.5 1.9 455.7 1.9
60 F. Testa et al. / Microporous and Mesoporous Materials 57 (2003) 57–72

The specific influence of the cations can also be
observed, if the amounts of TPA/u.c. which have
decomposed at high (HT) and low (LT) tempera-tures are plotted as a function of Fe/u.c. (Fig. 4).
For the (NH4, Fe)-silicalite-1 samples, TPA/u.c. of
the HT peak is always greater, than that corre-
sponding to the LT peak (Table 1 and Fig. 4).
They both decrease with increasing Fe/u.c. values,
the TPA/u.c. values of the single peak are also
decreasing with increasing Fe/u.c. as they representthe total amount of TPA/u.c. For the (Na, Fe)-
silicalite-1 samples the TPA/u.c. values of the LT
peaks are always higher than those of the HT
peaks and remain approximately constant as a
Table 1 (continued)
x y Fe/u.c.a TPA/u.c. LTb peak HTb peak
T (�C) TPA/u.c. T (�C) TPA/u.c.
21 1.3 4.0 404.9 1.8 445.4 2.2
24 0.9j 3.8 400.8 2.1 444.2 1.7
0.2 3 0.9 2.9 409.0 0.9 458.3 2.0
6 1.0 3.8 404.2 1.7 461.2 2.1
9 1.4 3.9 407.5 1.7 441.8 2.2
12 1.5 3.8 406.5 1.7 455.6 2.1
15 1.6 3.8 406.5 1.6 456.3 2.2
18 2.5 3.5 –d – 422.3d –
21 1.1 3.5 – – 423.0d –
24 2.6 3.5 – – 417.0d –
0.3 15 1.5 3.4 – – 430.0d –
18 2.3 3.4 – – 430.6d –
21 1.6 2.9 – – 428.5d –
24 2.6 2.8 – – 420.5d –
Panel D: CsF
0.1 6 1.0 3.8 405.4 1.6 453.9 2.2
12 1.1 3.8 408.2 1.9 452.2 1.9
15 1.3 3.8 409.4 1.8 452.5 2.0
18 1.4 3.8 – – 420.5 –
24 1.3 3.8 – – 429.1 –
0.2 6 2.1 3.8 410.0 2.0 455.1 1.8
12 2.1 3.7 408.1 1.9 440.5 1.8
18 1.8 3.5 415.7 1.6 459.8 1.9
24 2.2 3.4 –d – 431.1d –
0.3 6 2.8 2.8 – – 440.0d –
12k 3.6 2.7 – – 436.8d –
18 3.4 2.6 – – 441.9d –
24 3.3 2.8 – – 442.9d –
aValues obtained by atomic absorption spectroscopy.b Low (LT) and high (HT) temperature peaks for TPAþ decomposition.c Brownish crystals.d Single peak at intermediate temperature.eNa=u:c: ¼ 1:1.fNa=u:c: ¼ 1:0.gNa=u:c: ¼ 1:7.hK/u.c.¼ 2.7.i K=u:c: ¼ 1:0.j K=u:c: ¼ 2:5.k Cs=u:c: ¼ 0:65.
F. Testa et al. / Microporous and Mesoporous Materials 57 (2003) 57–72 61

function of Fe/u.c. On the other hand, for the (K,
Fe)-silicalite-1 samples, at low Fe/u.c. values, the
HT peak is larger than the LT peak and their TPA/
u.c. values do not depend much on the Fe/u.c.
values. Finally, for (Cs, Fe)-silicalite-1, the HTpeak decreases, while the LT peak increases with
increasing Fe/u.c. Of course, the TPA/u.c. values
are decreasing with increasing Fe/u.c. for the single
peak. Note, that in the case of Al-ZSM-5 [13],
borosilicalite-1 [13,25] and gallosilicalite-1 [26], the
specific influence of the cations Mþ could not be
distinguished, the alkali cations only influenced the
behavior of the TPAþ ions through their relative
quantities. At present, no clear-cut explanation
can be given for this specific behavior of the var-
ious cations. In order to better understand theirrole in the fluorine-route synthesis of zeolites a
study is in progress to identify the various Fe-
species, before and after calcination of the sam-
ples, together with the identification of the various
intermediates produced during the partial decom-
position of the TPAþ ions.
Fig. 2. DSC curves of (Cs, Fe)-silicalite-1 samples prepared with various amounts of CsF from the gel 10SiO2:xFe(NO3)39H2O:
yCsF:1.25TPABr:300H2O at 170 �C with y ¼ 6, 12, 18 and 24.
Table 229Si-MAS NMR results of Fe-ZSM-5 samples obtained from
the system 10SiO2:xFe(NO3)39H2O:15MF:1.25TPABr:300H2O
at 170 �C for 7 days
x I (%) at d (ppm)
)102 )107 )113 )117
0.1 NH4 6.7 9.6 55.5a 28.2
Na 14.7 10.3 62.7 12.3
K 6.9 5.9 69.5 17.7
Cs 10.2 8.8 57.3 23.7
0.2 NH4 7.5 10.9 56.2 25.4
Na 4.3 9.5 53.3a 32.9
K 15.2 16.6 43.2a 25.0
Cs 16.1 19.8 38.1a 26.0
0.3 NH4 12.2 16.5 37.7a 33.6
Na 8.3 11.0 20.3 60.4
K 11.1 7.8 62.7a 18.4
Cs 10.4 2.8 76.1 10.7
aAdditional lines at )110 ppm were added and the sum of
intensities is only reported.
Fig. 1. Variation of TPA/u.c. as a function of Fe/u.c.
62 F. Testa et al. / Microporous and Mesoporous Materials 57 (2003) 57–72
All the 29Si-NMR spectra are characteristic of
ZSM-5 in an orthorhombic form, the corre-
sponding lines are, however, broader due to the
presence of paramagnetic Fe(III) ions in the
framework. All the experimental spectra were de-composed by using four NMR lines centered at
approximately )102, )107, )113 and )117 ppm(Table 2). (In one half of the samples a fifth line
was added at approximately )110 ppm.) The firsttwo lines include the contribution of the SiOM
(M ¼ TPA, M and H) defect groups and that of
Si(OFe)(OSi)3 groups. The latter two lines stem
directly from the MFI framework as Si(OSi)4groups. The amount of SiOM/u.c. was computed
from both the )102 and )107 ppm lines. As theseinclude both SiOM and Si(1Fe) groups:
I�102;�107 ppm ¼ ISiOM þ ISið1FeÞ:
ISið1FeÞ is computed from the Si/Fe ratio (Table 1):
ISið1FeÞ ¼ 100/0.25 Si/Fe. The so-computed valuesare reported in Table 3.
Contrary to what has been reported for Al-
ZSM-5 [24] and Ga-ZSM-5 samples [26], no cor-
relation could be found between the Fe/u.c. and the
SiOM/u.c. values. The amount of defect groups
is rather high, much higher than in the Al- andGa-containing MFI structures. Only the (Cs, Fe)-
ZSM-5 sample does not show any defect groups
with 3.4 Fe/u.c. An extension of this work is nec-
essary to get more details on both the as-made and
calcined Fe-ZSM-5 samples.
Fig. 5 shows SEM pictures of some of the final
crystalline samples obtained at Si/Fe ratio of 33 in
the slurry in the presence of various cations. Themorphology of the crystals depends highly on both
the amount of Fe/u.c. in the structure and the
nature and the amount of M in the gel (Fig. 5 and
Table 4). The (Na, Fe)-silicalite-1 samples con-
tain essentially prismatic crystals, the length of
which can reach 130 lm. The Fe/u.c. is below1 for most of the samples. Even at high Fe/
u.c., the morphology remains prismatic. For the
Fig. 3. Variation of the temperatures of the peaks in the DSC curves as a function of Fe/u.c.
F. Testa et al. / Microporous and Mesoporous Materials 57 (2003) 57–72 63

(NH4, Fe)-silicalite-1 samples, the morphology is
prismatic at low Fe/u.c. (up to 1.3), but it becomes
ovoidal for higher Fe/u.c. values (equal to or
higher than 2). Note again, that the morphology
remains ovoidal for more than 3 Fe/u.c., too.
When the framework Fe/u.c. increases further, the
morphology becomes spherical. These spheres are,
in fact, agglomerates of small crystals. This habitcan be observed for the (K, Fe)- and (Cs, Fe)-
silicalite-1 samples (Table 5) as well. For these
samples, the change in the morphology from
prismatic to ovoidal, then to spherical occurs at
lower Fe/u.c. values, showing that the nature and
probably the amount of Mþ cations in the samples
also influence the crystal morphology.
The aspect (length to the width) ratio decreaseswith increasing Fe-content in the initial gels (Table
4). A rather complex behavior is detected if the
aspect ratios are plotted as a function of 1=r,where r is the radius of the bare exchange cation
M. The 1=r function is thus proportional to theelectrostatic energy of stabilization of the gel by
the various alkali counter-cations. This will be
Table 3
Tetrahedral framework Fe and defect groups per unit cell in Fe-
ZSM-5 samples obtained from the system 10SiO2:xFe(NO3)3-
9H2O:15MF:1.25TPABr:300H2O at 170 �C for 7 days
x M Fe/u.c. SiOM/u.c.a
0.1 NH4 1.2 10.8
Na 0.7 21.2
K 0.7 9.5
Cs 1.3 13.1
0.2 NH4 1.9 10.1
Na 0.7 10.5
K 1.6 24.1
Cs 1.8 31.1
0.3 NH4 3.9 11.9
Na 1.6 12.1
K 1.5 12.1
Cs 3.4 0
a SiOM defect groups, where M ¼ alkali cations, NH4, H or
TPA.
Fig. 4. Variation of TPA/u.c. decomposed at high (HT) and low (LT) temperatures as a function of Fe/u.c.
64 F. Testa et al. / Microporous and Mesoporous Materials 57 (2003) 57–72

discussed in more detail, in connection with thestudy of the rate of crystallization (see below).
The specific effects of the alkali cations is also
clearly visible, if the variation of lengths (L),
widths (W) and aspect ratios (L=W ) are plotted asa function of logR, where R is the crystallization
rate in %h�1 (Fig. 6). Both L andW are decreasing
very rapidly and almost linearly as logR increases(Fig. 6a and b). (NH4, Fe)- and (Na, Fe)-silicalite-1 samples show different variations, although the
slopes of the lines are similar. On the other hand,
(K, Fe)- and (Cs, Fe)-silicalite-1 samples show a
great similarity. Interestingly, the aspect ratios
L=W are increasing with increasing logR values.The pairs (NH4, Fe)–(Na, Fe) and (K, Fe)–(Cs,
Fe) silicalite-1 show similar behaviors (Fig. 6c). All
these results show convincingly that one of themost characteristic features in the physical ap-
pearance of zeolitic crystals, namely the aspect
ratio, does not only depend on the rate of crys-
tallization, but also on the specific interactions of
the exchange cations with the various crystal faces.
The crystallization curves representing the per-
centage of crystallinity as a function of time are
shown in Fig. 7. The peak at 2h ¼ 23:3� in the X-ray diffractogram was used as a measure of crys-
tallinity, taking a sonicated final crystalline sampleas standard for the 100% crystalline sample.
Table 5 reports the initial and final pH values of
the mother liquors, together with the induction
time (tind taken as the time necessary for the ap-pearance of 4% crystallinity), the crystallization
rate (R, expressed in %h�1) computed from the
slopes of the crystallization curves and the loga-
rithms of both the induction rate (1=tind) and of thecrystallization rate.
When logð1=tindÞ is plotted as a function oflogR, a general tendency can be observed: the rateof induction increases with an increasing rate of
crystallization. The points are rather scattered,
suggesting that the possible influence of the vari-
ous factors (pH, Fe(NO3)3-content and MF-con-
tent of the gels) is not exactly the same on the ratesof induction and of crystallization. In the follow-
ing, only general trends will be indicated for the
variation of the induction and crystallization rates.
Due to the rough parallel variation of logð1=tindÞand logR, only the variation of logR will be ana-lyzed in more detail.
From the observation that the pH values of the
mother liquor of the initial slurry (pHi) are alwayshigher than the final pH (pHf) (Table 5) it follows
Fig. 5. SEM pictures of some final Fe-silicalite-1 samples for an Si/Fe ratio of 33 in the presence of various cations.
F. Testa et al. / Microporous and Mesoporous Materials 57 (2003) 57–72 65

that globally OH� ions are consumed during the
dissolution of the solid phase of the gel and the
final condensation of the building units (BUs) to
form the crystalline Fe-silicalite-1. logR increaseswith increasing pH, although the experimental
points are, here too, scattered. A slope of 0.4 can
be proposed for the general trend showing the
positive influence of the OH� ions on the crystal-
lization rate. A similar slope was determined (0.3)
for the synthesis of silicalite-1 in fluoride-contain-
ing media (1 mol NaF in a given slurry) within thepH range of 2.5–6.5 [30] and for the synthesis of
gallosilicalite-1 within the pH range of 7.5–10 [26].
However, increasing the NaF content (to 10 mol,
Table 4
Crystal size (lm) of the samples synthesized from gels of the composition 10SiO2:xFe(NO3)39H2O:yMF:1.25TPABr:300H2O at 170 �C
M x y Shape Size (lm) Aspect ratiosa
L=W W =T
NH4 0.1 6 Prismatic 30� 7� 10 4.3 0.7
15 Prismatic 55� 25� 12 2.2 2.1
24 Prismatic 16:4� 6:4� 6:4 2.6 1.0
0.2 6 Ovoidal 50� 30 1.7 1.0
15 Ovoidal 70� 40 1.8 1.0
24 Ovoidal 50� 30 1.7 1.0
0.3 15 Ovoidal 40� 30 1.3 1.0
24 Ovoidal 30� 24 1.2 1.0
Na 0.1 6 Prismatic 111� 33� 30 3.4 1.1
15 Prismatic 47� 15� 4 3.1 3.8
24 Prismatic 65� 20� 10 3.2 2.0
0.2 6 Prismatic 110� 25� 18 4.4 1.4
15 Prismatic 100� 32� 22 3.1 1.5
24 Prismatic 88� 28� 16 3.1 1.8
0.3 15 Prismatic 51� 17� 10 3.0 1.7
24 Prismatic 129� 44� 32 2.9 1.4
K 0.1 6 Prismatic 40� 25� 8 1.6 3.1
15 Prismatic 50� 30� 5 1.7 6.0
24 Ovoidal 35� 20 1.8 1.0
0.2 6 Ovoidal 50� 25 2.0 1.0
15 Ovoidal 60� 50 1.2 1.0
24 Spherical 15 1.0 1.0
0.3 15 Spherical 51 1.0 1.0
24 Spherical 129 1.0 1.0
Cs 0.1 6 Prismatic 69� 25� 19 2.8 1.3
15 Prismatic 50� 25� 12 2.0 2.1
24 Ovoidal 75� 38 2.0 1.0
0.2 6 Ovoidal 75� 38 2.0 1.0
15 Ovoidal 60� 50 1.2 1.0
24 Spherical 50 1.0 1.0
0.3 6 Ovoidal 30� 16 1.9 1.0
15 Ovoidal 50� 30 1.7 1.0
24 Spherical 50 1.0 1.0
a L=W : length per width; W =T : width per thickness.
66 F. Testa et al. / Microporous and Mesoporous Materials 57 (2003) 57–72

under otherwise identical conditions) a steeperslope was obtained for silicalite-1 within the pH
range of 6–7.5 [31] and for borosilicalite-1 within
the pH range of 7–9.5 [25]. The positive role played
by the OH� ions emphasizes the fact that even in
fluoride-containing media the OH� ions play an
important mineralizing role.
logR slightly decreases with increasing Fe-(NO3)3-content in the gel (Table 5). Sometimes a
minimum is shown as in the case of (NH4, Fe)-
silicalite-1. A similar decrease in the crystallization
rates with trivalent substituting elements (like Al,
B, Ga) has previously been observed showing the
difficulty of the replacement of silicon by foreign
Table 5
Chemical and kinetic parameters for the Fe-silicalite-1 synthesis from the systems 10SiO2:xFe(NO3)39H2O:yMF:1.25TPABr:300H2O
at 170 �C
x y pHi pHf tind (h)a R (%h�1)b 3þ logð1=tindÞ logR
NH4F
0.1 6 7.2 7.0 19.7 5.7 1.70 0.76
15 6.9 6.5 8.0 4.4 2.11 0.64
24 7.0 6.8 9.0 4.5 2.04 0.66
0.2 6 7.0 6.8 48.0 3.0 1.30 0.48
15 7.0 6.9 24.0 3.1 1.62 0.49
24 7.0 6.8 28.0 2.8 1.55 0.45
0.3 15 6.5 6.5 34.0 3.8 1.48 0.58
24 7.0 7.0 53.0 3.6 1.30 0.56
NaF
0.1 6 7.6 7.0 13.0 7.5 1.90 0.88
15 7.5 7.0 7.1 11.2 2.15 1.05
24 7.2 7.0 10.7 10.2 1.95 1.01
0.2 6 7.5 7.0 20.0 6.8 1.70 0.83
15 7.5 7.0 13.0 9.0 1.90 0.95
24 7.1 7.0 13.8 8.6 1.85 0.93
0.3 15 7.2 6.8 12.0 4.6 1.90 0.67
24 7.4 7.0 17.0 4.8 1.78 0.68
KF
0.1 6 8.2 7.5 14.3 18.0 1.84 1.26
15 8.5 8.0 4.2 11.8 2.38 1.07
24 9.1 8.8 5.0 35.0 2.30 1.54
0.2 6 8.0 7.5 13.0 5.0 1.89 0.70
15 8.2 8.0 7.0 9.5 2.15 0.98
24 8.8 8.5 7.9 10.0 2.11 1.00
0.3 15 8.0 7.5 12.0 7.3 1.92 0.86
24 8.8 8.0 16.0 20.0 1.78 1.30
CsF
0.1 15 8.5 8.0 3.0 22.0 2.52 1.34
0.2 15 8.2 7.8 4.6 10.5 2.34 1.02
0.3 15 8.8 8.0 6.0 10.5 2.23 1.02
24 8.8 8.0 8.0 9.8 2.11 0.99
a tind (h) is the induction time corresponding to the appearance of �4% crystalline phase.bR (%h�1) is the crystallization rate.
F. Testa et al. / Microporous and Mesoporous Materials 57 (2003) 57–72 67

substituents in tetrahedral framework positions
[24–26,32].The variation of the crystallization rate as a
function of the amount of MF salts in the slurry
shows interesting behaviors (Table 5). logR de-
creases with increasing MF content for (NH4, Fe)-
silicalite-1 samples. As the F� ions are mineraliz-
ing agents in these syntheses, the decrease might be
attributed to a particular behavior of the NHþ4
ions. Indeed, for the other two cations, Naþ and
Kþ, logR increases with increasing MF content.For the KF:0.1Fe(NO3)3 system even a minimum
is found for 15 KF in the gel.
The specific influence of the various alkali ca-
tions on the crystallization rate can also be rec-
ognized, if logR is plotted as a function of 1=r for15 moles MF in the slurry. A similar variation isfound for the system 24MF:0.3Fe(NO3)3. Cs
þ is
the most effective cation for accelerating the crys-
tallization, followed by Kþ and Naþ. NHþ4 is the
least effective cation.
As mentioned above, the function 1=r is pro-portional to the electrostatic stabilization energy
of a surface which is negatively charged by the
positive cations. As no variation in parallel isfound, this means that the electrostatic stabiliza-
tion energy is not the main factor influencing the
crystallization rate in the case of various exchange
cations. Note, that as a rough increase is observed
for logR as a function of pHi, the pHi values show
a similar variation as a function of 1=r (not shown).This shows once again that the cations act more
through their chemical characteristics than bysolely physical (electrostatic) interaction in the
fluoride-containing media.
Fig. 6. Variation of the length L (a), the widthW (b) and L=W(c) of the crystals as a function of logR (R is the crystallizationrate in %h�1).
Fig. 7. Crystallization curves of Fe-silicalite-1 samples obtained
from the mixture 10 SiO2:0.2Fe(NO3)39H2O:15MF:1.25TPABr:
300H2O at 170 �C.
68 F. Testa et al. / Microporous and Mesoporous Materials 57 (2003) 57–72

It is worth mentioning that the pHi values are
lowest in the presence of NH4F. As both NHþ4 and
F� ions stem from a weak base and a weak acid, in
dilute aqueous solutions the approximate pH is
given by pH ¼ ðpKNH4 þ pKHFÞ=2. This value isequal to 5.6 because pKNH4 ¼ 9:25 and pKHF ¼2:0. The observed values are between 6.5 and 7.0.If, instead of Fe(NO3)3, Ga(NO3)3 is used in sim-
ilar synthesis slurries, the initial pHi is markedly
higher, reaching 6.7–8.5. Thus, specific character-
istics of the substituting ions (like their propen-
sity to hydrolysis of the respective F� containing
ions, or their specific adsorption/reaction on the
silica component) and not least the resulting ionicstrength in the fairly concentrated slurries, all in-
fluence greatly, and in a fairly complex way, the
initial pHi of the slurry and with it the induction
and crystallization rates as well.
These results emphasize the need for further in-
vestigation of the ‘‘solution chemistry’’ of the initial
crystallization slurry.Whereas in the fluoride route,
using slightly acidic or neutral media, the complexstability of various soluble Fe(III) fluoro complexes
determine the (near-) equilibrium concentrations of
various iron species in the slurry, their chemical
identification is currently hampered, because the
temperature of synthesis and the resulting ionic
strength are too high. Nevertheless, one point
seems to be important and worth noting. Irrespec-
tive of the chemical identity of the Fe(III) species(subsequently referred to as BU), it is certain that
this BU is a mononuclear iron species, because the
products are absolutely free of extra-framework
(EFW) iron-oxide/hydroxide which, when present
even in trace amounts, imparts rusty coloration of
various grades (from buff to a bright orange-red
rusty color). The mononuclearity of the BU is
strongly supported by M€oossbauer spectroscopystudies carried out on zeolite samples synthesized
within the frame of this research work (vide infra).
This behavior is in contrast with synthesis routes
carried out in alkaline media. In these methods
gelation of iron silicate is always preceded by the
preparation of a strongly acidic Fe(III) salt solu-
tion (using sulphuric or rather perchloric acid).
After cooling, the iron silicate zeolite precursor gelis formed by the addition of a cool waterglass so-
lution, rich in monomeric silica species. However,
earlier magnetic [33], spectroscopic [34] and po-
tentiometric [35] measurements showed that a
number of complex ions (like [Fe(OH)(H2O)5]2þ,
[(H2O]5Fe–O–Fe(H2O)5]4þ, [Fe2(OH)2(H2O)8]
4þ
where the two Fe(III) ions of octahedral, Oh co-
ordination share common edge, etc.) are formedwhen the pH is changed. Whilst at lower pH (<0.5)the whole iron appears to be monomeric, above
pH ¼ 2 at least 90% of the Fe(III) ions form di-
meric species. It must not be forgotten that, in
order to attain gelation, the pH has to be raised at
least to 4.2–4.4.
In previous publications [7,8], using XP and
M€oossbauer spectroscopy, we showed that thesebinuclear iron species cannot be separated into
monomeric ones; they are present in the iron sili-
cate gel too, and because only one of them can be
built into the zeolitic framework, a relatively high
percentage (using sulphuric acid at the onset,
about 30%) of iron is present in EFW positions
from the very beginning. In other words, these
samples, depending on the total iron content, aremore or less rust-colored. It is surprising, indeed,
that we find hints in the literature [36] that in
strongly alkaline media, at or above 180 �C, thesecolored gels (in the presence of TMA cations)
crystallize into white sodalite (SOD) specimens.
This seems to be possible only if the binuclear iron
species get separated from each other (probably
via forming ferrate anions) during the arduousconditions of the (sodalite) synthesis. We believe
that this mechanism cannot be operative in the
synthesis of ZSM-5 (MFI) zeolites.
From the point of view of catalytic activity both
the fluoride- and alkaline routes might result in
excellent catalysts, nonetheless, for theoretical (e.g.
spectroscopic) studies the fluoride-route should be
preferred because it leads to products with frame-work (FW) iron in unique tetrahedral, Th coordi-nation.
For M€oossbauer spectroscopic studies we se-lected the NH4F (x ¼ 0:1, y ¼ 15) and CsF (x ¼0:2, y ¼ 18) zeolite samples. Their spectra arepresented, respectively in Figs. 8 and 9, and the
corresponding parameters extracted from the
computer fits are given in Table 6.It can be concluded that the incorporation of
iron into framework positions (Fe3þTd) of the MFI
F. Testa et al. / Microporous and Mesoporous Materials 57 (2003) 57–72 69
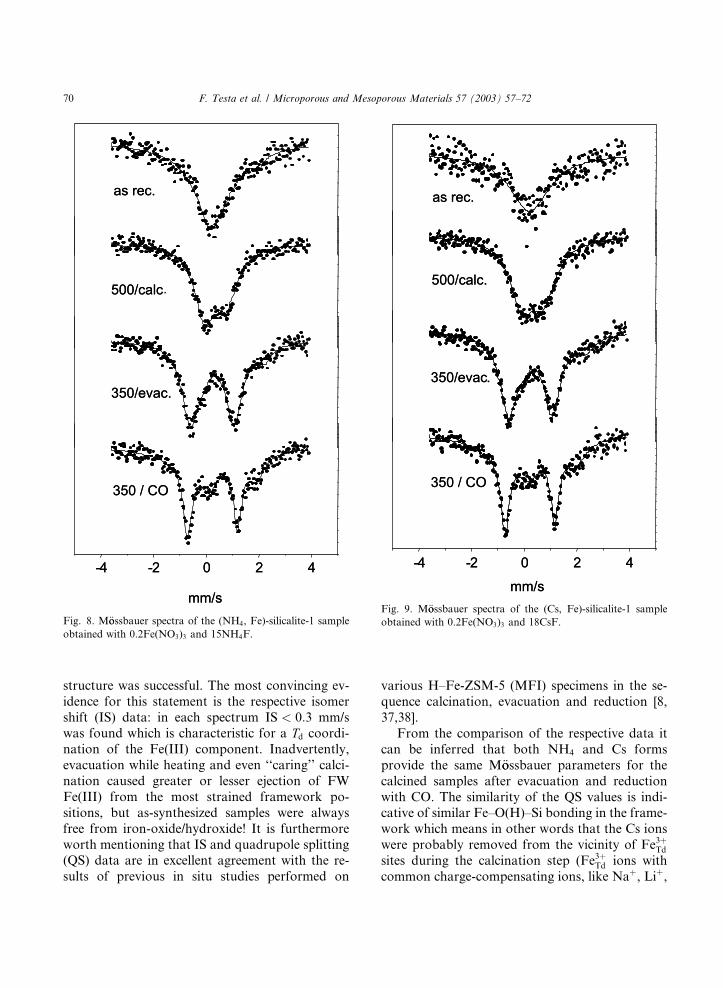
structure was successful. The most convincing ev-
idence for this statement is the respective isomer
shift (IS) data: in each spectrum IS < 0:3 mm/swas found which is characteristic for a Td coordi-nation of the Fe(III) component. Inadvertently,
evacuation while heating and even ‘‘caring’’ calci-
nation caused greater or lesser ejection of FW
Fe(III) from the most strained framework po-
sitions, but as-synthesized samples were always
free from iron-oxide/hydroxide! It is furthermore
worth mentioning that IS and quadrupole splitting(QS) data are in excellent agreement with the re-
sults of previous in situ studies performed on
various H–Fe-ZSM-5 (MFI) specimens in the se-
quence calcination, evacuation and reduction [8,
37,38].
From the comparison of the respective data it
can be inferred that both NH4 and Cs forms
provide the same M€oossbauer parameters for thecalcined samples after evacuation and reduction
with CO. The similarity of the QS values is indi-cative of similar Fe–O(H)–Si bonding in the frame-
work which means in other words that the Cs ions
were probably removed from the vicinity of Fe3þTdsites during the calcination step (Fe3þTd ions with
common charge-compensating ions, like Naþ, Liþ,
Fig. 8. M€oossbauer spectra of the (NH4, Fe)-silicalite-1 sample
obtained with 0.2Fe(NO3)3 and 15NH4F.
Fig. 9. M€oossbauer spectra of the (Cs, Fe)-silicalite-1 sampleobtained with 0.2Fe(NO3)3 and 18CsF.
70 F. Testa et al. / Microporous and Mesoporous Materials 57 (2003) 57–72
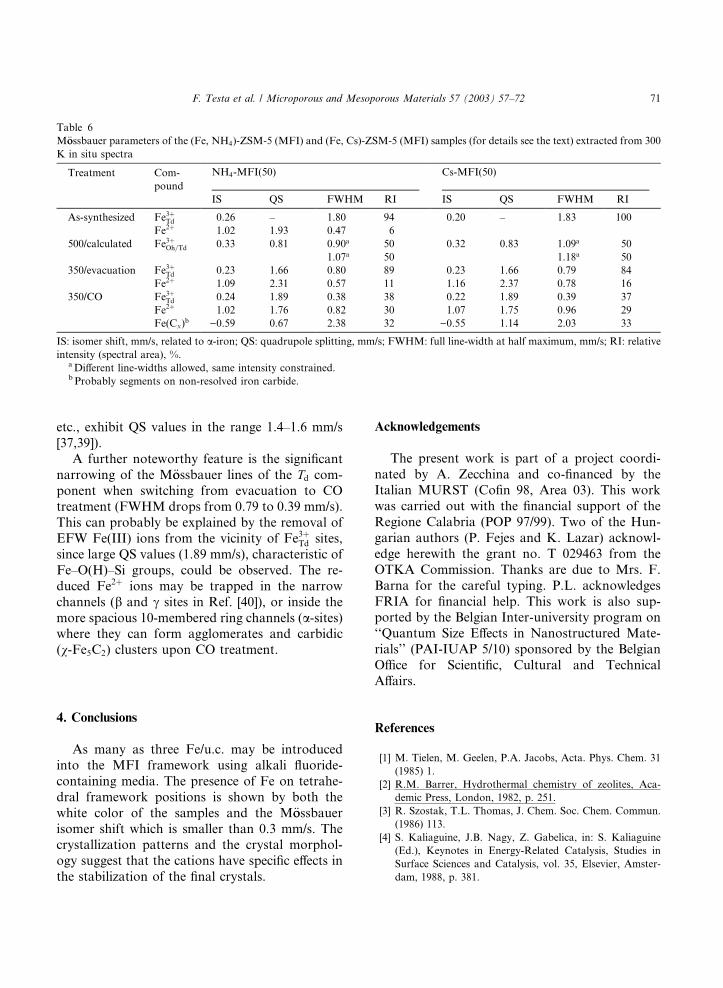
etc., exhibit QS values in the range 1.4–1.6 mm/s
[37,39]).
A further noteworthy feature is the significant
narrowing of the M€oossbauer lines of the Td com-ponent when switching from evacuation to COtreatment (FWHM drops from 0.79 to 0.39 mm/s).
This can probably be explained by the removal of
EFW Fe(III) ions from the vicinity of Fe3þTd sites,
since large QS values (1.89 mm/s), characteristic of
Fe–O(H)–Si groups, could be observed. The re-
duced Fe2þ ions may be trapped in the narrow
channels (b and c sites in Ref. [40]), or inside themore spacious 10-membered ring channels (a-sites)where they can form agglomerates and carbidic
(v-Fe5C2) clusters upon CO treatment.
4. Conclusions
As many as three Fe/u.c. may be introduced
into the MFI framework using alkali fluoride-
containing media. The presence of Fe on tetrahe-
dral framework positions is shown by both the
white color of the samples and the M€oossbauerisomer shift which is smaller than 0.3 mm/s. Thecrystallization patterns and the crystal morphol-
ogy suggest that the cations have specific effects in
the stabilization of the final crystals.
Acknowledgements
The present work is part of a project coordi-
nated by A. Zecchina and co-financed by theItalian MURST (Cofin 98, Area 03). This work
was carried out with the financial support of the
Regione Calabria (POP 97/99). Two of the Hun-
garian authors (P. Fejes and K. Lazar) acknowl-
edge herewith the grant no. T 029463 from the
OTKA Commission. Thanks are due to Mrs. F.
Barna for the careful typing. P.L. acknowledges
FRIA for financial help. This work is also sup-ported by the Belgian Inter-university program on
‘‘Quantum Size Effects in Nanostructured Mate-
rials’’ (PAI-IUAP 5/10) sponsored by the Belgian
Office for Scientific, Cultural and Technical
Affairs.
References
[1] M. Tielen, M. Geelen, P.A. Jacobs, Acta. Phys. Chem. 31
(1985) 1.
[2] R.M. Barrer, Hydrothermal chemistry of zeolites, Aca-
demic Press, London, 1982, p. 251.
[3] R. Szostak, T.L. Thomas, J. Chem. Soc. Chem. Commun.
(1986) 113.
[4] S. Kaliaguine, J.B. Nagy, Z. Gabelica, in: S. Kaliaguine
(Ed.), Keynotes in Energy-Related Catalysis, Studies in
Surface Sciences and Catalysis, vol. 35, Elsevier, Amster-
dam, 1988, p. 381.
Table 6
M€oossbauer parameters of the (Fe, NH4)-ZSM-5 (MFI) and (Fe, Cs)-ZSM-5 (MFI) samples (for details see the text) extracted from 300
K in situ spectra
Treatment Com-
pound
NH4-MFI(50) Cs-MFI(50)
IS QS FWHM RI IS QS FWHM RI
As-synthesized Fe3þTd 0.26 – 1.80 94 0.20 – 1.83 100
Fe2þ 1.02 1.93 0.47 6
500/calculated Fe3þOh=Td 0.33 0.81 0.90a 50 0.32 0.83 1.09a 50
1.07a 50 1.18a 50
350/evacuation Fe3þTd 0.23 1.66 0.80 89 0.23 1.66 0.79 84
Fe2þ 1.09 2.31 0.57 11 1.16 2.37 0.78 16
350/CO Fe3þTd 0.24 1.89 0.38 38 0.22 1.89 0.39 37
Fe2þ 1.02 1.76 0.82 30 1.07 1.75 0.96 29
Fe(Cx)b )0.59 0.67 2.38 32 )0.55 1.14 2.03 33
IS: isomer shift, mm/s, related to a-iron; QS: quadrupole splitting, mm/s; FWHM: full line-width at half maximum, mm/s; RI: relativeintensity (spectral area), %.aDifferent line-widths allowed, same intensity constrained.b Probably segments on non-resolved iron carbide.
F. Testa et al. / Microporous and Mesoporous Materials 57 (2003) 57–72 71

[5] R. Kumar, P. Ratnasamy, J. Catal 116 (1989) 440.
[6] R.B. Borade, A. Adnot, S. Kaliaguine, Zeolites 11 (1991)
710.
[7] P. Fejes, J.B. Nagy, J. Hal�aasz, A. Oszk�oo, Appl. Catal. A:
General 175 (1998) 89.
[8] P. Fejes, J.B. Nagy, K. L�aaz�aar, J. Hal�aasz, Appl. Catal. A:
General 190 (2000) 117.
[9] R.V. Joyner, M. Stockenhuber, in: M.M.J. Treacy, B.K.
Marcus, M.E. Bisher, J.B. Higgins (Eds.), Proceedings of
the 12th International Zeolite Conference, Baltimore, 1998,
vol. II, Materials Research Society, Warrendale, 1999, p.
1367.
[10] H. Berndt, A. Martin, H. Kosslick, B. L€uucke, Microporous
Mesoporous Mater. 2 (1994) 197.
[11] See e.g. D.L. Vanoppen, D.E. DeVos, M.J. Genet, P.G.
Rouxhet, P.A. Jacobs, Angew. Chem. Int. Ed. Engl. 34
(1995) 560.
[12] S. Iwamoto, S. Shimizu, T. Inui, in: J. Weitkamp, H.G.
Karge, H. Pfeifer, W. H€oolderich (Eds.), Zeolites and
Related Microporous Materials: State of the Art 1994,
Studies in Surface Science and Catalysis, vol. 84C, Elsevier,
Amsterdam, 1994, p. 1523.
[13] F. Testa, F. Crea, R. Aiello, J.B. Nagy, in: I. Kiricsi, G.
P�aal-Borb�eely, J.B. Nagy, H.G. Karge (Eds.), Porous Mate-
rials in Environmentally Friendly Processes, Studies in
Surface Science and Catalysis, vol. 125, Elsevier, Amster-
dam, 1999, p. 165.
[14] A.V. Smirnov, F. Di Renzo, O.E. Lebedeva, D. Brunel, B.
Chiche, A. Tavolaro, B.V. Romanovsky, G. Giordano, F.
Fajula, I. Ivanova, in: H. Chon, S.-K. Ihm, Y.S. Uh (Eds.),
Progress in Zeolite and Microporous Materials, Studies in
Surface Science and Catalysis, vol. 105, Elsevier, Amster-
dam, 1997, p. 1325.
[15] V.I. Sobolev, G.I. Pavon, A.S. Kharitonov, V.N. Roman-
nikov, A.M. Volodin, K.J. Ione, J. Catal. 139 (1993) 435.
[16] A.J. Chandwadkar, R.N. Bhat, P. Ratnasamy, Zeolites 11
(1991) 42.
[17] R. Kumar, A. Thangaraj, R.N. Bhat, P. Ratnasamy,
Zeolites 10 (1990) 85.
[18] R. Kumar, P. Ratnasamy, J. Catal. 116 (1989) 440.
[19] F. Testa, F. Crea, G.D. Diodati, L. Pasqua, R. Aiello, G.
Terwagne, P. Lentz, J.B. Nagy, Microporous Mesoporous
Materials 30 (1999) 187.
[20] J.B. Nagy, R. Aiello, F. Crea, F. Testa, in: M.M.J. Treacy,
B.K. Marcus, M.E. Bisher, J.B. Higgins (Eds.), Pro-
ceedings of the 12th Interntional Zeolite Conference,
Baltimore, 1998, vol. II, Materials Research Society,
Warrendale, 1999, p. 1619.
[21] J. Patarin, J.L. Guth, H. Kessler, G. Coudurier, F.Raatz,
Fr. Pat. 8617711, 1986.
[22] G. Debras, E.G. Derouane, J.-P. Gilson, Z. Gabelica, G.
Demortier, Zeolites 3 (1983) 37.
[23] G. Debras, A. Gourgue, J.B. Nagy, G. de Clippeleir,
Zeolites 5 (1985) 377.
[24] R. Aiello, F. Crea, E. Nigro, F. Testa, R. Mostowicz, A.
Fonseca, J.B. Nagy, Microporous Mesoporous Mater. 28
(1999) 241.
[25] F. Testa, R. Chiappetta, F. Crea, R. Aiello, A. Fonseca,
J.-C. Bertrand, G. Demortier, J.-L. Guth, L. Delmotte,
J.B. Nagy, Chem. Mater., submitted for publication.
[26] E. Nigro, F. Crea, F. Testa, R. Aiello, P. Lentz, J.B. Nagy,
Microporous Mesoporous Mater. 30 (1999) 199.
[27] J. El Hage-AlAsswad, N. Dewaele, J.B. Nagy, R. Hubert,
Z. Gabelica, E.G. Derouane, F. Crea, R. Aiello, A. Nastro,
Zeolites 8 (1988) 221.
[28] A. Fonseca, J.B. Nagy, J. El Hage-Al Asswad, R.
Mostowicz, F. Crea, F. Testa, Zeolites 15 (1995) 259.
[29] M. Soulard, S. Bilger, H. Kessler, J.-L. Guth, Zeolites 7
(1987) 463.
[30] A. Tavolaro, R. Mostowicz, F. Crea, A. Nastro, R. Aiello,
J.B. Nagy, Zeolites 12 (1992) 756.
[31] R. Mostovicz, F. Crea, J.B. Nagy, Zeolites 13 (1993) 678.
[32] G. Golemme, A. Nastro, J.B. Nagy, B. Subotic, F. Crea,
R. Aiello, Zeolites 11 (1991) 776.
[33] A. Bose, Proc. Ind. Acad. Soc. A 1 (1935) 754.
[34] L.N. Mulay, P.W. Selwood, J. Am. Chem. Soc. 77 (1955)
2693.
[35] B.O.A. Hedstr€oom, Arkiv Khemi 6 (1938).
[36] D. Goldfarb, M. Bernardo, K.G. Strohmaier, D.E.W.
Vaughan, H. Thomann, J. Am. Chem. Soc. 116 (1994) 6346.
[37] K. L�aaz�aar, G. Borb�eely, H. Beyer, Zeolites 11 (1991) 214.
[38] K. L�aaz�aar, R. Fricke, H. Kosslick, J. Cejka, G. Vorbeck,A.M. Szeleczky, in: H.K. Beyer, H.G. Karge, I. Kiricsi,
J.B. Nagy (Eds.), Catalysis by Microporous Materials,
Studies in Surface Science and Catalysis, vol. 94, Elsevier,
Amsterdam, 1995, p. 219.
[39] A. Raj, S. Sivasanker, K. L�aaz�aar, J. Catal. 147 (1994) 207.
[40] B. Wichterlova, J. Dedecek, Z. Sobalik, in: M.M.J. Treacy,
B.K. Marcus, M.E. Bisher, J.B. Higgins (Eds.), Proceedings
of the 12th International Zeolite Conference, Baltimore,
1998, vol. II, Materials Research Society, Warrendale,
1999, p. 941.
72 F. Testa et al. / Microporous and Mesoporous Materials 57 (2003) 57–72