Mobility of adsorbed species in zeolites: methane, ethane, and propane diffusivities
8
Downloaded from UvA-DARE, the institutional repository of the University of Amsterdam (UvA) http://hdl.handle.net/11245/2.29914 File ID uvapub:29914 Filename 2857108993now911.pdf Version unknown SOURCE (OR PART OF THE FOLLOWING SOURCE): Type article Title The mobility of adsorbed species in zeolites: Methane, ethane and propane diffusivities. Author(s) A.K. Nowak, C.J.J. den Ouden, S.D. Pickett, B. Smit, A.K. Cheetham, M.F.M. Post, J.M. Thomas Faculty UvA: Universiteitsbibliotheek Year 1991 FULL BIBLIOGRAPHIC DETAILS: http://hdl.handle.net/11245/1.423976 Copyright It is not permitted to download or to forward/distribute the text or part of it without the consent of the author(s) and/or copyright holder(s), other than for strictly personal, individual use, unless the work is under an open content licence (like Creative Commons). UvA-DARE is a service provided by the library of the University of Amsterdam (http://dare.uva.nl) (pagedate: 2014-11-27)
-
Upload
independent -
Category
Documents
-
view
3 -
download
0
Transcript of Mobility of adsorbed species in zeolites: methane, ethane, and propane diffusivities

Downloaded from UvA-DARE, the institutional repository of the University of Amsterdam (UvA)http://hdl.handle.net/11245/2.29914
File ID uvapub:29914Filename 2857108993now911.pdfVersion unknown
SOURCE (OR PART OF THE FOLLOWING SOURCE):Type articleTitle The mobility of adsorbed species in zeolites: Methane, ethane and propane
diffusivities.Author(s) A.K. Nowak, C.J.J. den Ouden, S.D. Pickett, B. Smit, A.K. Cheetham, M.F.M.
Post, J.M. ThomasFaculty UvA: UniversiteitsbibliotheekYear 1991
FULL BIBLIOGRAPHIC DETAILS: http://hdl.handle.net/11245/1.423976
Copyright It is not permitted to download or to forward/distribute the text or part of it without the consent of the author(s) and/orcopyright holder(s), other than for strictly personal, individual use, unless the work is under an open content licence (likeCreative Commons). UvA-DARE is a service provided by the library of the University of Amsterdam (http://dare.uva.nl)(pagedate: 2014-11-27)

848 J . Phys. Chem. 1991, 95, 848-854
A from C3 on the ( 2 1 x 3 axis (Figure 4). The crystallographic analyses of parabanic acid and alloxan show that the C.-O-C angles corresponding to the closest intermolecular distances are 157.4 and 154.7O, re~pectively;~.~' the corresponding projected positions of the oxygens on the molecular planes of XI1 and XI11 are 1.06 A from C2 and C3 for the former and 1.19 A from C3 for the latter. Thus these oxygens, which are negative (Figure 4), are near the most positive regions of the surface potentials, and the resulting electrostatic interactions can accordingly account for the short internuclear distances.
Finally, it should be noted that the calculated atomic charges listed in Table I bear little or no relationship to the Vs,c values. For example, the dinitro derivative IX, which has the largest V S , ~ in the table, has only an average acyl carbon charge. Even more striking are the ordering and range of magnitudes of the acyl carbon charges in parabanic acid and alloxan, which do not show at all the same trends as do the surface potentials. In alloxan, the carbon with the largest Vs,c is C3, which has the lowest charge in all of Table I. These observations are consistent with the absence of a reliable correlation between calculated atomic charges and chemical r e a c t i ~ i t y ? * ~ ~ * ~ ~
Summary We have investigated the susceptibilities toward nucleophilic
attack, e.g. hydrolysis, of a group of cyclic ureides. ,We examined the surface electrostatic potentials of these molecules, focusing upon the regions above the acyl carbons, to determine the effects of various chemical and structural modifications, including the presence of NO2 and/or NF2 substituents. The relative hydrolytic stabilities of these systems have been predicted. For the poly- carbonyl molecules parabanic acid and alloxan, the magnitudes and locations of the maxima in their surface potentials are fully consistent with observed unusually short intermolecular distances in their crystalline forms.
Acknowledgment. We thank Dr. Jorge M. Seminario and Mrs. Monica Concha for computational assistance. We greatly ap- preciate the support of this work by the Office of Naval Research through Contract No. N00014-85-K-0217.
(34) Julg, A. In Topics in Current Chemistry; Springer-Verlag: Berlin,
( 3 5 ) Polak, R. Theor. Chim. Acta 1918.50, 21 . 1975; Vol. 58.
Mobility of Adsorbed Species in Zeolites: Methane, Ethane, and Propane Diffusivities
A. K. Nowak,+ C. J . J . den Ouden,*i* S. D. Pickett? B. h i t , * A. K. Cheetham,! M. F. M. Post,* and J. M. Thomast Davy Faraday Research Laboratory, The Royal Institution, 21 Albemarle Street, London WIX 4BS, United Kingdom, KoninklijkelShell-Laboratorium, Amsterdam (Shell Research B. V.). Badhuisweg 3, I031 CM Amsterdam, The Netherlands, and Chemical Crystallography Laboratory, University of Oxford, 9 Parks Road, Oxford OX1 3PD, United Kingdom (Received: February 8, 1990; In Final Form: August 17, 1990)
Molecular dynamics simulations were performed in order to study the influence of the zeolite structure on molecular migration in the zeolitic void space. The migration of methane in various zeolitic environments was examined by using the all-silica polymorphs of zeolite EU- I , mordenite, and silicalite. Furthermore, diffusion simulations of ethane and propane in silicalite were carried out and computed diffusion characteristics were compared with experimental data.
Introduction Computer simulations of adsorption and diffusion in zeolites
have gained much interest over the last few years. This increasing interest is due to the notion that simulations may offer new insights into adsorption and diffusion phenomena that are of direct im- portance in studies on the catalytic activity and selectivity of zeolites.
Limitations arising from insufficient computer power hindered the application of computer simulations in the past. However, thanks to the advances made in the development of computer hardware and methodologies of computational chemistry, com- puter simulations now offer a valuable contribution to zeolite catalysis research.
Several adsorption and diffusion simulations in zeolites have been carried out recently. The first simulations, based on simple potential energy minimizations, identified preferred adsorption sites or potential energy maps of the zeolite inner void space.I4 Later, Monte Carlo (MC) simulations were employed to study the average siting of methane in zeolite Ys and in the zeolites ZSM-5 and mordenite$ Leherte et al.' studied concentration effects on water adsorption in ferrierite.
* Author to whom correspondence should be addressed. 'The Royal Institution. f Koninklijke/Shell-Laboratorium. 'University of Oxford.
0022-3654 I9 1 12095-0848SO2.50 I O
More recently, molecular dynamics (MD) simulations have been applied to determine time-dependent properties such as diffusion coefficients and intracrystalline site residence times for methane in the zeolites Y,8 m ~ r d e n i t e , ~ A,Io and ZSM-5?" for benzene
( I ) Bezus, A. G.; Kiselev, A. V.; Lopatkin, A. A.; Du, P. Q. J. Chem. Soc., Faraday Trans. 2 1978, 74, 367. Kiselev, A. V.; Du, P. Q. J. Chem. Soc., Faraday Trans. 2 1981 77, 1. Kiselev, A. V.; Du, P. Q. J. Chem. Sor., Faraday Trans. 2 1981 77, 17. Kiselev, A. V.; Lopatkin, A. A,; Shulga, A. A. Zeolites 1985, 5, 261.
(2) Wright, P. A.; Thomas, J. M.; Cheetham, A. K.; Nowak, A. K. Nature 1985,318,611.
(3) Muller, U.; Unger, K. K.; Dongfeng, P.; Merman, A.; Grillet, Y.; Rouquerol, F.; Rouquerol, J. In Zeolites as Catalysts, Sorbents and Detergent Builders. Studies in Surface Science and Catalysis; Weitkamp, J., Karge, H. G., Eds.; Elsevier: Amsterdam, (1989; Vol. 46, p 625.
(4) Nowak, A. K.; Cheetham, A. K.; Pickett, S. D.; Ramdas, S. Molecular Simulation 1987, I , 67.
(5) Yashonath, S.; Thomas, J . M.; Nowak, A. K.; Cheetham, A. K. Nature 1988, 331, 601.
(6) Smit, B.; Den Ouden, C. J . J. J . Phys. Chem. 1988, 92, 7169. (7) Leherte, L.; Vercauteren, D. P.; Derouane, E. G.; Andre, J. M. I n
Innovation in Zeolite Materials Science. Studies in Surface Science and Catalysis; Grobet, P. J., Mortier, W. J., Vansant, E. F., Schulz-Ekloff, G., Eds.; Elsevier: Amsterdam, 1988, Vol. 37, p 293.
(8) Yashonath, S.; Demontis, P.; Klein, M. L. Chem. Phys. Lett. 1988, 153 (6), 551.
(9) Den Ouden, C. J . J.; Smit, B.; Wielers, A. F. H.; Jackson, R. A.; Nowak, A. K. Molecular Simulation 1989, 4, 12 I .
(IO) Cohen De Lara, F.; Kahn, R.; Goulay, A. M. J. Chem. Phys. 1989, 90 (12), 7482.
0 1991 American Chemical Societv

Mobility of Adsorbed Species in Zeolites
in zeolite Y,I2 for water in ferrierite,13 and for xenon in ~ilicalite.'~ In all studies mentioned, the computed dynamical results were in good agreement with experimental data. Furthermore, the adsorbates were assumed to be rigid, which as a matter of fact seems a reasonable approximation considering the small size (methane, water) and nature (benzene) of the adsorbates.
In this paper, we will present the results of a systematic study on the influence of zeolite structure on the diffusivity of methane by considering the zeolites silicalite, mordenite, and EU-I. This particular choice allows us to compare migration of adsorbates through microchannels with different dimensions and tortuosities. Furthermore, computational data on the diffusivities of methane, ethane, and propane in silicalite are presented and compared with experimental pulse field gradient NMR (PFG-NMR) data.
Zeolite Structures SilicaliteIs has a three-dimensional channel system with sinu-
soidal channels consisting of 1 0-membered rings running along the a direction and straight channels consisting of 10-membered rings running along the b direction. The silicalite channels are connected with each other to form intersections. MordeniteI6 and zeolite EU- I are both characterized by a one-dimensional channel system with side pockets, which can be entered from the main channels. However, whereas mordenite has main channels con- sisting of 12-membered rings running along the c direction and side pockets with entrances consisting of eight-membered rings along the b direction, zeolite EU-1 has main channels consisting of IO-membered rings running along the a direction and side pockets with entrances formed by 12-membered rings along the c direction. This particular choice of zeolite networks covers a range of possible structures, allowing us to study the influence of topology on the diffusion process.
Calculations Performed For the simplest adsorbate considered in this paper, viz.
methane, diffusion was simulated in the all-silica polymorphs of mordenite, zeolite EU-I, and silicalite.
As a follow-up on the methane studies, ethane and propane diffusivities were examined in silicalite only. Experimental data on methane, ethane, and propane diffusivities in silicalite18 are available, so these studies enable us to verify the computational results.
I n order to eliminate concentration effects when studying structural features, we scaled the loadings of the various zeolites according to the zeolite framework densities. As a reference, silicalite was given a loading, 6 , of two adsorbate molecules per Si24048 unit. The densityI9 of silicalite is 17.9 T/1000 A3, so for mordenite. having a density of 17.2 T/ 1000 A', 6 = ( 1 7.2/17.9) X 2 = 1.9 adsorbate m o l e ~ u l e s / S i ~ ~ O ~ ~ , and for EU-I (density = 18.2 T/IOOO A3), 6 = 2 adsorbate m o l e ~ u l e s / S i ~ ~ O ~ ~ .
In all cases, the simulations were carried out in a zeolite unit consisting of 192 T sites ( 1 X 1 X 2 unit cells). Thus the total number of adsorbates considered in the ensemble is 16 for silicalite and EU-I and 15 for mordenite. Boundary effects were taken into account by applying periodic boundary conditions.
All simulations were performed by using the constraint dy- namics method as described by Allen and Tildesley.20 The zeolite
( I I ) June, R. L.; Bell, A. T.; Thecdorou, D. N. Presented at the 196th National Meeting of the American Chemical Society, Los Angeles, CA 1988.
(12) Yashonath, S.; Demontis, P.; Klein, M. L. J . Phys. Chem. 1989, 93, 5016.
( 1 3 ) Leherte, 1 . ; Lie, G. C.; Swamy, K. N.; Clementi, E.; Derouane, E. G.: Andre, J. M. Chem. Phys. Lett. 1988, 145, (3). 237.
(14) Pickett, S. D.; Nowak, A. K.; Thomas, J. M.; Peterson, B. K.; Swift, J . F. P.; Cheetham, A. K.; Den Ouden, C. J. J.; Smit, B.; Post, M. F. M. J . Phys. Chem. 1990. 94, 1233.
( I 5 ) Lermer, H.; Draeger, M.: Steffen, J.: Unger, K. K. Zeolites 1985, 5, 131.
(16) Meier. W. M. Z . Kristallogr. 1961, 115, 439. (17 ) Briscoe, N. A,; Johnson, D. W.; Kokotailo, G. T.: McCusker. L. B.;
(18) Caro, J.; Bulow, M.; Schirmer, W. J . Chem. Soc.. Faraday Trans.
(19) Meier, W . M.; Olsen, D. H. Atlas ofZeolite Structure Types; But-
Shannon, M. D. Zeolires 1988, 8, 74.
I 1985, 81. 2541.
terworths: London, 1987.
The Journal of Physical Chemistry, Vol. 95, No. 2, 1991 849
TABLE I: Potential Parameters for the van der Waals Interatomic Interactions
atom pair A, kJ/mol.A6 B, kJ/mol.AI2 1742.99 1897055.5 c. * *c
C***H 562.73 274875.3 t i * * * H 191.38 37072.3 c. * *o 1700.67 1 138 724.0 H a * *O 536.74 149 978.5
TABLE 11: Diffusivities for Methane" in the Zeolites Mordenite? EU-l,C and Silicalite' ( D in 108 m2/s) Together with Effective Pore Diameters (in A) for the Separate Directions
X Y Z
zeolite D, diameter Dy diameter D, diameter D mordenite 0.01 0.07 4.5 0.77 7.0 0.28 EU- 1 0.83 5.5 0.31 7.0 0.38 silicalite 0.44 5 .5 1.33 5 . 5 0.11 0.62
T = 298 K. = 1 .9CH4/Si24048. ' 6 = 2CH4/Si24048.
lattice as well as the adsorbate molecules was assumed to be rigid. All internal atom-atom distances of the adsorbates were con- strained with a tolerance of
Every time step, the adsorbate velocities were scaled in order to establish isothermal conditions for the adsorbate ensemble. The simulation temperature was 298 K, while the time step was ps for methane and ps for ethane and propane. The system was equilibrated over a time period typically in the order of 5 ps in order to suppress any undesirable simulation start-up effects. Sampling took place over 50, 5 , and 3 ps for methane, ethane, and propane, respectively. The short simulation times for ethane and propane were imposed by the availability of computer time.
Potentials The interatomic potentials between atoms of the zeolite lattice
and atoms of the adsorbates and between atoms of different adsorbates are described by a van der Waals (6-1 2) Lennard-Jones potential:
q5LJ = B/rI2 - A / r b
where r is the interatomic distance and A and B are poterltial parameters.
Because we are studying nonpolar hydrocarbon molecules in all-silica zeolite polymorphs, Coulombic interactions are not taken into account. In the zeolite, the atomic radius of the silicon atoms is much smaller than the radius of the oxygen atoms. It is thus assumed that silicon atoms are effectively screened by oxygen and their contribution to the potential energy of the adsorbates is not taken into account. Furthermore, their polarizability is negligible compared to that of the zeolite oxygen atoms, which further justifies this assumption. Potential parameters A and B for the various interatomic interactions between adsorbates and all the zeolites considered were determined following Kiselev et al.' and are given in Table I.
We do not include intraframework or intramolecular interac- tions since all simulations are performed on rigid frameworks and adsorbates. This assumption was made for two reasons, firstly, because framework flexibility is not expected to affect the diffusion of relatively small adsorbate molecules to a great extent and, secondly, to save computing time so that longer simulation times can be achieved.
Results and Discussion Methane in Silicalite, Mordenite, and EU-I. Figures 1 , 2, and
3 display the mean-square displacements versus time for methane molecules migrating in the zeolites mordenite, EU- I , and silicalite, respectively. The subfigures a, b, and c represent diffusion in the x, y , and z directions, respectively, while the subfigures d represent the overall mean-square displacements versus time. The x, y , and
A.
~~~~
(20) Allen, M. P.; Tildesley, D. J. Computer Simulation of Liquids; Clarendon Press: Oxford, 1987.
850 The Journal of Physical Chemistry, Vol. 95, No. 2, 1991
I O O r
80
60
40
2 0
- - - - -
0--.
a 100-
8 0
60-
4 0
20-
01 - ' I I 1
-
-
8 0
60
C
- -
::j 1, 100-
80
60
40
20
0 i o 20 30 40 50 TIME ( P S
- - - -
Nowak et al.
b
d
d 0 I O 20 3 0 4 0 5 0
TIME ( p s )
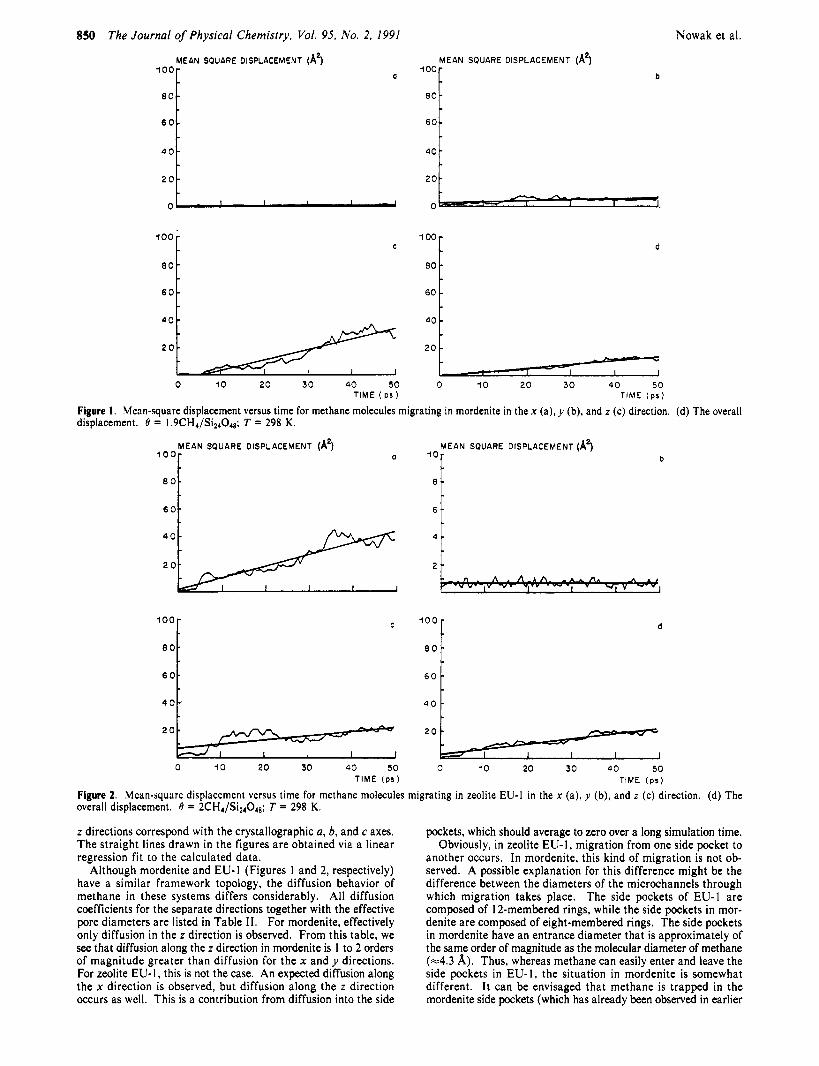
Figure I . Mean-square displacement versus time for methane molecules migrating in mordenite in the x (a), y (b), and z (c) direction. (d) The overall displacement. 0 = 1.9CH4/Si24048; T = 298 K.
MEAN SOUARE DISPLACEMENT (A2)
' "OF
a
60 401 2 0
100-
00.
6 0 -
4 0 .
C
20
0 10 20 30 40 50 T I M E ( p s )
MEAN SOUARE DISPLACEMENT (A2) b 10
8
6
4
2
lool 80
4 0 6ol d
2 o 0 I O 20 30 40 50
TIME ( p s )
Figure 2. Mean-sqoare displacement versus time for methane molecules migrating in zeolite EU-1 in the x (a), y (b), and z (c) direction. (d) The overall displacement. 0 = 2CH4/Si24048; T = 298 K.
z directions correspond with the crystallographic a, b, and c axes. The straight lines drawn in the figures are obtained via a linear regression fit to the calculated data.
Although mordenite and EU-1 (Figures 1 and 2, respectively) have a similar framework topology, the diffusion behavior of methane in these systems differs considerably. All diffusion coefficients for the separate directions together with the effective pore diameters are listed in Table 11. For mordenite, effectively only diffusion in the z direction is observed. From this table, we see that diffusion along the z direction in mordenite is 1 to 2 orders of magnitude greater than diffusion for the x and y directions. For zeolite EU- I , this is not the case. An expected diffusion along the x direction is observed, but diffusion along the z direction occurs as well. This is a contribution from diffusion into the side
pockets, which should average to zero over a long simulation time. Obviously, in zeolite EU-I, migration from one side pocket to
another occurs. In mordenite, this kind of migration is not ob- served. A possible explanation for this difference might be the difference between the diameters of the microchannels through which migration takes place. The side pockets of EU-1 are composed of 12-membered rings, while the side pockets in mor- denite are composed of eight-membered rings. The side pockets in mordenite have an entrance diameter that is approximately of the same order of magnitude as the molecular diameter of methane (=4.3 A). Thus, whereas methane can easily enter and leave the side pockets in EU-I, the situation in mordenite is somewhat different. It can be envisaged that methane is trapped in the mordenite side pockets (which has already been observed in earlier
Mobility of Adsorbed Species in Zeolites
100-
80
60
40
- - -
0
100-
80
60
40
20
-
-
-
-
C 100-
80
60
40
0 0 10 20 30 4 0 5 0
T I M E ( p s )
-
-
-
The Journal of Physical Chemistry, Vol. 95, No. 2, 1991 051
MEAN SQUARE DISPLACEMENT (A2)
80
b
d
2oj 0 20 30 40 50 10 TIME ( P S I 0
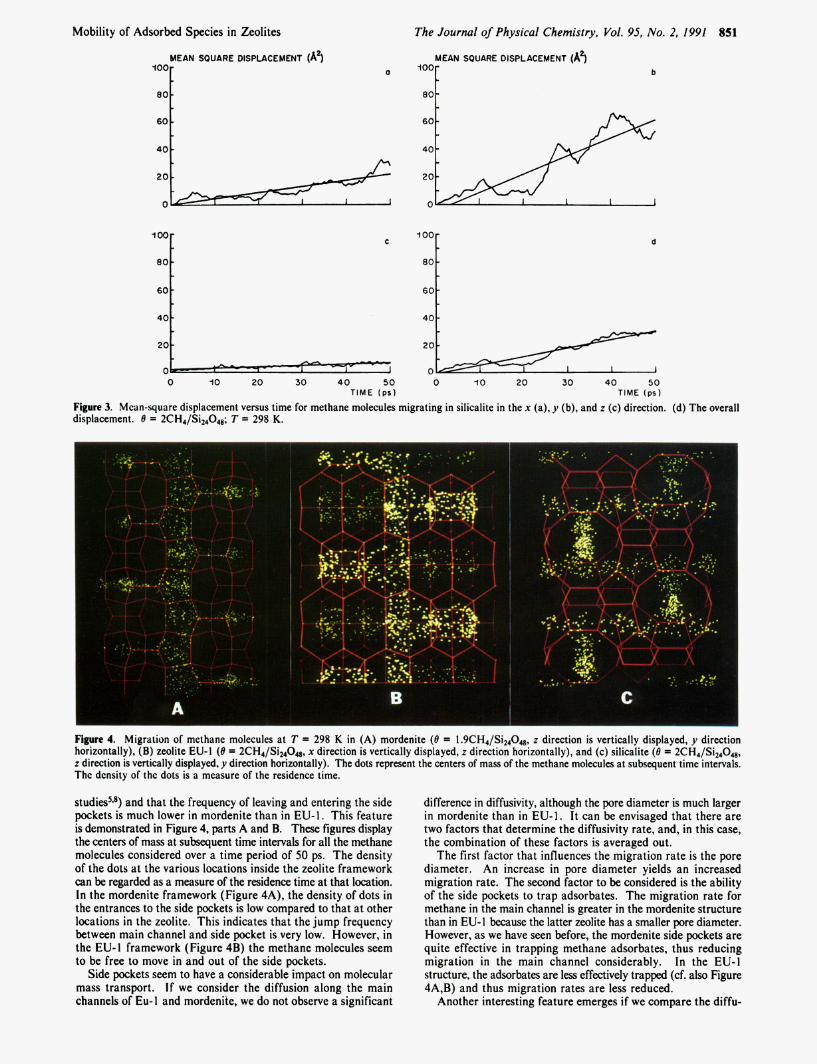
Figure 3. Mcan-square displacement versus time for methane molecules migrating in silicalite in the x (a), y (b), and z (c) direction. (d) The overall displacement. B = 2CH4/Si24048; T = 298 K.
$!$Le- tt%&
Figure 4. Migration of methane molecules at T = 298 K in (A) mordenite (8 = l.9CH4/Si24048, z direction is vertically displayed, y direction horizontally), (B) zeolite EU- 1 (8 = 2CH4/Si24048, x direction is vertically displayed, z direction horizontally), and (c) silicalite (8 = 2CH4/Si24048, z direction is vertically displayed, y direction horizontally). The dots represent the centers of mass of the methane molecules at subsequent time intervals. The density of the dots is a measure of the residence time.
studies5is) and that the frequency of leaving and entering the side pockets is much lower in mordenite than in EU-1. This feature is demonstrated in Figure 4, parts A and B. These figures display the centers of mass at subsequent time intervals for all the methane molecules considered over a time period of 50 ps. The density of the dots at the various locations inside the zeolite framework can be regarded as a measure of the residence time at that location. In the mordenite framework (Figure 4A), the density of dots in the entrances to the side pockets is low compared to that at other locations in the zeolite. This indicates that the jump frequency between main channel and side pocket is very low. However, in the EU-I framework (Figure 4B) the methane molecules seem to be free to move in and out of the side pockets.
Side pockets seem to have a considerable impact on molecular mass transport. If we consider the diffusion along the main channels of Eu-1 and mordenite, we do not observe a significant
difference in diffusivity, although the pore diameter is much larger in mordenite than in EU- 1. It can be envisaged that there are two factors that determine the diffusivity rate, and, in this case, the combination of these factors is averaged out.
The first factor that influences the migration rate is the pore diameter. An increase in pore diameter yields an increased migration rate. The second factor to be considered is the ability of the side pockets to trap adsorbates. The migration rate for methane in the main channel is greater in the mordenite structure than in EU-1 because the latter zeolite has a smaller pore diameter. However, as we have seen before, the mordenite side pockets are quite effective in trapping methane adsorbates, thus reducing migration in the main channel considerably. In the EU-I structure, the adsorbates are less effectively trapped (cf. also Figure 4A,B) and thus migration rates are less reduced.
Another interesting feature emerges if we compare the diffu-

10-
e -
6 -
Nowak et al.
10-
8 -
6 -
a
C
10-
8 -
6 -
4 -
0 *8
10-
8 -
6 -
4 -
0 I 2 3 4 5 T IME ( p s )
b
0 1 2 3 4 5 T I M E ( P S I
Figure 5. Mcan-square displacement versus time for ethane molecules migrating in silicalite in the x (a), y (b), and z (c) direction. (d) The overall displacement. B = 2C2H6/Si24048; T = 298 K .
sivity of methane in silicalite along the straight channel with the diffusivities of methane in the main channels of EU-1 and mor- denite. The diffusion rate in silicalite along the main channel is approximately twice as fast as in EU-I and mordenite. This reflects not only the presence of side pockets but also the openness of the silicalite structure for diffusion. In the silicalite void space, migration along the straight channels might be interrupted tem- porarily if an adsorbate enters one of the sinusoidal channels perpendicular to the straight channels. However, at a following intersection, the adsorbate has the possibility of proceeding again along the original direction but in another straight channel. Thus, in silicalite migration in any direction is never blocked. However, in the case of adsorbates trapped by side pockets, only migration in one direction (out of the side pocket, perpendicular to the main channel) is possible and thus diffusion is strongly reduced.
By comparing the diffusivities of methane in silicalite along the x and directions, we observe that the diffusivity along the sinusoidal channel is a factor of 3 lower than that along the straight channel. It should be noted, however, that diffusion in the x direction cannot proceed via a straight trajectory because of the tortuosity of the channels.
For silicalite it is observed that diffusion in the z direction readily occurs. Apparently, the adsorbate molecules are able to shift between the different channel systems since this is the only way in which migration along the z direction can occur. Figure 4C clearly shows the interconnection of the separate directions in the silicalite framework. Although silicalite has the smallest framework density, its openness for diffusion of methane is the highest of all zeolites considered.
Finally, we interpret our computational results in relation to experimental diffusivity measurements, in particular, PFG-NMR. The overall diffusion coefficients in Table I1 were obtained by taking the averages over the separate directions. By interpreting these figures, one shouid consider the time intervals between subsequent pulses in an PFG-NMR experiment and the timescale in which the MD simulations take place. For example, in EU-I, a diffusion coefficient of 0.3 I X m2/s in the z direction is calculated. However, this diffusion coefficient does not reflect the diffusivity that would be observed by PFG-NMR since no molecular mass transport along the z direction is possible. On the timescale of NMR, migration along the z direction would be averaged out. Since the timescale of MD is several orders of magnitude smaller, migration along the z direction is observed.
TABLE 111: Diffusivities for Methane, Ethane, and Propane in Silicalite (D in 108 m2/s)"
adsorbate D, D I, D, D methane 0.44 I .33 0.1 I 0.62 ethane 0.30 0.88 0.24 0.47 propane 0.30 0.90 0.03 0.41
T = 298 K, B = 2 ad~orbates/Si,~O,, .
Thus, the experimental diffusion coefficients for methane in mordenite and EU-I are estimated to be 0.77 X and 0.83 X m2/s, respectively. For silicalite, on the other hand, migration in all directions is possible, so the overall diffusion coefficient of 0.62 X low8 m2/s for methane as quoted in Table I1 reflects the diffusion coefficient that would be measured by a PFG-NMR experiment. We predict, therefore, that measured diffusion coefficients for methane in the three zeolites should be very similar.
Methane, Ethane, and Propane in Silicalite. I n this section we present results of MD simulations on the diffusivities of methane, ethane, and propane in silicalite. The computational results will be compared with experimental data obtained by PFG-NMR techniques."
Figures 5a-c display the mean-square displacement of the ethane molecules in silicalite versus time. Figure 5d displays the overall mean-square displacement versus time. Figures 6a-d display the same data for propane in silicalite. The straight lines drawn in the figures are obtained via a linear regression fit to the calculated data.
Computed diffusion coefficients for the separate directions and the overall diffusion coefficient are listed in Table 111. For comparison, the computational results for methane in silicalite are also presented in this table.
Computed overall diffusion coefficients are compared with experimental data in Figure 7 . This figure represents the diffusion coefficient as a function of carbon number of the alkanes for a loading R = 2 adsorbate m o l e ~ u l e s / S i ~ ~ O ~ ~ at T = 298 K. We see that for methane and ethane the agreement with experimental data is good. However, in the case of propane, a large deviation shows up. This may originate from the approximation of propane being rigid.
Examination of the diffusion coefficients for the separate di- rections in Table I l l and Figures 6a-d shows that diffusion in the

Mobility of Adsorbed Species in Zeolites
MEAN SQUARE DISPLACEMENT (A2)
3~ a
C
0 0 I 2 3
T IME ( o s )
The Journal of Physical Chemistry, Vol. 95, No. 2, 1991 853
MEAN SQUARE DISPLACEMENT (A2)
b
d
0 I 2 3 TIME (0s)
Figure 6. Mean-squarc displacement versus time for propane molecules migrating in silicalite in the x (a), y (b), and z (c) direction. (d) The overall displacement. B = 2C3HE/Si2404E; T = 298 K.
D (dh) I€-8r
t A EXPERIMENTAL
( re f i 7 )
I THIS WORK I
I E - I D 0 L I 2 CARBON 3 NUMBER 4
Figure 7. Diffusion coefficient in silicalite as a function of carbon num- ber. 0 = 2 adsorbate molec~les /S i~~O~~; T = 298 K.
straight and sinusoidal channels readily occurs, but diffusion in the z direction is virtually negligible. This indicates that during the simulation the propane molecules were not able to shift from one channel system to another due to their rigidness. This com- putational artefact enhances the diffusivity considerably. Fur- thermore, it is highly unlikely that propane molecules migrate in the micropores like bouncing balls. For the smaller adsorbates (methane and ethane), this can be envisaged, but propane is expected to migrate along the zeolite walls in a creeping motion,2'
(21) Derouane, E. G.; Andre, J. M.; Lucas, A. A. Chem. Phys. Lett. 1987,
(22) Papp, H.; Hinsen, W.; Do, N. T.; Baerns, M. Thermochim. Acta 137 (4), 336.
1984, 82, 137.
DSORPTION ENTHALPY (kJ/mot)
1 EXPERIMENTAL f ref 22 - 2 5 )
0 MD (THIS WORK)
I I I
2 3 4 CARBON NUMBER
A
Figure 8. Adsorption enthalpy in silicalite as a function of carbon num- ber. 0 = 2 adsorbate mole~ules/Si~~O~~; T = 298 K.
resulting in a considerable decrease of the diffusion coefficient. However, the rigid constraint on the propane molecule does not
(23) Stach, H.; Lohse, U.; Thamm, H.; Schirmer, W. Zeolites 1986,6,74.

854 J . Phys. Chem. 1991, 95, 854-858
allow a creeping motion. Finally, Figure 8 displays computed and experimental ad-
sorption enthalpies as a function of the alkane carbon number. For all three adsorbates considered, a good agreement between experiment and computation is found. This agreement indicates that the potentials used are fairly accurate. Therefore, we ascribe the mismatch of the propane diffusion coefficient in silicalite to the approximations made with respect to the rigidness of the adsorbate molecule.
Conclusions In this paper we have shown that MD simulations can give
detailed information on a molecular level of mass transport phenomena in porous solids. By considering a set of different
(24) Stach, H.; Thamm, H.; Fiedler, K.; Grauert, B.; Wieker, W.; Jahn, E.; Ohlmann, G. In New Developments in Zeolite Science and Technology; Studies in Surface Science and Catalysis; Murakami, Y., Lijima, A,, Ward, J. W., Eds.; Elsevier: Amsterdam, 1986; Vol. 28, p 539.
(25) Chiang, A. S.; Dixon, A. G.; Ma, Y. H. Chem. Eng. Sci. 1984, 39, 1451, 1461.
zeolite structures, it is possible to examine molecular migration in various microchannels. The pore diameter does not seem to be a limiting factor for methane diffusion (down to a pore diameter of 5.5 A). However, migration rates drop considerably when side pockets are present into which diffusion takes place (mordenite and EU-1) or when the channels are not straight but have a sinusoidal character (silicalite).
For small adsorbates, such as methane and ethane, the com- puted diffusion characteristics are in good agreement with ex- perimental data. However, this is not the case for propane in silicalite. This is probably due to a computational artefact stemming from the superficial assumption of propane being rigid. At this point, it is worth noting that earlier MD simulations dealt with small adsorbates that can be assumed to be rigid or with adsorbates such as benzene for which this assumption is certainly justified. Thus, our studies indicate that adsorbate flexibility plays a significant role during molecular migration.
Computed adsorption enthalpies are in good agreement with experimental data. This indicates that the potentials used are reasonably accurate.
Oxldation of [Au'(CN),]-. Formation of DlcyanogoM( I I I ) Oxide and Colloidal I#onocyanogold( I I I ) Oxide
Shlomo Mossed Hahn- Meitner- Institut Berlin GmbH, Bereich Strahlenchemie, Berlin. Federal Republic of Germany (Received: April 25, 1990)
[Au'(CN),]- is oxidized by 'OH radicals. The primary oxidation product is [(OH)AU"(CN)~]- which is in equilibrium with its protonated form: [(OH)Au"(CN),]- + H+ + [(OH)AU~I(CN)~]-H+. The protonated and the deprotonated oxidation products undergo disproportionation to give the Au"' species which is also in equilibrium with a protonated form: [(O- H)2Au11'(CN)2]- + H+ + [(OH)2Au1JJ(CN)2]-H+. In alkaline solution, the deprotonated Au"' species loses a water molecule to give the stable negatively charged dicyanogold(lI1) oxide [O=AU'~~(CN),]-. In acidic media, splitting of HCN is taking place to give O==Au"'(CN) which agglomerates rapidly into stable colloidal Au(II1). The absorption spectra of the various intermediates and of colloidal Au(ll1) are reported.
Introduction The effort of designing a photosystem capable of cyclic cleavage
of water into H2 and O2 prompted the development of new types of catalysts capable of storage of e1ectrons.l It has been dem- onstrated by Henglein and co-workers and by other authors that extremely small colloidal metals and colloidal semiconductors can be generated in aqueous solution containing metal ions and ad- ditives when exposed to y-radiolysis. For example, colloids of
Au,9Jo Mn02,11-13 IrO2,I4 and Ru021S were prepared successfully in situ in y-irradiated solutions.
Gold may exist in solution in two different stable ionic forms which possess the + I (aurous) and the +3 (auric) oxidation states. (The former is unstable except when complexed.) It has been however demonstrated (first by Faraday and later on by other w o r k e r ~ ~ J ~ J ~ ~ ~ ) that gold may also exist in solution in a colloidal Auo form. Its color varies between the red and the blue depending on the particle's size and shape.
More than 20 years ago, Ghosh-Mazumdar and Hart2' per- formed a pulse radiolysis study on the oxidation and the reduction of [Au'(CN),]- in aqueous solution which may be regarded today as a preliminary one. The authors obtained mainly the absorption spectra of the first intermediates resulting from the action of hydrated electrons and hydroxy radicals on [Au'(CN),]-. The
'Present address: CEA-CEN Saclay, Service de Chimie Moleculaire Bt. 522. F-91191 Gif-sur-Yvette Cedex, France.
absorption spectra were ascribed to zerovalent and divalent gold. N o attempt was done in that work to determine precisely these
( I ) Henglein, A. Top. Curr. Chem. 1988, 143, 113. (2) Henglein, A. J . Phys. Chem. 1979, 83, 2209. (3) Henglein, A. J . Phys. Chem. 1979, 83, 2858. (4) Henglein, A. Ber. Bunsen-Ges. Phys. Chem. 1980, 84, 253. (5) Henglein, A. J . Phys. Chem. 1980,84, 3461. (6) Henglein, A.; Lilie, J . J . Am. Chem. SOC. 1981, 103, 1059. (7) Henglein, A.; Lindig, B.; Westerhausen, J. J . Phys. Chem. 1981,85,
(8) Henglein, A.; Tausch-Terml. R. J . Colloid Interjoce Sci. 1981,80,84. (9) Westerhausen, J.; Henglein, A.; Lilie, J . J . Ber. Bunsen-Ges. Phys.
(IO) Mosseri, S.; Henglein, A.; Janata, E. J . Phys. Chem. 1989,93,6791. ( 1 1 ) Lume-Pereira, C.; Baral, S.; Henglein, A.; Janata, A. J . Phys. Chem.
(12) Lume-Pereira, C.; Janata, E.; Henglein, A. J . Phys. Chem. 1985.89,
( I 3) Baral, S.; Lume-Periera, C.; Janata, E.; Henglein, A. J . Phys. Chem.
(14) Harriman, A.; Nahor, G. S.; Mosseri, S.; Neta, P. J . Chem. Soc.,
( I 5 ) Harriman, A.; Neta, P. J . Chem. Soc., Faraday Trans. 1 1987, 83,
(16) Turkevich, J.; Garton, G.; Stevenson, P. C. J . Colloid Sci., Suppl. 1
(17) Hillier, J.; Turkevich, J.; Stavenson, P. C. Faraday Soc. Discuss.
(18) Meisel, D. J . Am. Chem.Soc. 1979, 101,6133. ( I 9) Koppel, K.; Meyerstein, D.; Meisel, D. J . Phys. Chem. 1980.84870. (20) Meisel, D.; Mulac, W. A.; Matheson, M. S. J . Phys. Chem. 1981,85,
1627.
Chem. 1981,85, 182.
1985,89, 5772.
5779.
1986. 90,6025.
Faraday Trans. 1 1988, 84, 2821.
3001.
1954, 26 and references therein.
1951, 2, 55.
179.
0022-3654191 12095-0854%02.50/0 0 1991 American Chemical Society


![Reactions of bis[1,2-bis(dialkylphosphino)ethane]-(dihydrogen)hydridoiron(1+) with alkynes](https://static.fdokumen.com/doc/165x107/63146d10c32ab5e46f0ce1ad/reactions-of-bis12-bisdialkylphosphinoethane-dihydrogenhydridoiron1-with.jpg)