Structuration and glass transition temperature of the adsorbed ...
182
Thèse soutenue le 24 th Octobre 2016 devant le jury composé de : Prof. Jean Paul CHAPEL Rapporteur (Université de Bordeaux, France) Dr. Allison SAITER Rapporteur (Université de Rouen, France) Prof. Alain GIBAUD Examinateur (Université du Maine, France) Prof. Nicolas DELORME Examinateur (Université du Maine, France) Prof. Yves GROHENS Directeur de thèse (Université de Bretagne Sud, France) Dr. Guillaume VIGNAUD Co- Directeur de thèse (Université de Bretagne Sud, France) Prof. Sabu THOMAS Co- Directeur de thèse (Mahatma Gandhi University, India) THÈSE / UNIVERSITÉ DE BRETAGNE-SUD sous le sceau de l’Université Bretagne Loire pour obtenir le titre de DOCTEUR DE L’UNIVERSITÉ DE BRETAGNE-SUD Mention : École doctorale SICMA Structuration and glass transition temperature of the adsorbed polymer layer: some insights in the property deviations of the ultra-thin polymer film présentée par : Aparna BEENA UNNI Préparée à l’IRDL, FRE CNRS 3744 Institut de Recherche Dupuy de Lôme Etablissement de rattachement : Université de Bretagne Sud Structuration and glass transition temperature of the adsorbed polymer layer : some insights in the property deviations of the ultra-thin polymer film Aparna Beena Unni, 2016
-
Upload
khangminh22 -
Category
Documents
-
view
0 -
download
0
Transcript of Structuration and glass transition temperature of the adsorbed ...

Thèse soutenue le 24th Octobre 2016
devant le jury composé de :
Prof. Jean Paul CHAPEL
Rapporteur (Université de Bordeaux, France)
Dr. Allison SAITER
Rapporteur (Université de Rouen, France)
Prof. Alain GIBAUD
Examinateur (Université du Maine, France)
Prof. Nicolas DELORME
Examinateur (Université du Maine, France)
Prof. Yves GROHENS
Directeur de thèse (Université de Bretagne Sud, France)
Dr. Guillaume VIGNAUD
Co- Directeur de thèse (Université de Bretagne Sud, France)
Prof. Sabu THOMAS
Co- Directeur de thèse (Mahatma Gandhi University, India)
THÈSE / UNIVERSITÉ DE BRETAGNE-SUD
sous le sceau de l’Université Bretagne Loire
pour obtenir le titre de
DOCTEUR DE L’UNIVERSITÉ DE BRETAGNE-SUD Mention :
École doctorale SICMA
Structuration and glass transition
temperature of the adsorbed
polymer layer: some insights in
the property deviations of the
ultra-thin polymer film
présentée par : Aparna BEENA UNNI Préparée à l’IRDL, FRE CNRS 3744 Institut de Recherche Dupuy de Lôme Etablissement de rattachement :
Université de Bretagne Sud
Structuration and glass transition temperature of the adsorbed polymer layer : some insights in the property deviations of the ultra-thin polymer film Aparna Beena Unni, 2016

Structuration and glass transition temperature of the
adsorbed polymer layer: some insights in the property
deviations of the ultra-thin polymer film
A dissertation submitted in the partial fulfilment of the requirement for the degree of
Doctor of Philosophy
by
Aparna BEENA UNNI
University of South Brittany
Department of Sciences & Engineering Sciences
&
International and Inter University Centre for Nanoscience and Nanotechnology
Mahatma Gandhi University, India
Defended on 24th
October, 2016, in front of the following commission:
Prof. Jean Paul CHAPEL Reviewer (Université de Bordeaux, France)
Dr. Allison SAITER Reviewer (Université de Rouen, France)
Prof. Alain GIBAUD Examiner (Université du Maine, France)
Prof. Nicolas DELORME Examiner (Université du Maine, France)
Prof. Yves GROHENS Director of Thesis (Université de Bretagne Sud, France)
Dr. Guillaume VIGNAUD Co-Director of Thesis (Université de Bretagne Sud, France)
Prof. Sabu THOMAS Co-Director of Thesis (Mahatma Gandhi University, India)
Structuration and glass transition temperature of the adsorbed polymer layer : some insights in the property deviations of the ultra-thin polymer film Aparna Beena Unni, 2016

Dedicated to my Grandparents
Late. Smt. Saraswathy Amma
&
Late. Mr. Sreedharan Nair
Structuration and glass transition temperature of the adsorbed polymer layer : some insights in the property deviations of the ultra-thin polymer film Aparna Beena Unni, 2016
Acknowledgments
First and foremost I thank Prof. Yves GROHENS and Prof. Sabu THOMAS who have been al-
ways there to listen and give their valuable advices. My PhD would not have been possible with-
out their kind help and support.
I express my deepest gratitude to Dr. Guillaume VIGNAUD. I am very fortunate to have an advi-
sor like him who helped me through out with his appropriate suggestions. He has been always
there with patience and support, keeping me in the right track for solving problems, leading to the
completion of this dissertation.
I thank Dr. Bastien SEANTIER for his kindness and patience for training me with AFM. He was
helpful and was always ready for technical discussions. I thank Dr. HELIAS and Dr. CHEBIL for
the training during initial days of my work. My hearty thanks to Dr. GIERMANSKA and Prof.
CHAPEL for very nice discussions and fruitful experiments we had during the collaboration at
CRPP. I appreciate very much a number of interesting discussions with Dr. J. K. Bal, who was
always willing to help me with my doubts.
I am much obliged to Prof. Christophe BALLEY, Prof. Jean-François FELLER, Dr. Stéphane
BRUZAUD, Prof. Pierre-Yves MANACH, Dr. Alain BOURMAUD, Dr. Antoine LE-DUIGOU
and Dr. Mickaël CASTRO. I would like to acknowledge Dr. Isabelle PILLIN, Mr. Hervé
BELLEGOU, Mr. Anthony MAGUERESSE, Mr. Antoine KERVOELEN and Mrs. Francoise
PÉRESSE for their technical supports.
I would also like to express my sincere gratitude towards the reviewers Prof. Jean Paul CHAPEL
and Dr. Allison SAITER for their kind time spend for reviewing this dissertation. I convey my
gratitude towards the jury members Prof. Alain GIBAUD and Dr. Nicolas DELORME for their
valuable support.
Special thanks to Dr. Nandakumar Kalarikkal, Dr. Nisha Kurivilla and Dr. Gargi Raina for guid-
ing me towards research.
Structuration and glass transition temperature of the adsorbed polymer layer : some insights in the property deviations of the ultra-thin polymer film Aparna Beena Unni, 2016
I take this opportunity to thank all teachers in my life. I thank all my colleagues at NSS college of
Engineering, Palakkad, for their kind support.
It is important to mention that I was lucky to have a group of fun loving intellectual friends
around me. I thank Dr. Benjamin Saulnier, Clara Jimenez-Saelices, Morgane Deroine, Marine
Lan for creating a wonderful ambience in the lab. I would also like to thank Morgane Tanguy,
Antoine Jouin, Antoine Lemartinel, Abhishek Sachan, Tran Manh-Trung, Clement Gourier, Ca-
mille Goudenhooft, Justin Merotte, Kevin Henry, Dr. Yves-Marie Corre, Dr. Rajendran Mu-
thuraj, Dr. David Siniscalco, Dr. Pierre Lemechko, Dr. Abdel Kader and Mikael Kedzierski for
making a very good atmosphere around me. Even if we had very short time together, I am much
obliged to Dr. Neethu Ninan for her kind advice and help. I extend my deepest appreciation for
my dearest friends Talal Manzoor and Krishna Priya C V, for their support and patience through-
out my PhD.
I am always indebted to my grandparents Mr. Medayil Ramachandran Nair and Late. Ms. Anan-
davalli Amma. Thanks to all my family members for their kind support. Lot of thanks to Ila devi
Unni, for being such a wonderful sister. Special thanks for her concern and prayers for my publi-
cations. Finally, but the foremost, I thank my parents M. R. Unni , Ms. Beena Sreedharan Nair
and Ettumanoorappan for their unconditional support, blessings and love.
I thank each and every one of those who helped me all along, leading to the attainment of this
degree.
Structuration and glass transition temperature of the adsorbed polymer layer : some insights in the property deviations of the ultra-thin polymer film Aparna Beena Unni, 2016

CONTENTS
Introduction ...................................................................................................................................... 1
Chapter 1. Materials and Methods ............................................................................................. 19
1.1 Materials used ............................................................................................................ 20
1.1.1 Polymers ................................................................................................................... 20
1.1.2 Ceria Nanoparticles .................................................................................................. 21
1.2 Sample preparation .................................................................................................... 21
1.2.1 Substrate preparation ................................................................................................ 21
1.2.2 Thin film formation .................................................................................................. 25
1.3 Characterization ......................................................................................................... 29
1.3.1 Ellipsometry ............................................................................................................. 29
1.3.2 Atomic force microscopy ......................................................................................... 35
1.3.3 X-ray Reflectivity ..................................................................................................... 40
1.3.4 Contact angle goniometry ........................................................................................ 43
1.3.5 Solvent rinsing using dip coater ............................................................................... 45
Chapter 2. Density variations of polymer thin films under confinement; a study based on Ceria
nanoparticle adsorption .................................................................................................................. 49
2.1 Introduction ............................................................................................................... 50
2.2 Ceria NP adsorption for sensing the density variations ............................................. 52
2.3 NP deposition on polymer thin films and data acquisition ........................................ 54
2.4 Nanoparticle adsorption as a function of refractive index value of polymers ........... 56
2.5 Density and NP adsorption of PS thin films .............................................................. 58
Structuration and glass transition temperature of the adsorbed polymer layer : some insights in the property deviations of the ultra-thin polymer film Aparna Beena Unni, 2016
2.6 Density and NP adsorption of PMMA thin films ...................................................... 61
2.7 Influence of substrate on NP adsorption .................................................................... 63
2.8 Correlation of density with thin film thermal behavior ............................................. 68
2.9 Conclusion ................................................................................................................. 71
Chapter 3. Stable ultrathin polymer films (<7nm) made by solvent rinsing ............................. 79
3.1 Introduction ............................................................................................................... 80
3.2 Ultrathin polymer films ............................................................................................. 83
3.2.1 Formation of ultrathin film (< 7 nm) by direct spin-coating .................................... 83
3.2.2 Formation of ultrathin films (≤ 7 nm) by solvent rinsing treatment ........................ 85
3.3 Correlation between the kinetics of dissolution and annealing ................................. 91
3.4 Morphology and verification of residual layer on substrates surface ........................ 92
3.5 Stability or instability of residual films of tunable thickness .................................... 94
3.5.1 The stability of residual films on H-Si wafers ......................................................... 94
3.5.2 The instability/metastability of residual films on SiOx-Si wafers ........................... 97
3.6 Conclusion ............................................................................................................... 105
Chapter 4. Characteristic features of ultrathin polymer residual layer studied by rinsing with
different solvents. ......................................................................................................................... 111
4.1 Introduction ............................................................................................................. 112
4.2 The film prior to solvent rinsing .............................................................................. 116
4.3 Thickness of polymer residual layer after rinsing with various solvents ................ 117
4.4 The morphology of polymer residual layer after rinsing with various solvents ...... 118
4.5 The stability/instability of polymer residual layer analyzed with Van der Waals -
intermolecular theory ............................................................................................................. 123
Structuration and glass transition temperature of the adsorbed polymer layer : some insights in the property deviations of the ultra-thin polymer film Aparna Beena Unni, 2016
4.6 The stability/instability of polymer residual layer analyzed with effective free energy of
the system ............................................................................................................................... 127
4.7 Conclusion ............................................................................................................... 131
Chapter 5. Stability and glass transition temperature of residual films on H-Si wafers .......... 139
5.1 Introduction ............................................................................................................. 140
5.2 Thickness and morphology of polymer residual layer after rinsing with various solvents
……………………………………………………………………………………..143
5.3 The stability/instability of polymer residual layer analyzed with Van der Waals -
intermolecular theory ............................................................................................................. 146
5.4 Glass transition properties of polymer residual layer .............................................. 149
5.5 Conclusion ............................................................................................................... 153
Conclusion and Perspectives ........................................................................................................ 163
Structuration and glass transition temperature of the adsorbed polymer layer : some insights in the property deviations of the ultra-thin polymer film Aparna Beena Unni, 2016

Introduction
1
Introduction
Miniaturization being one of the most sought after criteria in current technological research, the
number of studies focusing on the confinement increases day by day. Polymer films that are con-
fined by their thickness (Polymer thin films) obtained great scientific attention due to their wide
variety of technological and industrial applications. It found numerous applications in biomedi-
cal area, [1], [2] nanoelectronics, [3]–[6] tissue engineering, [7], [8] lithographic resists, [9], [10]
coatings, [11] sensors, [12] adhesives, [13] organic solar cells, [14], [15] etc. just to mention a
few. The properties of such polymer films, which are confined by their thickness are the combi-
nation of its interfacial properties and size effects. Generally these films are found to be in the
following forms
1. Free standing: films that have two free surfaces
2. Supported: films with one free surface and supported by a substrate
3. Capped: films without free surface
Figure 0-1. Three forms of polymer thin films: free standing, supported and capped films. In this thesis, we focus on the confinement effects of supported polymer thin films. The proper-
ties of the supported polymer thin films are resulting from the cumulative effect of interplay be-
tween the free surface, the substrate interface, size reduction etc. Such films exhibits various
anomalous properties compared to their bulk counterparts. It includes the deviations in viscosity,
physical aging, stability, density, glass transition temperature etc. just to mention a few. [16]–[20]
The property deviations of polymer films when they are confined by their thickness re-
main an interesting topic of discussion from long. Since Jackson and McKenna (1991) first dis-
covered a reduced glass transition temperature (Tg) in ortho-terphenyl (o-TP) confined in na-
nometer size pores, there has been a great deal of interest in nano-confinement effects on Tg and
on the dynamics of amorphous materials. [21]
Structuration and glass transition temperature of the adsorbed polymer layer : some insights in the property deviations of the ultra-thin polymer film Aparna Beena Unni, 2016

Introduction
2
The question, “Is the molecular surface of polystyrene really glassy?” was raised by Meyers et al.
back in 1992. [22] In 1993, Reiter observed the dewetting of polystyrene thin films at a thickness
below 10 nm at temperatures inferior to its bulk glass transition temperature. These findings sug-
gest that Tg was lower for ultrathin films than for thick films. This was the first direct evidence of
the thickness dependent chain mobility of polymer films confined at nanoscale. [23] Later a liq-
uid-like layer at the free surface was suggested as the main contributing factor to reduced Tg val-
ues in thin films by Keddie et. al. [24] This was the first systematic investigation of glass transi-
tion in thin polymer films, which involved the ellipsometric measurements of Tg in PS films sup-
ported on hydrogen terminated Si wafers. [24] The Tg was correlated to the films thickness by
means of an empirical equation as follows:
ℎ = ∞ "1 − $%ℎ&δ'
Here ∞ refers to the bulk Tg value, h is the film thickness, A and δ are the fitting pa-
rameters. They found that the Tg values for films whose thickness is less than 40 nm was reduced
below the bulk value. The lowest measured Tg value was 25 K less than the bulk value. Quantita-
tively similar results were obtained for various molecular weight studied. This means that neither
chain entanglements nor bulk radius of gyration, Rg plays a significant role in defining this Tg
reduction for supported PS thin films. [25]–[28] This effect was suggested as being dominated by
the existence of a liquid-like layer near the free surface with a characteristic size which increased
as the temperature was raised.
Focusing more on the influence of free surface on the film properties, an enhanced mo-
bility and thereby reduced Tg was attributed to the chain end segregation to the surface by Mayes.
[29] However, if chain ends were the origin of this effect, it would be expected that the thickness
dependence of Tg could be significantly altered by varying the surface chain-end concentration by
modification of the polymer molecular weight, which is not supported by experimental data.
Many studies were done on the free standing polymer films in order to understand more about the
influence of free surface. The first measurements of Tg values in free-standing PS films have been
done by Forrest et al. using Brillouin light scattering for films of 29-70 nm.[30] The Tg of a 20
nm thick film was found to be reduced by more than 70 °C relative to the bulk, whereas for a
similar thickness supported PS films, only a variation of 10 °C is observed. [31]
Structuration and glass transition temperature of the adsorbed polymer layer : some insights in the property deviations of the ultra-thin polymer film Aparna Beena Unni, 2016

Introduction
3
Subsequently a lot of experimental studies supported the notion that mobility is enhanced near
the free surface, which includes the contribution from Forrest et al. [32], [33], Ediger et. al. [34]–
[36], McKenna et al. [37], [38] and many others. [39]–[41]. Although there is substantial evi-
dence supporting a free-surface effect as the origin of Tg reductions in nanoconfined PS films,
there is not yet a detailed understanding of the free-surface effect.
Concerning the substrate interface, further work from Keddie et.al revealed the significant
role of specific interactions between polymer and substrate, that can determine the Tg variations.
[42] From this study, PMMA on a gold substrate displays depressions in Tg, while the same pol-
ymer on a silicon oxide substrate showed a small increase of Tg. The elevated Tg in PMMA-SiO2
system was attributed to the attractive interaction between PMMA and the Si native oxide due to
hydrogen bonding whereas PMMA-gold interaction is much weaker resulting in decreased Tg
value. The study of van Zanten et al. focused on the effect of polymer substrate interaction using
poly-2-vinylpyridine on oxide-coated Si substrates that possess much stronger attractive interac-
tion. [43] In that case, the Tg value was found to increase above the bulk Tg, with a maximum
increase of 50 K for 7.7 nm film. Later, a lot of studies reported the significant influence of pol-
ymer substrate interaction by the Tg averaged along with the whole film thickness. [31], [38],
[44]–[55]
Taking in account the presence of free surface along with the polymer substrate interface,
an empirical equation was suggested by Hsu et al. which predicted an enhancement of Tg relative
to its bulk value, in addition to commonly encountered Tg reduction. [56] In this case, the
measures of free surface effect along with the polymer substrate interaction were considered with
the film thickness and characteristic length which determine the glass transition temperature. In-
terface and surface effects on the glass transition in thin polystyrene films were studied by Posi-
tron annihilation lifetime spectroscopy (PALS) measurement showing that the entire film may
not be characterized as having only one value of Tg. It was later proposed a three-layer model in
which, every layer possesses different mobilities and glass transition temperatures. [57] A con-
tinuous multilayer model was later developed by Kim et. al. [58] which explained the decrease in
the Tg with decreasing thickness via ellipsometery where they obtained a depth dependent Tg pro-
file.
Structuration and glass transition temperature of the adsorbed polymer layer : some insights in the property deviations of the ultra-thin polymer film Aparna Beena Unni, 2016

Introduction
4
The model film consists of many continuous layers and each layer has a different Tg, which in-
creases monotonically to the bulk Tg with increasing distance from the free surface of the film.
The first experimental measurements of Tg in different layers of PS films were made by Bliznyuk
et al. on supported films and Ellison and Torkelson, on both free-standing and supported films
using scanning force microscopy and fluorescence-multilayer method respectively. [59], [60]
Bliznyuk et al. showed that for films of ∼25 nm, the glass-transition temperature in the surface
region decreases by ∼33 K with decreasing film thickness. Ellison and Torkelson have found that
when the thicknesses of all three layers are comparable (∼12 nm), the Tg decreases by 14, 5, and
4 K for surface, middle, and substrate layers respectively. Experiments with neutron reflectivity
measurements on multilayered PS thin films suggested that in supported films Tg is apparently
determined by competition between the surface and interfacial Tg. [61] Multiple glass transition
temperatures of polymer thin films as probed by multi-wavelength ellipsometery [58], [62]–[65]
and by Atomic Force Microscopy spectroscopy [66] gave evidences for the thin films which are
organized as multilayers. Strong substrate dependence of stratification properties in the multi
layers was also observed during the experiments. However, the layer models remain empirical to
some extent and it need to fit to experimental data to obtain the essential parameters that charac-
terize the surface layer and interfacial region. A recent study by the florescence bilayer method
could recover the bulk Tg on a time scale reflecting the degree of adsorption, by submerging the
adsorbed layer by the deposition of an additional layer above the residual layer. [67] They also
found that there exists a substantial reduction in Tg as compared to bulk due to the influence of
the free surface. Apart from the surface and interface effects, there are various other factors that
are known to influence Tg in confined systems including tacticity, [68]–[70] molecular weight for
PMMA thin films, [63], [71]–[73] sample preparation and measurement environment, [74]–[77]
annealing conditions, [78] chemical structure [79], [80] etc. It is also important to mention that no
shift in Tg is reported by the study on the effect of the substrate on the Tg of PMMA films, due to
film confinement and substrate interaction. [81], [82]
Considering the theories used for explaining the anomalous glass transition, Cohen and
Turnbull introduced the free volume theory in order to explain the anomalous behavior in glass
transition temperature for thin confined films. [83] It is based on the assumption that molecular
transport in viscous fluids occurs only when voids, having a volume large enough to accommo-
date a molecule, form by the redistribution of some “free volume”.
Structuration and glass transition temperature of the adsorbed polymer layer : some insights in the property deviations of the ultra-thin polymer film Aparna Beena Unni, 2016

Introduction
5
The specific free volume is defined by Vf = V − Vocc, where V is the total specific volume and
Vocc is the occupied volume including the interstitial free volume and the van der Waals volume
of molecules. In this model, the slowdown of the molecular transport in super cooled was as-
sumed to be occurring to a decrease of free volume rather than to the existence of energy barriers.
Later this model was broadened by Macedo and Litovitz taking into account both attractive and
repulsive forces. [84] A sliding model was proposed by de Gennes which could explain many of
the qualitative features of the Tg reductions in the presence of free surface. [85] The model pro-
posed a competition between two different modes of mobility: (1) the usual small length scale
segmental mobility associated with the bulk glass transition and (2) the polymer chain ‘slides’
along the direction of the primitive path, which requires less free volume. [86] Though the pre-
ceded experiments could provide a qualitative agreement with this model, quantitative differ-
ences still exist. [87], [88] Another explanation was from Ngai who proposed a coupling model to
glass transition dynamics. [89], [90] This approach has attempted to couple conventional ideas of
glass transition dynamics with polymer chain confinement. Adam and Gibbs developed a theory
of the glass transition where the decrease of the configurational entropy with decreasing tempera-
ture implies a concomitant increase of the length scale of the glass transition. [91] Apart from
this, various other approaches like the thermodynamic models, [92] mode coupling theory, [93]
Donth’s approach [94], [95] etc. are also commonly used. More recently, Napolitano et al.
showed that an essential parameter in the process of adsorption regulating the magnitude of Tg
deviations from bulk behavior is the amount of free interface, that is, the portion of interface ex-
hibiting no adsorbed polymer chains (Interstitial free volume). [96] Later, the free volume holes
diffusion (FVHD) model nicely rationalized the connection between the magnitude of Tg devia-
tions and the amount of free interface. [97]–[99] It also provides a way to understand the physical
aging. However, modern theory demonstrates that dynamical heterogeneity emerges during the
glass transition, [100] indicating that the diffusion of free volume holes in glassy state might also
show dynamical heterogeneity, that is, some free volumes diffuse faster and others move slower.
[101]
Considering all this available reports, the factors affecting the glass transition properties,
the deviations in thin film properties due to confinement etc., needs lot more experiments for a
clearer understanding. The main goal of this work is to contribute towards the studies on con-
finement effects in supported polymer thin films.
Structuration and glass transition temperature of the adsorbed polymer layer : some insights in the property deviations of the ultra-thin polymer film Aparna Beena Unni, 2016
Introduction
6
Considering various properties that change due to confinement, at the outset we investigate the
density variations in polymer thin films. In order to avoid the fitting models that are commonly
employed in the measurement techniques which can mislead the density determination, a novel
method of ceria nanoparticles adsorption was used for probing the density variations. One of the
main difficulties that were faced during our first study was, the polymer films become unstable
when they are reduced by their thickness and it dewets. So the next aim was to obtain stable films
with very small thickness. For this, a top down solvent rinsing method was employed along with
tuning of substrate properties, which gave stable polymer residual layers of thickness ranging
from 1.3 - 7nm. It was indeed intriguing to study the influence of solvents that were employed for
the rinsing process and hence it is analyzed in detail. Finally the glass transition properties of the
residual layers are studied.
The manuscript is organized in the following way:
Chapter 1: This chapter presents the materials and the experimental techniques that have been
used in this work. The first part deals with the studied materials, followed by the methods em-
ployed for carrying out the experiments and finally the characterization techniques involved in
this work are described.
Chapter 2: This chapter begins with a brief introduction to density studies and its significance.
The possibility of using ceria nanoparticles for probing the polymer thin films density and the
underlying theory is discussed. Then the study of Ceria nanoparticle adsorption on polystyrene
and poly (methyl methacrylate) films of varying thickness is detailed, which throws light on the
density evolution of these films with respect to their thickness. The influence of substrate on this
study is verified and finally a brief note on the correlation of density with thin film thermal be-
havior is made.
Chapter 3: In this chapter, initially the stability issues observed when the polymer thin films are
confined by their thickness are discussed. Then the instabilities observed on ultrathin film by di-
rect spin-coating is discussed which is followed by the discussion about the formation of ultrathin
films by solvent rinsing method.
Structuration and glass transition temperature of the adsorbed polymer layer : some insights in the property deviations of the ultra-thin polymer film Aparna Beena Unni, 2016

Introduction
7
The kinetics of dissolution during solvent rinsing and the effect of annealing are discussed. Then
the stability/instability of the residual layer is analyzed experimentally and is compared with the
Lifshitz van der Waals intermolecular theory.
Chapter 4: This chapter analyses significance of solvent used in the solvent assisted rinsing ex-
periments. It starts with a brief introduction about the interaction of supported polymer films with
the solvent.
Then, the thickness and morphology details of the residual layer after rinsing with various sol-
vents are discussed. Then the stability/instability of the residual layers is analyzed experimentally
and is interpreted with the help of Lifshitz van der Waals intermolecular theory.
Chapter 5: This chapter begins with an introduction to the glass transition behavior reported for
confined supported polymer thin films. The thickness and morphology details of polymer residual
layers obtained after rinsing with various solvents are discussed. The stability of such films is
analyzed both experimentally and theoretically. Finally the observations on glass transition prop-
erties of such films are studied by means of multi wavelength ellipsometry are discussed in detail.
Finally, some general conclusions and future perspectives are discussed.
Structuration and glass transition temperature of the adsorbed polymer layer : some insights in the property deviations of the ultra-thin polymer film Aparna Beena Unni, 2016

Introduction
8
REFERENCES
[1] V. K. Vendra, L. Wu, and S. Krishnan, “Polymer Thin Films for Biomedical
Applications,” in Nanotechnologies for the Life Sciences, Wiley, 2007.
[2] A. L. Hook, C.-Y. Chang, J. Yang, J. Luckett, A. Cockayne, S. Atkinson, Y. Mei, R.
Bayston, D. J. Irvine, R. Langer, D. G. Anderson, P. Williams, M. C. Davies, and M. R.
Alexander, “Combinatorial discovery of polymers resistant to bacterial attachment,” Nat.
Biotechnol., vol. 30, no. 9, pp. 868–875, Sep. 2012.
[3] J. Ouyang, C.-W. Chu, C. R. Szmanda, L. Ma, and Y. Yang, “Programmable polymer thin
film and non-volatile memory device,” Nat Mater, vol. 3, no. 12, pp. 918–922, Dec. 2004.
[4] C. D. Dimitrakopoulos and P. R. L. Malenfant, “Organic Thin Film Transistors for Large
Area Electronics,” Adv. Mater., vol. 14, no. 2, pp. 99–117, Jan. 2002.
[5] S. R. Forrest, “The path to ubiquitous and low-cost organic electronic appliances on
plastic,” Nature, vol. 428, no. 6986, pp. 911–918, Apr. 2004.
[6] C. Kim, A. Facchetti, and T. J. Marks, “Polymer Gate Dielectric Surface Viscoelasticity
Modulates Pentacene Transistor Performance,” Science (80-. )., vol. 318, no. 5847, pp. 76–
80, Oct. 2007.
[7] X. Liu and P. X. Ma, “Polymeric Scaffolds for Bone Tissue Engineering,” Ann. Biomed.
Eng., vol. 32, no. 3, pp. 477–486, 2004.
[8] L. Lu, C. A. Garcia, and A. G. Mikos, “In vitro degradation of thin poly(DL-lactic-co-
glycolic acid) films,” J. Biomed. Mater. Res., vol. 46, no. 2, pp. 236–244, 1999.
[9] Y.-C. Tseng, Q. Peng, L. E. Ocola, D. A. Czaplewski, J. W. Elam, and S. B. Darling,
“Enhanced polymeric lithography resists via sequential infiltration synthesis,” J. Mater.
Chem., vol. 21, no. 32, pp. 11722–11725, 2011.
[10] H. Duan, J. Zhao, Y. Zhang, E. Xie, and L. Han, “Preparing patterned carbonaceous
nanostructures directly by overexposure of PMMA using electron-beam lithography,”
Nanotechnology, vol. 20, no. 13, p. 135306, 2009.
Structuration and glass transition temperature of the adsorbed polymer layer : some insights in the property deviations of the ultra-thin polymer film Aparna Beena Unni, 2016

Introduction
9
[11] X. Li, X. Yu, and Y. Han, “Polymer thin films for antireflection coatings,” J. Mater.
Chem. C, vol. 1, no. 12, pp. 2266–2285, 2013.
[12] B. Adhikari and S. Majumdar, “Polymers in sensor applications,” Prog. Polym. Sci., vol.
29, no. 7, pp. 699–766, Jul. 2004.
[13] Q. Huang, I. Yoon, J. Villanueva, K. Kim, and D. J. Sirbuly, “Quantitative mechanical
analysis of thin compressible polymer monolayers on oxide surfaces,” Soft Matter, vol. 10,
no. 40, pp. 8001–8010, 2014.
[14] S. Günes, H. Neugebauer, and N. S. Sariciftci, “Conjugated Polymer-Based Organic Solar
Cells,” Chem. Rev., vol. 107, no. 4, pp. 1324–1338, Apr. 2007.
[15] G. Li, R. Zhu, and Y. Yang, “Polymer solar cells,” Nat. Photonics, vol. 6, no. 3, pp. 153–
161, Mar. 2012.
[16] H. Bodiguel and C. Fretigny, “Reduced viscosity in thin polymer films,” Phys. Rev. Lett.,
vol. 97, no. 26, pp. 266105, 1–4, 2006.
[17] C. J. Ellison, S. D. Kim, D. B. Hall, and J. M. Torkelson, “Confinement and processing
effects on glass transition temperature and physical aging in ultrathin polymer films: novel
fluorescence measurements.,” Eur. Phys. J. E. Soft Matter, vol. 8, no. 2, pp. 155–66, May
2002.
[18] J. E. Pye and C. B. Roth, “Above, below, and in-between the two glass transitions of
ultrathin free-standing polystyrene films: Thermal expansion coefficient and physical
aging,” J. Polym. Sci. Part B Polym. Phys., vol. 53, no. 1, pp. 64–75, Jan. 2015.
[19] A. Sharma and G. Reiter, “Instability of Thin Polymer Films on Coated Substrates:
Rupture, Dewetting, and Drop Formation,” J. Colloid Interface Sci., vol. 178, no. 2, pp.
383–399, 1996.
[20] G. Vignaud, M. S. Chebil, J. K. Bal, N. Delorme, T. Beuvier, Y. Grohens, and A. Gibaud,
“Densification and Depression in Glass Transition Temperature in Polystyrene Thin
Films,” Langmuir, vol. 30, no. 39, pp. 11599–11608, 2014.
Structuration and glass transition temperature of the adsorbed polymer layer : some insights in the property deviations of the ultra-thin polymer film Aparna Beena Unni, 2016

Introduction
10
[21] C. L. Jackson and G. B. McKenna, “Proceedings of the International Discussion Meeting
on Relaxations in Complex Systems The glass transition of organic liquids confined to
small pores,” J. Non. Cryst. Solids, vol. 131, pp. 221–224, 1991.
[22] G. F. Meyers, B. M. DeKoven, and J. T. Seitz, “Is the molecular surface of polystyrene
really glassy?,” Langmuir, vol. 8, no. 9, pp. 2330–2335, Sep. 1992.
[23] G. Reiter, “Mobility of polymers in films thinner than their unperturbed size,” Europhys.
Lett., vol. 23, no. 8, p. 579, 1993.
[24] J. L. Keddie, R. A. L. Jones, and R. A. Cory, “Size-Dependent Depression of the Glass
Transition Temperature in Polymer Films .,” Europhys. Lett., vol. 27, no. July, pp. 59–64,
1994.
[25] O. K. C. Tsui and H. F. Zhang, “Effects of Chain Ends and Chain Entanglement on the
Glass Transition Temperature of Polymer Thin Films,” Macromolecules, vol. 34, no. 26,
pp. 9139–9142, Dec. 2001.
[26] C. J. Ellison, M. K. Mundra, and J. M. Torkelson, “Impacts of Polystyrene Molecular
Weight and Modification to the Repeat Unit Structure on the Glass
Transition−Nanoconfinement Effect and the Cooperativity Length Scale,”
Macromolecules, vol. 38, no. 5, pp. 1767–1778, Mar. 2005.
[27] S. Kawana and R. A. L. Jones, “Character of the glass transition in thin supported polymer
films,” Phys. Rev. E, vol. 63, no. 2, p. 21501, 2001.
[28] J. Mattsson, J. A. Forrest, and L. Börjesson, “Quantifying glass transition behavior in
ultrathin free-standing polymer films,” Phys. Rev. E, vol. 62, no. 4, pp. 5187–5200, Oct.
2000.
[29] A. M. Mayes, “Glass Transition of Amorphous Polymer Surfaces,” Macromolecules, vol.
27, no. 11, pp. 3114–3115, May 1994.
[30] J. A. Forrest, K. Dalnoki-Veress, J. R. Stevens, and J. R. Dutcher, “Effect of Free Surfaces
on the Glass Transition Temperature of Thin Polymer Films,” Phys. Rev. Lett., vol. 77, no.
10, pp. 2002–2005, Sep. 1996.
Structuration and glass transition temperature of the adsorbed polymer layer : some insights in the property deviations of the ultra-thin polymer film Aparna Beena Unni, 2016

Introduction
11
[31] J. A. Forrest, K. Dalnoki-Veress, and J. R. Dutcher, “Interface and chain confinement
effects on the glass transition temperature of thin polymer films,” Phys. Rev. E, vol. 56, no.
5, pp. 5705–5716, 1997.
[32] D. Qi, Z. Fakhraai, and J. A. Forrest, “Substrate and chain size dependence of near surface
dynamics of glassy polymers,” Phys. Rev. Lett., vol. 101, no. 9, pp. 1–4, 2008.
[33] Z. Fakhraai and J. A. Forrest, “Measuring the surface dynamics of glassy polymers.,”
Science, vol. 319, pp. 600–604, 2008.
[34] K. Paeng, S. F. Swallen, and M. D. Ediger, “Direct Measurement of Molecular Motion in
Freestanding Polystyrene Thin Films,” J. Am. Chem. Soc., vol. 133, no. 22, pp. 8444–
8447, Jun. 2011.
[35] K. Paeng, R. Richert, and M. D. Ediger, “Molecular mobility in supported thin films of
polystyrene, poly(methyl methacrylate), and poly(2-vinyl pyridine) probed by dye
reorientation,” Soft Matter, vol. 8, no. 3, pp. 819–826, 2012.
[36] M. D. Ediger and J. A. Forrest, “Dynamics near Free Surfaces and the Glass Transition in
Thin Polymer Films: A View to the Future,” Macromolecules, vol. 47, pp. 471–478, 2014.
[37] M. Alcoutlabi and G. B. McKenna, “Effects of confinement on material behaviour at the
nanometre size scale,” J. Phys. Condens. Matter, vol. 17, no. 15, pp. R461–R524, 2005.
[38] H. Yoon and G. B. McKenna, “Substrate Effects on Glass Transition and Free Surface
Viscoelasticity of Ultrathin Polystyrene Films,” Macromolecules, vol. 47, no. 24, pp.
8808–8818, Dec. 2014.
[39] B. Zuo, Y. Liu, L. Wang, Y. Zhu, Y. Wang, and X. Wang, “Depth profile of the segmental
dynamics at a poly(methyl methacrylate) film surface,” Soft Matter, vol. 9, no. 39, pp.
9376–9384, 2013.
[40] F. Chen, C.-H. Lam, and O. K. C. Tsui, “The Surface Mobility of Glasses,” Science (80-.
)., vol. 343, no. 6174, pp. 975–976, Feb. 2014.
[41] J. DeFelice, S. T. Milner, and J. E. G. Lipson, “Simulating Local Tg Reporting Layers in
Glassy Thin Films,” Macromolecules, vol. 49, no. 5, pp. 1822–1833, Mar. 2016.
Structuration and glass transition temperature of the adsorbed polymer layer : some insights in the property deviations of the ultra-thin polymer film Aparna Beena Unni, 2016

Introduction
12
[42] J. L. Keddie, R. A. L. Jones, and R. A. Cory, “Interface and surface effects on the glass-
transition temperature in thin polymer films,” Faraday Discuss., vol. 98, pp. 219–230,
1994.
[43] J. van Zanten, W. Wallace, and W. Wu, “Effect of strongly favorable substrate interactions
on the thermal properties of ultrathin polymer films,” Physical Review E, vol. 53. pp.
R2053–R2056, 1996.
[44] O. K. C. Tsui, T. P. Russell, and C. J. Hawker, “Effect of Interfacial Interactions on the
Glass Transition of Polymer Thin Films,” Macromolecules, vol. 34, no. 16, pp. 5535–
5539, Jul. 2001.
[45] R. S. Tate, D. S. Fryer, S. Pasqualini, M. F. Montague, J. J. de Pablo, and P. F. Nealey,
“Extraordinary elevation of the glass transition temperature of thin polymer films grafted
to silicon oxide substrates,” J. Chem. Phys., vol. 115, no. 21, p. 9982, 2001.
[46] D. S. Fryer, R. D. Peters, E. J. Kim, J. E. Tomaszewski, J. J. de Pablo, P. F. Nealey, C. C.
White, and W. Wu, “Dependence of the Glass Transition Temperature of Polymer Films
on Interfacial Energy and Thickness,” Macromolecules, vol. 34, no. 16, pp. 5627–5634,
Jul. 2001.
[47] S. Napolitano, D. Prevosto, M. Lucchesi, P. Pingue, M. D’Acunto, and P. Rolla,
“Influence of a reduced mobility layer on the structural relaxation dynamics of aluminum
capped ultrathin films of poly(ethylene terephthalate).,” Langmuir, vol. 23, no. 4, pp.
2103–9, Feb. 2007.
[48] D. Labahn, R. Mix, and A. Schönhals, “Dielectric relaxation of ultrathin films of supported
polysulfone,” Phys. Rev. E, vol. 79, no. 1, p. 11801, Jan. 2009.
[49] Y. Shin, H. Lee, W. Lee, and D. Y. Ryu, “Glass Transition and Thermal Expansion
Behavior of Polystyrene Films Supported on Polystyrene-Grafted Substrates,”
Macromolecules, 2016.
[50] H. Yang and J. S. Sharp, “Interfacial Effects and the Glass Transition in Ultrathin Films of
Poly(tert-butyl methacrylate),” Macromolecules, vol. 41, no. 13, pp. 4811–4816, Jul. 2008.
Structuration and glass transition temperature of the adsorbed polymer layer : some insights in the property deviations of the ultra-thin polymer film Aparna Beena Unni, 2016
Introduction
13
[51] W. Ding, R. F. Sanchez, M. R. Ruggles, and P. Bernazzani, “Effect of surface interactions
on the glass transition temperature behavior of amorphous polystyrene,” J. Polym. Res.,
vol. 20, no. 6, p. 146, May 2013.
[52] R. P. White, C. C. Price, and J. E. G. Lipson, “Effect of Interfaces on the Glass Transition
of Supported and Freestanding Polymer Thin Films,” Macromolecules, vol. 48, no. 12, pp.
4132–4141, Jun. 2015.
[53] J. Baschnagel, H. Meyer, F. Varnik, S. Metzger, M. Aichele, M. Müller, and K. Binder,
“Computer Simulations of Polymers Close to Solid Interfaces: Some Selected Topics,”
Interface Sci., vol. 11, no. 2, pp. 159–173, 2003.
[54] D. Hudzinskyy, A. V. Lyulin, A. R. C. Baljon, N. K. Balabaev, and M. A. J. Michels,
“Effects of strong confinement on the glass-transition temperature in simulated atactic
polystyrene films,” Macromolecules, vol. 44, no. 7, pp. 2299–2310, Apr. 2011.
[55] J. Xu, L. Ding, J. Chen, S. Gao, L. Li, D. Zhou, X. Li, and G. Xue, “Sensitive
Characterization of the In fl uence of Substrate Interfaces on Supported Thin Films,”
Macromolecules, vol. 47, no. 18, pp. 6365–6372, 2014.
[56] D. T. Hsu, F. G. Shi, B. Zhao, and M. Brongo, “Theory for the thickness dependent glass
transition temperature of amorphous polymer thin films,” in Electrochemical Society, Low
and High Dielectric Constant Materials, and Thin Film Materials for Advanced Packaging
Technologies, 2000, vol. 99, no. 7, pp. 53–61.
[57] G. DeMaggio, W. Frieze, D. Gidley, M. Zhu, H. Hristov, and a. Yee, “Interface and
Surface Effects on the Glass Transition in Thin Polystyrene Films,” Phys. Rev. Lett., vol.
78, no. 8, pp. 1524–1527, Feb. 1997.
[58] J. H. Kim, J. Jang, and W.-C. Zin, “Thickness Dependence of the Glass Transition
Temperature in Thin Polymer Films,” Langmuir, vol. 17, no. 9, pp. 2703–2710, May 2001.
[59] V. N. Bliznyuk, H. E. Assender, and G. A. D. Briggs, “Surface Glass Transition
Temperature of Amorphous Polymers. A New Insight with SFM,” Macromolecules, vol.
35, no. 17, pp. 6613–6622, Aug. 2002.
Structuration and glass transition temperature of the adsorbed polymer layer : some insights in the property deviations of the ultra-thin polymer film Aparna Beena Unni, 2016

Introduction
14
[60] C. J. Ellison and J. M. Torkelson, “The distribution of glass-transition temperatures in
nanoscopically confined glass formers.,” Nat. Mater., vol. 2, no. 10, pp. 695–700, Oct.
2003.
[61] R. Inoue, K. Kawashima, K. Matsui, T. Kanaya, K. Nishida, G. Matsuba, and M. Hino,
“Distributions of glass-transition temperature and thermal expansivity in multilayered
polystyrene thin films studied by neutron reflectivity,” Phys. Rev. E, vol. 83, no. 2, p.
21801, Feb. 2011.
[62] A. El Ouakili, G. Vignaud, E. Balnois, J.-F. Bardeau, and Y. Grohens, “Multiple glass
transition temperatures of polymer thin films as probed by multi-wavelength
ellipsometry,” Thin Solid Films, vol. 519, no. 6, pp. 2031–2036, Jan. 2011.
[63] T. Lan and J. M. Torkelson, “Methacrylate-based polymer films useful in lithographic
applications exhibit different glass transition temperature-confinement effects at high and
low molecular weight,” Polymer., vol. 55, no. 5, pp. 1249–1258, Mar. 2014.
[64] M. Y. Efremov, A. V. Kiyanova, J. Last, S. S. Soofi, C. Thode, and P. F. Nealey, “Glass
transition in thin supported polystyrene films probed by temperature-modulated
ellipsometry in vacuum,” Phys. Rev. E - Stat. Nonlinear, Soft Matter Phys., vol. 86, pp. 1–
11, 2012.
[65] A. El Ouakili, G. Vignaud, E. Balnois, J.-F. Bardeau, and Y. Grohens, “Glass transition
temperatures of isotactic poly(methymethacrylate) thin films and individual chains probed
by multi wavelength ellipsometry,” Eur. Phys. J. Appl. Phys., vol. 56, p. 13703, 2011.
[66] N. Delorme, M. S. Chebil, G. Vignaud, V. Le Houerou, J.-F. Bardeau, R. Busselez, A.
Gibaud, and Y. Grohens, “Experimental evidence of ultrathin polymer film stratification
by AFM force spectroscopy,” Eur. Phys. J. E, vol. 38, no. 6, p. 56, 2015.
[67] M. J. Burroughs, S. Napolitano, D. Cangialosi, and R. D. Priestley, “Direct Measurement
of Glass Transition Temperature in Exposed and Buried Adsorbed Polymer Nanolayers,”
Macromolecules, vol. 49, no. 12, pp. 4647–4655, 2016.
Structuration and glass transition temperature of the adsorbed polymer layer : some insights in the property deviations of the ultra-thin polymer film Aparna Beena Unni, 2016

Introduction
15
[68] Y. Grohens, M. Brogly, C. Labbe, M.-O. David, and J. Schultz, “Glass Transition of
Stereoregular Poly(methyl methacrylate) at Interfaces,” Langmuir, vol. 14, no. 11, pp.
2929–2932, May 1998.
[69] Y. Grohens, L. Hamon, G. Reiter, a. Soldera, and Y. Holl, “Some relevant parameters
affecting the glass transition of supported ultra-thin polymer films,” Eur. Phys. J. E, vol. 8,
no. 2, pp. 217–224, May 2002.
[70] B. Frieberg, E. Glynos, G. Sakellariou, and P. F. Green, “Physical aging of star-shaped
macromolecules,” ACS Macro Lett., vol. 1, no. 5, pp. 636–640, 2012.
[71] W. Xia, D. D. Hsu, and S. Keten, “Molecular Weight Effects on the Glass Transition and
Confinement Behavior of Polymer Thin Films,” Macromol. Rapid Commun., vol. 36, no.
15, pp. 1422–1427, 2015.
[72] K. Geng and O. K. C. Tsui, “Effects of Polymer Tacticity and Molecular Weight on the
Glass Transition Temperature of Poly(methyl methacrylate) Films on Silica,”
Macromolecules, p. acs.macromol.6b00108, 2016.
[73] K. Geng, F. Chen, and O. K. C. Tsui, “Molecular-weight dependent T g depression of
silica-supported poly (α-methyl styrene) films,” J. Non. Cryst. Solids, vol. 407, pp. 296–
301, 2015.
[74] A. N. Raegen, M. V Massa, J. A. Forrest, and K. Dalnoki-Veress, “Effect of atmosphere
on reductions in the glass transition of thin polystyrene films,” Eur. Phys. J. E, vol. 27, no.
4, pp. 375–377, 2008.
[75] J. D. Ferry, Viscoelastic properties of polymers. John Wiley & Sons, 1980.
[76] G. B. McKenna, “Size and confinement effects in glass forming liquids: Perspectives on
bulk and nano-scale behaviours,” in Le Journal de Physique IV, 2000, vol. 10, no. PR7, pp.
7–53.
[77] G. Reiter and S. Napolitano, “Possible origin of thickness-dependent deviations from bulk
properties of thin polymer films,” J. Polym. Sci. Part B Polym. Phys., vol. 48, no. 24, pp.
2544–2547, 2010.
Structuration and glass transition temperature of the adsorbed polymer layer : some insights in the property deviations of the ultra-thin polymer film Aparna Beena Unni, 2016

Introduction
16
[78] S. Napolitano and M. Wübbenhorst, “The lifetime of the deviations from bulk behaviour in
polymers confined at the nanoscale,” Nat. Commun., vol. 2, p. 260, Mar. 2011.
[79] C. B. Roth and J. R. Dutcher, “Glass transition temperature of freely-standing films of
atactic poly (methyl methacrylate),” Eur. Phys. J. E, vol. 12, no. 1, pp. 103–107, 2003.
[80] R. D. Priestley, M. K. Mundra, N. J. Barnett, L. J. Broadbelt, and J. M. Torkelson, “Effects
of nanoscale confinement and interfaces on the glass transition temperatures of a series of
poly (n-methacrylate) films,” Aust. J. Chem., vol. 60, no. 10, pp. 765–771, 2007.
[81] M. Erber, M. Tress, E. U. Mapesa, A. Serghei, K.-J. Eichhorn, B. Voit, and F. Kremer,
“Glassy Dynamics and Glass Transition in Thin Polymer Layers of PMMA Deposited on
Different Substrates,” Macromolecules, vol. 43, no. 18, pp. 7729–7733, Sep. 2010.
[82] F. Kremer, M. Tress, and E. U. Mapesa, “Glassy dynamics and glass transition in
nanometric layers and fi lms : A silver lining on the horizon,” J. Non. Cryst. Solids, vol.
407, pp. 277–283, 2015.
[83] M. H. Cohen and D. Turnbull, “Molecular Transport in Liquids and Glasses,” J. Chem.
Phys., vol. 31, no. 5, pp. 1164–1169, 1959.
[84] P. B. Macedo and T. A. Litovitz, “On the Relative Roles of Free Volume and Activation
Energy in the Viscosity of Liquids,” J. Chem. Phys., vol. 42, p. 245, 1965.
[85] P. G. de Gennes, “Glass transitions in thin polymer films,” Eur. Phys. J. E, vol. 2, pp. 201–
205, 2000.
[86] M. S. Dehua Liu, “Thermodynamic and glass transition behavior in CO2 – polymer
systems emphasizing the surface region,” The Ohio State University, 2016.
[87] K. Akabori, K. Tanaka, T. Kajiyama, and A. Takahara, “Anomalous Surface Relaxation
Process in Polystyrene Ultrathin Films,” Macromolecules, vol. 36, no. 13, pp. 4937–4943,
Jul. 2003.
[88] S. Kim and J. M. Torkelson, “Distribution of glass transition temperatures in free-standing,
nanoconfined polystyrene films: a test of de Gennes’ sliding motion mechanism,”
Macromolecules, vol. 44, no. 11, pp. 4546–4553, 2011.
Structuration and glass transition temperature of the adsorbed polymer layer : some insights in the property deviations of the ultra-thin polymer film Aparna Beena Unni, 2016

Introduction
17
[89] K. L. Ngai, A. K. Rizos, and D. J. Plazek, “Reduction of the glass temperature of thin
freely standing polymer films caused by the decrease of the coupling parameter in the
coupling model,” J. Non. Cryst. Solids, vol. 235, pp. 435–443, 1998.
[90] K. L. Ngai, “Mobility in thin polymer films ranging from local segmental motion, Rouse
modes to whole chain motion: A coupling model consideration,” Eur. Phys. J. E, vol. 8,
no. 2, pp. 225–235, 2002.
[91] G. Adam and J. H. Gibbs, “On the temperature dependence of cooperative relaxation
properties in glass-forming liquids,” J. Chem. Phys., vol. 43, no. 1, pp. 139–146, 1965.
[92] J. H. Gibbs and E. A. DiMarzio, “Nature of the Glass Transition and the Glassy State,” J.
Chem. Phys., vol. 28, p. 373, 1958.
[93] W. Götze, Complex dynamics of glass-forming liquids: A mode-coupling theory, vol. 143.
OUP Oxford, 2008.
[94] E. Donth, “Characteristic length of the glass transition,” J. Polym. Sci. Part B Polym.
Phys., vol. 34, no. 17, pp. 2881–2892, 1996.
[95] A. Saiter, L. Delbreilh, H. Couderc, K. Arabeche, A. Schönhals, and J.-M. Saiter,
“Temperature dependence of the characteristic length scale for glassy dynamics:
Combination of dielectric and specific heat spectroscopy,” Phys. Rev. E, vol. 81, no. 4, p.
41805, 2010.
[96] S. Napolitano, C. Rotella, and M. Wübbenhorst, “Can Thickness and Interfacial
Interactions Univocally Determine the Behavior of Polymers Confined at the Nanoscale?,”
ACS Macro Lett., vol. 1, no. 10, pp. 1189–1193, Oct. 2012.
[97] J. G. Curro, R. R. Lagasse, and R. Simha, “Diffusion model for volume recovery in
glasses,” Macromolecules, vol. 15, no. 6, pp. 1621–1626, 1982.
[98] S. Napolitano and D. Cangialosi, “Interfacial Free Volume and Vitrification: Reduction in
Tg,” Macromolecules, vol. 46, pp. 8051–8053, 2013.
Structuration and glass transition temperature of the adsorbed polymer layer : some insights in the property deviations of the ultra-thin polymer film Aparna Beena Unni, 2016

Introduction
18
[99] D. Cangialosi, V. M. Boucher, A. Alegria, and J. Colmenero, “Free volume holes diffusion
to describe physical aging in poly (mehtyl methacrylate)/silica nanocomposites,” J. Chem.
Phys., vol. 135, no. 1, p. 14901, 2011.
[100] L. Berthier and G. Biroli, “Theoretical perspective on the glass transition and amorphous
materials,” Rev. Mod. Phys., vol. 83, no. 2, p. 587, 2011.
[101] S. Napolitano, Non-equilibrium Phenomena in Confined Soft Matter: Irreversible
Adsorption, Physical Aging and Glass Transition at the Nanoscale. Springer, 2015.
Structuration and glass transition temperature of the adsorbed polymer layer : some insights in the property deviations of the ultra-thin polymer film Aparna Beena Unni, 2016

Chapter 1. Materials and Methods
19
Chapter 1. Materials and Methods
Summary
This chapter provides the details of different materials used in this work, the exper-
imental techniques and protocols employed for developing the samples used etc. It
also gives the details of the characterization techniques used along with a brief de-
scription to their basic principle.
Structuration and glass transition temperature of the adsorbed polymer layer : some insights in the property deviations of the ultra-thin polymer film Aparna Beena Unni, 2016

Chapter 1. Materials and Methods
20
1.1 Materials used
1.1.1 Polymers
The polymers Polystyrene (PS) and Poly methyl methacrylate (PMMA) have been used for the
studies. The details of these polymers are given as the following.
1.1.1.1 Polystyrene
Polystyrene, which is also known as polyvinyl benzene, is a long chain hydrocarbon wherein
alternating carbon centers are attached to phenyl groups. Its chemical formula is )*+* , and can
be structurally represented as follows.
Figure 1-1: Structure of polystyrene. Polystyrene P10447-S purchased from Polymer Source, which is obtained by living anionic
polymerization of styrene was used for the studies. The molecular weight and molecular number
are 135.8 and 129.71 kg/mol respectively with a poly dispersity index of 1.05. This PS has an
atactic tacticity, which means that the chain on which the phenyl groups are attached does not
possess a specific order.
1.1.1.2 Poly (methyl methacrylate)
Poly (methyl methacrylate), PMMA is a polymer with the following chemical structure, which is
formed by the polymerization of methyl methacrylate.
Structuration and glass transition temperature of the adsorbed polymer layer : some insights in the property deviations of the ultra-thin polymer film Aparna Beena Unni, 2016

Chapter 1. Materials and Methods
21
Figure 1-2: Structure of PMMA We use the PMMA-17 purchased from Polymer experts, with a molecular weight of 152.8
kg/mol, molecular number = 141.6 kg/mol with a poly dispersity index of 1.08. It is syndiotactic
in tacticity, which means that the substituents have alternate positions along the chain.
1.1.2 Ceria Nanoparticles
Cerium oxide/ceria nanoparticle (CeO2 NP) [1], [2] dispersions (10%/w, pH 1.5) were supplied
by the Rhodia-Solvay chemical company (Belgium). The size distribution of the NPs was found
to be log-normal with median diameter 8.3 nm and a polydispersity 0.26 as measured from dy-
namic light scattering. The CeO2 NPs were stabilized at low pH by a combination of long range
electrostatic forces and short range hydration interactions.
1.2 Sample preparation
The preparation of the sample is done in two steps: (1) preparation of the substrate (2) thin film
deposition.
1.2.1 Substrate preparation
Considering the supported thin films, it is important to set the properties of the substrate by
means of various surface treatments. The silicon wafers purchased from SILTRONIX with an
orientation 100±0.5° were used as the substrate, which underwent one of the following treatments
to obtain the respective property.
Structuration and glass transition temperature of the adsorbed polymer layer : some insights in the property deviations of the ultra-thin polymer film Aparna Beena Unni, 2016

Chapter 1. Materials and Methods
22
1.2.1.1 RCA treatment
This method was developed by Werner Kern while working for the Radio Corporation of Ameri-
ca (RCA) and was named after the institute. A solution of ammonium hydroxide (NH4OH, 25%),
hydrogen peroxide (H2O2, 35%) and MilliQ water is taken in the ration 2:1:1. The wafer seg-
ments are immersed in this solution is heated at 100°C for 10 minutes. The organic contaminants
are removed by the solvating action of ammonium hydroxide and the oxidizing action of hydro-
gen peroxide [3]. The oxidizing agent H2O2 forms a continuous, thin silicon oxide layer (SiOx)
layer (~2nm) on the substrate surface. After treatment, the substrates are rinsed thoroughly with
MilliQ water. The result of this process is similar to the piranha treatment (which removes the
organic contaminants leaving a hydrophilic wafer with an oxide layer) and is used when the wa-
fer is not grossly contaminated. Hence the RCA treated wafers are also represented by SiOx-Si.
Usually we perform only the manipulations discussed above for RCA cleaning, which provides
an organic and particle cleaning. Apart from this, there exist further extensions such as oxide
strip, ionic cleaning etc., which can be performed depending on the properties required for the
substrate.
1.2.1.2 Piranha treatment
The solution for piranha treatment is made by mixing concentrated sulfuric acid and 30% hydro-
gen peroxide solution in a ratio of 2:1. This solution is energetic and even potentially explosive.
Its preparation is exothermic and hence care should be taken to add the peroxide to acid very
slowly. The beaker with the piranha solution is kept in a water bath which is at 80°C. The Si wa-
fer with an initial diameter of 100mm, which are cut to a desired size using a diamond scribe is
immersed in this piranha solution and is kept for 30 minutes. The wafers after the treatment are
rinsed thoroughly with MilliQ water, which has a resistivity of 18.2MΩ and is then dried with dry
Nitrogen. When the wafers are immersed in the piranha solution two distinct processes occurs.
The first and faster process is removal of hydrogen and oxygen as units of water by the concen-
trated sulfuric acid as shown below:
+2345 + +242 → +2348 + +24 1-1
Structuration and glass transition temperature of the adsorbed polymer layer : some insights in the property deviations of the ultra-thin polymer film Aparna Beena Unni, 2016
Chapter 1. Materials and Methods
23
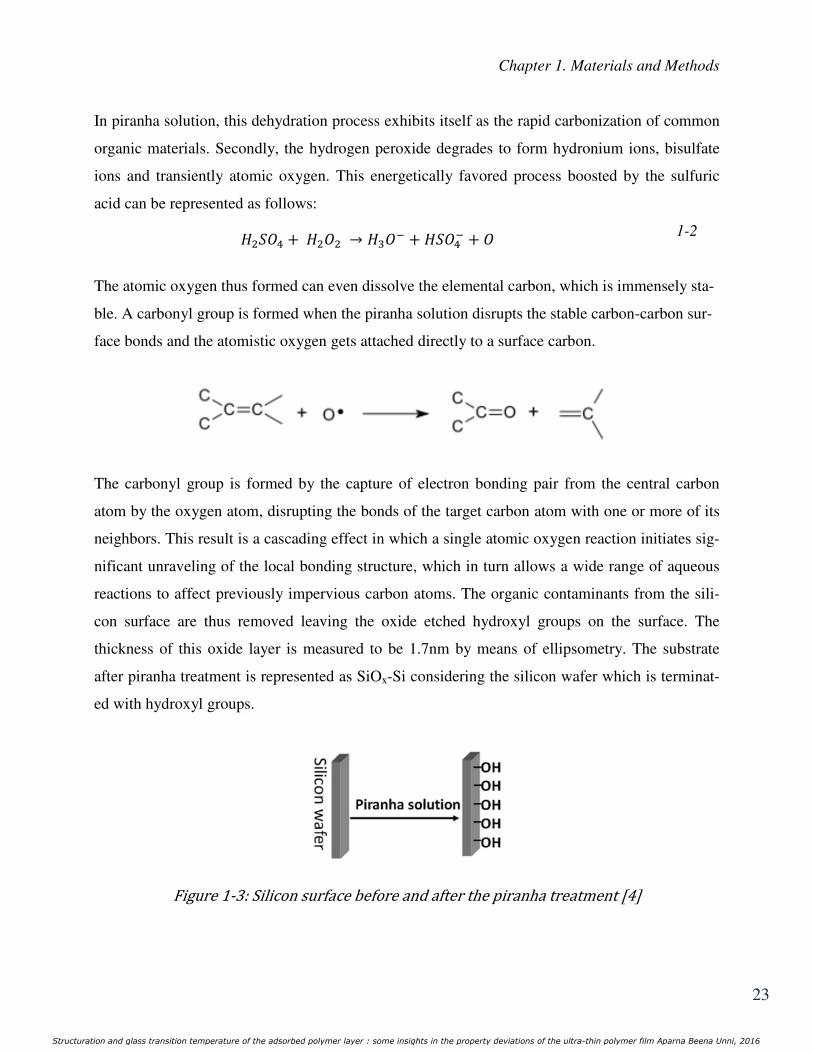
In piranha solution, this dehydration process exhibits itself as the rapid carbonization of common
organic materials. Secondly, the hydrogen peroxide degrades to form hydronium ions, bisulfate
ions and transiently atomic oxygen. This energetically favored process boosted by the sulfuric
acid can be represented as follows:
+2345 + +242 → +94: + +345: + 4 1-2
The atomic oxygen thus formed can even dissolve the elemental carbon, which is immensely sta-
ble. A carbonyl group is formed when the piranha solution disrupts the stable carbon-carbon sur-
face bonds and the atomistic oxygen gets attached directly to a surface carbon.
The carbonyl group is formed by the capture of electron bonding pair from the central carbon
atom by the oxygen atom, disrupting the bonds of the target carbon atom with one or more of its
neighbors. This result is a cascading effect in which a single atomic oxygen reaction initiates sig-
nificant unraveling of the local bonding structure, which in turn allows a wide range of aqueous
reactions to affect previously impervious carbon atoms. The organic contaminants from the sili-
con surface are thus removed leaving the oxide etched hydroxyl groups on the surface. The
thickness of this oxide layer is measured to be 1.7nm by means of ellipsometry. The substrate
after piranha treatment is represented as SiOx-Si considering the silicon wafer which is terminat-
ed with hydroxyl groups.
Figure 1-3: Silicon surface before and after the piranha treatment [4]
Structuration and glass transition temperature of the adsorbed polymer layer : some insights in the property deviations of the ultra-thin polymer film Aparna Beena Unni, 2016
Chapter 1. Materials and Methods
24
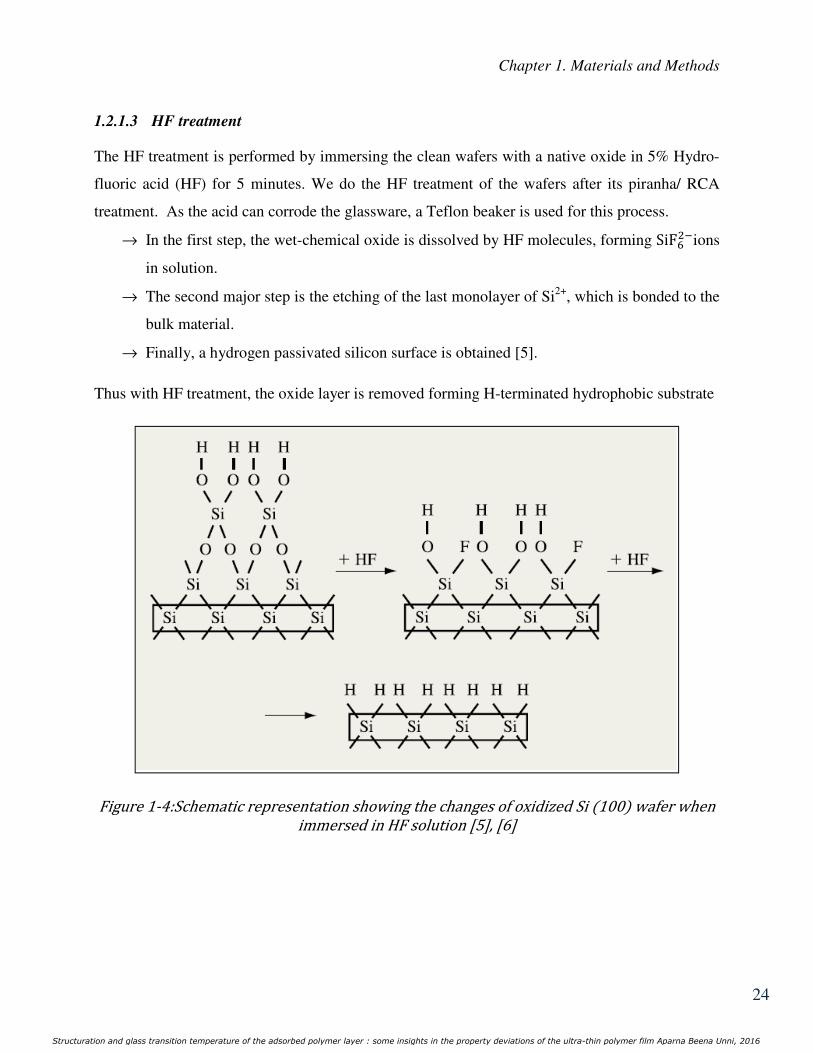
1.2.1.3 HF treatment
The HF treatment is performed by immersing the clean wafers with a native oxide in 5% Hydro-
fluoric acid (HF) for 5 minutes. We do the HF treatment of the wafers after its piranha/ RCA
treatment. As the acid can corrode the glassware, a Teflon beaker is used for this process.
→ In the first step, the wet-chemical oxide is dissolved by HF molecules, forming SiF@2:ions
in solution.
→ The second major step is the etching of the last monolayer of Si2+, which is bonded to the
bulk material.
→ Finally, a hydrogen passivated silicon surface is obtained [5].
Thus with HF treatment, the oxide layer is removed forming H-terminated hydrophobic substrate
Figure 1-4:Schematic representation showing the changes of oxidized Si 100 wafer when immersed in HF solution [5], [6]
Structuration and glass transition temperature of the adsorbed polymer layer : some insights in the property deviations of the ultra-thin polymer film Aparna Beena Unni, 2016

Chapter 1. Materials and Methods
25
1.2.2 Thin film formation
1.2.2.1 The polymer solution for spin coating
The solutions of PS and PMMA for spin coating are made using 99.8%, anhydrous toluene pur-
chased from Sigma Aldrich. The toluene was chosen considering its solubility parameter. The
solubility parameter helps to characterize the solubility and can imply how compactable/good a
solvent is, for a particular polymer. We have used Hansen solubility parameters which consider
the specific interactions, especially hydrogen bonding for the estimation of solubility [7]. The
basic equation governing the assignment of Hansen parameters is that the total cohesion energy,
E, is the sum of the individual energies corresponding to the three types of interactions:
G = GH + GI + GJ 1-3
Where ED is the dispersive component, P: the polar interaction, H: the hydrogen bond interaction.
Dividing this by the molar volume gives the square of the total (or Hansen) solubility parameter
as the sum of the squares of the Hansen D, P, and H components:
G K⁄ = GH K⁄ + GI K⁄ + GJ K⁄ 1-4
i.e. the cohesive energy density δ2 between two substances can be expressed based on dispersive
force, polar interaction and hydrogen bond interaction as follows
M2 = MH2 + MI2 + MJ2 1-5
According to equation 1-5, the solubility parameter of a given solvent can be considered as a vec-
tor with components MH , MI and MJ. This means that each solvent can be located in a three dimen-
sional system as a fixed point with co-ordinates agreeing with equation 1-5. The axes of the sys-
tem are the dispersion axis MH, the polar axis MI, and the hydrogen bonding axis MJ. The Hansen
characterization is considered as a sphere whose center has MH, MI and MJ values of PS as shown
in the Figure 1-5 below.
Structuration and glass transition temperature of the adsorbed polymer layer : some insights in the property deviations of the ultra-thin polymer film Aparna Beena Unni, 2016

Chapter 1. Materials and Methods
26
Figure 1-5:Representation of Hansen solubility sphere. The radius of the sphere Ro is termed as the interaction radius, which is experimentally calculated.
The boundary of the spherical characterization is based on the requirement that ‘good’ solvents
have a distance from the center of the sphere Ra less than Ro. The distance between the center of
solubility sphere and the position the compound can be expressed as:
OP = QR2MH,IS − 2MH,ST2 + RMI,IS − MI,ST2 + RMJ,IS − MJ,ST2
1-6
where S stands for the solvent. The smaller Ra, the more likely they are to be thermodynamically
compatible. It is also important to calculate the Relative energy difference (RED) that determines
the quality of solubility.
RED = UVUW
1-7
• RED < 1 the molecules are alike and are soluble
• RED = 1 the system will partially dissolve
• RED > 1 the system will not dissolve
Hence good solvent possess a low relative energy difference value.
Structuration and glass transition temperature of the adsorbed polymer layer : some insights in the property deviations of the ultra-thin polymer film Aparna Beena Unni, 2016

Chapter 1. Materials and Methods
27
Table 1-1: The Hansen solubility parameter values of PS, PMMA and toluene [7], [8]
Solvent
δd (MPa0.5
)
δp (MPa0.5
)
δh (MPa0.5
)
Polystyrene 21.28 5.75 4.3
PMMA 18.6 10.5 7.5
Toluene 18 1.4 2
Considering the solubility components of PS, PMMA and toluene as shown in the table 1-1 and
using the equations 1-6 and 1-7, the RED value is 0.65 considering PS-toluene and 0.84 for
PMMA-toluene system. As for both polymers the RED with toluene is less than 1, it was select-
ed as the solvent for the polymer solution used for spin coating. The polymer solution was pre-
pared 24 h prior to spin coating, for better polymer dissolution due to this aging time.
1.2.2.2 Spin coating
We use the spin coating technique for the thin film deposition. The spin coater, Spin 150 from
SPS Europe is used for spin coating. The process can be schematically represented in Figure 1-6.
The substrate is loaded on a vacuum chuck which holds it during the following high speed rota-
tion. The polymer solution is then dispensed on this substrate and is rotated at a speed of 2000
rpm for 60S. The centripetal acceleration causes the solution to spread out leaving a thin layer of
coating (polymer + solvent) on the substrate.
The final film thickness depends on the nature of the solution (for example: solution viscosity,
solvent evaporation rate) and the parameters such as angular speed, spin time etc. chosen for the
spin process. The dependence of the film thickness (h) to the solution viscosity (η) and the spin
speed (ω) is as follows [9]:
ℎ ∝ Q\] 1-8
Structuration and glass transition temperature of the adsorbed polymer layer : some insights in the property deviations of the ultra-thin polymer film Aparna Beena Unni, 2016

Chapter 1. Materials and Methods
28
Figure 1-6: Schematic representation of the spin coating process. The substrate represented by black, solvent: green and the polymer: red respectively. 1.2.2.3 Annealing
The annealing refers to the process for keeping the samples at a temperature at 160°C (which is
above the glass transition temperature of the polymers), for 24 hours in vacuum. The samples
after the annealing are then allowed to reach the room temperature under the vacuum before us-
age. The annealing process helps the films to approach its thermodynamical equilibrium, which
has been perturbed by the spin coating process due to the fast solvent evaporation [10]. The evi-
dence that polymers in ultrathin films exist in an out of equilibrium structure has been used to
account for the bizarre observation of negative thermal expansivity [11] and large residual stress-
es [12]. Annealing the films at temperatures above the glass transition temperature of the bulk
polymer (Tg,bulk) for many hours reduces the residual stresses in spin coated thin polymer films
but do not necessarily vanish even after long annealing. Annealing also helps to remove the re-
sidual solvent in the film. Since vitrification of spin-coated films generally occurs during solvent
removal, it was pointed out that residual solvent could remain trapped inside the thin films. The
work of Garcıa-Turiel and Jerôme [13] using gas chromatography supports this idea which is not
unanimously accepted.[14]
Structuration and glass transition temperature of the adsorbed polymer layer : some insights in the property deviations of the ultra-thin polymer film Aparna Beena Unni, 2016

Chapter 1. Materials and Methods
29
1.3 Characterization
1.3.1 Ellipsometry
The ellipsometry is an optical technique that measures the change of polarization upon reflection
and compares it to a model. It can be used to characterize thickness, roughness, electrical conduc-
tivity etc. and various other material properties. We use this technique mainly to measure the thin
film thickness, refractive index and to measure the glass transition temperature.
Figure 1-7: A schematic diagram showing the working principle of ellipsometry Horiba scientific The system can be schematically represented as shown in Figure 1-7. It consists of a light source
that emits the electromagnetic radiation which is linearly polarized by a polarizer. This linearly
polarized light is allowed to fall on the sample and on reflection from the sample, the light be-
comes elliptically polarized. The output head comprises a photoelastic modulator and an analyz-
ing polarizer that resolves the polarization state of the reflected beam. Both polarizers are held
fixed during the measurement while the photoelastic modulator is used to induce a modulated
phase shift of the reflected beam. The light is analyzed by a grating monochromator (analyzer)
that directs sequentially the light for each individual wavelength onto the detector. The detector
converts the light to electronic signal to determine the reflected polarization.
Structuration and glass transition temperature of the adsorbed polymer layer : some insights in the property deviations of the ultra-thin polymer film Aparna Beena Unni, 2016

Chapter 1. Materials and Methods
30
This information is compared to the known input polarization to determine the polarization
change caused by the sample reflection. The exact nature of the polarization change is determined
by the sample's properties such as thickness and refractive index.
The ellipsometer possess a well-established theory.[15], [16] The effect of the reflection
of light from a film will depend on several variables such as the wavelength of light, the angle of
incidence as well as the thickness and optical properties of all the films. The light beam can be
described by defining an imaginary plane of incidence perpendicular to the film. On the other
hand, the electric wave can be characterized by the orthogonal basis vectors, where Ep represents
the amplitude of the wave in the plane of incidence (p-wave), Es represents the amplitude of the
wave perpendicular to the plane of incidence (s-wave).
Figure 1-8: A typical geometry of an ellipsometric experiment showing the p- and s-directions.
The light is linearly polarized initially and is elliptically polarized after being reflected from the
sample.
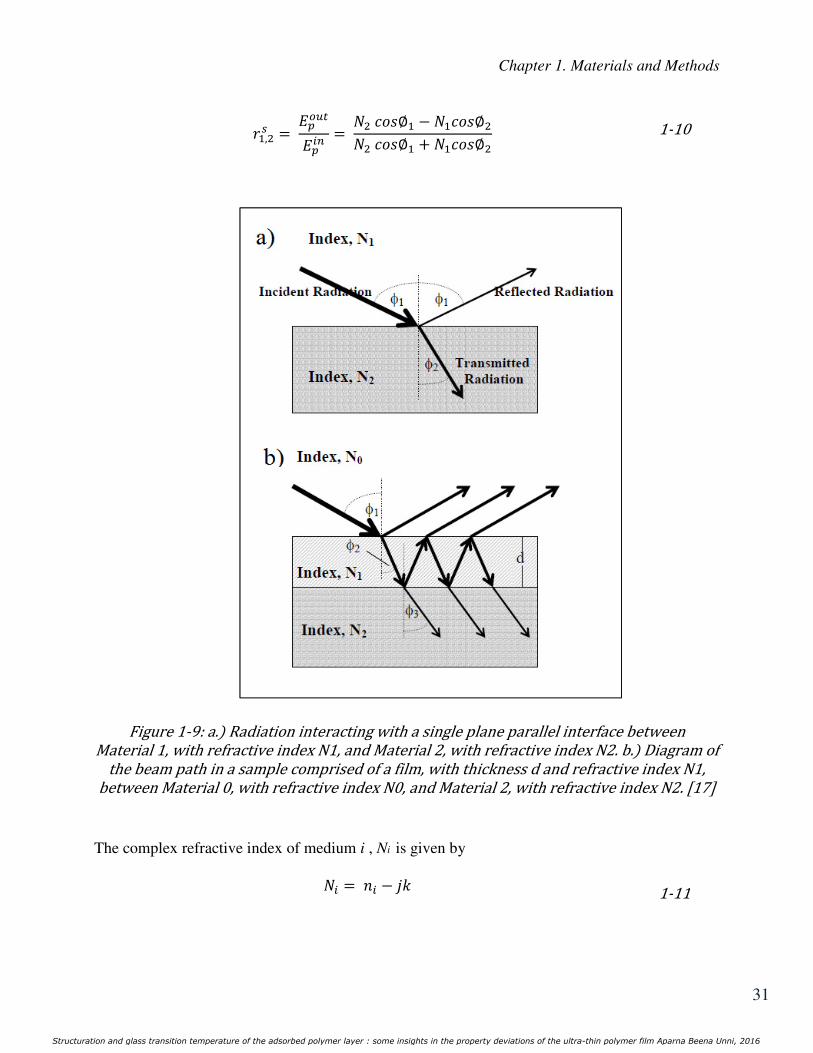
Considering a single interference as shown in Figure 1-9, a), the ratio of the amplitude of the re-
flected beam to the incoming beam for the p- and s-waves can be given by the equations 1-9 and
1-10.
_ ,2a = Gabcd
Gae, = f2 ghi∅` − f`ghi∅2f2 ghi∅` + f`ghi∅2 1-9
Structuration and glass transition temperature of the adsorbed polymer layer : some insights in the property deviations of the ultra-thin polymer film Aparna Beena Unni, 2016
Chapter 1. Materials and Methods
31
_ ,2l = GabcdGae, = f2 ghi∅` − f`ghi∅2f2 ghi∅` + f`ghi∅2 1-10
Figure 1-9: a. Radiation interacting with a single plane parallel interface between Material 1, with refractive index N1, and Material 2, with refractive index N2. b. Diagram of the beam path in a sample comprised of a film, with thickness d and refractive index N1, between Material 0, with refractive index N0, and Material 2, with refractive index N2. [17] The complex refractive index of medium i , Ni is given by fe = oe − pq 1-11
Structuration and glass transition temperature of the adsorbed polymer layer : some insights in the property deviations of the ultra-thin polymer film Aparna Beena Unni, 2016

Chapter 1. Materials and Methods
32
where ni is the real part of the refractive index, k is the extinction coefficient, and j is the imagi-
nary number. In the special case of a single interface, rp and rs are more commonly referred to as
the Fresnel reflection coefficients.
Considering the film on a substrate, that is considering the case where there are two interfaces,
the equations describing the ratio of the amplitudes of the outgoing wave to the incoming wave
are modified. This can be schematically represented as shown in Figure 1-9, b). Hence the result-
ant ratios of the p and s-waves can be written as given in equations 1-12 and 1-13.
Oa = GabcdGae, = _r,a + _ ,2a exp−p2s 1 + _r,a _ ,2a exp−p2s 1-12
Ol = GlbcdGle, = _r,`l + _ ,2l exp−p2s 1 + _r,`l _ ,2l exp−p2s 1-13
where Rp and Rs are the total reflection coefficients, rx,y are the Fresnel reflection coefficients be-
tween interfaces x and y, and β is the optical thickness that describes the phase change of the
wave as it moves from the top to the bottom of the film. [16], [17] The β can be given by the rela-
tion:
s = 2t $uv& f2ghi∅2 1-14 The fundamental equation of ellipsometry is [15] w = OaOl = tanΨ exp p∆
1-15 where Ψ and ∆ are measured by the ellipsometer. Equations 1-12 and 1-13 provide the magnitude
of the total reflection coefficients which is related to Ψ and the ∆ term is related to the relative
phase shift between the p and s-waves before and after reflection. Thus, by measuring Ψ and ∆
with an ellipsometer, important information such as the thickness and refractive index of a film
on a substrate can be extracted.
Structuration and glass transition temperature of the adsorbed polymer layer : some insights in the property deviations of the ultra-thin polymer film Aparna Beena Unni, 2016
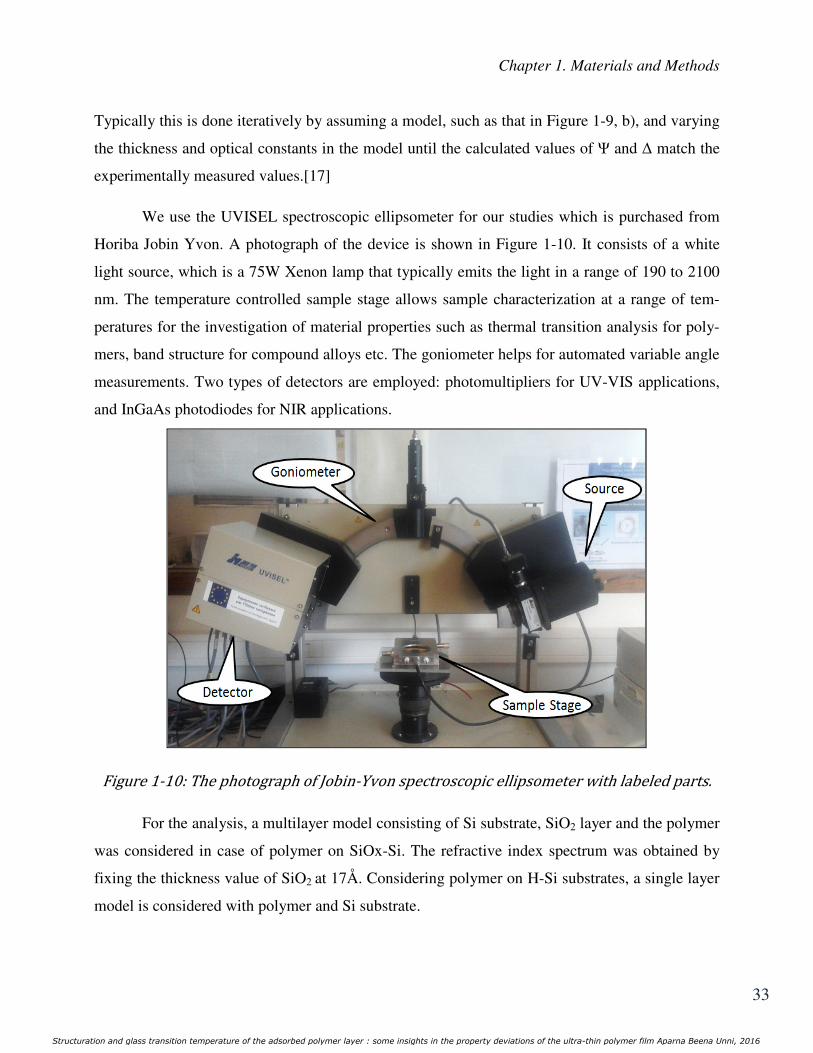
Chapter 1. Materials and Methods
33
Typically this is done iteratively by assuming a model, such as that in Figure 1-9, b), and varying
the thickness and optical constants in the model until the calculated values of Ψ and ∆ match the
experimentally measured values.[17]
We use the UVISEL spectroscopic ellipsometer for our studies which is purchased from
Horiba Jobin Yvon. A photograph of the device is shown in Figure 1-10. It consists of a white
light source, which is a 75W Xenon lamp that typically emits the light in a range of 190 to 2100
nm. The temperature controlled sample stage allows sample characterization at a range of tem-
peratures for the investigation of material properties such as thermal transition analysis for poly-
mers, band structure for compound alloys etc. The goniometer helps for automated variable angle
measurements. Two types of detectors are employed: photomultipliers for UV-VIS applications,
and InGaAs photodiodes for NIR applications.
Figure 1-10: The photograph of Jobin-Yvon spectroscopic ellipsometer with labeled parts. For the analysis, a multilayer model consisting of Si substrate, SiO2 layer and the polymer
was considered in case of polymer on SiOx-Si. The refractive index spectrum was obtained by
fixing the thickness value of SiO2 at 17Å. Considering polymer on H-Si substrates, a single layer
model is considered with polymer and Si substrate.
Structuration and glass transition temperature of the adsorbed polymer layer : some insights in the property deviations of the ultra-thin polymer film Aparna Beena Unni, 2016

Chapter 1. Materials and Methods
34
The incident angle is used as a fitting parameter. A transparent Sellmeier dispersion relation was
used for modeling the refractive index of the polymer film as follows
o2v = 1 + v2v2 − vr2
1-16
Where λ is the wavelength of incident light, B is a dimensionless parameter that determines the
shape of the refractive index in the visible range, and λ0 is the resonance wavelength for which
the refractive index diverges. The calculated optical constants were determined by simultaneous-
ly fitting the data obtained at three different incident angles (65°, 70° and 75°).
• The Glass transition temperature (Tg) measurement
When equipped with a hot stage (LinKAMTMS600), spectroscopic ellipsometer can be used to
detect thermal variations and transitions in polymer samples. The sample is held in the tempera-
ture controlled stage. For each sample, the measurements were made at every 5 °C interval from
25 to 160 °C and before each measurement the sample was held at a fixed temperature for 5 min
to equilibrate. During each of these temperature steps, the ellipsometric angles ψ and ∆ are meas-
ured. The small changes in thickness and refractive index typical of most of the ellipsometry ex-
periments can be shown to be linearly related to small changes in the ellipsometric measurable.
Since both these quantities vary with the density of the sample, they necessarily exhibit a ‘kink’
at the glass transition temperature. [18] While the film is being heated, the ellipsometric angles
linearly evolve as a function of the temperature, until the glass transition phase during which a
change in slope takes place as can be seen from the figure 1-11. [19]
Structuration and glass transition temperature of the adsorbed polymer layer : some insights in the property deviations of the ultra-thin polymer film Aparna Beena Unni, 2016

Chapter 1. Materials and Methods
35
Figure 1-11: Raw ellipsometric curves showing Δ as function of temperature for 100 nm PS film on Si wafer with native oxide. The Tg determination is done by selecting two linear regions of the data and finding the intersec-
tion point between the extrapolated lines. The data analysis with Matlab software, straight lines
that best fit all of the points and their intersections was used for an accurate Tg determination. 1.3.2 Atomic force microscopy
The atomic force microscope (AFM) belongs to the broad family of scanning probe micro-
scopes in which a proximal probe is exploited for investigating properties of surfaces with
sub nanometer resolution [20]. Usually, the probe is a sharp tip, which is a 3-6 µm tall pyramid
with 15-40 nm end radius.
Structuration and glass transition temperature of the adsorbed polymer layer : some insights in the property deviations of the ultra-thin polymer film Aparna Beena Unni, 2016

Chapter 1. Materials and Methods
36
Figure 1-12: A schematic diagram showing the working principle of AFM. Forces between the tip and the sample surface cause the cantilever to bend/ deflect. The amount
of force between the probe and sample depends on the spring constant (stiffness) of the cantilever
and the distance between the probe and sample surface.
This force, F can be described using Hooke’s law [21]:
F= -k.x 1-17
Where, k, the spring constant and x is the cantilever deflection. The deflection of the cantilever is
measured by detecting the deflection of a light beam reflected from the back of the cantilever onto
a position sensitive detector (PSD) as shown in Figure 1-12.
Structuration and glass transition temperature of the adsorbed polymer layer : some insights in the property deviations of the ultra-thin polymer film Aparna Beena Unni, 2016

Chapter 1. Materials and Methods
37
Figure 1-13:Photograph of Nanoscope IIIa with labeled parts. The differences between the signals of photo-detector segments indicate the position of the laser
spot on the detector and thus the angular deflections of the cantilever. The feedback loop consists
of the tube scanner that controls the height of the tip; the cantilever and optical lever, which
measures the local height of the sample; and a feedback circuit that attempts to keep the cantilever
deflection constant by adjusting the voltage applied to the scanner. Hence as a function of the
lateral sample position, the deflection measured from the cantilever allows the computer to gener-
ate the map of surface topography. The AFM not only measures the force on the sample but also
regulates it, allowing acquisition of images at very low forces. We use Nanoscope IIIa Multimode8
AFM for our studies. The major components of this AFM/ its control units, as explained above are
labeled in the photograph given in Figure 1-13.
Structuration and glass transition temperature of the adsorbed polymer layer : some insights in the property deviations of the ultra-thin polymer film Aparna Beena Unni, 2016

Chapter 1. Materials and Methods
38
• Imaging modes
There are three primary imaging modes in AFM: contact, non-contact and tapping mode. During
contact mode, the probe is in contact with the sample and repulsive Van der Waals forces prevail,
while the attractive Van der Waals forces are dominant when the tip moves further away from the
sample surface.
Figure 1-14: Inter atomic force vs. distance curve with different modes of operation.
i. Contact Mode
In contact mode, the tip is constantly in touch with the sample surface. The applied force is kept
constant while the tip scans the surface, creating the surface image. This imaging mode is good
for samples with rough and rigid surfaces as it provides fast scanning with high resolution. One
disadvantage of this imaging mode is that soft samples like tissues can be deformed or damaged
due to the applied force. This drawback can be solved by measuring the sample in aqueous envi-
ronments to reduce the interaction force between the tip and the sample.
Structuration and glass transition temperature of the adsorbed polymer layer : some insights in the property deviations of the ultra-thin polymer film Aparna Beena Unni, 2016

Chapter 1. Materials and Methods
39
ii. Tapping Mode
In tapping mode, the tip is not in constant contact with the sample surface. Instead, the cantilever
is oscillated at its resonant frequency, which makes the tip lightly tap on the surface during scan-
ning. A piezo stack excites the cantilever’s substrate vertically, causing the tip to bounce up and
down. As the cantilever bounces vertically, the reflected laser beam is deflected in a regular pat-
tern over a photodiode array, generating a sinusoidal electronic signal. The signal is converted to
a root mean square (rms, Rq) amplitude value, which is displaced in AC volts. A constant tip-
sample interaction is maintained by monitoring the oscillation amplitude and an image is ob-
tained.
Figure 1-15:A schematic representation of AFM operating in tapping mode[20]
Several parameters that affect the image contrast are the height, phase signals and amplitude. As
the dragging force during scanning is greatly reduced, this mode is useful where the samples are
easily damageable or loosely bound to their surface [21]. The advantage of tapping the surface is
an improved lateral resolution on soft samples. Resolution can reach atomic dimensions for flat
surfaces.[22] However, this imaging mode requires a slower scanning speed. We use tapping
mode for the imaging.
Structuration and glass transition temperature of the adsorbed polymer layer : some insights in the property deviations of the ultra-thin polymer film Aparna Beena Unni, 2016
Chapter 1. Materials and Methods
40
iii. Non-contact mode
There is no contact between the sample surface and the probe in non-contact mode. The probe
oscillates above the sample surface, forming a weak attractive force between the tip apex atom
and the sample surface atom.
Feedback signals are obtained by measuring a frequency shift in the mechanical oscillation of the
cantilever. The force exerted on the surface sample is very low in this case. Moreover, as there is
no contact between the probe and the surface, the probe lifetime can be extended. Another ad-
vantage of this operating mode is the possibility to observe an atomic defect if the very weak at-
tractive force can be detected. The drawback of this mode is the reduction of resolution, and the
oscillation of the cantilever is affected in case there are contaminants on the sample surface.
1.3.3 X-ray Reflectivity
XRR is a non-contact and non-destructive technique that can be used for thickness determination
of thin films with a precision of about 1-3Å. In addition to thickness determination, this technique
is also employed for measuring the density and roughness of films with a high precision. The
basic idea behind the technique is to reflect a beam of x-rays from a flat surface and to measure
the intensity of x-rays reflected in the specular direction, where the reflected angle is equal to the
incident angle. In the absence of a perfectly sharp and smooth interface, the reflected intensity
will deviate from that predicted by the law of Fresnel reflectivity. The deviations can then be ana-
lyzed to obtain the density profile of the interface normal to the surface.
Structuration and glass transition temperature of the adsorbed polymer layer : some insights in the property deviations of the ultra-thin polymer film Aparna Beena Unni, 2016

Chapter 1. Materials and Methods
41
Figure 1-16: The photograph of Empyrean Panalytical reflectometer.
• Refractive index and density determination
Considering a plane wave travelling in medium 0 incident on the surface of medium 1, the refractive
index n of a material for x-rays can be calculated using the following equations [23]:
o = 1 − M − s 1-18
M = _v22t frw ee + e eeee
1-19
s = _v22t frw ee + e ee ee
1-20
where _ is the classical radius of electron (2.818 x 10: m, fr is the Avogadro number, λ, the x-
ray wavelength, ρ is the density in (g/cm3), e is the atomic number of ith atom, e is the atomic
weight of the ith atom. e is the atomic/molar ratio of the ith atom and e, e are the atomic scat-
tering factors of the ith atom.
Structuration and glass transition temperature of the adsorbed polymer layer : some insights in the property deviations of the ultra-thin polymer film Aparna Beena Unni, 2016

Chapter 1. Materials and Methods
42
As from equation1-18, the refractive index is expressed as a complex number. The value of the
parameter M varies from 10-5 to 10-6 for x-rays with wavelength approximately 1 Å. From equa-
tion 1-19, the value of M depends on the x-ray wavelength, density and composition of the mate-
rial. The parameter s is related to x-ray absorption, which is expressed by a linear absorption
coefficient as shown below:
s = vμ/4t 1-21
The critical angle θc for the total reflection is given by the following formula:
= √2M 1-22
Thus the density of the surface film can be obtained from the critical angle for total reflection θc.
As by the equation 1-18, the refractive index of the material depends on the x-ray wavelength and
the density of the material. When the x-ray wavelength is longer/ with lower material density, the
θc is larger.
• Thickness measurement
The reflection of x-rays occurs at all the interfaces of a multilayer film. The x-ray reflectivity of a
multilayer film as a function can be theoretically calculated using equation 1-23, where the
vacuum or gas phase on the top of a film with n layers is regarded as the j= 1st layer. Each layer
in the multilayer film is numbered in sequence starting with j=2 and a substrate is considered as
the j= n+1 layer. When the reflection coefficient at the interface between the jth and (j+1)th layers
is defined as O,`where its value is calculated as follows:
O,` = O`,2 + ,`O`,2 × ,` + 1 5 1-23
,` = − ` + ` exp −8t2e``2v2
1-24
Structuration and glass transition temperature of the adsorbed polymer layer : some insights in the property deviations of the ultra-thin polymer film Aparna Beena Unni, 2016

Chapter 1. Materials and Methods
43
= R−tu v⁄ T 1-25
= Qoe2 − ghi2 1-26
The recurrence equation 1-23 together with equation 1-24, 1-25and 1-26 can be used to calculate
the values of O,`, starting at the interface on top of the substrate, and then the next upper inter-
face in sequence up to the surface layer. The x-ray reflectivity I/I0= O`,2 is finally calculated.
Generally, an x-ray experimental reflectivity curve is compared to the theoretical curve calculated
based on a layer structure model. The solution with optimal parameter values of thickness, densi-
ty and roughness of the interface in the multilayer film is obtained when the residual between the
measured and calculated reflectivity data reaches a minimum.
We used Empyrean Panalytical reflectometer, which has a Cu source (2kW) followed by a mirror
to select and enhance Cu Kα radiation with a wavelength of 1.543 Å. The measurements are car-
ried out in symmetric θ-θ geometry, in which the sample was kept fixed during the measure-
ments. The intensity was measured with a Pixel 3D detector using a fixed aperture of three chan-
nels (0.165°) in the 2θ direction. The photograph of Empyrean Panalytical reflectometer is given
in Figure 1-16
1.3.4 Contact angle goniometry
Contact goniometry is a method to determine the wettability of a surface, to calculate the surface
energy etc. The ‘contact angle’ is the angle at which a liquid/vapor interface meets the solid sur-
face. It is specific for any given system and is determined by the interactions across the three in-
terfaces –solid/ liquid, solid/gas and liquid/gas. The term ‘wetting’ describes the contact between
a liquid and a solid surface and is a result of intermolecular interactions when the two are brought
together. The amount of wetting depends on the energies (or surface tensions) of the interfaces
involved such that the total energy is minimized. The degree of wetting is described by the con-
tact angle. This is the angle at which the liquid/vapor interface meets the solid/liquid interface.
[24]
Structuration and glass transition temperature of the adsorbed polymer layer : some insights in the property deviations of the ultra-thin polymer film Aparna Beena Unni, 2016

Chapter 1. Materials and Methods
44
The contact angle for a flat surface is measured from a drop of a suitable liquid resting on a sur-
face (Figure 1-17)
Figure 1-17:Schematic representation for the wettability of surface [24]. If the liquid is very strongly attracted to the solid surface, as for example, water on a hydrophilic
solid, the droplet will completely spread out on the solid surface and the contact angle will be
close to zero degrees. Less strongly hydrophilic solids will have a contact angle up to 90°. The
contact angle will be larger than 90° for a hydrophobic solid surface. Surfaces are said to be super
hydrophobic when the contact angle is greater than 150°. On these surfaces, water droplets simp-
ly rest on the surface, without actually wetting to any significant extent. The contact angle thus
directly provides information on the interaction energy between the surface and the liquid.
The theoretical description of contact arises from the consideration of a thermodynamic equilib-
rium between the three phases: the liquid phase of the droplet (L), the solid phase of the substrate
(S), and the gas/vapor phase of the ambient (V). The latter will be a mixture of ambient atmos-
phere and an equilibrium concentration of the liquid vapor or could alternatively be another im-
miscible liquid phase. At thermodynamic equilibrium, the chemical potential in the three phases
should be equal. It is generally convenient to consider the interfacial energies involved.
Using the simplified planar geometry Young’s equation [25] can be written as
0 = S − S − cos 1-27
where S, l and are the interfacial energies at the solid/gas, solid/liquid and liquid/gas inter-
face.
Structuration and glass transition temperature of the adsorbed polymer layer : some insights in the property deviations of the ultra-thin polymer film Aparna Beena Unni, 2016

Chapter 1. Materials and Methods
45
We use the Dig drop GBX contact angle goniometer in static sessile drop method where the angle
formed between the liquid/solid interface and the liquid/vapor interface can be measured using a
high-resolution camera. 1.5 µL of liquids are deposited on substrate at a speed of 3µm/s and the
photos are captured at 20 ms after deposition. The Windrop software helps to capture and analyze
the contact angle.
1.3.5 Solvent rinsing using dip coater
Dip coating refers to the immersing of a substrate into a tank containing coating material, remov-
ing the substrate from the tank, and allowing it to drain. It is a popular way of creating thin film
coated materials along with the spin coating procedure.
Figure 1-18: Photograph showing the solvent rinsing performed with dip coater.
Unlike its standard application, we used the dip coater for rinsing our supported thin films with
various solvents. The advantage of using the dip coater for the solvent rinsing is that along with
the software (Nima TR 8.1) provides control of the sample immersion and withdrawal speeds,
rest positions, rest periods and number of cycles etc. The samples were dipped and withdrawn at
a speed of 48.2 mm/min. The dip coater also helps to keep the samples steady at upright position
for the desired amount of time.
Structuration and glass transition temperature of the adsorbed polymer layer : some insights in the property deviations of the ultra-thin polymer film Aparna Beena Unni, 2016
Chapter 1. Materials and Methods
46
REFERENCES
[1] L. Qi, J. Fresnais, P. Muller, O. Theodoly, J.-F. Berret, and J.-P. Chapel, “Interfacial
Activity of Phosphonated-Polyethylene Glycol Functionalized Cerium Oxide
Nanoparticles.,” Langmuir, 2012.
[2] L. Qi, A. Sehgal, J. C. Castaing, J. P. Chapel, J. Fresnais, J. F. Berret, and F. Cousin,
“Redispersible hybrid nanopowders: Cerium oxide nanoparticle complexes with
phosphonated-PEG oligomers,” ACS Nano, vol. 2, no. 5, pp. 879–888, 2008.
[3] W. Kern, “The evolution of silicon wafer cleaning technology,” J. Electrochem. Soc., vol.
137, no. 6, pp. 1887–1892, 1990.
[4] H.-X. Wu, L. Tan, M.-Y. Yang, C.-J. Liu, and R.-X. Zhuo, “Protein-resistance
performance of amphiphilic copolymer brushes consisting of fluorinated polymers and
polyacrylamide grafted from silicon surfaces,” RSC Adv., vol. 5, no. 16, pp. 12329–12337,
2015.
[5] H. F. Okorn-Schmidt, “Characterization of silicon surface preparation processes for
advanced gate dielectrics,” IBM J. Res. Dev., vol. 43, no. 3, pp. 351–326, 1999.
[6] H. F. Schmidt, I. Teerlinck, W. Storm, H. Bender, M. Meuris, P. W. Mertens, and M. M.
Heyns, “Cleaning Technology in Semiconductor Device Manufacturing,” in Proceedings
of the 4th International Symposium on Cleaning Technology, 1996, p. 480.
[7] C. M. Hansen, Hansen Solubility Parameters, A User’s Hand book. Taylor & Francis,
2007.
[8] T. Lindvig, M. L. Michelsen, and G. M. Kontogeorgis, “A Flory-Huggins model based on
the Hansen solubility parameters,” Fluid Phase Equilib., vol. 203, pp. 247–260, 2002.
[9] S. Franssila, Introduction to Microfabrication, vol. 1. John Wiley & Sons, 2004.
[10] G. Reiter and P. G. de Gennes, “Spin-cast, thin, glassy polymer films: Highly metastable
forms of matter,” Eur. Phys. J. E, vol. 6, no. 1, pp. 25–28, 2001.
Structuration and glass transition temperature of the adsorbed polymer layer : some insights in the property deviations of the ultra-thin polymer film Aparna Beena Unni, 2016

Chapter 1. Materials and Methods
47
[11] W. J. Orts, J. H. van Zanten, W. Wu, and S. K. Satija, “Observation of temperature
dependent thicknesses in ultrathin polystyrene films on silicon,” Phys. Rev. Lett., vol. 71,
no. 6, p. 867, 1993.
[12] G. Reiter, M. Hamieh, P. Damman, S. Sclavons, S. Gabriele, T. Vilmin, and E. Raphael,
“Residual stresses in thin polymer films cause rupture and dominate early stages of
dewetting,” Nat. Mater., vol. 4, no. 10, pp. 754–758, Oct. 2005.
[13] J. Garcia-Turiel and B. Jérôme, “Solvent retention in thin polymer films studied by gas
chromatography,” Colloid Polym. Sci., vol. 285, no. 14, pp. 1617–1623, 2007.
[14] X. Zhang, K. G. Yager, S. Kang, N. J. Fredin, B. Akgun, S. Satija, J. F. Douglas, A.
Karim, and R. L. Jones, “Solvent retention in thin spin-coated polystyrene and poly
(methyl methacrylate) homopolymer films studied by neutron reflectometry,”
Macromolecules, vol. 43, no. 2, pp. 1117–1123, 2009.
[15] R. M. A. Azzam and N. M. Bashara, Ellipsometry and Polarized LightNorth-Holland
Publ. 1977.
[16] H. G. Tompkins and W. A. McGahan, Spectroscopic ellipsometry and reflectometry: a
user’s guide. Wiley New York, 1999.
[17] Stephen Michael Sirard, “Structure and Interaction of Polymer Thin Films with
Supercritical Carbon Dioxide,” The University of Texas at Austin, 2003.
[18] J. A. Forrest and K. Dalnoki-Veress, “The glass transition in thin polymer films,” Adv.
Colloid Interface Sci., vol. 94, pp. 167–196, 2001.
[19] A. El Ouakili, G. Vignaud, E. Balnois, J.-F. Bardeau, and Y. Grohens, “Multiple glass
transition temperatures of polymer thin films as probed by multi-wavelength
ellipsometry,” Thin Solid Films, vol. 519, no. 6, pp. 2031–2036, Jan. 2011.
[20] A. Alessandrini and P. Facci, “AFM: a versatile tool in biophysics,” Meas. Sci. Technol.,
vol. 16, no. 6, pp. R65–R92, 2005.
Structuration and glass transition temperature of the adsorbed polymer layer : some insights in the property deviations of the ultra-thin polymer film Aparna Beena Unni, 2016
Chapter 1. Materials and Methods
48
[21] K. C. Khulbe, C. Y. Feng, and T. Matsuura, Synthetic Polymeric Membranes
Characterization by Atomic Force Microscopy. Springer, 2008.
[22] “NanoScope III Control System User’s Manual, ver 3.0.” Digital Instruments Inc., Santa
Barbara, 1993.
[23] M. Yasaka, “X-ray thin-film measurement techniques,” Rigaku J., vol. 26, no. 2, pp. 1–9,
2010.
[24] R. Förch, H. Schönherr, and A. T. A. Jenkins, “Appendix C: Contact Angle Goniometry,”
in Surface Design: Applications in Bioscience and Nanotechnology, Wiley-VCH Verlag
GmbH & Co. KGaA, 2009, pp. 471–473.
[25] J. N. Israelachvili, Intermolecular and surface forces. Academic Press London, 1991.
Structuration and glass transition temperature of the adsorbed polymer layer : some insights in the property deviations of the ultra-thin polymer film Aparna Beena Unni, 2016

Chapter 2. Density variations of polymer thin films under confinement;
a study based on Ceria nanoparticle adsorption
49
Chapter 2. Density variations of polymer
thin films under confinement; a study based
on Ceria nanoparticle adsorption
Summary
The density variation in confined polymer films still remains a puzzling problem subject to con-
troversy as the methods utilized to determine the density are often model dependent. In this chap-
ter, we propose a direct and model independent method to detect the density/refractive index var-
iations in polymer thin films through adsorption of ceria nanoparticles (NPs) onto their surface.
The amount of adsorbed NP scales with the polymer film refractive index, hence any in-
crease/decrease in the NP surface coverage directly indicates an increase/decrease in the film
refractive index and density. The nanoparticle adsorption experiments conducted on two well
studied polymers, Polystyrene and Poly (methyl methacrylate) is discussed.
Structuration and glass transition temperature of the adsorbed polymer layer : some insights in the property deviations of the ultra-thin polymer film Aparna Beena Unni, 2016
Chapter 2. Density variations of polymer thin films under confinement;
a study based on Ceria nanoparticle adsorption
50
2.1 Introduction
The polymer thin films in a confined state show-up many anomalous behavior in their viscosity,
[1], [2] physical aging, [3], [4] stability, [5], [6] density [7] etc. The mass density is an important
fundamental property of polymer thin films, on which many of the other properties like free vol-
ume, glass transition temperature (Tg), stability, coefficient of thermal expansion (CTE) etc. are
related. Considering the relation of density to other thin film properties, molecular dynamics sim-
ulation showed that the enhancement of the mobility of the polymer chains due to the lowering of
density of the polymer films at polymer vacuum interface results in the reduction of the glass
transition temperature. [8] Later in an experimental study on the effect interfacial interactions on
the glass transition properties of supported thin films, Tsui et. al. showed that a decrease in mass
density of a mobile layer could interpret the depression of Tg. [9] Considering the relation of den-
sity to the stability of polymer thin films, Sharma et. al. found that the increase in the density
with the increasing film thickness can actually stabilize a thermodynamically unstable film,
whereas due to decrease in the density with increasing film thickness, a thermodynamically stable
thin film can be destabilized. [10] Yet another main approach to interpret the anomalous behavior
of films under confinement is by the free volume theory, [11]–[13] where the density scales with
free volume. [14] Considering the traditional concepts of free volume, the motion of individual
particles in a glass forming material requires sufficient free volume into which the particles can
move. [15] The molecular motion in a fluid of hard spheres is conditioned by the presence of
located interstitial holes where there are vacancies of atoms. [16] The specific free volume is giv-
en as Vf = V − Vocc, where V is the total specific volume and Vocc is the occupied volume includ-
ing the interstitial free volume and the van der Waals volume of molecules. The movement of a
molecule into a hole within a cage by the immediate neighbors of the moving particle becomes
only possible when the hole has a greater size than some critical value v*. In such a case, the
temperature dependent redistribution of free volume is assumed to be the reason for the formation
of critical void. As the temperature is decreased, the density increases and it becomes increasing-
ly difficult for a particle to find sufficient free volume for motion to occur on a reasonable time
scale.
Structuration and glass transition temperature of the adsorbed polymer layer : some insights in the property deviations of the ultra-thin polymer film Aparna Beena Unni, 2016

Chapter 2. Density variations of polymer thin films under confinement;
a study based on Ceria nanoparticle adsorption
51
Recently, Napolitano et al. [17] put forward the concept of interfacial free volume (the space
available for molecular relaxations at the polymer/substrate interface) which can differ from the
bulk free volume due to the packing frustration of the adsorbed layer. They have evidenced that
the knowledge of the film thickness together with interfacial interactions are not sufficient to ful-
ly describe the properties of macromolecules under confinement. [17]–[20] Indeed, this local free
volume can alter the long-range structural dynamics from the substrate and consequently the Tg.
[18], [20] Thus the information about the density of polymer thin films can lead us to understand
many other properties which are linked to it. Hence a natural question is how we can probe the
density of polymer films that are confined by their thickness?
Even after more than 2 decades of intense research, the density variation in confined pol-
ymer films still remains a puzzling problem subject to controversy, as the methods utilized to
determine the density are model dependent. Vignaud et al. [14] showed by combining Spectro-
scopic Ellipsometry (SE) and X-ray reflectivity (XRR) that the average density of polystyrene
(PS) thin films on oxide-free H-terminated silicon wafer (H-Si) increases when reducing the film
thickness. This result is in line with the recent results of Gin et. al [21] revealing by X-ray and
neutron reflectivity experiments that the PS chains at the polymer/substrate interface exhibit a
more flattened conformation and thus possesses a higher density than in the bulk. At odds with
these results, XRR measurements reported either no systematic change in density with the film
thickness [22] or even a decreased electron density near the PS substrate interface. [23] Some of
these discrepancies can possibly arise from the sample preparation conditions like the quality and
evaporation rate of the spin-coating solvent [24] (acting on the entanglement density), the nature
of the substrate [25] (acting on interfacial interactions), the annealing time [26] (acting on the
monomer density at the polymer/substrate interface). Another possible source of controversy is
related to the way experimental results coming from ellipsometry and XRR are analyzed. For
XRR, the density profile is determined according to a guessed model that is refined by fitting the
model dependent calculated data to the measured ones. [27] This approach has however a serious
limitation as the phase of the reflected radiation is lost. This prevents the uniqueness of the densi-
ty profile determination from the data. [28] For ellipsometric measurements, the thickness and
refractive index values are strongly correlated in particular for thinner films (h < 10 nm).[29]
Structuration and glass transition temperature of the adsorbed polymer layer : some insights in the property deviations of the ultra-thin polymer film Aparna Beena Unni, 2016

Chapter 2. Density variations of polymer thin films under confinement;
a study based on Ceria nanoparticle adsorption
52
Because ellipsometry is sensitive to the product of the refractive index and the film thickness
(i.e., the optical path length) the absolute value of the index of refraction may be dubious for an
unknown thickness. Hence, probing small changes in the density of ultrathin films remains a very
challenging issue till date.
In this chapter, we propose a novel method based on the adsorption of ceria (CeO2) nano-
particles at the surface of polymer thin films to get this most demanding information. The study is
carried out on two well studied polymers, namely polystyrene (PS) and poly methyl methacrylate
(PMMA). The proposed method allows a direct assessment of the film density without relying on
any model. The amount of adsorbed nanoparticles scales with the polymer film refractive index,
hence any increase/decrease in the nanoparticle surface coverage directly indicates an in-
crease/decrease in the film refractive index. The refractive index, n is linked to the density, ρ by
the Clausius and Mossotti equation as follows:
o2 − 1 o2 + 2 = fP3 r w 2-1
where Na is Avogadro number, M is the molecular weight of the polymer repeating unit, r is the
vacuum permittivity and α being the average polarizability of polymer repeat unit whose unit is
(Cm2/V). Hence a variation in the refractive index is directly indicating the density variations.
2.2 Ceria NP adsorption for sensing the density variations
The principle for using is Ceria NPS for sensing the variations of polymer thin film density is
straightforward. High dielectric constant Ceria NPs [30] adsorb strongly onto any hydrophobic
polymer surface mainly through dispersive van der Waals (LW) interactions. The total Hamaker
constant ATotal of a particle interacting with a surface in a solution is the sum of a zero-frequency,
%¡¢r and a dispersive %¡£r Hamaker constants. [31]
%¤bdP = %¡¢r+ %¡£r 2-2
Structuration and glass transition temperature of the adsorbed polymer layer : some insights in the property deviations of the ultra-thin polymer film Aparna Beena Unni, 2016

Chapter 2. Density variations of polymer thin films under confinement;
a study based on Ceria nanoparticle adsorption
53
where %¡¢r ≈ 34 q $¦I:¦lb¦I¦lb& $¦§I:¦lb¦§I¦lb& 2-3
%¡£r = 3ℎ¨8√2 Roa2 − olb2 To§I2 − olb2 /
©o§I2 + olb2 `/2Roa2 + olb2 T`/2 ªRoa2 + olb2 T`/2 + o§I2 + olb2 `/2«¬
2-4
where h and k are the Planck and Boltzmann constants respectively, ¨ is the main electronic ab-
sorption frequency in the UV typically around 3 × 10`8i:`, T is the temperature, oa, olb, o§I
and ¦I, ¦lb, ¦§I are the refractive index and the relative permittivity of the polymer, the solu-
tion, and the nanoparticles respectively. A simulation of %¡¢r and %¡£r for Ceria NPs interacting
with polymers, Figure 2-1 clearly shows that the contribution of %¡£r is much higher than
%¡¢r and dominates the behavior of ATotal. It clearly shows that the dispersive contribution is
much higher than the zero-frequency term and dominates then the total Hamaker constant. It is
also to be noted that the Hamaker constant is a monotonous growing function of the polymer film
refractive index np.
Figure 2-1. a Zero-frequency eq. 2-3 and b dispersive eq. 2-4 contributions of the Hamaker constant as a function of the dielectric and the refractive index of the polymer surface for a given CeO2 NP dispersion with nNP=1.9, εNP=25, nsol=1.33 and εsol=80 .
Structuration and glass transition temperature of the adsorbed polymer layer : some insights in the property deviations of the ultra-thin polymer film Aparna Beena Unni, 2016

Chapter 2. Density variations of polymer thin films under confinement;
a study based on Ceria nanoparticle adsorption
54
Thus the bigger oa, the stronger the van der Waals interactions. Assuming that the interaction
between NPs and a polymer is mainly governed by ATotal , evidence for a change in the refractive
index of the polymer can be monitored by measuring the adsorption of ceria NPs at the surface of
the polymer. In the framework of this model, one can indeed expect that Ceria NPs will absorb
more strongly on polymer films having a bigger index of refraction. Conversely the higher the
adsorption of NPs, the bigger the index of refraction of the polymer film. This model can thus be
validated if one can observe large variation in the amount of absorbed NPs on polymer films hav-
ing different index of refraction.
2.3 NP deposition on polymer thin films and data acquisition
Thin films of PS (Mw = 136 Kg/mol and polydispersity index (PDI), Mw/Mn=1.05) and PMMA
(Mw = 152.8 Kg/mol and PDI, Mw/Mn=1.08) were spin-coated on Si (100) wafers. Their thickness
was varied by tuning the concentration of polymer/toluene solutions at a speed of 2000 rpm for 1
min. The silicon wafers were diced into pieces of dimension 1x1 cm2 and were immersed in a
piranha solution to remove the organic contamination. All the substrates were then rinsed thor-
oughly by Milli-Q water (resistivity ≈ 18.2 MΩ-cm) and dried with N2. The native oxide thick-
ness was measured to be around 1.7 nm by ellipsometry. Prior to spin-coating of the PS films, the
oxide layer is removed through HF treatment (wafers immersed in 5% HF for 5 mins). After spin-
coating, the films are annealed at 160°C during 24h under vacuum. AFM images also revealed
that the films were homogeneous and extremely flat with typical roughness (root mean square) of
the order of 4Å on a large area (100 µm2).
Structuration and glass transition temperature of the adsorbed polymer layer : some insights in the property deviations of the ultra-thin polymer film Aparna Beena Unni, 2016

Chapter 2. Density variations of polymer thin films under confinement;
a study based on Ceria nanoparticle adsorption
55
Figure 2-2. Schematic illustration of the ceria NPs adsorption process. The key parameters are the adsorption time, the refractive index of the polymer thin film and the NP dispersion, which allows tuning the surface coverage on samples of any shape and size.
Cerium oxide / ceria NP [32], [33] dispersions (10%/w, pH 1.5) were kindly supplied by the
Rhodia-Solvay chemical company (Belgium). The size distribution of the NPs was found to be
log-normal with median diameter 8.3 nm and a polydispersity 0.26 as measured from dynamic
light scattering. The CeO2 NPs were stabilized at low pH by a combination of long range electro-
static forces and short range hydration interactions. The NPs were then adsorbed from solution
onto both types of polymer thin films as shown in Figure 2-2. For PS, a 0.03% /w NP dispersion
was dropped over each sample and allowed to adsorb for 30s (a 100 µL droplet was used for a
1x1 cm2 Si wafer). The solution was then removed and the surface was rinsed with pure nitric
acid solution at pH~1.5. Finally, the surface was cleaned with distilled water (pH~5.6). The in-
termediate cleaning step with nitric acid was performed to avoid the precipitation of the NPs that
occurs when one directly cleans with water (due do an increase of the pH). For PMMA we used
instead a 0.1% /w dispersion and an adsorption time of 20 min (due to a much lower adsorption
resulting from a lower PMMA refractive index).
Structuration and glass transition temperature of the adsorbed polymer layer : some insights in the property deviations of the ultra-thin polymer film Aparna Beena Unni, 2016

Chapter 2. Density variations of polymer thin films under confinement;
a study based on Ceria nanoparticle adsorption
56
AFM measurements were performed in tapping mode using a Silicon cantilever. Two different
samples were measured for each thickness and polymer. At least 3 AFM images were acquired
on different zone of the sample (i.e. 2x3 AFM images for one film thickness) in order to have
good reproducibility and statistics avoiding image artifacts, which provides the error value. The
NP surface coverage was computed from AFM images using Image J software.
2.4 Nanoparticle adsorption as a function of refractive index value of poly-
mers
One of the best ways to validate our model is check the amount of absorbed NPs on polymer
films having different index of refraction. Hence experiments were conducted on PMMA, poly-
propylene (PP) and PS films having a similar thickness of about 200 nm for which the index of
refraction oa was increasing. [34], [35] (Figure 2-3)
Figure 2-3. Amount of ceria NPs adsorbed onto various hydrophobic polymer thin films as a function of the film refractive index. In addition, a silane hydrophobic silica layer SiO2-CH3 (water contact angle of 115°) made by
silanization of the SiO2-Si wafer with the help of ODTS molecules (octadecyltriethoxysilane)
was also used.
Structuration and glass transition temperature of the adsorbed polymer layer : some insights in the property deviations of the ultra-thin polymer film Aparna Beena Unni, 2016
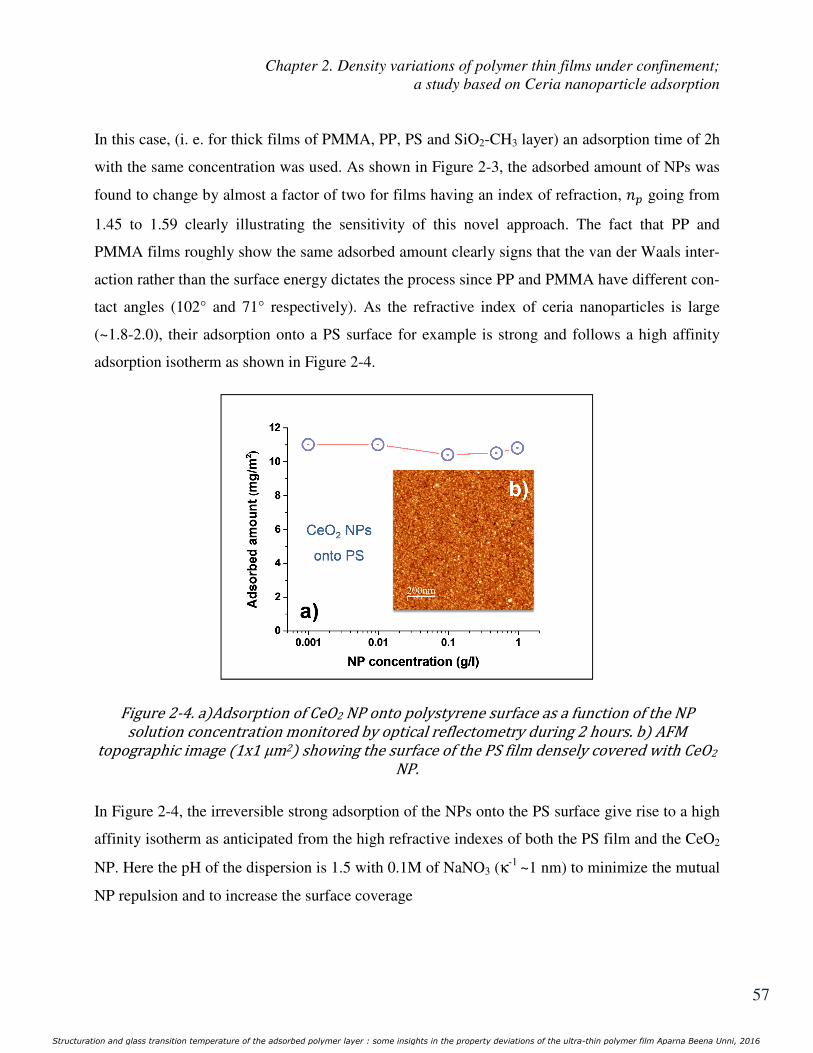
Chapter 2. Density variations of polymer thin films under confinement;
a study based on Ceria nanoparticle adsorption
57
In this case, (i. e. for thick films of PMMA, PP, PS and SiO2-CH3 layer) an adsorption time of 2h
with the same concentration was used. As shown in Figure 2-3, the adsorbed amount of NPs was
found to change by almost a factor of two for films having an index of refraction, oa going from
1.45 to 1.59 clearly illustrating the sensitivity of this novel approach. The fact that PP and
PMMA films roughly show the same adsorbed amount clearly signs that the van der Waals inter-
action rather than the surface energy dictates the process since PP and PMMA have different con-
tact angles (102° and 71° respectively). As the refractive index of ceria nanoparticles is large
(~1.8-2.0), their adsorption onto a PS surface for example is strong and follows a high affinity
adsorption isotherm as shown in Figure 2-4.
Figure 2-4. a Adsorption of CeO2 NP onto polystyrene surface as a function of the NP solution concentration monitored by optical reflectometry during 2 hours. b AFM topographic image 1x1 µm2 showing the surface of the PS film densely covered with CeO2 NP. In Figure 2-4, the irreversible strong adsorption of the NPs onto the PS surface give rise to a high
affinity isotherm as anticipated from the high refractive indexes of both the PS film and the CeO2
NP. Here the pH of the dispersion is 1.5 with 0.1M of NaNO3 (κ-1 ~1 nm) to minimize the mutual
NP repulsion and to increase the surface coverage
Structuration and glass transition temperature of the adsorbed polymer layer : some insights in the property deviations of the ultra-thin polymer film Aparna Beena Unni, 2016
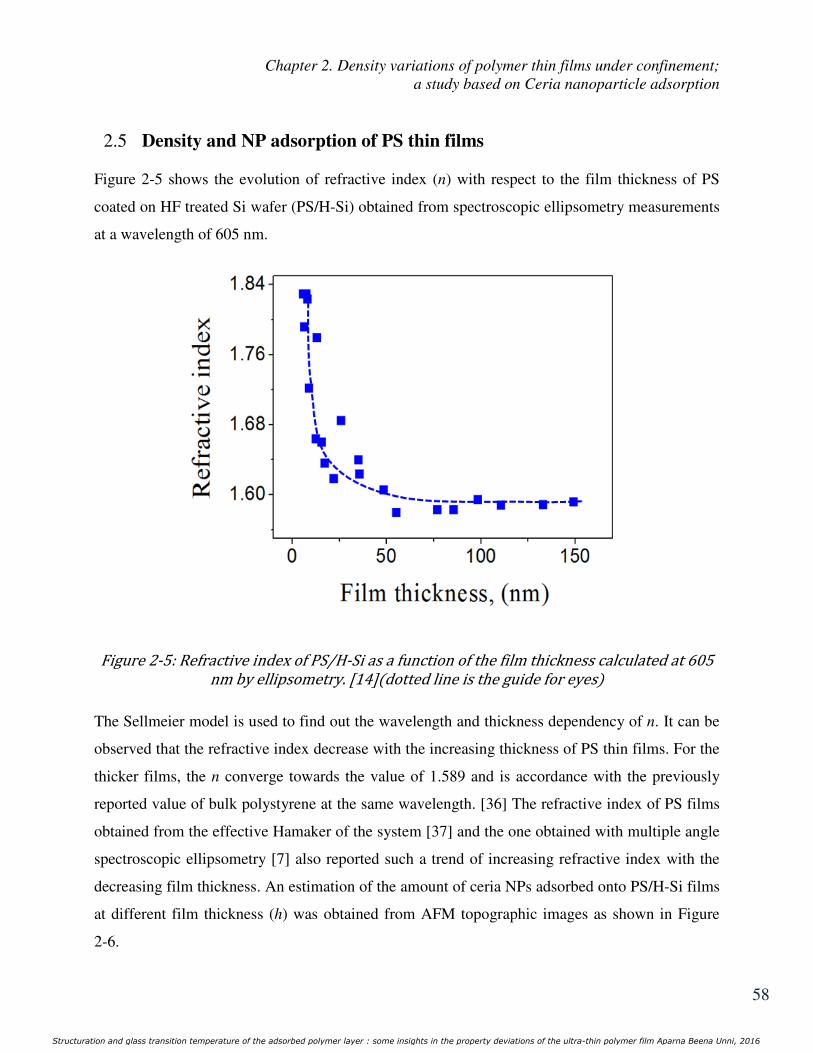
Chapter 2. Density variations of polymer thin films under confinement;
a study based on Ceria nanoparticle adsorption
58
2.5 Density and NP adsorption of PS thin films
Figure 2-5 shows the evolution of refractive index (n) with respect to the film thickness of PS
coated on HF treated Si wafer (PS/H-Si) obtained from spectroscopic ellipsometry measurements
at a wavelength of 605 nm.
Figure 2-5: Refractive index of PS/H-Si as a function of the film thickness calculated at 605 nm by ellipsometry. [14]dotted line is the guide for eyes The Sellmeier model is used to find out the wavelength and thickness dependency of n. It can be
observed that the refractive index decrease with the increasing thickness of PS thin films. For the
thicker films, the n converge towards the value of 1.589 and is accordance with the previously
reported value of bulk polystyrene at the same wavelength. [36] The refractive index of PS films
obtained from the effective Hamaker of the system [37] and the one obtained with multiple angle
spectroscopic ellipsometry [7] also reported such a trend of increasing refractive index with the
decreasing film thickness. An estimation of the amount of ceria NPs adsorbed onto PS/H-Si films
at different film thickness (h) was obtained from AFM topographic images as shown in Figure
2-6.
Structuration and glass transition temperature of the adsorbed polymer layer : some insights in the property deviations of the ultra-thin polymer film Aparna Beena Unni, 2016

Chapter 2. Density variations of polymer thin films under confinement;
a study based on Ceria nanoparticle adsorption
59
Considering three images for instance for easiness (a, c and f), One can clearly observe that the
6.7 nm thick film (a) is densely covered by the ceria NPs whereas the coverage on the 143.6 nm
thick PS film (f) is comparatively very low; the 18.8 nm film falling in between (c).These AFM
images, along with the evolution of percentage area of adsorbed NPs with respect to the PS film
thickness (Figure 2-7) clearly shows that the percentage area of adsorbed nanoparticles decreases
with increasing PS film thickness.
Figure 2-6: AFM topographic images showing the adsorbed ceria nanoparticles to the PS/H- Si surface of PS film thickness, h: a 6.7 nm, b 13.99 nm, c 18.84 nm, d 36 nm, 75.26 nm, f 143.55 nm. Scan size 1*1 µm2
Structuration and glass transition temperature of the adsorbed polymer layer : some insights in the property deviations of the ultra-thin polymer film Aparna Beena Unni, 2016

Chapter 2. Density variations of polymer thin films under confinement;
a study based on Ceria nanoparticle adsorption
60
Figure 2-7: NP coverage in percentage % as a function of PS film thickness h computed from AFM images Comparing this evolution of percentage area of adsorbed nanoparticles to the evolution of refrac-
tive index with thickness (Figure 2-5) one can observe that both follow the same trend. In other
words, the increase percentage area of adsorbed nanoparticles directly indicates an increase in the
refractive index (thus in density) of the film. Among the various factors which influence the den-
sity, the chain conformations of polymer molecules parallel to the solid surface accommodated at
the solid-polymer interfaces, supports the densification of PS films with decreasing film thick-
ness. [38], [39] In addition, the nature of the interactions between PS film and the hydrophobic
Si-H terminated surface [40], [41], the time of annealing of the samples above its Tg [26] etc. can
also generate a densification.
Structuration and glass transition temperature of the adsorbed polymer layer : some insights in the property deviations of the ultra-thin polymer film Aparna Beena Unni, 2016

Chapter 2. Density variations of polymer thin films under confinement;
a study based on Ceria nanoparticle adsorption
61
2.6 Density and NP adsorption of PMMA thin films
Following the observations of PS thin films, it is interesting to check how the percentage adsorp-
tion of the nanoparticle can sense the refractive index for PMMA on silicon wafer (SiOx-Si) with
an oxide layer of 1.7 nm. Figure 2-8 shows the adsorption percentage of ceria nanoparticles on
PMMA/SiOx-Si at various thicknesses. Contrary to what observed with the PS/H-Si, an increased
adsorption of nanoparticle with increasing film thickness can be observed through the AFM im-
ages.
Figure 2-8: AFM topographic images showing the adsorbed ceria nanoparticles to the PMMA/SiOx-Si surface of PMMA film thickness, h: a 6.66 nm, b 12.43 nm, c 32.1 nm, d 41.1 nm, e 66.74 nm, f 95,11nm. Scan size 1*1 µm2 The trend can be clearly observed with the percentage area of adsorbed nanoparticles as a func-
tion of PMMA film thickness as given in the Figure 2-9. Hence from Figure 2-9, one should ex-
pect a decrease in the refractive index of the PMMA films with decreasing film thickness. This is
exactly the case, as observed by the ellipsometric measurements as shown in Figure 2-10.
Structuration and glass transition temperature of the adsorbed polymer layer : some insights in the property deviations of the ultra-thin polymer film Aparna Beena Unni, 2016

Chapter 2. Density variations of polymer thin films under confinement;
a study based on Ceria nanoparticle adsorption
62
Refractive index is measured to be 1.5 at a thickness of 95.1 nm which comparable to the bulk
value 1.49 of the PMMA. [36] So from Figure 2-8 and Figure 2-9, the decrease in the refractive
index of PMMA/ SiOx-Si is detected by the decreased NP adsorption corresponding to the de-
creasing film thickness.
A study of PMMA thin films by neutron reflectivity also reported similar decreased density when
the films become thinner. [42] To explain the difference in density between PS and PMMA, a
key parameter could be the nature of the interactions between the polymer and SiOx layer. Unlike
PS chains that do not form hydrogen bond with the hydrophobic H-Si substrate, PMMA chains
are bonded to the substrate by acid-base interactions involving the carbonyl and the hydroxyl -
OH. For a given chain of atactic PMMA, the number of carbonyl in capacity to form hydrogen
bonds is limited [43] and reduces the number of conformations that a chain can have. These con-
formational restrictions may lead to situations where larger segments of the chains can no longer
arrange themselves in the same dense way as in the bulk.
Figure 2-9: NP surface coverage in percentage % as a function of PMMA film thickness
Structuration and glass transition temperature of the adsorbed polymer layer : some insights in the property deviations of the ultra-thin polymer film Aparna Beena Unni, 2016

Chapter 2. Density variations of polymer thin films under confinement;
a study based on Ceria nanoparticle adsorption
63
Figure 2-10: Refractive index of PMMA-SiOx-Si as a function of the PMMA film thickness. 2.7 Influence of substrate on NP adsorption
All our studies are employed with films of thickness ranging few nanometers (4-100 nm). A lot
of studies have reported that there is a significance influence of the substrate on various proper-
ties of thin films. [44]–[47] Hence a natural question that can arise is whether there is any influ-
ence of the substrate on the percentage adsorption of nanoparticles. In a study on the effect of
long range interactions on glass transition temperature of thin polystyrene films, Zhang et. al.
[48] portrays the influence of oxide layer thickness on the long range effective interfacial poten-
tial, φ(d)vdW as shown in Figure 2-11. This study shows that the relationship between the PS
thickness and the long-range interactions is strongly dependent on the thickness of the oxide lay-
er. The substrate effects are clearly observed when the thickness of the film falls below 10 nm. In
order to check the same, experiments were done on 30 nm films with various silicon oxide thick-
nesses. For the films around 30 nm, there was no observable variation the percentage of the ad-
sorbed NPs as given in the Table 2-1. It was not possible to carry out the experiments with low
thickness PS samples, as the films are found to be dewetted on substrate with oxide layer.
Structuration and glass transition temperature of the adsorbed polymer layer : some insights in the property deviations of the ultra-thin polymer film Aparna Beena Unni, 2016

Chapter 2. Density variations of polymer thin films under confinement;
a study based on Ceria nanoparticle adsorption
64
Figure 2-11.PS film thickness vs. long-range effective interfacial potential as a function of the SiOx layer thickness[48] Table 2-1. Nanoparticle coverage obtained on ~30 nm PS films with various oxide thicknesses.
NP surface
Coverage (%) Error (%)
Refractive index
at 610 nm
(a) Substrate without oxide 29.64 2.6 1.59
(b) Substrate with 1.7 nm oxide layer 29.24 1.59 1.58
(c) Substrate with 424 nm oxide layer 30.41 1.6 1.57
As it is not possible to obtain the details on the influence of substrate nature with very thin films
of PS, we tried the substrate influence test on PMMA samples. The experiments are done on
PMMA films at two thickness regions, (1) around 30 nm and case (2) around 4nm. Figure 2-12
shows the ceria nanoparticles adsorbed on films of PMMA film ~30 nm on Si wafer a) without
oxide layer on the substrate b) Oxide thickness of 1.7 nm on the substrate c) oxide thickness of
424 nm on the substrate. The measured amount of NPs adsorbed onto the film is given in the Ta-
ble 2-2.
Structuration and glass transition temperature of the adsorbed polymer layer : some insights in the property deviations of the ultra-thin polymer film Aparna Beena Unni, 2016

Chapter 2. Density variations of polymer thin films under confinement;
a study based on Ceria nanoparticle adsorption
65
Figure 2-12: AFM topographic images showing the adsorbed ceria nanoparticles on films of PMMA film ~30 nm on Si wafer a without oxide layer on the substrate b Oxide thickness of 1.7 nm on the substrate c oxide thickness of 424 nm on the substrate. Scan area of 1*1 µm.
NP surface
Coverage (%) Error (%)
Refractive index
at 610 nm
(a) Substrate without oxide 40.885 1.185 1.481
(b) Substrate with 1.7 nm oxide layer 39.73 2.83 1.480
(c) Substrate with 424 nm oxide layer 43.56 3.92 1.493
Table 2-2. Nanoparticle coverage obtained on ~30 nm PMMA films with various oxide thicknesses. It can be observed that the NP surface coverage possess a close value for all the films of thick-
ness ~30nm, irrespective of their oxide thickness. Considering the NP surface coverage of
PMMA films with thickness of around 4 nm, it was tested on the H terminated Si wafer and Si
with a 424 nm oxide layer. Figure 2-13 shows the ceria nanoparticles adsorbed on films of
PMMA film whose values are tabulated in Table 2-3.
Structuration and glass transition temperature of the adsorbed polymer layer : some insights in the property deviations of the ultra-thin polymer film Aparna Beena Unni, 2016
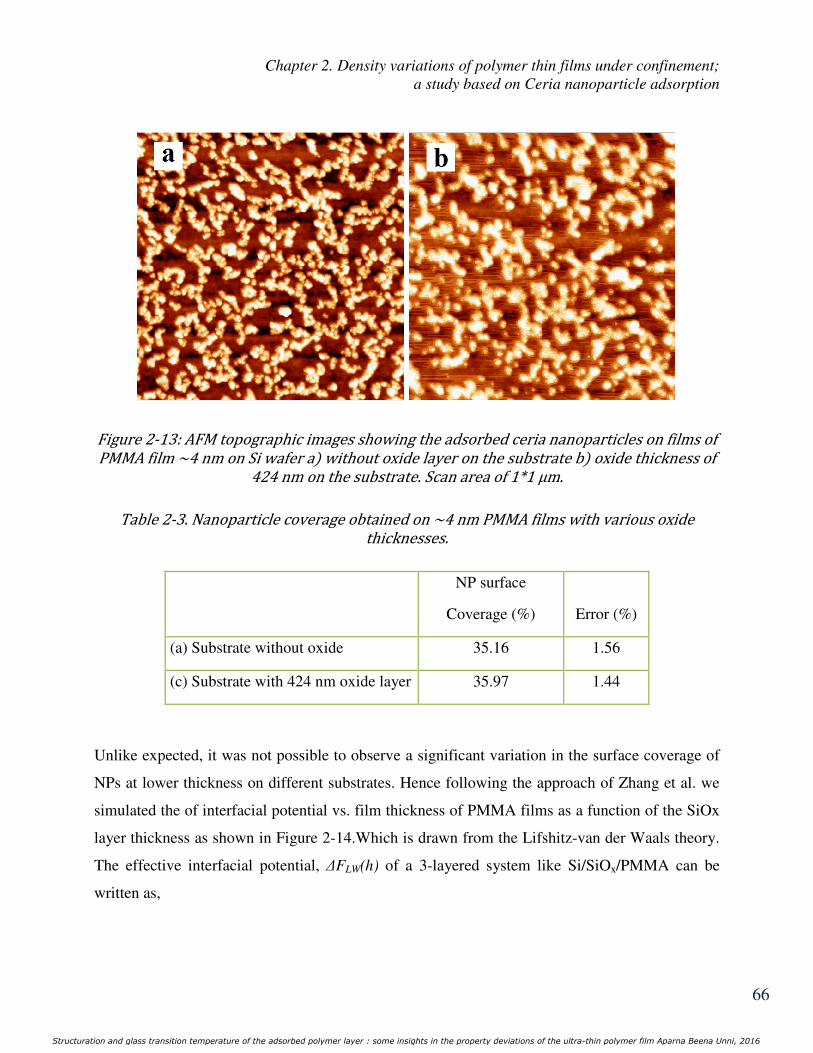
Chapter 2. Density variations of polymer thin films under confinement;
a study based on Ceria nanoparticle adsorption
66
Figure 2-13: AFM topographic images showing the adsorbed ceria nanoparticles on films of PMMA film ~4 nm on Si wafer a without oxide layer on the substrate b oxide thickness of 424 nm on the substrate. Scan area of 1*1 µm. Table 2-3. Nanoparticle coverage obtained on ~4 nm PMMA films with various oxide thicknesses.
NP surface
Coverage (%) Error (%)
(a) Substrate without oxide 35.16 1.56
(c) Substrate with 424 nm oxide layer 35.97 1.44
Unlike expected, it was not possible to observe a significant variation in the surface coverage of
NPs at lower thickness on different substrates. Hence following the approach of Zhang et al. we
simulated the of interfacial potential vs. film thickness of PMMA films as a function of the SiOx
layer thickness as shown in Figure 2-14.Which is drawn from the Lifshitz-van der Waals theory.
The effective interfacial potential, ∆FLW(h) of a 3-layered system like Si/SiOx/PMMA can be
written as,
Structuration and glass transition temperature of the adsorbed polymer layer : some insights in the property deviations of the ultra-thin polymer film Aparna Beena Unni, 2016

Chapter 2. Density variations of polymer thin films under confinement;
a study based on Ceria nanoparticle adsorption
67
∆FLW(h)=
+
−−
−+
+
−
)²(12²12)²(12//////
x
xx
x SiO
AirPolymerSiOAirPolymerSiO
SiO
AirPolymerSi
dh
A
h
A
dh
A
πππ
2-5
where ASi/Polymer/Air and ASiOx/Polymer/Air are the effective Hamaker constants of the Si/Polymer/Air
and SiOx/Polymer/Air 3 layer systems, respectively. This is calculated using the relation;
SubstrateSubstratePolymerPolymerPolymerPolymerAirPolymerSubstrate AAAA ///// ×−=
2-6
The average values of Hamaker constant obtained from the literature are used for the calcula-
tions, where ASi/Si = 22.3×10⁻²⁰J, ASiO2/SiO2 = 5.8×10⁻²⁰ J, APMMA/PMMA = 7.11×10⁻²⁰ J respectively.
[6], [31], [49]–[52] From the evolution of interfacial potential with respect to the oxide layer
thickness, we can expect a difference in the percentage adsorption of the nanoparticles only when
the film thickness is less than 1 nm. Hence the similar NP adsorption percentage observed on
PMMA films (even around 4nm) with substrates of varying oxide thickness can be justified.
Thus considering the influence of substrate on the NP adsorption, for PS, no significant influence
was observed for the film thickness around 30 nm whereas we were unable to probe the effect
below 10 nm due to film dewetting. In case of PMMA, the nanoparticle adsorption is found to be
independent of the substrate nature even for films of thickness around 4 nm.
Structuration and glass transition temperature of the adsorbed polymer layer : some insights in the property deviations of the ultra-thin polymer film Aparna Beena Unni, 2016

Chapter 2. Density variations of polymer thin films under confinement;
a study based on Ceria nanoparticle adsorption
68
Figure 2-14: Interfacial potential vs. film thickness of PMMA films as function of SiOx layer thickness. 2.8 Correlation of density with thin film thermal behavior
Even if the thermal behavior of the system is not within the scope of this chapter, as we observed
the opposing trends for the density evolution of PS and PMMA with film thickness, it is interest-
ing to have a short mention to the related thermal behavior which can lead to future investiga-
tions. Considering PS, the ellipsometric studies together with X ray reflectivity showed that the
free volume of a thin film is smaller than the one of a thick film below the glass transition tem-
perature; it reaches a characteristic value v* at a lower temperature which is near the glass transi-
tion temperature as schematically shown in Figure 2-15. As the density of the films scales as the
free volume, thinner films are found to be denser than thicker ones. Thus for PS, when film
thickness is reduced, Tg decreases, [53] coefficient of thermal expansion (CTE) [53]–[56] and
density increase [7], [14].
Structuration and glass transition temperature of the adsorbed polymer layer : some insights in the property deviations of the ultra-thin polymer film Aparna Beena Unni, 2016

Chapter 2. Density variations of polymer thin films under confinement;
a study based on Ceria nanoparticle adsorption
69
Figure 2-15:Schematic representation showing that the critical volume is reached at a lower temperature for the thinner film.[14] This is just the opposite for PMMA thin films whose glass transition temperature increase [45],
[57], [58] along with the coefficient of thermal expansion [59] and film density [42]. Although
counterintuitive, a reduction of Tg for PS (increase for PMMA) when density is higher than the
bulk (lower for PMMA) can be justified by an increase in CTE (decrease for PMMA) with de-
creasing film thickness. Based on our previous work, [14] a reduction in thermal expansion with
decreasing film thickness indicates that the increase in free volume with temperature is less rapid
in the thinner films of PMMA. The thermal behavior of the two studied polymers extracted from
the literature and compiled in Table 2-4.
Thus the thinner films reaches its critical volume v* (which is the minimum space needed to al-
low molecules rearrangement) later compared to the thick films, which is exactly the contrary for
the PS films. This behavior can be illustrated as shown in Figure 2-16.
Structuration and glass transition temperature of the adsorbed polymer layer : some insights in the property deviations of the ultra-thin polymer film Aparna Beena Unni, 2016

Chapter 2. Density variations of polymer thin films under confinement;
a study based on Ceria nanoparticle adsorption
70
Table 2-4. Shows the increase ↑ or decrease ↓ of Glass transition temperature Tg , Coefficient of thermal expansion CTE and the densityρ with decrease in film thickness of PS and PMMA. h ↓ Tg CTE ρ
PS ↓ ↑ ↑
PMMA ↑ ↓ ↓
Figure 2-16: The schematic representation of the free volume that evolves with temperature, for PMMA and PS films. v* stands for the critical volume.
Structuration and glass transition temperature of the adsorbed polymer layer : some insights in the property deviations of the ultra-thin polymer film Aparna Beena Unni, 2016

Chapter 2. Density variations of polymer thin films under confinement;
a study based on Ceria nanoparticle adsorption
71
2.9 Conclusion
A novel and simple approach is put forward to assess/detect the refractive index/density varia-
tions in polymer thin films through the adsorption of ceria NPs onto the polymer film surface.
The NP adsorbed amount being a monotonic function of the polymer surface refractive index,
any increase/decrease in the NP surface coverage can be directly ascribed to an increase/decrease
in the thin film refractive index and density. Furthermore, using this approach we found that the
density of PS thin films on high energy oxide-free Si wafer increases with a reduction of the film
thickness whereas the investigation performed on PMMA films spin-casted on low energy SiOx-
Si wafers shows a reverse trend: a decrease of the density with the film thickness. A better under-
standing on how confinement and interfaces perturb Tg in polymer thin films clearly substantiate
any further works on the coefficient of thermal expansion (CTE) - dependent density in particular
because CTE provides the evolution of the free volume/density as a function of the temperature.
[14]
Structuration and glass transition temperature of the adsorbed polymer layer : some insights in the property deviations of the ultra-thin polymer film Aparna Beena Unni, 2016

Chapter 2. Density variations of polymer thin films under confinement;
a study based on Ceria nanoparticle adsorption
72
REFERENCES
[1] H. Bodiguel and C. Fretigny, “Reduced viscosity in thin polymer films,” Phys. Rev. Lett.,
vol. 97, no. 26, pp. 266105, 1–4, 2006.
[2] F. Chen, D. Peng, C.-H. Lam, and O. K. C. Tsui, “Viscosity and Surface-Promoted
Slippage of Thin Polymer Films Supported by a Solid Substrate,” Macromolecules, vol.
48, no. 14, pp. 5034–5039, Jul. 2015.
[3] D. Cangialosi, V. M. Boucher, A. Alegria, and J. Colmenero, “Direct Evidence of Two
Equilibration Mechanisms in Glassy Polymers,” Phys. Rev. Lett., vol. 111, no. 9, p. 95701,
2013.
[4] D. Cangialosi, V. M. Boucher, A. Alegria, and J. Colmenero, “Physical aging in polymers
and polymer nanocomposites: recent results and open questions,” Soft Matter, vol. 9, no.
36, pp. 8619–8630, 2013.
[5] R. Xie, A. Karim, J. Douglas, C. Han, and R. Weiss, “Spinodal Dewetting of Thin Polymer
Films,” Phys. Rev. Lett., vol. 81, no. 6, pp. 1251–1254, 1998.
[6] A. Sharma and G. Reiter, “Instability of Thin Polymer Films on Coated Substrates:
Rupture, Dewetting, and Drop Formation,” J. Colloid Interface Sci., vol. 178, no. 2, pp.
383–399, 1996.
[7] S. Ata, K. Kuboyama, K. Ito, Y. Kobayashi, and T. Ougizawa, “Anisotropy and
densification of polymer ultrathin films as seen by multi-angle ellipsometry and X-ray
reflectometry,” Polymer., vol. 53, no. 4, pp. 1028–1033, 2012.
[8] K. F. Mansfield and D. N. Theodorou, “Molecular dynamics simulation of a glassy
polymer surface,” Macromolecules, vol. 24, no. 23, pp. 6283–6294, Nov. 1991.
Structuration and glass transition temperature of the adsorbed polymer layer : some insights in the property deviations of the ultra-thin polymer film Aparna Beena Unni, 2016

Chapter 2. Density variations of polymer thin films under confinement;
a study based on Ceria nanoparticle adsorption
73
[9] O. K. C. Tsui, T. P. Russell, and C. J. Hawker, “Effect of Interfacial Interactions on the
Glass Transition of Polymer Thin Films,” Macromolecules, vol. 34, no. 16, pp. 5535–
5539, Jul. 2001.
[10] A. Sharma, J. Mittal, and R. Verma, “Instability and Dewetting of Thin Films Induced by
Density Variations,” Langmuir, vol. 18, no. 26, pp. 10213–10220, Dec. 2002.
[11] V. M. Boucher, D. Cangialosi, A. Alegría, and J. Colmenero, “Accounting for the
thickness dependence of the Tg in supported PS films via the volume holes diffusion
model,” Thermochim. Acta, vol. 575, pp. 233–237, Jan. 2014.
[12] S. Herminghaus, K. Jacobs, and R. Seemann, “The glass transition of thin polymer films:
some questions, and a possible answer,” Eur. Phys. J. E, vol. 5, pp. 531–538, Aug. 2001.
[13] D. Long and F. Lequeux, “Heterogeneous dynamics at the glass transition in van der
Waals liquids, in the bulk and in thin films,” Eur. Phys. J. E, vol. 4, no. 3, pp. 371–387,
2001.
[14] G. Vignaud, M. S. Chebil, J. K. Bal, N. Delorme, T. Beuvier, Y. Grohens, and A. Gibaud,
“Densification and Depression in Glass Transition Temperature in Polystyrene Thin
Films,” Langmuir, vol. 30, no. 39, pp. 11599–11608, 2014.
[15] M. H. Cohen and D. Turnbull, “Molecular Transport in Liquids and Glasses,” J. Chem.
Phys., vol. 31, no. 5, pp. 1164–1169, 1959.
[16] D. Turnbull and M. H. Cohen, “Free-Volume Model of the Amorphous Phase: Glass
Transition,” J. Chem. Phys., vol. 34, no. 1, pp. 120–125, 1961.
[17] S. Napolitano, C. Rotella, and M. Wübbenhorst, “Can Thickness and Interfacial
Interactions Univocally Determine the Behavior of Polymers Confined at the Nanoscale?,”
ACS Macro Lett., vol. 1, no. 10, pp. 1189–1193, Oct. 2012.
Structuration and glass transition temperature of the adsorbed polymer layer : some insights in the property deviations of the ultra-thin polymer film Aparna Beena Unni, 2016
Chapter 2. Density variations of polymer thin films under confinement;
a study based on Ceria nanoparticle adsorption
74
[18] S. Napolitano, A. Pilleri, P. Rolla, and M. Wübbenhorst, “Unusual Deviations from Bulk
Behavior in Ultrathin Films of Poly(tert-butylstyrene): Can Dead Layers Induce a
Reduction of Tg?,” ACS Nano, vol. 4, no. 2, pp. 841–848, Feb. 2010.
[19] S. Napolitano and D. Cangialosi, “Interfacial Free Volume and Vitrification: Reduction in
Tg,” Macromolecules, vol. 46, pp. 8051–8053, 2013.
[20] S. Napolitano, S. Capponi, and B. Vanroy, “Glassy dynamics of soft matter under 1D
confinement: How irreversible adsorption affects molecular packing, mobility gradients
and orientational polarization in thin films,” Eur. Phys. J. E, vol. 36, no. 6, p. 61, 2013.
[21] P. Gin, N. Jiang, C. Liang, T. Taniguchi, B. Akgun, S. K. Satija, M. K. Endoh, and T.
Koga, “Revealed Architectures of Adsorbed Polymer Chains at Solid-Polymer Melt
Interfaces,” Phys. Rev. Lett., vol. 109, no. 26, p. 265501, Dec. 2012.
[22] W. E. Wallace, N. C. B. Tan, W. L. Wu, and S. Satija, “Mass density of polystyrene thin
films measured by twin neutron reflectivity,” J. Chem. Phys., vol. 108, no. 9, pp. 3798–
3804, 1998.
[23] G. Reiter, “Mobility of polymers in films thinner than their unperturbed size,” Europhys.
Lett., vol. 23, no. 8, p. 579, 1993.
[24] R. N. Li, A. Clough, Z. Yang, and O. K. C. Tsui, “Equilibration of Polymer Films Cast
from Solutions with Different Solvent Qualities,” Macromolecules, vol. 45, no. 2, pp.
1085–1089, Jan. 2012.
[25] D. S. Fryer, R. D. Peters, E. J. Kim, J. E. Tomaszewski, J. J. de Pablo, P. F. Nealey, C. C.
White, and W. Wu, “Dependence of the Glass Transition Temperature of Polymer Films
on Interfacial Energy and Thickness,” Macromolecules, vol. 34, no. 16, pp. 5627–5634,
Jul. 2001.
[26] S. Napolitano and M. Wübbenhorst, “The lifetime of the deviations from bulk behaviour in
polymers confined at the nanoscale,” Nat. Commun., vol. 2, p. 260, Mar. 2011.
Structuration and glass transition temperature of the adsorbed polymer layer : some insights in the property deviations of the ultra-thin polymer film Aparna Beena Unni, 2016

Chapter 2. Density variations of polymer thin films under confinement;
a study based on Ceria nanoparticle adsorption
75
[27] A. Gibaud and G. Vignaud, “Specular Reflectivity from Smooth and Rough Surfaces,” in
X-ray and Neutron Reflectivity: Principles and Applications, Springer, 2009, pp. 85–131.
[28] B. Bataillou, H. Moriceau, and F. Rieutord, “Direct inversion of interfacial reflectivity data
using the Patterson function,” J. Appl. Crystallogr., vol. 36, no. 6, pp. 1352–1355, 2003.
[29] H. G. Tompkins and E. A. Irene, Handbook of Ellipsometry, vol. 30, no. 7. William
Andrew, 2005.
[30] T. Yamamoto, H. Momida, T. Hamada, T. Uda, and T. Ohno, “First-principles study of
dielectric properties of cerium oxide,” Thin Solid Films, vol. 486, no. 1–2, pp. 136–140,
Aug. 2005.
[31] J. N. Israelachvili, Intermolecular and surface forces. Academic Press London, 1991.
[32] L. Qi, A. Sehgal, J. C. Castaing, J. P. Chapel, J. Fresnais, J. F. Berret, and F. Cousin,
“Redispersible hybrid nanopowders: Cerium oxide nanoparticle complexes with
phosphonated-PEG oligomers,” ACS Nano, vol. 2, no. 5, pp. 879–888, 2008.
[33] L. Qi, J. Fresnais, P. Muller, O. Theodoly, J.-F. Berret, and J.-P. Chapel, “Interfacial
Activity of Phosphonated-Polyethylene Glycol Functionalized Cerium Oxide
Nanoparticles.,” Langmuir, 2012.
[34] J. P. Chapel and M. Morvan, “Modified surfaces and method for modifying a surface,”
WO2007126925 A2, 2007.
[35] S. Sekar, J. Giermanska, and J.-P. Chapel, “Reusable and recyclable quartz crystal
microbalance sensors,” Sensors Actuators B Chem., vol. 212, pp. 196–199, Jun. 2015.
[36] S. N. Kasarova, N. G. Sultanova, C. D. Ivanov, and I. D. Nikolov, “Analysis of the
dispersion of optical plastic materials,” Opt. Mater. (Amst)., vol. 11, no. 29, pp. 1481–
1490, 2007.
Structuration and glass transition temperature of the adsorbed polymer layer : some insights in the property deviations of the ultra-thin polymer film Aparna Beena Unni, 2016

Chapter 2. Density variations of polymer thin films under confinement;
a study based on Ceria nanoparticle adsorption
76
[37] Y. Li, J. Q. Pham, K. P. Johnston, and P. F. Green, “Contact Angle of Water on
Polystyrene Thin Films : Effects of CO 2 Environment and Film Thickness,” Langmuir,
vol. 23, pp. 9785–9793, 2007.
[38] D. Hudzinskyy, A. V. Lyulin, A. R. C. Baljon, N. K. Balabaev, and M. A. J. Michels,
“Effects of strong confinement on the glass-transition temperature in simulated atactic
polystyrene films,” Macromolecules, vol. 44, no. 7, pp. 2299–2310, Apr. 2011.
[39] R. L. Jones, S. K. Kumar, D. L. Ho, R. M. Briber, and T. P. Russell, “Chain conformation
in ultrathin polymer films,” Nature, vol. 400, pp. 146–149, 1999.
[40] Y. Fujii, Z. Yang, J. Leach, H. Atarashi, K. Tanaka, and O. K. C. Tsui, “Affinity of
Polystyrene Films to Hydrogen-Passivated Silicon and Its Relevance to the T g of the
Films,” Macromolecules, vol. 42, no. 19, pp. 7418–7422, Oct. 2009.
[41] P. T. Wilson, L. J. Richter, W. E. Wallace, K. A. Briggman, and J. C. Stephenson,
“Correlation of molecular orientation with adhesion at polystyrene/solid interfaces,” Chem.
Phys. Lett., vol. 363, no. 1–2, pp. 161–168, 2002.
[42] W. Wu, W. J. Orts, J. H. Van Zanten, and B. M. Fanconi, “Density profile of spin cast
polymethylmethacrylate thin films,” J. Polym. Sci. Part B Polym. Phys., vol. 32, no. 15,
pp. 2475–2480, 1994.
[43] Y. Grohens, M. Brogly, C. Labbe, M.-O. David, and J. Schultz, “Glass Transition of
Stereoregular Poly(methyl methacrylate) at Interfaces,” Langmuir, vol. 14, no. 11, pp.
2929–2932, May 1998.
[44] D. Qi, Z. Fakhraai, and J. A. Forrest, “Substrate and chain size dependence of near surface
dynamics of glassy polymers,” Phys. Rev. Lett., vol. 101, no. 9, pp. 1–4, 2008.
[45] R. P. White, C. C. Price, and J. E. G. Lipson, “Effect of Interfaces on the Glass Transition
of Supported and Freestanding Polymer Thin Films,” Macromolecules, vol. 48, no. 12, pp.
4132–4141, Jun. 2015.
Structuration and glass transition temperature of the adsorbed polymer layer : some insights in the property deviations of the ultra-thin polymer film Aparna Beena Unni, 2016

Chapter 2. Density variations of polymer thin films under confinement;
a study based on Ceria nanoparticle adsorption
77
[46] X. Zheng, M. H. Rafailovich, J. Sokolov, Y. Strzhemechny, S. A. Schwarz, B. B. Sauer,
and M. Rubinstein, “Long-Range Effects on Polymer Diffusion Induced by a Bounding
Interface,” Phys. Rev. Lett., vol. 79, no. 2, pp. 241–244, 1997.
[47] R. D. Priestley, C. J. Ellison, L. J. Broadbelt, and J. M. Torkelson, “Structural relaxation of
polymer glasses at surfaces, interfaces, and in between.,” Science, vol. 309, no. 5733, pp.
456–9, Jul. 2005.
[48] C. Zhang, Y. Fujii, and K. Tanaka, “Effect of Long Range Interactions on the Glass
Transition Temperature of Thin Polystyrene Films,” ACS Macro Lett., vol. 1, pp. 1317–
1320, 2012.
[49] T. Kerle, R. Yerushalmi-Rozen, J. Klein, and L. J. Fetters, “van der Waals stable thin
liquid films : Correlated undulations and ultimate dewetting,” Eur. Lett., vol. 44, no. 4, pp.
484–490, 1998.
[50] L. Bergström, “Hamaker constants of inorganic materials,” Adv. Colloid Interface Sci.,
vol. 70, pp. 125–169, 1997.
[51] H. D. Ackler, R. H. French, and Y.-M. Chiang, “Comparisons of Hamaker constants for
ceramic systems with intervening vacuum or water: From force laws and physical
properties,” J. Colloid Interface Sci., vol. 179, pp. 460–469, 1996.
[52] H. Zhao, Y. J. Wang, and O. K. C. Tsui, “Dewetting induced by complete versus
nonretarded van der Waals forces.,” Langmuir, vol. 21, no. 13, pp. 5817–24, Jun. 2005.
[53] J. L. I. Keddie, R. A. L. Jones, and R. A. Cory, “Size-Dependent Depression of the Glass
Transition Temperature in Polymer Films .,” Europhys. Lett., vol. 27, no. July, pp. 59–64,
1994.
[54] J. E. Pye and C. B. Roth, “Above, below, and in-between the two glass transitions of
ultrathin free-standing polystyrene films: Thermal expansion coefficient and physical
aging,” J. Polym. Sci. Part B Polym. Phys., vol. 53, no. 1, pp. 64–75, Jan. 2015.
Structuration and glass transition temperature of the adsorbed polymer layer : some insights in the property deviations of the ultra-thin polymer film Aparna Beena Unni, 2016

Chapter 2. Density variations of polymer thin films under confinement;
a study based on Ceria nanoparticle adsorption
78
[55] S. Kawana and R. A. L. Jones, “Character of the glass transition in thin supported polymer
films,” Phys. Rev. E, vol. 63, no. 2, p. 21501, 2001.
[56] L. Singh, P. J. Ludovice, and C. L. Henderson, “Influence of molecular weight and film
thickness on the glass transition temperature and coefficient of thermal expansion of
supported ultrathin polymer films,” Thin Solid Films, vol. 449, no. 1–2, pp. 231–241, Feb.
2004.
[57] J. L. Keddie, R. A. L. Jones, and R. A. Cory, “Interface and surface effects on the glass-
transition temperature in thin polymer films,” Faraday Discuss., vol. 98, pp. 219–230,
1994.
[58] T. Lan and J. M. Torkelson, “Methacrylate-based polymer films useful in lithographic
applications exhibit different glass transition temperature-confinement effects at high and
low molecular weight,” Polymer., vol. 55, no. 5, pp. 1249–1258, Mar. 2014.
[59] W. Wu, J. H. van Zanten, and W. J. Orts, “Film Thickness Dependent Thermal Expansion
in Ultrathin Poly(methyl methacrylate) Films on Silicon,” Macromolecules, vol. 28, no. 3,
pp. 771–774, Jan. 1995.
Structuration and glass transition temperature of the adsorbed polymer layer : some insights in the property deviations of the ultra-thin polymer film Aparna Beena Unni, 2016
Chapter 3. Stable ultrathin polymer films (<7nm) made by solvent rinsing
79
Chapter 3. Stable ultrathin polymer films
(<7nm) made by solvent rinsing
Parts of this chapter are extracted from:
“Stability of Polymer Ultrathin Films (<7 nm) Made by a Top-Down Approach”
Adapted with permission from,
Bal, J. K.; Beuvier, T.; Unni, A. B.; Chavez Panduro, E. A.; Vignaud, G.; Delorme, N.; Chebil,
M. S.; Grohens, Y.; Gibaud, A. ACS Nano 2015, 9, 8184–8193
Copyright © (2015) American Chemical Society
Summary
Succeeding the discussion about density variations observed when polymer thin films are con-
fined by their thickness in chapter1, this chapter deals with stability issues observed when the
thickness of polymer films are reduced. Polystyrene films on Si wafer with different surface
treatment are employed for the study, with an aim to investigate the causes of instability in poly-
mer thin films and to find a route to obtain ultrathin stable polymer films. The bulk PS films are
rinsed with a good solvent toluene to obtain the polymer residual layer, whose thickness is in the
order of few nanometers. Its stability is experimentally analyzed and further understanding of the
results is achieved with the help of Lifshitz van der Waals intermolecular theory.
Structuration and glass transition temperature of the adsorbed polymer layer : some insights in the property deviations of the ultra-thin polymer film Aparna Beena Unni, 2016

Chapter 3. Stable ultrathin polymer films (<7nm) made by solvent rinsing
80
3.1 Introduction
The stability of thin polymer films is of paramount importance for a variety of applications such
as sensors, [1] coating, [2] adhesives, [3] biomedical devices, [4] organic solar cells, [5], [6] thin-
film transistors (OTFTs) [7] etc. Despite a notably growing literature, it is not yet clear why pol-
ymer thin films often exhibit strong deviations from bulk behavior. For example, under certain
conditions thin films show undesirable rupture although they are expected to be energetically
stable. [8] Key issues in interpreting these results are originating from sample preparation. The
induction of residual stress during spin-coating due to out of equilibrium chain conformations
that arise from rapid solvent loss has been frequently considered as the main source of instabili-
ties. [9] It has been shown recently that the reduction of mechanical stresses can be achieved by
severe thermal annealing for durations exceeding by far the reptation time. [10] However when
the film thickness becomes very small (typically of the order of a few Rg), numerous experiments
show that annealing above the glass transition temperature (Tg) reveals their instability through
the formation of holes. It is therefore of fundamental interest to address how one can predict the
stability of a thin film and more importantly to propose a strategy for the stabilization of ultrathin
films.
Considering the concept of stability, when there is fluid on a substrate, the fluid will not
form a stable film on the substrate if the substrate has a lower surface tension than a fluid. Conse-
quently such an unstable fluid film will retract from this substrate by a dewetting process, [11]–
[14] which is characterized by the formation of holes, their growth, and coalescence, finally lead-
ing to a set of droplets on the substrate. [15] The distinction among the stable, metastable and the
unstable states can be understood with the help of the effective interfacial potential, ∆ℎ and its
second derivative, ∆"ℎr . ∆ℎ is defined as the excess free energy per unit area necessary to
bring two interfaces (the substrate-polymer and the polymer-solvent interfaces) from infinity to a
certain distance h. The distance h defines the thickness of the polymer layer separating the two
interfaces. From its definition and as shown in Figure 3-1, it is clear that as ∆ℎ → 0 as ℎ tends
to infinity. [16]
Structuration and glass transition temperature of the adsorbed polymer layer : some insights in the property deviations of the ultra-thin polymer film Aparna Beena Unni, 2016

Chapter 3. Stable ultrathin polymer films (<7nm) made by solvent rinsing
81
Figure 3-1: Sketch of the effective interface potential as a function of film thickness for stable 1 , unstable 2 , and metastable 3 films. The film is said to be stable when ∆ℎ > 0 and the global minimum lies at infinite thickness
(curve 1). Considering the curve 2, the film is unstable for small film thickness ∆"ℎr < 0, (ℎr
is the initial film thickness) whereas the film is metastable for larger film thicknesses ∆"ℎr >0. In the metastable case, the system has to overcome a potential barrier in order to reach its state
of lowest energy at h = dmin. Some kind of nuclei, e.g. dust particles or defects, are required to
lower ∆ℎ and can therefore induce rupture of the film by a mechanism called “heterogeneous
nucleation”.[17] The system is unstable when the second derivative of ∆ w.r.t. the film thick-
ness is negative (curve 3). In this case, the capillary waves on the film surface are spontaneously
amplified under thermal annealing and the rupture mechanism is termed “spinodal dewetting”.
[18], [19] The spinodal wavelength λ is the key to clearly identify a spinodal dewetting process in
experimental systems which is related to the second derivative of interfacial potential as follows:
[12], [16]
vℎ = ¼−8t2½"ℎ 3-1
Where ½ is the surface tension between the film and surrounding media. Considering the
interfacial potential, Lifshitz van der Waals intermolecular potential provides a convincing start-
ing point to calculate free energy per unit area of a film ∆ℎ of thickness h on a flat surface as
follows: [11], [20]
Structuration and glass transition temperature of the adsorbed polymer layer : some insights in the property deviations of the ultra-thin polymer film Aparna Beena Unni, 2016
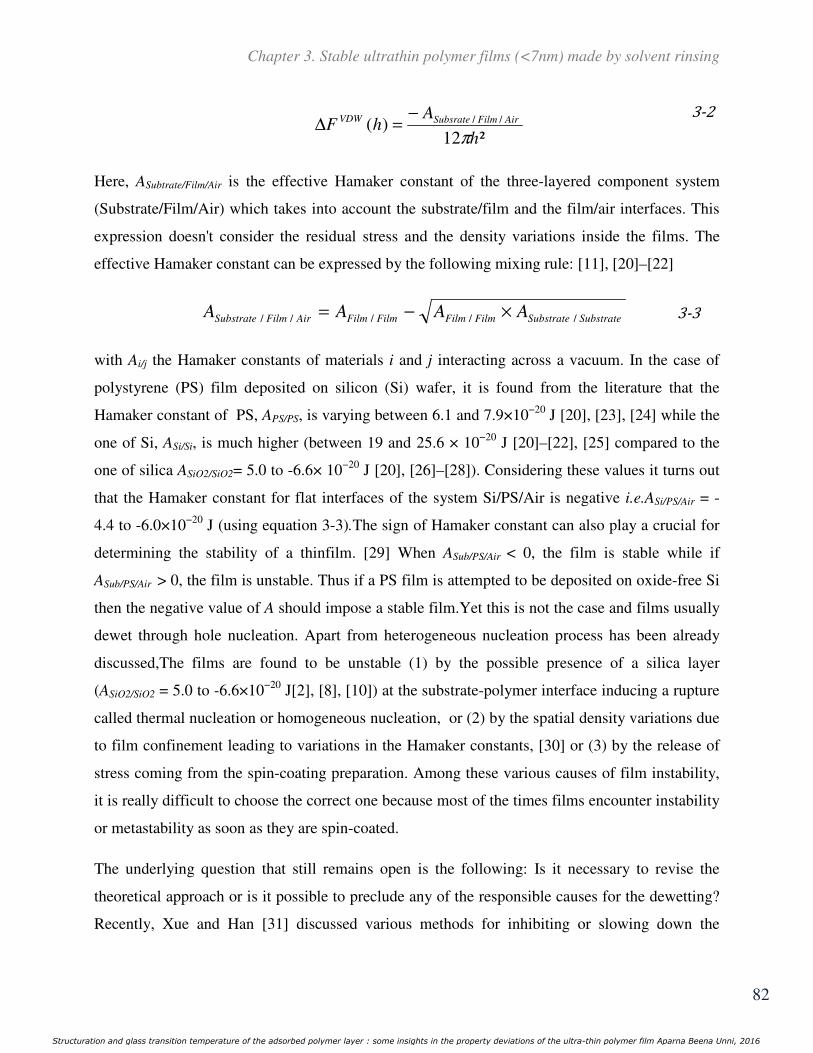
Chapter 3. Stable ultrathin polymer films (<7nm) made by solvent rinsing
82
²12
)( //
h
AhF AirFilmSubsrateVDW
π
−=∆
3-2 Here, ASubtrate/Film/Air is the effective Hamaker constant of the three-layered component system
(Substrate/Film/Air) which takes into account the substrate/film and the film/air interfaces. This
expression doesn't consider the residual stress and the density variations inside the films. The
effective Hamaker constant can be expressed by the following mixing rule: [11], [20]–[22]
SubstrateSubstrateFilmFilmFilmFilmAirFilmSubstrate AAAA ///// ×−= 3-3
with Ai/j the Hamaker constants of materials i and j interacting across a vacuum. In the case of
polystyrene (PS) film deposited on silicon (Si) wafer, it is found from the literature that the
Hamaker constant of PS, APS/PS, is varying between 6.1 and 7.9×10⁻²⁰ J [20], [23], [24] while the
one of Si, ASi/Si, is much higher (between 19 and 25.6 × 10⁻²⁰ J [20]–[22], [25] compared to the
one of silica ASiO2/SiO2= 5.0 to -6.6× 10⁻²⁰ J [20], [26]–[28]). Considering these values it turns out
that the Hamaker constant for flat interfaces of the system Si/PS/Air is negative i.e.ASi/PS/Air = -
4.4 to -6.0×10⁻²⁰ J (using equation 3-3).The sign of Hamaker constant can also play a crucial for
determining the stability of a thinfilm. [29] When ASub/PS/Air < 0, the film is stable while if
ASub/PS/Air > 0, the film is unstable. Thus if a PS film is attempted to be deposited on oxide-free Si
then the negative value of A should impose a stable film.Yet this is not the case and films usually
dewet through hole nucleation. Apart from heterogeneous nucleation process has been already
discussed,The films are found to be unstable (1) by the possible presence of a silica layer
(ASiO2/SiO2 = 5.0 to -6.6×10⁻²⁰ J[2], [8], [10]) at the substrate-polymer interface inducing a rupture
called thermal nucleation or homogeneous nucleation, or (2) by the spatial density variations due
to film confinement leading to variations in the Hamaker constants, [30] or (3) by the release of
stress coming from the spin-coating preparation. Among these various causes of film instability,
it is really difficult to choose the correct one because most of the times films encounter instability
or metastability as soon as they are spin-coated.
The underlying question that still remains open is the following: Is it necessary to revise the
theoretical approach or is it possible to preclude any of the responsible causes for the dewetting?
Recently, Xue and Han [31] discussed various methods for inhibiting or slowing down the
Structuration and glass transition temperature of the adsorbed polymer layer : some insights in the property deviations of the ultra-thin polymer film Aparna Beena Unni, 2016

Chapter 3. Stable ultrathin polymer films (<7nm) made by solvent rinsing
83
dewetting of polymer films. However, these approaches involve a change in the composition of
the film (new end-groups, cross-linking agents or additives) and are more over difficult to set up
for ultrathin films. In this context, we have explored a new strategy to inhibit the dewetting of
ultrathin films without modifying the composition of the films. Inspired by the works of Koga,
[32], [33] Fujii [34] and Napolitano [10] who reported that thick polymer films can be thinned
down after a good solvent rinsing, in this chapter we are investigating the stability/instability be-
havior of PS films with thicknesses ranging from ≈ 1.3 nm to 7.0 nm made on Si substrates with
and without a native oxide layer following the top-down approach (i.e. construction of a bulk film
proceeded by good solvent rinsing). The experimentally obtained results which are then com-
pared with the Lifshitz van der Waals intermolecular theory could provide better understanding
of the results.
3.2 Ultrathin polymer films
3.2.1 Formation of ultrathin film (< 7 nm) by direct spin-coating
The general trends observed when a thin film of PS is deposited by spin-coating a diluted solu-
tion (c < 1 g/L, where c stands for the concentration of PS in the toluene solution) on Si surfaces
are briefly reported in this section. Figure 3-2 shows AFM topographies immediately after
depositing PS films by spin-coating dilute solutions at 2000 rpm.
Structuration and glass transition temperature of the adsorbed polymer layer : some insights in the property deviations of the ultra-thin polymer film Aparna Beena Unni, 2016
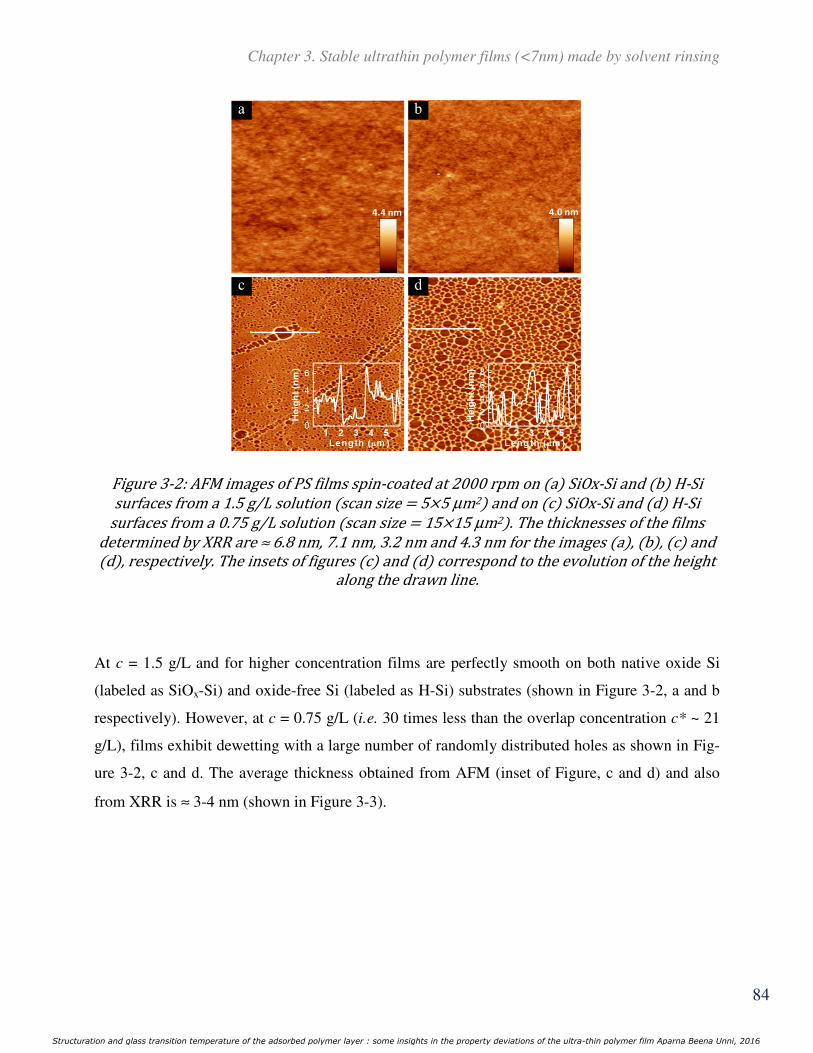
Chapter 3. Stable ultrathin polymer films (<7nm) made by solvent rinsing
84
Figure 3-2: AFM images of PS films spin-coated at 2000 rpm on a SiOx-Si and b H-Si surfaces from a 1.5 g/L solution scan size = 5×5 µm2 and on c SiOx-Si and d H-Si surfaces from a 0.75 g/L solution scan size = 15×15 µm2 . The thicknesses of the films determined by XRR are ≈ 6.8 nm, 7.1 nm, 3.2 nm and 4.3 nm for the images a , b , c and d , respectively. The insets of figures c and d correspond to the evolution of the height along the drawn line.
At c = 1.5 g/L and for higher concentration films are perfectly smooth on both native oxide Si
(labeled as SiOx-Si) and oxide-free Si (labeled as H-Si) substrates (shown in Figure 3-2, a and b
respectively). However, at c = 0.75 g/L (i.e. 30 times less than the overlap concentration c* ~ 21
g/L), films exhibit dewetting with a large number of randomly distributed holes as shown in Fig-
ure 3-2, c and d. The average thickness obtained from AFM (inset of Figure, c and d) and also
from XRR is ≈ 3-4 nm (shown in Figure 3-3).
Structuration and glass transition temperature of the adsorbed polymer layer : some insights in the property deviations of the ultra-thin polymer film Aparna Beena Unni, 2016

Chapter 3. Stable ultrathin polymer films (<7nm) made by solvent rinsing
85
Figure 3-3: XRR and EDP profiles showing dewetting of directly spin-coated ultrathin films. XRR data different symbols and analyzed curves solid line of as-prepared PS films on H-Si and SiOx-Si substrates by direct spin-coating of 0.75 g/L solution curves are shifted vertically for clarity . Insets: corresponding EDPs showing very low coverage of the PS films with respect to the bulk electron density ≈ 0.344 e. Å-3. The ruptures observed on the films made from diluted solution can not be explained by
the van der Waals interaction according to the formalism mentioned in the introduction. It may
probably come from residual stress during the fast evaporation of the solvent followed by a
relaxation during the early stages of the film or from density heterogeneities. As a consequence,
uniform ultrathin films of PS (Mw = 1.36 x 10⁵ g/mol) with a thickness less than 7 nm are very
difficult to obtain directly by spin-coating. The unexplained dewetting of thinner films on both
Si surfaces together with the quest to produce uniform ultrathin films motivated us to adopt a new
strategy.
3.2.2 Formation of ultrathin films (≤ 7 nm) by solvent rinsing treatment
Following the same leaching route as the one proposed by Guiselin et al. [35] and used by the
research groups of Koga, [32], [33] Tsui, [34] and Napolitano, [10] flat films of initial thickness
equal or greater than 7 nm were prepared by spin coating both on oxide Si (SiOx-Si) and oxide-
Structuration and glass transition temperature of the adsorbed polymer layer : some insights in the property deviations of the ultra-thin polymer film Aparna Beena Unni, 2016

Chapter 3. Stable ultrathin polymer films (<7nm) made by solvent rinsing
86
free Si (H-Si) substrates (shown in Figure 3-2, a and b). They were then sequentially immersed in
toluene for 10 min and dried by mild flow of N2 at ambient temperature and pressure. XRR data
and the corresponding analyzed curves of pre- and post-rinsing (up to 70 min of rinsing) for a PS
film on SiOx-Si are shown in Figure 3-4, a. The Kiessig fringes for the 10 min rinsed film (blue
curve) are well visible up to qz = 0.45 Å-1 highlighting a smooth surface (presumably no
dewetting) and a film thickness close to 2.9 nm.
According to the study of Koga’s group, [32], [33] we can assume that during this first rinsing,
the loosely attached layer was partly removed. This rinsing process was repeated several times on
the same sample as shown in Figure 3-4, (a) As expected from work of Gin et al., [32] we ob-
served that after the second rinsing the thickness decreased slowly. This decrement progressively
increased upon further rinsing and the film thickness reached about 1.7 nm after 70 min (i.e. after
7 rinsings). We attribute this progressive decay of the film thickness to the desorption of the re-
sidual loosely attached layer.
0.0 0.2 0.4
10-11
10-9
10-7
10-5
10-3
10-1
101
PS(Unannealed)
SiO
x-S
i
Reflectivity
Initial 10min 20min 30min 40min 50min 70min
qz [Å−1
]
(a)
0 2 4 6 80.0
0.2
0.4
0.6 Initial 10min 20min 30min 40min 50min 70min
z [nm]
ρ [e
.Å−3]
0.0 0.2 0.4
Initial 10min 20min 30min 40min 50min 70min
qz [Å−1
]
(b)
0 2 4 6 80.0
0.2
0.4
0.6
PS(Pre-annealed)
SiO
x-S
i
Initial 10min 20min 30min 40min 50min 70min
z [nm]
ρ [
e.Å
−3]
Figure 3-4: Structural evolution as a result of solvent rinsing. XRR data different symbols and analyzed curves solid line of unannealed a and pre-annealed b 7 nm PS films on SiOx-Si substrates before and after toluene rinsing during different durations curves are shifted vertically for clarity . Insets: corresponding EDPs showing different thicknesses of the PS films with different toluene rinsing time.
Structuration and glass transition temperature of the adsorbed polymer layer : some insights in the property deviations of the ultra-thin polymer film Aparna Beena Unni, 2016

Chapter 3. Stable ultrathin polymer films (<7nm) made by solvent rinsing
87
In contradiction with the work of Fujii et al. [34] in which no residual film was found after just
30 min of toluene rinsing, the existence of a non-zero residual film even after “prolonged” tolu-
ene rinsing can be observed in Figure 3-5 or when starting with a higher initial thickness h0 ≈ 130
nm, Figure 3-6 is a clear signature that an absorbed layer near the substrate/PS interface already
forms in the early times of spin-coating even though no annealing treatment has been performed.
Figure 3-5: Solvent rinsing of a thick h0 ≈ 130 nm PS film. XRR data different symbols and analyzed curves solid line of a thick PS film on a SiOx-Si substrates before and after toluene rinsing during different durations as mentioned in the legend. Insets: corresponding EDPs showing different thicknesses of the PS films with different toluene rinsing times. These observations match well with the observation of Napolitano et al. [10] who have shown a
non-zero adsorbed layer ( )0)0( ≠=anads th (where tan is the annealing time) without annealing.
Johnson and Granick [36] estimated that the net segment-surface interaction energy between PS
dissolved in carbon tetrachloride and an oxidized Si substrate is quite weak (~ 1.3 kT at 25 °C, k
is the Boltzmann constant and T is the absolute temperature) compare to the one for PMMA (~ 4
kT). This weak interaction combined with the low segment-surface interaction number may ex-
plain why PS chains adsorbed at ambient temperature can desorb progressively in toluene with
time. When films are annealed at 160oC during 24 h before rinsing, ascribed as pre-annealed
films, the decrement of thickness after the first rinsing is smaller as shown in Figure 3-4,(b) The
adsorption of PS segments initiated during the spin-coating is thus favored by annealing the
samples above Tg.
Structuration and glass transition temperature of the adsorbed polymer layer : some insights in the property deviations of the ultra-thin polymer film Aparna Beena Unni, 2016

Chapter 3. Stable ultrathin polymer films (<7nm) made by solvent rinsing
88
Figure 3-6: Solvent rinsing of a 7 nm preannealed PS film grown on H-Si substrate. XRR data different symbols and analyzed curves solid line of a preannealed 7 nm PS film on H-Si substrates before and after toluene rinsing during different durations as mentioned in the legend curves are shifted vertically for clarity . Insets: corresponding EDPs showing different thicknesses of the PS films with different toluene rinsing times. A similar kind of behavior was also encountered in films grown on H-Si as shown in Figure 3-7.
This confirms that annealing increases the thickness of the adsorbed layer probably by enhancing
the entanglement between the polymer chains and by increasing the number of segment-surface
contacts with the substrate. Corresponding EDPs (shown in the inset of Figure 3-4, a and b) show
that the electron density of the film remains nearly constant to about 0.33 e/Å3 (corresponding to
a mass density of 1.02 g/cm3 close to the one of the bulk 1.06 g/cm3 [37], [38]) for the unannealed
samples and slightly higher for the pre-annealed films. The higher density for thin and annealed
PS films was already reported. [39], [40] On the contrary to the work of Jiang et al. [33] and de-
spite trying other density models we were not able to prove that the adsorbed layer was composed
of 2 layers with different densities coming from the loosely attached layer and a denser flattened
layer. The best fits were obtained by putting a single layer of PS with a constant density.
Structuration and glass transition temperature of the adsorbed polymer layer : some insights in the property deviations of the ultra-thin polymer film Aparna Beena Unni, 2016
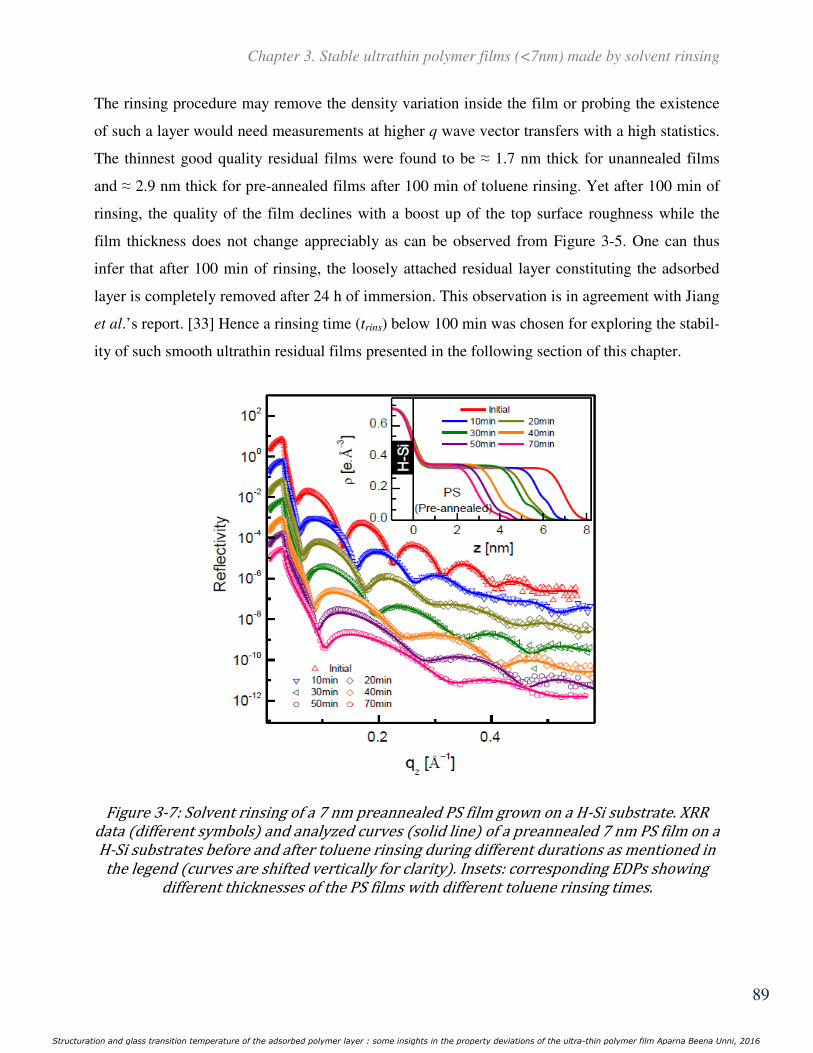
Chapter 3. Stable ultrathin polymer films (<7nm) made by solvent rinsing
89
The rinsing procedure may remove the density variation inside the film or probing the existence
of such a layer would need measurements at higher q wave vector transfers with a high statistics.
The thinnest good quality residual films were found to be ≈ 1.7 nm thick for unannealed films
and ≈ 2.9 nm thick for pre-annealed films after 100 min of toluene rinsing. Yet after 100 min of
rinsing, the quality of the film declines with a boost up of the top surface roughness while the
film thickness does not change appreciably as can be observed from Figure 3-5. One can thus
infer that after 100 min of rinsing, the loosely attached residual layer constituting the adsorbed
layer is completely removed after 24 h of immersion. This observation is in agreement with Jiang
et al.’s report. [33] Hence a rinsing time (trins) below 100 min was chosen for exploring the stabil-
ity of such smooth ultrathin residual films presented in the following section of this chapter.
Figure 3-7: Solvent rinsing of a 7 nm preannealed PS film grown on a H-Si substrate. XRR data different symbols and analyzed curves solid line of a preannealed 7 nm PS film on a H-Si substrates before and after toluene rinsing during different durations as mentioned in the legend curves are shifted vertically for clarity . Insets: corresponding EDPs showing different thicknesses of the PS films with different toluene rinsing times.
Structuration and glass transition temperature of the adsorbed polymer layer : some insights in the property deviations of the ultra-thin polymer film Aparna Beena Unni, 2016

Chapter 3. Stable ultrathin polymer films (<7nm) made by solvent rinsing
90
Additionally, we observed that in pre-annealed samples the adsorbed layer thickness obtained
after 10 min of toluene rinsing was found to increase almost linearly with the radius of gyration
(e.g. Rg) of PS as shown in the Figure 3-8. The films deposited on SiOx-Si are pre-annealed at
160 °C during 24 h and have thicknesses of 7 nm (±0.5 nm). hres is the value obtained after 10
min of toluene rinsing. This time of rinsing is expected to remove the unbound layer and proba-
bly only a small part of the adsorbed layer. The dotted line represents the relation published by
Fujii et al. [34] hres = 0.47 Rg (hres and Rg in nm). Results are quite similar to those of Fujii for
native oxide covered Si (hads≈ 0.47×Rg) and confirm that the longer the PS chains, the thicker the
adsorbed layer as reported also by Housmans et al. [41] The radius of gyration is deduced from
the relation Rg = 1.20 x 10⁻² Mw 0.595 [42].
Figure 3-8: Residual layer thickness hres as a function of Rg.
Structuration and glass transition temperature of the adsorbed polymer layer : some insights in the property deviations of the ultra-thin polymer film Aparna Beena Unni, 2016

Chapter 3. Stable ultrathin polymer films (<7nm) made by solvent rinsing
91
3.3 Correlation between the kinetics of dissolution and annealing
The residual thickness (hres) deduced from the fit to the data and from the EDPs is plotted in Fig-
ure 3-9 (a), as a function of the rinsing time trins.
Figure 3-9: Correlation between the kinetics of dissolution and annealing. a Residual thickness hres of pre-annealed and unannealed PS film of h0 ≈ 7 nm grown on SiOx-Si and H-Si substrates as a function of rinsing time trins . b Schematic illustration of the formation of an adsorbed layer hads From figure 3-9, it is evident that the film thickness can be controlled by tuning the rinsing time
trins. A similar trend was witnessed by Gin et al. [32] A careful observation of Figure 3-9,(a) re-
veals that hres is higher for the H-Si supported pre-annealed PS film than for the SiOx-Si support-
ed one but only up to 40 min of rinsing. The difference for "quick" rinsed samples is in agree-
ment with the work of Fujii [34]. For longer times, differences only arise when films are pre-
annealed or not. The value of hres for pre-annealed films is always greater than for unannealed
films. For h0 ≈ 7 nm, after 70 min of toluene rinsing hres is found to be ≈ 2.9 nm and ≈ 1.7 nm for
pre-annealed and unannealed films, respectively. The formation of an adsorbed layer hads is illus-
trated in Figure 3-9, (b) the schematic during the spin-coating (prior to preparing a film of thick-
ness h0, shown in top panel) and pre-annealing (right panel) processes of PS film followed by
toluene rinsing (bottom panel) that gives rise to a residual layer of thickness hres. Pre-annealing
incites the thickening of adsorbed layer hads and increases the number of polymer-surface interac-
Structuration and glass transition temperature of the adsorbed polymer layer : some insights in the property deviations of the ultra-thin polymer film Aparna Beena Unni, 2016
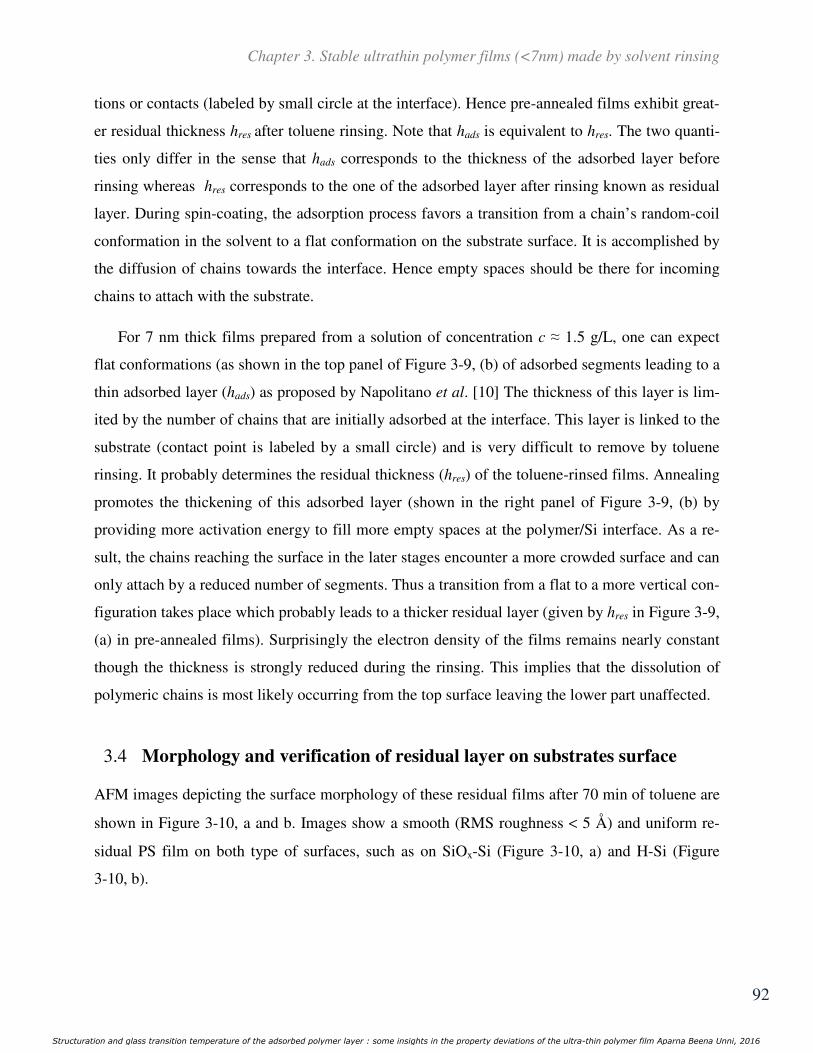
Chapter 3. Stable ultrathin polymer films (<7nm) made by solvent rinsing
92
tions or contacts (labeled by small circle at the interface). Hence pre-annealed films exhibit great-
er residual thickness hres after toluene rinsing. Note that hads is equivalent to hres. The two quanti-
ties only differ in the sense that hads corresponds to the thickness of the adsorbed layer before
rinsing whereas hres corresponds to the one of the adsorbed layer after rinsing known as residual
layer. During spin-coating, the adsorption process favors a transition from a chain’s random-coil
conformation in the solvent to a flat conformation on the substrate surface. It is accomplished by
the diffusion of chains towards the interface. Hence empty spaces should be there for incoming
chains to attach with the substrate.
For 7 nm thick films prepared from a solution of concentration c ≈ 1.5 g/L, one can expect
flat conformations (as shown in the top panel of Figure 3-9, (b) of adsorbed segments leading to a
thin adsorbed layer (hads) as proposed by Napolitano et al. [10] The thickness of this layer is lim-
ited by the number of chains that are initially adsorbed at the interface. This layer is linked to the
substrate (contact point is labeled by a small circle) and is very difficult to remove by toluene
rinsing. It probably determines the residual thickness (hres) of the toluene-rinsed films. Annealing
promotes the thickening of this adsorbed layer (shown in the right panel of Figure 3-9, (b) by
providing more activation energy to fill more empty spaces at the polymer/Si interface. As a re-
sult, the chains reaching the surface in the later stages encounter a more crowded surface and can
only attach by a reduced number of segments. Thus a transition from a flat to a more vertical con-
figuration takes place which probably leads to a thicker residual layer (given by hres in Figure 3-9,
(a) in pre-annealed films). Surprisingly the electron density of the films remains nearly constant
though the thickness is strongly reduced during the rinsing. This implies that the dissolution of
polymeric chains is most likely occurring from the top surface leaving the lower part unaffected.
3.4 Morphology and verification of residual layer on substrates surface
AFM images depicting the surface morphology of these residual films after 70 min of toluene are
shown in Figure 3-10, a and b. Images show a smooth (RMS roughness < 5 Å) and uniform re-
sidual PS film on both type of surfaces, such as on SiOx-Si (Figure 3-10, a) and H-Si (Figure
3-10, b).
Structuration and glass transition temperature of the adsorbed polymer layer : some insights in the property deviations of the ultra-thin polymer film Aparna Beena Unni, 2016

Chapter 3. Stable ultrathin polymer films (<7nm) made by solvent rinsing
93
Figure 3-10: AFM topography image of pre-annealed residual films on a SiOx-Si and b H-Si substrates obtained after 70 min of toluene rinsing. Inset of a and b show the 3D AFM images after scratching some regions of residual film by AFM tip in order to confirm that this is polymer rather than Si substrate. c Attenuated total reflectance absorbance spectra of a PS ultrathin film before h0 ≈ 18.0 nm and after hads ≈ 5.2 nm a "quick" toluene rinsing up to 20 min confirming the existence of PS residual layer on Si substrate. In order to confirm that the observed topography comes from the soft polymer film and not from
the Si surface, we scratched the surface of the film on both substrates by the AFM tip (shown in
the inset of Figure 3-10, a and b). We thus observed some patches of soft material confirming the
existence of a residual film residing on the Si surface. It should be mentioned here that despite
the application of high force (~ 2 nN) in AFM scan prior to testing the existence of the residual
film, we observe some patches instead of complete empty spaces through the scan area. It can be
an indication that PS chains are strongly adsorbed to the substrate since when such a force is ap-
plied during scanning of soft materials the bare substrate is generally observed after removing the
soft film as previously reported in the case of amphiphilic molecules grown on Si. [43] In addi-
tion, ATR spectroscopy was performed before and after toluene rinsing of an 18 nm (ho) PS film
grown on H-Si (shown in Figure 3-10, c) to ascertain the presence of this residual film. Peaks
located at 3000, 3030, 3060, 3085 and 3105 cm-1 are due to the C-H stretching modes of the C-H
groups located in the benzene ring on the PS side chain. The bands with peak positions of 2930
and 2850 cm-1 are due to the C-H stretching vibration of the CH2 and CH groups on the main PS
chain, respectively. [44] The intensity of all the peaks decreases by about a factor of 4 after 10
Structuration and glass transition temperature of the adsorbed polymer layer : some insights in the property deviations of the ultra-thin polymer film Aparna Beena Unni, 2016

Chapter 3. Stable ultrathin polymer films (<7nm) made by solvent rinsing
94
min of toluene rinsing. This decrease is due to the removal of loosely attached PS chains during
the rinsing. The thickness of the residual film obtained after 10 min of toluene rinsing (≈ 5.5 nm)
is also in agreement with the ATR results. Furthermore, beyond the first 10 min of toluene rins-
ing, the kinetics of dissolution drastically slows down (blue curve in Figure 3-10, c) supporting
the kinetics illustrated in Figure 3-9, a. Hence this series of experimental results consistently con-
firms the existence of a residual PS layer and their kinetics on the substrate upon toluene rinsing.
Having proved that it is possible to produce uniform films of controlled thickness using
this simple top-down approach by playing (1) on the nature of the substrate, (2) on the gyration
radius of the polymer (Rg), (3) on the pre-annealing time (tan) and (4) on the rinsing time (trins),
we want to address now the stability of the rinsed PS films when they are post-annealed above Tg
depending on the type of treatment the Si substrate.
3.5 Stability or instability of residual films of tunable thickness
The stability of thin films strongly depends on their thickness and on the chemical treatment of
the Si substrate. [29] Therefore 12 films were initially spin-coated on both SiOx-Si (6 films) and
H-Si (6 films) surfaces with thicknesses mostly of 7 nm and few of 16 nm prior to carrying out
the rinsing. Films having different hres values were thus obtained by playing either on the rinsing
time or on the pre-annealing treatment as tabulated in Table 3-1. Their stability was then scruti-
nized after they were annealed (at 120 oC) above the Tg of bulk polystyrene. For the sake of clari-
ty, this annealing treatment performed after rinsing is labeled as “post-annealing”. We first report
the results obtained on H-Si before commenting the ones on SiOx-Si.
3.5.1 The stability of residual films on H-Si wafers
Let us recall that PS ultrathin films on H-Si wafers usually dewet the surface of the substrate thus
violating the prediction given by the Lifshitz-van der Waals theory. Our aim here was to test
again if this violation was pertained for a series of uniform films of different thickness having
undergone a leaching treatment. Residual uniform films with thickness ranging from 1.5 nm to
6.0 nm were thus obtained on H-Si wafers (see Table 3-1) by tuning both the annealing time of
the films before rinsing and the duration of toluene rinsing.
Structuration and glass transition temperature of the adsorbed polymer layer : some insights in the property deviations of the ultra-thin polymer film Aparna Beena Unni, 2016

Chapter 3. Stable ultrathin polymer films (<7nm) made by solvent rinsing
95
The procurement of such uniform films is a “sine qua non” condition to apprehend their stability
upon annealing. Indeed to apply physical models such as the one based on Lifshitz van der Waals
interaction, it is compulsory to start with uniform films of known thickness (as shown by equa-
tion 3-2).
Table 3-1: Preparation of the PS rinsed films on Si substrates 6 samples on H-Si and 6 samples on SiOx-Si . Pre-annealing time tan of the film before the rinsing procedure and the duration of toluene rinsing trins determine the thicknesses of residual layer hres .
Sample
name
Silicon
treatment
Initial PS
thickness
h0 (nm)
Pre-annealing
time tan at 160 oC
Rinsing
time
trins(min)
Residual
PS film
thickness
hres (nm)
Stability after
post-annealing
at 120°C for
24h
H-Si-a HF 7 0h 100 1.5 no dewetting
H-Si-b HF 7 0h 50 2.5 no dewetting
H-Si-c HF 7 24h 40 4.0 no dewetting
H-Si-d HF 7 24h 20 4.6 no dewetting
H-Si-e HF 7 24h 10 5.0 no dewetting
H-Si-f HF 16 24h 2 6.0 no dewetting
SiOx-Si-a RCA 7 0h 100 1.3 dewetting
SiOx-Si-b RCA 7 0h 50 1.7 dewetting
SiOx-Si-c RCA 7 0h 30 2.2 dewetting
SiOx-Si-d RCA 7 0h 10 3.5 no dewetting
SiOx-Si-e RCA 7 24h 10 4.9 no dewetting
SiOx-Si-f RCA 16 24h 1 6.8 no dewetting
Structuration and glass transition temperature of the adsorbed polymer layer : some insights in the property deviations of the ultra-thin polymer film Aparna Beena Unni, 2016

Chapter 3. Stable ultrathin polymer films (<7nm) made by solvent rinsing
96
Figure 3-11: AFM topographic images scan size = 1×1 µm2 presented in the top panel A show the morphologies of residual films of thickness hresa ≈ 1.5 nm, b ≈ 2.5 nm, c ≈ 4.0 nm, d ≈ 4.6 nm, e ≈ 5.0 nm and f ≈ 6.0 nm on H-Si after post-annealing. In the bottom panel B are shown similar results for hres a ≈ 1.3 nm, b ≈ 1.7 nm, c ≈ 2.2 nm, d ≈ 3.5 nm, e ≈ 4.9 nm and f ≈ 6.8 nm thick films on SiOx-Si. Inset shows their corresponding 2D FFT image. Morphologies were obtained after post-annealing at 120 oC during 24 h. Note that the thicknesses that are mentioned here are the thicknesses of the residual films just before the post-annealing. Zm represents the maximum height in nm. The best way to probe the stability of such films is to perform AFM imaging of the surface of the
residual PS films after post-annealing above the Tg of bulk PS. Figure 3-11. A. shows such imag-
es for residual PS films of thickness ranging from ≈ 1.5 nm to ≈ 6.0 nm on H-Si after post-
annealing at 120°C for 24h. Further rise in annealing temperature to 170oC does not show any
kind of dewetting as can be observed from Figure 3-12. On the contrary to what was obtained for
films of similar thickness which were directly spin-coated on the same type of surface, we found
that continuous and flat films were always obtained. No dewetting occurred in this case thus rec-
onciling our experimental observations with the prediction of the Lifshitz-van der Waals theory.
With this in mind, it was natural to consider the behavior of films prepared in the same way but
deposited on SiOx-Si substrates.
Structuration and glass transition temperature of the adsorbed polymer layer : some insights in the property deviations of the ultra-thin polymer film Aparna Beena Unni, 2016
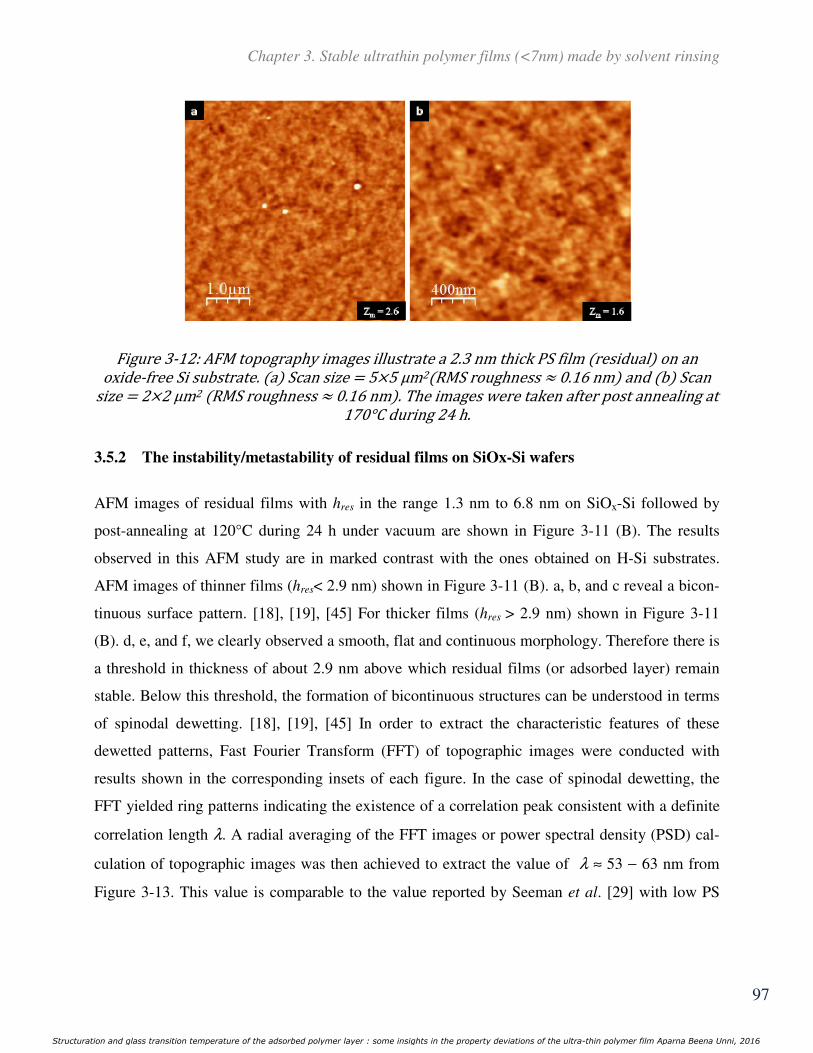
Chapter 3. Stable ultrathin polymer films (<7nm) made by solvent rinsing
97
Figure 3-12: AFM topography images illustrate a 2.3 nm thick PS film residual on an oxide-free Si substrate. a Scan size = 5×5 µm2RMS roughness ≈ 0.16 nm and b Scan size = 2×2 µm2 RMS roughness ≈ 0.16 nm . The images were taken after post annealing at 170°C during 24 h. 3.5.2 The instability/metastability of residual films on SiOx-Si wafers
AFM images of residual films with hres in the range 1.3 nm to 6.8 nm on SiOx-Si followed by
post-annealing at 120°C during 24 h under vacuum are shown in Figure 3-11 (B). The results
observed in this AFM study are in marked contrast with the ones obtained on H-Si substrates.
AFM images of thinner films (hres< 2.9 nm) shown in Figure 3-11 (B). a, b, and c reveal a bicon-
tinuous surface pattern. [18], [19], [45] For thicker films (hres > 2.9 nm) shown in Figure 3-11
(B). d, e, and f, we clearly observed a smooth, flat and continuous morphology. Therefore there is
a threshold in thickness of about 2.9 nm above which residual films (or adsorbed layer) remain
stable. Below this threshold, the formation of bicontinuous structures can be understood in terms
of spinodal dewetting. [18], [19], [45] In order to extract the characteristic features of these
dewetted patterns, Fast Fourier Transform (FFT) of topographic images were conducted with
results shown in the corresponding insets of each figure. In the case of spinodal dewetting, the
FFT yielded ring patterns indicating the existence of a correlation peak consistent with a definite
correlation length λ. A radial averaging of the FFT images or power spectral density (PSD) cal-
culation of topographic images was then achieved to extract the value of λ ≈ 53 − 63 nm from
Figure 3-13. This value is comparable to the value reported by Seeman et al. [29] with low PS
Structuration and glass transition temperature of the adsorbed polymer layer : some insights in the property deviations of the ultra-thin polymer film Aparna Beena Unni, 2016
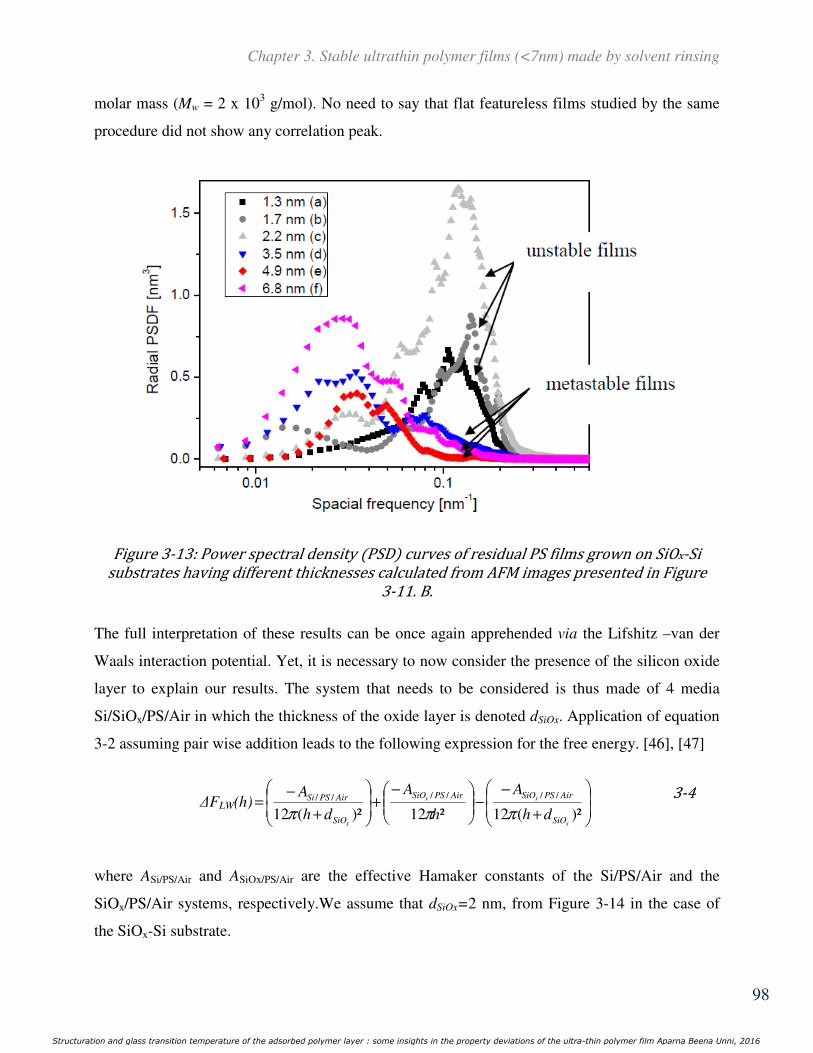
Chapter 3. Stable ultrathin polymer films (<7nm) made by solvent rinsing
98
molar mass (Mw = 2 x 10³ g/mol). No need to say that flat featureless films studied by the same
procedure did not show any correlation peak.
Figure 3-13: Power spectral density PSD curves of residual PS films grown on SiOx-Si substrates having different thicknesses calculated from AFM images presented in Figure 3-11. B. The full interpretation of these results can be once again apprehended via the Lifshitz –van der
Waals interaction potential. Yet, it is necessary to now consider the presence of the silicon oxide
layer to explain our results. The system that needs to be considered is thus made of 4 media
Si/SiOx/PS/Air in which the thickness of the oxide layer is denoted dSiOx. Application of equation
3-2 assuming pair wise addition leads to the following expression for the free energy. [46], [47]
∆FLW(h)
+
−−
−+
+
−=
)²(12²12)²(12//////
x
xx
x SiO
AirPSSiOAirPSSiO
SiO
AirPSSi
dh
A
h
A
dh
A
πππ 3-4
where ASi/PS/Air and ASiOx/PS/Air are the effective Hamaker constants of the Si/PS/Air and the
SiOx/PS/Air systems, respectively.We assume that dSiOx=2 nm, from Figure 3-14 in the case of
the SiOx-Si substrate.
Structuration and glass transition temperature of the adsorbed polymer layer : some insights in the property deviations of the ultra-thin polymer film Aparna Beena Unni, 2016
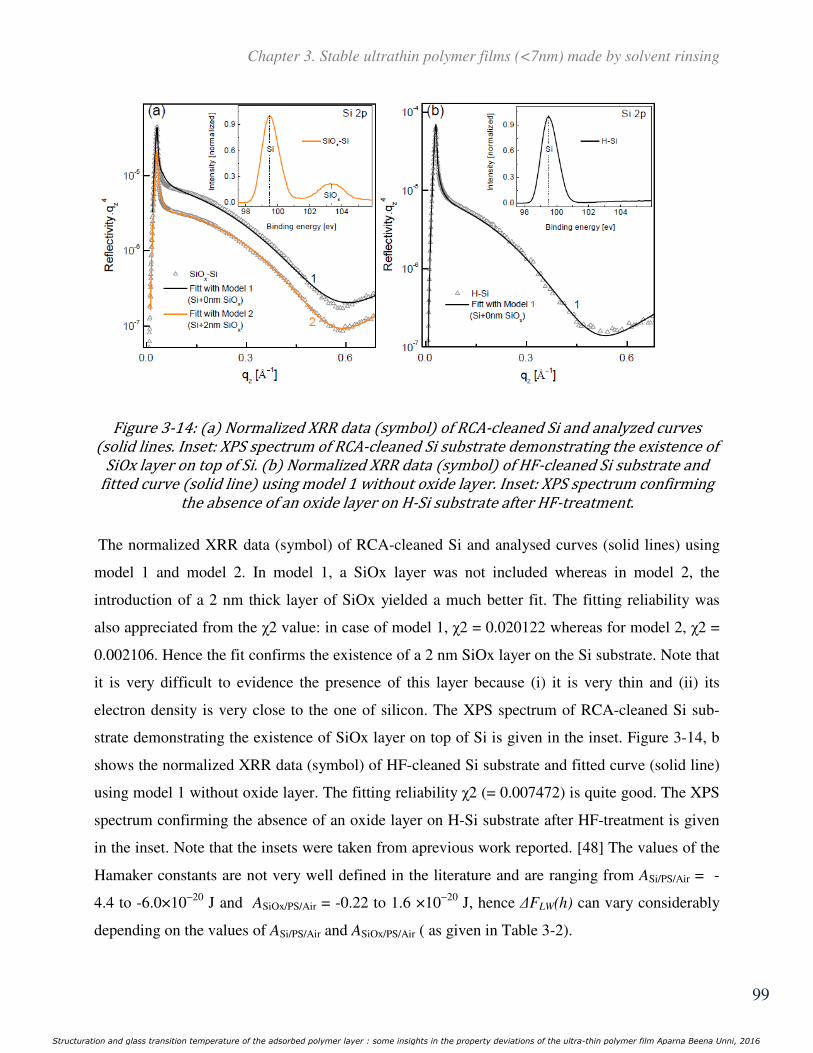
Chapter 3. Stable ultrathin polymer films (<7nm) made by solvent rinsing
99
Figure 3-14: a Normalized XRR data symbol of RCA-cleaned Si and analyzed curves solid lines. Inset: XPS spectrum of RCA-cleaned Si substrate demonstrating the existence of SiOx layer on top of Si. b Normalized XRR data symbol of HF-cleaned Si substrate and fitted curve solid line using model 1 without oxide layer. Inset: XPS spectrum confirming the absence of an oxide layer on H-Si substrate after HF-treatment. The normalized XRR data (symbol) of RCA-cleaned Si and analysed curves (solid lines) using
model 1 and model 2. In model 1, a SiOx layer was not included whereas in model 2, the
introduction of a 2 nm thick layer of SiOx yielded a much better fit. The fitting reliability was
also appreciated from the χ2 value: in case of model 1, χ2 = 0.020122 whereas for model 2, χ2 =
0.002106. Hence the fit confirms the existence of a 2 nm SiOx layer on the Si substrate. Note that
it is very difficult to evidence the presence of this layer because (i) it is very thin and (ii) its
electron density is very close to the one of silicon. The XPS spectrum of RCA-cleaned Si sub-
strate demonstrating the existence of SiOx layer on top of Si is given in the inset. Figure 3-14, b
shows the normalized XRR data (symbol) of HF-cleaned Si substrate and fitted curve (solid line)
using model 1 without oxide layer. The fitting reliability χ2 (= 0.007472) is quite good. The XPS
spectrum confirming the absence of an oxide layer on H-Si substrate after HF-treatment is given
in the inset. Note that the insets were taken from aprevious work reported. [48] The values of the
Hamaker constants are not very well defined in the literature and are ranging from ASi/PS/Air = -
4.4 to -6.0×10⁻²⁰ J and ASiOx/PS/Air = -0.22 to 1.6 ×10⁻²⁰ J, hence ∆FLW(h) can vary considerably
depending on the values of ASi/PS/Air and ASiOx/PS/Air ( as given in Table 3-2).
Structuration and glass transition temperature of the adsorbed polymer layer : some insights in the property deviations of the ultra-thin polymer film Aparna Beena Unni, 2016
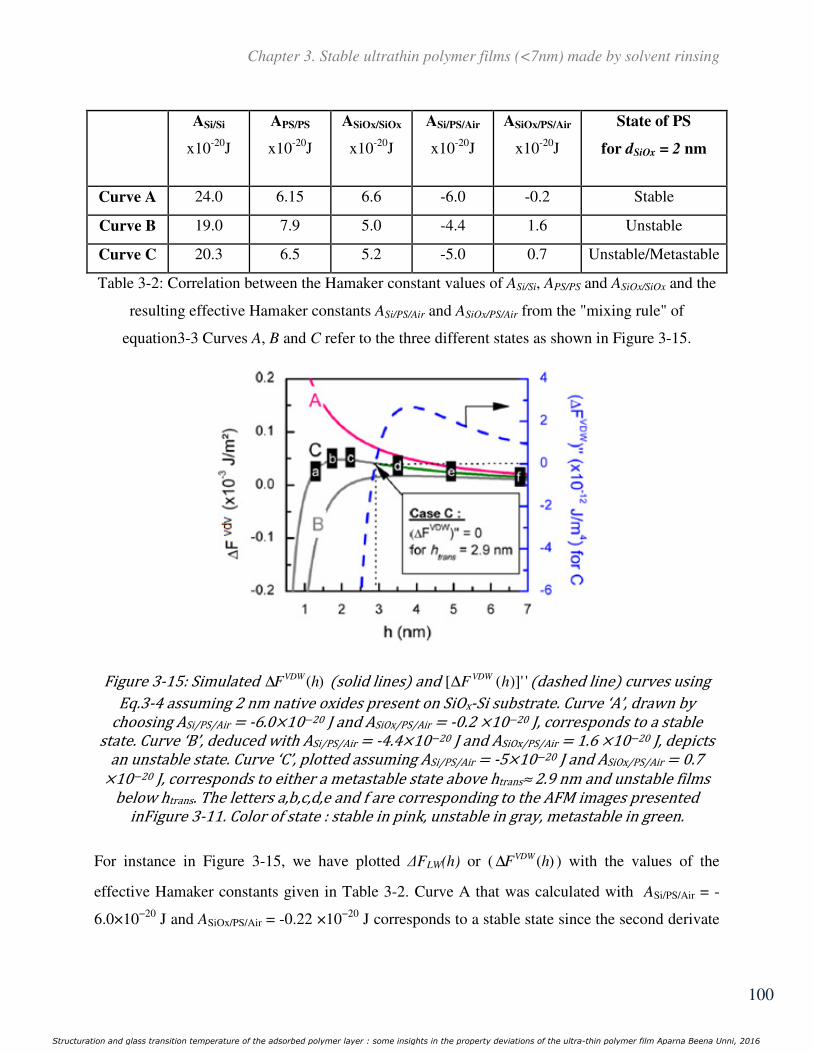
Chapter 3. Stable ultrathin polymer films (<7nm) made by solvent rinsing
100
Table 3-2: Correlation between the Hamaker constant values of ASi/Si, APS/PS and ASiOx/SiOx and the
resulting effective Hamaker constants ASi/PS/Air and ASiOx/PS/Air from the "mixing rule" of
equation3-3 Curves A, B and C refer to the three different states as shown in Figure 3-15.
Figure 3-15: Simulated )(hFVDW∆ solid lines and ')]'([ hF VDW∆ dashed line curves using Eq.3-4 assuming 2 nm native oxides present on SiOx-Si substrate. Curve ‘A’, drawn by choosing ASi/PS/Air = -6.0×10⁻²⁰ J and ASiOx/PS/Air = -0.2 ×10⁻²⁰ J, corresponds to a stable state. Curve ‘B’, deduced with ASi/PS/Air = -4.4×10⁻²⁰ J and ASiOx/PS/Air = 1.6 ×10⁻²⁰ J, depicts an unstable state. Curve ‘C’, plotted assuming ASi/PS/Air = -5×10⁻²⁰ J and ASiOx/PS/Air = 0.7 ×10⁻²⁰ J, corresponds to either a metastable state above htrans≈ 2.9 nm and unstable films below htrans. The letters a,b,c,d,e and f are corresponding to the AFM images presented inFigure 3-11. Color of state : stable in pink, unstable in gray, metastable in green. For instance in Figure 3-15, we have plotted ∆FLW(h) or ( )(hFVDW∆ ) with the values of the
effective Hamaker constants given in Table 3-2. Curve A that was calculated with ASi/PS/Air = -
6.0×10⁻²⁰ J and ASiOx/PS/Air = -0.22 ×10⁻²⁰ J corresponds to a stable state since the second derivate
ASi/Si
x10-20J
APS/PS
x10-20J
ASiOx/SiOx
x10-20J
ASi/PS/Air
x10-20J
ASiOx/PS/Air
x10-20J
State of PS
for dSiOx = 2 nm
Curve A 24.0 6.15 6.6 -6.0 -0.2 Stable
Curve B 19.0 7.9 5.0 -4.4 1.6 Unstable
Curve C 20.3 6.5 5.2 -5.0 0.7 Unstable/Metastable
Structuration and glass transition temperature of the adsorbed polymer layer : some insights in the property deviations of the ultra-thin polymer film Aparna Beena Unni, 2016
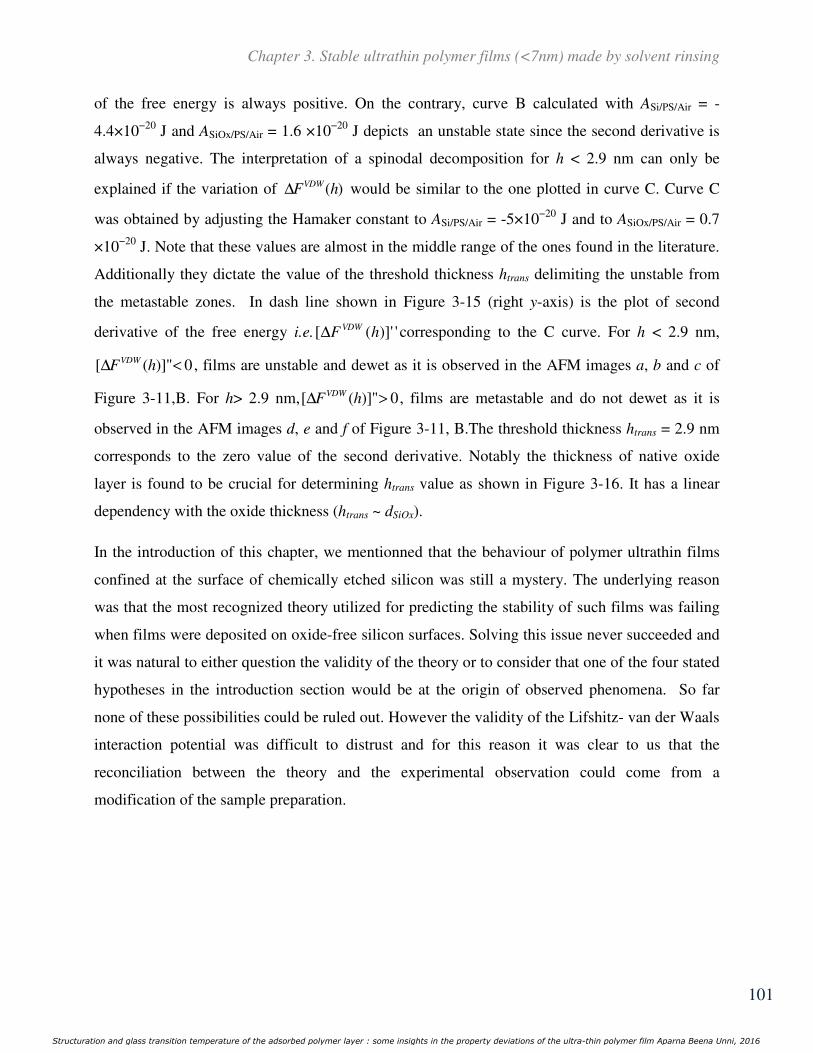
Chapter 3. Stable ultrathin polymer films (<7nm) made by solvent rinsing
101
of the free energy is always positive. On the contrary, curve B calculated with ASi/PS/Air = -
4.4×10⁻²⁰ J and ASiOx/PS/Air = 1.6 ×10⁻²⁰ J depicts an unstable state since the second derivative is
always negative. The interpretation of a spinodal decomposition for h < 2.9 nm can only be
explained if the variation of )(hFVDW∆ would be similar to the one plotted in curve C. Curve C
was obtained by adjusting the Hamaker constant to ASi/PS/Air = -5×10⁻²⁰ J and to ASiOx/PS/Air = 0.7
×10−20 J. Note that these values are almost in the middle range of the ones found in the literature.
Additionally they dictate the value of the threshold thickness htrans delimiting the unstable from
the metastable zones. In dash line shown in Figure 3-15 (right y-axis) is the plot of second
derivative of the free energy i.e. ')]'([ hF VDW∆ corresponding to the C curve. For h < 2.9 nm,
0')]'([ <∆ hFVDW , films are unstable and dewet as it is observed in the AFM images a, b and c of
Figure 3-11,B. For h> 2.9 nm, 0')]'([ >∆ hFVDW , films are metastable and do not dewet as it is
observed in the AFM images d, e and f of Figure 3-11, B.The threshold thickness htrans = 2.9 nm
corresponds to the zero value of the second derivative. Notably the thickness of native oxide
layer is found to be crucial for determining htrans value as shown in Figure 3-16. It has a linear
dependency with the oxide thickness (htrans ~ dSiOx).
In the introduction of this chapter, we mentionned that the behaviour of polymer ultrathin films
confined at the surface of chemically etched silicon was still a mystery. The underlying reason
was that the most recognized theory utilized for predicting the stability of such films was failing
when films were deposited on oxide-free silicon surfaces. Solving this issue never succeeded and
it was natural to either question the validity of the theory or to consider that one of the four stated
hypotheses in the introduction section would be at the origin of observed phenomena. So far
none of these possibilities could be ruled out. However the validity of the Lifshitz- van der Waals
interaction potential was difficult to distrust and for this reason it was clear to us that the
reconciliation between the theory and the experimental observation could come from a
modification of the sample preparation.
Structuration and glass transition temperature of the adsorbed polymer layer : some insights in the property deviations of the ultra-thin polymer film Aparna Beena Unni, 2016

Chapter 3. Stable ultrathin polymer films (<7nm) made by solvent rinsing
102
Figure 3-16: Evolution of the free energy as a function of SiOx thickness. Simulated a b curves using equation 3-4 considering 4 different thicknesses dSiOx of native oxides in SiOx-Si substrate. All the curves are plotted with ASi/PS/Air = -5.0×10⁻²⁰ J and ASiOx/PS/Air = 0.7 ×10⁻²⁰ J. The intercept point of curves to the x-axis indicates the value of htrans. c Plot of htrans as a function of dSiOx. Fitted linear curve dashed line draws a border line between stable or metastable and unstable regimes.
Structuration and glass transition temperature of the adsorbed polymer layer : some insights in the property deviations of the ultra-thin polymer film Aparna Beena Unni, 2016

Chapter 3. Stable ultrathin polymer films (<7nm) made by solvent rinsing
103
Following the solvent rinsing route, we are now confident that the first two hypotheses i.e. the
dewetting due to heterogeneities or the presence of silica can be excluded. Indeed, if there were
any heterogeneities and/or an oxide layer on the Si surface causing the dewetting of directly spin-
coated films, there should be no reason to get a stable residual film on H-Si after the leaching
procedure. Also it is not feasible to assume that the oxide layer and the heterogeneities present at
the dewetted PS film-Si interface would be removed by rinsing treatment. Thus the application of
this novel technique narrowed the possible reasons for the common discrepancy between
experimental results (Figure 3-2, c and d) and theoretical expectations (equation 3-2). The two
other hypotheses for the dewetting i.e.the negative stresses induced by the spin-coating procedure
and/or density variation could not yet be excluded. The leached films were then post-annealed at
120 oC and their stability was revisited. The observed results were then confronted to the theory
in a very successful way since the behaviour of PS films both on oxide-free and on SiOx silicon
surfaces was fully explained. The good agreement between the observed domains of stability of
the residual films and the underlying theory promotes the idea that the leaching route has
removed residual stresses and/or local density variations originating from the spin-coating and
from the fast evaporation of the solvent. Such stresses are usually considered to be at the origin of
the dewetting of directly spin-coated PS films both on oxide-free (H-Si) and native oxide
covered (SiOx-Si) Si surfaces (as shown in Figure 3-2, a and b). In contrast, the leached films of
identical thicknesses are amazingly stable on H-Si surfaces. One can thus conclude that the leach-
ing procedure combined to a post-annealing leads to stable films on H-Si substrates. In addition
all residual films on H-Si were found to be stable at ambient conditions up to ~ 2 months without
post-annealing as can be seen from Figure 3-17.
Structuration and glass transition temperature of the adsorbed polymer layer : some insights in the property deviations of the ultra-thin polymer film Aparna Beena Unni, 2016

Chapter 3. Stable ultrathin polymer films (<7nm) made by solvent rinsing
104
Figure 3-17: AFM topographic images Scan size = 2×2 µm2 show the morphologies of residual films of thicknesses hres a ≈ 1.5 nm, b ≈ 2.5 nm, c ≈ 4.0 nm, d ≈ 4.6 nm, e ≈ 5.0 nm and f ≈ 6.0 nm on H-Si substrates without post annealing. Zm represents the maximum height in nm. Hence, one can infer that the toluene rinsing induces a chain relaxation or allows some rear-
rangements of PS molecules in the residual layer. This assumption is in agreement with the re-
sults of Gin et al. [32] who reported that the inner flattened layer has no thermal expansion when
the loosely attached layer is thick whereas after removing the outer loosely adsorbed chains, the
flattened layer can reorganize due to the resultant empty spaces (i.e., more free volume). Toluene
diffuses easily into the flattened layer during rinsing. It acts as a plasticizer lowering the Tg below
room temperature. [9], [49] Hence the molecular mobility of the PS chains increases by minimiz-
ing the cumulative intermolecular forces along the chains leading to a reduction in the cohesion.
Thus PS chains can glide over another in presence of toluene solvent to reach equilibrium by re-
leasing the residual stress and/or erasing the density variations imposed during the spin-coating
process.
Structuration and glass transition temperature of the adsorbed polymer layer : some insights in the property deviations of the ultra-thin polymer film Aparna Beena Unni, 2016
Chapter 3. Stable ultrathin polymer films (<7nm) made by solvent rinsing
105
3.6 Conclusion
In conclusion, our results show that a two-step top-down approach consisting (1) in the prepara-
tion of homogeneous thick films by spin-coating and (2) in thinning them by rinsing in a good
solvent (e.g. toluene), could solve one of the most mysterious unanswered question encountered
in the physics of extremely confined polymer films: why ultrathin films of PS are unstable on
oxide-free silicon surfaces? We first demonstrated that the leaching procedure was perfectly
adapted to obtain thin and smooth residual films without any hole even after post-annealing
above Tg. By playing on two parameters, such as rinsing time (trins) and pre-annealing treatment
(tan), several desired thicknesses were obtained below 7 nm. After post-annealing above Tg, we
observed that residual films deposited on oxide-free H-Si surfaces do not dewet as expected from
the van der Waals theory. On the contrary, films deposited on SiOx-Si substrates with SiOx layer
thickness around 2nm were showing a spinodal dewetting below a critical film thickness htrans of
about ≈ 2.9 nm. Above this value films are in a metastable state and were found to be uniform on
a time scale of a few months. This transition between the two regimes unstable and metastable is
in perfect agreement with the intermolecular van der Waals interactions theory. We attribute the
stability of the films deposited on oxide-free silicon to the capability of toluene to remove either
the residual stresses of the film or the density variations inside the film.
Structuration and glass transition temperature of the adsorbed polymer layer : some insights in the property deviations of the ultra-thin polymer film Aparna Beena Unni, 2016
Chapter 3. Stable ultrathin polymer films (<7nm) made by solvent rinsing
106
REFERENCES
[1] B. Adhikari and S. Majumdar, “Polymers in sensor applications,” Prog. Polym. Sci., vol.
29, no. 7, pp. 699–766, Jul. 2004.
[2] Q. Huang, I. Yoon, J. Villanueva, K. Kim, and D. J. Sirbuly, “Quantitative mechanical
analysis of thin compressible polymer monolayers on oxide surfaces,” Soft Matter, vol. 10,
pp. 8001–8010, 2014.
[3] L. H. Lee, Adhesive Bonding. Springer US, 2013.
[4] A. L. Hook, C.-Y. Chang, J. Yang, J. Luckett, A. Cockayne, S. Atkinson, Y. Mei, R.
Bayston, D. J. Irvine, R. Langer, D. G. Anderson, P. Williams, M. C. Davies, and M. R.
Alexander, “Combinatorial discovery of polymers resistant to bacterial attachment,” Nat.
Biotechnol., vol. 30, no. 9, pp. 868–875, Sep. 2012.
[5] S. Günes, H. Neugebauer, and N. S. Sariciftci, “Conjugated Polymer-Based Organic Solar
Cells,” Chem. Rev., vol. 107, no. 4, pp. 1324–1338, Apr. 2007.
[6] G. Li, R. Zhu, and Y. Yang, “Polymer solar cells,” Nat. Photonics, vol. 6, no. 3, pp. 153–
161, Mar. 2012.
[7] C. Kim, A. Facchetti, and T. J. Marks, “Polymer Gate Dielectric Surface Viscoelasticity
Modulates Pentacene Transistor Performance,” Science (80-. )., vol. 318, no. 5847, pp. 76–
80, Oct. 2007.
[8] C. Bollinne, S. Cuenot, B. Nysten, and a. M. Jonas, “Spinodal-like dewetting of
thermodynamically-stable thin polymer films,” Eur. Phys. J. E, vol. 12, no. 3, pp. 389–
396, 2003.
[9] G. Reiter, M. Hamieh, P. Damman, S. Sclavons, S. Gabriele, T. Vilmin, and E. Raphael,
“Residual stresses in thin polymer films cause rupture and dominate early stages of
dewetting,” Nat. Mater., vol. 4, no. 10, pp. 754–758, Oct. 2005.
Structuration and glass transition temperature of the adsorbed polymer layer : some insights in the property deviations of the ultra-thin polymer film Aparna Beena Unni, 2016
Chapter 3. Stable ultrathin polymer films (<7nm) made by solvent rinsing
107
[10] S. Napolitano and M. Wübbenhorst, “The lifetime of the deviations from bulk behaviour in
polymers confined at the nanoscale,” Nat. Commun., vol. 2, p. 260, Mar. 2011.
[11] F. Wyart, J. Meglio, D. Quere, and P. Gennes, “Spreading of Nonvolatile Liquids in a
Continuum Picture,” Langmuir, vol. 12, no. 8, pp. 335–338, 1991.
[12] C. Redon, F. Brochard-Wyart, and F. Rondelez, “Dynamics of dewetting,” Phys. Rev.
Lett., vol. 66, no. 6, pp. 715–718, 1991.
[13] P. G. de Gennes, F. B. Wyart, and Q. David, Capillarity and Wetting Phenomena: Drops,
Bubbles, Pearls, Waves. Springer, 2004.
[14] G. Reiter, “Probing Properties of Polymers in Thin Films Via Dewetting,” in Glass
Transition, Dynamics and Heterogeneity of Polymer Thin Films, Springer, 2013.
[15] G. Reiter, “Dewetting of thin polymer films,” Phys. Rev. Lett., vol. 68, no. 1, pp. 75–78,
Jan. 1992.
[16] K. Jacobs, R. Seemann, and S. Herminghaus, “Stability and dewetting of thin liquid
films,” in Polymer thin films, vol. 1, World Scientific, 2008, p. 243.
[17] V. S. Mitlin, “Dewetting of Solid Surface: Analogy with Spinodal Decomposition,” J.
Colloid Interface Sci., vol. 156, no. 2, pp. 491–497, Mar. 1993.
[18] A. Vrij, “Possible mechanism for the spontaneous rupture of thin, free liquid films,”
Discuss. Faraday Soc., vol. 42, no. 0, pp. 23–33, 1966.
[19] R. Xie, A. Karim, J. Douglas, C. Han, and R. Weiss, “Spinodal Dewetting of Thin Polymer
Films,” Phys. Rev. Lett., vol. 81, no. 6, pp. 1251–1254, 1998.
[20] J. N. Israelachvili, Intermolecular and surface forces. Academic Press London, 1991.
[21] A. Sharma and G. Reiter, “Instability of Thin Polymer Films on Coated Substrates:
Rupture, Dewetting, and Drop Formation,” J. Colloid Interface Sci., vol. 178, no. 2, pp.
383–399, 1996.
Structuration and glass transition temperature of the adsorbed polymer layer : some insights in the property deviations of the ultra-thin polymer film Aparna Beena Unni, 2016

Chapter 3. Stable ultrathin polymer films (<7nm) made by solvent rinsing
108
[22] J. Visser, “On Hamaker constants: A comparison between Hamaker constants and Lifshitz-
van der Waals constants,” Adv. Colloid Interface Sci., vol. 3, no. 4, pp. 331–363, Dec.
1972.
[23] D. B. Hough and L R. White, “The calculation of hamaker constants from liftshitz theory
with applications to wetting phenomena,” Adv. Colloid Interface Sci., vol. 14, no. 1, pp. 3–
41, 1980.
[24] C. J. Van Oss, M. K. Chaudhury, and R. J. Good, “Interfacial Lifshitz-van der Waals and
polar interactions in macroscopic systems,” Chem. Rev., vol. 88, no. 6, pp. 927–941, 1988.
[25] T. Kerle, R. Yerushalmi-Rozen, J. Klein, and L. J. Fetters, “van der Waals stable thin
liquid films : Correlated undulations and ultimate dewetting,” Eur. Lett., vol. 44, no. 4, pp.
484–490, 1998.
[26] H. D. Ackler, R. H. French, and Y.-M. Chiang, “Comparisons of Hamaker constants for
ceramic systems with intervening vacuum or water: From force laws and physical
properties,” J. Colloid Interface Sci., vol. 179, pp. 460–469, 1996.
[27] L. Bergström, “Hamaker constants of inorganic materials,” Adv. Colloid Interface Sci.,
vol. 70, pp. 125–169, 1997.
[28] H. Zhao, Y. J. Wang, and O. K. C. Tsui, “Dewetting induced by complete versus
nonretarded van der Waals forces.,” Langmuir, vol. 21, no. 13, pp. 5817–24, Jun. 2005.
[29] R. Seemann, S. Herminghaus, and K. Jacobs, “Dewetting Patterns and Molecular Forces:
A Reconciliation,” Phys. Rev. Lett., vol. 86, no. 24, pp. 5534–5537, Jun. 2001.
[30] A. Sharma, J. Mittal, and R. Verma, “Instability and Dewetting of Thin Films Induced by
Density Variations,” Langmuir, vol. 18, no. 26, pp. 10213–10220, Dec. 2002.
[31] L. Xue and Y. Han, “Inhibition of dewetting of thin polymer films,” Prog. Mater. Sci., vol.
57, no. 6, pp. 947–979, 2012.
Structuration and glass transition temperature of the adsorbed polymer layer : some insights in the property deviations of the ultra-thin polymer film Aparna Beena Unni, 2016

Chapter 3. Stable ultrathin polymer films (<7nm) made by solvent rinsing
109
[32] P. Gin, N. Jiang, C. Liang, T. Taniguchi, B. Akgun, S. K. Satija, M. K. Endoh, and T.
Koga, “Revealed Architectures of Adsorbed Polymer Chains at Solid-Polymer Melt
Interfaces,” Phys. Rev. Lett., vol. 109, no. 26, p. 265501, Dec. 2012.
[33] N. Jiang, J. Shang, X. Di, M. K. Endoh, and T. Koga, “Formation Mechanism of High-
Density, Flattened Polymer Nanolayers Adsorbed on Planar Solids,” Macromolecules, vol.
47, pp. 2682–2689, 2014.
[34] Y. Fujii, Z. Yang, J. Leach, H. Atarashi, K. Tanaka, and O. K. C. Tsui, “Affinity of
Polystyrene Films to Hydrogen-Passivated Silicon and Its Relevance to the T g of the
Films,” Macromolecules, vol. 42, no. 19, pp. 7418–7422, Oct. 2009.
[35] O. Guiselin, “Irreversible Adsorption of a Concentrated Polymer Solution,” Europhys.
Lett., vol. 17, pp. 225–230, 1992.
[36] H. E. Johnson and S. Granick, “Granick_New mechanism for no equilibrium polymer
adsorbtion.pdf.” Science, p. 966, 1992.
[37] R. D. Priestley, C. J. Ellison, L. J. Broadbelt, and J. M. Torkelson, “Structural relaxation of
polymer glasses at surfaces, interfaces, and in between.,” Science, vol. 309, no. 5733, pp.
456–9, Jul. 2005.
[38] A. Van der Lee, L. Hamon, Y. Holl, and Y. Grohens, “Density profiles in thin PMMA
supported films investigated by X-ray reflectometry,” Langmuir, vol. 17, no. 24, pp. 7664–
7669, 2001.
[39] G. Vignaud, M. S. Chebil, J. K. Bal, N. Delorme, T. Beuvier, Y. Grohens, and A. Gibaud,
“Densi fi cation and Depression in Glass Transition Temperature in Polystyrene Thin
Films,” Langmuir, vol. 30, pp. 11599–11608, 2014.
[40] J. K. Bal, T. Beuvier, M. S. Chebil, G. Vignaud, Y. Grohens, M. K. Sanyal, and A.
Gibaud, “Relaxation of Ultrathin Polystyrene Films Hyperswollen in Supercritical Carbon
Dioxide,” Macromolecules, vol. 47, no. 24, pp. 8738–8747, Dec. 2014.
Structuration and glass transition temperature of the adsorbed polymer layer : some insights in the property deviations of the ultra-thin polymer film Aparna Beena Unni, 2016
Chapter 3. Stable ultrathin polymer films (<7nm) made by solvent rinsing
110
[41] C. Housmans, M. Sferrazza, and S. Napolitano, “Kinetics of irreversible chain adsorption,”
Macromolecules, vol. 47, pp. 3390–3393, 2014.
[42] L. J. Fetters, N. Hadjichristidis, J. S. Lindner, and J. W. Mays, “Molecular Weight
Dependence of Hydrodynamic and Thermodynamic Properties for Well-Defined Linear
Polymers in Solution,” Journal of Physical and Chemical Reference Data, vol. 23. p. 619,
1994.
[43] J. K. Bal, S. Kundu, and S. Hazra, “Growth and stability of Langmuir-Blodgett films on
OH-, H-, or Br-terminated Si(001),” Phys. Rev. B, vol. 81, no. 4, p. 45404, Jan. 2010.
[44] E. Jabbari and N. A. Peppas, “Use of ATR-FTIR to study interdiffusion in polystyrene and
poly(vinyl methyl ether),” Macromolecules, vol. 26, no. 9, pp. 2175–2186, Apr. 1993.
[45] J. Becker, G. Grun, R. Seemann, H. Mantz, K. Jacobs, K. R. Mecke, and R. Blossey,
“Complex dewetting scenarios captured by thin-film models,” Nat. Mater., vol. 2, no. 1,
pp. 59–63, Jan. 2003.
[46] R. Seemann, S. Herminghaus, and K. Jacobs, “Gaining control of pattern formation of
dewetting liquid films,” J. Phys. Condens. Matter, vol. 13, no. 21, p. 4925, 2001.
[47] G. Reiter, R. Khanna, and A. Sharma, “Enhanced Instability in Thin Liquid Films by
Improved Compatibility,” Phys. Rev. Lett., vol. 85, no. 7, pp. 1432–1435, Aug. 2000.
[48] J. K. Bal, S. Kundu, and S. Hazra, “Hydrophobic to hydrophilic transition of HF-treated Si
surface during Langmuir–Blodgett film deposition,” Chem. Phys. Lett., vol. 500, no. 1–3,
pp. 90–95, Nov. 2010.
[49] L. Xu, A. Sharma, and S. W. Joo, “Dewetting of stable thin polymer films induced by a
poor solvent: Role of polar interactions,” Macromolecules, vol. 45, pp. 6628–6633, 2012.
Structuration and glass transition temperature of the adsorbed polymer layer : some insights in the property deviations of the ultra-thin polymer film Aparna Beena Unni, 2016

Chapter 4.Characteristic features of ultrathin polymer residual layer
studied by rinsing with different solvents.
111
Chapter 4. Characteristic features of ultrathin
polymer residual layer studied by rinsing with
different solvents.
Parts of this chapter are extracted from:
“Solvent Assisted Rinsing: Stability/Instability of Ultrathin Polymer Residual Layer”
Adapted with permission from,
Beena Unni, A.; Vignaud, G.; Bal, J. K.; Delorme, N.; Beuvier, T.; Thomas, S.; Grohens, Y.;
Gibaud, A. Macromolecules 2016, 49, 1807–1815.
Copyright © (2016) American Chemical Society
Summary
In the previous chapter, we have observed the formation of stable thin films by solvent rinsing
method; hence it can be interesting to see in the following, what happens when different solvents
are used for the rinsing process. The aim of this chapter is to study the effect of solvent selection
while deconstructing PS thin films. Thin films of PS on silicon wafer with native oxide (PS/SiOx-
Si) were rinsed with four different solvents: toluene, chloroform, tetrahydrofuran (THF) and ace-
tone to obtain the polymer residual layer. The thickness and morphology of the residual layer is
measured, the experimentally observed stability/ instability of the residual layer is analyzed with
Lifshitz van der Waals intermolecular theory with consideration to the specific interactions in the
system.
Structuration and glass transition temperature of the adsorbed polymer layer : some insights in the property deviations of the ultra-thin polymer film Aparna Beena Unni, 2016
Chapter 4.Characteristic features of ultrathin polymer residual layer
studied by rinsing with different solvents.
112
4.1 Introduction
The characteristics of polymer thin films are greatly influenced by their interfaces. Due to the large
surface to volume ratio, the influence of free surfaces and interfacial layers on the physical properties
of films cannot be neglected for ultrathin films (thickness h <100 nm). At the polymer/air interface,
there exists a surface mobile layer which enhances the chain dynamics [1]–[3]. On the other hand, the
substrate interface is known to reduce the dynamics because of an immobile polymer adsorbed layer
[4]–[6]. However, our understanding of how the properties of thin films depend on the polymer struc-
ture at the polymer/substrate interface is still rudimentary. Several research groups have evidenced
the formation of an irreversibly adsorbed polymer layers on the substrate with thickness of few na-
nometers, even without specific interactions of the polymer with the substrate [7]–[17]. Lot of studies
shows that this irreversible layer plays a significant role on the physical properties of thin films, such
as the enhancement of segmental mobility in proximity to this layer [10], [11], [18], [19], the control
of the crystalline structure [20], [21], the impact on local viscosity [13], the long-range effects of this
interface on the dynamics [22]–[25], the increase of the density at the polymer/substrate interface
[14], [26] etc. Solvent rinsing is an effective method to obtain the details on this irreversibly adsorbed
polymer on the substrate. Guiselin [7] was the first to propose a method of rinsing polymer thin films
with good solvent. The underlying desorption mechanism of polymer thin films in contact with a
solvent can be visualized as follows: When a supported polymer thin film is in contact with a good
solvent, two distinct processes can occur: (i) the solvent diffuses in the polymer film and (ii) the pol-
ymer chains near the solid–liquid interface become solvated [27]. Due to the plasticization of the
polymer by the solvent, a gel-like swollen layer is formed along with two separate interfaces, one
between a glassy polymer and a gel layer and the other between the gel layer and the solvent [28],
[29]. With the consequent formation of a swollen layer, chain disentanglement is favored and the
solvated macromolecules are transported from the film into the solution.
Structuration and glass transition temperature of the adsorbed polymer layer : some insights in the property deviations of the ultra-thin polymer film Aparna Beena Unni, 2016

Chapter 4.Characteristic features of ultrathin polymer residual layer
studied by rinsing with different solvents.
113
Figure 4-1:Sketch representing the desorption mechanism of PS/SiOx-Si in contact with a good solvent. The substrate, the polymer and the solvent are shown in black, orange and blue respectively. The non-adsorbed polymer chains dissolve after a specific induction time. These different
steps of dissolution and desorption are illustrated in Figure 4-1. After the dissolution of non-
adsorbed chains, the solvent is in direct contact with the irreversibly adsorbed polymer layer.
Such an adsorbed polymer chain is attached to the surface by many segments with a very high
adsorption energy per chain [30]. The removal of such adsorbed chain from the solid interface
requires desorption of the fraction of polymer that is in contact with the surface overcoming its
enthalpic barrier along with its disentanglement from neighboring chains (a diffusive process).
Whereas dissolution with a good solvent of a thin PS film takes place in less than second and
lasts only a few minutes [27], [31], partial desorption needs more time at low shear rates when
there is no flow-enhanced desorption. In addition, the inter diffusive chain dynamics gets strongly
hindered compared to the bulk when the distance from the substrate is less than 3Rg, where Rg is
the radius of polymer gyration of PS [32].
Structuration and glass transition temperature of the adsorbed polymer layer : some insights in the property deviations of the ultra-thin polymer film Aparna Beena Unni, 2016
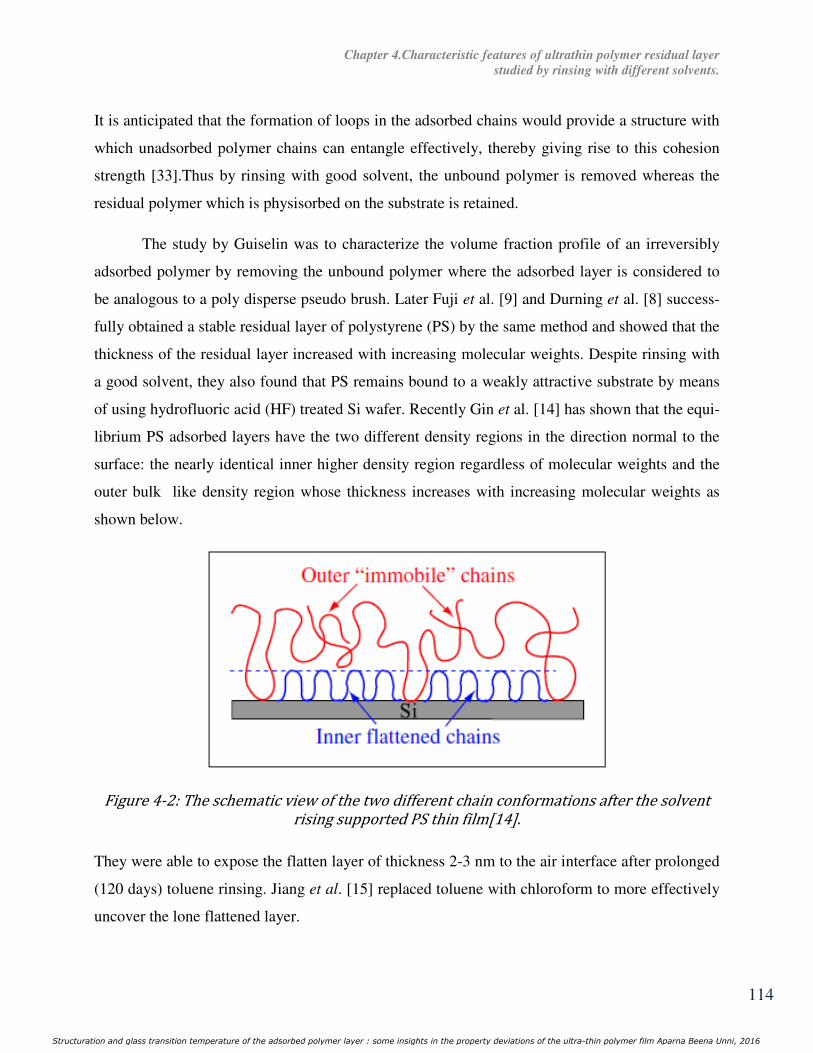
Chapter 4.Characteristic features of ultrathin polymer residual layer
studied by rinsing with different solvents.
114
It is anticipated that the formation of loops in the adsorbed chains would provide a structure with
which unadsorbed polymer chains can entangle effectively, thereby giving rise to this cohesion
strength [33].Thus by rinsing with good solvent, the unbound polymer is removed whereas the
residual polymer which is physisorbed on the substrate is retained.
The study by Guiselin was to characterize the volume fraction profile of an irreversibly
adsorbed polymer by removing the unbound polymer where the adsorbed layer is considered to
be analogous to a poly disperse pseudo brush. Later Fuji et al. [9] and Durning et al. [8] success-
fully obtained a stable residual layer of polystyrene (PS) by the same method and showed that the
thickness of the residual layer increased with increasing molecular weights. Despite rinsing with
a good solvent, they also found that PS remains bound to a weakly attractive substrate by means
of using hydrofluoric acid (HF) treated Si wafer. Recently Gin et al. [14] has shown that the equi-
librium PS adsorbed layers have the two different density regions in the direction normal to the
surface: the nearly identical inner higher density region regardless of molecular weights and the
outer bulk like density region whose thickness increases with increasing molecular weights as
shown below.
Figure 4-2: The schematic view of the two different chain conformations after the solvent rising supported PS thin film[14]. They were able to expose the flatten layer of thickness 2-3 nm to the air interface after prolonged
(120 days) toluene rinsing. Jiang et al. [15] replaced toluene with chloroform to more effectively
uncover the lone flattened layer.
Structuration and glass transition temperature of the adsorbed polymer layer : some insights in the property deviations of the ultra-thin polymer film Aparna Beena Unni, 2016

Chapter 4.Characteristic features of ultrathin polymer residual layer
studied by rinsing with different solvents.
115
They study the effect of the polymer/substrate interactions and the time of annealing on the flat-
tened layer structure by using three different homopolymers: polystyrene, poly(2-vinylpyridine),
and poly(methyl methacrylate). If the magnitude of the interactions controls the final thickness
and the kinetics of the flattened layer formation, this study also reveals that the flattened layer has
microscopic “textures” (partially covered surface) with characteristic lengths irrespective of the
polymer used. It is not conclusive yet from this study whether the polymer/solid interaction is the
main factor to control the size of the dimple structures. Yet another study from the same team
(using toluene and chloroform for unleashing the unbound polymer) showed that the higher mo-
lecular weight polymer chains with a high chain length can ‘‘reel-in’’ the empty spaces of the
flattened layer and develop the ‘‘loosely adsorbed polymer chains’’, covering the flattened layer
which makes the residual film stable compared to the low molecular weight polymers [34]. Xue
et al. [35] also studied the effect of varying annealing time and molecular weight on the architec-
ture of an irreversibly adsorbed layer of PMMA on quartz made by leaching with benzene. They
found that the wettability of the PMMA film depends on the solvent properties. Recalling our
previous study reported in Chapter 4, it brought out the possibility of obtaining stable ultrathin
polymer films by solvent rinsing method. In short we introduced a two-step top-down approach
comprising the preparation of homogeneous thick films by spin-coating and thinning them by
rinsing in a good solvent that removes the residual stress and/or the density variation of the PS
films inhibiting thermodynamically the dewetting on oxide-free silicon. Although a few studies
have been made on solvent rinsing, the role of different solvents on the dissolution or desorption
of polymer and thereby on the properties of the residual adsorbed layer remains largely unex-
plored. In order to understand the same, we perform solvent rinsing with four solvents such as
toluene, chloroform, THF and acetone. These solvents selected for the experiments based on their
Hansen solubility parameters. The aim is to understand the influence of solvents used for rinsing,
on the characteristics of polymer residual layer such as remnant thickness, morphology, stability
etc.
Structuration and glass transition temperature of the adsorbed polymer layer : some insights in the property deviations of the ultra-thin polymer film Aparna Beena Unni, 2016

Chapter 4.Characteristic features of ultrathin polymer residual layer
studied by rinsing with different solvents.
116
4.2 The film prior to solvent rinsing
The initial state of the spin-coated and annealed film (PS/SiOx-Si) which is used for the later sol-
vent rinsing study is shown in Figure 4-3.
Figure 4-3:a Optical microscope image of the PS/SiOx-Si film after spin coating and pre-annealing. b The 3D presentation of topographic image of PS/SiOx-Si film obtained using AFM. c The height profile along the drawn red line. From the optical microscopic image, the film seems to be continuous without any signature of
holes over a large scale. AFM imaging was done to characterize the surface at the nanoscale
along with the height information. The AFM image shown in Figure 4-3, b provides the 3D per-
spective of PS/SiOx-Si film after spin coating and pre-annealing (i.e. the annealing before solvent
rinsing). The step observed in the profile is due to the scratch made on the left end of the film to
obtain the thickness with AFM. The thickness is found to be 130 nm. A smooth continuous film
is observed with an average roughness value ≈ 0.3 nm. All the experiments in this section are
performed with such films. The rinsing is performed with toluene, chloroform, THF and acetone
at different times from 5 seconds to 2 hours
Structuration and glass transition temperature of the adsorbed polymer layer : some insights in the property deviations of the ultra-thin polymer film Aparna Beena Unni, 2016

Chapter 4.Characteristic features of ultrathin polymer residual layer
studied by rinsing with different solvents.
117
4.3 Thickness of polymer residual layer after rinsing with various solvents
Figure 4-4 shows the evolution of the thickness of polymer residual layer after rinsing with tolu-
ene, chloroform, THF and acetone.
Figure 4-4: Residual thickness hres of bound PS after rinsing with different solvents. hres is measured by ellipsometry and complemented with XRR. It can be seen that the residual film thickness decreases eventually with increased time of rinsing for
all the solvents. i.e. as the time of rinsing increases, the residual thickness hres decreases. After 5s of
rinsing, the hres value obtained for film rinsed with toluene is measured to be 4.51 nm. Whereas the
hres is measured as 18.33, 47.47 and 90.68 nm for films rinsed for 5s with chloroform, THF and ace-
tone respectively. The variations observed in the hres value obtained after rinsing with different sol-
vents can to be related to the quality of solvent. Where, the solvent quality is explained by means of
the Relative energy difference of the solvents w.r.t. PS, which is acquired from the Hansen solubility
parameters as given in Table 4-1.
Structuration and glass transition temperature of the adsorbed polymer layer : some insights in the property deviations of the ultra-thin polymer film Aparna Beena Unni, 2016

Chapter 4.Characteristic features of ultrathin polymer residual layer
studied by rinsing with different solvents.
118
Table 4-1: The HSP and relative energy difference values PS and some of its good solvents [37],[38].
Solvent
δd
(MPa0.5
)
δp (MPa0.5
)
δh (MPa0.5
)
Ra/Ro
(Relative en-
ergy differ-
ence, RED)
Dipolar
moment [36]
(π/D)
Polystyrene 21.28 5.75 4.3 -
Toluene 18 1.4 2 0.65 0.375 ± 0.010
Chloroform 17.3 3 5.6 0.67 1.04 ± 0.02
THF 16.8 5.7 8 0.76 1.75 ± 0.04
Acetone 15.5 10.5 7 1 2.88 ± 0.03
From Table 4-1, the compatibility of selected solvents with PS is in the increasing order
from toluene>chloroform>THF>acetone. i.e. for example, due to their low RED, the interaction
of toluene with PS is higher compared to the other solvents. Consequently toluene can easily re-
move polymer chains by promoting disentanglement. Thus, the lower the RED, the better the
extraction of entangled chains from the adsorbed layer. Films having a smaller thickness are thus
promoted. This explains why we observe different hres for the same time of rinsing with different
solvents.
4.4 The morphology of polymer residual layer after rinsing with various
solvents
The morphology of residual films resulting from rinsing with three different solvents, whose re-
sidual film thickness (hres) measured with ellipsometry as shown in Figure 4-4 is revealed by the
images depicted in Figure 4-5.
Structuration and glass transition temperature of the adsorbed polymer layer : some insights in the property deviations of the ultra-thin polymer film Aparna Beena Unni, 2016
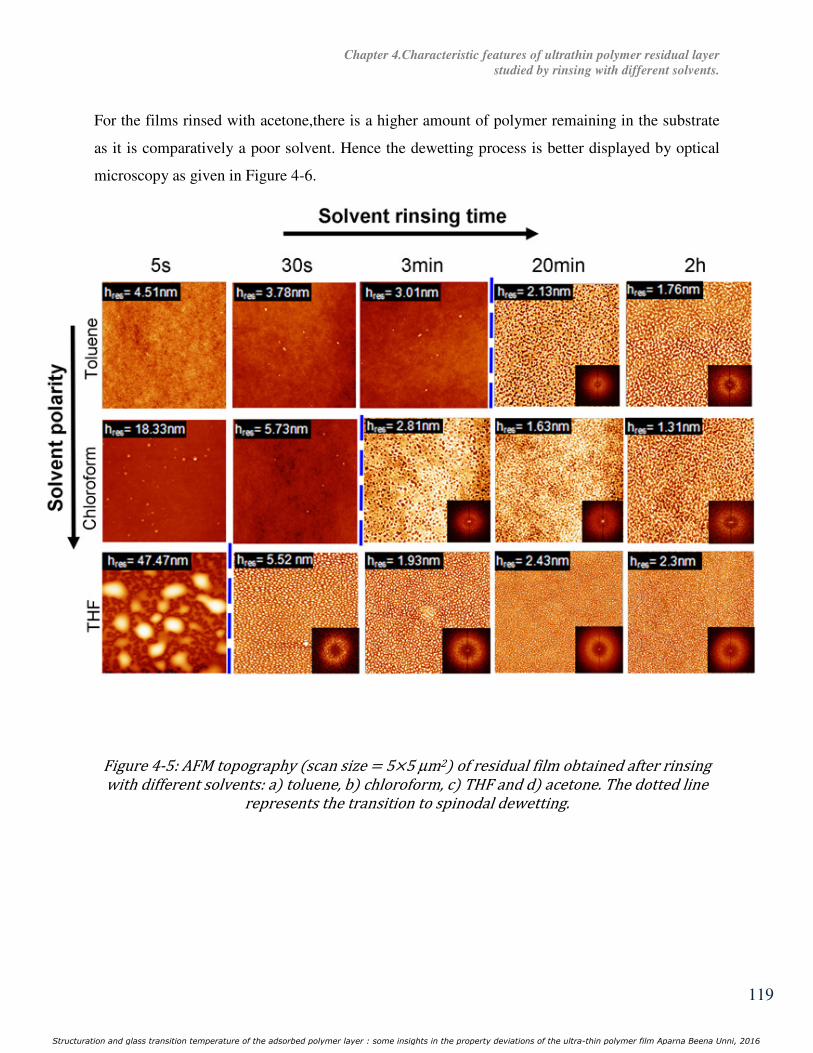
Chapter 4.Characteristic features of ultrathin polymer residual layer
studied by rinsing with different solvents.
119
For the films rinsed with acetone,there is a higher amount of polymer remaining in the substrate
as it is comparatively a poor solvent. Hence the dewetting process is better displayed by optical
microscopy as given in Figure 4-6.
Figure 4-5: AFM topography scan size = 5×5 µm2 of residual film obtained after rinsing with different solvents: a toluene, b chloroform, c THF and d acetone. The dotted line represents the transition to spinodal dewetting.
Structuration and glass transition temperature of the adsorbed polymer layer : some insights in the property deviations of the ultra-thin polymer film Aparna Beena Unni, 2016

Chapter 4.Characteristic features of ultrathin polymer residual layer
studied by rinsing with different solvents.
120
Figure 4-6: Optical images of PS films rinsed with acetone from 5s to 2h scale bar 100 μm . The scan size of AFM image = 5×5 µm2 It clearly appears that the morphology of the residual films evolves with their thickness, hres. With in-
creased time of rinsing, the initially flat film turns non homogeneous revealing a bicontinuous surface
pattern typically observed in spinodal dewetting [39]. All the fluctuations in film thickness are ampli-
fied under thermal stimulation even at room temperature (RT) and lead to spontaneous dewetting.
Structuration and glass transition temperature of the adsorbed polymer layer : some insights in the property deviations of the ultra-thin polymer film Aparna Beena Unni, 2016

Chapter 4.Characteristic features of ultrathin polymer residual layer
studied by rinsing with different solvents.
121
Solvent molecules are known to readily diffuse and saturate the PS film, reducing the glass transition
temperature of the polymer below the room temperature and thereby rendering it mobile for reorgani-
zation [40], [41]. Thus, once the solvent has leached away the outer loosely attached polymer chains,
a solvent-driven dewetting takes place [29], [42]. As depicted in the inset of Figure 4-5 and Figure 4-6,
the Fast Fourier transform (FFT) of the images reveals a ring pattern indicating the existence of a pre-
ferred wavelength of the instabilities which is the signature of a spinodal dewetting. The blue dotted
line points out the transition where the film undergoes a spinodal dewetting in Figure 4-5. Considering
the particular case of the THF rinsing, the film is already no more uniform after 5 s of rinsing (thus
before the marked dotted line), indicating that the film has started a dewetting process. Whereas we
can observe in a larger scale, the smooth film breaks up by the creation of randomly distributed holes
in acetone rinsed films also. However, within the experimental error, no correlations of hole sites can
be detected from FFT after 5s of rinsing with THF and acetone, which rules out the possibility of a
spinodal dewetting. Yet, the presence of a native oxide layer probably makes the film metastable, so
that only nucleation (randomly distributed holes) can drive such a thicker films toward dewetting [43].
Yet another striking effect from the film morphology is that all the films after solvent rinsing undergo
spinodal dewetting at different instants of rinsing time, i.e., at different values of hres. In the case of
toluene rinsed films, the spinodal dewetting is observed after 20 min of rinsing (hres = 2.1 nm) while
the films rinsed with chloroform exhibits spinodal dewetting after 3 min of rinsing (hres = 2.8 nm) and
after 30 s for THF rinsed films (hres = 5.5nm). The exact rinsing time at which acetone rinsed film un-
dergo spinodal dewetting is not obtained as AFM imaging is not done inside very small holes observed
in the initial stages, but the film from which we obtain the dewetting pattern inside the hole has a
thickness of 8 nm. This raises the question: what property of the solvent influences the onset of spi-
nodal dewetting at different hres?
The dewetting can be influenced by a lot of factors such as composition of polymer [44], film
thickness [45], type of substrate used [46], disjoining pressure involved [47] etc. Among the underly-
ing causes of dewetting, Sharma [48] pointed out the fact that the polar interactions cannot be neglect-
ed for a thin film sandwiched between a substrate and a semi-infinite fluid.
Structuration and glass transition temperature of the adsorbed polymer layer : some insights in the property deviations of the ultra-thin polymer film Aparna Beena Unni, 2016

Chapter 4.Characteristic features of ultrathin polymer residual layer
studied by rinsing with different solvents.
122
In a similar way, Lee et al. [40] differentiate between thermal dewetting and solutal dewetting where
in the former case the instability is caused due to the long-range force of Lifshitz−van der Waals inter-
actions, and in the latter one it can be attributed to the short-range force of polar interactions. Recently,
Xu et al. [41] demonstrated that PS films which are stable under thermal annealing are rendered unsta-
ble to dewetting when contacted by acetone. They explained by the introduction of destabilizing polar
interactions, notwithstanding the stabilizing apolar Lifshitz−van der Waals interactions. The work by
Verma and Sharma [49] is another good example where they found that strong polar solvents play a
significant role in the dewetting process. They were able to fabricate submicron droplets and arrays by
the dewetting of ultrathin PS using optimal mixture of water, acetone, and methyl ethyl ketone over-
coming the weak destabilizing Lifshitz−van der Waals forces and the high surface energy penalty re-
quired for deformations on small scales. Thus from these studies, two key factors that can influence the
instability of films which are in contact with a solvent are the solvent polarity and the Lifshitz−van der
Waals interactions in the system. In our case, the solvents we used present a significant difference in
their dipole moment (tabulated in Table 4-1). From our experimental observations (Figure 4-5 and
Figure 4-6) we can surmise that the films rinsed with a solvent having higher polarity dewet faster than
the ones rinsed with weakly polar solvents. Hence, the acetone rinsed film dewets before the one
rinsed with THF and chloroform respectively. The film rinsed with toluene which has the weakest po-
larity value undergoes dewetting at a later stage. Our observations are in line with the results of Lee et
al, [40] who observed that the acetone-laden film would become unstable first followed by the toluene-
laden film. With increased time of rinsing the continued coalescence of holes finally leads to the for-
mation of PS droplets generating a regular pattern of polygons as characteristics of thermal annealing.
[50] The use of a poor solvent like acetone prevents a rapid dissolution of the polymer during the first
30s of rinsing. Consequently, the film which is still thick initiates a dewetting by hole nucleation.
However, numerical simulations [51] have highlighted that different morphologies (isolated circular
holes, droplets, bicontinuous) and their combinations can all be produced by the spinodal decomposi-
tion mechanism depending on the form of the intermolecular potential in an extended neighborhood of
the film thickness. Thus it is clear from the experimental measurements that when the polarity of the
solvents increases, the film is able to dewet earlier, i.e., at a higher residual thickness.
Structuration and glass transition temperature of the adsorbed polymer layer : some insights in the property deviations of the ultra-thin polymer film Aparna Beena Unni, 2016

Chapter 4.Characteristic features of ultrathin polymer residual layer
studied by rinsing with different solvents.
123
4.5 The stability/instability of polymer residual layer analyzed with Van der
Waals - intermolecular theory
In order to predict the stability of the polymer residual layer obtained after rinsing with different
solvents, we have to recall the free energy ∆F(h) and its second derivative ∆F″(h) which can de-
termine the stability or instability of polymer films as already discussed in chapters 1 and 4.
Looking back to the concept, Æℎ is defined as the excess free energy per unit area necessary
to bring two interfaces (the substrate–polymer and the polymer–solvent interfaces) from infinity
to a certain distance h. The distance h defines the thickness of the polymer layer separating the
two interfaces. The sign of the second derivative of the free energy indicates whether the film is
stable (∆"ℎ > 0) or dewets spontaneously (∆"ℎ < 0). [43] Thus the effective free energy
of a system can be represented as follows,
∆F(h) = ∆FLW(h) + ∆FAB(h) + c/h8 4-1
where ∆FLW (h) represents the long-range interactions by the Lifshitz-van der Waals potential and
∆FAB(h) represents the polar contribution by the acid-base interactions in the system. The last
term includes short-range electrostatic repulsion of strength c whose value is 1.8±1 x 10-77 Jm6
for a silicon wafer with 1.7 nm of native oxide. [43], [46]
We first consider the Lifshitz-van der Waals component, ∆FLW(h). As the film is totally immersed
in the solvent during the time of rinsing, the system can be thought of a 4-layered system like
Si/SiOx/PS/Solvent in which the last layer is the solvent itself. Accordingly, ∆FLW (h) can be ex-
pressed as
∆FLW(h)
+
−−
−+
+
−=
)²(12²12)²(12//////
x
xx
x SiO
SolventPSSiOSolventPSSiO
SiO
SolventPSSi
dh
A
h
A
dh
A
πππ
4-2
where ASi/PS/Solvent and ASiOx/PS/Solvent are the effective Hamaker constants of the Si/PS/Solvent and
SiOx/Ps/Solvent 3 layer systems, respectively. The effective Hamaker constant %`92 of a 3 lay-
er system is calculated using the relation:
Structuration and glass transition temperature of the adsorbed polymer layer : some insights in the property deviations of the ultra-thin polymer film Aparna Beena Unni, 2016

Chapter 4.Characteristic features of ultrathin polymer residual layer
studied by rinsing with different solvents.
124
%`29 = Ç%`` − Ç%22 Ç%99 − Ç%22 4-3
In our case, equation 4-3 can be written as
%Seb2 /IS/ lb½,d = Ç%Seb2/Seb2 − Ç%IS/IS Ç%lb½,d/lb½,d −Ç%IS/IS)
4-4. (a)
and
%Se /IS/ lb½,d = Q%Se/Se − Q%IS/IS Q%lb½,d/lb½,d − Q%IS/IS (b)
To calculate the effective Hamaker constants of the system, Hamaker constants of each interface
(
Table 4-2) were chosen as the average value of values reported in the literature. [52]–[59]
Table 4-2: The Hamaker constants reported in the literature [52]–[59]and their average value used in our calculations.
Hamaker constants values re-
ported in literature(J)
Average Hamaker constant
value(J)
ASi/Si 19 - 24 × 10−20 22.3×10⁻²⁰
ASiO2/SiO2 5.0 - 6.6×10⁻²⁰ 5.8×10⁻²⁰
APS/PS 6.15 - 7.9×10⁻²⁰ 7.56 ×10⁻²⁰
The Hamaker constants of solvents were calculated from their surface tension using the relation
[51], [54]:
e = %ee24 tÉr2 4-5
Structuration and glass transition temperature of the adsorbed polymer layer : some insights in the property deviations of the ultra-thin polymer film Aparna Beena Unni, 2016
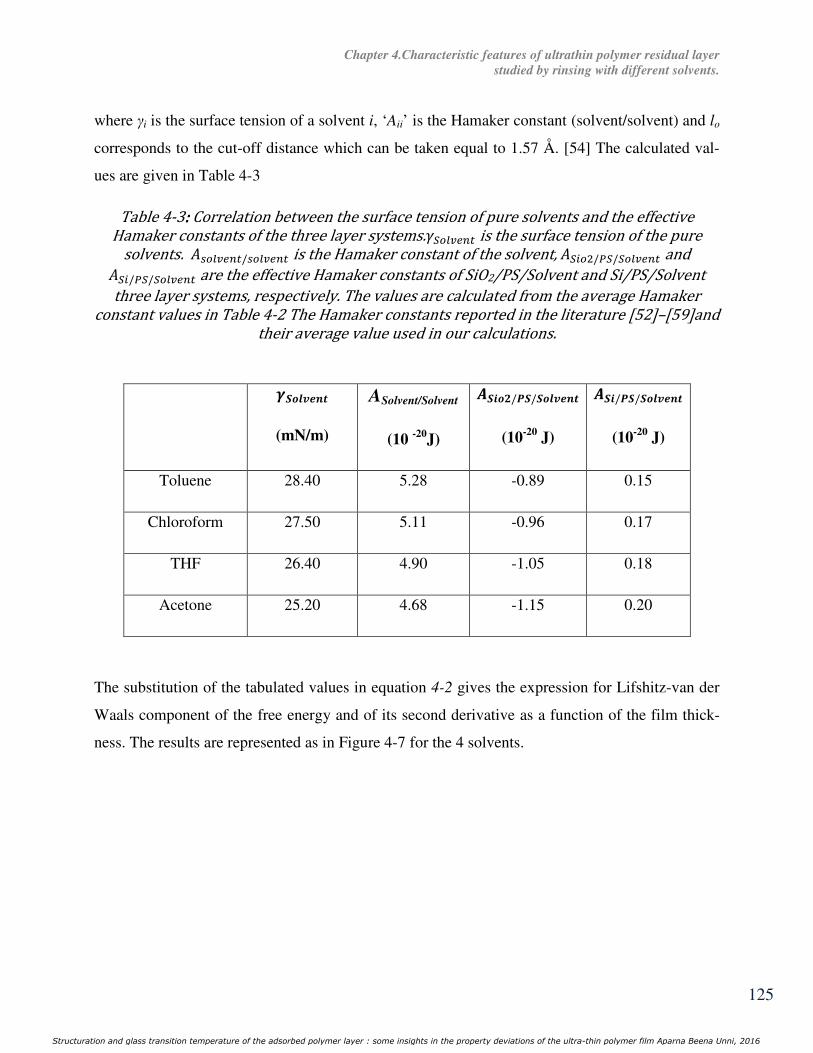
Chapter 4.Characteristic features of ultrathin polymer residual layer
studied by rinsing with different solvents.
125
where γi is the surface tension of a solvent i, ‘Aii’ is the Hamaker constant (solvent/solvent) and lo
corresponds to the cut-off distance which can be taken equal to 1.57 Å. [54] The calculated val-
ues are given in Table 4-3
Table 4-3: : : : Correlation between the surface tension of pure solvents and the effective Hamaker constants of the three layer systems.Sb½,d is the surface tension of the pure solvents. %lb½,d/lb½,d is the Hamaker constant of the solvent, %Seb2/IS/Sb½,d and %Se/IS/Sb½,d are the effective Hamaker constants of SiO2/PS/Solvent and Si/PS/Solvent three layer systems, respectively. The values are calculated from the average Hamaker constant values in Table 4-2 The Hamaker constants reported in the literature [52]–[59]and their average value used in our calculations.
The substitution of the tabulated values in equation 4-2 gives the expression for Lifshitz-van der
Waals component of the free energy and of its second derivative as a function of the film thick-
ness. The results are represented as in Figure 4-7 for the 4 solvents.
ÊËÌÍÎÏÐÑ (mN/m)
ASolvent/Solvent
(10 -20
J)
ÒËÓÌÔ/ÕË/ËÌÍÎÏÐÑ (10
-20 J)
ÒËÓ/ÕË/ËÌÍÎÏÐÑ (10
-20 J)
Toluene 28.40 5.28 -0.89 0.15
Chloroform 27.50 5.11 -0.96 0.17
THF 26.40 4.90 -1.05 0.18
Acetone 25.20 4.68 -1.15 0.20
Structuration and glass transition temperature of the adsorbed polymer layer : some insights in the property deviations of the ultra-thin polymer film Aparna Beena Unni, 2016

Chapter 4.Characteristic features of ultrathin polymer residual layer
studied by rinsing with different solvents.
126
Figure 4-7: a Simulation of the Lifshitz-van der Waals component of the free energy ∆FLW and b its second derivative ∆× ℎ as a function of film thickness h for PS films for the four layer system Si/SiOx/PS/Solvent under different solvent media. The effective Hamaker constants are the ones given in Table 4-3 and the thickness of the SiOx layer was taken to be equal to 1.7 nm. From Figure 4-7.a, for all the solvents, the excess free energy per unit area, ∆FLW (h) possess both
positive and negative values which points to the fact that the system is unstable for small film
thicknesses whereas metastable for larger film thicknesses. [60], [61] The system has to over-
come a potential barrier to reach the lowest energy state which is slightly different according to
the solvent used. The potential barrier is a bit higher for a film rinsed in acetone and decreases in
order for the films rinsed with THF, chloroform and then toluene respectively. It is readily shown
that spinodal dewetting can take place only if the second derivative of ∆FLW (h) with respect to
film thickness is negative. From Figure 4-7.b, it is quite amazing to observe that the transition
thickness at which the film undergoes spinodal dewetting, htrans is equal to 2.7±1 nm and is the
same for all the solvents. Yet from the experimental results, only the toluene-rinsed film shows a
spinodal dewetting for a thickness hres = 2.1 nm less than htrans.= 2.7 nm while all other films
rinsed with polar solvents experimentally dewet at a thickness which is higher than the calculated
value htrans. Since the polarity of toluene is almost negligible, one can logically infer that the dif-
ference in these behaviors can be attributed to the contribution of polar interactions. It is thus
important to quantify the contribution of the polar component ∆FAB(h) to the total free energy of
the system.
Structuration and glass transition temperature of the adsorbed polymer layer : some insights in the property deviations of the ultra-thin polymer film Aparna Beena Unni, 2016
Chapter 4.Characteristic features of ultrathin polymer residual layer
studied by rinsing with different solvents.
127
4.6 The stability/instability of polymer residual layer analyzed with effective
free energy of the system
The acid-base (AB) interactions occur between molecules that display conjugate polarities
as measured by their electron (proton) donor and acceptor capabilities. PS is a weakly electron-
donor monopolar material but when the polar solvent molecules enter into the PS film, the polar
interactions have to be considered. The contribution by short range polar interactions, can be ex-
pressed as
∆FAB(h) =Sp exp ((dmin – h)/É) 4-6
where SP is the polar component of spreading coefficient and exp((dmin – h)/l) stands for
the decay function describing the short range of the polar interactions with the correlation length
l. The decay function for the polar interactions satisfies the relation exp((dmin – h)/l) = 1 at a cutoff
dmin and is 0 at large distances. For water, an estimation of the correlation length is about l = 0.6
nm [48] whereas for polymer l can be taken as 2.5 nm. [51] The value of SP can be evaluated
from contact angle measurements. [62]
S = SLW+SP= γ23 (cosθ-1) 4-7
where the spreading coefficient, S is the sum of two terms: the long range Lifshitz-van der Waals
dispersive surface energy SLW and the contribution by short range polar interactions SP. Hence it
is possible to estimate the spreading coefficient S by knowing the values of the contact angle θ
and of the surface tension. The surface tension γ between PS and the solvent is calculated by the
following relation with γPS = 40.7 mN/m
IS,Sb½,d = IS + Sb½,d − 2IS ∗ Sb½,d ` 2 4-8
where γSolvent is taken from Table 4-3.
Structuration and glass transition temperature of the adsorbed polymer layer : some insights in the property deviations of the ultra-thin polymer film Aparna Beena Unni, 2016
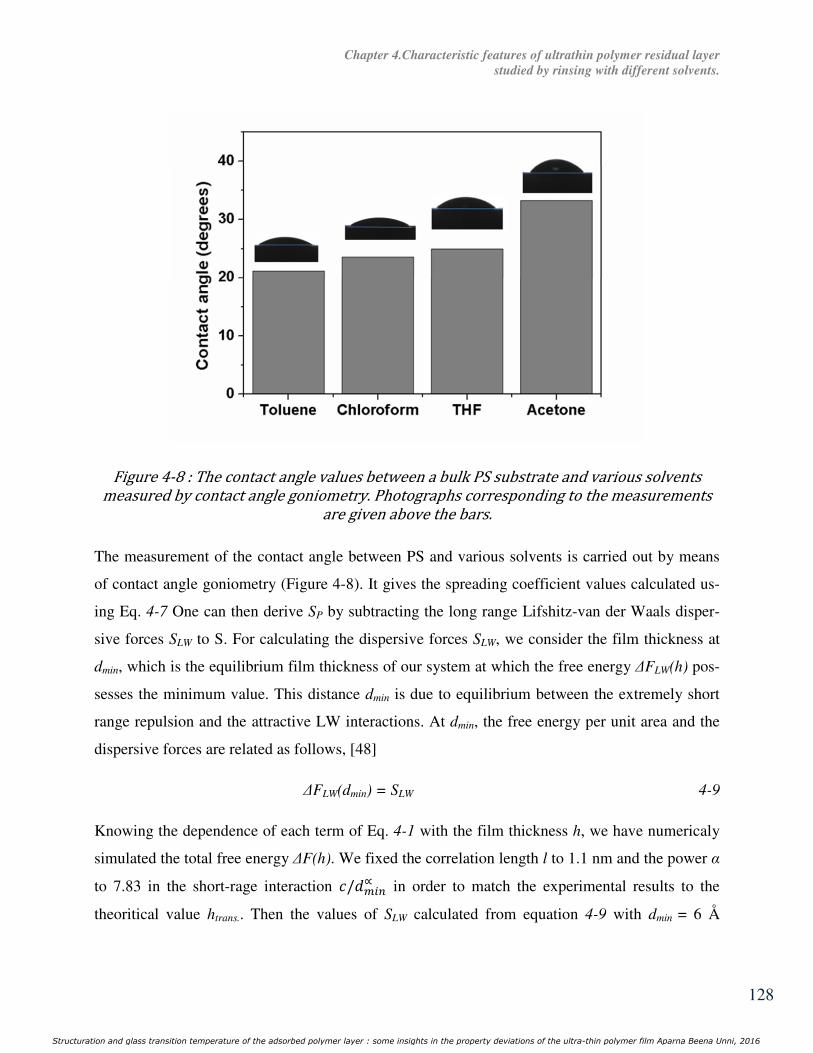
Chapter 4.Characteristic features of ultrathin polymer residual layer
studied by rinsing with different solvents.
128
Figure 4-8 : The contact angle values between a bulk PS substrate and various solvents measured by contact angle goniometry. Photographs corresponding to the measurements are given above the bars. The measurement of the contact angle between PS and various solvents is carried out by means
of contact angle goniometry (Figure 4-8). It gives the spreading coefficient values calculated us-
ing Eq. 4-7 One can then derive SP by subtracting the long range Lifshitz-van der Waals disper-
sive forces SLW to S. For calculating the dispersive forces SLW, we consider the film thickness at
dmin, which is the equilibrium film thickness of our system at which the free energy ∆FLW(h) pos-
sesses the minimum value. This distance dmin is due to equilibrium between the extremely short
range repulsion and the attractive LW interactions. At dmin, the free energy per unit area and the
dispersive forces are related as follows, [48]
∆FLW(dmin) = SLW 4-9
Knowing the dependence of each term of Eq. 4-1 with the film thickness h, we have numericaly
simulated the total free energy ∆F(h). We fixed the correlation length l to 1.1 nm and the power α
to 7.83 in the short-rage interaction g/uÙe,∝ in order to match the experimental results to the
theoritical value htrans.. Then the values of SLW calculated from equation 4-9 with dmin = 6 Å
Structuration and glass transition temperature of the adsorbed polymer layer : some insights in the property deviations of the ultra-thin polymer film Aparna Beena Unni, 2016

Chapter 4.Characteristic features of ultrathin polymer residual layer
studied by rinsing with different solvents.
129
obtained from the simulation (which is matching with the results of Seeman et al. [43], dmin = 8 Å
for a 1.7 nm thick native oxide layer) are given in the Table 4-4 along with the Spvalues obtained
thereby. In the numerical simulation, it is interesting to note that the power α plays a role on dmin,
the location of the minimum of energy (thus affecting the calculation of SLW and Sp) and the
correlation length l impacts direcly the values of htrans. From Table 4-4, it can be seen that the
spreading parameter Sp which represents the contribution of the short range polar interactions to
the total free energy of the system increases with increasing polarity of the solvents. Hence it is
now clear that the instability is accelerated by the polarity of solvents, which increases in the or-
der Sptoluene< SpChloroform< SpTHF< Spacetone.
Table 4-4: Correlation between the surface tension γPS/Solvent , the total S, the Lifshitz-van der Waals SLW and the polar SP spreading coefficients.
Thus by considering the 3 contributions, i.e. the effective contribution of Lifshiftz-van der Waals
∆FLW , the polar contribution ∆FP along with thesteric repulsion energy c/hα , the excess free
energy per unit of area ∆F and its second derivative ∆F’’ as a function of film thickness h for PS
films on native oxide covered Si substrate under different solvent exposures could be simulated.
They are plotted in Figure 4-9.
ÊÕË/ËÌÍÎÏÐÑ (mN/m)
S
(mN/m)
SLW
(N/m) x 10-5
SP
(N/m) x10-5
Toluene 1.10 -0.07 - 5.92 -1.53
Chloroform 1.29 -0.11 -6.69 -4.06
THF 1.54 -0.14 -7.75 -6.69
Acetone 1.85 -0.3 -8.90 -21.35
Structuration and glass transition temperature of the adsorbed polymer layer : some insights in the property deviations of the ultra-thin polymer film Aparna Beena Unni, 2016

Chapter 4.Characteristic features of ultrathin polymer residual layer
studied by rinsing with different solvents.
130
Figure 4-9: Simulation of a the effective free energy ∆F and b its second derivative ∆F’’ as a function of PS film thickness h for a four layer Si/SiOx/PS/Solvent system. In these simulations, 4 solvents are considered: toluene, chloroform, THF and acetone. The effective free energy takes into account the effective contribution of the Lifshitz-van der Waals ∆FLW and of the polar ∆FP components as well as the steric repulsion energy c/hα. The consideration of polar contributions along with the effect of steric repulsion paves the way to
a drastic change in the resulting free energy curves as shown in Figure 4-9. In comparison to tol-
uene rinsed samples (Figure 4-9.a), the acetone laden samples depicts an increase in its negative
value of free energy for a smaller thickness, which clearly points out the amplification of instabil-
ity with increasing polar interactions in the system. From the second derivative of the effective
free energy (Figure 4-9.b), htrans is found to be increased with the polarity of the solvent. Conse-
quently the films undergo spinodal dewetting at different thicknesses w.r.t. the type of solvent
used. The htrans value of toluene is found to be around 2.8 nm, where we could experimentally
observe the spinodal dewetting pattern when its thickness fall below 3 nm i.e. at 2.1nm. In case of
chloroform and THF, htrans is observed at 5.5 nm and 6.7 nm, respectively whose experimental
dewetted results estimate htrans to be in the 2.8 – 5.7 nm range and 5.5 – 47.5 nm range, respec-
tively (Figure 4-5). The AFM images inside the hole of the films dewetted by acetone rinsing also
exhibits a dewetted pattern at a thickness of 8 nm which is less than its htrans of 8.5 nm. Thus in
case of solvents owing to the low polarity (case of toluene), the transition thickness htrans below
which the film spinodally dewets can be directly obtained by the Lifshitz-van der Waals theory,
Structuration and glass transition temperature of the adsorbed polymer layer : some insights in the property deviations of the ultra-thin polymer film Aparna Beena Unni, 2016

Chapter 4.Characteristic features of ultrathin polymer residual layer
studied by rinsing with different solvents.
131
whereas the contribution of the acid base interactions has to be taken in account for the polar sol-
vents. If our numerical simulation undeniably shows the influence of the polar interactions on the
transition htrans, we must stress that it is not an absolute calculation but can be considered as a
comparative calculation. An example of complexity is the polar AB interactions which decay ex-
ponentially for simple liquids, but till date their decay behavior for the polymer−solvent mixtures
is not really known.
4.7 Conclusion
Polystyrene thin films supported on SiOx-Si substrates were rinsed with four different solvents:
toluene, chloroform, THF and acetone. These solvents can be defined by their Hansen solubility
parameter HSP. We observed that the closer their HSP to the one of PS and the faster the dissolu-
tion and desorption of the polymer chains. This is in good agreement with the Relative Energy
Difference theory. In addition, we observed for this four layer Si/SiOx/PS/Solvent system, that
the films exhibited two different morphologies depending on their thicknesses h. For h>htrans, the
films were flat whereas they exhibited spinodal dewetting for h<htrans. When toluene was used as
solvent, the experimental transition thickness htrans was equal to about 2.8 nm. This value can be
explained theoretically by determining the apolar Lifshiftz-van der Waals free energy ∆FLW.
However, as soon as the other solvents were used for rinsing, htrans was clearly shifting to higher
value. In particular, we highlighted a correlation between htrans and the polarity of the solvent. To
go deeper into the analyses, the polar acid-base free energy ∆FAB was determined and we demon-
strated that the addition of this polar term ∆FAB to the LW free energy can perfectly explain the
unstable and metastable domains for the 4 different solvents. Thus from these results, it is inter-
esting to note that we can tune the thickness, morphology, amount of polymer bound to the sub-
strate etc., by employing a solvent specific rinsing.
Structuration and glass transition temperature of the adsorbed polymer layer : some insights in the property deviations of the ultra-thin polymer film Aparna Beena Unni, 2016

Chapter 4.Characteristic features of ultrathin polymer residual layer
studied by rinsing with different solvents.
132
REFERENCES
[1] Z. Fakhraai and J. A. Forrest, “Measuring the surface dynamics of glassy polymers.,”
Science, vol. 319, no. 5863, pp. 600–604, 2008.
[2] N. Delorme, M. S. Chebil, G. Vignaud, V. Le Houerou, J.-F. Bardeau, R. Busselez, A.
Gibaud, and Y. Grohens, “Experimental evidence of ultrathin polymer film stratification
by AFM force spectroscopy,” Eur. Phys. J. E, vol. 38, no. 6, p. 56, 2015.
[3] Z. Yang, Y. Fujii, F. K. Lee, C.-H. Lam, and O. K. C. Tsui, “Glass transition dynamics and
surface layer mobility in unentangled polystyrene films.,” Science, vol. 328, no. 5986, pp.
1676–9, Jul. 2010.
[4] X. Jie, L. Ding, J. Chen, S. Gao, L. Li, D. Zhou, X. Li, and G. Xue, “Sensitive
Characterization of the In fl uence of Substrate Interfaces on Supported Thin Films,”
Macromolecules, vol. 47, no. 18, pp. 6365–6372, 2014.
[5] R. P. White, C. C. Price, and J. E. G. Lipson, “Effect of Interfaces on the Glass Transition
of Supported and Freestanding Polymer Thin Films,” Macromolecules, vol. 48, pp. 4132–
4141, 2015.
[6] F. Chen, D. Peng, C.-H. Lam, and O. K. C. Tsui, “Viscosity and Surface-Promoted
Slippage of Thin Polymer Films Supported by a Solid Substrate,” Macromolecules, vol.
48, no. 14, pp. 5034–5039, Jul. 2015.
[7] O. Guiselin, “Irreversible Adsorption of a Concentrated Polymer Solution,” Europhys.
Lett., vol. 17, pp. 225–230, 1992.
[8] C. J. Durning, B. O’Shaughnessy, U. Sawhney, D. Nguyen, J. Majewski, and G. S. Smith,
“Adsorption of poly(methyl methacrylate) melts on quartz,” Macromolecules, vol. 32, pp.
6772–6781, 1999.
[9] Y. Fujii, Z. Yang, J. Leach, H. Atarashi, K. Tanaka, and O. K. C. Tsui, “Affinity of
Polystyrene Films to Hydrogen-Passivated Silicon and Its Relevance to the T g of the
Films,” Macromolecules, vol. 42, no. 19, pp. 7418–7422, Oct. 2009.
Structuration and glass transition temperature of the adsorbed polymer layer : some insights in the property deviations of the ultra-thin polymer film Aparna Beena Unni, 2016
Chapter 4.Characteristic features of ultrathin polymer residual layer
studied by rinsing with different solvents.
133
[10] S. Napolitano, C. Rotella, and M. Wübbenhorst, “Can Thickness and Interfacial
Interactions Univocally Determine the Behavior of Polymers Confined at the Nanoscale?,”
ACS Macro Lett., vol. 1, no. 10, pp. 1189–1193, Oct. 2012.
[11] S. Napolitano, A. Pilleri, P. Rolla, and M. Wübbenhorst, “Unusual Deviations from Bulk
Behavior in Ultrathin Films of Poly(tert-butylstyrene): Can Dead Layers Induce a
Reduction of Tg?,” ACS Nano, vol. 4, no. 2, pp. 841–848, Feb. 2010.
[12] S. Napolitano and M. Wübbenhorst, “The lifetime of the deviations from bulk behaviour in
polymers confined at the nanoscale,” Nat. Commun., vol. 2, p. 260, Mar. 2011.
[13] T. Koga, N. Jiang, P. Gin, M. K. Endoh, S. Narayanan, L. B. Lurio, and S. K. Sinha,
“Impact of an irreversibly adsorbed layer on local viscosity of nanoconfined polymer
melts,” Phys. Rev. Lett., vol. 107, no. 22, pp. 1–5, 2011.
[14] P. Gin, N. Jiang, C. Liang, T. Taniguchi, B. Akgun, S. K. Satija, M. K. Endoh, and T.
Koga, “Revealed Architectures of Adsorbed Polymer Chains at Solid-Polymer Melt
Interfaces,” Phys. Rev. Lett., vol. 109, no. 26, p. 265501, Dec. 2012.
[15] N. Jiang, J. Shang, X. Di, M. K. Endoh, and T. Koga, “Formation Mechanism of High-
Density, Flattened Polymer Nanolayers Adsorbed on Planar Solids,” Macromolecules, vol.
47, pp. 2682–2689, 2014.
[16] J. K. Bal, T. Beuvier, A. B. Unni, E. A. Chavez Panduro, G. Vignaud, N. Delorme, M. S.
Chebil, Y. Grohens, and A. Gibaud, “Stability of Polymer Ultrathin Films (<7 nm) Made
by a Top-Down Approach,” ACS Nano, vol. 9, no. 8, pp. 8184–8193, Aug. 2015.
[17] S. Napolitano, Non-equilibrium Phenomena in Confined Soft Matter: Irreversible
Adsorption, Physical Aging and Glass Transition at the Nanoscale. Springer, 2015.
[18] S. Napolitano and D. Cangialosi, “Interfacial Free Volume and Vitrification: Reduction in
T,” Macromolecules, vol. 46, pp. 8051–8053, 2013.
[19] D. Cangialosi, “Effect of Confinement Geometry on Out-of-Equilibrium Glassy
Dynamics,” in Non-equilibrium Phenomena in Confined Soft Matter, Springer, 2015, pp.
265–298.
Structuration and glass transition temperature of the adsorbed polymer layer : some insights in the property deviations of the ultra-thin polymer film Aparna Beena Unni, 2016

Chapter 4.Characteristic features of ultrathin polymer residual layer
studied by rinsing with different solvents.
134
[20] M. Asada, N. Jiang, L. Sendogdular, P. Gin, Y. Wang, M. K. Endoh, T. Koga, M. Fukuto,
D. Schultz, M. Lee, X. Li, J. Wang, M. Kikuchi, and A. Takahara, “Heterogeneous
Lamellar Structures Near the Polymer/Substrate Interface,” Macromolecules, vol. 45, no.
17, pp. 7098–7106, Sep. 2012.
[21] B. Vanroy, M. Wübbenhorst, and S. Napolitano, “Crystallization of thin polymer layers
confined between two adsorbing walls,” ACS Macro Lett., vol. 2, no. 2, pp. 168–172, Feb.
2013.
[22] X. Zheng, M. H. Rafailovich, J. Sokolov, Y. Strzhemechny, S. A. Schwarz, B. B. Sauer,
and M. Rubinstein, “Long-Range Effects on Polymer Diffusion Induced by a Bounding
Interface,” Phys. Rev. Lett., vol. 79, no. 2, pp. 241–244, 1997.
[23] G. Vignaud, J. F. Bardeau, A. Gibaud, and Y. Grohens, “Multiple glass-transition
temperatures in thin supported films of isotactic PMMA as revealed by enhanced raman
scattering,” Langmuir, vol. 21, no. 19, pp. 8601–8604, 2005.
[24] S. Ata, K. Ito, Y. Kobayashi, and T. Ougizawa, “Possible origin of reduced glass transition
temperatures of spin-cast ultrathin polystyrene films,” Chem. Phys. Lett., vol. 517, no. 1–3,
pp. 68–70, Nov. 2011.
[25] D. Qi, Z. Fakhraai, and J. A. Forrest, “Substrate and chain size dependence of near surface
dynamics of glassy polymers,” Phys. Rev. Lett., vol. 101, no. 9, pp. 1–4, 2008.
[26] G. Vignaud, M. S. Chebil, J. K. Bal, N. Delorme, T. Beuvier, Y. Grohens, and A. Gibaud,
“Densi fi cation and Depression in Glass Transition Temperature in Polystyrene Thin
Films,” Langmuir, vol. 30, pp. 11599–11608, 2014.
[27] V. Marcon and N. F. A. van der Vegt, “How does low-molecular-weight polystyrene
dissolve: osmotic swelling vs. surface dissolution,” Soft Matter, vol. 10, pp. 9059–9064,
2014.
[28] B. A. Miller-Chou and J. L. Koenig, “A review of polymer dissolution,” Prog. Polym. Sci.,
vol. 28, pp. 1223–1270, Aug. 2003.
Structuration and glass transition temperature of the adsorbed polymer layer : some insights in the property deviations of the ultra-thin polymer film Aparna Beena Unni, 2016

Chapter 4.Characteristic features of ultrathin polymer residual layer
studied by rinsing with different solvents.
135
[29] J. You, S. Zhang, G. Huang, T. Shi, and Y. Li, “Solvent annealing induced phase
separation and dewetting in PMMA/SAN blend film: Film thickness and solvent
dependence,” J. Chem. Phys., vol. 138, no. 24, pp. 3943–3948, 2013.
[30] C. Yu and S. Granick, “Revisiting Polymer Surface Diffusion in the Extreme Case of
Strong Adsorption,” Langmuir, vol. 30, no. 48, pp. 14538–14544, Dec. 2014.
[31] I. Devotta, V. D. Ambeskar, A. B. Mandhare, and R. A. Mashelkar, “The life time of a
dissolving polymeric particle,” Chem. Eng. Sci., vol. 49, no. 5, pp. 645–654, 1994.
[32] N. Jiang, L. Sendogdular, X. Di, M. Sen, P. Gin, M. K. Endoh, T. Koga, B. Akgun, M.
Dimitriou, and S. Satija, “Effect of CO2 on a Mobility Gradient of Polymer Chains near an
Impenetrable Solid,” Macromolecules, vol. 48, pp. 1795–1803, 2015.
[33] Z. Huang, H. Ji, J. W. Mays, and M. D. Dadmun, “Understanding the grafting of telechelic
polymers on a solid substrate to form loops,” Macromolecules, vol. 41, no. 3, pp. 1009–
1018, 2008.
[34] N. Jiang, J. Wang, X. Di, J. Cheung, W. Zeng, M. K. Endoh, T. Koga, and S. K. Satija,
“Nanoscale adsorbed structures as a robust approach for tailoring polymer film stability,”
Soft Matter, vol. 12, no. 6, pp. 1801–1809, 2016.
[35] L. Xue and Y. Han, “Autophobic dewetting of a poly(methyl methacrylate) thin film on a
silicon wafer treated in good solvent vapor,” Langmuir, vol. 25, no. 24, pp. 5135–5140,
2009.
[36] D. R. Lide, CRC Handbook of Chemistry and Physics. 2003.
[37] D. C. Sherrington, “Preparation, structure and morphology of polymer supports,” Chem.
Commun., no. 21, pp. 2275–2286, 1998.
[38] D. Kim, S. Park, Y. Choi, and S. K. Lee, “Optimization of Solvent for the Determination
of Polybrominated Diphenyl Ethers in High-Impact Polystyrene by GC / ECD,” Bull.
Korean Chem. Soc., vol. 33, no. 10, pp. 3485–3488, 2012.
[39] R. Xie, A. Karim, J. Douglas, C. Han, and R. Weiss, “Spinodal Dewetting of Thin Polymer
Films,” Phys. Rev. Lett., vol. 81, no. 6, pp. 1251–1254, 1998.
Structuration and glass transition temperature of the adsorbed polymer layer : some insights in the property deviations of the ultra-thin polymer film Aparna Beena Unni, 2016

Chapter 4.Characteristic features of ultrathin polymer residual layer
studied by rinsing with different solvents.
136
[40] S. H. Lee, P. J. Yoo, S. J. Kwon, and H. H. Lee, “Solvent-driven dewetting and rim
instability,” J. Chem. Phys., vol. 121, no. 2004, pp. 4346–4351, 2004.
[41] L. Xu, A. Sharma, and S. W. Joo, “Dewetting of stable thin polymer films induced by a
poor solvent: Role of polar interactions,” Macromolecules, vol. 45, pp. 6628–6633, 2012.
[42] S. Zhang, T. Shi, J. You, and Y. Li, “Solvent annealing induced phase separation and
dewetting in PMMA/SAN blend films: composition dependence,” Polym. Chem., vol. 4,
no. 14, pp. 3943–3948, 2013.
[43] R. Seemann, S. Herminghaus, and K. Jacobs, “Dewetting Patterns and Molecular Forces:
A Reconciliation,” Phys. Rev. Lett., vol. 86, no. 24, pp. 5534–5537, Jun. 2001.
[44] J. You, S. Hu, Y. Liao, K. Song, Y. Men, T. Shi, and L. An, “Composition effect on
dewetting of ultrathin films of miscible polymer blend,” Polymer., vol. 50, no. 19, pp.
4745–4752, 2009.
[45] J. You, Y. Liao, Y. Men, T. Shi, and L. An, “Film Thickness Dependence of Phase
Separation and Dewetting Behaviors in PMMA/SAN Blend Films,” Langmuir, vol. 26, no.
18, pp. 14530–14534, 2010.
[46] R. Seemann, S. Herminghaus, and K. Jacobs, “Gaining control of pattern formation of
dewetting liquid films,” J. Phys. Condens. Matter, vol. 13, no. 21, p. 4925, 2001.
[47] H. I. Kim, C. M. Mate, K. A. Hannibal, and S. S. Perry, “How Disjoining Pressure Drives
the Dewetting of a Polymer Film on a Silicon Surface,” Phys. Rev. Lett., vol. 82, no. 17,
pp. 3496–3499, 1999.
[48] A. Sharma, “Relationship of Thin Film Stability and Morphology to Macroscopic
Parameters of Wetting in the Apolar and Polar Systems,” Langmuir, vol. 28, no. 23, pp.
861–869, 1993.
[49] A. Verma and A. Sharma, “Submicrometer pattern fabrication by intensification of
instability in ultrathin polymer films under a water-solvent mix,” Macromolecules, vol. 44,
no. 12, pp. 4928–4935, 2011.
Structuration and glass transition temperature of the adsorbed polymer layer : some insights in the property deviations of the ultra-thin polymer film Aparna Beena Unni, 2016
Chapter 4.Characteristic features of ultrathin polymer residual layer
studied by rinsing with different solvents.
137
[50] G. Reiter, “Dewetting of thin polymer films,” Phys. Rev. Lett., vol. 68, no. 1, pp. 75–78,
Jan. 1992.
[51] A. Sharma and R. Khanna, “Pattern Formation in Unstable Thin Liquid Films,” Phys. Rev.
Lett., vol. 81, no. 16, pp. 3463–3466, 1998.
[52] H. D. Ackler, R. H. French, and Y.-M. Chiang, “Comparisons of Hamaker constants for
ceramic systems with intervening vacuum or water: From force laws and physical
properties,” J. Colloid Interface Sci., vol. 179, pp. 460–469, 1996.
[53] L. Bergström, “Hamaker constants of inorganic materials,” Adv. Colloid Interface Sci.,
vol. 70, pp. 125–169, 1997.
[54] J. N. Israelachvili, Intermolecular and surface forces. Academic Press London, 1991.
[55] H. Zhao, Y. J. Wang, and O. K. C. Tsui, “Dewetting induced by complete versus
nonretarded van der Waals forces.,” Langmuir, vol. 21, no. 13, pp. 5817–24, Jun. 2005.
[56] D. B. Hough and L R. White, “The calculation of hamaker constants from liftshitz theory
with applications to wetting phenomena,” Adv. Colloid Interface Sci., vol. 14, no. 1, pp. 3–
41, 1980.
[57] T. Kerle, R. Yerushalmi-Rozen, J. Klein, and L. J. Fetters, “van der Waals stable thin
liquid films : Correlated undulations and ultimate dewetting,” Eur. Lett., vol. 44, no. 4, pp.
484–490, 1998.
[58] A. Sharma and G. Reiter, “Instability of Thin Polymer Films on Coated Substrates:
Rupture, Dewetting, and Drop Formation,” J. Colloid Interface Sci., vol. 178, no. 2, pp.
383–399, 1996.
[59] C. J. Van Oss, M. K. Chaudhury, and R. J. Good, “Interfacial Lifshitz-van der Waals and
polar interactions in macroscopic systems,” Chem. Rev., vol. 88, no. 6, pp. 927–941, 1988.
[60] A. Sharma and R. Khanna, “Pattern formation in unstable thin liquid films under the
influence of antagonistic short- and long-range forces.,” J. Chem. Phys., vol. 110, no. 10,
pp. 4929–4936, 1999.
Structuration and glass transition temperature of the adsorbed polymer layer : some insights in the property deviations of the ultra-thin polymer film Aparna Beena Unni, 2016

Chapter 4.Characteristic features of ultrathin polymer residual layer
studied by rinsing with different solvents.
138
[61] L. Xue and Y. Han, “Pattern formation by dewetting of polymer thin film,” Prog. Polym.
Sci., vol. 36, no. 2, pp. 269–293, 2011.
[62] Y. Li, J. Q. Pham, K. P. Johnston, and P. F. Green, “Contact Angle of Water on
Polystyrene Thin Films : Effects of CO 2 Environment and Film Thickness,” Langmuir,
vol. 23, pp. 9785–9793, 2007.
Structuration and glass transition temperature of the adsorbed polymer layer : some insights in the property deviations of the ultra-thin polymer film Aparna Beena Unni, 2016
Chapter 5. Stability and glass transition temperature of residual films on H-Si wafers
139
Chapter 5. Stability and glass transition
temperature of residual films on H-Si wafers
Summary
After the discussions about the polymer residual layer and its extraction in the previous chapters,
this chapter is mainly dedicated to the study of glass transition behavior of the polymer residual
layers. The thickness, morphology, stability etc. of the residual layers which are obtained by
means of rinsing with four different solvents are analyzed, which is then followed by the analysis
of glass transition properties by means of spectroscopic ellipsometry.
Structuration and glass transition temperature of the adsorbed polymer layer : some insights in the property deviations of the ultra-thin polymer film Aparna Beena Unni, 2016
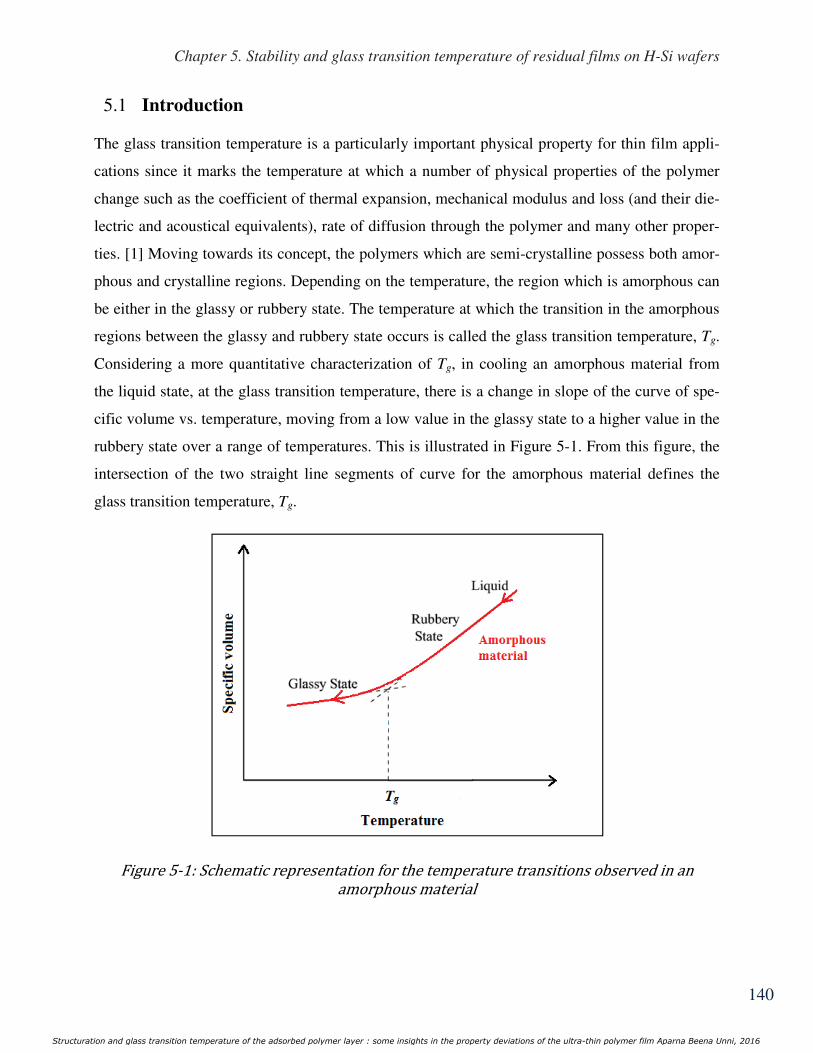
Chapter 5. Stability and glass transition temperature of residual films on H-Si wafers
140
5.1 Introduction
The glass transition temperature is a particularly important physical property for thin film appli-
cations since it marks the temperature at which a number of physical properties of the polymer
change such as the coefficient of thermal expansion, mechanical modulus and loss (and their die-
lectric and acoustical equivalents), rate of diffusion through the polymer and many other proper-
ties. [1] Moving towards its concept, the polymers which are semi-crystalline possess both amor-
phous and crystalline regions. Depending on the temperature, the region which is amorphous can
be either in the glassy or rubbery state. The temperature at which the transition in the amorphous
regions between the glassy and rubbery state occurs is called the glass transition temperature, Tg.
Considering a more quantitative characterization of Tg, in cooling an amorphous material from
the liquid state, at the glass transition temperature, there is a change in slope of the curve of spe-
cific volume vs. temperature, moving from a low value in the glassy state to a higher value in the
rubbery state over a range of temperatures. This is illustrated in Figure 5-1. From this figure, the
intersection of the two straight line segments of curve for the amorphous material defines the
glass transition temperature, Tg.
Figure 5-1: Schematic representation for the temperature transitions observed in an amorphous material
Structuration and glass transition temperature of the adsorbed polymer layer : some insights in the property deviations of the ultra-thin polymer film Aparna Beena Unni, 2016

Chapter 5. Stability and glass transition temperature of residual films on H-Si wafers
141
Here we study polymer residual layers, which are supported thin films confined by their thick-
ness. When the polymer films are confined by their thickness, their glass transition temperature
nature remains elusive. In presence of a substrate, the film is considered to have a gradient of
mobility along the confinement dimension, which is well explained by a trilayer model which
consists of a liquid like free surface region, a reduced mobility layer near the substrate and a bulk
like layer in between. [2], [3] Various studies reported that the Tg is reduced in the proximity of
the free surface, whereas an increased Tg is reported near the adsorbing interface due to the slow
molecular motion.[4]–[6] So the Tg shifts observed in thin films can be generally interpreted in
terms of the combined influences of the substrate and free surface. [7], [8] Focusing on the resid-
ual polymer adsorbed to the substrate, it is found to have a significant influence in the film Tg. An
increase in Tg is widely reported for polymers exhibiting strong attractive interactions with the
substrate when film thickness decreases below a critical value. [4], [9]–[17] On the other hand,
decrease in Tg is observed for polymers lacking such attractive interactions with the substrate.
[18]–[22] The neutron reflectivity studies on polycarbonate films less than 20 nm resulted in ele-
vated Tg, which points to the fact that the dynamics of the adsorbed polymer chains in the direc-
tion normal to the film surface is strongly hindered even above temperature greater than Tg. [23]
Apart from this, the residual layer is found to be the reason for the existence of an increase in the
local viscosity while approaching the substrate. Various studies showed that the segmental mobil-
ity is enhanced near the proximity of the irreversibly adsorbed polymer layer.[24]–[28] An in-
creased film density was reported near the substrate polymer interface in recent simulations,[29]
which is matching with the results obtained by ellipsometry [30] and X ray reflectivity. [31] It is
also evidenced that the crystalline structure of film is controlled by the polymer substrate inter-
face. [32], [33] So, as the study about the polymer residual layer being significant, it is interesting
to know how one can obtain the details of the same. Along with many studies that probed the
substrate interface effects within the supported polymer thin film based on the concept of multi-
layer structuration, [2]–[4], [13], [18], [34] many studies were done exclusively on the residual
layer by removing the bulk and surface layer of film, which revealed various properties and in-
fluence of residual layer in the system. In such cases, usually the residual layer is revealed (re-
moving bulk and surface layers) by means of rinsing with a good solvent as proposed by Guisel-
in, who found that the polymer chains adsorbed on the substrate are retained after rinsing sup-
ported thin film with a good solvent. [35]–[39]
Structuration and glass transition temperature of the adsorbed polymer layer : some insights in the property deviations of the ultra-thin polymer film Aparna Beena Unni, 2016

Chapter 5. Stability and glass transition temperature of residual films on H-Si wafers
142
The significance of selecting the solvents for such extraction of residual layer is discussed in the
previous chapter. [40] A recent study by Gin et. al throws light on the fact that the adsorbed lay-
ers are composed of the two different nano architectures: flattened chains that constitute the inner
higher density region of the adsorbed layers and loosely adsorbed polymer chains that form the
outer bulk like density region. [31] A later study from the same group on the flattening process
of polymer chains postulated that increasing the number of surface-segmental contacts (i.e., en-
thalpic gain) is the driving force for the flattening process of the polymer chains, even onto a
weakly interactive solid to overcome the conformational entropy loss in the total free energy. [41]
Studies done on the kinetics of irreversible adsorption showed two adsorption regimes based on
the time evolution of adsorbed layer thickness that is linear at short times and logarithmic at
longer times, separated by a temperature independent crossover thickness and a molecular weight
independent crossover time. [42] The study on the distribution of glass transition temperatures
and dielectric relaxation strength inside ultrathin polymer films based on the residual layer
proved that the chain organization and its evolution upon annealing are key parameters in ration-
alizing the thermal properties of polymer layers at interface. [43] Even if numerous studies that
investigated the details of polymer residual layer exist, a pivotal parameter which is less under-
stood from literature is the glass transition behavior of the polymer residual layer. Among the
existing reports, no significant changes in the thickness of flattened layer were observed with the
temperature XR experiments up to 200 °C for polymers such as P2VP, PS and PMMA. [38] On
contrary, modulated thermal gravimetric analysis of PMMA films resulted in a single transition
for bulk and broader two-component transitions for the adsorbed polymer layer. [44] A recent
study by the florescence bilayer method also found a substantial reduction in Tg as compared to
bulk due to the influence of the free surface. They could recover the bulk Tg on a time scale re-
flecting the degree of adsorption, by submerging the adsorbed layer by the deposition of an addi-
tional layer above the residual layer. [45] Considering the existing disparity in the reported resid-
ual layer Tg, the prime objective of this chapter is to investigate the glass transition behavior of
polystyrene residual layers on silicon (Si) wafer, addressing the uncertainty, whether the residual
layer is mobile or not ?
Structuration and glass transition temperature of the adsorbed polymer layer : some insights in the property deviations of the ultra-thin polymer film Aparna Beena Unni, 2016
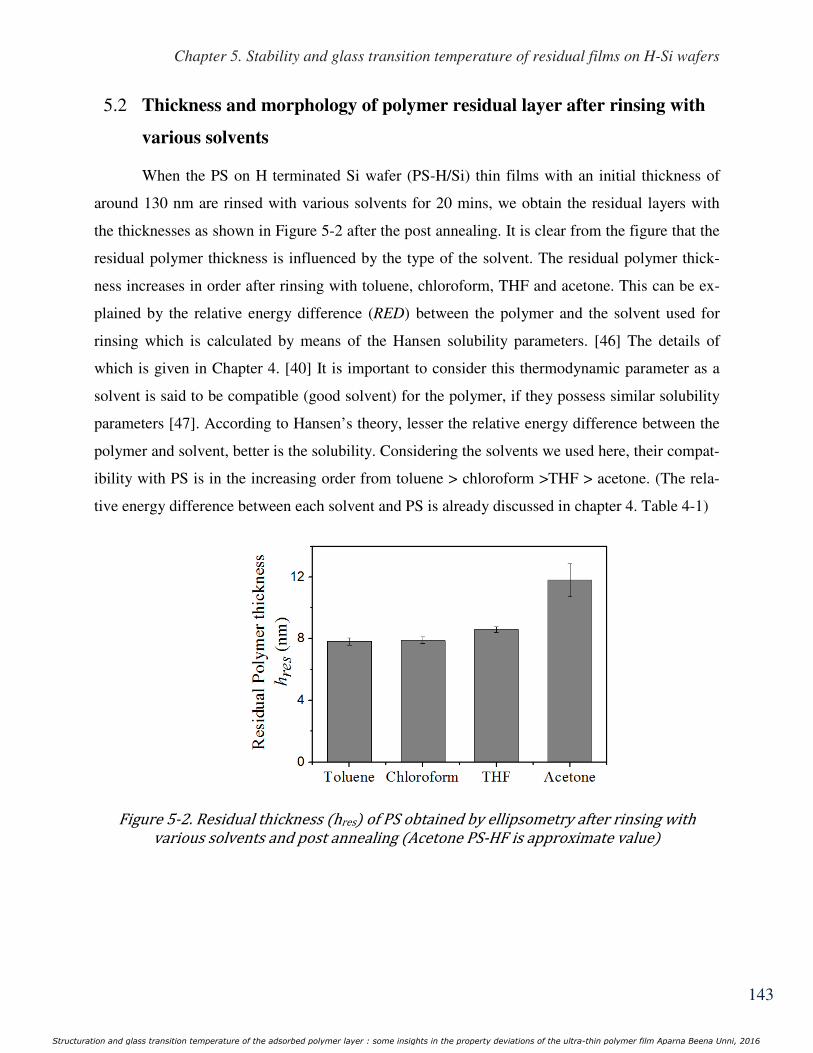
Chapter 5. Stability and glass transition temperature of residual films on H-Si wafers
143
5.2 Thickness and morphology of polymer residual layer after rinsing with
various solvents
When the PS on H terminated Si wafer (PS-H/Si) thin films with an initial thickness of
around 130 nm are rinsed with various solvents for 20 mins, we obtain the residual layers with
the thicknesses as shown in Figure 5-2 after the post annealing. It is clear from the figure that the
residual polymer thickness is influenced by the type of the solvent. The residual polymer thick-
ness increases in order after rinsing with toluene, chloroform, THF and acetone. This can be ex-
plained by the relative energy difference (RED) between the polymer and the solvent used for
rinsing which is calculated by means of the Hansen solubility parameters. [46] The details of
which is given in Chapter 4. [40] It is important to consider this thermodynamic parameter as a
solvent is said to be compatible (good solvent) for the polymer, if they possess similar solubility
parameters [47]. According to Hansen’s theory, lesser the relative energy difference between the
polymer and solvent, better is the solubility. Considering the solvents we used here, their compat-
ibility with PS is in the increasing order from toluene > chloroform >THF > acetone. (The rela-
tive energy difference between each solvent and PS is already discussed in chapter 4. Table 4-1)
Figure 5-2. Residual thickness hres of PS obtained by ellipsometry after rinsing with various solvents and post annealing Acetone PS-HF is approximate value
Structuration and glass transition temperature of the adsorbed polymer layer : some insights in the property deviations of the ultra-thin polymer film Aparna Beena Unni, 2016
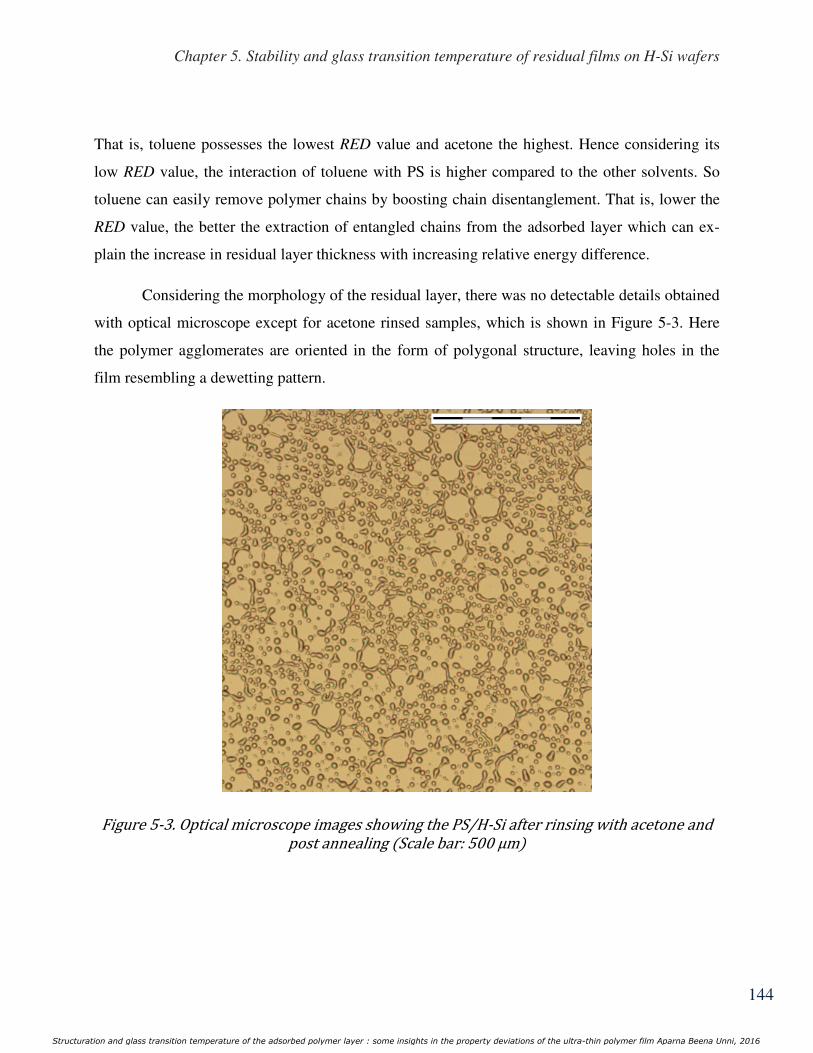
Chapter 5. Stability and glass transition temperature of residual films on H-Si wafers
144
That is, toluene possesses the lowest RED value and acetone the highest. Hence considering its
low RED value, the interaction of toluene with PS is higher compared to the other solvents. So
toluene can easily remove polymer chains by boosting chain disentanglement. That is, lower the
RED value, the better the extraction of entangled chains from the adsorbed layer which can ex-
plain the increase in residual layer thickness with increasing relative energy difference.
Considering the morphology of the residual layer, there was no detectable details obtained
with optical microscope except for acetone rinsed samples, which is shown in Figure 5-3. Here
the polymer agglomerates are oriented in the form of polygonal structure, leaving holes in the
film resembling a dewetting pattern.
Figure 5-3. Optical microscope images showing the PS/H-Si after rinsing with acetone and post annealing Scale bar: 500 µm
Structuration and glass transition temperature of the adsorbed polymer layer : some insights in the property deviations of the ultra-thin polymer film Aparna Beena Unni, 2016
Chapter 5. Stability and glass transition temperature of residual films on H-Si wafers
145
The measured height of the agglomerated polymer is in the range of 400 nm to 1µm. In this case,
the acetone molecules readily diffuses and saturates the PS film, reducing the glass transition
temperature of the polymer below the room temperature and thereby rendering it mobile for
reorganization. [48] Being a polar solvent, acetone can additionally induce a strong destabilizing
electrostatic force. [49] The rapid polymer dissolution favoured by good solvents make the
polymer reorganization undetectable by the optical microscope.
As highligthed by Lee et al [50] in a similar system, this kind of rim instability is the sign of
dewetting induced mainly by the solvent polarity which is a type II rim instability in which the
rim undulation leads to finger formation followed by breaking of these fingers into droplets. It is
also pertinent that the thermally annealed thin polymer films that are stable on higher energy
substrates owing to stabilizing repulsive van der Waals force can be made unstable at room
temperature by contact with vapor of a poor solvent and to a much greater extent, by immersing
them in the same liquid solvent. [48], [51] A recent study by Al-Khayat et. al. also reported that
the PS films dewetted readily in a mixture of the vapor of a good solvent and a nonsolvent
compared to a dewetting solely by good solvent. [52] Similar studies could even find some
practical application, for example, to fabricate submicron droplets and arrays by the dewetting of
ultrathin PS using strong polar solvents, overcoming the weak destabilizing Lifshitz−van der
Waals forces and the high surface energy penalty required for deformations on small scales. [53]
Thus the unique dewetting patteren observed for the sample rinsed with acetone is due to the
solvant polarity and the low dissolution of polymer.
In order to characterize the residual layer remaining after rinsing with other solvents, we em-
ployed AFM imaging. In case of acetone, (Figure 5-4, d ) the AFM image represents the topogra-
phy inside the hole of dewetted PS film. (That is the bound polymer inside the hole, which is ob-
tained by means of rinsing with a poor solvent is investigated) The polystyrene remaining on H-
Si substrate is devoid of any specific features. It seems to be stable irrespective of the solvent
used for rinsing.
Structuration and glass transition temperature of the adsorbed polymer layer : some insights in the property deviations of the ultra-thin polymer film Aparna Beena Unni, 2016

Chapter 5. Stability and glass transition temperature of residual films on H-Si wafers
146
Figure 5-4. AFM images of PS/H-Si after rinsing with solvents a toluene, b chloroform, c THF and d acetone and post annealing. Scan size 5x5 µm2 . Inset shows the surface profiles which scales from 0-1.4 nm. 5.3 The stability/instability of polymer residual layer analyzed with Van der
Waals - intermolecular theory
The stability of films is often discussed in terms of the effective interfacial potential of the sys-
tem, which is the excess free energy per unit area to bring two interfaces from infinity to a specif-
ic distance, h. The distance h defines the thickness of the liquid layer separating the two interfac-
es. The sign of second derivative of the interfacial potential indicates whether the film is stable
(∆F″(h) > 0) or dewets spontaneously (∆F″(h) < 0). [54] That effective free energy of a system
can be represented as follows,
∆F(h) = ∆FLW(h) + ∆FAB(h) + c/h8 5-1
Structuration and glass transition temperature of the adsorbed polymer layer : some insights in the property deviations of the ultra-thin polymer film Aparna Beena Unni, 2016
Chapter 5. Stability and glass transition temperature of residual films on H-Si wafers
147
where ∆FLW (h) represents the long-range interactions by the Lifshitz-van der Waals potential ,
∆FAB(h) represents the polar contribution by the acid-base interactions in the system and the last
term includes short-range electrostatic repulsion of strength ‘c’. The Lifshitz-van der Waals com-
ponent, ∆FLW(h) can be written as follows,
∆FLW(h)
−=
)²(12//
h
A SolventPSSi
π
5-2
where ASi/PS/Solvent is the effective Hamaker constants of the Si/PS/Solvent and 3 layer system. The
contribution by short range polar interactions, can be expressed as
∆FAB(h) =Sp exp ((dmin – h)/É) 5-3
where SP is the polar component of spreading coefficient and exp((dmin – h)/l) stands for the decay
function describing the short range of the polar interactions with the correlation length l. The de-
cay function for the polar interactions satisfies the relation exp((dmin – h)/l) = 1 at a cutoff dmin and
is 0 at large distances. For polymer l can be taken as 2.5 nm. [55]
In our case, the films are immersed in solvents which is capable of removing the non-adsorbed
chains and thus reducing the film thickness and thereby stability. i.e. the film instability is accel-
erated compared to condition when the film is situated in air medium. Form our previous study in
chapter 4, the PS/SiOx-Si is unstable and it spinodally dewets at different thicknesses with re-
spect to the type of solvent used. [40] Hence it is interesting to see what happens when the PS/H-
Si is in contact with various solvents. Figure 5-5 shows the effective interfacial potential and its
second derivative as a function of the film thickness which is plotted using the parameters listed
in Table 5-1. From the ∆F(h) curve, it possess both positive and negative values which points to
the fact that the system is unstable for small film thicknesses whereas metastable for larger film
thicknesses. [56], [57] Apart from the film rinsed with toluene, from the second derivative of
interfacial potential, the films undergo spinodal dewetting under a thickness of ~7nm. (For PS/H-
Si, the residual thickness values we obtained are 7.83, 7.9, 8.62 and 11.8 nm respectively. That is
none of the films are supposed to dewet spinodally above 7 nm, which is in line with our experi-
mental observation.
Structuration and glass transition temperature of the adsorbed polymer layer : some insights in the property deviations of the ultra-thin polymer film Aparna Beena Unni, 2016

Chapter 5. Stability and glass transition temperature of residual films on H-Si wafers
148
Another point to be noted in theoretical simulation is that, irrespective of the thickness, the tolu-
ene rinsed films are stable and the instability is accelerated by the increasing polarity of solvents.
This is also in agreement with the topography of the toluene rinsed PS/H-Si (Figure 5-4, ii, a).
Even if there is no spinodal dewetting pattern observed for rest of samples (Figure 5-4, ii, b, c and
d), some random hole initiations can be observed, which is not surprising as their thickness lies in
the border line of transition from positive to negative considering the second derivative of inter-
facial potential. At this stage, it is also to be remembered that the solvent polarity can accelerate
the instability. [58]
Figure 5-5. Simulation of a the effective interfacial potential ∆F and b its second derivative ∆F’’ as a function of PS film thickness ‘h’ for PS/H-Si. The effective free energy takes into account the effective contribution of the Lifshitz-van der Waals ∆FLWand of the polar ∆FP components as well as the steric repulsion energy c/hα.
Structuration and glass transition temperature of the adsorbed polymer layer : some insights in the property deviations of the ultra-thin polymer film Aparna Beena Unni, 2016
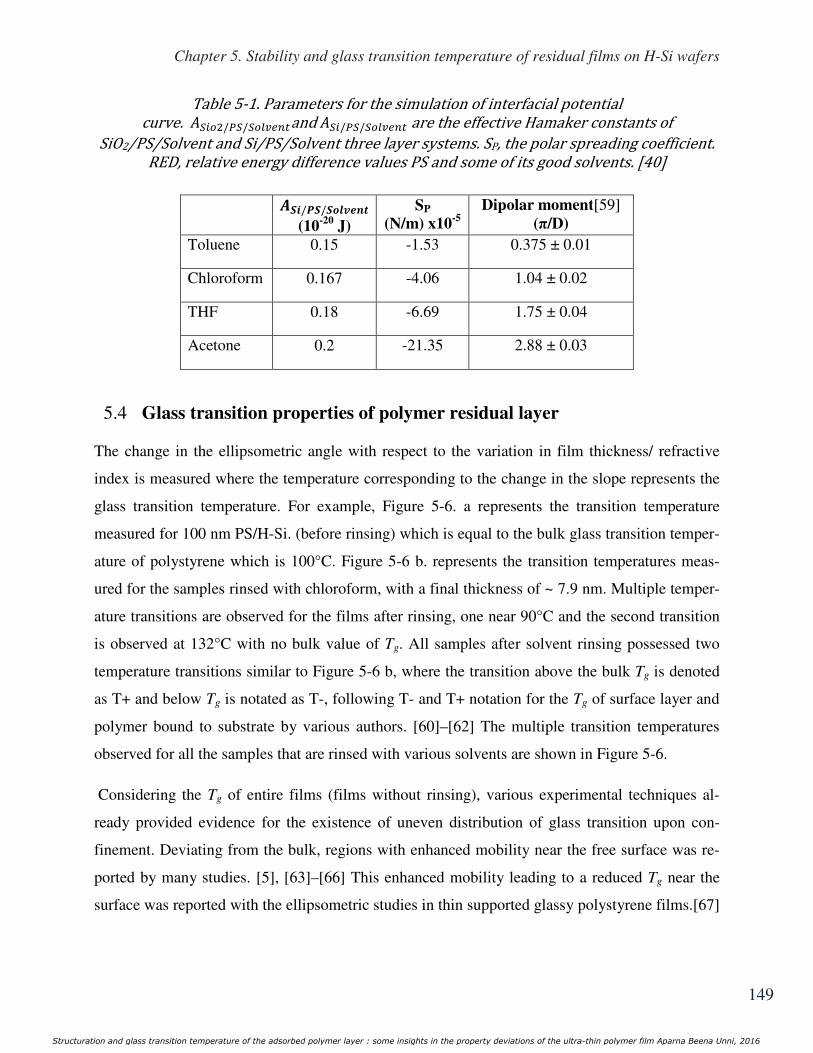
Chapter 5. Stability and glass transition temperature of residual films on H-Si wafers
149
Table 5-1. Parameters for the simulation of interfacial potential curve. %Seb2/IS/Sb½,dand %Se/IS/Sb½,d are the effective Hamaker constants of SiO2/PS/Solvent and Si/PS/Solvent three layer systems. SP, the polar spreading coefficient. RED, relative energy difference values PS and some of its good solvents. [40] ÒËÓ/ÕË/ËÌÍÎÏÐÑ
(10-20
J)
SP
(N/m) x10-5
Dipolar moment[59] (π/D)
Toluene 0.15 -1.53 0.375 ± 0.01
Chloroform 0.167 -4.06 1.04 ± 0.02
THF 0.18 -6.69 1.75 ± 0.04
Acetone 0.2 -21.35 2.88 ± 0.03
5.4 Glass transition properties of polymer residual layer
The change in the ellipsometric angle with respect to the variation in film thickness/ refractive
index is measured where the temperature corresponding to the change in the slope represents the
glass transition temperature. For example, Figure 5-6. a represents the transition temperature
measured for 100 nm PS/H-Si. (before rinsing) which is equal to the bulk glass transition temper-
ature of polystyrene which is 100°C. Figure 5-6 b. represents the transition temperatures meas-
ured for the samples rinsed with chloroform, with a final thickness of ~ 7.9 nm. Multiple temper-
ature transitions are observed for the films after rinsing, one near 90°C and the second transition
is observed at 132°C with no bulk value of Tg. All samples after solvent rinsing possessed two
temperature transitions similar to Figure 5-6 b, where the transition above the bulk Tg is denoted
as T+ and below Tg is notated as T-, following T- and T+ notation for the Tg of surface layer and
polymer bound to substrate by various authors. [60]–[62] The multiple transition temperatures
observed for all the samples that are rinsed with various solvents are shown in Figure 5-6.
Considering the Tg of entire films (films without rinsing), various experimental techniques al-
ready provided evidence for the existence of uneven distribution of glass transition upon con-
finement. Deviating from the bulk, regions with enhanced mobility near the free surface was re-
ported by many studies. [5], [63]–[66] This enhanced mobility leading to a reduced Tg near the
surface was reported with the ellipsometric studies in thin supported glassy polystyrene films.[67]
Structuration and glass transition temperature of the adsorbed polymer layer : some insights in the property deviations of the ultra-thin polymer film Aparna Beena Unni, 2016

Chapter 5. Stability and glass transition temperature of residual films on H-Si wafers
150
The segmental motion at the substrate interface is reported to follow a slower dynamics com-
pared to the bulk [23], [24], [36], [68], [69] and the study on the long range effects on the poly-
mer diffusion induced by a bounding interface found that the Tg is increased near such walls. [70]
The interface and surface effects on the glass transition in thin polystyrene films studied by PALS
measurement in a three layer model found that the entire film may not be characterized as having
only one value of Tg which later lead to the proposal of a three-layer model in which, within thin
films there are three layers with different mobilities and glass transition temperatures. [2]
Figure 5-6. Raw ellipsometric curves showing Δ as function of temperature for a PS/H-Si 100 nm measured at 2.75 eV b PS/H-Si ~ 7.9 nm after chloroform rinsing and post annealing.
Structuration and glass transition temperature of the adsorbed polymer layer : some insights in the property deviations of the ultra-thin polymer film Aparna Beena Unni, 2016
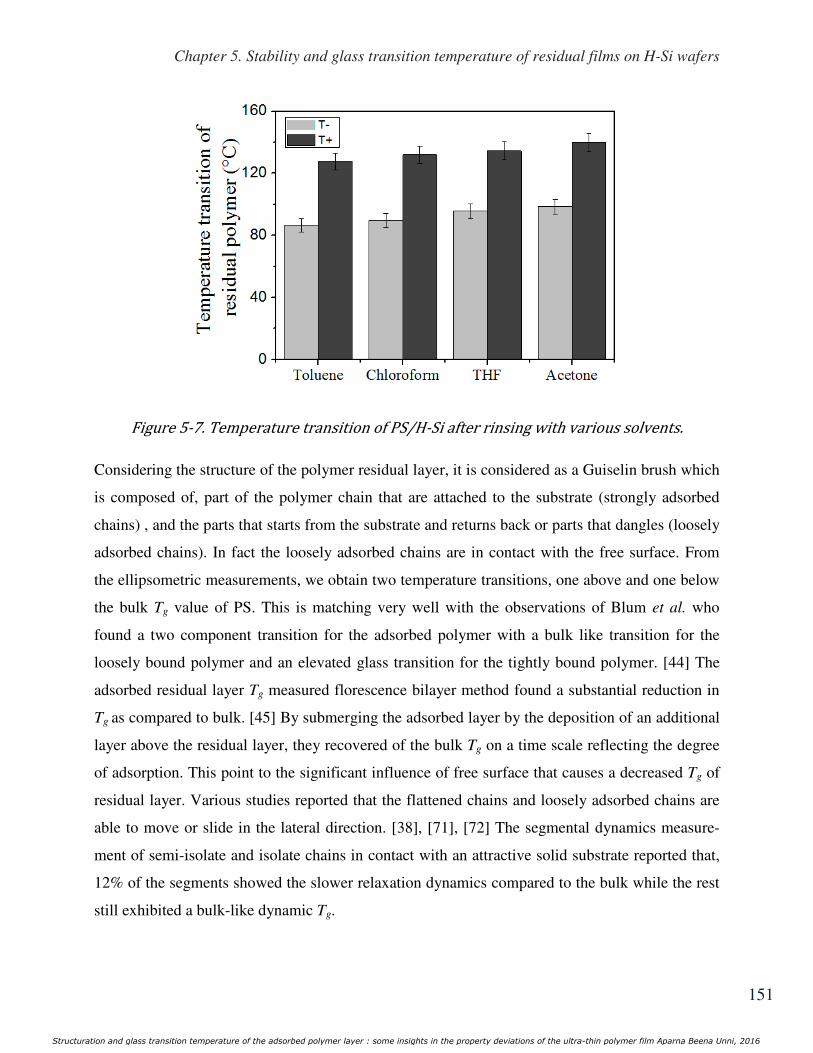
Chapter 5. Stability and glass transition temperature of residual films on H-Si wafers
151
Figure 5-7. Temperature transition of PS/H-Si after rinsing with various solvents. Considering the structure of the polymer residual layer, it is considered as a Guiselin brush which
is composed of, part of the polymer chain that are attached to the substrate (strongly adsorbed
chains) , and the parts that starts from the substrate and returns back or parts that dangles (loosely
adsorbed chains). In fact the loosely adsorbed chains are in contact with the free surface. From
the ellipsometric measurements, we obtain two temperature transitions, one above and one below
the bulk Tg value of PS. This is matching very well with the observations of Blum et al. who
found a two component transition for the adsorbed polymer with a bulk like transition for the
loosely bound polymer and an elevated glass transition for the tightly bound polymer. [44] The
adsorbed residual layer Tg measured florescence bilayer method found a substantial reduction in
Tg as compared to bulk. [45] By submerging the adsorbed layer by the deposition of an additional
layer above the residual layer, they recovered of the bulk Tg on a time scale reflecting the degree
of adsorption. This point to the significant influence of free surface that causes a decreased Tg of
residual layer. Various studies reported that the flattened chains and loosely adsorbed chains are
able to move or slide in the lateral direction. [38], [71], [72] The segmental dynamics measure-
ment of semi-isolate and isolate chains in contact with an attractive solid substrate reported that,
12% of the segments showed the slower relaxation dynamics compared to the bulk while the rest
still exhibited a bulk-like dynamic Tg.
Structuration and glass transition temperature of the adsorbed polymer layer : some insights in the property deviations of the ultra-thin polymer film Aparna Beena Unni, 2016

Chapter 5. Stability and glass transition temperature of residual films on H-Si wafers
152
The molecular dynamics stimulations showed that the segmental dynamics is slower for the stiff-
er chains that are bound to the substrate (trains), compared to the unadsorbed segments that in-
cludes the loops and tails. [73] Hence one can conclude that the elevated Tg observed for the
chains pinned to the substrate and T- is from the unadsorbed polymer segments. This observation
can be schematically represented as shown in Figure 5-8. Here a supported thin film with a multi-
layer Tg distribution after rinsing with a good solvent is found to have the temperature transitions
below and above the bulk Tg value.
Figure 5-8. Schematic representation of the effect of solvent rinsing on the supported thin film and transition temperature Considering the effect of solvent in the Tg of the residual layer, It can be seen that both T- and
T+ of the residual layer increases slightly, in order from toluene to acetone as shown in Figure
5-7. We hypothesize this observation with respect to the RED. That is the Tg increases with the
increasing relative energy difference between the polymer and the solvent. As the relative energy
difference increases, the ability of the solvent to extract the adsorbed polymer chains decreases
resulting in the increased thickness of the residual layer due to presence of more non-desorbed
chains. In case of PS, a number of experiments already showed that the Tg increases with the film
thickness. [74] Apart from this, the increased Tg can also have a contribution from the increased
polymer substrate interaction. [11], [75], [76] Thus the thickness of residual layer which is de-
pendent on the quality of solvent used for its extraction is found have spectacular influence on the
glass transition properties of polymer residual layer.
Structuration and glass transition temperature of the adsorbed polymer layer : some insights in the property deviations of the ultra-thin polymer film Aparna Beena Unni, 2016
Chapter 5. Stability and glass transition temperature of residual films on H-Si wafers
153
5.5 Conclusion
The residual layers of polystyrene on the H-terminated wafers, after rinsing with various solvents
are devoid of spinodal dewetting at a thickness above 7 nm. In case of rinsing with a polar sol-
vent like acetone, the residual layer undergoes dewetting at a microscopic scale. Unlike the glass
transition behavior of bulk polymer, two temperature transitions were observed for the residual
polymer layer, one above and one below the bulk Tg value of polymer. This elevated temperature
transition observed can be attributed to the chains pinned to the substrate whereas the temperature
transition observed below the bulk Tg can have its origin from the unadsorbed polymer segments
in contact with the free surface.
Structuration and glass transition temperature of the adsorbed polymer layer : some insights in the property deviations of the ultra-thin polymer film Aparna Beena Unni, 2016

Chapter 5. Stability and glass transition temperature of residual films on H-Si wafers
154
REFERENCES
[1] L. Singh, “Effect of nanoscale confinement on the physical properties of polymer thin
films,” Georgia Institute of Technology, 2004.
[2] G. DeMaggio, W. Frieze, D. Gidley, M. Zhu, H. Hristov, and a. Yee, “Interface and
Surface Effects on the Glass Transition in Thin Polystyrene Films,” Phys. Rev. Lett., vol.
78, no. 8, pp. 1524–1527, Feb. 1997.
[3] K. Fukao and Y. Miyamoto, “Glass transitions and dynamics in thin polymer films:
dielectric relaxation of thin films of polystyrene,” Phys. Rev. E. Stat. Phys. Plasmas.
Fluids. Relat. Interdiscip. Topics, vol. 61, no. 2, pp. 1743–54, Feb. 2000.
[4] R. D. Priestley, C. J. Ellison, L. J. Broadbelt, and J. M. Torkelson, “Structural relaxation of
polymer glasses at surfaces, interfaces, and in between.,” Science, vol. 309, no. 5733, pp.
456–9, Jul. 2005.
[5] Z. Fakhraai and J. A. Forrest, “Measuring the surface dynamics of glassy polymers.,”
Science, vol. 319, pp. 600–604, 2008.
[6] M. D. Ediger and J. A. Forrest, “Dynamics near Free Surfaces and the Glass Transition in
Thin Polymer Films: A View to the Future,” Macromolecules, vol. 47, pp. 471–478, 2014.
[7] J. A. Forrest and K. Dalnoki-Veress, “The glass transition in thin polymer films,” Adv.
Colloid Interface Sci., vol. 94, pp. 167–196, 2001.
[8] R. P. White, C. C. Price, and J. E. G. Lipson, “Effect of Interfaces on the Glass Transition
of Supported and Freestanding Polymer Thin Films,” Macromolecules, vol. 48, no. 12, pp.
4132–4141, Jun. 2015.
[9] C. J. Ellison and J. M. Torkelson, “Sensing the glass transition in thin and ultrathin
polymer films via fluorescence probes and labels,” J. Polym. Sci. Part B Polym. Phys., vol.
40, no. 24, pp. 2745–2758, Dec. 2002.
Structuration and glass transition temperature of the adsorbed polymer layer : some insights in the property deviations of the ultra-thin polymer film Aparna Beena Unni, 2016
Chapter 5. Stability and glass transition temperature of residual films on H-Si wafers
155
[10] J. L. Keddie, R. A. L. Jones, and R. A. Cory, “Interface and surface effects on the glass-
transition temperature in thin polymer films,” Faraday Discuss., vol. 98, pp. 219–230,
1994.
[11] J. van Zanten, W. Wallace, and W. Wu, “Effect of strongly favorable substrate interactions
on the thermal properties of ultrathin polymer films,” Physical Review E, vol. 53. pp.
R2053–R2056, 1996.
[12] Y. Grohens, L. Hamon, G. Reiter, a. Soldera, and Y. Holl, “Some relevant parameters
affecting the glass transition of supported ultra-thin polymer films,” Eur. Phys. J. E, vol. 8,
no. 2, pp. 217–224, May 2002.
[13] D. S. Fryer, R. D. Peters, E. J. Kim, J. E. Tomaszewski, J. J. de Pablo, P. F. Nealey, C. C.
White, and W. Wu, “Dependence of the Glass Transition Temperature of Polymer Films
on Interfacial Energy and Thickness,” Macromolecules, vol. 34, no. 16, pp. 5627–5634,
Jul. 2001.
[14] C. H. Park, J. H. Kim, M. Ree, B.-H. Sohn, J. C. Jung, and W.-C. Zin, “Thickness and
composition dependence of the glass transition temperature in thin random copolymer
films,” Polymer., vol. 45, no. 13, pp. 4507–4513, Jun. 2004.
[15] M. K. Mundra, C. J. Ellison, P. Rittigstein, and J. M. Torkelson, “Fluorescence studies of
confinement in polymer films and nanocomposites: Glass transition temperature,
plasticizer effects, and sensitivity to stress relaxation and local polarity,” Eur. Phys. J.
Spec. Top., vol. 141, no. 1, p. 143, 2007.
[16] C. J. Ellison, S. D. Kim, D. B. Hall, and J. M. Torkelson, “Confinement and processing
effects on glass transition temperature and physical aging in ultrathin polymer films: novel
fluorescence measurements.,” Eur. Phys. J. E. Soft Matter, vol. 8, no. 2, pp. 155–66, May
2002.
Structuration and glass transition temperature of the adsorbed polymer layer : some insights in the property deviations of the ultra-thin polymer film Aparna Beena Unni, 2016
Chapter 5. Stability and glass transition temperature of residual films on H-Si wafers
156
[17] R. D. Priestley, L. J. Broadbelt, and J. M. Torkelson, “Physical Aging of Ultrathin Polymer
Films above and below the Bulk Glass Transition Temperature: Effects of Attractive vs
Neutral Polymer−Substrate Interactions Measured by Fluorescence,” Macromolecules, vol.
38, no. 3, pp. 654–657, Feb. 2005.
[18] C. J. Ellison and J. M. Torkelson, “The distribution of glass-transition temperatures in
nanoscopically confined glass formers.,” Nat. Mater., vol. 2, no. 10, pp. 695–700, Oct.
2003.
[19] J. L. Keddie, R. A. L. Jones, and R. A. Cory, “Size-Dependent Depression of the Glass
Transition Temperature in Polymer Films .,” Europhys. Lett., vol. 27, no. July, pp. 59–64,
1994.
[20] S. Kawana and R. A. L. Jones, “Character of the glass transition in thin supported polymer
films,” Phys. Rev. E, vol. 63, no. 2, p. 21501, 2001.
[21] J. S. Sharp and J. A. Forrest, “Free Surfaces Cause Reductions in the Glass Transition
Temperature of Thin Polystyrene Films,” Phys. Rev. Lett., vol. 91, no. 23, p. 235701, Dec.
2003.
[22] F. L. Pratt, T. Lancaster, M. L. Brooks, S. J. Blundell, T. Prokscha, E. Morenzoni, A.
Suter, H. Luetkens, R. Khasanov, R. Scheuermann, U. Zimmermann, K. Shinotsuka, and
H. E. Assender, “Surface dynamics of a thin polystyrene film probed by low-energy
muons,” Phys. Rev. B, vol. 72, no. 12, p. 121401, Sep. 2005.
[23] T. Koga, N. Jiang, P. Gin, M. K. Endoh, S. Narayanan, L. B. Lurio, and S. K. Sinha,
“Impact of an irreversibly adsorbed layer on local viscosity of nanoconfined polymer
melts,” Phys. Rev. Lett., vol. 107, no. 22, pp. 1–5, 2011.
[24] S. Napolitano and M. Wübbenhorst, “The lifetime of the deviations from bulk behaviour in
polymers confined at the nanoscale,” Nat. Commun., vol. 2, p. 260, Mar. 2011.
[25] S. Napolitano, C. Rotella, and M. Wübbenhorst, “Can Thickness and Interfacial
Interactions Univocally Determine the Behavior of Polymers Confined at the Nanoscale?,”
ACS Macro Lett., vol. 1, no. 10, pp. 1189–1193, Oct. 2012.
Structuration and glass transition temperature of the adsorbed polymer layer : some insights in the property deviations of the ultra-thin polymer film Aparna Beena Unni, 2016

Chapter 5. Stability and glass transition temperature of residual films on H-Si wafers
157
[26] S. Napolitano, A. Pilleri, P. Rolla, and M. Wübbenhorst, “Unusual Deviations from Bulk
Behavior in Ultrathin Films of Poly(tert-butylstyrene): Can Dead Layers Induce a
Reduction of Tg?,” ACS Nano, vol. 4, no. 2, pp. 841–848, Feb. 2010.
[27] C. E. Porter and F. D. Blum, “Thermal characterization of PMMA thin films using
modulated differential scanning calorimetry,” Macromolecules, vol. 33, no. 19, pp. 7016–
7020, 2000.
[28] F. D. Blum, W.-Y. Lin, and C. E. Porter, “Dynamics of adsorbed poly(methyl acrylate)
and poly(methyl methacrylate) on silica,” Colloid Polym. Sci., vol. 281, no. 3, pp. 197–
202, 2003.
[29] D. Hudzinskyy, A. V. Lyulin, A. R. C. Baljon, N. K. Balabaev, and M. A. J. Michels,
“Effects of strong confinement on the glass-transition temperature in simulated atactic
polystyrene films,” Macromolecules, vol. 44, no. 7, pp. 2299–2310, Apr. 2011.
[30] G. Vignaud, M. S. Chebil, J. K. Bal, N. Delorme, T. Beuvier, Y. Grohens, and A. Gibaud,
“Densification and Depression in Glass Transition Temperature in Polystyrene Thin
Films,” Langmuir, vol. 30, no. 39, pp. 11599–11608, 2014.
[31] P. Gin, N. Jiang, C. Liang, T. Taniguchi, B. Akgun, S. K. Satija, M. K. Endoh, and T.
Koga, “Revealed Architectures of Adsorbed Polymer Chains at Solid-Polymer Melt
Interfaces,” Phys. Rev. Lett., vol. 109, no. 26, p. 265501, Dec. 2012.
[32] M. Asada, N. Jiang, L. Sendogdular, P. Gin, Y. Wang, M. K. Endoh, T. Koga, M. Fukuto,
D. Schultz, M. Lee, X. Li, J. Wang, M. Kikuchi, and A. Takahara, “Heterogeneous
Lamellar Structures Near the Polymer/Substrate Interface,” Macromolecules, vol. 45, no.
17, pp. 7098–7106, Sep. 2012.
[33] B. Vanroy, M. Wübbenhorst, and S. Napolitano, “Crystallization of thin polymer layers
confined between two adsorbing walls,” ACS Macro Lett., vol. 2, no. 2, pp. 168–172, Feb.
2013.
Structuration and glass transition temperature of the adsorbed polymer layer : some insights in the property deviations of the ultra-thin polymer film Aparna Beena Unni, 2016

Chapter 5. Stability and glass transition temperature of residual films on H-Si wafers
158
[34] L. Zhang, R. Elupula, S. M. Grayson, and J. M. Torkelson, “Major Impact of Cyclic Chain
Topology on the T g -Confinement Effect of Supported Thin Films of Polystyrene,”
Macromolecules, vol. 49, pp. 257–268, 2015.
[35] C. J. Durning, B. O’Shaughnessy, U. Sawhney, D. Nguyen, J. Majewski, and G. S. Smith,
“Adsorption of poly(methyl methacrylate) melts on quartz,” Macromolecules, vol. 32, pp.
6772–6781, 1999.
[36] Y. Fujii, Z. Yang, J. Leach, H. Atarashi, K. Tanaka, and O. K. C. Tsui, “Affinity of
Polystyrene Films to Hydrogen-Passivated Silicon and Its Relevance to the T g of the
Films,” Macromolecules, vol. 42, no. 19, pp. 7418–7422, Oct. 2009.
[37] B. O’Shaughnessy and D. Vavylonis, “Non-equilibrium in adsorbed polymer layers,” J.
Phys. Condens. Matter, vol. 17, no. 2, p. R63, 2005.
[38] N. Jiang, J. Shang, X. Di, M. K. Endoh, and T. Koga, “Formation Mechanism of High-
Density, Flattened Polymer Nanolayers Adsorbed on Planar Solids,” Macromolecules, vol.
47, pp. 2682–2689, 2014.
[39] O. Guiselin, “Irreversible Adsorption of a Concentrated Polymer Solution,” Europhys.
Lett., vol. 17, pp. 225–230, 1992.
[40] A. Beena Unni, G. Vignaud, J. K. Bal, N. Delorme, T. Beuvier, S. Thomas, Y. Grohens,
and A. Gibaud, “Solvent Assisted Rinsing: Stability/Instability of Ultrathin Polymer
Residual Layer,” Macromolecules, vol. 49, no. 5, pp. 1807–1815, Feb. 2016.
[41] M. Sen, N. Jiang, J. Cheung, M. K. Endoh, T. Koga, D. Kawaguchi, and K. Tanaka,
“Flattening Process of Polymer Chains Irreversibly Adsorbed on a Solid,” ACS Macro
Lett., vol. 5, no. 4, pp. 504–508, 2016.
[42] C. Housmans, M. Sferrazza, and S. Napolitano, “Kinetics of irreversible chain adsorption,”
Macromolecules, vol. 47, pp. 3390–3393, 2014.
Structuration and glass transition temperature of the adsorbed polymer layer : some insights in the property deviations of the ultra-thin polymer film Aparna Beena Unni, 2016

Chapter 5. Stability and glass transition temperature of residual films on H-Si wafers
159
[43] C. Rotella, S. Napolitano, L. De Cremer, G. Koeckelberghs, and M. Wübbenhorst,
“Distribution of Segmental Mobility in Ultrathin Polymer Films,” Macromolecules, vol.
43, no. 20, pp. 8686–8691, Oct. 2010.
[44] F. D. Blum, E. N. Young, G. Smith, and O. C. Sitton, “Thermal Analysis of Adsorbed
Poly ( methyl methacrylate ) on Silica,” Langmuir, vol. 22, no. 10, pp. 4741–4744, 2006.
[45] M. J. Burroughs, S. Napolitano, D. Cangialosi, and R. D. Priestley, “Direct Measurement
of Glass Transition Temperature in Exposed and Buried Adsorbed Polymer Nanolayers,”
Macromolecules, vol. 49, no. 12, pp. 4647–4655, 2016.
[46] C. M. Hansen, Hansen Solubility Parameters, A User’s Hand book. Taylor & Francis,
2007.
[47] D. C. Sherrington, “Preparation, structure and morphology of polymer supports,” Chem.
Commun., no. 21, pp. 2275–2286, 1998.
[48] L. Xu, A. Sharma, and S. W. Joo, “Dewetting of stable thin polymer films induced by a
poor solvent: Role of polar interactions,” Macromolecules, vol. 45, pp. 6628–6633, 2012.
[49] R. Mukherjee and A. Sharma, “Instability, Self Organization and Pattern Formation in
Thin Soft Films,” Soft Matter, vol. 11, pp. 8718–8740, 2015.
[50] S. H. Lee, P. J. Yoo, S. J. Kwon, and H. H. Lee, “Solvent-driven dewetting and rim
instability,” J. Chem. Phys., vol. 121, no. 2004, pp. 4346–4351, 2004.
[51] L. Xu, A. Sharma, S. W. Joo, H. Liu, and T. Shi, “Unusual Dewetting of Thin Polymer
Films in Liquid Media Containing a Poor Solvent and a Nonsolvent,” Langmuir, vol. 30,
no. 49, pp. 14808–14816, Dec. 2014.
[52] O. Al-khayat, K. Geraghty, K. Shou, A. Nelson, and C. Neto, “Chain Collapse and
Interfacial Slip of Polystyrene Films in Good/ Nonsolvent Vapor Mixtures,”
Macromolecules, vol. 49, no. 4, pp. 1344–1352, 2016.
Structuration and glass transition temperature of the adsorbed polymer layer : some insights in the property deviations of the ultra-thin polymer film Aparna Beena Unni, 2016

Chapter 5. Stability and glass transition temperature of residual films on H-Si wafers
160
[53] A. Verma and A. Sharma, “Submicrometer pattern fabrication by intensification of
instability in ultrathin polymer films under a water-solvent mix,” Macromolecules, vol. 44,
no. 12, pp. 4928–4935, 2011.
[54] R. Seemann, S. Herminghaus, and K. Jacobs, “Gaining control of pattern formation of
dewetting liquid films,” J. Phys. Condens. Matter, vol. 13, no. 21, p. 4925, 2001.
[55] A. Sharma and R. Khanna, “Pattern Formation in Unstable Thin Liquid Films,” Phys. Rev.
Lett., vol. 81, no. 16, pp. 3463–3466, 1998.
[56] A. Sharma and R. Khanna, “Pattern formation in unstable thin liquid films under the
influence of antagonistic short- and long-range forces.,” J. Chem. Phys., vol. 110, no. 10,
pp. 4929–4936, 1999.
[57] L. Xue and Y. Han, “Pattern formation by dewetting of polymer thin film,” Prog. Polym.
Sci., vol. 36, no. 2, pp. 269–293, 2011.
[58] A. Sharma, “Relationship of Thin Film Stability and Morphology to Macroscopic
Parameters of Wetting in the Apolar and Polar Systems,” Langmuir, vol. 28, no. 23, pp.
861–869, 1993.
[59] D. R. Lide, CRC Handbook of Chemistry and Physics. CRC press, 2003.
[60] J. H. Kim, J. Jang, and W.-C. Zin, “Thickness Dependence of the Glass Transition
Temperature in Thin Polymer Films,” Langmuir, vol. 17, no. 9, pp. 2703–2710, May 2001.
[61] A. El Ouakili, G. Vignaud, E. Balnois, J.-F. Bardeau, and Y. Grohens, “Multiple glass
transition temperatures of polymer thin films as probed by multi-wavelength
ellipsometry,” Thin Solid Films, vol. 519, no. 6, pp. 2031–2036, Jan. 2011.
[62] T. Lan and J. M. Torkelson, “Methacrylate-based polymer films useful in lithographic
applications exhibit different glass transition temperature-confinement effects at high and
low molecular weight,” Polymer., vol. 55, no. 5, pp. 1249–1258, Mar. 2014.
[63] K. F. Mansfield and D. N. Theodorou, “Molecular dynamics simulation of a glassy
polymer surface,” Macromolecules, vol. 24, no. 23, pp. 6283–6294, Nov. 1991.
Structuration and glass transition temperature of the adsorbed polymer layer : some insights in the property deviations of the ultra-thin polymer film Aparna Beena Unni, 2016
Chapter 5. Stability and glass transition temperature of residual films on H-Si wafers
161
[64] J. A. Forrest, K. Dalnoki-Veress, J. R. Stevens, and J. R. Dutcher, “Effect of Free Surfaces
on the Glass Transition Temperature of Thin Polymer Films,” Phys. Rev. Lett., vol. 77, no.
10, pp. 2002–2005, Sep. 1996.
[65] W. E. Wallace, D. A. Fischer, K. Efimenko, W.-L. Wu, and J. Genzer, “Polymer Chain
Relaxation: Surface Outpaces Bulk,” Macromolecules, vol. 34, no. 15, pp. 5081–5082,
Jul. 2001.
[66] Z. Yang, Y. Fujii, F. K. Lee, C.-H. Lam, and O. K. C. Tsui, “Glass Transition Dynamics
and Surface Layer Mobility in Unentangled Polystyrene Films,” Science, vol. 328, no.
5986, pp. 1676–1679, Jun. 2010.
[67] S. Kawana and R. a L. Jones, “Effect of physical ageing in thin glassy polymer films.,”
Eur. Phys. J. E. Soft Matter, vol. 10, no. 3, pp. 223–30, Mar. 2003.
[68] R. Inoue, K. Kawashima, K. Matsui, T. Kanaya, K. Nishida, G. Matsuba, and M. Hino,
“Distributions of glass-transition temperature and thermal expansivity in multilayered
polystyrene thin films studied by neutron reflectivity,” Phys. Rev. E, vol. 83, no. 2, p.
21801, Feb. 2011.
[69] H. Tsuruta, Y. Fujii, N. Kai, H. Kataoka, T. Ishizone, M. Doi, H. Morita, and K. Tanaka,
“Local Conformation and Relaxation of Polystyrene at Substrate Interface,”
Macromolecules, vol. 45, no. 11, pp. 4643–4649, Jun. 2012.
[70] X. Zheng, M. H. Rafailovich, J. Sokolov, Y. Strzhemechny, S. A. Schwarz, B. B. Sauer,
and M. Rubinstein, “Long-Range Effects on Polymer Diffusion Induced by a Bounding
Interface,” Phys. Rev. Lett., vol. 79, no. 2, pp. 241–244, 1997.
[71] M. Asada, N. Jiang, L. Sendogdular, J. Sokolov, M. K. Endoh, T. Koga, M. Fukuto, L.
Yang, B. Akgun, M. Dimitriou, and S. Satija, “Melt crystallization/dewetting of ultrathin
PEO films via carbon dioxide annealing: the effects of polymer adsorbed layers,” Soft
Matter, vol. 10, no. 34, pp. 6392–6403, 2014.
Structuration and glass transition temperature of the adsorbed polymer layer : some insights in the property deviations of the ultra-thin polymer film Aparna Beena Unni, 2016

Chapter 5. Stability and glass transition temperature of residual films on H-Si wafers
162
[72] N. Jiang, M. K. Endoh, and T. Koga, “Structures and Dynamics of Adsorbed Polymer
Nanolayers on Planar Solids Structures and Dynamics of Adsorbed Polymer Nanolayers
on Planar Solids,” in Non-equilibrium Phenomena in Confined Soft Matter, S. Napolitano,
Ed. Springer, 2015, pp. 129–160.
[73] J.-M. Y. Carrillo, S. Cheng, R. Kumar, M. Goswami, A. P. Sokolov, and B. G. Sumpter,
“Untangling the Effects of Chain Rigidity on the Structure and Dynamics of Strongly
Adsorbed Polymer Melts,” Macromolecules, vol. 48, no. 12, pp. 4207–4219, Jun. 2015.
[74] C. B. Roth and J. R. Dutcher, “Glass transition and chain mobility in thin polymer films,”
J. Electroanal. Chem., vol. 584, no. 1, pp. 13–22, Oct. 2005.
[75] J. A. Forrest, K. Dalnoki-Veress, and J. R. Dutcher, “Interface and chain confinement
effects on the glass transition temperature of thin polymer films,” Phys. Rev. E, vol. 56, no.
5, pp. 5705–5716, 1997.
[76] E. K. Lin, R. Kolb, S. K. Satija, and W. L. Wu, “Reduced polymer mobility near the
polymer/solid interface as measured by neutron reflectivity,” Macromolecules, vol. 32, pp.
3753–3757, 1999.
Structuration and glass transition temperature of the adsorbed polymer layer : some insights in the property deviations of the ultra-thin polymer film Aparna Beena Unni, 2016
163
Conclusion and Perspectives
In this thesis, the investigations were done mainly around the deviation in polymer thin film
properties when they are confined by their thickness. Even if there exist numerous studies report-
ing such property deviations, the non-agreement of these reported results lead to controversies
that still remain within the scientific community. One of such properties that exhibit anomalous
behavior due to film confinement is the density of polymer thin films. Our first mission was to
study the density variations in polymer thin films which were achieved by the adsorption of ceria
nanoparticles onto the polymer film surface. The usage of ceria nanoparticles for density studies
was a novel approach which is devoid of any models which are usually employed in the density
studies. As the amount of nanoparticle adsorbed is a monotonic function of the polymer surface
refractive index, any increase/decrease in the nanoparticle surface coverage was directly ascribed
to an increase/decrease in the thin film refractive index and thereby density. The main outcome of
this study is that, the density of Polystyrene thin films on oxide-free Si wafer increases with a
reduction of the film, whereas the PMMA films spin-casted on Si wafers with silicon oxide layer
shows a reverse trend; i.e. a decrease of the density with the film thickness. This opposing trend
observed is explained by the distinct chain conformation resulting from the difference in polymer
substrate interaction.
One of the main difficulties we faced during the first study was the dewetting of films when their
thickness is reduced. So our second aim was to find an alternative to this dewetting issue. By
rinsing the bulk polymer film with good solvent, we were able to prepare flat polystyrene films
with a controlled thickness ranging from 1.3 to 7.0 nm. The films are found to be stable, even
after the scrutiny of their stability by an annealing procedure above the glass transition tempera-
ture. Films were found to be stable on oxide-free silicon irrespective of film thickness. In case of
films on 2 nm oxide-covered silicon substrates, they were found to be unstable below a thickness
of 2.9 nm and metastable above 2.9 nm. The Lifshitz-van der Waals intermolecular theory, which
can predict the domains of stability as a function of the film thickness and of the substrate nature
was fully reconciled with our experimental observations. We surmise that this reconciliation is
due to the good solvent rinsing procedure that removes the residual stress and the density varia-
tion of the polystyrene films inhibiting thermodynamically the dewetting on oxide-free silicon.
Structuration and glass transition temperature of the adsorbed polymer layer : some insights in the property deviations of the ultra-thin polymer film Aparna Beena Unni, 2016
164
As rinsing with a good solvent is found to be a promising method for obtaining ultra-thin
polymer films, it was indeed intriguing to see what happens to the characteristics of residual pol-
ymer film if we use different solvents for rinsing. Hence the study given in Chapter 3 deals with
the significance of choosing solvents for deconstructing polymer thin films. The solvents toluene,
chloroform, tetrahydrofuran and acetone were chosen for the study, considering their relative
energy difference with the polymer. It was found that smaller the relative energy differences be-
tween the polymer and the solvent, faster the dissolution and desorption of the polymer chains.
The thickness of the residual layer is thus a function on the solvent quality. It was found that the
films undergo spinodal dewetting at different time and thickness, depending on the solvent na-
ture, mainly the polarity. On the theoretical side, the polar acid-base component together with the
Lifshitz-van der Waals free energy could perfectly explain the unstable and metastable domains
for the four different solvents.
From the previous studies, one could successfully obtain stable films by rinsing with a good sol-
vent. The following question was whether these residual layers possess the same properties like
their bulk counter parts or they exhibit some deviations in their properties. The final study report-
ed in the dissertation (Chapter 4) deals with the characteristics and properties of polystyrene re-
sidual layers on H-terminated Si wafer. The residual layers of polystyrene on the H-terminated
wafers, after rinsing with various solvents were devoid of spinodal dewetting as their thickness
above 7 nm. In case of rinsing with a polar solvent like acetone, the residual layer underwent
dewetting at a microscopic scale. Unlike the glass transition behavior of bulk polymer, two tem-
perature transitions were observed for the residual polymer layer, one above and one below the
bulk glass transition value of polymer. The elevated temperature transition observed is attributed
to the chains pinned to the substrate whereas the temperature transition observed below the bulk
Tg is found to have its origin from the unadsorbed polymer segments in contact with the free sur-
face.
Altogether, this work contributes towards a better understanding of the density variations
observed in polymer thin films upon confinement. It provided a promising way to obtain stable
ultra-thin polymer films by the method of solvent rinsing, which is reconciled with the Lifshitz-
van der Waals intermolecular theory. It can also help one to understand various characteristics
and properties of polymer residual layer.
Structuration and glass transition temperature of the adsorbed polymer layer : some insights in the property deviations of the ultra-thin polymer film Aparna Beena Unni, 2016
165
There are lots of interesting factors which are yet to be investigated in addition to what we
have discussed here. For example, as the ceria nanoparticles adsorption is found to be a promis-
ing method to characterize the density variations in the polymer thin films, it can be interesting to
try this method on polymer residual layers to investigate their properties. Another study which
can be interesting is to reconstruct thin films of various thickness range over the polymer residual
layer to understand their properties, and then to compare it with the films made by direct spin
coating. This can help one to understand whether or not the recoating over the residual layer in-
fluence the films properties.
Apart from the various factors that can influence the properties of the polymer residual
layer we have already studied, an important factor that should be considered in the future study is
the polymer tacticity. The tacticity is found to have influence on the configuration differences in
the adsorbed layer,[1] glass transition temperature,[2], [3] dielectric properties [4] etc. Hence it is
very intriguing to know whether or not the polymer tacticity affect the properties of the polymer
residual layer, which is reported to have its influence on the thin film properties.
Considering the polymer films that dewets on the substrate, the dewetted polymer struc-
tures can be more interesting leading to its applications, if one can control the spinodal wave-
length by controlling the parameters such as solvent rinsing time, annealing, type of solvent used
etc.
Structuration and glass transition temperature of the adsorbed polymer layer : some insights in the property deviations of the ultra-thin polymer film Aparna Beena Unni, 2016

166
REFERENCES
[1] Y. Grohens, M. Brogly, C. Labbe, and J. Schultz, “Chain flattening of spin-cast PMMMA
on aluminum mirrors: Influence of polymer tacticity,” Eur. Polym. J., vol. 33, no. 5, pp.
691–697, 1997.
[2] Y. Grohens, M. Brogly, C. Labbe, M.-O. David, and J. Schultz, “Glass Transition of
Stereoregular Poly(methyl methacrylate) at Interfaces,” Langmuir, vol. 14, no. 11, pp.
2929–2932, May 1998.
[3] E. V Thompson, “Dependence of the glass transition temperature of poly (methyl
methacrylate) on tacticity and molecular weight,” J. Polym. Sci. Part A‐2 Polym. Phys.,
vol. 4, no. 2, pp. 199–208, 1966.
[4] J. H. Park, D. K. Hwang, J. Lee, S. Im, and E. Kim, “Studies on poly (methyl
methacrylate) dielectric layer for field effect transistor: Influence of polymer tacticity,”
Thin Solid Films, vol. 515, no. 7, pp. 4041–4044, 2007.
Structuration and glass transition temperature of the adsorbed polymer layer : some insights in the property deviations of the ultra-thin polymer film Aparna Beena Unni, 2016
167
LIST OF FIGURES
Figure 0-1. Three forms of polymer thin films: free standing, supported and capped films. ____________________ 1
Figure 1-1: Structure of polystyrene. _______________________________________________________________ 20
Figure 1-2: Structure of PMMA ___________________________________________________________________ 21
Figure 1-3: Silicon surface before and after the piranha treatment ______________________________________ 23
Figure 1-4:Schematic representation showing the changes of oxidized Si (100) wafer when immersed in HF solution
[5], [6] _______________________________________________________________________________________ 24
Figure 1-5:Representation of Hansen solubility sphere. ________________________________________________ 26
Figure 1-6:Schematic representation of the spin coating process. The substrate represented by black, solvent: green
and the polymer: red respectively. ________________________________________________________________ 28
Figure 1-7: A schematic diagram showing the working principle of ellipsometry (Horiba scientific) _____________ 29
Figure 1-8: A typical geometry of an ellipsometric experiment showing the p- and s-directions. The light is linearly
polarized initially and is elliptically polarized after being reflected from the sample. ________________________ 30
Figure 1-9: a.) Radiation interacting with a single plane parallel interface between Material 1, with refractive
index N1, and Material 2, with refractive index N2. b.) Diagram of the beam path in a sample comprised of a film,
with thickness d and refractive index N1, between Material 0, with refractive index N0, and Material 2, with
refractive index N2. ____________________________________________________________________________ 31
Figure 1-10: The photograph of Jobin-Yvon spectroscopic ellipsometer with labeled parts. ___________________ 33
Figure 1-11: Raw ellipsometric curves showing Δ as function of temperature for 100 nm PS film on Si wafer with native oxide. _____________________________________________________________________________ 35
Figure 1-12: A schematic diagram showing the working principle of AFM. ________________________________ 36
Figure 1-13:Photograph of Nanoscope IIIa with labeled parts. __________________________________________ 37
Figure 1-14: Inter atomic force vs. distance curve with different modes of operation. _______________________ 38
Figure 1-15:A schematic representation of AFM operating in tapping mode _______________________________ 39
Figure 1-16: The photograph of Empyrean Panalytical reflectometer. ____________________________________ 41
Figure 1-17:Schematic representation for the wettability of surface _____________________________________ 44
Figure 1-18: Photograph showing the solvent rinsing performed with dip coater. ___________________________ 45
Figure 2-1.a) Zero-frequency (2-3) and b) dispersive (2-4) contributions of the Hamaker constant as a function of the
dielectric and the refractive index of the polymer surface for a given CeO2 NP dispersion (with nNP=1.9, εNP=25,
nsol=1.33 and εsol=80). __________________________________________________________________________ 53
Figure 2-2. Schematic illustration of the ceria NPs adsorption process. The key parameters are the adsorption time,
the refractive index of the polymer thin film and the NP dispersion, which allows tuning the surface coverage on
samples of any shape and size. ___________________________________________________________________ 55
Structuration and glass transition temperature of the adsorbed polymer layer : some insights in the property deviations of the ultra-thin polymer film Aparna Beena Unni, 2016
168
Figure 2-3. Amount of ceria NPs adsorbed onto various hydrophobic (polymer) thin films as a function of the
refractive index. _______________________________________________________________________________ 56
Figure 2-4. a)Adsorption of CeO2 NP onto polystyrene surface as a function of the NP solution concentration
monitored by optical reflectometry during 2 hours. b) AFM topographic image (1x1 µm2) showing the surface of the
PS film densely covered with CeO2 NP. _____________________________________________________________ 57
Figure 2-5: Refractive index of PS/H-Si as a function of the film thickness calculated at 605 nm by ellipsometry.
(dotted line is the guide for eyes) _________________________________________________________________ 58
Figure 2-6: AFM topographic images showing the adsorbed ceria nanoparticles to the PS-H Si surface of PS film
thickness, h: (a) 6.7 nm, (b) 13.99 nm, (c) 18.84 nm, (d) 36 nm, 75.26 nm, (f) 143.55 nm. (Scan size 1*1 µm) _____ 59
Figure 2-7: NP coverage (in percentage %) as a function of PS film thickness h computed from AFM images _____ 60
Figure 2-8: AFM topographic images showing the adsorbed ceria nanoparticles to the PMMA/SiOx-Si surface of
PMMA film thickness, h: (a) 6.66 nm, (b) 12.43 nm, (c)32.1 nm, (d) 41.1 nm, (e) 66.74 nm, (f) 95,11nm. (Scan size
1*1 µm) _____________________________________________________________________________________ 61
Figure 2-9: NP surface coverage (in percentage %) as a function of PMMA film thickness ____________________ 62
Figure 2-10: Refractive index of PMMA-SiOx-Si as a function of the PMMA film thickness. ___________________ 63
Figure 2-11.PS film thickness vs. long-range effective interfacial potential as a function of the SiOx layer thickness 64
Figure 2-12: AFM topographic images showing the adsorbed ceria nanoparticles on films of PMMA film ~30 nm on
Si wafer a) without oxide layer on the substrate b) Oxide thickness of 1.7 nm on the substrate c) oxide thickness of
424 nm on the substrate. Scan area of 1*1 µm. ______________________________________________________ 65
Figure 2-13: AFM topographic images showing the adsorbed ceria nanoparticles on films of PMMA film ~4 nm on Si
wafer a) without oxide layer on the substrate b) oxide thickness of 424 nm on the substrate. Scan area of 1*1 µm. 66
Figure 2-14: Interfacial potential vs. film thickness of PMMA films as function of SiOx layer thickness. _________ 68
Figure 2-15:Schematic representation showing that the critical volume is reached at a lower temperature for the
thinner film. __________________________________________________________________________________ 69
Figure 2-16: The schematic representation of the free volume that evolves with temperature, for PMMA and PS
films. v* stands for the critical volume. ____________________________________________________________ 70
Figure 3-1: Sketch of the effective interface potential as a function of film thickness for stable (1), unstable (2), and
metastable (3) films. ___________________________________________________________________________ 81
Figure 3-2: AFM images of PS films spin-coated at 2000 rpm on (a) SiOx-Si and (b) H-Si surfaces from a 1.5 g/L
solution (scan size = 5×5 µm2) and on (c) SiOx-Si and (d) H-Si surfaces from a 0.75 g/L solution (scan size = 15×15
µm2). The thicknesses of the films determined by XRR are ≈ 6.8 nm, 7.1 nm, 3.2 nm and 4.3 nm for the images (a),
(b), (c) and (d), respectively. The insets of figures (c) and (d) correspond to the evolution of the height along the
drawn line. ___________________________________________________________________________________ 84
Figure 3-3: XRR and EDP profiles showing dewetting of directly spin-coated ultrathin films. XRR data (different
symbols) and analyzed curves (solid line) of as-prepared PS films on H-Si and SiOx-Si substrates by direct spin-
Structuration and glass transition temperature of the adsorbed polymer layer : some insights in the property deviations of the ultra-thin polymer film Aparna Beena Unni, 2016

169
coating of 0.75 g/L solution (curves are shifted vertically for clarity). Insets: corresponding EDPs showing very low
coverage of the PS films with respect to the bulk electron density ≈ 0.344 e.Å-3. ___________________________ 85
Figure 3-4: Structural evolution as a result of solvent rinsing. XRR data (different symbols) and analyzed curves (solid
line) of unannealed (a) and pre-annealed (b) 7 nm PS films on SiOx-Si substrates before and after toluene rinsing
during different durations (curves are shifted vertically for clarity). Insets: corresponding EDPs showing different
thicknesses of the PS films with different toluene rinsing time. __________________________________________ 86
Figure 3-5: Solvent rinsing of a thick (h0 ≈ 130 nm) PS film. XRR data (different symbols) and analyzed curves (solid
line) of a thick PS film on a SiOx-Si substrates before and after toluene rinsing during different durations as
mentioned in the legend. Insets: corresponding EDPs showing different thicknesses of the PS films with different
toluene rinsing times. __________________________________________________________________________ 87
Figure 3-6: Solvent rinsing of a 7 nm preannealed PS film grown on H-Si substrate. XRR data (different symbols) and
analyzed curves (solid line) of a preannealed 7 nm PS film on H-Si substrates before and after toluene rinsing during
different durations as mentioned in the legend (curves are shifted vertically for clarity). Insets: corresponding EDPs
showing different thicknesses of the PS films with different toluene rinsing times. __________________________ 88
Figure 3-7: Solvent rinsing of a 7 nm preannealed PS film grown on a H-Si substrate. XRR data (different symbols)
and analyzed curves (solid line) of a preannealed 7 nm PS film on a H-Si substrates before and after toluene rinsing
during different durations as mentioned in the legend (curves are shifted vertically for clarity). Insets: corresponding
EDPs showing different thicknesses of the PS films with different toluene rinsing times. _____________________ 89
Figure 3-8: Residual layer thickness hres as a function of Rg. ____________________________________________ 90
Figure 3-9: Correlation between the kinetics of dissolution and annealing. (a) Residual thickness (hres) of pre-
annealed and unannealed PS film of h0 ≈ 7 nm grown on SiOx-Si and H-Si substrates as a function of rinsing time
(trins). (b) Schematic illustration of the formation of an adsorbed layer hads ________________________________ 91
Figure 3-10: AFM topography image of pre-annealed residual films on (a) SiOx-Si and (b) H-Si substrates obtained
after 70 min of toluene rinsing. Inset of (a) and (b) show the 3D AFM images after scratching some regions of
residual film by AFM tip in order to confirm that this is polymer rather than Si substrate. (c) Attenuated total
reflectance absorbance spectra of a PS ultrathin film before (h0 ≈ 18.0 nm) and after (hads ≈ 5.2 nm) a "quick"
toluene rinsing (up to 20 min) confirming the existence of PS residual layer on Si substrate. __________________ 93
Figure 3-11: AFM topographic images (scan size = 1×1 µm2) presented in the top panel (A) show the morphologies of
residual films of thickness hres(a) ≈ 1.5 nm, (b) ≈ 2.5 nm, (c) ≈ 4.0 nm, (d) ≈ 4.6 nm, (e) ≈ 5.0 nm and (f) ≈ 6.0 nm on
H-Si after post-annealing. In the bottom panel (B) are shown similar results for hres (a) ≈ 1.3 nm, (b) ≈ 1.7 nm, (c) ≈
2.2 nm, (d) ≈ 3.5 nm, (e) ≈ 4.9 nm and (f) ≈ 6.8 nm thick films on SiOx-Si. Inset shows their corresponding 2D FFT
image. Morphologies were obtained after post-annealing at 120 oC during 24 h. Note that the thicknesses that are
mentioned here are the thicknesses of the residual films just before the post-annealing. Zm represents the maximum
height in nm. _________________________________________________________________________________ 96
Structuration and glass transition temperature of the adsorbed polymer layer : some insights in the property deviations of the ultra-thin polymer film Aparna Beena Unni, 2016

170
Figure 3-12: AFM topography images illustrate a 2.3 nm thick PS film (residual) on an oxide-free Si substrate. (a)
Scan size = 5×5 µm2(RMS roughness ≈ 0.16 nm) and (b) Scan size = 2×2 µm2 (RMS roughness ≈ 0.16 nm). The images
were taken after post annealing at 170°C during 24 h. ________________________________________________ 97
Figure 3-13: Power spectral density (PSD) curves of residual PS films grown on SiOx-Si substrates having different
thicknesses calculated from AFM images presented in Figure 3-11. B. ____________________________________ 98
Figure 3-14: (a) Normalized XRR data (symbol) of RCA-cleaned Si and analyzed curves (solid lines. Inset: XPS
spectrum of RCA-cleaned Si substrate demonstrating the existence of SiOx layer on top of Si. (b) Normalized XRR
data (symbol) of HF-cleaned Si substrate and fitted curve (solid line) using model 1 without oxide layer. Inset: XPS
spectrum confirming the absence of an oxide layer on H-Si substrate after HF-treatment. ____________________ 99
Figure 3-15: Simulated )(hFVDW∆ (solid lines) and ')]'([ hF VDW∆ (dashed line) curves using Eq.3-4assuming 2 nm
native oxides present on SiOx-Si substrate. Curve ‘A’, drawn by choosing ASi/PS/Air = -6.0×10⁻²⁰ J and ASiOx/PS/Air = -0.2
×10−20 J, corresponds to a stable state. Curve ‘B’, deduced with ASi/PS/Air = -4.4×10⁻²⁰ J and ASiOx/PS/Air = 1.6 ×10⁻²⁰ J,
depicts an unstable state. Curve ‘C’, plotted assuming ASi/PS/Air = -5×10⁻²⁰ J and ASiOx/PS/Air = 0.7 ×10⁻²⁰ J, corresponds
to either a metastable state above htrans≈ 2.9 nm and unstable films below htrans. The letters a,b,c,d,e and f are
corresponding to the AFM images presented inFigure 3-11. Color of state : stable in pink, unstable in gray,
metastable in green. __________________________________________________________________________ 100
Figure 3-16: Evolution of the free energy as a function of SiOx thickness.Simulated (a) (b) curves using equation 3-4
considering 4 different thicknesses (dSiOx) of native oxides in SiOx-Si substrate. All the curves are plotted with
ASi/PS/Air = -5.0×10⁻²⁰ J and ASiOx/PS/Air = 0.7 ×10⁻²⁰ J. The intercept point of curves to the x-axis indicates the
value of htrans. (c) Plot of htrans as a function of dSiOx. Fitted linear curve (dashed line) draws a border line
between stable or metastable and unstable regimes. ________________________________________________ 102
Figure 3-17: AFM topographic images (Scan size = 2×2 µm2) show the morphologies of residual films of thicknesses
hres (a) ≈ 1.5 nm, (b) ≈ 2.5 nm, (c) ≈ 4.0 nm, (d) ≈ 4.6 nm, (e) ≈ 5.0 nm and (f) ≈ 6.0 nm on H-Si substrates without
post annealing. Zm represents the maximum height in nm. ___________________________________________ 104
Figure 4-1:Sketch representing the desorption mechanism of PS/SiOx-Si in contact with a good solvent. The
substrate, the polymer and the solvent are shown in black, orange and blue respectively. ___________________ 113
Figure 4-2: The schematic view of the two different chain conformations after the solvent rising supported PS thin
film[14]. ____________________________________________________________________________________ 114
Figure 4-3:a) Optical microscope image of the PS/SiOx-Si film after spin coating and pre-annealing. b) The 3D
presentation of topographic image of PS/SiOx-Si film obtained using AFM. c) The height profile along the drawn red
line. ________________________________________________________________________________________ 116
Figure 4-4:Residual thickness (hres) of bound PS after rinsing with different solvents. hres is measured by ellipsometry
and complemented with XRR. ___________________________________________________________________ 117
Structuration and glass transition temperature of the adsorbed polymer layer : some insights in the property deviations of the ultra-thin polymer film Aparna Beena Unni, 2016

171
Figure 4-5: AFM topography (scan size = 5×5 µm2) of residual film obtained after rinsing with different solvents: a)
toluene, b) chloroform, c) THF and d) acetone. The dotted line represents the transition to spinodal dewetting. _ 119
Figure 4-6: Optical images of PS films rinsed with acetone from 5s to 2h (scale bar 100 μm). The scan size of AFM
image = 5×5 µm2 _____________________________________________________________________________ 120
Figure 4-7: (a) Simulation of the Lifshitz-van der Waals component of the free energy ∆FLW and (b) its second
derivative ∆ÛÜ′′ℎ as a function of film thickness h for PS films for the four layer system Si/SiOx/PS/Solvent under
different solvent media. The effective Hamaker constants are the ones given in Table 4-3 and the thickness of the
SiOx layer was taken to be equal to 1.7 nm. ________________________________________________________ 126
Figure 4-8 : The contact angle values between a bulk PS substrate and various solvents measured by contact angle
goniometry. Photographs corresponding to the measurements are given above the bars. ___________________ 128
Figure 4-9: Simulation of (a) the effective free energy ∆F and (b) its second derivative ∆F’’ as a function of PS film
thickness h for a four layer Si/SiOx/PS/Solvent system. In these simulations, 4 solvents are considered: toluene,
chloroform, THF and acetone. The effective free energy takes into account the effective contribution of the Lifshitz-
van der Waals ∆FLW and of the polar ∆FP components as well as the steric repulsion energy c/hα. _____________ 130
Figure 5-1: Schematic representation for the temperature transitions observed in an amorphous material _____ 140
Figure 5-2. Residual thickness (hres) of PS obtained by ellipsometry after rinsing with various solvents and post
annealing (Acetone PS-HF is approximate value) ____________________________________________________ 143
Figure 5-3.Optical microscope images showing the PS/H-Si after rinsing with acetone and post annealing (Scale bar:
500 µm) ____________________________________________________________________________________ 144
Figure 5-4.AFM images of PS/H-Si after rinsing with solvents a) toluene, b) chloroform, c) THF and d) acetone and
post annealing. Scan size (5x5 µm). Inset shows the surface profiles which scales from 0-1.4 nm. _____________ 146
Figure 5-5.Simulation of (a) the effective interfacial potential ∆F and (b) its second derivative ∆F’’ as a function of PS
film thickness ‘h’ for PS/H-Si. The effective free energy takes into account the effective contribution of the Lifshitz-
van der Waals ∆FLWand of the polar ∆FPcomponents as well as the steric repulsion energy c/hα. _____________ 148
Figure 5-6.Raw ellipsometric curves showing Δ as function of temperature for a) PS/H-Si (100 nm) measured at 2.75
eV b) PS/H-Si (~ 7.9 nm) after chloroform rinsing and post annealing. ___________________________________ 150
Figure 5-7. Glass transition temperature of PS/H-Si after rinsing with various solvents. _____________________ 151
Figure 5-8.Schematic representation of the effect of solvent rinsing on the supported thin film and transition
temperature _________________________________________________________________________________ 152
Structuration and glass transition temperature of the adsorbed polymer layer : some insights in the property deviations of the ultra-thin polymer film Aparna Beena Unni, 2016
172
LIST OF TABLES
Table 1-1: The Hansen solubility parameter values of PS, PMMA and toluene ______________________________ 27
Table 2-1. Nanoparticle coverage obtained on ~30 nm PS films with various oxide thicknesses. _______________ 64
Table 2-2. Nanoparticle coverage obtained on ~30 nm PMMA films with various oxide thicknesses. ____________ 65
Table 2-3. Nanoparticle coverage obtained on ~4 nm PMMA films with various oxide thicknesses. _____________ 66
Table 2-4. Shows the increase (↑) or decrease (↓) of Glass transi[on temperature (Tg), Coefficient of thermal
expansion (CTE) and the density(ρ) with decrease in film thickness of PS and PMMA. _______________________ 70
Table 3-1: Preparation of the PS rinsed films on Si substrates (6 samples on H-Si and 6 samples on SiOx-Si). Pre-
annealing time tan of the film (before the rinsing procedure) and the duration of toluene rinsing trins determine the
thicknesses of residual layer (hres). ________________________________________________________________ 95
Table 3-2: Correlation between the Hamaker constant values of ASi/Si, APS/PS and ASiOx/SiOx and the resulting effective
Hamaker constants ASi/PS/Air and ASiOx/PS/Air from the "mixing rule" of equation3-3Curves A, Band C refer to the three
different states as shown in Figure 3-15. __________________________________________________________ 100
Table 4-1: The HSP and relative energy difference values PS and some of its good solvents. _________________ 118
Table 4-2: The Hamaker constants reported in the literature and their average value used in our calculations. __ 124
Table 4-3: Correlation between the surface tension of pure solvents and the effective Hamaker constants of the
three layer systems.3hÉÞoßis the surface tension of the pure solvents. %ihÉÞoß/ihÉÞoßis the Hamaker constant
of the solvent, %3h2/à3/3hÉÞoß and %3/à3/3hÉÞoß are the effective Hamaker constants of SiO2/PS/Solvent
and Si/PS/Solvent three layer systems, respectively. The values are calculated from the average Hamaker constant
values in Table 4-2. ___________________________________________________________________________ 125
Table 4-4: Correlation between the surface tension γPS/Solvent , the total S, the Lifshitz-van der Waals SLW and the polar
SP spreading coefficients. _______________________________________________________________________ 129
Table 5-1. Parameters for the simulation of interfacial potential curve. %3h2/à3/3hÉÞoßand %3/à3/3hÉÞoß
are the effective Hamaker constants of SiO2/PS/Solvent and Si/PS/Solvent three layer systems. SP, the polar
spreading coefficient. RED, relative energy difference values PS and some of its good solvents. ______________ 149
Structuration and glass transition temperature of the adsorbed polymer layer : some insights in the property deviations of the ultra-thin polymer film Aparna Beena Unni, 2016

173
PUBLICATIONS
• J. K. Bal, T. Beuvier, A. B. Unni, E. A. Chavez Panduro, G. Vignaud, N. Delorme, M. S.
Chebil, Y. Grohens, and A. Gibaud, “Stability of Polymer Ultrathin Films (<7 nm) Made
by a Top-Down Approach,” ACS Nano, vol. 9, no. 8, pp. 8184–8193, Aug. 2015.
• A. B. Unni, G. Vignaud, J. K. Bal, N. Delorme, T. Beuvier, S. Thomas, Y. Grohens, and
A. Gibaud, “Solvent Assisted Rinsing: Stability/Instability of Ultrathin Polymer Residual
Layer,” Macromolecules, vol. 49, no. 5, pp. 1807–1815, Feb. 2016.
• A. B. Unni, G. Vignaud, J-P Chapel, J. Giermanska, J. K. Bal, N. Delorme, T. Beuvier,
S.Thomas, M. S. Chebil, Y. Grohens, and A. Gibaud “Probing directly the density varia-
tion of confined polymer thin films via simple CeO2 nanoparticle adsorption” (communi-
cated)
• M. S Chebil, J. K. Bal, G. Vignaud, T. Beuvier, N. Delorme, A. B. Unni, Y. Grohens, A.
Gibaud, “Origin of Depressed Tg in Confined Polystyrene Thin Films: An Approach Us-
ing Supercritical Carbon Dioxide” (communicated)
CONFERENCE PRESENTATION
• Oral communication at the International Conference, Groupe Français d'études et d'appli-
cations des Polymères (GFP), November -2015 at Luxembourg Institute of Science and Technology, Luxembourg Topic: Stable polymer thin films (<7nm) obtained by means top down solvent rinsing ap-
proach
Structuration and glass transition temperature of the adsorbed polymer layer : some insights in the property deviations of the ultra-thin polymer film Aparna Beena Unni, 2016

Structuration and glass transition temperature of the adsorbed polymer layer : some insights in the property deviations of the ultra-thin polymer film Aparna Beena Unni, 2016