
Ground-Motion Scaling in Eastern Sicily, Italy
11
568 Bulletin of the Seismological Society of America, Vol. 95, No. 2, pp. 568–578, April 2005, doi: 10.1785/0120030124 Ground-Motion Scaling in Eastern Sicily, Italy by Laura Scognamiglio, Luca Malagnini, and Aybige Akinci Abstract We describe the characteristics of crustal wave propagation in eastern Sicily by using the background seismicity of the area. We follow the approach de- scribed by Malagnini, Hermann, and Di Bona (2000) and Malagnini et al. (2002). Our data set consists of 106 earthquakes recorded by nine three-component digital seismic stations between 1994 and 2001. We used only crustal events (depths shal- lower than 25 km), with local magnitudes ranging from 1.0 to 4.3, and hypocentral distances from 10 to 130 km. Peak ground velocities from 1311 narrow bandpass-filtered waveforms are mea- sured in the frequency range 1.0–16.0 Hz, and regressed to define crustal propagation, excitation, and site characteristics, with respect to a reference station. A subsequent modeling effort is carried out, through the use of random vibration theory (RVT), for obtaining a quantitative evaluation of the apparent geometrical spreading g(r), and of the crustal quality factor Q( f ). An attenuation parameter, j 0 , is also evaluated relative to a reference rock site. The attenuation and source parameters estimated in this study are used through the RVT in order to predict the peak horizontal ground acceleration (PGA), and the 5% damping pseudoacceleration spectra (PSA). Introduction Eastern Sicily is one of the most seismically active re- gions in Italy. In the last 1000 years this area has experienced at least five large and destructive events (1169, 1542, 1624, 1693, 1818) with equivalent magnitude ranging from 5.5 to 7.4 (Boschi et al., 1995). The last important event (M S 5.3) to strike this region occurred on 13 December 1990 (Amato et al., 1995), after 50 years of seismic quiescence. The epi- center was located in the Ionian Sea, a few kilometers off- shore from Augusta (Fig. 1), on a transverse element of the Ibleo-Maltese fault system (Amato et al., 1995). In spite of being a moderate-sized earthquake, it damaged a wide area and produced 19 casualties due to the collapse of a poorly constructed building in the town of Carlentini (Basili et al., 1995). The high seismic potential of the region, its popula- tion density, and the inadequacy of some of the buildings to withstand even moderate levels of ground motion, make eastern Sicily an area of high seismic risk where modern hazard studies are needed. The prediction of the ground shaking for engineering applications is often obtained through the use of empirical predictive relationships (Kramer, 1996), which usually are developed by regressing a large number of strong-motion data. Since there are regions with high seismic potential that do not have enough recordings of large earthquakes, it is common practice in such cases to use relationships coming from tectonically similar areas, with the assumption that the ground motions would be similar. Alternatively, we can use the predictive relationships obtained for areas in different tectonic regimes. This practice, though, could lead to unre- liable estimates of the ground motions. Boore (2001) made a quantitative comparison between the response spectra from ground motions recorded during the 1999 Chi-Chi earthquake in Taiwan, and the response spectra predicted from the four frequently-used, empirical predictive models (Abrahamson and Silva, 1997; Boore and Joyner, 1997; Campbell, 1997, 2001; Sadigh et al., 1997) that are based largely on data from California. He found that the observed motions differed from the predicted ones by factors larger than expected from earthquake-to-earthquake variations (Boore, 2001). The same incongruence could be observed in Italy, where the predictive relationships for hazard maps or for estimates of the ground motions were calculated by Sabetta and Pugliese (1987, 1996) from strong-motion data coming from different tectonic and geological environments (Friuli, Sicily, Irpinia, and central Italy) (Akinci et al., 2004). These equations describe the attenuation of horizontal peak ground acceleration (PGA), velocity, and response spectra as a func- tion of the epicentral distance, only in terms of constant geo- metrical spreading at all distances (g[r] 1/r). As suggested by Chouet et al. (1978) and demonstrated by Raoof et al. (1999) and Malagnini, Hermann, and Di Bona (2000), the linear attenuative properties of the crust at high frequencies can be evaluated using the background seis-
-
Upload
independent -
Category
Documents
-
view
1 -
download
0
Transcript of Ground-Motion Scaling in Eastern Sicily, Italy

568
Bulletin of the Seismological Society of America, Vol. 95, No. 2, pp. 568–578, April 2005, doi: 10.1785/0120030124
Ground-Motion Scaling in Eastern Sicily, Italy
by Laura Scognamiglio, Luca Malagnini, and Aybige Akinci
Abstract We describe the characteristics of crustal wave propagation in easternSicily by using the background seismicity of the area. We follow the approach de-scribed by Malagnini, Hermann, and Di Bona (2000) and Malagnini et al. (2002).Our data set consists of 106 earthquakes recorded by nine three-component digitalseismic stations between 1994 and 2001. We used only crustal events (depths shal-lower than 25 km), with local magnitudes ranging from 1.0 to 4.3, and hypocentraldistances from 10 to 130 km.
Peak ground velocities from 1311 narrow bandpass-filtered waveforms are mea-sured in the frequency range 1.0–16.0 Hz, and regressed to define crustal propagation,excitation, and site characteristics, with respect to a reference station. A subsequentmodeling effort is carried out, through the use of random vibration theory (RVT), forobtaining a quantitative evaluation of the apparent geometrical spreading g(r), andof the crustal quality factor Q( f ). An attenuation parameter, j0, is also evaluatedrelative to a reference rock site.
The attenuation and source parameters estimated in this study are used throughthe RVT in order to predict the peak horizontal ground acceleration (PGA), and the5% damping pseudoacceleration spectra (PSA).
Introduction
Eastern Sicily is one of the most seismically active re-gions in Italy. In the last 1000 years this area has experiencedat least five large and destructive events (1169, 1542, 1624,1693, 1818) with equivalent magnitude ranging from 5.5 to7.4 (Boschi et al., 1995). The last important event (MS 5.3)to strike this region occurred on 13 December 1990 (Amatoet al., 1995), after 50 years of seismic quiescence. The epi-center was located in the Ionian Sea, a few kilometers off-shore from Augusta (Fig. 1), on a transverse element of theIbleo-Maltese fault system (Amato et al., 1995). In spite ofbeing a moderate-sized earthquake, it damaged a wide areaand produced 19 casualties due to the collapse of a poorlyconstructed building in the town of Carlentini (Basili et al.,1995). The high seismic potential of the region, its popula-tion density, and the inadequacy of some of the buildings towithstand even moderate levels of ground motion, makeeastern Sicily an area of high seismic risk where modernhazard studies are needed.
The prediction of the ground shaking for engineeringapplications is often obtained through the use of empiricalpredictive relationships (Kramer, 1996), which usually aredeveloped by regressing a large number of strong-motiondata. Since there are regions with high seismic potential thatdo not have enough recordings of large earthquakes, it iscommon practice in such cases to use relationships comingfrom tectonically similar areas, with the assumption that theground motions would be similar. Alternatively, we can use
the predictive relationships obtained for areas in differenttectonic regimes. This practice, though, could lead to unre-liable estimates of the ground motions.
Boore (2001) made a quantitative comparison betweenthe response spectra from ground motions recorded duringthe 1999 Chi-Chi earthquake in Taiwan, and the responsespectra predicted from the four frequently-used, empiricalpredictive models (Abrahamson and Silva, 1997; Boore andJoyner, 1997; Campbell, 1997, 2001; Sadigh et al., 1997)that are based largely on data from California. He found thatthe observed motions differed from the predicted ones byfactors larger than expected from earthquake-to-earthquakevariations (Boore, 2001).
The same incongruence could be observed in Italy,where the predictive relationships for hazard maps or forestimates of the ground motions were calculated by Sabettaand Pugliese (1987, 1996) from strong-motion data comingfrom different tectonic and geological environments (Friuli,Sicily, Irpinia, and central Italy) (Akinci et al., 2004). Theseequations describe the attenuation of horizontal peak groundacceleration (PGA), velocity, and response spectra as a func-tion of the epicentral distance, only in terms of constant geo-metrical spreading at all distances (g[r] ! 1/r).
As suggested by Chouet et al. (1978) and demonstratedby Raoof et al. (1999) and Malagnini, Hermann, and DiBona (2000), the linear attenuative properties of the crust athigh frequencies can be evaluated using the background seis-

Ground-Motion Scaling in Eastern Sicily, Italy 569
Figure 1. Structural map of Sicily (modified from Lentini et al., 1994 and Adam et al.,2000). (1) regional overthrusts; (2) external front of the Apennine Chain; (3) front of theexternal thrust system; (4) normal faults; (5) strike-slip faults; (6) Hyblean-Malta Plateau;(7) Gela-Catania Foredeep; (8) INGV seismic stations; (9) Scicli Line; (10) Malta Escarp-ment; (11) Scordia-Lentini Graben; (12) 13 December 1990 earthquake (Amato et al., 1995);(13) epicentral distribution of the earthquakes used in this study.
micity of the interest area. In other words, it becomes pos-sible to develop regionally-calibrated attenuation relation-ships even where strong-motion data are not available.
Several authors have used small earthquakes, recordedin homogeneous tectonic regions, to define, with differentmethods, the crustal propagation characteristics (e.g., Akiand Chouet, 1975, for Japan and California; Hermann andMalagnini, 1996, for central United States; Rodriguez et al.,1983, and Ortega et al., 2002, for Mexico; Jeon, 2000, forUtah; Malagnini et al., 2002, for northeastern Alps).
In this study we characterize the distance-scaling of theearthquake-induced ground motions in eastern Sicily usingthe small earthquake background seismicity, following theapproach described by Malagnini, Hermann, and Di Bona(2000). Peak ground motions of narrow bandpass-filteredwaveforms will be used in a general regression scheme thataccounts for source excitation, crustal propagation, and siteeffects. A subsequent modeling effort is carried out throughthe use of random vibration theory (RVT), (Cartwright andLonguet-Higgins, 1956), in order to obtain a simple func-tional form that describes the empirical excitation and thedistance-scaling relationships. Results of this study will beused for upgrading the most recent hazard map of Italy(Stucchi et al., 2004).
Structural Setting and Seismicity of Eastern Sicily
Eastern Sicily is part of a complex structural domainthat is a segment of the Alpine collisional belt developingalong the Africa–Eurasia plate boundary. Three main ele-ments from north to south, mark, the collisional complex ofSicily and its offshore continuation (Fig. 1): the Sicilian
compressional margin, the Gela-Catania foredeep, and theforeland area of the Hyblean-Malta Plateau outcropping ineastern Sicily and in the Sicily Channel (Lentini et al., 1994;Catalano et al., 1996).
Almost all authors describe the Hyblean foreland as partof the northern margin of the African continental crust,which is bounded to the north by the thrust front of theApennine allocthonous units, and to the east by the MaltaEscarpment. It is a multiply-segmented normal faultingzone, striking north-northwest–south-southeast, dippingeast-northeast, and developing over 300 km from north Af-rica to eastern Sicily (Reuther et al., 1993; Sirovich and Pet-tinati, 1999). This escarpment separates the 23-km-thickcontinental crust of the Hyblean Plateau (Finetti, 1982) fromthe 13-km-thick oceanic crust in the Ionian Sea (Ferrucci etal., 1991; Reuther et al., 1993; Adam et al., 2000).
The regional tectonic stress field of eastern Sicily actsalong an approximately north–south direction, and is mainlydetermined by Africa and Euro-Asiatic plate convergence(Bonaccorso and Patane, 2001). An extensional east–westtrending regime is also observable along the eastern coast ofSicily, related to the Malta Escarpment (Bonaccorso and Pa-tane, 2001).
Historical and instrumentally-recorded seismicity aredistributed mainly in two areas: moderate magnitude shallowearthquakes (Ms ! 5.0) are localized in the inner sector ofthe Hyblean Plateau and are associated with minor structuressuch as the Mineo fault or the Scicli line (Fig. 1) (Azzaroand Barbano, 2000); larger events are distributed along theIonian coast and could be related to the activation of theScordia-Lentini graben and the Malta Escarpment (Azzaroand Barbano, 2000).

570 L. Scognamiglio, L. Malagnini, and A. Akinci
Table 1Some Information on the INGV Stations Used in the Regression
Described in This Study
StationName
Altitude(m) Surface Geology and Unit Thickness
S1R 530 clayey marl and sandstone (100 m)S2R 95 quaternary sedimentary depositsS3R 190 pyroclastic rocks and basaltic lavas (80–100m)S4R 730 lavasS5R 600 calcarenites (20–400m)S6R 100 calcarenites (20–400 m)S7R 540 calcarenites and marly limestone (! 60m)S8R 455 calcarenites (! 250 m)S9R 126 pyroclastic rock and pillow lavas (50–100m)
Data Set
We used a data set of waveforms from 106 earthquakesin eastern Sicily, which were recorded by a seismic networkrun by the Istituto Nazionale di Geofisica e Vulcanologia(INGV, Fig. 1). The nine-station network is equipped with24-bit digitizers, 9 MARK-L4-3D sensors, with an averagesensitivity of 172 V/m/sec, natural frequencies of 1.5 Hz,and critical damping equal to 0.65. Signals were recorded ata sampling rate of 125 samples/sec.
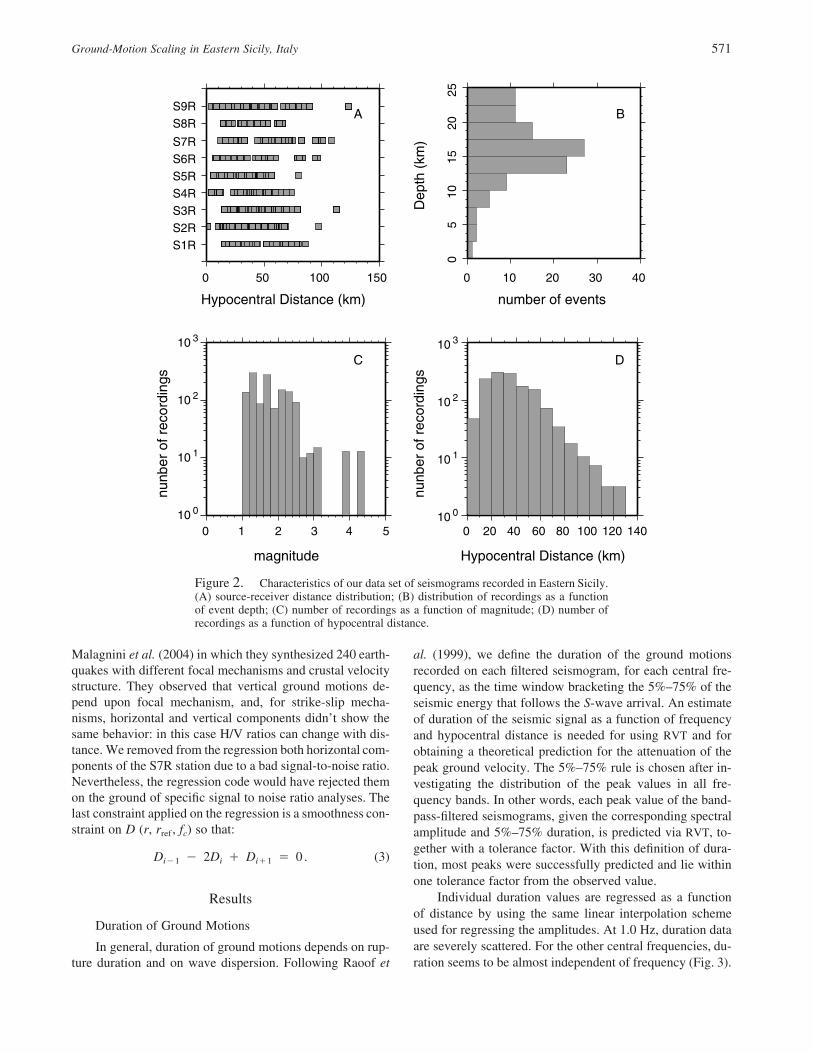
Due to the heterogeneity of the surface geology in theregion, the stations were deployed on different kinds of geo-logic outcrops. Three stations (S3R, S4R, S9R) were placedon volcanic sites (pyroclastic rocks and lavas) 50–100 mthick, and four stations (S5R, S6R, S7R, S8R) on 20–400-m-thick calcarenites. The last two stations (S1R, S2R) wereput on quaternary sedimentary deposits, up to 100 m thick.All this information about the seismic network is gatheredin Table 1. We used data recorded from 23/04/94 to 08/10/01, with local magnitudes ranging from 1.0 to 4.3. We usedonly crustal earthquakes (shallower than 25 km). Source-receiver distances range between 10 and 130 km (Fig. 2).
Data Processing
Details of the data processing scheme used in this studywere described by Malagnini, Hermann, and Di Bona (2000),and Malagnini et al. (2002): each waveform is corrected forthe instrument response, examined to eliminate those withspurious transients including double events and/or low signalto noise ratios, and is reviewed for the picking of P- and S-wave arrivals. We also decided to remove all the waveformswith propagation paths crossing the Etna volcanic edifice,since they had nucleated and/or traveled in a medium whichstrongly differs from the surrounding region. After this selec-tion, the data set was reduced to about 50% of its originalsize, and now consists of 1311 waveforms. We rotated thehorizontal recordings to radial and transverse components ofthe ground velocity, and applied a set of narrow bandpassfilters defined around central frequencies, fc, chosen at 1.0,2.0, 3.0, 4.0, 5.0, 6.0, 8.0, 10.0, 12.0, 14.0, and 16.0 Hz. Thebandpass filter is the combination of two 8-pole Butterworthfilters: a high-pass with corner frequency at (1/Z2)fc fol-lowed by a low-pass with corner frequency at Z2fc.
On each filtered seismogram, recorded at the hypocen-tral distance r, we read the peak amplitude of the ground-velocity a (fc, r). The logarithm of a (fc, r) can be written asthe summation of a source term, a site term and a propaga-tion term:
log a ( f , r) ! EXC ( f , r )c c ref
" SITE ( f ) " D(r, r , f ) . (1)c ref c
EXC (fc, rref) is the contribution of the source to the hypo-central distance rref; this arbitrary reference hypocentral dis-tance is chosen in between the hypocentral distance data set
distribution, and large enough to avoid the effect of sourcedepth error in the hypocentral distance. The distance of 40km satisfies these conditions, and it is the same in similarstudies in other regions, so we can compare the results. SITE( fc) is the site term. D (r, rref , fc) is the crustal propagationterm, and represents an estimate of the average crustal re-sponse for the region. For representing the distance depen-dence of observed motion, we approximate the attenuationterm as a piece-wise linear function (Anderson and Lei,1994; Harmsen, 1997):
D(r, r , f ) ! ! L (r) D , (2)ref c i i
where Li(r) is a linear interpolation function and Di are nodevalues such that D (ri, fc) " Di. We select the number (n)and the spacing between the nodes, based on the distributionof data with distance. The regression may fit any curvaturein the actual distance dependence.
Equation (1) allows us to cast all available observationsinto large matrices—one for each central frequency—thatare independently inverted to obtain excitation, site, andpropagation terms. In each regression, the degrees of free-dom of the system may be reduced by forcing the propa-gation term to be zero at the reference distance, and by con-straining a reference site term (in general, the average of asubset of site terms) to a reference (in our case, null) value.The first constraint completely decouples the propagationterm from the source/site ones. The second constraint forcesany systematic effect acting on the reference site(s) into theexcitation terms. After identifying the station that is leastaffected by local effects, we decided to force only the ver-tical site term of this station (S6R) to be null. The horizontalcomponents and the other station’s vertical components wereleft free to vary during the regressions.
The constraint imposed on the vertical component ofthe site term implies that excitation and propagation termsare referred to the vertical motions observed at the S6R sta-tion. As observed by Atkinson (1993, 2005), we supposehorizontal S-wave ground motions to decay with distance inthe same way as the vertical motions do. This assumptionwas thoroughly investigated in a new study by Hermann and
Ground-Motion Scaling in Eastern Sicily, Italy 571
nunb
er o
f rec
ordi
ngs
10 0
10 1
10 2
10 3
0 1 2 3 4 5
magnitude
0 20 40 60 80 100 120 140
0 50 100 150
Hypocentral Distance (km)
S1RS2RS3RS4RS5RS6RS7R
S8RS9R
05
1015
2025
Dep
th (
km)
0 10 20 30 40
number of events
10 0
10 1
10 2
10 3
nunb
er o
f rec
ordi
ngs
Hypocentral Distance (km)
A
C
B
D
Figure 2. Characteristics of our data set of seismograms recorded in Eastern Sicily.(A) source-receiver distance distribution; (B) distribution of recordings as a functionof event depth; (C) number of recordings as a function of magnitude; (D) number ofrecordings as a function of hypocentral distance.
Malagnini et al. (2004) in which they synthesized 240 earth-quakes with different focal mechanisms and crustal velocitystructure. They observed that vertical ground motions de-pend upon focal mechanism, and, for strike-slip mecha-nisms, horizontal and vertical components didn’t show thesame behavior: in this case H/V ratios can change with dis-tance. We removed from the regression both horizontal com-ponents of the S7R station due to a bad signal-to-noise ratio.Nevertheless, the regression code would have rejected themon the ground of specific signal to noise ratio analyses. Thelast constraint applied on the regression is a smoothness con-straint on D (r, rref , fc) so that:
D # 2D " D ! 0 . (3)i#1 i i"1
Results
Duration of Ground Motions
In general, duration of ground motions depends on rup-ture duration and on wave dispersion. Following Raoof et
al. (1999), we define the duration of the ground motionsrecorded on each filtered seismogram, for each central fre-quency, as the time window bracketing the 5%–75% of theseismic energy that follows the S-wave arrival. An estimateof duration of the seismic signal as a function of frequencyand hypocentral distance is needed for using RVT and forobtaining a theoretical prediction for the attenuation of thepeak ground velocity. The 5%–75% rule is chosen after in-vestigating the distribution of the peak values in all fre-quency bands. In other words, each peak value of the band-pass-filtered seismograms, given the corresponding spectralamplitude and 5%–75% duration, is predicted via RVT, to-gether with a tolerance factor. With this definition of dura-tion, most peaks were successfully predicted and lie withinone tolerance factor from the observed value.
Individual duration values are regressed as a functionof distance by using the same linear interpolation schemeused for regressing the amplitudes. At 1.0 Hz, duration dataare severely scattered. For the other central frequencies, du-ration seems to be almost independent of frequency (Fig. 3).

572 L. Scognamiglio, L. Malagnini, and A. Akinci
1.0 Hz 2.0 Hz 3.0 Hz
20 40 60 20 40 60 20 40 60
30
0
10
20
4.0 Hz
0
10
20
306.0 Hz 8.0 Hz
20 40 60 20 40 60 20 40 60
10.0 Hz
0
10
20
3014.0 Hz
16.0 Hz
20 40 60 20 40 60 20 40 60
5% -
75%
Dur
atio
n (s
)
Hypocentral Distance (km)
Figure 3. Duration of the seismic signals and associated standard errors as a func-tion of hypocentral distance for each frequency studied. A linear interpolation schemeis used in the regressions for intermediate distances.
Crustal Attenuation
Colored curves in Figure 4 show our empirical estimatesfor the crustal attenuation terms at the different central fre-quencies. These curves are plotted as the deviation from a1/r trend (horizontal lines in the figure represent a decay #1/r) of the normalized attenuation functions.
Black lines represent theoretical predictions of the at-tenuation functions obtained for each central frequencythrough the equation:
D(r, r , f ) ! log g(r) # log g(r )ref ref
pf(r # r )ref# log e . (4)bQ( f )
Curves in Figure 4 are sensitive to the duration T, to thefunctional form of geometrical spreading g(r), to the qualityfactor Q( f ), and to its frequency dependence. The best fit isobtained with the crustal attenuation parameter:
gQ( f ) ! Q ( f/f ) with f ! 1.0,0 ref ref (5)Q ! 400 and g ! 0.26 ,0
and the following (continuous) geometrical spreading func-tion:
g(r) ! 1/r r ! 40 km(6)#0.4g(r) ! (1/40)(40/r) r $ 40 km .
The parameter g determines spreading of the set of curves.For g ! 1, curves would lie on top of one another. Thecrustal attenuation parameter Q0 trades off with the geo-metrical spreading function, since both act on the steepnessof the decay with distance.
Site Terms
Figure 5A shows the results of the regressions relativeto the vertical site terms. Due to the constraint imposed onthe site terms during the regressions, each curve is the de-viation of the specific site from station S6R. There are nolarge deviations of the vertical site terms from S6R at variousfrequencies. Details on the site characteristics are shown inTable 1. A more interesting behavior is shown by the hori-zontal site terms, which are investigated through the use of

Ground-Motion Scaling in Eastern Sicily, Italy 573
Figure 4. Colored curves are the empiricalpropagation term D (r, rref, fc) at the centralfrequencies of 1.0, 2.0, 3.0, 4.0, 5.0, 6.0, 8.0,10.0, 12.0, 14.0, 16.0 Hz, resulting from theregression of the peak value of the data setwaveforms. The attenuation term was forced tozero at the reference distance rref ! 40 km.Black lines represent our theoretical predic-tions, which were obtained for each central fre-quency through the use of RVT.
the horizontal-to-vertical site term ratios (Fig. 5B). Theseratios, calculated for each station for the horizontal compo-nent resulting from compositions of the radial and transversecomponents, seem more affected by the local geology of thesubstratum. Unfortunately, our knowledge about the localgeology of station’s sites is limited to the informationshowed in Table 1. We can only suppose that the peculiarspectral ratios’ behavior, showed by stations S1R and S3R,could be explained with phenomena related to the less-con-solidated formations below them (i.e., impedance contrastand/or resonance effects).
Excitation Terms
Black diamonds in Figure 6 show the excitation termsexc(fc, rref), obtained from the regression on peak groundvelocities. They describe the vertical peak ground-motionvelocity as a function of frequency at the reference hypo-central distance of 40 km, and at the S6R station site.
We fit the empirical excitation curves with the followingspectral model:
exc( f , r ) ! C(2pf ) M s( f ) g(r )c ref 0 ref (7)gexp[#(pr )/(bQ ( f/f ) )] m( f ) exp(#pfj ) ,ref 0 ref 0
where the rock site amplification m( f ) is fixed to 1.0. Theconstant C controls the low-frequency spectral amplitudes,while the stress parameter and the attenuation parameter j0
determine the high-frequency part of the theoretical spectra.The parameters used in the constant C are the radiation pat-tern, RHU, the partition of total shear-waves energy into hor-izontal components, V, and the effect of the free surface, F.These parameters were calibrated through waveform mod-eling of the largest event (the only one for which broadbandwaveforms were available). The earthquake was inverted us-ing the technique by Zhu and Helmberger (1996) and resultsin a moment magnitude Mw 3.8.
A tradeoff exists between the stress parameter and j0,as shown in Figure 7. j0 governs the high-frequency decayof the theoretical excitation terms, as well as Dr, which af-fects the radiated spectra beyond their corner frequencies. Inthe frequency band of our interest, however, the effect of Dris strongest for the largest earthquakes, while j0 completelycontrols the behavior of the small earthquakes at high fre-quency. For these reasons, we initially search the best j0 inorder to fit the average shape of the small magnitude events(i.e., smaller than 2.3), and then we adjust the spectral levelsat larger magnitudes (Mw $ 3.5) by using the appropriateDr. The values taken by the different parameters in equation(6) are shown in Table 2.
Di Bona et al. (1995) evaluated the source and the at-tenuation parameters for the 1990, MS 5.3, Eastern Sicilyearthquake. They estimated k-values, for each station site,ranging between 0.033 sec and 0.045 sec, fitting the S-waveacceleration spectra with an omega-square model (Boore,1986). They also found a stress-drop value from 21 to 200MPa calculated at regional and local distance, respectively.This variety of values for the stress parameter and k wasattributed by the authors to crustal heterogeneities and near-receiver amplification due to surface geology and topogra-phy, although it could also represent the effects of unac-counted attenuation. Our estimate of j0 is conceptuallydifferent from the ones computed by Di Bona et al. (1995),and originally proposed by Anderson and Hough (1984),since the former is distance-independent and refers to theaverage network site.
The residuals from the regressions show an almostGaussian distribution, characterized by a light degree ofskewness, which is amplified by the log–log presentation(Fig. 8). Nevertheless, the inversions are performed usingthe L-1 norm. Residuals refer to data points at all frequen-cies. Each residual is computed by subtracting the amplitude,calculated using equation (1), from the amplitude of the ob-served peak. Because of the presentation, the presence of

574 L. Scognamiglio, L. Malagnini, and A. Akinci
1
3
5
7
1
3
5
7
1 2 5 10 20
-1
1
3
5
7
0.5 1 2 5 10 20 0.5 1 2 5 10 20
S4R
S8R S9R
S2R S3R
S5R S6R
S1R
Hor
izon
tal t
o V
ertic
al R
atio
F r e q u e n c y ( H z )
A
B
Sit
e T
erm
s Z
-co
mp
- 0 . 6
- 0 . 4
- 0 . 2
0 . 0
0 . 2
0 . 4
0 . 6
0 . 8
P e a k A m p l i t u d e
Fr e q u e n c y ( H z )
0 . 5 1 . 0 2 . 0 5 . 0 1 0 . 0 2 0 . 0
Figure 5. (A) Vertical site terms obtained from the regression. Each curve describesthe deviation of the specific site from the S6R station’s site that was forced to zeroduring the regression. (B) Horizontal-to-vertical ratio for each site as a function offrequency.
outliers in any frequency band would be easily detected. Forthe same reason, differences in behavior for the differentfrequency bands would be easily detected, too.
Predicted Ground Motions
Using the source and the attenuation parameters esti-mated in this study and a set of programs called Stochastic
Model SIMulation (SMSIM; Boore, 1996) we predicted theexpected PGA and the 5% damping pseudoacceleration spec-tra (PSA) for the eastern Sicily region.
Figure 9A shows the comparison, at moment magnitudeMW 5.0, between the attenuation relation evaluated in thisstudy, the attenuation relation obtained regressing onlystrong-motion data from Sabetta and Pugliese (1996) forItaly and Ambraseys et al. (1996) for the Mediterranean re-

Ground-Motion Scaling in Eastern Sicily, Italy 575
Frequency (Hz)0.5 1 2 5 10 20
-8
-7
-6
-5
-4
-3E
xcita
tion
Ter
ms
at 4
0 km
(lo
g[m
/s])
Mw=1.5
Mw=1.8
Mw=2.0
Mw=2.2
Mw=2.5
Mw=3.8
Peak AmplitudeZ-comp.
Figure 6. Estimated excitation terms of the peak-filtered velocity at the reference distance of 40 km.Gray line is our theoretical prediction performed byusing the RVT and the source parameters in Table 2.We show only some empirical curves for a better vi-sual inspection.
gion, and those obtained using background seismicity for theeastern Alps (Malagnini et al., 2002), for the Apennines(Malagnini, Hermann, and Di Bona, 2000) and for the west-ern Alps (Morasca et al., unpublished manuscript, 2005).
Comparisons are made in terms of epicentral distance,and so we transformed the hypocentral distances of our dataset using a fixed focal depth of 15 km; that is, the depth ofthe largest earthquake recorded in the Eastern Sicily (13 De-cember 1990, MS 5.3, Augusta earthquake). Curves by Am-braseys et al. (1996) are calculated using the fault distanceinstead of epicentral distance. Fault and epicentral distanceare nearly the same for small earthquakes, or for very largedistances, but their difference could be significant at localdistances, as the magnitude gets larger due to the dimensionsof the fault. This is not the case of this study, in which wework with moderate magnitude.
Eastern Sicily PGA results are slightly higher with re-spect to the other predictions. This result comes from achange in attenuation of seismic waves when comparing re-gions with different tectonic regimes. A recently deformedregion, the Appenines, has strong attenuation, Q( f ) ! 130f 0.1 (Malagnini, Hermann, and Di Bona, 2000), while atten-
uation is lower in western Alps (Q( f ) ! 310 f 0.2) due to theshallow depth of the crystalline basement, and here (Q( f ) !400 f 0.26) where the seismic waves travel in the more stablecrust of the Hyblean foreland.
We also compared (Fig. 9B) the acceleration responsespectra for 5% damping, computed using the parameters ofTable 2, at magnitude 5.0 and frequency of 1 Hz, to anempirical response spectra of Sabetta and Pugliese (1996),Ambraseys et al. (1996), and data from the other Italian re-gions. According to new studies on the relationship existingbetween stress parameter and magnitude (Bodin et al.,2004), the predicted amplitudes at MW 5.0 were obtainedwith a slightly larger stress parameter (40 MPa).
Discussion and Conclusions
Results of this study are valid in a wide frequency range(1.0–16.0 Hz), for small magnitude (Mw ! 3.8), and at dis-tances less than 70 km. We give a quantitative evaluation ofthe eastern Sicily ground-motion parameters in order to de-crease the uncertainties for seismic hazard. Our results areobtained through regressions of 1311 bandpassed wave-forms, recorded by nine digital stations equipped withMARK-L4-3D sensors.
A crustal propagation term is obtained by modeling theempirical results with a crustal attenuation parameter Q( f ),and a bilinear geometrical spreading defined as:
0.26Q( f ) ! 400 ( f ) ;g(r) ! 1/r r ! 40 km
#0.4g(r) ! (1/40)(40/r) r $ 40 km .
A tradeoff exists between Q0 and g(r) at short distances,while we uniquely define the parameter g (in equation [5])that is effectively decoupled from the other attenuation pa-rameter j0 (in equation [7]) by forcing the propagation termto be zero at the reference distance. Q( f ) and g(r) describethe averaged attenuative characteristics of the crust in easternSicily.
There is a previous estimate of Q( f ) available for east-ern Sicily obtained by Giampiccolo et al. (2003), althoughthey used a constant geometrical spreading proportional to1/r. There is a clear tradeoff between geometric and anelasticattenuation; for this reason, we do not compare our estimateof Q with the one produced by Giampiccolo et al. (2003).
By using the same approach used in this study, otherauthors have found different Q( f ) relations for other Italianregions. In the western Alps Q( f ) ! 310 ( f )0.2 (Morasca etal., unpublished manuscript, 2005), while in the eastern AlpsQ( f ) ! 260 ( f )0.55 (Malagnini et al., 2002). Lower Q-valueswere found in the Apennine and in Colfiorito area (Q( f ) !130 ( f )0.1). These differences are linked with the differentgeologic and tectonic settings of the areas and they play akey role in hazard studies.

576 L. Scognamiglio, L. Malagnini, and A. Akinci
Exc
itatio
n at
40
km
1e-10
1e-09
1e-08
1e-07
1e-06
1e-05
0.0001
0.001
0.01
0.1
0.01 0.1 1 10
Frequency (Hz)
Mw 2.0
Mw 5.0
!0 = 0.005!0 = 0.005
!0 = 0.04
"# = 0.4 MPa "# = 4 MPa
"# = 40 MPa
"# = 40 MPa
"# = 0.4 MPa "# = 4 MPa
Figure 7. Tradeoff existing between Drand j0. We show velocity spectra at two ref-erence magnitudes (Mw 2.0 and Mw 7.0), de-rived by using the Brune spectral model withthree different values for the stress parameterDr, and for two different values of the high-frequency attenuation parameter j0. Spectraare propagated to the reference distance of 40km using the propagation characteristics of theSicilian crust. The two values of j0 genericallyrefer to rock sites (0.005 sec), and to moder-ately attenuating sites (0.04 sec). The three val-ues of stress parameter are within a normalrange of variability.
Table 2Parameters of the Spectral Model Used to Compute the
Theoretical Excitation Terms of Figure 6
High-Frequency Ground-Motion Model Parameters
C ! RHU VF/4pqb3
RHU ! 0.80; V ! 0.707; F ! 2.0; q ! 2.8 g/cm3; b ! 3.5 km/secs( f ) ! 1/[1 " ( f/fa)
2]fa ! 4.9 $ 106 b (Dr/M0)
1/3 HzDr ! 20 MPaj0 ! 0.01
m( f ) ! 1.0
-3 -2 -1 0 1 2 3residual amplitude (log unit)
410
310
210
110
010
num
ber
of r
esid
uals
Figure 8. Residuals computed in the regression ofpeak amplitude at all frequencies.
We reproduced the seismic spectra at r ! rref using aBrune spectral model with a stress drop Dr ! 20 MPa, ageneric rock site amplification factor m( f ) ! 1.0, and thehigh-frequency cutoff parameter j0 ! 0.01 sec.
Di Bona et al. (1995), analyzing the 1990 Eastern Sicilyearthquake for source and attenuation parameters, found a jvalue of 0.040 % 0.005 sec (most of the strong-motion sta-tions were located on the Iblean platform). Based on ourresults, crustal wave propagation in eastern Sicily is moreefficient than in other Italian regions. The combination ofthe geometrical spreading function and the parameter Q( f )is strictly related to the crustal characteristics of the HybleanPlateau, where most of the investigated seismic rays trav-eled. This portion of the African foreland is essentially sta-ble: according to seismic interpretations of Finetti (1982), itis made of about 8.8-km-thick Permo-Triassic–Tertiary car-bonates and volcanic rocks underlined by a 7.2-km-thickcrystalline basement and 7.0-km-thick lower crust.
Finally, for investigating the horizontal site behavior,we calculated the spectral ratios between the average of thehorizontal components and the vertical ones for each stationsite (Fig. 5B). The observed H/V ratios show different be-haviors for different geologic site formations.
Acknowledgments
The authors would like to particularly thank Andrea Ursino and Giu-seppe di Grazia of the Insituto Nazionale di Geofisica e Vulcanologia, Ca-tania, for providing us with the earthquake data set. We thank Dr. LupeiZhu, Department of Earth and Atmospheric Sciences, St. Louis University,for providing us with the moment tensor solution of the biggest data setevent. We thank Marco Olivieri for helpful discussions and for his criticism.We also thank the reviewers for their useful comments, which helped usto improve the article. This study was supported by the Ministerodell’Universita’ e della Ricerca Scientifica, Dipartimento per la Program-mazione, il Coordinamento e gli Affari Economici, Servizio per lo Sviluppoe il Potenziamento delle Attivita’ di Ricerca (SSPAR), under contract FIRB,Prot. RBAU013NRZ.

Ground-Motion Scaling in Eastern Sicily, Italy 577
A
B
Figure 9. Estimation of peak ground accel-eration (A) and response spectra 5% damping(B), computed for Mw 5.0 earthquake at hard-rock site. Results for this study, derived fromsource parameters in Table 2 and the attenua-tion parameters obtained by fitting the empir-ical curves in Figure 4, are compared with at-tenuation relation obtained by Malagnini,Hermann, and Di Bona (Apennines, 2000) andMalagnini et al. (Eastern Alps, 2002), Morascaet al. (Western Alps, unpublished manuscript,2005), and Sabetta and Pugliese (1996)(dashed curves); and Ambraseys et al. (1996)(dotted curves). To model the absolute level ofground shaking, we estimated the stress param-eter of the largest event to be Dr ! 40 MPa.
References
Abrahamson, N. A., and W. J. Silva (1997). Overview, Seism. Res. Lett.68, 9–23.
Adam, J., C.-D. Reuther, M. Grasso, and L. Torelli (2000). Active faultkinematics and crustal stresses along the Ionian margin of southeast-ern Sicily, Tectonophysics 326, 217–239.
Aki, K., and B. Chouet (1975). Origin of coda waves: source attenuation,and scattering effects, J. Geophys. Res. 80, 3322–3342.
Akinci, A., C. Mueller, L. Malagnini, and A. Lombardi (2004). Seismichazard estimate in the Alps and Apennines (Italy) using historicalseismicity and regionalized predictive ground-motion relationships,Boll. Geo. Teo. App. 45, 285–304.
Akinci, A., L. Malagnini, N. A. Pino, L. Scognamiglio, R. B. Hermann,and H. Eyidogan (2001). High-frequency ground motion in the Er-zincan region. Turkey: inferences from small earthquakes, Bull.Seism. Soc. Am. 91, 1446–1455.
Amato, A., R. Azzara, A. Basili, C. Chiarabba, M. Cocco, M. Di Bona, and
G. Selvaggi (1995). Main shock and aftershocks of the 13 December1990, Eastern Sicily earthquake, Ann. Geofis. 38, no. 2, 255–266.
Ambraseys, N. N., K. A. Simpson, and J. J. Bommer (1996). Prediction ofhorizontal response spectra in Europe, Earthquake Eng. Struct. Dyn.25, 371–400.
Anderson, J. G., and S. E. Hough (1984). A model for the shape of theFourier amplitude spectrum of acceleration at high frequencies, Bull.Seism. Soc. Am. 74, 1969–1993.
Anderson, J. G., and Y. Lei (1994). Nonparametric description of peakacceleration as a function of magnitude, distance, and site in Guerrero,Mexico, Bull. Seism. Soc. Am. 84, 1003–1017.
Atkinson, G. M. (2005), Ground-motion relations for earthquake in south-western British Columbia and northwestern Washington: crustal, in-slab and offshore events, Bull. Seism. Soc. Am. 95, no. 3 (in press).
Atkinson, G. M. (1993). Notes on ground-motion parameters for easternNorth America—duration and H/V ratio, Bull. Seism. Soc. Am. 83,587–596.
Azzaro, R., and S. Barbano (2000). Analysis of the seismicity of the South-

578 L. Scognamiglio, L. Malagnini, and A. Akinci
eastern Sicily: a proposed tectonic interpretation, Ann. Geofis. 43,171–188.
Basili, A., M. Cocco, and E. Boschi (1995). Preface to the collection ofpapers on the 1990 Eastern Sicily earthquake, Ann. Geofis. 38, no. 2,221–222.
Bay, F., D. Fah, L. Malagnini, and D. Giardini (2003). Spectral shear-waveground motion scaling for Switzerland, Bull. Seism. Soc. Am. 93,414–429.
Bodin, P., L. Malagnini, and A. Akinci (2004). Ground motion scaling inthe Kachchh basin, India, deduced from aftershocks of the 2001 MW
7.6 Bhuj earthquake, Bull. Seism. Soc. Am. 94, 1658–1669.Bonaccorso, A., and D. Patane (2001). Shear response to an intrusive epi-
sode at Mt. Etna volcano (January 1998) inferred through seismic andtilt data, Tectonophysics 334, 61–75.
Boore, D. M. (1986). Short-period P- and S- wave radiation from largeearthquakes: implication for spectral scaling relation, Bull. Seism. Soc.Am. 76, 43–64.
Boore, D. M. (1996). SMSIM: Fortran programs for simulating groundmotion from earthquakes, version 1.0, Geol. Surv. Open-File Report96-80A, 73 pp.
Boore, D. M. (2001). Comparison of ground motions from the 1999 Chi-Chi earthquake with empirical predictions largely based on data fromCalifornia, Bull. Seism. Soc. Am. 91, 1212–1217.
Boore, D. M., and W. B. Joyner (1997). Site amplification for generic rocksites, Bull. Seism. Soc. Am. 87, 327–341.
Boore, D. M., W. B. Joyner, and T. E. Fumal (1997). Equations for esti-mating horizontal response spectra and peak acceleration from west-ern North American earthquakes: a summary of recent work, Seism.Res. Lett. 68, 128–153.
Boschi, E., G. Ferrari, P. Gasperini, E. Guidoboni, G. Smiriglio, and G.Valensise (Editors) (1995). Catalogo dei forti terremoti in Italia dal461 a.C. al 1980, ING, Roma-SGA Bologna, 973 pp.
Campbell, K. W. (1997). Empirical near-source attenuation relationshipsfor horizontal and vertical components of peak ground acceleration,peak ground velocity, and pseudoabsolute acceleration response spec-tra, Seism. Res. Lett. 68, 154–179.
Campbell, K. W. (2001). Appendix to “Strong motion attenuation relations:community and discussion of selected relations,” in IASPEI Hand-book of Earthquake and Engineering Seismology, W. H. K. Lee (Ed-itor), Academic Press, San Diego, California.
Cartwright, D. E., and M. S. Longuet-Higgins (1956). The statistical dis-tribution of the maxima of a random function, Proc. R. Soc. LondonA237, 212–232.
Catalano, R., P. Di Stefano, A. Sulli, and F. P. Vitale (1996). Paleogeog-raphy and structure of the central Mediterranean: Sicily and its off-shore area, Tectonophysics 260, 291–323.
Catalano, R., A. Franchino, S. Merlini, and A. Sulli (2000). Central westernSicily structural setting interpreted from seismic profiles, Mem. Soc.Geol. It. 55, 5–16.
Chouet, B., K. Aki, and M. Tsujiura (1978). Regional variation of the scal-ing law of earthquake source spectra, Bull. Seism. Soc. Am. 68,49–79.
Di Bona, M., M. Cocco, A. Rovelli, R. Berardi, and E. Boschi (1995).Analysis of strong-motion data of the 1990 Eastern Sicily earthquake,Ann. Geofis. 38, no. 2, 283–300.
Ferrucci, F., G. Gaudiosi, A. Hirn, and R. Nicholich (1991). Ionian basinand Calbrian Arc. Some new elements from DDS data, Tectonophys-ics 195, 411–419.
Finetti, F. (1982) Structure, stratigraphy and evolution of central Mediter-ranean, Boll. Geofis. Teor. Appl. 24, 247–312.
Giampiccolo, E., S. Gresta, and G. Ganci (2003). Attenuation of bodywaves in southeastern Sicily (Italy), Phys. Earth Planet. Inter. 135,267–279.
Harmsen, S. (1997). Estimating the diminution of shear-wave amplitudewith distance: application to the Los Angeles, California, urban area,Bull. Seism. Soc. Am. 87, 888–903.
Hermann, R. B., and L. Malagnini (1996). Absolute ground-motion scalingin the New Madrid Seismic Zone, Seism. Res. Lett. 67, 40.
Hermann, R. B., and J. Dutt (1999). High-frequency vertical ground motionin the Pacific Northwest using PNSN data, Seism. Res. Lett. 70, 216.
Hermann, R. B., and L. Malagnini (2004). Interpretation of high-frequencyground motion from regional seismic network observations, Bull.Seism. Soc. Am (submitted).
Jeon, Y.-S. (2000). High-frequency earthquake ground motion scaling inUtah, Master’s Thesis, Saint Louis University, 106 pp.
Kramer, S. L. (1996). Geotechnical Earthquake Engineering, Prentice Hall,Upper Saddle River, NJ.
Lay, T., and T. C. Wallace (1995). Modern Global Seismology, AcademicPress, San Diego, 521 pp.
Lentini, F., S. Carbone, and S. Catalano (1994). Main structural domainsof the central Mediterranean region and their Neogene evolution, Boll.Geofis. Teor. Appl. 36, 103–125.
Makris, J., R. Nicolich, and W. Weigel (1986). A seismic study in thewestern Ionian Sea, Ann. Geophys. 4B, 665–678.
Malagnini, L., and R. B. Hermann (2000). Ground-motion scaling in theregion of the Umbria-Marche earthquake of 1997, Bull. Seism. Soc.Am. 90, 1041–1051.
Malagnini, L., R. B. Hermann, and M. Di Bona (2000). Ground-motionscaling in the Apennines (Italy), Bull. Seism. Soc. Am. 90, 1062–1081.
Malagnini, L., R. B. Hermann, and K. Koch (2000). Regional ground-motion scaling in central Europe, Bull. Seism. Soc. Am. 90, 1052–1061.
Malagnini, L., K. Mayeda, A. Akinci, and P. L. Bragato (2004). Estimatingabsolute site effects, Bull. Seism. Soc. Am. 94, 1343–1352.
Malagnini, L., A. Akinci, R. B. Hermann, N. A. Pino, and L. Scognamiglio(2002). Characteristics of the ground motion in northeastern Italy,Bull. Seism. Soc. Am. 92, 2186–2204.
Ortega, R., R. B. Hermann, and L. Quintinar (2002). High-frequency earth-quake ground-motion scaling in central Mexico between 0.7 and 7.0Hz, Bull. Seism. Soc. Am. 93, 397–413.
Raoof, M., R. B. Hermann, and L. Malagnini (1999). Attenuation and ex-citation of three-component ground motion in southern California,Bull. Seism. Soc. Am. 89, 888–902.
Reuther, C.-D., Z. Ben-Avraham, and M. Grasso (1993). Origin and roleof the major strike-slip transfer during plate collision in the centralMediterranean, Terra Nova 5, 249–257.
Rodriguez, M., J. Havskov, and J. S. Singh (1983). Q from coda wavesnear Petatlan, Guerrero, Mexico, Bull. Seism. Soc. Am. 73, 321–326.
Sabetta, F., and A. Pugliese (1987). Attenuation of peak horizontal accel-eration and velocity from Italian strong-motion records, Bull. Seism.Soc. Am. 77, 1491–1511.
Sabetta, F., and A. Pugliese (1996). Estimation of response spectra andsimulation of nonstationary earthquake ground motion, Bull. Seism.Soc. Am. 86, 337–352.
Sadigh, K., C.-Y. Chang, J. A. Egan, F. Makdisi, and R. R. Youngs (1997).Attenuation relationships for shallow crustal earthquakes based onCalifornia strong motion data, Seism. Res. Lett. 68, 180–189.
Samiezade-Yazde, M. R. (1993). Ground-motion studies in the SouthernGreat Basin of Nevada and California, Ph.D. Thesis, Saint Louis Uni-versity, 203 pp.
Sirovich, L., and F. Pettenati (1999). Seismotectonic outline of Southeast-ern Sicily: an evaluation of available options for earthquake faultrupture scenario, J. Seism. 3, 213–233.
Stucchi, M., A. Akinci, E. Faccioli, P. Gasperini, L. Malagnini, C. Meletti,V. Montaldo, and G. Valensise (2004). Mappa di Pericolosita’ Sis-mica, http://zonesismiche.mi.ingv.it (last accessed August 2004).
Zhu, L., and D. V. Helmberger (1996). Advancements in source estimationtechniques using broadband regional seismograms, Bull. Seism. Soc.Am. 86, 1634–1641.
Istituto Nazionale di Geofisica e VulcanologiaVia di Vigna Murata 60500143 Roma, Italy
(L.S., L.M., A.A.)
Manuscript received 17 June 2003.