New scaling for compressible wall turbulence
12
SCIENCE CHINA Physics, Mechanics & Astronomy © Science China Press and Springer-Verlag Berlin Heidelberg 2013 phys.scichina.com www.springerlink.com *Corresponding author (email: [email protected]) †Contributed by SHE ZhenSu (Associated Editor) • Article • New scaling for compressible wall turbulence † PEI Jie 1 , CHEN Jun 1 , FAZLE Hussain 2 & SHE ZhenSu 1* 1 State Key Laboratory for Turbulence and Complex Systems and Dept of Mechanics, College of Engineering, Peking University, Beijing 100871, China; 2 Department of Mechanical Engineering, University of Houston, Houston, Texas 77204, USA Received April 3, 2013; accepted April 26, 2013 Classical Mach-number (M) scaling in compressible wall turbulence was suggested by van Driest (Van Driest E R. Turbulent boundary layers in compressible fluids. J Aerodynamics Science, 1951, 18(3): 145–160) and Huang et al. (Huang P G, Cole- man G N, Bradshaw P. Compressible turbulent channel flows: DNS results and modeling. J Fluid Mech, 1995, 305: 185–218). Using a concept of velocity-vorticity correlation structure (VVCS), defined by high correlation regions in a field of two-point cross-correlation coefficient between a velocity and a vorticity component, we have discovered a limiting VVCS as the closest streamwise vortex structure to the wall, which provides a concrete Morkovin scaling summarizing all compressibility effects. Specifically, when the height and mean velocity of the limiting VVCS are used as the units for the length scale and the velocity, all geometrical measures in the spanwise and normal directions, as well as the mean velocity and fluctuation (r.m.s) profiles become M-independent. The results are validated by direct numerical simulations (DNS) of compressible channel flows with M up to 3. Furthermore, a quantitative model is found for the M-scaling in terms of the wall density, which is also validated by the DNS data. These findings yield a geometrical interpretation of the semi-local transformation (Huang et al., 1995), and a conclusion that the location and the thermodynamic properties associated with the limiting VVCS determine the M-effects on supersonic wall-bounded flows. compressible channel flow, coherent structures, correlation structures, Morkovin’s hypothesis PACS number(s): 47.27.nd, 47.27.De, 47.40.-x Citation: Pei J, Chen J, Fazle H, et al. New scaling for compressible wall turbulence. Sci China-Phys Mech Astron, doi: 10.1007/s11433- 013-5147-9 1 Introduction In recent years, Morkovin’s hypothesis [1] has been the subject of much theoretical study of compressible wall- bounded flows [1–3]: at moderate Mach number (M<5), the essential dynamics of compressible flows remains invariant when properly rescaled by the mean thermodynamic quanti- ties (density, temperature, etc.). Two well-known proposals inspired by Morkovin’s hypothesis are the so-called the van Driest density-weighted transformation [4] for the mean velocity and semi-local scaling [5] for the root-mean-square (r.m.s) fluctuation, both of which map the property of the compressible flow to its incompressible counterpart. The M-invariant forms serve as important standards to validate turbulence models and numerical simulations of compressi- ble wall-bounded flows. However, the physical origin of Morkovin’s hypothesis is little explored. For instance, what is the geometrical interpretation of the Morkovin’s hypothe- sis? In other words, how do the geometrical properties of the structures vary with M? If such interpretation exists, it would be possible to derive more accurate transformations, compared to the van Driest or the semi-local, which is rele- vant to the quantitative understanding of compressible wall doi: 10.1007/s11433-013-5147-9
Transcript of New scaling for compressible wall turbulence

SCIENCE CHINA Physics, Mechanics & Astronomy
© Science China Press and Springer-Verlag Berlin Heidelberg 2013 phys.scichina.com www.springerlink.com
*Corresponding author (email: [email protected]) †Contributed by SHE ZhenSu (Associated Editor)
• Article • February 2013 Vol.56 No.2: 1–12
doi: 10.1007/s11433-013-5147-9
New scaling for compressible wall turbulence†
PEI Jie1, CHEN Jun1, FAZLE Hussain2 & SHE ZhenSu1*
1 State Key Laboratory for Turbulence and Complex Systems and Dept of Mechanics, College of Engineering, Peking University, Beijing 100871, China;
2 Department of Mechanical Engineering, University of Houston, Houston, Texas 77204, USA
Received April 3, 2013; accepted April 26, 2013
Classical Mach-number (M) scaling in compressible wall turbulence was suggested by van Driest (Van Driest E R. Turbulent boundary layers in compressible fluids. J Aerodynamics Science, 1951, 18(3): 145–160) and Huang et al. (Huang P G, Cole-man G N, Bradshaw P. Compressible turbulent channel flows: DNS results and modeling. J Fluid Mech, 1995, 305: 185–218). Using a concept of velocity-vorticity correlation structure (VVCS), defined by high correlation regions in a field of two-point cross-correlation coefficient between a velocity and a vorticity component, we have discovered a limiting VVCS as the closest streamwise vortex structure to the wall, which provides a concrete Morkovin scaling summarizing all compressibility effects. Specifically, when the height and mean velocity of the limiting VVCS are used as the units for the length scale and the velocity, all geometrical measures in the spanwise and normal directions, as well as the mean velocity and fluctuation (r.m.s) profiles become M-independent. The results are validated by direct numerical simulations (DNS) of compressible channel flows with M up to 3. Furthermore, a quantitative model is found for the M-scaling in terms of the wall density, which is also validated by the DNS data. These findings yield a geometrical interpretation of the semi-local transformation (Huang et al., 1995), and a conclusion that the location and the thermodynamic properties associated with the limiting VVCS determine the M-effects on supersonic wall-bounded flows.
compressible channel flow, coherent structures, correlation structures, Morkovin’s hypothesis
PACS number(s): 47.27.nd, 47.27.De, 47.40.-x
Citation: Pei J, Chen J, Fazle H, et al. New scaling for compressible wall turbulence. Sci China-Phys Mech Astron, doi: 10.1007/s11433- 013-5147-9
1 Introduction
In recent years, Morkovin’s hypothesis [1] has been the subject of much theoretical study of compressible wall- bounded flows [1–3]: at moderate Mach number (M<5), the essential dynamics of compressible flows remains invariant when properly rescaled by the mean thermodynamic quanti-ties (density, temperature, etc.). Two well-known proposals inspired by Morkovin’s hypothesis are the so-called the van Driest density-weighted transformation [4] for the mean
velocity and semi-local scaling [5] for the root-mean-square (r.m.s) fluctuation, both of which map the property of the compressible flow to its incompressible counterpart. The M-invariant forms serve as important standards to validate turbulence models and numerical simulations of compressi-ble wall-bounded flows. However, the physical origin of Morkovin’s hypothesis is little explored. For instance, what is the geometrical interpretation of the Morkovin’s hypothe-sis? In other words, how do the geometrical properties of the structures vary with M? If such interpretation exists, it would be possible to derive more accurate transformations, compared to the van Driest or the semi-local, which is rele-vant to the quantitative understanding of compressible wall
doi: 10.1007/s11433-013-5147-9
2 Pei J, et al. Sci China-Phys Mech Astron February (2013) Vol. 56 No. 2
turbulence. We attempt to address these issues in the present work.
The study of the geometry of coherent or organized mo-tions (CS) has a long history. Boundary layer measurements reveal quasi-streamwise vortices and low-speed streaks both in the near-wall region (y+<30) [6] and in the logarithmic region [7], and the study is extended to the outer region up to several boundary layer thicknesses in recent experiments [8]. In compressible flows, abundant large-scale organized motions, for example the hairpin vortex, quasi-stream vor-tex and streak, were experimentally visualized [9–11], and the bulges of structures are observed at the scale of , which contributes to the shear-stress-production in the outer layer [12,13]. These observations are qualitatively consistent with earlier hot-wire measurement of the large-scale motions in incompressible boundary layers [14], and the essential dy-namical process is found to be similar to the incompressible case [10].
The quantitative features of CS are recognized to be im-portant, but scarcely used in practical modeling. The very first quantitative study of the CS focused on the length scales of near-wall streaks in spanwise direction and its variation with the wall normal distance. Ref. [7] reported a spanwise spacing of low speed streaks in turbulent bounda-ry layers, +≈100, which was confirmed by Smith and Metzler (1983) up to Re=5830 [15]. The latter study re-ported also a spacing increase with the distance from the wall for y+<30. This spacing increase was further confirmed and characterized to be a linear function of the distance to the wall by Kim, Moin and Moser [16], using channel flow DNS data. On the other hand, outside the near-wall region, the identification and quantification of the spanwise growth become difficult, due to more developed fluctuations in the bulk flow. Compared to near-wall streaks, the streamwise vortices remain much less explored. Essentially none is re-ported for compressible wall-bounded flows. It is worth mentioning that Blackwelder & Eckelmann [17] reported a near-wall spacing of 34 in wall units for streamwise vortices in incompressible channel flow, much smaller than the spacing between streaks. The lack of practical significance of the above study stems from the fact that the geometrical information of the CS is never related to the mean quantities such as the mean velocity and the r.m.s profiles.
In the present study, we apply the concept of a newly- defined statistical structure, named velocity-vorticity corre-lation structure (VVCS) [18,19], which yields a series of geometrical measures of flow structures including height and spanwise spacing throughout the entire domain, to in-compressible and compressible channel flows up to M=3. This description defines a structure of particular importance, called limiting VVCS which is the nearest vortex structures to the wall. It is shown below that the physical measures (its height, spanwise spacing and its associated mean velocity and r.m.s amplitude) of the limiting VVCS form the basic normalization factors defining all M-invariant profiles in the
computed isothermal channel flows. The new transfor-mation replaces the semi-local transformation with a global one, based on the physical properties of the limiting VVCS, and yields an excellent collapse of profiles for all simulated Ms, as shown by our DNS data. These results also yield a model for describing the M-dependence of the structure height, the mean velocity profile and the velocity fluctua-tion amplitude (r.m.s), in terms of the wall density. Thus, for the first time, we establish a link between the geomet-rical information and the mean profiles, suggesting a poten-tial role of the CS in engineering models.
2 Velocity-Vorticity Correlation Structure (VVCS)
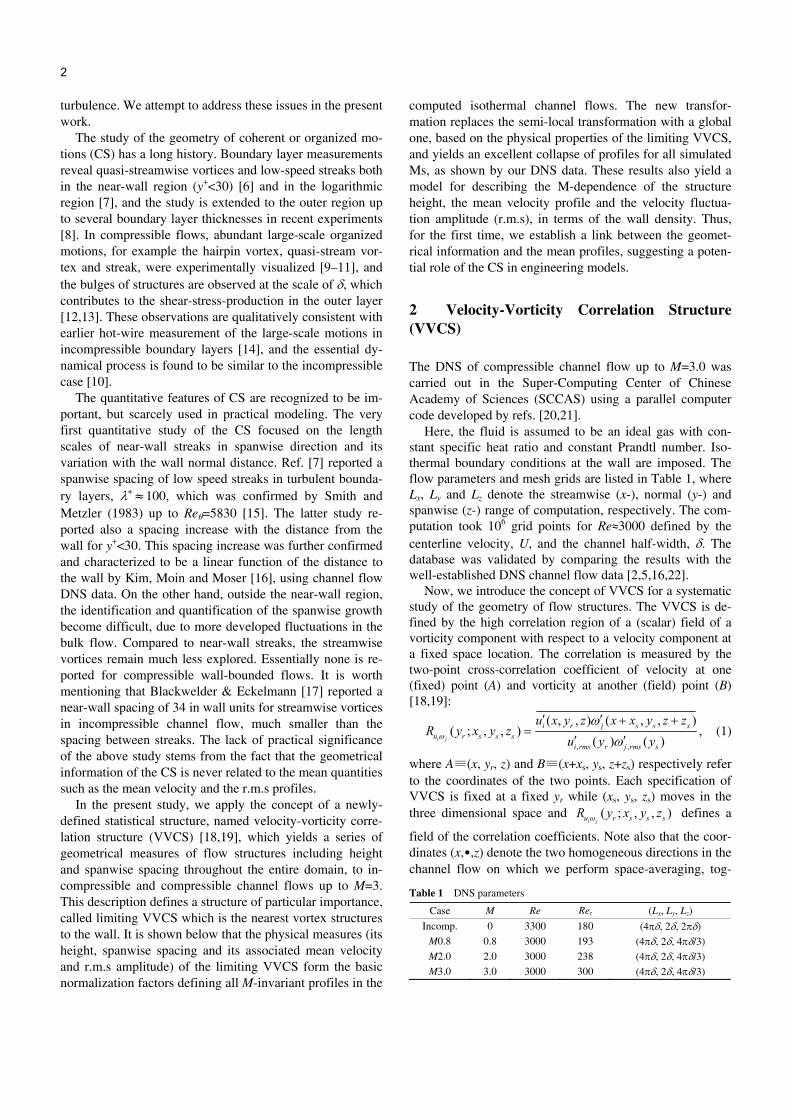
The DNS of compressible channel flow up to M=3.0 was carried out in the Super-Computing Center of Chinese Academy of Sciences (SCCAS) using a parallel computer code developed by refs. [20,21].
Here, the fluid is assumed to be an ideal gas with con-stant specific heat ratio and constant Prandtl number. Iso-thermal boundary conditions at the wall are imposed. The flow parameters and mesh grids are listed in Table 1, where Lx, Ly and Lz denote the streamwise (x-), normal (y-) and spanwise (z-) range of computation, respectively. The com-putation took 106 grid points for Re≈3000 defined by the centerline velocity, U, and the channel half-width, . The database was validated by comparing the results with the well-established DNS channel flow data [2,5,16,22].
Now, we introduce the concept of VVCS for a systematic study of the geometry of flow structures. The VVCS is de-fined by the high correlation region of a (scalar) field of a vorticity component with respect to a velocity component at a fixed space location. The correlation is measured by the two-point cross-correlation coefficient of velocity at one (fixed) point (A) and vorticity at another (field) point (B) [18,19]:
, ,
( , , ) ( , , )( ; , , ) ,
( ) ( )
i j
i r j s s su r s s s
i rms r j rms s
u x y z x x y z zR y x y z
u y y (1)
where A≡(x, yr, z) and B≡(x+xs, ys, z+zs) respectively refer
to the coordinates of the two points. Each specification of VVCS is fixed at a fixed yr while (xs, ys, zs) moves in the three dimensional space and ( ; , , )i ju r s s sR y x y z defines a
field of the correlation coefficients. Note also that the coor-dinates (x,•,z) denote the two homogeneous directions in the channel flow on which we perform space-averaging, tog-
Table 1 DNS parameters
Case M Re Reτ (Lx, Ly, Lz)
Incomp. 0 3300 180 (4, 2, 2) M0.8 0.8 3000 193 (4, 2, 4/3)
M2.0 2.0 3000 238 (4, 2, 4/3)
M3.0 3.0 3000 300 (4, 2, 4/3)

Pei J, et al. Sci China-Phys Mech Astron February (2013) Vol. 56 No. 2 3
Figure 1 (Color online) The mean velocity profile of compressible channel flows by DNS at M=0, 0.8, 2 and 3, compared to refs. [5, 22].
ether with time average. Eq. (1) is easy to compute from DNS data, in particular
for turbulent channel flows. In this paper, we focus on the streamwise component of the velocity, u′ and of vorticity
x , which are the important components for wall-bounded
flows. The volumes determined by the iso-surface of Ruωx at the threshold are defined as VVCSuωx, as shown in Figure 2. It can be seen that when the correlation magnitude reaches a threshold (about 0.1 in most cases), the iso-surfaces are geometrically well-defined and topologically invariant. At lower correlation magnitudes (e.g. |Ruωx|<0.02), as shown in Figure 2(a), the positive and negative correlation regions are randomly distributed in the whole computational domain. However, as the magnitude of |Ruωx| reaches a threshold 0.07 (see Figure 2(b)), the iso-surfaces of |Ruωx|, VVCSuωx, form four elongated volumes, two positive (bright) and two negative (dark). An enlarged view (see Figure 2(c)) shows that they are cross-situated with respect to the plane z=0.
The 2-D contours of |Ruωx| in the y-z plane are shown in Figure 3, from which we measure the scales of VVCSuωx.
Figure 2 The iso-surfaces of (a) |Ruωx|=0.02; (b) |Ruωx|=0.07; (c) the en-larged view of (b), defining VVCSuωx at yr
+=3. The dark (bright) iso-surfaces correspond to negative (positive) correlation Ruωx <0 (Ruωx >0).
Figure 3 (Color online) 2-D slice of VVCSuωx in (y-z) plane at x=0 at three normal distances: (a) y+
r=5.4; (b) y+r=46.6; (c) y+
r=72.8. Here, the solid/dash lines in bright/dark region correspond to positive/negative cor-relation structures. The location of maximum (or minimum) correlation coefficient in VVCSuωx is marked by the triangles and called structural location––yi
s, while the red cross + is the reference location yr. Note that the height of the NWCS (or ASCS) are y1
s=y2s (or y3
s=y4s). Note also that the
highlighted areas correspond to the volumes shown in Figure 2.
Let us denote the location of the local maximum of | |xuR
by (xis, y
is, z
is) (i=1, 2, …, 4), called structural coordinates,
which represent the centers of the most correlated regions to the velocity fluctuations at the reference wall-normal dis-tance, yr. In Figure 3(c), there are four most-correlated points for the four elongated structures. Hence, the eleva-tions and the spanwise coordinates of the structures as a function of reference wall-normal distance are obtained: yi
s=(yr) and zis =(yr) (i=1, 2, …, 4). Because of the sym-
metry in the spanwise direction, we have y1s= y2
s and y3
s=y4s. As observed in Figure 3, the near-wall pair of
structures have a nearly fixed y1s and y2
s≈3–5, being al-ways attached to the wall. In contrast, y3
s and y4s, for the
other pair, increase as yr increases. We call the first pair the near-wall correlation structures (NWCS), and the second pair the accompanying streamwise correlation structure (ASCS).
Note that the two flat NWCS have a longer streamwise extent in comparison to the ASCS. On the other hand, ASCS of two quasi-streamwise structures with opposite- signs, inclined away from the wall, resemble the conceptual model of counter-rotating streamwise vortices proposed by Blackwelder & Kaplan [23]. The measure of the spanwise spacing is obtained: Dz=z4
s–z3s≈2|z3
s|; its dependence on yr is discussed in the next section. Here, the geometry of

4 Pei J, et al. Sci China-Phys Mech Astron February (2013) Vol. 56 No. 2
VVCSuωx is parameterized by the reference distance, yr. Note that VVCSuωx are simultaneously present for small
y+r<100. Thus, one may conjecture that NWCSuωx stands as
the footprint or the near-wall signature of ASCSuωx. Ac-cording to conventional picture of the near-wall vortex dy-namics, the low-speed streaks, as schematically shown as the shading regions in Figure 4 are ‘pumped away’ from the wall between two counter-rotating quasi-streamwise vorti-ces. The low-speed streaks with velocity u- are positively correlated with the negative streamwise vorticity ( x
) on
the left side, and negatively correlated to the positive streamwise vorticity ( x
) on the right side, as suggested by
the common picture of the near-wall vortical motions [10,22,23]. These signs are consistent with the signs of the NWCSuωx and ASCSuωx; hence low-speed streaks are gener-ated between the pair of NWCSuωx.
Note also that as seen from Figure 4, the two NWCSuωx streamwise-stretched structures are flat (near the wall), while the two ASCSuωx ‘cigars’ are nearly circular. Either from the shape or close inspecting of the correlation calcu-lation, it is confirmed that in the flat structures of the NWCSuωx, / / v z w y ; in other words, the NWCSuωx
consists mainly of two convergent spanwise-arranged structures attaching to the wall at the two sides of the refer-ence point (see Figure 4), which favors the formation of low speed streaks right below the reference point (see Figure 4). On the other hand, the two shearing terms in the definition of x, i.e. / w y and / , v z are of the same order in
the ASCSuωx, so that, statistically, the structure is more cir-cular, indicating its strong association with the streamwise vortices. This argument supports the conceptual link be-tween the VVCS and commonly accepted near-wall vortex structures, although an intimate bridge is yet to be built.
Interestingly, the VVCS involves only a computation of two-point correlation coefficients which are easy to carry out using DNS data. As shown in Figure 3, the correlation coefficients define a few locations of large correlations, from which we can quantify the geometry of the VVCSuωx. In the next section, we will study the variations of these
Figure 4 VVCSuωx and a model picture of a pair of counter-rotating streamwise vortices [23]. Here, both the vortices and streaks are qua-si-periodic in the spanwise direction.
geometrical measures including the height and the width of VVCS as a function of yr and M. With these variations, we define the geometrical similarity of structure in compressi-ble flows.
3 Geometrical similarity and scaling of VVCSuωx
We now carry out quantitative measures of the VVCSuωx at all Ms from the DNS data. Figure 5(a) and (b) show the top view and the side view of the projection of isosurface de-fining the VVCSuωx at yr
+=2, very close to the wall. Physi-cally, these VVCSuωx structures represent the volumes of correlated vorticity, which are the most correlated with the near-wall velocity fluctuations (yr→0). It can be seen that the extent of both ASCSuωx and NWCSuωx increases with M. At M=3, the streamwise extent almost reaches the entire streamwise computational scale (periodic in the x-direction). This observation is consistent with the results of Coleman et al. [3] (see Figure 6 in Coleman et al. 1995) using the fluc-tuation of the vertical vorticity component, namely, a re-markable increase of the length of streaks with increasing M. This rapid increase of the length indicates an enhancement of the degree of coherence in the near-wall region due to higher gradient of temperature or density at the isothermal wall condition (cooled-wall).
The geometrical similarity of the near-wall VVCSuωx is also remarkable, at all Ms, as shown in Figure 5. This simi-larity, when quantitatively measured, is used to yield a tran-
Figure 5 (Color online) The top view (a) and side view (b) of VVCSuωx at four Ms (The first one is response to incompressible case, and the last one denotes M=3.0 case) for y+
r=2, very close to the wall. The grid scale is 200×200 in wall viscous units.

Pei J, et al. Sci China-Phys Mech Astron February (2013) Vol. 56 No. 2 5
sformation which characterizes a concrete Morkovin scaling for compressible channel flow. In the rest of this section, we quantitatively discuss this geometrical similarity.
Traditionally, two units are used to quantify compressi-ble channel flows—the widely used wall unit defined by the wall friction velocity and the viscosity, and the so-called semi-local coordinate. In the wall unit, the length unit is lν=ν/uτ, where, ν is the kinetic viscosity, u=(w/w)0.5 and τw and w are the wall shear stress and density. Hereinafter, normalization by the wall unit is denoted with superscript “+”. On the other hand, in the semi-local coordinate, the length unit is replaced by lν
*(y), where lν*(y)=<ν(y)>/uτ
*(y) and u
*(y)=(w/<(y)>)0.5 [5, 22], and the normalized varia-bles are marked with superscript “*”. An important differ-ence between the two units is that the wall unit involves only the physical quantities at the wall, while the semi-local unit involves the physical quantities (density and viscosity) at all y. In this work, we will suggest a new unit which in-volves the quantities at the wall and at a specific location related to the geometrical measure of the VVCS. The new unit, denoted with superscript “#” and referred to as the VVCS-based coordinate, is shown to yield a very good col-lapse of data at different M, and hence fully capture the M- dependence of the structures. Hence, the geometrical simi-larity is presented by the new unit in the compressible channel flows studied here.
3.1 Wall normal length scale
The first quantitative measure is the height of the VVCSuωx, as a function of the wall normal distance, i.e. ys
+=+(yr+),
which characterizes the vertical distance of the ASCSuωx most correlated to the velocity fluctuations at yr
+. + is re-ferred to as a VVCS-defined function, which displays re-markable similarity, as shown in Figure 6(a). For increasing M, ys
+ systematically shifts upward, indicating the “moving away” of the correlated vortical structures and the thicken-ing of the near-wall layers. Most interestingly, Figure 6(a) shows that + (yr
+) approaches a limiting thickness for small yr
+<10, indicating the existence of a minimum distance to the wall for the limiting vortical structures responsible for near-wall velocity fluctuations in the viscous sublayer. The limiting location is expressed by
,00
lim ( ).
rs r
yy y (2)
From Figure 6(a), we observe that for increasing M, y+s,0
monotonically increases and stands as a single parameter characterizing the vertical distance of the ASCSuωx. Below, we will take y+
s,0 as a fundamental unit to define the vertical length scale. Following this proposal, we use y+
s,0 to nor-malize both yr
+ and +(yr+) for compressible channel flows
at different M:
Figure 6 The VVCS structure function of the ASCS: in viscous wall unit ys+=+(yr
+) (a), newly defined VVCS–based coordinate ys#=# (yr
#) (b), and semi-local ys
*=*(yr*) coordinate (c). Four sets of data correspond to four Ms. The line in (b) is from eq. (4).

6 Pei J, et al. Sci China-Phys Mech Astron February (2013) Vol. 56 No. 2
# #,0 ,0/ , / r r s s sy y y y y (3)
Indeed, Figure 6(b) shows a complete collapse of all pro-files at the four Ms, confirming the importance of the limit-ing vortex structure. Further inspection shows that the col-lapsed curve is well described by a hyperbolic form:
2 2# # 1 s ry y (4)
In other words, measured with the new unit, the relation between the reference location y#
r (for the velocity fluctua-tion) and the location of its most-correlated vortex structure, y#
s, is shown to be invariant, displaying a hyperbolic rela-tion, for all Ms, as a specific form of the geometrical simi-larity. The hyperbolic function (eq. (4)) is shown in Figure 6(b) by the solid line, which well agrees with y#
s of VVCS. Eq. (4) yields the following physical picture: for increas-
ing M, the only important compressibility effect occurs within the viscous sublayer where significant density and temperature variations take place. The height of the limiting VVCS structure fully captures this variation; hence when normalized with respect to this height, the mean property of the entire wall-bounded flow (e.g. profile such as ys
#) re-main invariant in M. Furthermore, this characteristic height is close to the height for the peak of turbulent kinetic ener-gy.
For the four Ms simulated, the numerical values of limit-ing location y+
s,0 is 17, 21, 30 and 47, respectively, in wall unit, while the locations of the maximum of the r.m.s are approximately 14, 16, 27, 41. In incompressible channel flow, Kim et al. [16] suggested y+~20 to be the most proba-ble location of streamwise vortices. Earlier studies already suggested that an accumulation of energetic streamwise vortices [6,17] and hairpin legs (around y+~10 to 25) [7] occur around this location. Hence, the dominant near-wall vortex structures are also responsible for maximum turbu-lence production. Therefore, the limiting VVCS stands as the representative near-wall vortices (in the statistical sense), and the role of its height leading to M-invariant profiles provides a convincing proof that the VVCS captures the right M-dependence in the simulated compressible channel flows.
It is interesting to observe that, when normalized with the semi-local unit, the VVCS structure function ys
*=*(y*r)
also collapse for all Ms, as shown in Figure 6(c). Consider-ing the similarity of +(yr
+), the new collapse with the semi-local transformation can be readily explained. In the present compressible channel flow with cold wall, the only significant density variation takes place within the viscous sublayer. Hence the semi-local transformation is, in fact, quasi-local, with very minor variations in the bulk flow. Thus, the VVCS global transformation (eq. (3)) yields sim-ilar result as the semi-local transformation of Huang et al. [5], as Figure 6(b) and 6(c) show.
A further support to the validity of the VVCS global transformation comes from the fact that at the limiting loca-tion ys,0, the mean density equals unit for all Ms (Figure 7). We believe that it is NOT a coincidence that all three struc-tures (the maximum turbulent kinetic energy, unit density and the limiting VVCS) appear around the same location. This remarkable correspondence among the three quantities tells that the height of the near-wall vortex structures is in-timately related to the layer thickness for significant density variation. This assertion, if validated by further tests, would elucidate the geometrical origin of Morkovin’s hypothesis, which is an intriguing topic for future studies.
An interesting question raised here is: how does the nor-malization height y+
s,0 depend on M? This question can be answered with the introduction of a M-dependent length
scale, ,0 ,0 ,0/ , Ms s s w which, by dimensional argu-
ment, involves the wall shear stress and two thermodynamic quantities (e.g. s,0, s,0) associated with the limiting VVCS. Note that in the incompressible case, this length scale natu-rally equals the length scale for defining the wall unit:
,0 . IMs Thus
,0
,0 ,0
0 0
,0
,0,0
lim lim
sr r
s s
MrM M IM
r r IMy yr
sIM IM wM
s ws
yy y y
y
y y
(5)
Hereafter, the superscript ‘IM’ denotes incompressible case, and the superscript ‘M’ for non-zero M case.
On the other hand, for isobaric flow, T is constant and 2/3 T [24]; thus, we have: 2/3
.0 .0/ / . s w s w
This yields:
,0 ,0
7/6 7/6
#
0,0
lim .
s s
r
rM IM wry
s s
yy y y
y (6)
Figure 7 The mean density profiles of simulated three Ms, using the
VVCS-based coordinate. Note an empirical finding: 1 1.

Pei J, et al. Sci China-Phys Mech Astron February (2013) Vol. 56 No. 2 7
Since s,0≈1 for all Ms, eq. (6) yields an approximate es-timation for compressible channel flows:
,0 ,0
7 /6 s s
M IMwy y (7)
where y+Ms,0≈17 is empirically obtained from the DNS data.
This value later becomes an important parameter to charac-terize M-effect in the present compressible channel flow.
Table 2 shows the comparison of eq. (7) with measured values from DNS. In Figure 6(b), the normalization height y+
s,0 is used to normalize both the reference location and the location of the VVCS. Note that this scale transformation is different from the semi-local transformation—the former takes only two parameters, y+IM
s,0 and the M-dependent w, while in the semi-local unit, the density profile is necessary for proper transformation. In other words, we here propose a new “global’’ transformation, the importance of which will be discussed below.
3.2 Spanwise length scale
In this subsection, we report the second quantitative meas-ure, namely spanwise spacing of ASCSuωx as a function of M, and show that the VVCS-based unit again yields a uni-versal description, independent of M. Gathering all evidence, we believe that this measure is related to the spanwise spacing of the streamwise (or counter-rotating) vortices in the traditional CS study. Contrary to the arbitrary defini-tions of the streamwise scale, the spanwise spacing of
ASCS is relatively easy to quantify. The spanwise scales of VVCSuωx are measured from
DNS data, and displayed in Figure 8, with three units: the wall unit, Dz
+=Dz/l+ν,s, the semi-local unit, Dz
*=Dz/l*ν,s, and
the VVCS–based unit, Dz#=Dz
+/D+z,s0, where , 0
z sD
0
lim .
rz sy
D y Physically, D+z,s0 is the spanwise spacing
associated with the limiting VVCS structures (the pair of ASCS uωx).
As seen in Figure 8(a), the profiles of Dz+ increase grad-
ually with ys+ in the wall unit. As M increases, the structures
tend to have a larger spanwise spacing, though their profiles remain similar for all the Ms. Similar to the former structure function ys
#=# (yr#) in the VVCS unit, we take D+
s,0 as a fundamental unit to define the spanwise length scale. We found that Dz
# in the VVCS unit yields good collapse as shown in Figure 8(b).
In addition, Dz seems to have a logarithmic dependence on the distance to the wall over most parts of the domain. It is interesting that an empirical approximation of Dz in the VVCS-based unit is obtained as (see the line in Figure 8(b)):
Table 2 Comparison of the VVCS predictions for VVCS-characteristic height with DNS (Validation of eq. (7))
Incomp. M0.8 M2.0 M3.0
w (DNS) 1 1.11 1.63 2.4
ys,0+ (DNS) 17.7 21.2 31.7 50.3
ys,0+ (eq. (7)) 17.3 21 32.5 49
Figure 8 Spanwise spacing Dz as a function of ys and M in viscous coordinate (a), structural coordinate (b) and semi-local coordinate(c). The logarithmic expansion of the pair of ASCS in Z-Y plane is away from the wall.

8 Pei J, et al. Sci China-Phys Mech Astron February (2013) Vol. 56 No. 2
# #0.3ln( ) 1; zD y (8)
which yields an approximation in the original wall unit as
ln( ) , MzD y (9a)
, 0 ,0 , 01 1; 1 ln( ) ,3 3
M M M
z s s z sD y D (9b)
Clearly, the M-dependence of the coefficients and in eq. (9a) is entirely determined by the geometrical properties of the limiting VVCS structure: Dz,s0
+M and ys,0+M, which are
M-dependent (see eq. (9b)). It turns out that Dz,0+M has a
similar relation to w as for ys,0 (eq. (7)):
7/6,0 ,0 M IMs s wD D (10)
with Dz,0+=35. The validity of eq. (10) is verified with the
DNS data, see Table 3. Furthermore, we found that the semi-local unit also leads
to a collapse of the profiles of Dz* at four Ms, as seen in Figure 8(c). Similar collapse in Figure 8(b) and Figure 8(c) indicates that the origin of the semi-local transformation in simulated channel flows is more or less equivalent to a global transformation, the VVCS-based transformation.
We also note that the observed logarithmic variation of Dz* extends up to ys*=140, far beyond the range in previous experimental study of the CS. This result suggests that co-herence extends even to the center of channel, the well- developed turbulent region.
Note that eqs. (8) and (10) reveals an entire new similar-ity for compressible channel flows, a kind of geometrical similarity with the wall density as the similarity variable. This result is obtained by means of the VVCS study. This is an empirical formulation of the Morkovin’s hypothesis with an explicit expression in terms of the VVCS structure. This promises a quantitative prediction of the spatial scales of the coherent structures in compressible channel flows.
3.3 Mean velocity and r.m.s profiles
A long lasting effort has been taken to seek a universal transformation of the mean velocity of an incompressible flow to the corresponding compressible cases. According to Morkovin’s hypothesis, compressibility effect on the mean profiles can be properly taken the variation of the thermo-dynamic quantities such as density and viscosity into ac-count. The very first proposal by van-Driest called the van-Driest transformation (VDT) is defined as:
0
d/ d ',d '
VD
y
w
UU y
y (11)
where w is the mean density at the wall. Eq. (11) is a den-sity-weighted integral of the velocity gradient profile. One motivation behind eq. (11) is to reproduce the universal log-law: U+
VD=(1/κ)ln(y+)+C. However, as shown in Figure
Table 3 Comparison of the VVCS predictions for VVCS-spanwise spac-ing with DNS (Validation of eq. (10))
Incomp M0.8 M2.0 M3.0
ρw7/6 (DNS) 1 1.13 1.8 2.86
D+Ms,0/D
+IMs,0 (eq. (10)) 1 1.19 1.8 2.9
9(a), the mean velocity profiles (MVP) for different Ms by VDT do not collapse in the log-region. Similar comment was made by Coleman et al. [3] in Figure 17 and by Foysi et al. [22] in Figure 1. The semi-local scaling, introduced by Huang et al. [5], yields better collapsed profiles for the ve-locity fluctuations, as shown in Figure 9(b), and similar observations were made by others [3,22].
We now define a VVCS–based scaling, using the mean velocity and the r.m.s amplitude associated with the limiting VVCS structure to normalize the corresponding profiles. Thus, the mean velocity is renormalized by
#
,0
,
s
UU
U (12a)
while the r.m.s amplitude is normalized by
#rms# #
rmsrms ,0
.( )
s
u yu y
u y (12b)
It is a global scaling, since a constant coefficient is ap-plied for each M. Both mean velocity (see Figure 9(c)) and r.m.s of the velocity (see Figure 10(c)) precisely collapse for all Ms. Note that the collapse of the mean velocity under VVCS-based transformation (Figure 9(c)) is even much better than that of the VDT (Figure 9(b)). Furthermore, the r.m.s profile under VVCS-based transformation (Figure 10(c)) is also much better than that of the semi-local scaling (Figure 10(b)), in the near wall region.
Next, we use the VVCS-based unit to derive a series of models. First, the MVP in the new unit (U#) has a new uni-versal description, which has been tested for the all simu-lated Ms:
# #0
0
1 ln ,
U y C (13a)
,0 0 4.75, M MsU (13b)
0 1.1.C (13c)
where, 0≈4.75 and C0≈1.1 are obtained by fitting the pro-files of the mean velocities. We now derive this new de-scription for the MVP in the log-law based on the log-law relation:
1 ln ,
M M
MU y C (14a)
0
,0
,
M
MsU
(14b)

Pei J, et al. Sci China-Phys Mech Astron February (2013) Vol. 56 No. 2 9
Figure 9 The mean velocity in viscous coordinate, VDT and VVCS-based coordinates (eq. (12)).
Figure 10 The r.m.s of streamwise velocity fluctuations in different coordinates.

10 Pei J, et al. Sci China-Phys Mech Astron February (2013) Vol. 56 No. 2
,0 0 ,00
1 ln .
M M
s sC U C y (14c)
In the right hand side (r.h.s.) of eq. (14c), both Us,0M and
ys,0+ vary with M. In order to study the relation between
Us,0M and ys,0
+ (and also w), we make an additional assump-tion that the additive log-law constant, CM, in the wall unit is a constant, i.e., CM ≈5.8. This assumption is inspired by the fact that all the logarithmic profiles have the same in-tersection point at y+=1 and U+=5.8 (as shown in Figure 9(a)), though the nature of the common characteristic near-wall velocity (U+=5.8) needs further elucidation.
Under the empirical parameter of the M-invariant
1 ,MyC we obtain a relation between ,0
MsU and y+
s,0, the
latter being a function of w, as expressed by eq. (8), and Us,0
+M is obtained by calculating eq. 15(c):
,0 ,0
,0
5.8* 4.75 / 1.1* 4.75 ln
27.6 / 5.2 ln ,
Ms s
s
U y
y
(15a)
or
,0727.6 / 2.33 ln .6
Ms wU (15b)
The prediction in eq. (15b) is supported by the DNS measurement (see Table 4). This result substantiates Mork- ovin’s hypothesis that the compressible mean velocity is determined by the variation of the mean density. In the pre-sent study, intensive change of density only occurs at the near-wall region, as shown in Figure 7, and hence the mean velocity at y+
s,0 depends only on the density at the wall, ρw. An expression describing the M-effect due to the density variation is then derived from eq. (15b) as:
,0,0
,0
2.4 .72.33 ln6
Ms M
s wIMs
w
Uf
U (16)
The expression of eq. (16) should be universal, but since it is derived from limited data at moderate Re, the numerical coefficients need to be confirmed by higher Re DNS.
Substituting eq. (15b) into eq. (14b), with κ0≈4.75, we obtain
0
72.33 ln6 0.4 0.21ln ,
27.6
wM
w (17)
where the first term in the r.h.s. (i.e. 0.4) coincides with the Karman constant for impressible channel flow. This relation yields an asymptotic 7.38 w for M=0, which sets an
upper limit for the validity of the present description. From our limited DNS data, by linear extrapolation, we find that a critical Mach number is approximately M=6.3. So, we sug-gest that eq. (17) is effective for w . At this point, it
is strongly desired to have a higher M computation.
Table 4 DNS observations for VVCS-characteristic velocity
Incomp. M0.8 M2.0 M3.0
y+s,0
(DNS) 17.7 21.2 31.7 50.3
w (DNS) 1 1.11 1.63 2.4
Us,0+ (DNS) 11.5 12.97 16.38 20.2
Us,0+M (eq. (15b)) 11.6 12.7 15.5 20.0
Us,0+VD (eq. (10)) 11.5 12.9 14.8 16.8
M (eq. (17)) 0.4 0.38 0.30 0.22
DNS (DNS) 0.4 0.36 0.28 0.235
Furthermore, the good collapse of the r.m.s of the veloc-
ity in the VVCS-based unit implies # #rms (1) (1) 1 M Mu U (as
shown in Figure 9(c) and Figure 10(c)). This also implies that the dynamics from the wall to y+
s,0 is universal, inde-pendent of M; in other words, in the near-wall region, y+~ y+
s,0, the density variation affects the mean velocity U#M in the same way as u#M
rms for all Ms. We are then led to con-jecture that
rms, ,0 ,0,0
rms, ,0 ,0
( ),
M M
s s Ms wIM IM
s s
u Uf
u U (18a)
or
rms, ,0 rms, ,0 ,0 ( ), M IM Ms s s wu u f (18b)
which is an application of Morkovin’s hypothesis to the amplitude of fluctuations, in light of the limiting VVCS structure at y+
s,0. Eq. (18) is tested by the DNS-measured velocity r.m.s, and the agreement is also presented in Table 5. The VVCS predictions are compared to DNS measure-ments at various moderate Re. Considering the moderate Re effects (for which the logarithmic layer is not fully devel-oped), the agreement is also satisfactory.
The difference in the MVP near the wall may be caused by the Re-associated effect on the mean velocity. As shown in Figure 10(c), the r.m.s of velocity in the near-wall region yields a good collapse, while in the outer region, the differ-ence becomes obvious. Compared to Figure 9(c), we con-clude that the low Re is a main source of the departure. The very short log-region in M=3 simulation indicates an un-der-developing turbulence at this low Reynolds number. In the future, the DNS data with higher Reynolds number will be needed to validate the proposal presented here.
Our results support Morkovin’s hypothesis through the geometrical scales defined by the VVCS, which yields a satisfactory similarity solution independent of the Mach number. This conclusion is consistent with the previous studies by Huang et al. [5], Foysi et al. [22] and Coleman et al. [3] in compressible channel flows, all of which indicate
Table 5 Comparison of the VVCS and semi-local predictions for the characteristic r.m.s amplitude at ys,0
+ with DNS
Incomp. M0.8 M2.0 M3.0
u+rms,0 (DNS) 2.6 3.06 3.7 4.57
u+rms,0 (eq. (17)) 2.6 2.8 3.4 4.63

Pei J, et al. Sci China-Phys Mech Astron February (2013) Vol. 56 No. 2 11
that when the mean density variation is properly taken into account, the basic mean variable, such as mean velocity, its r.m.s, and turbulent energy, the amplitude and the peak val-ue, become nearly identical for all moderate Ms.
4 Conclusions
In this paper, using the concept of VVCS, we discover a special statistical vortex structure, namely the limiting VVCS which is responsible for the velocity fluctuations nearest to the wall. The physical measures (its height and its associated mean velocity) of the limiting VVCS form the basic scales for the length and the velocity defining M- invariant profiles. The assertion is validated by the DNS- computed isothermal channel flows up to M=3. The new transformation is quantitatively close to the semi-local transformation, but replaces the latter with a global parame-ter of the physical property of the limiting VVCS, and yields an excellent collapse of profiles for all simulated Ms. Furthermore, we found that the limiting VVCS defines a layer near the wall, on top of which the density remains close to unity. This finding yields a model for describing the M-dependence of the structure height, the mean velocity profile and the velocity fluctuation amplitude, in terms of the wall density.
The geometrical similarity found in this study is proved to be valid for the compressible channel flows at three moderate Ms. On the one hand, it provides a geometrical interpretation of the Morkovin’s hypothesis. What is re-markable is that this similarity, when quantitatively meas-ured, is used to yield a transformation which characterizes a concrete Morkovin scaling for compressible channel flow. In other words, using the physical measures of the limiting VVCS, we constructed a VVCS-based transformation link-ing the compressible channel flows to incompressible ones. The success of the collapse using the newly defined trans-formation leads to the claim that Morkovin’s hypothesis is approximately valid as long as the geometrical similarity is maintained.
In this work, we suggest a new unit related to the meas-ure of the limiting VVCS, defined by the most correlated vortex structure to velocity fluctuations very close to the wall. The new unit is shown to yield a very good collapse of profiles (structural coordinate ys, mean velocity, as well as its amplitude (r.m.s)) at different M, and hence capture the M-dependence very well. Furthermore, a wall-density de-pendent Karman constant is discovered for isothermal com-pressible channel flows up to M=3. Note that the VVCS- based is closer to the wall unit (rather than the semi-local unit): while the wall unit involves only the physical quanti-ties at the wall, the new unit uses the physical quantities associated with the limiting VVCS, to define the M- dependence of the mean profiles.
Our work yields also a geometrical interpretation of the
semi-local transformation [5], which suggests a quantitative model to describe the M-dependence of the wall-normal and spanwise length scales as well as the mean velocity and r.m.s profiles in terms of the wall density. It yields the con-clusion that the location, the kinematic and thermodynamic properties associated with the closest vortex structures to the wall determine the M-effects in supersonic wall-boun- ded flows. This conclusion, validated with DNS data of compressible channel flows at moderate Reynolds and Mach numbers, needs to be confirmed by more empirical analysis.
In conclusion, the quantitative study of the VVCS is proved to be constructive in carrying the information of the CS in quantifying the mean flow properties. For the first time, we show that the geometrical information of the CS is useful to model quantities of engineering interest, e.g. the transformation defining the mean velocity and r.m.s pro-files.
This work was supported by the National Nature Science Foundation of China (Grant Nos. 90716008, 10572004 and 11172006) and the National Basic Research Program of China (Grant No. 2009CB724100). The au-thors would like to thank Prof. LI XinLiang of Chinese Academy of Scienc-es for the help in computations.
1 Morkovin M V. Effects of compressibility on turbulent flows. In: Mechanique de la Turbulence. Favre A, ed. NewYork: Gordon and Breach publ., 1964. 367–380
2 Bradshaw P. Compressible turbulent shear layers. Annu Rev Fluid Mech, 1977, 9: 33–54
3 Coleman G N, Kim J, Moser R D. A numerical study of turbulent supersonic isothermal-wall channel flow. J Fluid Mech, 1995, 305: 159–183
4 Van Driest E R. Turbulent boundary layers in compressible fluids. J Aerodyn Sci, 1951, 18(3): 145–160
5 Huang P G, Coleman G N, Bradshaw P. Compressible turbulent channel flows: DNS results and modeling. J Fluid Mech, 1995, 305: 185–218
6 Kline S J, Reynolds W C, Schraub F A, et al. The structure of turbu-lent boundary layers. J Fluid Mech, 1967, 30: 741–773
7 Adrian R J, Meinhart C D, Tomkins C D. Vortex organization in the outer region of the turbulent boundary layer. J Fluid Mech, 2000, 422: 1–54
8 Smits A J, McKeon B J, Marusic I. High–Reynolds number wall tur-bulence. Annu Rev Fluid Mech, 2011, 43: 353–375
9 He L, Yi S H, Zhao Y X, et al. Experimental study of a supersonic turbulent boundary layer using PIV. Sci China-Phys Mech Astron, 2011, 54(9): 1702–1709
10 Huang Z F, Zhou H, Luo J S. The investigation of coherent structures in the wall region of a supersonic turbulent boundary layer based on DNS database. Sci China Ser G-Phys Mech Astron, 2007, 50(3): 348–356
11 Smith M W, Smits A J. Visualization of the structure of supersonic turbulent boundary layers. Exp Fluids, 1995, 18: 288–302
12 Pan C, Wang J J, Zhang C. Identification of Lagrangian coherent structures in the turbulent boundary layer. Sci China-Phys Mech As-tron, 2012, 52(2): 248–257
13 Anotonia R A. Conditional sampling in turbulent measurement. Annu Rev Fluid Mech, 1981, 13: 131–156
14 Kovasznay L S G, Kibens V, Blackwelder R F. Large-scale motion in the intermittent region of a turbulent boundary layer. J Fluid Mech, 1970, 41: 283–325

12 Pei J, et al. Sci China-Phys Mech Astron February (2013) Vol. 56 No. 2
15 Smith C R, Metzler S P. The Characteristics of low-speed streaks in the near-wall region of a turbulent boundary layer. J Fluid Mech, 1983, 129: 27–54
16 Kim J, Moin P, Moser R. Turbulent statistics in fully developed channel flow at low Reynolds number. J Fluid Mech, 1987, 177: 133–166
17 Blackwelder R F, Eckelmann H. Streamwise vortices associated with the bursting phenonmenon. J Fluid Mech, 1979, 94: 577–594
18 Pei J, Chen J, She Z S, et al. Model for propagation speed in turbulent channel flows. Phys Rev E, 2012, 86: 046307
19 Chen J, Pei J, She Z S, et al. Velocity-vorticity correlation structure in turbulent channel flow. AIP Conference Proceedings, 2011, 1376: 87–89
20 Li X L, Ma Y W, Fu D X. DNS and scaling law analysis of com-
pressible turbulent channel flow. Sci China Ser A-Math Phys Astron, 2001, 44(5): 645–654
21 Li X L, Fu D X, Ma Y W. Direct numerical simulation of compressi-ble turbulent flows. Acta Mech Sin, 2010, 26: 795–806
22 Foysi H, Sarkar S, Friedrich R. Compressibility effects and turbu-lence scalings in supersonic channel flow. J Fluid Mech, 2004, 509: 207–216
23 Blackwelder R F, Kaplan R E. On the wall structure of the turbulent boundary layer. J Fluid Mech, 1976, 76: 89–112
24 Tang Z Q, Jiang N, Reinhard G, et al. Tomographic PIV investigation of coherent structures in a turbulent boundary layer flow. Acta Mech Sin, 2012, 28: 572–582
25 Sutherland W. The viscosity of gases and molecular force. Philos Mag, 1893, S.5, 36: 507–531