Thermal-instabilities-of-charge-carrier-transport-in-solar-cells ...
Upload
independentCategory
view
1download
0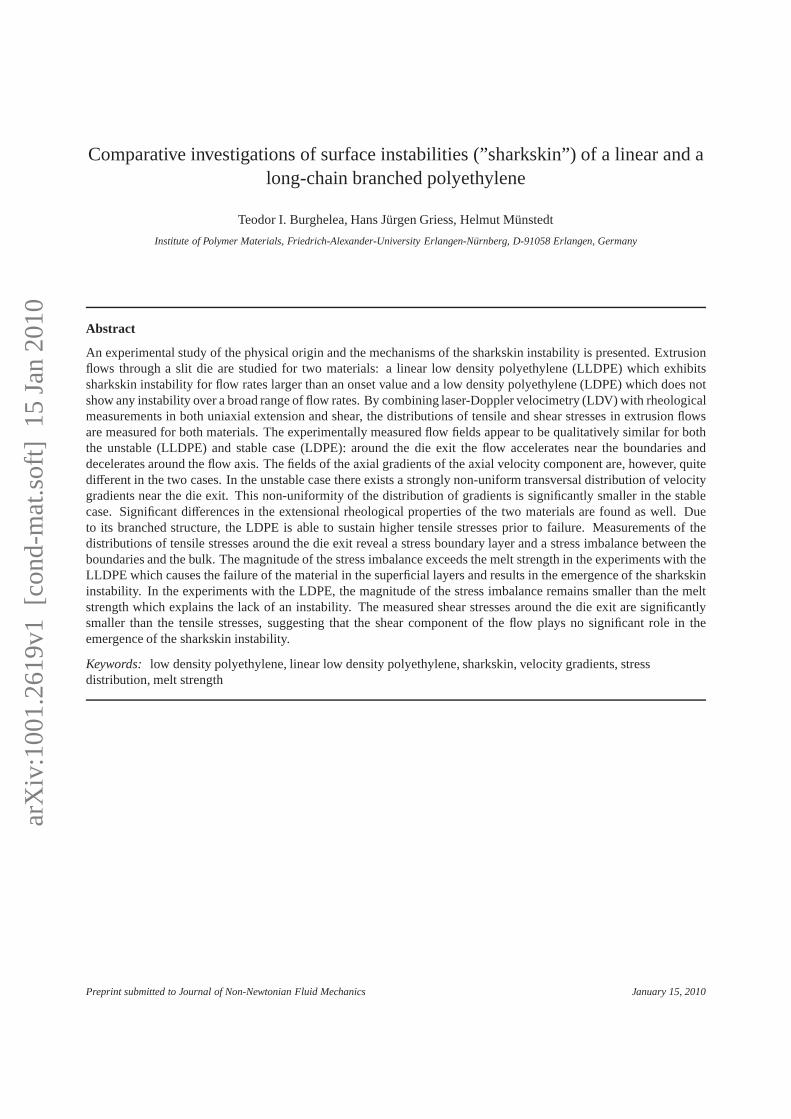
arX
iv:1
001.
2619
v1 [
cond
-mat
.sof
t] 1
5 Ja
n 20
10
Comparative investigations of surface instabilities (”sharkskin”) of a linear and along-chain branched polyethylene
Teodor I. Burghelea, Hans Jurgen Griess, Helmut Munstedt
Institute of Polymer Materials, Friedrich-Alexander-University Erlangen-Nurnberg, D-91058 Erlangen, Germany
Abstract
An experimental study of the physical origin and the mechanisms of the sharkskin instability is presented. Extrusionflows through a slit die are studied for two materials: a linear low density polyethylene (LLDPE) which exhibitssharkskin instability for flow rates larger than an onset value and a low density polyethylene (LDPE) which does notshow any instability over a broad range of flow rates. By combining laser-Doppler velocimetry (LDV) with rheologicalmeasurements in both uniaxial extension and shear, the distributions of tensile and shear stresses in extrusion flowsare measured for both materials. The experimentally measured flow fields appear to be qualitatively similar for boththe unstable (LLDPE) and stable case (LDPE): around the die exit the flow accelerates near the boundaries anddecelerates around the flow axis. The fields of the axial gradients of the axial velocity component are, however, quitedifferent in the two cases. In the unstable case there exists a strongly non-uniform transversal distribution of velocitygradients near the die exit. This non-uniformity of the distribution of gradients is significantly smaller in the stablecase. Significant differences in the extensional rheological properties of the two materials are found as well. Dueto its branched structure, the LDPE is able to sustain highertensile stresses prior to failure. Measurements of thedistributions of tensile stresses around the die exit reveal a stress boundary layer and a stress imbalance between theboundaries and the bulk. The magnitude of the stress imbalance exceeds the melt strength in the experiments with theLLDPE which causes the failure of the material in the superficial layers and results in the emergence of the sharkskininstability. In the experiments with the LDPE, the magnitude of the stress imbalance remains smaller than the meltstrength which explains the lack of an instability. The measured shear stresses around the die exit are significantlysmaller than the tensile stresses, suggesting that the shear component of the flow plays no significant role in theemergence of the sharkskin instability.
Keywords: low density polyethylene, linear low density polyethylene, sharkskin, velocity gradients, stressdistribution, melt strength
Preprint submitted to Journal of Non-Newtonian Fluid Mechanics January 15, 2010
1. Introduction
Understanding and reducing polymer instabilities are of enormous economical importance, as they are limitingfactors of extrusion efficiency. Flow instabilities during the extrusion of polymermelts have been observed sincenearly six decades ago and sharkskin instabilities, in particular, were first reported in late 60’s, [9, 28]. Such insta-bilities have been extensively reviewed during the past three decades [22, 16, 4]. In spite of a large amount of bothexperimental and theoretical studies of the sharkskin, theorigins and the physical mechanisms of this phenomenonare not yet fully understood. It has been agreed, however, that the sharkskin instability is most probably related toboth the flow kinematics and the local dynamics near the exit of the die.
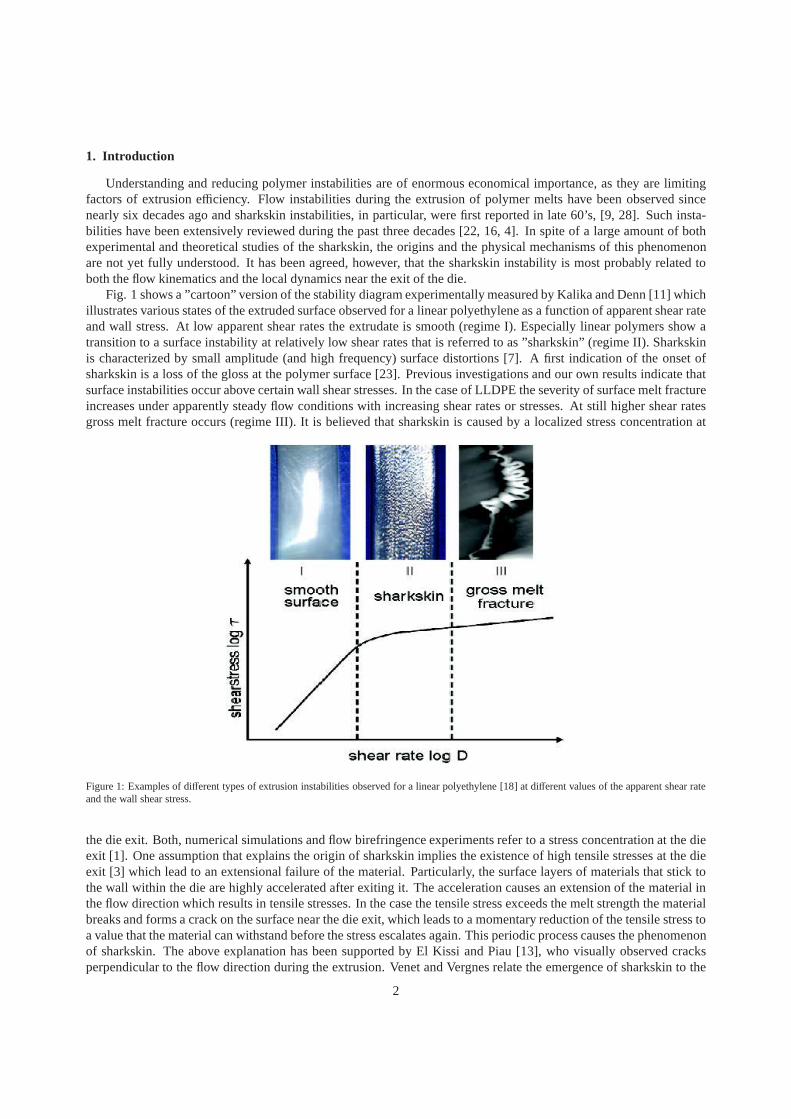
Fig. 1 shows a ”cartoon” version of the stability diagram experimentally measured by Kalika and Denn [11] whichillustrates various states of the extruded surface observed for a linear polyethylene as a function of apparent shear rateand wall stress. At low apparent shear rates the extrudate issmooth (regime I). Especially linear polymers show atransition to a surface instability at relatively low shearrates that is referred to as ”sharkskin” (regime II). Sharkskinis characterized by small amplitude (and high frequency) surface distortions [7]. A first indication of the onset ofsharkskin is a loss of the gloss at the polymer surface [23]. Previous investigations and our own results indicate thatsurface instabilities occur above certain wall shear stresses. In the case of LLDPE the severity of surface melt fractureincreases under apparently steady flow conditions with increasing shear rates or stresses. At still higher shear ratesgross melt fracture occurs (regime III). It is believed thatsharkskin is caused by a localized stress concentration at
Figure 1: Examples of different types of extrusion instabilities observed for a linear polyethylene [18] at different values of the apparent shear rateand the wall shear stress.
the die exit. Both, numerical simulations and flow birefringence experiments refer to a stress concentration at the dieexit [1]. One assumption that explains the origin of sharkskin implies the existence of high tensile stresses at the dieexit [3] which lead to an extensional failure of the material. Particularly, the surface layers of materials that stick tothe wall within the die are highly accelerated after exitingit. The acceleration causes an extension of the material inthe flow direction which results in tensile stresses. In the case the tensile stress exceeds the melt strength the materialbreaks and forms a crack on the surface near the die exit, which leads to a momentary reduction of the tensile stress toa value that the material can withstand before the stress escalates again. This periodic process causes the phenomenonof sharkskin. The above explanation has been supported by ElKissi and Piau [13], who visually observed cracksperpendicular to the flow direction during the extrusion. Venet and Vergnes relate the emergence of sharkskin to the
2
stress levels along local streamlines close to the extrudate surface, [29, 30]. Rutgers and Mackley [24] proposed thata rupture mechanism could explain the correlation between sharkskin and melt strength.
Though there exists little doubt that the sharkskin is indeed caused by an extensional failure of the material nearthe die exit [5], a rigorous quantitative description of thephenomenon is missing. This is mostly due to the factthat a complete theoretical picture of different mechanisms of failure of polymeric materials remainsan elusive goal.The simple scaling theory of failure in the fast stretching regime proposed by Joshi and Denn [10] is, most probably,unable to explain the sharkskin because the emergence of sharkskin implies a reorganization of the free surface of thematerial accompanied by a stress release.
The present study explores the physical origins of the sharkskin phenomenon by combined measurements of theflow kinematics (flow fields and fields of axial velocity gradients) and measurements of the rheological propertiesof the materials in both uniaxial extension and shear. The distributions of tensile and shear stresses in the flow areobtained by merging the kinematic data with the rheologicaldata. This method has several advantages over classicalbirefringence measurements [1]:
1. It can measure separately the tensile and shear stresses.2. It can resolve the distributions of both tensile and shearstresses at the corners regions near the die exit.3. It provides quantitative stress measurements which can be directly compared with the melt strength measured
by an extensional rheometer.
To gain additional insights into the emergence of the sharkskin instability, a comparative analysis of the stress distri-butions corresponding to both an unstable (sharkskin) and stable extrusion flows is performed.
2. Outline
The paper is organized as follows. The experimental setup, the measuring techniques, the physical properties ofthe polymer melts and the analysis procedure of the flow data are discussed in Sec. 3. A detailed description of theflow kinematics is given in Sec. 4.1. A comparative analysis of the rheological properties of the materials in uniaxialextension is performed in Sec. 4.2. Measurements of the distributions of tensile stresses in the flow are presented anddiscussed in Sec. 4.3.1. The role of the shear stresses in theemergence of the sharkskin instability is discussed in Sec.4.3.2. The paper closes with a concise discussion of the mainfindings, Sec. 5.
3. Experimental section
3.1. Experimental setup and measuring techniques
The experimental setup is schematically presented in Fig. 2(a). It consists of a slit die with a rectangular cross-section. The dimensions of the slit die are 50× 14× 1mm(L ×W × Hslit). For all measurements the entrance angleof the slit die was 180 ˚. The origin of the coordinate system was chosen in the plane of the die inlet at a distance of7 mmfrom the glass window, Fig. 2 (b). A pressure transducer in the slit allow the determination of the wall shearstress. The temperature was controlled within± 0.2 ˚C along the flow channel and over the duration of an experiment.
A commercial two component laser-Doppler velocimeter fromDantec Dynamics was used to investigate the flowfields of the two polyethylenes.
Two pairs of laser beams are focused in the flow channel through the transparent glass window of the setup and thelocal flow velocity is assessed by measurements of the Doppler shift of the light scattered by small seeding particlesadded to the polymer melt, [6].TiO2 particles with sizes ranging from 0.1 µm to 1 µm have been used as seedingparticles. The LDA probe is mounted on a three dimensional translational stage (from Dantec Dynamics) with aresolution of 10µ m on each axis. The flow speed can be reliably measured down to 250 µm/s. Within this velocityrange the accuracy of the velocity measurements is about 10 %and becomes better than 1 % with increasing velocities.A more detailed description of the LDV system and the mechanical setup for generating a constant throughput of themelt are given in [25]. The coordinate system used are shown in Fig. 2 (b).
3

Figure 2: (a) Schematic view of the experimental setup:FC - flow channel,DI -die inserts,GW - glass window,ES - extruded strand (b) Coordinatesystem.
LDPE LLDPEρ25◦C(g cm−3) 0.919 0.926
Tm(◦C) 110 125Mw(kg kmol−1) 256 148
Mw/Mn 15 4.2
Table 1: Physical properties of the polyethylenes investigated.
3.2. Molecular and physical properties of the materials investigated
The materials selected in this study are a linear low-density polyethylene (LLDPE) and a low-density polyethylene(LDPE). The LLDPE used is a commercial product from Exxon called Escorene LLN 1201 XV which is mainly usedfor the manufacturing of films. A detailed investigation of the molecular and rheological properties of the LDPE hasbeen recently reported, [12]. The LDPE used was Lupolen 1840H from Basell, a commercial product frequently usedfor film extrusion and film blowing. Its molecular and rheological properties have been extensively investigated byHertel, [8]. It has random-like long-chain branched molecular structure which originates in its radical polymerizationat high pressures, as opposed to LLDPE which has a linear molecular structure. Characteristic material data aresummarized in Table 1. Due to substantial differences in their molecular structure, the materials have different melttemperatureTm, different molar massMw and different distributionsMw/Mn of the molar mass, Table 1.
The choice of the two polyethylenes was motivated by the factthat the LLDPE shows sharkskin under the ex-perimental conditions and LDPE does not show sharkskin and thus a comparative study is possible. Both materialswere investigated with regard to differences in flow behavior and melt strength with the aim to explain their differentsurface structures.
3.3. Rheological characterization of the materials
As it will be shown in detail through the paper, the flow of the polymer melts through the die combines both shearand biaxial extension and therefore a characterization of the stress distribution in the flow requires the knowledge ofthe rheological properties of the melts in both extension and shear. Measuring the extensional rheological responseof the material under such kinematic conditions was not possible and therefore we have investigated the transientresponse of the materials in uniaxial elongation, only. Therheological characterization of the materials in uniaxialextension has been done using a Munstedt type extensional rheometer built in the house. A detailed description of thisdevice and its operating principle can be found elsewhere, [21]. The elongational specimens were manufactured byextrusion through a capillary followed by a retardation process in silicone oil. The samples were glued to aluminum
4

Experiment Material T(◦C) m (g min−1) D (s−1) axx(mm s−2) sharkskin
1 LDPE 135 1.4 12.5 10 No2 LDPE 180 9 85 510 No3 LDPE 180 14.4 135 1170 No4 LDPE 180 18 168 2010 No5 LDPE 220 7.4 71 265 No6 LLDPE 135 1.4 12.5 6.4 No7 LLDPE 220 4.5 43 100 Yes8 LLDPE 220 7.4 70 200 Yes9 LLDPE 220 9 85 320 Yes
Table 2: Investigations on sharkskin under different extrusion conditions. ˙m is the mass throughput (flow rate),D the apparent shear rate, andaxx
the acceleration according to equation (2).
clamps. For the elongational tests, specimens with a lengthof 20 mmand a diameter of approximately 3mmwereused. The specimen under investigation is clamped between the plates of the rheometer and immersed in a siliconeoil bath to minimize gravity and buoyancy effects. A secondary role of the oil bath is to ensure isothermalconditionsduring the extensional tests. While the bottom plate of the rheometer is stationary, the top plate of the rheometeris moved vertically by an AC-servo motor controlled by an analogue to digital converter installed on a personalcomputer. The force acting on the bottom plate and the position of the top plate (which defines the actual Henckystrain) are transferred in real time to a personal computer by an analogue to digital card. Elongational measurementsare performed at constant rate of deformation ˙ǫ. The maximal value of the rate of deformation accessible by therheometer was 3s−1. This upper bound could be increased only by using the time-temperature superposition principle.
The rheological characterization of the materials in shearhas been done using a stress controlled shear rheometer(AR−G2 from TA Instruments) equipped with a magnetic bearing.
3.4. Analysis of the flow fields
Velocity profiles were measured at various positions withinthe die (x ∈ [−50, 0] (mm)) as well as outside the die(x ∈ [0, 1.5] (mm)). Whereas inside the die the axial distance between consecutive profiles was∆x = 5 mm, aroundthe die exit it has been reduced down to∆x = 0.1 mm. This allows one to characterize the flow fields near the die exitwith increased spatial resolution. As a next step, the velocity profiles are fitted by the power law below, as suggestedin [25].
vx = v0
1−∣
∣
∣
∣
∣
2xH
∣
∣
∣
∣
∣
n+1n
(1)
v0 is the maximum of the velocity andn the power law index of the material. The power law fit allows both anextrapolation of the measured points to the die wall and a noise free calculation of the spatial derivatives of the flowfields. As the velocity profiles acquired within the die seem to systematically extrapolate to zero at the die walls, it canbe concluded that there exists no wall slip for the materialswe have investigated. The two dimensional fitted velocitydata has been interpolated on an equally-spaced x-y grid which further allows calculation of the velocity gradients,∂Vx∂x and ∂Vx
∂y . The two dimensional fields of velocity gradients are ultimately converted in two dimensional stress fieldsusing both the elongational and the shear rheological data.
Systematic measurements of the flow fields have been carried out for both LLDPE and LDPE at various flow rates(or apparent shear rates) and temperatures which are listedin Table 2.
4. Results and Discussion
4.1. Kinematics of unstable (sharkskin) and stable (no sharkskin) extrusion flows
Previous work has shown that the sharkskin instability is initiated near the die exit, [20].
5

In a previous work [26] it has been demonstrated that sharkskin can be diminished or even suppressed, if thematerial slips at the die wall. This is consistent with the ideas of Cogswell [3] who suggested that the sharkskinis related to the abrupt changes of the flow conditions at the die exit. The acceleration decreases with the velocitydifference∆vx between the surface layers inside and outside the die. This fact indicates how the acceleration forcescan be changed, namely by varying the flow behavior at the die wall. That can be done by inducing slip at thewall of the die which is a commonly applied measure in practice. Fig. 3 illustrates a quantitative picture of such amodification. It exhibits the velocity profile of a pure LLDPEin comparison to that of a LLDPE with a fluoropolymeradditive. The pure LLDPE sticks to the wall and the surface ofthe extruded strand displays distinct sharkskin. Uponaddition of the fluoropolymer the material slips at the die wall, tensile stresses are no longer accumulated at the surfacelayers of the material around the die exit and, consequently, the sharkskin has disappeared. This result is in agreementwith previous experimental observations [14, 31] which show unequivocally that wall slip induced by the addition offluorinated polymers to the melt suppresses the sharkskin instability.
Figure 3: Velocity profiles for a LLDPE with and without a fluoropolymer additive [26]: circles - LLDPE with fluoropolymer at T = 220◦ C ,D = 146 s−1, squares - LLDPE without fluoropolymer atT = 220◦ C , D = 128s−1. The data has been acquired inside the die,x = −20 mm.
An alternative and ingenious way of suppressing the sharkskin instability is to locally heat the die walls, [19].This way, the viscosity of the material is reduced in the surface layer and accumulation of the tensile stresses may bediminished up to the point the sharkskin instability disappears.
It has been previously demonstrated that the sharkskin observed for LLDPE is not caused by a change of theflow conditions within the die [18]. It is rather assumed thatthe accelerations of the surface layers of the exitingstrand are the reason for the generation of sharkskin. To geta deeper insight into the flow kinematics, measurementsin the die exit region were carried out for both polyethylenes. Flow measurements with LLDPE were performed atseveral temperatures and values of the apparent shear rateD (see Table 2) both below and above the onset of thesharkskin instability. The apparent shear rate has been defined asD = 6Q
WH2slit
whereQ is the volumetric flow rate. The
measurements above the onset of the instability and right below it will be particularly discussed through this study.We note that for both materials investigated the transversal velocity componentVy was zero everywhere inside the
die and nearly ten times smaller thanVx around the die exit. For this reason we will focus in the following only onthe fields of the axial component and the corresponding fieldsof gradients. The smallness of the transversal velocitycomponent as compared to the axial component also suggests that one can neglect the extension of the materialelements in the transversal direction∂Vy
∂y and, consequently, approximate the flow around the die exit by an uniaxialextension.
Fig. 4 (b) presents several velocity profiles inside the die,at the die exit and outside the die. Inside the die (x < 0)the velocity profiles can be described by Eq. 1, do not depend on the axial coordinatex and extrapolate to zero near thedie walls (diamonds, Fig. 4 (b)). At the die exit and outside of the die significant changes of the velocity profiles arevisible (circles, squares, Fig. 4 (b)). As one moves downstream (x > 0), the flow speed decreases in the bulk region of
6

Figure 4: (a) Spatial distribution of the axial velocity componentVx. The full lines indicate the location of the die walls.(b) Sample velocity profilesat several axial locations: diamonds -x = −3 mm, circles -x = 0 mm, squares-x = 0.1 mm, stars -x = 0.3 mm, triangles -x = 0.6 mm. The datarefers to experiment 7, Table 2.
the flow (y ∈ [−0.4 0.4] mm) and increases in the boundary region of the flow. It is obvious that especially the surfacelayers of the polymer become strongly accelerated over a very short distance from an initial velocityvx0 = 0 at the dieexit to the final velocityvxs of the strand. This acceleration may cause high forces in thesurface layers which mayultimately lead to the failure of the material and the emergence of the sharkskin instability. The accelerationaxx ofthe surface layers can be estimated by [17].
axx =∆vx
∆x
[
vx0 +∆vx
2
]
(2)
where∆vx is the velocity difference between two profiles separated by the axial distance∆x andvx0 is the velocity ofthe surface layer of the extruded strand at the die exit.
As constitutive theories for polymeric materials involve velocity gradients rather than accelerations [2], monitoringthe acceleration of the surface layers might seem, at least at a first glance, somewhat unusual and deserves a briefdiscussion. Following ideas similar to the widely known Taylor hypothesis [27, 15], one can quickly realize that over
Figure 5: (a) Spatial distribution of the axial velocity componentVx. The full lines indicate the location of the die walls. (b) Sample velocityprofiles at several axial locations: diamonds -x = −3 mm, circles -x = 0 mm, squares-x = 0.1 mm, stars -x = 0.3 mm, triangles -x = 0.6 mm. Thedata refers to experiment 1, Table 2.
short distances the accelerationaxx is in fact proportional to the axial gradient of the axial velocity component,∂Vx∂x .
This is also visible in Eq. 2 if the second order term is assumed to be negligible over short distances. Therefore,
7

Figure 6: (a) Spatial distribution of the rate of axial extension rate∂Vx∂x . The full lines indicate the location of the die walls.(b) Sample profiles of the
rate of axial extension at several axial locations downstream: diamonds -x = −3 mm, circles -x = 0 mm, squares-x = 0.1 mm, stars -x = 0.3 mm,triangles -x = 0.6 mm.The data refers to experiment 7, Table 2.
accelerations would be interpreted through our manuscriptas axial gradients of the axial velocity component or aslocal rates of extension.
The spatial distribution of the axial velocity componentVx has been measured for LDPE, Fig. 5 (a). The velocitydistribution for this stable (no sharkskin) case is qualitatively similar to that measured for the unstable case Fig. 4 (a).A flow deceleration in the bulk region and an acceleration in the boundary region are also observed for LDPE . Forboth LLDPE and LDPE, the extent of the flow fields along the y axis increases as the materials exit the die, indicatinga significant die swell effect, Fig. 4 (a), 5 (a).
This qualitative similarity of the flow fields between the sharkskin and the no sharkskin cases suggests that aproper understanding of the sharkskin phenomenon requiresa deeper analysis of the flow kinematics and, perhaps, acorrelation of the flow kinematics with the extensional rheological properties of the materials.
In the following we focus on the spatial distribution of axial gradients of the axial velocity component∂Vx∂x which,
as already pointed out above, provides an information on thedistribution of accelerations as well.Measurements of the axial velocity gradients for LLDPE above the onset of sharkskin are presented in Fig. 6. The
rates of axial extension are practically zero within the die(x < −1 mm), diamonds Fig. 6(b). As one approaches thedie exit (x = 0) a clear spatial pattern of the axial gradients is visible,Fig. 6(a) . The distribution of the axial gradientsis symmetric with respect to the main flow direction (x), Fig.6(b).
Large (and positive) values of the axial velocity gradientsare visible near the corner region (y = ±0.5 mm)around the die exit which suggests that the readjustment of the flow from a no-slip to a free boundary condition isaccompanied by a significant stretching of the material (or ahigh acceleration of the surface layers). The bulk of theflow is characterized by negative values of the axial gradients, consistent with a deceleration of the material elements.
There are two important points to make regarding the transversal distribution of the gradients near the die exit(circles Fig. 6(b)). First, the absolute value of the gradients near the free surface of the flow is about twice as large asin the bulk. This suggests that the accumulation of extensional stresses is larger near the free surface of the materialthan in the bulk. Secondly, the transversal distribution ofthe gradients is strongly non-uniform (note the pronouncedlocal maxima and the minimum of the profile around the die exit(circles and squares Fig. 6(b)) which suggests that,most likely, the extensional stresses are non uniformly distributed along the y axis as well.
To understand the origins of this particular distribution of the axial velocity gradients in the unstable case, we focuson the fields of axial velocity gradients right below the onset of sharkskin instability. Fig. 7 presents a comparison ofthe topology of the fields of axial velocity gradients∂Vx
∂x for LLDPE right below the onset of the sharkskin instability(panel (a)) and above the onset of the sharkskin instability(panel (b)).
The iso-contours presented in Fig. 7 indicate that the particular distribution of velocity gradients in the flow isdirectly related to the transition to an unstable (sharkskin) regime. Indeed, all the features of the field above the onsetof sharkskin instability Fig. 7 (b) are already emerging right below the onset of the instability, Fig. 7 (a). We therefore
8
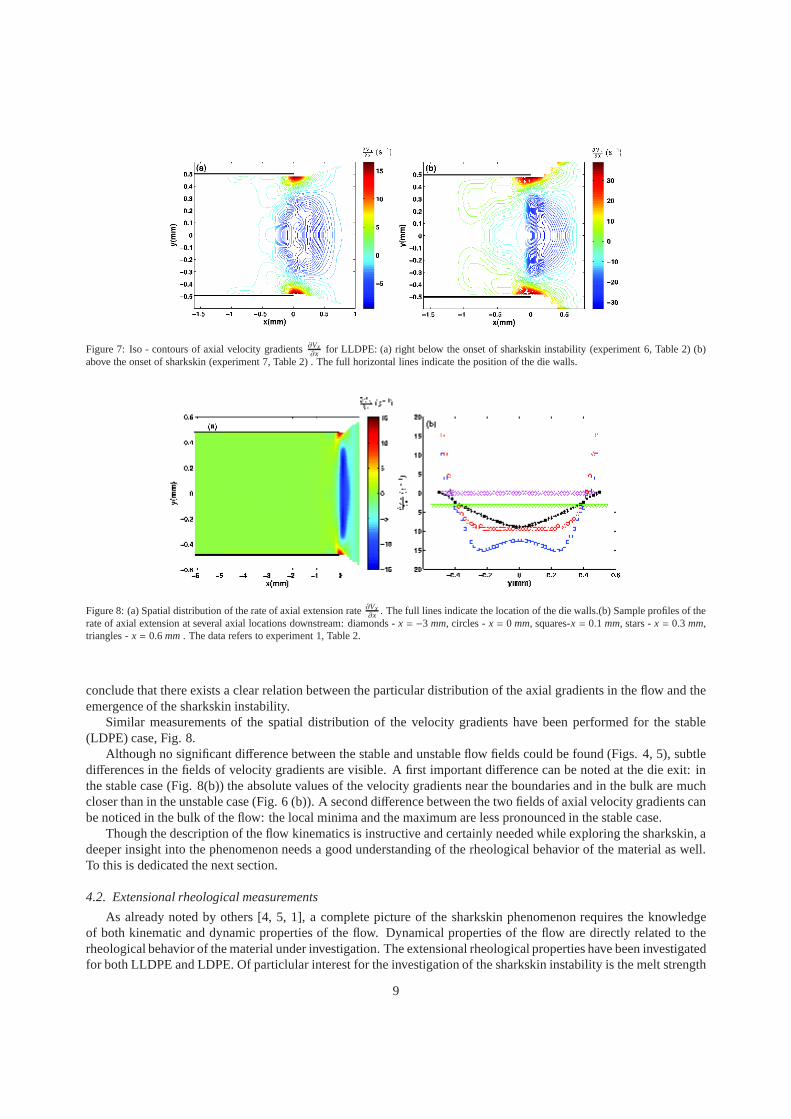
Figure 7: Iso - contours of axial velocity gradients∂Vx∂x for LLDPE: (a) right below the onset of sharkskin instability (experiment 6, Table 2) (b)
above the onset of sharkskin (experiment 7, Table 2) . The full horizontal lines indicate the position of the die walls.
Figure 8: (a) Spatial distribution of the rate of axial extension rate∂Vx∂x . The full lines indicate the location of the die walls.(b) Sample profiles of the
rate of axial extension at several axial locations downstream: diamonds -x = −3 mm, circles -x = 0 mm, squares-x = 0.1 mm, stars -x = 0.3 mm,triangles -x = 0.6 mm. The data refers to experiment 1, Table 2.
conclude that there exists a clear relation between the particular distribution of the axial gradients in the flow and theemergence of the sharkskin instability.
Similar measurements of the spatial distribution of the velocity gradients have been performed for the stable(LDPE) case, Fig. 8.
Although no significant difference between the stable and unstable flow fields could be found (Figs. 4, 5), subtledifferences in the fields of velocity gradients are visible. A first important difference can be noted at the die exit: inthe stable case (Fig. 8(b)) the absolute values of the velocity gradients near the boundaries and in the bulk are muchcloser than in the unstable case (Fig. 6 (b)). A second difference between the two fields of axial velocity gradients canbe noticed in the bulk of the flow: the local minima and the maximum are less pronounced in the stable case.
Though the description of the flow kinematics is instructiveand certainly needed while exploring the sharkskin, adeeper insight into the phenomenon needs a good understanding of the rheological behavior of the material as well.To this is dedicated the next section.
4.2. Extensional rheological measurements
As already noted by others [4, 5, 1], a complete picture of thesharkskin phenomenon requires the knowledgeof both kinematic and dynamic properties of the flow. Dynamical properties of the flow are directly related to therheological behavior of the material under investigation.The extensional rheological properties have been investigatedfor both LLDPE and LDPE. Of particlular interest for the investigation of the sharkskin instability is the melt strength
9

Figure 9: (a)Transient stress measurements for the LLDPE atdifferent rates of elongation andT = 220◦C: squares -˙ǫ = 6.7s−1, up triangles -ǫ = 8.7s−1, circles -ǫ = 10.6s−1, down triangles - ˙ǫ = 12.5s−1, left triangles - ˙ǫ = 14.5s−1. (b) Transient stress measurements for the LDPE atdifferent rates of elongation andT = 135◦C: squares -˙ǫ = 1.4s−1, circles - ǫ = 1.8s−1, down triangles - ˙ǫ = 2.2s−1, rhumbs - ˙ǫ = 2.6s−1, uptriangles - ˙ǫ = 3s−1. The vertical arrows indicate the physical rupture of the sample.
of the material defined as the stressσb at which the sample breaks during the extensional test. In the case a sampledoes not break it can only be said that the melt strength is higher than the maximum stressσm measured. The meltstrength is usually measured using the Rheotens apparatus.The Munstedt type extensional rheometer employed inthis study is able, however, to deliver more accurate results than the Rheotens device as it operates under isothermalconditions. The reproducibility of the stress strain curves in the stressing experiments (constant rate of extension,ǫ)for the LLDPE and the LDPE is better than 5 %.
Measurements of the transient extensional stresses for theLLDPE atT = 220◦C are presented in Fig. 9 (a). Theextensional data has been shifted fromT = 135◦C using the time temperature superposition principle, in order toextend the range of rates of extension closer to the rates achieved during the extrusion experiment (experiment 7 inTable 2). This way, a correlation between the flow kinematicsdiscussed in Sec. 4.1 and the rheological properties ofthe material is possible. For each of the rates of extension investigated, no significant strain hardening effect has beenobserved. It can also be noted that a steady state of extension (a plateau) seems to be reached for each of the rates ofdeformation investigated prior to the physical rupture of the sample.
Similar measurements were carried out with the LDPE Fig. 9 (b). There exist several significant differencesbetween the LDPE and the LLDPE extensional data. Firstly, incontrast to the LLDPE, only the samples at the twohighest elongational rates broke during elongation, Fig. 9(b). In the other cases the samples could be stretched tothe maximum strain of 3.2 and failed shortly afterwards due to interfacial effects. The points at which the specimensbroke are indicated by arrows. Secondly, unlike in the experiments with LLDPE, no steady state seems to be reachedin the experiments with LDPE. Thirdly, the extensional tests with LDPE indicate a significant strain hardening.
A comparison of two typical stress-strain curves of the two materials is presented in Fig. 10. The shape of thetwo curves differs completely which indicates that the failure mechanismsare, most probably, different for the twomaterials, too. Finally, we note that the stress at break is much higher in the case of LDPE than in the case of theLLDPE which simply means that, at a given flow rate through thedie, the LDPE can sustain larger stresses prior tofailure.
Fig. 11 shows a comparison of the highest stresses reached during the extensional tests as a function of the rate ofextension ˙ǫ. Each point represents the average of at least five measurements. As seen before, the maximum stressesobtained increase with growing shear rates. LDPE displays maximum stresses that are three to four times higher thanthe values for LLDPE. For both materials the dependence of the maximal stresses on the rate of extension can be fittedby a power law (the full lines in Fig. 11) and this will be used in the next section for assessments of the distributionof the extensional stresses in the flow.
10

Figure 10: Comparison of the stress-strain curves for LDPE and LLDPE: squares - LDPE at ˙ǫ = 3.0s−1 andT = 135◦C, circles - LLDPE atǫ = 14.5s−1 andT = 220◦C. The vertical arrows indicate the physical rupture of the samples.
Figure 11: Comparison of the maximum stresses obtained for LDPE and LLDPE: squares - LLDPE ,T = 220◦C, circles - LDPET = 135◦C. Thefull lines are power law fits. The LLDPE data has been shifted from T = 135◦C using the time-temperature superposition principle. The verticalarrows indicate the maximal rates of extension reached nearthe boundaries during the extrusion experiments.
11
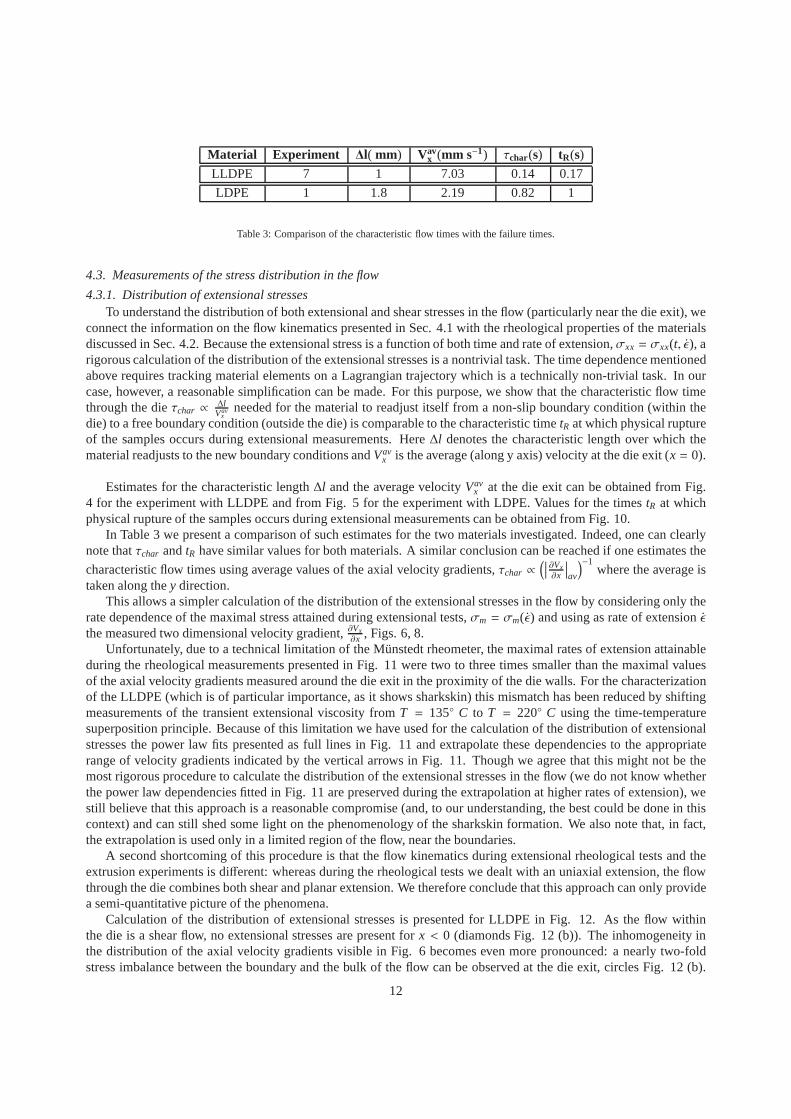
Material Experiment ∆l( mm) Vavx (mm s−1) τchar(s) tR(s)
LLDPE 7 1 7.03 0.14 0.17
LDPE 1 1.8 2.19 0.82 1
Table 3: Comparison of the characteristic flow times with thefailure times.
4.3. Measurements of the stress distribution in the flow
4.3.1. Distribution of extensional stressesTo understand the distribution of both extensional and shear stresses in the flow (particularly near the die exit), we
connect the information on the flow kinematics presented in Sec. 4.1 with the rheological properties of the materialsdiscussed in Sec. 4.2. Because the extensional stress is a function of both time and rate of extension,σxx = σxx(t, ǫ), arigorous calculation of the distribution of the extensional stresses is a nontrivial task. The time dependence mentionedabove requires tracking material elements on a Lagrangian trajectory which is a technically non-trivial task. In ourcase, however, a reasonable simplification can be made. For this purpose, we show that the characteristic flow timethrough the dieτchar ∝
∆lVav
xneeded for the material to readjust itself from a non-slip boundary condition (within the
die) to a free boundary condition (outside the die) is comparable to the characteristic timetR at which physical ruptureof the samples occurs during extensional measurements. Here ∆l denotes the characteristic length over which thematerial readjusts to the new boundary conditions andVav
x is the average (along y axis) velocity at the die exit (x = 0).
Estimates for the characteristic length∆l and the average velocityVavx at the die exit can be obtained from Fig.
4 for the experiment with LLDPE and from Fig. 5 for the experiment with LDPE. Values for the timestR at whichphysical rupture of the samples occurs during extensional measurements can be obtained from Fig. 10.
In Table 3 we present a comparison of such estimates for the two materials investigated. Indeed, one can clearlynote thatτchar andtR have similar values for both materials. A similar conclusion can be reached if one estimates the
characteristic flow times using average values of the axial velocity gradients,τchar ∝(∣
∣
∣
∂Vx∂x
∣
∣
∣
av
)
−1where the average is
taken along they direction.This allows a simpler calculation of the distribution of theextensional stresses in the flow by considering only the
rate dependence of the maximal stress attained during extensional tests,σm = σm(ǫ) and using as rate of extension ˙ǫ
the measured two dimensional velocity gradient,∂Vx∂x , Figs. 6, 8.
Unfortunately, due to a technical limitation of the Munstedt rheometer, the maximal rates of extension attainableduring the rheological measurements presented in Fig. 11 were two to three times smaller than the maximal valuesof the axial velocity gradients measured around the die exitin the proximity of the die walls. For the characterizationof the LLDPE (which is of particular importance, as it shows sharkskin) this mismatch has been reduced by shiftingmeasurements of the transient extensional viscosity fromT = 135◦ C to T = 220◦ C using the time-temperaturesuperposition principle. Because of this limitation we have used for the calculation of the distribution of extensionalstresses the power law fits presented as full lines in Fig. 11 and extrapolate these dependencies to the appropriaterange of velocity gradients indicated by the vertical arrows in Fig. 11. Though we agree that this might not be themost rigorous procedure to calculate the distribution of the extensional stresses in the flow (we do not know whetherthe power law dependencies fitted in Fig. 11 are preserved during the extrapolation at higher rates of extension), westill believe that this approach is a reasonable compromise(and, to our understanding, the best could be done in thiscontext) and can still shed some light on the phenomenology of the sharkskin formation. We also note that, in fact,the extrapolation is used only in a limited region of the flow,near the boundaries.
A second shortcoming of this procedure is that the flow kinematics during extensional rheological tests and theextrusion experiments is different: whereas during the rheological tests we dealt with anuniaxial extension, the flowthrough the die combines both shear and planar extension. Wetherefore conclude that this approach can only providea semi-quantitative picture of the phenomena.
Calculation of the distribution of extensional stresses ispresented for LLDPE in Fig. 12. As the flow withinthe die is a shear flow, no extensional stresses are present for x < 0 (diamonds Fig. 12 (b)). The inhomogeneity inthe distribution of the axial velocity gradients visible inFig. 6 becomes even more pronounced: a nearly two-foldstress imbalance between the boundary and the bulk of the flowcan be observed at the die exit, circles Fig. 12 (b).
12

Figure 12: (a) Spatial distribution of the extensional stressesσxx for LLDPE above the onset of sharkskin. (b) Profiles of the extensional stressesacross the flow direction at several axial positions: diamonds -x = −3 mm, circles -x = 0 mm, squares-x = 0.1 mm, stars -x = 0.3 mm, triangles -x = 0.6 mm. The data refer to experiment 7, Table 2. The vertical dottedlines indicate the locations of the edges of the stress boundary layer (seetext).
Corresponding to the location (alongy axis) where the axial gradients of the axial velocity component change sign Fig.6 (b) the extensional stresses pass through a minimum. We interpret this fact as the emergence of a boundary layerfor the extensional stresses within which the material elements are significantly stretched along the flow direction (seethe vertical dotted lines in Fig. 12 (b)). It is very important to note that the extrapolated value of the melt strength(σm = 0.5 MPa at ǫ = 40 s−1) is comparable to the average stress imbalance between the boundary layer and bulk:σ
boundaryxx − σ+xxbulk = 0.37 MPa. This suggests that the material located within the boundary layer fails during the
extrusion process and sharkskin is observed.Over a distance as small as 0.1 mmfrom the die exit, the stress imbalance visible atx = 0 mmdiminishes rapidly
and the stresses in the boundary layer are now comparable to stresses in the bulk, squares Fig. 12 (b). Simultaneouswith this redistribution of extensional stresses between the boundaries and the bulk, the sharkskin instability emerges.Further downstream, the stress accumulation in the boundaries disappears gradually (stars and triangles, Fig. 12 (b)).
Measurements of the distribution of extensional stresses are presented for LDPE in Fig. 13. Clear differenceswith respect to the stress distribution for LLDPE (above theonset of sharkskin) can be observed. First, the stressdistribution around the die exit is in this case more homogeneous than in the case of LLDPE. Indeed, the stress valuesin the boundaries are in this case only about 30% higher than in the bulk. We interpret this as a more stable stressdistribution along they axis. A second notable difference is related to the extent of the boundary layer: in the case ofthe LDPE the bulk region is wider and the boundary layer thinner than in the (unstable) LLDPE case. This is, in ouropinion, a stabilizing factor as well. The extrapolated value of the melt strength (σm = 1.7 MPaat ǫ = 15s−1) is nearlytwo times larger than the average stress imbalance between the boundary layer and bulk:σ+boundary− σ
+bulk = 1 MPa.
This suggests that the material can sustain the extensionalstress imbalance without failing which corroborates withthe absence of the sharkskin instability. A third difference between the stress distributions for the LLDPE and theLDPE experiments relates to the axial extent of the stress distributions, Figs. 12, 13 (a). Whereas in the case of theLLDPE the local stress maxima visible in the bulk region of the flow extend over nearly two millimeters along theflow direction (x axis) Fig. 12 (a), in the stable case (LDPE) they extend over less than a millimeter, Fig. 13 (a). Thiscan be qualitatively understood as follows. Due to a smallerstress imbalance between the boundary and the bulk, thematerial readjusts itself from a non-slip boundary condition to a plug like flow faster (over a shorter axial distance) inthe case of LDPE flow but it needs more time in the case of the LLDPE experiments.
Finally we note that the simplified way of calculating the stress distribution in the flow (by neglecting the timedependence of the tensile stresses) proposed in the beginning of this section does not alter the validity of our conclu-sions, as these conclusions are stated in terms of stress differences (between boundary and bulk) rather than in termsof stresses.
13

Figure 13: (a) Spatial distribution of the extensional stressesσxx for LDPE . The horizontal white lines indicate the position of the die wall.(b)Profiles of the extensional stresses across the flow direction at several axial positions: diamonds -x = −3 mm, circles - x = 0 mm, squares-x = 0.1 mm, stars -x = 0.3 mm, triangles -x = 0.6 mm. The data refer to experiment 1, Table 2. The vertical dottedlines indicate the locations ofthe edges of the stress boundary layer (see text).
4.3.2. Distribution of shear stressesDifferent flow regimes during the extrusion of polymer melts through dies have been traditionally characterized
in terms of the wall shear stress (calculated using the pressure drop) and the apparent shear rates [5, 4], as illustratedin the sketch presented in Fig. 1. On the other hand, it has been demonstrated in Sec. 4.3.1 that a main differencebetween the unstable and stable flows is actually related to the distribution of extensional stresses around the die exit,more precisely to the stress balance between the boundariesand the bulk of the flow.
In this context, a natural question arrises: do the shear stresses play any role in the emergence of the sharkskininstability and furthermore, is the wall shear stress a truecontrol parameter or just a formal one?
To address this question, we present in the following a comparative study of the distributions of shear stresses inboth unstable (LLDPE) and stable (LDPE) cases. Two dimensional maps of the shear stresses are obtained using aprocedure similar to that described in Sec. 4.3.1. First, shear rheological measurements have been carried out forboth materials and the dependence of the shear stressesσxy on the rate of shear ˙γ has been obtained (data not shownhere). Secondly, the shear flow curves have been fitted with the Carreau-Yassuda model and the distribution of theshear stresses in the flow has been calculated using the fit function and interpreting the transversal velocity gradients∂Vx∂y as rates of shear. Measurements of the distribution of the shear stresses for LLDPE and LDPE are shown in Figs.
14, 15, respectively.For both materials investigated, the flow within the die (x < 0) is consistent with a fully developed Poiseuille
flow characterized by shear stresses monotonically decreasing from a maximal value near the boundaries (y = ±0.5)to zero at the center line (y = 0). Around the die exit the shear stresses quickly decay to zero for both materialswhich corresponds to a transition to a plug-like flow. For both the unstable (LLDPE) and stable (LDPE) cases themaximal shear stresses attained within the die near the walls are significantly smaller than the extensional stresseswhich suggests that the emergence of the sharkskin instability is, most probably, unrelated to the shear stresses.
Therefore one can conclude that the wall shear stress can be used only as a formal control parameter in studyingdifferent flow regimes. The fact that diagrams such as the one sketched in Fig. 1 still provide useful informationregarding the stability of the extrusion flow is that the extensional stresses are increasing with the pressure drop aswell.
5. Conclusions
A systematic experimental study of the sharkskin instability has been presented. The flows of two polymer melts(namely LLDPE, which shows sharkskin for apparent shear rates larger than an onset value and LDPE, which shows
14

Figure 14: (a) Spatial distribution of the shear stressesσxy for the LLDPE above the onset of sharkskin. The horizontal white lines indicate theposition of the die wall.(b) Profiles of the shear stresses across the flow direction at several axial positions: diamonds- x = −3 mm, circles -x = 0 mm, squares-x = 0.1 mm, stars -x = 0.3 mm, triangles -x = 0.6 mm. The data refer to experiment 7, Table 2.
Figure 15: (a) Spatial distribution of the shear stressesσxy for the LDPE. The horizontal white lines indicate the position of the die wall.(b) Profilesof the shear stresses across the flow direction at several axial positions: circles -x = 0 mm, squares-x = 0.1 mm, stars -x = 0.3 mm, triangles -x = 0.6 mm.The data refers to experiment 1, Table 2.
15

no sharkskin over a broad range of apparent shear rates) through a slit die have been accurately characterized usingLDA.
The central idea of the present study is to analyze separately the flow kinematics and the rheological propertiesof the materials (in both extension and shear) and based on this to obtain the distribution of extensional and shearstresses in the flow by connecting the kinematic flow properties with the rheological properties.
In Sec. 4.1 we have compared the kinematics of unstable and stable extrusion flows. The flow fields are qualita-tively similar in both cases: as the materials exit the die the flows accelerate near the boundaries and decelerate aroundthe center line, Figs. 4, 5.
This apparent similarity of the unstable and stable flow fields prompted us to perform a deeper analysis of theflow kinematics by analyzing the fields of the axial gradientsof the axial velocity component,∂Vx
∂x . Unlike the flowfields, the fields of gradients for the unstable and stable cases do show several notable differences. In the unstablecase there exists a larger imbalance of the velocity gradients between the boundary region and the bulk region thanin the stable case, Figs. 6, 8. This indicates that corresponding to the unstable case the surface layers of the materialare subjected to higher accelerations (or equivalently rates of extension) than in the stable case. In the unstable caseone can also note that at the die exit the transversal distribution of the axial velocity gradients is more inhomogeneousthan in the stable case. Indeed, whereas the transversal profiles of velocity gradients at the die exit exhibit pronouncedlocal maxima for the LLDPE (circles, Figs. 6(b)), the transversal profiles for the LDPE exhibit less pronounced or nolocal maxima (circles and squares, Figs. 8(b)).
Sec. 4.2 presents a comparative study of the rheological properties of LLDPE and LDPE in uniaxial extension.A major difficulty is related to matching the range of the rates of extension accessible by the Munstedt rheometerwith the range of velocity gradients measured by LDA in the extrusion flows. This is particularly important for thecase of LLDPE(where the sharkskin instability is observed). As the maximal rate of deformation (˙ǫmax = 3 s−1)achievable during the rheometric tests could not be increased, the only way to overcome this difficulty was using thetime-temperature superposition principle to shift the extensional data acquired atT = 135◦C to T = 220◦C (which isthe temperature at which the flow data was acquired - experiment 7, Table 2). Thus, the maximal rate of deformationduring the extensional tests becomes ˙ǫmax= 14.5 s−1 which compares better to the average values of the axial velocitygradients at the die exit (roughly 20s−1 in the bulk and up to 40s−1).
Measurements of the transient tensile stresses reveal a significantly different rheological behavior of the two ma-terials, Figs. 9, 10. The tensile stress measurements for LLDPE show no significant strain hardening behavior and asteady state seems to be reached prior to the physical rupture of the sample (which occurred for each of the rates ofdeformation investigated), Fig. 9 (a). The tensile stress measurements for LDPE show a significant strain hardeningbehavior and for each of the rates of extension observed, no steady state has been reached, Fig. 9 (b). Correspondingto the highest rates of the deformation explored, the LDPE samples break at a higher Hencky strain and the terminalstress at the break point is about 4.6 times larger than in the case of LLDPE, Fig. 10. The main conclusion of therheological investigation is that, at a given deformation (Hencky strain), the LDPE is able to sustain much highertensile stresses prior to failure.
Sec. 4.3 connects the results on the flow kinematics presented in Sec. 4.1 with the rheological characterizationpresented in Sec. 4.2 in order to characterize the distribution of both tensile and shear stresses during the extrusionflows of the two materials. Spatial distributions of the tensile stresses have been measured using the rate dependenceof the maximal stresses reached during tensile tests Fig. 11and the spatial distribution of the axial gradients of theaxial velocity component, Figs. 6, 8. The inhomogeneity in the transversal distribution of the velocity gradientsobserved near the die exit during the experiments with the LLDPE translates into an even stronger inhomogeneity inthe transversal distribution of the extensional stresses,Fig. 12 (b). This inhomogeneity is less pronounced or absentinthe case of LDPE, Fig. 13 (b), suggesting that this transversal stress distribution relates to a more stable configuration.
Of particular relevance is the emergence of a boundary layerfor the tensile stresses, Figs. 12 (b), 13(b). Corre-sponding to the edge of the boundary layer the profiles of the axial gradients measured outside of the die intersect(Figs. 6 (b), 8 (b)) and the corresponding tensile stresses pass through a minimum, Figs. 12 (b), 13(b). In the unstablecase (LLDPE) the tensile stress in the boundary layer is roughly twice larger than the tensile stress in the bulk at thedie exit. The stress imbalance between boundary and bulk is in this case practically equal to the melt strength of thematerial Fig. 11. As a consequence, the materials fails, thesharkskin instability emerges and the stress imbalance isreleased right after the die exit (squares, Fig. 12 (b)).
In the stable case (LDPE) the stresses in the boundary are only about 30% larger than in the bulk and this imbalance
16

is smaller than the melt strength. Consequently the material does not fail near the die exit and no sharkskin instabilityis observed. Another important difference between the unstable and the stable case relates to the extent of the stressboundary layer: in the unstable case the boundary layer is wider. Bearing in mind that the integral of the tensile stressover the boundary layer
∫
BLσxx(y)dy represents a surface energy density, one can conclude that in the unstable case
more energy is accumulated in the superficial layers than in the stable case. Measurements of the distribution of theshear stresses at the die exit and outside the die for both materials reveal a quick transition from a Poisseuile flowto a plug flow characterized by negligible values of the shearstresses. Therefore a role of the shear stresses in theemergence of the sharkskin instability is ruled out.
Acknowledgments
T. I. B. gratefully acknowledges the financial support from the German Research Foundation, grant MU 1336/6-4.We are grateful to J. Resch and U. Kessner for their support with the time-temperature shift of the LLDPE elongationaldata. Furthermore, we thank the referees for their valuablecomments and suggestions.
[1] Arda, D., R., Mackley, M., R., 2005. The effect of die exit curvature, die surface roughness and a fluoropolymer additive on sharkskinextrusion instabilities in polyethylene processing. Journal of Non-Newtonian Fluid Mechanics 126, 47–61.
[2] Bird, R. B., Curtiss, C. F., Armstrong, R. C., Hassager, O., 1987. Dynamics of Polymeric Liquids. John Willey, New York.[3] Cogswell, F., N., 1977. Stretching flow instabilities atthe exits of extrusion dies. Journal of Non-Newtonian FluidMechanics 2, 37–47.[4] Denn, Morton, M., 2001. Extrusion instabilities and wall slip. Annual Review of Fluid Mechanics 33, 265–287.[5] Denn, M. M., 2009. Simulation of polymer melt processing. AIChE Journal 55, 1641–1647.[6] Durst, F., April 1976. Principles and Practice of Laser Doppler Anemometry. Academic Press Inc.[7] Ghanta, V., G., Riise, B., L., Denn, M. M., 1999. Disappearance of extrusion instabilities in brass capillary dies. Journal of Rheology 43,
435–442.[8] Hertel, D., 2007. Flow of polyethylene melts within and into rectangular ducts investigated by laser-Doppler velocimetry, PhD Thesis,
Friedrich-Alexander-Universitat Erlangen-Nurnberg.Sierke Verlag, Gottingen.[9] Howells, E. R., Benbow, J. J., 1962. Flow defects in polymer melts. Trans. J. Plast. Inst. 30, 240–253.
[10] Joshi, Y. M., Denn, M. M., 2004. Rupture of entangled polymer liquids in elongational flow with dissipation. Journalof Rheolgy 48, 591–598.[11] Kalika, D. S., Denn, M. M., 1987. Wall slip and extrudatedistortion in linear low-density polyethylene. Journal ofRheology 31, 815–834.[12] Kessner, U., Kaschta, J., Munstedt, H., 2009. Determination of method-invariant activation energies of long-chain branched low-density
polyethylenes. Journal of Rheolgy 53, 1001–1016.[13] Kissi, N. E., Piau, J., M., 1994. Adhesion of linear low density polyethylene for flow regimes with sharkskin. Journal of Rheology 38,
1447–1463.[14] Kissi, N. E., Piau, J., M., 1994. Effect of surface properties on polymer melt slip and extrusiondeffects. Journal of Non-Newtonian Fluid
Mechanics 52, 249–261.[15] Koeltzsch, K., 1999. On the relationship between the lagrangian and eulerian time scale. Atmos. Environ. 33, 117.[16] Larson, R., G., 1992. Instabilities in viscoelastic flows. Rheologica Acta 31, 213–263.[17] Merten, A., 2005. Untersuchungen zu fliessinstabilit¨aten bei der extrusion von polymeren mit der laser-doppler anemometrie. Doctoral Thesis,
Friedrich-Alexander-Universitat Erlangen-Nurnberg.[18] Merten, A., Schwetz, M., Munstedt, H., 2003. Laser doppler anemometry: a powerful tool to investigate the flow behavior of polymer melts.
International Journal of Applied Mechanics and Engineering 8, 283–288.[19] Miller, E., Lee, S. J., Rothstein, J. P., 2006. The effect of temperature gradients on the sharkskin surface instability in polymer extrusion
through a slit die. Rheologica Acta 45, 943–950.[20] Moynihan, R. H., Baird, D. G., Ramanathan, R., 1990. Additional observations on the surface melt fracture behaviorof linear low-density
polyethylene. Journal of Non Newtonian Fluid Mechanics 36,255.[21] Munstedt, H., 1979. New universal extensional rheometer for polymer melts. Journal of Rheology 23, 421–436.[22] Petrie, C. J. S., Denn, Morton, M., 1976. Instabilitiesin polymer processing. AIChE Journal 22, 209–236.[23] Ramamurthy, A. V., 1986. Wall slip in viscous fluids and influence of materials of construction. Journal of Rheology 30, 337–357.[24] Rutgers, R. P. G., Mackley, M. R., 2000. The correlationof experimental surface extrusion instabilities with numerically predicted exit surface
stress concentrations and melt strength for linear low-density polyethylene. Journal of Rheology 44, 1319–1334.[25] Schmidt, M., Wassner, E., Munstedt, H., 1999. Setup and test of a laser doppler velocimeter for investigations of flow behaviour of polymer
melts. Mechanics of Time-Dependent Materials 3, 371–393.[26] Schwetz, M., 2002. Untersuchungen zu Dusenstrmungenvon Polyolefinschmelzen mit der Laser-Doppler-Anemometrie,PhD Thesis,
Friedrich-Alexander-Universitat Erlangen-Nurnberg.Shaker Verlag, Aachen.[27] Taylor, G. I., 1938. The spectrum of turbulence. Proc. R. Soc. London Ser. A. 164, 476.[28] Tordella, J. P., 1963. Unstable flow of molten polymers:A second site of melt fracture. Journal of Applied Polymer Science 7, 215–229.[29] Venet, C., Vergnes, B., 1997. Experimental characterization of sharkskin in polyethylenes. Journal of Rheology 41, 873–892.[30] Venet, C., Vergnes, B., 2000. Stress distribution around capillary die exit: an interpretation of the onset of sharkskin defect. Journal of
Non-Newtonian Fluid Mechanics 93, 117–132.[31] Wang, S.-Q., Drda, P. A., Inn, Y.-W., 1996. Exploring molecular origins of sharkskin, partial slip and slope changein linear low-density
polyetylene. Journal of Rheology 40, 875–898.
17
Copyright © 2022 FDOKUMEN