Geophysical investigations in the Flumendosa River Delta, Sardinia (Italy) --- Seismic reflection...
8
Geophysical investigations in the Flumendosa River Delta, Sardinia „Italy… — Seismic reflection imaging Gian Piero Deidda 1 , Gaetano Ranieri 1 , Gabriele Uras 1 , Pietro Cosentino 2 , and Raffaele Martorana 2 ABSTRACT A geophysical investigation that included seismic-reflec- tion surveying and time-domain electromagnetics EM was carried out in the Flumendosa River Delta plain in southeast- ern Sardinia, Italy. The objective was to improve knowledge of geologic and hydrogeologic controls on a highly produc- tive aquifer hosted in thick Quaternary deposits and known to be affected by an extensive saltwater intrusion. The seismic reflection survey, whose results are reported here, aimed to image the Paleozoic bedrock topography and to obtain de- tailed structural and stratigraphic information on the se- quence of largely fluvial sediments extending from the sur- face down to bedrock. The survey consisted of two inline pro- files, nearly parallel to the coastline and 1 km inland. The sources 0.25 kg of explosives buried at 2 m depth and re- ceivers 50-Hz vertical geophones produced a twelvefold data set with common midpoints every 2.5 m. Detailed inte- grated velocity analysis constant velocity gathers, constant velocity stacks, and semblance plots and frequency-wave- number-domain dip moveout DMO proved to be the most important processing steps in producing the two stacked sec- tions. Both sections were characterized by distinct seismic units bounded by quasi-continuous reflectors. The lowermost reflection, imaged on section 1 at two-way traveltimes be- tween 310 ms 300 m and 580 ms 530 m and on sec- tion 2 between 200 ms 190 m and 65 ms 52 m, was interpreted to be Paleozoic bedrock. A maximum depth twice as deep as expected was the primary and somewhat surpris- ing result. Imaging of oblique progradational facies — anoth- er major finding — proved the existence of undocumented marine Pleistocene sediments that could help in revising the area’s geology. INTRODUCTION With a rapidly increasing population density, particularly in coast- al areas, the quantity and quality of water have become rate-limiting parameters in land management. Proper water-resource manage- ment relies on the development of accurate, predictive groundwater- flow models. However, the accuracy of the models is largely depen- dent upon our ability to determine adequately the geometries of geologic structures and hydrogeologic systems. Groundwater-flow models usually are developed from information obtained by drilling observation wells. However, when geologic settings are complex and/or aquifers are deep, surface geophysical surveys can provide a more economical approach with sufficient detail for modeling. Among the various geophysical methods, seismic reflection, elec- tric, and EM techniques appear to be the most suitable for this pur- pose. Seismic reflection profiling potentially can provide an accurate spatial representation of geologic, structural, and stratigraphic boundaries Birkelo et al., 1987; Jongerius and Helbig, 1988; Gei- ssler, 1989; Miller et al., 1989; Miller and Steeples, 1990; Liberty, 1998; Whiteley et al., 1998. However, electric and EM methods are better suited for identifying hydrogeologic units Fitterman and Stewart, 1986; Poulsen and Christensen, 1999 and distinguishing between freshwater and saltwater Mills et al., 1988; Goldman et al., 1991. Following the general approach reported in Shtivelman and Gold- man 2000, a geophysical survey using seismic-reflection and time- domain electromagnetic TDEM methods was conducted to study a complex coastal aquifer of vital importance in the southeastern part of Sardinia, Italy. This insufficiently explored study area is the delta plain of the Flumendosa River, which hosts a highly productive aquifer. Unfortunately, the aquifer has been affected by extensive saltwater intrusion caused mainly by uncontrolled overexploitation of groundwater resources for drinking water and irrigation purposes, by fish farming, and by a decrease in natural recharge of coastal aqui- fers as a result of upstream damming. Detailed knowledge of the ar- Manuscript received by the Editor February 26, 2005; revised manuscript received June 24, 2005; published online August 7, 2006. 1 University of Cagliari, Dipartimento di Ingegneria del Territorio, Sezione di Geologia Applicata e Geofisica Applicata, Piazza d’Armi, 16, Cagliari 09123, Italy. E-mail: [email protected]; [email protected]; [email protected]. 2 University of Palermo, Dipartimento di Chimica e Fisica Della Terra ed Applicazioni Alle Georisorse e ai Rischi Naturali, Via Archirafi 26, Palermo 90123, Italy. E-mail: [email protected]; [email protected]. © 2006 Society of Exploration Geophysicists. All rights reserved. GEOPHYSICS, VOL. 71, NO. 4 JULY-AUGUST 2006; P. B121–B128, 10 FIGS., 2 TABLES. 10.1190/1.2213247 B121
Transcript of Geophysical investigations in the Flumendosa River Delta, Sardinia (Italy) --- Seismic reflection...

GS
GR
I
I
GEOPHYSICS, VOL. 71, NO. 4 �JULY-AUGUST 2006�; P. B121–B128, 10 FIGS., 2 TABLES.10.1190/1.2213247
eophysical investigations in the Flumendosa River Delta,ardinia „Italy… — Seismic reflection imaging
ian Piero Deidda1, Gaetano Ranieri1, Gabriele Uras1, Pietro Cosentino2, andaffaele Martorana2
apmfldgmoam
tpsbs1bSb1
mdcopasobf
eceivede di Ge
pplica
ABSTRACT
A geophysical investigation that included seismic-reflec-tion surveying and time-domain electromagnetics �EM� wascarried out in the Flumendosa River Delta plain in southeast-ern Sardinia, Italy. The objective was to improve knowledgeof geologic and hydrogeologic controls on a highly produc-tive aquifer hosted in thick Quaternary deposits and known tobe affected by an extensive saltwater intrusion. The seismicreflection survey, whose results are reported here, aimed toimage the Paleozoic bedrock topography and to obtain de-tailed structural and stratigraphic information on the se-quence of largely fluvial sediments extending from the sur-face down to bedrock. The survey consisted of two inline pro-files, nearly parallel to the coastline and 1 km inland. Thesources �0.25 kg of explosives buried at 2 m depth� and re-ceivers �50-Hz vertical geophones� produced a twelvefolddata set with common midpoints every 2.5 m. Detailed inte-grated velocity analysis �constant velocity gathers, constantvelocity stacks, and semblance plots� and frequency-wave-number-domain dip moveout �DMO� proved to be the mostimportant processing steps in producing the two stacked sec-tions. Both sections were characterized by distinct seismicunits bounded by quasi-continuous reflectors. The lowermostreflection, imaged on section 1 at two-way traveltimes be-tween 310 ms ��300 m� and 580 ms ��530 m� and on sec-tion 2 between 200 ms ��190 m� and 65 ms ��52 m�, wasinterpreted to be Paleozoic bedrock.Amaximum depth twiceas deep as expected was the primary and somewhat surpris-ing result. Imaging of oblique progradational facies — anoth-er major finding — proved the existence of undocumentedmarine Pleistocene sediments that could help in revising thearea’s geology.
Manuscript received by the Editor February 26, 2005; revised manuscript r1University of Cagliari, Dipartimento di Ingegneria del Territorio, Sezion
taly. E-mail: [email protected]; [email protected]; [email protected] of Palermo, Dipartimento di Chimica e Fisica Della Terra ed A
taly. E-mail: [email protected]; [email protected].© 2006 Society of Exploration Geophysicists.All rights reserved.
B121
INTRODUCTION
With a rapidly increasing population density, particularly in coast-l areas, the quantity and quality of water have become rate-limitingarameters in land management. Proper water-resource manage-ent relies on the development of accurate, predictive groundwater-ow models. However, the accuracy of the models is largely depen-ent upon our ability to determine adequately the geometries ofeologic structures and hydrogeologic systems. Groundwater-flowodels usually are developed from information obtained by drilling
bservation wells. However, when geologic settings are complexnd/or aquifers are deep, surface geophysical surveys can provide aore economical approach with sufficient detail for modeling.Among the various geophysical methods, seismic reflection, elec-
ric, and EM techniques appear to be the most suitable for this pur-ose. Seismic reflection profiling potentially can provide an accuratepatial representation of geologic, structural, and stratigraphicoundaries �Birkelo et al., 1987; Jongerius and Helbig, 1988; Gei-sler, 1989; Miller et al., 1989; Miller and Steeples, 1990; Liberty,998; Whiteley et al., 1998�. However, electric and EM methods areetter suited for identifying hydrogeologic units �Fitterman andtewart, 1986; Poulsen and Christensen, 1999� and distinguishingetween freshwater and saltwater �Mills et al., 1988; Goldman et al.,991�.
Following the general approach reported in Shtivelman and Gold-an �2000�, a geophysical survey using seismic-reflection and time-
omain electromagnetic �TDEM� methods was conducted to study aomplex coastal aquifer of vital importance in the southeastern partf Sardinia, Italy. This insufficiently explored study area is the deltalain of the Flumendosa River, which hosts a highly productivequifer. Unfortunately, the aquifer has been affected by extensivealtwater intrusion caused mainly by uncontrolled overexploitationf groundwater resources for drinking water and irrigation purposes,y fish farming, and by a decrease in natural recharge of coastal aqui-ers as a result of upstream damming. Detailed knowledge of the ar-
June 24, 2005; published onlineAugust 7, 2006.ologia Applicata e Geofisica Applicata, Piazza d’Armi, 16, Cagliari 09123,
zioni Alle Georisorse e ai Rischi Naturali, Via Archirafi 26, Palermo 90123,

eld
qudrqih
ssflbaoorsmstt
cvttwr
rgbmz�c
tostmtcsiWomfectoftoart
mitw
FeatmmPmu
B122 Deidda et al.
a’s geology and hydrogeology is vitally important because pro-onged periods of drought have made groundwater the region’s pre-ominant �if not sole� water resource.
Generally, quantitative interpretation of subsurface geology re-uires borehole information. However, because such information isnavailable in the present case, we must rely chiefly on geophysicalata for determining the geometry of subsurface structures, with theesult that certain aspects remain speculative. Nevertheless, high-uality geophysical imaging can provide detailed, useful subsurfacenformation that cannot be obtained through sparsely spaced drill-oles.
Here, we report the results of a 2D seismic reflection survey de-igned to image the Paleozoic bedrock topography and to obtaintructural and stratigraphic information on the sequence of largelyuvial sediments extending from the surface down to the bedrockoundary. Since we could obtain no certain a priori informationbout bedrock depth for this location, we assumed a maximum depthf 200–300 m �Di Gregorio, personal communication, 2002�, basednly on surface geologic and geomorphologic information and bed-ock depths from similar areas in Sardinia. The high-quality seismicections reveal a complex bedrock topography with unexpectedaximum depths of about 530 m. The results also show interesting
tratigraphic features characteristic of fluvial deltaic environmentshat could be of great importance for future groundwater exploita-ion.
SURVEY LOCATION AND GEOLOGIC SETTING
The coastal plain of the Flumendosa River on the southeasternoast of Sardinia �Figure 1� extends from the Tyrrhenian Sea to theillage of San Vito �S. Vito�, 7 km westward. Prior to this project, lit-le detailed information was available on its geology, despite morehan 2000 exploitation wells drilled in the area. In fact, none of theseells, which extend no more than 50 m in depth, sampled the bed-
ock �Paleozoic� section.
igure 1. Map showing location of seismic lines and a simplified geora plain survey area. Unit 1: Alluvial �second-order alluvial terracend littoral gravels, sand, silt, and clays. Unit 2: Conglomerates and sem of alluvial terraces �first order� linking up with the Piedmont al
aterial. Units 3–6: Metamorphic rocks �mainly metaconglomeratetasiltstones, metalimestones, and porphyritic metavolcanic rockaleozoic basement. Unit 7: The Arenarie di S.Vito Formation �irricaceous metasandstones and metaquartzarenites� is the most im
nit bordering the Muravera plain.
The map in Figure 1 is based on surface outcrops of Paleozoicocks and general geologic features in the area. Schematically, theeology of the area is characterized by a Paleozoic metamorphicasement overlain by a thick Quaternary alluvial blanket. The base-ent, which outcrops at the edges of the plain, consists of the Paleo-
oic Arenarie di S. Vito Formation �Cambrian-Ordovician�, a thick�500 m� terrigenous succession of irregular sequences of mica-eous metasandstone and metaquartzarenite.
Both Pleistocene and Holocene sediments can be recognized inhe Quaternary alluvial deposits. Surface geology and geomorphol-gy, together with bedrock depth information from similar areas,uggest a maximum thickness of 200–300 m for the deposits. Pleis-ocene sediments are mostly fluvial continental facies, with local
arine facies �Tyrrhenian transgression� located slightly south ofhe area of investigation �Barca et al., 1981�. These sediments areomprised of tabular beds of coarse conglomerates with a lean sand-hale matrix that alternates with thin beds of red siltstone. These sed-ments, which were probably reincised during the peak of the
ürmian marine regression, form a system of alluvial terraces �firstrder� that outcrop fairly continuously along the banks of the Flu-endosa River and its tributaries and link up with Piedmont alluvial
ans of detritic material. Holocene alluvial material, largely deposit-d during the weak Versilian transgression, is comprised of coarseonglomerates with a shaly sand matrix prevailing over pebbles.Af-erward, this formation was reincised, forming a system of secondrder alluvial terraces that extends throughout much of the plain. Aew meters of present alluvial sediments �gravel and sand� completehe Quaternary sequence. Although there are no certain indicationsf pre-Tyrrhenian marine transgression �Eocene?�, the presence oflluvial deposits of that age at the base of the Quaternary sedimenta-y complex cannot be ruled out �Di Gregorio, personal communica-ion, 2002�.
Paleozoic formations in the area are characterized by low-gradeetamorphism and two phases of Hercynian tectonics. A system of
soclinal folds with axes striking east-west appears to be related tohe first phase, while the folds related to the second phase show axesith a northwest-southeast trend. The main regional fractures
�Carmignani et al., 2001� striking east-west andnorthwest-southeast are normal. Strike-slip faultshave resulted in the Cambrian units overlappingthe Silurian-Devonian and Carboniferous units�Barca and Maxia, 1982�.
A north-south-striking fault system, wellknown both on dry land and in the continentalshelf of southeast Sardinia, is the most importantfeature of post-Hercynian tectonics. This faultsystem, associated with Alpine tectonics, has off-set the eastern side of the area by about 200–300 m �Calvino, 1961�. In particular, these faults,which cut through the Eocene deposits �sand-stone and conglomerates� a little farther to thenorthwest of the surveyed area �Carmignani et al.,2001�, could have offset the Eocene depositsthemselves in the eastern part, protecting themfrom complete erosion �Di Gregorio, personalcommunication, 2002�. North-south-striking nor-mal faults, dated to the upper Miocene-Pleistocene,also have been imaged during earlier deep seismicsurveys acquired offshore opposite the Muraveraplain �Fabretti et al., 1995�.
r the Murav-uvial, eolian,orming a sys-an of detritictasandstones,represent thesequences ofoutcropping
logy fos�, collands f
luvial fes, mes� thategularportant

Plawafv
icia
baeaolb
rp2Gtmm2
rmsetf
laabeplrhndfl
gr
T
DGEFSPSVDNRS
T
Reflection surveys at Muravera Plain B123
DATA ACQUISITION
The seismic reflection survey includes two-wave seismic lines, both approximately 1.1 km
ong �lines 1 and 2 in Figure 1�. A few metersbove sea level in the plain, the topography is flatith a maximum elevation variation of only
bout 0.5 m. Logistical impediments, such as fisharming systems, buildings, and rice fields, pre-ent the acquisition of a single long line.
For both lines, seismic data were acquired us-ng single 50-Hz geophones attached to a 48-hannel seismograph system with 18-bit record-ng capability. The sample interval was 0.5 msnd the record length 1024 ms �Table 1�.
In general, for seismographs that record at 16its or more, it is best to record using only a prean-log-to-digital �A/D� antialiasing filter �Steeples et al., 1997�. In ar-as with significant levels of ambient noise or characterized by high-mplitude surface waves, additional low-cut frequency filtering pri-r toA/D conversion might be advisable. In the present case, a 50-Hzow-cut filter �24-dB/octave roll off� helped to attenuate ground rolletter.
Data were recorded using a standard common-midpoint �CMP�oll-along technique in an end-on configuration with 48 active geo-hones. A 0.25-kg explosive source was buried at approximatelym depth �generally below the water table� for each shot position.eophone spacing of 5 m and source spacing of 10 m provided
welvefold CMP coverage with a CMP spacing of 2.5 m. The maxi-um source-receiver offset of 245 m was chosen to allow the deter-ination of stacking velocities for reflections from depths of about
00–300 m �e.g., from the expected bedrock surface�.
DATA ANALYSIS, PROCESSING,AND RESULTS
The data were generally of high quality, so theyequired relatively simple processing using com-ercial software �Table 2�. Because noise and
ignal varied along the lines, shot-record-orient-d processing was effective for improving S/N ra-io and introduced few computation-related arti-acts into the data.
Figure 2 shows shot gathers recorded at threeocations along line 1. Reflections are evidentbove 600 ms. In record 13, the reflection atround 400 ms �event a� shows distorted hyper-olic moveout, suggesting a dip-moveout �DMO�ffect caused by a downdip reflector. The upperart of record 29 shows clear first breaks fol-owed by reverberating arrivals �event b�. Finally,ecord 53 is characterized by low-frequency,igh-amplitude ground roll �event c�. However,ote the clear reflection at about 550 ms �event�, where reversed moveout suggests an updip re-ector at this location.Figure 3 displays three representative shot
athers recorded along line 2. The S/N ratio for allecords along line 2 is less than that for line 1. A
Table 1. Seis
RecorderEnergy sourcReceivers —Receiver spacShot spacingSpread geomMinimum offMaximum foRecord lengthTime samplinAnalog low-c
Figure 2. Rawarrows in Figu100-ms windotext.
mic data acquisition equipment and parameters.
48-channel Abem Mark 6 seismographe Blasting cap plus 0.25-kg boostersingle geophones 50 Hz �vertical�ing 5 m
10 metry Off endset 10 mld 12
1024 msg interval 0.5 msut filter 50 Hz, 24 dB/octave
able 2. Seismic data processing sequence.
ata conversioneometryditingirst-break mutingpectral analysis and frequency filteringredictive deconvolutioncalingelocity analysisMO correctionMO correctionesidual staticstack
f-k migrationime-to-depth conversion
field files from three locations along seismic line 1 �locations indicated byre 5a�. For display purposes, automatic gain control �AGC� scaling with aw has been applied. Letters a, b, c, and d highlight events described in the

srprsf
liTifi
Fab .
Ftseg
B124 Deidda et al.
trong airwave �event e� is evident in all records. Event f , with cleareversed moveout from record 3 visible up to record 11, suggests theresence of an updip reflector at the beginning of the line, whereasecord 72 on the right, representative of records at the end of line 2,hows clearly refracted arrivals g, indicating the presence of a re-ractor at shallower depths.
igure 3. Raw field files from three locations along seismic line 2 �lorrows in Figure 6a�. For display purposes, an AGC scaling with a 1een applied. Letters e, f , and g highlight events described in the text
igure 4. �a� CMP supergather derived from three adjacent CMP gathhe location marked with a black star in Figure 5a. �b� Correspondinghowing the estimated velocity function. �c� Interval velocities detquation. Stacking velocities were based on an integrated evaluationathers, constant velocity stacks, and semblance analysis.
Initial processing steps involved setting up the geometry, fol-owed by routine editing of the entire data set. To avoid misprocess-ng refractions as reflections, a hand-picked early mute was applied.he reverberations present in some records �such as those observed
n record 29 of line 1� were attenuated by predictive-deconvolutionltering. Butterworth filtering �50–180 Hz, 24 dB/octave� helped
attenuate ground roll. Surgical muting was usedto remove the airwave from records from line 2.
As is often the case, detailed velocity analysisproved to be the most important and time-con-suming processing step. For both lines 1 and 2,the initial velocity models were developedthrough integrated analysis of constant velocitygathers, constant velocity stacks, and semblanceplots. Hand-picked direct arrivals supplied addi-tional information on near-surface velocities. Re-fracted arrivals, clearly visible in the last recordsof line 2 �e.g., record 72 on Figure 3�, allowed ap-parent velocity to be measured �4200–7000 m/s�in the upper part of the Paleozoic basement.
As shown by clear reflections in Figure 4a andthe relatively sharp peaks in the semblance plot ofFigure 4b, resolution of stacking velocities wasquite good for events above 500 ms traveltime,while velocity resolution was poor between 500and 600 ms. Prestack processing was completedwith the application of static corrections. Becausetopography was flat, only residual static correc-tions were calculated and applied. Five iterationsof surface-consistent statics with a maximum al-lowable shift of ±5 ms improved the continuityof some events.
To obtain the final stacked-time sections fromline 1 �Figure 5a� and line 2 �Figure 6a�, furtherprocessing was required. Preliminary stacks con-firmed the presence of dipping reflectors, asshown in Figure 7 �relative to line 1�. To moveo-ut-correct these records properly, dip moveout�DMO� was applied in the f–k domain. Figure 7bshows the improvement from DMO and an im-proved stacking velocity field. Optimum stackingvelocities along lines 1 and 2 are shown in Fig-ures 5b and 6b, respectively.
Finally, applying f-k migration, with input in-terval velocities obtained by converting stackingvelocities in Figures 5b and 6b using Dix equa-tions �Dix, 1955�, both DMO-corrected sectionswere time migrated to obtain the sections in Fig-ures 5c and 6c. Migration was successful wherefull coverage and detailed velocity models wereavailable. The primary reflecting horizons areclear and can be correlated quite easily with thoseon the unmigrated time sections.
In general, with a detailed velocity model, mi-gration improves interpretation because thedepths of the reflectors can be determined moreaccurately, scattering is reduced, and dippingreflectors are positioned better. However, thesmearing effect of the migration operator couldobscure some details and produce artificial align-
indicated bywindow has
ng line 1 nearance analysisd by the Dixstant velocity
cations00-ms
ers alosemblermineof con
mtlrc
2scl
oswivmsdss
lflt
Fruts
Reflection surveys at Muravera Plain B125
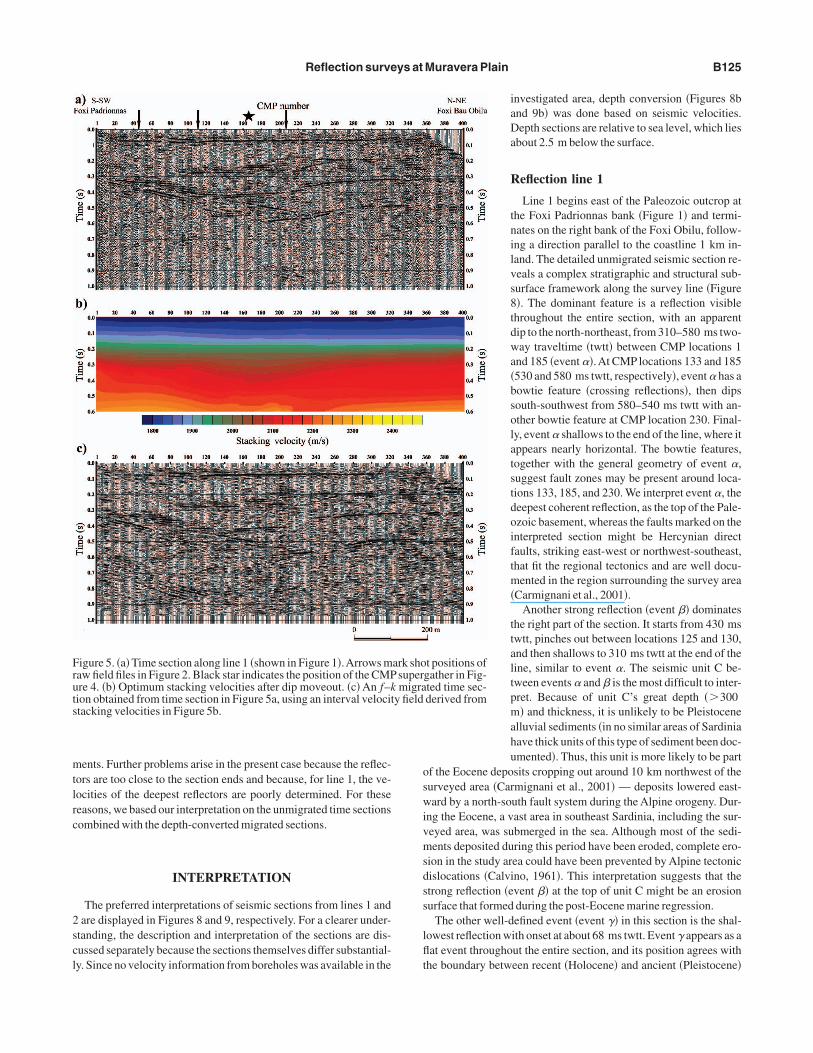
ents. Further problems arise in the present case because the reflec-ors are too close to the section ends and because, for line 1, the ve-ocities of the deepest reflectors are poorly determined. For theseeasons, we based our interpretation on the unmigrated time sectionsombined with the depth-converted migrated sections.
INTERPRETATION
The preferred interpretations of seismic sections from lines 1 andare displayed in Figures 8 and 9, respectively. For a clearer under-
tanding, the description and interpretation of the sections are dis-ussed separately because the sections themselves differ substantial-y. Since no velocity information from boreholes was available in the
igure 5. �a� Time section along line 1 �shown in Figure 1�.Arrows maw field files in Figure 2. Black star indicates the position of the CMPre 4. �b� Optimum stacking velocities after dip moveout. �c� An f–kion obtained from time section in Figure 5a, using an interval velocittacking velocities in Figure 5b.
investigated area, depth conversion �Figures 8band 9b� was done based on seismic velocities.Depth sections are relative to sea level, which liesabout 2.5 m below the surface.
Reflection line 1
Line 1 begins east of the Paleozoic outcrop atthe Foxi Padrionnas bank �Figure 1� and termi-nates on the right bank of the Foxi Obilu, follow-ing a direction parallel to the coastline 1 km in-land. The detailed unmigrated seismic section re-veals a complex stratigraphic and structural sub-surface framework along the survey line �Figure8�. The dominant feature is a reflection visiblethroughout the entire section, with an apparentdip to the north-northeast, from 310–580 ms two-way traveltime �twtt� between CMP locations 1and 185 �event ��.At CMP locations 133 and 185�530 and 580 ms twtt, respectively�, event � has abowtie feature �crossing reflections�, then dipssouth-southwest from 580–540 ms twtt with an-other bowtie feature at CMP location 230. Final-ly, event � shallows to the end of the line, where itappears nearly horizontal. The bowtie features,together with the general geometry of event �,suggest fault zones may be present around loca-tions 133, 185, and 230. We interpret event �, thedeepest coherent reflection, as the top of the Pale-ozoic basement, whereas the faults marked on theinterpreted section might be Hercynian directfaults, striking east-west or northwest-southeast,that fit the regional tectonics and are well docu-mented in the region surrounding the survey area�Carmignani et al., 2001�.
Another strong reflection �event �� dominatesthe right part of the section. It starts from 430 mstwtt, pinches out between locations 125 and 130,and then shallows to 310 ms twtt at the end of theline, similar to event �. The seismic unit C be-tween events � and � is the most difficult to inter-pret. Because of unit C’s great depth ��300m� and thickness, it is unlikely to be Pleistocenealluvial sediments �in no similar areas of Sardiniahave thick units of this type of sediment been doc-umented�. Thus, this unit is more likely to be part
f the Eocene deposits cropping out around 10 km northwest of theurveyed area �Carmignani et al., 2001� — deposits lowered east-ard by a north-south fault system during the Alpine orogeny. Dur-
ng the Eocene, a vast area in southeast Sardinia, including the sur-eyed area, was submerged in the sea. Although most of the sedi-ents deposited during this period have been eroded, complete ero-
ion in the study area could have been prevented by Alpine tectonicislocations �Calvino, 1961�. This interpretation suggests that thetrong reflection �event �� at the top of unit C might be an erosionurface that formed during the post-Eocene marine regression.
The other well-defined event �event �� in this section is the shal-owest reflection with onset at about 68 ms twtt. Event � appears as aat event throughout the entire section, and its position agrees with
he boundary between recent �Holocene� and ancient �Pleistocene�
t positions ofgather in Fig-ted time sec-derived from
ark shosupermigra
y field

srbn�r
R
ctmdnt1mtbost
Frmity field derived from stacking velocities in Figure 6b.
Fb
B126 Deidda et al.
terraced alluvium. Event �, together with events� in the left portion of the section and � on theright, delimits seismic unit B. Current informa-tion suggests this unit is comprised of continentaldeposits alone, described as ancient �Pleistocene�alluvial deposits.
However, internal reflection patterns �Figure10� suggest a different interpretation that not onlycould stimulate geologists to revise the geologichistory of the area but also could be useful to bet-ter define the groundwater-flow dynamics and toevaluate the quality of groundwater �e.g., brack-ish water or saltwater�.
Between CDPs 150 and 300, in the time win-dow ranging 200–260 ms twtt, oblique prograda-tional facies, characteristic of fluvial deltas and ofassociated coastal-plain sediments �Sangree andWidmier, 1979�, can be observed. These well-mapped, consistent clinoforms probably repre-sent periodic meltings and depositions in a deltaicenvironment. In other words, during the Pleis-tocene, a marine sedimentation phase locally re-placed the largely continental erosion and deposi-tion processes during an interglacial Riss-Würmtransgression �Tyrrhenian II�. With interaction offluvial and marine processes, the Tyrrheniancoastline retreated farther inland for some kilo-meters, creating a deltaic system in the centralpart of the plain. The marine conglomerates dis-covered in the nearby San Priamo plain, 5 kmsouth of the Muravera plain �Barca et al., 1981�,testify to a similar situation.
Extending event � to the surface, seismic unitA is the only unit along the line that was sampleddirectly by drilling. Unit A consists of Holocenealluvial deposits comprised of conglomerates,
ands, and clays. Events appearing in some parts of the section aboveeflection � have not been interpreted as genuine reflections. In fact,ecause the upper 60 ms of the recorded data are generally contami-ated by various types of source-generated, high-amplitude noisedirect, refracted, surface waves�, it is not always possible to discerneflections and consistently separate coherent noise and signal.
eflection line 2
Line 2 �see Figure 1� begins on the left bank of the Flumini Becciuhannel �500 m from the end of line 1�, partially parallels a loop ofhe Flumendosa River, and terminates on the right bank of the Flu-
endosa River, 140 m from the Paleozoic outcrop. Two reflectionsominate the section in Figure 9. Event � has apparent dip to theorth-northeast from about 290–165 ms twtt between CMP loca-ions 10 and 60. Then it gently shallows with a dip angle of about0°, reaching 125 ms twtt at CMP 160. In the migrated section theost inclined part of this reflector disappears, suggesting a diffrac-
ion �probably a fault� or an artifact of the migration operator causedy low coverage in this part of the section. From CMP 160 to the endf the line, event � is less continuous and has lower amplitudes buttill can be traced across the section. The change in reflection charac-er of event � could be caused by a change in reflectivity of the over-
t positions ofut. �c� An f-kterval-veloc-
igure 6. �a� Time section along line 2 �shown in Figure 1�.Arrows mark shoaw field files in Figure 3. �b� Optimum stacking velocities after dip moveoigrated time section obtained from the time section in Figure 6a using an in
igure 7. Aportion of time section 1 showing stack improvement �a�efore and �b� after DMO processing.

Fc
Feura3discrete interface in the model because tomography produces smooth mode
Reflection surveys at Muravera Plain B127
lying sedimentary sequence. After an abruptdeepening between CMPs 160 and 200, event �gently updips from 160 ms ��135 m� to 130 mstwtt ��105 m� at CMP 300. From there, it seemsto shallow to the end of the line near the Flumen-dosa River, reaching 66 ms twtt ��52 m�.
We interpret event �, which is the deepest co-herent reflection in the section, as the top of thePaleozoic bedrock. This interpretation is in goodagreement with the outcrop geology and topogra-phy.At the end of the section, event � is at a depthof approximately 52 m. By extrapolating it up tothe Paleozoic bedrock at the surface, which out-crops 260 m beyond the end of the section, wecan tie the subsurface interpretation to the out-crop geology.
The interpretation of event � as the top of thebedrock is also supported by the velocity modelobtained by combining reflection-derived inter-val velocities and those derived from first-arrivalinformation using refraction tomography �Figure9b�. In this velocity model, available only at loca-tions where refracted first breaks are clear, reflec-tor � appears to have velocities from 3500–4500 m/s, which are higher than those obtainedfrom reflections above event �.
Reflection event � is nearly flat, with onset at50–70 ms twtt. It extends from the beginning ofthe line to CMP location 340, where event �pinches out. Event � probably represents theboundary between Holocene and Pleistocene al-luvia. Events above reflection � were not consid-ered for the same reasons as for line 1.
CONCLUSIONS
The 2D seismic reflection survey carried out inthe Muravera plain successfully imaged the sub-surface geologic structures of the FlumendosaRiver Delta. A first-order result of the investiga-tion is the clear image of the Paleozoic basementtopography. The �300-m maximum depth to thebasement beneath profile 1 was somewhat sur-prising. The deepest part of the basement, at580 ms twtt ��530 m�, is nearly twice as deep asexpected. Imaging of oblique, progradationalseismic facies is another major finding of the in-vestigation. The presence of this seismic pattern,usually characteristic of delta environments,proves that in the Muravera plain, Pleistocene al-luvial deposits are partially of marine environ-ment, as are the analogous deposits in the nearbySan Priamo plain. This finding is of great impor-tance in better understanding the groundwater-flow dynamics and in guiding other geophysicalinvestigations aimed at improving the knowledgeof groundwater quality �saline content� in thearea.
Unfortunately, because lithologic controls are
ime-to-depthon.
elocity mod-ities obtainedeflection-de-and refractedsediments tother than by als.
time sectionoblique pro-facies withrms charac-
elta environ-zone corre-lain environ-zone corres-nvironment.
igure 8. �a� Interpreted time section 1; �b� interpreted depth section 1. Tonversion was made using interval velocities obtained using the Dix equati
igure 9. �a� Interpreted time section 2; �b� interpreted depth section 2 with vl superimposed. Time-to-depth conversion was made using interval velocsing the Dix equation. The velocity model was obtained by combining rived interval velocities and tomographic velocities derived from the directrrivals. Velocities increase from 1000–3000 m/s in the Quaternary500–4500 m/s in bedrock. Event � is represented by a velocity gradient ra
Figure 10. Zoom ofin Figure 5a showinggradational seismicwell-mapped clinofoteristic of fluvial dments. Undaformsponds to the delta-pment. Fondoformponds to delta-front e

ntabsi
hmpstgs
letsta
ortaadne
B
B
B
C
C
D
F
F
G
G
J
L
M
M
M
P
S
S
S
W
B128 Deidda et al.
ot available, information about the true depth of reflectors and de-ailed stratigraphic interpretation are unreliable — a problem solv-ble only through deep-borehole investigations. Despite the inevita-le uncertainties on reflector depth and on seismic-unit lithology, theeismic data alone provide a new subsurface model that requires re-nterpretation of the geologic history of the area.
The well-defined images we produced prove that the study area isighly conducive to seismic reflection profiling. This will enableore extensive seismic imaging to be conducted throughout the
lain, to gather information for constructing a good preliminary sub-urface model for other geophysical and hydrogeological investiga-ions. Subsequently, oriented coring will allow us to obtain a detailedeologic interpretation that could be of great help to land and re-ource managers.
The seismic sections �1� provide conclusive evidence of previous-y undefined basement topography and �2� image the vertical and lat-ral extents of the main formations, which could not be obtainedhrough sparsely spaced drillholes. Furthermore, the study demon-trates that the reflection technique can be implemented successfullyo provide crucial information for subsurface mapping of structuresnd stratigraphy in the Muravera plain.
ACKNOWLEDGMENTS
We thank F. Di Gregorio for providing information on the geologyf the Muravera plain and M. A. Melis for help in manuscript prepa-ation. We also thank L. Noli, M. Sitzia, M. Serci,A. Lai, and G. Cas-i for their superlative fieldwork. Timely and helpful reviews by annonymous associate editor and two anonymous journal reviewersre appreciated. This project �n° 25/98� was partially developed un-er a grant from the RegioneAutonoma della Sardegna �L. R. 9/8/50,° 43�. The support of the University of Cagliari also is acknowl-dged.
REFERENCES
arca, S., F. Di Gregorio, and V. Palmerini, 1981, Linea di costa Pleistoceni-ca nella piana di S. Priamo �Sarrabus, Sardegna Sud-orientale�: Bollettino
della Società Geologica Italiana, 100, 71–84.arca, S., and M. Maxia, 1982, Assetto stratigrafico e tettonico del Paleozo-ico del Sarrabus occidentale, in Guida alla Geologia del Paleozoico Sardo:Società Geologica Italiana, 87–93.
irkelo, B. A., D. W. Steeples, R. D. Miller, and M. Sophocleous, 1987, Seis-mic reflection study of a shallow aquifer during a pumping test: GroundWater, 25, 703–709.
alvino, F., 1961, Lineamenti strutturali del Sarrabus-Gerrei �Sardegna sud-orientale�: Bollettino del Servizio Geologico d’Italia, 81, 489–556.
armignani, L., P. Conti, P. C. Pertusati, S. Barca, N. Cerbai, A. Eltrudis, A.Funedda, G. Oggiano, and E. D. Patta, 2001, Note illustrative della CartaGeologica d’Italia alla scala 1:50000, folio 549 — Muravera: ServizioGeologico d’Italia.
ix, C. H., 1955, Seismic velocities from surface measurements: Geophys-ics, 20, 68–86.
abretti, P., R. Sartori, L. Torelli, N. Zitellini, and G. Brancolini, 1995, Lastruttura profonda del Margine orientale della Sardegna dall’ interpre-tazione di sismica a riflessione ed a rifrazione: Studi Geologici Camerti,Volume Speciale 1995/2, Convegno Scientifico Nazionale CNR Geodi-namica e tettonica attiva del sistema Tirreno-Appennino, 239–246.
itterman, D. V., and M. T. Stewart, 1986, Transient electromagnetic sound-ing for groundwater: Geophysics, 51, 995–1005.
eissler, P. E., 1989, Seismic profiling for groundwater studies in Victoria,Australia: Geophysics, 54, 31–37.
oldman, M., D. Gillar, A. Ronel, and A. Melloul, 1991, Mapping of seawa-ter intrusion into the coastal aquifer of Israel by the time domain electro-magnetic method: Geoexploration, 28, 152–175.
ongerius, P., and K. Helbig, 1988, Onshore high-resolution seismic profilingapplied to sedimentology: Geophysics, 53, 1276–1283.
iberty, L., 1998, Seismic reflection imaging of a geothermal aquifer in anurban setting: Geophysics, 63, 1285–1294.iller, R. D., and D. W. Steeples, 1990, A shallow seismic reflection surveyin basalts of the Snake River Plain, Idaho: Geophysics, 55, 761–768.iller, R. D., D. W. Steeples, and M. Brannan, 1989, Mapping a bedrock sur-face under dry alluvium with shallow seismic reflections: Geophysics, 27,1528–1534.ills, T., P. Hoekstra, M. Blohm, and L. Evans, 1988, Time domain electro-magnetic soundings for mapping sea water intrusion in Monterey County,CA: Ground Water, 26, 771–782.
oulsen, L. H., and N. B. Christensen, 1999, Hydrogeophysical mappingwith the transient electromagnetic sounding method: European Journal ofEnvironmental and Engineering Geophysics, 3, 201–220.
angree, J. B., and J. M. Widmier, 1979, Interpretation of depositional faciesfrom seismic data: Geophysics, 44, 131–160.
htivelman, V., and M. Goldman, 2000, Integration of shallow reflectionseismics and time domain electromagnetics for detailed study of the coast-al aquifer in the Nitzanim area of Israel: Journal of Applied Geophysics,44, 197–215.
teeples, D. W., A. G. Green, T. V. McEvilly, R. D. Miller, W. E. Doll, and J.W. Rector, 1997, A workshop examination of shallow seismic reflectionsurveying: The Leading Edge, 16, 1641–1647.hiteley, R. J., J. A. Hunter, S. E. Pullan, and P. Nutalaya, 1998, “Optimumoffset” seismic reflection mapping of shallow aquifers near Bangkok,
Thailand: Geophysics, 63, 1385–1394.