Recent Advances in Multidisciplinary Analysis and Optimization
526
NASA Conference Publication 3031 Part 1 I Recent Advances in Multidisciplinary Analysis and Optimization Jean-Franqois M. Proceedings of a symposium cosponsored by NASA Langley Research Center, NASA Lewis Research Center, and the Wright Research Development Center, and held in Hampton, Virginia September 28-30, 1988 National Aeronautics and Space Administration Office of Management Scientific and Technical Information Division 1989
-
Upload
khangminh22 -
Category
Documents
-
view
1 -
download
0
Transcript of Recent Advances in Multidisciplinary Analysis and Optimization

NASA Conference Publication 3031 Part 1
I Recent Advances in Multidisciplinary
Analysis and Optimization
Jean-Franqois M.
Proceedings of a symposium cosponsored by NASA Langley Research Center, NASA Lewis
Research Center, and the Wright Research Development Center, and held in
Hampton, Virginia September 28-30, 1988
National Aeronautics and Space Administration
Office of Management Scientific and Technical
Information Division
1989
PREFACE
This publication contains papers presented at the Second NASA/Air Force Symposium on Recent Advances in Multidisciplinary Analysis and Optimization held September 28-30, 1988 in Hampton, Virginia. The symposium was cosponsored by NASA Langley, NASA Lewis, and the Wright Research Development Center. The meeting was attended by 195 participants, with 41% from industry, 35% from academia, and 24% from government organizations.
The aim of the symposium was to provide a forum for researchers, software developers, and practitioners of multidisciplinary analysis and optimization to learn of the latest developments and to exchange experiences in this burgeoning field of engineering.
Ninety-two papers were presented (83 of which are published here). Of the papers originally presented, 58% discussed method development, 30% applications, and 12% software development or implementation. Most (72%) of the contributions to the symposium were strictly multidisciplinary. There were 15 papers dealing with the combination of structures and control systems, 10 with aeroelastic problems, and 5 with aeroservoelastic problems. Eight papers dealt with generic developments in multidisciplinary design. based systems in analysis and optimization.
The keynote address was a review of the role of knowledge-
The papers are grouped by sessions and are identified in the Contents. edited to conform to the technical standards set by NASA for conference publications. A list of addresses of all registered participants is included.
Papers were
Jean-Franqois M. Barthelemy Technical Program Chairman
corn-
PREFACE ....................................................................... iii
ATTENDEES ..................................................................... xiii
Part 1
Session 1 : Plenary Chairman: Owen F. Hughes
APPLICATIONS OF INTEGRATED DESIGN/ANALYSIS SYSTEMS IN AEROSPACE STRUCTURAL DESIGN ........................................................... 3 Philip Mason, Edwin Lerner, and Lawrence Sobel
INTEGRATED DESIGN OPTIMIZATION RESEARCH AND DEVELOPMENT IN AN INDUSTRIAL ENVIRONMENT ................................................................. 39 V. Kumar, M. D. German, and S.-J. Lee
OPTIMIZATION BY DECOMPOSITION: A STEP FROM HIERARCHIC TO NON-HIERARCHIC SYSTEMS ..................................................................... 51 Jaroslaw Sobieszczanski-Sobieski
OVERVIEW OF DYNAMICS INTEGRATION RESEARCH (DIR) PROGRAM AT LANGLEY RESEARCH CENTER: Goals and Progress ........................................ 79 Steven M. Sliwa and Irving Abel
SESSION 2: HELICOPTERS Chairmen: D. Anderson and R. G. Kvaternik
AN INITIATIVE IN MULTIDISCIPLINARY OPTIMIZATION OF ROTORCRAFT ................. 109 Howard M. Adelman and Wayne R. Mantay
STRUCTURAL OPTIMIZATION OF ROTOR BLADES WITH STRAIGHT AND SWEPT TIPS SUBJECT TO AEROELASTIC CONSTRAINTS .......................................... 145 Peretz P. Friedmann and Roberto Celi
OPTIMIZATION OF ROTOR BLADES FOR COMBINED STRUCTURAL, PERFORMANCE, AND AEROELASTIC CHARACTERISTICS ................................................. 163 David A. Peters and Y. P. Cheng
TRANSONIC AIRFOIL DESIGN FOR HELICOPTER ROTOR APPLICATIONS .................... 181 Ahmed A. Hassan and B. Jackson
EFFICIENT SENSITIVITY ANALYSIS AND OPTIMIZATION OF A HELICOPTER ROTOR ......... 195 J. W. Lim and I. Chopra
STRUCTURAL OPTIMIZATION OF ROTOR BLADES WITH INTEGRATED DYNAMICS AND AERODYNAMICS ................................................................ 209 Aditi Chattopadhyay and Joanne L. Walsh
PRECEDiNG PAGE BLANK NOT FILMED
V
MULTI-OBJECTIVE/LOADING O P T I M I Z A T I O N FOR ROTATING COMPOSITE FLEXBEAMS ......... 235 B r i a n K. H a m i l t o n and James R. Peters
S E S S I O N 3: A R T I F I C I A L INTEZLIGENCE Chairmen: K. E. Abbott and P. 5jela
DEVELOPMENT O F A MICRO-COMPUTSR BASED INTEGRATED D E S I G N SYSTEM FOR HIGH ALTITUDE LONG ENDURANCE AIRCRAFT ............................................ 275
D a v i d W. H a l l and J. Edward R o g a n
DEMONSTRATION OF DECOMPOSITION AND OPTIMIZATION IN THE DESIGN OF EXPERIMENTAL S P A C E SYSTEMS .................................................. 297
Sharon L. Padula, C h r i s A. Sandridge, Raphael T. Haftka, and Joanne L. Walsh
STRUTEX - A PROTOTYPE KNOWLEDGE-BASED SYSTEM FOR I N I T I A L L Y CONFIGURING A STRUCTURE TO SUPPORT P O I N T LOADS I N TWO DIMENSIONS ........................ 317
James L. R o g e r s and Jaroslaw Sobieszczanski-Sobieski
TRUSS: AN I N T E L L I G E N T D E S I G N SYSTEM FOR AIRCRAFT WINGS ....................... 333 Pres ton R. B a t e s and D a n i e l P. Schrage
REAL-TIME A P P L I C A T I O N O F KNOWLEDGE-BASED SYSTEMS .............................. 357 Randal W. B r u m b a u g h and Eugene L. Duke
THE DESIGNER O F THE 90's: A L I V E DEMONSTRATION ............................... 373 Tommy L. G r e e n , B a s i l M. Jordan, Jr., and Timothy L. Oglesby
S E S S I O N 4: ARROIZUSTIC TAILORING Chairmen: B. A. R o m m e l a n d T. A. Weisshar
STRUCTURAL T A I L O R I N G O F COUNTER ROTATION PROPFANS ............................. 389 K. W. B r o w n and D. A. H o p k i n s
COMPOSITE S I Z I N G AND PLY ORIENTATION FOR S T I F F N E S S REQUIREMENTS U S I N G A LARGE F I N I T E ELEMENT STRUCTURAL MODEL ..................................... 403
N. A. R a d o v c i c h and D. P. G e n t i l e
AEROELASTIC T A I L O R I N G AND INTEGRATED WING D E S I G N .............................. 431 Mike Love and Jon B o h l m a n n
INTEGRATED AERODYNAMIC-STRUCTURAL D E S I G N O F A FORWARD-SWEPT TRANSPORT WING .............................................................. 445
R. T. H a f t k a , B. G r o s s m a n , P. J. Kao, D. M. Polen, and J. Sobieszczanski-Sobieski
S T A T I C AEROELASTIC ANALYSIS AND T A I L O R I N G O F M I S S I L E CONTROL F I N S ............. 465 S . C. McIntosh, Jr., and M. F. E. D i l l e n i u s
v i
EFFECTS OF NONLINEAR AERODYNAMICS AND STATIC AEROELASTICITY ON MISSION PERFORMANCE CALCULATIONS FOR A FIGHTER AIRCRAFT ............................. 477 Gary L. Giles, Kenneth E. Tatum, and William E. Foss, Jr.
OPTIMUM STRUCTURAL DESIGN WITH STATIC AEROELASTIC CONSTRAINTS ................. 497 K. B. Bowman, R. V. Grandhi, and F. E. Eaetep
OPTIMUM DESIGN OF SWEPT-FORWARD HIGH-ASPECT-RATIO GRAPHITE-EPOXY WINGS ........ 509 M. J. Shuart, R. T. Haftka, and R. L. Campbell
PART 2*
SESSION 5: s0E;PLwARg I Chairren: G. N. Vanderplaats and R. E. Fulton
ASTROS . A MULTIDISCIPLINARY AUTOMATED STRUCTURAL DESIGN TOOL ................. 529 D. Ja Neil1
A GENERALIZED SOFTWARE EXECUTIVE FOR MULTIDISCIPLINARY COMPUTATIONAL STRUCTURAL DYNAMICS ~ o o o m m . m ~ ~ a ~ o ~ ~ ~ ~ o ~ ~ ~ a ~ ~ ~ n ~ ~ a ~ ~ ~ a a ~ o ~ ~ ~ ~ ~ ~ o ~ ~ ~ n ~ ~ a ~ ~ ~ ~ ~ ~ n 545
Alex Berman
RESEARCH ON OPTIMIXATION-BASED DESIGN AT THE ENGINEERING DESIGN METHODS LAB, BRIGHAM YOUNG UNIVERSITY o o * ~ * o ~ . * * . ~ o * o o o o o ~ ~ o * o * * ~ o * o a * ~ ~ ~ ~ o ~ e 565 R. J. Balling, A. R. Parkineon, and J. C. Free
RECENT EXPERIENCES USING FINITE-ELEMENT-BASED STRUCTURAL OPTIMIZATION ......... 581 B. K. Paul, J. C. McConne11, and M. H. Love
THE SIZING AND~OPTIMIZATION LANGUAGE (SOL) - A COMPUTER LANGUAGE TO IMPROVE THE USER/OPTIMIZER INTERFACE ........................................ 601 S. H. Lucas and S. J. Scotti
ROBUST COMPUTER-AIDED SYNTHESIS AND OPTIMIZATION OF LINEAR MULTIVARIABLE CONTROL SYSTEMS WITH VARYING PLANT DYNAMICS VIA AUTOCON ..................... 621
C . P. Lefkowitz, J. A. Tekawy, P. K. Pujara, and M. G. Safonov
COMPUTERIZED DESIGN SYNTHESIS (CDS), A DATA BASE-DRIVEN MULTIDISCIPLINARY DESIGN TOOL ................................................................. 639 D. M. Anderson and A. 0. Bolukbasi
SESSION 6: SENSITIVITY ANALYSIS Chairmen: R. T. Haftka and B. Prasad
ON EQUIVALENCE OF DISCRETE-DISCRETE AND CONTINUUM-DISCRETE DESIGN SENSITIVITY ANALYSIS ........................................................ 653 Kyung K. Choi and Sung-Ling Twu
AN INVESTIGATION OF USING AN RQP BASED METHOD TO CALCULATE PARAMETER SENSITIVITY DERIVATIVES ..................................................... 673 Todd J. Beltracchi and Gary A. Gabriele
*Presented under separate cover.
vi i
GRID SENSITIVITY CAPABILITY FOR LARGE SCALE STRUCTURES ........................ 697 Gopal K. Nagendra and David V. Wallerstein
ITERATIVE METHODS FOR DESIGN SENSITIVITY ANALYSIS ............................. 713 A. D. Belegundu and B. G. Yoon
RESULTS OF AN INTEGRATED STRUCTURE/CONTROL LAW DESIGN SENSITIVITY ANALYSIS .................................................................... 727 Michael G. Gilbert
ON THE CALCULATION OF DERIVATIVES OF EIGENVALUES AND EIGENVECTORS IN THE SIMULTANEOUS DESIGN AND CONTROL OF STRUCTURES ........................ 747 Luis Mesquita and Manohar P. Kamat
I TREATMENT OF BODY FORCES IN BOUNDARY ELEMENT DESIGN SENSITIVITY ANALYSIS .................................................................... 759 Sunil Saigal, R. Aithal, and Jizu Cheng
I DESIGN SENSITIVITY ANALYSIS OF BOUNDARY ELEMENT SUBSTRUCTURES ................. 777
I James H. Kane, Sunil Saigal, and Richard H. Gallagher.
SESSION 7: CONTROL OF AEROELASTIC STRUCTURES Chairmen: I. A b e l . and N. A. Radovcich
AEROSERVOELASTIC TAILORING FOR LATERAL CONTROL ENHANCEMENT .................... 803 Terrence A. Weisshaar and Changho Nam
RESULTS OF INCLUDING GEOMETRIC NONLINEARITIES IN AN AEROELASTIC MODEL OF AN F/A-18 ................................................................ 815 Carey S. Buttrill
FLUTTER SUPPRESSION USING EIGENSPACE FREEDOMS TO MEET REQUIREMENTS ............ 837 William M. Adams, Jr., Robert E. Fennell, and David M. Christhilf
AEROELASTIC MODELING FOR THE FIT TEAM F/A-18 SIMULATION ....................... 861 Thomas A. Zeiler and Carol D. Wieseman
DIGITAL ROBUST CONTROL LAW SYNTHESIS USING CONSTRAINED OPTIMIZATION ........... 879 Vivekananda Mukhopadhyay
AN INTEGRATED APPROACH TO THE OPTIMUM DESIGN OF ACTIVELY CONTROLLED COMPOSITE WINGS ............................................................. 897 E. Livne
CONTROL SURFACE SPANWISE PLACEMENT IN ACTIVE FLUTTER SUPPRESSION SYSTEMS ..................................................................... 919 E. Nissim and J. J. Burken
SESSION 8: STRUCTURES Chairmen: R. Levy and P. Papalambros
viii
STRUCTURAL O P T I M I Z A T I O N O F FRAMED STRUCTURES U S I N G GENERALIZED OPTIMALITY C R I T E R I A ......................................................... 955
R. M. K o l o n a y , V. B. V e n k a y y a , V. A. Tischler , and R. A. C a n f i e l d
F I N I T E ELEMENT FLOW-THERMAL-STRUCTURAL ANALYSIS O F AERODYNAMICALLY HEATED LEADING EDGES ........................................................ 971
Pramote Dechaumphai, A l l a n R. Wiet ing , and A j a y K. Pandey
INVOLUTE COMPOSITE D E S I G N EVALUATION USING GLOBAL D E S I G N S E N S I T I V I T Y DERIVATIVES ................................................................. 991
J. K. H a r t and E. L. S t a n t o n
O P T I M I Z I N G FOR MINIMUM WEIGHT WHEN TWO D I F F E R E N T F I N I T E ELEMENT MODELS AND ANALYSES ARE REQUIRED ................................................... 1009
Jeffrey C. H a l l
PART 3*
S E S S I O N 9: LARGE ENGINEERING S Y S m Chairman: G. L. G i l e s
ENGINEERING A P P L I C A T I O N S O F H E U R I S T I C MULTILEVEL O P T I M I Z A T I O N METHODS ......... 1029 Jean-Francois M. B a r t h e l e m y
RECENT DEVELOPMENTS I N MULTILEVEL O P T I M I Z A T I O N ................................ 1039 G. N. V a n d e r p l a a t s and D-S Kim
A DECOMPOSITION-BASED D E S I G N O P T I M I Z A T I O N METHOD WITH A P P L I C A T I O N S ............ 1055 S. A z a r m , M. Pecht , W.-C. L i , and S. Praharaj
MULTILEVEL DECOMPOSITION O F COMPLETE VEHICLE CONFIGURATION I N A PARALLEL COMPUTING ENVIRONMENT .............................................. 1069
V i n a y B h a t t and K. M. R a g s d e l l
SESSION 10: SHAPE OPTIMIZATION Chairman: G. A. Gabriele
D E S I G N O P T I M I Z A T I O N OF AXISYMMETRIC B O D I E S I N NONUNIFORM TRANSONIC FLOW ........................................................................ 1085
C. Edward Lan
PROCEDURES FOR SHAPE O P T I M I Z A T I O N O F GAS TURBINE D I S K S ........................ 1097 T s u - C h i e n C h e u
S E S S I O N 1 1 : ENGINEERING SYSTEM D E S I G N Chairmen: M. D. German and D. P. Schrage
A DECISION-BASED P E R S P E C T I V E FOR THE D E S I G N O F METHODS FOR SYSTEMS D E S I G N ...................................................................... 1111
Farrokh Mistree, D o u g l a s Muster, Jon A. Shupe, and J a n e t K. A l l e n
*Presented under separate cover.
ix

THE ART OF SPACECRAFT DESIGN: A MULTIDISCIPLINARY CHALLENGE .................. 1137 F. Abdi, H. Ide, M. Levine, and L. Austel
HYPERSONIC AIRBREATHING VEHICLE CONCEPTUAL DESIGN (FOCUS ON AERO-SPACE PLANE) ........................................................... 1157 James L. Hunt and John G. Martin
OPTIMIZING CONCEPTUAL AIRCRAFT DESIGNS FOR MINIMUM LIFE CYCLE COST e e e e e e o e e e e e 1195 Vicki S a Johnson
AIRCRAFT DESIGN OPTIMIZATION WITH MULTIDISCIPLINARY PERFORMANCE CRITERIA e e e e e e e e e e e a e e e e e e e e e e e e e e e e e e e e e e e e e e e e e e e e e e e o e e e e e e e o e e e e e e o e e o e e 1219
Stephen Morris and Ilan Kroo
SESSION 12: MBTHODS Chairmn: M. P. Kamat and J. E. Rogan
AN INTERPRETATION AND SOLUTION OF ILL-CONDITIONED LINEAR EQUATIONS e o a e e e e e e e o o 1239 Ie U'e Ojalvo and Te Ting
GENERALIZED MATHEMATICAL MODELS IN DESIGN OPTIMIZATION e e e e e e e e e e e e e e e e e b e e e e o b 1253 Panos Yo Papalambros and Je Re Jagannatha Rao
OPTIMUM DESIGN OF STRUCTURES SUBJECT TO GENERAL PERIODIC LOADS e e e e e e e e e e e e e e e e 1265 Re Reiss and Be Qian
............................ I FUZZY SET APPLICATIONS IN ENGINEERING OPTIMIZATION 1279 Alejandro Re Diaz
A PENALTY APPROACH FOR NONLINEAR OPTIMIZATION WITH DISCRETE DESIGN VARIABLES ................................................................... 1291 Dong Ke Shin, Z e Gurdal, and Om He Griffin, Jr.
1 MULTIPLIER-CONTINUATION ALGORITHMS FOR CONSTRAINED OPTIMIZATION e e e e e e e e e e e e e e e 1303 Bruce Ne Lundberg, Aubrey Be Poore and Bing Yang
SESSION 13: SOFlWARE I1 Chairmen: R. A. Canfield and J. L. Rogers, Jr.
A LARGE SCALE SOFTWARE SYSTEM FOR SIMULATION AND DESIGN OPTIMIZATION I OF MECHANICAL SYSTEMS e e e e e e e e e e . e e e e e e e e e e e e e e e e e e e o e ~ e e e e e e e e e e e e . e o e . e e e e e 1319
Bernhard Dopker and Edward Je Haug
THE ROLE OF OPTIMIZATION IN THE NEXT GENERATION OF COMPUTER-BASED DESIGN TOOLS ................................................................ 1335 Je E. Rogan
AN OVERVIEW OF THE DOlJGLAS AIRCRAFT COMPANY AEROELASTIC DESIGN OPTIMIZATION PROGRAM (ADOP) ................................................. 1359 Alan J. Dodd
MEETING THE CHALLENGES WITH THE DOUGLAS AIRCRAFT COMPANY AEROELASTIC DESIGN OPTIMIZATION PROGRAM (ADOPI .......................................... 1369 Bruce A. Rommel
X
SESSION 14: DYNAMICS AND CONTROL OF FLEXIBLE S'IRUCTURES Chairmen: J.-N. Juang and E. Lime
O P T I M I Z A T I O N O F STRUCTURE AND CONTROL SYSTEM .................................. 1381 N. S. K h o t and R. V. G r a n d h i
STRUCTURAL O P T I M I Z A T I O N AND RECENT LARGE GROUND ANTENNA INSTALLATIONS ............................................................... 1393
R o y Levy
A NOVEL IMPLEMENTATION O F METHOD O F OPTIMALITY C R I T E R I O N I N S Y N T H E S I Z I N G SPACECRAFT STRUCTURES WITH NATURAL FREQUENCY CONSTRAINTS .................... 1417
B. P. Wang and F. H. Chu
COMPUTATIONAL EXPERIMENTS I N THE OPTIMAL SLEWING O F F L E X I B L E STRUCTURES .................................................................. 1427
T. E. R a k e r and E. Po lak
OPTIMAL PLACEMENT O F E X C I T A T I O N S AND SENSORS BY SIMULATED ANNEALING ........... 1441 , M. S a l a m a , R. B r u n o , G-S. C h e n , and J. G a r b a I
EXPERIENCES I N APPLYING O P T I M I Z A T I O N TECHNIQUES TO CONFIGURATIONS FOR THE CONTROL O F F L E X I B L E STRUCTURES ( C O F S ) PROGRAM ....................... 1459
Joanne L. Walsh
AN IMPROVED ALGORITHM FOR OPTIMUM STRUCTURAL D E S I G N WITH MULTIPLE FREQrJENCY CONSTRAINTS ....................................................... 1489
O l i v e r G. M c G e e and K h i n g F. Phan
ADDITIONAL PAPERS
The f o l l o w i n g paper is be ing i n c l u d e d i n t h i s publ ica t ion although t i m e r e s t r i c t i o n s d i d n o t permit i t s p r e s e n t a t i o n a t t h e September conference.
STRUCTURAL DAMAGE ASSESSMENT AS AN I D E N T I F I C A T I O N PROBLEM ..................... 1507 P. Hajela and F. J. Soeiro
The f o l l o w i n g paper a r r ived d u r i n g t h e p r i n t i n g process and was o r i q i n a l l y i-ncluded i n S e s s i o n I.
RECENT DEVELOPMENTS I N LARGE-SCALE STRUCTURAL O P T I M I Z A T I O N .................... 1521 V. E. V e n k a y y a I
xi

ATTENDEES Dr. Jean-Francois Y. Barthelemy NASA/Langley Research Center MS 246 Hampton, VA 23665-5225
Mr. Oscar Barton, Jr. Howard University Department of Mechanical Engineering 2308 6th St. N.W. Washington, DC 20059
Mrs. Kathy H. Abbott NASA/Langley Research Center MS 156A Hampton, VA 23665-5225
Mr. Irving Abel NASA/Langley Research Center MS 242 Hampton, VA 23665-5225
Mr. William M. Adams Jr. NASA/Langley Research Center MS 489 Hampton, VA 23665-5225
Dr. Howard M. Adelman NASA/Langley Research Center MS 246 Hampton, VA 23665-5225
Dr. Don Anderson McDonnell Douglas Helicopter Co. Bldg. 530/B327 5000 E. McDowell Rd. Mesa. AZ 85205
Mr. Ernest S. Armstrong NASA/Langley Research Center MS 499 Hampton, VA 23665-5225
Prof. Shapour Azarm The University of Maryland Department of Mechanical Engineering College Park, b D 20742
Dr. Richard J. Balling Brigham Young University Engineering Design Methods Laboratory 3681 Clyde Building P ~ O V O , UT a4602
Dr. Dey Banerjee McDonnell Douglas Helicopter Co. Bldg. 530, MS/B 346 5000 E. McDowell Rd. Mesa, AZ 85205
Mr. Paul Barnhart Sverdrup Technology, Inc. P.O. Box 30650, Midpark Branch Middleburg Heights, OH 44130
Dr. Bruno Barthelemy Ford Research and Engineering Center Room E3184/SCI-LAE P. 0. Box 2053 Dearborn, MI 48121-2053
Mr. P. R. Bates Georgia Institute of Technology School of Aerospace Engineering P. 0. Box 30302, Atlanta, GA 30332-0150
Prof. Ashok D . Belegundu Penn State University Mechanical Engineering University Park, PA 16802
Mr. Todd J. Beltracchi Rennselaer Polytechnic Institute 2418 Huntington Lane #3 Redondo Beach, CA 90218
Dr. Laszlo Berke NASA/Lewis Research Center MS 4907 21000 Brookpark Road Cleveland, OH 44135
Mr. Alex Berman Kaman Aerospace Corp. Old Windsor Road P.O. Box 2 Bloomfield, CT 06002
Mr. Vinay Bhatt Univernity of Missouri-Columbia Mechanical and Aerospace Engineering 1080 Engineering UMC Columbia, MO 65201
Mr. Robert Blackwell Sikorsky Aircraft No. Main Street Stratford, CT 06601-1381
Mr. Chris Borland Boeing Military Airplane Co. P.O. Box 3707
Seattle, WA 98124 Mail Code 33-04
Mr. Keith Bowman US Air Force AFWAL/FIBCA Wright AFB Wright-Patterson AFB, OH 45433
Mrs. Lynn M. Bowman Planning Research Corporation 303 Butler Farm Rd, Suite 100 Rampton, VA 23666
Mr. Kenneth W. Brown Pratt L Whitney Aircraft 400 Main Street, N.S. 163-09 Eamt Hartford, CT 06108
Mr. Randal 1. Brumbaugh Planning Research Corporation PO Box 213 NASA Dryden Bldg. 4839 Edwards, CA 93323
Mr. Christopher N. Butten Digital Equipment Corporation 4411 Corporation Virginia Beach, VA 23462
Mr. Carey S. Buttrill NASA/Langley Research Center m 494 Hunpton, VA 23665-5225
Mt. Charles Camarda NASA/Langley Research Center MS 396 Hampton, VA 23665-5225
Mr. Frank Campisano Northrop Corporation Ono Northrop Avo Hawthorno, CA 90250
Capt. Robert A. Canfield AF Wright Aeronautical Laboratories AFWAL/FIBRA Wright-Patterson AFB, OH 45433-6553
Mr. Richard G. Carter ICASB NASA/Langley Research Center MS 132C Hampton, VA 23665
Mr. Jeffrey A. Cerro Planning Research Corporation 303 Butler Farm Rd, Suite 100 suite 100 Hampton, VA 23666
Dr. Christ06 C. Chamis NASA/Lewis Research Center
21000 Brookpark Road Cleveland, OH 44135
MS 49-8
x i i i
PRECEDING PAGE BLANK NOT FILMED
Prof. A. Chandra University of Arizona Aerospace and Mechanical Engineering Aero Bldg I16 Tucson, AZ 85721
Dr. Kwan J. Chang Planning Research Corporation 303 Butler Farm Rd, Suite 100 Hampton, VA 23666
Dr. Mladen Chargin NASA/Ames Research Center
Moffett Field, CA 94035 MC 213-3
Dr. Adit1 Chattopadhyay Analytical Services and Material8 Inc. NASA/Langley Research Center MS 246 Hampton, VA 23665-5225
Dr. Tsu-Chien Cheu Textron Lycoming, Dept. LSK-5 550 S. Main Street Stratford. CT 06497
Prof. Kyung K . Choi The University of Iowa Dept.of Mechanical Engineering 2132 Engineering Bldg Iowa City, IA 52242
Mr. Choon T. Chon Ford Motor Company
P.O. Box 2053 Dearborn. MI 48121
s-1108, SRL
Prof. Inderjit Chopra University of Maryland Dept. of Aerospace Engineering College Park, MD 20742
Mr. David M. Christhilf Planning Research Corporation NASA/Langley Research Center MS/489 Hampton, VA 23665-5225
Mr. Ching-Hung Chuang Old Dominion University 937 Rockbridge Ave. #244 Norfolk, VA 23508
Prof. Young W. Chun Villanova University Dept. of Mechanical Engineering Villanova, PA 19085
Mr. Robert D. Consoll General Dynamics P. 0. Box 748 Fort Worth, TX 76102
Mr. Mark W. Davis United Technologies Research Center Ms 19 Silver Lane E. Hartford, CT 06108
Mr. Randall C. Davis NASA/Langley Research Center MS 396 Hampton, VA 23665-5225
Dr. Pramote Dechaumphai NASA/Langley Research Center Ms 395 Hampton, VA 23665-5225
Prof. Alejandro Diaz Michigan State University Dept. of Mechanical Engineering Room 200, Engineering Building East Lansing, MI 48824-1226
Mr. Alan J. Dodd Douglas Aircraft Company Cl-E84, Mail Code 212-10 3155 Lakewood Blvd. Long Beach, CA 90815
Mr. Auqustine R. Dovi Planning Research Corporation 303 Butler Farm Rd, Suite 100 Hampton, VA 23666
Mr. Rodney Dreisbach The Boeing Company P. 0. Box 707 Mail Stop 9W-22 Seattle, WA
Mr. Delmar W. Drier NASA/Lewis Research Center MS 86-12 21000 Brookpark Road Cleveland, OH 44135
Dr. Ernest D. Eason Modeling & Computing Services 1153 Bordeaux Drive Suite 107 Sunnyvale, CA 94089
Dr. Peter A. Fenyes General Motors Research Laboratories Engineering Mechanics Department 30500 Mound Rd Dept 15 Warren, MI 48090-9055
Mr. Brian Fite NASA/Lewis Research Center 21000 Brookpark Road MS 86-10 Cleveland, OH 44135
Dr. Donald Flaggs Lockheed Palo Alto Research Laboratory Lockheed M&S 93-30/251 3251 Hanover ST. Palo Alto, CA 94304
Prof. Claude Fleury University of California Dept. of Mech. Aero. h Nuclear Engrg . 5732 Boelter Hall Los Angeles, CA 90024
Mr. Williard E. FOBS Jr. NASA/Langley Research Center MS 412 Hampton, VA 23665
Prof. Joseph Free Brigham Young University Department of Mechanical Engineering 242 Clyde Building Provo, UT 84602
Prof. Peretz P. Friedmann University of California-Los Angelas 57328 Boelter Hall Los Angelee, CA 90024
Prof. Robert E. Fulton Georgia institute of Technology Mechanical Engineering Atlanta, GA 30332
Dr. Gary A. Gabriele Rensselaer Polytechnic Institute Dept. of Mechanical Engineering Johnson Engineering Center, Rm. 4026 Troy, NY 12180-3590
Mr. James E. Gardner NASA/Langley Research Center MS 246 Hampton, VA 23665
Mrs. Marjorie German G. E. Research and Development 1 River Road, Bldg. K-I., Room 3A20 Schenectady, NY
Mr. D. Ghosh Planning Research Corporation 303 Butler Farm Rd, Suite 100 Hampton, VA 23665
Mr. Daniel P. Giesy Planning Research Corporation 303 Butler Farm Rd, Suite 100 Suite 100 Hampton, Va 23666
xiv
Mr. Michael G. Gilhrt NASA/Langley Reaoarch Center MS 243 Hampton, VA 23665-5225
Dr. Gary L. Gilem NASA/Langley Remearch Center MS 246 Hunpton, VA 23665-5225
Mr, David E. Qlarr halytiaal Serviaar 6 Uaterialr 107 Rerearah Drlw Hunpton, VA 23666
Prof. R w n a Qrandhi Wright Btata Univerrity Maapaniaal Byrtemr and Engineering Dayton, OH 45435
xr. Philip C. Qrawm Vigyan Rerearah Ammoaiation 30 Rerearah Driw Hunpton, VA 23666
Mr. Tomy L. Greon LTV Aerompaae and Dofenme Company Aircraft Product8 Group P.O. Box 655907, M!3 194-24 Dallaa, TX 75265-5907
Mr. William H . Greene NASA/Langloy Remearch Center MS 190 Hunpton, VA 23665-5225
Prof. Bernard Crommman Aerompaae and Ooean Engineering W I L su B1a0k8burgl VA 24061
Prof. Zafer Qurdal W I L su Engineering Saienoe and Machaniam Dept. Norrir Hall Blackmburg, VA 24061
Prof. Raphael T. Haftka VPICSU Dept. of Aerompace C Ocean Engineering Blackmburg, VA 24061
Prof. Prabhat Hajela Univeraity of Florida Dept. of Aero. Eng., Mach. and Eng. Sci. 231 Aerompace, Aero Gaineaville, FL 32611
Mr. David W. Hall David Hall Conaulting 1158 South Mary Avenue Sunnyvale, CA 94087-2103
Dr. Jeffrey C. Hall General Dynamic8 Corp./Eloc. Boat Div. Departunnt 463
Croton, CT 06340 Bantern Point Road
W . Stephen A. Hambrio David Taylor Rerearah Center cod. 1844 Batherd., rn 20004 Dr. I(. #.bit Auuouda Planning Remarob Corporation UMA/Langlay Rerearoh Center W 340 #-ton, VA 23665-5225
Mr. Jonathan 1. Wart PDA Engineering. Ina. 2975 Redhill Awnue Corta Mama, CA 92626-5923
Mr. Ahnvd A. Haman HaDonna11 Dough# Weliaopter Company 5000 P. HaDomll Bldg 530, MS B346 Mama, AE 85205-9797
Mr. T. X. Aammelnun Engineering Machanicm A880C., In0 . 3820 Del Am0 Boulevard, Suite 318 Torranae, CA 90503
ld.. Jennifer Heeq Planning Rerearah Corporation 303 Butler Farm Rd, Suite 100 Hunpton, Va 23666
W . Charlor Holland AF Offioe of Saientifia Rerear Departnunt of tho A i r PorM Bolling Air Foror Bare, DC 20332-6458
Prof. Jean Win Aou Old Dominion Uniwraity Dapt. Mach. Engineering and
Norfolk, VA 23462 Machaniam
Prof. Owen F. Hughes W I c SUN 1745 Jefferaon Davim Xighway STE 300 Arlington, VA 22202
Mr. Amir Izadpanah Vigyan Reamarch A8sociation NASA/Langley Raaaarch Center MS 340 Hampton, VA 23665
Mr. Burton H . Jackmon McDonnell Doug1.a Helicopter 5000 E. &Dowel1 Mema, Az
MS. Cheryl C. Jackmon Old Dominion Univarmity Dept. of Maah. Eng. and Meoh. Worfolk, VA 23529-0247
Mr. Banjamin P. Junmr I11 Planning Rerearah Corporation 303 Outler Farm Rd, luita 100 R m o n , VA 23666
Ma. Viaki Johnaon UMA/Langley Reaearob Canter W 412 X q t o n , VA 23665-5225
Mr. a. W. Jordan, Jr. L W Aerorpaoa 6 Defame Company P.O. Box 655907 #I 194-24 Dallam, Taxa# 75265-5907
W , Suremh #. Joahi N&SA/Langley Ramearah Center Ids 161 Hunpton, VA 23665-5225
Dr. Jar-Nan Jbang NASA/Langley Remearch Center M!3 230 Hunpton, VA 23665-5225
Prof. Hanohar P. X m t Qoorgia Inmtitute of Teahnology Soh001 of Aerompaam Engineering Atlanta, CA 30332
Nr. Junmr Xana Chrk80n Univarrity Maah. and Ind. Engineering Dept . Ootmduu, UY 13676
'Oh
W . Pi-Jan KAO WILBU Dept. of Aarompaae L Oaean Engineering Blackrburg, VA 24061
Mr. Mordeahay Xarp.1 Technion -1mra.l Inmtitute of Technology Dept. of Aero Engineering Haif. 32000 Imrael
W . Sean P. Kenny Old Dominion Uniwrmity Norfolk, VA 23508
Mr. Surerrh Xhandelwal Sverdrup Technology 16530 Cormwrce Ct. Middleburg Hta, OH 44130
xv
Prof. Noboru Kikuchi University of Michigan Department of Mechanical Engineering Ann Arbor, MI 48109
Prof. Rex K. Kincaid College of William and Mary Dept. of Mathematics Williamsburg, VA 23185
Dr. Norman F. Knight, Jr. NASA/Langley Research Center MS 244 Hampton, VA 23665-5225
Mr. Raymond M. Kolonay AF Wright Aeronautical Laborat ories AFWAL/FIBRA Wright-Patterbon AFB, OH 45433
Prof. Ilan Kroo Stanford University Dept. of Aero/Astro Stanford, CA 94305
Dr. Raymond G. Kvaternik NASA/Langley Research Center MS 340 Hampton, VA 23665-5225
Prof. C. Edward Lan The Univernity o € Kansas Aerospace Engineering Dept. Room 2004, Learned' Hall Lawrence, KS 66045
Mr. Jerry Lang NASA/LOWIS Research Center 21000 Brookpark Rd. Cleveland, OH 44135
Mr. M. Levina Rockwell International P.O. Box 92098 Los Angeles, CA 90245
Dr. Roy Levy Jet Propulsion Laboratory MS 144-201 4800 Oak Grove Drive Pasadena, CA 91109
Mr. Joon W. Lim University of Maryland College Park, MD
Mr. Kyong B. Lim Planning Research Corporation 303 Butler Farm Rd suite 100 Hampton, Va 23666
Mr. Eli Livne University of California LOB Angeles 4531 Boelter Hall, UCLA Loa Angeles, CA 90024
Mr. Andrew Logan McDonnell Douglas Helicopter Co. Bldg. 503, MSB 325 5000 E. McDowell Rd. Mesa, AZ 85205
Mr. Michael G. Long Cray Research. Inc. 1333 Northland Drive Mendota Heights, MN 55120
Dr. Robert V. Lust General Motors Research Laboratories Engineering Mechanicn Department 30500 Mound Road, MS 256 Rm B Warren, MI 48090-9057
Mr. Peiman G. Maghami Old Dominion University Norfolk. VA 23508 23508
W . W a y n e R. Mantay US Army Aerostnactures Directorate NASA/Langley Research Center MS 266 Hampton, VA 23665-5225
Mr. Carl J. Martin Planning Remarch Corporation 303 Butler Farm Rd, Suite 100 Hampton, Va 23666
Mr. John G. Martin Planning Research Corporation 303 Butler Farm Rd, Suite 100 Hampton, Va 23666
Mr. Zoran N. Martinovic Analytical Mechanics Associates, Inc. 17 Research Drive Hampton, VA 23666
Mr. Philip Mason GNmman Aerospace Corp. B-35, Dept. 430 Stewart Ave. Bethpage, NY 11714
Mr. Oliver G. McGee Ohio State University Department of Civil Engineering 417B Hitchcock Hall Columbus OH 43210
Mr. Niki Mehta Old Dominion University Dept. of Mechanical Eng. and Mechanical
College of Engineering and Technology Norfolk, VA 23529-0247
Prof. Luis Mesquita University of Nebraska Department of Enigneering Mechanics 217 Bancroft Lincoln, NE 68588
Prof. Farrokh Mistree University of Houston-Univ. Park Dept. of Mechanical Engineering 4800 Calhoun Road Houston, TX 77204-4792
Dr. Hiro Miura NASA/Ames Research Center Amem Research Center Attn: 237-11 Moffett Field, CA 94035
Mrs. Arlene A. Moore Planning Research Corporation 303 Butler Farm Rd, Suite 100 Hampton, Va 23666
Prof Subrata Mukherjee Cornel1 University Dept of T S AM Kimball Hall Ithica, NY 14853
Dr. T. Sreekanta Murthy Planning Research Corporation MS 340 NASA/Langley Research Center Hampton, VA 23665-5225
Mr. Evhen M. Mychalowycz Boeing Vertol Company MS P32-15 P. 0. Box 16858 Philadelphia, PA 19142
Dr. Gopal K. Nagendra Mac Neal-Schwendler Cow. 815 Colorado Blvd. Los Angeles, CA 90041-1777
Mr. Changho Nam Purdue University School of Aeronaut ice/Astronaut ics West Lafayette, IN 47907
Mr. D. J. Neil1 Northrop Corporation, Aircraft Division Dynamics 6 Loads Research 3854/82 One Northrop Avenue Hawthorne, CA 90250
xvi
Dr. Elli Ni8Pim NASA Dryden CODE OBV Edwards, CA 93523-5000
Mr. Kevin W. Noonan NASA/LMghy Research Center MS 266 Hampton, VA 23665-5225
Dr. Ahmnd K. Noor The George Wa8hington Univermity NASA/Langley Remarch Center MS269 Hampton, VA 23665-5225
Mr. T. L. Oglesby LTV Aerospace & Defense Company P. 0. Box 655907 MS 194-24 Dallam, TX 75265-5907
Prof. Irving U. Ojalvo University of Bridgeport Dept. of kchmical Engineering Bridgeport, CT 06601
Mrs. Sharon L. Padula NASA/Langley Research Center IRO Office bls 246 Hampton, VA 23665
Mr. Ajay IC. Pandey Planning Remearch Corporation 303 Butler Farm Rd, Suite 100 Wampton, VA 23666
Prof. Alan Parkinson Department of Mechanical Engineering Brigham Young Univer8ity 242 CB Provo, UT 04602
Mr. Bernhard Pepker CCAD, EB Univeraity of Iowa Iowa City, IA 52242
Prof. David Peter8 Georgia In8titute o f Technology School of Aerospace Engineering Atlanta, GA 30332
Mr. James Peter8 McDonnell Dough8 Helicopter Co. Bldg. 530/B346 5000 E . McDowell Rd. Mesa, AZ 05205-9797
Prof. Lucian Elijah Polak University of California Dept. of Electrical Engineering 565 Cory Hall Berkeley, CA 94720
Mr. Dave Polen VPILSU Dept. of Aoroapaco L Ocean Engineering 400 H. Foxridge Blackmburg, VA 24061
Prof. Aubrey Poore Colorado State University Dept. of Mathematic8 Fort Collina, CO 00523
Dr. Biren Pra8ad Electronic Data System Corporation 5555 New King Street Troy, MI 40007-7019
Dr. Thomas K. Pratt Pratt L Whitney Engineering Building, 161-16 400 Main Street $ant Hartford, CT 06100
Dr. N. A. Radovcich Lockheed Aeronautical System8 co . D/76-12, Bldg 63-6, Plant A-1 P.O. Box 551 Burbank, CA 91520
Mr. Charles C. Rankin Lockheed Mimilea and Space Palo Alto Remarch Lab. 0/93-30 B/251 Palo Alto, CA 94304-1191
Dr. S. M. Rankin Mathematic8 Dept. Worcester Poly. Tech. Worcester, Ma 01609
Mr. Jagannatha Rao The Univermity o f Michigan 2212 0 . C. Brown Lab. Ann Arbor, MI 40109
Mr. J o h J. Rebder NASA/Langley Re8earch Center MS 365 Hampton, VA 23665-5225
Prof. Robert Reiss Howard University Department of Mechanical Engineering 2300 Sixth Street, N.W. Washington, DC 20059
Mr. J. Edward Rogan Georgia Inmtitute o f Technology School of Aerospace Engineering Atlanta, GA 30332-0150
Mr. J-8. L. Roger8 NASA/Langley Research Center IRO Office bfS 246 Hampton, VA 23665
Mrs. V. Aileen Rogers Planning Research Corporation 303 Butler Farm Rd, Suite 100 Hampton, VA 23666
Mr. Bruce A. Ronmel Douglas Aircraft Company Cl-E84, Mail Code 212-10 3055 Lakewood Blvd. Long Beach, CA 90846
Dr. Sunil Saigal Worcester Polytechnic Institute Meeohanical Engineering Department Inatitute Road Worcester, Mans 01069
Dr. Moktar Sal- Jet Propulsion Laboratory Applied Mechanics Div. - MS 157-316 California Institute of Technology Pasadena, CA 91109
Mr. Chris A. Sandrldge VPI L su Aerospace L Ocean Engineering Blacksburg, VA 24061
Prof. Lucien A. Schmit University of California, Los Angeles 453% Boelter Hall Los Angeles, CA 90024
Prof. Daniel P . Schrage Georgia Institute of Technology School of Aerospace Engineering 250 Drumnen Ct Atlanta, GA 30332-0150
Mr. Stephen J. Scotti NASA/Langley Research Center MS 396 Hampton, VA 23665-5225
Mr. Jeen S. Sheen Old Dominion University Dept. of Mechanical Eng. and Mechanics College of Engineering and Technology Norfolk, VA 23529-0247
Mr. Joram Shenhar Planning Research Corporation 303 Butler Farm Rd, Suite 100 Hampton, VA 23665
xvii
Dr. Mark J. Shuart NASA/Langley Research Center MS 190 Hampton, VA 23665-5225
Mr. J. A. Shupe B. F. Goodrich 9921 Breckrville Road Breckrville, OH 44141
Mr. Walter A. Silva Planning Rerearoh Corporation 303 Butler Pam Rd, Buite 100 Hampton, VA 23666
Mr. Jurur A. Sinuk General Dynrmiar Data Sy8t.m. Divirion 3.0. Box 748 Fort Worth, TX 76102
Dr. Jarorlaw Sobierki NASA/Langlay Rerearah Canter M9 246 nampton, VA 23665-5225
Mr. Andy 8. Soediono Georgia Inrtitute of Technology P. 0. Box 34091 225 North Avenue Atlanta, GA 30332
Dr. Jamer H. Starnen, Jr. NASA/Langley Research Center MS 120 Hampton, VA 23665-5225
Mr. Frank J. Tarzanin Booing Vertol Company
P. 0. Box 16858 Philadelphia, PA 19142
Mr. Kenneth E. Tatum Planning Rerearch Corporation SSD/ATD 303 Butler Farm Rd., Suite 100 Hampton, VA 23666
Mr. Rajiv Thareja Planning Remarch Corporation 303 Butler Farm Rd, Suite 100 Hampton, VA 23666
Prof. Garret N. VanderplaatB Univerrity of California, Santa Barbara Dept. of Mechanical 6 Environmental Eng. Santa Barbara, CA 93160
MS P32-15
Dr. Vipperla B. Venkayya AF Wright Aeronautical Laboratories AFWAL/FIBR Wright-Patterson AFB, OH 45433
Dr. A. V. Viswanathan Boeing Commercial Airplane Co. P. 0. Box 3107 Seattle, WA 90124
Mr. A, Von Flotor MIT 31-335, UIT Cambridge, UA 02139
MI. Joanne L. Walrh NASA/Langlay Rerearoh Center US 246 Wunpton, VA 23665-5225
Prof. Bo Ping Wang The Univerrity of Texan Dept. of Wahaniaal Engineering P.O. Box 19023 Ulington, TX 76019
Ur. Bryan Watron Spaatragraphior Corporation 9125 Rehao Road Ban Diego, CA 92121
Prof. Terrenam A. Wei8rhaat Purdue University School of ~ronautic~/Artronauticr West Lafayette, IN 41907
Ur. W. H. Weller United Technologier Rerearch Center M. 9 . 19, Silver Lane Eart Hartford, CT 06108
Ur Carol D. Wierenun NASA/Langley Rerearch Center MS 243 nunpton, VA 23665-5225
bfr. June. L. Williun. NASA/Lanqley Rerearah Center MS 499 Hunpton, VA 23665-5225
Urr . Jarmica A. Woodr Planning Rerearch Corporation NASA Langley Rerearch Center h i 1 Stop 243 Hunpton, VA 23665-5225
Ur. Gregory A. Wrenn Planning Remarch Corporation NASA/Langley Rerearch Center US905 Hampton, VA 23665-5225
Ur. Ren-Jye Yang Ford Motor Company Scientific Research Labs P. 0. Box 2053, RU E-1134 Dearborn, MI 48212
Dr. E. Carson Yates NASA/Langley Research Center MS 246 Hampton, VA 23665-5225
Ur. Chao-Pin Yeh Georgia Tech Atlanta, Georgia 30332
bfr. John W. Young NASA/Langley Rerearoh Center US 499 Wunpton, VA 23665-5225
Urr. Katharine C. Young NABA/Langley Rerearah Center IRO Offiaa US 246 nunpton, VA 23665
Ur. Rudy Yurkoviah WaDonnell Airaraft Co. P.O. Box 516 St. Louir, WO 63166
Dr. Thonur A. Zeiler Planning Rarearch Corporation NASA/Langhy Ruaarch Center US 243 Hampton, VA 23665-5225
xv i i i

PART I
S E S S I O N 1: PLENARY
Chairman: Owen F . Hughes

N89- 25147 .. \
APPLICATIONS OF INTEGRATED DESIGN/ANALYSIS SYSTEMS IN AEROSPACE STRUCTURAL DESIGN
Philip Mason, Edwin Lerner, and Lawrence Sobel
Grumman Aircraft Systems Division Grumman Corporation Bethpage, New York
PRECEDING PAGE BLANK NOT RLMfD
3
4
INTRODUCTION
Many papers have been written on structural optimization techniques and integrated design and analysis systems; however, engineering managers, project engineers and design engineers still ask the questions: Are structural optimization techniques of academic interest only, or are they really being used on actual hardware designs in a real production environment? And, if these techniques are being used, do they really contribute to the structural design? Also, are optimization tools being used as an integral part of the overall design/analysis systems that various companies are either currently using or plan on developing? paper will attempt to answer these questions by reviewing development efforts and the application of the resulting systems to actual hardware designs that have been developed and manufactured at Grumman Corporation.
Our
Many papers have been written on structural optimization techni ues and integrated analysis and design systems. Yet, many 3 esign engineers ask
Are structural optimization techniques of academic interest only, or are they really being used in a production environment? If so, do they really contribute to the design of a structure?
Are optimization techniques being used as an integral part of the overall designlanal sis systems that various companies are currently using an dy /or developing?
DEVELOPMENT OF AUTOMATED STRUCTURAL DESIGN/ANALYSIS SYSTEMS AT GRUMMAN
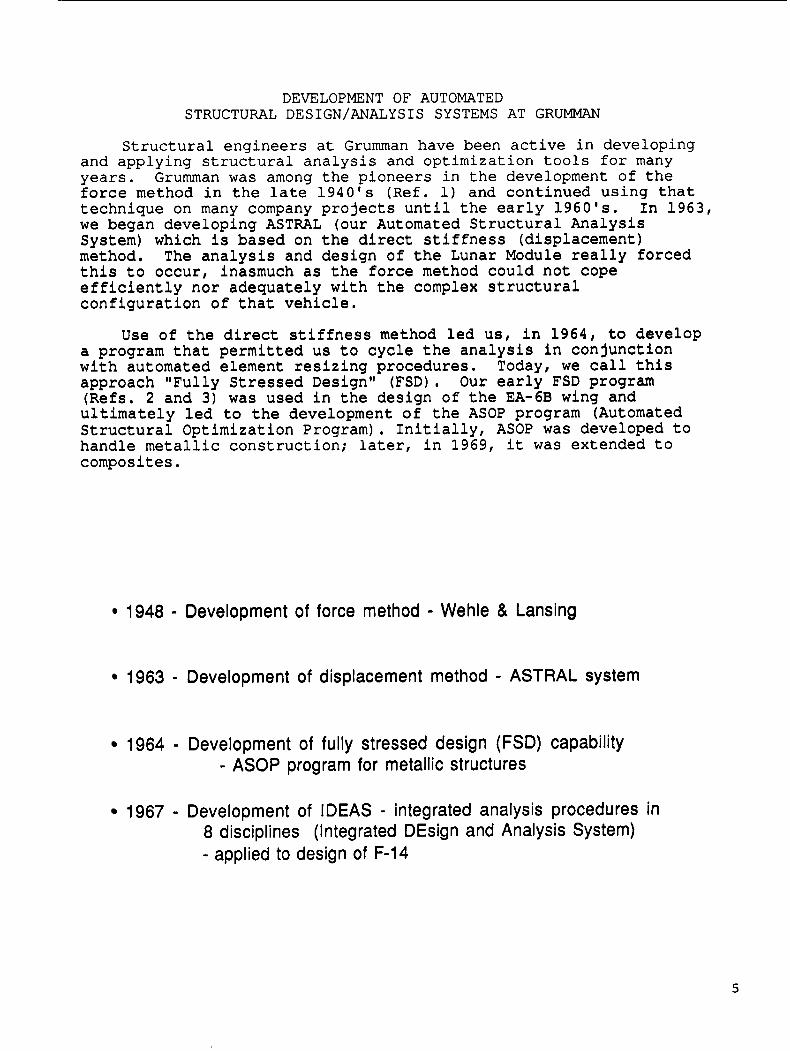
S t r u c t u r a l e n g i n e e r s a t Grumman have been active i n deve lop ing and applying s t r u c t u r a l a n a l y s i s and o p t i m i z a t i o n t o o l s f o r many years. Grumman w a s among t h e p i o n e e r s i n t h e development of t h e force method i n t h e l a t e 1 9 4 0 ' s ( R e f . 1) and c o n t i n u e d u s i n g t h a t t e c h n i q u e on many company p r o j e c t s u n t i l t he e a r l y 1 9 6 0 ' s . I n 1 9 6 3 , w e began d e v e l o p i n g ASTRAL (ou r Automated S t r u c t u r a l A n a l y s i s System) which i s based on t h e direct s t i f f n e s s ( d i s p l a c e m e n t ) method. The a n a l y s i s and d e s i g n o f t h e Lunar Module r e a l l y forced t h i s t o occur , inasmuch a s t h e f o r c e method c o u l d n o t cope e f f i c i e n t l y n o r a d e q u a t e l y w i t h t h e complex s t r u c t u r a l c o n f i g u r a t i o n o f t h a t vehicle .
Use o f t h e direct s t i f f n e s s method l e d u s , i n 1964, t o develop a program t h a t permitted u s t o c y c l e t h e a n a l y s i s i n c o n j u n c t i o n w i t h au tomated e lement r e s i z i n g p r o c e d u r e s . Today, w e c a l l t h i s approach " F u l l y Stressed Design" (FSD) . Our e a r l y FSD program (Refs. 2 and 3 ) was used i n t h e d e s i g n of t h e EA-6B wing and u l t i m a t e l y l e d t o t h e development of t h e ASOP program (Automated S t r u c t u r a l O p t i m i z a t i o n P rogram) , I n i t i a l l y , ASOP was deve loped t o h a n d l e metall ic c o n s t r u c t i o n ; l a te r , i n 1969, it was e x t e n d e d t o compos i t e s .
1948 - Development of force method - Wehle & Lansing
1963 - Development of displacement method - ASTRAL system
1964 - Development of fully stressed design (FSD) capability - ASOP program for metallic structures
1967 - Development of IDEAS - integrated analysis procedures in 8 disciplines (Integrated DEsign and Analysis System) - applied to design of F-14
5

DEVELOPMENT OF AUTOMATED STRUCTURAL design/analysis SYSTEMS
AT GRUMMAN (CONTINUED)
Obviously, one cannot analyze a structure without applied loads and, likewise, cannot predict flight and ground loads without knowledge of the elasticity of the vehicle. In 1967, when facing a potential, major new design contract (that was to become the F-14), we embarked on the development of a comprehensive computer system that would address the overall external and internal loads problem. We called the system IDEAS (Integrated Design and Analysis System, Ref. 4) and used it extensively in the design of the F-14 fighter and in preliminary designs of the Space Shuttle (Refs. 5 - 7). IDEAS was a batch-oriented system in which special care was given to consistent 1/0 between the various modules that comprised the system. Later, the concepts behind the IDEAS system were extended to a time share environment and the development of the RAVES system (Rapid Aerospace Vehicle Evaluation System - Ref. 8).
a 1969 - Extension of ASOP to composite construction
0 1972 - Development of RAVES (Rapid Aerospace Vehicle Evaluation System) time share system - considered 15 disciplines
1973-1 981 - Development of FASTOP system - flutter constraints, aeroelastic effectiveness, divergence speed
a 1975 - Development of GEMS system -- interactive graphics - IBM 2250 -3250 -- 5080 -- GIP system - uses CADAM, CATIA on IBM main frames via 5080 scopes
DEVELOPMENT OF AUTOMATED STRUCTURAL DESIGN/ANALYSIS SYSTEMS
AT GRUMMAN (CONTINUED)
Between 1973 and 1981, Grumman was active in developing optimization procedures for combined strength and aeroelastic requirements (Refs. 9 - 2 2 ) . A major computer program that was developed in this time frame was FASTOP (Flutter and Strength Optimization Program). This program, which received Air Force sponsorship, was one of the first major systems to incorporate strength and aeroelastic constraints in one design/analysis system.
In 1975, the company began developing our CAD/CAM "GEMS" system (Grumman Engineering and Manufacturing System). This system embodies various commercial programs such as CADAM, CATIA and PATRAN and operates on IBM mainframes via 5080-type scopes. Our in-house developed design/analysis system, COGS, operates in this same interactive graphics environment, making use of the same equipment used by our designers and manufacturing engineers.
COGS derives its flexibility from the ASTRAL-COMAP system that has been used at Grumman for many years on virtually all major projects that require structural analysis. This system is constantly upgraded to reflect new changes in hardware, software and the interactive graphics environment.
COGS places strong emphasis on interactive graphics and has an extensive analysis capability. For example, using COGS, an engineer can generate a structural finite-element model, a lifting surface airloads model, or a dynamic transient response model. He can calculate aerodynamic influence coefficients, aerodynamic node loads, and inertia loads due to flight or ground loading conditions. He can transform these loads from their respective models to the structural model and can calculate and interactively plot moment, shear and torsion curves, as well as envelopes of these curves, on a 5080 scope. He can also calculate internal loads, stresses and strains, nodal deflections, vibration modes and frequencies, flexibility coefficients, and buckling loads and mode shapes. The system can also perform multilevel substructuring, thermal analysis, plastic analysis, nonlinear variable contact analysis and crack growth analysis. A given model, once analyzed, may be resized for strength or for other constraints such as those dictated by aeroelastic or frequency requirements. (Here, we have incorporated portions of the FASTOP code into COGS.) The user may also perform a wide variety of user-specified matrix operations.
Graphical output may be viewed at the scope or plotted via a batch submittal to a Versatec plotter for hard copy. Buffer plots of any scope display may be obtained by requesting a "buffer dump" at the scope and then plotting these data on the Versatec. addition, hard copy of color graphics that show contours of stresses, composite ply layups, derivatives of frequency with respect to element gage, plus a wide variety of other information,
In
7

DEVELOPMENT OF AUTOMATED STRUCTURAL ANALYSIS/DESIGN SYSTEMS
AT GRUMMAN (CONCLUDED)
may be obtained from a Seiko D-SCAN plotter that is attached to selected scopes. We usually plot full E-size or J-size drawings showing such data as internal panel loads, average stresses or strains, ply layups, cap loads and shear flows, element gages, nodal deflections or mode shapes.
As a subsystem of GEMS, COGS runs interactively on the IBM 3090, or compatible mainframes like the NAS 9060. We have attached an FPS-164 to one of the 3090 mainframes in order to provide a 10 Mflops capability for real-time, computer-intensive calculations while, at the same time, off-loading the mainframe so that these calculations do not interfere with other interactive systems. COGS presently interfaces with CADAM and will interface with CATIA in the future. Grumman has worked with PDA Engineering and acted as a beta test site for developing a 5080 fully interactive graphics version of PATFUN. Thus, our COGS structural analysis system' is very much entwined with the same computing hardware, software and system that is used to perform computer= aided design and computer-aided manufacturing.
We have used COGS on a wide variety of company projects including: Gulfstream-111, PDX TOKAMAK, M-161 Hydrofoil, F-14, C-2A, E-2C, Dehavilland DASH-8, A-6F, V-22, EA-6B, X-29, Orbiting Maneuvering Vehicle, Space Based Radar, CW/VT (Composite Wing and Vertical Tail Program), and C-17 Control Surfaces.
I
1976 - Development of strength resize capability in ASTRAL
8
1978 - Development of COGS system (subsystem of GEMS) Applications: G-Ill, PDX TOKAMAK, M161 Hydrofoil, F-14, C-2A Reprocurement, E-2C, Dehavilland DASH 8, A-6F, V-22, EA-6B, X-29, OMV, SBR, NPBIE, CW/VT, (2-17 control surfaces
structural analysis capability - incorporate FASTOP optimization capability, add flight loads, ground loads,
1983 - Development of COGS system as major interactive graphic
weights, and thermal analysis capability
I graphics capability
I 1987 - Conversion of system to PHIGS standard -- increase interactive

OBJECTIVE OF THE COGS SYSTEM
The objective of the COGS system is to provide a capability for analyzing and designing structures in .a fully integrated interactive graphics environment. The word "analyzing" implies the ability to calculate all external loads due to various conditions such as maneuvers, gusts, landing, catapulting, taxiing, thermal environment as well as calculating the response of the structure to these loads. The word "designing" implies sizing the structure so as to maintain structural integrity and satisfy specified performance requirements throughout the complete flight envelcpe.
We do not mean to imply that we have linked our finite-element structural analysis and optimization capability directly to CADAM- type shop drawings; however, if we are ever going to achieve this type of objective in the future, the system upon which to build is in place in an interactive graphics environment.
The objective of the COGS system is to provide a capability for
ANALYZING and DESIGNING structures
ANALYZING implies the ability to calculate all external loads due to various conditions such as flight maneuvers, gusts, landing, catapulting, taxiing, thermal environment as well calculating the response of the structure, such as internal loads.
DESIGNING implies sizing the structure so as to maintain structural integrity and specified performance throughout the complete flight spectrum.
9

THE INTERACTIVE GRAPHICS ENVIRONMENT
Many elements make up the environment for the performance of structural analysis, optimization and design. We certainly need software, and at Grumman our GEMS system embraces and supports CADAM, CATIA, PATRAN, NASTRAN and, of course, our in-house COGS system. GEMS operates on 5080 high-function scopes and utilizes IBM 3090 mainframes. We also have access to a Cray and have an FPS-164 attached to the 3090 to provide on-line computing support and to off-load the mainframe. We have a large number of disk packs for storing data and have design facilities in all of our design and manufacturing plants for properly using the system.
Our trained users are rapidly becoming part of collocated design/analysis/manufacturing teams.
COLLOCATED DESIGN - ANALY MANUFACTURING TEAM
TRAINED USERS
HIGH FUNCTION
E NUMBER OF DISK PACKS
WORK STAT LAYOUT BO
TA BASE ADMINISTRATOR
COGS
3090 309 01 F PS
10

DESIGN-USAGE CYCLE
The d e s i g n - e v o l u t i o n c y c l e f o r a g i v e n v e h i c l e may be d i v i d e d i n t o s i x p h a s e s . Phase 1, Concep tua l Des ign , i s b a s i c a l l y parametric i n n a t u r e . F i n i t e - e l e m e n t a n a l y s i s and o p t i m i z a t i o n t e c h n i q u e s are u s u a l l y n o t a p p l i e d i n t h i s p h a s e . P h a s e 2 , P r e l i m i n a r y Des ign , b e g i n s w i t h a 3-view d rawing of t h e c a n d i d a t e v e h i c l e and p r o g r e s s e s u n t i l enough i n f o r m a t i o n i s g a i n e d t o prepare a proposal f o r ha rdware d e s i g n . Our s t r u c t u r a l o p t i m i z a t i o n p r o c e d u r e s and t h e COGS sys t em have been u s e d e x t e n s i v e l y i n t h i s p h a s e of d e s i g n on a wide v a r i e t y of v e h i c l e s . Phase 3, F i n a l Des ign , b e g i n s a f t e r award of a ha rdware proposal a n d progresses u n t i l a l l d rawings have been released t o m a n u f a c t u r i n g . C l e a r l y , s t r u c t u r a l a n a l y s i s and o p t i m i z a t i o n t e c h n i q u e s p l a y a n i m p o r t a n t r o l e . I n P h a s e s 4 , P r o d u c t i o n , and 5, V e h i c l e Usage, s y s t e m s s u c h as COGS are u s e d p r i m a r i l y f o r i n v e s t i g a t i o n s re la ted t o l oca l problem s o l v i n g . Phase 6, I n v e s t i g a t i o n s and Des ign M o d i f i c a t i o n s , i s c o n c e r n e d w i t h d e s i g n u p g r a d i n g f o r improved v e h i c l e pe r fo rmance o r e x t e n d e d l i f e .
MAJOR AP PI CA 0 SOF
SYSTEMS ( CONCEPTUAL DESIGN)
3 VIEW DIAO. OF CANDIDATE VEHICLE
UATA REQUIRED FOR PROPOSAL
FINAL DESIGN
FINAL DRAWINGS TO MANUFACTURINO
B I I I
i t ; I I
PHASE 5 VEHICLE USAGE
( FLEET SERVlCE )
UPGRADE REQUIREMENTS
I I I I t I
INVESTIGATIONS AND DESIGN MODIFICATIONS
DESIGN-USAGE CYCLE
1 1
TYPICAL DESIGN/ANALYSIS CYCLE
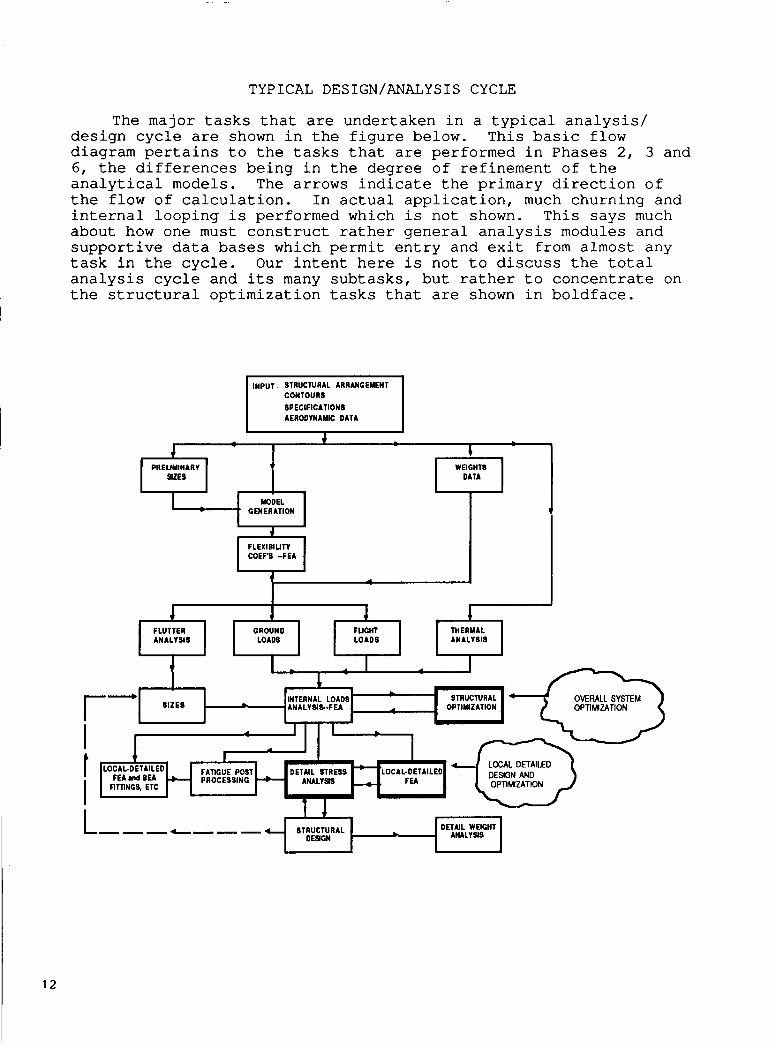
The major t a sks t h a t are unde r t aken i n a t y p i c a l a n a l y s i s / d e s i g n c y c l e are shown i n t h e f i g u r e below. T h i s basic f low d iagram p e r t a i n s t o t h e t a s k s t h a t are per formed i n Phases 2 , 3 and 6, t h e d i f f e r e n c e s b e i n g i n t he degree o f r e f i n e m e n t o f t h e a n a l y t i c a l models . The a r rows i n d i c a t e t h e p r imary d i r e c t i o n o f t h e f l o w o f c a l c u l a t i o n . I n a c t u a l a p p l i c a t i o n , much c h u r n i n g and i n t e r n a l l o o p i n g is per formed which i s n o t shown. T h i s s a y s much abou t how one must c o n s t r u c t rather g e n e r a l a n a l y s i s modules and s u p p o r t i v e data bases which permit e n t r y and e x i t from a lmos t any t a s k i n t h e c y c l e . Our i n t e n t here i s n o t t o d i s c u s s t h e t o t a l a n a l y s i s c y c l e and i t s many s u b t a s k s , b u t ra ther t o c o n c e n t r a t e on t h e s t r u c t u r a l o p t i m i z a t i o n t a sks t h a t are shown i n b o l d f a c e .
CONTOURS SPECIFICATIONS AERODYNAMIC DATA
T
PRELIYINARY 7 SIZES
I MODEL ' GENERATION
4 FLEXIBILITY COEF'S -FEA
WEIGHTS 7 t t
FLUTTER GROUND FLIGHT THERMAL ANALYSIS LOADS LOADS ANALYSIS
I , 1 - OVERALL SYSTEM OPTlMlZATlON
L
INTERNAL LOADS STRUCTURAL SIZES - ANALYSIS-FEA OPTlYlZATlON
I LOCAL DETAILED DESIGN AND OPTIMIZATION
LOCAL-DETAILED -
- t i
DETAIL STRESS - -.
FATIGUE POST FEAnd BE4 & PROCESSING ANALYSIS FEA
FITTING& ETC
I t DETAIL WEIGHT
---&--- STRUCTURAL L ANALYSIS DESIGN
L

APPLICATIONS OF OPTIMIZATION PROCEDURES TO ACTUAL DESIGN AT GRUMMAN
PHASE 2 -- PRELIMINARY DESIGN phases of the X-29 (Ref. 23) and we will elaborate on this later.
We used the FASTOP system extensively in the preliminary design
We also used our ASTRAL/COGS system to perform element resizing for frequency avoidance on several space type structures. Two examples are the preliminary sizing for the O W and NPBIE.
PHASE 2 -- PRELIMINARY DESIGN
X-29 - use of FASTOP to optimize structure for divergence avoidance -- evaluate laminate configurations
OMV - Orbiting Maneuvering Vehicle use of ASTRAUCOGS -- multiple frequency avoidance
NPBIE - Neutral Particle Beam Ionization Experiment use of ASTRAUCOGS -- frequency avoidance
13
APPLICATIONS OF OPTIMIZATION PROCEDURES TO ACTUAL DESIGN AT GRUMMAN
14
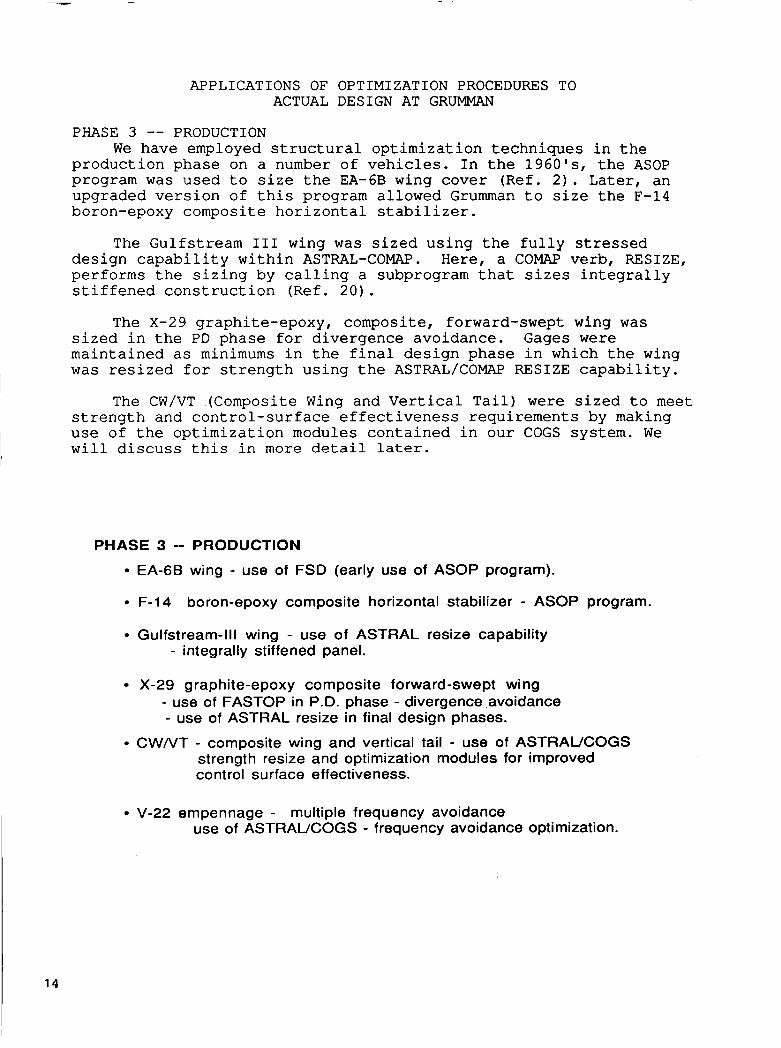
PHASE 3 -- PRODUCTION We have employed structural optimization techniques in the
production phase on a number of vehicles. In the 1960's, the ASOP program was used to size the EA-6B wing cover (Ref. 2 ) . Later, an upgraded version of this program allowed Grumman to size the F-14 boron-epoxy composite horizontal stabilizer.
The Gulfstream I11 wing was sized using the fully stressed design capability within ASTRAL-COW. Here, a COMAP verb, RESIZE, performs the sizing by calling a subprogram that sizes integrally stiffened construction (Ref. 20) .
The X-29 graphite-epoxy, composite, forward-swept wing was sized in the PD phase for divergence avoidance. Gages were maintained as minimums in the final design phase in which the wing was resized for strength using the ASTRAL/COW RESIZE capability.
The CW/VT .(Composite Wing and Vertical Tail) were sized to meet strength and control-surface effectiveness requirements by making use of the optimization modules contained in our COGS system. We will discuss this in more detail later.
PHASE 3 -- PRODUCTION
EA-6B wing - use of FSD (early use of ASOP program).
F-14 boron-epoxy composite horizontal stabilizer - ASOP program.
Gulfstream-Ill wing - use of ASTRAL resize capability - integrally stiffened panel.
X-29 graphite-epoxy composite forward-swept wing - use of FASTOP in P.D. phase - divergence.avoidance - use of ASTRAL resize in final design phases.
C W N T - composite wing and vertical tail - use of ASTRAUCOGS strength resize and optimization modules for improved control surface effectiveness.
V-22 empennage - multiple frequency avoidance use of ASTRAUCOGS - frequency avoidance optimization.
APPLICATIONS OF STAND-ALONE DETAIL ANALYSIS
PROCEDURES TO ACTUAL DESIGN AT GRUMMAN
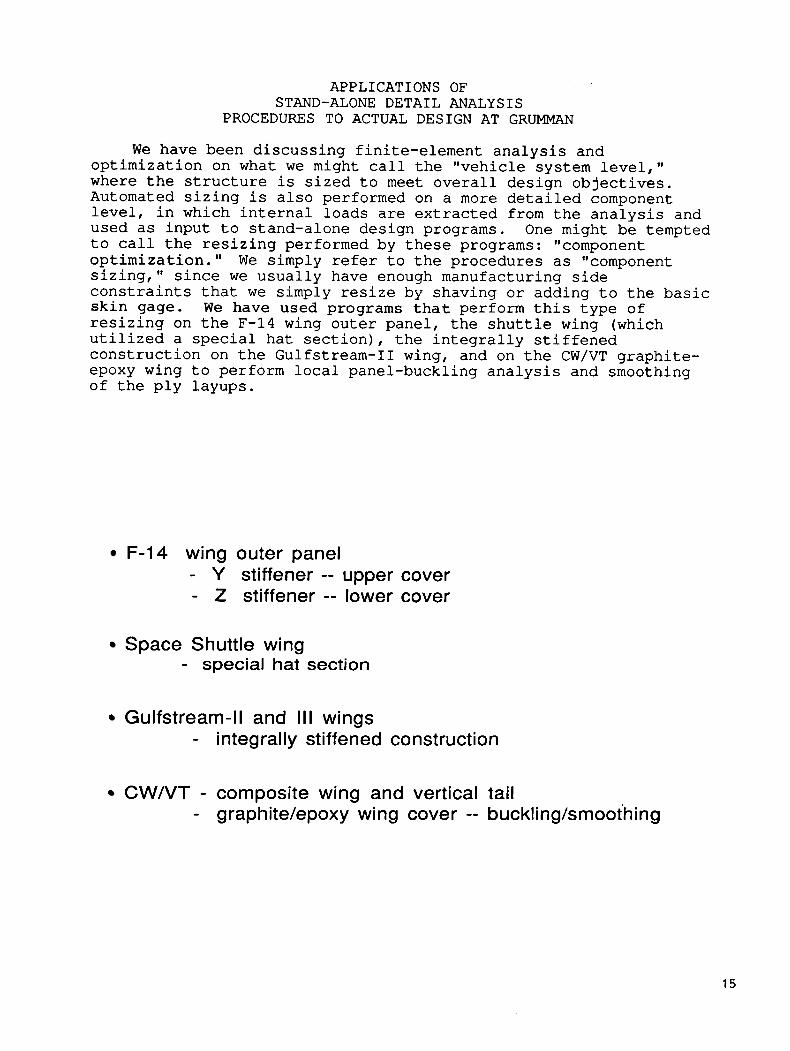
We have been discussing finite-element analysis and optimization on what we might call the "vehicle system level," where the structure is sized to meet overall design objectives. Automated sizing is also performed on a more detailed component level, in which internal loads are extracted from the analysis and used as input to stand-alone design programs. to call the resizing performed by these programs: "component optimization." We simply refer to the procedures as "component sizing," since we usually have enough manufacturing side constraints that we simply resize by shaving or adding to the basic skin gage. resizing on the F-14 wing outer panel, the shuttle wing (which utilized a special hat section), the integrally stiffened construction on the Gulfstream-I1 wing, and on the CW/VT graphite- epoxy wing to perform local panel-buckling analysis and smoothing of the ply layups.
One might be tempted
We have used programs that perform this type of
F-14 wing outer panel - Y stiffener -- upper cover - 2 stiffener -- lower cover
Space Shuttle wing - special hat section
Gulfstream-ll and 1 1 1 wings - integrally stiffened construction
CW/VT - composite wing and vertical tail - graphite/epoxy wing cover -- buckling/smoothing
15
GRUMMAN OPTIMIZATION PROCEDURES
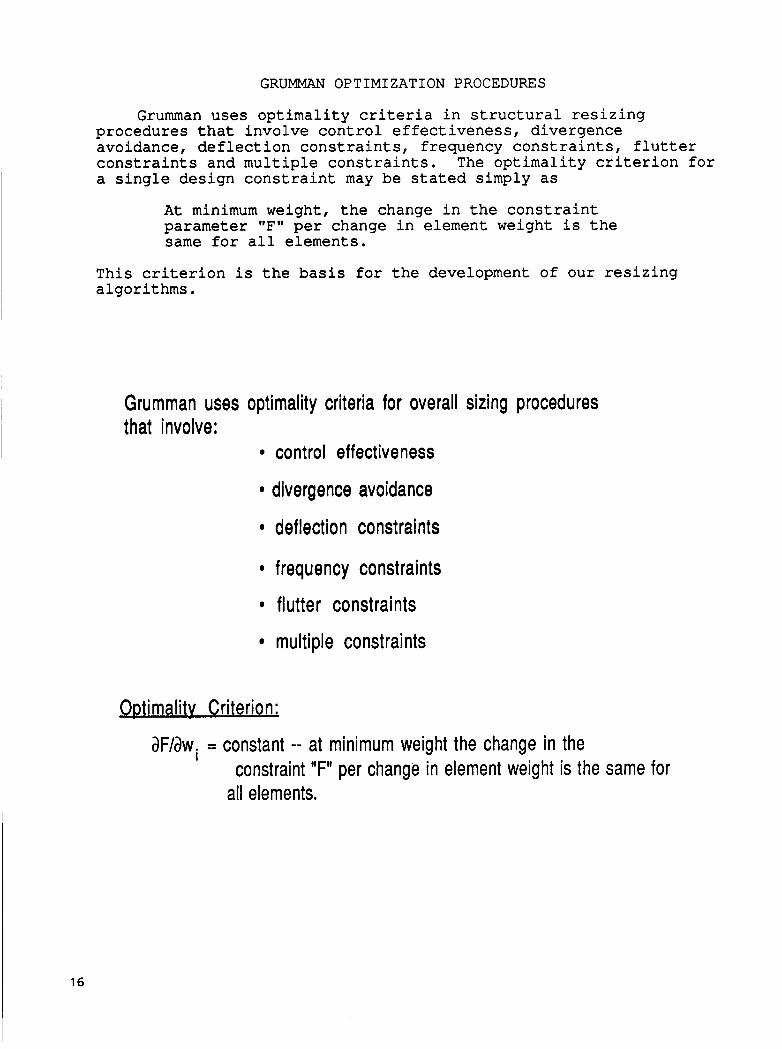
Grumman uses optimality criteria in structural resizing procedures that involve control effectiveness, divergence avoidance, deflection constraints, frequency constraints, flutter constraints and multiple constraints. The optimality criterion for a single design constraint may be stated simply as
At minimum weight, the change in the constraint parameter "F" per change in element weight is the same for all elements.
This criterion is the basis for the development of our resizing algorithms.
Grumman uses optimality criteria for overall sizing procedures that involve:
0 control effectiveness
0 divergence avoidance
0 deflection constraints
0 frequency constraints
0 flutter constraints
multiple constraints
ODtimalitv Criterion:
3Fl3w. = constant -- at minimum weight the change in the I
constraint "F" per change in element weight is the same for all elements.
16
GRUMMAN OPTIMIZATION PROCEDURES
In sizing for strength, we use resizing procedures that recognize detail design parameters pertinent to the type of construction employed. The appropriate procedure is tied to the "construction code" that is assigned to the element in the member data file. For example:
Construction Code A1 = Metallic - Isotropic construction The failure criteria give consideration to:
Principal stress Modified effective stress ratio Minimum and maximum gages
We use structural sizing procedures that recognize detail design parameters where the structure is sized for strength:
Metallic -- Isotropic
principal stress
modified effective stress ratio
minimum and maximum gages
17

GRUMMAN O P T I M I Z A T I O N PROCEDURES (CONCLUDED)
Construction Code A'3 = Metallic stiffened sheet The failure criteria give consideration to:
Stringer compression Stringer rigidity (EI/bd) Biaxial loading - sheet compression and shear Minimum and maximum parameter specification Stiffener gage is slaved to skin thickness
Construction Code C1 = Composite construction The failure criteria give consideration to:
Multi-ply orientation Fiber allowable stresses Balanced layer requirements Minimum and maximum number of plies in a given layer direction
Metallic Stiffened Sheet
stringer compression stringer rigidity (El/bd)
biaxial loading -- sheet compression and shear
minimum and maximum parameter specification
stiffener gage is slaved to skin thickness
Composite Construction
mu Iti-ply orientation
fiber allowable stresses
balanced layer constraints
18
STRENGTH SIZING SCHEME
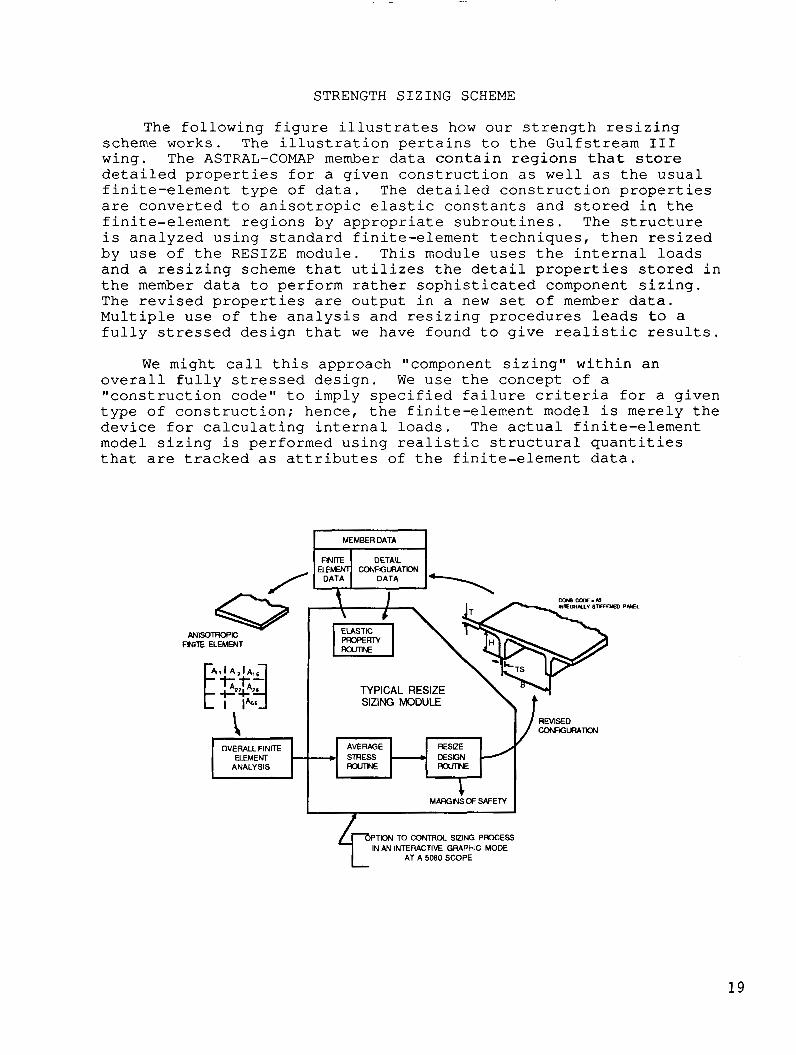
The f o l l o w i n g f i g u r e i l l u s t r a t e s how o u r s t r e n g t h r e s i z i n g scheme works . The i l l u s t r a t i o n p e r t a i n s t o t h e G u l f s t r e a m I11 wing. The ASTRAL-COMAP member d a t a c o n t a i n r e g i o n s t h a t store d e t a i l e d p r o p e r t i e s f o r a g i v e n c o n s t r u c t i o n as w e l l a s t h e u s u a l f i n i t e - e l e m e n t t y p e of d a t a . are c o n v e r t e d t o a n i s o t r o p i c e l a s t i c c o n s t a n t s a n d s tored i n t h e f i n i t e - e l e m e n t r e g i o n s b y a p p r o p r i a t e s u b r o u t i n e s . The s t r u c t u r e i s a n a l y z e d u s i n g s t a n d a r d f i n i t e - e l e m e n t t e c h n i q u e s , t h e n r e s i z e d by u s e of t h e RESIZE module. T h i s module u s e s t h e i n t e r n a l l o a d s a n d a r e s i z i n g scheme t h a t u t i l i z e s t h e d e t a i l p rope r t i e s stored i n t h e member data t o pe r fo rm r a t h e r s o p h i s t i c a t e d component s i z i n g . The revised proper t ies are o u t p u t i n a new set of m e m b e r da t a . M u l t i p l e u s e of t h e a n a l y s i s a n d r e s i z i n g p r o c e d u r e s leads t o a f u l l y stressed d e s i g n t h a t w e have found t o give r e a l i s t i c r e s u l t s .
The d e t a i l e d c o n s t r u c t i o n proper t ies
W e might c a l l t h i s a p p r o a c h "component s i z i n g " w i t h i n a n o v e r a l l f u l l y stressed d e s i g n . W e u s e t h e c o n c e p t of a " c o n s t r u c t i o n code" t o imply spec i f ied f a i l u r e c r i t e r i a f o r a g i v e n t y p e o f c o n s t r u c t i o n ; hence , t h e f i n i t e - e l e m e n t model i s mere ly t h e device f o r c a l c u l a t i n g i n t e r n a l loads . The a c t u a l f i n i t e - e l e m e n t model s i z i n g i s pe r fo rmed u s i n g r e a l i s t i c s t r u c t u r a l q u a n t i t i e s t h a t are t r a c k e d a s a t t r i b u t e s of t h e f i n i t e - e l e m e n t da t a .
~
MEMBER DATA
FINITE DETAIL
TYPICAL RESIZE SIZING MODULE
F W l E ELEMENT
OVERALL FINITE AVERAGE w STRESS -
ANALYSIS RamJE Ra(m5
i MARGINS OF SAFETY
f TlON TO CONTROL SIZING P R X E S S
IN AN INTERACTIVE GRAPHIC MODE AT A 5080 SCOPE
1 9
20
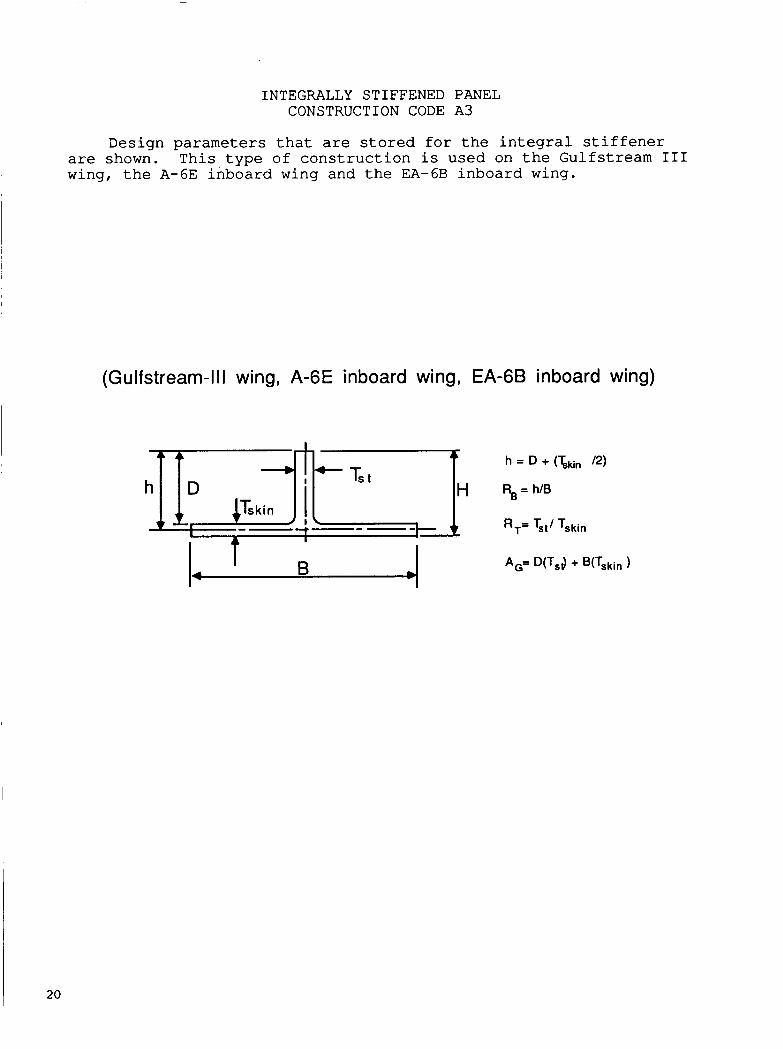
INTEGRALLY STIFFENED PANEL CONSTRUCTION CODE A3
Design parameters that are stored for the integral stiffener are shown. This type of construction is used on the Gulfstream I11 wing, the A-6E inboard wing and the EA-6B inboard wing.
(Gulfstream-Ill wing, A-6E inboard wing, EA-6B inboard wing)

Z-STIFFENED SHEET CONSTRUCTION CODE A4
Detail parameters that are stored for the 2-stiffened sheet are shown. wings.
This type of construction is used on the E-2C and C-2A
(E-2C and C-2A wing) BFL
I
7 I \ I
HU
21

Y-STIFFENED PANEL
Detail parameters that are stored for the Y-stiffened panel are This type of construction is used on upper cover of the shown.
F-14 wing outer panel.
(F-14 wing outer panel - upper cover)
22
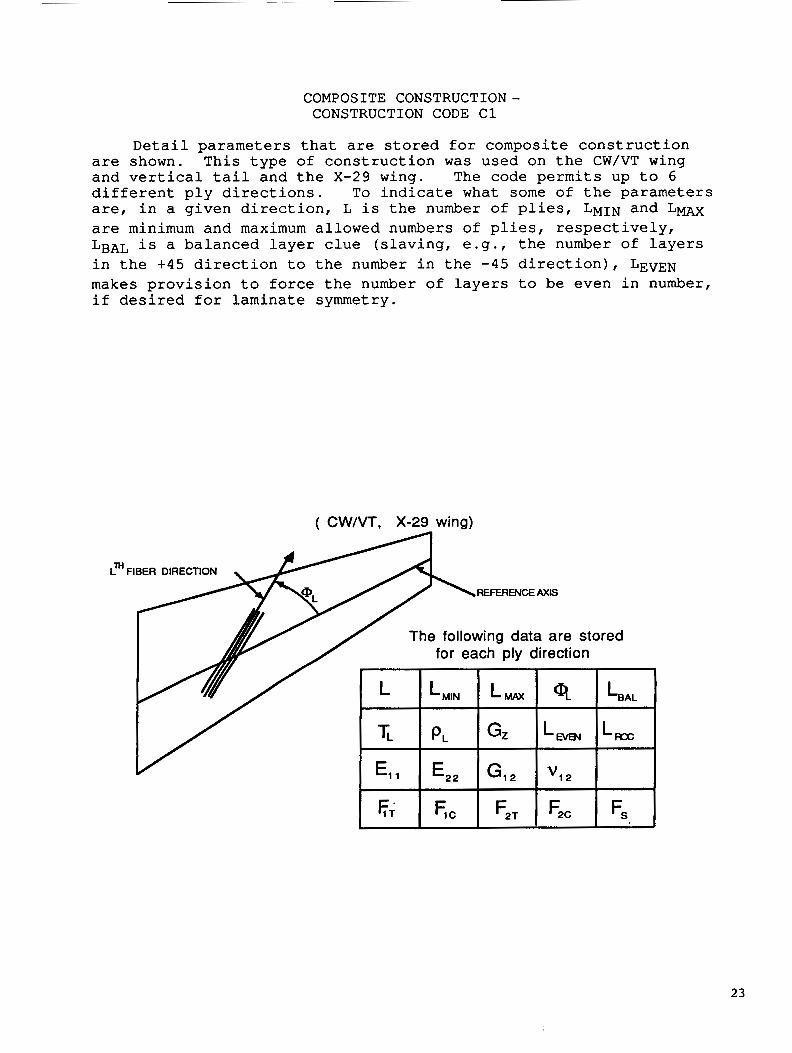
COMPOSITE CONSTRUCTION- CONSTRUCTION CODE C 1
Deta i l p a r a m e t e r s t h a t are s t o r e d f o r composi te c o n s t r u c t i o n T h i s t y p e of c o n s t r u c t i o n w a s u sed on t h e CW/VT wing are shown.
and ver t ica l t a i l and t h e X-29 wing. d i f f e r e n t p l y d i r e c t i o n s . T o i n d i c a t e what some of t h e parameters are, i n a g i v e n d i r e c t i o n , L i s t h e number of pl ies , LMIN a n d Lmx are minimum and maximum allowed numbers o f p l i e s , r e s p e c t i v e l y , LBAL i s a b a l a n c e d l a y e r c l u e ( s l a v i n g , e . g . , t h e number of l a y e r s i n t he + 4 5 d i r e c t i o n t o t h e number i n t h e - 4 5 d i r e c t i o n ) , LEVEN makes p r o v i s i o n t o f o r c e t h e number of l a y e r s t o be even i n number, i f desired f o r l a m i n a t e symmetry.
The code permits up t o 6
( CWNT, X-29 wing)
23
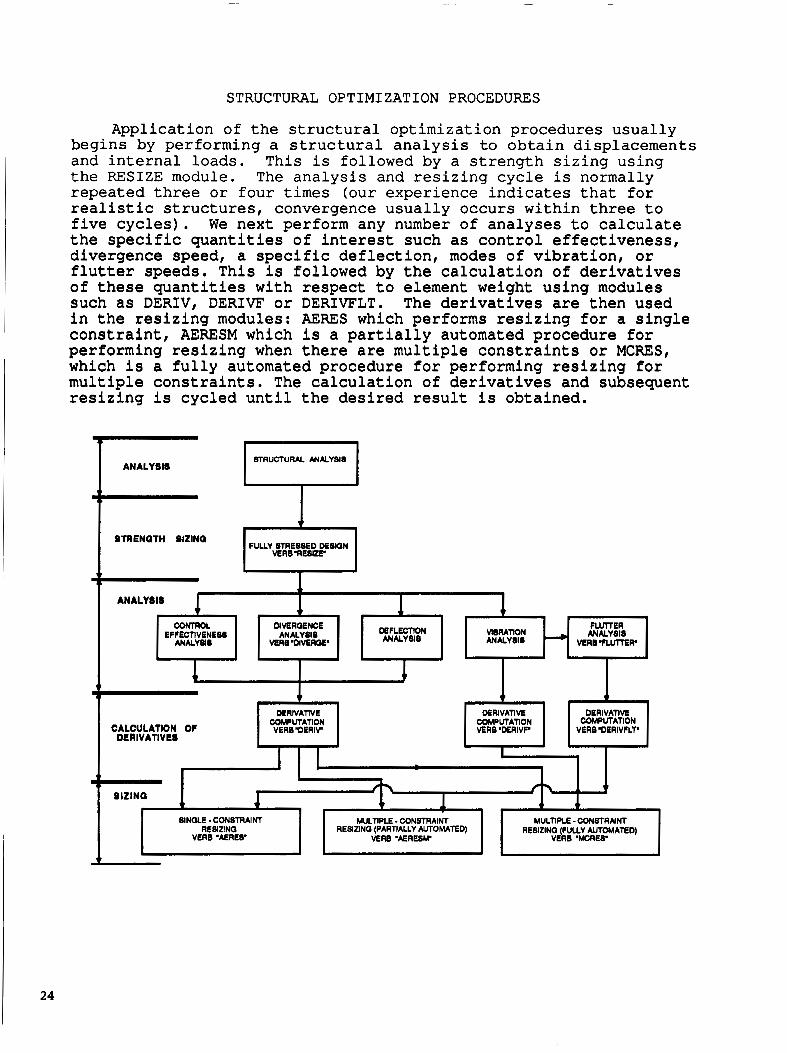
STRUCTURAL OPTIMIZATION PROCEDURES
24
Application of the structural optimization procedures usually begins by performing a structural analysis to obtain displacements and internal loads. This is followed by a strength sizing using the RESIZE module. The analysis and resizing cycle is normally repeated three or four times (our experience indicates that for realistic structures, convergence usually occurs within three to five cycles). We next perform any number of analyses to calculate the specific quantities of interest such as control effectiveness, divergence speed, a specific deflection, modes of vibration, or flutter speeds. This is followed by the calculation of derivatives of these quantities with respect to element weight using modules such as DERIV, DERIVE' or DERIVFLT. The derivatives are then used in the resizing modules: AERES which performs resizing for a single constraint, AERESM which is a partially automated procedure for performing resizing when there are multiple constraints or MCRES, which is a fully automated procedure for performing resizing for multiple constraints. The calculation of derivatives and subsequent resizing is cycled until the desired result is obtained.
T ANALYSIS
I
I FULLY STRESSED D E W N VERB'RELUZF I STRENOTH SlZlNO I
ANALYSIS 1'1
CALCULATION OF DERIVATIVES
1 DERIVATIVE 1 COMPUTATION I
VERB "DERIV
DERIVATIVE COMPUTATION
VERB 'DERIVFLT' COMPUTATION VERB 'DERIVP
I
SIZINO w SINOLE -CONSTRAINT MULTIPLE - CONSTRAINT MuLnPLE - CONBTRA~M
RELUDNQ RESIZINQ (PARTIALLY AUTOMATED) RESlZlNQ (FULLY AUTOMATED) VERB 'MCRES' VERB 'MREB' VERB 'KRESM'
THE X-29 FORWARD-SWEPT-WING DEMONSTRATOR AIRCRAFT
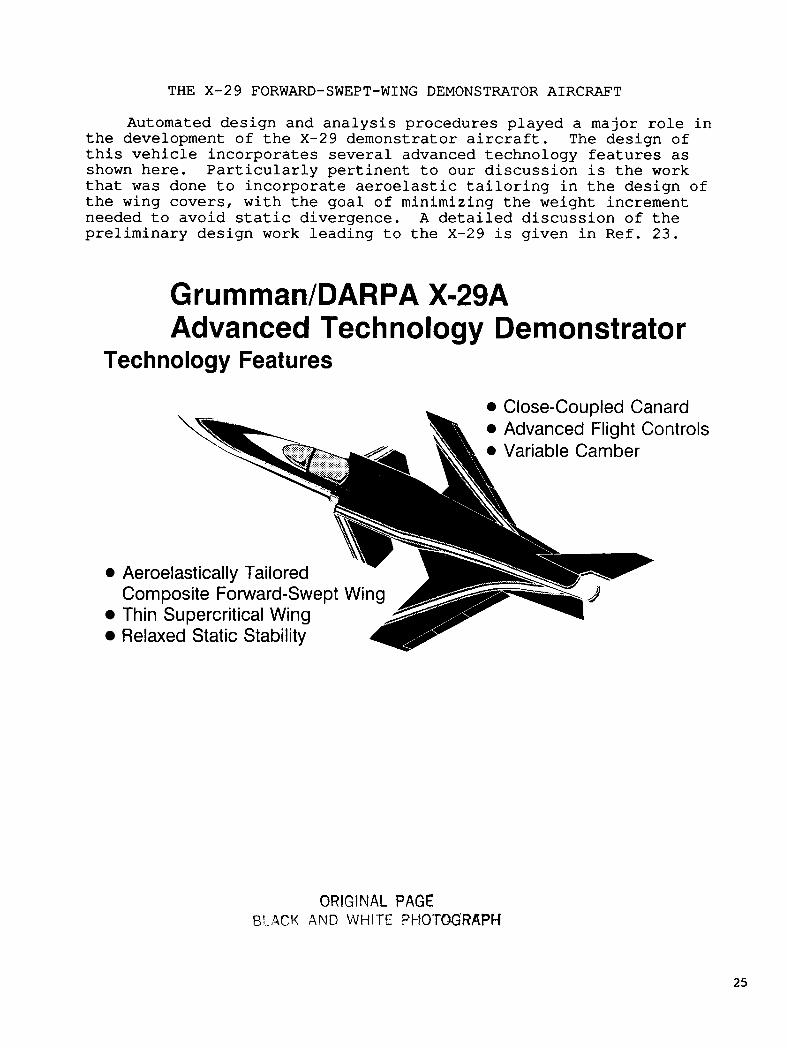
Automated design and analysis procedures played a major role in the development of the X-29 demonstrator aircraft. The design of this vehicle incorporates several advanced technology features as shown here. Particularly pertinent to our discussion is the work that was done to incorporate aeroelastic tailoring in the design of the wing covers, with the goal of minimizing the weight increment needed to avoid static divergence. A detailed discussion of the preliminary design work leading to the X-29 is given in Ref. 23.
G ru m man/DARPA X-29A Advanced Technology Demonstrator
Technology Features
- 0 Close-Couded Canard \
0 Aeroelastically Tailored
Thin Supercritical Wing Composite Forward-Swept Wing 1
Relaxed Static Stability 1
i n t rols
ORIGINAL PAGE Bi .9CK AND WHITE PHOTOC'RAPH
25

FORWARD-SWEPT WING FEASIBILITY STUDY
26
Our initial efforts in the design of a forward-swept wing were in a feasibility study we performed for DARPA in 1977. The study examined a relatively high-aspect-ratio wing having variable sweep. A goal was to investigate various configurations of composite cover skins with the objective of minimizing the weight increment required to avoid static divergence. Both beam and coarse-grid, finite-element models were employed to study various materials and laminate configurations with regard to their effect on divergence and flutter characteristics and to identify the weight increments required to avoid divergence. As an example of one part of the study, it was desired to evaluate the benefits of induced bend/twist coupling caused by kicking the spanwise fiber direction forward of the nominal structural axis. Four kick angles were examined with the use of our optimization procedures. Some results are shown in the sketch shown here. We see normalized weight variations for the wing model as obtained for strength-based designs, via fully stressed design, in the lower curve. The upper curve shows the effect on weight when each of the strength designs is stiffened to meet a critical divergence-speed requirement. It may be noted that the optimum kick angle is about 10 degrees.
Examined feasibility of a variable sweep wing that used advanced composites to minimize weight increment to avoid static divergence
Used beam and finite-element models and optimization methods to:
- Assess behavior of various materials & ply configurations for covers - Provide estimates of divergence & flutter behavior - Estimate weight increments for divergence prevention
TO MEET DIVERGENCE REQTS
KICKANGLE - 10 DEG
AVOIDANCE
FINITE ELEMENT WGT/ STRENGTH DESIGN WGT '.' AT ZERO KICK ANGLE
0 4 8 1 2 16 SPANWISE FIBER KICK ANGLE, DEG

X - 2 9 PRELIMINARY AND FINAL D E S I G N
I n a l a t e r "Forward Swept Wing Demons t r a to r Technology I n t e g r a t i o n a n d E v a l u a t i o n S t u d y , " conduc ted by Grumman f o r DARPA and t h e U.S. A i r F o r c e , w e t r a n s i t i o n e d o u r d e s i g n c o n c e p t s t o a f ixed -wing c o n f i g u r a t i o n and u t i l i z e d s t r u c t u r a l o p t i m i z a t i o n t e c h n o l o g y i n what was t o become a p r e l i m i n a r y d e s i g n e f f o r t f o r t h e X - 2 9 . W e a d o p t e d a wing c o v e r a r rangement t h a t u s e s 0/90/f45 d e g r e e g r a p h i t e - e p o x y l a m i n a t e s which are r o t a t e d a b o u t 9 degrees f o r w a r d of t h e nominal s t r u c t u r a l a x i s . T h i s mater ia l a r r angemen t o f f e r s favorable b e n d / t w i s t c o u p l i n g w h i l e m a i n t a i n i n g high bend ing s t i f f n e s s a n d l i n e a r s t r e s s / s t r a i n b e h a v i o r . The 9-degree r o t a t i o n a n g l e comes a b o u t from o u r f i n d i n g s i n t h e f e a s i b i l i t y s t u d y and t h e added b e n e f i t t h a t f i b e r c o n t i n u i t y i s preserved a c r o s s t h e a i r p l a n e c e n t e r l i n e . W e a g a i n used o u r f u l l y stressed d e s i g n and d i v e r g e n c e o p t i m i z a t i o n t o o l s t o s i z e t h e wing c o v e r s and s u b s t r u c t u r e . Gages t h a t were i d e n t i f i e d a s b e i n g gove rned by d i v e r g e n c e r e q u i r e m e n t s were m a i n t a i n e d as minimums i n t h e s u b s e q u e n t f i n a l d e s i g n e f f o r t .
Preliminary Design Transi tioned to fixed wing conf ip uration utilizing g rap hite/epoxy cover skins of 0/90& 45 deg plies. Laminates were balanced in f 45 deg directions and were rotated approximately 9 deg forward to - produce favorable bend/twist coupling - maintain high bending stiffness - provide linear stresdstrain behavior to limit load - preserve fiber continuity accross airplane centerline
Employed full stressed design and automated optimization to size wing for CY ivergence speed requirements
Final Design Increased model complexity and expanded number and type of design loading conditions. Used fully stressed design while maintaining as minimums the numbers of plies identified in the preliminary design as required for divergence avoidance
27

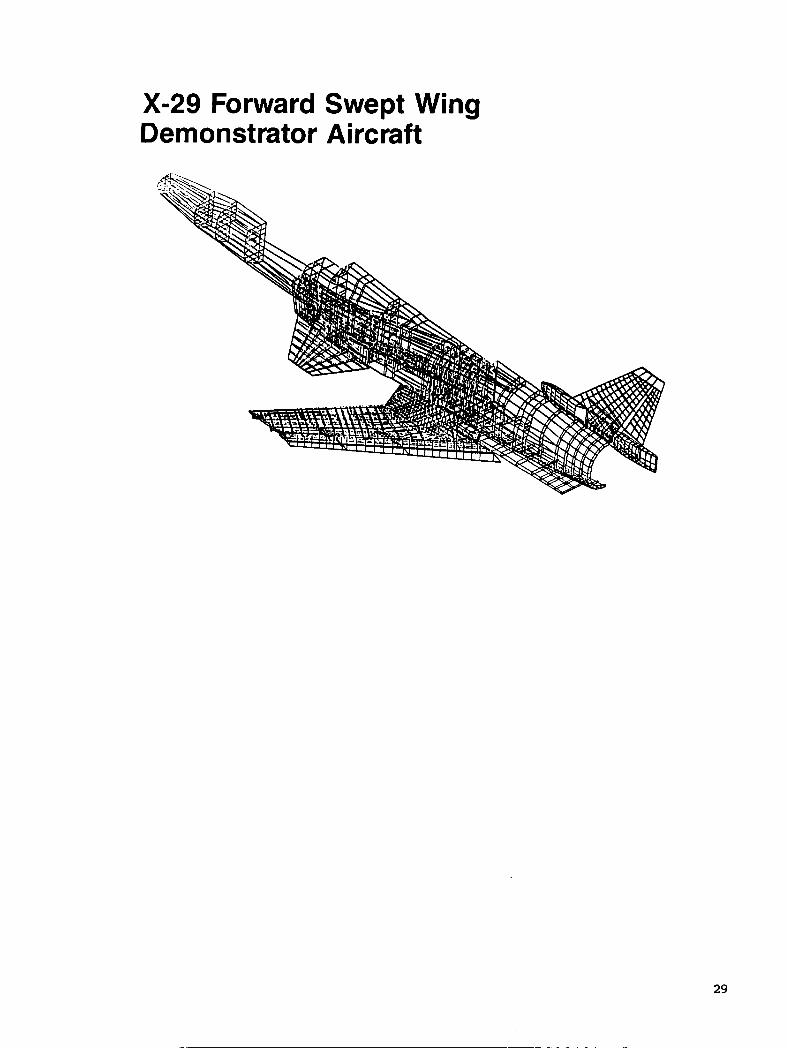
PRELIMINARY DESIGN DEMONSTRATOR WING AND FINAL X - 2 9 FINITE-ELEMENT MODEL
Here we have a planform of the wing model used in the technology evaluation and preliminary design work. This is followed by an isometric view of the final half-aircraft, finite-element model of the X - 2 9 .
Fr
29.27
'ont Be
Vertical Shear Suppi
1
-c 45"
loL Layer Directions
Leading Edge Sweep = -29.3" Aspect Ratio = 4.0 & 40% Chord Semis pan = 163 in.
Ref Line tlc = 0.05
X-29 Forward Swept Wing Demonstrator Aircraft
29

FINITE-ELEMENT MODEL OF CW/VT WING
The CW/VT wing is a multispar configuration having graphite-epoxy covers and metallic substructure. It is attached to the fuselage at 8 points. Movable surfaces consist of a leading- edge flap and inboard and outboard elevons. The covers are modeled as anisotropic membrane panels; ribs and spars are represented by bars and shear panels. members, 3400 degrees of freedom and approximately 6000 design variables (which account for the individual ply directions in the covers).
The total model contains about 3100
The structure was analyzed and sized to meet strength requirements for 102 flight design conditions. For the covers, strength requirements were based on maximum allowed fiber strains and panel buckling avoidance. requirements also played a major role in the design of this relatively thin wing. These requirements involved both pitch and roll, as well as ratios of pitch moment to hinge moment and roll moment to hinge moment, at Mach 0.9 and 1.2. The design was checked for flutter and leading-edge flap divergence, neither of which had any significant impact on the final design.
Control-surface effectiveness
30
& A Outboard Elevon
-2
t -x Leading Edge Flap
-Y Indicates store pickup point Indicates fuselage attachment point
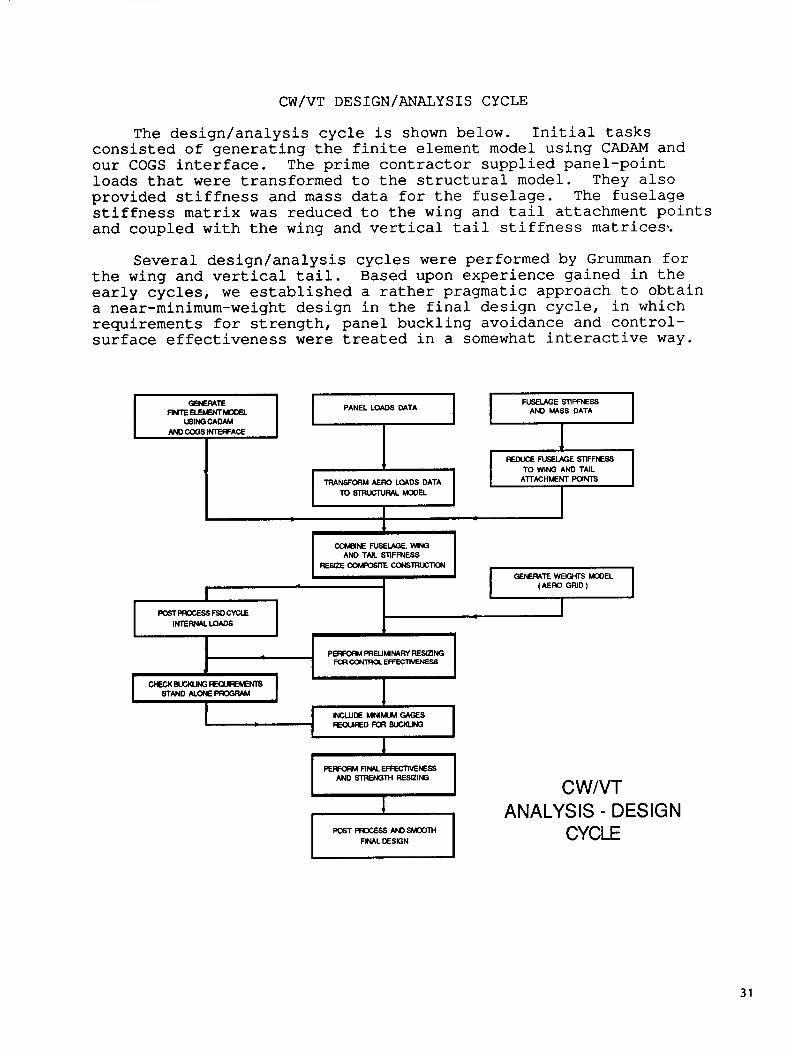
CW/VT DESIGN/ANALYSIS CYCLE
PANEL LOADS DATA DEFLRATE mELEENrMDc€L
USING CADAM
The design/analysis cycle is shown below. Initial tasks consisted of generating the finite element model using CADAM and our COGS interface. The prime contractor supplied panel-point loads that were transformed to the structural model. They also provided stiffness and mass data for the fuselage. The fuselage stiffness matrix was reduced to the wing and tail attachment points and coupled with the wing and vertical tail stiffness matrices..
FUSEIAGE S l l F M S S AND UASS DATA
Several design/analysis cycles were performed by Grumman for the wing and vertical tail. Based upon experience gained in the early cycles, we established a rather pragmatic approach to obtain a near-minimum-weight design in the final design cycle, in which requirements for strength, panel buckling avoidance and control- surface effectiveness were treated in a somewhat interactive way.
A N D c o O s ~ A c E 1 FUWCE NSELAGE STIFFNSS
I
?
CWIVT ANALYSIS - DESIGN
CYCLE
t
TRANSFORM AERO LOADS DATA TosTRucNR4Lmu
TO WING AND TAIL ATTACHMENT POINTS
I
31
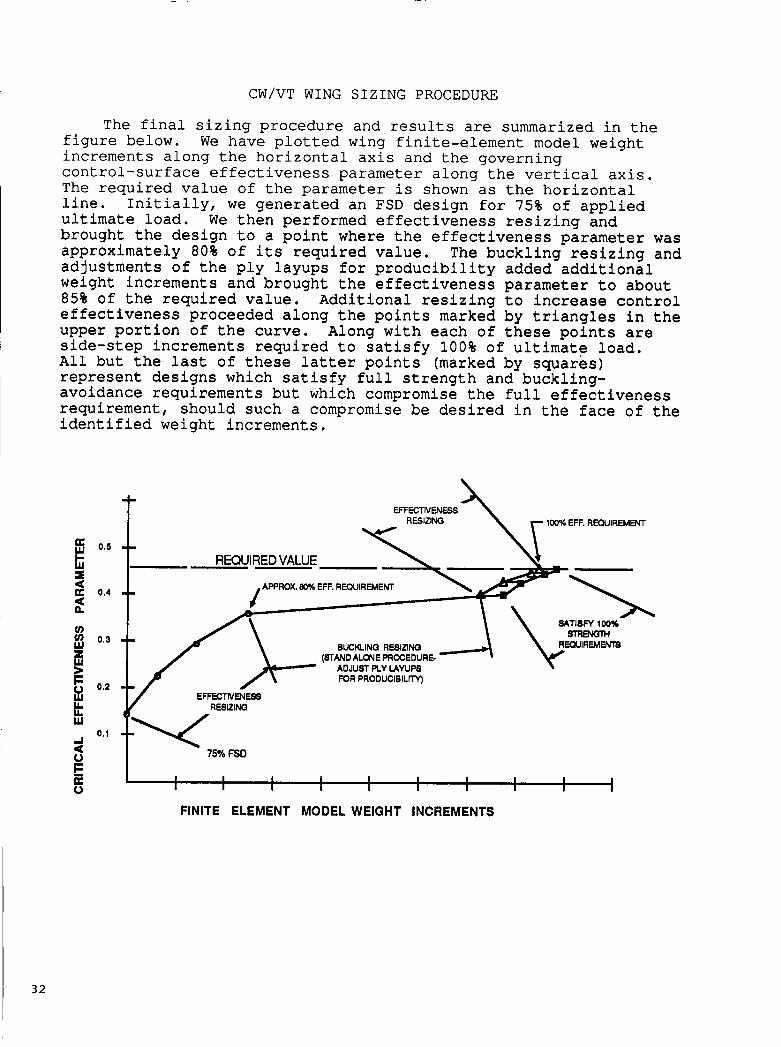
CW/VT WING SIZING PROCEDURE
The final sizing procedure and results are summarized in the figure below. increments along the horizontal axis and the governing control-surface effectiveness parameter along the vertical axis. The required value of the parameter is shown as the horizontal line. Initially, we generated an FSD design for 75% of applied ultimate load. We then performed effectiveness resizing and brought the design to a point where the effectiveness parameter was approximately 80% of its required value. The buckling resizing and adjustments of the ply layups for producibility added additional weight increments and brought the effectiveness parameter to about 85% of the required value. Additional resizing to increase control effectiveness proceeded along the points marked by triangles in the upper portion of the curve. side-step increments required to satisfy 100% of ultimate load. All but the last of these latter points (marked by squares) represent designs which satisfy full strength and buckling- avoidance requirements but which compromise the full effectiveness requirement, should such a compromise be desired in the face of the identified weight increments.
We have plotted wing finite-element model weight
Along with each of these points are
t 7 lM%FFF RFOLIIRFMFNT EFFECTIVENESS
RESIZING
BUCKLINQ RESIZING (STANDALONE PROCEDURE.
ADJUST PLY LAYUPB FOR PRODUCIBILITY)
/\ \ SATISM 100%
RESlZlNG
75% FSD
I I
I I
I I
I I
I I 1 I
I I I I I I I
FINITE ELEMENT MODEL WEIGHT INCREMENTS
32
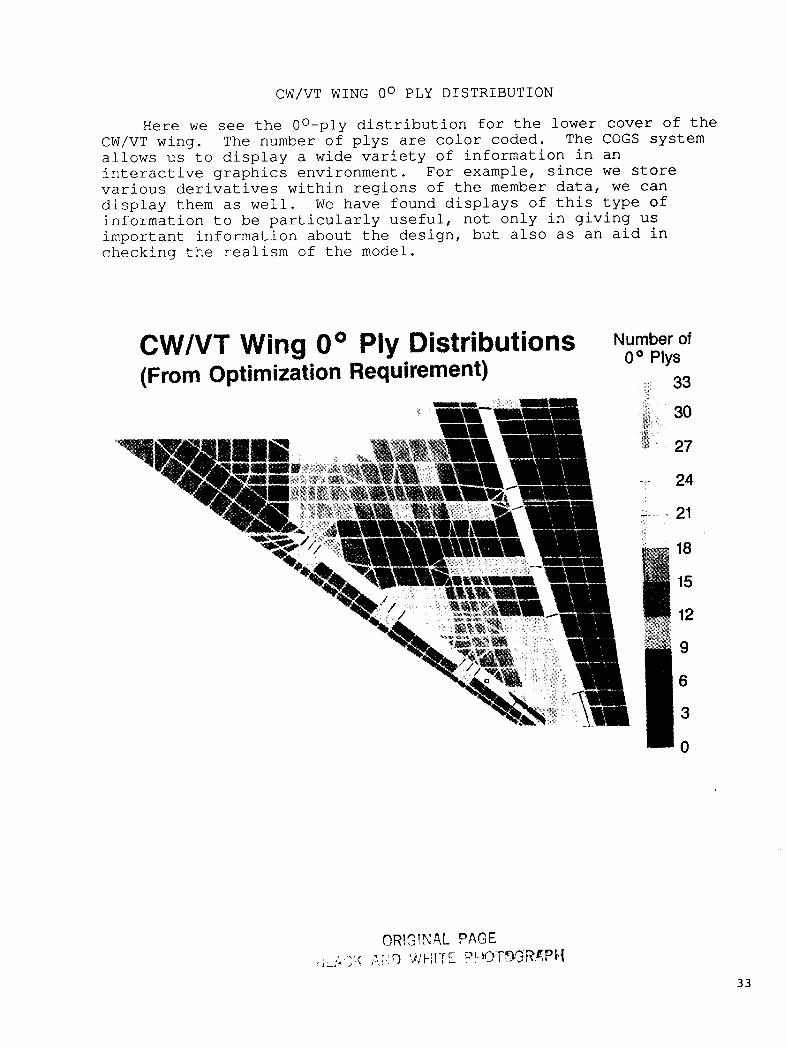
CW/VT WING O o PLY DISTRIBUTION
Here we see the Oo-ply distribution for the lower cover of the CW/VT wing. The number of plys are color coded. The COGS system allows us to display a wide variety of information in an interactive graphics environment. For example, since we store various derivatives within regions of the member data, we can display them as well. We have found displays of this type of information to be particularly useful, not only in giving us important information about the design, but also as an aid in checking the realism of the model.
CW/VT Wing 0' Ply Distributions (From Optimization Requirement)
Number of
33
30
27
24
21
18
15
12
9
6
3
oo Plys
n
3 3
CONCLUSIONS
Integrated structural analysis and design systems and structural optimization procedures being used in a production environment. Successful use of these systems requires experienced personnel. Interactive computer graphics can and will play a significant role in the analysis/optimization/design/manufacturing area. Today, we talk about collocating a team of people that include analysts, designers and manufacturing engineers on a given project so that they can interact via a common system. Practical structural optimization procedures are tools that must be made available to the team.
Much work still needs to be done to tie finite-element modeling to actual design details which are being tracked on systems such as CADAM or CATIA.
More work needs to be done to automate the detailed design and analysis process -- more emphasis should be placed on the real design problems.
CONCLUSIONS
Integrated structural design and analysis systems, and structural optimization procedures are being used in the production environment.
Successful use of these systems requires experienced personnel.
More work needs to be done in developing data base systems that will track structural detail and permit better means for controlling the finite-element model idealization.
(Example: Tie CADAM -- structural modeler -- analysis -- structural design)
More work needs to be done to automate the detailed design and analysis process. (Example: Incorporate panel buckling and internal load redistribution due to post buckling)
34
REFERENCES
1.
2 .
3.
4.
5.
6.
7 .
8 .
9.
Wehle, L . B . and L a n s i n g , W . , "A Method f o r Reducing t h e A n a l y s i s o f Complex S t r u c t u r e s t o a Rou t ine P rocedure , " i k u m m A e r o n a u t i c a l S c i e n c e s , O c t . 1952.
Dwyer, W . , Rosenbaum, J . , Shul.man, M . , and Pardo, H . , " F u l l y S t r e s s e d Des ign o f A i r f r ame Redundant S t r u c t u r e s , " p r o c e e d i n g s o f t h e Second Confe rence on M a t r i x Methods i n S t r u c t u r a l Mechanics , A i r F o r c e F l i g h t Dynamics L a b o r a t o r y AFFDL-TR-68-150, D e c . 1969.
Lans ing , W . , Dwyer, W . , Emerton, R . , and R a n a l l i , E . , " A p p l i c a t i o n o f F u l l y Stressed Design P rocedures t o Wing and Empennage S t r u c t u r e s , 'I Journa l o f A i r c r a f t , Vol. 9, N o . 9, S e p t . 1971, pp 683-688.
Wennagel, G . , Mason, P . , and Rosenbaum, J . , "IDEAS, I n t e g r a t e d Design and A n a l y s i s System," S o c i e t y o f Automotive Eng inee r s , Paper N o . 680728, O c t . 1968.
Lansing, W . , "The Role of Design A n a l y s i s Systems f o r Aerospace S t r u c t u r e s and F u t u r e Trends , " Keynote Address - T h i r d Conference on Mat r ix Methods i n S t r u c t u r a l Mechanics, O c t . 1971, p u b l i s h e d i n AFFDL-TR-71-160, Dec. 1973.
Lans ing , W . , Mason, P . , Dwyer, W . , and Cooper, J . C . , " A p p l i c a t i o n of a Design A n a l y s i s System t o a Space S h u t t l e P r e l i m i n a r y Des ign , " 2nd Symposium on S t r u c t u r a l O p t i m i z a t i o n , AGARD Conference P roceed ings No. 123, A p r i l 1973.
Mason, P . , "Design Exper i ence With an I n t e g r a t e d Design A n a l y s i s System," i n v i t e d p a n e l i s t , opening s e s s i o n p r e s e n t a t i o n a t t h e 1 4 t h SDM ( S t r u c t u r e s , Dynamics, Materials) Confe rence , Wi l l i amsburg , V i r g i n i a , 1973.
Wennagel, G . J . , Losh ig ian , H . H . , and Rosenbaum, J., "RAVES - Rapid Aerospace Vehicle E v a l u a t i o n S y s t e m , " ASME Winter Conference , Houston, Texas, Nov.-Dec. 1975.
Dwyer, W . , Emerton, R . K . , and Oja lvo , I . U . , "An Automated Procedure f o r t h e O p t i m i z a t i o n of Pract ical Aerospace S t r u c t u r e s , " AFFDL-TR-70-118, V o l s . I and 11, A p r i l 1971.
1 0 . Dwyer, W . , " F i n i t e Element Modeling and O p t i m i z a t i o n of
11. Dwyer, W.,"An Improved Automated O p t i m i z a t i o n Program,"
Aerospace S t r u c t u r e s , " AFFDL-TR-72-59, Aug. 1972.
AFFDL-TR-74-96, Sept. 1974.
1 2 . Wi lk inson , K . , e t a l , "An Automated P rocedure f o r F l u t t e r and S t r e n g t h A n a l y s i s and Op t imiza t ion of Aerospace V e h i c l e s , " Vol . I - Theory, V o l I1 - Programer User's Manual, AFFDL-TR-75-137, Dec. 1975.
35
13. Wilkinson, K . , Le rne r , E . , and T a y l o r R . F . , " P r a c t i c a l Design o f Minimum-Weight A i rc ra f t S t r u c t u r e s f o r S t r e n g t h and F l u t t e r Requirements , Journal of A i r c r a f t , Vol. 13, N o . 8, Aug. 1976, pp. 614-624. A l s o p r e s e n t e d as Paper 74-986 a t t h e AIAA 6 t h A i r c r a f t Design, F l i g h t T e s t and O p e r a t i o n s Meeting, Los Angeles , C a l i f . , August 1974.
1 4 . I s akson , G . and Pardo, H . , "ASOP-3: A Program f o r t h e Minimum- Weight Design o f S t r u c t u r e s S u b j e c t t o S t r e n g t h and D e f l e c t i o n C o n s t r a i n t s , 'I AFFDL-TR-76-157, D e c . 1976.
15. Wilkinson, K . , Markowitz, J. , Le rne r , E . , George, D . , and B a t i l l , S.M., "FASTOP: A F l u t t e r and S t r e n g t h Op t imiza t ion Program f o r L i f t i n g - S u r f a c e S t r u c t u r e s , " Jou rna l o f Aircraft, Vol . 1 4 , N o . 6, June 1977, pp. 581-587. A l so p r e s e n t e d a t t h e AIAA/ASME/SAE 1 7 t h S t r u c t u r e s , S t r u c t u r a l Dynamics and Materials Conference , King o f P r u s s i a , Pa . , May 1976.
16. Lans ing , W . , Lerner , E . , and Tay lo r , R.F., "Applications of S t r u c t u r a l O p t i m i z a t i o n f o r S t r e n g t h and Aeroelast ic Design Requi rements , " AGARD Report N o . 664, S e p t . 1977. I n v i t e d paper p r e s e n t e d a t t h e 45 th S t r u c t u r e s and Materials P a n e l Meet ing, Voss, Norway, September 1977.
17 . Markowitz, J., and I sakson , G., "FASTOP-3: A S t r e n g t h , D e f l e c t i o n and F l u t t e r O p t i m i z a t i o n Program f o r Metallic and Composite S t r u c t u r e s , " Vol . I - Theory and A p p l i c a t i o n s , Vol. I1 - Programers U s e r ' s Manual, AFFDL-TR-78-50, May 1978.
18 . A u s t i n , F . , "A Rapid O p t i m i z a t i o n P rocedure f o r S t r u c t u r e s S u b j e c t e d t o M u l t i p l e C o n s t r a i n t s , " Paper N o . 77-374, AIAA/ASME/SAE 1 8 t h S t r u c t u r e s , S t r u c t u r a l Dynamics and Materials Conference , San Diego, C a l i f . , March 1977.
19. I s akson , G., Pardo , H. , Le rne r , E . , and Venkayya, V.B. , "ASOP-3: A Program f o r Optimum S t r u c t u r a l Design t o S a t i s f y
15, N o . 7, J u l y 1978, pp. 422-428. A l so p r e s e n t e d a s Paper 77-378 a t t h e AIAA/ASME/SAE 1 8 t h S t r u c t u r e s , S t r u c t u r a l Dynamics and Materials Conference, San Diego, C a l i f . , March 1977.
S t r e n g t h and D e f l e c t i o n C o n s t r a i n t s , " Journal o f A i r c r a f t , V O l .
20 . Mason, P . , Gregory, D . , Balderes, T . , and I a c c a r i n o , S . , "Towards a Rea l i s t i c S t r u c t u r a l Ana lys i s /Des ign System," Symposium on F u t u r e Trends i n Computer ized S t r u c t u r a l A n a l y s i s and S y n t h e s i s , O c t . 1978, Washington D . C . , sponso red by George Washington U n i v e r s i t y and NASA Langley Research C e n t e r .

2 1 . Lerner, E . , and Markowitz, J . , "An E f f i c i e n t S t r u c t u r a l Resizing Procedure f o r Meeting S t a t i c Aeroe las t ic Design Objec t ives ," Journal of Aircraft , V o l . 1 6 , N o . 2 , Feb. 1979 , pp. 65-71 . Also presented a s Paper 78-471 a t t h e AIAA/ASME 1 9 t h S t r u c t u r e s , S t r u c t u r a l Dynamics and Mater ia ls Conference. Bethesda, Md., Apri l 1 9 7 8 .
2 2 . Mason, P . , Balderes , T . , and A r m e n , H . , "The Appl ica t ion of Nonl inear A n a l y s i s Techniques t o Prac t ica l S t r u c t u r a l Design Problems,I1 Symposium on Advances and Trends i n S t r u c t u r a l and So l id Mechanics, O c t . 1982, Washington D . C . , sponsored by George Washington Universi ty and NASA Langley Research Center.
Techniques i n t h e P r e l i m i n a r y S t r u c t u r a l Design of a Forward-Swept Wing." Col lected papers of t h e Second I n t e r n a t i o n a l Symposium on Aeroelast ic i ty and S t r u c t u r a l Dynamics, Techn ica l Universi ty of Aachen, West Germany, A p r i l 1985, pp. 381-393.
23. Le rne r , E. , "The Application of P rac t i ca l Optimization
,
I 37

INTEGRATED DESIGN OPTIMIZATION RESEARCH AND DEVELOPMENT IN AN INDUSl'RIAL ENVIRONMENT
v. Kumar M. D. German
s. -J. Lee GE Research and Development
Schenechdy, New York
PRECEDING PAGE BLAKK NOT' FilMED
39
ABSTRACT
This paper presents an overview of a design optimization project that is in progress at the GE Research and Development Center for the past few years. The objective of this project is to develop a methodology and a software system for design automation and optimization of structural/mechanical components and systems. The effort focuses on research and development issues and also on optimization applications that can be related to real-life industrial design problems. The overall technical approach is based on integration of numerical optimization techniques, finite element methods, CAE and software engineering, and artificial intelligence/expert systems (AI/ES) concepts. The role of each of these engineering technologies in the development of a unified design methodology is illustrated below in Figure 1. A software system DESIGN- OPT has been developed for both size and shape optimization of structural components subjected to static as well as dynamic loadings. By integrating this software with an automatic mesh generator, a geometric modeler and an attribute specification computer code, a software module SHAPE-OFT has been developed for shape optimization. Details of these software packages together with their applications to some 2- and 3- dimensional design problems will be described later in this presentation.
In regard to the integration with AI/ES, a pilot ~ e r t system advisor has been developed to help an engineer use the optimization technology for complex design problems in an effective manner. Some remarks
Finally, several topics of future research, like process optimization and simultaneous product and process design, are introduced; and the role of multidisciplinary optimization, multilevel design and decomposition models is highlighted.
I are also made concerning experience with the use of optimization methods for practical design applications.
1
40
TECHNICAL APPROACH
0 INTEGRATION OF KEY ENGINEERING DISCIPLINES - ENGINEERING ANALYSIS
- NUMERICAL OPTIMIZATION
- CAE/SOFlWARE ENGINEERING
- AI/WPERT SYSTEMS
Figure 1
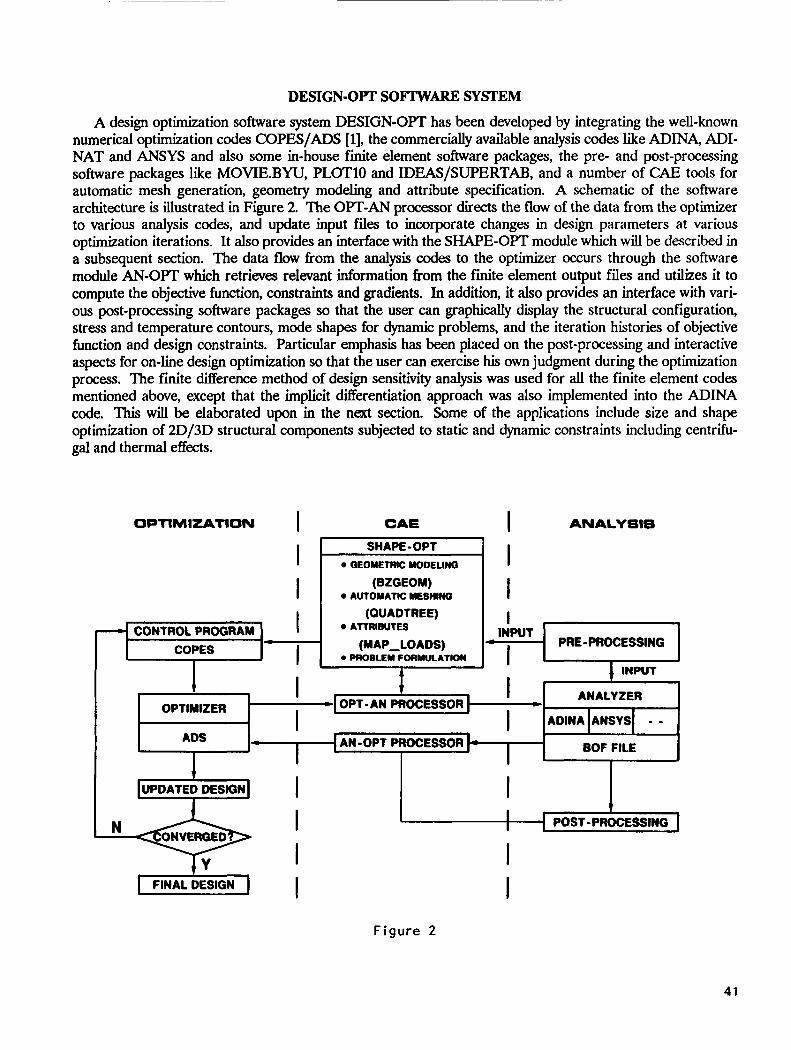
DESIGN-OW SOFTWARE SYSTEM
A design optimization software system DESIGN-OPT has been developed by integrating the well-known numerical optimization codes COPES/ADS [l], the commercially available analysis codes like ADINA, ADI- NAT and ANSYS and also some in-house finite element software packages, the pre- and post-processing software packages like MOVIE.BYU, PLOT10 and IDEAS/SUPERTAB, and a number of CAE tools for automatic mesh generation, geometry modeling and attribute specification. A schematic of the software architecture is illustrated in Figure 2. The OPT-AN processor directs the flow of the data from the optimizer to various analysis codes, and update input files to incorporate changes in design parameters at various optimization iterations. It also provides an interface with the SHAPE-OPT module which will be described in a subsequent section. The data flow from the analysis codes to the optimizer occurs through the software module AN-OPT which retrieves relevant information from the finite element output files and utilizes it to compute the objective function, constraints and gradients. In addition, it also provides an interface with vari- ous post-processing software packages so that the user can graphically display the structural configuration, stress and temperature contours, mode shapes for dynamic problems, and the iteration histories of objective function and design constraints. Particular emphasis has been placed on the post-processing and interactive aspects for on-line design optimization so that the user can exercise his own judgment during the optimization process. The finite dserence method of design sensitivity analysis was used for all the finite element codes mentioned above, except that the implicit differentiation approach was also implemented into the ADINA code. This will be elaborated upon in the next section. Some of the applications include size and shape optimization of 2D/3D structural components subjected to static and dynamic constraints including centrifu- gal and thermal effects.
OPTIMIZATION I CAE I ANALYSIS
I SHAPE-OPT I I C I I I GEOMETRIC MODELINQ I
I (BZGEOM)
(QUADTREE) I AUTOMATIC MESMWa
I ATTRIBUTES (MAP-LOADS) PRE-PROCESSING
* lNWT
* I *PROELEUFORMULATlOW I IN PUT
ANALYZER
BOF FILE I
1
I
1 FINALDESIGN 1 I I
Figure 2
41
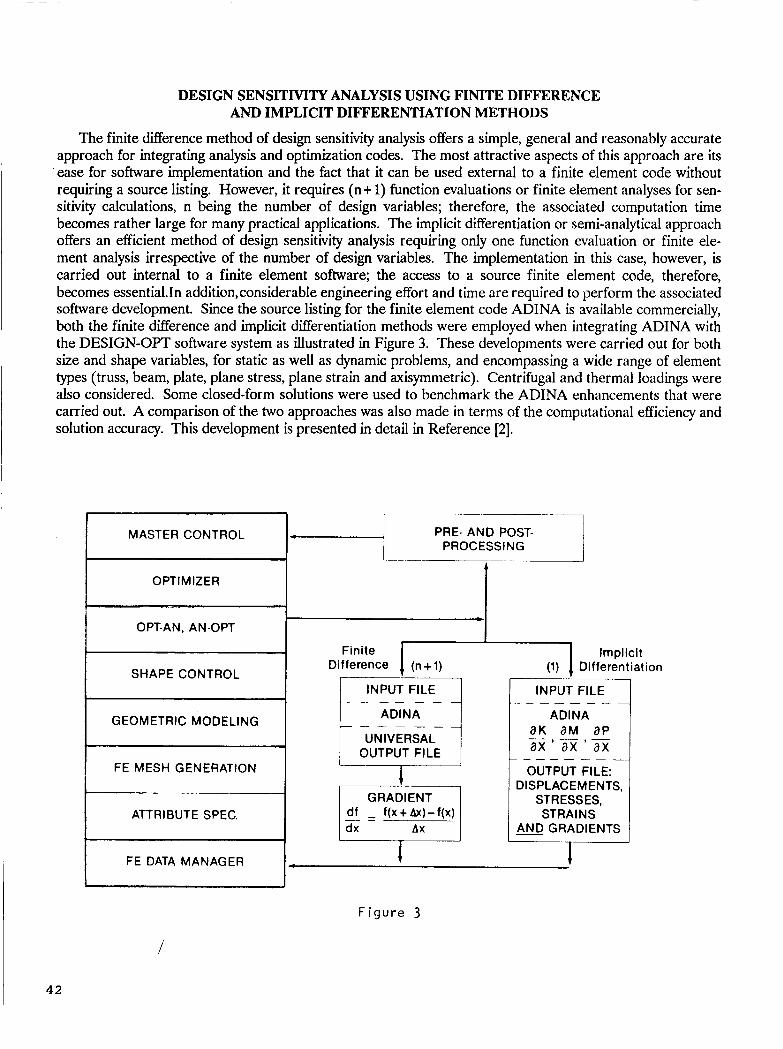
DESIGN SENSITIVITY ANALYSIS USING FINITE DIFFERENCE AND IMPLICIT DIFFERENTiATION METHODS
The finite difference method of design sensitivity analysis offers a simple, general and reasonably accurate approach for integrating analysis and optimization codes. The most attractive aspects of this approach are its
. ease for software implementation and the fact that it can be used external to a finite element code without requiring a source listing. However, it requires (n+ 1) function evaluations or finite element analyses for sen- sitivity calculations, n being the number of design variables; therefore, the associated computation time becomes rather large for many practical applications. The implicit differentiation or semi-analytical approach offers an efficient method of design sensitivity analysis requiring only one function evaluation or finite ele- ment analysis irrespective of the number of design variables. The implementation in this case, however, is carried out internal to a finite element software; the access to a source finite element code, therefore, becomes essential.In addition,considerable engineering effort and time are required to perform the associated software development. Since the source listing for the finite element code ADINA is available commercially, both the finite difference and implicit differentiation methods were employed when integrating ADINA with the DESIGN-OPT software system as illustrated in Figure 3. These developments were carried out for both size and shape variables, for static as well as dynamic problems, and encompassing a wide range of element types (truss, beam, plate, plane stress, plane strain and axisymmetric). Centrifugal and thermal loadings were also considered. Some closed-form solutions were used to benchmark the ADINA enhancements that were carried out. A comparison of the two approaches was also made in terms of the computational efficiency and solution accuracy. This development is presented in detail in Reference [2].
4 2
MASTER CONTROL
0 PTI M IZ E R . .
OPT-AN, AN-OPT I ~
SHAPE CONTROL
GEOMETRIC MODELING
FE MESH GENERATION
ATTRIBUTE SPEC.
FE DATA MANAGER - PRE- AND POST- PROCESSING
Finite Difference 1 (n+l)
Implicit
INPUT FILE
ADINA
UNIVERSAL OUTPUT FILE
GRADIENT
I
INPUT FILE
ADINA a K aM aP
- - - - - _ _ -
ax'ax'ax - - - - - - - -
OUTPUT FILE: DISPLACEMENTS,
STRESSES, STR A I N S
AND GRADIENTS
I
F i g u r e 3
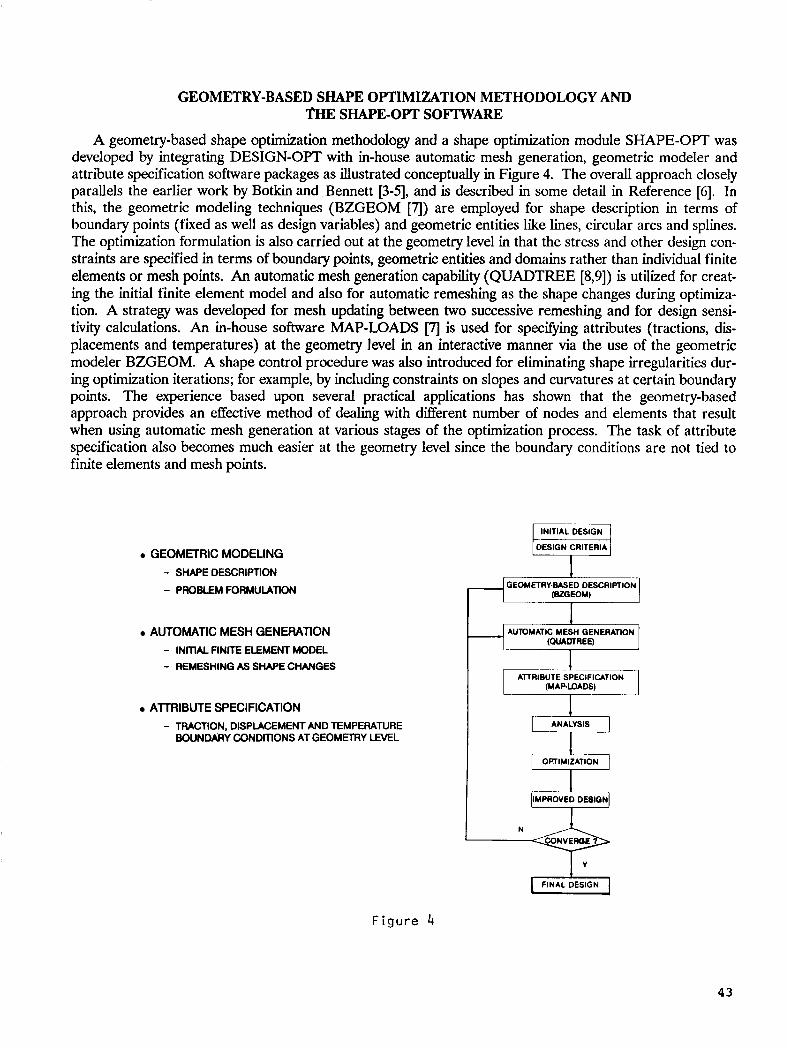
GEOMETRY-BASED SHAPE OPTIMIZATION METHODOLOGY AND THJI SHAPE-OPT SOFTWARE
A geometry-based shape optimization methodology and a shape optimization module SHAPE-OPT was developed by integrating DESIGN-OPT with in-house automatic mesh generation, geometric modeler and attribute specification software packages as illustrated conceptually in Figure 4. The overall approach closely parallels the earlier work by B o t h and Bennett [3-51, and is described in some detail in Reference [6]. In this, the geometric modeling techniques (BZGEOM [A) are employed for shape description in terms of boundary points (fixed as well as design variables) and geometric entities like lines, circular arcs and splines. The optimization formulation is also carried out at the geometry level in that the stress and other design con- straints are specified in terms of boundary points, geometric entities and domains rather than individual finite elements or mesh points. An automatic mesh generation capability (QUADTREE [8,9]) is utilized for creat- ing the initial finite element model and also for automatic remeshing as the shape changes during optimiza- tion. A strategy was developed for mesh updating between two successive remeshing and for design sensi- tivity calculations. An in-house software MAP-LOADS [7] is used for specifying attributes (tractions, dis- placements and temperatures) at the geometry level in an interactive manner via the use of the geometric modeler BZGEOM. A shape control procedure was also introduced for eliminating shape irregularities dur- ing optimization iterations; for example, by including constraints on slopes and curvatures at certain boundary points. The experience based upon several practical applications has shown that the geometry-based approach provides an effective method of dealing with different number of nodes and elements that result when using automatic mesh generation at various stages of the optimization process. The task of attribute specification also becomes much easier at the geometry level since the boundary conditions are not tied to finite elements and mesh points.
GEOMETRIC MODELING - SHAPE DESCRIPTION
- PROBLEM FORMULATION
AUTOMATIC MESH GENERATION - INITIAL FINITE ELEMENT MODEL - REMESHING AS SHAPE CHANGES
AllRIBUTE SPECIFICATION - TRACTION, DISPLACEMENT AND TEMPERATURE
BOUNDARY CONDITIONS AT GEOMElRY LEVEL
I I AUTOMATIC MESH GENERATION H (WADTREE) I
NVEROE 7 -+ I
FINAL DESIGN
Figure 4
43
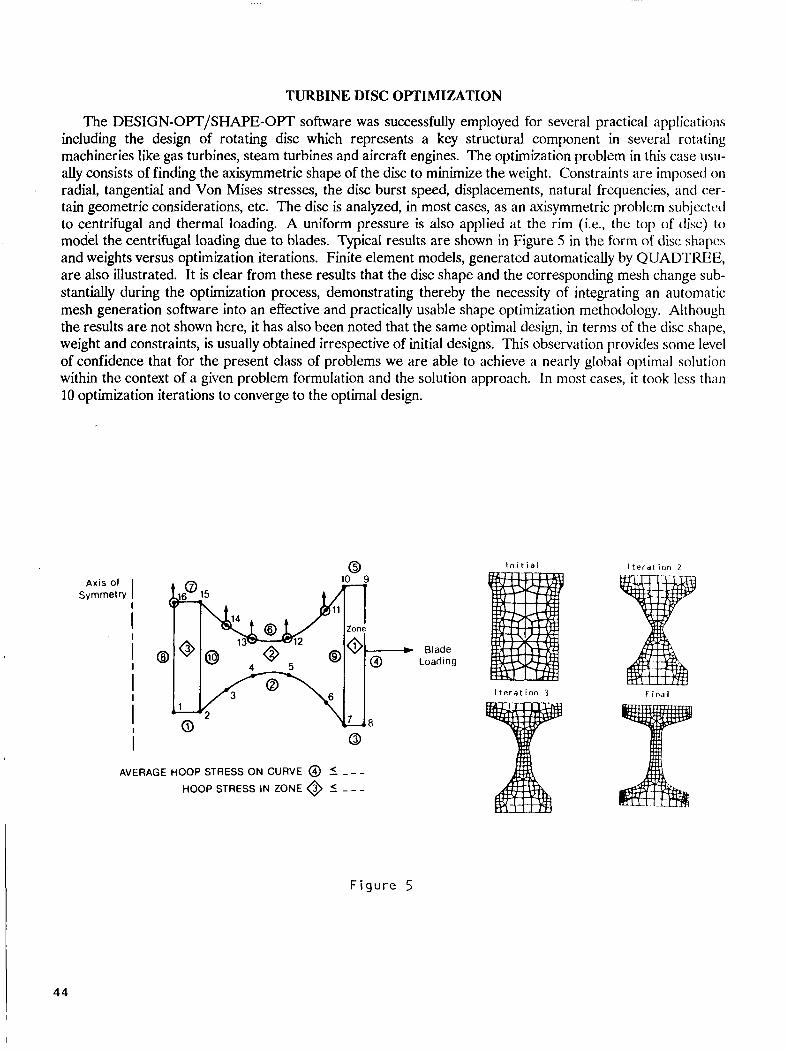
TURBINE DISC OPTIMIZATION
The DESIGN-OPT/SHAPE-OPT software was successfully employed for several practical applicatioiis including the design of rotating disc which represents a key structural component in several rotating machineries like gas turbines, steam turbines and aircraft engines. The optimization problem in this case usu- ally consists of finding the axisymmetric shape of the disc to minimize the weight. Constraints are imposed on radial, tangential and Von Mises stresses, the disc burst speed, displacements, natural frequencies, and cer- tain geometric considerations, etc. The disc is analyzed, in most cases, as an axisymmetric problem subjected to centrifugal and thermal loading. A uniform pressure is also applied at the rim (ie., the top of disc) t o model the centrifugal loading due to blades. Typical results are shown in Figure 5 in the form of disc shapes and weights versus optimization iterations. Finite element models, generated automatically by QUADTREE, are also illustrated. It is clear from these results that the disc shape and the corresponding mesh change sub- stantially during the optimization process, demonstrating thereby the necessity of integrating an automatic mesh generation software into an effective and practically usable shape optimization methodology. Although the results are not shown here, it has also been noted that the same optimal design, in terms of the disc shape, weight and constraints, is usually obtained irrespective of initial designs. This observation provides some level of confidence that for the present class of problems we are able to achieve a nearly global optimal solution within the context of a given problem formulation and the solution approach. In most cases, it took less than 10 optimization iterations to converge to the optimal design.
Axis of Symmetry
@
1
0
Blade Loading
AVERAGE HOOP STRESS ON CURVE @ I _ _ - HOOP STRESS IN ZONE @ 5 - - -
Initial
Iteration 3
Iteration 2
Final
Figure 5
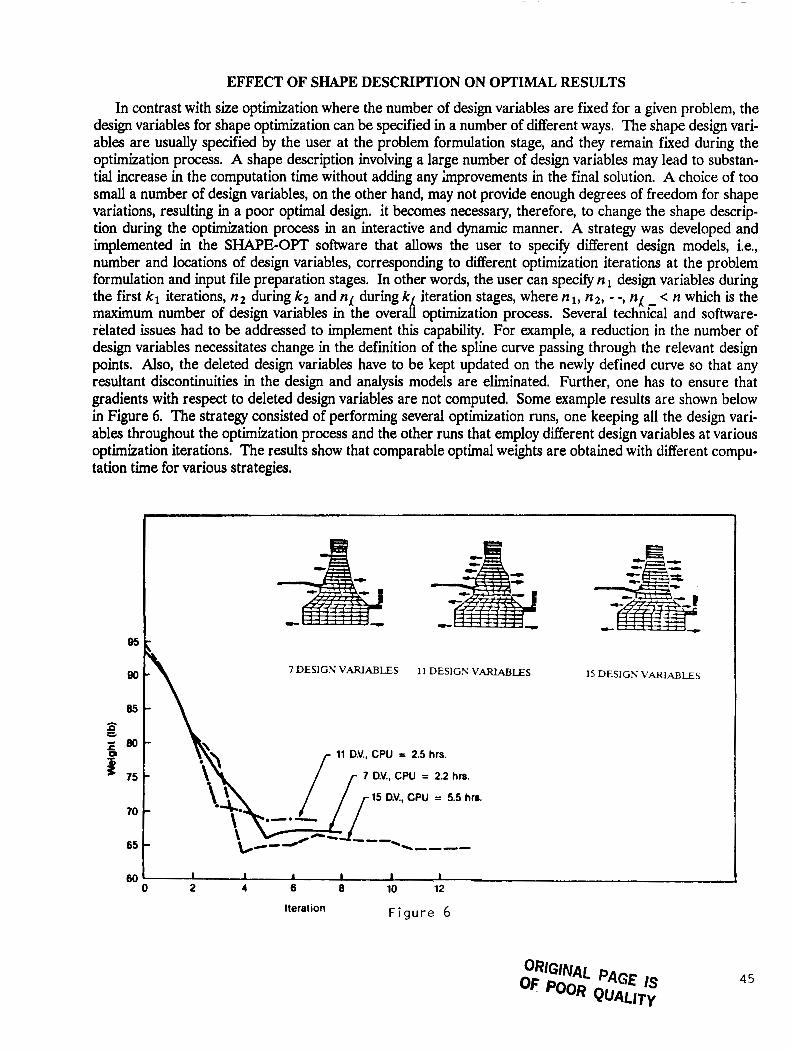
EFFECT OF SHAPE DESCRIPTION ON OPTIMAL RESULTS In contrast with size optimization where the number of design variables are fixed for a given problem, the
design variables for shape optimization can be specified in a number of different ways. The shape design vari- ables are usually specified by the user at the problem formulation stage, and they remain fixed during the optimization process. A shape description involving a large number of design variables may lead to substan- tial increase in the computation time without adding any hprovements in the final solution. A choice of too small a number of design variables, on the other hand, may not provide enough degrees of freedom for shape variations, resulting in a poor optimal design. it becomes necessary, therefore, to change the shape descrip- tion during the optimization process in an interactive and dynamic manner. A strategy was developed and implemented in the SHAPE-OPT software that allows the user to specify different design models, i.e., number and locations of design variables, corresponding to different optimization iterations at the problem formulation and input file preparation stages. In other words, the user can specify n design variables during the first kl iterations, n 2 during kz and ni during ki iteration stages, where nl, n2, - -, ni - < n which is the maximum number of design variables in the overall optimization process. Several technical and software- related issues had to be addressed to implement this capability. For example, a reduction in the number of design variables necessitates change in the definition of the spline curve passing through the relevant design points. Also, the deleted design variables have to be kept updated on the newly defined curve so that any resultant discontinuities in the design and analysis models are eliminated. Further, one has to ensure that gradients with respect to deleted design variables are not computed. Some example results are shown below in Figure 6. The strategy consisted of performing several optimization runs, one keeping all the design vari- ables throughout the optimization process and the other runs that employ different design variables at various optimization iterations. The results show that comparable optimal weights are obtained with different compu- tation time for various strategies.
80
85 =h 70
65
60
IS DESIGN VARIMLES 7 DESIGN VARIABLES 11 DESIGN VARLABLES
11 D.V., CPU = 2.5 hrs.
/ / r 1 5 D.V., CPU = 5.5 hrs.
7 D.V., CPU = 2.2 hrs.
0 2 4 6 8 10 12
Iteration Figure 6
45
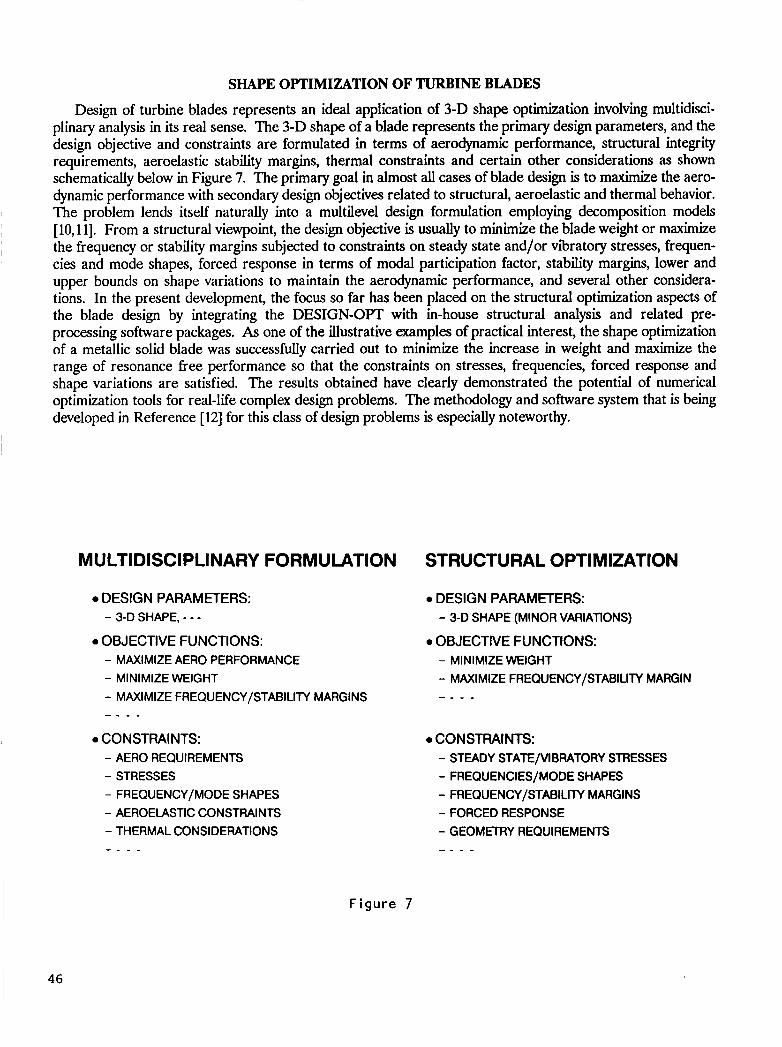
SHAPE OPTIMIZATION OF TURBINE BLADES Design of turbine blades represents an ideal application of 3-D shape optimization involving multidisci-
plinary analysis in its real sense. The 3-D shape of a blade represents the primary design parameters, and the design objective and constraints are formulated in terms of aerodynamic performance, structural integrity requirements, aeroelastic stability margins, thermal constraints and certain other considerations as shown schematically below in Figure 7. The primary goal in almost all cases of blade design is to maximize the aero- dynamic performance with secondary design objectives related to structural, aeroelastic and thermal behavior. The problem lends itself naturally into a multilevel design formulation employing decomposition models [ 10,111. From a structural viewpoint, the design objective is usually to minimize the blade weight or maximize the frequency or stability margins subjected to constraints on steady state and/or vibratory stresses, frequen- cies and mode shapes, forced response in terms of modal participation factor, stability margins, lower and upper bounds on shape variations to maintain the aerodynamic performance, and several other considera- tions. In the present development, the focus so far has been placed on the structural optimization aspects of the blade design by integrating the DESIGN-OPT with in-house structural analysis and related pre- processing software packages. As one of the illustrative examples of practical interest, the shape optimization of a metallic solid blade was successfully carried out to minimize the increase in weight and maximize the range of resonance free performance so that the constraints on stresses, frequencies, forced response and shape variations are satisfied. The results obtained have clearly demonstrated the potential of numerical optimization tools for real-life complex design problems. The methodology and software system that is being developed in Reference [12] for this class of design problems is especially noteworthy.
MULTIDISCIPLINARY FORMULATION
0 DESIGN PARAMETERS: - 3-0 SHAPE, - - -
0 OBJECTIVE FUNCTIONS: - MAXIMIZE AERO PERFORMANCE - MINIMIZE WEIGHT - MAXIMIZE FREQUENCY/STABILITY MARGINS - - - -
0 CONSTRAINTS: - AERO REQUIREMENTS - STRESSES - FREQUENCY/MODE SHAPES - AEROEIASTIC CONSTRAINTS - THERMAL CONSIDERATIONS - _ - -
STRUCTURAL OPTIMIZATION
0 DESIGN PARAMETERS: - 3-D SHAPE (MINOR VARIATIONS)
0 OBJECTIVE FUNCTIONS: - MINIMIZE WEIGHT - MAXIMIZE FREQUENCY/STABILIlY MARGIN - - - -
0 CONSTRAINTS: - STEADY STATE/VIBRATORY STRESSES - FREOUENCIES/MODE SHAPES - FREQUENCY/STABILITY MARGINS - FORCED RESPONSE - GEOMETRY REQUIREMENTS - - - -
Figure 7
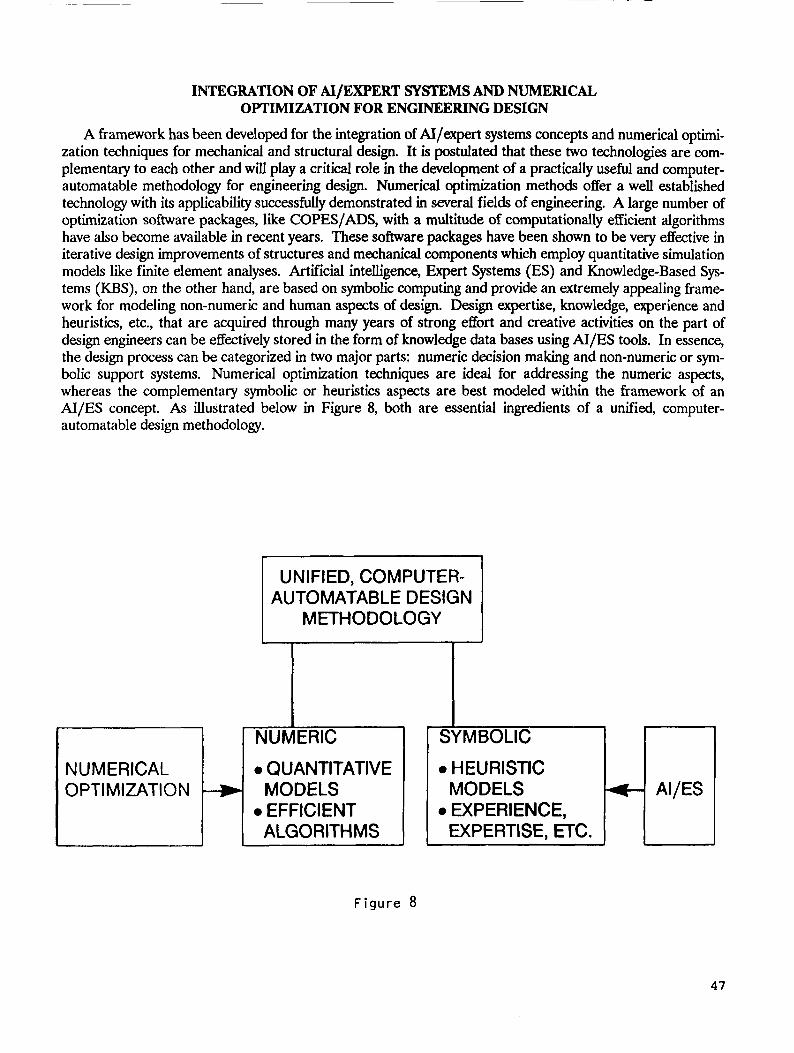
INTEGRATION OF AI/EXPERT SYSl'EMS AND NUMERICAL OPTIMIZATION FOR ENGINEERING DESIGN
A framework has been developed for the integration of AI/expert systems concepts and numerical optimi- zation techniques for mechanical and structural design. It is postulated that these two technologies are com- plementary to each other and will play a critical role in the development of a practically useful and computer- automatable methodology for engineering design. Numerical optimization methods offer a well established technology with its applicability successfully demonstrated in several fields of engineering. A large number of optimization software packages, like COPES/ADS, with a multitude of computationally efficient algorithms have also become available in recent years. These software packages have been shown to be very effective in iterative design improvements of structures and mechanical components which employ quantitative simulation models like finite element analyses. Artificial intelligence, Expert Systems (ES) and Knowledge-Based Sys- tems (KBS), on the other hand, are based on symbolic computing and provide an extremely appealing frame- work for modeling non-numeric and human aspects of design. Design expertise, knowledge, experience and heuristics, etc., that are acquired through many years of strong effort and creative activities on the part of design engineers can be effectively stored in the form of knowledge data bases using AI/ES tools. In essence, the design process can be categorized in two major parts: numeric decision making and non-numeric or sym- bolic support systems. Numerical optimization techniques are ideal for addressing the numeric aspects, whereas the complementary symbolic or heuristics aspects are best modeled within the framework of an AI/ES concept. As illustrated below in Figure 8, both are essential ingredients of a unified, computer- automatable design methodology.
UNIFIED, COMPUTER- AUTOMATABLE DESIGN
METHODOLOGY
NUMERICAL 0 QUANTITATIVE 0 PTI M lZATl0 N MODELS
0 EFFICIENT ALGORITHMS
I
SY MBOLlC
0 HEURISTIC MODELS
0 EXPERIENCE, EXPERTISE, ETC.
AI/ES 1- Figure 8
47
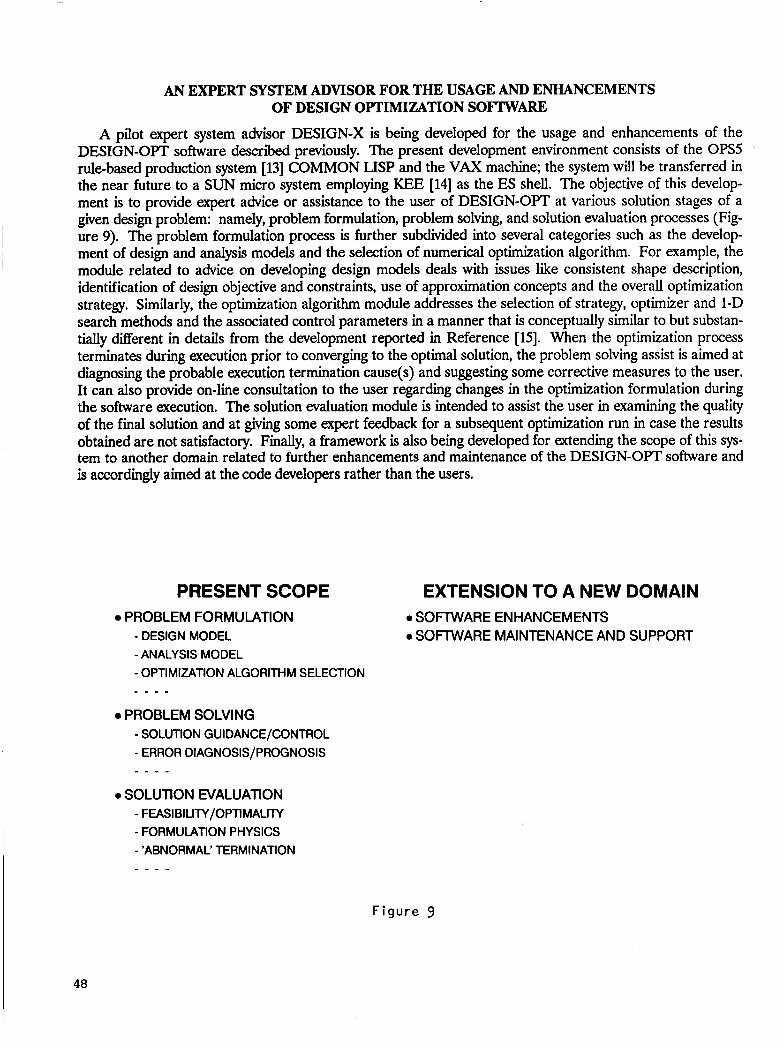
AN EXPERT WSTEM ADVISOR FOR THE USAGE AND ENHANCEMENTS OF DESIGN OPTIMIZATION SOFTWARE
A pilot expert system advisor DESIGN-X is being developed for the usage and enhancements of the DESIGN-OPT software described previously. The present development environment consists of the OPS5 rule-based production system [13] COMMON LISP and the VAX machine; the system will be transferred in the near future to a SUN micro system employing KEE [14] as the ES shell. The objective of this develop- ment is to provide expert advice or assistance to the user of DESIGN-OPT at various solution stages of a given design problem: namely, problem formulation, problem solving, and solution evaluation processes (Fig- ure 9). The problem formulation process is further subdivided into several categories such as the develop- ment of design and analysis models and the selection of numerical optimization algorithm. For example, the module related to advice on developing design models deals with issues like consistent shape description, identification of design objective and constraints, use of approximation concepts and the overall optimization strategy. Similarly, the optimization algorithm module addresses the selection of strategy, optimizer and l-D search methods and the associated control parameters in a manner that is conceptually similar to but substan- tially different in details from the development reported in Reference [15]. When the optimization process terminates during execution prior to converging to the optimal solution, the problem solving assist is aimed at diagnosing the probable execution termination cause(s) and suggesting some corrective measures to the user. It can also provide on-line consultation to the user regarding changes in the optimization formulation during the software execution. The solution evaluation module is intended to assist the user in examining the quality of the final solution and at giving some expert feedback for a subsequent optimization run in case the results obtained are not satisfactory. Finally, a framework is also being developed for extending the scope of this sys- tem to another domain related to further enhancements and maintenance of the DESIGN-OPT software and is accordingly aimed at the code developers rather than the users.
PRESENT SCOPE 0 PROBLEM FORMULATION
- DESIGN MODEL - ANALYSIS MODEL - OPTIMIZATION ALGORITHM SELECTION - - - -
0 PROBLEM SOLVING - SOLUTION GUIDANCE/CONTROL - ERROR DIAGNOSIS/PROGNOSIS
EXTENSION TO A NEW DOMAIN 0 SOFTWARE ENHANCEMENTS 0 SOFTWARE MAINTENANCE AND SUPPORT
48
0 SOLUTION EVALUATION - FEASIBILITY/OPTIMAUTY - FORMULATION PHYSICS - 'ABNORMAL' TERMINATION
F igure 9
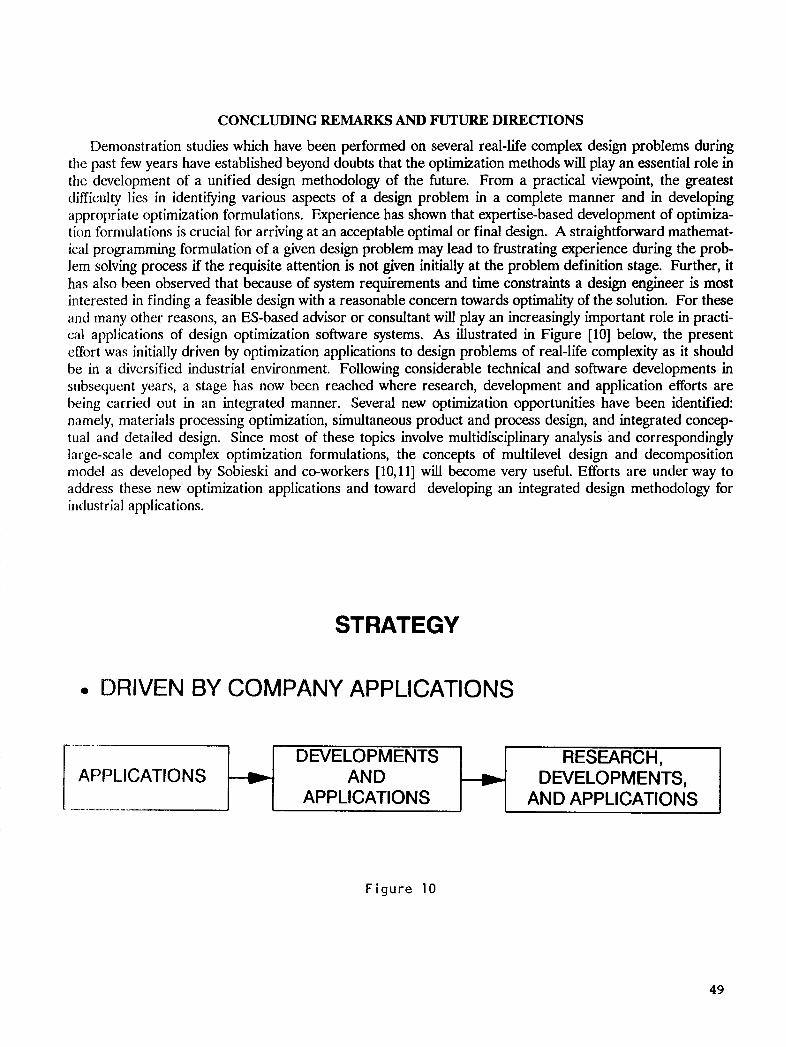
CONCLUDING REMARKS AND FUTURE DIRECTIONS
Demonstration studies which have been performed on several real-life complex design problems during the past few years have established beyond doubts that the optimization methods will play an essential role in the development of a unified design methodology of the future. From a practical viewpoint, the greatest difficulty lies in identifying various aspects of a design problem in a complete manner and in developing appropriate optimization formulations. Experience has shown that expertise-based development of optimiza- tion formulations is crucial for arriving at an acceptable optimal or final design. A straightforward mathemat- ical programming formulation of a given design problem may lead to frustrating experience during the prob- lem solving process if the requisite attention is not given initially at the problem definition stage. Further, it has also been observed that because of system requirements and time constraints a design engineer is most interested in finding a feasible design with a reasonable concern towards optimality of the solution. For these and many other reasons, an ES-based advisor or consultant will play an increasingly important role in practi- cal applications of design optimization software systems. As illustrated in Figure [lo] below, the present effort was initially driven by optimization applications to design problems of real-life complexity as it should be in a diversified industrial environment. Following considerable technical and software developments in subsequent years, a stage has now been reached where research, development and application efforts are being carried out in an integrated manner. Several new optimization opportunities have been identified: namely, materials processing optimization, simultaneous product and process design, and integrated concep- tual and detailed design. Since most of these topics involve multidisciplinary analysis and correspondingly large-scale and complex optimization formulations, the concepts of multilevel design and decomposition model as developed by Sobieski and co-workers [10,11] will become very useful. Efforts are under way to address these new optimization applications and toward developing an integrated design methodology for iridustrial applications.
[Yf’PLICATIONS
STRATEGY
DEVELOPMENTS -- AND
e DRIVEN BY COMPANY APPLICATIONS
I _____I APPLICATIONS D WELOPMENTS,
AND APPLICATIONS
F i g u r e 10
49

1.
2.
3.
4.
5.
, 6.
I 7.
8.
9.
10.
11.
12.
13.
14.
15.
50
REFERENCES
Vanderplaats, G. N.; and Sugimoto, H.: A General Purpose Optimization Program for Engineering Design. Int. J. Comp. Struct., Vol. 24, No. 1, 1986.
Kumar, V.; Lee, S . -J.; and German, M. D.: Finite Element Design Sensitivity Analysis and Its Integration with Numerical Optimization for Engineering Design. ADINA User’s Conference Proceedings, Boston, MA, August 1989.
Botkin, M. E.: Shape Optimization of Plate and Shell Structures. AIAA J., Vol 20,. No. 3,
Bennett, J. E.; and Botkin, M. E.: Structural Shape Optimization with Geometric Problem Description and Adaptive Mesh Refinement. AIAA J., Vol. 23, No. 3, 1985, pp. 458-464.
Bennett, J. E.; and Botkin, M. E.: The Optimum Shape-Automated Structural Design. Plenum Press, New York, 1986.
Kumar, V.; German, M. D.; and Lee, S.-J.: A Geometry-Based 2-Dimensional Shape Optimiza- tion Methodology and a Software System with Applications. Third Int. CARS/FOF Conf. Proceed., Southfield, MI, August, 1988.
Shaffer, B. W.: BZANS User’s Manual. GE Aircraft Engines, Lynn, MA, 1988.
Shephard, M. S.; and Yerry, M. A.: Approaching the Automatic Generation of Finite Element Meshes. ASME J. Comp. in Mech. Eng., 1983, pp. 49-56.
Graichen. C. M.; and Hathaway, A. F.: QUADTREE-A 2-D Fully Automatic Mesh Genera- tion. GE CR&D Report, Schenectady, NY, 1988.
Sobieszczanski-Sobieski, Jaroslaw: A Linear Decomposition Method for Large Optimization Problems - Blueprint for Development. NASA TM-83248, February 1982.
Sobiesznanski-Sobieski, J.; Barthelemy, J. M.; and Giles, G.: Aerospace Engineering Design by Systematic Decomposition and Multilevel Optimization. ICAS-4.7.3.
Brown, K. W.; Hirschbein, M. S.; and Chamis, C. C.: Finite Element Engine Blade Structural Optimization. AIAA Paper No. 85-0645.
Brownston, L.; Farrell, R.; Kant, E.; and Martin, N.: Programming Expert Systems in OPS5- An Introduction to Rule-Based Programming. Addison-Wesley, Reading, MA, 1986.
Intellicorp WETM Software Development System User’s Manual. Intellicorp, Mountainview, CA, 1986.
Rogers, J. L.; and Barthelemy, J. M.: An Expert System for Choosing the Best Combination of Options in a General Purpose Program -Automated Design Synthesis. Presented at the 1985 ASME International Computers in Engineering Conference and Exhibition, Boston, MA,
1988, pp. 268-273.
August 4-8, 1985.

N89- 2 5 1 4 9 .. OPTIMIZATION BY DECOMPOSITION: A STEP
FROM HIERARCHIC TO NON-HIERARCHIC SYSTEMS
Jarosl aw Sobieszczanski -Sobieski NASA Langley Research Center
Hampton, V i r g i n i a
51
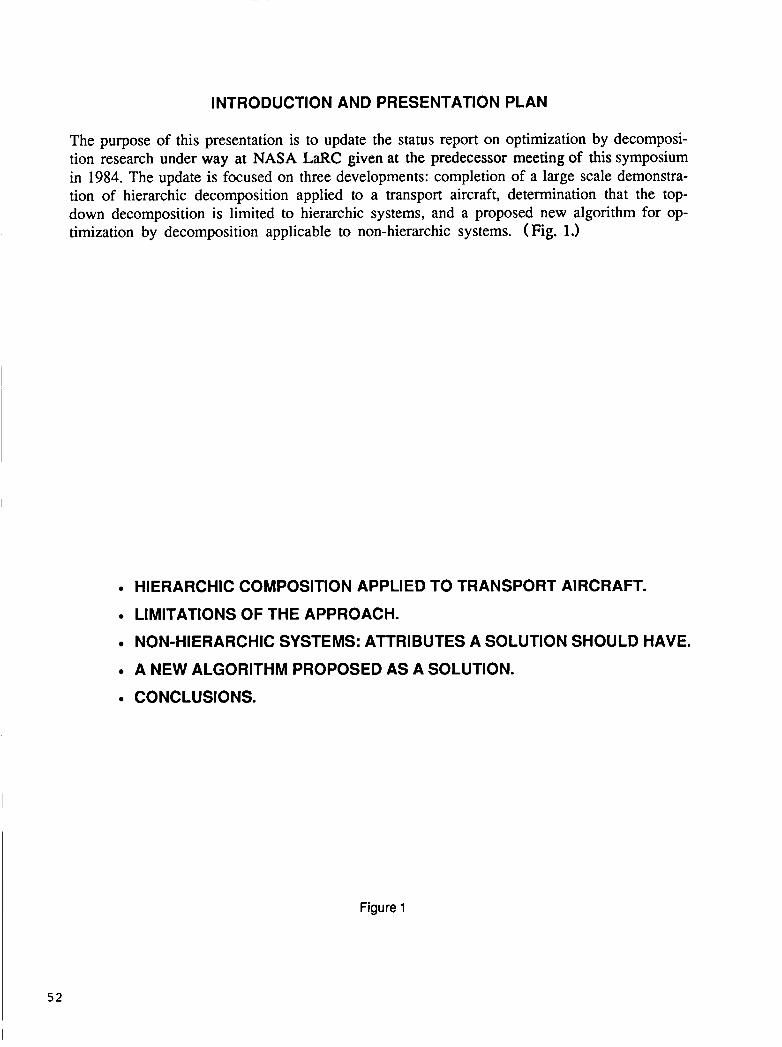
INTRODUCTION AND PRESENTATION PLAN
The purpose of this presentation is to update the status report on optimization by decomposi- tion research under way at NASA LaRC given at the predecessor meeting of this symposium in 1984. The update is focused on three developments: completion of a large scale demonstra- tion of hierarchic decomposition applied to a transport aircraft, determination that the top- down decomposition is limited to hierarchic systems, and a proposed new algorithm for op- timization by decomposition applicable to non-hierarchic systems. ( Fig. 1 .)
LIMITATIONS OF THE APPROACH.
NON-HIERARCHIC SYSTEMS: ATTRIBUTES A SOLUTION SHOULD HAVE.
A NEW ALGORITHM PROPOSED AS A SOLUTION.
CONCLUSIONS.
HIERARCHIC COMPOSITION APPLIED TO TRANSPORT AIRCRAFT.
Figure 1

OPTIMIZATION BY LINEAR DECOMPOSITION: ITS USEFULNESS AND LIMITATIONS
Parent Linear estimate of daughter
Implementation and application experience with optimization by linear decomposition has been reported several times since introduction of the concept in ref.1. The concept applies to systems amenable to a hierarchic representation as shown in Fig.2a. In such applications, the general flow of information takes the analysis results from a parent to the daughters, and the optimization results and their sensitivity to the parameters received as parent output are trans- mitted back to the parent as seen in Fig.2b. This approach was successful in formulating struc- tural optimization by substructuring in ref.2, and in solving a very large multidisciplinary op- timization problem related to a transport aircraft design reported in ref.3 and summarized in the next three figures.
Daughter Parent input constant
0 . 0
n Parent
l y / \ I 0 Daughter
Parent l y / \ I
0 Daughter
Figure 2
53
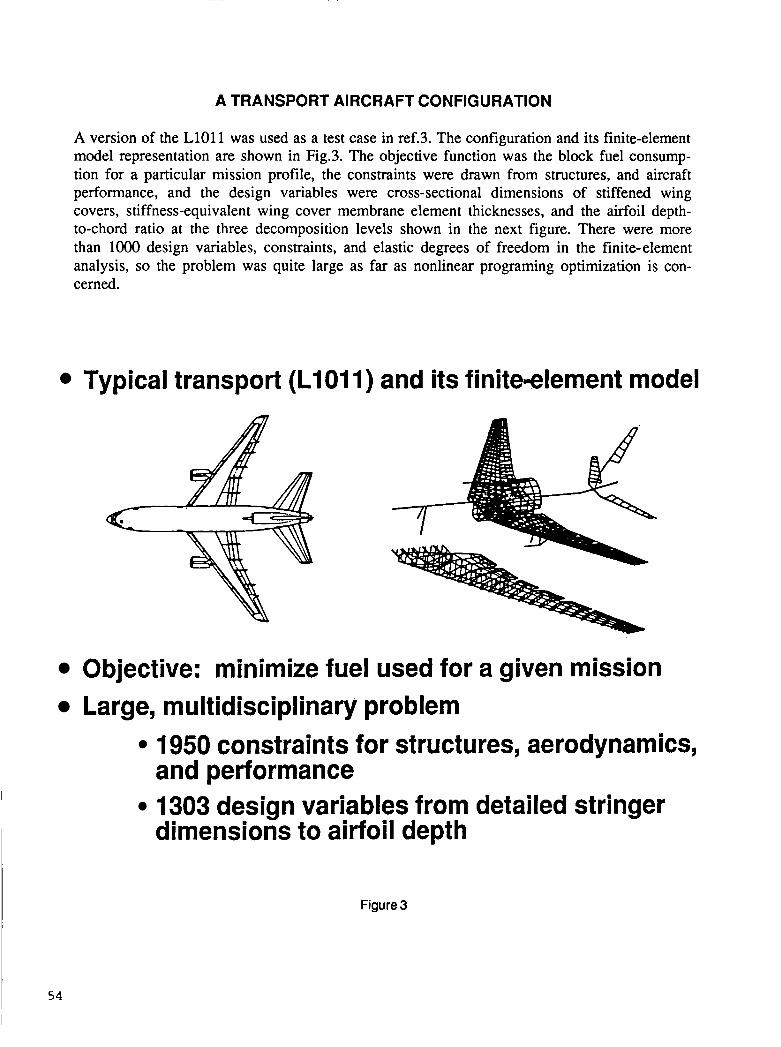
A TRANSPORT AIRCRAFT CONFIGURATION
A version of the LlOl 1 was used as a test case in ref.3. The configuration and its finite-element model representation are shown in Fig.3. The objective function was the block fuel consump- tion for a particular mission profile, the constraints were drawn from structures, and aircraft performance, and the design variables were cross-sectional dimensions of stiffened wing covers, stiffness-equivalent wing cover membrane element thicknesses, and the airfoil depth- to-chord ratio at the three decomposition levels shown in the next figure. There were more than 1000 design variables, constraints, and elastic degrees of freedom in the finite-element analysis, so the problem was quite large as far as nonlinear programing optimization is con- cerned.
Typical transport (L1011) and its finitelelement model
Objective: minimize fuel used for a given mission Large, multidisciplinary problem
and performance
dimensions to airfoil depth
1950 constraints for structures, aerodynamics,
1303 design variables from detailed stringer
54
Figure 3
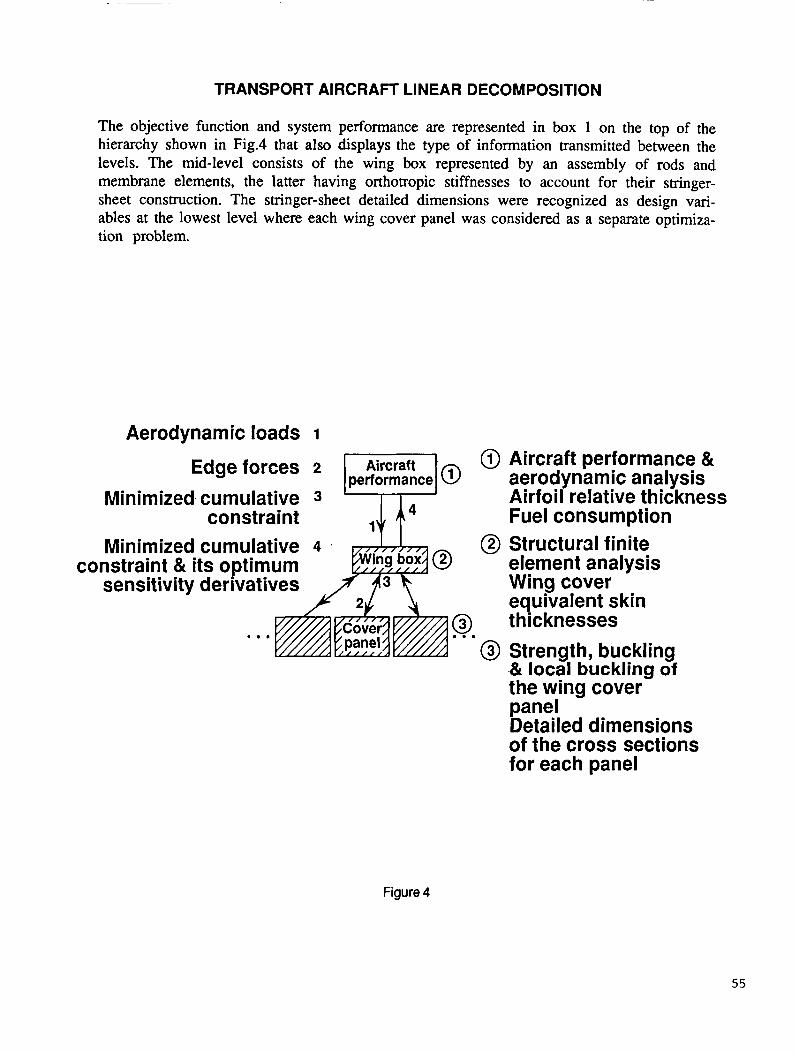
TRANSPORT AIRCRAFT LINEAR DECOMPOSITION
The objective function and system performance are represented in box 1 on the top of the hierarchy shown in Fig.4 that also displays the type of information transmitted between the levels. The mid-level consists of the wing box represented by an assembly of rods and membrane elements, the latter having orthotropic stiffnesses to account for their stringer- sheet construction. The stringer-sheet detailed dimensions were recognized as design vari- ables at the lowest level where each wing cover panel was considered as a separate optimiza- tion problem.
Aerodynamic loads
Edge forces Minimized cumulative
constraint Minimized cumulative
constraint & its optimum sensitivity derivatives
1
0 performance
Aircraft performance & aerodynamic analysis Airfoi I relative thickness Fuel consumption Structural finite element analysis Wing cover equivalent skin thicknesses Strength, buckling & local buckling of the wing cover panel Detailed dimensions of the cross sections for each panel
Figure 4
55

SAMPLE OF TRANSPORT AIRCRAFT RESULTS
Test optimizations were performed from design points deliberately initialized away from the existing LlOll design in both feasible and infeasible directions. Two typical results shown in Fig.5 indicate convergence at a quite fast rate to the same results very close to the existing design. Since the subject design was well established and previously optimized by other means, the convergence to the existing design constituted a positive test of the method which demonstrated that it is possible to link mathematically a design detail at the bottom of the hierarchy to the system performance at the top in a large problem.
Several other examples of multilevel optimization are reviewed in ref.4 of this symposium.
220 x 103 go x 103
21 0 80 0 Case 1 o Case2 oca=' wing 70
Ibs 60 Blockfuel 200 weight Ibs 190
180 50 170 40
0 2 4 6 8 101214 Cycles cycles
Fast convergence from initially infeasible
Compared well with actual L1011 data Decomposition made it possible:
an NLP-based optimization
to system performance
and feasible designs
To handle more than 1000 design variables in
To link mathematically the design detail
Figure 5
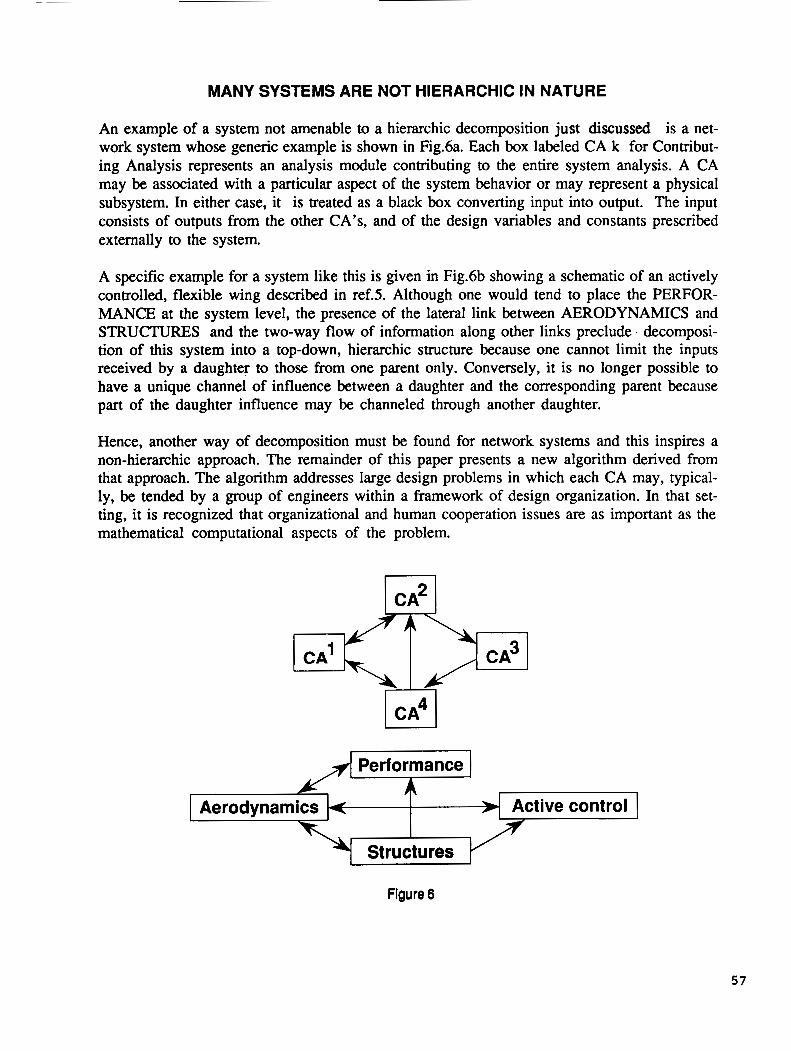
MANY SYSTEMS ARE NOT HIERARCHIC IN NATURE
An example of a system not amenable to a hierarchic decomposition just discussed is a net- work system whose generic example is shown in Fig.6a. Each box labeled CA k for Contribut- ing Analysis represents an analysis module contributing to the entire system analysis. A CA may be associated with a particular aspect of the system behavior or may represent a physical subsystem. In either case, it is treated as a black box converting input into output. The input consists of outputs from the other CA’s, and of the design variables and constants prescribed externally to the system.
A specific example for a system like this is given in Fig.6b showing a schematic of an actively controlled, flexible wing described in r e f 5 Although one would tend to place the PERFOR- MANCE at the system level, the presence of the lateral link between AERODYNAMICS and STRUCTURES and the two-way flow of information along other links preclude decomposi- tion of this system into a top-down, hierarchic structure because one cannot limit the inputs received by a daughter to those from one parent only. Conversely, it is no longer possible to have a unique channel of influence between a daughter and the corresponding parent because part of the daughter influence may be channeled through another daughter.
Hence, another way of decomposition must be found for network systems and this inspires a non-hierarchic approach. The remainder of this paper presents a new algorithm derived from that approach. The algorithm addresses large design problems in which each CA may, typical- ly, be tended by a group of engineers within a framework of design organization. In that set- ting, it is recognized that organizational and human cooperation issues are as important as the mathematical computational aspects of the problem.
Performance
Aerodynam Active control
Figure 6
57
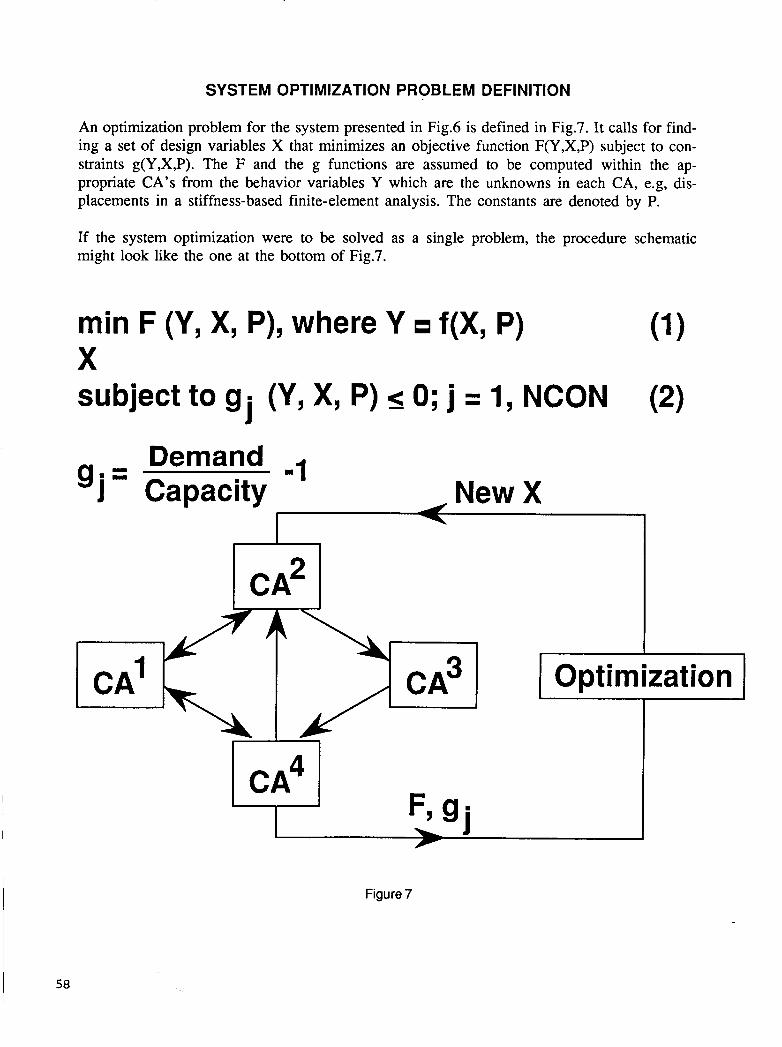
SYSTEM 0 PTI M IZATl ON PR OB LE M DE FI NlTlO N
An optimization problem for the system presented in Fig.6 is defined in Fig.7. It calls for find- ing a set of design variables X that minimizes an objective function F(Y,X,P) subject to con- straints g(Y,X,P). The F and the g functions are assumed to be computed within the ap- propriate CA’s from the behavior variables Y which are the unknowns in each CA, e.g, dis- placements in a stiffness-based finite-element analysis. The constants are denoted by P.
If the system optimization were to be solved as a single problem, the procedure schematic might look like the one at the bottom of Fig.7.
min F (Y, X, P), where Y f(X, P) (1 1
(2) X subject to gj (Y, X, P) < 0; j - - I , NCON
-1 Demand gj= Capacity New X
1 I
CA2
Optimization
58
Figure 7
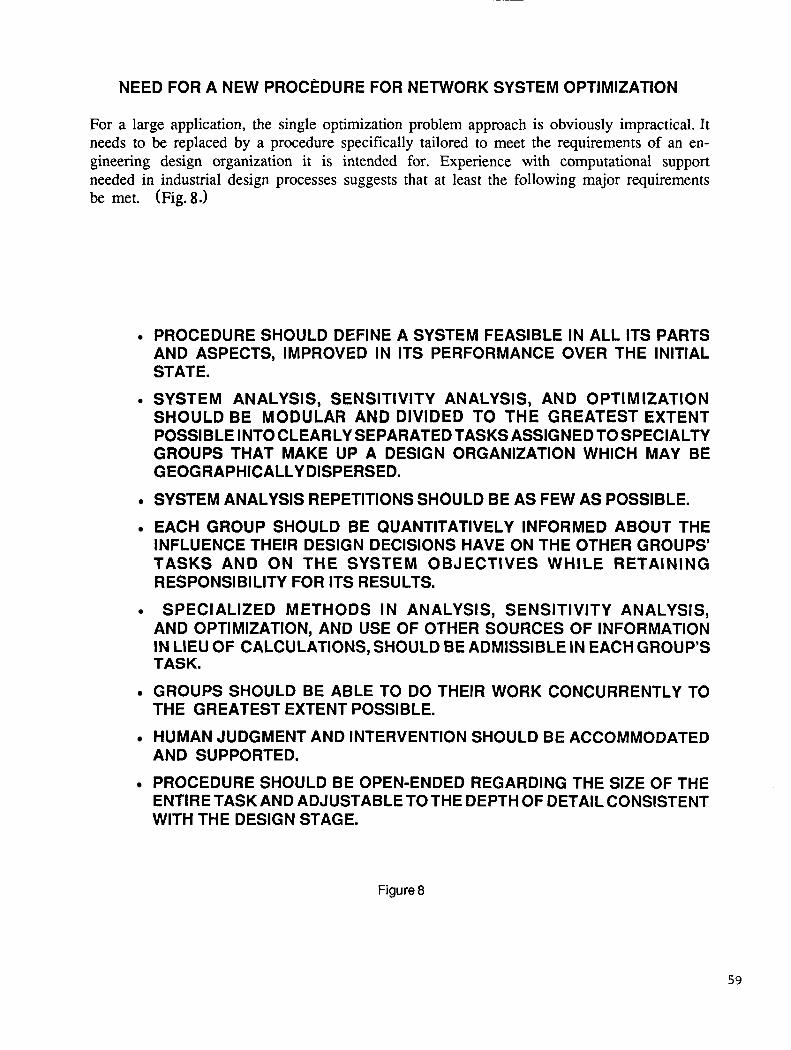
NEED FOR A NEW PROCEDURE FOR NETWORK SYSTEM OPTIMIZATION
For a large application, the single optimization problem approach is obviously impractical. It needs to be replaced by a procedure specifically tailored to meet: the requirements of an en- gineering design organization it is intended for. Experience with computational support needed in industrial design processes suggests that at least the following major requirements be met. (Fig.8.)
PROCEDURE SHOULD DEFINE A SYSTEM FEASIBLE IN ALL ITS PARTS AND ASPECTS, IMPROVED IN ITS PERFORMANCE OVER THE INITIAL STATE.
SHOULD BE MODULAR AND DIVIDED TO THE GREATEST EXTENT POSSIBLE INTO CLEARLY SEPARATEDTASKS ASSIGNEDTOSPECIALTY GROUPS THAT MAKE UP A DESIGN ORGANIZATION WHICH MAY BE GEOGRAPHICALLY DISPERSED.
SYSTEM ANALYSIS, SENSITIVITY ANALYSIS, AND OPTIMIZATION
SYSTEM ANALYSIS REPETITIONS SHOULD BE AS FEW AS POSSIBLE.
EACH GROUP SHOULD BE QUANTITATIVELY INFORMED ABOUT THE INFLUENCE THEIR DESIGN DECISIONS HAVE ON THE OTHER GROUPS’ TASKS AND ON THE SYSTEM OBJECTIVES WHILE RETAINING RES PONS1 BI LlTY FOR ITS RESULTS.
AND OPTIMIZATION, AND USE OF OTHER SOURCES OF INFORMATION IN LIEU OF CALCULATIONS, SHOULD BE ADMISSIBLE IN EACH GROUP’S TASK.
GROUPS SHOULD BE ABLE TO DO THEIR WORK CONCURRENTLY TO
SPECIALIZED METHODS IN ANALYSIS, SENSITIVITY ANALYSIS,
THE GREATEST EXTENT POSSIBLE.
AND SUPPORTED.
ENTIRE TASK AND ADJUSTABLE TOTHE DEPTH OF DETAIL CONSISTENT WITH THE DESIGN STAGE.
HUMAN JUDGMENT AND INTERVENTION SHOULD BE ACCOMMODATED
PROCEDURE SHOULD BE OPEN-ENDED REGARDING THE SIZE OF THE
Figure 8
59
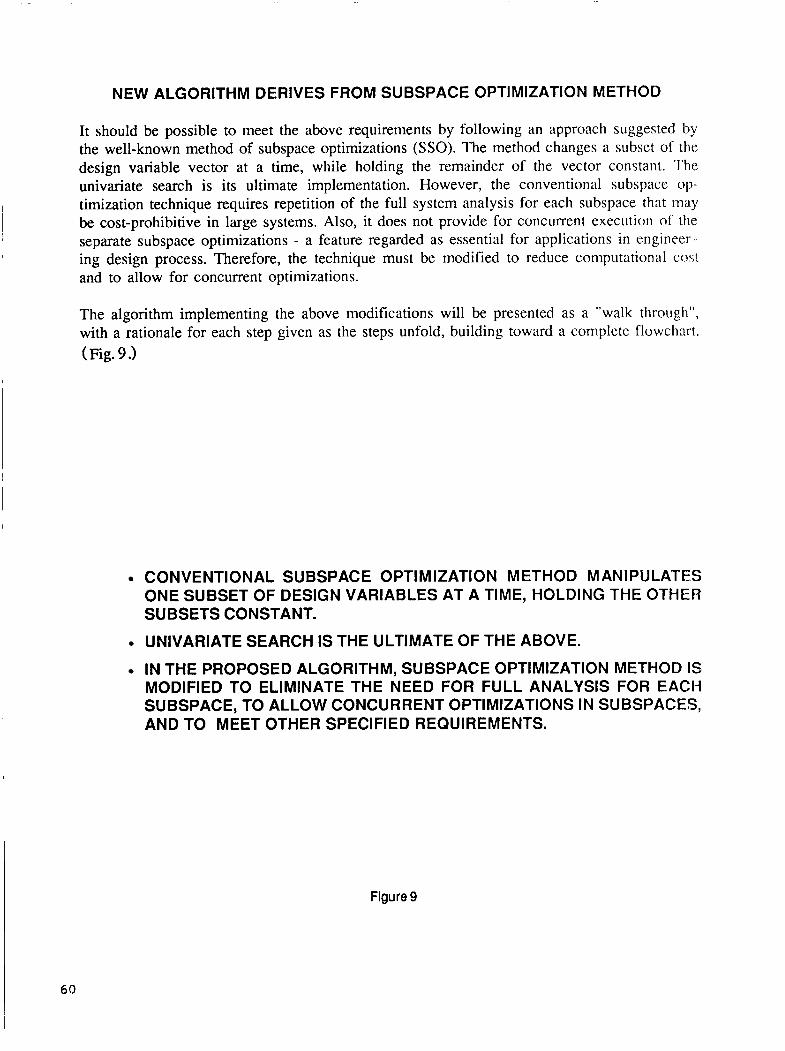
NEW ALGORITHM DERIVES FROM SUBSPACE OPTIMIZATION METHOD
It should be possible to meet the above requirements by following an approach suggested by the well-known method of subspace optimizations (SSO). The method changes a subset of the design variable vector at a time, while holding the remainder of the vector constant. The univariate search is its ultimate implementation. However, the conventional subspace op- timization technique requires repetition of the full system analysis for each subspace that may be cost-prohibitive in large systems. Also, it does not provide for concurrent execution of' the separate subspace optimizations - a feature regarded as essential for applications in engineer - ing design process. Therefore, the technique must be modified to reduce computational cos! and to allow for concurrent optimizations.
The algorithm implementing the above modifications will be presented as a "walk through", with a rationale for each step given as the steps unfold, building toward a complete flowchart. (Fig. 9 .)
CONVENTIONAL SUBSPACE OPTIMIZATION METHOD MANIPULATES ONE SUBSET OF DESIGN VARIABLES AT A TIME, HOLDING THE OTHER SUBSETS CONSTANT.
UNIVARIATE SEARCH IS THE ULTIMATE OF THE ABOVE.
IN THE PROPOSED ALGORITHM, SUBSPACE OPTIMIZATION METHOD IS MODIFIED TO ELIMINATE THE NEED FOR FULL ANALYSIS FOR EACH SUBSPACE, TO ALLOW CONCURRENT OPTIMIZATIONS IN SUBSPACES, AND TO MEET OTHER SPECIFIED REQUIREMENTS.
Figure 9
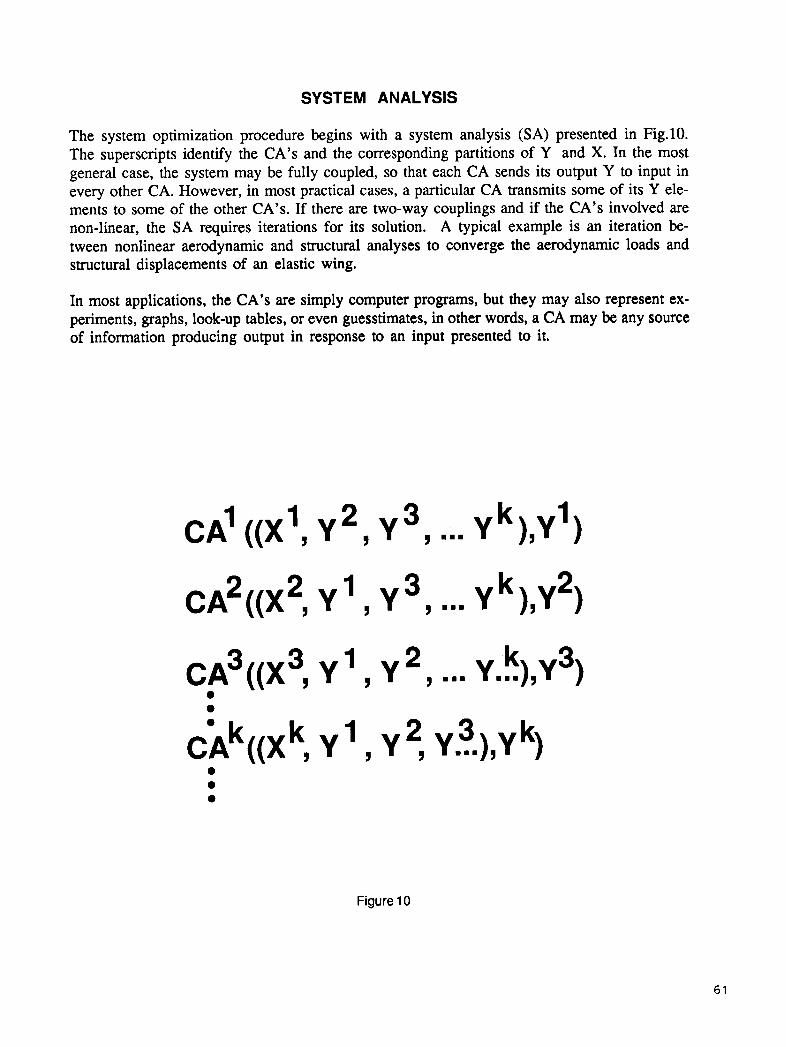
SYSTEM ANALYSIS
The system optimization procedure begins with a system analysis (SA) presented in Fig.10. The superscripts identify the CA’s and the corresponding partitions of Y and X. In the most general case, the system may be fully coupled, so that each CA sends its output Y to input in every other CA. However, in most practical cases, a particular CA transmits some of its Y ele- ments to some of the other CA’s. If there are two-way couplings and if the CA’s involved are non-linear, the SA requires iterations for its solution. A typical example is an iteration be- tween nonlinear aerodynamic and structural analyses to converge the aerodynamic loads and structural displacements of an elastic wing.
In most applications, the CA’s are simply computer programs, but they may also represent ex- periments, graphs, look-up tables, or even guesstimates, in other words, a CA may be any source of information producing output in response to an input presented to it.
k 1 CA1((X ’ , Y , Y , ... Y ) , Y )
2 2 1 k 2 CA ((X , Y , Y 3 ,... Y ),Y )
k 3 Y...),Y ) CA 0 ((X , Y ,Y2 , . . . 3 3 1 0
‘ k k 1 2 3 k CA ((X , Y , Y , Y...),Y )
0 0 0
Figure 10
61
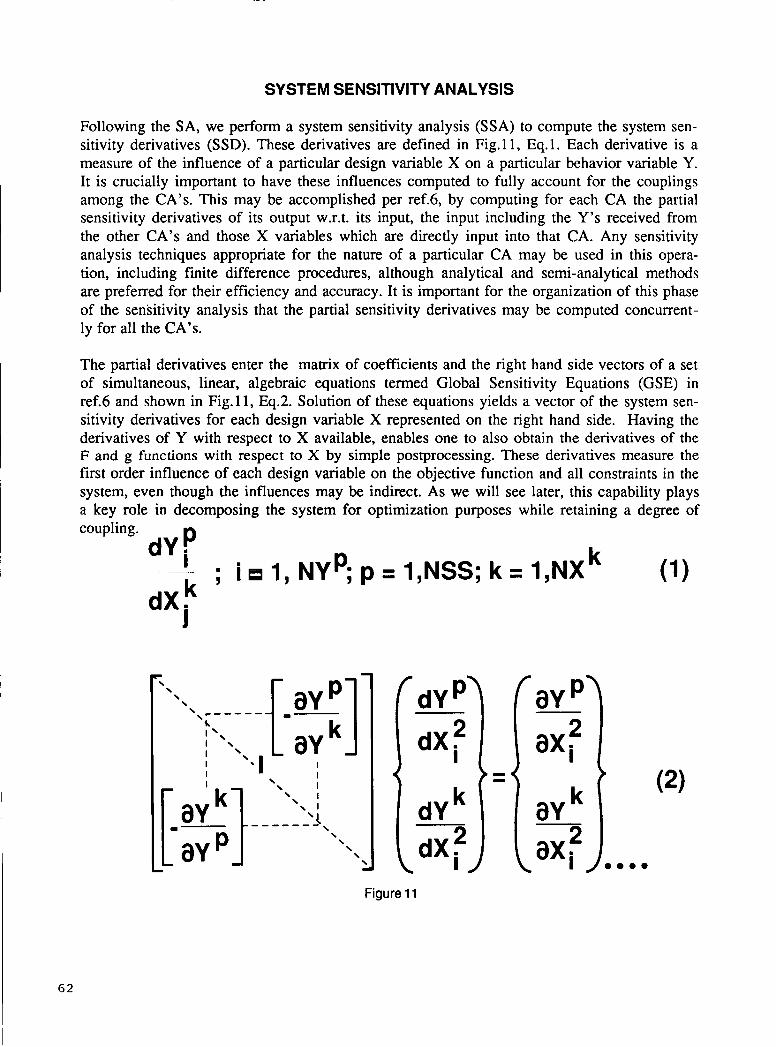
SYSTEM SENSITIVITY ANALYSIS
Following the SA, we perform a system sensitivity analysis (SSA) to compute the system sen- sitivity derivatives (SSD). These derivatives are defined in Fig.11, Eq.1. Each derivative is a measure of the influence of a particular design variable X on a particular behavior variable Y. It is crucially important to have these influences computed to fully account for the couplings among the CA's. This may be accomplished per ref.6, by computing for each CA the partial sensitivity derivatives of its output w.r.t. its input, the input including the Y's received from the other CA's and those X variables which are directly input into that CA. Any sensitivity analysis techniques appropriate for the nature of a particular CA may be used in this opera- tion, including finite difference procedures, although analytical and semi-analytical methods are preferred for their efficiency and accuracy. It is important for the organization of this phase of the sensitivity analysis that the partial sensitivity derivatives may be computed concurrent- ly for all the CA's.
The partial derivatives enter the matrix of coefficients and the right hand side vectors of a set of simultaneous, linear, algebraic equations termed Global Sensitivity Equations (GSE) in ref.6 and shown in Fig. 11, Eq.2. Solution of these equations yields a vector of the system sen- sitivity derivatives for each design variable X represented on the right hand side. Having the derivatives of Y with respect to X available, enables one to also obtain the derivatives of the F and g functions with respect to X by simple postprocessing. These derivatives measure the first order influence of each design variable on the objective function and all constraints in the system, even though the influences may be indirect. As we will see later, this capability plays a key role in decomposing the system for optimization purposes while retaining a degree of coupling.
(1 1 dY p k __ ; i I , NYp; p = 1,NSS; k = 1,NX
dX k J
62
dY p9
dX i
dYk dX
c i,
I I
D O 0 0
Figure 11
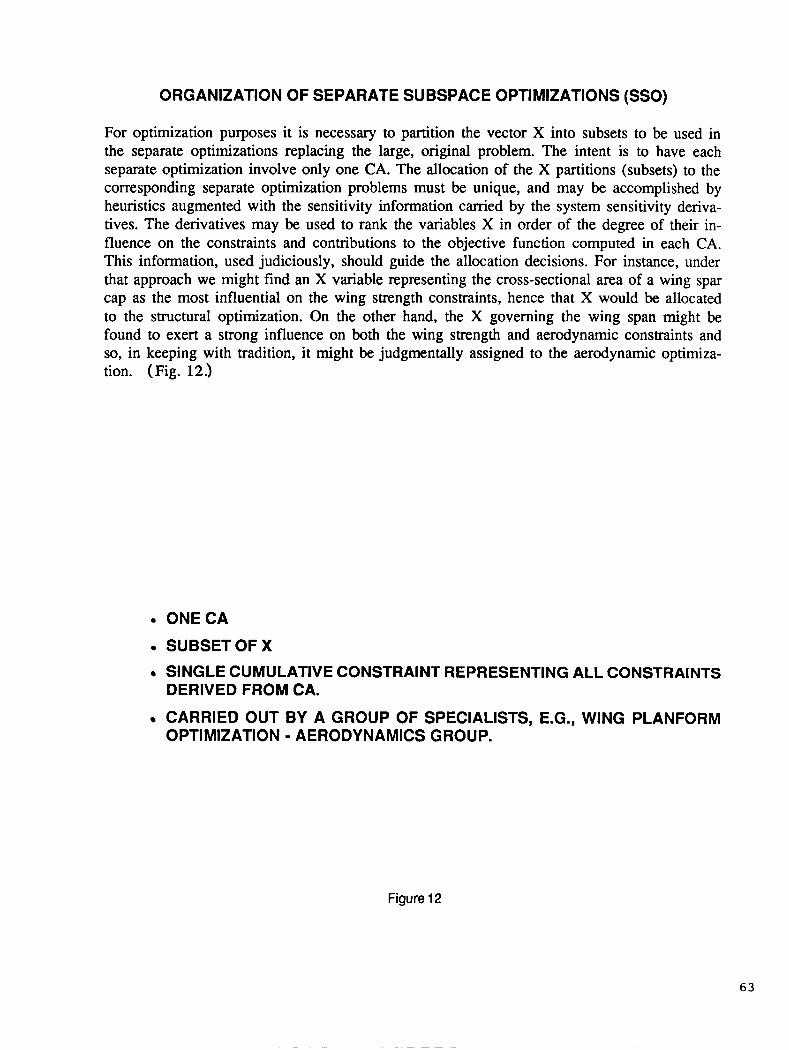
ORGANIZATION OF SEPARATE SUBSPACE OPTIMIZATIONS (SSO)
For optimization purposes it is necessary to partition the vector X into subsets to be used in the separate optimizations replacing the large, original problem. The intent is to have each separate optimization involve only one CA. The allocation of the X partitions (subsets) to the corresponding separate optimization problems must be unique, and may be accomplished by heuristics augmented with the sensitivity information carried by the system sensitivity deriva- tives. The derivatives may be used to rank the variables X in order of the degree of their in- fluence on the constraints and contributions to the objective function computed in each CA. This information, used judiciously, should guide the allocation decisions. For instance, under that approach we might find an X variable representing the cross-sectional area of a wing spar cap as the most influential on the wing strength constraints, hence that X would be allocated to the structural optimization. On the other hand, the X governing the wing span might be found to exert a strong influence on both the wing strength and aerodynamic constraints and so, in keeping with tradition, it might be judgmentally assigned to the aerodynamic optimiza- tion. (Fig. 12.)
ONECA
SUBSETOFX SINGLE CUMULATIVE CONSTRAINT REPRESENTING ALL CONSTRAINTS DERIVED FROM CA.
CARRIED OUT BY A GROUP OF SPECIALISTS, E.G., WING PLANFORM OPTIMIZATION - AERODYNAMICS GROUP.
Figure 12
63

CUMULATIVE CONSTRAINT
The cumulative constraint represents by a single number all the g’s computed from the CA as- sociated with the SSO. The cumulative constraint is formulated as a Kreisselmeier-Steinhauser function (KS function), Eq.1, per ref.7. The derivatives of the KS function with respect to a g are obtained analytically and combined in a chain differentiation with the derivatives of the g with respect to X to yield the derivatives of the cumulative constraint with respect to X, Eq.2.
Knowing the system solution, its sensitivity to design variables, and having organized the design variables and CA’s in separate optimization problems, we may now begin the optimizations. (Fig. 13.)
Kreisselmeier-Stein hauser function:
64
( j p g ) 1 P K S = - I ~ C e i
p user controlled factor
Figure 13
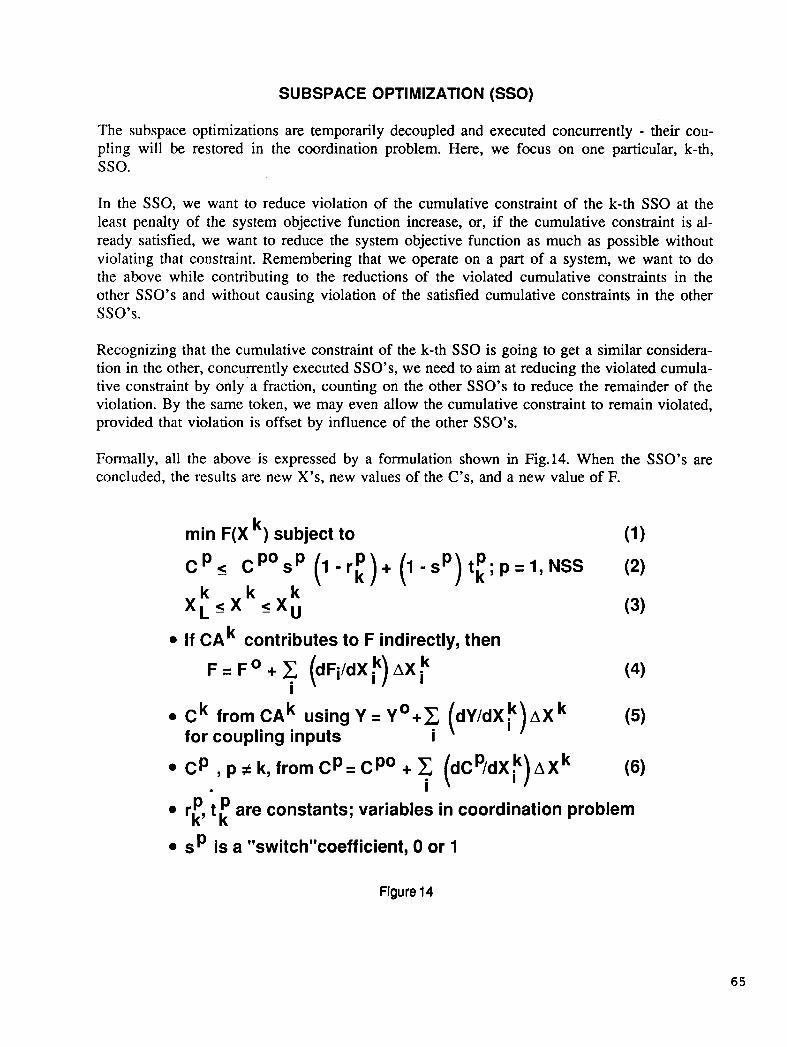
SUBSPACE OPTIMIZATION (SSO)
The subspace optimizations are temporarily decoupled and executed concurrently - their cou- pling will be restored in the coordination problem. Here, we focus on one particular, k-th, sso.
In the SSO, we want to reduce violation of the cumulative constraint of the k-th SSO at the least penalty of the system objective function increase, or, if the cumulative constraint is al- ready satisfied, we want to reduce the system objective function as much as possible without violating that constraint. Remembering that we operate on a part of a system, we want to do the above while contributing to the reductions of the violated cumulative constraints in the other SSO’s and without causing violation of the satisfied cumulative constraints in the other SSO’S.
Recognizing that the cumulative constraint of the k-th SSO is going to get a similar considera- tion in the other, concurrently executed SSO’s, we need to aim at reducing the violated cumula- tive constraint by only a fraction, counting on the other SSO’s to reduce the remainder of the violation. By the same token, we may even allow the cumulative constraint to remain violated, provided that violation is offset by influence of the other SSO’s.
Formally, all the above is expressed by a formulation shown in Fig.14. When the SSO’s are concluded, the results are new X’s, new values of the C’s, and a new value of F.
k min F(X ) subject to C p , CpOsp (l-rkp)+ ( l - s P P ) t k ; p = l , N S S
k k k x p x ‘ X ”
If CAk contributes to F indirectly, then
F = Fo + 2 (dFiidX F) AX F i
Ck from CAk using Y = Yo+c (dY/dX:)AXk for coupling inputs i
Cp , p f k, from Cp= CpO +
r P P , t are constants; variables in coordination problem k k sp is a “switch’koefficient, 0 or 1
Figure 14
65
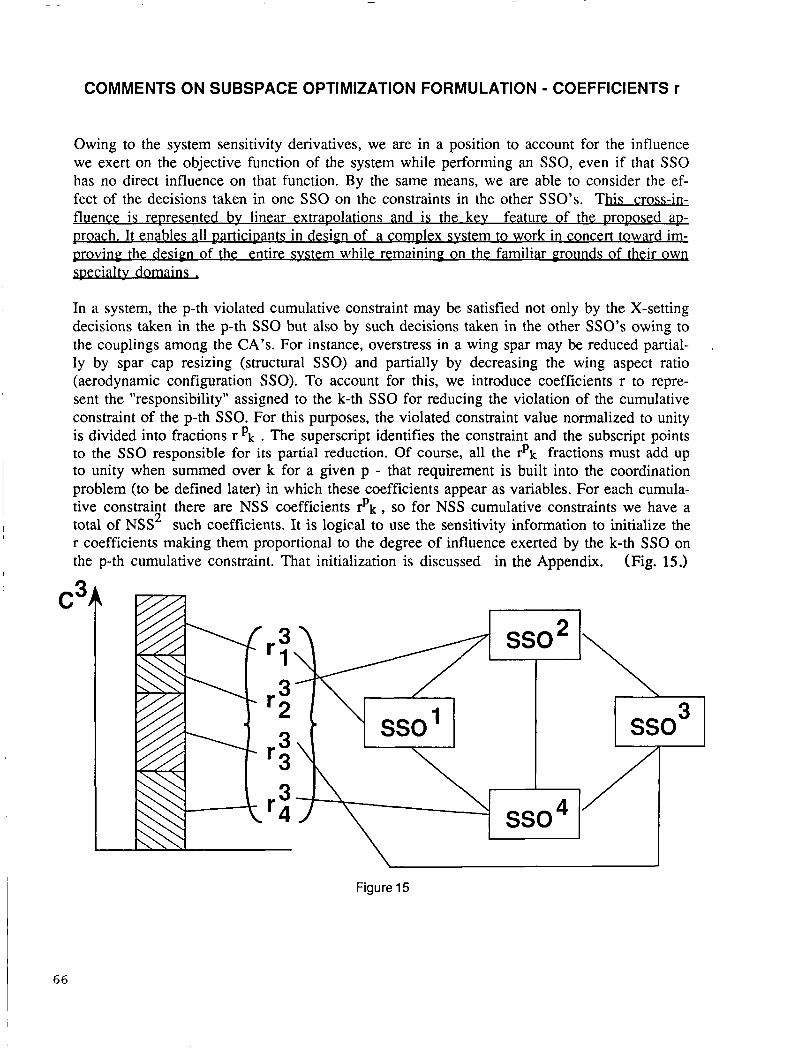
COMMENTS ON SUBSPACE OPTIMIZATION FORMULATION - COEFFICIENTS r
Owing to the system sensitivity derivatives, we are in a position to account for the influence we exert on the objective function of the system while performing an SSO, even if that SSO has no direct influence on that function. By the same means, we are able to consider the ef- fect of the decisions taken in one SSO on the constraints in the other SSO’s. This cross -in- ‘
fluence is represented bv linear extrapolations and is the kev feature of the proposed ap- poach. It enables all participants in design of a complex svste m to work in concert toward im- proving the des ign - of the entire svstem while remaining on the familiar mounds of their own specialty d o m m
In a system, the p-th violated cumulative constraint may be satisfied not only by the X-setting decisions taken in the p-th SSO but also by such decisions taken in the other SSO’s owing to the couplings among the CA’s. For instance, overstress in a wing spar may be reduced partial- ly by spar cap resizing (structural SSO) and partially by decreasing the wing aspect ratio (aerodynamic configuration SSO). To account for this, we introduce coefficients r to repre- sent the “responsibility” assigned to the k-th SSO for reducing the violation of the cumulative constraint of the p-th SSO. For this purposes, the violated constraint value normalized to unity is divided into fractions r pk . The superscript identifies the constraint and the subscript points to the SSO responsible for its partial reduction. Of course, all the rpk fractions must add up to unity when summed over k for a given p - that requirement is built into the coordination problem (to be defined later) in which these coefficients appear as variables. For each cumula- tive constraint there are NSS coefficients rpk , so for NSS cumulative constraints we have a total of NSS such coefficients. It is logical to use the sensitivity information to initialize the r coefficients making them proportional to the degree of influence exerted by the k-th SSO on the p-th cumulative constraint. That initialization is discussed in the Appendix. (Fig. 15.)
2
c3
\
Figure 15

COMMENTS ON SUBSPACE OPTIMIZATION FORMULATION - COEFFICIENTS t.
Extending this reasoning to the case of the p-th cumulative constraint being critical for the given X, we should account for the possibility of further reducing the objective function by let- ting that constraint become somewhat violated in the p-th SSO, provided that the violation will be offset by oversatisfaction of that constraint in the k-th SSO. For example, should we find the wing spar stress constraint at zero (critical) in the structural SSO, we may let the stress rise above the allowable value thus reducing the spar cross-sectional area and weight, if we in- struct the aerodynamic SSO to offset that violation by oversatisfying the same constraint by reducing the wing aspect ratio at the price of the induced drag increase. If the wing spar weight reduction more than offsets the induced drag increase with respect to a measure of the aircraft performance, then this is a positive trade-off the procedure ought to be able to recognize. To account for that type of trade-offs, we introduce the coefficients tpk whose number equals NSS2 . For the p-th cumulative constraint, the sum of these coefficients over k must be zero, to keep the constraint in the critical, but not violated, status. This condition is enforced in the coordination problem where the coefficients t appear as variables. (Fig. 16.)
SSOI SSO* S S O ~ S S O ~
Figure 16
67
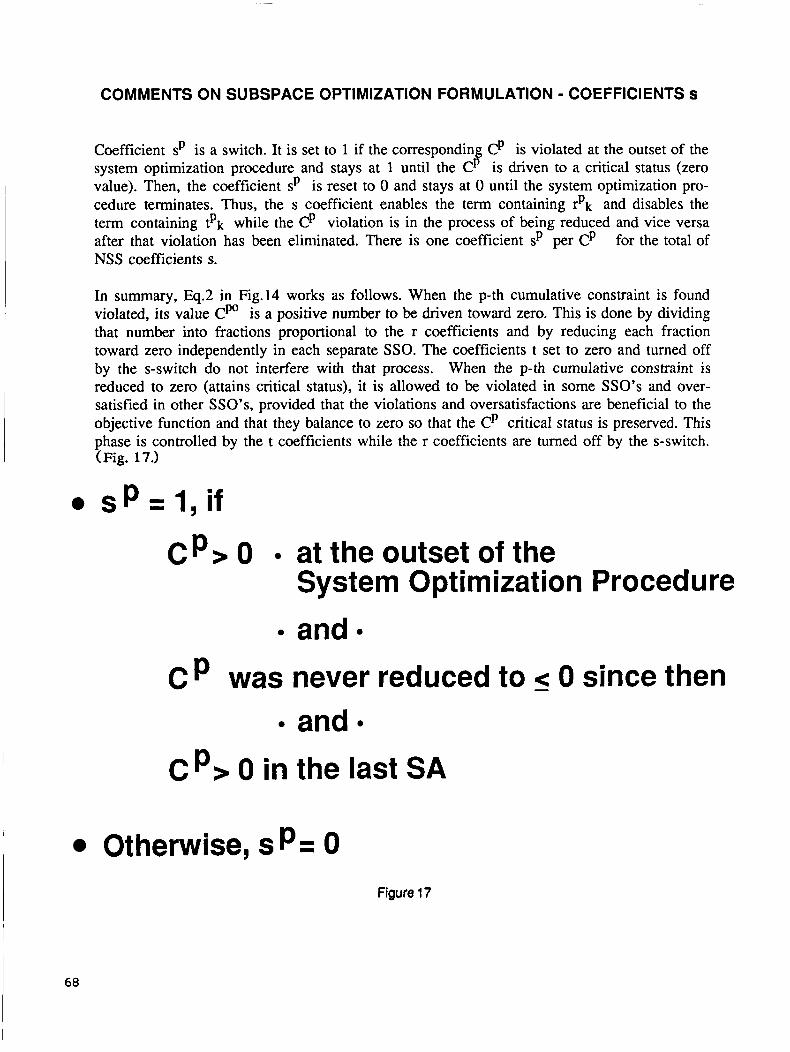
COMMENTS ON SUBSPACE OPTIMIZATION FORMULATION - COEFFICIENTS s
Coefficient sp is a switch. It is set to 1 if the corresponding Cp is violated at the outset of the system optimization procedure and stays at 1 until the Cp is driven to a critical status (zero value). Then, the coefficient sp is reset to 0 and stays at 0 until the system optimization pro- cedure terminates. Thus, the s coefficient enables the term containing rpk and disables the term containing tpk while the Cp violation is in the process of being reduced and vice versa after that violation has been eliminated. There is one coefficient sp per Cp for the total of NSS coefficients s.
In summary, Eq.2 in Fig.14 works as follows. When the p-th cumulative constraint is found violated, its value Cpo is a positive number to be driven toward zero. This is done by dividing that number into fractions proportional to the r coefficients and by reducing each fraction toward zero independently in each separate SSO. The coefficients t set to zero and turned off by the s-switch do not interfere with that process. When the p-th cumulative constraint is reduced to zero (attains critical status), it is allowed to be violated in some SSO’s and over- satisfied in other SSO’s, provided that the violations and oversatisfactions are beneficial to the objective function and that they balance to zero so that the Cp critical status is preserved. This phase is controlled by the t coefficients while the r coefficients are turned off by the s-switch. (Fig. 17.)
C b 0 at the outset of the System Optimization Procedure and
Cp was never reduced to - e 0 since then and
C b 0 in the last SA
I Otherwise, sp= 0 Figure 17
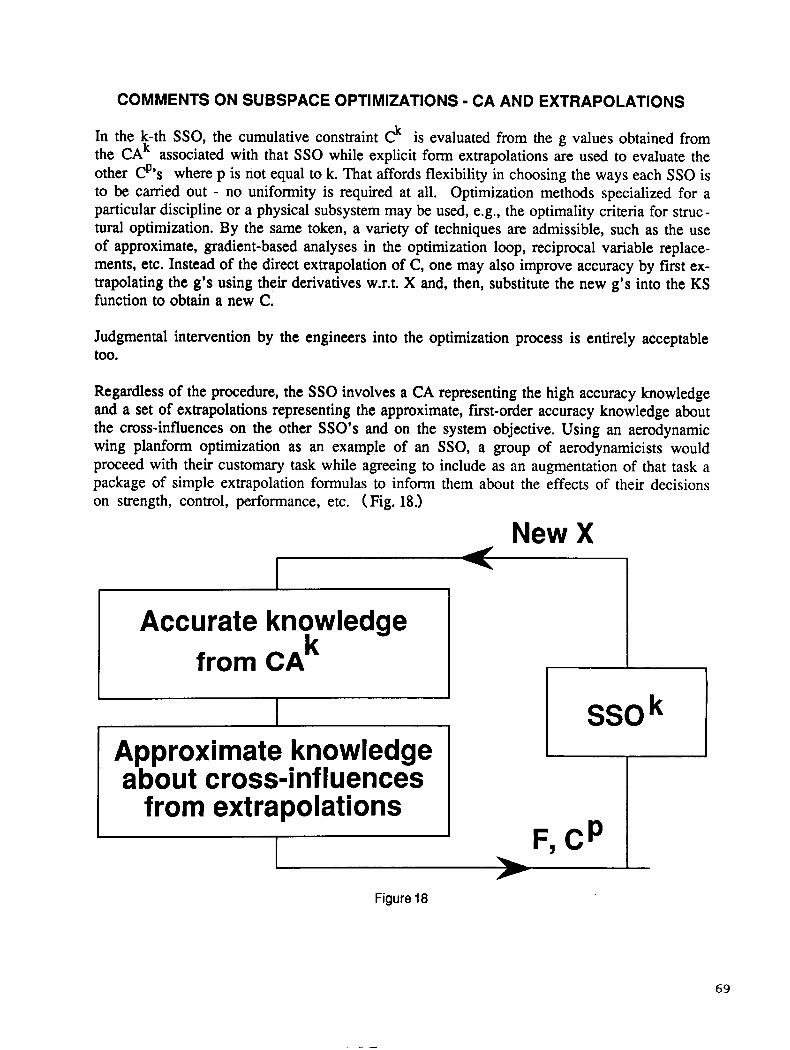
COMMENTS ON SUBSPACE OPTIMIZATIONS - CA AND EXTRAPOLATIONS
from extrapolations
In the k-th SSO, the cumulative constraint ck is evaluated from the g values obtained from the CAk associated with that SSO while explicit form extrapolations are used to evaluate the other Cp’s where p is not equal to k. That affords flexibility in choosing the ways each SSO is to be carried out - no uniformity is required at all. Optimization methods specialized for a particular discipline or a physical subsystem may be used, e.g., the optimality criteria for struc- tural optimization. By the same token, a variety of techniques are admissible, such as the use of approximate, gradient-based analyses in the optimization loop, reciprocal variable replace- ments, etc. Instead of the direct extrapolation of C, one may also improve accuracy by first ex- trapolating the g’s using their derivatives w.r.t. X and, then, substitute the new g’s into the KS function to obtain a new C.
Judgmental intervention by the engineers into the optimization process is entirely acceptable too.
Regardless of the procedure, the SSO involves a CA representing the high accuracy knowledge and a set of extrapolations representing the approximate, first-order accuracy knowledge about the cross-influences on the other SSO’s and on the system objective. Using an aerodynamic wing planform optimization as an example of an SSO, a group of aerodynamicists would proceed with their customary task while agreeing to include as an augmentation of that task a package of simple extrapolation formulas to inform them about the effects of their decisions on strength, control, performance, etc. (Fig. 18.)
New X - I Accurate knowledge
k -
from CA
Approximate knowledge about cross=inf luences
4 l
Figure 18
69
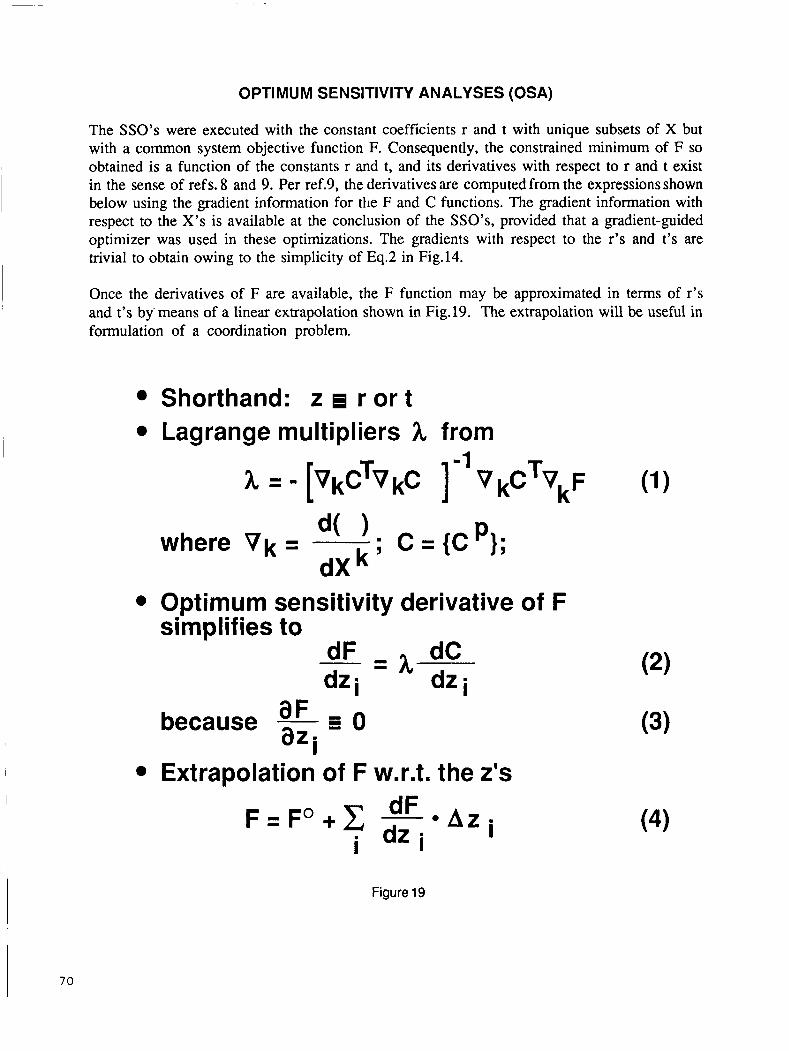
OPTIMUM SENSITIVITY ANALYSES (OSA)
The SSO’s were executed with the constant coefficients r and t with unique subsets of X but with a common system objective function F. Consequently, the constrained minimum of F so obtained is a function of the constants r and t, and its derivatives with respect to r and t exist in the sense of refs. 8 and 9. Per ref.9, the derivatives are computed from the expressions shown below using the gradient information for the F and C functions. The gradient information with respect to the X’s is available at the conclusion of the SSO’s, provided that a gradient-guided optimizer was used in these optimizations. The gradients with respect to the r’s and t’s are trivial to obtain owing to the simplicity of Eq.2 in Fig.14.
Once the derivatives of F are available, the F function may be approximated in terms of r’s and t’s by’means of a linear extrapolation shown in Fig.19. The extrapolation will be useful in formulation of a coordination problem.
Shorthand: z r or t Lagrange multipliers h from
-I h [VkCTVkC ] vkcTvkF (1)
d( 1 . C = { C P }; where Vk = d X k ’
Optimum sensitivity derivative of F simplifies to
i o aF because - az i Extrapolation of F w.r.t. the z’s
Figure 19
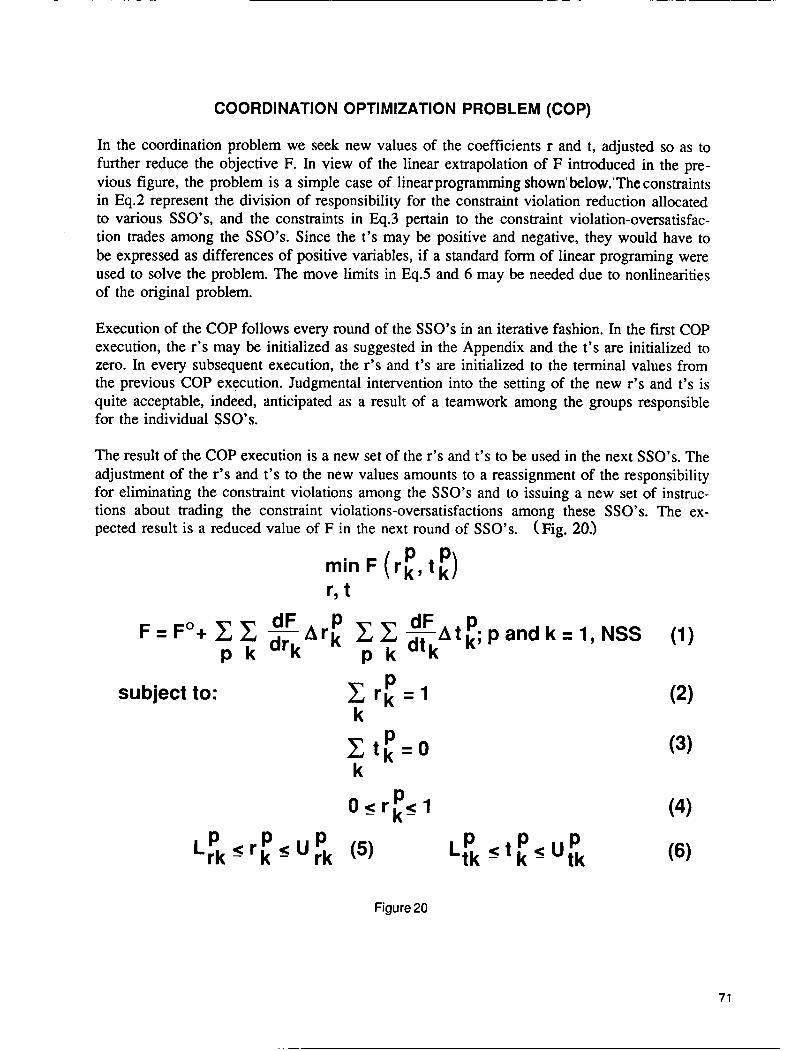
COORDINATION OPTIMIZATION PROBLEM (COP)
In the coordination problem we seek new values of the coefficients r and t, adjusted so as to further reduce the objective F. In view of the linear extrapolation of F introduced in the pre- vious figure, the problem is a simple case of linearprogramming shownlbelow.’The constraints in Eq.2 represent the division of responsibility for the constraint violation reduction allocated to various SSO’s, and the constraints in Eq.3 pertain to the constraint violation-oversatisfac- tion trades among the SSO’s. Since the t’s may be positive and negative, they would have to be expressed as differences of positive variables, if a standard form of linear programing were used to solve the problem. The move limits in Eq.5 and 6 may be needed due to nonlinearities of the original problem.
Execution of the COP follows every round of the SSO’s in an iterative fashion. In the first COP execution, the r’s may be initialized as suggested in the Appendix and the t’s are initialized to zero. In every subsequent execution, the r’s and t’s are initialized to the terminal values from the previous COP execution. Judgmental intervention into the setting of the new r’s and t’s is quite acceptable, indeed, anticipated as a result of a teamwork among the groups responsible for the individual SSO’s.
The result of the COP execution is a new set of the r’s and t’s to be used in the next SSO’s. The adjustment of the r’s and t’s to the new values amounts to a reassignment of the responsibility for eliminating the constraint violations among the SSO’s and to issuing a new set of instruc- tions about trading the constraint violations-oversatisfactions among these SSO’s. The ex- pected result is a reduced value of F in the next round of SSO’s. (Fig. 20.)
P P min F ( r k , t k )
F = Fo+ P
subject to: C r k = I P
k
O S r k 5 l P
L P < t P < U P tk - k - tk
Figure 20
71
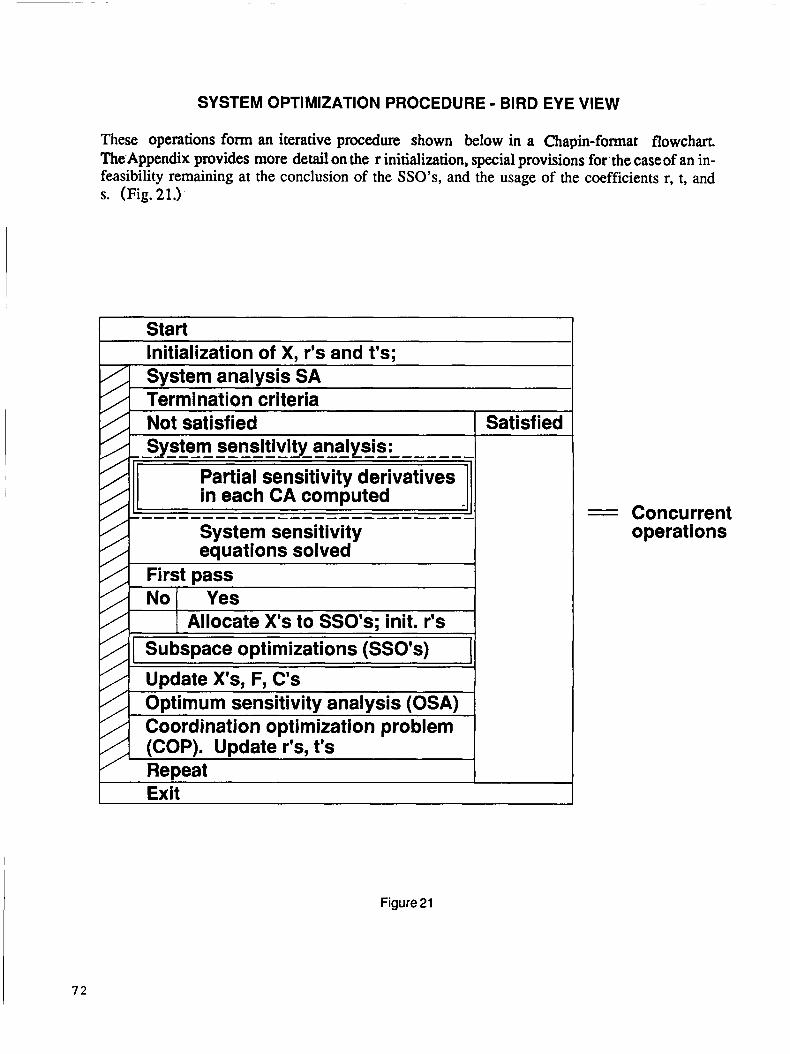
SYSTEM OPTIMIZATION PROCEDURE - BIRD EYE VIEW
/ Not satisfied 5 ............................ System sensitivity analysis:
These operations form an iterative procedure shown below in a Chapin-format flowchart, The Appendix provides more detail on the r initialization, special provisions forthe case of an in- feasibility remaining at the conclusion of the SSO's, and the usage of the coefficients r, t, and s. (Fig.21.)
/ / No Yes Allocate X's to SSO's; init. r's 5 1 Subspace optimizations (SSO's) 5 Update X's, F, C's
/, Optimum sensitivity analysis (OSA)
Start Initialization of X, r's and t's;
v j System analysis SA I I / I - - I
y/1 Termination criteria
I / I I
Coordination optimization problem (COP). Update r's, t's
I / I = 1
Satisfied
Concurrent operations
- -
Figure 21
7 2
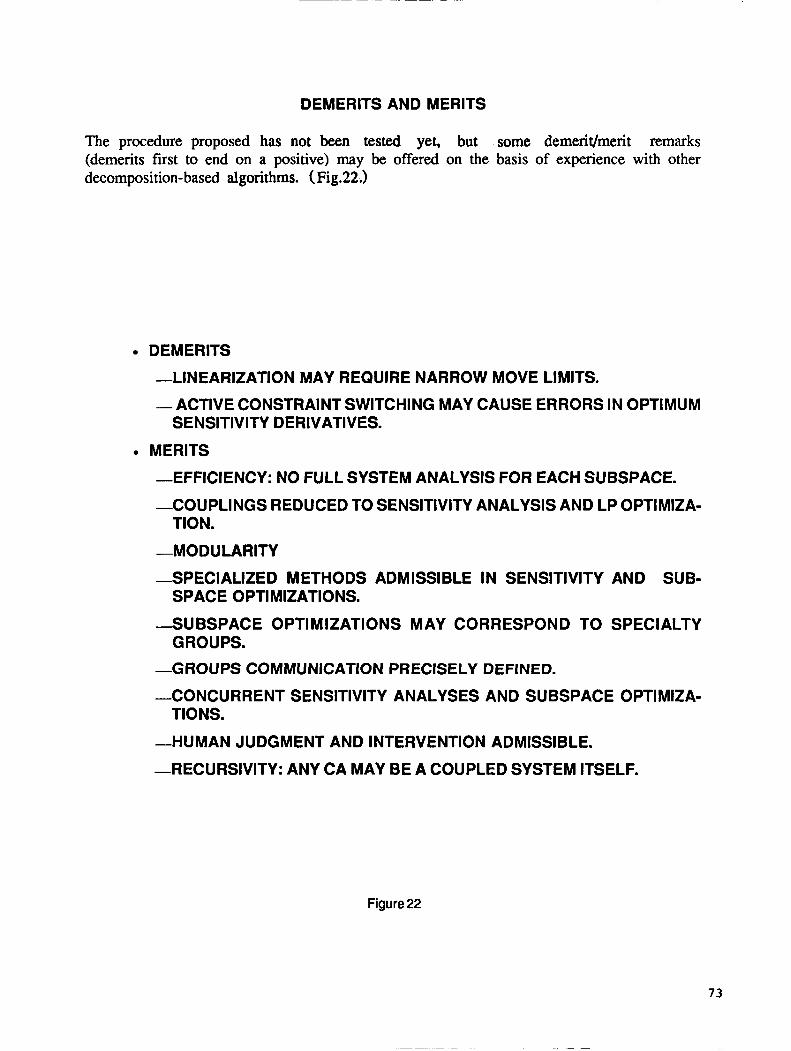
DEMERITS AND MERITS
The procedure proposed has not been tested yet, but some demerit/merit remarks (demerits first to end on a positive) may be offered on the basis of experience with other decomposition-based algorithms. (Fig.22.)
DEMERITS
-LINEARIZATION MAY REQUIRE NARROW MOVE LIMITS.
-ACTIVE CONSTRAINT SWITCHING MAY CAUSE ERRORS IN OPTIMUM SENSITIVITY DERIVATIVES.
MERITS
-EFFICIENCY: NO FULL SYSTEM ANALYSIS FOR EACH SUBSPACE.
-COUPLINGS REDUCED TO SENSITIVITY ANALYSIS AND LP OPTIMIZA- TION.
-MODULARITY
3PEClALlZED METHODS ADMISSIBLE IN SENSITIVITY AND SUB- SPACE 0 PTI MlZATlO NS.
GROUPS. S U B S P A C E OPTIMIZATIONS MAY CORRESPOND TO SPECIALTY
-GROUPS COMMUNICATION PRECISELY DEFINED.
-CONCURRENT SENSITIVITY ANALYSES AND SUBSPACE OPTIMIZA- TIONS.
-HUMAN JUDGMENT AND INTERVENTION ADMISSIBLE.
-RECURSIVITY: ANY CA MAY BE A COUPLED SYSTEM ITSELF.
Figure 22
73
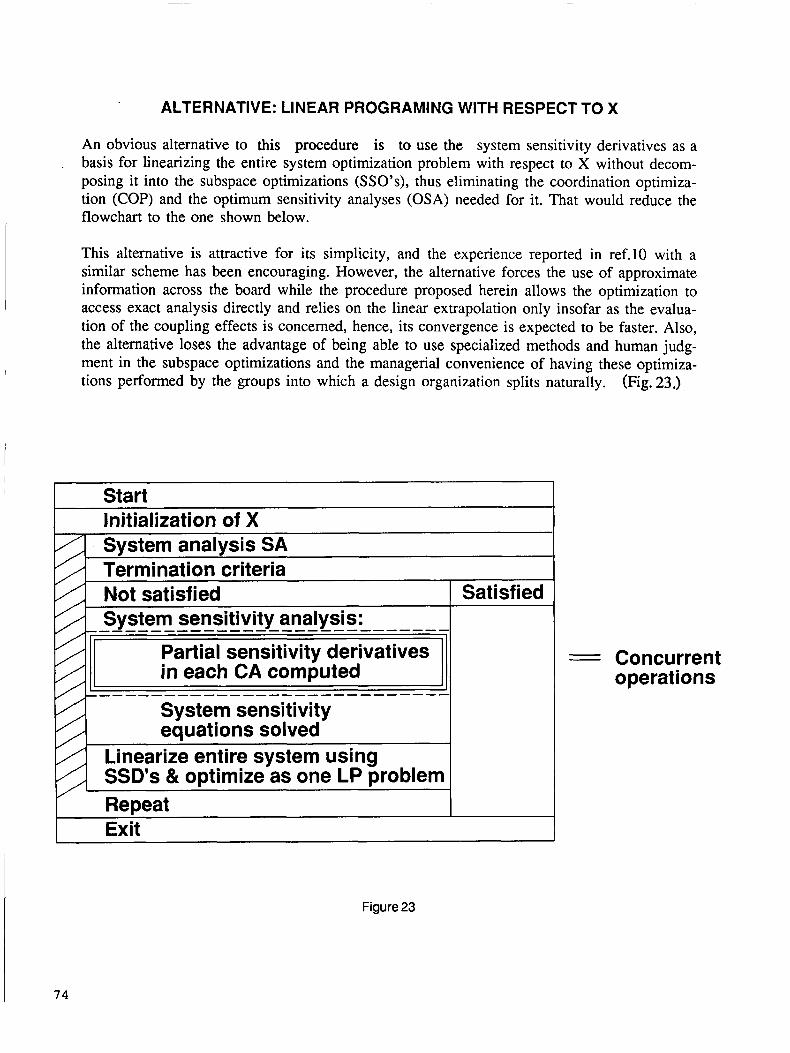
ALTERNATIVE: LINEAR PROGRAMING WITH RESPECT TO X
An obvious alternative to this procedure is to use the system sensitivity derivatives as a basis for linearizing the entire system optimization problem with respect to X without decom- posing it into the subspace optimizations (SSO’s), thus eliminating the coordination optimiza- tion (COP) and the optimum sensitivity analyses (OSA) needed for it. That would reduce the flowchart to the one shown below.
This alternative is attractive for its simplicity, and the experience reported in ref.10 with a similar scheme has been encouraging. However, the alternative forces the use of approximate information across the board while the procedure proposed herein allows the optimization to access exact analysis directly and relies on the linear extrapolation only insofar as the evalua- tion of the coupling effects is concerned, hence, its convergence is expected to be faster. Also, the alternative loses the advantage of being able to use specialized methods and human judg- ment in the subspace optimizations and the managerial convenience of having these optimiza- tions performed by the groups into which a design organization splits naturally. (Fig. 23.)
74
Figure 23
= Concurrent operations
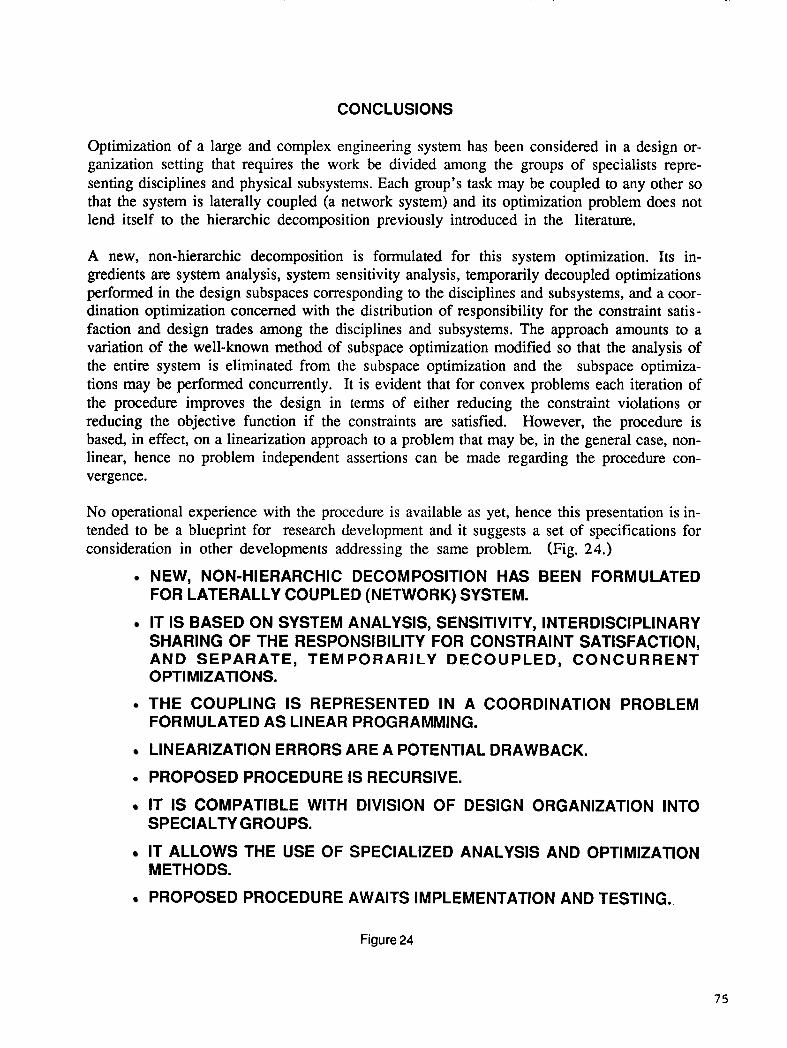
CONCLUSIONS
Optimization of a large and complex engineering system has been considered in a design or- ganization setting that requires the work be divided among the groups of specialists repre- senting disciplines and physical subsystems. Each group’s task may be coupled to any other so that the system is laterally coupled (a network system) and its optimization problem does not lend itself to the hierarchic decomposition previously introduced in the literature.
A new, non-hierarchic decomposition is formulated for this system optimization. Its in- gredients are system analysis, system sensitivity analysis, temporarily decoupled optimizations performed in the design subspaces corresponding to the disciplines and subsystems, and a coor- dination optimization concerned with the distribution of responsibility for the constraint satis - faction and design trades among the disciplines and subsystems. The approach amounts to a variation of the well-known method of subspace optimization modified so that the analysis of the entire system is eliminated from the subspace optimization and the subspace optimiza- tions may be performed concurrently. It is evident that for convex problems each iteration of the procedure improves the design in terms of either reducing the constraint violations or reducing the objective function if the constraints are satisfied. However, the procedure is based, in effect, on a linearization approach to a problem that may be, in the general case, non- linear, hence no problem independent assertions can be made regarding the procedure con- vergence.
No operational experience with the procedure is available as yet, hence this presentation is in- tended to be a blueprint for research development and it suggests a set of specifications for consideration in other developments addressing the same problem. (Fig. 24.)
FOR LATERALLY COUPLED (NETWORK) SYSTEM.
IT IS BASED ON SYSTEM ANALYSIS, SENSITIVITY, INTERDISCIPLINARY SHARING OF THE RESPONSIBILITY FOR CONSTRAINT SATISFACTION, AND SEPARATE, TEMPORARILY DECOUPLED, CONCURRENT 0 PTI MIZATIONS.
FORMULATED AS LINEAR PROGRAMMING.
NEW, NON-HIERARCHIC DECOMPOSITION HAS BEEN FORMULATED
THE COUPLING IS REPRESENTED IN A COORDINATION PROBLEM
LINEARIZATION ERRORS ARE A POTENTIAL DRAWBACK.
PROPOSED PROCEDURE IS RECURSIVE.
IT IS COMPATIBLE WITH DIVISION OF DESIGN ORGANIZATION INTO SPECIALTY GROUPS.
METHODS. IT ALLOWS THE USE OF SPECIALIZED ANALYSIS AND OPTIMIZATION
PROPOSED PROCEDURE AWAITS IMPLEMENTATION AND TESTING.
Figure 24
75

APPENDIX
Initialization of the r Coefficients
The coefficients may be initialized on the basis of the sensitivity information so as to assign a greater responsibility for a cumulative constraint satisfaction to those SSO’s that have rela- tively greater influence on that constraint. From the system sensitivity analysis (SSA) we know the derivatives of the cumulative constraints in each SSO. For the k-th SSO we have
The above derivatives collected for all SSO’s form a matrix
Consider the p-th column of the above matrix and select
Repeating the above for k = 1 + NSS, we assemble thq aPk7s in a vector normalized such that
This vector has an element equal to a unity at the location where the maximal apk appeared and elements smaller than unity everywhere else. The vector is now scaled so that its elements add up to unity and renamed a vector of the coefficients rPk
Elements of the above vector of length NSS may be used as initial values for the rPk coeffi- cients. The total number of the r coefficients for p = 1 -+ NSS is NSS2.
Failure of Finding a Feasible Design in an SSO
The procedure requires that each SSO ends with a feasible solution because the optimum sen- sitivity analysis that follows it is meaningful only at a constrained optimum. Because of the use of the move limits required by linearization it may not be possible to meet that requirement when beginning with an infeasible initial design.
In the above case, one possible way to circumvent the difficulty is to use a constraint relaxa- tion technique described in ref.11. The technique temporarily relaxes the violated constraints to bring them to a critical state and thus satisfies the formalism of a constrained minimum. The relaxation is gradually removed in the subsequent iterations to yield design feasible in a true, physical sense.
76

Another solution readily available in the procedure itself is to reset temporarily an appropriate coefficient t to remove the offending constraint violation. That arbitrary resetting will have the same effect as the technique from ref. 11 and it will cause a violation of the constraint that re- quires that all the tpk coefficients summed over k add up to zero in the coordination optimiza- tion problem (COP). This violation will force a resetting of the t coefficients in the process of solving the COP toward satisfying the violated cumulative constraint by a collective influence of all the SSO’s that affect it.
The r, t, and s Coefficients in System Optimization Procedure
With the entire System Optimization Procedure laid out in a flowchart format, it may be il- luminating to elaborate on the way the procedure is controlled by the coefficients r, t, and s.
The simplest situation occurs when a Cp lis found satisfied after the first SA. Then, its sp is set to 0 and that, in conjunction with its tPk ’s that always are initialized to 0, makes the SSO’s to treat that constraint as an ordinary inequality constraint with 0 on the right hand side. It is like- ly that in at least one SSO that constraint will become critical. If so, its tPk ’s will be adjusted in the COP and the adjusted values will be used in the next SSO’s. If the constraint never be- comes active in any SSO, its t pk ’s remain dormant at the initial setting of 0.
If a Cp is found critical after the first SA, its s p is set to 0 and in the next SSO’s it is treated as an inequality constraint with 0 on the right hand side. Subsequently, its tPk ’s will be adjusted in the COP, and the adjusted values will be used in the next SSO’s.
If a Cp is found violated after the first SA, its sp is set to 1 and its r pk ’s initial values will be used in the SSO’s. Had the SSO’s operated on accurate information only, the constraint would have been driven to a critical status after the f i s t execution of the SSO’s and there would be no need to adjust its rpk ’s in the next COP. However, due to the approximation errors incurred in the SSO’s one cannot rule out that a Cp predicted satisfied or critical in the SSO’s may turn out to be still violated after the next execution of the SA (this may occur also due to inability of finding a feasible design, as discussed in the preceding section of this Appendix). To prepare for that eventuality two actions are taken: the Optimum Sensitivity Derivatives w.r.t. all the r and t coefficients corresponding to that constraint are computed in the next OSA, and the con- straint rpk ’s are adjusted in the subsequent COP.
If the SA in the next pass reveals that the Cp is still violated, then the adjusted values of its rpk ’s will be used in the next SSO to further improve the constraint satisfaction. If the Cp is found satisfied, then it undergoes the treatment described above for a satisfied or critical constraint.
It is apparent from the above that the COP is never executed with a full set of NSS2 variables r and NSS2 variables t because the s-switch makes the rPk and tPk mutually exclusive. That reduces the dimensionality of the COP.
On the other hand, the OSA is carried out for each SSO for a full set of the r’s and a full set of the t’s, at least at the beginning of the procedure until all the s-switches settle in their final set- tings. Using the full sets of r’s and t’s in OSA does not pose a computational cost problem since
77
the partial derivatives w.r.t. these coefficients are trivial to obtain.
REFERENCES
1. Sobieszczanski-Sobieski, J.: A Linear Decomposition Method for Large Optimization Problems - Blueprint for Development. NASA TM 83248, Feb. 1982.
2. Sobieszczanski-Sobieski, J., James,B. B.; and Riley,M. F.: Structural Sizing by Generalized, Multilevel Optimization, AIAA J. Vo1.25, No. 1, January 1987, p.139.
3. Wrenn, G. A.; and Dovi, A. R.: Multilevel Decomposition Approach to the Preliminary Sizing of a Transport Aircraft Wing; AIAA/ASMEi/ASCE/AHS 28th Structures, Dynamics, and Materials Conference, Monterey, Cal., April 6-8, 1987, AIAA Paper No.87-07 14-CP.
4. Barthelemy, J.-F. M.: Engineering Applications of Multilevel Optimization; paper presented at Second NASA/Air Force Symposium on Recent Advances in Multidisciplinary Analysis and Optimization, Sept. 28-30, 1988, Hampton, Virginia. Proceedings published as NASA CP- 3031.
5. Abdi,F. F.; Ide, H.; Shankar, V. J.; and Sobieszczanski-Sobieski, J.: Optimization for Non- linear Aeroelastic Tailoring Criteria, paper presented at Int’l Council for Aeronautical Sc., 16th Congress, Jerusalem, Aug.-Sept., 1988.
6. Sobieszczanski-Sobieski, J.; On the Sensitivity of Complex, Internally Coupled Systems; AIAA/ASME/ASCE/AHS 29th Structures, Structural Dynamics and Materials Conference, Williamsburg, Va, April 1988; AIAA Paper No. CP-88-2378.
7. Kreisselmeier, G.; and Steinhauser, R.: Systematic Control Design by Optimizing a Vector Performance Index; International Federation of Active Control Symposium on Computer- Aided Design of Control Systems, Zurich, Switzerland, Aug. 29-31, 1979.
8. Sobieszczanski-Sobieski, J.; Barthelemy,J.-E. M.; and Riley, K. M.: Sensitivity of Optimum Solutions to Problem Parameters; AIAA J, V01.21, Sept. 1982, pp. 1291-1299.
9. Barthelemy, J.- F.M.; and Sobieszczanski-Sobieski, J.: Optimum Sensitivity Derivatives of Objective Functions in Nonlinear Programing; AIAA J, V01.22, No.6, June 1983, pp.913-915.
10. Vanderplaats, G. N.; Yang, Y. J.; and Kim, D. S.: An Efficient Multilevel Optimization Method for 7hgineering Design, AIAA/ASME/ASCE/AHS 29th Structures, Structural Dynamics and Materials Conference, Williamsburg, Va, April 1988; AIAA Paper No, CP-88- 2226.
11. Barthelemy, J.-F. M.; and Riley, M. F.: Improved Multilevel Optimization Approach for the Design of Complex Engineering Systems; AIAA J., Vo1.26, No.3, March 1988, pp. 353-360.
I

N89- 25150 .. OVERVIEW OF DYNAMICS INTEGRATION RESEARCH @R) PROGRAM
AT LANGLEY RESEARCH CENTER
Goals and Progress
Steven M. Sliwa Guidance and Control Division
Langley Research Center Hampton, Virginia
and
Irving Abel Structural Dynamics Division
Langley Research Center Hampton, Virginia

80
This presentation and paper describes research goals and objectives for an ongoing activity at Langley Research Center. The activity is aimed principally at dynamics optimization for aircraft. The effort involves active participation by the Flight Systems, Structures, and Electronics directorates at LaRC. The Functional Integration Technology (FIT) team has been pursuing related goals since 1985. A prime goal has been the integration and optimization of vehicle dynamics through collaboration at the basic principles or equation level. Some significant technical progress has been accomplished since then and this paper and some others at this symposium capture these results. An augmentation for this activity, Dynamics Integration Research (DIR), has been proposed to NASA Headquarters and is being considered for funding in FY 90 or FY 9 1.

In 1984, NASA and several outside study groups (e.g., Aero 2000) identified multidisciplinary research as a key, untapped opportunity for aeronautical research. NASA Langley prepared a new initiative for pursuing this area. The overall goals and the kickoff chart are represented. If a capability existed to analytically model all the interactions and then numerical procedures were used to iterate the design variables until performance was optimized, many significant benefits would result. These include explicitly optimized configurations, all synergistic multidisciplinary interactions exploited, greater productivity in the design process and an opportunity to all designers to exercise more creativity. Truthfully, at the time, the plans did not go much deeper. An approach had not been worked out for accomplishing the research. The new initiative was not funded. Langley then put together a multidisciplinary technical team to make some recommendations on a technical approach.
AIRCRAFT SYSTEM INTEGRATION GOALS
6
Initial Design Mission Performanct
Iterate Design Degrees of Freedom
o Explicitly Optimize Proposed Configurations o Synergistically Exploit Multidisciplinary Interactions o Speed ConceptuaVPreliminary Design Process o Maximize Designer's Opportunity for Creativity
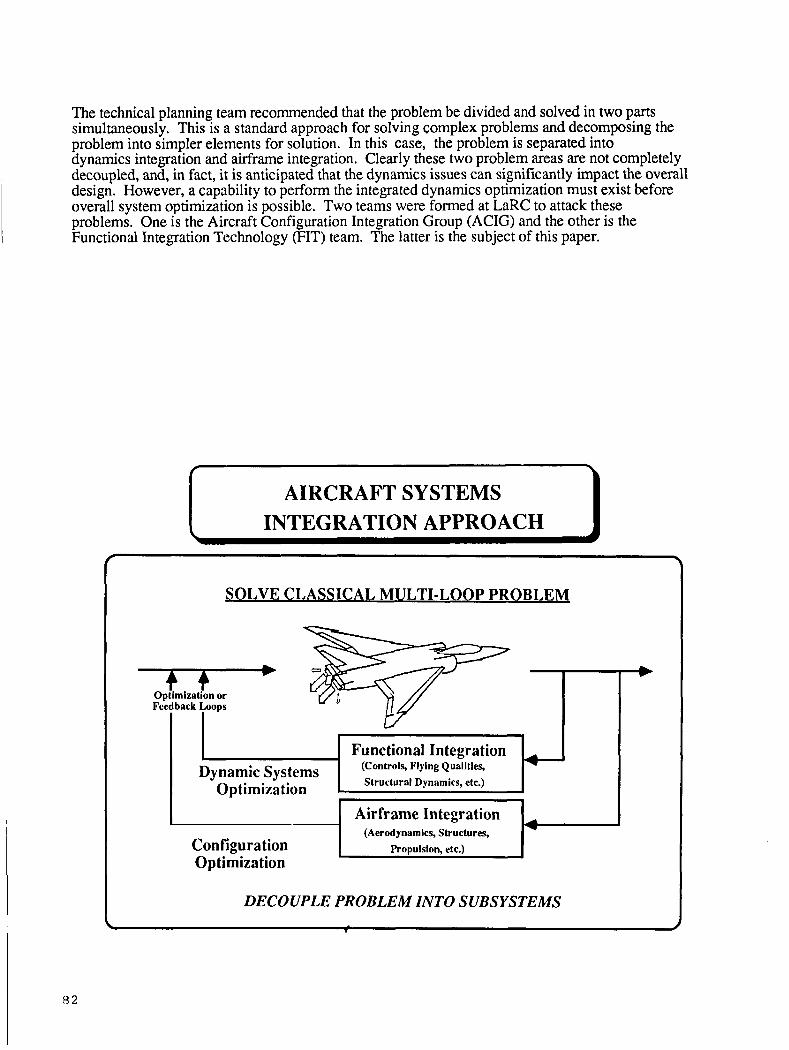
The technical planning team recommended that the problem be divided and solved in two parts simultaneously. This is a standard approach for solving complex problems and decomposing the problem into simpler elements for solution. In this case, the problem is separated into dynamics integration and airframe integration. Clearly these two problem areas are not completely decoupled, and, in fact, it is anticipated that the dynamics issues can significantly impact the overall design. However, a capability to perform the integrated dynamics optimization must exist before overall system optimization is possible. Two teams were formed at LaRC to attack these problems. One is the Aircraft Configuration Integration Group (ACIG) and the other is the Functional Integration Technology (FIT) team. The latter is the subject of this paper.
AIRCRAFT SYSTEMS INTEGRATION APPROACH
SOLVE CLASSICAL MULTI-LOOP PROBLEM
Functional Integration (Controls, Flying Qualities, Structural Dynamics, etc.)
Dynamic Systems
Airframe Integration (Aerodynamics, Structures,
Configuration Propulsion, etc.) Optimization
DECOUPLE PROBLEM INTO SUBSYSTEMS
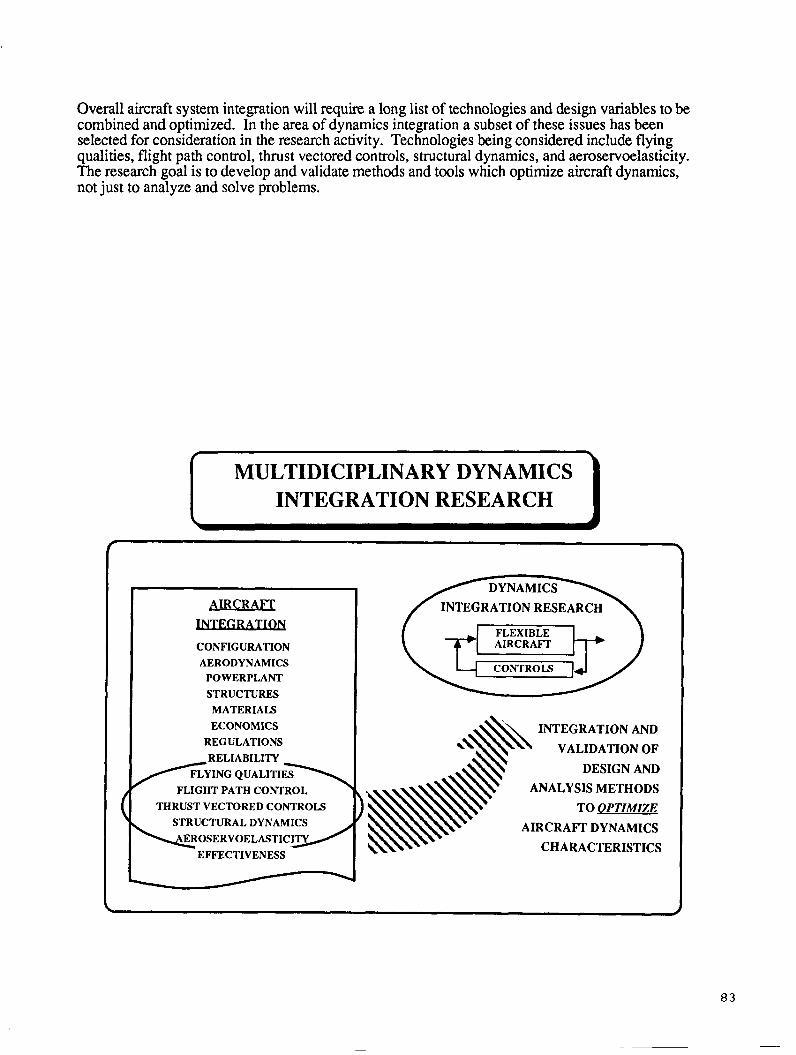
Overall aircraft system integration will require a long list of technologies and design variables to be combined and optimized. In the area of dynamics integration a subset of these issues has been selected for consideration in the research activity. Technologies being considered include flying qualities, flight path control, thrust vectored controls, structural dynamics, and aeroservoelasticity. The research goal is to develop and validate methods and tools which optimize aircraft dynamics, not just to analyze and solve problems.
I MULTIDICIPLINARY DYNAMICS 1 INTEGRATION RESEARCH
AlRCRAFT I" CONFIGURATION AERODYNAMICS
PO WERPLANT STRUCTURES
MATERIALS ECONOMICS
REGULATIONS
T FLIGHT PATH CONTROL - THRUST VECTORED CONTROLS
STRUCTURAL DYNAMICS \OSERVOELaTIC/
\ EFFECTIVENESS
INTEGRATION RESEARCH
INTEGRATION AND VALIDATION OF
DESIGN AND ANALYSIS METHODS
TO OPTIMIZE AIRCRAFT DYNAMICS
CHARACTERISTICS
8 3
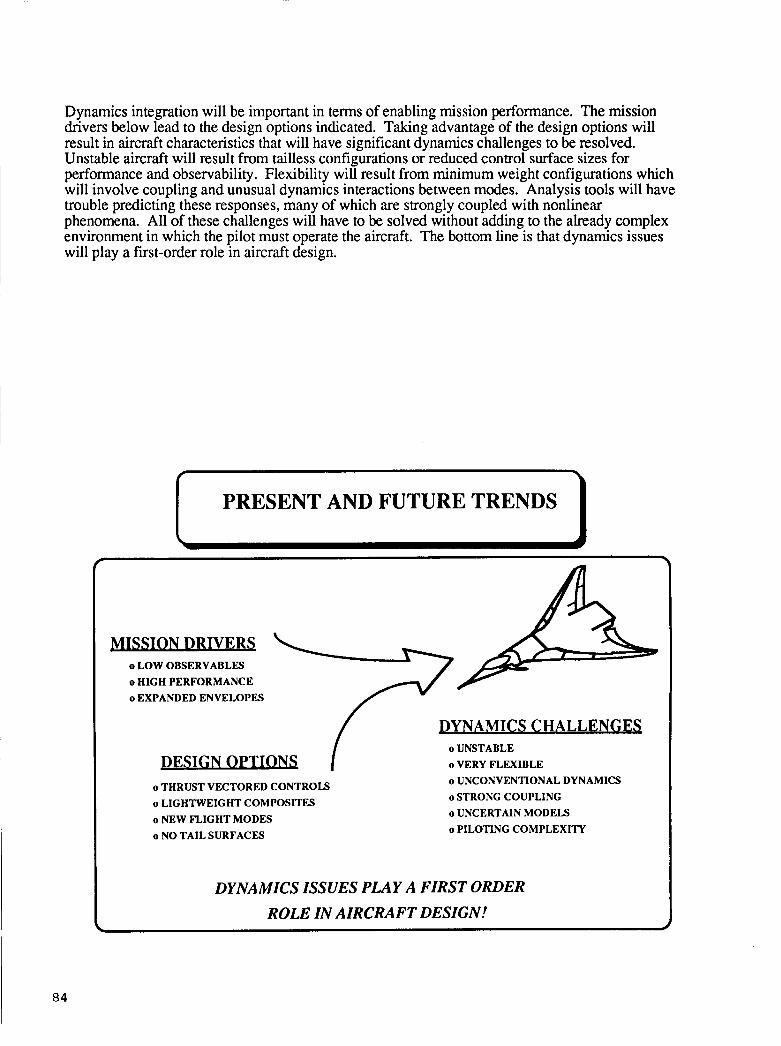
Dynamics integration will be important in terms of enabling mission performance. The mission drivers below lead to the design options indicated. Taking advantage of the design options will result in aircraft characteristics that will have significant dynamics challenges to be resolved. Unstable aircraft will result from tailless configurations or reduced control surface sizes for performance and observability. Flexibility will result from minimum weight configurations which will involve coupling and unusual dynamics interactions between modes. Analysis tools will have trouble predicting these responses, many of which are strongly coupled with nonlinear phenomena. All of these challenges will have to be solved without adding to the already complex environment in which the pilot must operate the aircraft. The bottom line is that dynamics issues will play a first-order role in aircraft design.
I PRESENT AND FUTURE TRENDS
SSION DRIVERS o LOW OBSERVABLES o HIGH PERFORMANCE o EXPANDED ENVELOPES
DESIGN 0 PTIONS I o THRUST VECTORED CONTROLS o LIGHTWEIGHT COMPOSITES o NEW FLIGHT MODES o NO TAIL SURFACES
DYNAM ICs c HALLENGES o UNSTABLE o VERY FLEXIBLE o UNCONVENTIONAL DYNAMICS o STRONG COUPLING o UNCERTAIN MODELS o PILOTING COMPLEXITY
DYNAMICS ISSUES PLAY A FIRST ORDER ROLE IN AIRCRAFT DESIGN!
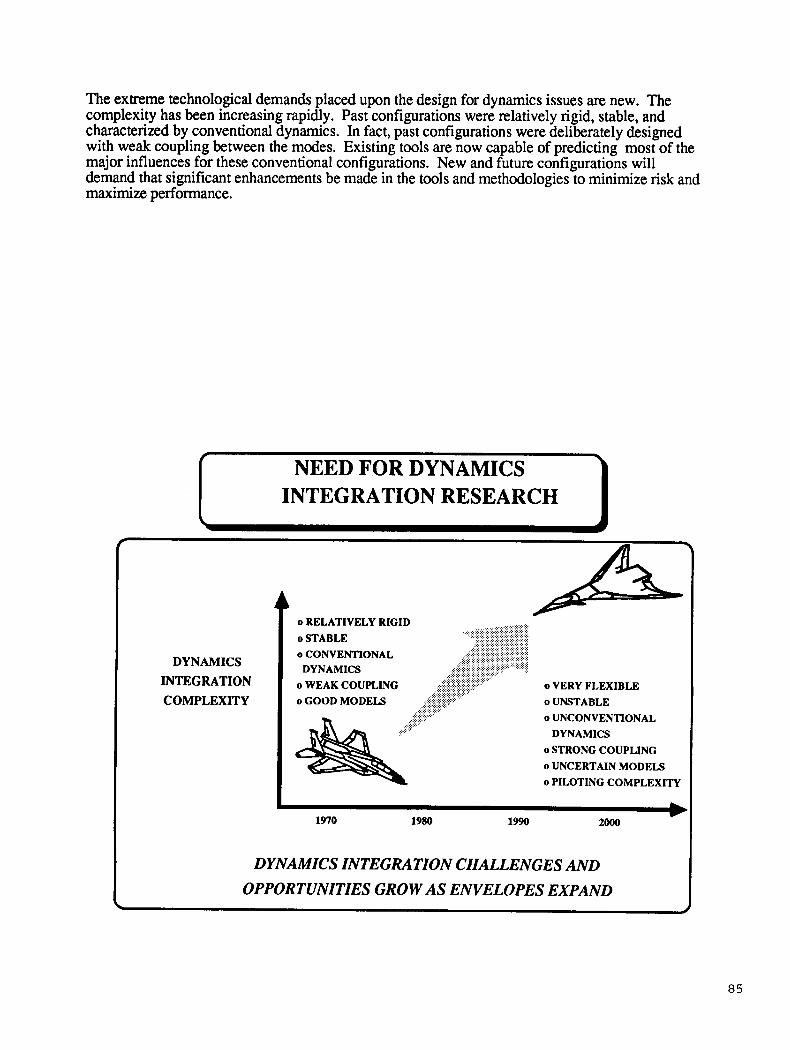
The extreme technological demands placed upon the design for dynamics issues are new. The complexity has been increasing rapidly. Past configurations were relatively rigid, stable, and characterized by conventional dynamics. In fact, past configurations were deliberately designed with weak coupling between the modes. Existing tools are now capable of predicting most of the major influences for these conventional configurations. New and future configurations will demand that significant enhancements be made in the tools and methodologies to minimize risk and maximize performance.
I NEED FOR DYNAMICS INTEGRATION RESEARCH
DYNAMICS INTEGRATION COMPLEXITY
o RELATIVELY RIGID o STABLE o CONVENTIONAL
o WEAK COUPLING o GOOD MODELS o UNSTABLE
DYNAMICS o VERY FLEXIBLE
o UNCONVENTIONAL DYNAMICS
o STRONG COUPLING o UNCERTAIN MODELS o PILOTING COMPLEXITY
1970 1980 1990 2000
DYNAMICS INTEGRATION CHALLENGES AND OPPORTUNITIES GROW AS ENVELOPES EXPAND
85
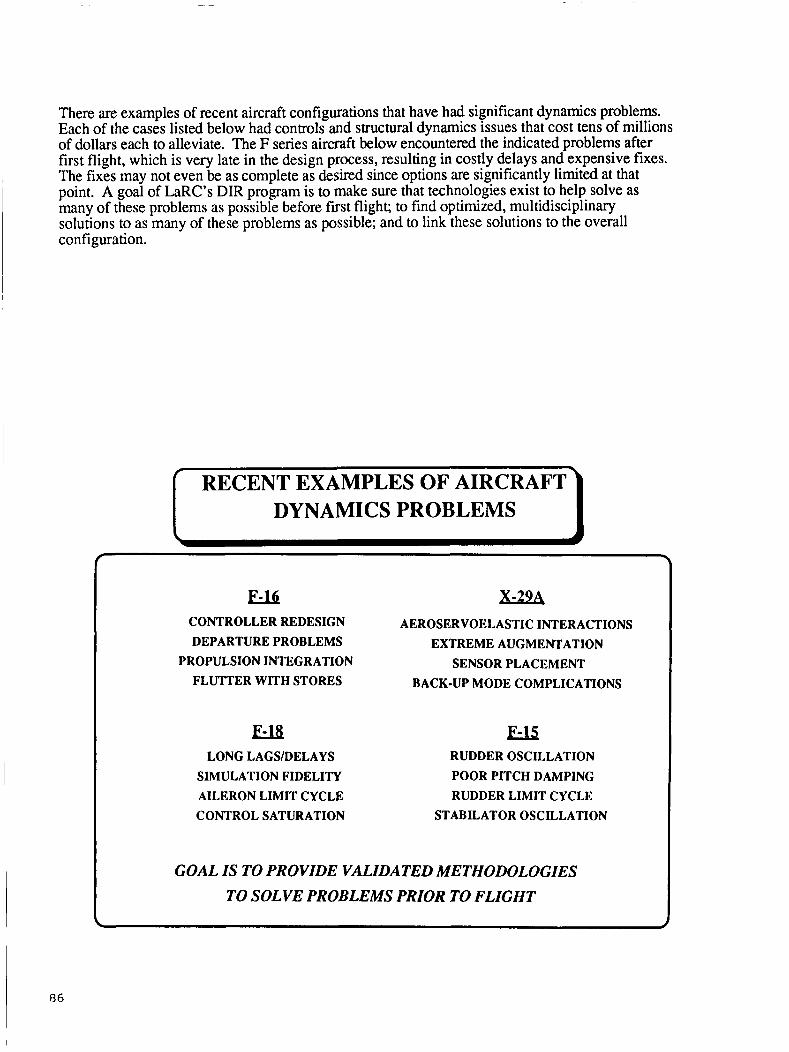
There are examples of recent aircraft configurations that have had significant dynamics problems. Each of the cases listed below had controls and structural dynamics issues that cost tens of millions of dollars each to alleviate. The F series aircraft below encountered the indicated problems after first flight, which is very late in the design process, resulting in costly delays and expensive fixes. The fixes may not even be as complete as desired since options are significantly limited at that point. A goal of LaRC’s DIR program is to make sure that technologies exist to help solve as many of these problems as possible before first flight; to find optimized, multidisciplinary solutions to as many of these problems as possible; and to link these solutions to the overall configuration.
I RECENT EXAMPLES OF AIRCRAFT I DYNAMICS PROBLEMS
u X-29A CONTROLLER REDESIGN AEROSERVOELASTIC INTERACTIONS DEPARTURE PROBLEMS EXTREME AUGMENTATION
PROPULSION INTEGRATION SENSOR PLACEMENT FLUTTER WITH STORES BACK-UP MODE COMPLICATIONS
E a u . 5 LONG LAGSlDELAYS RUDDER OSCILLATION
SIMULATION FIDELITY POOR PITCH DAMPING AILERON LIMIT CYCLE RUDDER LIMIT CYCLE CONTROL SATURATION STABILATOR OSCILLATION
GOAL IS TO PROVIDE VALIDATED METHODOLOGIES TO SOLVE PROBLEMS PRIOR TO FLIGHT
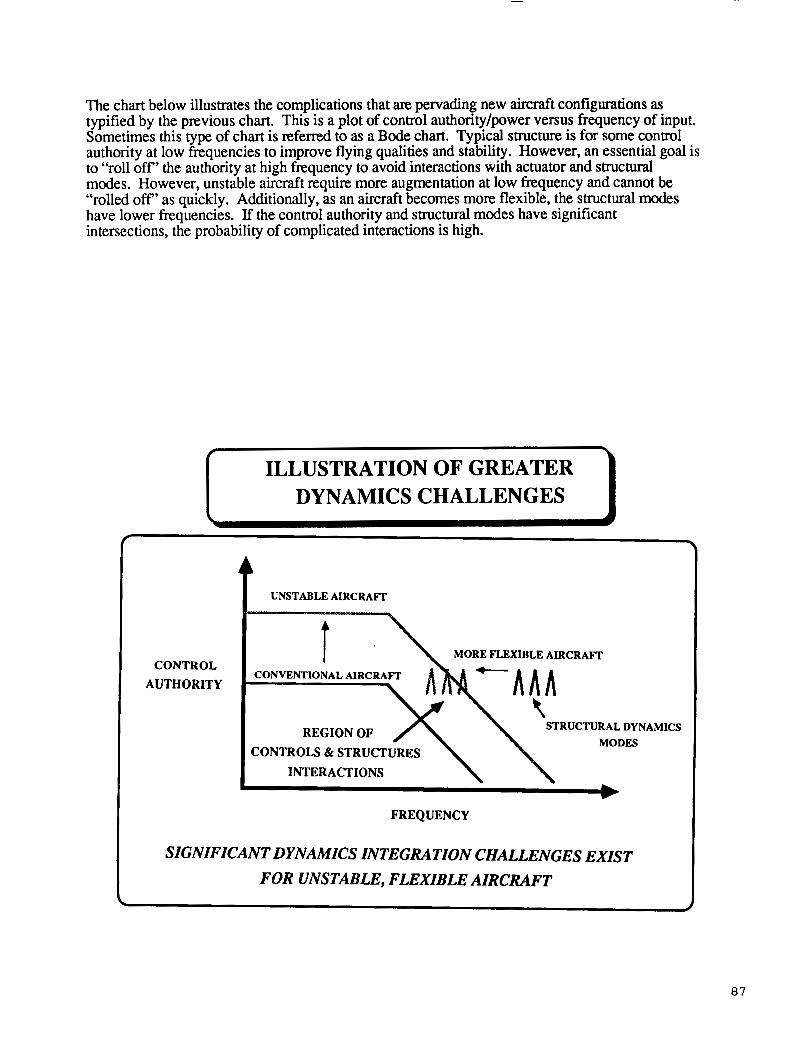
The chart below illustrates the complications that are pervading new aircraft configurations as typified by the previous chart. This is a plot of control authority/power versus frequency of input. Sometimes this type of chart is referred to as a Bode chart. Typical structure is for some control authority at low frequencies to improve flying qualities and stability. However, an essential goal is to “roll off’ the authority at high frequency to avoid interactions with actuator and structural modes. However, unstable aircraft require more augmentation at low frequency and cannot be “rolled off’ as quickly. Additionally, as an aircraft becomes more flexible, the structural modes have lower frequencies. If the control authority and structural modes have significant intersections, the probability of complicated interactions is high.
ILLUSTRATION OF GREATER DYNAMICS CHALLENGES
UNSTABLE AIRCRAm
~ CONTROL AUTHORITY
t , \ MORE FLEXIBLE AIRCRAFT
CONVENTIONAL AIRCRAFT
STRUCTURA DYNAMICS MODES
REGION OF CONTROLS & STRUCTURES
INTERACTIONS
FREQUENCY
SIGNIFICANT DYNAMICS INTEGRATION CHALLENGES EXIST FOR UNSTABLE, FLEXIBLE AIRCRAFT
87
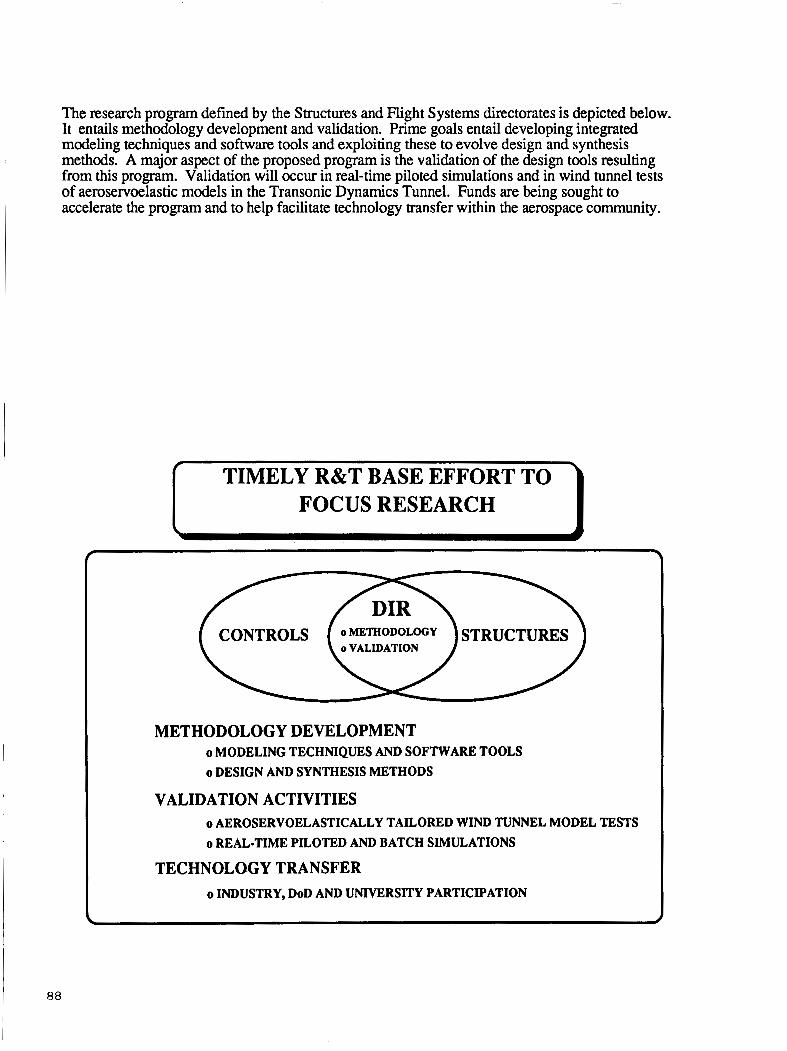
The research program defined by the Structures and Flight Systems directorates is depicted below. It entails methodology development and validation. Prime goals entail developing integrated modeling techniques and software tools and exploiting these to evolve design and synthesis methods. A major aspect of the proposed program is the validation of the design tools resulting from this program. Validation will occur in real-time piloted simulations and in wind tunnel tests of aeroservoelastic models in the Transonic Dynamics Tunnel. Funds are being sought to accelerate the program and to help facilitate technology transfer within the aerospace community.
TIMELY R&T BASE EFFORT TO FOCUS RESEARCH
STRUCTURES o VALIDATION
METHODOLOGY DEVELOPMENT o MODELING TECHNIQUES AND SOFTWARE TOOLS o DESIGN AND SYNTHESIS METHODS
VALIDATION ACTIVITIES o AEROSERVOELASTICALLY TAILORED WIND TUNNEL MODEL TESTS o REAL-TIME PILOTED AND BATCH SIMULATIONS
TECHNOLOGY TRANSFER o INDUSTRY, DoD AND UNIVERSITY PARTICIPATION

This chart represents some of the payoffs that might be accomplished if such a program is fully funded. The list includes performance benefits if a configuration is completely redesigned to exploit technologies that might result from the DIR program. Additionally, increases in reliability and effectiveness of the design tools and methods result.
I DIR PAYOFFS & GOALS I o 25% INCREASE IN AIRCRAFT AGILITY o 15% INCREASE IN ENVELOPE VELOCITY WITH STORES
o SUPERSONIC PERFORMANCE UNCOMPROMISED DUE TO
o MINIMIZED NEED FOR EXPENSIVE "FIXES" AFTER
o 30% DECREASE IN TAKE-OFF GROSS WEIGHT
LOW-SPEED CONSTRAINTS AND FLYING QUALITIES
FIRST FLIGHT
LINARY PAYOFFS & GOAM
o VALIDATED AEROSERVOELASTIC ANALYSIS AND DESIGN TOOLS
- TAILORED WIND TUNNEL MODEL TESTS
o INCREASED EFFECTIVENESS OF REAL-TIME SIMULATION
- IMPROVED FIDELITY & REDUCED TIME FOR DESIGN ITERATIONS
89
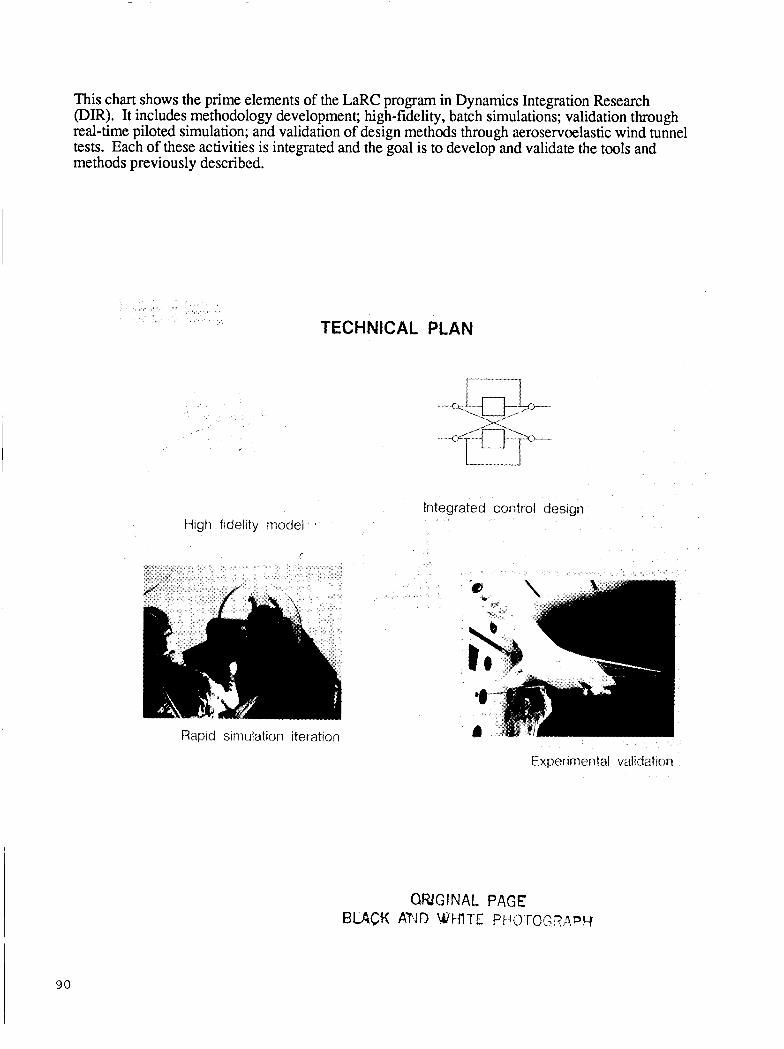
This chart shows the prime elements of the LaRC program in Dynamics Integration Research (DIR). It includes methodology development; high-fidelity, batch simulations; validation through real-time piloted simulation; and validation of design methods through aeroservoelastic wind tunnel tests. Each of these activities is integrated and the goal is to develop and validate the tools and methods previously described.
TECHNICAL PLAN
l-----l
u
Integrated control design High fidelity rnodel .
Rapid simulation iteration
Experimental validation

A comparison of present design methodologies with proposed methodologies that will be enabled through the pursuit of DIR is shown below. Presently, control system design and structural design (for dynamics) are two separate and distinct functions. At some point the control system team typically delivers time histones of typical evaluation maneuvers to the structural dynamicists who analyze for structural load integrity. When the design has converged, the airplane is built and flown. Almost all recent airplanes have had significant problems with structural dynamics, controls systems, and flying qualities. Some examples were described in a previous chart. Once the airplane prototype is built and flown, many options to redesign and fix the problems no longer exist. The two basic options included redesigning the control system, which is quite expensive, and an alternative and less favorable approach, redesigning the structure (and the tooling jig, etc.). This latter option is prohibitively expensive and time-consuming. A better approach would be to allow the two teams to integrate their approaches and work with common models. In fact, if they go to simulation and generate structural loads data as well as flying qualities types of information, the cost of building and flying will be significantly reduced.
CONTROL SYSTEM DESIGN +
I METHODOLOGIES FOR SOLVING 1 STRUCTURAL LOADS PROBLEMS
SIMULATION STRUCTURAL - . DYNAMICS
MISSION A t h - REQUlREMENTS
CONTROL SYSTEM DESIGN
- MISSION \ - - - - - - - - - - SIMULATION .m+
REQUIREMENTS MINIMIZED STRUCTURAL
DESIGN - LOADS AND S ~ U C T U R A L i DYNAMICS PROBLEMS
BLJILD AND PROBLEMS
F-18 FLY
91
4 AFH-16 \ STRUCTURAL DESIGN SHUTTLE
ETC VERY EXPENSIVE
.........................................................
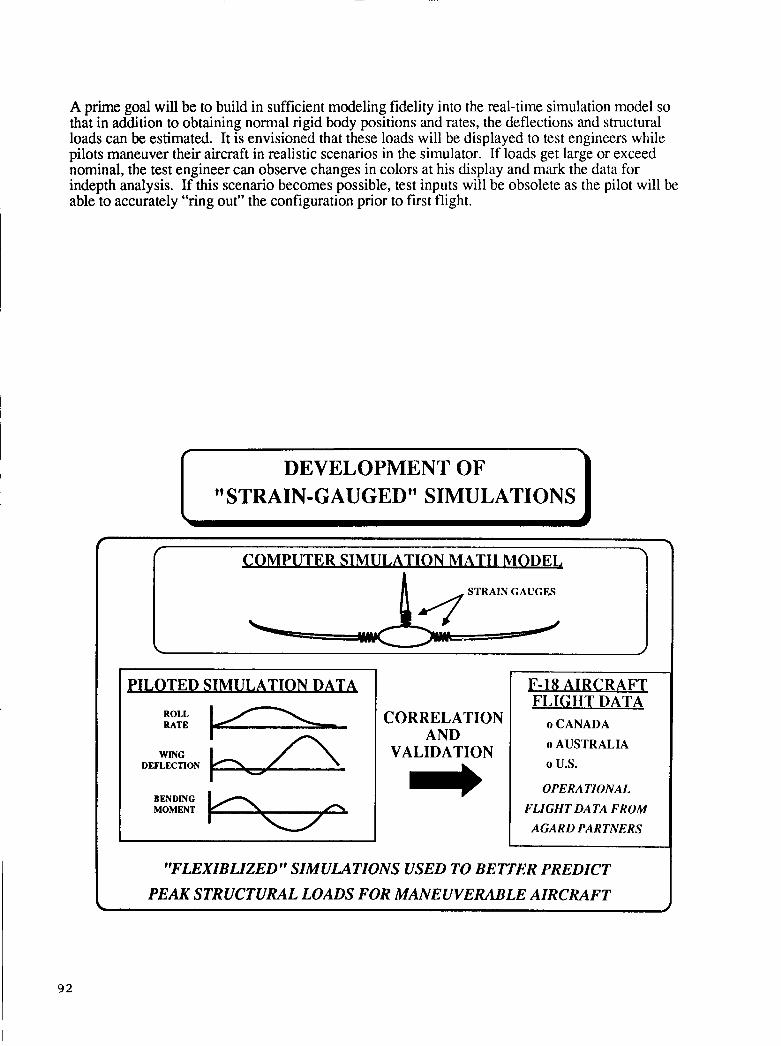
A prime goal will be to build in sufficient modeling fidelity into the real-time simulation model so that in addition to obtaining normal rigid body positions and rates, the deflections and structural loads can be estimated. It is envisioned that these loads will be displayed to test engineers while pilots maneuver their aircraft in realistic scenarios in the simulator. If loads get large or exceed nominal, the test engineer can observe changes in colors at his display and mark the data for indepth analysis. If this scenario becomes possible, test inputs will be obsolete as the pilot will be able to accurately "ring out" the configuration prior to fiist flight.
PUTER SIMULA TION MATH MODEL
STRAIN GAUGES
I DEVELOPMENT OF I "STRAIN-GAUGED" SIMULATIONS
PILOTED SIMULATION DATA
RATE - wmc
BENDING MOMENT
CORRELATION AND
VALIDATION
F-18 AIRCRAFT FLIGHT DATA
o CANADA o AUSTRALIA 0 u s .
OPERATIONAL FLIGHT DATA FROM
AGARL) PARTNERS
'IFLEXIBLIZED" SIMULATIONS USED TO BETTER PREDICT PEAK STRUCTURAL LOADS FOR MANEUVERABLE AIRCRAFT

One accomplishment that the FIT team has contributed is a modeling methodology that constructs high-fidelity, truth models. The process has been automated significantly and involves integrating information from wind tunnels, CFD and panel, steady aerodynamic codes, unsteady aerodynamic codes and other sources into a nonlinear model. The model maintains the structure needed for nonlinear maneuvers and integrates in the structural dynamics in a rigorous way. During the model integration many terms were uncovered that are typically ignored and could be important for highly maneuverable and flexible vehicles. Tools were developed to check coordinate systems as models were transferred from one discipline to another. The result is a large parent model that is detailed enough to compute air combat maneuvers. When the parent model is trimmed, a by-product is its deflected shape. If the parent model is operated at high enough speed, it flutters. This model is too complex to be used for real-time simulation or probably with direct design tools, but such models could be extracted. The benefit is that if a common model is used for each discipline, the integration process has been fostered.
HIGH-FIDELITY OR TRUTH MODEL HAS BEEN DEVELOPED TO COUPLE AEROSERVOELASTICITY AND FLIGHT DYNAMICS
I HIGH-FIDELITY, TRUTH MODEL 1 INTEGRATES DISCIPLINES
r
COMMANDED AILERON STEP Mt.7, SEA LEVEL
0
P (degl=)
- 240
NONLINEAR MANEUVERING FLIGHT MODEL - RIGID
1 0 TIME (seconds)
LINEAR AEROSERVOELASTIC MODEL
9 3
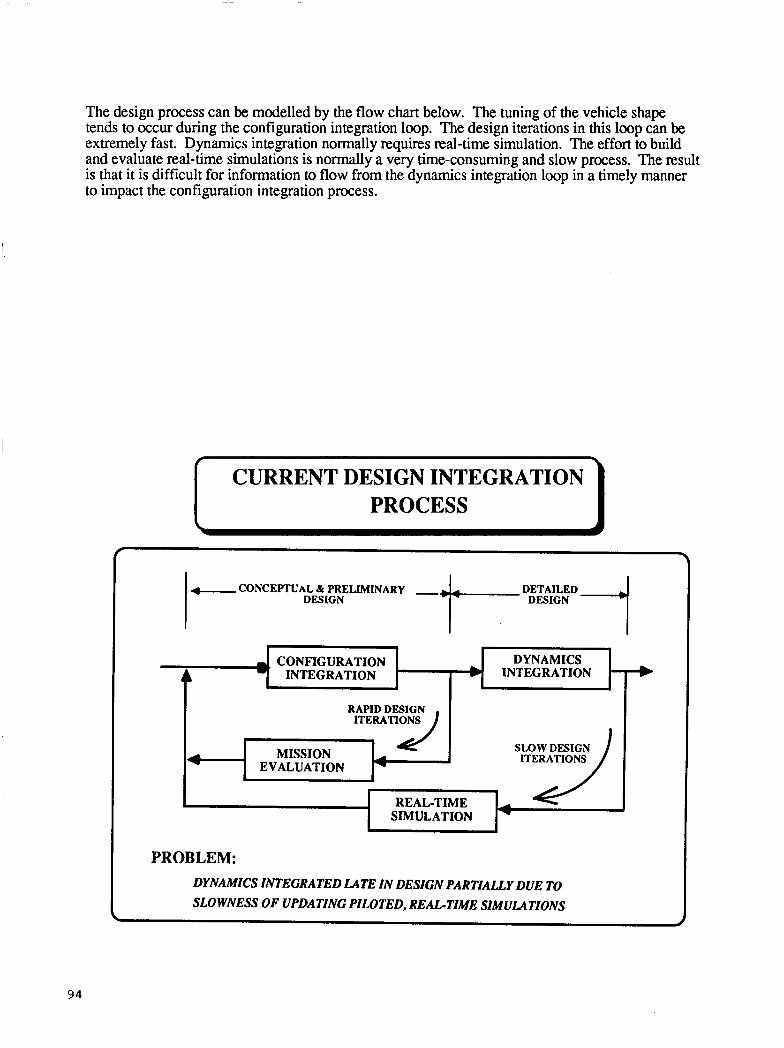
The design process can be modelled by the flow chart below. The tuning of the vehicle shape tends to occur during the configuration integration loop. The design iterations in this loop can be extremely fast. Dynamics integration normally requires real-time simulation. The effort to build and evaluate real-time simulations is normally a very time-consuming and slow process. The result is that it is difficult for information to flow from the dynamics integration loop in a timely manner to impact the configuration integration process.
DYNAMICS , CONFIGURATION A INTEGRATION A INTEGRATION
RAPID DESIGN ITERATIONS
SLOW DESIGN 4 MISSION ITERATIONS EVALUATION
REAL-TIME SIMULATION
PROBLEM: DYNAMICS INTEGRATED LATE IN DESIGN PARTIALLY DUE TO SLOWNESS OF UPDATING PILOTED, REALTIME SIMULATIONS
d
I CURRENT DESIGN INTEGRATION PROCESS
4 CONCEPTUAL & PRELIMINARY - DESIGN
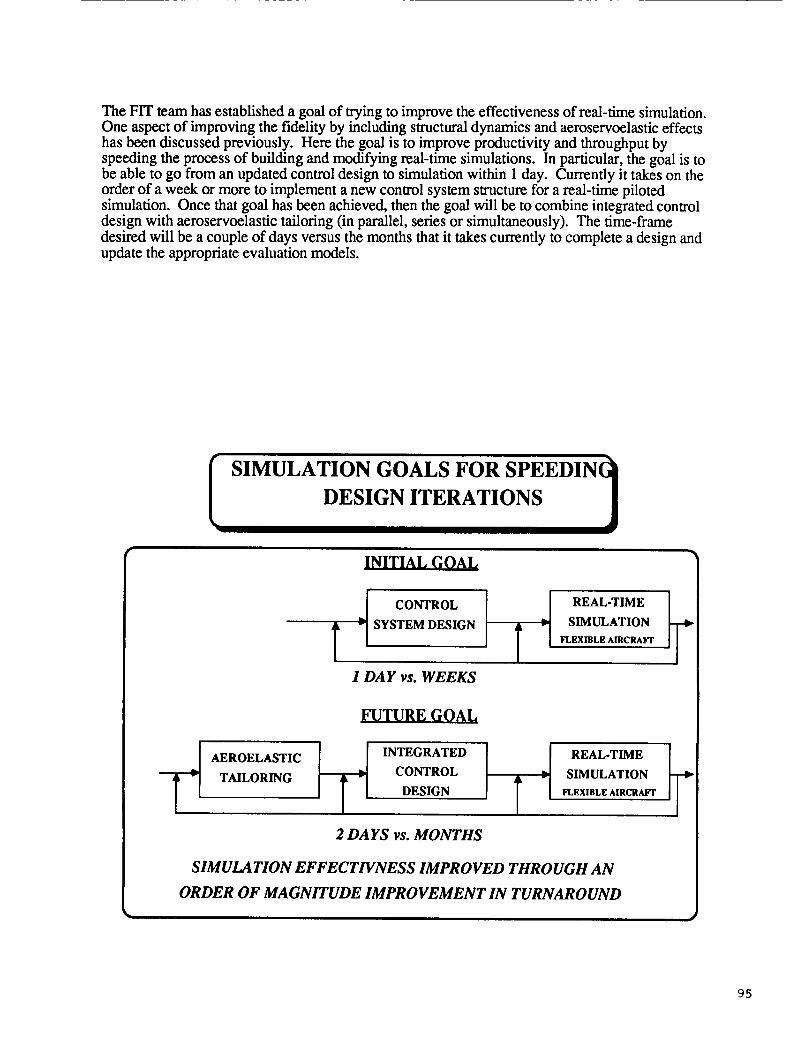
The FIT team has established a goal of trying to improve the effectiveness of real-time simulation. One aspect of improving the fidelity by including structural dynamics and aeroservoelastic effects has been discussed previously. Here the goal is to improve productivity and throughput by speeding the process of building and modifying real-time simulations. In particular, the goal is to be able to go from an updated control design to simulation within 1 day. Currently it takes on the order of a week or more to implement a new control system structure for a real-time piloted simulation. Once that goal has been achieved, then the goal will be to combine integrated control design with aeroservoelastic tailoring (in parallel, series or simultaneously). The time-frame desired will be a couple of days versus the months that it takes currently to complete a design and update the appropriate evaluation models.
’
SIMULATION GOALS FOR SPEEDIN DESIGN ITERATIONS
w
CONTROL REAL-TIME
SYSTEM DESIGN 0 SIMULATION FLEXIBLE AIRCRAFT
A ’
I DAY vs. WEEKS
AEROELASTIC INTEGRATED REAL-TIME ’ + SIMULATION --I CONTROL TAILORING DESIGN FLEXIBLE AIRCRAFT
FUTURE GOAL,
SIMULATION EFFECTIVNESS IMPROVED THROUGH AN ORDER OF MAGNITUDE IMPROVEMENT IN TURNAROUND
95
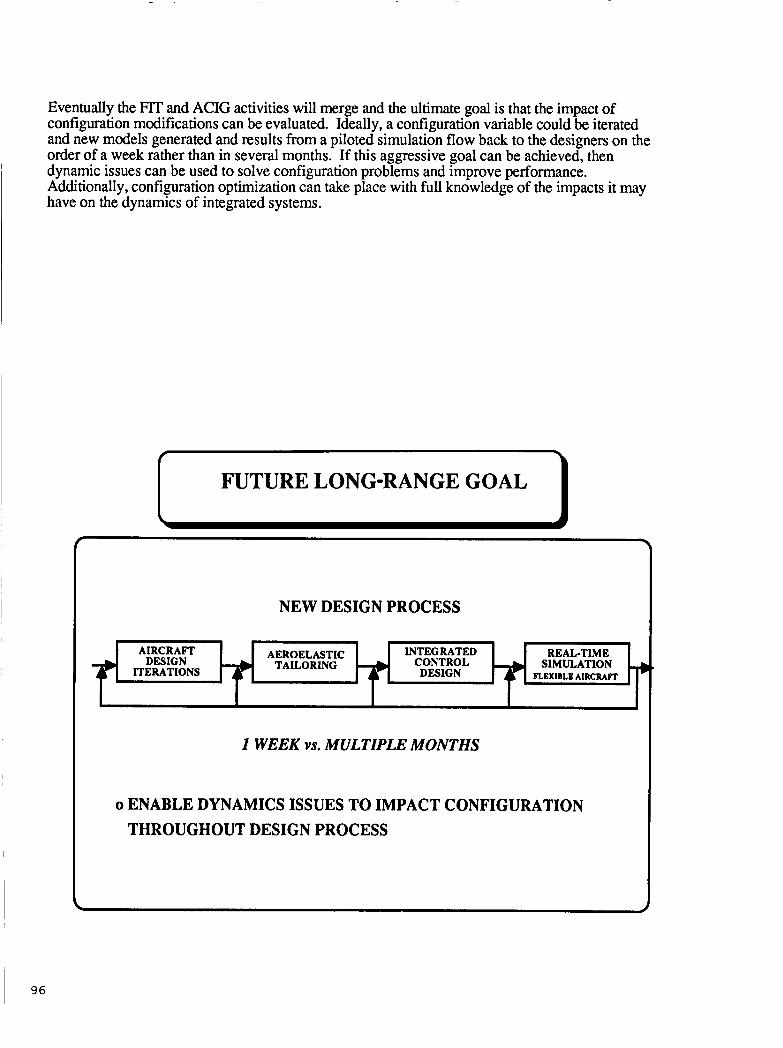
96
INTEGRATED CONTROL AEROELASTIC AIRCRAm
ITERATIONS DESIGN DESIGN TAILORING
Eventually the FIT and ACIG activities will merge and the ultimate goal is that the impact of configuration modifications can be evaluated. Ideally, a configuration variable could be iterated and new models generated and results from a piloted simulation flow back to the designers on the order of a week rather than in several months. If this aggressive goal can be achieved, then dynamic issues can be used to solve configuration problems and improve performance. Additionally, configuration optimization can take place with full knowledge of the impacts it may have on the dynamics of integrated systems.
REAL-TIME SIMULATION
FLEXIBLE AIRCRAm '
I FUTURE LONG-RANGE GOAL
NEW DESIGN PROCESS
I WEEK vs. MULTIPLE MONTHS
o ENABLE DYNAMICS ISSUES TO IMPACT CONFIGURATION THROUGHOUT DESIGN PROCESS
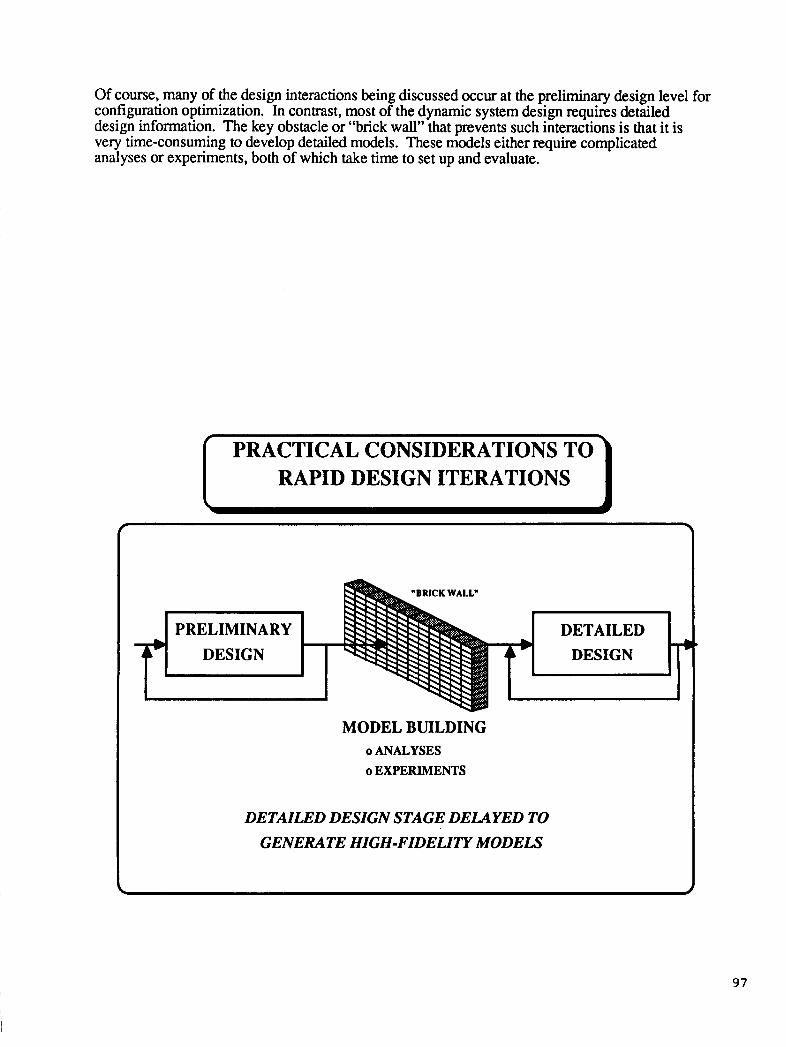
Of course, many of the design interactions being discussed occur at the preliminary design level for configuration optimization. In contrast, most of the dynamic system design requires detailed design information. The key obstacle or “brick wall” that prevents such interactions is that it is very time-consuming to develop detailed models. These models either require complicated analyses or experiments, both of which take time to set up and evaluate.
I PRACTICAL CONSIDERATIONS TO RAPID DESIGN ITERATIONS
I PRELIMINARY I DESIGN I I DETAILED I
DESIGN M MODEL BUILDING
o ANALYSES o EXPERIMENTS
DETAILED DESIGN STAGE DELAYED TO GENERATE HIGH-FIDELITY MODELS
97
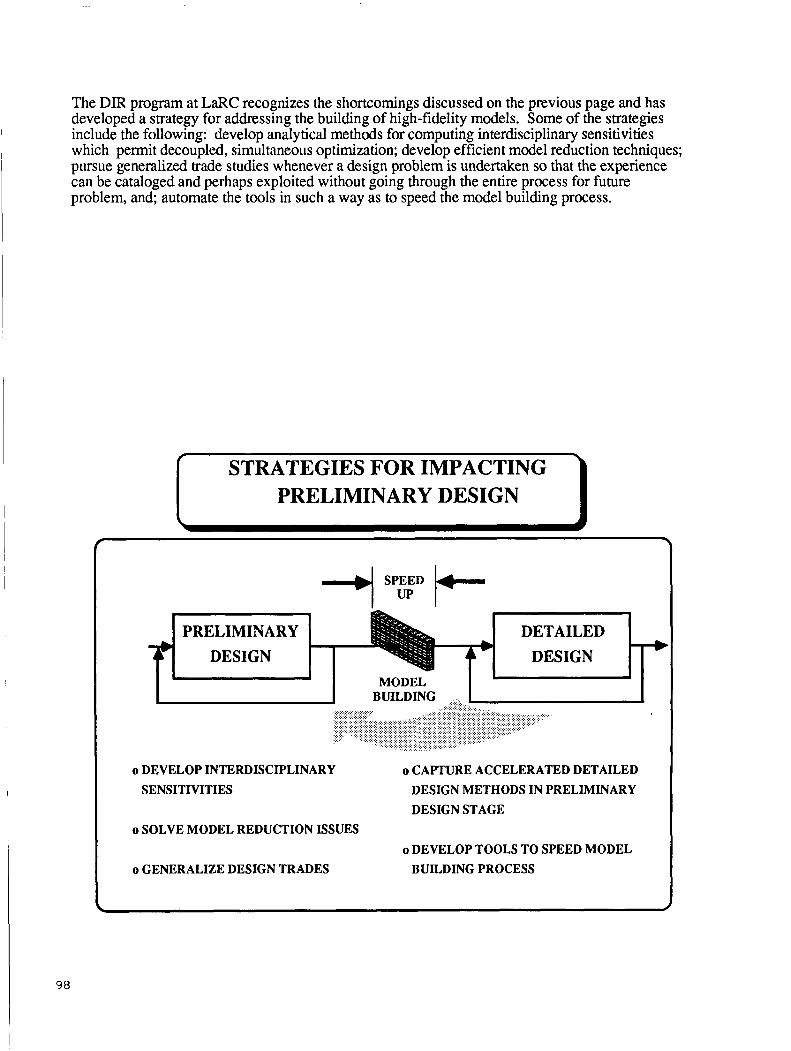
The DIR program at LaRC recognizes the shortcomings discussed on the previous page and has developed a strategy for addressing the building of high-fidelity models. Some of the strategies include the following: develop analytical methods for computing interdisciplinary sensitivities which permit decoupled, simultaneous optimization; develop efficient model reduction techniques; pursue generalized trade studies whenever a design problem is undertaken so that the experience can be cataloged and perhaps exploited without going through the entire process for future problem, and; automate the tools in such a way as to speed the model building process.
98
STRATEGIES FOR IMPACTING PRELIMINARY DESIGN I
PRELIMINARY
o DEVELOP INTERDISCIPLINARY o CAPTURE ACCELERATED DETAILED SENSITIVITIES DESIGN METHODS IN PRELIMINARY
I DESIGN STAGE o SOLVE MODEL REDUCTION ISSUES
o DEVELOP TOOLS TO SPEED MODEL o GENERALIZE DESIGN TRADES BUILDING PROCESS

A summary of the key technology areas is shown. For each area a set of challenges is listed. For each challenge, an indication of the status of the available tools in terms of validation and maturity is indicated. As can be seen, at best in this multidisiciplinary focus the validation and maturity status of any particular technology area is marginal. A lot of experimental work is needed to enable designers to address these types of complicated and challenging problems. Methods cannot be integrated into design methodologies unless they have been validated to a sufficient level to permit the confident use of them for vehicle analysis and synthesis.
CHALLENGES o SEPARATED AND VORTEX FLOWS o TRANSONIC o CONTROL EFFECTIVENESS
TECHNICAL AREAS NEEDING I EXPERIMENTAL VALIDATION
STATUS POOR EMERGING MARGINAL
AREA
o HIGH GAIN CONTROLS o HIGHLY FLEXIBLE STRUCTURES
UNSTEADY AERODYNAMICS
EMERGING EMERGING
STRUCTURAL LOADS & RESPONSE
o INTEGRATED STATICDYNAMIC
o SENSITIVITY
AEROELASTIC TAILORING
AEROSERVO- ELASTICITY
POOR
MARGINAL
CONTROL LAW DESIGN
STRUCTURE/CONTROL DESIGN
o NON-LINEAR o BUFFET
POOR MARGINAL
o MULTI-CONTROL o MULTI-FUNCTION
EMERGING EMERGING
99

This chart shows what it means to validate methods. Various analytical schemes exist already or are under development. These sketches illustrate obtaining experimental data that corresponds directly with analytical data that has been previously computed. This comparison can then be used to investigate improvements in the analytical prediction methods (or perhaps experimental met hods).
I VALIDATION OF AEROSERVO- r ELASTIC ANALYSIS METHODS
1 **....-. 9 ?I\ . a * T w i a t .
S o m i s p a n Semlrpan
DEFORMATION OF TAILORED STRUCTURAL STRUCTURES LOADS
" F
Gam
UNSTEADY AERO CONTROL OF AEROELASTIC H ES I'ON s E I
V F [ 3 ,
a HIGH-ALPHA
1 100
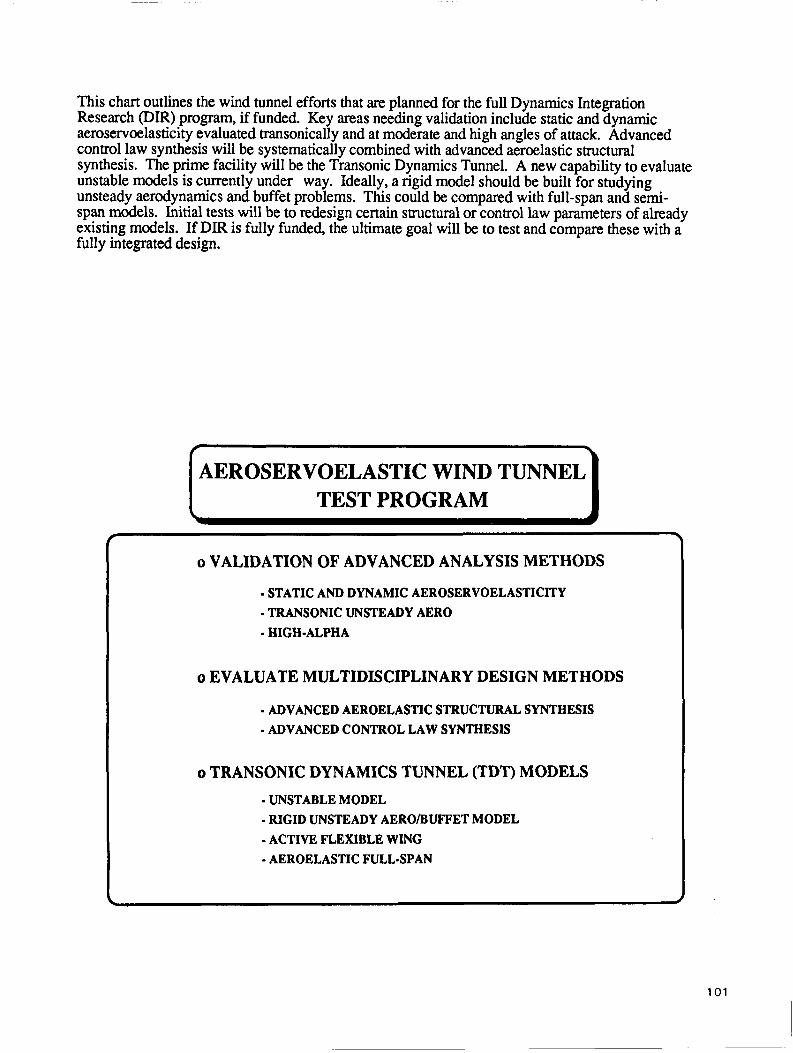
This chart outlines the wind tunnel efforts that are planned for the full Dynamics Integration Research (DIR) program, if funded. Key areas needing validation include static and dynamic aeroservoelasticity evaluated transonically and at moderate and high angles of attack. Advanced control law synthesis will be systematically combined with advanced aeroelastic structural synthesis. The prime facility will be the Transonic Dynamics Tunnel. A new capability to evaluate unstable models is currently under way. Ideally, a rigid model should be built for studying unsteady aerodynamics and buffet problems. This could be compared with full-span and semi- span models. Initial tests will be to redesign certain structural or control law parameters of already existing models. If DIR is fully funded, the ultimate goal will be to test and compare these with a fully integrated design.
1 AEROSERVOELASTIC WIND TUNNEL TEST PROGRAM
o VALIDATION OF ADVANCED ANALYSIS METHODS
- STATIC AND DYNAMIC AEROSERVOELASTICITY - TRANSONIC UNSTEADY AERO - HIGH-ALPHA
o EVALUATE MULTIDISCIPLINARY DESIGN METHODS
- ADVANCED AEROELASTIC STRUCTURAL SYNTHESIS - ADVANCED CONTROL LAW SYNTHESIS
o TRANSONIC DYNAMICS TUNNEL (TDT) MODELS - UNSTABLE MODEL - RIGID UNSTEADY AEROBUFFET MODEL - ACTIVE FLEXIBLE WING - AEROELASTIC FULL-SPAN
101
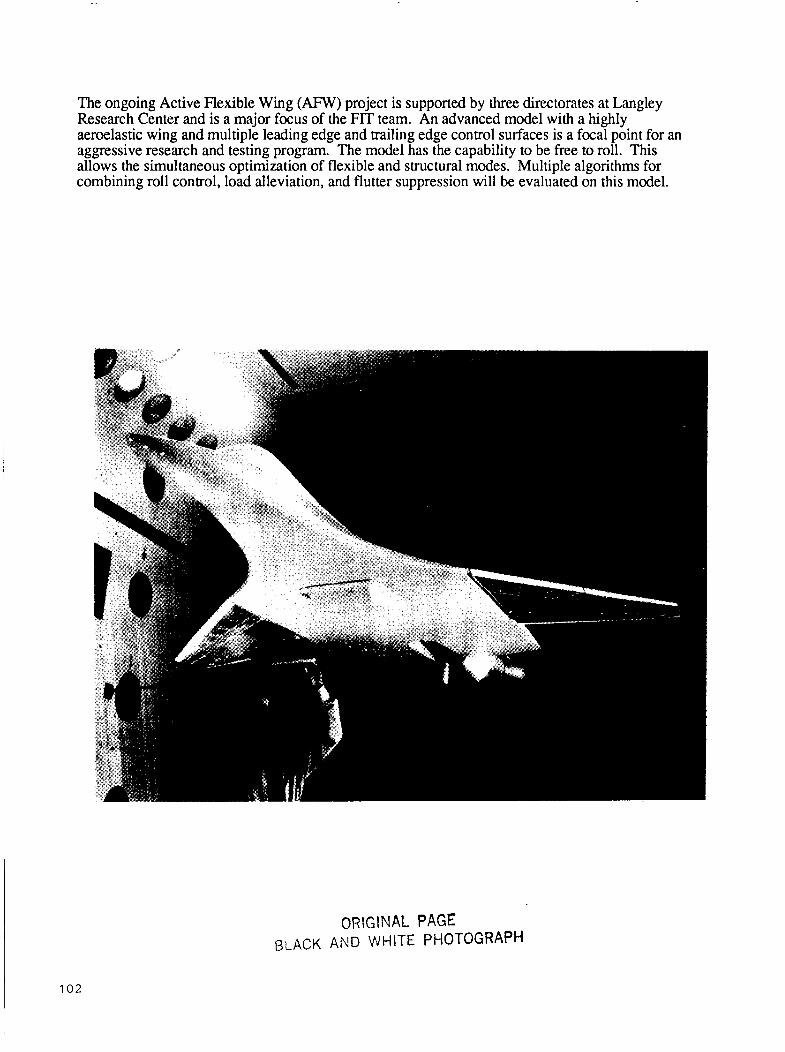
The ongoing Active Flexible Wing (AFW) project is supported by three directorates at Langley Research Center and is a major focus of the FIT team. An advanced model with a highly aeroelastic wing and multiple leading edge and trailing edge control surfaces is a focal point for an aggressive research and testing program. The model has the capability to be free to roll. This allows the simultaneous optimization of flexible and structural modes. Multiple algorithms for combining roll control, load alleviation, and flutter suppression will be evaluated on this model.
ORIGINAL PAGE BLACK AND WHITE PHOTOGRAPH
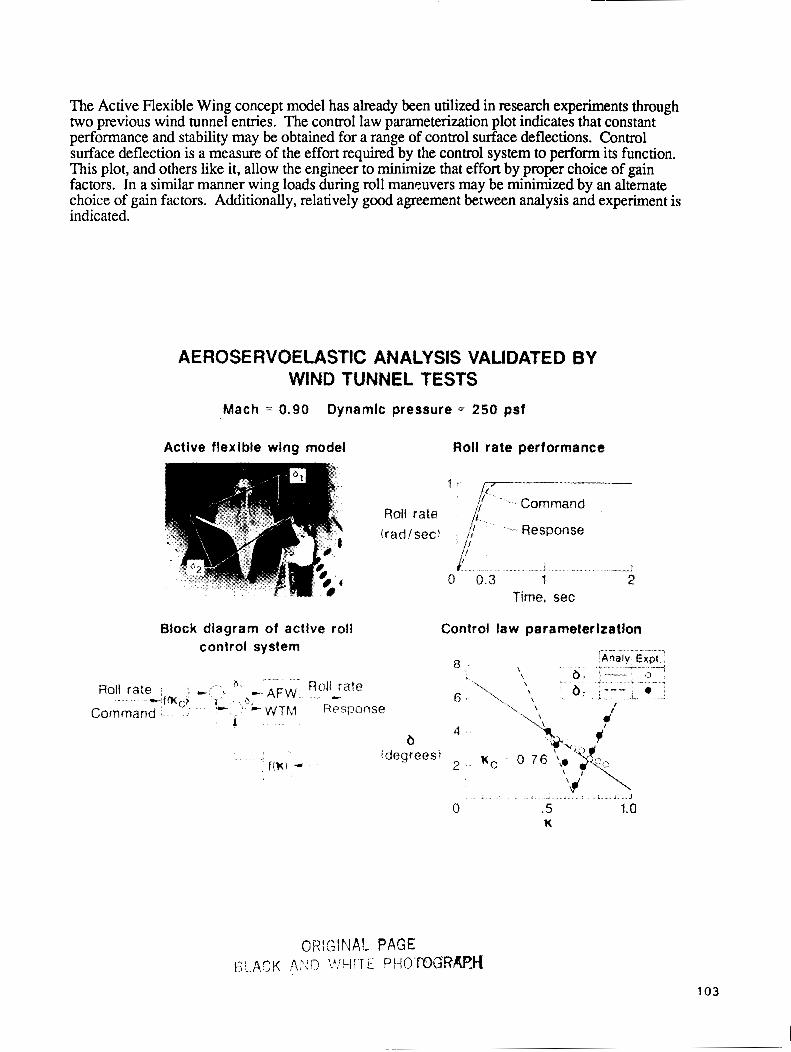
The Active Flexible Wing concept model has already been utilized in research experiments through two previous wind tunnel entries. The control law parameterization plot indicates that constant performance and stability may be obtained for a range of control surface deflections. Control surface deflection is a measure of the effort required by the control system to perform its function. This plot, and others like it, allow the engineer to minimize that effort by proper choice of gain factors. In a similar manner wing loads during roll maneuvers may be minimized by an alternate choice of gain factors. Additionally, relatively good agreement between analysis and experiment is indicated.
AEROSERVOELASTIC ANALYSIS VALIDATED BY WIND TUNNEL TESTS
Mach = 0.90 Dynamic pressure = 250 psf
Active flexible wing model Roll rate performance
1 * [(7"--
'' -Command
(radfsec) if -- Response Roll rate /
k' " I --
0 0.3 1 2 Time, sec
Block diagram of active roll Control law parameterization control system c - - . ..--
Analy Expt \ 8 \ '. \
.. Roil rate r ' 0 - A F W , Roll , - rate ', b: i---t. e 6 ' '\, \\
\ h --.fnC,t - :. .
', \ * -WTb,I RPSpOnSe I
4 1 Cornrnand
b (degrees)
fcxl =
& 2 6 L . e , , , J
0 .5 1.0 U
103
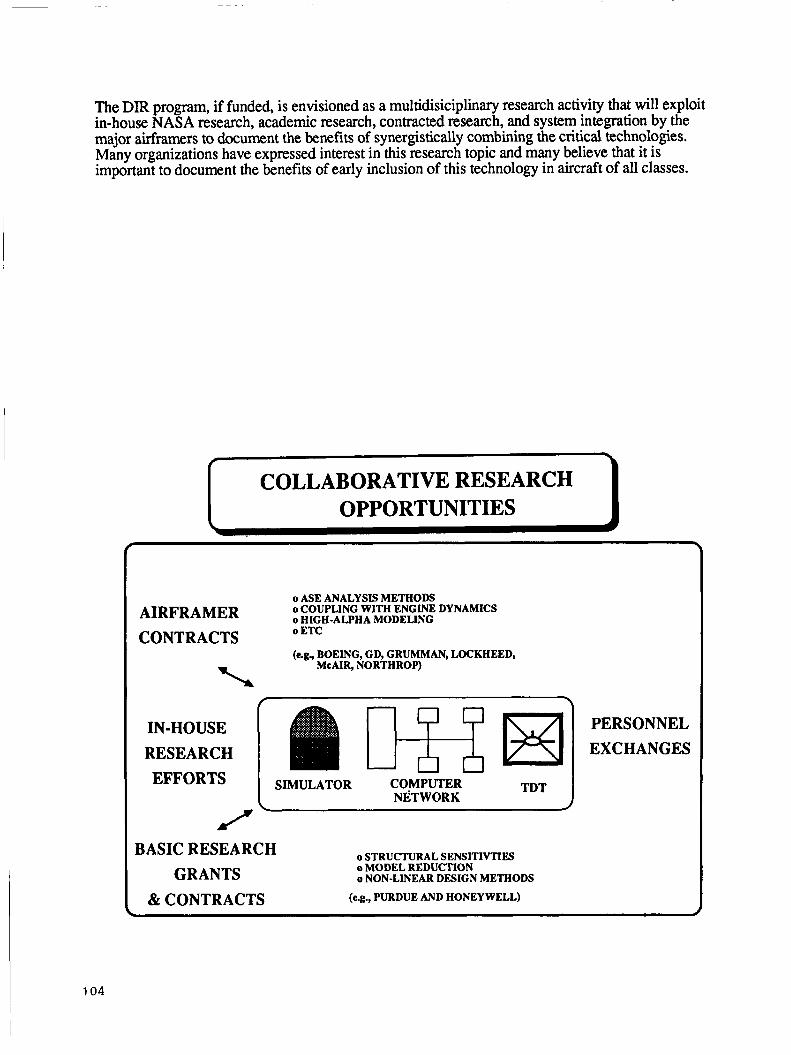
The DIR program, if funded, is envisioned as a multidisiciplinary research activity that Will exploit in-house NASA research, academic research, contracted research, and system integration by the major airframers to document the benefits of synergistically combining the critical technologies. Many organizations have expressed interest in this research topic and many believe that it is important to document the benefits of early inclusion of this technology in aircraft of all classes.
COLLABORATIVE RESEARCH OPPORTUNITIES
AIRFRAMER CONTRACTS
IN-HOUSE RESEARCH EFFORTS
o ASE ANALYSLS METHODS o COUPLING WITH ENGINE DYNAMICS
o ETC
(e.g., BOEINC, GD, GRUMMAN, LOCKHEED,
o HIGH-ALPHA MODELING
McAIR, NORTHROP)
SIMULATOR COMPUTER NETWORK
TDT
A?
BASIC RESEARCH o STRUCTURAL SENSITIVTIES o MODEL REDUCTION GRANTS o NON-LINEAR DESIGN METHODS
& CONTRACTS (eg., PURDUE AND HONEYWELL)
PERSONNEL EXCHANGES
104
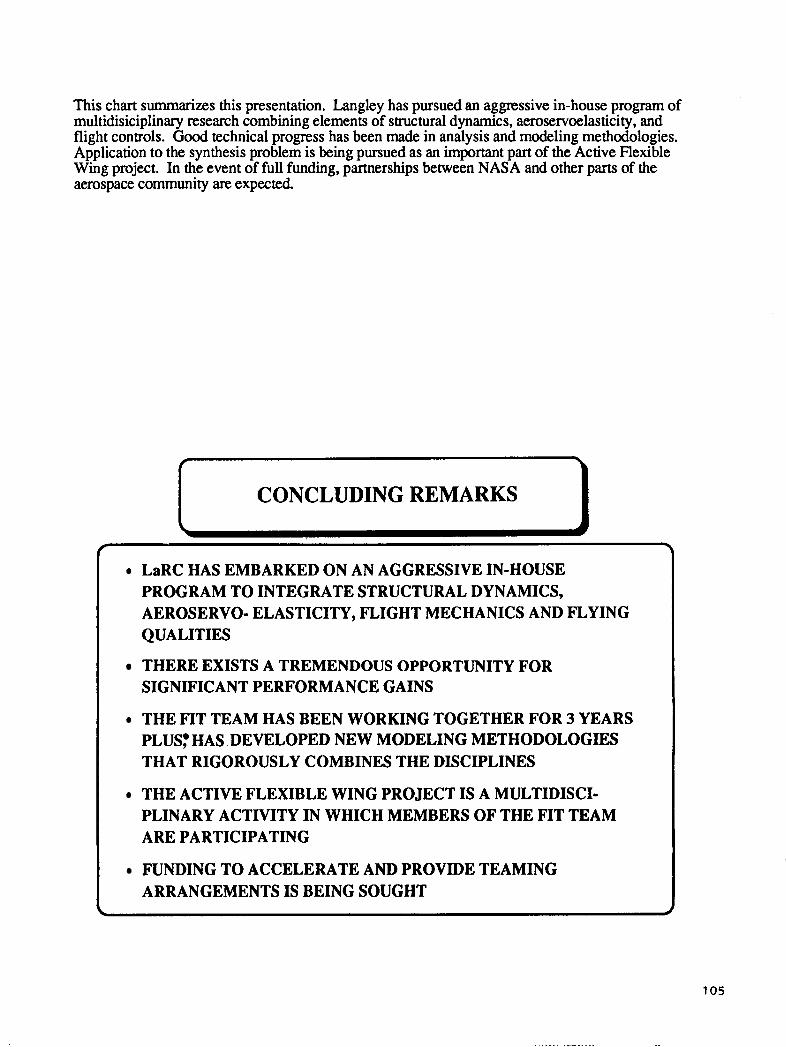
This chart summarizes this presentation. Langley has pursued an aggressive in-house program of multidisiciplinary research combining elements of structural dynamics, aeroservoelasticity, and flight controls. Good technical progress has been made in analysis and modeling methodologies. Application to the synthesis problem is being pursued as an important part of the Active Flexible Wing project. In the event of full funding, partnerships between NASA and other parts of the aerospace community are expected.
1 [ CONCLUDING REMARKS
r
LaRC HAS EMBARKED ON AN AGGRESSIVE IN-HOUSE PROGRAM TO INTEGRATE STRUCTURAL DYNAMICS,
QUALITIES
THERE EXISTS A TREMENDOUS OPPORTUNITY FOR SIGNIFICANT PERFORMANCE GAINS
THE FIT TEAM HAS BEEN WORKING TOGETHER FOR 3 YEARS PLUS: HAS DEVELOPED NEW MODELING METHODOLOGIES THAT RIGOROUSLY COMBINES THE DISCIPLINES
AEROSERVO- ELASTICITY, FLIGHT MECHANICS AND FLYING
THE ACTIVE FLEXIBLE WING PROJECT IS A MULTIDISCI- PLINARY ACTIVITY IN WHICH MEMBERS OF THE FIT TEAM ARE PARTICIPATING
FUNDING TO ACCELERATE AND PROVIDE TEAMING ARRANGEMENTS IS BEING SOUGHT
105

SESSION 2: HELICOPTERS
Chairmen: D. Anderson and R. G. Kvaternik
PRECEDING PAGE BLANK NOT FILMED
107

N89- 25151 ... AN INITIATIVE IN MULTIDISCIPLINARY OPTIMIZATION OF ROTORCRAFT
Howard M. Adelman NASA Langley Research Center
Hampton, Virginia and
Wayne R. Mantay U.S. Army Aerostructms Directorate
Hampton, Virginia
PRECEDING PAGE BLANK NOT FILMED 109
INTRODUCTION
An emerging trend in the analytical design of aircraft is the integration of all appropriate disciplines in the design process (refs. 1,2). This means not only including limitations on the behavior of the design from the various disciplines, but also defining and accounting for interactions so that the disciplines influence design decisions simultaneously rather than sequentially. The integrated approach has the potential to produce a better product as well as a better, more systematic design practice. In rotorcraft design (the rotor in particular), the appropriate disciplines include aerodynamics, dynamics, structures, and acoustics. The purpose of this paper is to describe a plan for developing a helicopter rotor design optimization procedure which includes the above disciplines in an integrated manner.
Rotorcraft design is an ideal application for integrated multidisciplinary optimization. There are strong interactions among the four disciplines cited previously; indeed, certain design parameters influence all four disciplines. For example, rotor blade tip speed influences dynamics through the inertial and air loadings, structures by the centrifugal loadings, acoustics by local Mach number and air loadings, and aerodynamics through dynamic pressure and Mach number. All of these considerations are accounted for in current design practice. However, the process is sequential, not simultaneous, and often involves correcting a design late in the design schedule.
Applications of rigorous and systematic analytical design procedures to rotorcraft have been increasing, especially in the past five years. Procedures have accounted for dynamics (refs.3-9), aerodynamics (refs. 10-ll), and structures (ref. 12). Generally, these applications have only considered single-discipline requirements, although in reference 5, dynamic and structural requirements were considered together, and in reference 6, dynamics and aeroelastic stability were combined. Integrated multidisciplinary applications to rotorcraft are largely nonexistent.
In early 1985, several occurrences led to an excellent opportunity at the NASA Langley Research Center to address the multidisciplinary design problem for rotorcraft. The Interdisciplinary Research Office was established and charged with the development of integrated multidisciplinary optimization methods. Nearly concurrently, the Army Aerostructures Directorate at Langley established the goal of improving rotorcraft design methodology by "discipline integration." Close cooperation between the NASA and Army organizations led to initial plans for a comprehensive, integrated analytical design capability. By 1986, a group of NASA/Army researchers had formed a committee and began detailed planning for this activity. The committee, designated IRASC (Integrated Rotorcraft Analysis Steering Committee), has now completed the bulk of the planning and has formulated the approach described in this paper.

The development of an integrated multidisciplinary design methodology for rotorcraft is a three- phased approach. In Phase 1, the disciplines of blade dynamics, blade aerodynamics, and blade structures will be closely coupled, while acoustics and airframe dynamics will be decoupled from the first three and will be accounted for by effective constraints on the other disciplines. In Phase 2, acoustics will be integrated with the first three disciplines. Finally, in Phase 3, airframe dynamics will be fully integrated with the other four disciplines. This paper deals only with the Phase 1 approach and includes: details of the optimization formulation, design variables, constraints, and objective function as well as details of discipline interactions, analysis methods, and methods for validating the procedure.
I
111
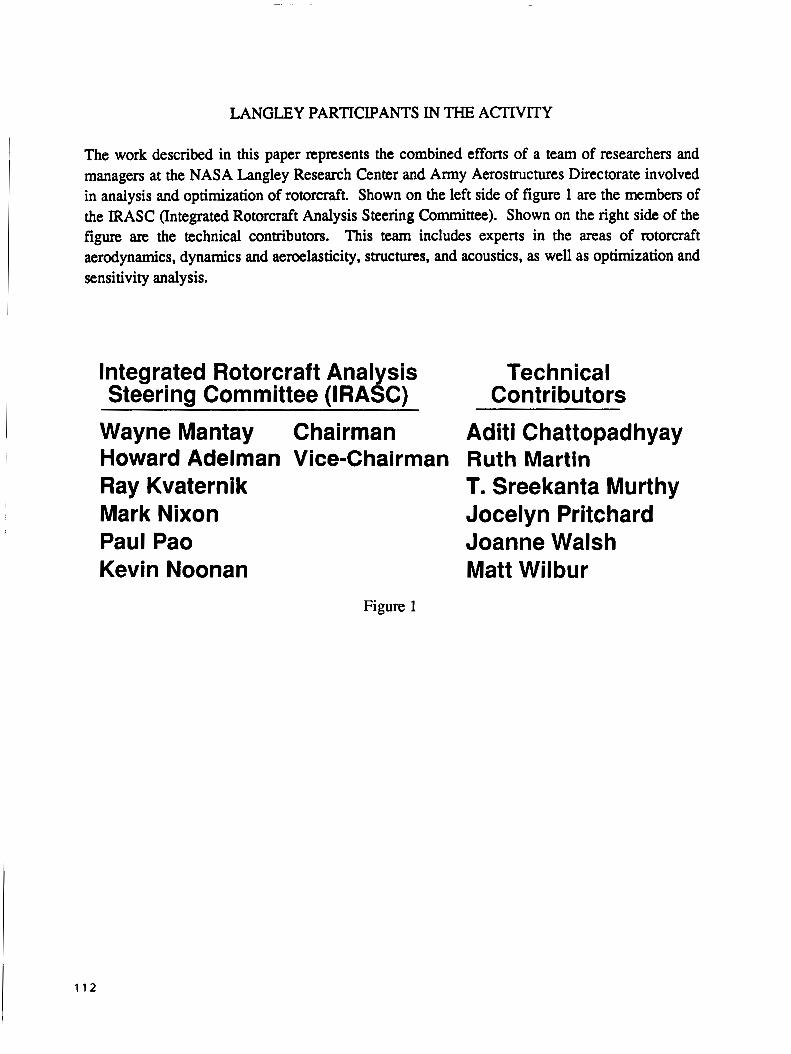
LANGLEY PARTICIPANTS IN THE ACTIVITY
The work described in this paper represents the combined efforts of a team of researchers and managers at the NASA Langley Research Center and Army Aerosmctures Directorate involved in analysis and optimization of rotorcraft. Shown on the left side of figure 1 are the members of the IRASC (Integrated Rotorcraft Analysis Steering Committee). Shown on the right side of the figure are the technical contributors. This team includes experts in the areas of rotorcraft aerodynamics, dynamics and aeroelasticity, structures, and acoustics, as well as optimization and sensitivity analysis.
Integrated Rotorcraft Analysis Steering Committee (IRASC)
Wayne Mantay Chairman Howard Adelman Vice-chairman Ray Kvaternik Mark Nixon Paul Pao Kevin Noonan
Figure 1
112
Tech n i ca I Contributors
~
Aditi Chattopadhyay Ruth Martin T. Sreekanta Murthy Jocelyn Pritchard Joanne Walsh Matt Wilbur

OBJECTIVE OF THE EFFORT
Figure 2 represents the Charter of the IR4SC activity. The unique features of the work are the emphasis on integrating the disciplines and explicitly accounting for the interactions among disciplines. While the team does not intend to develop new or improved analyses in m y of the included disciplines, the latest developments in rotorcraft disciplinary analysis will be used. Finally, it is a goal of the team to stimulate activity in the rotorcraft (and the aircraft) community in the general area of multidisciplinary design integration and the use of formal Mathematical Programming in design work.
Develop and validate an integrated multidisciplinary
design capability involving aerodynamics, dynamics,
structures, and acoustics which leads to improved
design practices and improved rotorcraft. Figure 2
113
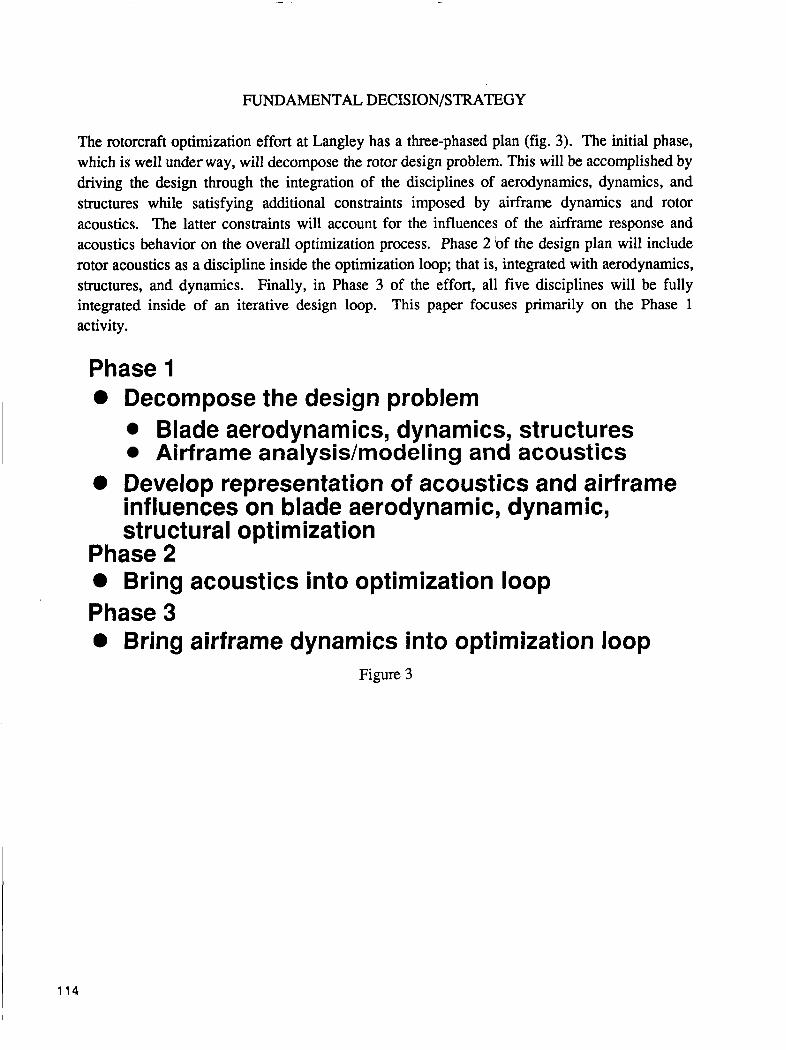
FUNDAMENTAL DECISION/STRATEGY
The rotorcraft optimization effort at Langley has a three-phased plan (fig. 3). The initial phase, which is well under way, will decompose the rotor design problem. This will be accomplished by driving the design through the integration of the disciplines of aerodynamics, dynamics, and structures while satisfying additional constraints imposed by airframe dynamics and rotor acoustics. The latter constraints will account for the influences of the airframe response and acoustics behavior on the overall optimization process. Phase 2 'of the design plan will include rotor acoustics as a discipline inside the optimization loop; that is, integrated with aerodynamics, structures, and dynamics. Finally, in Phase 3 of the effort, all five disciplines will be fully integrated inside of an iterative design loop. This paper focuses primarily on the Phase 1 activity.
Phase 1 0 Decompose the design problem
Blade aerodynamics, dynamics, structures Airframe analysidmodeling and acoustics
0 Develop representation of acoustics and airframe influences on blade aerodynamic, dynamic, structural optimization
Phase 2 0 Bring acoustics into optimization loop Phase 3 0 Bring airframe dynamics into optimization loop
Figure 3
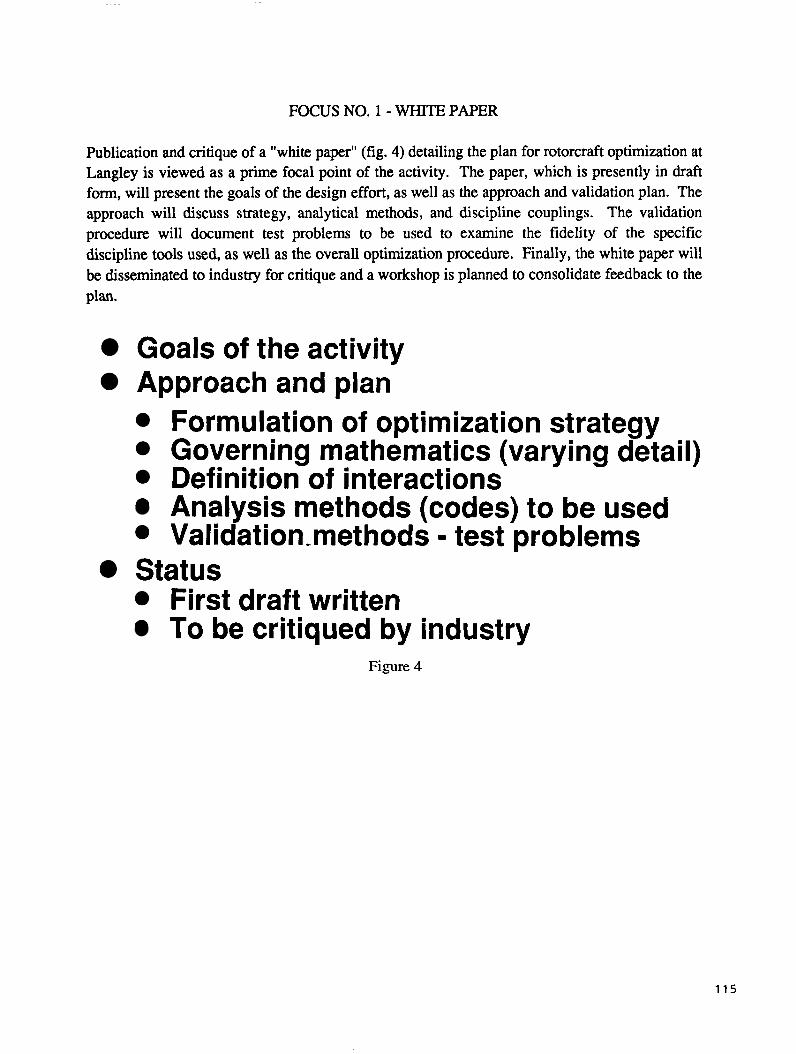
FOCUS NO. 1 - WHITE PAPER
Publication and critique of a "white paper" (fig. 4) detailing the plan for rotorcraft optimization at Langley is viewed as a prime focal point of the activity. The paper, which is presently in draft form, will present the goals of the design effort, as well as the approach and validation plan. The approach will discuss strategy, analytical methods, and discipline couplings. The validation procedure will document test problems to be used to examine the fidelity of the specific discipline tools used, as well as the overall optimization procedure. Finally, the white paper will be disseminated to industry for critique and a workshop is planned to consolidate feedback to the plan.
Goals of the activity Approach and plan
Formulation of optimization strategy Governing mathematics (varying detail) Definition of interactions Analysis methods (codes) to be used Validation.methods - test problems
First draft written To be critiqued by industry
Status
Figure 4
115
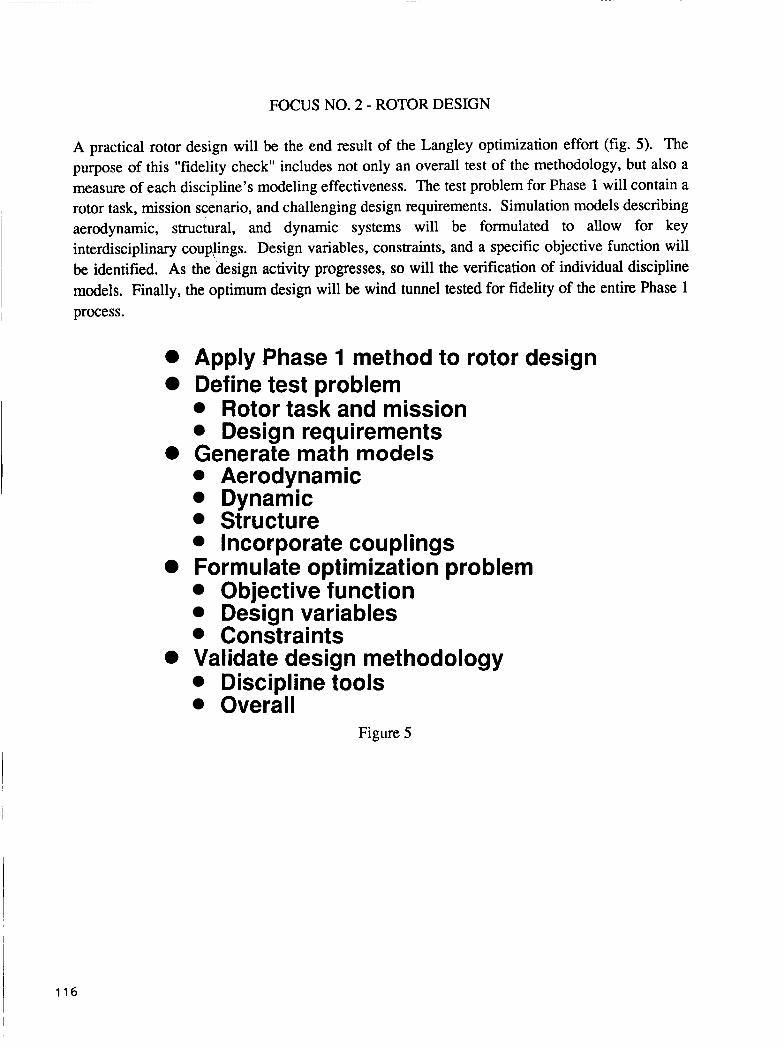
FOCUS NO. 2 - ROTOR DESIGN
A practical rotor design will be the end result of the Langley optimization effort (fig. 5). The purpose of this "fidelity check" includes not only an overall test of the methodology, but also a measure of each discipline's modeling effectiveness. The test problem for Phase 1 will contain a rotor task, mission scenario, and challenging design requirements. Simulation models describing aerodynamic, structural, and dynamic systems will be formulated to allow for key interdisciplinary couflings. Design variables, constraints, and a specific objective function will be identified. As the design activity progresses, so will the verification of individual discipline models. Finally, the optimum design will be wind tunnel tested for fidelity of the entire Phase 1
I
I process.
0 Apply Phase 1 method to rotor design Define test problem
Rotor task and mission Design requirements
0 Generate math models Aerodynamic Dynamic Structure Incorporate couplings
Objective function Design variables Constraints
Discipline tools Overall
0 Formulate optimization problem
0 Validate design methodology
Figure 5
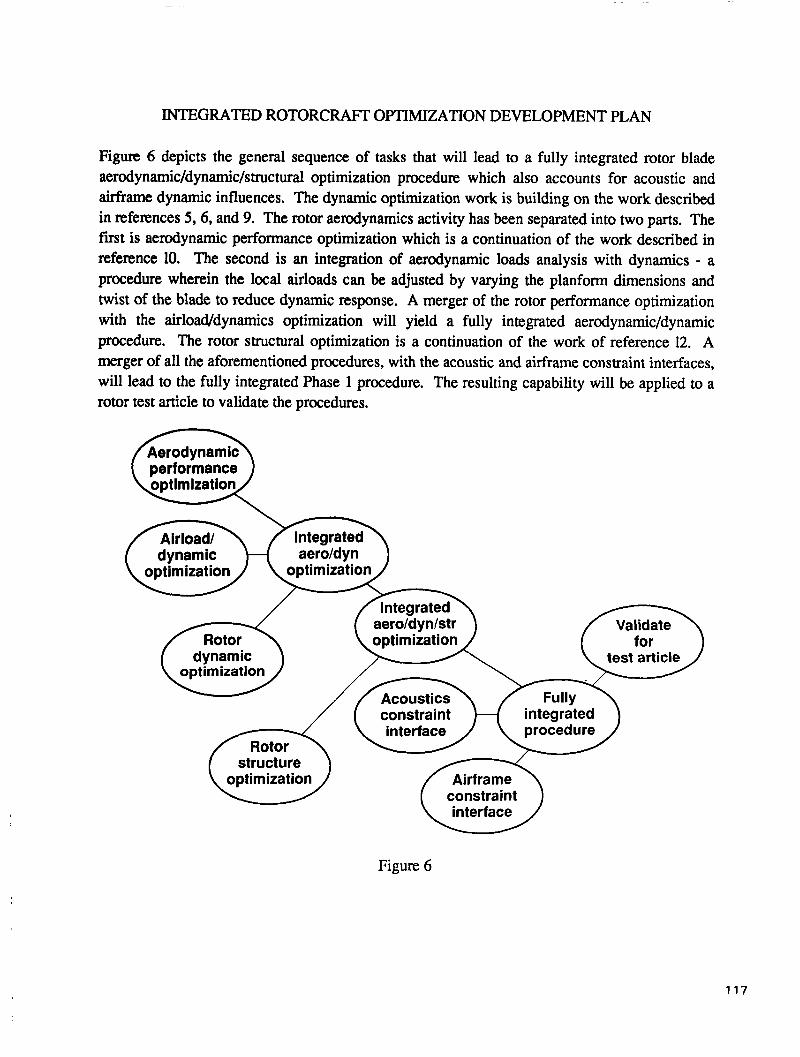
INTEGRATED ROTORCRAFT OPTIMIZATION DEVELOPMENT PLAN
Figure 6 depicts the general sequence of tasks that will lead to a fully integrated rotor blade aerodynamic/dynamic/structural optimization procedure which also accounts for acoustic and airframe dynamic influences. The dynamic optimization work is building on the work described in references 5,6 , and 9. The rotor aerodynamics activity has been separated into two parts. The first is aerodynamic performance optimization which is a continuation of the work described in reference 10. The second is an integration of aerodynamic loads analysis with dynamics - a procedure wherein the local airloads can be adjusted by varying the planform dimensions and twist of the blade to reduce dynamic response. A merger of the rotor performance optimization with the airload/dynamics optimization will yield a fully integrated aerodynamic/dynamic procedure. The rotor structural optimization is a continuation of the work of reference 12. A merger of all the aforementioned procedures, with the acoustic and airframe constraint interfaces, will lead to the fully integrated Phase 1 procedure. The resulting capability will be applied to a rotor test article to validate the procedures.
Figure 6
117

DEFINITION OF THE OPTIMIZATION PROBLEM
As indicated in figure 7, the next section of the paper consists of details of the integrated rotorcraft optimization problem. Included are descriptions of the following: the objective function (the quantity to be minimized for obtaining an optimum design); the design variables (dimensions and other parameters of the design); constraints (a set of behavioral or characteristic limitations required to assure acceptable and safe performance); and definitions of the interactions among the disciplines.
e
e
e
a
Objective function
Design variables
Constraints
Interact ions among disciplines Figure 7

CONTRIBUTORS TO OBJECTIVE FUNCTION
In formulating the objective function, a number of indicators (fig. 8) were considered. Basically, the indicators fell into two categories - penalty types such as weight and cost; and performance types such as vibratory loads (shears and moments); and required horsepower. It was decided, for the purpose of the Phase 1 work, to choose performance type quantities for the objective function; specifically, transmitted vertical vibratory hub shear and horsepower required at several flight conditions. Blade mass will be prevented from becoming excessive by enforcing an upper limit constraint. Cost is not explicitly accounted for in the formulation.
0
Blade mass
cost
Vibratory loads
Required horsepower Figure 8
119
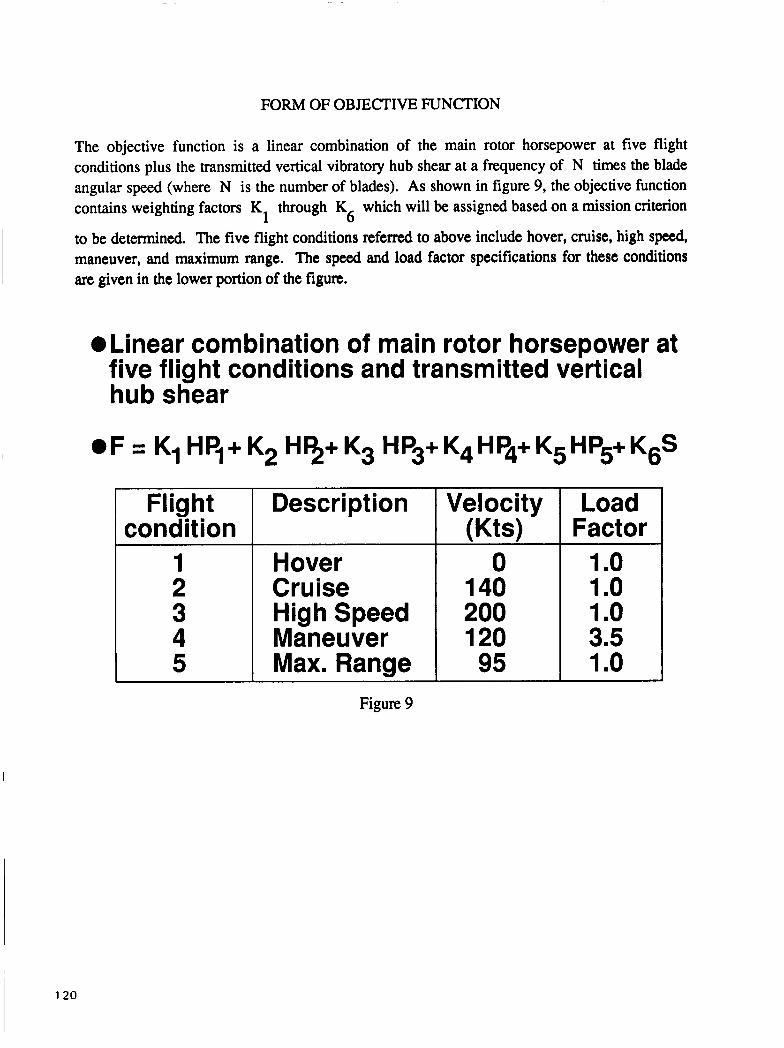
FORM OF OBJECTIVE FUNCTION
Description
The objective function is a linear combination of the main rotor horsepower at five flight conditions plus the transmitted vertical vibratory hub shear at a frequency of N times the blade angular speed (where N is the number of blades). As shown in figure 9, the objective function contains weighting factors K through K which will be assigned based on a mission criterion 1 6 to be determined, The five flight conditions referred to above include hover, cruise, high speed, maneuver, and maximum range. The speed and load factor specifications for these conditions are given in the lower portion of the figure.
Velocity Wts)
.Linear combination of main rotor horsepower at five flight conditions and transmitted vertical hub shear
Hover Cruise High Speed Maneuver Max. Range
Flight
0 140 200 120 95
conciit ion 1 2 3 4 5
Figure 9
Load Factor
1 .o 1 .o 1 .o 3.5 1 .o
120
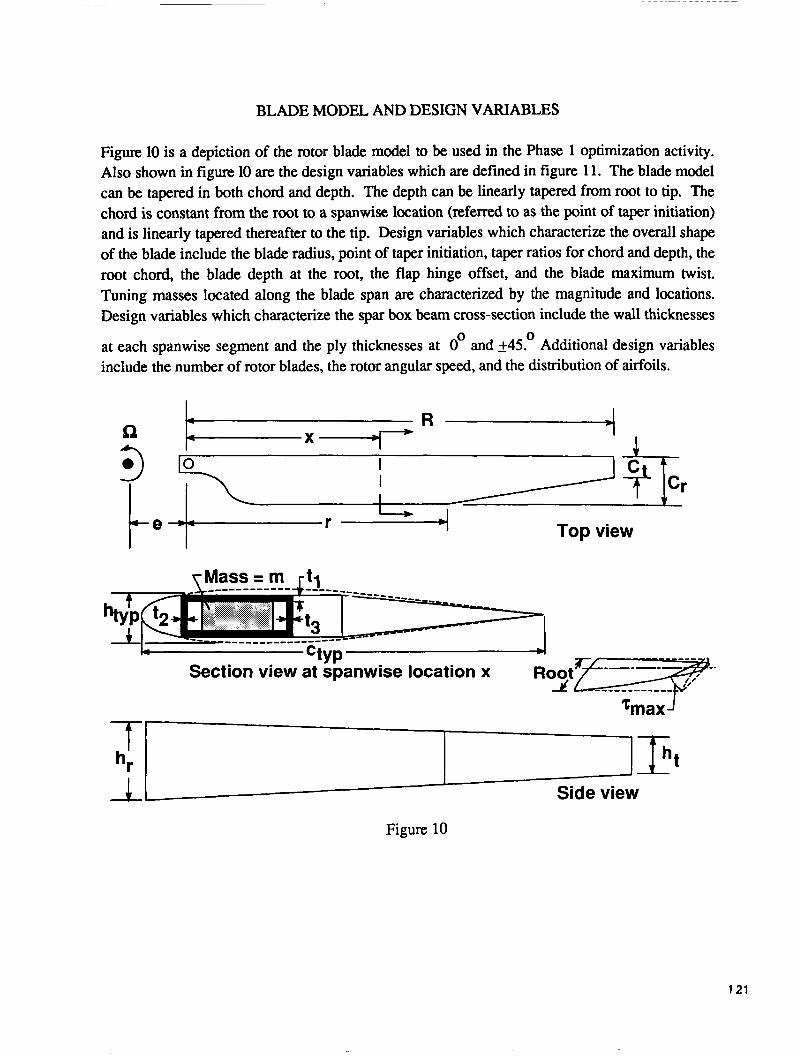
BLADE MODEL AND DESIGN VARIABLES
f- hr 1.
Figure 10 is a depiction of the rotor blade model to be used in the Phase 1 optimization activity. Also shown in figure 10 are the design variables which are defined in figure 11. The blade model can be tapered in both chord and depth. The depth can be linearly tapered from root to tip. The chord is constant from the root to a spanwise location (referred to as the point of taper initiation) and is linearly tapered thereafter to the tip. Design variables which characterize the overall shape of the blade include the blade radius, point of taper initiation, taper ratios for chord and depth, the root chord, the blade depth at the root, the flap hinge offset, and the blade maximum twist. Tuning masses located along the blade span are characterized by the magnitude and locations. Design variables which characterize the spar box beam cross-section include the wall thicknesses
0 0 at each spanwise segment and the ply thicknesses at 0 and 345. Additional design variables include the number of rotor blades, the rotor angular speed, and the distribution of airfoils.
5 Side view
I I I , I r e t r Top view
Figure 10
121
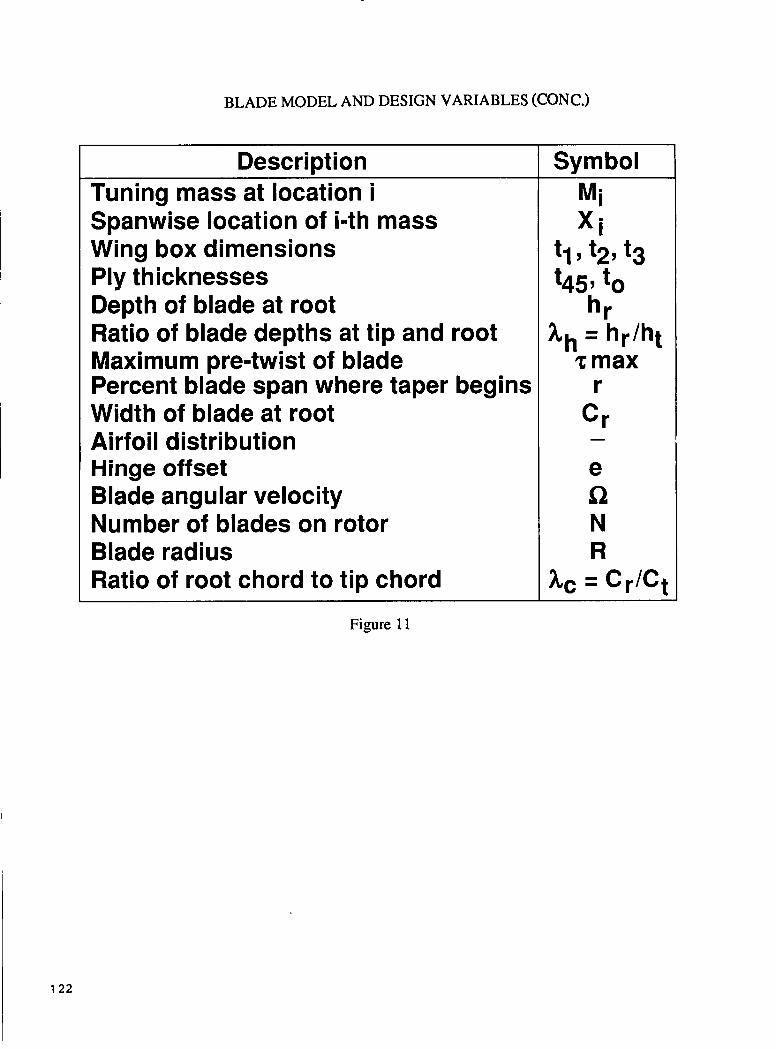
~
BLADE MODEL AND DESIGN VARIABLES (CONC.)
Description Tuning mass at location i Spanwise location of i-th mass Wing box dimensions Ply thicknesses Depth of blade at root Ratio of blade depths at tip and root Maximum pre-twist of blade Percent blade span where taper begins Width of blade at root Airf oi I distribution Hinge offset Blade angular velocity Number of blades on rotor Blade radius Ratio of root chord to tip chord
Figure 11

CONSTRAINTS OVERVIEW
As previously described, the Phase 1 activity is based on integrating the blade aerodynamic, dynamic, and structural analyses within the optimization procedure. The acoustics and airframe dynamics analyses are decoupled from the first three disciplines and their influences are expressed in terms of constraints. Accordingly, the total set of constraints is made up of two subsets as indicated in figure 12. The first subset consists of constraints which are evaluated directly from the first three disciplinary analyses and are a direct measure of the degree of acceptability of the aerodynamic, dynamic, and structural behavior. The second subset represents indirect measures of the satisfaction of constraints on the acoustics behavior and the requirement of avoiding excessive vibratory excitation of the airframe by the rotor.
1 Aerodynamic
Dynamic Evaluated directly
Structure J - r from analysis
0 Acoustic
Airframe
Expressed indirectly as constraints on disciplines in top group
Figure 12
123

SUMMARY OF CONSTRAINTS
The constraints are summarized in figures 13 and 14. The first two constraints are for aerodynamic performance and require that for all flight conditions, main rotor horsepower not exceed available horsepower and that airfoil section stall not occur at any azimuthal location. The next nine constraints address blade dynamics. The first requires that the blade natural frequencies be bounded to avoid approaching any multiples of rotor speed. The next five impose upper limits on the blade vertical and inplane loads, transmitted hub shear, and hub pitching and rolling moments. The next three dynamic constraints are an upper limit on blade response amplitude, a lower limit on blade autorotational inertia, and finally, the aeroelastic stability requirement. The structural constraints consist of upper limits on box beam stresses, blade static deflection, and blade twist deformation. The acoustic constraints are expressed as an upper bound on the tip Mach number and an upper bound on the blade thickness to limit thickness noise; and an upper bound on the gradient of the lift distribution to limit blade vortex interaction (BVI) and loading noise. The effective airframe constraints are expressed first as a separation of the fundamental blade inplane natural frequency in the fixed system from the fundamental pitching and rolling frequency of the fuselage. Second is a bounding of the blade passage frequency to avoid the proximity to any fuselage frequency. The final constraint is an upper limit on the blade mass which will avoid any designs which satisfy the constraints at the expense of large mass increases.
I Constraint DescriDtior Main rotor horsepowe
Airfoil section stall
Blade frequencies Blade vertical load Blade inplane load Transmitted i n-plane
Hub pitching moment Hub rolling moment Blade response amp. Autorotational inertia Aeroelast ic sta bi I ity Wing box stresses
hub shear
'orm of Constrain1 "Pi S HP avail for
i-th condition
Zomments =or 5 flight :onditions Enforced at 12 azimutha ocations
Figure 13
124
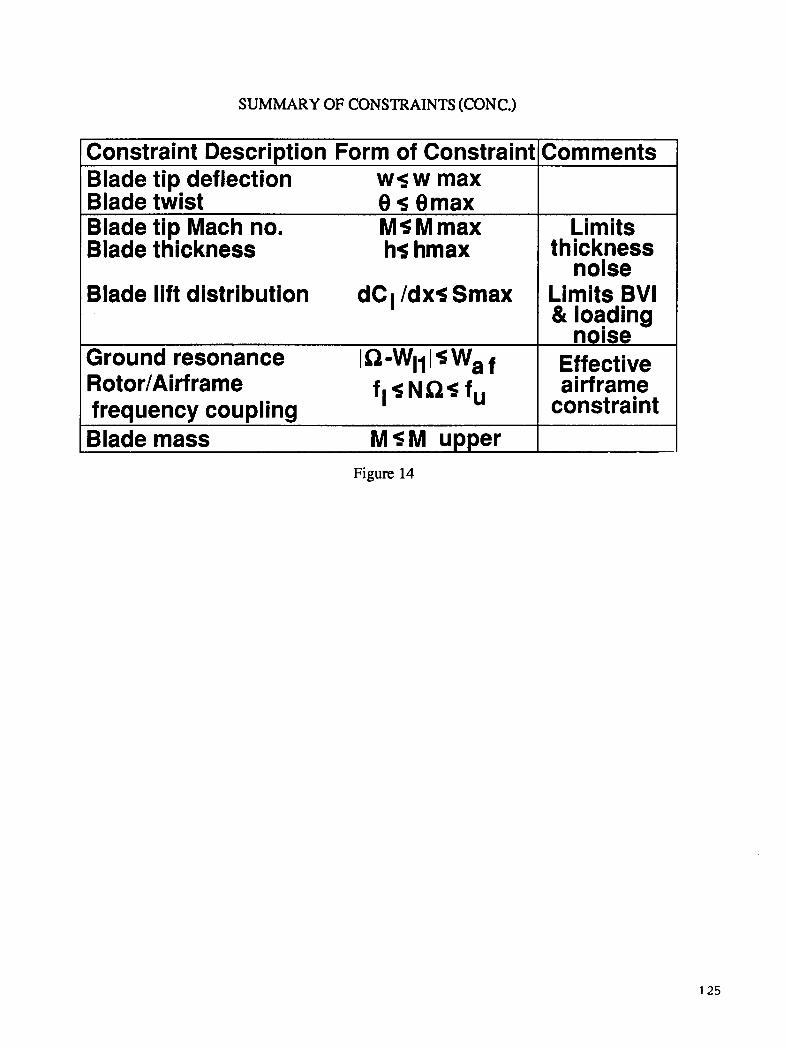
SUMMARY OF CONSTRAINTS (CONC.)
Constraint DescriDtion Form of ConstraintlComments
Blade twist 0 5 Bmax Blade tip Mach no. M5Mmax
Blade tip deflection w s w max I
Limits Blade thickness hi; hmax
Blade lift distribution
Ground resonance IQ-Wlll5Waf Roto r/Ai rf rame frequency coupling Blade mass MSM upper
dCI /dxs Smax
fl S N Q S fu
thickness noise
Limits BVI & loading
noise Effective airframe
constraint
Figure 14
125
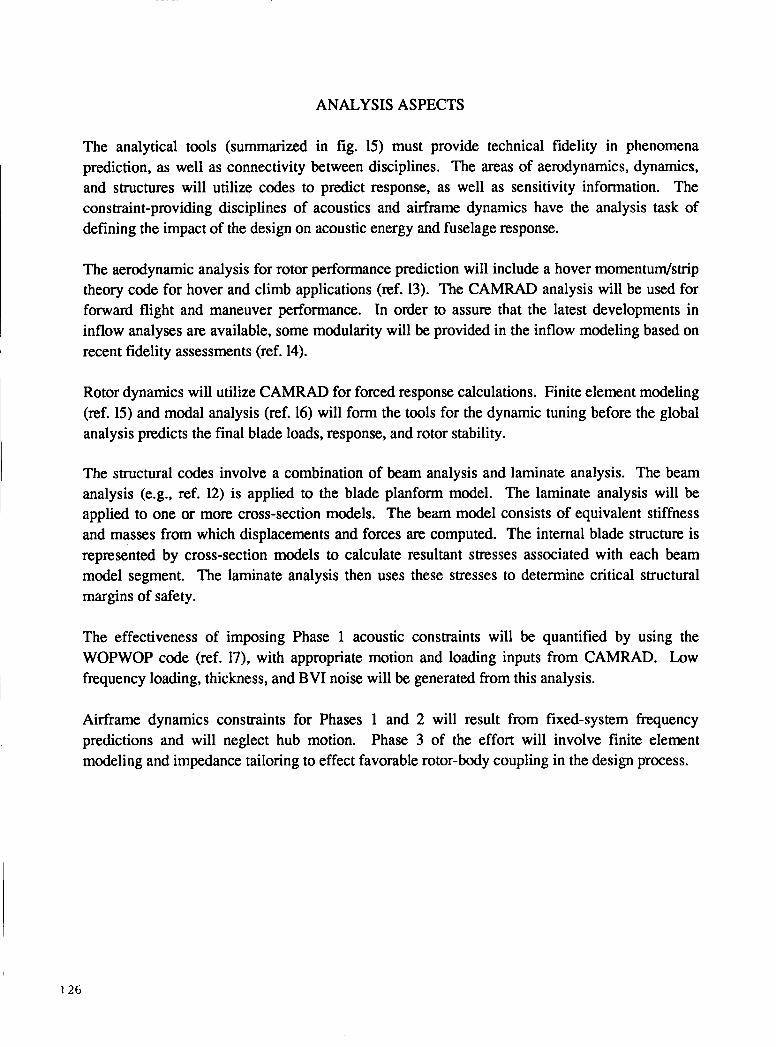
ANALYSIS ASPECTS
The analytical tools (summarized in fig. 15) must provide technical fidelity in phenomena prediction, as well as connectivity between disciplines. The areas of aerodynamics, dynamics, and structures will utilize codes to predict response, as well as sensitivity information. The constraint-providing disciplines of acoustics and airframe dynamics have the analysis task of defining the impact of the design on acoustic energy and fuselage response.
The aerodynamic analysis for rotor performance prediction will include a hover momentudstrip theory code for hover and climb applications (ref. 13). The CAMRAD analysis will be used for forward flight and maneuver performance. In order to assure that the latest developments in inflow analyses are available, some modularity will be provided in the inflow modeling based on recent fidelity assessments (ref. 14).
Rotor dynamics will utilize CAMRAD for forced response calculations. Finite element modeling (ref. 15) and modal analysis (ref. 16) will form the tools for the dynamic tuning before the global analysis predicts the final blade loads, response, and rotor stability.
The structural codes involve a combination of beam analysis and laminate analysis. The beam analysis ( e g , ref. 12) is applied to the blade planform model. The laminate analysis will be applied to one or more cross-section models. The beam model consists of equivalent stiffness and masses from which displacements and forces are computed. The internal blade structure is represented by cross-section models to calculate resultant stresses associated with each beam model segment. The laminate analysis then uses these stresses to determine critical structural margins of safety.
The effectiveness of imposing Phase 1 acoustic constraints will be quantified by using the WOPWOP code (ref. 17), with appropriate motion and loading inputs from CAMRAD. Low frequency loading, thickness, and BVI noise will be generated from this analysis.
Airframe dynamics constraints for Phases 1 and 2 will result from fixed-system frequency predictions and will neglect hub motion. Phase 3 of the effort will involve finite element modeling and impedance tailoring to effect favorable rotor-body coupling in the design process.
126
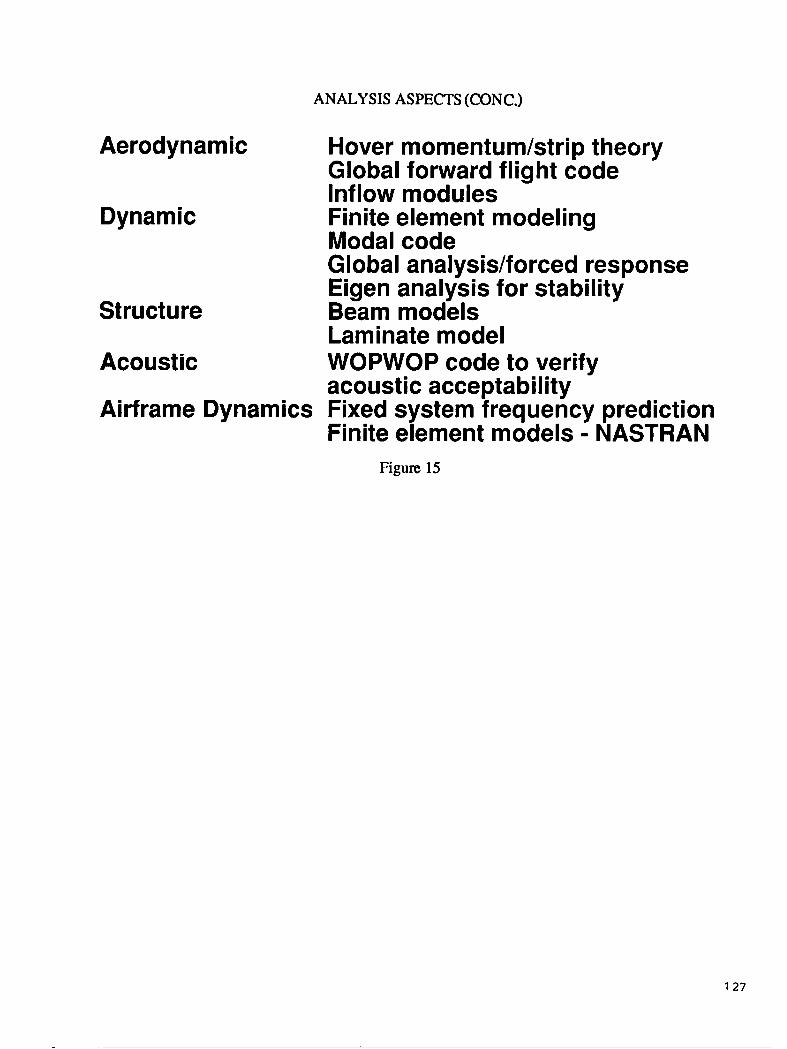
ANALYSIS ASPECTS (CONC.)
Aerodynamic Hover momentum/strip theory
Dynamic Finite element modeling
Global forward flight code Inflow modules
Modal code Global analysis/forced response Eigen analysis for stability
Structure Beam models Laminate model
Acoustic WOPWOP code to verify acoustic acceptability
Airframe Dynamics Fixed system frequency prediction Finite element models - NASTRAN
Figure 15
127
INTERDISCIPLINARY COUPLINGS
Phase 1 of the Langley rotorcraft optimization effort will utilize several design variables which have historically been significant drivers of disciplinary phenomena. In addition, other variables are being included to provide other unexplored design opportunities. Figure 16 shows our first attempt to quantify the interactions among the disciplines through the design variables. For example, rotor tip speed has driven past rotor designs based solely on acoustics, performance, or dynamics. This variable also influences blade structural integrity and fixed system response to transmitted loads. This provides the strong interdisciplinary coupling for tip speed shown in figure 16. There are variables, such as blade twist, which can strongly influence some disciplines, such as aerodynamics, while not perturbing others (e.g., structures) and other variables such as hinge offsets which, heretofore, have not greatly influenced conventional rotor design.
It is a significant part of the current design methodology effort to explore not only the obvious strong design variable couplings, but also to address those variables which may provide design synergism for multidisciplinary design goals. This may provide a design key for missions which have not been accomplished with today’s rotorcraft.
Variable
Airfoil Dist. Planform Twist Tip speed Blade number Stiff ness Mass dist. Hinge offset
Acoustics
S S W S S W W W
S Strong interaction W Weak interaction
Aerodyn. Perf & Loads)
S S S S W S W W
lynamics
w S S S S S S
s/w
Structures
W S W S W S S W
Fuselage 3ynamics
W s/w W S S
s/w s/w SIW
Figure 16
128

INTEGRATED AERODYNAMICDY NAMIC/STRUCTURAL OPTIMIZATION OF ROTOR BLADES
Aerodynamic analysis
(performance)
Figure 17 is a flow chart which explains how the integrated procedure will function. The current set of design variables (summarized in fig. 11) will be input to design variable preprocessors which will generate input tailored for each analysis. For example, box beam cross-sectional dimensions will be used to compute values of E1 and GJ for use in the dynamic analysis. Each disciplinary analysis will be carried out using the preprocessed data along with the necessary input which is the product of other disciplinary analyses. For example, as the flow chart shows, the dynamic response requires airloads from the aerodynamic loads analysis. The appropriate output from each disciplinary analysis is collected in a module which computes the objective function (fig. 9) and constraints (figs. 13 and 14). The next major step is the sensitivity analysis to calculate derivatives of the objective function and constraints with respect to the design variables. At this stage, all the information is available for the optimizer module (based on the program CONMIN (ref. 18)) wherein the values of the design variables are updated. The above steps are repeated until a converged design is obtained. Convergence requires that the objective function is minimized and all constraints are satisfied.
+ +Objective function and constraintsb-
4
Current design variables and fixed parameters
HP req'd trim
T
[ Design v a r i a b l e 7 1
Sensitivity analysis
analysis analysis analysis Airloads
stability RespT . I
Stresses deflections
Updated design variables Optimizer
Figure 17
129

RESULTS OBTAINED TO DATE
As indicated in figure 18, progress has been made in the areas of aerodynamic performance optimization, dynamic optimization, optimum placement of tuning masses for vibration reduction, and structural optimization. Selected results from these activities are highlighted in the next portion of the paper.
e
e
e
e
Aerodynamic performance optimization
Dynamic optimization
Optimum placement of tuning masses
Structural optimization Figure 18
130
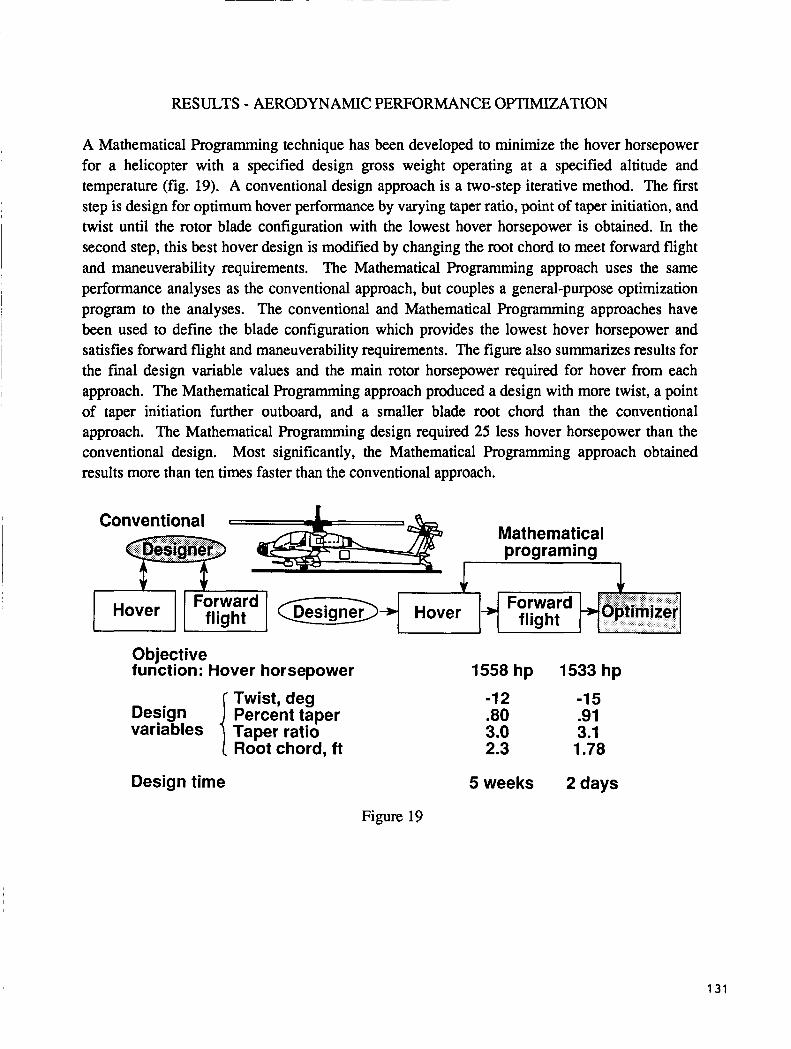
RESULTS - AERODYNAMIC PERFORMANCE OPTIMIZATION
A Mathematical Programming technique has been developed to minimize the hover horsepower for a helicopter with a specified design gross weight operating at a specified altitude and temperature (fig. 19). A conventional design approach is a two-step iterative method. The first step is design for optimum hover performance by varying taper ratio, point of taper initiation, and twist until the rotor blade configuration with the lowest hover horsepower is obtained. In the second step, this best hover design is modified by changing the root chord to meet forward flight and maneuverability requirements. The Mathematical Programming approach uses the same performance analyses as the conventional approach, but couples a general-purpose optimization program to the analyses. The conventional and Mathematical Programming approaches have been used to define the blade configuration which provides the lowest hover horsepower and satisfies forward flight and maneuverability requirements. The figure also summarizes results for the final design variable values and the main rotor horsepower required for hover from each approach. The Mathematical Programming approach produced a design with more twist, a point of taper initiation further outboard, and a smaller blade root chord than the conventional approach. The Mathematical Programming design required 25 less hover horsepower than the conventional design. Most significantly, the Mathematical Programming approach obtained results more than ten times faster than the conventional approach.
Conventional _I Mathematical
Objective function: Hover horsepower 1558 hp 1533 hp
-1 2 -1 5 .80 .9 1 3.0 3.1 2.3 1.78
Design time 5weeks 2days
Figure 19
1 3 1
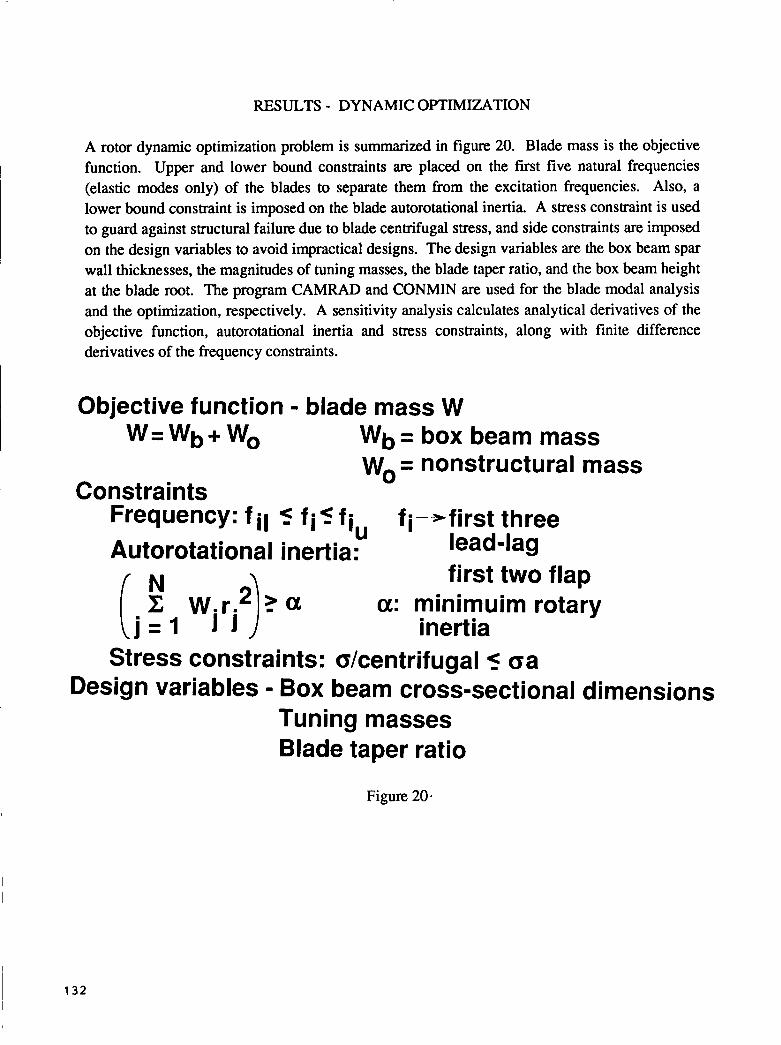
RESULTS - DYNAMIC OPTIMIZATION
A rotor dynamic optimization problem is summarized in figure 20. Blade mass is the objective function. Upper and lower bound constraints are placed on the first five natural frequencies (elastic modes only) of the blades to separate them from the excitation frequencies. Also, a lower bound constraint is imposed on the blade autorotational inertia. A stress constraint is used to guard against structural failure due to blade centrifugal stress, and side constraints are imposed on the design variables to avoid impractical designs. The design variables are the box beam spar wall thicknesses, the magnitudes of tuning masses, the blade taper ratio, and the box beam height at the blade root. The program CAMRAD and CONMIN are used for the blade modal analysis and the optimization, respectively. A sensitivity analysis calculates analytical derivatives of the objective function, autorotational inertia and stress constraints, along with finite difference derivatives of the frequency constraints.
Objective function - blade mass W w=wb+wo wb= box beam mass
= nonstructural mass WO
Constraints Frequency: f il 5 f i 5 f i Autorotational inertia: U lead-lag
f i--*first three
first two flap a: minimuim rotary
inertia Stress constraints: okentrifugal 5 oa
Design variables - Box beam cross-sectional dimensions Tuning masses Blade taper ratio
Figure 20.

RESULTS - DYNAMIC OPTIMIZATION (CONCLUDED)
Optimum designs for minimum mass rotor blades have been obtained for both rectangular and tapered blades. The optimum designs are compared with an existing baseline blade denoted the 'reference' blade in figure 21. The reference blade is based on an actual flight article and is described in more detail in references 5 and 9. The figure also shows the box beam wall thickness distributions for the rectangular blade using 30 design variables (tl , t2, t3 at ten spanwise
locations), and for the tapered blade with 42 design variables (ten lumped masses,and h and hh
are the additional design variables), Blade mass reductions of four to six percent (compad to a baseline or reference blade) have been achieved without violating the imposed constraints. The optimization process tends to shift the wall thickness distribution outboard for both designs due to the presence of the autorotational inertia constraint. The tapered design requires more outboard mass shift, but this is easily accomplished within the stress constraints.
r
OPTIMUM HORIZONTAL WALL THICKNESS DISTRIBUTIONS
- Reference --. Optimum (rect)
.012,~, -- Optimum (tapered)
Radial distance, r
Reference
Blade weight
Figure 21
133
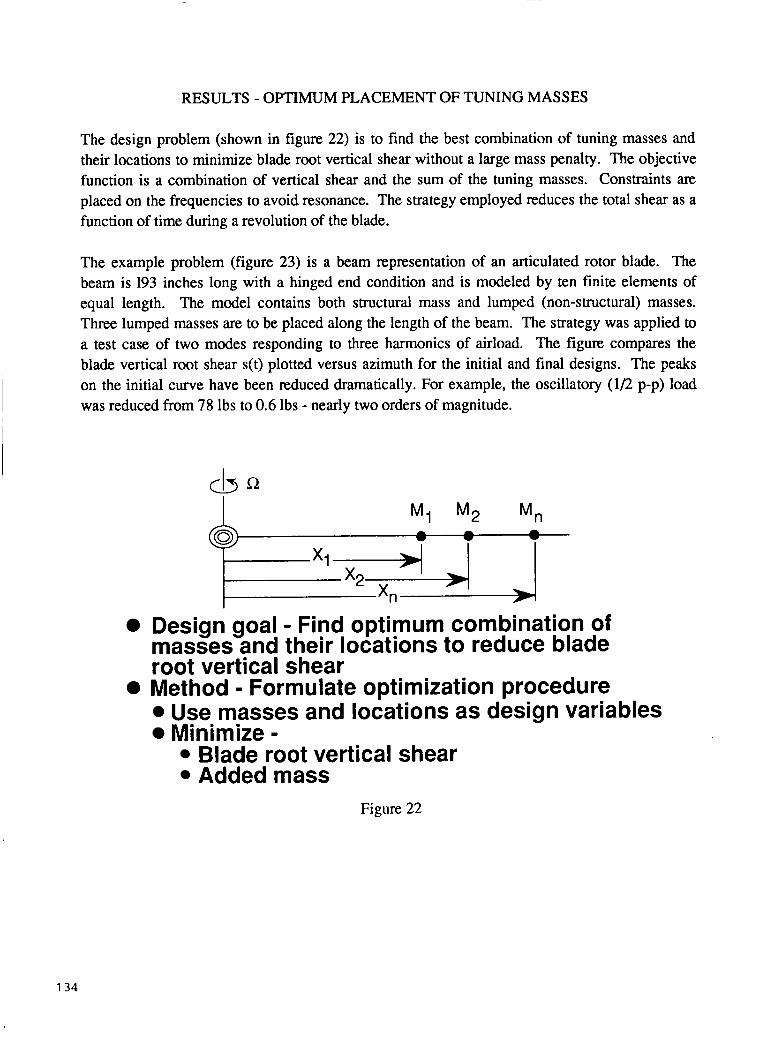
RESULTS - OPTIMUM PLACEMENT OF TUNING MASSES
The design problem (shown in figure 22) is to find the best combination of tuning masses and their locations to minimize blade root vertical shear without a large mass penalty. The objective function is a combination of vertical shear and the sum of the tuning masses. Constraints are placed on the frequencies to avoid resonance. The strategy employed reduces the total shear as a function of time during a revolution of the blade.
I
The example problem (figure 23) is a beam representation of an articulated rotor blade. The beam is 193 inches long with a hinged end condition and is modeled by ten finite elements of equal length. The model contains both structural mass and lumped (non-structural) masses. Three lumped masses are to be placed along the length of the beam. The strategy was applied to a test case of two modes responding to three harmonics of airload. The figure compares the blade vertical root shear s(t) plotted versus azimuth for the initial and final designs. The peaks on the initial curve have been reduced dramatically. For example, the oscillatory (1/2 p-p) load was reduced from 78 lbs to 0.6 lbs - nearly two orders of magnitude.
M1 M2 M" A
"'+J J 0 Design goal - Find optimum combination of
masses and their locations to reduce blade root vertical shear
0 Method - Formulate optimization procedure Use masses and locations as design variables Minimize -
Blade root vertical shear Added mass
Figure 22
I 134
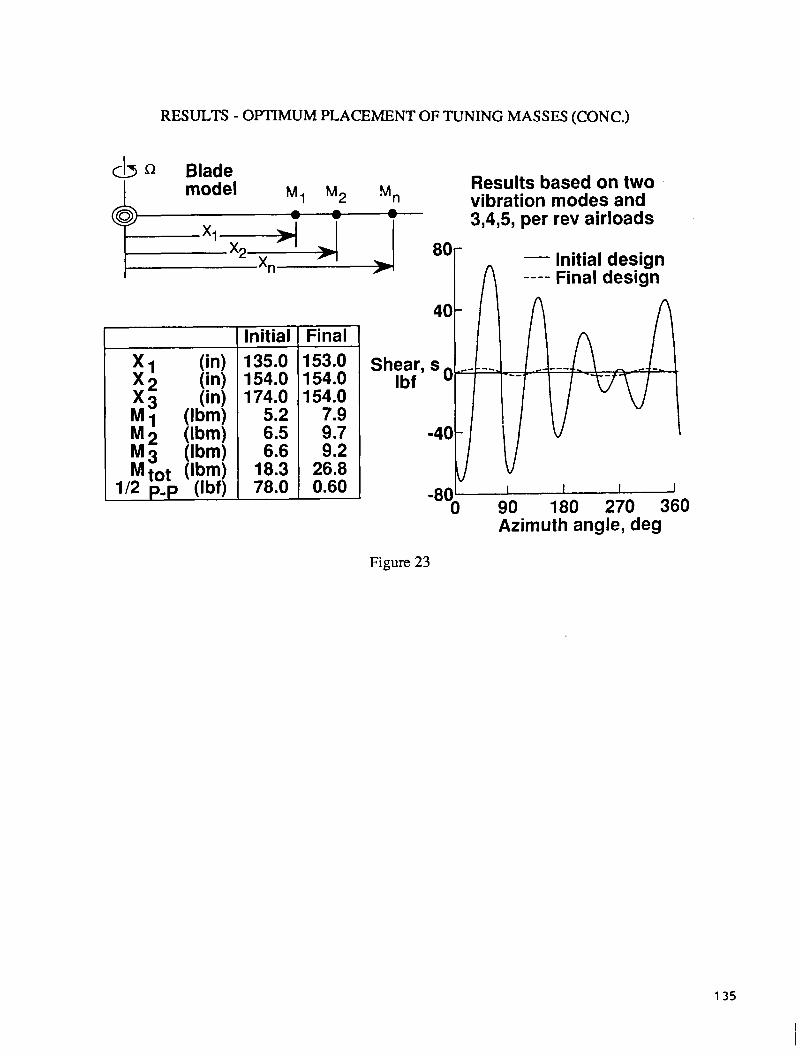
RESULTS - OPTIMUM PLACEMENT OF TUNING MASSES (CONC.)
Results based on two
3,4,5, per rev airloads
- Initial design ---- Final design
&j Q Blade model
M1 M2 M" vibration modes and -
Initial 135.0 154.0 174.0
18.3 78.0
Fi na I 153.0 154.0 154.0
9.7 9.2
26.8 0.60
40
Shear, s o I bf
-40
I. , v I I I I
90 180 270 360 Azimuth angle, deg
-80' 0
Figure 23
135
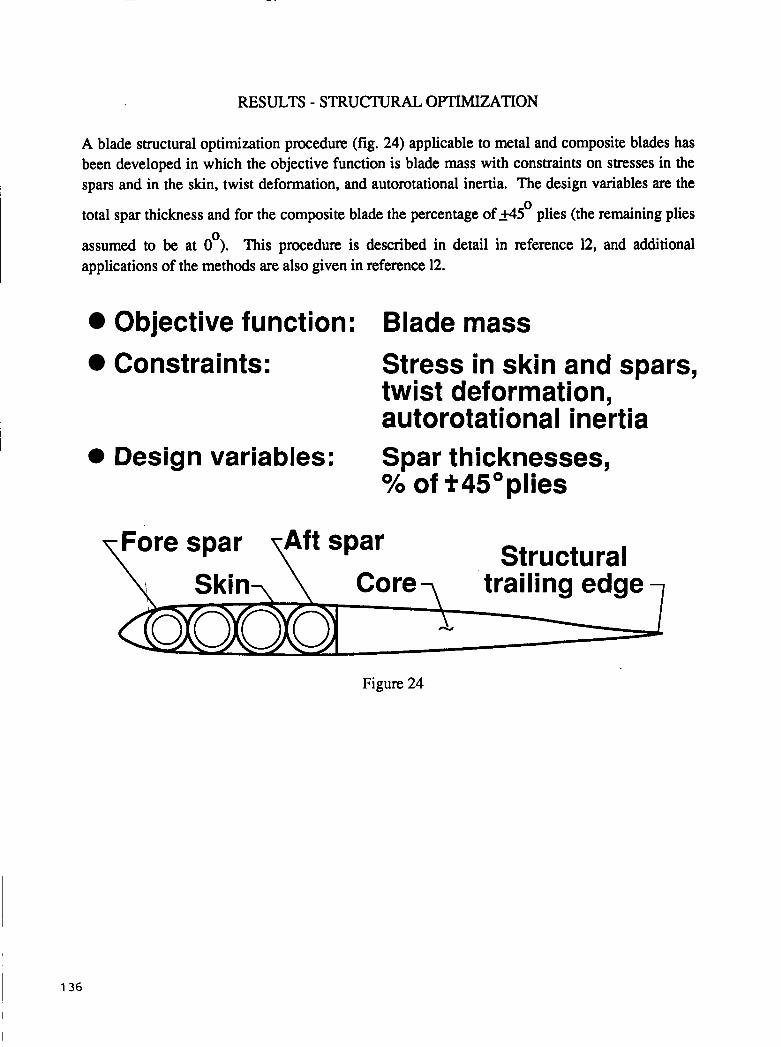
RESULTS - STRUCTURAL OPTIMIZATION
A blade structural optimization procedure (fig. 24) applicable to metal and composite blades has been developed in which the objective function is blade mass with constraints on stresses in the spars and in the skin, twist deformation, and autorotational inertia. The design variables are the
total spar thickness and for the composite blade the percentage of 9 5 plies (the remaining plies
assumed to be at 0 ). This procedure is described in detail in reference 12, and additional applications of the methods are also given in reference 12.
0
0
Objective function: Blade mass Constraints: Stress in skin and spars,
twist deformation, autorotational inertia
0 Design variables: Spar thicknesses, % of *45Oplies
Structural
Figure 24
I 136
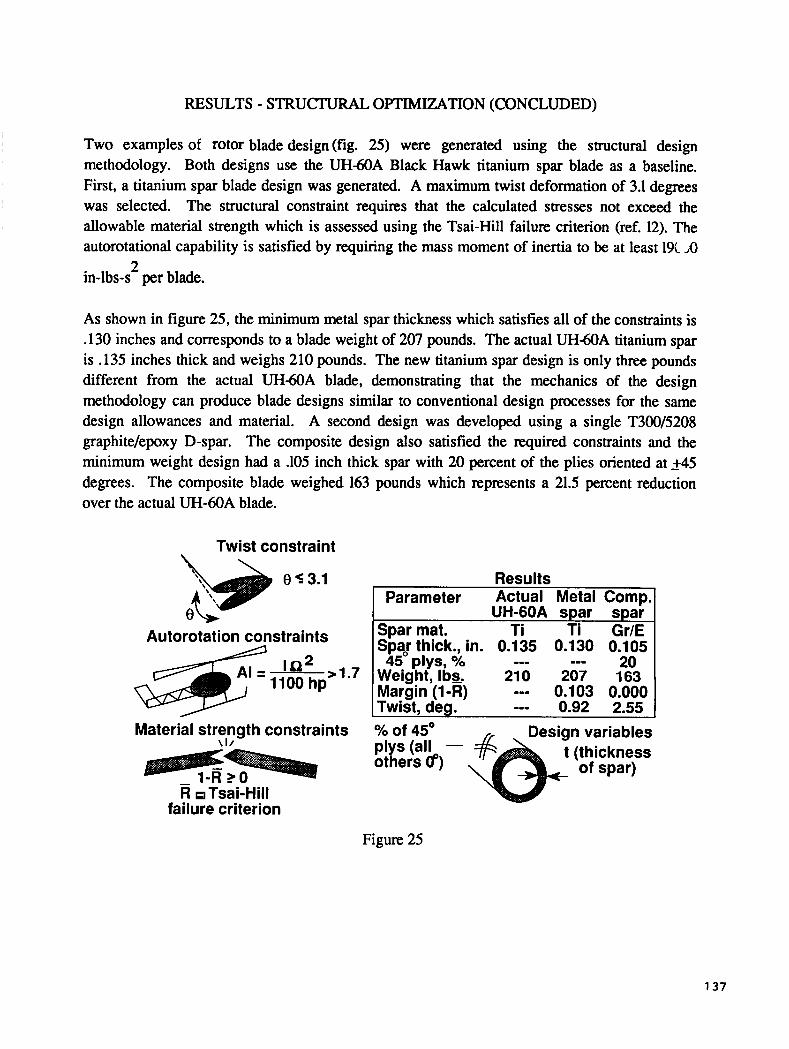
RESULTS - STRUCTURAL OPTIMIZATION (CONCLUDED)
Two examples of rotor blade design(fig. 25) were generated using the structural design methodology. Both designs use the U H m A Black Hawk titanium spar blade as a baseline. First, a titanium spar blade design was generated. A maximum twist deformation of 3.1 degrees was selected. The structural constraint requires that the calculated stresses not exceed the allowable material strength which is assessed using the Tsai-Hill failure criterion (ref. 12). The autorotational capability is satisfied by requiring the mass moment of inertia to be at least 19C ,O
in-lbs-s per blade. 2
As shown in figure 25, the minimum metal spar thickness which satisfies all of the constraints is .130 inches and corresponds to a blade weight of 207 pounds. The actual UHmA titanium spar is .135 inches thick and weighs 210 pounds. The new titanium spar design is only three pounds different from the actual UH-60A blade, demonstrating that the mechanics of the design methodology can produce blade designs similar to conventional design processes for the same design allowances and material. A second design was developed using a single T300/5208 graphite/epoxy D-spar. The composite design also satisfied the required constraints and the minimum weight design had a .I05 inch thick spar with 20 percent of the plies oriented at +I5 degrees. The composite blade weighed 163 pounds which represents a 21.5 percent reduction over the actual UH-60A blade.
Twist constraint
e s 3.1
U b Autorotation constraints
la* >1.7 1100 hp
Results Parameter Actual Metal ComD,
UH-GOA spar spai SDar mat. Ti Ti Gr/E Spa! thick., in. 0.135 0.130 0.105
20 Weight, Ibs, 210 207 163 Margin (1-R) --- 0.103 0.000
45 plys, % --- ---
Twist. dea. --- 0.92 2.55
Material strength constraints )/o of 45' plys (all - others 0")
- R Tsai-Hill
failure criterion
Figure 25
137
VALIDATION OF PROCEDURES
The process of validating the optimization methodology (fig. 26) involves substantially more than evaluating the success of the final design. Specifically, the analyses used in optimizing the rotor during the Phase 1 effort will be examined for predictive fidelity and design technique validation. The usefulness of the basic tools involves not only accuracy of analysis, but also a reliable parametric sensitivity capability. Several opportunities are currently available to assess the fidelity of the analyses. For example, rotor performance, dynamics, and acoustics predictions need accurate inflow distributions for various flight conditions. Recent experimental efforts (e.g., ref. 19) and code validations (ref. 14) are helping to provide confidence in the available inflow models. Rotor geometric design variable sensitivity (e.g., effect of taper on performance) which was reasonably well-known for past rotor designs, is being re-examined in light of recent correlation anomalies for high-speed flight. Acoustic source mechanisms and modeling validity are also being examined (ref. 20), especially for parametric sensitivity of the acoustic energy to rotor state. Structural coupling mechanics are being exploited in new rotor designs to assess the structural tailoring benefits while satisfying structural integrity requirements (ref. 2 1).
Proof of the fidelity of design techniques is crucial to the overall design optimization effort. For example, aerodynamics and dynamics interact so strongly in rotor design that basic aeroelastic tailoring efforts must be validated. Such a validation effort is being undertaken at Langley, as well as other research centers (ref. 22). Also, since rotor speed is a strong driver for aeroelastic response, a program to assess variable RPM designs is under way at Langley. The object of this effort is to define the benefits and limitations of an aerodynamically and dynamically designed multi-speed rotor. In addition to design techniques, which capitalize on the strong effects of certain design variables, small variances in other blade characteristics may impede the practical operation of even conventional designs. Hence, the ability to accurately predict even these secondary phenomena is important for the design effort. For example, track-and-balance sensitivity experiments and studies are being undertaken which can lead to a practical design capability to eliminate blade-to-blade variability effects.
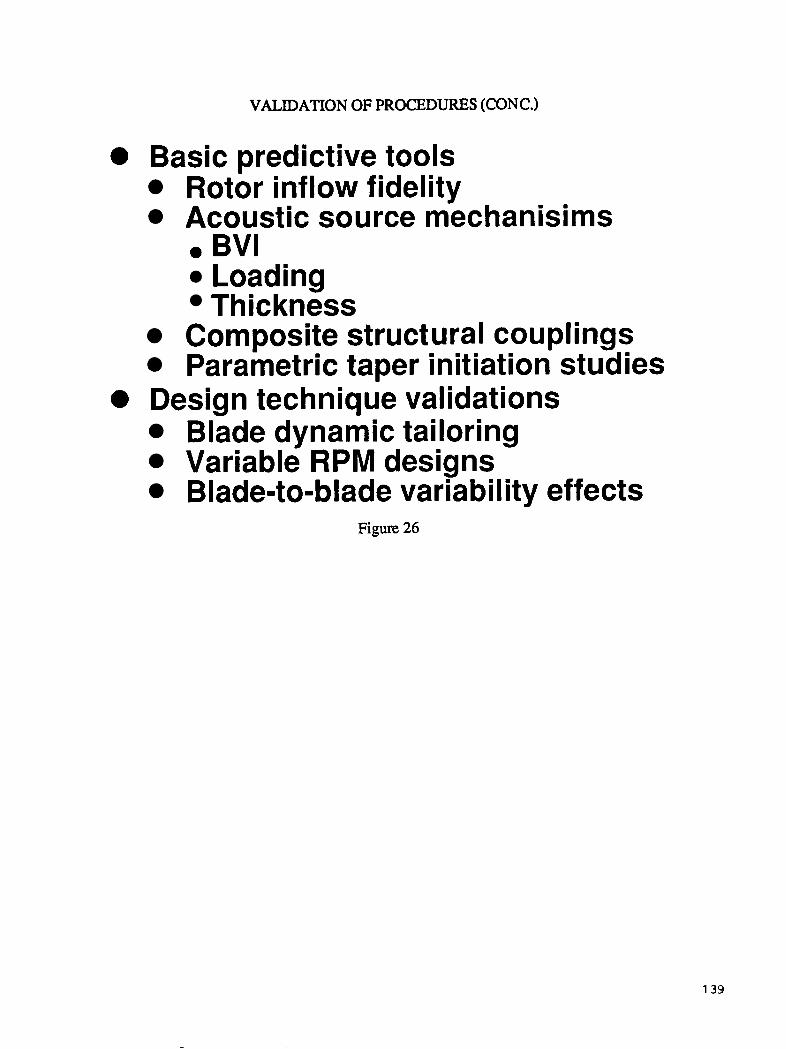
VALIDATION OF PROCEDURES (CONC.)
0 Basic predictive tools Rotor inflow fidelity Acoustic source mechanisims 0 BVI
Loading Thickness
Composite structural couplings Parametric taper initiation studies
0 Design technique validations Blade dynamic tailoring Variable RPM designs Blade-to-blade variability effects
Figure 26
139
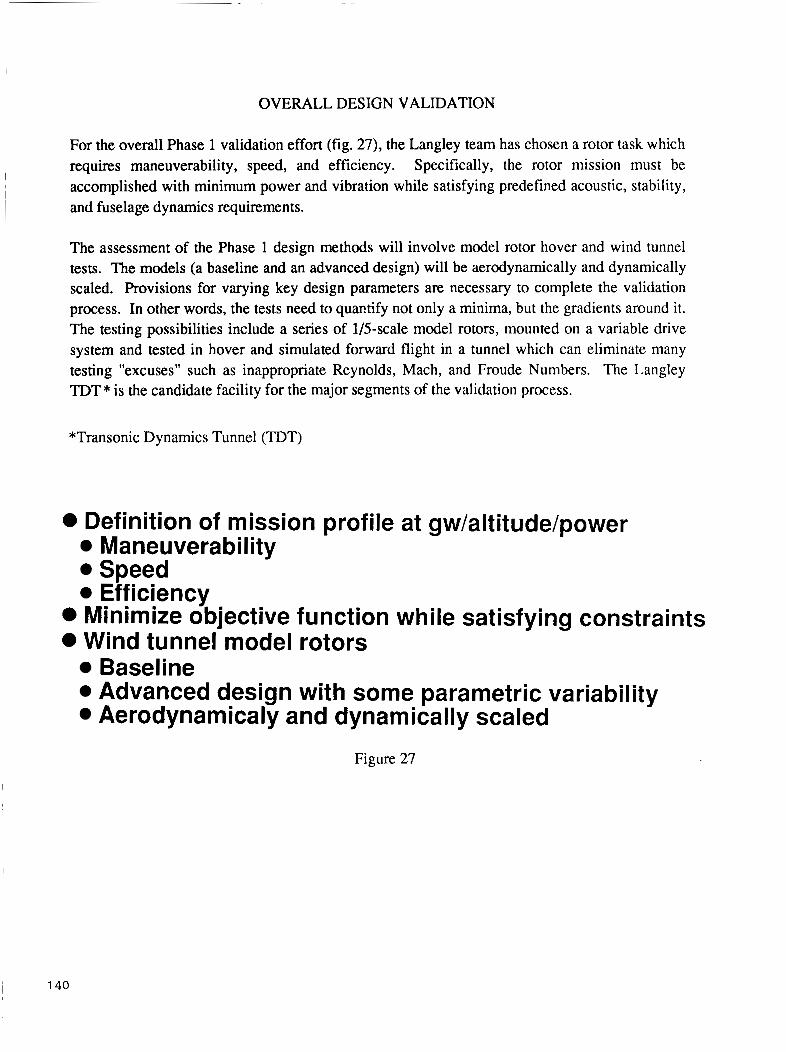
OVERALL DESIGN VALIDATION
For the overall Phase 1 validation effort (fig. 27), the Langley team has chosen a rotor task which requires maneuverability, speed, and efficiency. Specifically, the rotor mission must be accomplished with minimum power and vibration while satisfying predefined acoustic, stability, and fuselage dynamics requirements.
The assessment of the Phase 1 design methods will involve model rotor hover and wind tunnel tests. The models (a baseline and an advanced design) will be aerodynamically and dynamically scaled. Provisions for varying key design parameters are necessary to complete the validation process. In other words, the tests need to quafitify not only a minima, but the gradients around it. The testing possibilities include a series of lb-scale model rotors, mounted on a variable drive system and tested in hover and simulated forward flight in a tunnel which can eliminate many testing "excuses" such as inappropriate Reynolds, Mach, and Froude Numbers. The Langley TDT * is the candidate facility for the major segments of the validation process.
*Transonic Dynamics Tunnel (TDT)
0 Definition of mission profile at gw/altitude/power Maneuverability Speed Efficiency
Baseline Advanced design with some parametric variability
0 Minimize objective function while satisfying constraints 0 Wind tunnel model rotors
I Aerodynamicaly and dynamically scaled
Figure 27
I 140
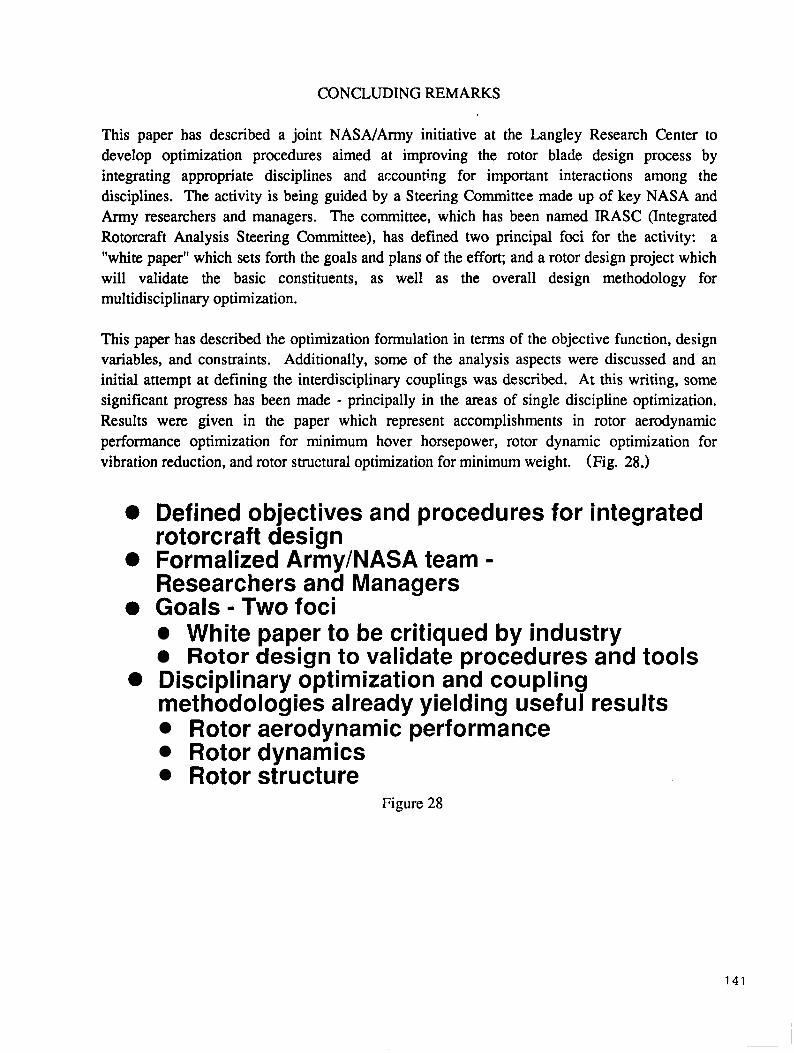
CONCLUDING REMARKS
This paper has described a joint NASNArmy initiative at the Langley Research Center to develop optimization procedures aimed at improving the rotor blade design process by integrating appropriate disciplines and accounti.ng for important interactions among the disciplines. The activity is being guided by a Steering Committee made up of key NASA and Army researchers and managers. The committee, which has been named IRASC (Integrated Rotorcraft Analysis Steering Committee), has defined two principal foci for the activity: a "white paper" which sets forth the goals and plans of the effort; and a rotor design project which will validate the basic constituents, as well as the overall design methodology for multidisciplinary optimization.
This paper has described the optimization formulation in terms of the objective function, design variables, and constraints. Additionally, some of the analysis aspects were discussed and an initial attempt at defining the interdisciplinary couplings was described. At this writing, some significant progress has been made - principally in the areas of single discipline optimization. Results were given in the paper which represent accomplishments in rotor aerodynamic performance optimization for minimum hover horsepower, rotor dynamic optimization for vibration reduction, and rotor structural optimization for minimum weight. (Fig. 28.)
0 Defined objectives and procedures for integrated rotorcraft design
0 Formalized Army/NASA team - Researchers and Managers
0 Goals - Two foci White paper to be critiqued by industry Rotor design to validate procedures and tools
0 Disciplinary optimization and coupling methodologies already yielding useful results
Rotor aerodynamic performance Rotor dynamics Rotor structure
Figure 28
141
REFERENCES
1. Aircraft, Vol. 19, No. 1,1982, pp. 5-28.
Ashley, H.: On Making Things the Best - Aeronautical Use of Optimization. Journal of
2. Sobieszczanski-Sobieski, J.: Structural Optimization Challenges and Opportunities. Presented at International Conference on Modem Vehicle Design Analysis, London, England, June 1983.
3. Problems: A Survey. NASA TM-86010, October 1984.
Miura, H.: Application of Numerical Optimization Methods to Helicopter Design
4. Bennett, R. L.: Application of Optimization Methods to Rotor Design Problems. Vertica, ~ Vol. 7, NO. 3,1983, pp. 201-208.
5. Peters, D. A.; Rossow, M. P.; Korn, A.; and KO, T.: Design of Helicopter Rotor Blades for Optimum Dynamic Characteristics. Computers and Mathematics with Applications, Vol. 12A, NO. 1,1986, pp. 85-109.
6. Rotorcraft. Vertica, Vol. 9, No. 4,1986, pp. 363-376.
Friedmann, P.: Application of Modern Structural Optimization to Vibration Reduction in
7. Reduction in Forward Flight. Journal of American Helicopter Society, October 1984, pp. 70-80.
Friedmann, P.; and Shanthakumaran, P.: Optimum Design of Rotor Blades for Vibration
8. NASA CP-2327, Part 2, September 1984, pp. 609-625.
Davis, M. W.: Optimization of Helicopter Rotor Blade Design for Minimum Vibration.
9. Chattopadhyay, Aditi; and Walsh, Joanne L.: Minimum Weight Design of Rotorcraft Blades with Multiple Frequency and Stress Constraints. Proceedings of the AIAA/ASME/ASCE/AHS 29th Structures, Structural Dynamics and Materials Conference, Williamsburg, VA, April 18-20, 1988. AIAA Paper No. 88-2337-CP. Also available as NASA TM-100569, March 1988.
I 1 4 2
10. Walsh, J. L.; Bingham, G. J.; and Riley, M. F.: Optimization Methods Applied to the Aerodynamic Design of Helicopter Rotor Blades. Journal of American Helicopter Society, October 1987, pp. 39-44.
11. Proceedings of the 43rd Annual AHS Forum, St. Louis, MO, May 18-20,1987.
Kumar, S.; and Bassett, D.: Rotor Performance Optimization for Future Light Helicopters.
12. Minimum Weight. NASA TP-2730, July 1987.
Nixon, M. W.: Preliminary Structural Design of Composite Main Rotor Blades for
13. Gessow, Alfred; and Myers, Gany C., Jr.: Aerodynamics of the Helicopter. Frederick Unger Publishing Company, NY, 1952.
14. Berry, J. D.; Hoad, D. R.; Elliott, J. W.; and Althoff, S. L.: Helicopter Rotor Induced Velocities, Theory and Experiment. Proceedings of the AHS Specialists Meeting on Aerodynamics Acoustics, Fort Worth, TX, February 1987.
15. Lend, 2091. Engineering Information Systems, July 1983. San Jose, CA
Whetstone, W. D.: Engineering Analysis Language Reference Manual EISI-EAL System
16. Lang, K. W.; and Nemat-Nasser, S.: An Approach for Estimating Vibration Characteristics of Non-uniform Rotor Blades. AIAA Journal, Vol. 17, No. 9, September 1979.
17. Brentner, K. S.: Prediction of Helicopter Rotor Discrete Frequency Noise - A Computer Program Incorporating Realistic Blade Motions and Advanced Acoustic Formulation. NASA TM-87721, October 1986.
18. Vanderplaats, G. N.: CONMIN - A Fortran Program for Constrained Function Minimization. User’s Manual. NASA TMX-62282, August 1973.
19. Velocimeter on a Helicopter Model in Forward Flight. NASA TM-100541, April 1988.
Elliott, J. W.; Althoff, S. L.; and Sailey, R. H.: Inflow Measurement Made with a Laser
20. Cardonna, F. X.; Lantenschlager, J. L.; and Silva, M. J.: An Experimental Study of Rotor- Vortex Interactions. AIAA Paper No. 88-0045. Presented at AIAA 26th Aerospace Sciences Meeting, Reno, Nevada, January 1988.
143

21. Lake, R. C.; and Nixon, M. W.: A Preliminary Investigation of Finite-Element Modeling in Analysis for Composite Rotor Blades. Proceedings of the Second International Conference on Rotorcraft Basic Research, College Park, Maryland, February 1988.
22. Weller, William H.; and Davis, Mark W.: Experimental Verification of Helicopter Blade Designs Optimized for Minimum Vibration. Proceedings of the 44th Annual Forum of the American Helicopter Society, Washington, DC, June 1988.
~
! 144
N89- 25 1 STRUCTURAL OPTIMIZATION OF ROTOR BLADES WITH STRAIGHT AND
SWEPT TIPS SUBJECT TO AEROELASTIC CONSTRAINTS
P e r e t z P. Friedmann Mechanical, Aerospace and Nuclear Engineering Department
U n i v e r s i t y o f C a l i f o r n i a , Los Angeles, CA 90024
and
5 2
Roberto C e l i Aerospace Engineering Department
U n i v e r s i t y o f Maryland, Co l lege Park, MD 20742
145
LIST OF SYMBOLS
Blade semichord Th rus t c o e f f i c i e n t Vector o f des ign v a r i a b l e s O b j e c t i v e f u n c t i o n Grad ien t o f o b j e c t i v e f u n c t i o n o r behav io r c o n s t r a i n t s Vector o f behav io r c o n s t r a i n t s He igh t of t h e s i n g l e c e l l c ross s e c t i o n Hessian o f o b j e c t i v e f u n c t i o n o r behav io r c o n s t r a i n t s Mass moment o f i n e r t i a o f t h e b lade i n f l a p p i n g Mass p o l a r moment o f i n e r t i a o f t h e r o t o r Length o f t h e e l a s t i c p o r t i o n o f t h e b lade Thickness o f t h e cross s e c t i o n Peak-to-peak va lue o f t h e 4 / rev v e r t i c a l hub shears, nondimensional ized through d i v i s i o n by 2R21b/fi O f f s e t between t h e e l a s t i c a x i s and t h e aerodynamic cen te r , p o s i t i v e f o r aerodynamic c e n t e r ahead o f t h e e l a s t i c a x i s O f f s e t between t h e e l a s t i c a x i s and t h e c e n t e r o f g r a v i t y , p o s i t i v e f o r c e n t e r o f g r a v i t y ahead o f t h e e l a s t i c a x i s D is tance between l e a d i n g edge and i n t e r n a l w a l l i n double c e l l c ross s e c t i o n Chordwise l e n g t h o f t h e cross s e c t i o n Blade Lock number Real p a r t o f hover s t a b i l i t y e igenvalue f o r t h e k - t h mode T i p sweep angle, p o s i t i v e f o r backward sweep Advance r a t i o Ro to r s o l i d i t y Ro to r angu la r v e l o c i t y
1. INTRODUCTION AND PROBLEM STATEMENT
o f t h e most c o s t e f f e c t i v e s o l u t i o n s t o t h e problem o f v i b r a t i o n i n r o t o r - c r a f t i s t o des ign r o t o r b lades w i t h an i n h e r e n t l y low v i b r a t i o n l e v e l . accomplished by a e r o e l a s t i c t a i l o r i n g t h e b lade, u s i n g s t r u c t u r a l o p t i m i z a t i o n . Th is i m p l i e s t h a t t h e b lade mass and s t i f f n e s s d i s t r i b u t i o n s and i t s geometry a r e d e t e r - mined i n such a manner t h a t t h e v i b r a t i o n l e v e l s a t t h e r o t o r hub a r e minimized. Using t h i s approach v i b r a t i o n s a r e reduced d i r e c t l y a t t h e i r source, i.e., t h e r o t o r .
T h i s can be
A thorough rev iew o f t h e l i t e r a t u r e concerning t h e use o f optimum design tech- niques i n dynamic problems, and p a r t i c u l a r l y i n h e l i c o p t e r r o t o r b lade dynamic design, i s presented i n r e f . (1). A more r e c e n t survey has been presented by Friedmann (ref. 2) . These rev iews reveal t h e ex i s tence o f a v e r y l i m i t e d amount o f work devoted t o t h e s t r u c t u r a l o p t i m i z a t i o n o f r o t o r b lades f o r v i b r a t i o n reduct ion.
I n another r e c e n t survey Miura ( r e f . 3) s t a t e s t h a t i t i s n o t unreasonable t o pursue des ign o p t i m i z a t i o n i n areas, such as h e l i c o p t e r v i b r a t i o n reduc t i on , i n which r e l i a b l e p r e d i c t i o n c a p a b i l i t i e s do n o t e x i s t y e t . B e t t e r o p t i m i z a t i o n $technology can be developed and implemented i n h i g h l y modular computer codes so t h a t new, improved a n a l y s i s codes can be e a s i l y i n c o r p o r a t e d as they become a v a i l a b l e , and the o p t i m i z a t i o n program can work w i t h t h e b e s t p r e d i c t i v e c a p a b i l i t y a v a i l a b l e a t any p a r t i cu 1 a r t ime.
146
When t h e mass and s t i f f n e s s d i s t r i b u t i o n s o f t he b lade a r e changed t o reduce the v i b r a t i o n l e v e l s i t i s v e r y impor tan t t o be sure t h a t no degrada t ion o f t h e aero- e l a s t i c s t a b i l i t y occurs. T h i s i s even more i m o r t a n t when t i p sweep i s added as a des ign v a r i a b l e because o f i t s powerfu l i n f l u e n c e on bo th b lade response and s t a b i l - i t y ( r e f . 4 ) . c o n s t r a i n t s i n t h e optimum design process. T h i s compl icates t h e des ign problem because a f u l l y coupled a e r o e l a s t i c s t a b i l i t y and response a n a l y s i s has t o be com- b ined w i t h t h e s t r u c t u r a l o p t i m i z a t i o n program. Only a few s t u d i e s hav ing t h i s capa- b i l i t y a r e a v a i l a b l e ( r e f s . 1,5,6). I n r e f s . (1,5,6) t h e o b j e c t i v e was t h e m i n i m i z a t i o n o f t h e 4 / r e v o s c i l l a t o r y v e r t i c a l hub shears a t an advance r a t i o p = 0.3. The a e r o e l a s t i c s t a b i l i t y c o n s t r a i n t s r e q u i r e d t h a t t h e fundamental f requencies i n f l a p , l a g , and t o r s i o n f a l l between pre-assigned upper and lower bounds.
Prudence mandates t h e i n t r o d u c t i o n o f a e r o e l a s t i c s t a b i l i t y
I n a study by Pe te rs e t a l . ( r e f . 7 ) two d i f f e r e n t o b j e c t i v e f u n c t i o n s were used t o m in im ize b lade we igh t i n one case, and t h e d iscrepancy between d e s i r e d and a c t u a l n a t u r a l f requenc ies o f t h e blade. A s i m p l i f i e d f o r c e d response a n a l y s i s leads t h e au tho rs t o conclude t h a t t h e o b j e c t i v e f u n c t i o n s used i n t h e s tudy a r e "adequatell f o r v i b r a t i o n r e d u c t i o n purposes, b u t no comprehensive a e r o e l a s t i c a n a l y s i s i s performed, and no s t a b i l i t y c o n s t r a i n t s a r e imposed on t h e design.
Davis and W e l l e r ( r e f . 8) used s t r u c t u r a l o p t i m i z a t i o n techniques t o s o l v e f o u r d i f f e r e n t dynamic problems, namely: (a) maximizat ion o f t h e i n -p lane s t r u c t u r a l damping o f a b e a r i n g l e s s r o t o r w i t h e las tomer i c dampers; (b) placement o f b lade n a t u r a l f requencies; ( c ) m i n i m i z a t i o n o f t h e v i b r a t o r y hub shears u s i n g a s i m p l i f i e d r o t o r aerodynamic model; and (d) m i n i m i z a t i o n o f c e r t a i n r o t o r v i b r a t i o n i nd i ces . The r o t o r a n a l y s i s codes were d i r e c t l y coupled t o t h e o p t i m i z a t i o n codes. a e r o e l a s t i c s t a b i l i t y c o n s t r a i n t s were considered.
No
More r e c e n t work has a l s o addressed t h e minimum we igh t des ign o f r o t o r blades w i t h f requency c o n s t r a i n t s ( r e f . 9) as w e l l as t h e v i b r a t i o n r e d u c t i o n problem i n fo rward f l i g h t by u s i n g o p t i m a r l y p laced t u n i n g masses ( r e f . 10) w i t h o u t e n f o r c i n g a e r o e l a s t i c response a n a l y s i s t o o b t a i n t h e v i b r a t o r y loads. Such s t u d i e s a r e use fu l s i n c e they c o n t r i b u t e towards t h e o v e r a l l understanding o f t h e problem; however, t h e p o s s i b i l i t y e x i s t s t h a t such an approach may n o t produce r e l i a b l e designs. A ve ry d e t a i l e d combined exper imenta l and t h e o r e t i c a l s tudy ( r e f . l l ) , aimed a t exper imental v e r i f i c a t i o n o f h e l i c o p t e r b lade designs op t im ized f o r v i b r a t i o n reduc t i on , i n d i c a t e d t h e need f o r using t h e dynamic l o a d i n g on t h e blade, ob ta ined f rom t h e a e r o e l a s t i c response, i n t h e o p t i m i z a t i o n process.
A s e r i o u s problem encountered i n t h e d i r e c t c o u p l i n g o f a comprehensive a e r o e l a s t i c s t a b i l i t y and response code w i t h an o p t i m i z a t i o n , o r n o n l i n e a r mathemati- c a l p r o g r a m i n g code i s t h e ve ry l a r g e computat ion e f f o r t r e q u i r e d f o r t h e s o l u t i o n . T h i s problem can be a l l e v i a t e d by c o n s t r u c t i n g an approximate, c o m p u t a t i o n a l l y e a s i e r t o so lve, o p t i m i z a t i o n problem ( r e f . 12). The approximate problems converge t o the s o l u t i o n o f t h e o r i g i n a l , exac t o p t i m i z a t i o n problems.
One t y p i c a l method o f c o n s t r u c t i n g t h e approximate problem i s t o expand t h e o b j e c t i v e f u n c t i o n and t h e behav io r c o n s t r a i n t s i n f i r s t o r second o r d e r T a y l o r s e r i e s i n terms o f t h e des ign v a r i a b l e s , and i n t h e neighborhood o f t h e c u r r e n t des ign ( r e f . 12). T h i s method o r i g i n a t e d i n t h e f i e l d o f s t a t i c s t r u c t u r a l a n a l y s i s , i n which t h e g r a d i e n t i n f o r m a t i o n r e q u i r e d t o c o n s t r u c t t h e T a y l o r s e r i e s expansions can be ob ta ined a t a f r a c t i o n o f t h e c o s t o f one a n a l y s i s , through i m p l i c i t d i f f e r e n - t i a t i o n ( r e f . 13). T h i s i s d i f f i c u l t t o achieve i n h e l i c o p t e r a e r o e l a s t i c op t im iza - t i o n , and t h e g r a d i e n t i n f o r m a t i o n has t o be cons t ruc ted u s i n g expensive-to-compute f i n i t e d i f f e r e n c e approximat ions. References (1,5,6) u t i l i z e d an expensive approach
147
based on f i n i t e d i f f e r e n c e s f o r genera t i ng approx imat ions t o t h e o b j e c t i v e f u n c t i o n and a e r o e l a s t i c c o n s t r a i n t s . The genera t i on o f t h e approximate problem was cumber- some and had t o be c a r r i e d o u t i n an i n t e r a c t i v e manner, d u r i n g t h e o p t i m i z a t i o n pro- cess. I t i s a l s o p o s s i b l e t o c o n s t r u c t approximate problems us ing d e r i v a t i v e s , o r t h e s e n s i t i v i t y o f t h e o b j e c t i v e func t i on . T h i s approach was s u c c e s s f u l l y used i n a recent , comprehensive o p t i m i z a t i o n s tudy by Lim and Chopra ( r e f . 14).
I T h i s paper has t h r e e main o b j e c t i v e s :
1. To d e s c r i b e a new f o r m u l a t i o n o f t h e s t r u c t u r a l o p t i m i z a t i o n problem f o r a h e l i - c o p t e r r o t o r b lade i n fo rward f l i g h t . The o b j e c t i v e i s t h e m i n i m i z a t i o n o f t h e n / r e v v e r t i c a l hub shears. The behav io r c o n s t r a i n t s express ma themat i ca l l y t h e requirements t h a t t h e b lade be a e r o e l a s t i c a l l y s t a b l e , t h a t i t s n a t u r a l f requen- c i e s f a l l between preass igned upper and lower bounds, and t h a t t h e a u t o r o t a t i o n performance n o t be degraded d u r i n g t h e a e r o e l a s t i c t a i l o r i n g process. A new f o r - m u l a t i o n o f t h e approximate problem a l l o w s increases i n e f f i c i e n c y , i n t h e complete s o l u t i o n o f t h e optimum design problem, o f a t l e a s t one o r d e r o f magni- tude, compared w i t h e x i s t i n g procedures.
2. To p resen t r e s u l t s ob ta ined by l e t t i n g t h e t i p sweep angle be one o f t h e des ign v a r i a b l e s i n t h e o p t i m i z a t i o n procedure. T i p sweep has a powerfu l i n f l u e n c e on t h e dynamic behav io r t h e b lade, and when i n c l u d e d i n t h e a e r o e l a s t i c t a i l o r i n g process, can l e a d t o f u r t h e r r e d u c t i o n s i n b lade v i b r a t i o n l e v e l s .
To d e s c r i b e some ongoing work be ing c a r r i e d o u t a t UCLA on t h e s t r u c t u r a l o p t i m i z a t i o n o f r o t o r blades w i t h s t r a i g h t and swept t i p s .
3.
F i n a l l y i t should be noted t h a t a cons ide rab le amount o f a d d i t i o n a l r e s u l t s per- t a i n i n g t o t h e f i r s t two o b j e c t i v e s o f t h i s paper can be found i n r e f s . (15)-(18).
2. AEROELASTIC STABILITY AND RESPONSE ANALYSIS
T h i s s e c t i o n desc r ibes b r i e f l y t h e a e r o e l a s t i c s t a b i l i t y and response a n a l y s i s and t h e procedure used t o c a l c u l a t e t h e v e r t i c a l hub shears, t h a t i s , t h e a n a l y s i s p o r t i o n o f t h e optimum des ign process. a r e s i m i l a r t o those d e r i v e d i n r e f . (19). desc r ibed i n r e f . ( 4 ) . The equat ions d e s c r i b e t h e coupled f l a p - l a g - t o r s i o n a l mot ion o f a f l e x i b l e , homogeneous, i s o t r o p i c blade, modeled as a B e r n o u l l i - E u l e r beam undergoing smal l s t r a i n s and moderate d e f l e c t i o n s . G e o m e t r i c a l l y n o n l i n e a r terms a re p resen t i n t h e s t r u c t u r a l , i n e r t i a , and aerodynamic opera to rs , due t o n o n l i n e a r beam k inemat ics. The i n e r t i a loads a r e ob ta ined u s i n g D 'A lember t ' s p r i n c i p l e . Quasi - steady s t r i p theo ry , w i t h u n i f o r m i n f l o w , i s used t o d e r i v e t h e aerodynamic loads. S t a l l and c o m p r e s s i b i l i t y e f f e c t s a r e n o t inc luded. I n t h e model ing o f t h e swept t i p t h e independence p r i n c i p l e i s assumed t o apply , t h a t i s , t h e aerodynamic loads depend o n l y on t h e component o f t h e f l o w conta ined i n t h e p lane o f t h e c ross sec t i on , and r a d i a l f l o w e f f e c t s a r e neg lec ted ( r e f . 4).
The equat ions o f mo t ion o f t h e s t r a i g h t b lade The model ing o f t h e swept t i p i s
The s p a t i a l dependence o f t h e p a r t i a l d i f f e r e n t i a l equat ions o f mo t ion o f t he b lade i s e l i m i n a t e d by us ing a G a l e r k i n method o f weighted r e s i d u a l s ( r e f . 19). T h i s r e s u l t s i n a f i n i t e element d i s c r e t i z a t i o n . Cubic i n t e r p o l a t i o n polynomia ls a re used f o r t h e model ing o f f l a p and l a g bending, q u a d r a t i c i n t e r p o l a t i o n polynomia ls f o r t h e model ing o f t o r s i o n . The r e s u l t i n g f i n i t e elements have a t o t a l o f 11 degrees o f freedom: displacement and s lope a t each end o f t h e element, f o r f l a p and
I 143
l a g bending, r o t a t i o n a t each end o f the element and a t a mid-element node, f o r t o r - sion. The a x i a l degree o f freedom i s e l im ina ted by making the assumption t h a t the blade i s inextens ional . The p a r t i a l d i f f e r e n t i a l equations o f mot ion o f the blade are thus transformed i n t o a se t o f nonl inear, coupled, o rd inary d i f f e r e n t i a l equations w i t h p e r i o d i c coe f f i c i en ts . A modal coordinate t ransformat ion i s per- formed t o reduce the number o f degrees o f freedom. S i x r o t a t i n g coupled blade nor- mal modes a re used t o perform the modal coordinate t ransformat ion. The coupled modes are ca lcu la ted f o r a r o o t p i t c h angle equal t o the c o l l e c t i v e p i t ch .
I n forward f l i g h t , the e q u i l i b r i u m p o s i t i o n o f the blade is t i m e dependent, and is obtained by so l v ing a sequence o f l i n e a r , pe r iod i c response problems, using quasi- l i n e a r i z a t i o n . The s t a b i l i t y o f the system is determined us ing Floquet theory. A spec ia l , i m p l i c i t fo rmula t ion o f quas i l i nea r i za t i on ( r e f . 20) which reduces con- s iderab ly the implementation e f f o r t i s used. The a lgebra ic expressions t h a t de f ine the aerodynamic loads are no t expanded e x p l i c i t l y . They are coded separate ly i n the computer program and combined numer ica l ly dur ing the s o l u t i o n procedure. Q u a s i l i n e a r i z a t i o n is a Newton-Raphson type procedure, and the d e r i v a t i v e matr ices t h a t a re requ i red by the a lgor i thm a r e computed using f i n i t e d i f f e r e n t approxima- t ions.
The o v e r a l l h e l i c o p t e r t r i m procedure used i n t h i s study is a propu ls ive trim procedure i d e n t i c a l t o t h a t used i n ref. (21).
The c a l c u l a t i o n o f the hub loads, cons is t ing o f forces and moments, i s performed us lng the d l rec t fo rce I n t e g r a t i o n method. The response o f the blade I s obtained f r o m the ae roe las t i c response c a l c u l a t i o n code; thus the hub loads are obtained f rom a spanwise I n t e g r a t i o n o f the I n e r t i a and aerodynamic loads d i s t r i b u t e d along the blade. D e t a i l s on the hub loads ca l cu la t i ons can be found i n re fs . 15-18.
3. FORMULATION OF THE OPTIMUM DESIGN PROBLEM
The op t im iza t i on problem i s cast i n r mathematical p rog raming form. Thus the o b j e c t i v e i s t o minimize a subject t o a c e r t a i n number o f
) o f a vector 8 o f design var iab les ,
To reduce the computational requirements, the computer program performing the ae roe las t i c ana lys i s i s n o t connected d i r e c t l y t o the op t im iza t ion program. Instead, the op t im iza t i on i s conducted on an approximate p r o b l m , which reproduces the charac- t e r i s t i c s o f the ac tua l problem i n a neighborhood o f the cur ren t design, and which i s cont inuously updated as the op t im iza t ion progresses.
An e f f e c t i v e method o f b u i l d i n g an approximate problem i s t o expand the ob jec t i ve func t i on and the behavior cons t ra in t s i n Tay lor ser ies i n terms o f the design var iab les ( re f . 9):
F(8) = F(a0) + VF(80)6d + $ 6dT[H(do)]6d (3 )
149
where F(d) i s t ken t o be
a t t h e c u r r e n t dgsign. The Hessian m a t r i x i s t h e m a t r i x o f t h e second p a r t i a l d e r i v a t i v e s o f t h e o b ' e c t i v e f u n c t i o n w i t h respec t t o t h e des ign va r iab les . The
n o b j e c t i v e o r c o n s t r a i n t f unc t i on , z) i s t h e c u r r e n t design, and VF( if ) and [H($ j l a r e r e s p e c t i v e l y t h e g r a d i e n t and f h e Hessian matr
p e r t u r b a t i o n v e c t o r 6 i) i s d e f i n e d as
68 = z) - a, ( 4
X
The most expensive f u n c t i o n t o eva lua te i s t h e o b j e c t i v e f u n c t i o n . The c o s t o f one e v a l u a t i o n o f t h e o b j e c t i v e f u n c t i o n i s two o rde rs o f magnitude h i g h e r than the t o t a l c o s t o f e v a l u a t i n g t h e behav io r c o n s t r a i n t s . No a n a l y t i c expressions f o r the g r a d i e n t s a r e a v a i l a b l e f o r t h e o b j e c t i v e f u n c t i o n , and f i n i t e d i f f e r e n c e approxima- t i o n s a r e r e q u i r e d f o r t h e c o n s t r u c t i o n o f t h e d e r i v a t i v e i n f o r m a t i o n i n Eq. (3) . Therefore, i f n des ign v a r i a b l e s a r e used i n t h e o p t i m i z a t i o n , n a d d i t i o n a l aero- e l a s t i c analyses a r e r e q u i r e d t o compute t h e g r a d i e n t , and an a d d i t i o n a l n(n+1) /2 f o r t h e c a l c u l a t i o n o f t h e Hessian, making t h e c o s t o f b u i l d i n g t h e T a y l o r s e r i e s approx- i m a t i o n t o t h e o b j e c t i v e f u n c t i o n ext remely high. For t h i s reason an a l t e r n a t i v e approx imat ion technique, i n t roduced by Vanderplaats [22,23], was used i n t h i s study.
T h i s t h e Hess whatever expanded
I n which
a l t e r n a t i v e technique i s based on t h e idea of approx imat ing t h e g r a d i e n t and an i n Eq. ( 3 ) , n o t by using smal l f i n i t e d i f f e r e n c e s teps, b u t by us ing des ign i n f o r m a t i o n i s a v a i l a b l e a t t h e t ime. Eq. (3) can be r e w r i t t e n , i n form, as ( r e f s . 22,23).
+ H 6D 6D + H136D16D3 +...+ Hln6D16Dn 12 1 2
+ H 6D 6D +...+ Hn-l,n 6D n-l 60 23 2 3
AF = F(E) - F(S0), = F - Fo
(5 )
and
VFi = VFi(do) ; Hij = Hij(do) ( 7 )
Assu e t h a t a b a s e l i n e des ign E has been analyzed t o g i v e Fo, and t h a t o t h e r designs E,, 1, ,... ,z)k have been p r e v i o u g l y analyzed, t o p r o v i d e F1,F2 ,... Fk. L e t
I (8) 6di = di - 8, i = 1,2,...,k
and
AFi = Fi - Fo i = 1,2,...,k (9)

I f k designs a r e a v a i l a b l e , Eq. (5 ) can be w r i t t e n k times. The unknowns o f t h e r e s u l t i n g l i n e a r system a r e VF VF ,..., V , and H H ,..., H , I f t h e designs a r e l i n e a r l y independent, the sys t& Q gquat ioks (5 ) w i t ; p k i d e a!!" t h e c o e f f i c i e n t s r e q u i r e d f o r t h e q u a d r a t i c polynomial approximat ion Eq. (3). I f a l l t h e designs are very c l o s e l y spaced, t h e s o l u t i o n t o the g r a d i e n t and Hessian m a t r i x a t -b . (3) w i l l t h n represent a t runcated Tay lo r s e r i e s expansion o f F, v a l i d i R a neigh-
be a quadratyc po lynomia l approximat ion, de f ined over a w ider r e g i o n o f the design space.
Equation
borhood o f 8 . I f t h e designs a r e d ispersed i n t h e des ign space, Eq. (3) w i l l s imply
An impor tan t c h a r a c t e r i s t i c o f t h i s technique i s t h a t the system o f equat ions (5) can be w r i t t e n w i t h l e s s than Q equations. I f a t l e a s t n + 1 designs a r e a v a i l a b l e , the s o l u t i o n o f the system w i l l p rov ide a l i n e a r p o r t i o n o f the .approx imat ion , Eq. (3). An approximate o p t i m i z a t i o n can be conducted, based on t h i s l i n e a r approxima- t i o n . The r e s u l t i n g optimum i s then analyzed p r e c i s e l y and prov ides an a d d i t i o n a l design: a system o f n + 2 equat ions ( 5 ) can then be w r i t t e n . I t s s o l u t i o n w i l l p ro- v i d e a new approximat ion, Eq. ( 5 ) , w i t h a l l t h e l i n e a r terms p l u s one p a i r o f quadra- t i c terms o f t h e symnetr ic Hessian m a t r i x . The process can then be repeated, w i t h each new approximate optimum p r o v i d i n g an a d d i t i o n a l des ign p o i n t t o increase the number o f terms i n t h e q u a d r a t i c approximat ion t o o b j e c t i v e f u n c t i o n and behavior c o n s t r a i n t s .
One i t e r a t i o n o f t h e o p t steps:
1. C a l c u l a t i o n o f t h e b lade shaDes:
mum design process thus c o n s i s t s o f t h e f o l l o w i n g s
p r o p e r t i e s , i n c l u d i n g n a t u r a l f requencies and mode
X
. - 2. A e r o e l a s t i c a n a l y s i s i n hover; 3. A e r o e l a s t i c a n a l y s i s i n forward f l i g h t , i n c l u d i n g c a l c u l a t i o n o f hub loads; 4. C a l c u l a t i o n o f o b j e c t i v e f u n c t i o n and behavior c o n s t r a i n t s ; 5.
6.
C a l c u l a t i o n o f a new approx imat ion ( l i n e a r o r incomplete q u a d r a t i c ) t o o b j e c t i v e f u n c t i o n and behavior c o n s t r a i n t s ; S o l u t i o n o f t h e approximate cons t ra ined o p t i m i z a t i o n problem, us ing the f e a s i b l e d i r e c t i o n code CONMIN ( r e f s . 24,25) t o o b t a i n a new, improved b lade design.
The process i s te rmina ted when a f e a s i b l e , optimum design has been reached, or arbitrarily, when t h e improvement i n the design i s considered "adequate".
The f i r s t n + 1 i t e r a t i o n s o f the procedure a r e n o t t r u e o p t i m i z a t i o n i t e r a t i o n s because s teps 5 and 6 above a r e n o t performed. I n f a c t , these i n i t i a l i t e r a t i o n s a r e used t o generate a s u f f i c i e n t number o f designs t o b u i l d a t l e a s t an i n i t i a l l i n e a r approx imat ion t o o b j e c t i v e f u n c t i o n and behavior c o n s t r a i n t s .
Side const ra in ts a r e p laced on the design v a r i a b l e s t o p revent them from reaching i m p r a c t i c a l va lues which v i o l a t e p r a c t i c a l , p h y s i c a l c o n s t r a i n t s . Thus a l l the th icknesses and d is tances a r e assumed t o be nonnegative numbers.
Three d i f f e r e n t types o f behavior constra ints a r e p laced on the design.
1. frequency p l a c m e n t constra ints . The fundamental f requencies i n f l a p , l a g and t o r s i o n a r e r e q u i r e d t o f a l l between preassigned upper and lower bounds. i f w i s one o f t h e t h r e e f requencies, and w and w a r e the preassigned lower and upper bound r e s p e c t i v e l y , t h e frequency piacemen! c o n s t r a i n t i s expressed mathemati- c a l l y i n t h e form:
1 5 1
2 g (d ) = 1 - % s o
wL
Equat ions (10) and (ll), w r i t t e n f o r each o f t h e t h r e e fundamental f requencles o f t h e b lade, p r o v i d e a t o t a l o f s i x behav io r c o n s t r a i n t s . Furthermore, t h e frequen- c i e s a r e a l s o cons t ra ined so as t o be s u f f i c i e n t l y removed f rom t h e n / r e v f r e - quencies.
2. Aeroe las t f c s t a b i l i t y cons t ra in t s . The b lade I s r e q u l r e d t o be a e r o e l a s t l c a l l y s t a b l e i n hover. No c o n s t r a i n t s a r e p laced on t h e s t a b i l i t y i n forward f l i g h t because a l l t h e b lade c o n f l g u r a t i o n s considered i n t h i s o p t i m l t a t l o n s tudy a re s o f t - i n - p l a n e b l a d e c o n f l g u r a t i o n s , and t h e e f f e c t o f f o rward f l i g h t I s u s u a l l y s t a b i l i z i n g f o r t h i s t ype o f b lades ( r e f . 21). The a e r o e l a s t l c s t a b l l l t y c o n s t r a i n t s a r e expressed mathemat i ca l l y i n t h e form:
k = 1,2,...,m
I f m modes a r e used t o pe r fo rm t h e modal c o o r d i n a t e t r a n s f o r m a t i o n i n t h e so lu- t i o n o f t h e equat ions o f mot ion, t h e r e a r e m c o n s t r a i n t equat ions l i k e Eq. (12), where t h e q u a n t i f y 5 i s t h e r e a l p a r t o f t h e hover s t a b i l i t y e igenvalue f o r the k - t h mode. As i n d i c k t e d i n t h e r e s u l t s sec t i on , i n some cases more s t r i n g e n t a e r o e l a s t i c c o n s t r a i n t s were a l s o imposed.
3. Auto ro ta t ion cons t ra in t s . The a u t o r o t a t i o n c o n s t r a i n t expresses t h e requirement t h a t p o s s i b l e mass r e d i s t r i b u t i o n s produced i n t h e o p t i m i z a t i o n process do n o t degrade t h e a u t o r o t a t i o n p r o p e r t i e s o f t h e r o t o r . The most convenient au to ro ta - t i o n c o n s t r a i n t I s one which r e s t r i c t s v a r i a t i o n s o f t h e p o l a r mass moment o f i n e r t i a o f t h e r o t o r ( r e f . 26, pp. 346-364). Therefore, t h e a u t o r o t a t i o n c o n s t r a i n t i s expressed mathemat i ca l l y i n t h e form:
The c o n s t r a i n t equa t ion (13) r e q u i r e s t h a t t h e mass p o l a r moment o f i n e r t i a J o f t h e r o t o r m a i n t a i n , d u r i n g t h e o p t i m i z a t i o n , a t l e a s t 90% o f i t s i n i t i a l value Joe
Therefore, a t o t a l o f t h i r t e e n behavior c o n s t r a i n t equat ions a r e p laced on the design va r i ab 1 es .
4. RESULTS
The b a s i c b lade c o n f i g u r a t i o n considered i n t h i s s tudy i s a s o f t - i n - p l a n e hinge- l e s s blade, shown i n F i g u r e 1, which i s p a r t o f a f o u r b laded r o t o r . The uncoupled fundamental l ag , f l a p , and t o r s i o n f requencies, f o r zero t i p sweep, a r e 0.732/rev, 1.125/rev, and 3.17/rev r e s p e c t i v e l y . The Lock number i s y = 5.5, t h e t h r u s t coef - f i c i e n t C = 0.005, and t h e r o t o r s o l i d i t y o = 0.07. a t i o n s , t h e outermost 10% o f t h e b lade i s swept. The b lade precone angle B
For t h e swept t i p c o n f i g u r - t h e
P ’
1 5 2

r o o t o f f s e t e , t h e o f f s e t x between t h e e l a s t i c a x i s and t h e aerodynamic center , and t h e o f f s e t x between t h 8 e l a s t i c a x i s and t h e cross s e c t i o n a l cen te r o f g r a v i t y a r e a l l s e t t o zkro, un less s p e c i f i e d otherwise. The modal coo rd ina te t rans fo rma t ion i s based on t h e s i x lowest frequency, r o t a t i n g , coupled modes of t h e blade. I n a l l cases t h e s i x modes were one t o r s i o n , two lag , and t h r e e f l a p modes. The blades were modeled u s i n g 5 f i n i t e elements, w i t h nodes a t O X , 22.5%, 45%, 67.53, 90% and 100% o f t h e span. Se lec ted r e s u l t s a r e presented here. Numerous a d d i t i o n a l r e s u l t s can be found i n r e f s . (15)-(18).
Two types o f c ross s e c t i o n s a r e considered i n t h i s study, namely a s i n g l e c e l l , r e c t a n g u l a r c ross sec t i on , and a double c e l l c ross sect ion. Both cross sec t i ons a re shown i n F i g u r e 2. Up t o f i v e , and up t o n i n e independent des ign parameters can be s p e c i f i e d f o r t h e s i n g l e c e l l and t h e double c e l l c ross s e c t i o n r e s p e c t i v e l y ( re f . 16). I n t h i s s tudy t h e cross s e c t i o n a l des ign parameters a r e l i n k e d i n such a way as t o reduce t h e number o f independent des ign parameters t o two, f o r bo th t h e s i n g l e and t h e double c e l l c ross sect ions. The f i r s t independent des ign v a r i a b l e i s t he th i ckness t o f a l l t h e elements o f which b o t h cross s e c t i o n s a r e composed. The second indebendent des ign v a r i a b l e i s t h e chordwise w i d t h x f o r b o t h cross sect ions. I n t h e s i n g l e c e l l c ross s e c t i o n t h e r a t i o between t h e w i d t 6 x and t h e h e i g h t hS i s k e p t constant , w i t h x /h = 4.5. I n t h e double c e l l c ross seceion t h e i n t e r n a l w a l l i s p laced ha l fway b e t i e e f i t h e l e a d i n g edge and t h e r e a r w a l l , so t h a t x = x /2. The o u t s i d e w a l l o f t h e double c e l l c ross s e c t i o n has t h e shape of a NACA Ob12 a ? r f o i l . The p r o p e r t i e s o f b o t h c ross s e c t i o n s a r e presented i n r e f . (16).
As a p r e l i m i n a r y t o t h e o p t i m i z a t peak-to-peak va lues o f t h e 4 / r e v v e r t
on s tud ies , t h e e f f e c t o f t i p sweep on the c a l hub shears was i n v e s t i g a t e d .
F i g u r e 3 shows t h e peak-to-peak va lue VZpk o f t h e v e r t i c a l hub shears as a func- t i o n o f t h e t i p sweep ang le A , f o r f o u r d i f f e r e n t va lues o f t h e advance r a t i o p, f o r t h e s o f t - i n - p l a n e b lade c o n f i g u r a t i o n . F i g u r e 3 shows t h a t t i p sweep may o r may n o t be b e n e f i c i a l f o r t h e s o f t - i n - p l a n e c o n f i g u r a t i o n , depending on t h e advance r a t i o and t h e t i p sweep angle. A t an advance r a t i o p = 0.3 t h e o s c i l l a t o r y loads r a p i d l y i nc rease w i t h t i p sweep. A t = 0.4, instead, t i p sweep has a b e n e f i c i a l e f f e c t . Based on t h e r e s u l t s o f t h i s p r e l i m i n a r y i n v e s t i g a t i o n , t h e advance r a t i o a t which t h e 4 / r e v v e r t i c a l hub shears a r e min imized was s e t a t p = 0.4.
INBOARD SEGMENT
PITCH CHANGE BEARING \ /ROTOR HUB
SWEPT
'PITCH LINK
-e--= I I
Figure 1: Swept t i p h inge less r o t o r Flgure 2: S i n g l e and double c e l l b lade model. cross sect ions.
153
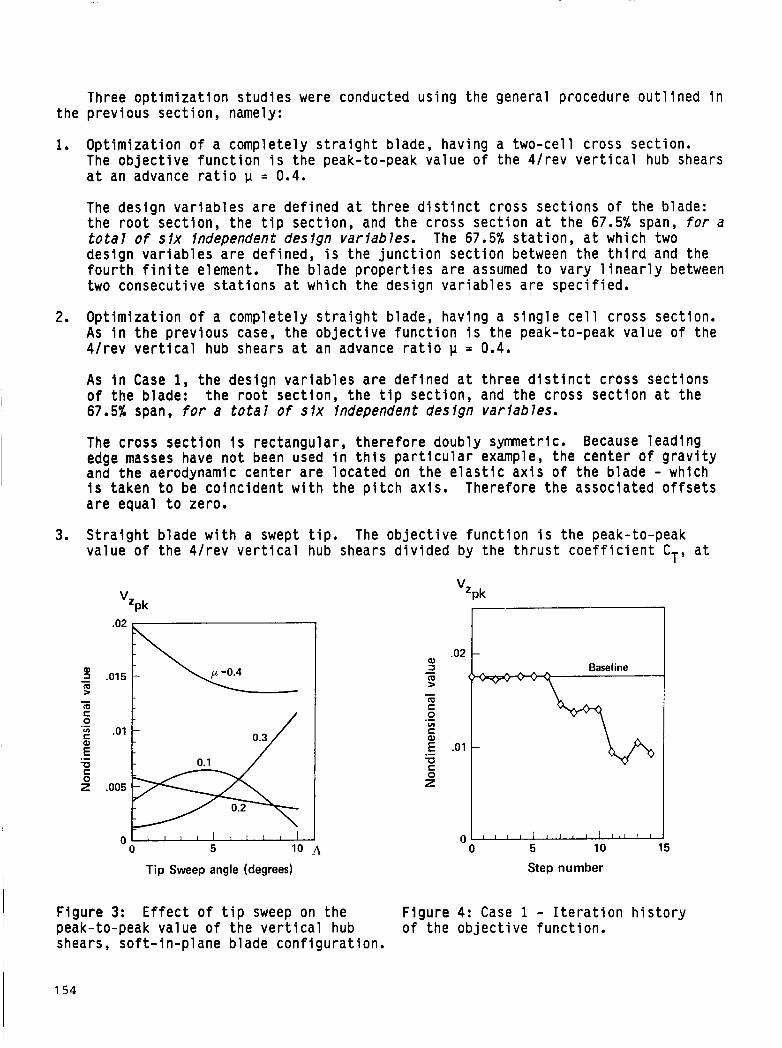
Three o p t i m i z a t i o n s t u d i e s were conducted us ing t h e general procedure o u t l i n e d i n t h e p rev ious s e c t i o n , namely:
1.
2.
3.
O p t i m i z a t i o n o f a complete ly s t r a i g h t b lade, hav ing a t w o - c e l l c ross sect ion. The o b j e c t i v e f u n c t i o n i s t h e peak-to-peak va lue o f t h e 4 / r e v v e r t i c a l hub shears a t an advance r a t i o p = 0.4.
The des ign v a r i a b l e s a r e d e f i n e d a t t h r e e d i s t i n c t cross s e c t i o n s o f t h e blade: t h e r o o t sec t i on , t h e t i p sec t i on , and t h e cross s e c t i o n a t t h e 67.5% span, for a t o t a l o f s i x independent design var iab les . The 67.5% s t a t i o n , a t which two des ign v a r i a b l e s a r e de f i ned , i s t h e j u n c t i o n s e c t i o n between t h e t h i r d and t h e f o u r t h f i n i t e element. The b lade p r o p e r t i e s a r e assumed t o v a r y l i n e a r l y between two consecut ive s t a t i o n s a t which t h e des ign v a r i a b l e s a r e s p e c i f i e d .
O p t i m i z a t i o n o f a complete ly s t r a i g h t b lade, hav ing a s i n g l e c e l l c ross sect ion. As i n t h e p rev ious case, t h e o b j e c t i v e f u n c t i o n i s t h e peak-to-peak va lue o f t he 4 / r e v v e r t i c a l hub shears a t an advance r a t i o p = 0.4.
As i n Case 1, t h e des ign v a r i a b l e s a r e d e f i n e d a t t h r e e d i s t i n c t cross sec t i ons o f t h e blade: t h e r o o t sec t i on , t h e t i p sec t i on , and t h e c ross s e c t i o n a t t h e 67.5% span, for a t o t a l o f s i x independent design var iab les .
The c ross s e c t i o n i s rec tangu la r , t h e r e f o r e doubly symnetr ic. Because l e a d i n g edge masses have n o t been used i n t h i s p a r t i c u l a r example, t h e c e n t e r o f g r a v i t y and t h e aerodynamic c e n t e r a r e l o c a t e d on t h e e l a s t i c a x i s o f t h e b lade - which i s taken t o be c o i n c i d e n t w i t h t h e p i t c h ax i s . Therefore t h e assoc ia ted o f f s e t s a r e equal t o zero.
S t r a i g h t b lade w i t h a swept t i p . va lue o f t h e 4 / r e v v e r t i c a l hub shears d i v i d e d by t h e t h r u s t c o e f f i c i e n t CT, a t
The o b j e c t i v e f u n c t i o n i s t h e peak-to-peak
"Zpk
- m C 0
C a
-a C 0 z
.- v)
E .- .01
.005
n
"Zpk
.02 Q)
m 5
m C 0
C Q)
m E 0 z
a - - .- v)
E .01 .-
n " 0 5 10 A
Tip Sweep angle (degrees)
1 , 1 I I I I l I I I I I I
5 10 15
Step number
F i g u r e 3: E f f e c t o f t i p sweep on t h e F i g u r e 4: Case 1 - I t e r a t i o n h i s t o r y peak-to-peak va lue o f t h e v e r t i c a l hub o f t h e o b j e c t i v e f u n c t i o n . shears, s o f t - i n - p l a n e b lade c o n f i g u r a t i o n .
154
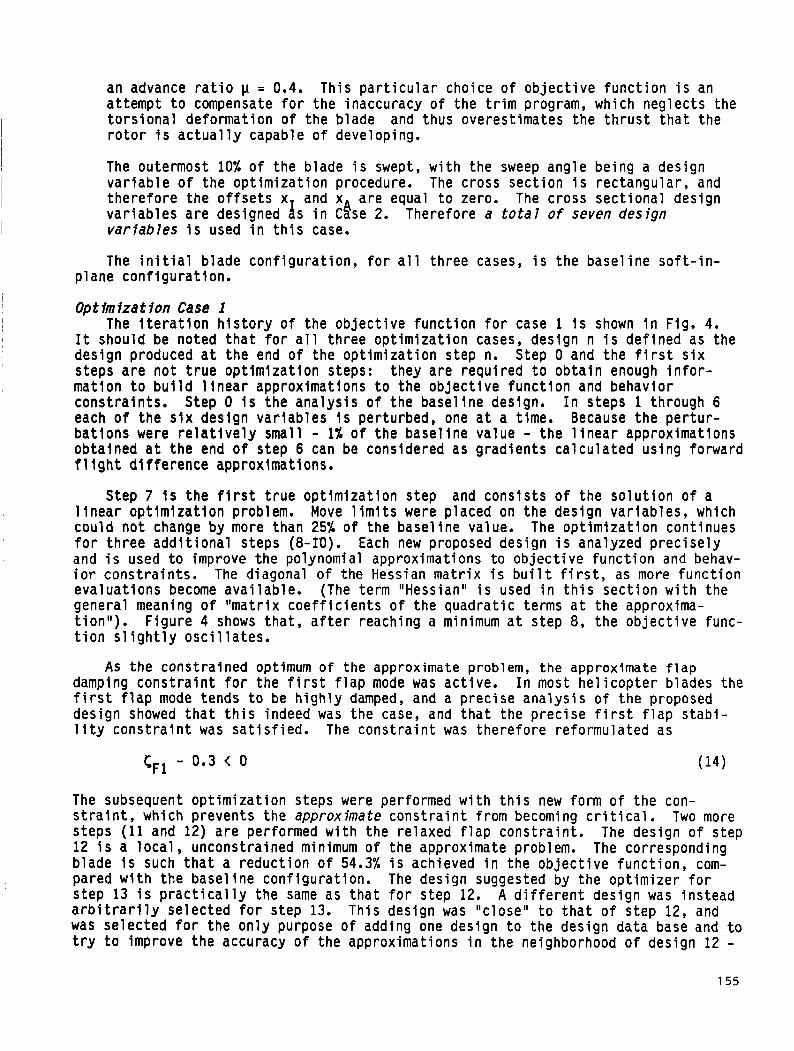
an advance r a t i o p = 0.4. a t tempt t o compensate f o r the inaccuracy o f the t r i m program, which neg lec ts the t o r s i o n a l deformat ion o f t h e b lade and thus overest imates t h e t h r u s t t h a t the r o t o r i s a c t u a l l y capable o f developing.
Th is p a r t i c u l a r choice o f o b j e c t i v e f u n c t i o n i s an
The outermost 10% o f the b lade i s swept, w i t h the sweep angle be ing a design v a r i a b l e o f t h e o p t i m i z a t i o n procedure. The cross s e c t i o n i s rec tangu lar , and t h e r e f o r e t h e o f f s e t s x and x a r e equal t o zero. The cross s e c t i o n a l design v a r i a b l e s a r e designed 4s i n C h e 2. Therefore a t o t a l o f seven design var iab les i s used i n t h i s case.
~ The i n i t i a l b lade c o n f i g u r a t i o n , f o r a l l t h r e e cases, i s t h e b a s e l i n e s o f t - i n - p lane c o n f i g u r a t i o n .
Optimization Case 1
design produced a t t h e end o f the o p t i m i z a t i o n s tep n. Step 0 and t h e f i r s t s i x steps a r e n o t t r u e o p t i m i z a t i o n steps: mat ion t o b u i l d l i n e a r approximat ions t o the o b j e c t i v e f u n c t i o n and behavior c o n s t r a i n t s . Step 0 i s the a n a l y s i s o f the base l ine design. I n s teps 1 through 6 each o f t h e s i x des ign v a r i a b l e s i s per turbed, one a t a time. Because t h e p e r t u r - b a t i o n s were r e l a t i v e l y small - 1% o f the b a s e l i n e va lue - t h e l i n e a r approxlmat ions ob ta ined a t t h e end o f s tep 6 can be considered as g r a d i e n t s c a l c u l a t e d us ing forward f l i g h t d i f f e r e n c e approximat ions.
I The i t e r a t i o n h i s t o r y o f the o b j e c t i v e f u n c t i o n f o r case 1 i s shown i n Fig. 4. I I t should be noted t h a t f o r a l l t h r e e o p t i m i z a t i o n cases, des ign n i s d e f i n e d as the
they a r e r e q u i r e d t o o b t a i n enough i n f o r -
Step 7 i s t h e f i r s t t r u e o p t i m i z a t i o n s tep and c o n s i s t s o f t h e s o l u t i o n o f a l i n e a r o p t i m i z a t i o n problem. Move l i m i t s were p laced on t h e des ign v a r i a b l e s , which cou ld n o t change by more than 25% o f the b a s e l i n e value. The o p t i m i z a t i o n cont inues f o r t h r e e a d d i t i o n a l s teps (8-10). Each new proposed des ign i s analyzed p r e c i s e l y and i s used t o improve t h e polynomial approximat ions t o o b j e c t i v e f u n c t i o n and behav- i o r c o n s t r a i n t s . The diagonal o f the Hessian m a t r i x i s b u i l t f i r s t , as more f u n c t i o n e v a l u a t i o n s become a v a i l a b l e . (The term ItHessian" i s used i n t h i s s e c t i o n w i t h the general meaning o f " m a t r i x c o e f f i c i e n t s o f the quadra t ic terms a t t h e approxima- t i o n " ) . F i g u r e 4 shows t h a t , a f t e r reaching a minimum a t s tep 8, t h e o b j e c t i v e func- t i o n s l i g h t l y o s c i l l a t e s .
damping c o n s t r a i n t f o r t h e f i r s t f l a p mode was a c t i v e . f i r s t f l a p mode tends t o be h i g h l y damped, and a p r e c i s e a n a l y s i s o f t h e proposed des ign showed t h a t t h i s indeed was t h e case, and t h a t t h e p r e c i s e f i r s t f l a p s t a b i - l i t y c o n s t r a i n t was s a t i s f i e d . The c o n s t r a i n t was t h e r e f o r e re fo rmula ted as
AS t h e cons t ra ined optimum o f the approximate problem, t h e approximate f l a p I n most h e l i c o p t e r blades the
t,, - 0.3 < 0 (14)
The subsequent o p t i m i z a t i o n steps were performed w i t h t h i s new form o f the con- s t r a i n t , which prevents t h e approximate c o n s t r a i n t f rom becoming c r i t i c a l . s teps (11 and 12) a r e performed w i t h the re laxed f l a p c o n s t r a i n t . 12 i s a l o c a l , unconst ra ined minimum o f the approximate problem. The corresponding b lade i s such t h a t a r e d u c t i o n o f 54.3% i s achieved i n t h e o b j e c t i v e f u n c t i o n , com- pared w i t h t h e b a s e l i n e conf igura t ion . The des ign suggested by the o p t i m i z e r f o r s t e p 13 i s p r a c t i c a l l y t h e same as t h a t f o r s tep 12. A d i f f e r e n t des ign was i n s t e a d a r b i t r a r i l y s e l e c t e d f o r s tep 13. Th is des ign was llclosel' t o t h a t o f s tep 12, and was s e l e c t e d f o r t h e o n l y purpose o f adding one des ign t o t h e des ign d a t a base and t o t r y t o improve t h e accuracy o f the approximat ions i n the neighborhood o f des ign 12 -
Two more The des ign o f step
155
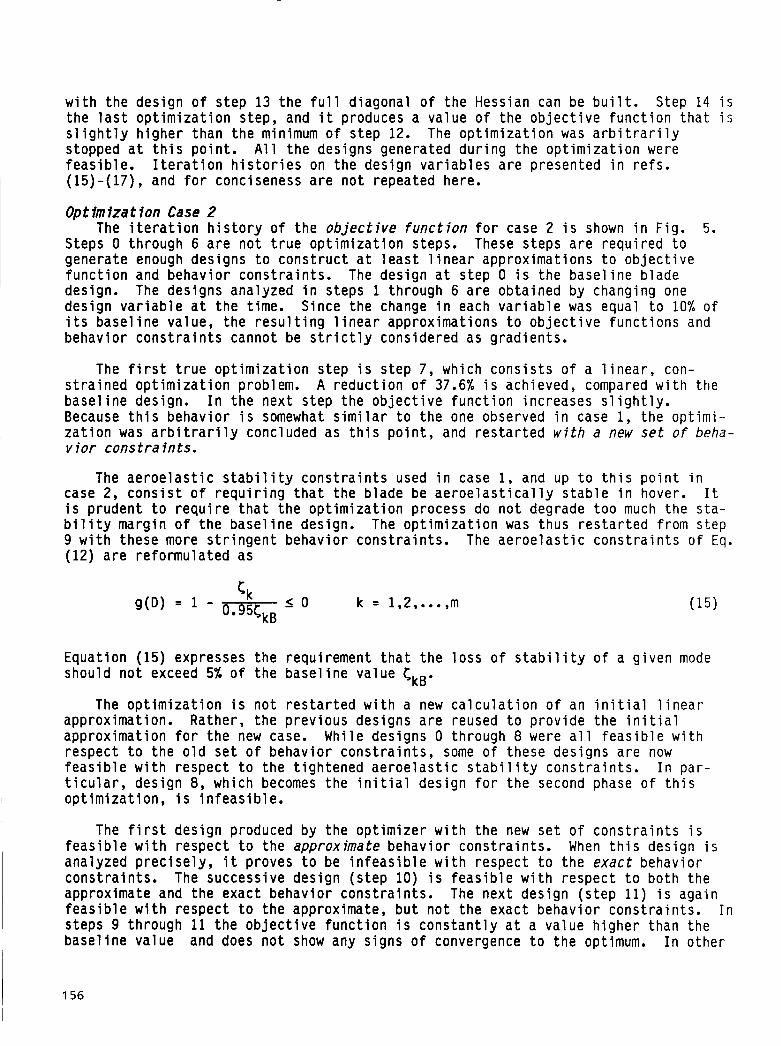
w i t h t h e des ign o f s tep 13 t h e f u l l d iagonal o f t h e Hessian can be b u i l t . Step 14 i s t h e l a s t o p t i m i z a t i o n s tep, and i t produces a va lue o f t h e o b j e c t i v e f u n c t i o n t h a t i s s l i g h t l y h i g h e r than t h e minimum o f s tep 12. The o p t i m i z a t i o n was a r b i t r a r i l y stopped a t t h i s p o i n t . A l l t h e designs generated d u r i n g t h e o p t i m i z a t i o n were f e a s i b l e . I t e r a t i o n h i s t o r i e s on t h e des ign v a r i a b l e s a r e presented i n r e f s . (15)-(17), and f o r conciseness a r e n o t repeated here.
Optimization Case 2
Steps 0 through 6 a r e n o t t r u e o p t i m i z a t i o n steps. These s teps a r e r e q u i r e d t o generate enough des igns t o c o n s t r u c t a t l e a s t l i n e a r approx imat ions t o o b j e c t i v e f u n c t i o n and behav io r c o n s t r a i n t s . The des ign a t s tep 0 i s t h e b a s e l i n e b lade design. The des igns analyzed i n s teps 1 through 6 a r e ob ta ined by changing one des ign v a r i a b l e a t t h e t ime. S ince t h e change i n each v a r i a b l e was equal t o 10% o f i t s b a s e l i n e va lue, t h e r e s u l t i n g l i n e a r approx imat ions t o o b j e c t i v e f u n c t i o n s and behav io r c o n s t r a i n t s cannot be s t r i c t l y cons idered as g rad ien ts .
The i t e r a t i o n h i s t o r y o f t h e objec t ive funct ion f o r case 2 i s shown i n Fig. 5.
The f i r s t t r u e o p t i m i z a t i o n s tep i s s tep 7, which c o n s i s t s o f a l i n e a r , con- s t r a i n e d o p t i m i z a t i o n problem. A r e d u c t i o n o f 37.6% i s achieved, compared w i t h the b a s e l i n e design. I n t h e nex t s tep t h e o b j e c t i v e f u n c t i o n increases s l i g h t l y . Because t h i s behav io r i s somewhat s i m i l a r t o t h e one observed i n case 1, the o p t i m i - z a t i o n was a r b i t r a r i l y concluded as t h i s p o i n t , and r e s t a r t e d w i t h a new set o f beha- v io r cons t r a i n t s .
The a e r o e l a s t i c s t a b i l i t y c o n s t r a i n t s used i n case 1, and up t o t h i s p o i n t i n case 2, c o n s i s t o f r e q u i r i n g t h a t t h e b lade be a e r o e l a s t i c a l l y s t a b l e i n hover. I t i s p ruden t t o r e q u i r e t h a t t h e o p t i m i z a t i o n process do n o t degrade t o o much the s t a - b i l i t y marg in o f t h e b a s e l i n e design. The o p t i m i z a t i o n was thus r e s t a r t e d f rom s t ep 9 w i t h these more s t r i n g e n t behav io r c o n s t r a i n t s . (12) a r e re fo rmu la ted as
The a e r o e l a s t i c c o n s t r a i n t s o f Eq.
g(D) = 1 - s o k = 1,2,...,m 0 955,,
Equat ion (15) expresses t h e requirement t h a t t h e l o s s o f s t a b i l i t y o f a g i v e n mode should n o t exceed 5% o f t h e b a s e l i n e va lue ckB.
The o p t i m i z a t i o n i s n o t r e s t a r t e d w i t h a new c a l c u l a t i o n o f an i n i t i a l l i n e a r approximat ion. Rather, t h e p rev ious des igns a r e reused t o p r o v i d e t h e i n i t i a l approx imat ion f o r t h e new case. Whi le des igns 0 through 8 were a l l f e a s i b l e w i t h respec t t o t h e o l d s e t o f behav io r c o n s t r a i n t s , some o f these des igns a r e now f e a s i b l e w i t h respec t t o t h e t i g h t e n e d a e r o e l a s t i c s t a b i l i t y c o n s t r a i n t s . I n pa r - t i c u l a r , des ign 8, which becomes t h e i n i t i a l des ign f o r t h e second phase o f t h i s o p t i m i z a t i o n , i s i n f e a s i b l e .
The f i r s t des ign produced by t h e o p t i m i z e r w i t h t h e new s e t o f c o n s t r a i n t s i s f e a s i b l e w i t h respec t t o t h e approximate behav io r c o n s t r a i n t s . When t h i s des ign i s analyzed p r e c i s e l y , i t proves t o be i n f e a s i b l e w i t h respec t t o t h e exact behavior c o n s t r a i n t s . The successive des ign ( s t e p 10) i s f e a s i b l e w i t h respec t t o bo th the approximate and t h e exac t behav io r c o n s t r a i n t s . The nex t des ign ( s t e p 11) i s again f e a s i b l e w i t h respec t t o t h e approximate, b u t n o t t h e exact behav io r c o n s t r a i n t s . I n steps 9 through 11 t h e o b j e c t i v e f u n c t i o n i s c o n s t a n t l y a t a va lue h i g h e r than the b a s e l i n e va lue and does n o t show any s igns o f convergence t o t h e optimum. I n o the r
156

words, t h e o p t i m i z e r does n o t seem t o be a b l e t o produce a f e a s i b l e des ign t h a t improves on the b a s e l i n e design, which s a t i s f i e s the new c o n s t r a i n t equat ions, Eq. (1510
The apparent ly e r r a t i c behavior o f the o b j e c t i v e f u n c t i o n r e q u i r e d a recon- s i d e r a t i o n o f t h e o p t i m i z a t i o n s t r a t e g y which, s t a r t i n g f rom s tep 14, was modi f ied, and t i g h t e r move l i m i t s were enforced, i n a s e l e c t i v e manner. T h i s m o d i f i e d approach f i n a l l y y i e l d s des ign 16 which represents a r e d u c t i o n i n peak-to-peak va lue o f the 4 / r e v v e r t i c a l hub shears t o 16.6% compared t o the b a s e l i n e value. Thus t h e imposi- t i o n o f a e r o e l a s t i c c o n s t r a i n t s reduces t h e ga ins i n the o b j e c t i v e f u n c t i o n by more than 50%.
Optimization Case 3
i s t h e peak-to-peak va lue o f t h e 4 / rev v e r t i c a l hub shears d i v i d e d by t h e t h r u s t c o e f f i c i e n t CT. The t i g h t e n e d a e r o e l a s t i c c o n s t r a i n t s o f Eq. (15) a r e enforced.
seven s teps a r e n o t t r u e o p t i m i z a t i o n steps. As i n cases 1 and 2, they p r o v i d e enough p r e c i s e va lues o f the o b j e c t i v e f u n c t i o n and behavior cons t ra in t s t o b u i l d a t l e a s t a l i n e a r approx imat ion o f o b j e c t i v e and c o n s t r a i n t s . I n t h e designs 1 through 7 each o f t h e seven des ign v a r i a b l e s i s per turbed, one a t a time. Design 7 i s the only swept b lade design. Designs 0 through 6 a r e s t r a i g h t b lade designs and a r e i d e n t i c a l t o t h e corresponding designs o f case 2. Thus these designs a r e n o t r e - analyzed t o d e r i v e t h e r e s u l t s o f F igure 3, and need no t be reca lcu la ted .
F igure 6 shows t h e i t e r a t i o n h l s t o r y o f the o b j e c t i v e f u n c t l o n f o r case 3 , which
Design 0 i s t h e b a s e l i n e s o f t - i n - p l a n e s t r a i g h t b lade c o n f i g u r a t i o n . The first
Thus t h e o p t i m i z a t i o n process o f case 3 begins w i t h o u t t h e need f o r any p r e c i s e analyses, i n t h e sense t h a t t h e e i g h t p r e c i s e analyses r e q u i r e d t o s t a r t t h e proce- dure were a l r e a d y a v a i l a b l e f rom prev ious p a r t s o f t h i s s tudy and c o u l d be d i r e c t l y r e u t i l i z e d . The a b i l i t y t o make use o f p r e v i o u s l y analyzed designs, even i f n o t very
',pk
0 5 10 15
Step number
F i g u r e 5: o f t h e o b j e c t i v e f u n c t i o n .
Case 2 - I t e r a t i o n h i s t o r y
Best design Baseline
0 0 5 10
Step number
F i g u r e 6: Case 3 - I t e r a t i o n h i s t o r y o f the o b j e c t i v e func t ion .
157
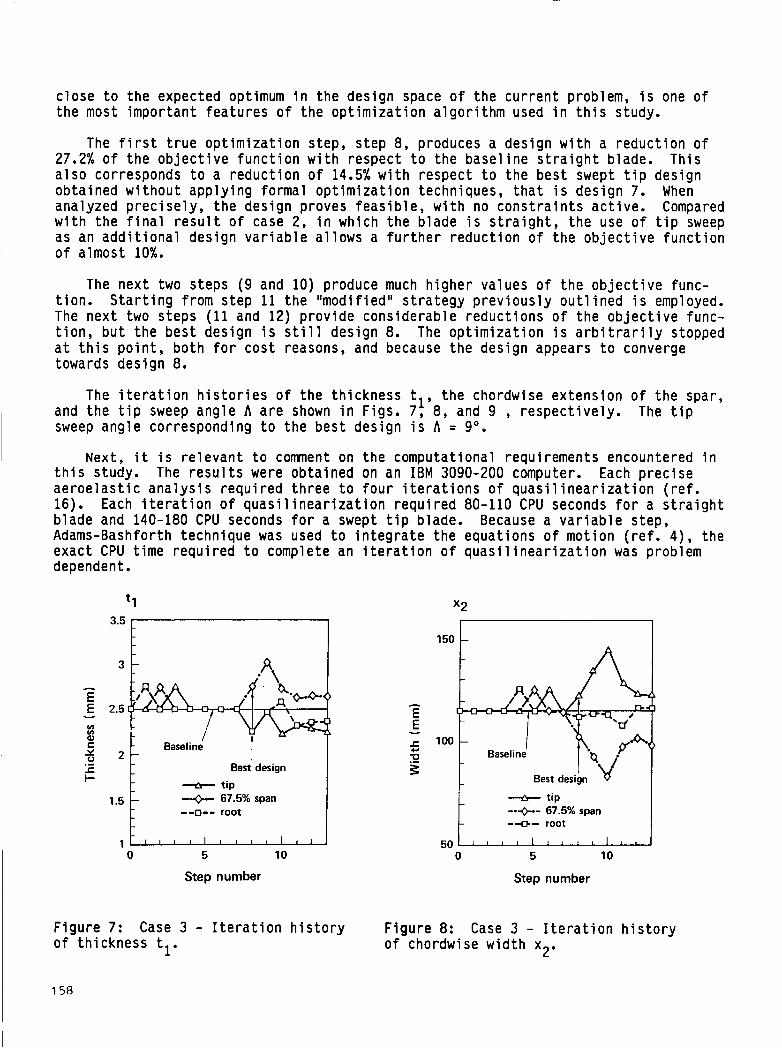
c l o s e t o t h e expected optimum i n t h e des ign space o f t h e c u r r e n t problem, i s one o f t h e most impor tan t f e a t u r e s o f t h e o p t i m i z a t i o n a l g o r i t h m used i n t h i s study.
The f i r s t t r u e o p t i m i z a t i o n step, s tep 8, produces a des ign w i t h a r e d u c t i o n o f 27.2% o f t h e o b j e c t i v e f u n c t i o n w i t h respec t t o t h e b a s e l i n e s t r a i g h t blade. T h i s a l s o corresponds t o a r e d u c t i o n o f 14.5% w i t h respec t t o t h e b e s t swept t i p des ign ob ta ined w i t h o u t a p p l y i n g formal o p t i m i z a t i o n techniques, t h a t i s des ign 7. When analyzed p r e c i s e l y , t h e des ign proves f e a s i b l e , w i t h no c o n s t r a i n t s a c t i v e . Compared w i t h t h e f i n a l r e s u l t o f case 2, i n which t h e b lade i s s t r a i g h t , t h e use o f t i p sweep as an a d d i t i o n a l des ign v a r i a b l e a l l o w s a f u r t h e r r e d u c t i o n o f t h e o b j e c t i v e f u n c t i o n o f a lmost 10%.
The n e x t two s teps (9 and 10) produce much h i g h e r va lues o f t h e o b j e c t i v e func- t i o n . S t a r t i n g f rom s tep 11 t h e "mod i f i ed " s t r a t e g y p r e v i o u s l y o u t l i n e d i s employed. The n e x t two s teps (11 and 12) p r o v i d e cons ide rab le r e d u c t i o n s o f t h e o b j e c t i v e func- t i o n , b u t t h e b e s t des ign i s s t i l l des ign 8. The o p t i m i z a t i o n i s a r b i t r a r i l y stopped a t t h i s p o i n t , b o t h f o r c o s t reasons, and because t h e des ign appears t o converge towards des ign 8.
The i t e r a t i o n h i s t o r i e s o f t h e th i ckness tl, t h e chordwise ex tens ion o f t h e spar, and t h e t i p sweep ang le A a r e shown i n Figs. 7, 8, and 9 , r e s p e c t i v e l y . The t i p sweep ang le corresponding t o t h e b e s t des ign i s A = 9'.
Next, i t is r e l e v a n t t o corrrnent on t h e computat ional requi rements encountered i n t h i s study. The r e s u l t s were ob ta ined on an I B M 3090-200 computer. Each p r e c i s e a e r o e l a s t i c a n a l y s i s r e q u i r e d t h r e e t o f o u r i t e r a t i o n s o f q u a s i l i n e a r i z a t i o n ( r e f . 16). Each i t e r a t i o n o f quasi 1 i n e a r i z a t i o n r e q u i r e d 80-110 CPU seconds f o r a s t r a i g h t b lade and 140-180 CPU seconds f o r a swept t i p blade. Because a v a r i a b l e step, Adams-Bashforth technique was used t o i n t e g r a t e t h e equat ions o f mo t ion ( r e f . 4) , t he exac t CPU t i m e r e q u i r e d t o complete an i t e r a t i o n o f q u a s i l i n e a r i z a t i o n was problem dependent.
E E
8 a
- VI
C
.-
.c I-
t 1 3.5
3
2.5
2
1.5 -+- 67.5% span --o-- root
1 0 5 10
Step number
F i g u r e 7: Case 3 - I t e r a t o f t h i ckness tl.
on h i s t o r y
x2
150
+ tip
-+- root
- -a+- 67.5% span
50 0 5 10
F i g u r e 8: o f chordw
Step number
Case 3 - I t e r a t i o n h i s t o r y se w i d t h x2.
158
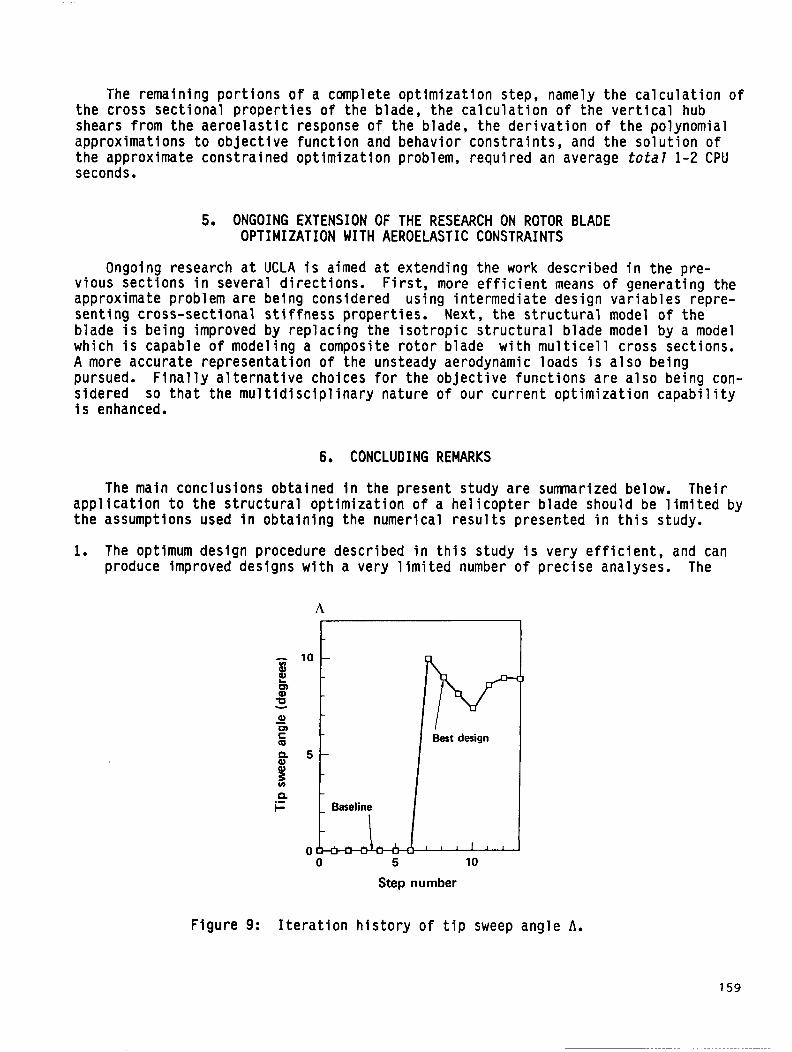
The remaining p o r t i o n s o f a complete o p t i m i z a t i o n step, namely t h e c a l c u l a t i o n of t h e cross s e c t i o n a l p r o p e r t i e s o f the blade, the c a l c u l a t i o n o f t h e v e r t i c a l hub shears f rom t h e a e r o e l a s t i c response o f the blade, t h e d e r i v a t i o n o f the polynomial approx imat ions t o o b j e c t i v e f u n c t i o n and behavior c o n s t r a i n t s , and t h e s o l u t i o n o f the approximate cons t ra ined o p t i m i z a t i o n problem, r e q u i r e d an average t o t a l 1-2 CPU seconds.
5. ONGOING EXTENSION OF THE RESEARCH ON ROTOR BLADE OPTIMIZATION WITH AEROELASTIC CONSTRAINTS
Ongoing research a t UCLA i s aimed a t extending t h e work descr ibed i n t h e pre- v ious s e c t i o n s i n severa l d i r e c t i o n s . F i r s t , more e f f i c i e n t means o f genera t ing t h e approximate problem a r e be ing considered us ing in te rmed ia te des ign v a r i a b l e s repre- s e n t i n g c ross-sec t iona l s t i f f n e s s proper t ies . Next, t h e s t r u c t u r a l model o f t h e b lade i s be ing improved by r e p l a c i n g the i s o t r o p i c s t r u c t u r a l b lade model by a model which i s capable o f model ing a composite r o t o r b lade w i t h m u l t i c e l l c ross sect ions. A more accura te r e p r e s e n t a t i o n o f the unsteady aerodynamic loads i s a l s o be ing pursued. s idered so t h a t t h e m u l t i d i s c i p l i n a r y na ture o f our c u r r e n t o p t i m i z a t i o n c a p a b i l i t y i s enhanced.
F i n a l l y a l t e r n a t i v e choices f o r t h e o b j e c t i v e f u n c t i o n s a r e a l s o being con-
6. CONCLUDING REMARKS
The main conclus ions obta ined i n the present s tudy a r e summarized below. T h e i r a p p l i c a t i o n t o t h e s t r u c t u r a l o p t i m i z a t i o n o f a h e l i c o p t e r b lade should be l i m i t e d by t h e assumptions used i n o b t a i n i n g the numerical r e s u l t s presented i n t h i s study.
1. The optimum design procedure descr ibed i n t h i s study i s very e f f i c i e n t , and can produce improved designs w i t h a very l i m i t e d number o f p r e c i s e analyses. The
A
c
0 5 10
Step number
F i g u r e 9: I t e r a t i o n h i s t o r y o f t i p sweep
1
angle A.
159
method o f c o n s t r u c t i n g t h e approximate problem i s such t h a t p r e v i o u s l y conducted a e r o e l a s t i c analyses can be reused i n a new o p t i m i z a t i o n problem. For example, i f an o p t i m i z a t i o n s tudy i s preceded by a pa ramet r i c s tudy i n which t h e e f f e c t o f v a r i o u s combinat ions o f b lade des ign parameters i s examined, a l l t h e a e r o e l a s t i c analyses performed f o r t h e pa ramet r i c s tudy can be r e u t i l i z e d i n t h e o p t i m i z a t i o n study. s e r i e s expansions.
T h i s i s n o t p o s s i b l e when t h e approximate problem i s b u i l t f rom Tay lo r
2. The r e s u l t s o f t h e o p t i m i z a t i o n a r e q u i t e s e n s i t i v e t o t h e a e r o e l a s t i c s t a b i l i t y margins r e q u i r e d o f t h e blade. I n t h e o p t i m i z a t i o n o f case 2 , changing t h e aero- l e a s t i c s t a b i l i t y c o n s t r a i n t s f rom s imp ly r e q u i r i n g t h a t t h e b lade be s t a b l e i n hover, t o r e q u i r i n g t h a t t h e s t a b i l i t y margins be ma in ta ined d u r i n g the course o f t h e o p t i m i z a t i o n , reduced t h e ga ins i n n / r e v v i b r a t i o n l e v e l s by more than 50%.
3. The i n t r o d u c t i o n o f t i p sweep can reduce t h e n / r e v v e r t i c a l hub shears beyond the l e v e l t h a t can be ob ta ined by j u s t m o d i f y i n g t h e mass and s t l f f n e s s d l s t r l b u t l o n s o f t h e blade.
ACKNOWLEDGMENT
T h i s research was funded p r i m a r i l y by NASA g r a n t NAG 2-226, NASA Ames Research Center, M o f f e t t F i e l d , CA. Grant NAG 1-833, by NASA Langley Research Center, i s also g r a t e f u l l y acknowledged.
Funding o f t h e c o n t i n u a t i o n o f t h i s research under NASA
REFERENCES
1. Shantakumaran, P., "Optimum Design o f Rotor Blades f o r V i b r a t i o n Reduction i n Forward F l i g h t , " Ph.D. D i s s e r t a t i o n , U n i v e r s i t y o f C a l i f o r n i a , Los Angeles, CA, 1984.
2. Friedmann, P.P., " A p p l i c a t i o n o f Modern S t r u c t u r a l O p t i m i z a t i o n t o V i b r a t i o n
3. Miura, H., " A p p l i c a t i o n o f Numerical O p t i m i z a t i o n Methods t o H e l i c o p t e r Design
Reduct ion i n Ro to rc ra f t , I l Ver t f ca , Vol. 9, No. 4, 1985, pp. 363-373.
Problems - A Survey," Ver t f ca , Vol. 9, No. 2, 1985, pp. 141-154.
4. C e l i , R., and P.P. Friedmann, " A e r o e l a s t i c Model ing o f Swept T i p Rotor Blades Using F i n i t e Elements,Il Journal o f the Anerican He l i cop te r Soc le ty , A p r i l 1988, pp. 43-52.
5. Friedmann, P.P., and P. Shanthakumaran, I IAe roe las t i c T a i l o r i n g o f Rotor Blades f o r V i b r a t i o n Reduct ion i n Forward F l i g h t , " A I A A Paper No. 83-0914, Proceedings o f t h e AIAAIASMEIASCEIAHS 24th S t r u c t u r e s , S t r u c t u r a l Dynamics and M a t e r i a l s Conference, Lake Tahoe, NV, Vol. 2, May 1983, pp. 344-359.
6. Friedmann, P.P., and P. Shanthakumaran, IIOptimum Design o f Rotor Blades f o r V i b r a t i o n Reduct ion i n Forward F l i g h t , " Journal o f the h e r l c a n He l icop ter Soc ie ty , Vol. 29, No. 4, October 1984, pp. 70-80.
7. Peters , D.A., M.P. Rossow, A. Korn, and T. KO, "Design o f H e l i c o p t e r Rotor Blades f o r Optimum Dynamic C h a r a c t e r i s t i c s , " Cmputers and Ma thmat i cs w i t h Appl ica- t i o n s , Vol. 12A, No. 1, 1986, pp. 85-109.
160
8.
9.
10.
11.
12.
13.
14.
15.
16.
17.
18.
19.
20.
Davis, M.W., and Wel ler , W.H., " A p p l i c a t i o n o f Design O p t i m i z a t i o n Techniques t o Ro to r Dynamics Problems," Proceedings o f t h e 42nd Annual Forum o f t h e American H e l i c o p t e r Soc ie ty , Washington, DC, June 1986, pp. 27-44.
Chattopadhyay, A., and J. Walsh, "Minimum Weight Design o f Rectangular and Tapered H e l i c o p t e r Ro to r Blades w i t h Frequency Cons t ra in t s , " Proceedings o f the Second I n t e r n a t i o n a l Conference on R o t o r c r a f t Bas ic Research, Col lege Park, MD, February 1988.
P r i t c h a r d , J.L., and H.M. Adelman, "Optimal Placement o f Tuning Masses f o r V i b r a t i o n Reduct ion i n H e l i c o p t e r Rotor Blades," Proceedings o f t h e Second I n t e r n a t i o n a l Conference on R o t o r c r a f t Bas ic Research, Co l l ege Park, MD, February 1988.
We l le r , W.H., and M. Davis, "Exper imental Demonstrat ion o f H e l i c o p t e r Blade Designs Opt imized f o r Minimum V ib ra t i on , " Proceedings 44 th Annual Forum o f t he American H e l i c o p t e r Society , Washington, DC, June 1988.
Schmit, L.A., Jr., and H. Miura, H., I 'Approximation Concepts f o r E f f i c i e n t S t r u c t u r a l Synthes is , " NASA CR-2552, 1976.
Schmit, L.A., Jr., I I S t r u c t u r a l Synthes is - I t s Genesis and Development,Il A I A A Journal , Vol. 18, No. 10, 1981, pp. 1249-1263.
Lim, J., and I. Chopra, " A e r o e l a s t i c O p t i m i z a t i o n o f a H e l i c o p t e r Rotor," Proceedings o f t h e 44 th Annual Forum o f t h e American H e l i c o p t e r Society," Washington, DC, June 16-19, 1988, pp. 545-558.
w i t h S t r a i g h t and Swept Tips," Paper No. 3-1, Proceedings o f T h i r t e e n t h European R o t o r c r a f t Forum," A r les , France, September 8-11, 1987.
C e l i , R., and P.P. Friedmann, " E f f i c i e n t S t r u c t u r a l O p t i m i z a t i o n o f Rotor Blades
C e l i , R., " A e r o e l a s t i c i t y and S t r u c t u r a l O p t i m i z a t i o n o f H e l i c o p t e r Rotor Blades w i t h Swept T ips, " Ph.D. D i s s e r t a t i o n , Mechanical, Aerospace and Nuclear Engineer ing Department, U n i v e r s i t y o f C a l i f o r n i a , Los Angeles, CA, September 1987.
C e l i , R., and P.P. Friedmann, " S t r u c t u r a l O p t i m i z a t i o n w i t h A e r o e l a s t i c C o n s t r a i n t s o f Ro to r Blades w i t h S t r a i g h t and Swept T ips, " A IAA Paper 88-2297, Proceedings AIAA/ASME/aSCE/AHS 29th S t r u c t u r e s , S t r u c t u r a l Dynamics and M a t e r i a l s Conference, P a r t 2, Wi l l iamsburg, VA, A p r i l 18-20, 1988, pp. 668-680.
Friedmann, P.P., and R. C e l i , " A e r o e l a s t i c i t y and S t r u c t u r a l O p t i m i z a t i o n o f Ro to r Blades w i t h Swept Tips," I C A S Paper 88-5.7.4, Proceedings S i x t e e n t h Congress o f I n t e r n a t i o n a l Counci l o f t h e Aeronau t i ca l Sciences, August 28-September 2, 1988, Jerusalem, I s r a e l , pp. 1092-1108.
Ro ta ry Wing A e r o e l a s t i c i t y , " NASA CR-165854, February 1982. Straub, F.K., and P. Friedmann, " A p p l i c a t i o n o f t h e F i n i t e Element Method t o
C e l i , R., and P.P. Friedmann, YJse o f I m p l i c i t Fo rmu la t i on Based on Quasi- l i n e a r i z a t i o n f o r t h e A e r o e l a s t i c Response and S t a b i l i t y o f Ro to r Blades i n Forward F1 i g h t , " Proceedings o f t he A I A A Dynamics S p e c i a l i s t s Conference, Monterey, CA, P a r t 28, A p r i l 1987, pp. 730-742.
161
21. Friedmann, P., and S.B.R. K o t t a p a l l i , Youp led Flap-Lag-Torsional Dynamics o f Hingeless Rotor Blades i n Forward F l i g h t , " Journal o f the M e r i c a n Hel icopter Society, Vol. 27, October 1982, pp. 28-36.
22. Vanderplaats, G.N., Approximation Concepts f o r Numerical A i r f o i l Opt imizat ion," NASA Technical Paper 1370, March 1979.
23. Vanderplaats, G.N., Nunerical Optimization Techniques f o r Engineering Design, Wi th Appl icat ions, McGraw-Hi 11 Book Co., 1984, pp. 211-215.
24. Vanderplaats. G.N., and F. Moses, " S t r u c t u r a l Opt imzat ion by Methods o f Feasib le D i rec t ions , " Journal o f Cmputers and Structures, Vol. 3 , Ju ly 1973, pp. 739-755.
25. Vanderplaats, G.N., 'TONMIN - A FORTRAN Program f o r Constrained Funct ion Min imiza t ion ; User 's Manua1,Il NASA TM X-62,282, August 1973.
26. Prouty, R.W., Hel icopter Performance, S t a b i l i t y and Control , PWS Publ ishers, Boston, 1986.
N89- 25153 ..
OPTIMIZATION OF ROTOR BLADES FOR COMBINED STRUCTURAL, PERFORMANCE, AND AEROELASTIC CHARACTERISTICS
David A . Peters and
Y . P . Cheng School o f Aerospace Engineering Georgia I n s t i t u t e o f Technology
A t l a n t a , Georgia
163

ABSTRACT
T h i s paper out1 i n e s t h e s t r a t e g i e s whereby he1 i c o p t e r r o t o r b lades can be op t im ized f o r combined s t r u c t u r a l , i n e r t i a l , dynamic, a e r o e l a s t i c , and aerodynamic performance c h a r a c t e r i s t i c s . There a r e t h r e e key i n g r e d i e n t s i n t h e successfu l execu t ion o f such an i n t e r d i s c i p l i n a r y o p t i m i z a t i o n . The f i r s t i s t h e d e f i n i t i o n o f a s a t i s f a c t o r y performance index t h a t combines a l l aspects o f t h e problem w i t h o u t t o o many c o n s t r a i n t s . The second element i s t h e j u d i c i o u s choice o f compu ta t i ona l l y e f f i c i e n t a n a l y s i s t o o l s f o r t h e v a r i o u s q u a n t i t a t i v e components i n bo th t h e c o s t f u n c t i o n a l and c o n s t r a i n t s . The t h i r d element i s an e f f e c t i v e s t r a t e g y f o r combining t h e v a r i o u s d i s c i p l i n e s e i t h e r i n p a r a l l e l o r sequen t ia l o p t i m i z a t i o n s .
I INTRODUCTION
T h i s paper desc r ibes ongoing work i n t h e o p t i m i z a t i o n o f h e l i c o p t e r main r o t o r blades. The h e l i c o p t e r i s i n t r i n s i c a l l y i n t e r d i s c i p l i n a r y due t o t h e c l o s e c o u p l i n g between aerodynamics, dynamics, and t h e b lade s t r u c t u r a l d e t a i l s . As a r e s u l t , t h e
I o p t i m i z a t i o n o f a h e l i c o p t e r r o t o r i n v o l v e s impor tan t des ign c o n s i d e r a t i o n s f rom many d i v e r s e eng ineer ing d i s c i p l i n e s . I n our p resen t work, we at tempt t o combine severa l o f these impor tan t e f f e c t s i n a u n i f i e d manner. F i r s t , t h e b lade must be designed t o have n a t u r a l f requenc ies t h a t a r e removed f rom i n t e g e r m u l t i p l e s o f t h e r o t o r speed. T h i s i s necessary i n o rde r t o ensure good dynamic c h a r a c t e r i s t i c s . Second, t h e b lade must be as light as p o s s i b l e b u t y e t have s u f f i c i e n t i n e r t i a t o a l l o w a u t o r o t a t i o n a l l and ings . T h i r d , t h e s t r u c t u r e must be designed t o ensure t h a t b lade s t resses can be s a f e l y c a r r i e d by t h e c ross s e c t i o n through an adequate number o f l o a d i n g cyc les . Four th, t h i s c r o s s - s e c t i o n a l s t r u c t u r e must f i t w i t h i n t h e aerodynamic envelope o f t h e b lade and be manufacturable. F i f t h , t h a t aerodynamic envelope must y i e l d s a t i s- f a c t o r y r o t o r performance i n hover and fo rward f l i g h t . S i x t h , t h e combined s t r u c - t u r a l , i n e r t i a l , and aerodynamic c h a r a c t e r i s t i c s o f t h e b lade must be a e r o e l a s t i c a l l y s t a b l e w i t h low v i b r a t i o n s . I n t h e p resen t work, we concen t ra te on t h e b e s t methods o f f o r m u l a t i o n f o r t h e above c o n s i d e r a t i o n s such t h a t t h e b lade can be op t im ized e f f e c t i v e l y .
There has been a good deal o f good work i n r o t o r o p t i m i z a t i o n through t h e years. Al though we do n o t have space t o do a complete survey, c e r t a i n impor tan t c o n t r i b u - t i o n s should be mentioned. I n r e f . 1, i t i s no ted t h a t e f f i c i e n t placement o f lumped masses w i t h i n t h e b lade can lower h e l i c o p t e r s t resses . References 2 and 3 at tempt optimum placement o f these masses b u t n o t e t h a t t h e minimum v i b r a t i o n s o l u t i o n o f t e n r e s u l t s e i t h e r i n h i g h b lade s t resses o r i n bend ing - to rs ion f l u t t e r due t o t h e n a t u r a l m i g r a t i o n o f t h e t o r s i o n a l f requency t o an i n t e g e r m u l t i p l e o f r o t o r speed d u r i n g t h e o p t i m i z a t i o n process. Bielawa, r e f . 4, per forms a "man-in-the-loop" o p t i m i z a t i o n i n which a e r o e l a s t i c s t a b i l i t y i s an i n t e g r a l p a r t o f t h e problem. He no tes t h a t a major h indrance t o comp le te l y automated o p t i m i z a t i o n i s t h e complex i ty o f c o n s t r a i n t s t h a t d e f i n e a r e a l i s t i c b lade des ign.
I n more r e c e n t work, T a y l o r ( r e f . 5) shows t h a t o p t i m i z a t i o n t o low v i b r a t i o n s can r e s u l t f rom e f f i c i e n t t a i l o r i n g o f mode shapes as w e l l as f rom frequency p lace- ment. Reference 6 p rov ides a combined a e r o e l a s t i c and v i b r a t i o n o p t i m i z a t i o n w i t h complete f l a p - l a g - t o r s i o n equat ions. The work shows t h a t such an o p t i m i z a t i o n i s f e a s i b l e , b u t t h a t f requency c o n s t r a i n t s must s t i l l be a p p l i e d i n o rde r t o p reven t m i g r a t i o n o f some modes t o undes i rab le va lues. Reference 7 prov ides an optimum placement o f dynamic f requenc ies based on i n i t i a l designs o f i n - s e r v i c e r o t o r blades. Design parameters a r e taken t o be t h e i n t e r n a l s t r u c t u r a l t h i cknesses o f box beams and lumped masses ( r a t h e r than t h e gener i c E I ' s , e t c . , used i n p rev ious work) . Resu l t s show t h a t a l l f r equenc ies can be e f f e c t i v e l y p laced w i t h t h e use o f r e a l i s t i c
I 164
s t r u c t u r a l changes t h a t can f i t w i t h i n the aerodynamic envelope. Reference 8 pre- sents work on the op t im iza t i on o f r o t o r blades i n order t o have good aerodynamic performance, a cons idera t ion t h a t i s l ack ing i n the e a r l i e r s t r u c t u r a l op t im iza t ions .
I n the most recent work, r e f s . 9 and 10 re-examine the op t im iza t i on problems o f r e f s . 5 and 7 bu t w i t h emphasis on op t im iza t i on s t r a t e g i e s and use o f l i m i t e d design spaces. Reference 11 prov ides some o f the most invo lved ae roe las t i c op t im iza t i on t o date. Th is research shows the importance o f ob ta in ing a n a l y t i c modal g rad ien ts i n order t o make the op t im iza t i on procedure e f f i c i e n t . F i n a l l y , r e f . 12 o f f e r s the f i r s t experimental v e r i f i c a t i o n t h a t numerical op t im iza t i on can t r u l y r e s u l t i n r o t o r blades w i t h lower v i b r a t i o n a l cha rac te r i s t i cs .
I n t h i s paper, we l ook a t t he t h e o r e t i c a l and p r a c t i c a l problems associated wi th the a d d i t i o n o f s t r e s s cons t ra in t s and aerodynamic performance goals t o the t r a d i - t i o n a l s t r u c t u r a l and ae roe las t i c op t im iza t ions 1 i s t e d above. I n t r a d i t i o n a l design methodologies i n the indus t ry , t he choice o f the aerodynamic blade shape (chord, th ickness, t w i s t , e t c . ) i s the f i r s t s tep i n the design process. Th is geometry i s chosen based on aerodynami c performance cons1 d e r a t i ons. Next, a s t r u c t u r a l design i s performed i n order t o f i n d an adequate s t r u c t u r e ( i .e., one t h a t can wi thstand the blade f a t i g u e loads) t h a t can f i t w i t h i n the aerodynamic surfaces. Th i rd , ae roe las t i c and v i b r a t i o n a l analyses are performed t o see i f the blade needs t o be tuned f u r t h e r i n order t o e l im ina te e i t h e r i n s t a b i l i t i e s o r harmonic resonances ( t h e l a t t e r o f which would impact the s t ress ca l cu la t i ons ) . It may very w e l l be t h a t a more "optimum" design could be obtained i f these var ious i n d i v i d u a l op t im iza t ions were done i n p a r a l l e l r a t h e r than i n ser ies . For example, i t may be t h a t a s l i g h t compromise i n blade performance ( i n order t o accommodate add i t i ona l s t r u c t u r e ) might lower v i b r a t i o n s t o the p o i n t t h a t a heavy v i b r a t i o n absorber could be e l iminated, thus m i t i g a t i n g the performance loss . Therefore, i t i s impor tant t o determine how such a u n i f i e d op t im iza t i on might be performed.
THEORETICAL BACKGROUND
Struc ture
The f i r s t s tep i n t h e op t im iza t i on research descr ibed he re in i s t o rep lace the t r u e blade w i t h a r e a l i s t i c , box-beam model t h a t has dynamic c h a r a c t e r i s t i c s s i m i l a r t o t h a t o f t he t r u e beam as we l l as a r e a l i s t i c s t ress d i s t r i b u t i o n . F i g u r e 1 dep ic t s the schematic model used here. The blade chord and a i r f o i l th ickness are assumed t o come from a performance ana lys i s which could be running i n p a r a l l e l o r i n se r ies w i t h the s t r u c t u r a l analys is . This, then, de f ines a geometric area w i t h i n which the box beam may be placed. are i t s w i d t h ( b ) , i t s f l ange th ickness ( t ) , and i t s web thicknesses (sl and s2). The box beam i s assumed t o c a r r y a l l b lade tens ion and a l l v e r t i c a l bending. How- ever, t he secondary c e l l formed by the t r a i l i n g - e d g e s k i n i s assumed t o c o n t r i b u t e t o both t o r s i o n a l s t i f f n e s s and inp lane s t i f f n e s s through a s k i n th ickness ( p ) . Two add i t i ona l p r i m i t i v e design parameters ( a and d) a l l o w f o r add i t i ona l freedom i n weight d i s t r i b u t i o n . The parameter ( a ) de f ines the s i z e o f the t i p weight, and the parameter ( d ) de f ines the w id th o f a lumped mass i n t e r n a l t o the box beam. These seven design parameters (a1 ong w i t h g iven mater i a1 p roper t i es ) de f ine the blade mass and s t r u c t u r a l p roper t i es . Na tu ra l l y , they are const ra ined such t h a t t he p ieces must f i t w i t h i n each o ther (e. g . , d<b-sl-s2).
Now, these seven p r i m i t i v e design va r iab les t r a n s l a t e i n t o e i g h t o v e r a l l s t r u c - t u r a l p roper t i es . These are the two bending s t i f f n e s s e s (E I f and E Ic ) , the t o r s i o n a l
The p r i m i t i v e design va r iab les f o r the box beam
165
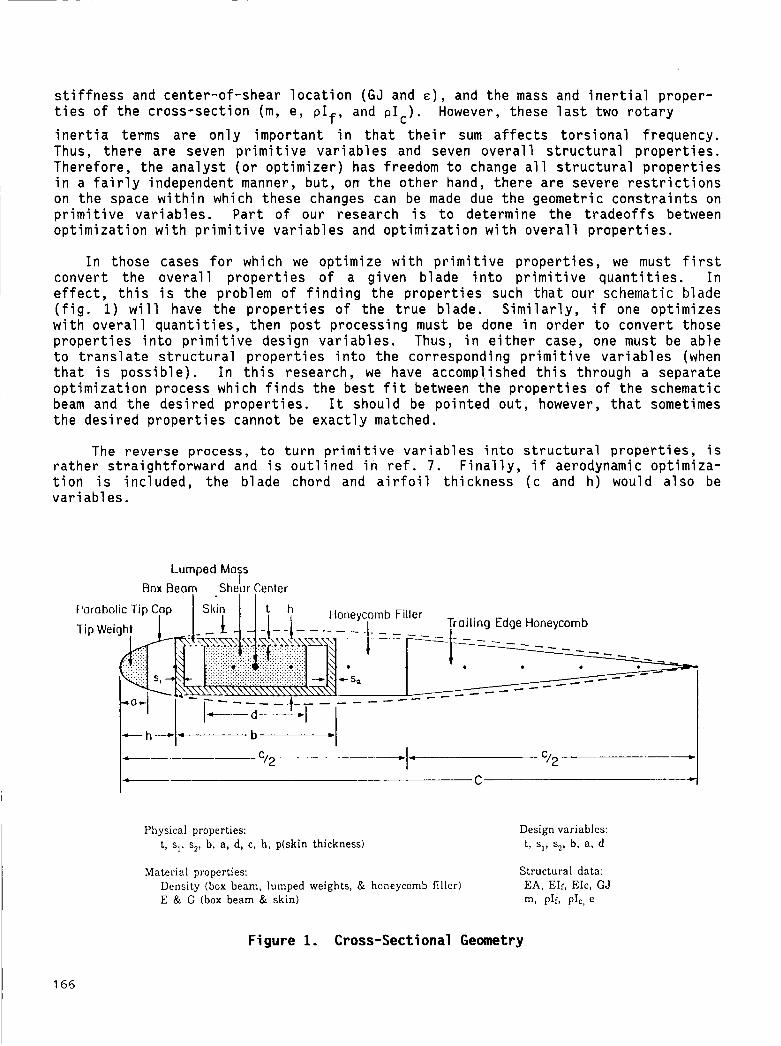
stiffness and center-of-shear location (GJ and E ) , and the mass and inertial proper- ties of the cross-section (m, e, PIf, and pic). inertia terms are only important in that their sum affects torsional frequency. Thus, there are seven primitive variables and seven overall structural properties. Therefore, the analyst (or optimizer) has freedom to change all structural properties in a fairly independent manner, but, on the other hand, there are severe restrictions on the space within which these changes can be made due the geometric constraints on primitive variables. Part of our research is to determine the tradeoffs between optimization with primitive variables and optimization with overall properties.
However, these last two rotary
In those cases for which we optimize with primitive properties, we must first convert the overall properties of a given blade into primitive quantities. In effect, this is the problem of finding the properties such that our schematic blade (fig. 1) will have the properties of the true blade. Similarly, if one optimizes with overall quantities, then post processing must be done in order to convert those properties into primitive design variables. Thus, in either case, one must be able to translate structural properties into the corresponding primitive variables (when that is possible). In this research, we have accomp1,ished this through a separate optimization process which finds the best fit between the properties of the schematic beam and the desired properties. It should be pointed out, however, that sometimes the desired properties cannot be exactly matched.
The reverse process, to turn primitive variables into structural properties, is rather straightforward and i s outlined in ref. 7. Finally, if aerodynamic optimiza- tion is included, the blade chord and airfoil thickness (c and h) would also be variables.
Lumped Mass I
Box Beam S h e w Center
tiorieycomb Filler Trailing Edge Honeycomb
--- - - - - -_ -- - - . . .
*- - * sa - ---.-- _ - - - - - - _ _ _ - - - - -
9 2 *
Physical properties: t, sI, sp , b, a, d, c, h , p(skin thickness)
Design variables: t, s,, sq, b, a , d
Material properties: Structural data: Density (box beam, lumped weights, & honeycomb filler) EA, EIr, EIc, GJ E & G (box beam & skin) m, PIL PIC, e
Figure 1. Cross-Secti onal Geometry
165

Elements o f Analys is
Once the s t r u c t u r e i s def ined, the next steop i s t o se t up the ana lys is t o o l s requ i red i n the op t im iza t ion process. These are l i s t e d below:
1. Weight and i n e r t i a s 2. Natural f requencies and modes 3 . Performance and handl ing q u a l i t i e s 4. V ib ra t ions and loads 5. Blade s t resses and f a t i g u e l i f e 6. Aeroel a s t i c s tab i 1 i t y
I n the f i r s t category, a c a l c u l a t i o n o f blade weight i s necessary because blade mass n o t on ly adds i t s own weight t o the he l i cop te r bu t a lso r e s u l t s i n add i t i ona l weight i n the con t ro l system, bearings, e tc . Thus, every pound o f blade weight could r e s u l t i n 3 pounds o f s t r u c t u r a l weight, which imp1 i e s l ess payload, more f u e l , o r shor te r range. The mass moment o f i n e r t i a i s important because i t must be l a r g e enough t o support au toro ta t ion . For example, some companies recommend t h a t the k i n e t i c energy i n the blade d i v ided by hover power should be a t l e a s t 2 sec. Also, the chordwise mass balance i s important t o v i b r a t i o n and t o bending-torsion f l u t t e r . A l l th ree o f these aspects are inc luded i n the present work.
I n the second i t e m , we f i n d t h a t the na tura l f requencies and mode shapes can a lso enter the op t im iza t ion process. Past op t im iza t i on s tud ies have found i t neces- sary and usefu l t o keep blade frequencies w i t h i n prescr ibed bounds. Figure 2 f r o m r e f . 7 shows v e r t i c a l shears as a func t i on o f the second na tura l frequency o f a t e e t e r i n g r o t o r (symmetric mode). One can see the s t rong coupl ing between frequency
I O
8
h
N 6
D
b
I
v
a 5 4
2
0
FINAL DESIGN (With And Without Aerodynamics)
I 1 I
I I 1 1 I I I I .5 2.0 2.5 3.0 3.5 4.0 4.5
W2(No Rev) W l ( = l . l 8 ) And W3(=5.67)Are Fixed
Figure 2. Ef fect o f Frequency on Shear Stress
I 167
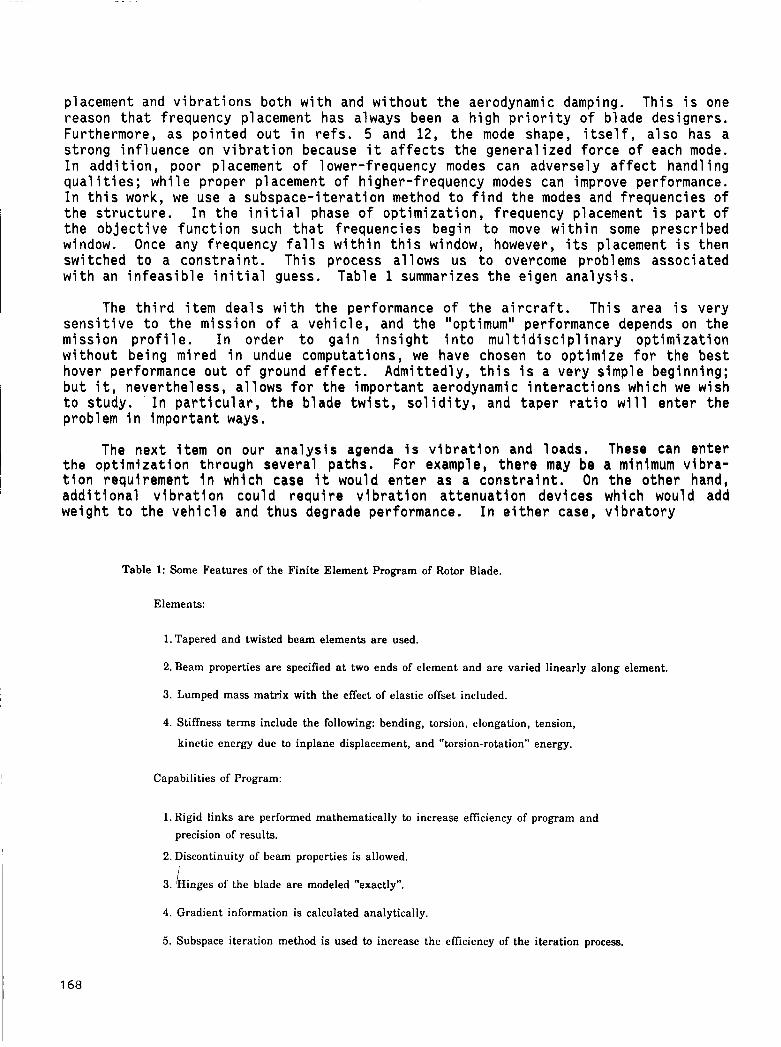
placement and vibrations both with and without the aerodynamic damping. This is one reason that frequency placement has always been a high priority of blade designers. Furthermore, as pointed out in refs. 5 and 12, the mode shape, itself, also has a strong influence on vibration because it affects the generalized force of each mode. In addition, poor placement of lower-frequency modes can adversely affect hand1 ing qualities; while proper placement of higher-frequency modes can improve performance. In this work, we use a subspace-iteration method to find the modes and frequencies of the structure. In the initial phase of optimization, frequency placement is part of the objective function such that frequencies begin to move within some prescribed window. Once any frequency falls within this window, however, its placement is then switched to a constraint. This process allows us to overcome problems associated with an infeasible initial guess. Table 1 summarizes the eigen analysis.
The third item deals with the performance of the aircraft. This area is very sensitive to the mission o f a vehicle, and the "optimum" performance depends on the mission profile. In order to gain insight into multidisciplinary optimization without being mired in undue computations, we have chosen to optimize for the best hover performance out of ground effect. Admittedly, this is a very simple beginning; but it, nevertheless, allows for the important aerodynamic interactions which we wish to study. In particular, the blade twist, solidity, and taper ratio will enter the problem in important ways.
The next item on our analysis agenda is vibration and loads. These can enter the optlmization through several paths. For example, there may be a minimum vibra- tion requirement In which case it would enter as a constraint. On the other hand, additional vibration could require Vibration attenuation devices which would add weight to the vehicle and thus degrade performance. In either case, vibratory
Table 1: Some Features of the Finite Element Program of Rotor Blade.
Elements:
1. Tapered and twisted beam elements are used.
2. Beam properties are specified at two ends of element and are varied linearly along element.
3. Lumped mass matrix with the effect of elastic offset included.
4. Stiffness terms include the following: bending, torsion, elongation, tension,
kinetic energy due to inplane displacement, and "torsion-rotation" energy.
Capabilities of Program:
1. Rigid links are performed mathematically to increase efficiency of program and precision of results.
2. Discontinuity of beam properties is allowed.
inges of the blade are modeled "exactly".
4. Gradient information is calculated analytically.
5. Subspace iteration method is used to increase the efficiency of the iteration process.

airloads contribute to the fatigue of components and affect the life of blades. As with performance, we have elected to begin the optimization study with a simplified vibration analysis. Thus, in the initial stages, we are applying a given load spectrum to the blade with viscous damping added to simulate aerodynamic feedback. Obviously, this is a far cry from the detailed aeroelastic vibration analysis we plan to do later. However, it does give reasonable loads that interact with frequencies and mode shapes in a meaningful way. Therefore, it will allow a study of problems in combined optimization. It should also be noted that, since mode shapes enter the vibratory response, gradients of the modes are required in order to perform the optimization, see ref. 11.
The fifth item of analysis is that o f stresses and fatigue life. Perhaps the most important goal of this present work is to incorporate this into the optimization process. In computation of stresses, we use the combined tensile stresses (due to centrifugal force) and the bending-torsion stresses due to the loading described above. These are combined in the conventional tensor way in order to find the three-dimensional "Mohr I s Ci rcl ea that describes the stress state (static pl us osci 1 1 atory) . Fatigue 1 i fe is then computed based on the methodol ogi es described in refs. 13 and 14. In particular the infinite-fatigue-life stress is lowered by the typical "Endurance Reduction Factor" of 0.8 to obtain a "Reduced Endurance Limit. 'I Next, a "Weighted Fatigue Approach" is used to modify the computed stresses. In this methodology, the alternating loads are multiplied by a factor of 2.0 and added to the static loads. A design is within the stress constraint if this computed maximum stress is less than the reduced endurance stress at all points within the structure. The use of stress as a constraint requires the computation of stress gradients. When primitive design variables are used in optimization, this method is straightforward, a1 though involved. However, when the overall quanti ties are used, the detai 1 ed thicknesses are unknown at each iteration; and the stress computation encounters some necessary approximations. In this work, we also explore the consequences of these approximations.
The final element in the analysis is aeroelastic stability. Past work has shown this to be very important either when frequency placement is not a constraint or for hingeless and bearingless rotors. In this phase of our research, we are restricting oursel ves to arti cul ated and teetering rotors for which aeroel asti c stabi 1 i ty is not generally a problem. Thus, for the aeroelasticity portion of the analysis, we simply include a constraint that the center of mass be forward of the elastic axis of the blade at all cross sections. This prevents any classical bending-torsion flutter.
Object i ve Function
For the case of optimizing hover performance, it is possible to unify the entire problem into one objective function. This could be the payload (lifting force) of the rotor at a certain altitude at a given temperature. Such an objective function would be penalized by blade weight, by a reduction in rotor figure of merit, or by the added weight of vibration absorbers. To make this operational, one would have to decide on numerical values for the ratio of total mass to blade mass (taken above as 4 to 1) and on the number of pounds of isolator mass required to eliminate a certain number of pounds of 4/rev vibration at some location. Thus, the objective function would be the lifting capability at a given power minus the blade weight (multiplied by a factor to account for control-system weight to blade weight) minus the weight of vibration absorbers based on calculated vibrations. Similar objective functions could be formulated for other missions in terms of range or maneuverability.
169

RESULTS AND DISCUSSION
Scope of Present Results
This paper describes work in progress. However, we do have some very interest- ing numerical results obtained in the first phase of our work; and these results are presented here. In these first results, we have added the effect of stress con- straints to the optimization, but we have not added the aerodynamic performance. Thus, the results below are for a fixed aerodynamic envelope. The initial blade design is the so-called "Hughes blade" of ref. 7 which resembles a typical McDonnell Douglas AH-64A blade in geometry but not in detailed design. is taken to be 6061 T6 Aluminum alloy with 35x10 psi yield stress and 13x10 psi endurance limit. radial distribution. other harmonics are given magnitudes based on the flight loads survey in ref. 15. The optimization is performed with CONMIN.
The box-beam material 3 3
Blade loads are considered harmonic in nature with a quadratic The strength of the zero harmonic is based on a given CT, and
Section Properties
The first step in this optimization study was to try to match the physical data with the primitive cross-sectional variables. In the beginning work, we found that the optimizer indiscriminately placed stiffness in the box beam (rather than in the skin) which made skin thicknesses unreasonably small. Therefore, we fixed skin thickness and only allowed its modulus to vary. As a result, we could match all the physical stiffness properties with reasonable success, a1 though the shear center seemed to end up closer to the front end of the box beam than in the data. Tables 2 and 3 outline the initial and modified procedures for this pre-optimization.
Table 2: Procedures Now Used to Determine Section Properties from Given Structural Data.
* Step 3: Design variables: a, d, skin density.
Objective:
Constraints:
w, ( m - mJ2 + wq ( p1f.- pIfo )2 + w3 ( pIc - PI, 0 )2 + w4 ( e - e, 12
( 1-r, ) ( mo )< m <( 1 +r, ) (m, )
( 1-r, ) ( PIf 0 )< PIf <( 1 +r3 ) ( pIr 0 )
( 1-r, ) ( PI, 0 )< PIC<( 1 +r, ) ( PI, 0 )
( l-rg ) ( e, )< e <( 1 +r7 1 (e , )
* Where Wj is weightingscalar, ti is tolerant value, ( )o is given data, ( )f represents quantity in flapping direction, ( represents quantity in chordwise direction, and e is elastic offset.
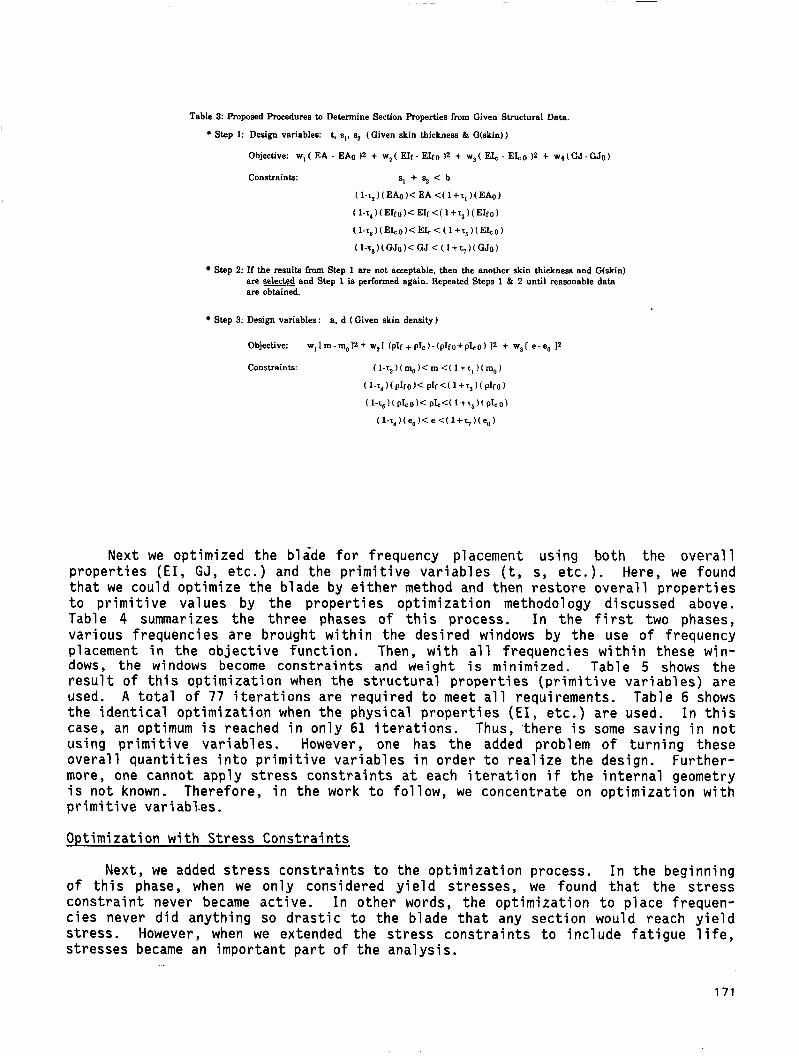
Table 3: Proposed Procedures to Determine Section Properties from Given Structural Data.
* Step 1: Design variables: t, s,, sz (Given skin thickness & G(skin) )
Objective: w, ( EA - EAo )2 + w2( EIr - E 4 0 12 + w,( EL - EIeo )Z + ~ ~ ( G J - G J o ) Constraints: s, + s2 < b
( 1-T, ) ( EA0 )< EA <( 1 + r, ) ( EA0 )
( 1-X, ) ( EIro )< EIr <( 1 + T ~ ) ( EIfo )
( 1-T, ) ( EI, 0 )< EI, < ( 1 +t6 ) ( EI, o )
( 1-r8) ( GJo )< GJ < ( 1 fr, ) ( GJo)
Step 2: If the results from Step 1 are not acceptable, then the another skin thickness and C(skin) are are obtained.
and Step 1 is performed again. Repeated Steps 1 & 2 until reasonable data
Step 3: Design variables: a, d ( Given skin density)
Objective:
Constraints:
w,Im-m,12+ wz[ (pIr +pIe ) - (pIro+pI ,o ) 12 + w,[ e - e , 12
( 1-r, ) ( m,, )< m <( 1 + r , ) ( m a )
( 1-r, ) ( PIfO )< PIf <( 1 +r3 ) ( PIfO )
( 1-r,) ( PIC0 )< PI&( 1 +"$ ) ( PIe 0 )
( 1-r, ) ( e,, )< e <( 1 +r, ) ( e, )
Next we optimized the blade for frequency placement using both the overall properties (EI, GJ, etc.) and the primitive variables (t, s, etc.). Here, we found that we could optimize the blade by either method and then restore overall properties to primitive values by the properties optimization methodology discussed above. Table 4 summarizes the three phases of this process. In the first two phases, various frequencies are brought within the desired windows by the use of frequency placement in the objective function. Then, with all frequencies within these win- dows, the windows become constraints and weight i s minimized. Table 5 shows the result of this optimization when the structural properties (primitive variables) are used. A total of 77 iterations are required to meet all requirements. Table 6 shows the identical optimization when the physical properties (EX, etc.) are used. In t h i s case, an optimum is reached in only 61 iterations. Thus, 'there is some saving in not using primitive variables. However, one has the added problem of turning these overall quantities into primitive variables in order to realize the design. Further- more, one cannot apply stress constraints at each iteration if the internal geometry is not known. Therefore, in the work to follow, we concentrate on optimization with primitive Variables.
Optimization with Stress Constraints
Next, we added stress constraints to the optimization process. In the beginning of this phase, when we only considered yield stresses, we found that the stress constraint never became active. In other words, the optimization to place frequen- cies never did anything so drastic to the blade that any section would reach yield stress. However, when we extended the stress constraints to include fatigue life, stresses became an important part of the analysis.
171
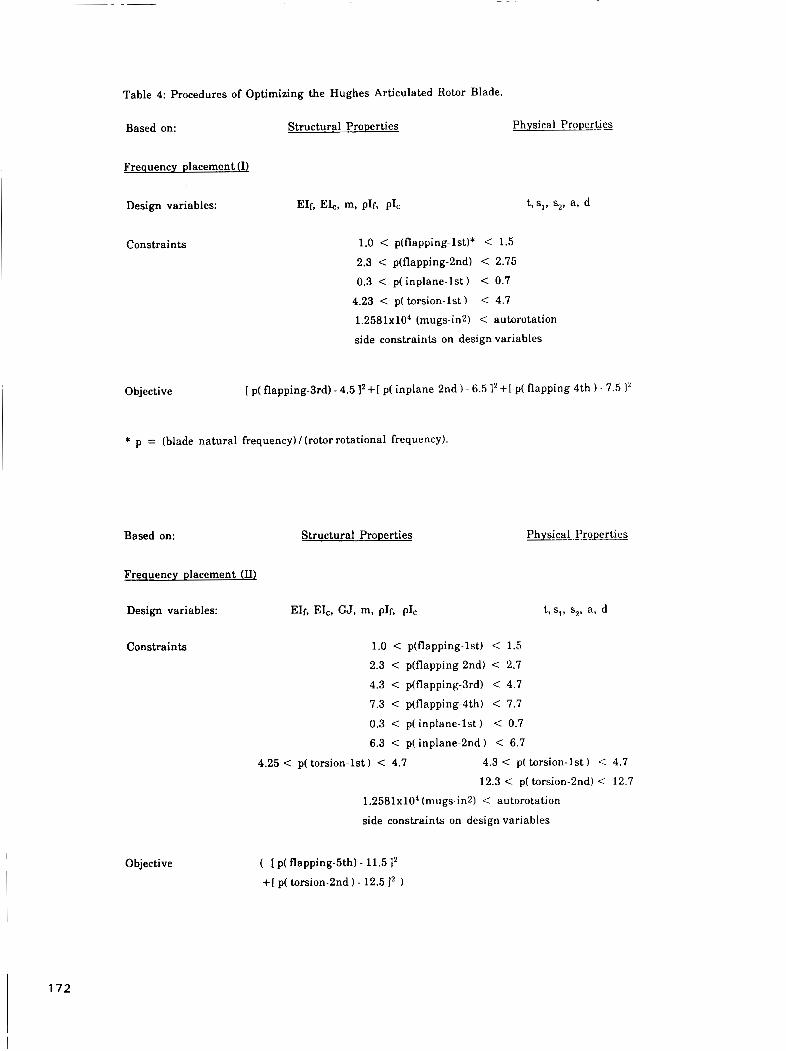
Table 4: Procedures of Optimizing the Hughes Articulated Rotor Blade.
Based on: Structural Properties Physical Properties
Frequency placement (I)
Constraints 1.0 < p(flapping-lst)* < 1.5
2.3 < flappi ping-2nd) < 2.75 0.3 < p( inplane-1st)
4.23 < p( torsion-1st)
1 . 2 5 8 1 ~ 1 0 ~ (mugs-in2) < autorotation
side constraints on design variables
< 0.7
< 4.7
Objective [ p( flapping-3rd) - 4.5 l2 + [ p( inplane-2nd ) - 6.5 12+ [ p( flapping-4th ) - 7.5 l2
* p = (blade natural frequency) / (rotor rotational frequency).
Based on: Structural Properties Physical Properties
Frequency placement (II)
Constraints 1.0 < p(flapping-1st) < 1.5 2.3 < flappi ping-2nd) < 2.7
4.3 < flappi ping-3rd) < 4.7
7.3 < flappi ping-4th) < 7.7
0.3 < p( inplane-1st) < 0.7
6.3 < ~ ( i n p l a n e - 2 n d ) < 6.1
4.25 < torsion-1st) < 4.7 4.3 < p( torsion-1st) < 4.7
12.3 < p( torsion-2nd) < 12.7
1 . 2 5 8 1 ~ 1 0 ~ (mugs-in21 < autorotation
side constraints on design variables
Objective ( [ p( flapping-5th) - 11.5 1' +[ p( torsion-2nd ) - 12.5 1' )

Table 4: Procedures of Optimizing the Hughes Articulated Rotor Blade (Concluded).
Based on Structural Properties Physical Properties
Weight Minimization
Constraints 1.0 < p(flapping-1st) < 1.5 2.3 < flappi ping-2nd) < 2.7 4.3 < flappi ping-3rd) < 4.7 7.3 < flappi ping-4th) < 7.7
11.3 < flappi ping-5th) < 11.7 0.3 < p( inplane-1st) < 0.7 6.3 < p( inplane-2nd) < 6.7 4.3 < p( torsion-1st < 4.7
12.3 < p( torsion-2nd) < 12.7
1 . 2 5 8 1 ~ 1 0 ~ (mugs-in2) < autorotation side constraints on design variables
0. < elastic offset'
Objective Weight of Blade
* Except a t station 76 which originally has an elastic offset equal to - 5 2 and has the constraint ( elastic offset > -0.64 1.
Table 5: Optimization Results of Hughes Blade (Structural Properties as Design Variables).
Weight (lbs)
Autorotation
p(inp1ane- 1st)
p(flapping- 1st)
p( flappi ng-2nd)
p(torsion- 1 st)
flappi ping-3rd)
p(inp1ane-2nd)
flappi ping-4th)
flappi ping-5th)
p( torsion-2nd)
flappi ping-6th)
Iterations(CONM1N)
Original
203.42
12581.
0.4756
1.0293
2.7451
4.2483
4.9035
6.8914
7.9378
12.058
12.921
16.996
_ _
Frequency Placement(1)
217.36
13233.
0.4820
1.0304
2.6143
4.2501
4.5101
6.5029
7.5026
10.933
12.927
15.521
21
Frequency Placement(II)
217.03
13203.
0.4820
1.0304
2.6287
4.2563
4.5772
6.5118
7.5923
11.500
12.500
15.921
7
Weight Minimization
193.03
12661.
0.4677
1.0257
2.6876
4.3058
4.6979
6.6958
7.5558
11.302
12.642
15.484
49
173
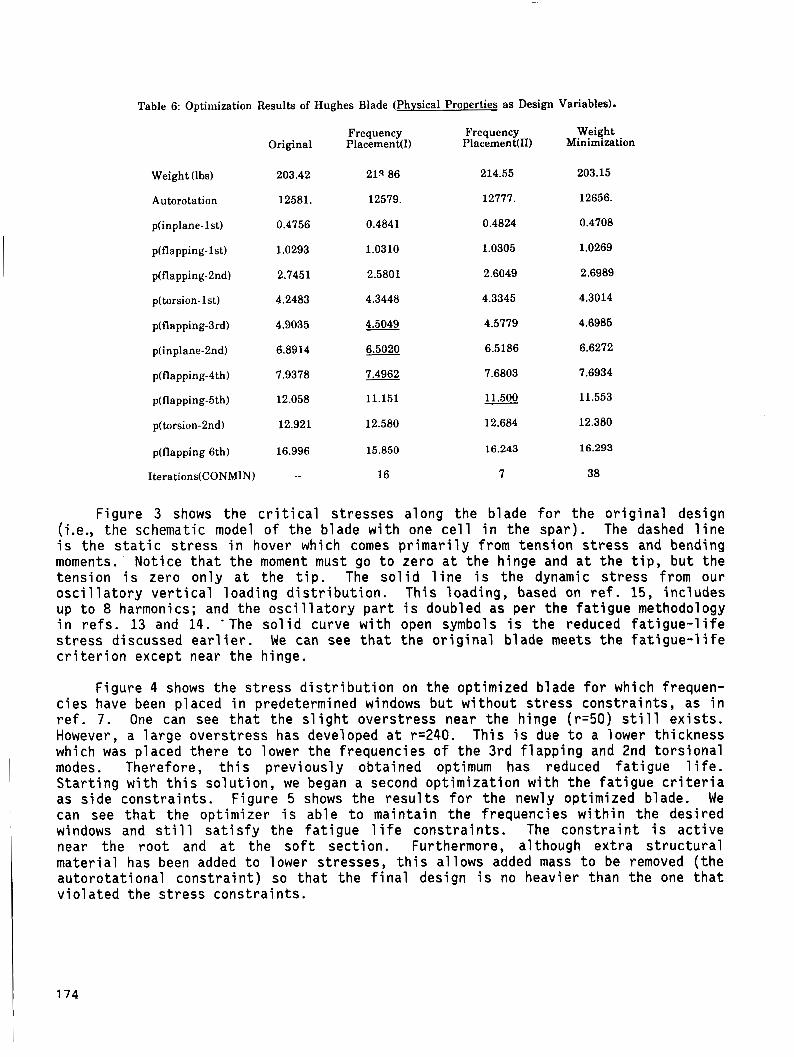
Table 6: Optimization Results of Hughes Blade (Physical Properties as Design Variables).
Frequency Frequency Weight Original Placement(1) PlacementUI) Minimization
Weight (lbs) 203.42 213 86 214.55 203.15
Autorotation 12581. 12579. 12777. 12656.
p(inp1ane-1st) 0.4756 0.4841 0.4824 0.4708
p(flapping-1st) 1.0293 1.0310 1.0305 1.0269
flappi ping-2nd) 2.7451 2.5801 2.6049 2.6989
p(torsion- 1st) 4.2483 4.3448 4.3345 4.3014
flappi ping-3rd) 4.9035 4.5049 4.5779 4.6985
~(inplane-2nd) 6.8914 6.5020 6.5186 6.6272
flappi ping-4th) 7.9378 7.4962 7.6803 7.6934
flappi ping-5th) 12.058 11.151 11.500 11.553
torsion-2nd) 12.921 12.580 12.684 12.380
flappi ping-6th) 16.996 15.850 16.243 16.293
-
Iterations(C0NMIN) -_ 16 7 38
Figure 3 shows the critical stresses along the blade for the original design (i.e., the schematic model of the blade with one cell in the spar). The dashed line is the static stress in hover which comes primarily from tension stress and bending moments. Notice that the moment must go to zero at the hinge and at the tip, but the tension is zero only at the tip. The solid line is the dynamic stress from our oscillatory vertical loading distribution. This loading, based on ref. 15, includes up to 8 harmonics; and the oscillatory part is doubled as per the fatigue methodology in refs. 13 and 14. .The solid curve with open symbols is the reduced fatigue-life stress discussed earlier. We can see that the original blade meets the fatigue-life criterion except near the hinge.
Figure 4 shows the stress distribution on the optimized blade for which frequen- cies have been placed in predetermined windows but without stress constraints, as in ref. 7. One can see that the slight overstress near the hinge (r=50) still exists. However, a large overstress has developed at ~ 2 4 0 . This is due to a lower thickness which was placed there to lower the frequencies of the 3rd flapping and 2nd torsional modes. Therefore, this previously obtained optimum has reduced fatigue life. Starting with this solution, we began a second optimization with the fatigue criteria as side constraints. Figure 5 shows the results for the newly optimized blade. We can see that the optimizer is able to maintain the frequencies within the desired windows and still satisfy the fatigue life constraints. The constraint is active near the root and at the soft section. Furthermore, although extra structural material has been added to lower stresses, this allows added mass to be removed (the autorotational constraint) so that the final design is no heavier than the one that violated the stress constraints.

*--6 FATIGUE STRESS __ TOTAL STRESS - _ _ STATIC STPTSS(PEF) 0
0 0 0 STATIC STRESS
Figure 3. Stresses o f I n i t i a l Design
FATIGUE STRESS
STATIC STRESS(REF) __ TOTAL STRESS
0 0 STATIC STRESS
_ _ _
X I
0 0.00 50.00 100.00 150.00 200.00 250.00 b 500.00
DISTANCE
Figure 4. Stresses o f Optimum Design
175
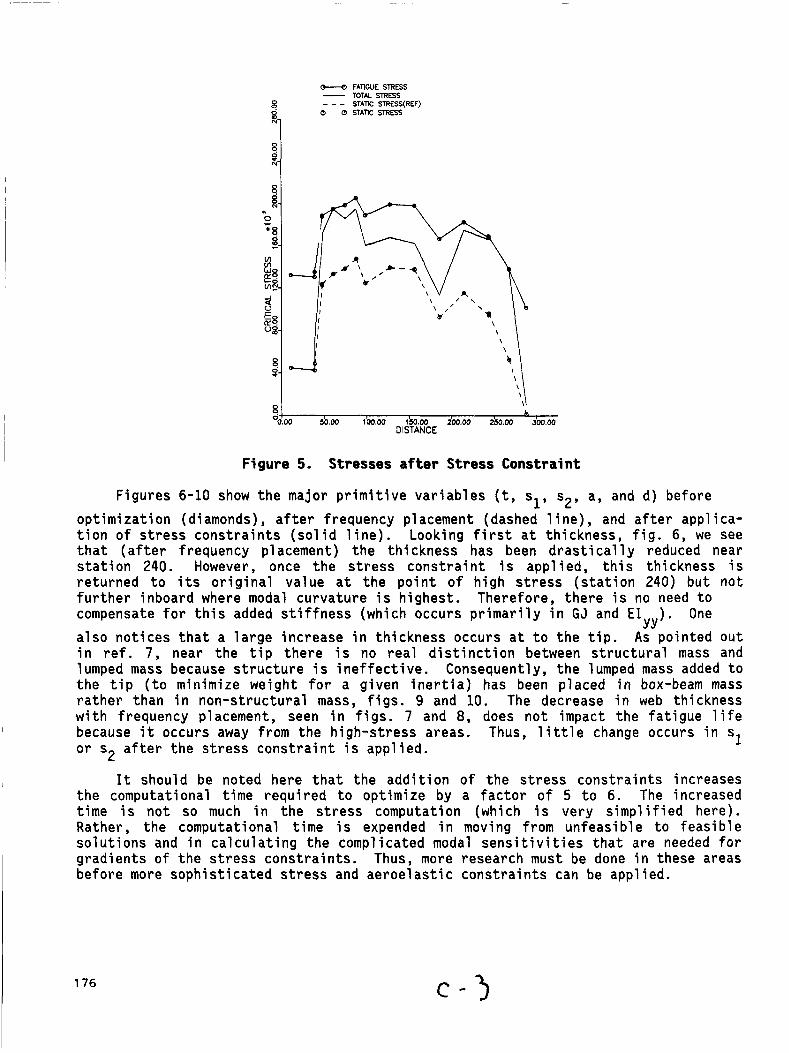
FATIGUE STRESS - TOTM STRESS _ _ _ m n c STRESS(REF) Q o mnc ~ E S S
8
"1
\ I 8 0
h 0.00 50.00 100.00 150.00 zbo.00 2bo.00 Jbo.00
DISTANCE
Figure 5. Stresses a f te r Stress Constraint
Figures 6-10 show the major primitive variables (t, sly s2, a, and d) before optimization (diamonds), after frequency placement (dashed line), and after applica- tion of stress constraints (sol id 1 ine) . Looking first at thickness, fig. 6, we see that (after frequency placement) the thickness has been drastically reduced near station 240. However, once the stress constraint is applied, this thickness is returned to its original value at the point o f high stress (station 240) but not further inboard where modal curvature is highest. Therefore, there is no need to compensate for this added stiffness (which occurs primarily in GJ and E1 ) . One also notices that a large increase in thickness occurs at to the tip. As pointed out in ref. 7, near the tip there is no real distinction between structural mass and lumped mass because structure is ineffective. Consequently, the lumped mass added to the tip (to minimize weight for a given inertia) has been placed in box-beam mass rather than in non-structural mass, figs. 9 and 10. The decrease in web thickness with frequency placement, seen in figs. 7 and 8, does not impact the fatigue life
or s2 after the stress constraint is applied.
I It should be noted here that the addition of the stress constraints increases the computational time required to optimize by a factor of 5 to 6. The increased time is not so much in the stress computation (which is very simplified here). Rather, the computational time is expended in moving from unfeasible to feasible solutions and in calculating the complicated modal sensitivities that are needed for gradients of the stress constraints. Thus, more research must be done in these areas before more sophisticated stress and aeroelastic constraints can be applied.
YY
I because it occurs away from the high-stress areas. Thus, little change occurs in s1
176 c - 3

Q
1 I I 1 I 1
10 50.00 100.00 150.00 200.00 250.00 JOO.00 DISTANCE FROM ROOT
Figure 6. Flange Thickness, t
300.00 10 - v l l , l l 50.00 100.00 150.00 200.00 250.00 DISTANCE FROM ROOT
Figure 7. Webb Thickness, s1
177
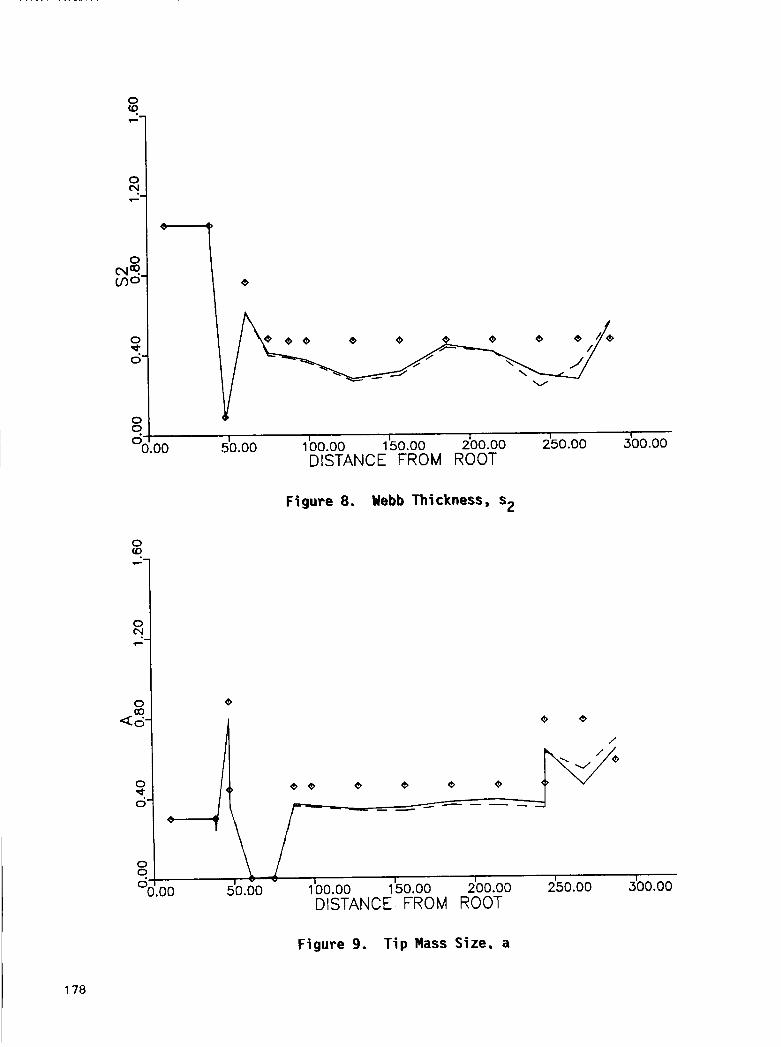
0
0' t
178
1 1 1 1 1 300.00 1 200.00 250.00 .oo 50.00 100.00 150.00
DISTANCE FROM ROOT
Figure 8. Webb Thickness, s2
Q
1
I " " 1 1 1 1 30 50.00 lbO.00 150.00 200.00 250.00 300.00 DISTANCE FROM ROOT
Figure 9. T i p Mass Size, a
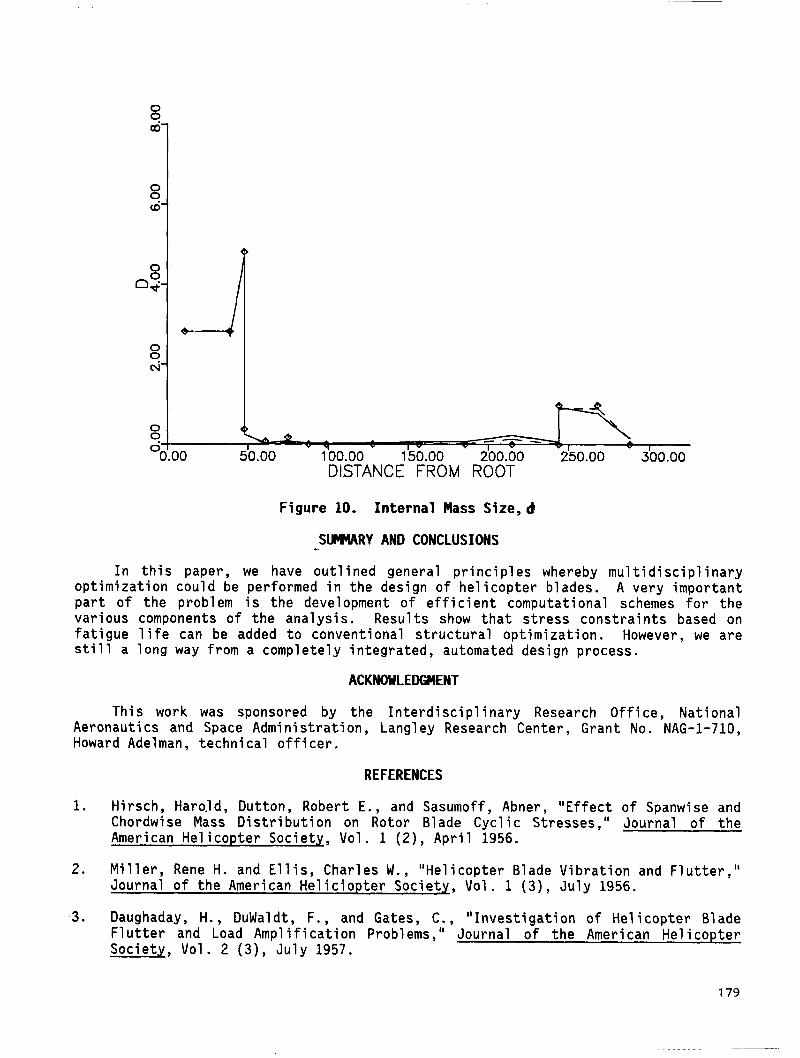
DISTANCE FROM ROOT
Figure 10. Internal Mass S i z e , d
S W R Y AND CONCLUSIONS
In this paper, we have outlined general principles whereby multidisciplinary optimization could be performed in the design of helicopter blades. A very important part of the problem is the development of efficient computational schemes for the various components of the analysis. Results show that stress constraints based on fatigue life can be added to conventional structural optimization. However, we are still a long way from a completely integrated, automated design process.
ACKNOWLEDGMENT
This work was sponsored by the Interdisciplinary Research Office, National Aeronauti cs and Space Admi ni strati on, Langl ey Research Center, Grant No. NAG-1-710, Howard Adelman, technical officer.
REFERENCES
1. Hirsch, Harold, Dutton, Robert E., and Sasumoff. Abner, "Effect of banwise and Chordwi se Mass- Di stri buti on on Rotor B1 ade Cycl i c Stresses ,I' Journal o f the American Helicopter Society, Vol. 1 (Z), April 1956.
2. Miller, Rene H. and Ellis, Charles W., "Helicopter Blade Vibration and Flutter," Journal of the American Heliciopter Society, Vol. 1 ( 3 ) , July 1956.
3. Daughaday, H . , DuWaldt, F., and Gates, C., "Investigation of He1 icopter Blade Flutter and Load Amp1 ification Problems," Journal o f the American .He1 icopter Society, Vol. 2 ( 3 ) , July 1957.
179

4.
5.
6.
7.
8.
9.
10.
11.
12.
13.
14.
15.
180
Bielawa, Richard L., "Techniques for Stability Analysis and Design Optimization with Dynami c Constraints of Nonconservati ve Li near Systems, I' AIAA/ASME 12 SDM Conference, Anaheim, California, April 19-21, 1971, AIAA Paper No. 71-388.
Taylor, Robert 6. , "He1 i copter Vi brati on Reduction by Rotor 61 ade Modal Shap- ing," Proceedings of the 38th Annual National Forum of the American Helicopter Society, Anaheim, California, May 1982.
Friedmann. P.P. and Shanthakumaran, P., "Optimum Design o f Rotor Bades for Vibration' Reduction," Journal of the American He1 i c o p t 6 Society, Vol. 29(4), October 1984, pp. 70-80.
Peters, David A., ROSSOW, Mark P., Korn, Alfred, and K O , Timothy, "Design o f He1 i copter Rotor B1 ades for Optimum Dynamic Characteristics ,I' Computers and Mathematics with Applications, Vol. 12(1), 1986, pp. 85-109.
Walsh, Joanne L., Bingham, Gene J., and Riley, Michael F., "Optimization Methods Applied to the Aerodynamic Design of Helicopter Rotor Blades," Journal of %he American Helicopter Society, Vol. 32(4), October 1987, pp. 39-44.
Chattopadhyay, Aditi and Walsh, Joanne L., "Minimum Weight Design o f Rectangular and Tapered Helicopter Rotor Blades with Frequency Constraints," Second Interna- tional Conference on Rotorcraft Basic Research, University of Maryland, February 1988.
Pritchard, J. and Adelman, H., "Optimal Placement of Tuning Masses for Vibration Reduction in He1 i copter Rotor 61 ades, 'I Second International Conference on Rotorcraft Basic Research, University of Maryland, February 1988.
Lim, Joon W. and Chopra, Inderjit, "Aeroelastic Optimization of a Helicopter Rotor," Proceedings of the 44th Annual National Forum of the American Helicopter Society, Washington, DC, June 16-18, 1988.
Weller, W.H. and David, M.W., "Experimental Verification o f Helicopter Blade Design Optimization for Minimum Vibration," Proceedings of the 44th Annual National Forum of the Ameri can He1 i copter Society , Washington, DC, June 16-18, 1988.
Noback, R., "State of the Art and Statistical Aspects of Helicopter Fatigue Substantiation Procedures," Helicopter Fatigue Life Assessment, AGARD Conference Proceedings No. 297, also presented at the 51st Meeting of the AGARD Structures and Materials Panel, Air-in-Provence, France, September 14-19, 1980.
McDermott, John, "The Methodology of Fatigue Analysis and Testing - Main Rotor 61 ade and Hub - Hughes YAH-64 Advanced Attack He1 i copter, I' He1 i copter Fati que Life Assessment, AGARD Conference Proceedings No. 297, also presented at the 51st Meeting of the AGARD Structures and Materi a1 s Panel , Ai r-en-Provence, France, September 14-19, 1980.
Escul i er , J. and Bousman, W . G. , "Cal cul ated and Measured B1 ade Structural Response on a Full Scale Rotor," Journal of the American Helicopter Society, Vol . 33( 1), January 1988.

N89- 2 5 1 5 4
TRANSONIC AIRFOIL DESIGN FOR HELICOPTER
ROTOR APPLICATIONS
Ahmed A. Hassan and B. Jackson McDonnell Douglas Helicopter Company
Mesa, Arizona
181
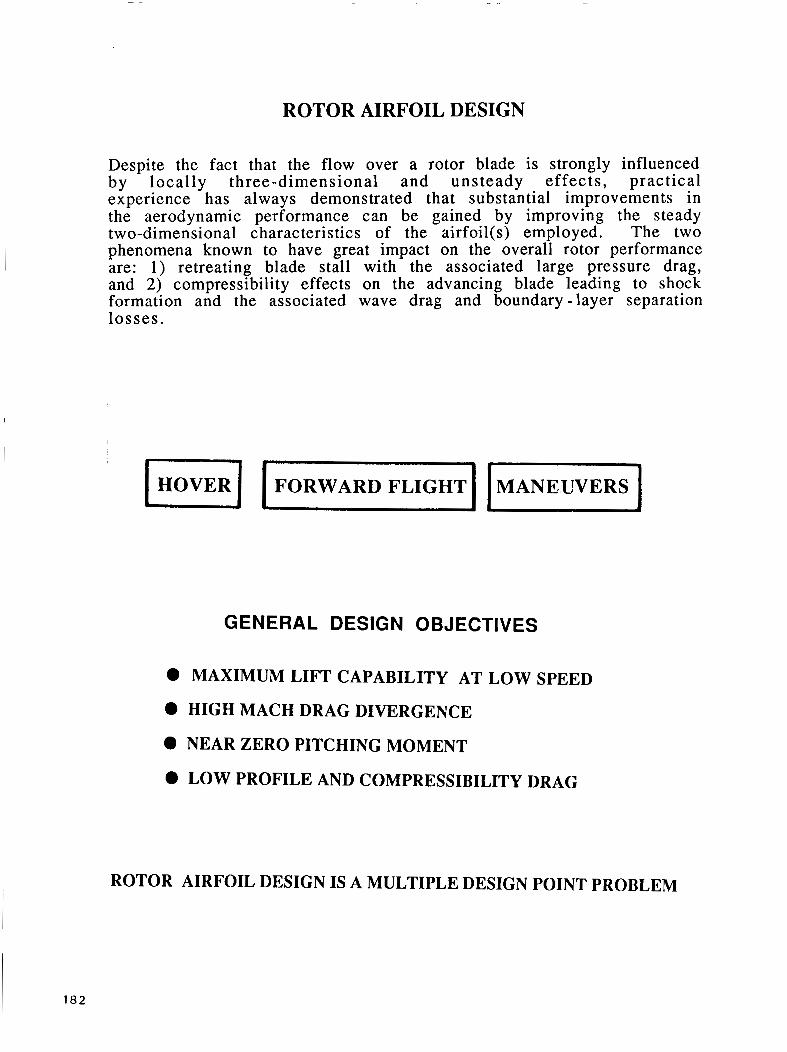
ROTOR AIRFOIL DESIGN
Despite the fact that the flow over a rotor blade is strongly influenced by locally three-dimensional and unsteady effects, practical experience has always demonstrated that substantial improvements in the aerodynamic performance can be gained by improving the steady two-dimensional characteristics of the airfoil(s) employed. The two phenomena known to have great impact on the overall rotor performance are: 1 ) retreating blade stall with the associated large pressure drag, and 2) compressibility effects on the advancing blade leading to shock formation and the associated wave drag and boundary - layer separation losses.
GENERAL DESIGN OBJECTIVES
0 MAXIMUM LIFT CAPABILITY AT LOW SPEED
0 HIGH MACH DRAG DIVERGENCE
0 NEAR ZERO PITCHING MOMENT
0 LOW PROFILE AND COMPRESSIBILITY DRAG
ROTOR AIRFOIL DESIGN IS A MULTIPLE DESIGN POINT PROBLEM
182
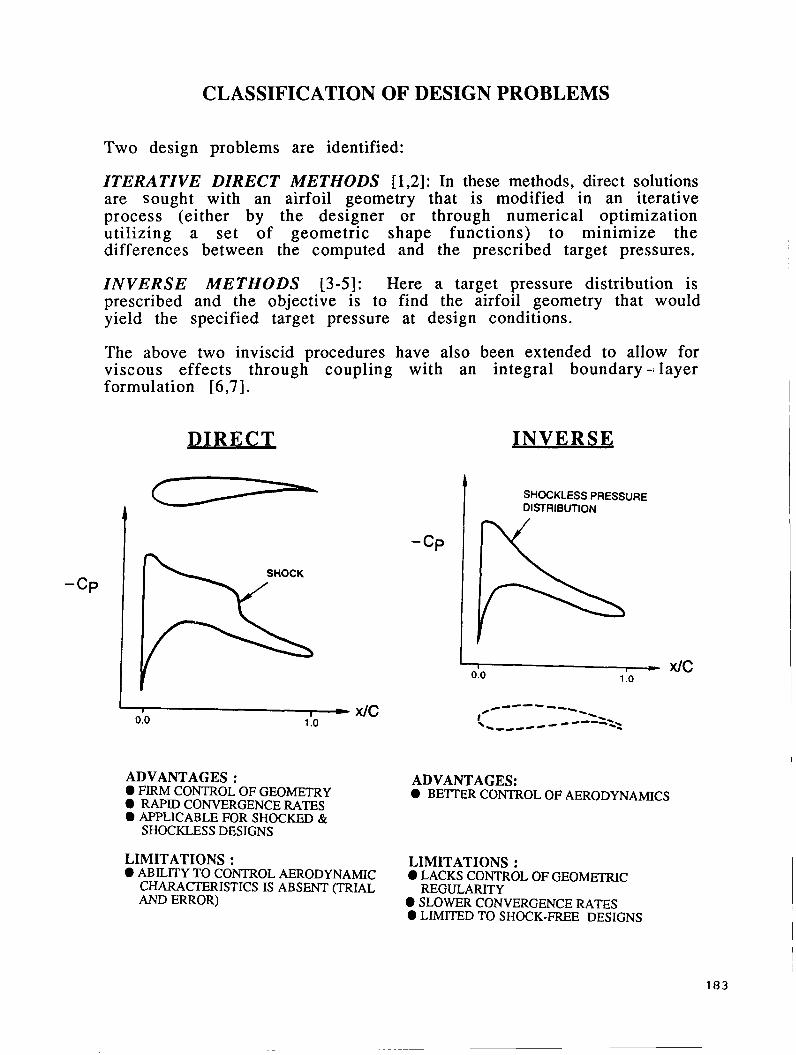
CLASSIFICATION OF DESIGN PROBLEMS
Two design problems are identified:
ITERATIVE DIRECT METHODS [ 1,2]: In these methods, direct solutions are sought with an airfoil geometry that is modified in an iterative process (either by the designer or through numerical optimization utilizing a set of geometric shape functions) to minimize the differences between the computed and the prescribed target pressures.
INVERSE METHODS [3-51: Here a target pressure distribution is prescribed and the objective is to find the airfoil geometry that would yield the specified target pressure at design conditions.
The above two inviscid procedures have also been extended to allow for viscous effects throug6 coupling with an formulation [6,7].
DIRECT
integral boundary -I layer
INVERSE
SHOCKLESS PRESSURE DISTRIBUTION
I z
0.0 1 .o
1 I -x/c 0.0 1 .o
ADVANTAGES : 0 FIRM CONTROL OF GEOMETRY 0 RAPID CONVERGENCE RATES 0 APPLICABLE FOR SHOCKED &
SHOCKLESS DESIGNS
LIMITATIONS : 0 ABILITY TO CONTROL AERODYNAMIC
CHARACTERISTICS IS ABSENT (TRIAL AND ERROR)
ADVANTAGES: 0 BETTER CONTROL OF AERODYNAMICS
LIMITATIONS : 0 LACKS CO”%OL OF GEOMETRIC
REGULARITY 0 SLOWER CONVERGENCE RATES 0 LIMITED TO SHOCK-FREE DESIGNS
x/C
183
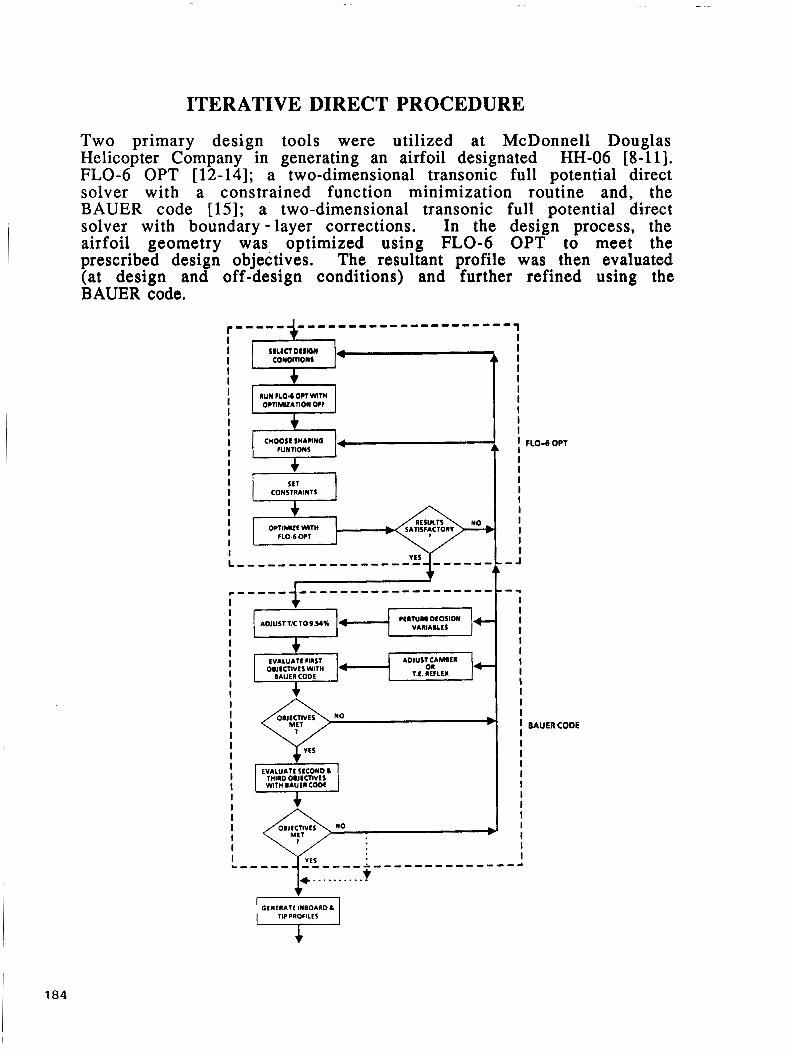
ITERATIVE DIRECT PROCEDURE
Two primary design tools were utilized at McDonnell Douglas Helicopter Company in generating an airfoil designated "-06 [8-111. FLO-6 OPT [ 12-14]; a two-dimensional transonic full potential direct solver with a constrained function minimization routine and, the BAUER code [15]; a two-dimensional transonic full potential direct solver with boundary - layer corrections. In the design process, the airfoil geometry was optimized using FLO-6 OPT to meet the prescribed design objectives. The resultant profile was then evaluated (at design and off-design conditions) and further refined using the BAUER code.
I I !
I
EVALUATf FIRST
I I I
I ' I I 9-4 I 'I BAUERCODE
I I
I I I I Y f S i 1 f V A L U A T F 6 THIRD OOJEcIIVf5 1
WITH IIAUERCODE
I I I I i I I I 0-J i
I I I I
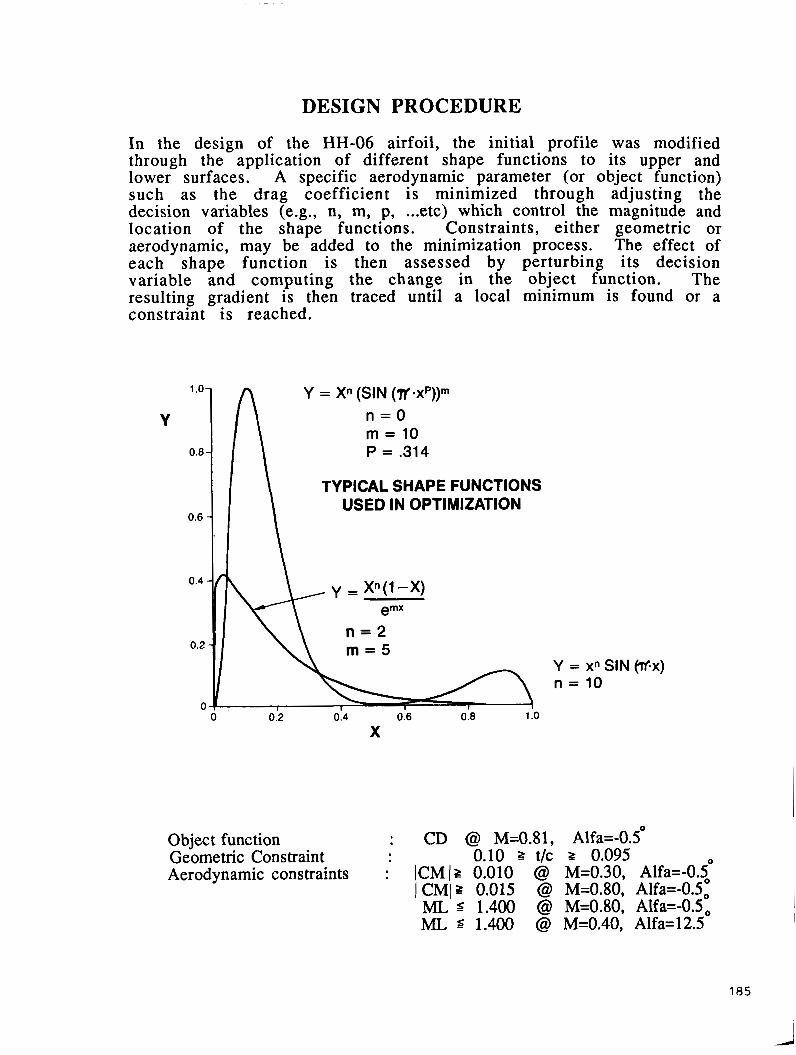
DESIGN PROCEDURE
In the design of the "-06 airfoil, the initial profile was modified through the application of different shape functions to its upper and lower surfaces. A specific aerodynamic parameter (or object function) such as the drag coefficient is minimized through adjusting the decision variables (e.g., n, m, p, ... etc) which control the magnitude and location of the shape functions. Constraints, either geometric or aerodynamic, may be added to the minimization process. The effect of each shape function is then assessed by perturbing its decision variable and computing the change in the object function. The resulting gradient is then traced until a local minimum is found or a constraint is reached.
Y = X" (SIN (V-XP))~
n = O m = 10
0.8 P = .314
TYPICAL SHAPE FUNCTIONS
Y
0 . 4 I \ USED IN OPTIMIZATION
y = X"(1-X) emx
II n = 2 m = 5
0 0.2 0.4 0.6 0.8 1 .o X
Y = n =
xn SIN 10
Object function : CD @ M=0.81, Alfa=-0S0 Geometric Constraint 0.10 B t/c z 0.095 Aerodynamic constraints :' ICM 12 0.010 @ M=0.30, Alfa=-OSO
1 CMIZ 0.015 @ M=0.80, Alfa=-O.5: ML d 1.400 @ M=0.80, Alfa=-0.5, ML 1.400 @ M=0.40, Alfa=l2.5
185
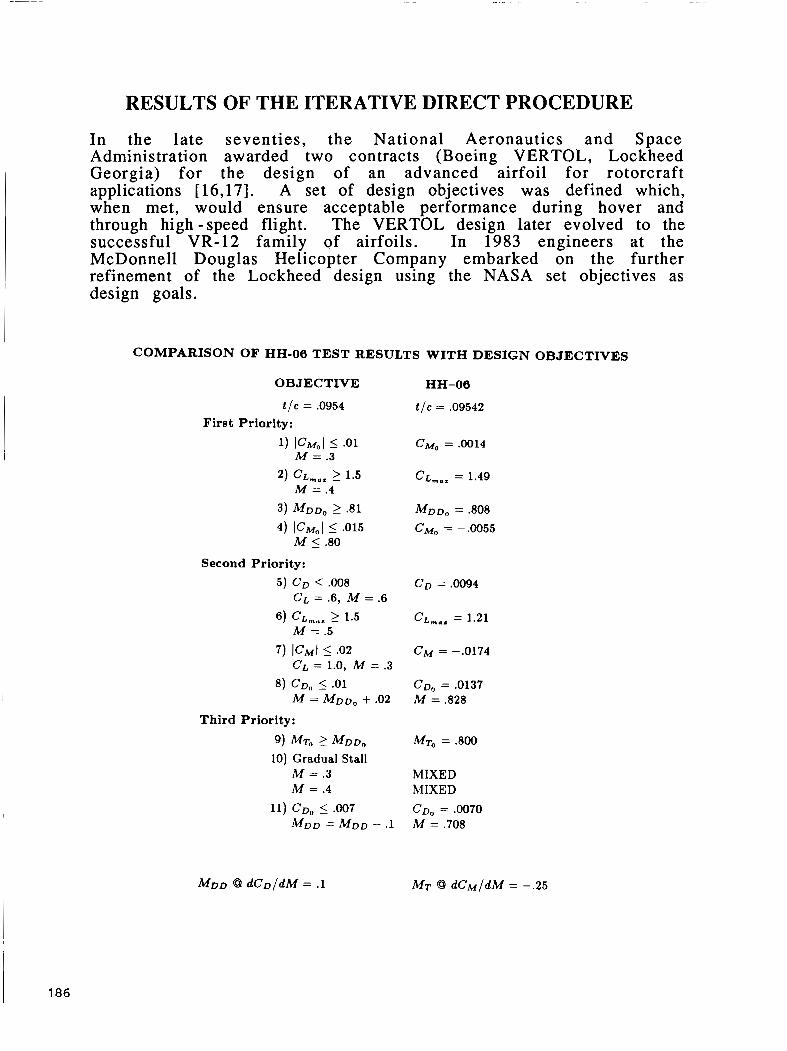
RESULTS OF THE ITERATIVE DIRECT PROCEDURE
In the late seventies, the National Aeronautics and Space Administration awarded two contracts (Boeing VERTOL, Lockheed Georgia) for the design of an advanced airfoil for rotorcraft applications [16,17]. A set of design objectives was defined which, when met, would ensure acceptable performance during hover and through high -speed flight. The VERTOL design later evolved to the successful VR-12 family of airfoils. In 1983 engineers at the McDonnell Douglas Helicopter Company embarked on the further refinement of the Lockheed design using the NASA set objectives as design goals.
COMPARISON OF "-00 TEST RESULTS WITH DESIGN OBJECTIVES
OBJECTIVE
t / c = .0954 First Priority:
1) ICMoI 5 s o 1 M = .3
M = .4 2) C L ~ ~ , 2 1.5
3 ) M D D , 2 -81 4 ) ICM,,I I ,015
M 5 .80
Second Priority: 5) C D 5 .008
CL = .6, M = .6 6) CL,,.,,~ 2 1.5
M = .5
7 ) l c M l 5 -02 CL = 1.0, M = .3
8 ) CDe 5 -01 M = MDD,, + .02
Third Priority:
9) MTn 2 MODO 10) Gradual Stall
M = .3 M = .4
1 1 ) C D , 5 .007 M D D = M D D - . 1
"-00
t / c = .09542
C M ~ = .0014
CL,,. = 1.21
Ct,g = -.0174
C D , = ,0137 M = ,828
MT, = ,800
MIXED MIXED C D , = .0070 M = .708
186
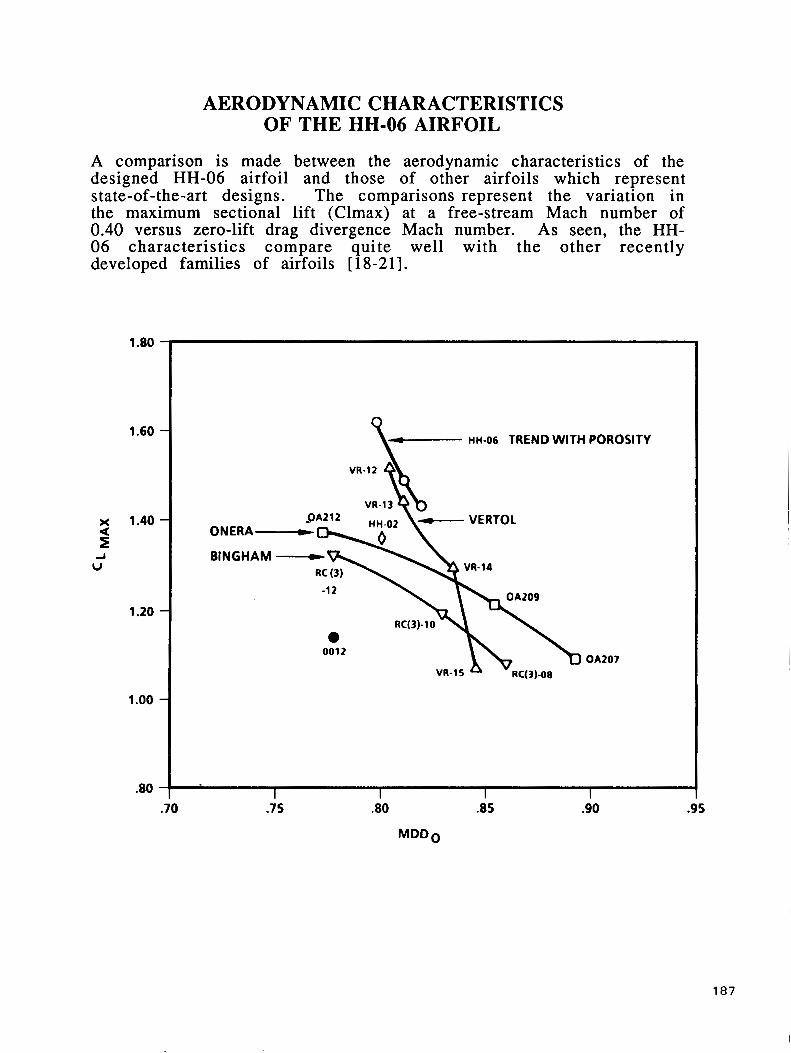
AERODYNAMIC CHARACTERISTICS OF THE "-06 AIRFOIL
A comparison is made between the aerodynamic characteristics of the designed "-06 airfoil and those of other airfoils which represent state-of-the-art designs. The comparisons represent the variation in the maximum sectional lift (Clmax) at a free-stream Mach number of 0.40 versus zero-lift drag divergence Mach number. As seen, the HH- 06 characteristics compare quite well with the other recently developed families of airfoils [ 18-21].
1.80
1.60
x 1.40
2 A U
1.20
1 .oo
3 0
- HH-06 TREND WITH POROSITY \ SA212 VERT01
ONERA-
BINCHAM - 0012
OA207
.70 .75 .80 .85 .90 .95
MODO
187
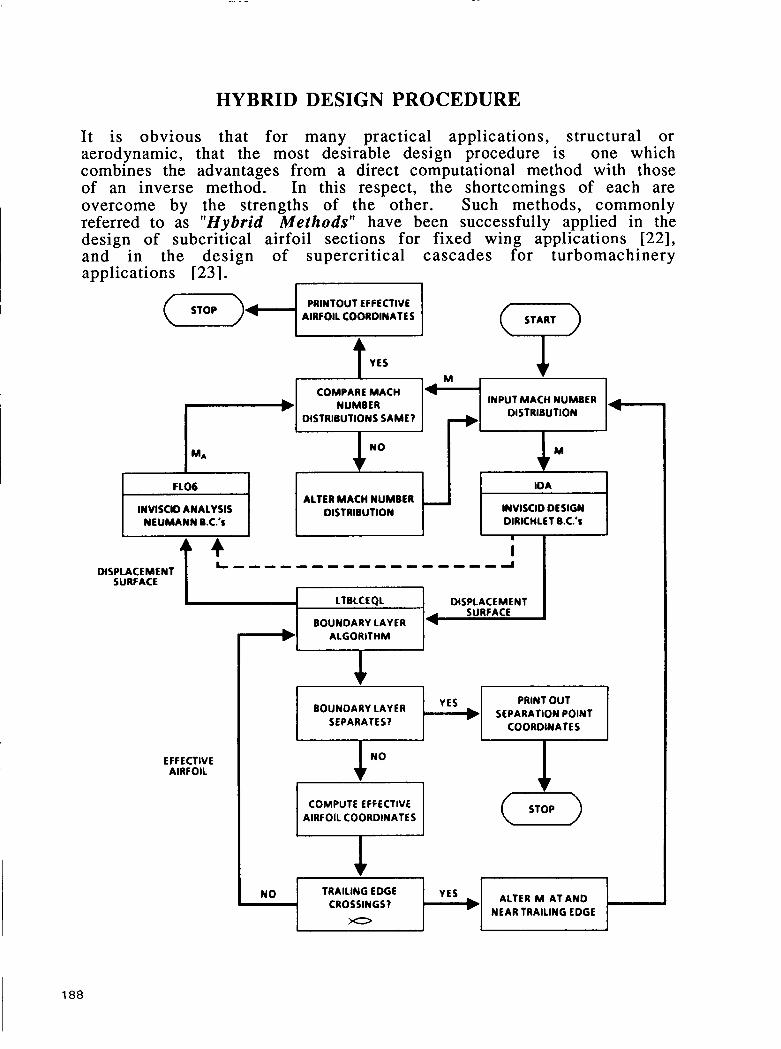
HYBRID DESIGN PROCEDURE
It is obvious that for many practical applications, structural or aerodynamic, that the most desirable design procedure is one which combines the advantages from a direct computational method with those of an inverse method. In this respect, the shortcomings of each are overcome by the strengths of the other. Such methods, commonly referred to as "Hybrid Methods" have been successfully applied in the design of subcritical airfoil sections for fixed wing applications [22], and in the design of supercritical cascades for turbomachinery applications [23].
PRINTOUT EFFECTIVE AIRFOIL COORDINATES
I I
INPUT MACH NUMBER DISTRIBUTION
COMPARE MACH
DISTRIBUTIONS SAME?
M A
INVISCID DESIGN DIRICHLET n.c:s
FLO6 ALTER MACH NUMBER -
INVISCID ANALYSIS DISTRIBUTION NEUMANNB.~:~
1 I I 1
4 4 1 I DISPLACEMENT 1. SURFACE I LTBLCEQL
BOUNDARY LAYER
EFFECTIVE AIRFOIL
ALGORITHM -+ I * 1 I
1 1 EOUNDARYLAYER 1 '1 S E P ~ ~ ~ ~ ~ ~ o I N T
SEPARATES? COORDINATES
COMPUTE EFFECTIVE AIRFOIL COORDINATES
1 (7) 1
ALTER M ATANO NEAR TRAILING EDGE
CROSSINGS?
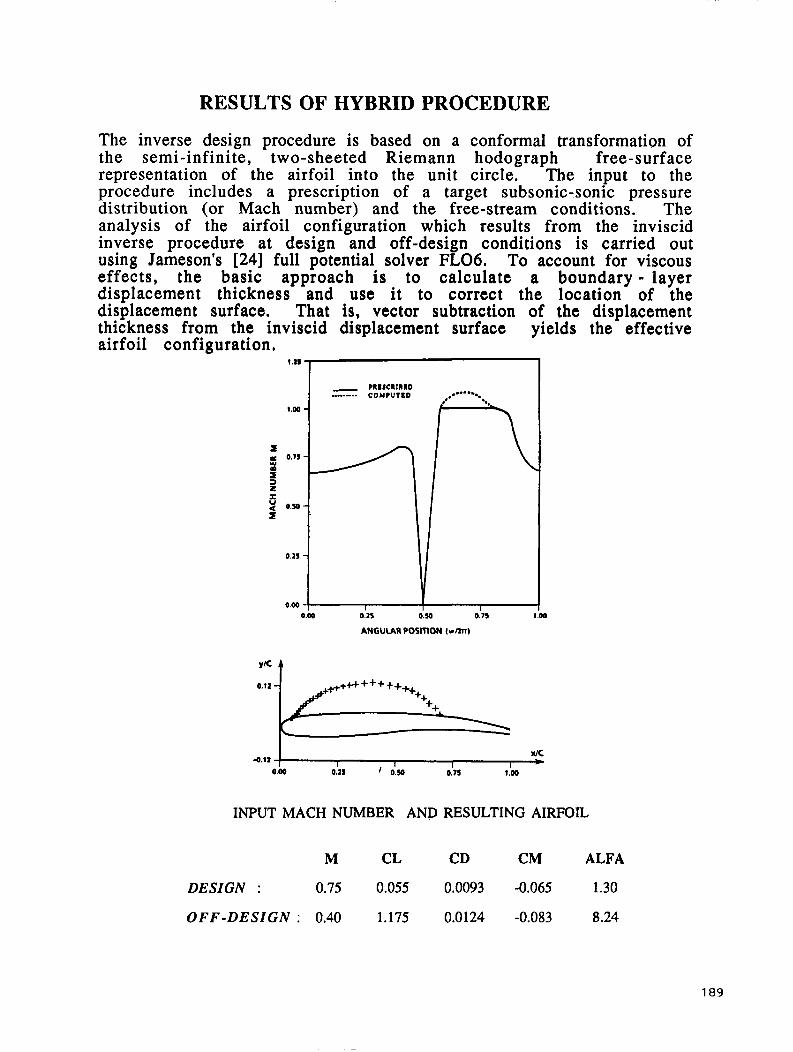
RESULTS OF HYBRID PROCEDURE
The inverse design procedure is based on a conformal transformation of the semi-infinite, two-sheeted Riemann hodograph free-surface representation of the airfoil into the unit circle. The input to the procedure includes a prescription of a target subsonic-sonic pressure distribution (or Mach number) and the free-stream conditions. The analysis of the airfoil configuration which results from the inviscid inverse procedure at design and off-design conditions is carried out using Jameson's [24] full potential solver FL06. To account for viscous effects, the basic approach is to calculate a boundary - layer displacement thickness and use it to correct the location of the displacement surface. That is, vector subtraction of the displacement thickness from the inviscid displacement surface yields the effective airfoil configuration.
0.00 0.21 0.W 0.75 1
ANGUIAR POSITION l w m )
Y K 4
Q
XIC -0.12 , I I I t
0.00 0.31 ' oh 0.75 1.00
INPUT MACH NUMBER AND RESULTING AIRFOIL
M CL CD CM ALFA
DESIGN : 0.75 0.055 0.0093 -0.065 1.30
OFF-DESIGN 0.40 1.175 0.0124 -0.083 8.24
189
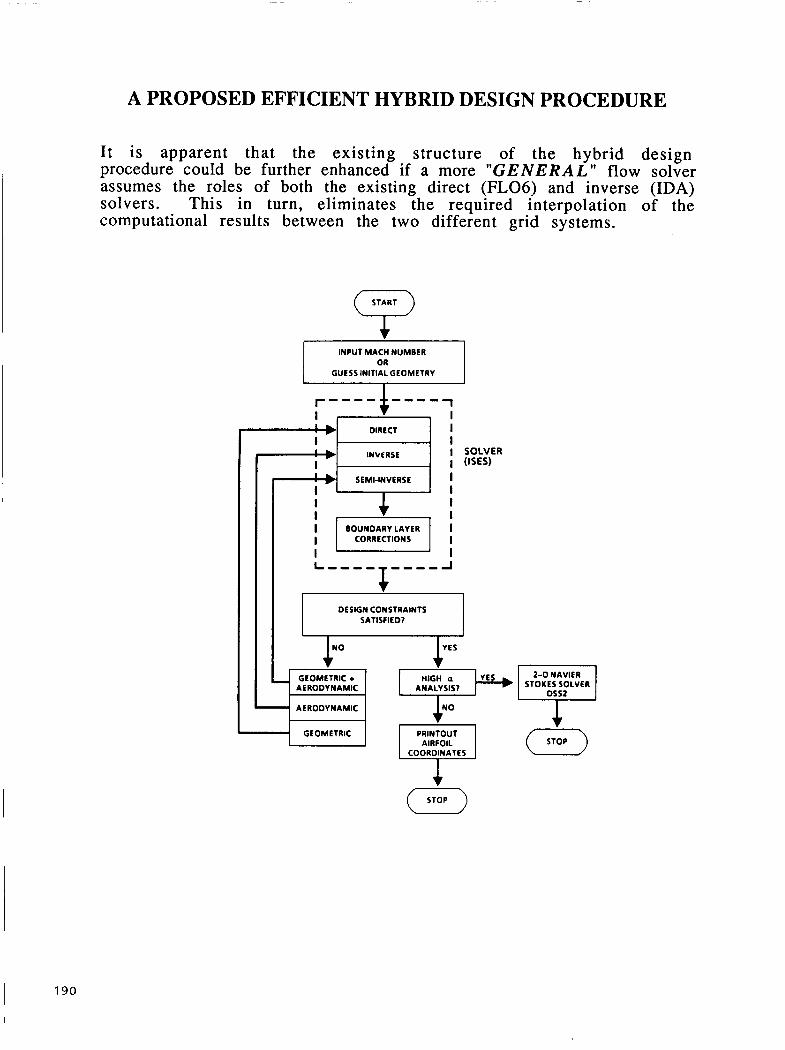
190
A PROPOSED EFFICIENT HYBRID DESIGN PROCEDURE
It is apparent that the existing structure of the hybrid design procedure could be further enhanced if a more "GENERAL" flow solver assumes the roles of both the existing direct (FL06) and inverse (IDA) solvers. This in turn, eliminates the required interpolation of the computational results between the two different grid systems.
START cr' INPUT MACH NUMBER
GUESS INITIAL GEOMETRV
1 I I I I SOLVER
I I I I I I I
I (ISES)
I I I I DESIGNCONSTRAINTS I ~ --.--.---
I l l , + I I '1 GEOMETRIC + 1 1 A;Hl;s;s, AERODVNAMIC
AERODYNAMIC
GEOMETRIC PRINTOUT AIRFOIL
COORDINATES
2-0 NAVIER STOKES SOLVER
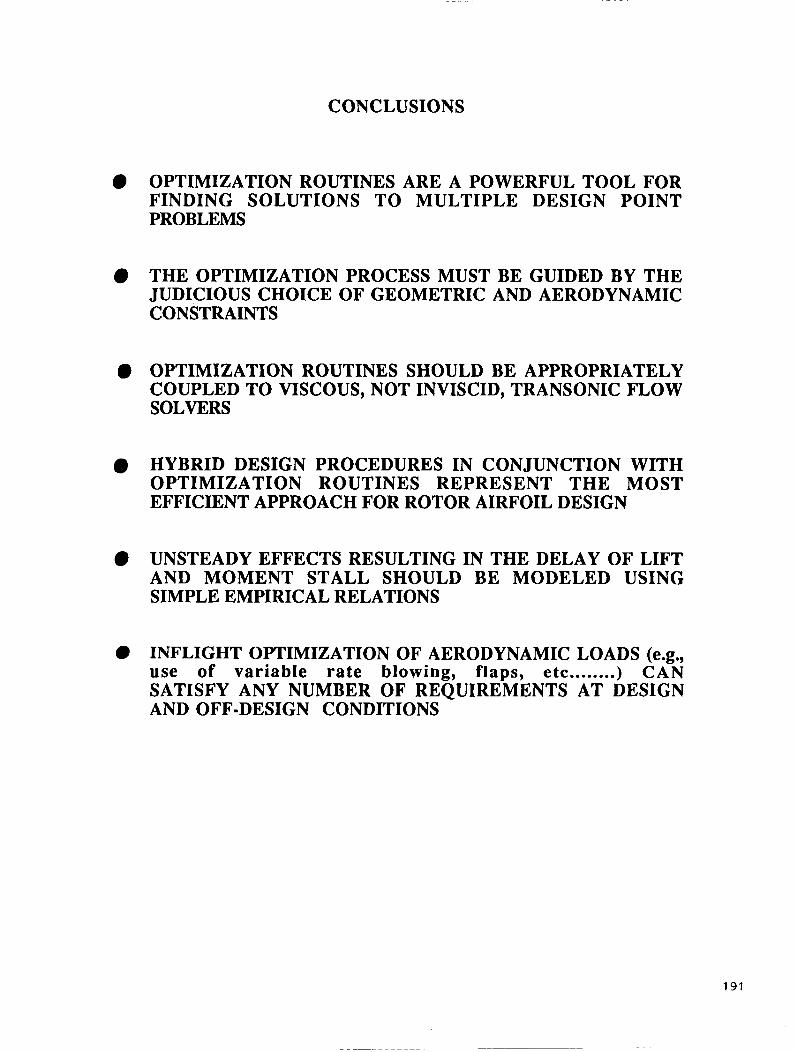
CONCLUSIONS
0 OPTIMIZATION ROUTINES ARE A POWERFUL TOOL FOR FINDING SOLUTIONS TO MULTIPLE DESIGN POINT PROBLEMS
0 THE OPTIMIZATION PROCESS MUST BE GUIDED BY THE JUDICIOUS CHOICE OF GEOMETRIC AND AERODYNAMIC CONSTRAINTS
0 OPTIMIZATION ROUTINES SHOULD BE APPROPRIATELY COUPLED TO VISCOUS, NOT INVISCID, TRANSONIC FLOW SOLVERS
HYBRID DESIGN PROCEDURES IN CONJUNCTION WITH OPTIMIZATION ROUTINES REPRESENT THE MOST EFFICIENT APPROACH FOR ROTOR AIRFOIL DESIGN
0 UNSTEADY EFFECTS RESULTING IN THE DELAY OF LIFT AND MOMENT STALL SHOULD BE MODELED USING SIMPLE EMPIRICAL RELATIONS
0 INFLIGHT OPTIMIZATION OF AERODYNAMIC LOADS (e.g., use of variable rate blowing, flaps, etc ........) C A N SATISFY ANY NUMBER OF REQUIREMENTS AT DESIGN AND OFF-DESIGN CONDITIONS
191
REFERENCES
1. Volpe, G. and Melnik, R. E. "The Role of Constraints in the Inverse Design Problem for Transonic Airfoils," AIAA Paper 8 1 - 1233, June 1981.
2. Hicks, R. M. and Vanderplaats, G. N. "Application of Numerical Optimization to the Design of Supercritical Airfoils Without Drag Creep," SAE Paper 770440, March 1977.
~
3. Hassan, A. A,, Sobieczky, H. and Seebass, A. R. "Subsonic Airfoils With a Given Pressure Distribution," AIAA J,, Vol, 22, No. 9, pp. 1185- I
1 19 1, September 1984.
4. Bauer, F., Garabedian, P. and Korn, D. "Supercritical Wing Sections 111," Lecture Notes in Economics and Mathematical Systems, Springer Verlag, New York, 1977.
5. Hassan, A. A., Sobieczky, H. and Seebass, A. R. "Shock-Free Transonic Airfoils with a Given Pressure Distribution," Computer Methods in Applied Mechanics and Engineering, Vol. 58, pp. 285-304, 1986.
6. Hassan, A. A. "The Design of Shock-Free Supercritical Airfoils Including Viscous Effects," Communications In Applied Numerical Methods, Vol. 2, pp. 37-45, 1986.
7. Melnik, R. E., Mead, H. R. and Jameson, A. A Multi-Grid Method for the Computation of Viscid/Inviscid Interactions on Airfoils," AIAA Paper 83-0234, January 1983.
8. Jackson, B. "Wind Tunnel Report for the Development of Airfoils for MDHC," McDonnell Douglas Helicopter Company Technical Report ATN 86-018, February 1986.
9. Wegryn, S. J. "BSWT 602 A Supersonic Wind Tunnel Test of Nine Two-Dimensional Airfoils," Boeing Report Number D6-52979, October 1985.
10, Brown, B. "Two-Dimensional Wind Tunnel Tests of Hughes Helicopter Inc. Airfoils "-01, "-02, and CR-2961 (Data Release),"
~
Lockheed Report LR-3053 1 (S-434), September 1983.
11. Prouty, R. "Wind Tunnel Report of Potential HARP Airfoils," Hughes Helicopters Report 150-A-1015.
12. Vanderplaats, G. N. "CONMIN - A FORTRAN Program for Constrained Function Minimization," NASA TM-X-62282, 1973.
13. Hicks, R. and Vanderplaats, G. N. "Application of Numerical Optimization to the Design of Low Speed Airfoils," NASA TM-X-3213, March 1975.
14. Hicks, R. and Vanderplaats, G. N. "Airfoil Section Drag Reduction at Transonic Speeds by Numerical Optimization," Presented at the Society of Automotive Engineers, Business Aircraft Meeting, April 1976.
15. Bauer, F., Garabedian, P., and Korn, D. "Supercritical w i n g Sections 11," Lecture Notes in Economics and Mathematical Systems, Volume 108, Springer Verlag, 1975.
16. Blackwell, J. and Hinson, B. "The Aerodynamic Design of an Advanced Rotor Airfoil," NASA CR-2961, May 1977.
17. Dadone, L. "Design and Analytical Study of a Rotor Airfoil," NASA Report CR-2988, 1978.
18. Thibert, J. and Gallot, J. "Advanced Research on Helicopter Blade Airfoils," Vertica, Vol. 5, No. 3, 1981.
19. McVeigh, M. and MuHugh, F. "Recent Advances in Rotor Technology at Boeing VERTOL," Presented at the American Helicopter Society Forum, May 1982.
20. Bingham, G. and Noonan, K. "Two-Dimensional Aerodynamic Characteristics of Three Rotorcraft Airfoils at Mach Numbers from 0.35 to 0.90," NASA TP-2000, March 1982.
21. Wortmann, F. X. and Drees, J. M. "Design of Airfoils for Rotors," Presented at CAL/AVLABS Symposium on Aerodynamics of Rotary Wing and VTOL Aircraft, 1969.
22. Hassan, A. A. "A Viscous-Inviscid Coupling Method for the Design of Low Reynolds Number Aerofoil Sections," Communications In Applied Numerical Methods, Vol. 2, pp. 419-427, 1986.
23. Ives, D. C. "Inverse and Hybrid Cascade Design Methods," Proc. Int. Conf. on Inverse Design Concepts in Engineering Sciences (ICIDES), Austin, Texas, pp. 555-572, 1984.
24. Jameson, A. "Iterative Solution of Transonic Flows Over Aerofoils and Wings, Including Flows at Mach 1," Comm. Pure Appl. Math., Vol. 27, pp. 283-309, 1974.
193
N89- 25155 .r
EFFICIENT SENSITIVITY ANALYSIS AND OPTIMIZATION OF A HELICOPTER ROTOR
J. W. Lim and
I. Chopra Center for Rotorcraft Education and Research
Department of Aerospace Engineering University of Maryland 'Jollege Park, Maryland
PRECEDING PAGE BLANK NOT FILMED
195
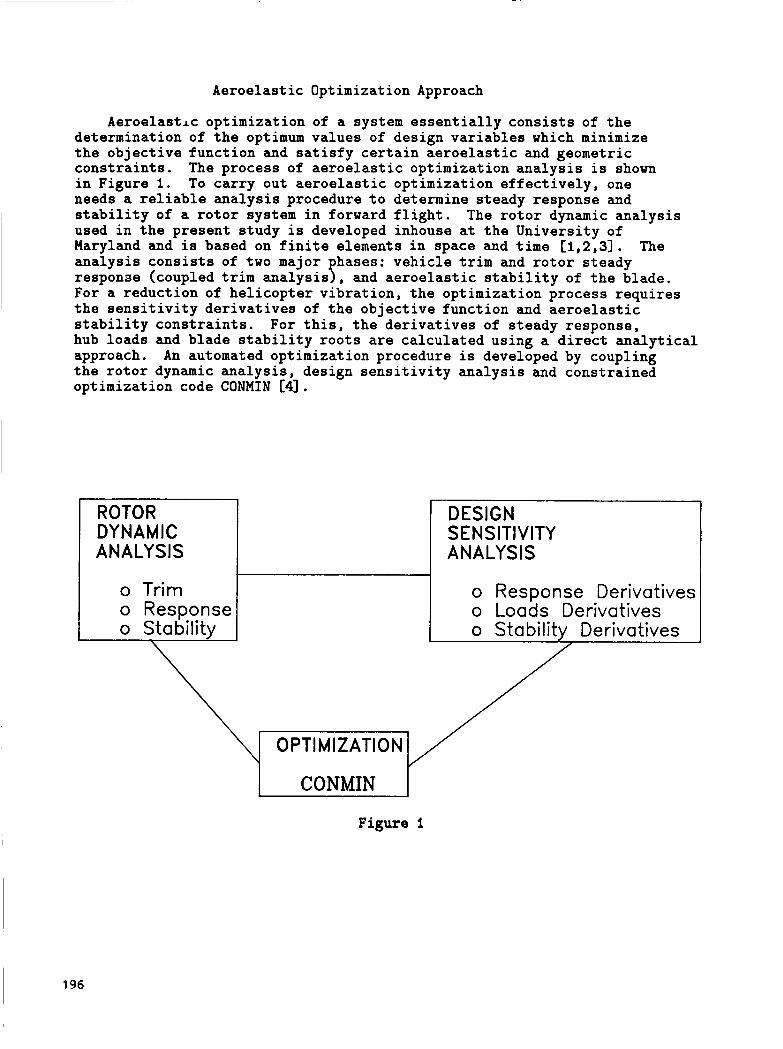
Aeroelas t ic Optimization Approach
ROTOR DYNAMIC ANALYSIS
o Trim o Response o Stability
Aeroelastrc opt imizat ion of a system e s s e n t i a l l y c o n s i s t s of t h e determination of t h e optimum values of design v a r i a b l e s which minimize t h e o b j e c t i v e f u n c t i o n and s a t i s f y c e r t a i n a e r o e l a s t i c and geometric c o n s t r a i n t s . The process of a e r o e l a s t i c opt imizat ion a n a l y s i s is shown i n Figure 1. To c a r r y out a e r o e l a s t i c opt imizat ion e f f e c t i v e l y , one needs a r e l i a b l e a n a l y s i s procedure t o determine s teady response and s t a b i l i t y of a r o t o r system i n forward f l i g h t . used i n t h e present s tudy is developed inhouse at t h e Universi ty of Maryland and is based on f i n i t e elements in space and time [1,2,31. a n a l y s i s c o n s i s t s of two major phases: v e h i c l e t r i m and r o t o r s teady response (coupled t r i m a n a l y s i s ) , and a e r o e l a s t i c s t a b i l i t y of t h e blade. For a reduct ion of h e l i c o p t e r v i b r a t i o n , t h e opt imizat ion process r e q u i r e s t h e s e n s i t i v i t y d e r i v a t i v e s of t h e o b j e c t i v e f u n c t i o n and a e r o e l a s t i c s t a b i l i t y c o n s t r a i n t s . For t h i s , t h e d e r i v a t i v e s of s teady response, hub loads and blade s t a b i l i t y r o o t s are c a l c u l a t e d using a d i r e c t a n a l y t i c a l approach. An automated opt imizat ion procedure is developed by coupling t h e r o t o r dynamic a n a l y s i s , design s e n s i t i v i t y a n a l y s i s and constrained opt imizat ion code CONMIN C41.
The r o t o r dynamic a n a l y s i s
The
DESIGN S EN S IT1 VlTY AN A LY S I S
o Response Derivatives o Loads Derivatives o Stability Derivatives
Figure 1

Coupled Trim Analysis
- - ,-\
/ \ \ - \ / - \ / \ / \ /
/
Coupled trim analysis in forward flight consists of calculation of vehicle trim (propulsive), blade steady response and hub loads. vehicle trim solution determines the control settings and vehicle attitude for the prescribed flight condition. nonlinear vehicle force and moment equilibrium equations. steady response solution involves the determination of time dependent blade deflections at different azimuth locations. The blade is assumed as an elastic beam undergoing flap bending, lag bending, elastic twist and axial deflections, and is discretized into a number of beam elements. To reduce computation time, a large number of finite-element equations are transformed to a few (typically eight) normal mode equations.- These nonlinear periodic equation8 are then solved for rteady response using a finite-element method in time formulated from Hamilton’s weak principle. The hub loads are obtained using a force summation approach. coupled trim analyrir, the vehicle trim and rotor rerponre equations are solved iteratively as one coupled solution uring a modified Newton method. the overall force and moment equations of the vehicle. Figure 2 shows the blade steady flap response at tip for an advance ratio of 0.3. a completely trimmed condition, there is no unbalanced force or moment acting on the hub, and the lag and torsion responses consist primarily of l/rev amplitudes, whereas the flap response is dominated by 2/rev amplitude.
The
It is calculated from the overall The blade
For the
The converged trim and response solutions satisfy simultaneously
For
BLADE FLAP RESPONSE
WTlP - R
.08
.07
.06
.05
.04
I I I 1 90 180 270 360
.03 0
+ ( d e d
Figure 2
197
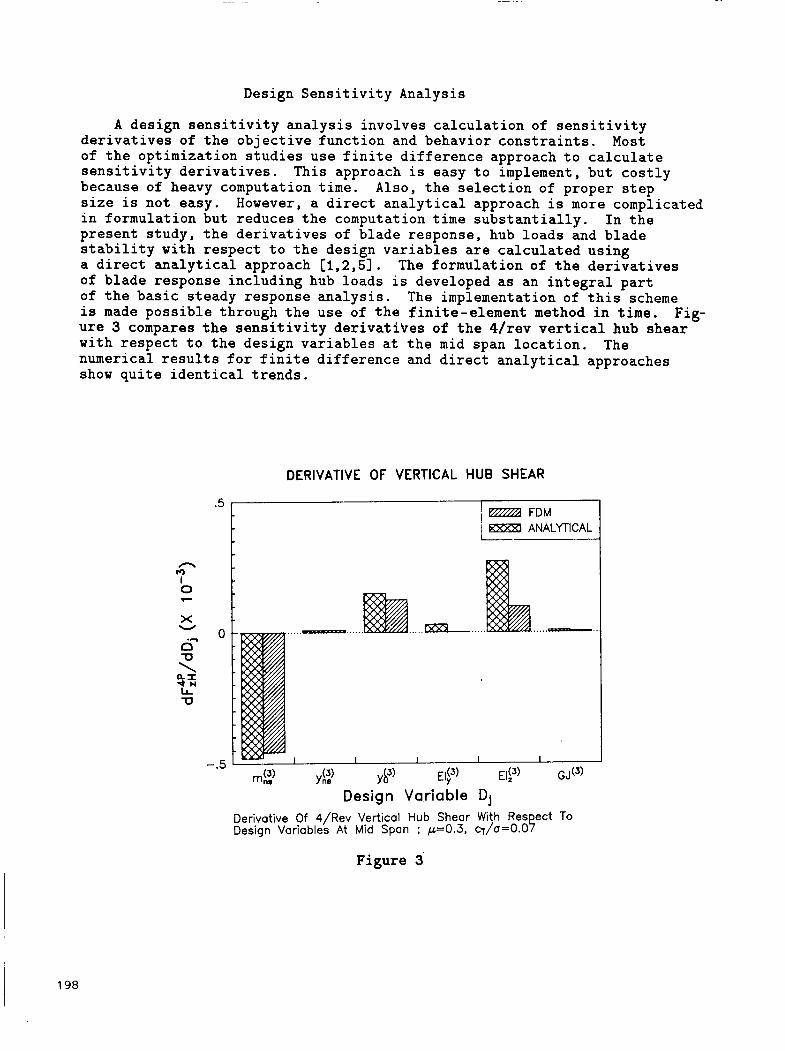
Design S e n s i t i v i t y Analys is
A d e s i g n s e n s i t i v i t y a n a l y s i s i nvo lves c a l c u l a t i o n of s e n s i t i v i t y Most d e r i v a t i v e s of t h e o b j e c t i v e f u n c t i o n and behavior c o n s t r a i n t s .
of t h e o p t i m i z a t i o n s t u d i e s u s e f i n i t e d i f f e r e n c e approach t o c a l c u l a t e s e n s i t i v i t y d e r i v a t i v e s . because of heavy computation t ime. size i s no t easy . i n fo rmula t ion b u t reduces t h e computation t i m e s u b s t a n t i a l l y . p r e s e n t s t u d y , t h e d e r i v a t i v e s of b l a d e response , hub l o a d s and b l a d e s t a b i l i t y w i t h r e s p e c t t o t h e des ign v a r i a b l e s are c a l c u l a t e d u s i n g a direct a n a l y t i c a l approach [1,2,5]. of b l a d e r e sponse i n c l u d i n g hub l o a d s i s developed as an i n t e g r a l p a r t of t h e b a s i c s t e a d y response a n a l y s i s . i s made p o s s i b l e through t h e u s e of t h e f . i n i t e - e l emen t method i n time. u re 3 compares t h e s e n s i t i v i t y d e r i v a t i v e s of t h e 4 / r ev ver t ical hub s h e a r w i t h r e s p e c t t o t h e des ign v a r i a b l e s a t t h e mid span l o c a t i o n . numer ica l r e s u l t s f o r f i n i t e d i f f e r e n c e and d i r e c t a n a l y t i c a l approaches show q u i t e i d e n t i c a l t r e n d s .
Th i s approach i s easy t o implement, b u t c o s t l y Also, t h e s e l e c t i o n of p rope r s t e p
I n t h e However, a d i r e c t a n a l y t i c a l approach is more complicated
The fo rmula t ion of t h e d e r i v a t i v e s
The implementation of t h i s scheme Fig-
The
DERIVATIVE OF VERTICAL HUB SHEAR
.5
.....I__. ...... ...... -. 0
(3) Yb3’ Ely) EI;~) GJ(3) -.5
Yns (3) mns
Design Variable Dj
Derivative Of 4/Rev Vertical Hub Shear With Res ect To Design Variables At Mid Span ; p=0.3, c~/a=o.O 7
F i g u r e 3

CPU Time f o r Design S e n s i t i v i t y Analys is
The s t a b i l i t y s e n s i t i v i t y a n a l y s i s i nvo lves t h e c a l c u l a t i o n of t h e d e r i v a t i v e s of b l a d e s t a b i l i t y r o o t s , and aga in c o n s t i t u t e s an i n t e g r a l p a r t of t h e b a s i c s t a b i l i t y a n a l y s i s . For t h i s , t h e F loquet t ' r a n s i t i o n m a t r i x is extended t o i n c l u d e t h e d e r i v a t i v e s of b l a d e s t a b i l i t y r o o t s . F igu re 4 shows CPU t i m e r e q u i r e d i n UNISYS-1100/90 f o r c a l c u l a t i o n of s e n s i t i v i t y d e r i v a t i v e s of b l a d e response , o s c i l l a t o r y hub l o a d s ( o b j e c t i v e f u n c t i o n ) and b l a d e dampings (behavior c o n s t r a i n t s ) of t h e b a s e l i n e b l a d e u s i n g f i n i t e d i f f e r e n c e and d i r e c t ana ly t ica l approaches. f i v e d e s i g n v a r i a b l e s , t h e CPU time used is 110 min f o r t h e f i n i t e d i f f e r e n c e , and 25 min f o r t h e d i r e c t a n a l y t i c a l approach. t h e CPU time i s i n c r e a s e d t o 560 min f o r t h e f i n i t e d i f f e r e n c e , wh i l e it i s 50 min f o r t h e d i r e c t a n a l y t i c a l approach. v a r i a b l e s is i n c r e a s e d , t h e d i f f e r e n c e of t h e CPU time r e q u i r e d becomes larger.
For
For t h i r t y d e s i g n v a r i a b l e s ,
As t h e number of des ign
. - c
w 5 I k 4 3 a 3 0
2
1
n
-
- 5 10 15 20 25 30
Number O f Design Variables
__.
CPU Time Required In UNISYS-1 100/90 For Calculation Of Derivatives Of Blade Response, Stability And Hub Loads
F i g u r e 4
199

Design Variables
Figure 5 shows the blade and airfoil section. For the analysis, the blade is discretized into five beam elements of equal length, and the numerals indicate the order of beam elements. Each beam element consists of fifteen degrees of freedom, representing flap bending, lag bending, elastic twist and axial deflections. denotes the elastic axis, and the mo is a baseline blade mass per unit length (reference), which has an offset of yo. an extra nonstructural mass structural design parameters can be chosen from nonstructural mass (mna), chordwise offset of nonstructural mass (Yn,) , blade center of gravity offset (yo) , and blade flap bending stiffness (EIy) , lag bending stiffness (EI,) and torsional stiffness (GJ). have spanwise variations. beam elements are
(6 structural parameters) x (5 beam elements) = 30
In the airfoil, the ‘8.a.’
There can be placed at a chordwise location of Yna. Therefore,
These structural parameters can Thus, the total design variables for five
mx +=E?- Yn.
n
5 4 5 2 1
o Nonstructural Mass
o Chordwise Location of Nonstructural Mass
o Chordwise Location of Blade CG
o Blade Flap Bending Stiffness
o Blade Lag Bending Stiffness
o Blade Torsional Stiffness
* Spanwise Variations
* Total 30 Design Variables
Figure 5
200

Minimization of 4/Rev Vertical Shear Alone
Helicopter vibrations are characterized by means of oscillatory hub loads including three forces and three moments. vibrations, most of the optimization studies minimized 4/rev vertical shear alone for a four-bladed rotor, without constraining other components of oscillatory hub forces o r moments. iteration history when 4/rev vertical hub shear alone is minimized. After 7 iterations, the 4/rev vertical hub shear is reduced by 75%. Other 4/rev hub loads are increased instead; an increase by 30% for longitudinal and lateral hub shears, 10% for rolling and lateral hub moments and 210% for yawing hub moment. other components of oscillatory hub loads besides 4/rev vertical hub shear,are not involved in the objective function. one needs to make a careful choice of the objective function to achieve an optimum solution.
To reduce helicopter
Figure 6 shows the optimization
This is due to the fact that
This shows that
OPTIMIZATION ITERATION HISTORY
4P Hub Load (X 10-3)
S
.6
.4
.2
.6
.4
.2
I 1 1 I I I 1 0 1 2 3 4 5 6 7
Iteration
OBJECTIVE : MINIMIZATION OF 4/REV VERTICAL HUB SHEAR ALONE
Figure 6
20 1
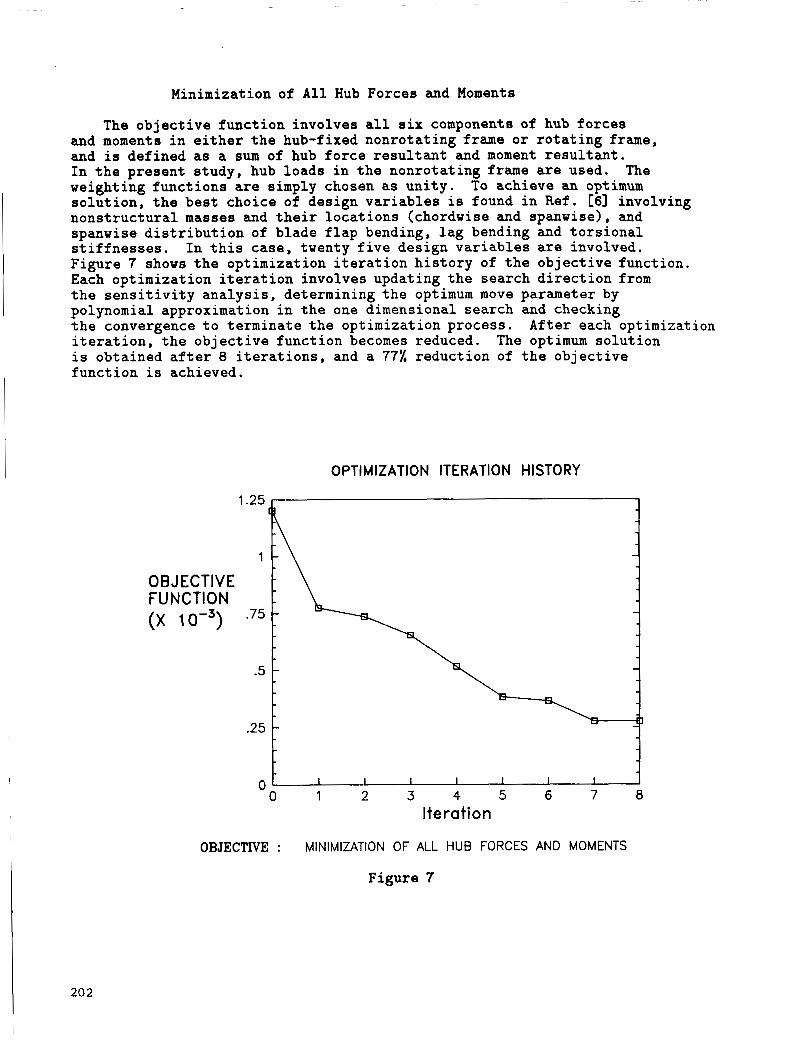
Minimization of All Hub Forces and Moments
The objective function involves all six components of hub forces and moments in either the hub-fixed nonrotating frame o r rotating frame, and is defined as a sum of hub force resultant and moment resultant. In the present study, hub loads in the nonrotating frame are used. The weighting functions are simply chosen as unity. To achieve an optimum solution, the best choice of design variables is found in Ref. [SI involving nonstructural masses and their locations (chordwise and spanwise), and spanwise distribution of blade flap bending, lag bending and torsional stiffnesses. In this case, twenty five design variables are involved. Figure 7 shows the optimization iteration history of the objective function. Each optimization iteration involves updating the search direction from the sensitivity analysis, determining the optimum move parameter by polynomial approximation in the one dimensional search and checking the convergence to terminate the optimization process. iteration, the objective function becomes reduced. is obtained after 8 iterations, and a 77% reduction of the objective
After each optimization The optimum solution
I function is achieved.
OPTIMIZATION ITERATION HISTORY
202
1
OB J ECTlVE FU NCTl ON (x
.25
1
.75
.5
.25
0 1 - 0 1 2 3 4 5 6 7 8
Iteration
OBJECTlVE : MINIMIZATION OF ALL HUB FORCES AND MOMENTS
Figure 7

Optimum Hub Loads
Figure 8 compares optimum 4/rev hub forces and moments with the baseline values. and moments are reduced from the baseline values. This is because all the components are included in the objective function, and also equal weighting function is enforced on each component. There are considerable reductions of 4/rev hub loads achieved: an 80% reduction for longitudinal and lateral hub shears, a 60% reduction for vertical hub shear, an 80% reduction for rolling and pitching hub moments and a 90% reduction for yawing hub moment. function must, therefore, include all six components of 4/rev hub loads in conjunction with appropriate weighting functions.
The optimum result shows that all the 4/rev hub forces
For a reduction of helicopter vibration, the objective
.5
.4
4P Hub Loads (x .3
.2
.1
0 Longitudinal Lateral Vertical Rolling Pitching Yawing
OBJECTIVE : MINIMIZATION OF ALL HUB FORCES AND MOMENTS
Figure 8
203
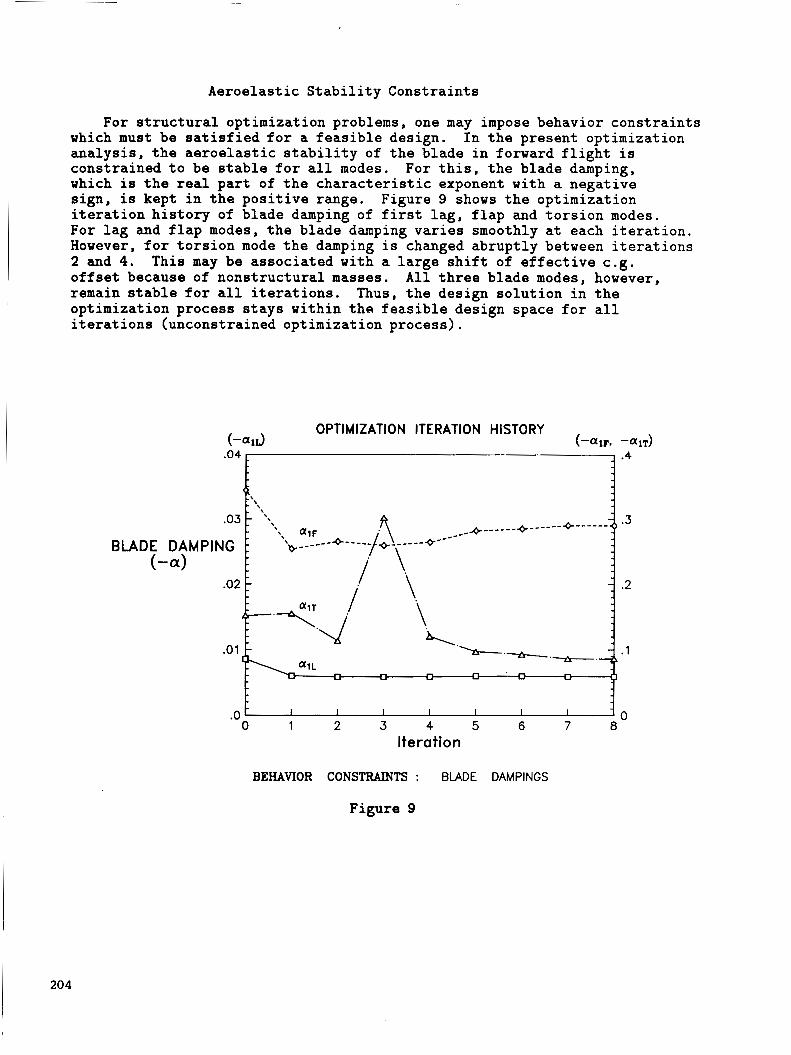
Aeroelas t ic S t a b i l i t y Cons t ra in ts
For s t r u c t u r a l opt imizat ion problems, one may impose behavior c o n s t r a i n t s which must be s a t i s f i e d f o r a feasible design. a n a l y s i s , t h e a e r o e l a s t i c s t a b i l i t y of t h e blade i n forward f l i g h t i s constrained t o be s t a b l e f o r a l l modes. For t h i s , t h e blade damping, which is t h e real p a r t of t h e characteristic exponent with a negat ive s i g n , is kept i n t h e p o s i t i v e range. Figure 9 shows t h e opt imizat ion i t e r a t i o n h i s t o r y of blade damping of f irst l a g , f l a p and t o r s i o n modes. For lag and f l a p modes, t h e blade damping v a r i e s smoothly a t each i t e r a t i o n . However, f o r t o r s i o n mode t h e damping i s changed abrupt ly between i t e r a t i o n s 2 and 4. o f f s e t because of nons t ruc tura l masses. remain s t a b l e f o r a l l i t e r a t i o n s . Thus, t h e design s o l u t i o n i n t h e opt imizat ion process s t a y s wi th in t h e f e a s i b l e design space f o r a l l i t e r a t i o n s (unconstrained opt imizat ion process) .
I n t h e present optimization
This may be assoc ia ted with a large s h i f t of e f f e c t i v e c.g. A l l t h r e e blade modes, however,
I I I I 1 1 I 0
OPTIMIZATION ITERATION HISTORY (-a13 (-alFv - a l T )
BEHAVIOR CONSTRAINTS : BLADE DAMPINGS
Figure 9
204
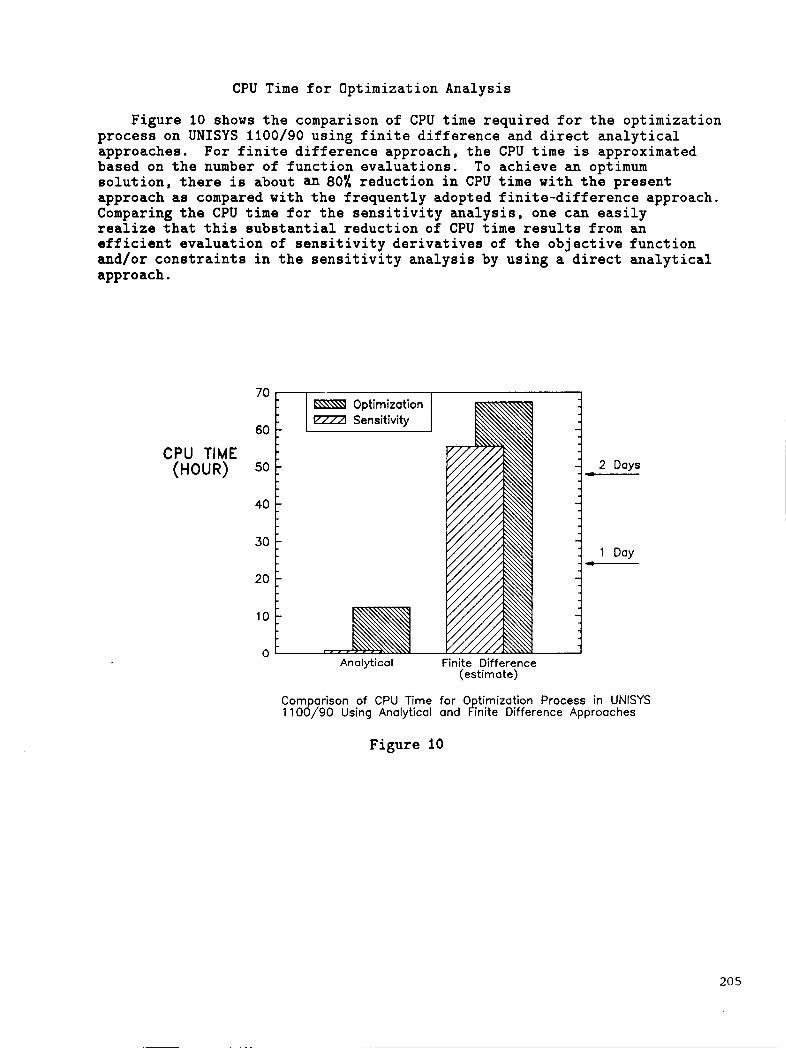
CPU Time f o r Optimizat ion Analys is
F i g u r e 10 shows t h e comparison of CPU time r e q u i r e d f o r t h e op t imiza t ion p r o c e s s on UNISYS 1100/90 us ing f i n i t e d i f f e r e n c e and d i r e c t a n a l y t i c a l approaches. based on t h e number of f u n c t i o n eva lua t ions . s o l u t i o n , t h e r e is about an 80% r e d u c t i o n i n CPU time w i t h t h e p r e s e n t approach as compared wi th t h e f r e q u e n t l y adopted f i n i t e - d i f f e r e n c e approach. Comparing t h e CPU time f o r t h e s e n s i t i v i t y a n a l y s i s , one can e a s i l y realize t h a t t h i s s u b s t a n t i a l r educ t ion of CPU time r e s u l t s from an eff ic ient e v a l u a t i o n of s e n s i t i v i t y d e r i v a t i v e s of t h e o b j e c t i v e f u n c t i o n and/or c o n s t r a i n t s i n t h e s e n s i t i v i t y a n a l y s i s by u s i n g a d i r e c t a n a l y t i c a l approach.
For f i n i t e d i f f e r e n c e approach, t h e CPU t i m e is approximated To achieve an optimum
CPU TIME (HOUR)
70
60
50
40
30
20
10
n
Optimization
2 Days -
1 Day -
., Analytical Finite Difference
(estimate)
Comparison of CPU Time for 0 timization Process in UNISYS 1 100/90 Using Analytical and Rnite Difference Approaches
Figure 10
205
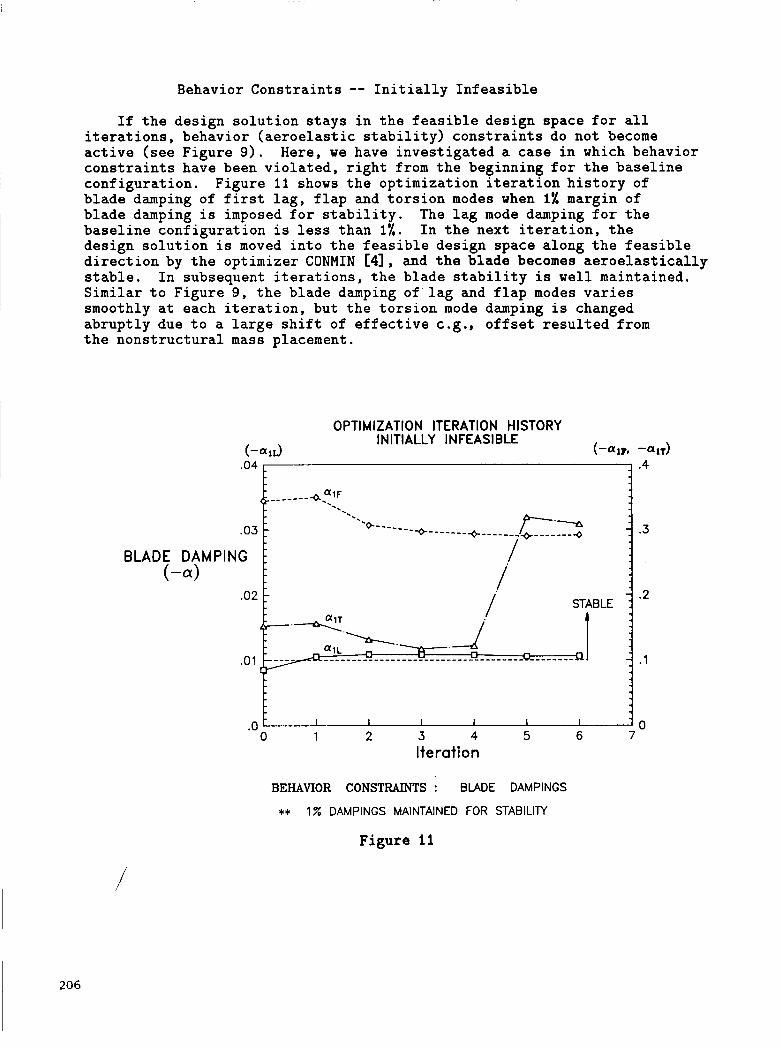
Behavior C o n s t r a i n t s -- I n i t i a l l y I n f e a s i b l e
If t h e des ign s o l u t i o n s t a y s i n t h e f e a s i b l e des ign space f o r a l l i t e r a t i o n s , behavior ( a e r o e l a s t i c s t a b i l i t y ) c o n s t r a i n t s do n o t become a c t i v e (see F igure 9 ) . c o n s t r a i n t s have been v i o l a t e d , r i g h t from t h e beginning for t h e b a s e l i n e c o n f i g u r a t i o n . b l a d e damping of f i rs t lag, f l a p and t o r s i o n modes when 1% margin of b l a d e damping is imposed f o r s t a b i l i t y . b a s e l i n e c o n f i g u r a t i o n i s less t h a n 1%. des ign s o l u t i o n is moved i n t o t h e f e a s i b l e des ign space a long t h e f e a s i b l e d i r e c t i o n by t h e op t imize r CONMIN C41, and t h e b l a d e becomes a e r o e l a s t i c a l l y s t a b l e . I n subsequent i t e r a t i o n s , t h e b l a d e s t a b i l i t y is w e l l maintained. S i m i l a r t o F igu re 9 , t h e b l ade damping o f ' l a g and f l a p modes v a r i e s smoothly a t each i t e r a t i o n , bu t t h e t o r s i o n mode damping i s changed a b r u p t l y due t o a large s h i f t of e f f e c t i v e c.g., o f f s e t r e s u l t e d from t h e n o n s t r u c t u r a l mass placement.
Here, w e have i n v e s t i g a t e d a case i n which behavior
F igu re 11 shows t h e op t imiza t ion i t e r a t i o n h i s t o r y of
The lag mode damping f o r t h e I n t h e next i t e r a t i o n , t h e
BEHAVIOR CONSTRAINTS : BLADE DAMPINGS
** 1% DAMPINGS MAINTAINED FOR STABILITY
Figure 11
i

Initially Infeasible Design
Figure 12 shows the optimization iteration history of the objective function for the case in which behavior (aeroelastic stability) constraint is violated by the baseline configuration. minimization of all six components of 4/rev hub loads for a four-bladed rotor. locations (spanwise and chordwise), and spanwise distribution of blade bending stiffnesses (flap, lag and torsion), and there are total twenty five design variables. move along the feasible direction so that no behavior constraint is violated. (see Figure 111, and the objective function is slightly increased. subsequent iterations, the objective function becomes continually reduced. The optimum solution is obtained after six iterations, and there is about a 25% reduction of the objective function achieved. Comparing with the case of initially feasible design where no stability constraint was violated and a reduction of 77% of the objective function was achieved, the optimum for initially infeasible design is far less achieved.
The objective function involves
The design variables involve nonstructural masses and their
The optimizer enforces the design solution to
After first iteration, the design solution becomes feasible In
OPTIMIZATION ITERATION HISTORY INITIALLY INFEASIBLE
OB J ECTlVE FU NCTlON (x
1.25
1
.75
.5
.25
I I I I I I 1 1 0 1 2 3 4 5 6 7 8
Iteration
OBJECTNE : MINIMIZATION OF ALL HUB FORCES AND MOMENTS
Figure 12
207
References
[l] J. W. Lim and I. Chopra, “Design Sensitivity Analysis f o r an Aeroelastic Optimization of Helicopter Blades,” 28th AIAA Dynamics Specialists Conference , Monterey , CA, April 1987’, Part 2B
[2] J. W. Lim, “Aeroelastic Optimization of a Helicopter Rotor,” Ph.D. Dissertation, University of Maryland, May 1988
C31 B. Panda and I. Chopra,“Dynamics of Composite Rotor Blades in Forward Flight,” Special Issue in the 10th Anniversary of Vert ica, 1987
Constrained Function Minimization,” User’s Manual, NASA TMX 62282, 1973
C5l J. W. Lim and I. Chopra,“Stability Sensitivity Analysis for Aeroelastic Optimization of a Helicopter Rotor,” 29th AIAA SDM Conference, Williamsburg, VA, April 1988 ; Also, Appeared in The Workshop on Dynamics and Aeroelastic Stability Modeling of Rotor Systems, Florida Atlantic University, November 1987
[SI J. W. Lim and I. Chopra,“Aeroelastic Optimization of a Helicopter,” 44th Annual Forum of American Helicopter Society, Washington, D.C., June 1988
C41 G. N. Vanderplaats,“CONMIN - A Fortran Program f o r
208
.- Structural Optimization of Rotor Blades With Integrated Dynamics and Aerodynamics
Aditi Chattopadhyay Analytical Services h Materials, Inc.
Hampton, Virginia
and
Joanne L. Walsh National Aeronautics and Space Administration
Langley Research Center Bampton, Virginia
209
INTRODUCTION
The helicopter rotor design process is highly multidisciplinary in nature and requires a merging of several technical disciplines such as dynamics, aerodynamics, structures and acoustics. In the past the conventional design process was controlled by the designer's experience and the use of trial and error methods. Today, one of the more promising approaches to the rotor blade design process is the application of structural optimization techniques. design optimization procedures to bring the state of the art to a very high
While these techniques have received wide attention in the fixed- wing field', they are fairly recent in the rotary wing industry3-'. host of the work involving application of optimization techniques to rotor blade design has been focused on nearly independent technical disciplines with very little consideration of the coupling and interaction between the disciplines. For example, the dynamic design requirements have been considered in the optimum rotor blade design in refs. 6-10. Blade aerodynamic and structural requirements were considered in refs. 11 and 12, respectively.
The necessity of merging appropriate disciplines to obtain an integrated design procedure has been recently emerging and with improved understanding of helicopter analyses and optimization schemes, it is now possible to apply optimization techniques and include the couplings between the disciplines. In refs. 13-15 the dynamic and structural design requirements were coupled with airloads in the analysis and in refs. 16 and 17 the dynamic and aeroelastic requirements were integrated. The optimization procedure described in this paper i s part of an effort at NASA Langley Research Center'' and is aimed at integrating two technical disciplines, aerodynamics and dynamics. As a first investigation, the airloads will be included to perform coupled airload/dynamic integration of rotor blades. Later the aerodynamic performance requirements will be added to obtain an integrated aerodynamic/dynamic optimum design procedure. The procedure is no longer sequential - rather it will account for the interactions between the two disciplines simultaneously. The paper briefly describes some of the recent work done by the authors which focussed on optimum blade design with dynamic behavioral constraints and presents some of the authors' recent experiences in developing a strategy for structural optimization with integrated dynamics/aerodynamics of rotor blades.
An extensive amount of work has been done in developing
I
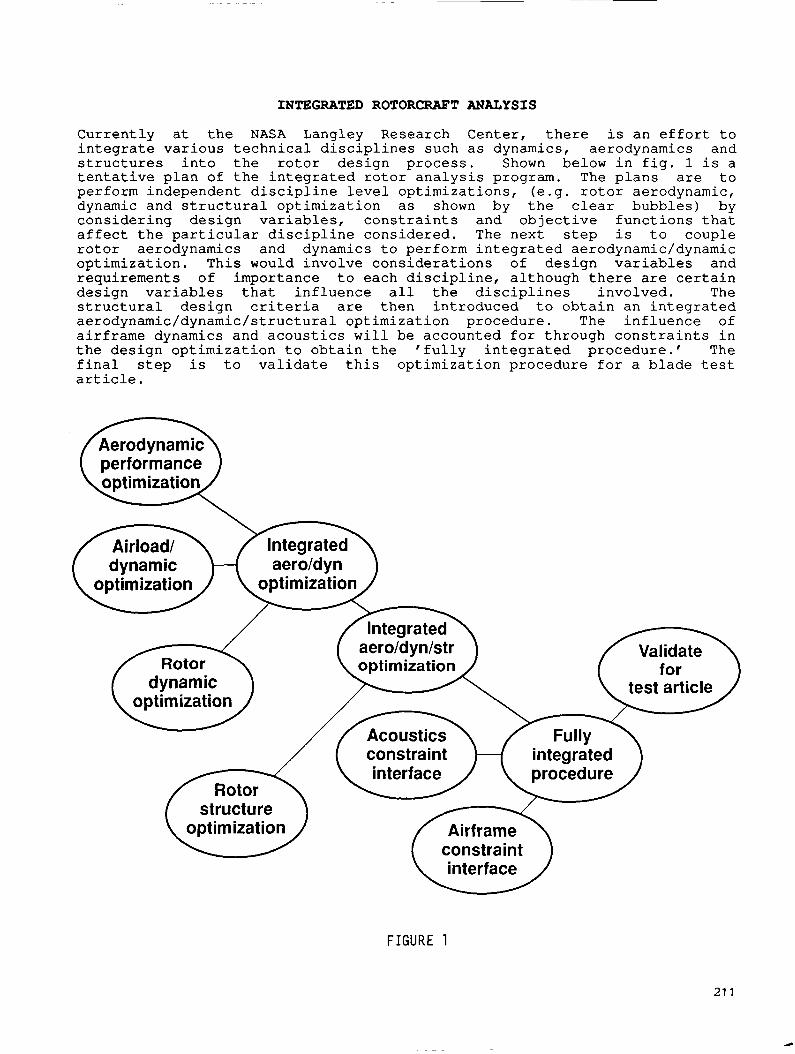
INTEGRATED ROTORCRAFT ANALYSIS
Currently at the NASA Langley Research Center, there is an effort to integrate various technical disciplines such as dynamics, aerodynamics and structures into the rotor design process. Shown below in fig. 1 is a tentative plan of the integrated rotor analysis program. The plans are to perform independent discipline level optimizations, (e.g. rotor aerodynamic, dynamic and structural optimization as shown by the clear bubbles) by considering design variables, constraints and objective functions that affect the particular discipline considered. The next step is to couple rotor aerodynamics and dynamics to perform integrated aerodynamic/dynamic optimization. This would involve considerations of design variables and requirements of importance to each discipline, although there are certain design variables that influence all the disciplines involved. The structural design criteria are then introduced to obtain an integrated aerodynamic/dynamic/structural optimization procedure. The influence of airframe dynamics and acoustics will be accounted for through constraints in the design optimization to obtain the 'fully integrated procedure.' The final step is to validate this optimization procedure for a blade test article.
FIGURE 1
21 1
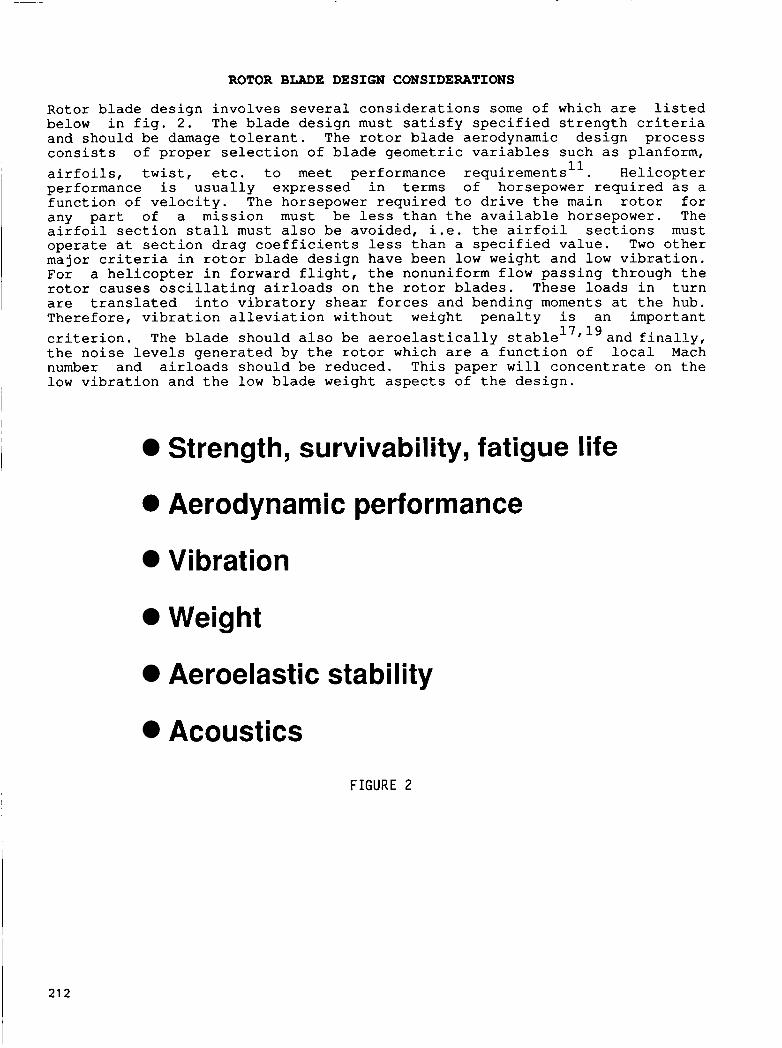
ROTOR BLADE DESIGN CONSIDERATIONS
Rotor blade d e s i g n i n v o l v e s s e v e r a l c o n s i d e r a t i o n s some o f which are l i s t e d below i n f i g . 2 . The blade d e s i g n must s a t i s f y s p e c i f i e d s t r e n g t h c r i t e r i a and shou ld be damage t o l e r a n t . The r o t o r blade aerodynamic d e s i g n p r o c e s s c o n s i s t s o f p r o p e r s e l e c t i o n o f b l a d e geomet r i c v a r i a b l e s such as planform, a i r f o i l s , t w i s t , e t c . t o meet performance r equ i r emen t s . H e l i c o p t e r performance i s u s u a l l y e x p r e s s e d i n t e r m s o f horsepower r e q u i r e d as a f u n c t i o n of v e l o c i t y . The horsepower r e q u i r e d t o d r i v e t h e main r o t o r f o r any pa r t of a m i s s i o n must be less t h a n t h e avai lable horsepower. The a i r f o i l s e c t i o n s t a l l must a l so be avoided , i . e . t h e a i r f o i l s e c t i o n s must o p e r a t e a t s e c t i o n drag c o e f f i c i e n t s less t h a n a s p e c i f i e d v a l u e . Two o t h e r major c r i t e r i a i n r o t o r blade d e s i g n have been l o w weight and l o w v i b r a t i o n . For a h e l i c o p t e r i n fo rward f l i g h t , t h e nonuniform f low p a s s i n g th rough t h e ro tor c a u s e s o s c i l l a t i n g airloads on t h e r o t o r blades. These loads i n t u r n are t r a n s l a t e d i n t o v i b r a t o r y s h e a r f o r c e s and bending moments a t t h e hub. The re fo re , v i b r a t i o n a l l e v i a t i o n wi thou t we igh t p e n a l t y i s an impor t an t c r i t e r i o n . and f i n a l l y , t h e n o i s e l e v e l s g e n e r a t e d by t h e r o t o r which are a f u n c t i o n o f l o c a l Mach number and a i r l o a d s s h o u l d be reduced . T h i s paper w i l l c o n c e n t r a t e on t h e low v i b r a t i o n and t h e low blade weight aspects of t h e d e s i g n .
11
The blade s h o u l d a l so be a e r o e l a s t i c a l l y s table l7
Strength, survivability, fatigue life
0 Aerodynamic performance
Vibration
Weight
Aeroelastic stability
Acoustics
FIGURE 2

DYNAMIC OPTIMIZATION PROBLEM STATEMENT
As ment ioned b e f o r e , low v i b r a t i o n i s a n i m p o r t a n t d e s i g n r e q u i r e m e n t i n h e l i c o p t e r r o t o r blade d e s i g n . One way o f r e d u c i n g t h e v i b r a t i o n l e v e l i n t h e blade i s t o d e s i g n t h e blade s u c h t h a t t h e n a t u r a l f r e q u e n c i e s are separated from m u l t i p l e s o f t h e d r i v i n g f r e q u e n c i e s . F a i l u r e t o c o n s i d e r f r e q u e n c y p l acemen t e a r l y i n t h e d e s i g n p r o c e s s can c a u s e a s i g n i f i c a n t i n c r e a s e i n t h e f i n a l blade weight l a t e r if p o s t d e s i g n a d d i t i o n o f n o n s t r u c t u r a l masses i s r e q u i r e d . A p p r o p r i a t e l y p l a c i n g t h e na tu ra l . f r e q u e n c i e s can be done by a p r o p e r t a i l o r i n g of t h e blade m a s s a n d / o r s t i f f n e s s d i s t r i b u t i o n s t o m e e t t h e n e c e s s a r y d e s i g n r e q u i r e m e n t s u s i n g s t r u c t u r a l o p t i m i z a t i o n . T h i s s e c t i o n o f t h e paper p r e s e n t s a n overview of t h e dynamic o p t i m i z a t i o n work which h a s been comple t ed . The g o a l o f t h e dynamic o p t i m i z a t i o n p rob lem ( f i g . 3 ) i s t o o b t a i n minimum we igh t d e s i g n s of blades w i t h c o n s t r a i n t s on m u l t i p l e c o u p l e d f l a p - l a g n a t u r a l f r e q u e n c i e s . It i s a l so i m p o r t a n t t h a t t h e a u t o r o t a t i o n a l pe r fo rmance of t h e blade n o t be degraded d u r i n g t h e t a i l o r i n g p r o c e s s s i n c e t h e blade s h o u l d have s u f f i c i e n t i n e r t i a t o a u t o r o t a t e i n case o f a n e n g i n e f a i l u r e . I n order t o e n s u r e a safe d e s i g n , t h e blade c e n t r i f u g a l stress s h o u l d be l i m i t e d by a n a p p r o p r i a t e uppe r bound. For t h i s s t u d y o n l y c e n t r i f u g a l stress h a s been c o n s i d e r e d . The blade i s assumed t o be i n vacuum i n t h i s i n v e s t i g a t i o n and t h e r e s u l t s of t h i s a n a l y s i s w i l l g e n e r a t e a good s t a r t i n g p o i n t f o r t h e i n t e g r a t e d o p t i m i z a t i o n .
Goal - Minimize blade weight with constraints on multiple coupled natural frequencies, autorotational inertia and stress
0 Approach - Stiffness and/or mass modifications, placement of tuning masses
.Assumption - Blade is in vacuum - generates good starting point for integrated opt i m kat ion
FIGURE 3

ROTOR BLADE MODEL FOR DYNAMIC OPTIMIZATION ,
The r o t o r blade model f o r dynamic opt imizat ion i s shown below i n f i g . 4 . The blade i s a r t i c u l a t e d and has a f ixed hub, a pre twis t and a root spr ing which allows t o r s i o n a l motion. A box beam w i t h unequal v e r t i c a l wall th icknesses i s loca ted i n s i d e t h e a i r f o i l and lumped nons t ruc tura l masses a r e loca t ed i n s i d e t h e box and d i s t r i b u t e d spanwise. T h i s model i s based on an e x i s t i n g blade design denoted t h e ' re fe rence blade' descr ibed i n r e f s . 8 , 9 , and 13. A s i n r e f . 13, it i s assumed t h a t t h e box beam con t r ibu te s a l l t h e blade s t i f f n e s s , t h a t i s , t h e cont r ibu t ions of t h e s k i n , honeycomb, e t c . t o t h e blade f l a p and l a g s t i f f n e s s e s a r e neglected. The d e t a i l s f o r c a l c u l a t i n g t h e box beam sec t ion p rope r t i e s can be found i n r e f . 8 . The p r o p e r t i e s of t h e box beam loca ted i n s i d e t h e a i r f o i l a r e a s follows: h=0.117 f t , b=0.463 f t , p=8.645 s l u g s / f t , E=2.304x10⁹ l b / f t , allowable stress bmax=l.93x107 l b / f t 2 and f a c t o r of s a fe ty , FS=3. The blade i s d i s c r e t i z e d i n t o t e n segments. Both rec tangular and tapered blades a r e considered. For t h e rec tangular blade, t h e box beam ou te r dimensions along t h e blade span remain unchanged. The design va r i ab le s f o r t h e rectangular blade a r e t h e box beam wall th icknesses tl, and t3 and t h e magnitudes of t h e nons t ruc tura l weights loca ted i n s i d e t h e box beam a t t e n spanwise loca t ions . For t h e tapered blade it i s assumed, a s i n r e f s . 8 and 9 t h a t t h e box beam i s tapered and t h e add i t iona l design va r i ab le s a r e t h e box beam he ight a t t h e roo t , h,, and t h e t ape r r a t i o , hh, which i s def ined a s t h e r a t i o of t h e box beam height a t t h e roo t t o t h e corresponding value a t t h e t i p . A l i n e a r v a r i a t i o n of t h e box beam he ight , h, i n t h e spanwise d i r e c t i o n i s assumed.
3 2
t2, i
I
0 Reference blade I_ b Articulated, rigid hub Rectangular planform, pretwist,
0 Design variables Box beam wall thicknesses, tl, t2, t3 (10 spanwise positions)
@Box beam outer dimension hr Taper ratio Xh Magnitudes of lumped masses (1 0 spanwise positions)
root spring
FIGURE 4
I 21 4
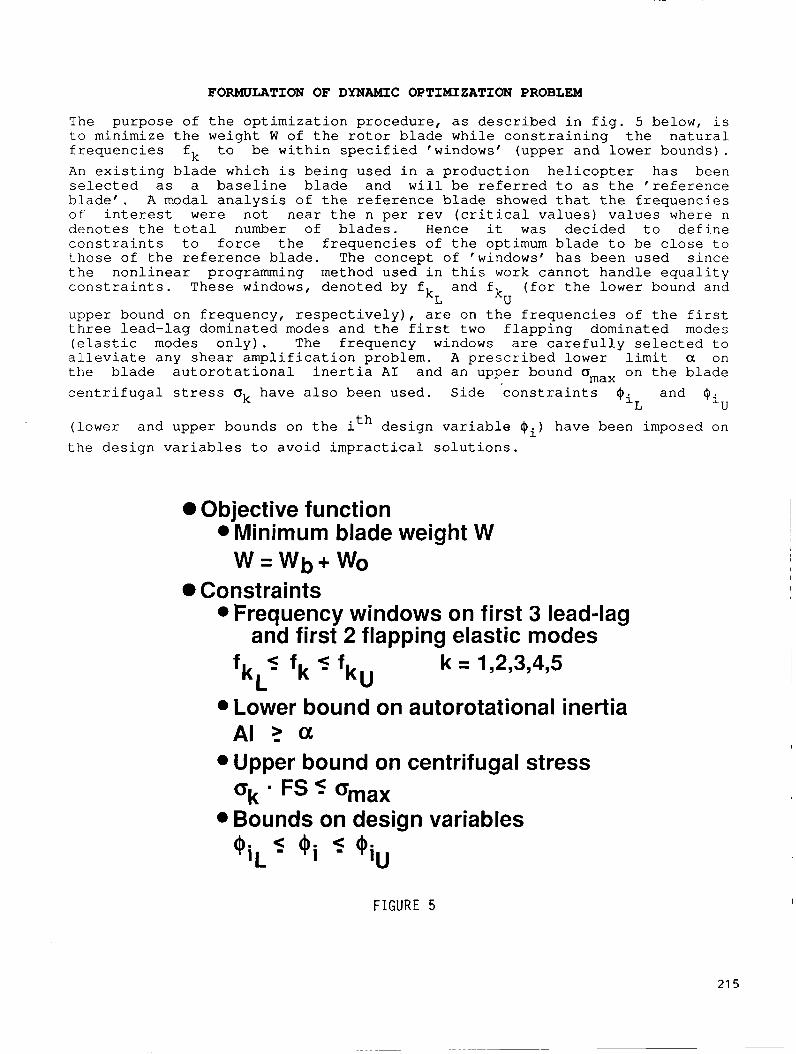
FORMULATION OF DYNAMIC OPTIMIZATION PROBLEM
The purpose of t h e opt imizat ion procedure, a s descr ibed i n f i g . 5 below, i s t o m i n i m i z e t h e weight W of t h e r o t o r blade w h i l e cons t ra in ing t h e na tura l f requencies f k t o be within spec i f i ed 'windows' (upper and lower bounds). An e x i s t i n g blade which i s being used i n a production he l i cop te r has been se l ec t ed a s a base l ine blade and w i l l be r e fe r r ed t o a s t h e ' reference b lade ' . A modal ana lys i s of t h e reference blade showed t h a t t h e frequencies of i n t e r e s t were not near t he n per rev ( c r i t i c a l values) values where n denotes t h e t o t a l number of blades. Hence it was decided t o def ine c o n s t r a i n t s t o fo rce t h e frequencies of t h e optimum blade t o be c lose t o those of t h e re ference blade. The concept of 'windows' has been used s ince the nonl inear programming method used i n t h i s work cannot handle equal i ty c o n s t r a i n t s . These windows, denoted by fk and f ( f o r t h e lower bound and
upper bound on frequency, r e s p e c t i v e l y ) , a r e on t h e frequencies of t h e f i r s t t h r e e lead-lag dominated modes and the f i r s t two f lapping dominated modes ( e l a s t i c modes o n l y ) . The frequency windows a r e c a r e f u l l y se l ec t ed t o a l l e v i a t e any shear ampl i f ica t ion problem. A p rescr ibed lower l i m i t a on t he blade a u t o r o t a t i o n a l i n e r t i a A I and an upper bound omax on t h e blade c e n t r i f u g a l s t r e s s ok have a l s o been used. Side c o n s t r a i n t s qi and Oi
L U
(lower and upper bounds on t h e ith design va r i ab le Qi ) have been imposed on t h e design va r i ab le s t o avoid imprac t ica l so lu t ions .
L kU
0 Objective function Minimum blade weight W w = w b + w O
0 Constraints a
a
a
a
Frequency windows on first 3 lead-lag and first 2 flapping elastic modes
fkL5 fk fkU k = 1,2,3,4,5
Lower bound on autorotational inertia AI ? a Upper bound on centrifugal stress
Bounds on design variables
FIGURE 5
21 5

METHODOLOGY FOR DYNAMIC OPTIMIZATION PROBLEM
The procedure described in this paper uses the program Comprehensive - Analytical Model of Rotorcraft Aerodynamics and Dynamics (CAMRAD) 20 . The modal analysrs portion sf the program CAMRAD which uses a modified Galerkin approach” has been used for the dynamic optimization problem. According to ref. 22, this approach is the preferred method for computing mode shapes and frequencies of structures having large radial variations in bending stiffness. The general purpose optimization program CONMIN23 which uses the nonlinear programming method of feasible directions has been used for the optimization. The method of solution described below (fig. 6) starts with discretizing the blade into finite segments. In the search for the optimum vector of new design variables, CONMIN requires derivatives of the objective function and constraints. The user has the option of either allowing CONMIN to calculate derivatives by using forward differences, or by supplying those derivatives to CONMIN. In the work presented in this paper, the latter approach has been used. Analytical expressions for the derivatives of the
I obtained. A central difference scheme has been used for the derivatives of the frequency constraints. The initial attempt * using forward, differences gave highly inaccurate derivatives.
The optimization process generally requires many evaluations of the objective function and the constraints before an optimum design is obtained. The process therefore can be very expensive if exact analyses are made for each evaluation. To reduce computational requirements, the optimization is based on the use of approximate analyses. In the present paper a piecewise linear analysis, based on first order Taylor Series expansions, is used. The approximate analyses should produce accurate characteristics of the real problem in a neighborhood of the current design which is continuously updated during optimization. The method has been found to be effective in the past (e.g., ref. 24) for providing accurate approximations.
I objective function and the autorotational inertia constraint have been
*Codes used OCAMRAD - Blade modal analysis (modified
Galerkin approach) CONMIN - Optimization (nonlinear programming
approach - method of feasible directions)
Discretize the blade (10 finite segments) 0 Compute mode shapes and frequencies
Perform sensitivity analysis
autorotational inertia constraint and stress constraints
derivatives
Method of solution
Analytical derivatives of objective function,
Central differences for frequency constraint
Use approximate analysis techniques
FIGURE 6
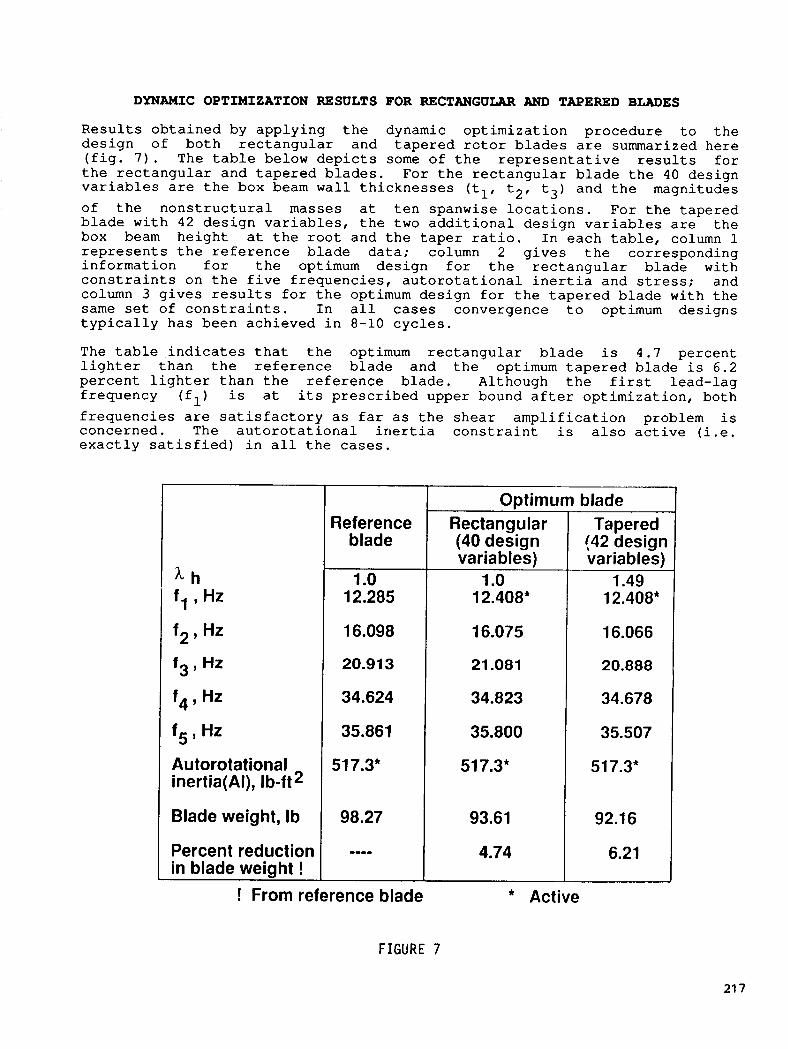
DYNAMIC OPTIMIZATION RESULTS FOR RECTANGULAR AND TAPERED BLADES
Results obtained by applying t h e dynamic optimization procedure t o the design of both rectangular and tapered rc tor blades a re summarized here ( f i g . 7 ) . The t ab le below depicts some of the representative resu l t s f o r the rectangular and tapered blades. For the rectangular blade the 40 design variables a re the box beam wall thicknesses (tl , t2, t3) and the magnitudes of the nonstructural masses a t ten spanwise locations. For the tapered blade w i t h 42 design variables, the two additional design variables are the box beam height a t the roo t and the taper r a t i o . I n each table , column 1 represents the reference blade data; column 2 gives the corresponding information f o r the optimum design for the rectangular blade w i t h constraints on the f ive frequencies, autorotational i n e r t i a and s t ress ; and column 3 gives resu l t s for the optimum design f o r the tapered blade w i t h the same s e t of constraints . I n a l l cases convergence t o optimum designs typ ica l ly has been achieved i n 8-10 cycles.
The t ab le indicates t ha t the optimum rectangular blade i s 4 . 7 percent l i gh te r than t h e reference blade and the optimum tapered blade i s 6 . 2 percent l i gh te r than t h e reference blade. Although the f i r s t lead-lag frequency ( f l ) i s a t i t s prescribed upper bound a f t e r optimization, both frequencies a re sa t i s fac tory as f a r as the shear amplification problem i s concerned. The autorotational i n e r t i a constraint i s a lso act ive ( i . e . exactly s a t i s f i e d ) i n a l l the cases.
Autorotational inertia(Al), Ib-ft
Blade weight, Ib
Percent reduction in blade weight !
Reference blade
1 .o 12.285
16.098
20.91 3
34.624
35.861
51 7.3*
98.27
----
Optimum blade Rectangular (40 design variables)
1 .o 12.408*
16.075
21.081
34.823
35.800
51 7.3*
93.61
4.74
Tapered (42 design variables)
1.49 12.408*
16.066
20.888
34.678
35.507
51 7.3*
92.1 6
6.21
! From reference blade * Active
FIGURE 7
21 7
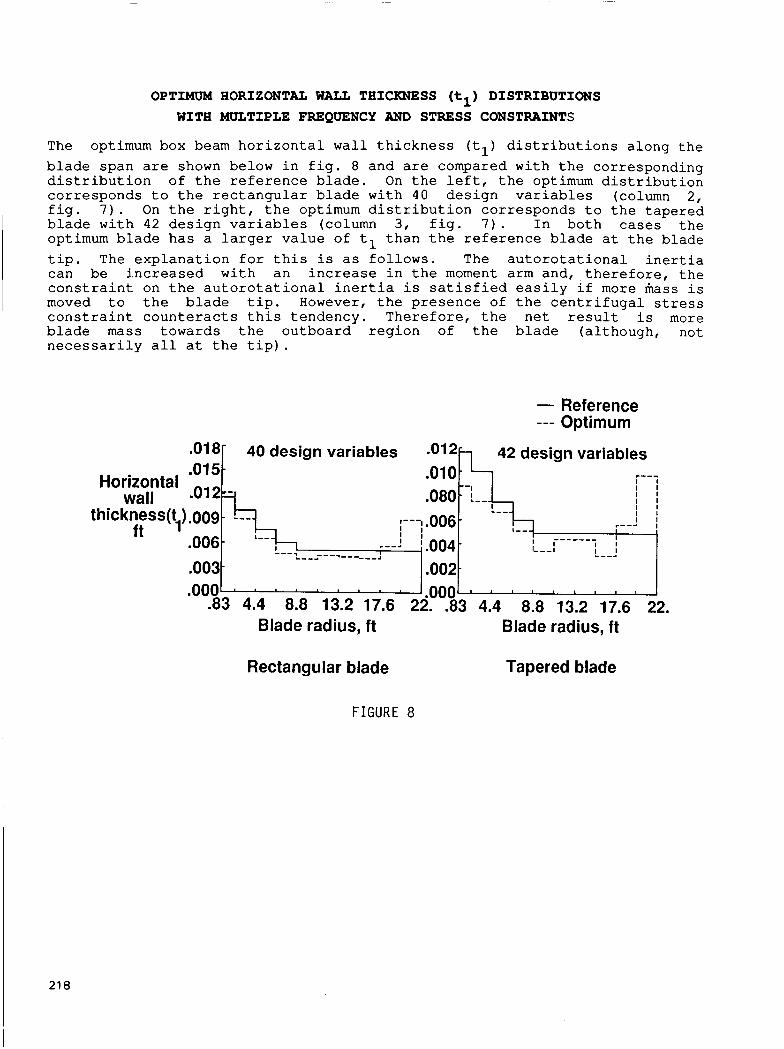
OPTIMUM HORIZONTAL WALL THICKNESS (tl) DISTRIBUTIONS WITH MULTIPLE FREQUENCY AND STRESS CONSTRAINTS
.018r 40 design variables
.015 .010
thickness(t ) '---I .006
- Horizontal
wall .080-
1 I I ft ' '.004-
.003- ,002 . O O O " " " " '
---.a
The optimum box beam h o r i z o n t a l w a l l t h i c k n e s s (t,) d i s t r i b u t i o n s a l o n g t h e blade s p a n are shown below i n f i g . 8 a n d are compared w i t h t h e c o r r e s p o n d i n g d i s t r i b u t i o n o f t h e r e f e r e n c e blade. On t h e l e f t , t h e optimum d i s t r i b u t i o n c o r r e s p o n d s t o t h e r e c t a n g u l a r blade w i t h 40 d e s i g n v a r i a b l e s (column 2 , f i g . 7 ) . On t h e r i g h t , t h e optimum d i s t r i b u t i o n c o r r e s p o n d s t o t h e t a p e r e d blade w i t h 42 d e s i g n v a r i a b l e s (column 3 , f i g . 7 ) . I n b o t h cases t h e optimum blade h a s a la rger v a l u e o f t l t h a n t h e r e f e r e n c e blade a t t h e b l a d e t i p . The e x p l a n a t i o n f o r t h i s i s as f o l l o w s . The a u t o r o t a t i o n a l i n e r t i a can be i n c r e a s e d w i t h a n i n c r e a s e i n t h e moment a r m a n d , , t h e r e f o r e , t h e c o n s t r a i n t on t h e a u t o r o t a t i o n a l i n e r t i a i s s a t i s f i e d e a s i l y i f more mass i s moved t o t h e blade t i p . However, t h e p r e s e n c e of t h e c e n t r i f u g a l s tress c o n s t r a i n t c o u n t e r a c t s t h i s t e n d e n c y . T h e r e f o r e , t h e n e t r e s u l t i s more blade m a s s t o w a r d s t h e o u t b o a r d r e g i o n of t h e blade ( a l t h o u g h , n o t n e c e s s a r i l y a l l a t t h e t i p ) .
- 0 1 2 1 42 design variables r--- I 1 I I I I I I I I I I - I I
- --I L--
-
. O O O " " " " '
Rectangular blade Tapered blade
FIGURE 8
21 8
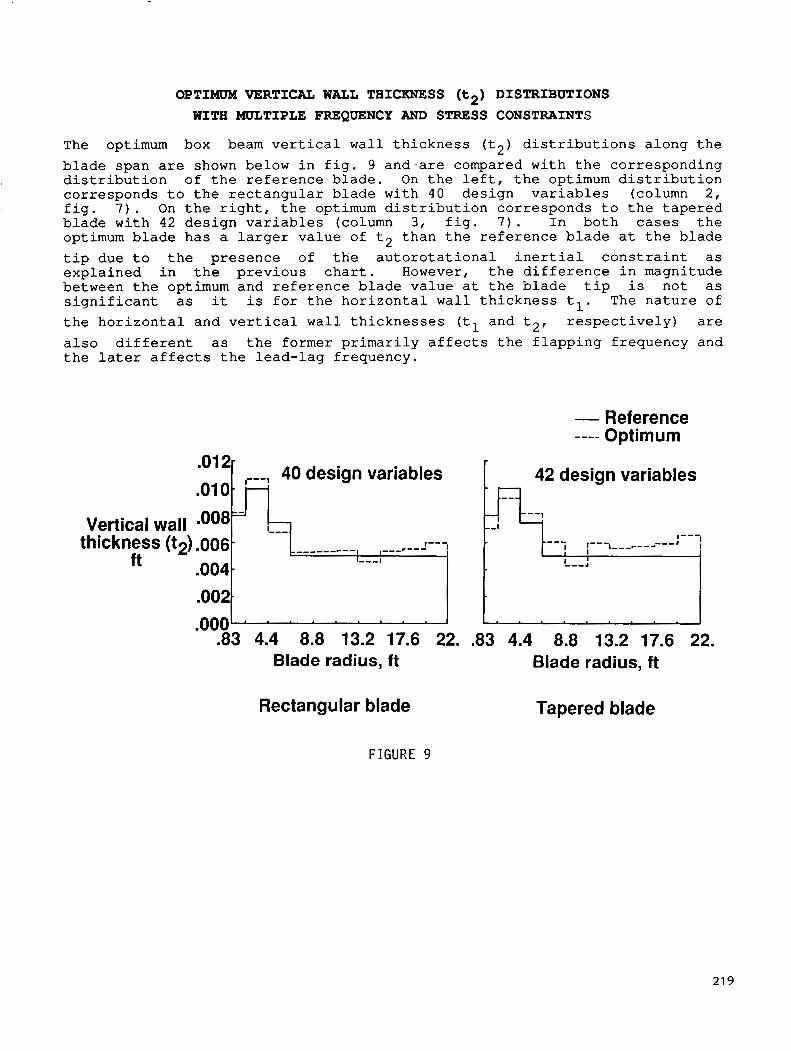
OPTIMUM VERTICAL WALL THICKNESS (t2) DISTRIBUTIONS WITH MULTIPLE FREQUENCY AND STRESS CONSTRAINTS
The optimum box beam ve r t i ca l w a l l t h i c k n e s s (t2) d i s t r i b u t i o n s a l o n g t h e blade s p a n are shown below i n f i g . 9 and are compared w i t h t h e c o r r e s p o n d i n g d i s t r i b u t i o n of t h e r e f e r e n c e blade. On t h e l e f t , t h e optimum d i s t r i b u t i o n c o r r e s p o n d s t o t h e r e c t a n g u l a r blade w i t h 4 0 d e s i g n var iables (column 2 , f i g . 7 ) . On t h e r i g h t , t h e optimum d i s t r i b u t i o n c o r r e s p o n d s t o t h e tapered blade w i t h 42 d e s i g n v a r i a b l e s (column 3 , f i g . 7 ) . I n both cases t h e optimum blade h a s a larger v a l u e o f t2 t h a n t h e r e f e r e n c e blade a t t h e blade t i p due t o t h e p r e s e n c e of t h e a u t o r o t a t i o n a l i n e r t i a l c o n s t r a i n t as e x p l a i n e d i n t h e p r e v i o u s c h a r t . However, t h e d i f f e r e n c e i n magni tude be tween t h e optimum a n d r e f e r e n c e blade v a l u e a t t h e blade t i p i s n o t as s i g n i f i c a n t as it i s f o r t h e h o r i z o n t a l w a l l t h i c k n e s s t l . The n a t u r e o f t h e h o r i z o n t a l a n d ve r t i ca l w a l l t h i c k n e s s e s (tl a n d t2, r e s p e c t i v e l y ) are a l s o d i f f e r e n t as t h e former p r i m a r i l y a f f e c t s t h e f l a p p i n g f r e q u e n c y and t h e l a t e r a f fec ts t h e lead-lag f r e q u e n c y .
Vertical wall
40 design variables
.ooo .""2t----J .83 4.4 8.8 13.2 17.6 22.
Blade radius, ft
- Reference ---- Optimum
1 42 design variables
t .83 4.4 8.8 13.2 17.6 22.
Blade radius, ft
Rectangular blade Tapered blade
FIGURE 9
219

OPTIMUM NONSTRUCT- SEGMENT WEIGHT DISTRIBUTIONS WITH MULTIPLE FREQUENCY AND STRESS CONSTRAINTS
10- Nonstructural 8.
segment weight,
I bs 4-
Shown below ( f i g . 1 0 ) a r e the optimum and the reference blade nonstructural segment weight d i s t r ibu t ions along the blade radius f o r both the rectangular blade w i t h 40 design variables (column 2, f i g . 7 ) and t h e tapered blade w i t h 4 2 design variables (column 3 , f i g . 7 ) . For the rectangular blade ( l e f t side of t h e f igure) the optimum blade has lower nonstructural weight throughout the blade span. However, for the tapered.blade ( r igh t s ide of the f igure) t h e optimum blade has larger nonstructural weight toward the blade t i p than the reference blade. T h i s i s because the tapered blade has reduced s t ruc tu ra l weight requirements a t the blade t i p . Hence, i n order t o s a t i s fy the autorotat ional i n e r t i a constraint , the nonstructural weight a t the t i p must increase. Even so the t o t a l weight of the optimum blade i s s t i l l lower than tha t of the reference blade.
40 design variables
- 6=
- Reference ---- Optimum
42 design variables
I
.83 4.4 8.8 13.2 17.6 22. .83 4.4 8.8 13.2 17.6 22. Blade radius, ft Blade radius, ft
Rectangular blade Tapered blade
FIGURE 10
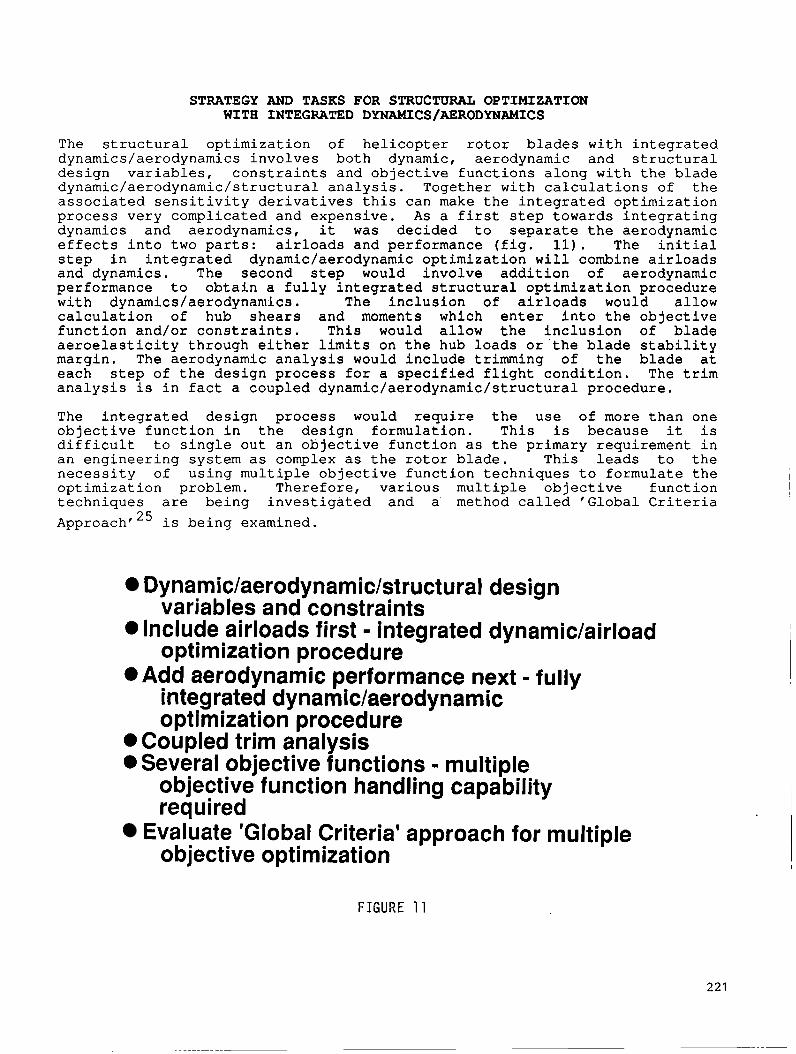
STRATEGY AND TASKS FOR STRUCTURAL OPTIMIZATION WITH INTEGRATED DYNAMICS/AERODYNAMICS
The structural optimization of helicopter rotor blades with integrated dynamics/aerodynamics involves both dynamic, aerodynamic and structural design variables, constraints and objective functions along with the blade dynamic/aerodynamic/structural analysis. Together with calculations of the associated sensitivity derivatives this can make the integrated optimization process very complicated and expensive. As a first step towards integrating dynamics and aerodynamics, it was decided to separate the aerodynamic effects into two parts: airloads and performance (fig. 11). The initial step in integrated dynamic/aerodynamic optimization will combine airloads and dynamics. The second step would involve addition of aerodynamic performance to obtain a fully integrated structural optimization procedure with dynamics/aerodynamics . The inclusion of airloads would allow calculation of hub shears and moments which enter into the objective function and/or constraints. This would allow the inclusion of blade aeroelasticity through either limits on the hub loads or'the blade stability margin. The aerodynamic analysis would include trimming of the blade at each step of the design process for a specified flight condition. The trim analysis is in fact a coupled dynamic/aerodynamic/structural procedure.
The integrated design process would require the use of more than one objective function in the design formulation. This is because it is difficult to single out an objective function as the primary requirement in an engineering system as complex as the rotor blade. This leads to the necessity of using multiple objective function techniques to formulate the optimization problem. Therefore, various multiple objective function techniques are being investigated and a method called 'Global Criteria Approach' * is being examined.
Dynamic/aerodynamic/structural design variables and constraints
0 Include airloads first - integrated dynamic/airload optimization procedure
0 Add aerodynamic performance next - fully integrated dynamiclaerodynamic optimization procedure
0 Coupled trim analysis 0 Several objective functions - multiple
objective function handling capability required
Evaluate 'Global Criteria' approach for multiple objective optimization
FIGURE 11
221
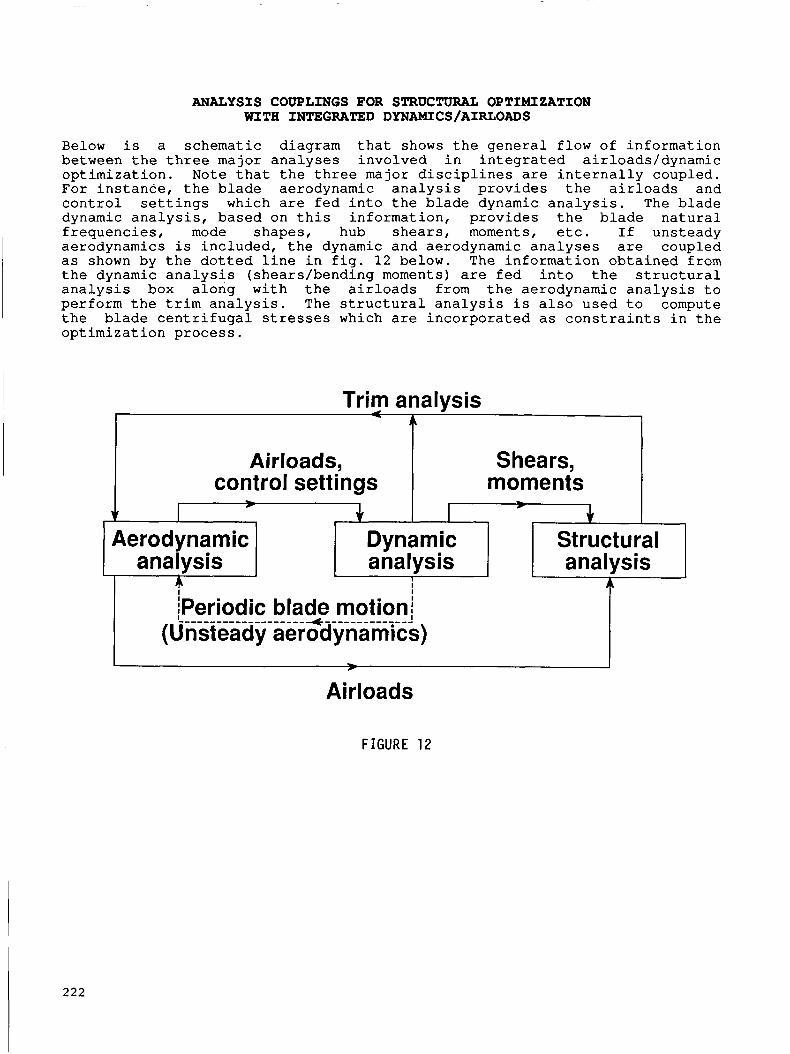
ANALYSIS COUPLINGS FOR STRUCTURAL OPTIMIZATION WITH INTEGRATED DYNAMICS/AIRLOADS
Below is a schematic diagram that shows the general flow of information between the three major analyses involved in integrated airloads/dynamic optimization. Note that the three major disciplines are internally coupled. For instance, the blade aerodynamic analysis provides the airloads and control settings which are fed into the blade dynamic analysis. The blade dynamic analysis, based on this information, provides the blade natural frequencies, mode shapes, hub shears, moments, etc. If unsteady aerodynamics is included, the dynamic and aerodynamic analyses are coupled as shown by the dotted line in fig. 12 below. The information obtained from the dynamic analysis (shears/bending moments) are fed into the structural analysis box along with the airloads from the aerodynamic analysis to perform the trim analysis. The structural analysis is also used to compute the blade centrifugal stresses which are incorporated as constraints in the optimization process.
Trim analvsis
f Airloads,
control settings Shears,
moments
Aerodynamic analysis
Dynamic
:Periodic (Unsteady
L----,--------------
Structural - analysis
A
L r I
Airloads
FIGURE 12
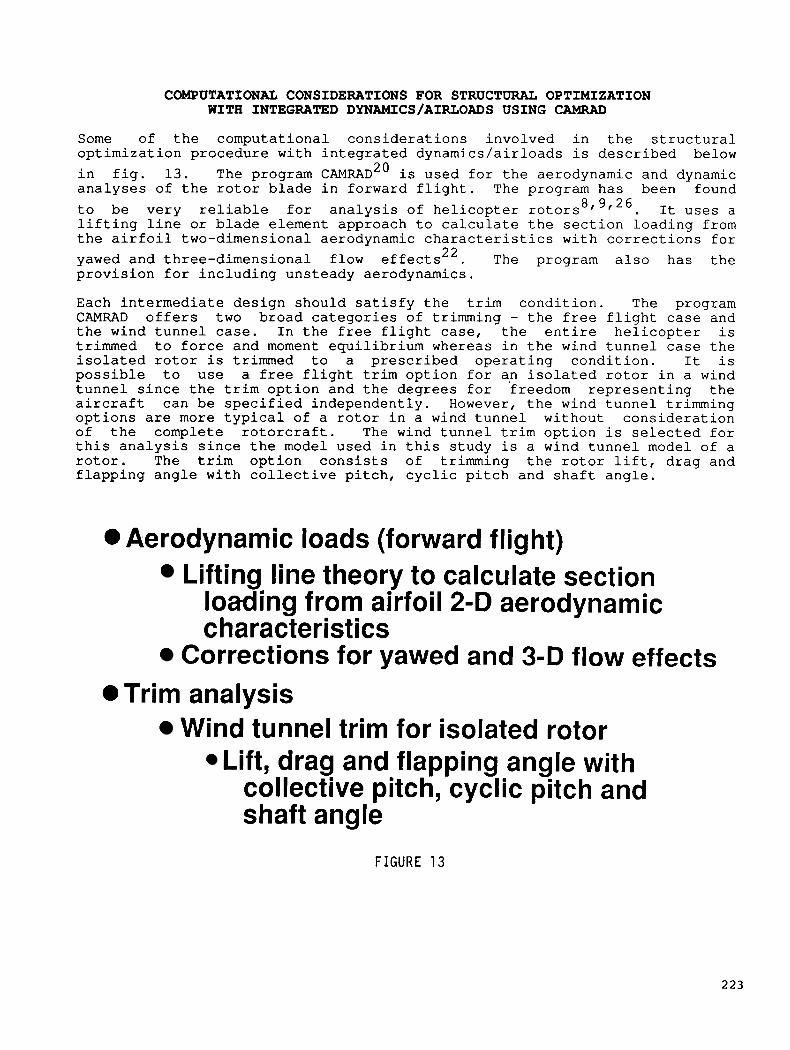
COMPUTATIONAL CONSIDERATIONS FOR STRUCTURAL OPTIMIZATION WITH INTEGRATED DYNAMICS/AIRLOADS USING CAMRAD
Some of the computational considerations involved in the structural optimization procedure with integrated dynamics/airloads is described below in fig. 13. The program CAMRAD2' is used for the aerodynamic and dynamic analyses of the rotor blade in forward flight. The program has been found to be very reliable for analysis of helicopter rotors It uses a lifting line or blade element approach to calculate the section loading from the airfoil two-dimensional aerodynamic characteristics with corrections for yawed and three-dimensional flow effects . The program also has the provision for including unsteady aerodynamics.
22
Each intermediate design should satisfy the trim condition. The program CAMRAD offers two broad categories of trimming - the free flight case and the wind tunnel case. In the free flight case, the entire helicopter is trimmed to force and moment equilibrium whereas in the wind tunnel case the isolated rotor is trimmed to a prescribed operating condition. It is possible to use a free flight trim option for a,n isolated rotor in a wind tunnel since the trim option and the degrees for freedom representing the aircraft can be specified independently. However, the wind tunnel trimming options are more typical of a rotor in a wind tunnel without consideration of the complete rotorcraft. The wind tunnel trim option is selected for this analysis since the model used in this study is a wind tunnel model of a rotor. The trim option consists of trimming the rotor lift, drag and flapping angle with collective pitch, cyclic pitch and shaft angle.
0 Aerodynamic loads (forward flight) Lifting line theory to calculate section
loading from airfoil 2-D aerodynamic characteristics
Corrections for yawed and 3-D flow effects
Wind tunnel trim for isolated rotor 0 Trim analysis
Lift, drag and flapping angle with collective pitch, cyclic pitch and shaft angle
FIGURE 13
223
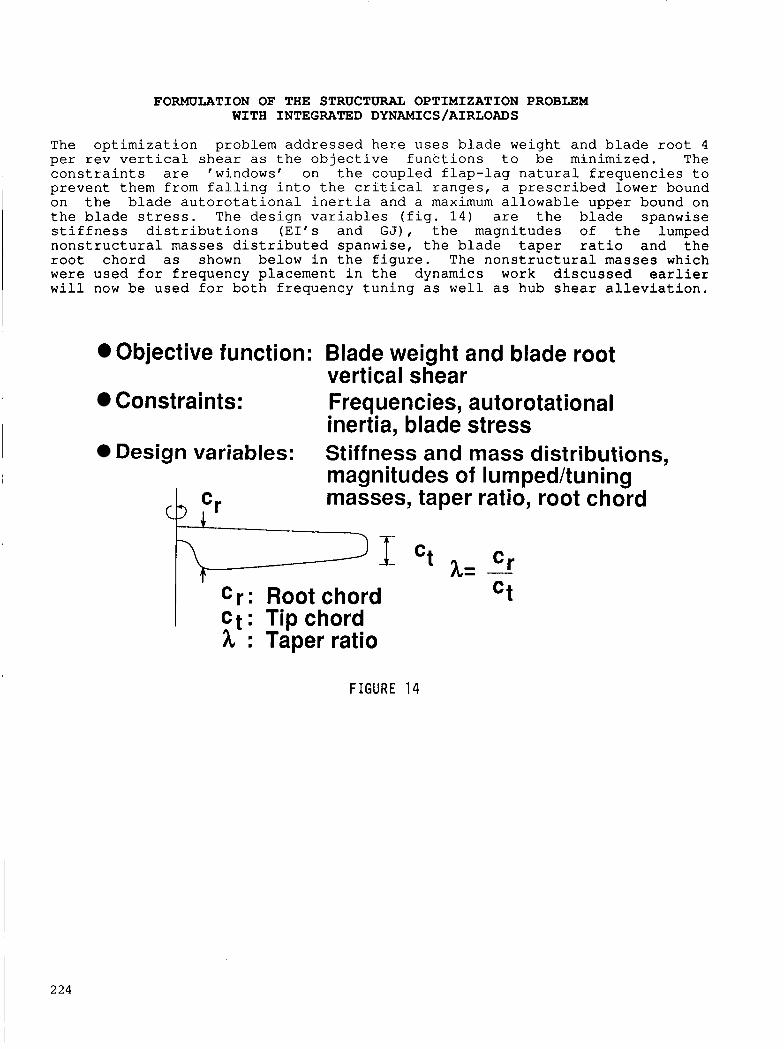
FORMULATION OF THE STRUCTURAL OPTIMIZATION PROBLEM WITH INTEGRATED DYNAMICS/AIRLOADS
The optimization problem addressed here uses blade weight and blade root 4 per rev vertical shear as the objective functions to be minimized. The constraints are 'windows' on the coupled flap-lag natural frequencies to prevent them from falling into the critical ranges, a prescribed lower bound on the blade autorotational inertia and a maximum allowable upper bound on the blade stress. The design variables (fig. 14) are the blade spanwise stiffness distributions ( E I ' s and GJ), the magnitudes of the lumped nonstructural masses distributed spanwise, the blade taper ratio and the root chord as shown below in the figure. The nonstructural masses which were used for frequency placement in the dynamics work discussed earlier will now be used for both frequency tuning as well as hub shear alleviation,
Objective function: Blade weight and blade root
Constraints: Frequencies, autorotational
Design variables:
vertical shear
inertia, blade stress Stiffness and mass distributions, mag nit udes of lum pedhuning masses, taper ratio, root chord
I 2 24
Ct I
C y : Root chord Ct: Tip chord h : Taper ratio
FIGURE 14

FLOW CHART OF THE STRUCTURAL OPTIMIZATION PROCEDURE WITH INTEGRATED DYNAMICS/AIRLOADS
Preassigned par am ete rs
The optimization procedure shown in the flow chart below (fig. 15) is initiated by identifying the blade preassigned parameters which are the parameters that are held fixed during optimization. The next step is to initialize the design variables and perform the internally coupled blade analysis which comprises blade aerodynamic, dynamic and structural analyses. A sensitivity analysis is part of the procedure and consists of evaluations of the derivatives of the objective function and the constraints with respect to the independent design variables. Once the sensitivity analysis is performed the approximate model is defined based on a standard approximation technique. Using CONMIN along with the approximate model updated design variable values are obtained. The process continues until convergence is achieved.
Updated design
Aerodynamic Sensitivity
FIGURE 15
stop
225
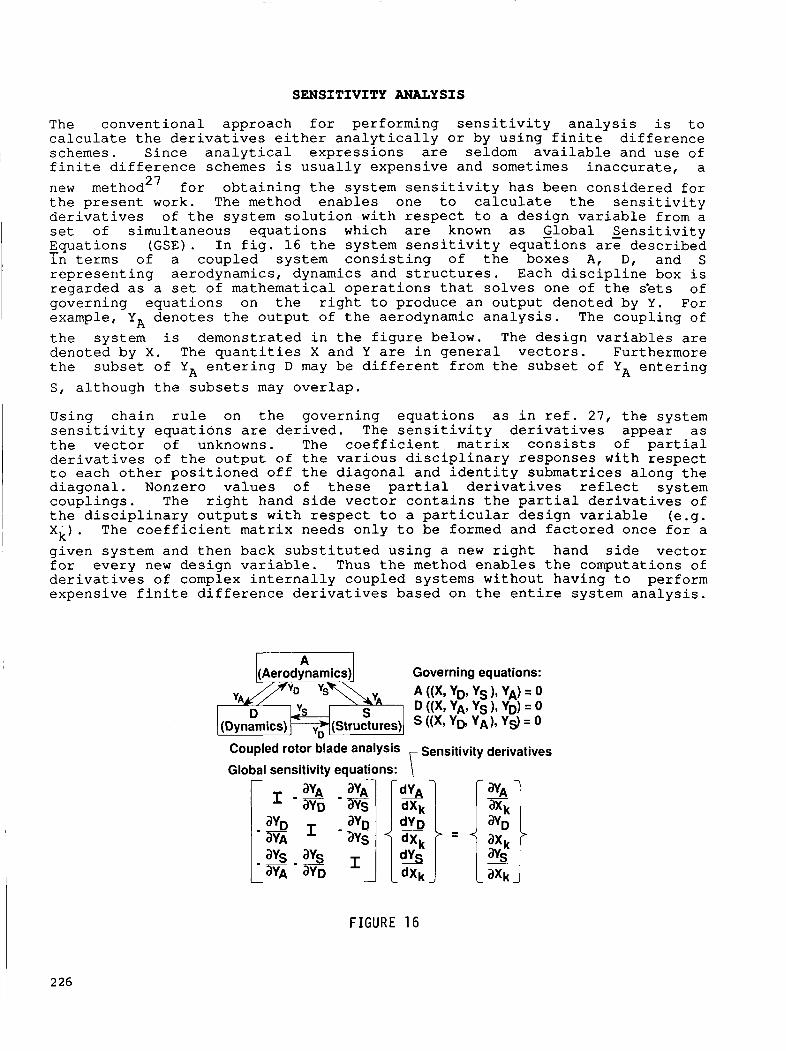
SENSITIVITY ANALYSIS
The c o n v e n t i o n a l a p p r o a c h f o r p e r f o r m i n g s e n s i t i v i t y a n a l y s i s i s t o c a l c u l a t e t h e d e r i v a t i v e s e i t h e r a n a l y t i c a l l y o r by u s i n g f i n i t e d i f f e r e n c e schemes. S i n c e a n a l y t i c a l e x p r e s s i o n s are se ldom a v a i l a b l e and u s e of f i n i t e d i f f e r e n c e schemes i s u s u a l l y e x p e n s i v e a n d sometimes i n a c c u r a t e , a new method 27 f o r o b t a i n i n g t h e s y s t e m s e n s i t i v i t y h a s been c o n s i d e r e d f o r t h e p r e s e n t work. The method e n a b l e s o n e t o c a l c u l a t e t h e s e n s i t i v i t y d e r i v a t i v e s o f t h e s y s t e m s o l u t i o n w i t h respect t o a d e s i g n var iable from a se t o f s i m u l t a n e o u s e q u a t i o n s which are known as G l o b a l S e n s i t i v i t y - E q u a t i o n s ( G S E ) . I n f i g . 1 6 t h e s y s t e m s e n s i t i v i t y e q u a t i o n s are described i n t e r m s o f a c o u p l e d s y s t e m c o n s i s t i n g of t h e boxes A, D , and S r e p r e s e n t i n g ae rodynamics , dynamics a n d s t r u c t u r e s . Each d i s c i p l i n e box i s regarded as a set o f m a t h e m a t i c a l o p e r a t i o n s t h a t s o l v e s one o f t h e s'ets of g o v e r n i n g e q u a t i o n s on t h e r i g h t t o p r o d u c e a n o u t p u t d e n o t e d by Y , Fo r example, YA d e n o t e s t h e o u t p u t o f t h e aerodynamic a n a l y s i s . The c o u p l i n g o f t h e s y s t e m i s d e m o n s t r a t e d i n t h e f i g u r e below. The d e s i g n v a r i a b l e s are d e n o t e d by X . The q u a n t i t i e s X a n d Y are i n g e n e r a l v e c t o r s . Fu r the rmore t h e s u b s e t of YA e n t e r i n g D may be d i f f e r e n t f rom t h e s u b s e t of YA e n t e r i n g S I a l t h o u g h t h e s u b s e t s may o v e r l a p .
Us ing c h a i n r u l e on t h e g o v e r n i n g e q u a t i o n s as i n r e f . 2 1 , t h e sys t em s e n s i t i v i t y e q u a t i o n s are d e r i v e d . The s e n s i t i v i t y der iva t ives appear as t h e v e c t o r o f unknowns. The c o e f f i c i e n t m a t r i x c o n s i s t s of p a r t i a l d e r i v a t i v e s of t h e o u t p u t of t h e v a r i o u s d i s c i p l i n a r y r e s p o n s e s w i t h respect t o each o ther p o s i t i o n e d of f t h e d i a g o n a l a n d i d e n t i t y s u b m a t r i c e s a l o n g t h e d i a g o n a l . Nonzero v a l u e s of t h e s e p a r t i a l d e r i v a t i v e s r e f l e c t sys t em c o u p l i n g s . The r i g h t hand side v e c t o r c o n t a i n s t h e p a r t i a l d e r i v a t i v e s o f t h e d i s c i p l i n a r y o u t p u t s w i t h respect t o a p a r t i c u l a r design v a r i a b l e ( e .g . Xi). The c o e f f i c i e n t m a t r i x n e e d s o n l y t o be formed a n d f a c t o r e d once f o r a g i v e n s y s t e m a n d t h e n b a c k s u b s t i t u t e d u s i n g a new r i g h t hand side v e c t o r f o r e v e r y new d e s i g n v a r i a b l e . Thus t h e method e n a b l e s t h e computa t ions of d e r i v a t i v e s of complex i n t e r n a l l y c o u p l e d s y s t e m s w i t h o u t h a v i n g t o pe r fo rm e x p e n s i v e f i n i t e d i f f e r e n c e d e r i v a t i v e s based on t h e e n t i r e s y s t e m a n a l y s i s .
Aerod Aarnicsll
- kDynarnics) ](Structures)]
Coupled rotor blade analysis Sensitivity derivatives Global sensitivity equations:
FIGURE 16
2 26
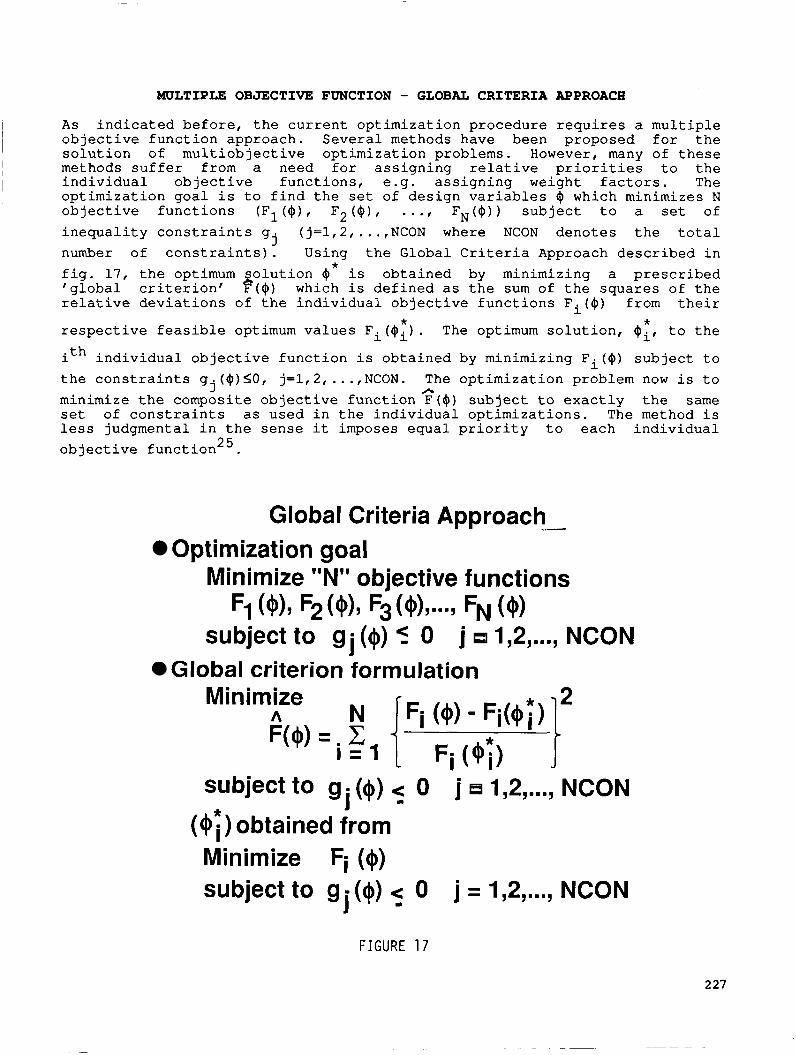
MULTIPLE OBJECTIVE FUNCTION - GLOBAL CRITERIA APPROACH
As indicated before, the current optimization procedure requires a multiple objective function approach. Several methods have been proposed for the solution of multiobjective optimization problems. However, many of these methods suffer from a need for assigning relative priorities to the individual objective functions, e.g. assigning weight factors. The optimization goal is to find the set of design variables I$ which minimizes N objective functions (F1($), F2($), . . ., FN($)) subject to a set of inequality constraints g (j=1,2, ..., NCON where NCON denotes the total number of constraints). Using the Global Criteria Approach described in fig. 17, the optimum solution $ is obtained by minimizing a prescribed 'global criterion' p($) which is defined as the sum of the squares of the relative deviations of the individual objective functions Fi($) from their
respective feasible optimum values Fi(Qi). The optimum solution, $i, to the
ith individual objective function is obtained by minimizing Fi (0) subject to the constraints g.($)SO, j=1,2, ..., NCON. The optimization problem now is to minimize the composite objective function F($) subject to exactly the same set of constraints as used in the individual optimizations. The method is less judgmental in the sense it imposes equal priority to each individual objective function .
j *
* *
3 A
25
Global Criteria Approach _.-
Mi n i m ize "N" objective f u nc t io ns Optimization goal
subject to gj (4) ? 0 j 1,2,..m, NCON Global criterion formulation
subject to g = (4) 4 0 j 1,2, ..., NCON
($i) obtained from Minimize Fi (4) subject to g ($)
I I
0 j = 1,2, ..., NCON I J
FIGURE 17
227
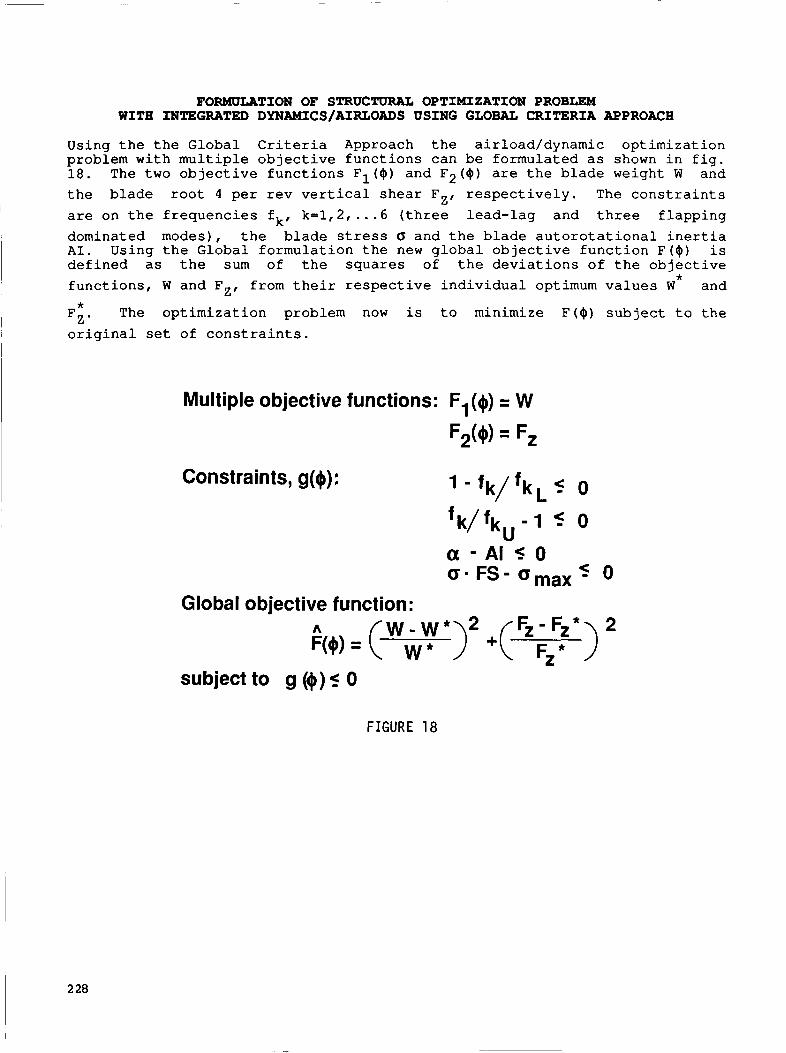
FORMULATION OF STRUCTURAL OPTIMIZATION PROBLEM WITH INTEGRATED DYNAMICS/AIRLOADS USING GLOBAL CRITERIA APPROACH
Using the the Global Criteria Approach the airload/dynamic optimization problem with multiple objective functions can be formulated as shown in fig. 18. The two objective functions F1($) and F2($) are the blade weight W and the blade root 4 per rev vertical shear FZ, respectively. The constraints are on the frequencies fk, k=1,2, ... 6 (three lead-lag and three flapping dominated modes), the blade stress d and the blade autorotational inertia AI. Using the Global formulation the new global objective function F($) is defined as the sum of the squares of the deviations of the objective functions, W and FZr from their respective individual optimum values W and
Fi. The optimization problem now is to minimize F ( 4 ) subject to the original set of constraints.
*
Multiple objective functions: F1($) = W
Constraints, g($):
a - A l S 0 O ' F S - O , ~ ~ ~ 0
Global objective function:
subject to g ($)s 0
FIGURE 18
I 2 28
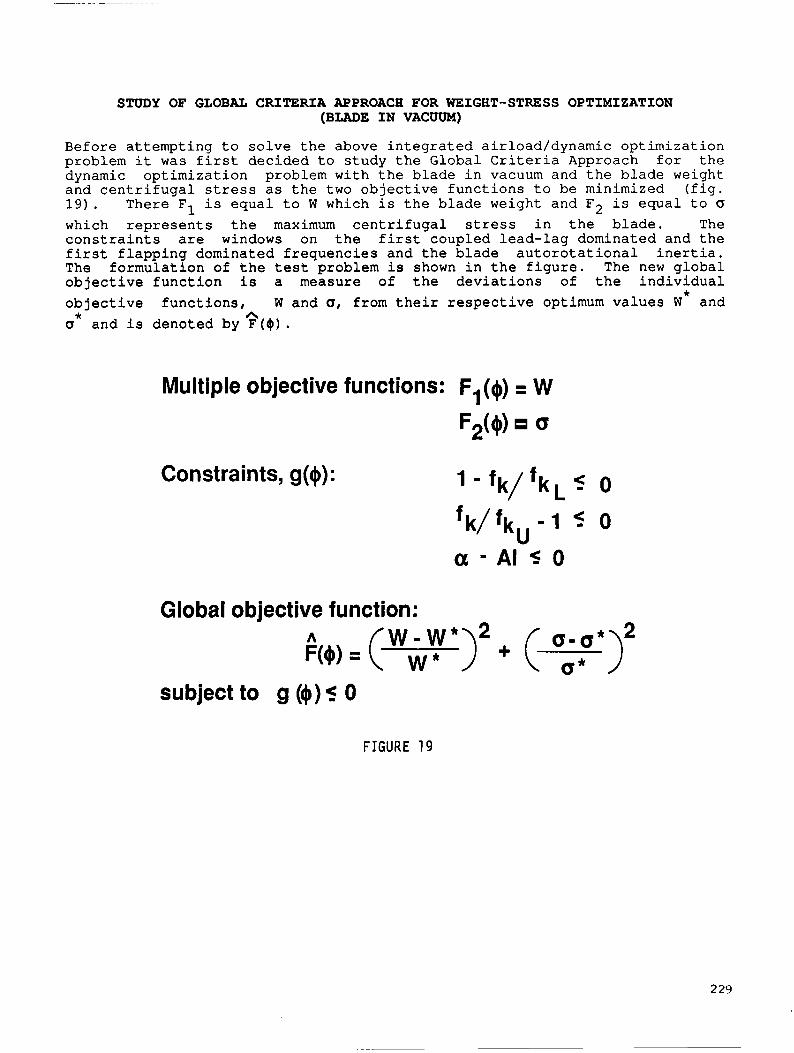
STUDY OF GLOBAL CRITERIA APPROACH FOR WEIGHT-STRESS OPTIMIZATION (BLADE IN VACUUM)
Before attempting t o solve the above integrated airload/dynamic optimization problem it was f i r s t decided t o study the Global Cr i t e r i a Approach f o r the dynamic optimization problem w i t h the blade i n vacuum and the blade weight and centr i fugal s t r e s s as the two objective functions t o be minimized ( f i g . 1 9 ) . There F1 i s equal t o W which i s the blade weight and F2 i s equal t o (T
which represents the maximum centr i fugal s t r e s s i n the blade. The constraints a r e windows on the f i r s t coupled lead-lag dominated and the f i r s t flapping dominated frequencies and t h e blade autorotat ional i n e r t i a . The formulation of t h e t e s t problem is shown i n the f igure. The new global objective function is a measure of the deviations of the individual objective functions, W and 0, from t h e i r respective optimum values W and d
* *
and i s denoted by $ ( $ ) I
Multiple objective functions: F,(+) = W
F&$) a
Constraints, g($):
Global objective function: w - w *
subject to g (+)5 0
FIGURE 19
2 29
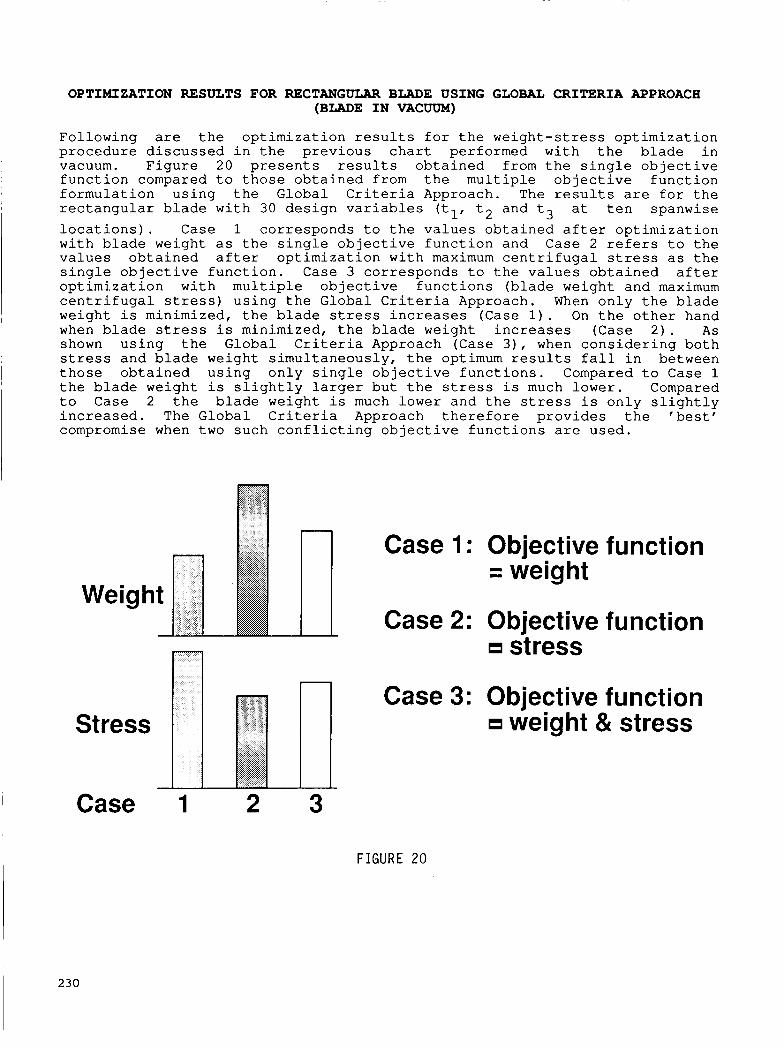
OPTIMIZATION RESULTS FOR RECTANGULAR BLADE USING GLOBAL CRITERIA APPROACH (BLADE IN VACUUM)
F o l l o w i n g are t h e o p t i m i z a t i o n r e s u l t s f o r t h e w e i g h t - s t r e s s o p t i m i z a t i o n p r o c e d u r e d i s c u s s e d i n t h e p r e v i o u s c h a r t performed w i t h t h e blade i n vacuum. F i g u r e 20 p r e s e n t s r e s u l t s o b t a i n e d f rom t h e s i n g l e ob jec t ive f u n c t i o n compared t o t h o s e o b t a i n e d f r o m t h e m u l t i p l e ob jec t ive f u n c t i o n f o r m u l a t i o n u s i n g t h e G l o b a l C r i t e r i a Approach . The r e s u l t s are f o r t h e r e c t a n g u l a r blade w i t h 30 d e s i g n v a r i a b l e s (tl, t2 a n d t3 a t t e n s p a n w i s e l o c a t i o n s ) . Case 1 c o r r e s p o n d s t o t h e v a l u e s o b t a i n e d a f t e r o p t i m i z a t i o n w i t h blade w e i g h t a s t h e s i n g l e ob jec t ive f u n c t i o n a n d Case 2 refers t o t h e v a l u e s o b t a i n e d a f t e r o p t i m i z a t i o n w i t h maximum c e n t r i f u g a l stress as t h e s i n g l e o b j e c t i v e f u n c t i o n . Case 3 c o r r e s p o n d s t o t h e v a l u e s o b t a i n e d a f t e r o p t i m i z a t i o n w i t h m u l t i p l e ob jec t ive f u n c t i o n s (blade w e i g h t a n d maximum c e n t r i f u g a l s tress) u s i n g t h e Global C r i t e r i a Approach . When o n l y t h e blade w e i g h t i s m i n i m i z e d , t h e blade stress i n c r e a s e s (Case 1 ) . On t h e o t h e r h a n d when blade stress i s m i n i m i z e d , t h e blade w e i g h t i n c r e a s e s (Case 2 ) . A s shown u s i n g t h e Global C r i t e r i a Approach (Case 31, when c o n s i d e r i n g b o t h stress a n d blade w e i g h t s i m u l t a n e o u s l y , t h e opt imum r e s u l t s f a l l i n b e t w e e n t h o s e o b t a i n e d u s i n g o n l y s i n g l e ob jec t ive f u n c t i o n s . Compared t o Case 1 t h e blade w e i g h t i s s l i g h t l y larger b u t t h e s tress i s much lower. Compared t o Case 2 t h e blade w e i g h t i s much l o w e r a n d t h e stress i s o n l y s l i g h t l y i n c r e a s e d . The Global C r i t e r i a Approach t h e r e f o r e provides t h e 'best ' compromise when two s u c h c o n f l i c t i n g ob jec t ive f u n c t i o n s are u s e d .
II Case 1 : Objective function = weight
Case 2: Objective function - stress
Case 3: Objective function Stress weight & stress
Case 1 2 3
FIGURE 20
I 230

CONCLUDING REMARKS
The paper addresses t h e problem of s t r u c t u r a l opt imizat ion of he l i cop te r r o t o r b lades with in t eg ra t ed dynamic and aerodynamic design cons idera t ions . R e s u l t s of recent opt imizat ion work on r o t o r blades f o r m i n i m u m weight w i t h c o n s t r a i n t s on mul t ip le coupled na tu ra l f lap- lag frequencies , blade a u t o r o t a t i o n a l i n e r t i a and c e n t r i f u g a l stress has been reviewed. A s t r a t egy has been def ined f o r t h e ongoing a c t i v i t i e s i n t h e in t eg ra t ed dynamic/aerodynamic opt imizat ion of r o t o r b lades . A s a f i r s t s t e p the in t eg ra t ed dynamic/airload opt imizat ion problem has been formulated. To c a l c u l a t e s y s t e m s e n s i t i v i t y de r iva t ives necessary f o r t h e opt imizat ion r ecen t ly developed Global S e n s i t i v i t y Equations (GSE) a r e being inves t iga t ed . A n e e 5 f o r mui t ip le objec t ive func t ions f o r t h e in t eg ra t ed opt imizat ion problem has been demonstrated and var ious techniques f o r so lv ing t h e mul t ip l e objec t ive funct ion opt imizat ion a r e being inves t iga t ed . The method c a l l e d t h e 'Global C r i t e r i a Approach' has been appl ied t o a t e s t problem w i t h t h e blade i n vacuum and t h e blade weight and t h e c e n t r i f u g a l stress a s t h e mul t ip l e ob jec t ives . The r e s u l t s i n d i c a t e t h a t t h e method i s q u i t e e f f e c t i v e i n so lv ing opt imizat ion problems w i t h c o n f l i c t i n g objec t ive func t ions . F ig . 2 1) .
Reviewed procedure for dynamic optimization with minimum weight objective and frequency, autorotational inertia and stress constraints
Defined strategy for integrating the above with complete aerodynamic optimization
Formulated integrated dynamidairload optimization
Investigating global sensitivity equations for calculating system sensitivity derivatives
Described need for multiple objective functions
Investigated 'Global Criteria' approach for mu1 t i ple objective optimization
FIGURE 21
231
REFERENCES
1.
2.
3.
4.
5.
6.
7.
8.
9.
10.
11.
12.
13.
14.
232
Ashley, H., "On Making Things the Best - Aeronautical Use of Optimization," AIAA J. Aircraft, Vol. 19, No. 1, 1982.
Sobieszczanski-Sobieski, J., "Structural Optimization Challenges and Opportunities," presented at Int. Conference on Modern Vehicle Design Analysis, London, England, June 1983.
Miura, H., "Application of Numerical Optimization Method to Helicopter Design Problems: A Survey," NASA TM 86010, October 1984.
Bennett, R. L., "Application of Optimization Methods to Rotor Design Problems," Vertica, Vol. 7, No. 3, 1983, pp. 201-208.
Sobieszczanski-Sobieski, J., "Recent Experiences in Multidisciplinary Analysis and Optimization," NASA CP 2327, 1984.
Peters, D. A., KO, Timothy, ROSSOW, Mark P., "Design of Helicopter Rotor Blades for Desired Placement of Natural Frequencies," Proc. of the 39th Annual Forum of the AHS, May 9-11, 1983, St. Louis, Missouri.
Taylor, R. B., "Helicopter Vibration Reduction by Rotor Blade Modal Shaping1*, Proc. of the 38th Annual Forum of the AHS, May 4-7, 1982, Anaheim, California.
Chattopadhyay, Aditi and Walsh, Joanne L., "Minimum Weight Design of Rectangular and Tapered Helicopter Rotor Blades with Frequency Constraints," Proc. of the 2nd Int. Conference on Rotorcraft Basic Research, February 16-18, 1988, College Park, Maryland. Also available as NASA TM 100561, February 1988.
Chattopadhyay, Aditi and Walsh, Joanne L., "Minimum Weight Design of Rotorcraft Blades with Multiple Frequency and Stress Constraints," Proc. of the AIAA/ASME/ASCE/AHS 29th Structures, Structural Dynamics and Materials Conference, Williamsburg, Virginia, April 18-20, 1988. AIAA Paper No. 88-2337-CP. Also available as NASA TM 100569, March 1988.
Weller, W. H. and Davis M. W., "Experimental Verification of Helicopter Blade Designs Optimized for Minimum Vibration," Proc. of the 44th Annual Forum of the AHS, June 16-18, 1988, Washington, D. C.
Walsh, J. L., Bingham, G. J., and Riley, M. F., Optimization Methods Applied to the Aerodynamic Design of Helicopter Rotor Blades. Journal of the American Helicopter Society, Vol 32, No. 4, October 1987.
Nixon, M. W., "Preliminary Structural Design of Composite Main Rotor Blades for Minimum Weight," NASA TP-2730, July 1987.
Peters, D. A., KO, Timothy, Korn, Alfred, and Rossow, Mark P., "Design of Helicopter Rotor Blades for Desired Placements of Natural Frequencies," Proc. of the 39th Annual Forum of the AHS, May 9-11, 1983, St. Louis, Mo.
Hanagud, S., Chattopadhyay, Aditi, Yillikci, Y. K., Schrage, D., and Reichert, G., "Optimum Design of a Helicopter Rotor Blade," Paper No.
12, Proc. of the 12th European Rotorcraft Forum, September 22-25, 1986, Garmisch-Partenkirchen, West Germany.
15.
16.
17.
18.
19.
20.
21.
22.
23.
24.
25.
26.
27.
Peters, D. A., Rossow, Mark P., Korn, Alfred, and KO, Timothy, "Design of Helicopter Rotor Blades for Optimum Dynamic Characteristics," Computers & Mathematics with Applications, Vol. 12A, No. 1, 1986, pp. 85-109.
Friedmann, P. P. and Shantakumaran, P., "Optimum Design of Rotor Blades for Vibration Reduction in Forward Flight," Proc. of the 39th Annual Forum of the AHS, May 9-11, 1983, St. Louis, Missouri.
Celi, R.. and Friedmann, P. P., "Efficient Structural Optimization of Rotor Blades with Straight and Swept Tips," Proc. of the 13th European Rotorcraft Forum, Arles, France, September 1987. Paper No. 3-1.
Adelman, H. M. and Mantay, W. R., "An Initiative in Integrated Multidisciplinary Optimization of Rotorcraft," To be presented at the Second NASA/Air Force Symposium on Recent Advances in Multidisciplinary Analysis and Optimization, Hampton, Virginia, September 28-30, 1988.
Lim, Joon and Chopra, Inderjit, "Stability Sensitivity Analysis for the Aeroelastic Optimization of a Helicopter Rotor," Proc. of the AIAA/ASME/ASCE/AHS 29th Structures, Structural Dynamics and Materials Conference, Williamsburg, Virginia, April 18-20, 1988.
Johnson, W., "A Comprehensive Analytical Model of Rotorcraft Aerodynamics and Dynamics," Part 11: User's Manual, NASA TM 81183, June 1980.
Lang, K. W., and Nemat-Nasser, S., "An Approach for Estimating Vibration Characteristics of Nonuniform Rotor Blades," AIAA Journal, Vol. 17, No. 9, September 1979.
Johnson, W., "A Comprehensive Analytical Model of Rotorcraft Aerodynamics and Dynamics," Part I: Analysis Development, NASA TM 81182, June 1980.
Vanderplaats, G. N., "CONMIN - A Fortran Program for Constrained Function Minimization," User's Manual, NASA TMX-62282, August 1973.
Walsh, Joanne L . , "Applications of Numerical Optimization Procedures to a Structural Model of a Large Finite-Element Wing," NASA TM 87597, 1986.
Rao, S. S., "Multiobjective Optimization in Structural Design with Uncertain Parameters and Stochastic Processes," AIAA Journal, Vol. 22, No. 11, November 1984.
Callahan, C. and Bassett, D., "Application of a Comprehensive Analytical Model of Rotorcraft Aerodynamics and Dynamics (CAMRAD) to the McDonnell Douglas AH-64A Helicopter," Proc. of 43rd Annual AHS Forum, St. Louis, Missouri, May 18-20, 1987, pp. 293-355.
Sobieszczanski-Sobieski, J., "On the Sensitivity of Complex Internally Coupled Systems," NASA TM 100537, January 1988.
233
N89- 25 15 7 - _
MULTI-OBJECTIVE/LOADING OPTIMIZATION FOR ROTATING COMPOSITE FLEXBEAMS
BRIAN K. HAMILTON JAMES R. PETERS
McDonnell Douglas Helicopter Company Mesa, AZ
PRECEDING PAGE BLANK NOT FILMED
235
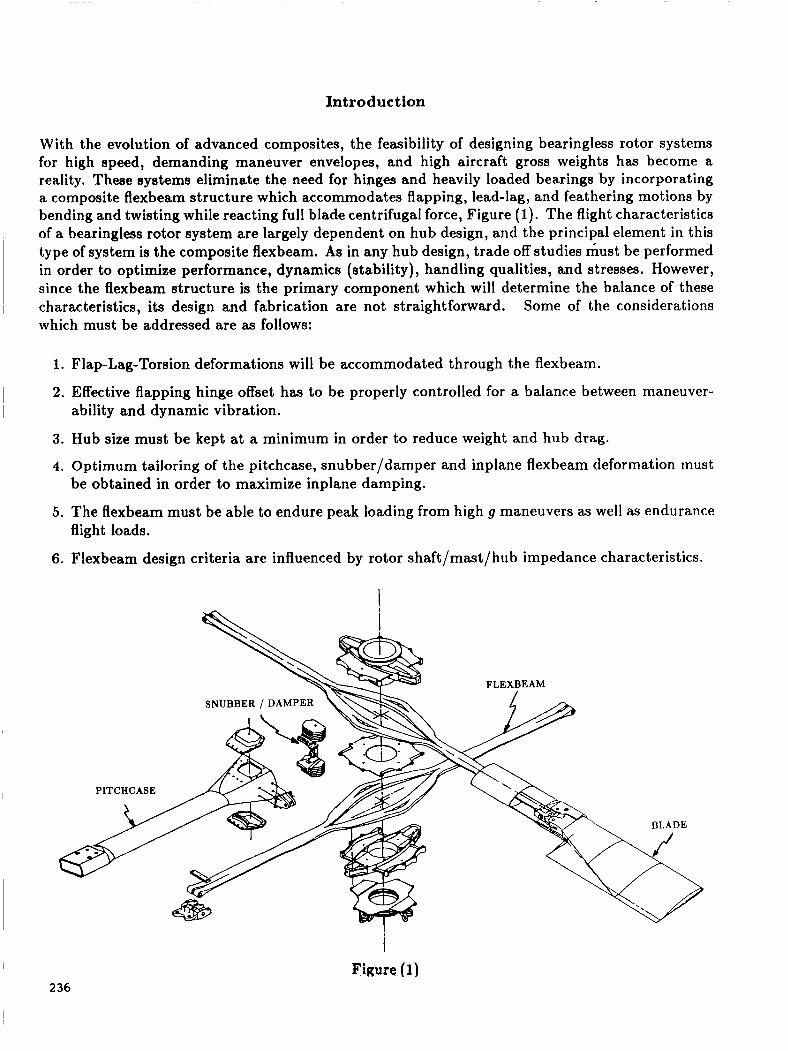
Introduction
With the evolution of advanced composites, the feasibility of designing bearingless rotor systems for high speed, demanding maneuver envelopes, and high aircraft gross weights has become a reality. These systems eliminate the need for hinges and heavily loaded bearings by incorporating a composite flexbeam structure which accommodates flapping, lead-lag, and feathering motions by bending and twisting while reacting full blade centrifugal force, Figure (1). The flight characteristics of a bearingless rotor system are largely dependent on hub design, and the principal element in this type of system is the composite flexbeam. As in any hub design, trade off studies must be performed in order to optimize performance, dynamics (stability), handling qualities, and stresses. However, since the flexbeam structure is the primary component which will determine the balance of these characteristics, its design and fabrication are not straightforward. Some of the considerations which must be addressed are as follows:
1. Flap-Lag-Torsion deformations will be accommodated through the flexbeam.
2. Effective flapping hinge offset has to be properly controlled for a balance between maneuver-
3. Hub size must be kept at a minimum in order to reduce weight and hub drag.
4. Optimum tailoring of the pitchcase, snubber/damper and inplane flexbeam deformation must
5 . The flexbeam must be able to endure peak loading from high g maneuvers as well as endurance
6. Flexbeam design criteria are influenced by rotor shaft/mast/hub impedance characteristics.
ability and dynamic vibration.
be obtained in order to maximize inplane damping.
flight loads.
PITCHCASE
& i
Figure (1) 2 36
Model Development
At McDonnell Douglas Helicopter Company, the previous considerations have been integrated into a mathmatical procedure for design and optimization of advanced composite bearingless rotor systems. Because of the highly coupled structural and damping requirements of the flexbeam, it wag critical to include a representation of the pitchcase and snubber/damper, as well as the flexbeam, in the math model. Various alternatives can be proposed for formulation of such a problem:
1. choice of flexbeam cross section
2. choice of composite material type and configuration
3. choice of hub attachment configuration
4. choice of objective function and constraints for optimization routine
(a) minimization of peak stresses due to flap, lag and torsion with a requirement on damper
(b) maximization of rotor damping with upper bound contraints on stresses motion and hence rotor inplane damping
Flexbeam Cross Section
Jn an effort to simplify the beam design and fabrication, a comprehensive review of candidate cross sections waa conducted under a company IRAD*program . Geometries studied ranged from rectangular, cruciform and multiple “H” closed sections to multiple element open sections and elastomericly connected rectangular cross sections.
Based on this review, a simple rectangular section was selected as the best overall configuration for the advanced flexbeam. In addition to the efficient load carrying capability, the relatively straightforward rectangular configuration offered advantages of simplified fabrication resulting in lower production costs, superior quality control, and simplified inspectability.
Composite Material Selection
The composite material selected for the advanced flexbeam was S-2 fiberglass impregnated with a 350 deg F cured “toughened resin” epoxy system. The resin system was selected based on the results of an extensive study of candidate systems conducted under other McDonnell Douglas Helicopter Company IRAD programs.
The S-2 fiberglass provides improved compressive stress margins and reduces long term enviromen- tal degradation concerns associated with the previously selected Kevlar material.
lnternal Research and Development *
237
Hub Attachment Configuration
Flexbeam design criteria are influenced by rotor shaft/ mast/hub impedance characteristics. A relatively soft rotor mast mount can significantly modify a flexbeam’s effective flapping hinge offset and bending requirements. An inhouse analysis has indicated that a softer mount can result in an increased level of airframe vibration and the need for vibration suppression systems.
The Helicopter Advanced Rotor Program (HARP) flight test program demonstrated low vibra- tion characteristics for the initial composite flexbeams using the McDonnell Douglas Helicopter Company rigid mast system with no active or passive vibration control equipment required. The advanced beam design approach was also based on the proven rigid mast configuration.
Objective Function and Constraints
Significant progress has been made both by industry and the goverment in the study of flexbeam design over the past ten years. McDonnell Douglas Helicopter Company has kept abreast of this work and has incorporated the lessons learned both by ourselves and other investigators into the present math model.
The primary goal in flexbeam sizing is to achieve the required rotor blade motions without exceeding the allowable stresses in the composite material. Simultaneous goals are to minimize flexbeam length, to achieve blade flap and lead-lag hinge offsets which provide suitable dynamics properties, and to obtain sufficient lead-lag motion a t the snubber/damper for satisfactory dynamic response to cyclic loads. The criteria for blade motions include the maximum blade cyclic flap, lead-lag, and feathering motions seen in the flight envelope (the one hour condition), as well as endurance limit, static droop and start-up conditions.
notor blade flapping, lead-lag and feathering motions acting in combination with the blade and pitchcase centrifugal force cause flexbeam deformations. The flexbeam must be so designed aa to allow these blade motions without exceeding the allowable stresses of the fiber composite of which it is constructed. Because blade motions have both steady and cyclic components, fatigue loads prevail and the fatigue strength of the composite material is critical for design. Therefore, the one hour and endurance limit flap, lead-lag, and torsional motions are applied to the flexbeam. The cyclic stresses which the one hour motions cause should not exceed the corresponding one hour fatigue allowables of the composite material. Similarly, cyclic stresses due to endurance limit loads should not exceed endurance limit fatigue allowables. In addition, criteria for the blade motions include static droop and start-up torque conditions. These goals, taken together, are used in sizing the flexbeam in lieu of a complete fatigue life analysis covering the full operating spectrum of the helicopter.
The objective function selected for the advanced beam was minimization of stresses due to a critical combination of flap, lead-lag and torsional deformation. In addition, a displacement constraint is imposed for adequate damper motion to satisfy the dynamic requirements.
238

Theoretical Background
The conventional finite element method is not applicable in the case of an elastic structure under- going high angular motions. This is of interest because numerous structural configurations such as spinning helicopter blades, satellites, rotating flexbeams, shafts and linkages fall into this cate- gory. The analysis of these rotating structures differs from that of stationary structures due to the complexity of the accelerations which act throughout the system. In addition to the accelerations resulting from elastic structural deformations, contributions due to Coriolis and centripetal accel- eration may be of significance. Also, the stiffness characteristics of the structure may be modified by the internal loads induced by the centrifugal forces. The finite element formulation given in this section includes all these effects in a uniform general formulation.
The variational principle useful for problems in dynamics is Hamilton's principle. The functional for this principle is the Lagrangian, L, defined as
where T is the kinetic energy, U is the strain energy, and V is the potential of the applied loads. The strain energy density may be expressed as
where C is the material elastic matrix. The potential of the applied loads, V , may be expressed as the sum of the potential of the body forces and surface tractions as
where is the body force vector, u is the displacement vector, and T' is the vector of surface tractions. The second integral is over the surface of the body on which the surface tractions are prescribed.
The total kinetic energy density is defined as
1 2
dT = -pVTVdV (4)
where p is the density of the material and V is the absolute velocity of a particle in the element as given by
v = VRjg + u + Gu ( 5 )
239
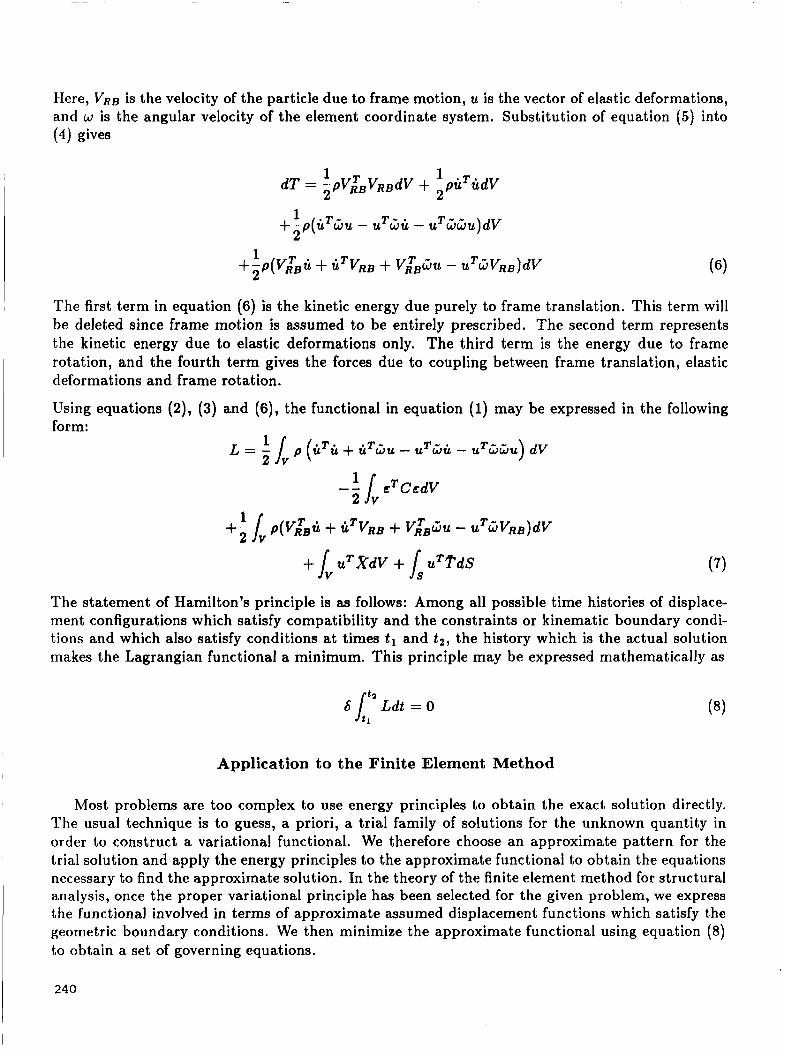
Here, VRB is the velocity of the particle due to frame motion, u is the vector of elastic deformations, and w is the angular velocity of the element coordinate system. Substitution of equation ( 5 ) into (4) gives
T - - . 1 2
+ - p(uTL;ru - uT&U - u wwu)dV
The first term in equation (6) is the kinetic energy due purely to frame translation. This term will be deleted since frame motion is assumed to be entirely prescribed. The second term represents the kinetic energy due to elastic deformations only. The third term is the energy due to frame rotation, and the fourth term gives the forces due to coupling between frame translation, elastic deformations and frame rotation.
Using equations (2), (3) and (6), the functional in equation (1) may be expressed in the following form:
L = - J p (ti!"& + tiT3u - u*~iti - U~GGU) dV 1 2 v
11 aTCedV 2 v
The statement of Hamilton's principle is as follows: Among all possible time histories of displace- ment configurations which satisfy compatibility and the constraints or kinematic boundary condi- tions and which also satisfy conditions at times t l and t 2 , the history which is the actual solution makes the Lagrangian functional a minimum. This principle may be expressed mathematically as
b l : Ldt = 0
Application to the Finite Element Method
Most problems are too complex to use energy principles to obtain the exact solution directly. The usual technique is to guess, a priori, a trial family of solutions for the unknown quantity in order to construct a variational functional. We therefore choose an approximate pattern for the trial solution and apply the energy principles to the approximate functional to obtain the equations necessary to find the approximate solution. In the theory of the finite element method for structural analysis, once the proper variational principle has been selected for the given problem, we express the functional involved in terms of approximate assumed displacement functions which satisfy the geometric boundary conditions. We then minimize the approximate functional using equation (8) to obtain a set of governing equations.
240
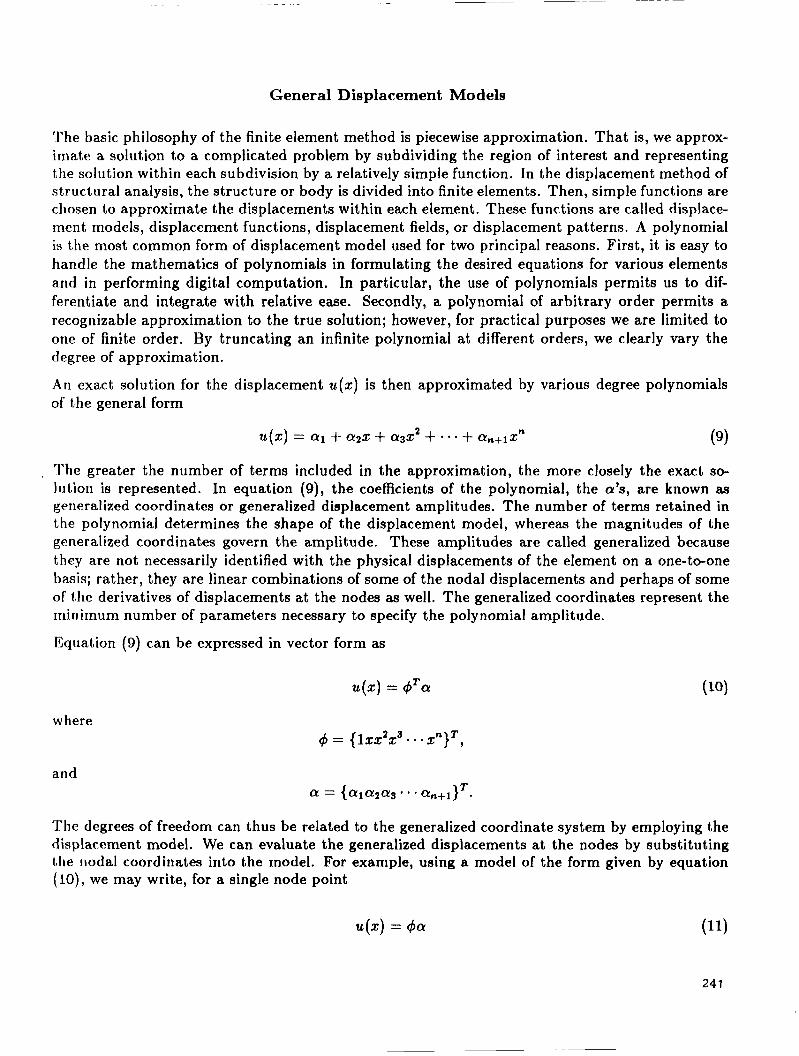
General Displacement Models
The basic philosophy of the finite element method is piecewise approximation. That is, we approx- irriate a solution to a complicated problem by subdividing the region of interest and representing the solution within each subdivision by a relatively simple function. In the displacement method of structural analysis, the structure or body is divided into finite elements. Then, simple functions are chosen to approximate the displacements within each element. These functions are called displace- ment models, displacement functions, displacement fields, or displacement patterns. A polynomial is the most common form of displacement model used for two principal reasons. First, it is easy to handle the mathematics of polynomials in formulating the desired equations for various elements and in performing digital computation. In particular, the use of polynomials permits us to dif- ferentiate and integrate with relative ease. Secondly, a polynomial of arbitrary order permits a recognizable approximation to the true solution; however, for practical purposes we are limited to one of finite order. By truncating an infinite polynomial at different orders, we clearly vary the degree of approximation.
A n exact solution for the displacement u(z ) is then approximated by various degree polynomials of the general form
u(x) = CY1 1- cy22 + a3x2 + * * * + an+lzn (9)
, The greater the number of terms included in the approximation, the more closely the exact so- lution is represented. In equation (9), the coefficients of the polynomial, the a ’ s , are known as gcrieralized coordinates or generalized displacement amplitudes. The number of terms retained in the polynomial determines the shape of the displacement model, whereas the magnitudes of the generalized coordinates govern the amplitude. These amplitudes are called generalized because they are not necessarily identified with the physical displacements of the element on a one-to-one basis; rather, they are linear combinations of some of the nodal displacements and perhaps of some of the derivatives of displacements at the nodes as well. The generalized coordinates represent the minimum number of parameters necessary to specify the polynomial amplitude.
Equation (9) can be expressed in vector form as
u(x) = t$TCY
where t$ = { 1xx2x3 - - * xn}T,
The degrees of freedom can thus be related to the generalized coordinate system by employing the displacement model. We can evaluate the generalized displacements at the nodes by substituting (,lie iiodal coordinates into the model. For example, using a model of the form given by equation (IO), we may write, for a single node point
24 1
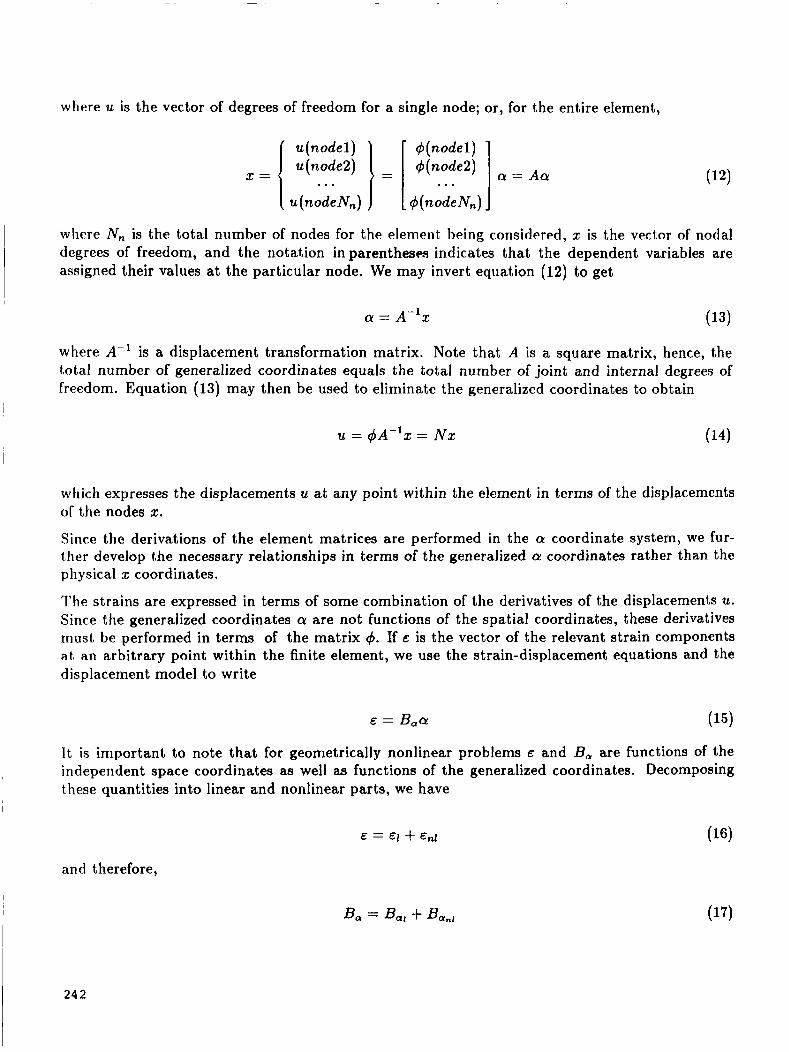
where u is the vector of degrees of freedom for a single node; or, for the entire element,
u(node1) 4 (nodel) x = ( u(n.ofe2))- [ 4( node2) ... ] a = A a
u( nodeN,,) 4(nodeNn)
where N,, is the total number of nodes for tohe element, being considered, x is the vector of nodal degrees of freedom, and the notation in parentheses indicates that the dependent variables are assigned their values at the particular node. We may invert equation (12) to get
a = A-'x (13)
where A-' is a displacement transformation matrix. Note that A is a square matrix, hence, the total number of generalized coordinates equals the total number of joint and internal degrees of freedom. Equation (13) may then be used to eliminate the generalized coordinates to obtain
u = $A-'x = N x (14)
which expresses the displacements u at any point within the element in terms of the displacements of the nodes 5.
Since the derivations of the element matrices are performed in the a coordinate system, we fur- ther develop the necessary relationships in terms of the generalized a coordinates rather than the physical x coordinates.
The strains are expressed in terms of some combination of the derivatives of the displacements u. Since the generalized coordinates ar are not functions of the spatial coordinates, these derivatives must be performed in terms of the matrix 4. If E is the vector of the relevant strain components at an arbitrary point within the finite element, we use the strain-displacement equations and the displacement model to write
It is important to note that for geometrically nonlinear problems E and B, are functions of the independent space coordinates as well as functions of the generalized coordinates. Decomposing these quantities into linear and nonlinear parts, we have
l and therefore,
242

If 0 is the vector of stresses corresponding to the strains e, we may use an appropriate matrix form of the stress strain equations and equation (15) to write the element stresses as
u = CB,a
where C is the matrix of material constants given by equation (3).
Variational Formulation of Element Matrices
As discussed above, the method used here for calculating the element matrices and load vectors is the application of Hamilton's principle. Therefore, we develop the Lagrangian given in equation (7) in terms of the CY generalized coordinates and apply equation ( 8 ) to obtain the element equations in terms of the generalized coordinates and shape functions.
In order to formulate the Lagrangian in terms of the generalized coordinates, we insert equations (11), (15) and (18) into equation (7) to obtain
aTBzCB,adV
-:/ p (hTJd& + hTB2a - aTB2& - aTBla) dV 2 v
-- 1 / p (VzB4iY + h T 4 T V ~ ~ + VzB&ja - CY T 4 T - v w R B ) dV 2 v
- aT$TXdV - aTg5TpdS
and B2 = dT&d
Applying the variational principle given by equation (8), we obtain
243
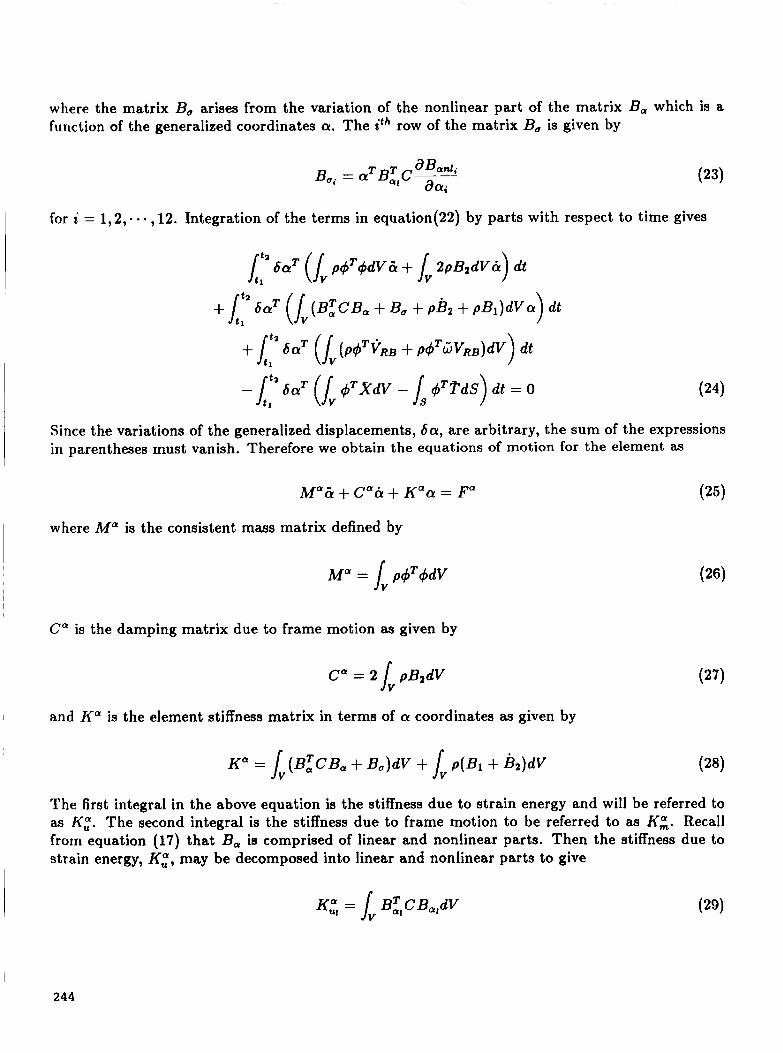
where the matrix B, arises from the variation of the nonlinear part of the matrix B, which is a function of the generalized coordinates a. The Z t h row of the matrix B, is given by
~
for i = 1,2, -. - ,12. Integration of the terms in equation(22) by parts with respect to time gives
Since the variations of the generalized displacements, 6a, are arbitrary, the sum of the expressions in parentheses must vanish. Therefore we obtain the equations of motion for the element as
I where Ma is the consistent mass matrix defined by
C" is the damping matrix due to frame motion it9 given by
l and K" is the element stiffness matrix in terms of a coordinates as given by
Ka = /Y(B:CB, + B,)dV + / V p ( B l + &)dV (28)
The first integral in the above equation is the stiffness due to strain energy and will be referred to as K,". The second integral is the stiffness due to frame motion to be referred to as Kk. Recall from equation (17) that B, is comprised of linear and nonlinear parts. Then the stiffness due to strain energy, K,", may be decomposed into linear and nonlinear parts to give
I 244
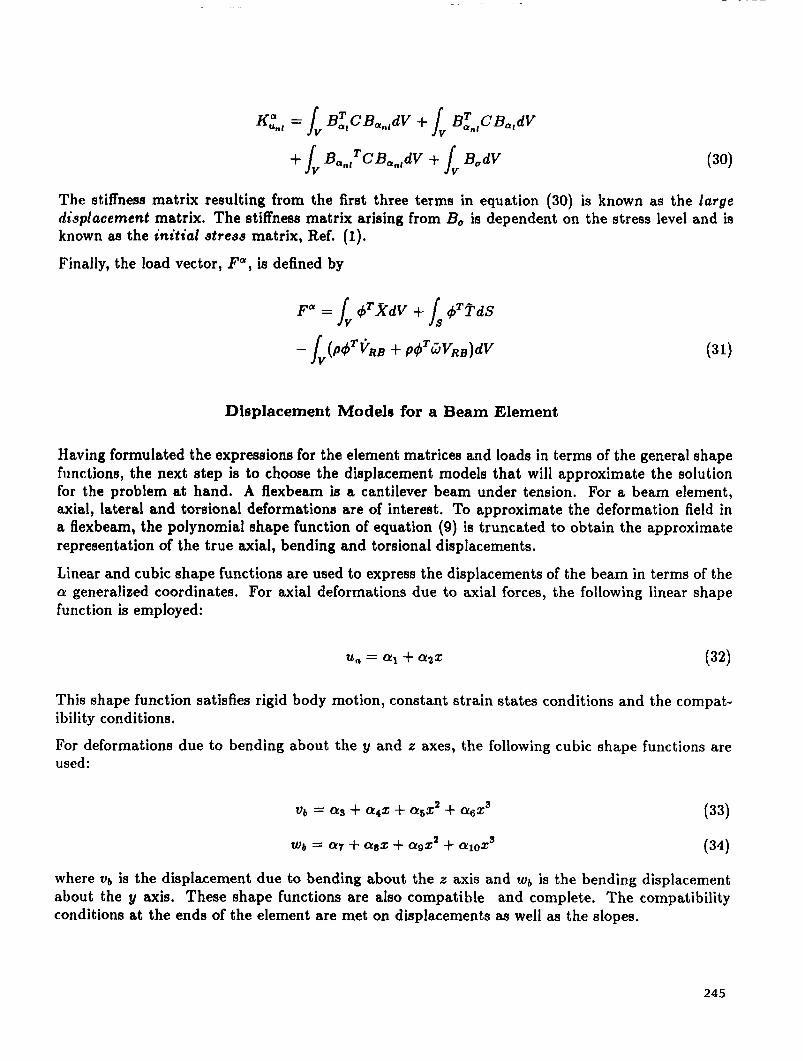
The stiffness matrix resulting from the first three terms in equation (30) is known as the large displacement matrix. The Stiffness matrix arising from Bo is dependent on the stress level and is known as the initial stress matrix, Ref. (1).
Finally, the load vector, Fa, is defined by
Displacement Models for a Beam Element
Having formulated the expressions for the element matrices and loads in terms of the general shape fiinctions, the next step is to choose the displacement models that will approximate the solution for the problem at hand. A flexbeam is a cantilever beam under tension. For a beam element, axial, lateral and torsional deformations are of interest. To approximate the deformation field in a flexbeam, the polynomial shape function of equation (9) is truncated to obtain the approximate representation of the true axial, bending and torsional displacements.
Linear and cubic shape functions are used to express the displacements of the beam in terms of the a generalized coordinates. For axial deformations due to axial forces, the following linear shape function is employed:
This shape function satisfies rigid body motion, constant strain states conditions and the compat- ibili ty conditions.
For deformations due to bending about the y and z axes, the following cubic shape functions are used:
where ub is the displacement due to bending about the z axis and wb is the bending displacement about the y axis. These shape functions are also compatible and complete. The compatibility conditions at the ends of the element are met on displacements as well as the slopes.
245
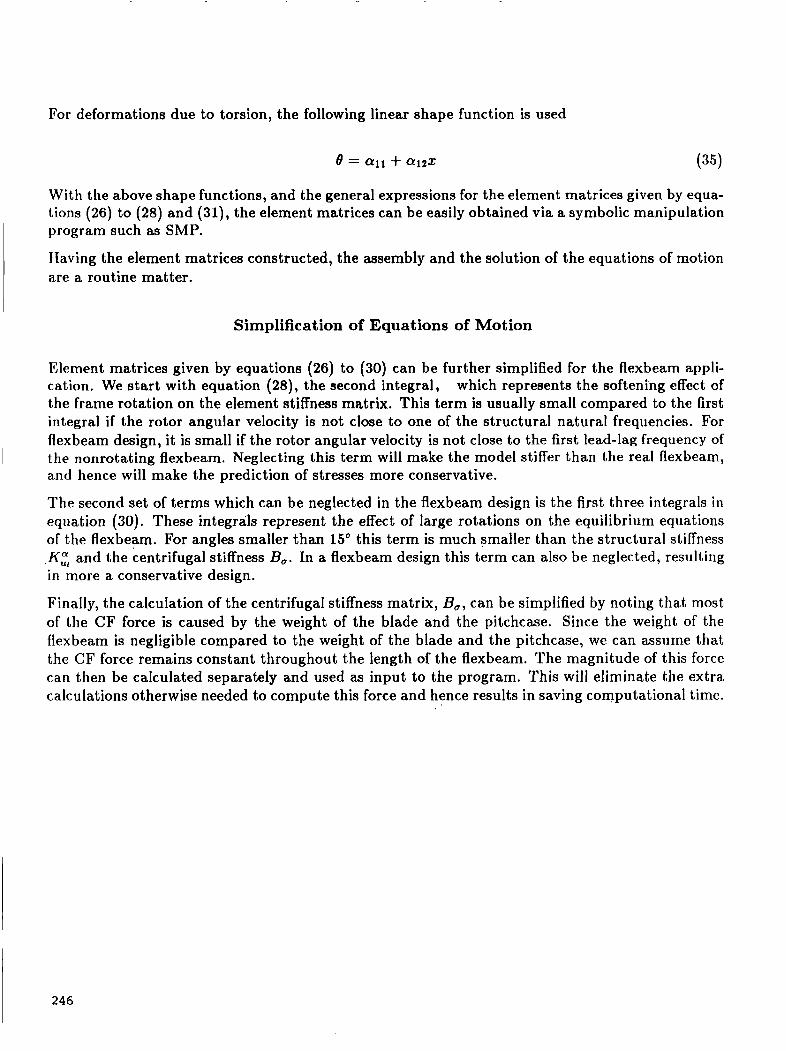
For deformations due to torsion, the following linear shape function is used
e = all + a12t (35)
With the above shape functions, and the general expressions for the element matrices given by equa- tions (26) to (28) and (31), the element matrices can be easily obtained via a symbolic manipulation program such as SMP.
Having the element matrices constructed, the assembly and the solution of the equations of motion are a routine matter.
Simplification of Equations of Motion
Element matrices given by equations (26) to (30) can be further simplified for the flexbeam appli- cation. We start with equation (28), the second integral, which represents the softening effect of the frame rotation on the element stiffness matrix. This term is usually small compared to the first integral if the rotor angular velocity is not close to one of the structural natural frequencies. For flexbeam design, it is small if the rotor angular velocity is not close to the first lead-lag frequency of the nonrotating flexbeam. Neglecting this term will make the model stiffer than the real flexbeam, and hence will make the prediction of stresses more conservative.
The second set of terms which can be neglected in the flexbeam design is the first three integrals in equation (30). These integrals represent the effect of large rotations on the equilibrium equations of the flexbeam. For angles smaller than 15' this term is much smaller than the structural stiffness .K:( and the centrifugal stiffness B,. In a flexbeam design this term can also be neglected, resulting in more a conservative design.
Finally, the calculation of the centrifugal stiffness matrix, B,, can be simplified by noting that most of the CF force is caused by the weight of the blade and the pitchcase. Since the weight of the flexbeam is negligible compared to the weight of the blade and the pitchcase, we can assume that the CF force remains constant throughout the length of the flexbeam. The magnitude of this force can then be calculated separately and used as input to the program. This will eliminate the extra calculations otherwise needed to compute this force and hence results in saving computational time.
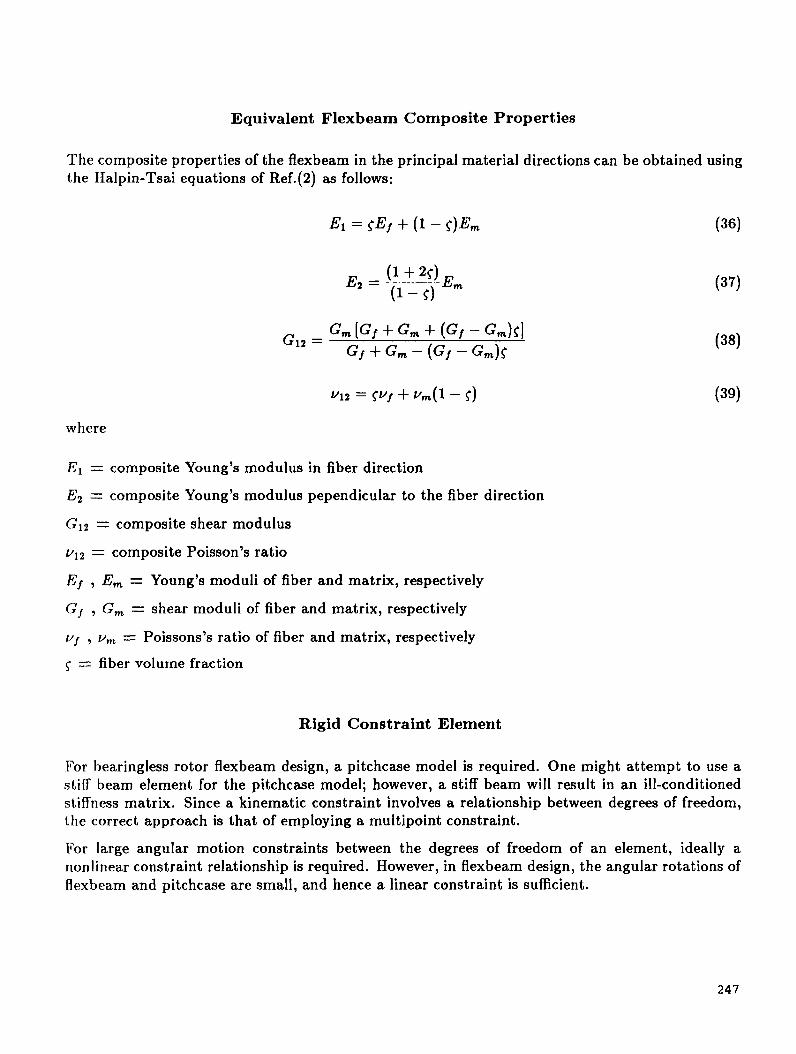
Equivalent Flex b eam Composite Properties
The composite properties of the flexbeam in the principal material directions can be obtained using the Halpin-Tsai equations of Ref.(2) as follows:
where
El = composite Young’s modulus in fiber direction
E2 = composite Young’s modulus pependicular to the fiber direction
GI2 = composite shear modulus
v12 = composite Poisson’s ratio
E, , E, = Young’s moduli of fiber and matrix, respectively
G, , G, = shear moduli of fiber and matrix, respectively
uf , v, = Poissons’s ratio of fiber and matrix, respectively
( = fiber volume fraction
Rigid Constraint Element
For bearingless rotor flexbeam design, a pitchcase model is required. One might attempt to use a stiff beam element for the pitchcase model; however, a stiff beam will result in an ill-conditioned stiffness matrix. Since a kinematic constraint involves a relationship between degrees of freedom, the correct approach is that of employing a multipoint constraint.
For large angular motion constraints between the degrees of freedom of an element, ideally a nonlinear constraint relationship is required. However, in flexbeam design, the angular rotations of flexbeam and pitchcase are small, and hence a linear constraint is sufficient.
247

To derive the rigid constraint element which will be used to represent the pitchcase, consider two node points A and B , which are connected by a rigid link. The rotational degrees of freedom of nodes A and B are 8 A and OB, respectively. Similarly, the displacement degrees of freedom are U A
a.nd uB. Assuming a rigid member between the two nodes, the displacements and rotations of node B can then be expressed in terms of the displacements and rotations of node A as
- u1- u2
u3 - 81 92
. e 3 - E
an d
'1 0 0 0 L, L, - - U1 - 0 1 0 -L , 0 L, u2 0 0 1 L, -L , 0 u3
- 0 0 0 1 0 0 81 0 0 0 0 1 0 8 2 -0 o o o 0 1 - - 9 3 - A
(42)
where rBA is a vector from node A to node B the magnitude of which is the length of the rigid member. Writing the vector cross product in matrix form, we obtain
This, then, is the constraint equation relating the degrees of freedom of the outboard end of the flexbeam to the degrees of freedom of the snubber/damper element.
HUBFLEX Mat hema t ical Model
Using the mathematical formulations presented earlier, a finite element computer program called IIUBFLEX was developed. This computer program is tailored specifically for the analysis of flexbeams with rectangular cross sect ions.
ITUBFLEX is a finite element analysis model for a cantilevered beam under centrifugal force. The rxiodel permits rapid calculation of spanwise load and stress distributions for a specific geometry flexbeam with specified material properties, centrifugal force, and modal deflections. The analysis has been validated against two- and three-dimensional NASTRAN models of equivalent beams, and has shown excellent correlation. Spanwise stress distributions can be calculated with HUBFLEX in less than 10 seconds CPU time on a Digital Equipment Corporation VAX 11/785. Substantial economies in the study of new designs are thus realized.
Analytically, HUBFLEX treats the flexbeam as fixed at the inboard end of the rotor mast. At the outboard end, radial tension, bending moments, shears, and torque are applied. The beam is a sta,tically indeterminate structure in that the elastic/cross sectional properties influence the load distribution. When any section of the beam is modified, a complete iteration is required to determine the new load and stress distribution along the beam.
248
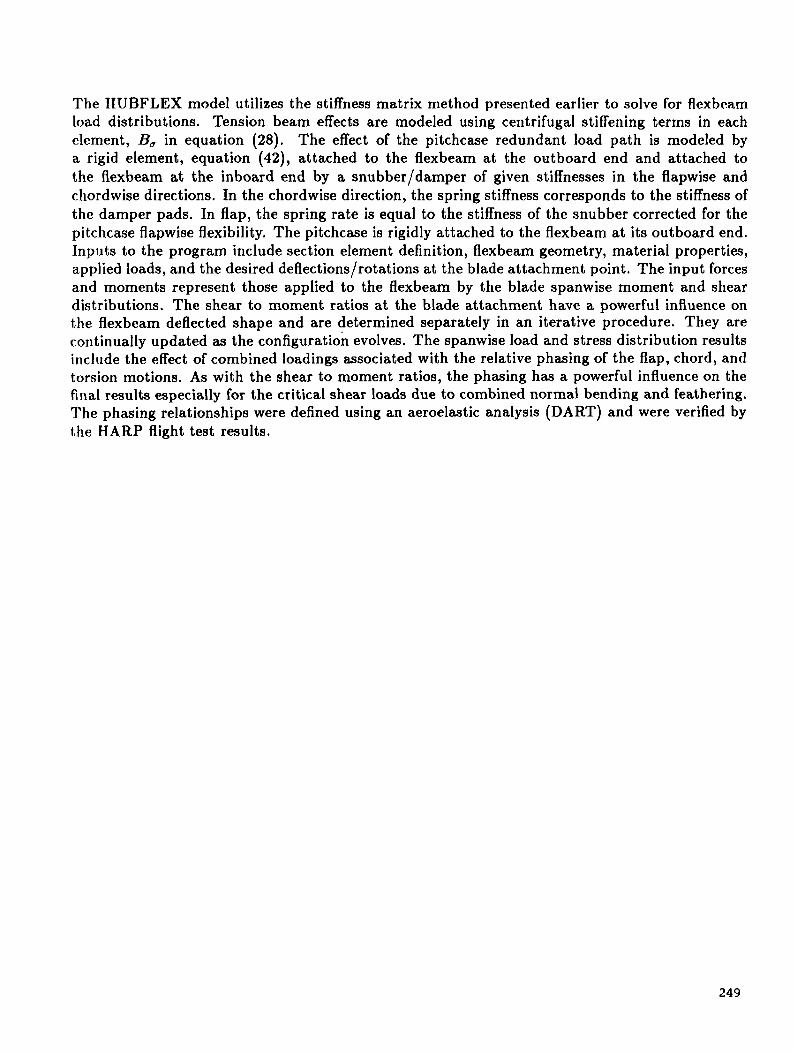
The IlUBFLEX model utilizes the stiffness matrix method presented earlier to solve for flexbeam load distributions. Tension beam effects are modeled using centrifugal stiffening terms in each element, Bo in equation (28). The effect of the pitchcase redundant load path is modeled by a rigid element, equation (42), attached to the flexbeam at the outboard end and attached to the flexbeam at the inboard end by a snubber/damper of given stiffnesses in the flapwise and chordwise directions. In the chordwise direction, the spring stiffness corresponds to the stiffness of the damper pads. In flap, the spring rate is equal to the stiffness of the snubber corrected for the pitchcase flapwise flexibility. The pitchcase is rigidly attached to the flexbeam at its outboard end. Inputs to the program include section element definition, flexbeam geometry, material properties, applied loads, and the desired deflections/rotations at the blade attachment point. The input forces and moments represent those applied to the flexbeam by the blade spanwise moment and shear distributions. The shear to moment ratios at the blade attachment have a powerful influence on the flexbeam deflected shape and are determined separately in an iterative procedure. They are coritinually updated as the configuration evolves. The spanwise load and stress distribution results include the effect of combined loadings associated with the relative phasing of the flap, chord, and torsion motions. As with the shear to moment ratios, the phasing has a powerful influence on the final results especially for the critical shear loads due to combined normal bending and feathering. The phasing relationships were defined using an aeroelastic analysis (DART) and were verified by the HARP flight test results.
249
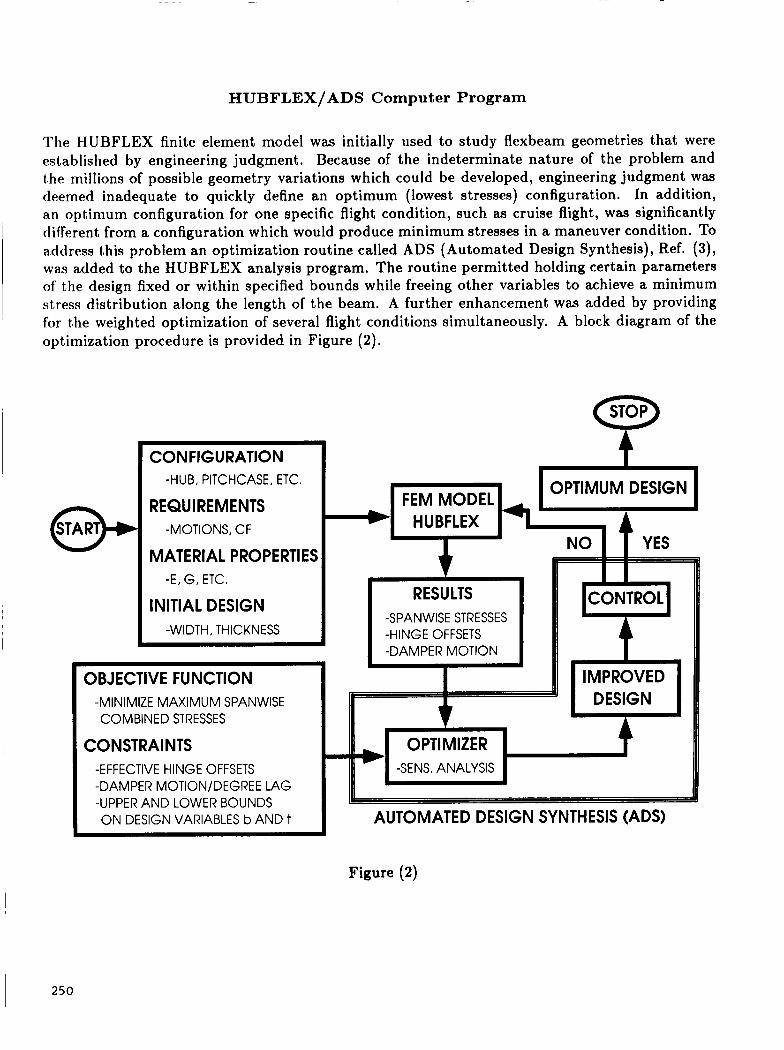
HUBFLEX/ADS Computer Program
The HUBFLEX finite element model was initially used to study flexbeam geometries that were established by engineering judgment. Because of the indeterminate nature of the problem and the millions of possible geometry variations which could be developed, engineering judgment was deemed inadequate to quickly define an optimum (lowest stresses) configuration. In addition, an optimum configuration for one specific flight condition, such as cruise flight, was significantly different from a configuration which would produce minimum stresses in a maneuver condition. To address this problem an optimization routine called ADS (Automated Design Synthesis), Ref. (3), was added to the HUBFLEX analysis program. The routine permitted holding certain parameters of the design fixed or within specified bounds while freeing other variables to achieve a minimum stress distribution along the length of the beam. A further enhancement was added by providing for the weighted optimization of several flight conditions simultaneously. A block diagram of the optimization procedure is provided in Figure (2).
I
I
CONFIGURATION
REQUIREMENTS -HUB, PITCHCASE, ETC.
-MOTIONS, CF
MATERIAL PROPERTIES
INITIAL DESIGN -E, G, ETC.
-WIDTH, THICKNESS
* I FEM HUBFLEX MoDELl OPTIMUM DESIGN
.) YES
RESULTS I -SPAN W ISE STRESSES -HINGE OFFSETS -DAMPER MOTION
-MINIMIZE MAXIMUM SPANWISE COMBINED STRESSES
I CONSTRAINTS -EFFECTIVE HINGE OFFSETS -DAMPER MOTION/DEGREE LAG -UPPER AND LOWER BOUNDS ON DESIGN VARIABLES b AND t
7 5 CONTROL
t IMPROVED
DESIGN
OPT1 MlZER -SENS. ANALYSIS
AUTOMATED DESIGN SYNTHESIS (ADS)
Figure (2)
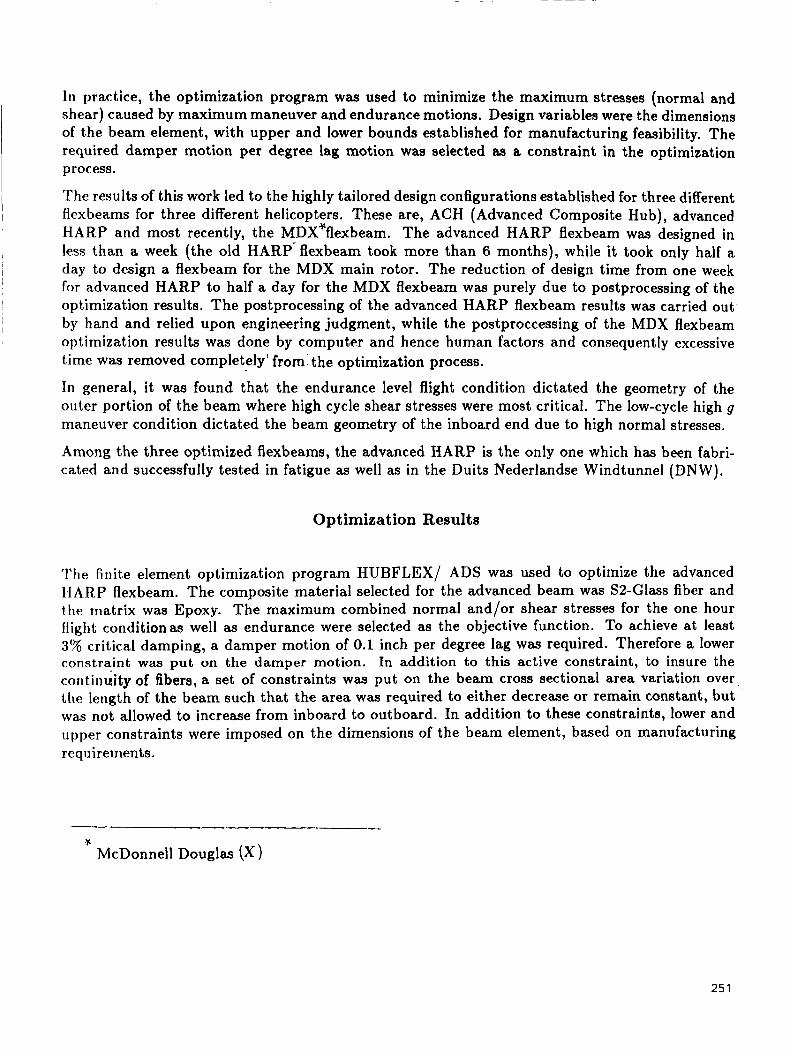
I n practice, the optimization program was used to minimize the maximum stresses (normal and shear) caused by maximum maneuver and endurance motions. Design variables were the dimensions of the beam element, with upper and lower bounds established for manufacturing feasibility. The required damper motion per degree lag motion was selected as a constraint in the optimization process.
The results of this work led to the highly tailored design configurations established for three different flexbeams for three different helicopters. These are, ACH (Advanced Composite Hub), advanced HARP and most recently, the MDX’flexbeam. The advanced HARP flexbeam was designed in less than a week (the old HARP‘flexbeam took more than 6 months), while it took only half a
for advanced HARP to half a day for the MDX flexbeam was purely due to postprocessing of the I day to design a flexbeam for the MDX main rotor. The reduction of design time from one week
optimization results. The postprocessing of the advanced HARP flexbeam results was carried out by hand and relied upon engineering judgment, while the postproccessing of the MDX flexbeam
I
I I
optimization results was done by computer and hence human factors and consequently excessive time was removed completely’ from the optimization process.
In general, it was found that the endurance level flight condition dictated the geometry of the outer portion of the beam where high cycle shear stresses were most critical. The low-cycle high g maneuver condition dictated the beam geometry of the inboard end due to high normal stresses.
Among the three optimized flexbeams, the advanced HARP is the only one which has been fabri- cated and successfully tested in fatigue as well as in the Duits Nederlandse Windtunnel (DNW).
Optimization Results
The finite element optimization program HUBFLEX/ ADS was used to optimize the advanced HARP flexbeam. The composite material selected for the advanced beam was S2-Glass fiber and t.he matrix waa Epoxy. The maximum combined normal and/or shear stresses for the one hour ftight conditionas well as endurance were selected as the objective function. To achieve at least 3% critical damping, a damper motion of 0.1 inch per degree lag was required. Therefore a lower constraint was put on the damper motion. In addition to this active constraint, to insure the continuity of fibers, a set of constraints was put on the beam cross sectional area variation over the lcngth of the beam such that the area was required to either decrease or remain constant, but was not allowed to increase from inboard to outboard. In addition to these constraints, lower and upper constraints were imposed on the dimensions of the beam element, based on manufacturing reqiiirements.
.k McDonnell Douglas (X)
25 1
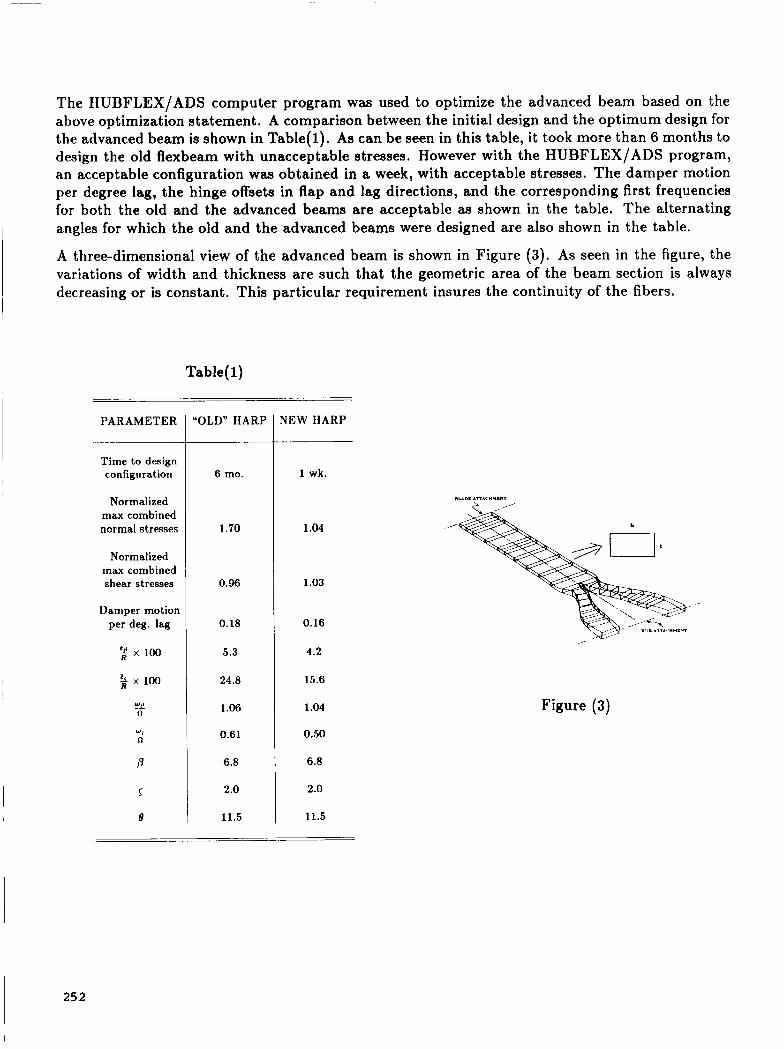
The HUBFLEX/ADS computer program was used to optimize the advanced beam based on the above optimization statement. A comparison between the initial design and the optimum design for the advanced beam is shown in Table( I) . As can be seen in this table, it took more than 6 months to design the old flexbeam with unacceptable stresses. However with the HUBFLEX/ADS program, an acceptable configuration was obtained in a week, with acceptable stresses. The damper motion per degree lag, the hinge offsets in flap and lag directions, and the corresponding first frequencies for both the old and the advanced beams are acceptable as shown in the table. The alternating angles for which the old and the advanced beams were designed are also shown in the table.
A three-dimensional view of the advanced beam is shown in Figure (3). As seen in the figure, the variations of width and thickness are such that the geometric area of the beam section is always decreasing or is constant. This particular requirement insures the continuity of the fibers.
Table( 1)
PARAMETER
Time to design configuration
Normalized max combined normal stresses
Normalized max combined shear stresses
Damper motion per deg. lag
2 x 100
k x 100
Yl!
w< n
D
s
"OLD" HARP
6 mo.
1.70
0.96
0.18
5.3
24.8
1.06
0.61
6.8
2.0
11.5
NEW HARP
1 wk.
1.04
1.03
0.16
4.2
15.6
1.04
0.50
6.8
2.0
11.5 8
.'
,
Figure (3)
I 25 2
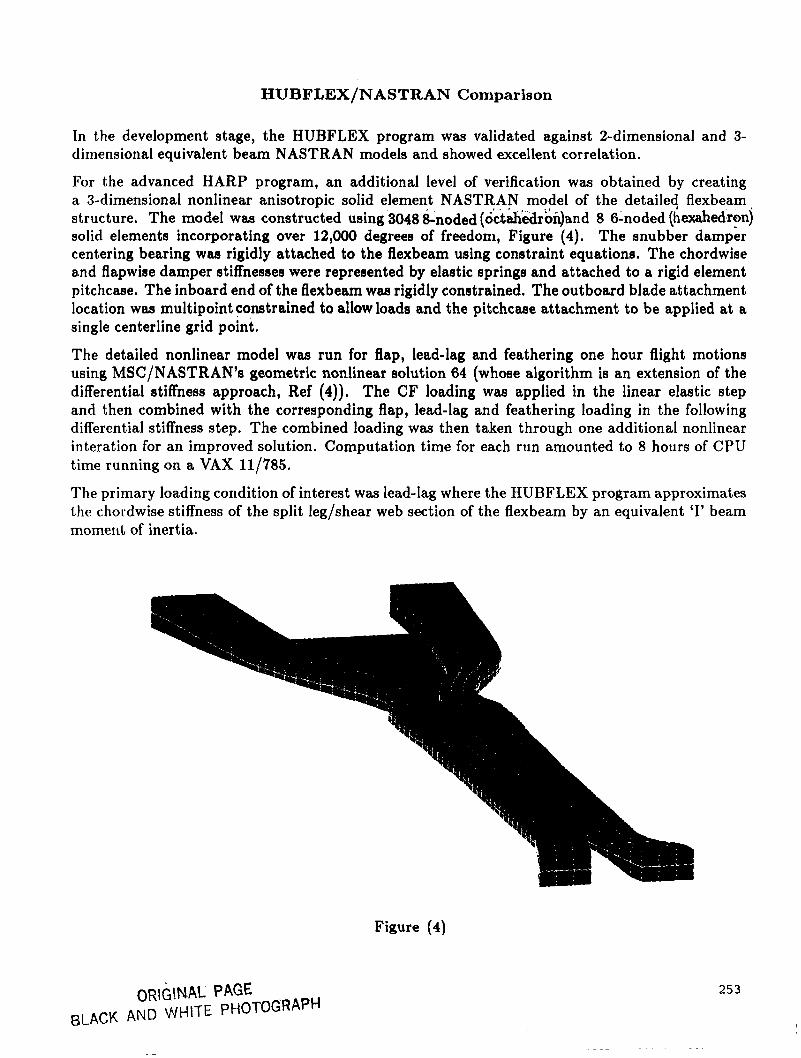
HUBFLEX/NASTRAN Comparison
In the development stage, the HUBFLEX program was validated against 2-dimensional and 3- dirriensional equivalent beam NASTRAN models and showed excellent correlation.
For the advanced HARP program, an additional level of verification was obtained by creating a 3-dimensional nonlinear anisotropic solid element NASTRAN model of the detaile4 flexbeam structure. The model wm constructed using 3048 &noded (d’ctahedroi$md 8 6-noded (hexahedron) solid elements incorporating over 12,000 degrees of freedom, Figure (4). The snubber damper centering bearing waa rigidly attached to the flexbeam using constraint equations. The chordwise and flapwise damper stiffnesses were represented by elastic springs and attached to a rigid element pitchcase. The inboard end of the flexbeam waa rigidly constrained. The outboard blade attachment location was multipoint constrained to allow loads and the pitchcase attachment to be applied at a single centerline grid point.
The detailed nonlinear model waa run for flap, lead-lag and feathering one hour flight motions using MSC/NASTRAN’e geometric nonlinear solution 64 (whose algorithm is an extension of the differential stiffness approach, Ref (4)). The CF loading waa applied in the linear elastic step and then combined with the corresponding flap, lead-lag and feathering loading in the following differential stiffness step. The combined loading was then taken through one additional nonlinear interation for an improved solution. Computation time for each run amounted to 8 hours of CPU time running on a VAX 11/785.
The primary loading condition of interest was lead-lag where the HUBFLEX program approximates the chordwise stiffness of the split leg/shear web section of the flexbeam by an equivalent ‘I’ beam momeril of inertia.
Figure (4)
OR~GINAL PAGE BLACK AND WHITE PtjOTOGRAPH
253
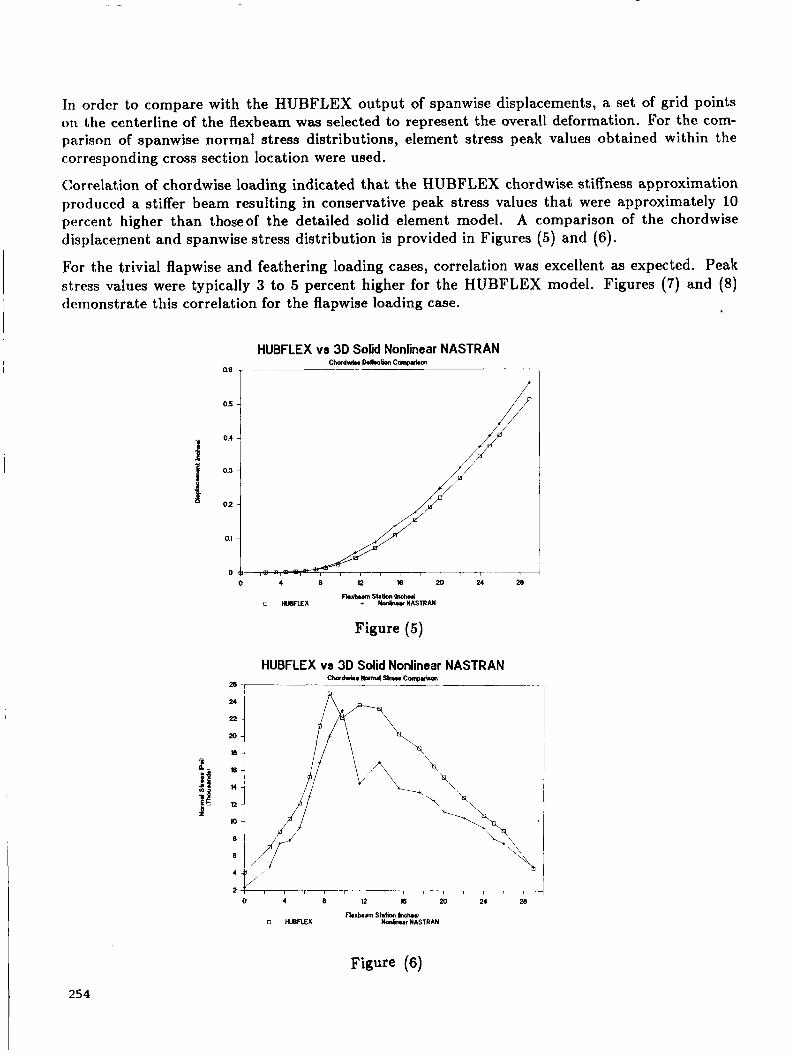
In order to compare with the HUBFLEX output of spanwise displacements, a set of grid points on the centerline of the flexbeam was selected to represent the overall deformation. For the com- parison of spanwise normal stress distributions, element stress peak values obtained within the corresponding cross section location were used.
Correlation of chordwise loading indicated that the HUBFLEX chordwise stiffness approximation produced a stiffer beam resulting in conservative peak stress values that were approximately 10 percent higher than thoseof the detailed solid element model. A comparison of the chordwise displacement and spanwise stress distribution is provided in Figures ( 5 ) and (6).
For the trivial flapwise and feathering loading cases, correlation was excellent as expected. Peak stress values were typically 3 to 5 percent higher for the HUBFLEX model. Figures (7) and (8)
I demonstrate this correlation for the flapwise loading case.
HUBFLEX vs 3D Solid Nonlinear NASTRAN C h a r d 6 D . k h CrmprLm
f 0.5
0.4
0.3
0.2
0.1
0 0 4 8 n m 20 24 28
F*rb.m Station 0nch.J 0 nBFl.Ex + N D m u r N A S l W J
Figure ( 5 )
HUBFLEX vs 30 Solid Nonlinear NASTRAN -__-___ Chardwin )(onr* S t n u Corngr*on
26,
Figure (6)
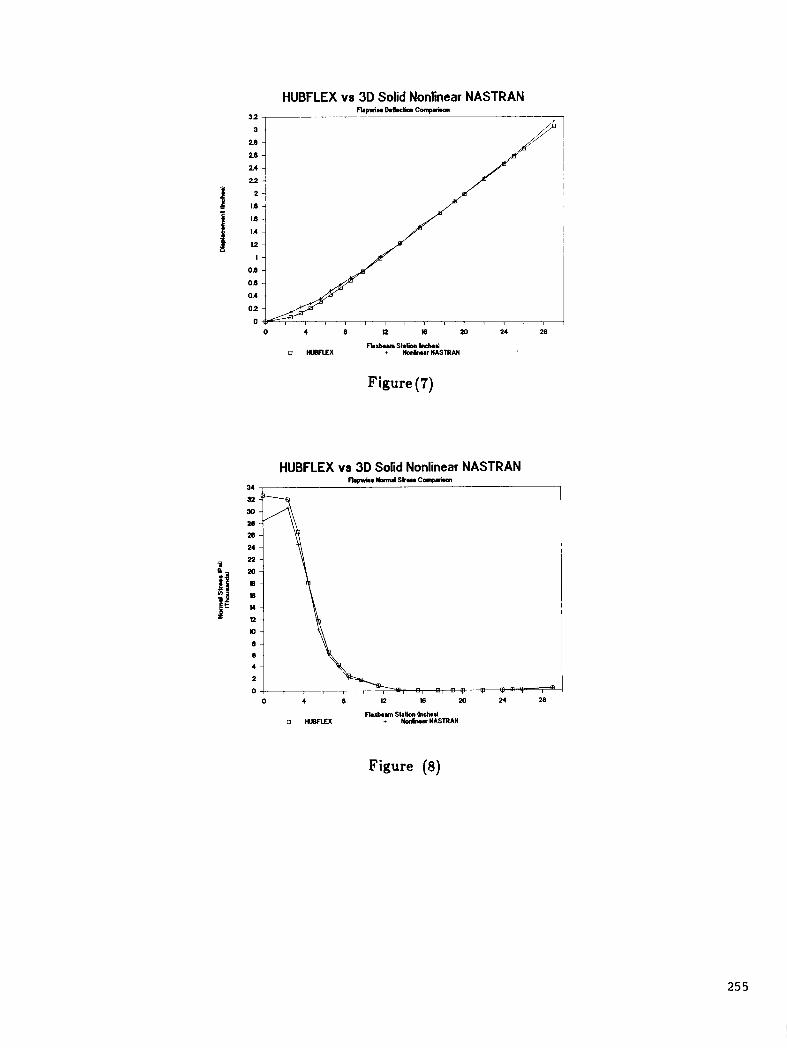
HUBFLEX vs 3D Solid Nonlinear NASTRAN Flapwin D.nDCLim conpr*a
3.2
24
22
7 7 T
0 4 0 n m 20 24 28
Wrkun SIl(pn hch.d 0 "X + -uNASTRAN
Figure (7)
HUBFLEX vs 3D Solid Nonlinear NASTRAN Flapwin mnnd S k u conpr*a
m 24
0 4 8 12 16 20 24 28
Flarklrn s t a l i i 0nCh.d 0 HUBFLEX + WonhurNASTRAN
Figure (8)
255

Conclusions
1. Pitchcase and snubber damper representations are required in the flexbeam model for proper sizing resulting from dynamic requirements.
in an improved design.
3. Tnclusion of multiple flight conditions and their corresponding fatigue allowables is necessary for the optimization procedure.
4. A simplified beam model is adequate for flexbeam sizing. The simplified model gives excel- lent accuracy (compared to a detailed 3D nonlinear NASTRAN analysis) with a significant reduction in computational time.
5 . IIUBFLEX’s rapid computation capability enables design parameters to be easily modified
2. Optimization is necessary for flexbeam design. It reduces the design iteration time and results
and implemented.
References
1. Zienkiewicz, O.C., “The Finite Element Method”, 3rd Edition, McGraw Hill Book Co., New York, 1982.
2 . Jones, R.M., “Mechanics of Composite Materials”, McGraw Hill Book Co., New York, 1973.
3. Vanderplaats, G.N., “ADS - A Fortran Program for Automated Design Synthesis”, Version 1.00 , NASA Contract Report 172460, Langley Research Center, Hampton, Virginia, 1984.
4 . MSC/NASTRAN Application Manual, Macneal- Schwendler Corporation, March 1981.

SESSION 3: ARTIFICAL INTELLIGENCE
Chairmen: K. H. Abbott and P. Hajela

N89- 25158 m.
New Directions for Artificial Intelligence (AI) Methods in Optimum Design
Prabhat Ha] ela Aerospace Engineering, Mechanics, & Engineering Science
University of Florida, Gainesville, Florida
PRECEDING PAGE BLANK NOT FILMED
259
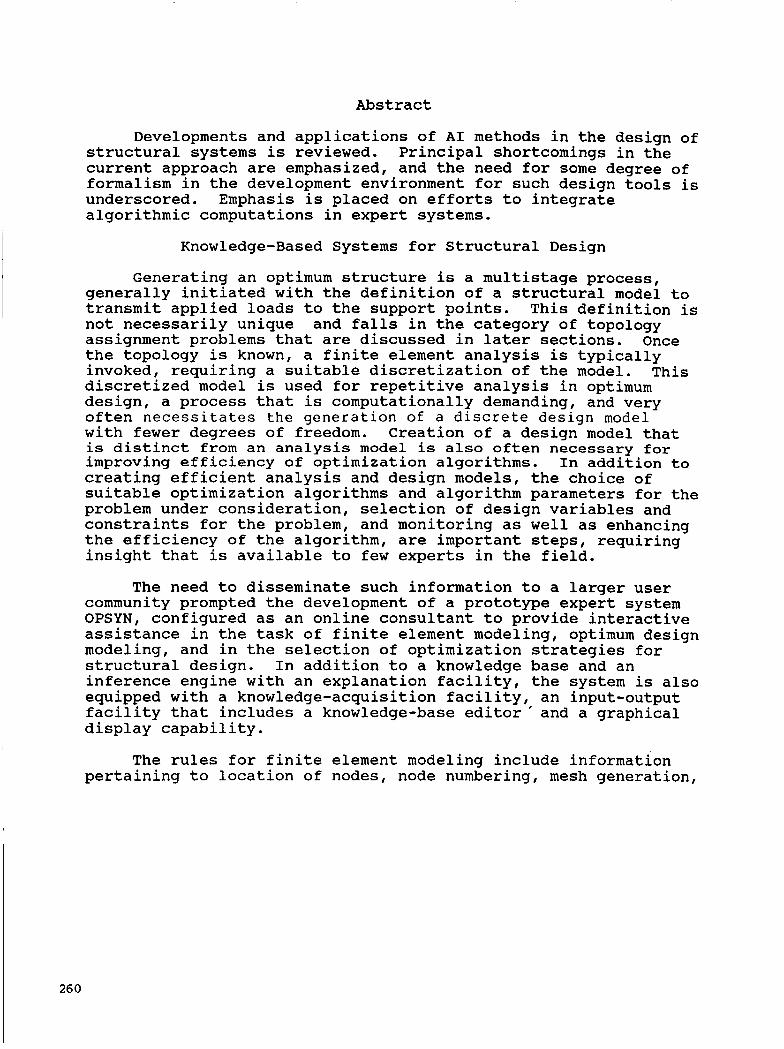
Abstract
Developments and applications of AI methods in the design of structural systems is reviewed. Principal shortcomings in the current approach are emphasized, and the need for some degree of formalism in the development environment for such design tools is underscored. Emphasis is placed on efforts to integrate algorithmic computations in expert systems.
Knowledge-Based Systems for Structural Design
Generating an optimum Structure is a multistage process, generally initiated with the definition of a structural model to transmit applied loads to the support points. This definition is not necessarily unique and falls in the category of topology assignment problems that are discussed in later sections. Once the topology is known, a finite element analysis is typically invoked, requiring a suitable discretization of the model. This discretized model is used for repetitive analysis in optimum design, a process that is computationally demanding, and very often necessitates the generation of a discrete design model with fewer degrees of freedom. Creation of a design model that is distinct from an analysis model is also often necessary for improving efficiency of optimization algorithms. In addition to creating efficient analysis and design models, the choice of suitable optimization algorithms and algorithm parameters for the problem under consideration, selection of design variables and constraints for the problem, and monitoring as well as enhancing the efficiency of the algorithm, are important steps, requiring insight that is available to few experts in the field.
The need to disseminate such information to a larger user community prompted the development of a prototype expert system OPSYN, configured as an online consultant to provide interactive assistance in the task of finite element modeling, optimum design modeling, and in the selection of optimization strategies for structural design. In addition to a knowledge base and an inference engine with an explanation facility, the system is also equipped with a knowledge-acquisition facility, an input-output facility that includes a knowledge-base editor’ and a graphical display capability.
The rules for finite element modeling include information pertaining to location of nodes, node numbering, mesh generation,

mesh refinement, element selection, and guidelines to eliminate element distortion. The rules for optimum design modeling include concepts pertinent to selection of design variables, constraints, approximation techniques, and strategies for sensitivity analysis. A third set of rules to enhance optimization performance primarily assists the user in selecting optimization strategies for the design problem. This includes rules for both unconstrained and constrained optimization problems, and rules for algorithm switching in the event that the initial selection is unsatisfactory. Additional details about this implementation are available in References [l-31. A schematic illustrating the framework of this implementation is shown in Figure 1.
Knowledge acquisition and representation are important issues in expert system development and are addressed in a novel manner in the OPSYN system. Misrepresentation of information is a frequent dilemma, particularly when text alone is used for communication. This limitation was overcome by adding a graphical display of both rules and actions in addition to the textual format. A CAD-based knowledge acquisition system embracing the protocol analysis approach [ 4 ] , was also developed for this system. Automated knowledge acquisition and analysis to generate new rules are key features of this system.
OPSYN is in the general category of consultative type systems for structural analysis and design modeling (other notable systems include SACON [5], ESSDAN [ 6 ] and ADEPT [ 7 ] ) . Such systems facilitate in the dissemination of large amounts of documennted and experiential knowledge in this domain to a larger user community. The goals or objectives of the work are well understood, and hence a backward reasoning strategy is naturally applicable. The suitability of such an approach in design, which is essentially a generative process, is questionable. This issue is a principal focus of the present work. The design problem under consideration may be stated as follows: given a design domain, a set of distributed or applied loads, and a set of support points, generate a structural configuration that is optimal with respect to the stated objectives and design constraints.
The traditional design approach starts with a chosen initial configuration.' and successively refines this design to obtain an optimum with reference to a set of prescribed constraints. Despite the success in using this approach, it has a limitation in that the final outcome is strongly linked to the initial model abstraction process. Human designers are quite adroit at finding - a promising configuration and developing it into a feasible design. The present paper deals with the development and evaluation of strategies to facilitate the automated search for alternative preliminary design configurations, with the goal of spanning the space of conceptually distinct plausible designs.
The preliminary structural layout problem has received some
26 1

attention but with no emphasis on optimality of the final design. References [ 8 ] and [ 9 ] report initial efforts in the development of expert systems for preliminary form design of structural machine parts. The general approach adopted in this study was one in which the structure was decomposed into primitive components. Previously catalogued case studies were used to build the structural form, starting at the primitive level and incrementally adding degrees of complexity. The study also emphasized the need for algorithmic processing in such activity. Nevi11 and his co-workers [lO,ll] and Brown [12] also recognize the importance of the preliminary synthesis problem. The research activity in this group has resulted in the development of an automated preliminary design system MOSAIC, currently implemented for 2-D mechanical and structural systems. In this system, point loads are stabilized by connecting them to predefined supports, using structural elements that satisfy other established goals. sequence of promising initial designs, but with no focus on optimality.
The thrust of this work is in generating a
The developments described above are drawn from the discipline of structural design. lines are reported in the chemical, electrical and mechanical engineering domains. These efforts have been somewhat disjointed in form, each devoting significant development effort in building a framework that was considered by its developer as novel and necessary for the application at hand. Other than the fact that such systems have common components in the form of a knowledge base and an inference facility, there is very little adherence to a set of common development guidelines. This unproductive approach results, in most instances, in marginal contributions towards advancing design practice in that domain ’ and is largely responsible for the growing skepticism about the expert system field in general.
Numerous efforts along similar
There exists no general agreement on what is regarded as a good model for engineering design practice. In fact, definitions of what design entails are varied, with every practitioner having a different philosophical viewpoint. focussed at attempting to establish some formalism in knowledge- based design [13,14]. Not surprisingly, the principal concepts of such proposals have been part of the optimum design literature that is traditionally not associated with heuristic methods. Subsequent sections of this paper attempt to develop a framework that is based on one such model of design, largely in the context of optimum structural synthesis.
Recent efforts have
A General Framework for Automated Structural Design
Tong [13] presents an elaborate description of the principal components of knowledge-based problem solving systems. The framework for automated structural design systems discussed in this section incorporates some of these ideas, and extends them to the structural design domain. At the very outset, it is
26 2

important to recognize the levels at which the automated design process can be organized. Tong classifies these as the knowledge level, the function level, and the program level. The present paper describes the attributes of each of these levels of organization, using the task of optimum structural synthesis (both conceptual and refined) as the design domain. A typical relational arrangement of these levels of organization is shown in Figure 2.
Knowledge Level
This level constitutes a rigorous and detailed description of the design domain. Applicable theories for analysis in the domain should be accessible at this level, as should criterion or rules that define acceptable solutions. There is scope for a significant amount of organization at this level. The types of design applications envisaged for such systems would very seldom generate designs that bear no resemblance to their predecessors. It is therefore possible to classify previous feasible solutions based on salient characteristics and the design constraints to which they conform. This step provides a general nomenclature and classification of types of design constraints, of problems that can be solved, and of possible solution strategies.
A s stated in earlier discussions, optimum design of structural systems starts with the process of proposing a structural configuration to transmit a set of prescribed loads to given supports. Once an initial model is obtained, it can be refined to yield an optimum. To limit the scope of the present paper, this discussion will be confined to the problem of optimal generation of structural topology. The domains that must be considered in this exercise include geometric modeling, structural analysis, and optimization methodology. The problem is further simplified by restricting load deflection analysis to the linear region. The tools to analyze the structure or parts of the structure must be accessible at the knowledge level. In the implementation under study, a finite element analysis program EAL [15] and several independent analysis modules provide this capability. Also available at this stage are simplistic tools to implement and analyze geometrical layouts of structures for feasibility. Finally, access to gradient and non-gradient based optimization methods is made available at this level [16,17].
In creating a taxonomy of design requirements for the problem under consideration, it is also important to identify any salient characteristics that result from an imposition of such requirements. Structural design requirements may be classified on the basis of strength, stiffness, elastic stability, degree of redundancy, types of support conditions, dynamic behavior, and a requirement of least weight or least complexity in manufacturability. Clearly, each of these requirements has an influence on the design that distinguishes it from designs dominated by other requirements. As an example, a structure that is governed by structural stability requirements will have
263
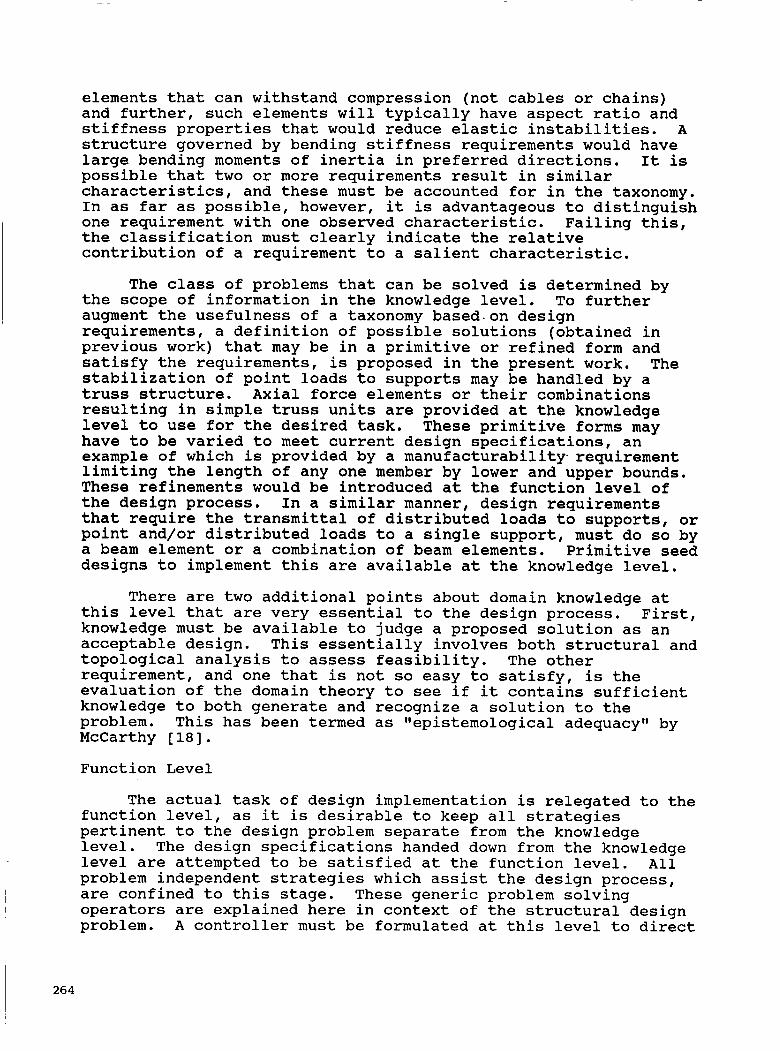
elements that can withstand compression (not cables or chains) and further, such elements will typically have aspect ratio and stiffness properties that would reduce elastic instabilities. A structure governed by bending stiffness requirements would have large bending moments of inertia in preferred directions. It is possible that two or more requirements result in similar characteristics, and these must be accounted for in the taxonomy. In as far as possible, however, it is advantageous to distinguish one requirement with one observed characteristic. the classification must clearly indicate the relative contribution of a requirement to a salient characteristic.
Failing this,
The class of problems that can be solved is determined by the scope of information in the knowledge level. To further augment the usefulness of a taxonomy based.on design requirements, a definition of possible solutions (obtained in previous work) that may be in a primitive or refined form and satisfy the requirements, is proposed in the present work. The stabilization of point loads to supports may be handled by a truss structure. Axial force elements or their combinations resulting in simple truss units are provided at the knowledge level to use for the desired task. These primitive forms may have to be varied to meet current design specifications, an example of which is provided by a manufacturability. requirement limiting the length of any one member by lower and upper bounds. These refinements would be introduced at the function level of the design process. In a similar manner, design requirements that require the transmittal of distributed loads to supports, or point and/or distributed loads to a single support, must do so by a beam element or a combination of beam elements. Primitive seed designs to implement this are available at the knowledge level.
There are two additional points about domain knowledge at this level that are very essential to the design process. First, knowledge must be available to judge a proposed solution as an acceptable design. This essentially involves both structural and topological analysis to assess feasibility. The other requirement, and one that is not so easy to satisfy, is the evaluation of the domain theory to see if it contains sufficient knowledge to both generate and recognize a solution to the problem. This has been termed as tlepistemological adequacytt by McCarthy [ 181.
I Function Level
I The actual task of design implementation is relegated to the
I function level, as it is desirable to keep all strategies pertinent to the design problem separate from the knowledge level. The design specifications handed down from the knowledge level are attempted to be satisfied at the function level. All problem independent strategies which assist the design process, are confined to this stage. These generic problem solving operators are explained here in context of the structural design problem. A controller must be formulated at this level to direct
the flow of the design from one process operator to another. Although designs can be generated by considering all requirements simultaneously, this methodology is not considered appropriate for the task at hand. D e s i g n is, more n a t u r a l l y , a process of refinement in steps to satisfy local goals how the current design step is likely to influence the global design. Some of these approaches are similar to methods of multilevel decomposition represented in recent studies [19,20].
and to keep track of
The process of refinement in steps is initiated by a decomposition of the problem into smaller, more tractable, and preferably, single goal problems. The underlying principle in such a refinement is that the solution space is more likely to be unique in the presence of a higher degree of specification detail. The approach is one where a set of refinement operators are invoked by the controller to add greater detail in either the specifications or to the initial design (Figure 3). These two approaches for refinement have their accompanying ramifications, and are discussed in the following paragraphs. portal framework of beam elements to carry point forces and moments (Figure 4 ) is used to illustrate these concepts. The choice of the beam cross section must be made between an I- section, an open C-section, and a hollow circular section. The support points are defined and a choice of pin or clamped supports is available.
The design of a
Refinement in specifications r equ i r e s t h a t t h e d e s i g n specifications be arranged by a priority derived from their relative importance. For the sake of illustration the design specifications for the portal framework are ordered as follows:
a) The structure must be such that all loads have a load path to all supports. b) The structure must not allow static displacements larger than specified values at points of load application. c) The components (beam elements) must not be overstressed beyond elastic limits. d) Local buckling or crimping in structural elements is disallowed.
The first requirement is of a topological nature by accessing domain knowledge available at the knowledge level. A controller would invoke an element generating program to generate beam elements that would meet this specification without attention to any other requirements. specifications would require assignment of cross sectional properties (cross sectional areas and moments of inertia) to the beam elements. No attention is paid at this level to the specificity of cross sections involved. The controller can either look for existing designs at the knowledge level or proceed with a generate-and-test strategy to implement the requirement. selection of particular types of cross sections based on the load conditions and also require detailed sizing of these cross
and is handled
The next set of
The next two requirements similarly dictate
265
sections for the problem at hand.
A design obtained by this approach is likely to vary with different ordering of design specifications. This difficulty can be alleviated to some extent by requiring that each design specification be only partly satisfied as it is considered. This is akin to maintaining a constant buffer in the constraint activity and tightening all constraints after each specification has made a contribution to the design.
A second approach of refinement is one where the system design specification is decomposed into design specifications for components of the system. be embedded into the one described above, wherein each design specification is further .deccmposed into component specifications. The underlying philosophy in this approach is one that assumes elimination of a large number of possible solutions with increasing detail in specifications. This hierarchical decomposition is described in terms of the portal frame problem as follows.
This type of refinement can actually
A design with all previous specifications and an additional requirement of minimum weight must be obtained. conditions cannot be transferred to the component level, the structural generation problem can be viewed as designing each component separately for whatever specifications are applicable. Beam element A is sized for each of the applicable specifications. Its length is determined by distance from load PI to the support point SI. Similarly, the cross sectional type and the corresponding section dimensions are obtained from strength and local buckling considerations. level, however, sufficient detail is not available to see if component level design satisfies the specification of the global structural stiffness. A recommended procedure at this level is to determine the sensitivity of global structural stiffness to local component variables, and to use this information when an assemblage of the components is done.
While all
At the component
In addition to processors that implement strategy, testing operators comprise an important component of the function level. The controller is faced with the formidable task of directing execution of generators and testers in an efficient sequence. Clearly, if a generated concept fails an acceptability test, several remedial measures are available for implementation. The simplest entails a backtracking to the last decision, and revising that decision with the failure as a constraint. As an example, if a square cross section was selected for a beam element to satisfy stiffness and strength requirements. and was later found unfit from a manufacturablity standpoint, one would simply backtrack to the decision of choosing a cross section with the additional manufacturability constraint. Another frequently used approach, and described by Tong [13] as "pruningtt, is especially applicable if specification decomposition allows construction of tree-like deduction paths. Here, failure of a
partial design can result in eliminating several possibilities from the search space.
Finally, the controller must have the option of modifying the design rules, particularly if it assists in realizing the design specifications. The acceptability tests can themselves be relaxed to admit designs. Examples of this include relaxation of manufacturability requirements to admit non circular cross sections. Likewise, allowable values of stress or displacements can be modified to pass the acceptability test. This concept is particularly powerful, if critical satisfaction of constraints in partial designs is consciously avoided. Yet another option available at this stage is to extend the design without replacing the current design. This translates into adding features which work with an existing design to enable it to pass the acceptability requirements.
Program Level
The foregoing discussion details the requirements and assigned tasks of the knowledge and function level. The mechanics of implementing all the design s t e p s , i n c l u d i n g programming procedures, production rules, and database management systems is relegated to the program level. No problem solving knowledge is available at this level - it simply implements and manages instructions passed in from the other levels.
Particular attention must be directed at the database management capabilities of such a system. Significant a m o u n t s of dataaregenerated and must be managed for a design system to work efficiently. This is even more crucial as large amounts of algorithmically generated numerical data must be stored and post- processed to use meaningfully in the iterative process. Two levels of data management are planned in the current system. The global data base is at the core of such a system and records information for long term usage. Problem and subproblem related databases are extracted from the main system and are local to the knowledge level. This provides a convenient blackboard for constraint posting and propagation as the design is taken through a process of incremental refinement (Figure 5 ) .
The inference facility is another important feature at this level. In the structural design problem that is currently under implementation, a rule-based, C Language Integrated Production Systems (CLIPS) [21] is being used. This utility can be invoked from within a FORTRAN program, making available a convenient link between algorithmic and heuristic processing of information.
Optimal Topology Assignment
The basic goals of an optimal topology generation system within the framework of a problem solving system described in previous sections is outlined here for completeness. A set of load conditions and support points are defined in a design space.
267
The design space also consists of obstacles and prohibited zones in which no portion of a structural assembly may be placed. An optimal, minimum weight structural topology is to be generated to transfer the applied loads to the supports, satisfying requirements of allowable stress in structural members, displacements at load points, and limits on component and system static stability.
The types of structural elements that may be used in the ctural synthesis are limited to axial force members (tension , and tension/compression), flexural beam elements, and rane elements (triangular and quadrilateral). In addition to
these primitive elements, assembly of axial force elements (tension/compression) in a triangular truss is also available as a master element.
The topology generator is first invoked to construct a series of structural assemblies that stabilizeethe applied loads . This is an incremental process which attempts to meet the problem specifications in one of two ways. The first approach looks at each laad sequentially, assessing its geometric orientation with respect to the supports, and selects an appropriate element to provide partial stability. At any step of the generation, a branching can be introduced to implement more than one acceptable afternative. A second approach divides the structural domain into Pour quadrants, and a structure is generated in each quadrant to account for loads in that region. The substructures are then connected by acceptable least weight elements. At this stage of the problem, the only active problem specifications are those related to the geometry of the load distribution and the applicable element types.
possibilities, with each step accounting for one design specification from an ordered list. Such an approach assumes that a set of alternate designs optimized in this manner are better suited to identifying the most promising configuration for detailed design. A second approach that is planned for implementation in the proposed study uses the topology generator to seed the design space with possible alternatives. An optimal topology is then obtained by a combination of the most favorable characteristics of the seed designs. The generate and test approach outlined above relies to a large extent on algorithmic processing and efficient handling of numerical data. The three tier organization of the problem solving system described in preceding sections is ideally suited to this complex task. Additional details of the implementation will be presented in
A sequence of refinements is made to these configurational
[223
Closing Remarks
The present paper presents the framework of a knowledge- based system for structural design. The process of design of a structural system includes the initial structural geometry
268 ORIGINAL PAGE IS OF POOR QUALITY

definition followed by successive refinement of this initial configuration to obtain an optimum. this task is distinct from previous systems in this domain. The latter were largely restricted to consultative tasks. The use of decomposition principles to make the design problem more tractable is very similar to multilevel decomposition techniques proposed in automated optimum synthesis of structures. formalism in the organization of such systems is considered very important if significant advances in problem solving capabilities are to be realized. Finally, the role of integrating algorithmic and heuristic processing of databases is considered vital for the success of such systems.
The system described for
A
Acknowledgments
The author gratefully acknowledges his discussions with doctoral student N. Sangameshwaran during the preparation of this paper.
References
1.
2 .
3 .
4.
5.
6.
7 .
J.L. Chen and P. Hajela, "FEMOD: A Consultative Expert System for Finite Element Modeling", proceedings of the AIAA/ASME/ASCE/AHS SDM Conference, April 6-8, 1987, Monterey, California. Comr, uters and Structures, Vol. 29, NO. 1, 1988.
J.L. Chen and P. Hajela, "A Rule Based Approach to Optimum Design Modeling1@, ComDuter Amlications in Structural Enaineering, (ea. D.R. Jenkins) ASCE, New York, pp. 66-81, 1987.
P. Hajela and J.L. Chen, "CAD Interfaces in the Development of Expert Systems for Optimum Structural Design", Proceedings of the Second International Conference in Computational Engineering Science, Atlanta, Georgia, April 1988, Computational Mechanics, Srxinser Verlaq, April 1988.
A. Hart, tlKnowledge Elicitation: Issues and Methods", Computer Aided Design, Vol. 17, No. 9, November 1985, pp. 455-462.
J. Bennett, L. Creart, R. Englemore and R. Melosh, llSACON: A Knowledge Based Consultant for Structural Analysist1, Technical Report STAN-CS-78-699, Stanford University, Stanford, California, 1978,
S.C.-Y. Liu, "A Consultative Expert System for Finite Element Modeling of Strip Drawing", presented at XI11 North American Research Conference, University of California at Berkeley, May 1985.
R.H. Holt and U.V.L. Narayana, "Adding Intelligence to Finite Element Modeling1#, Expert Systems in Government
269

8.
9.
10.
11.
12.
13.
14.
15.
16.
17.
18.
19.
270
Svmposium (eds. K.N. Karna, K. Parsaye and B.G. Silverman), IEEE, New York, 1986, pp. 326-337.
J.J. Shah, vfDevelopment of a Knowledge Base for an Expert System for Design of Structural Parts", Proceedings of the ASME International Computers in Engineering Conference, 1985.
J.J. Shah, "Deziner - An Expert System for Conceptual Form Design of Structural Parts", Proceedings of the ASME International Computers in Engineering Conference, 1986.
G.E. Nevill, L.A. Jackson, and J.H. Clinton, "Automated Hierarchical Planning for Structural Design", proceedings of the ASME International Computers in Engineering Conference, San Francisco, California, August 1988.
G.E. Nevill, and G.H. Paul, @*Knowledge Based Spatial Reasoning for Designing Structural Configurations", proceedings of the 1987 ASME International Computers in Engineering Conference, New York, Vol. 1, pp. 155-160.
J.P. Brown, "Managing Interacting Design Subproblems in Incremental Preliminary Design", M.S. Thesis, Department of Aerospace Engineering, Mechanics and Engineering Science,University of Florida, August 1988.
C. Tong, "Toward an Engineering Science of Knowledge-Based Design", Artificial Intellisence in Ensineerinq, Vol. 2, No. 3, 1987, pp. 133-166.
C. Tong, "KBSDE: An Environment for Developing Knowledge- Based Design Too1sI1, proceedings of Knowledge Compilation Workshop, Oregon State University, September 1986.
D. Whetstone, "SPAR - Reference Manual", NASA CR-145098-1, February 1977.
P. Hajela, "Genetic Search - An Approach to the Nonconvex Optimization Problemft, in review for presentation at the 30th AIAA/ASME/ASCE/AHS/ASC SDM Conference, Mobile, Alabama, April 1989.
G.N. Vanderplaats, I) An Efficient Feasible Direction Algorithm for Design Synthesis ( I , AIAA Journal, Vol. 22, No. 11, October 1984, pp. 1633-1640.
J. McCarthy and P. Hayes, IISome Philosophical Problems from the Standpoint of Artificial Intelligencef1, Readings In Artificial Intelligence, Nilsson, 1981.
J.E. Sobieski, A Linear Decomposition Method for Larger Optimization Problems - Blueprint for Development, NASA TM- 83248, 1982.

20. J.E. Sobieski, B.B. James, and A. Dovi, tlStructural Optimization by Multilevel Decompositiontt, AIAA Journal, V o l . , 23, No. 11, 1983, pp.1775-1782.
21. CLIPS Reference Manual, JSC-22948, NASA Johnson Space Center, April 1988.
22. P. Hajela and N. Sangameshwaran, Coupled Algorithmic and Heuristic Approach for Optimum Structural Topology Generationtt, in review for International Conference in Computer Aided Optimum Design of Structures, 20-23 June 1989, Southampton, England.
27 1

KNOWLEDGE INFERENCE ENGINE
* r’ FORWARD CHAINING BASE
(META-RULES) BACKWARD CHAINING (RULES) EXPLANATION FACILITY
i
KNOWLEDGE LEVEL
b
TEMPORARY KNOWLEDGE - BASE
( FACTS )
TOOLS c
AUTOMATED KNOWLEDGE- KNOWLEDGE LEARNING ENGINEER BASE
b EDITOR
0 STRUCTURAL ANALYSIS 0 TOPOLOGY GENERATION 0 OPTIMIZATION
b 4
CONVENTIONAL PROGRAM
GRAPHICS
DOMAIN KNOWLEDGE c-
b - r
KNOWLEDGE
SYSTEM ACQUISITION (DESIGNER, EXPERT)
0 DESIGN SPECIFICATIONS 0 DESIGN ACCEPTABILITY 0 LIBRARY OF PRIOR DESIGNS TAXONOMY BY SPECIFICATIONS
F.E.M OPTIMIZATION
. DATA BASE
1 FUNCTION LEVEL
PROGRAM LEVEL
CONTROLLER
PROBLEM DECOMPOSITION
GENERATOR
TESTER r INFERENCE FACILITY
DATABASE MANAGER A
- - J
Figure 2. Organization/Subdivsion of tasks in a typical problem solving system.
27 2

3 INPUT 4.
0 PROBLEM SPECIFICATIONS 0 DESIGN SPECIFICATIONS
Figure 3. Schematic of a refinement operator
0 SPECIFICATION DETAIL 4 w
I I I
TEST FOR ACCEPTABILITY
I I 1 I
I I s2 I
I s1 ///////
I ///// /
Figure 4. The portal framework problem.
27 3
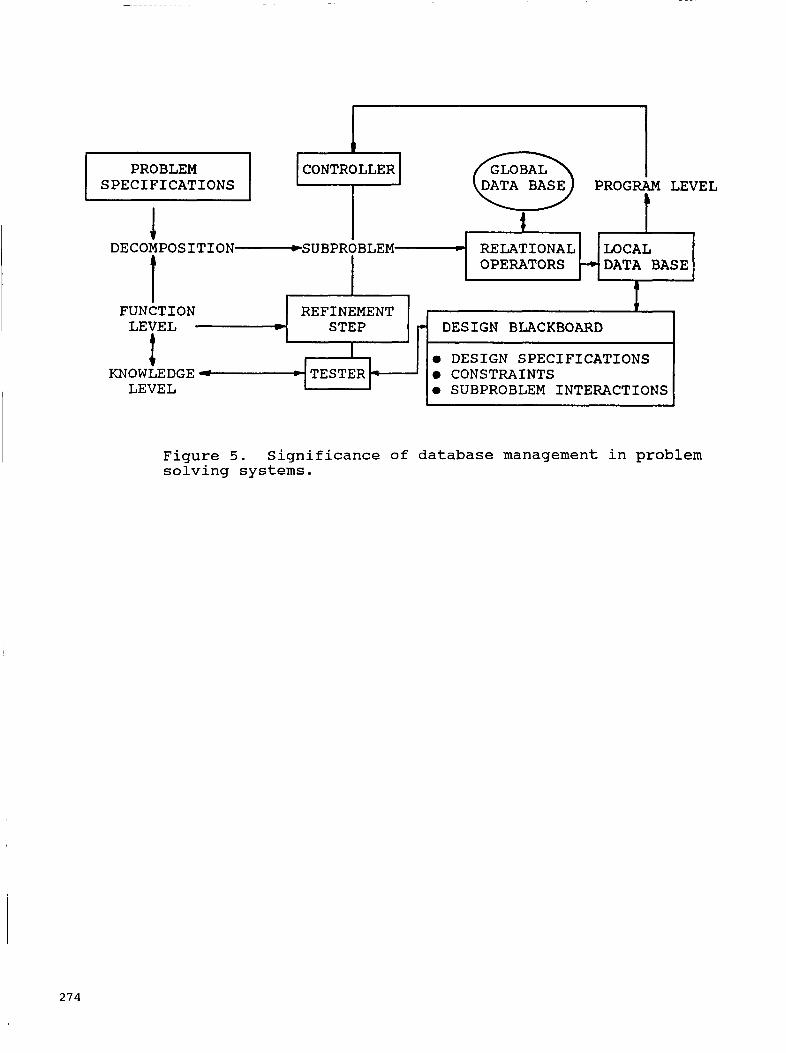
1 PROBLEM SPECIFICATIONS
FUNCTION REFINEMENT LEVEL P STEP -
I I KNOWLEDGE e
LEVEL
GLOBAL
I
RELATIONAL LOCAL OPERATORS DATA BASE
DECOMPOSITION-SUBPROBLEM
t I 4
DESIGN BUCKBOARD
0 DESIGN SPECIFICATIONS 0 CONSTRAINTS 0 SUBPROBLEM INTERACTIONS
Figure 5. Significance of database management in problem solving systems.
274
1

N89- 25159 .. DEVELOPMENT OF A MICRO-COMPUTER BASED
INTEGRATED DESIGN SYSTEM FOR
HIGH ALTITUDE LONG ENDURANCE AIRCRAFT*
Davld W. Hall** & J. Edward Rogan*** by
ABSTRACT
In recent years, increasing attention has been given in the aerospace industry to integration of aircraft design disciplines. This approach has been applied theoretically to sailplane design and to solar powered high altitude long endurance (HALE) aircraft design. More recently, it has been applied to the design of microwave powered aircraft. These studies describe attempts to arrive at integrated designs of one class of aircraft using then-existing state-of-the-art computer capabilities. No attempt was made in any of these cases, though, to use new programming techniques derived from Artificial Intelligence (AI) research to develop more flexible systems for the conceptual design of HALE aircraft.
The purpose of this study was to investigate the feasibility of developing a general parametric sizing capability for micro-computers using integrated design methodology implementing an existing HALE methodology as a test case. The methodology described here incorporates some detailed calculations, many qualitative rules-of-thumb and constraints which are not easily quantified except by the accumulation of design experience. In this regard, the resultant software which will be developed in future efforts will be a knowledge-based system for the conceptual design of HALE aircraft.
*
* *
This work was sponsored as a Phase I SBlR by the NASA/Ames Research Center, Advanced Plans & Programs Office David Hall Consulting, AlAA member The Georgia Institute of Technology, School of Aerospace Engineering, AlAA member .**
275
INTRODUCTION
Advances in computing technology have made it possible to create a new kind of design tool. Current generation CAD/CAE/CAM systems are based on an idea of the computer as a "number cruncher"---computations are thought of as manipulations of numbers. This approach has led to an emphasis on geometry representation and numerical techniques in engineering computing. Viewed in this way, computers aid design, but are essentially external to the design process.
An alternative view of the computer has been around since Alan Turing's epoch-making work in the 1930's: the view of computing as manipulation of symbols, (which might include numbers among other things). The great beauty of Turing's work is in the intimate connection between the scientific definition of what a computer is (it's called a Turing Machine) and aspects of mathematics as a language that are among the most important scientific discoveries of this century (Kurt G6del's completeness and incompleteness theorems).
What does any of this have to do with design or aircraft? After all, designers are notoriously,and admittedly, innocent of mathematicsl. However, designers, like everyone else, use a language of symbols to solve problems. The idea of a symbolic programming language for (aerospace) design, clearly delineated and with most of the main pieces present, is the primary innovation of the work described in this paper.
The application, if not the development, of a programming language for design must be graphical since designers think graphically. A symbolic "design programming language" must provide the designer with the means to describe design concepts and manipulate them in a convenient, but disciplined, manner. Certainly, the language must provide the capability to describe (1) the air vehicle itself ("What it is"), (2) the functional decomposition ("What it does") and (3) various approximate theories, analyses and models which collectively describe "How it works".
What does it mean to execute or "run" (the word "interpret", in its everyday sense, rather than in the specialized computing sense, is probably most accurate) computer programs written in such a language? Interpretation of a computer program involves defining contexts (environments) in which names (variables, attributes) are bound (assigned, set) to values (which may be numbers or other symbols)? Procedures, in which the named variables appear as parameters, are then evaluated in the environments. On the other hand, execution of an air vehicle design process involves exploring how alternative design ideas fit together by preparing engineering drawings and performing analyses. The process of making an engineering drawing is a decision-making process that results not only in the design specification, but in the designer's understanding of how the final concept works and why design decisions were made the way they were. It is this understanding that allows the designer to conscientiously "sign off" that the design is correct in the designer's professional opinion.
The design programming language to be described in this report allows designers to use computers to do design, rather than to aid design. This means that interpretation of computer programs written in the design programming language must support the design decision-making process. Designers must be able to use computer programs written in the "programming language for design" to gain a technical understanding of the way the aircraft will work and might fail, and to develop and communicate their rationales for design decisions.
Background
A programming language for design is a "knowledge-based system" in the sense that the basic architecture (knowledge-base, inference engine, problem state or context) and the techniques used for structuring and interpreting computer programs (inheritance, constraint propagation, objects/modularity/state, data and procedure abstraction, and metalinguistic abstraction) are basically the same. However, a "programming language for design" is far from being an "expert" system. The idea of an expert system is that once knowledge has been extracted from the expert (or experts), the computer program is able to reach conclusions that can be logically inferred from the rule base with only minimal human intervention. The implication is that novices would then be able to tackle many of the problems that can nowadays only be solved by experts. In contrast, the programming language for design is a tool specifically for use by expert aircraft designers. The intention is to accomplish the kinds of productivity gains for aircraft designers that word processing provides for authors and secretaries, or that symbolic mathematics programs (e.g., MACSYMA or SMP) provide for mathematicians and other scientists.
An example is a decision-oriented (rather than drafting oriented) user interface for preparing aircraft three-views. An important insight resulting from the research is that a fundamentally wrong turn is being taken with the introduction of three-dimensional geometry in the very early phases of conceptual design in that the declsion-support aspects of the three-view drawing have been overlooked in favor of the product deflntlon advantages of three-dimensional surfaced geometric models. The three-view drawing is a classic example of the suppression of non-essential detail (required to implement a 3-0 model) in order to emphasize critical design aspects: placement of landing gear, pilot visibility, wing planform shape, static stability, propulsion integration, etc. The three-view should properly be used to make these design decisions. Three-dimensional surface definition should then be developed by interpreting the three-view drawing. Procedures for interpreting three-views would be implemented using the computer programming language for design.
Successful implementation of the integrated design system for rnicro-computers will accelerate the use of computers to do design, increasing product quality and reducing the length of the development cycle by allowing designers to look at a broader range of design concepts. Additional benefits obtain if the use of a computer programming language for design is carried forward into preliminary design, detailed design, production, and support phases of the system life cycle. Here, the ability of computers to manage complexity and detail would be invaluable. The idea that a product decision history, represented by a portion of the computer programs for the design, could be carried onboard each "tail number" and used to assess the impact of maintenance actions and for configuration control has considerable appeal for long-life, high-value systems such as aircraft and reusable spacecraft.
The advantages of a computer programming language for design are clear. The question remains, "How can a design computing language be implemented?". The answer to this question begins with an assessment of some alternative approaches to applying advanced computing technology to design, comparing and contrasting them with our technical approach. From this discussion will emerge key issues that must be addressed to establish proof-of-concept for the design
277
computing language. These issues then provide a backdrop for the technical discussions, results and conclusions which follow.
AI te rnative Approaches
I The design computing language being developed at QHC, (called "windframe") is one of several design tools that could justifiably be said to represent the next generation. These alternative approaches are in various stages of maturity, ranging from research projects to small, new-start CAD companies and new directions being taken by established CAD vendors. One of the first projects to break ground in design computing languages was the Paper Airplane project at the Massachusetts Institute of Technology 3. Paper Airplane contributed the idea that constraint propagation could be used in conjunction with a symbolic representation of design "attributes" and relationships among those attributes to free the designer from the tendency of FORTRAN synthesis programs to have "hard-wired" design decision paths. Newton's method was applied in a single variable to solve the constraints in the "backward direction. Paper Airplane, written in the LISP programming language, was envisioned primarily as a tool for conceptual design.
Rubber Airplane, currently being developed by Mark Kolb at M.I.T., was started as a result of a technical exchange between Dr. Elias and Randy Smith, then (December 1985) at The Lockheed-Georgia Company 4. Smith had been working on a FORTRAN code for parametric geometry and 3-0 surface definition, called GRADE. In his Rubber Airplane work, sponsored by the NASNAmes Advanced Plans and Programs Office, Kolb continues to apply a constraint propagation technique based on the successful Paper Airplane ideas (Rubber Airplane is written in Common LISP). However, Rubber Airplane provides components, which are similar (from a design point of view) to the components defined in GRADE (except that the designer has much more flexibility). Rubber Airplane also provides design links between components. Paper Airplane was originally developed on a VAX using Franz Lisp. Rubber Airplane is being implemented on Texas Instruments Explorer workstations, although it also runs on Symbolics LISP Machines.
At about the same time Elias was starting work on Paper Airplane, Larry Rosenfeld was developing a parametric geometry modeller that eventually evolved into the CAD systems. The details of how CAD works are rather closely guarded; however, it can be noted that the system provides an advanced parametric surface definition capability and demand-driven propagation of symbolic and numeric constraints. Constraint propagation does not appear to be as powerful as those in Paper Airplane and Rubber Airplane because it works only in one direction. An often-cited problem with CAD is that the user/designer interacts with the system primarily by programming in a LISP-like design programming
the structure of the design concept representation: the design is represented as a hierarchical tree of parts, linked by relationships that are not given any special structure. Early versions of CAD ran primarily on Symbolics LISP Machines, but the product is becoming available on other workstations with fast LISP software.
I I
language, the CAD Language. A feature of CAD that is important for comparison with windFrame is
Dr. Gene Bouchards work at The Lockheed Aeronautical Systems Company should also be mentionede. Details of the system are proprietary, except that the system is LISP-based, runs on the Symbolics, and provides a valuable graphical programming user interface. Bouchard has focused on providing designers with a quick turnaround trade study capability. Parametric surface definition capability is planned lor the system but has not yet been implemented.
lntergraph Corporation made the decision about four years ago to implement their Non-Uniform-Rational-B-Spline (NURBS) package using object-oriented techniques in the C programming language. This has provided them with a significant fallout design programming language
I 278

capability, although the system is primarily oriented toward geometry definition, rather than design decision-making7.
The Cognition system attracted considerable attention when it first appeared, offering an attractive object-oriented drawing interface linked with on-line standard handbook@. Constraint propagation was provided through the solution of relatively large multi-dimensional Newton-Raphson methods. The Cognition system was written in Mainsail, a LISP-like object-oriented language.
windFrame was conceived to explore areas of design computing languages that were not being emphasized by any of these products or projects. These areas were
Apply optimization as a constraint propagation technique and use decomposition and parameter passing to limit the extent of constraint propagation.
Base the organization of the language around Systems Engineering discipline, especially explicit description of design function .
Focus on aircraft design and develop the system through walkthroughs of a proven aircraft design methodology, working closely with an experienced aircraft designer.
Develop a system that would run on a relatively inexpensive micro-computer and plan to place the system in the public domain.
Base the development of the language on the user interface.
Design the computer programming language so that it could be used throughout the life cycle of an aircraft.
Focus on design decision-making.
Use approximation techniques to provide interactive explanation and "What if?" analysis as part of the constraint propagation.
Issues that have been addressed to date include:
b Is object-oriented programming the "best" way to implement a design language? If not, what replaces or complements it?
b What "objects" (or their equivalents) are needed to organize the language around Systems Engineering disciplines?
How can Dr. Sobieski's (NASNLangley Research Center Interdisciplinary Research Office) decomposition techniques be extended to apply to discrete parameters?
How can constraint propagation problems be formulated as optimization problems?
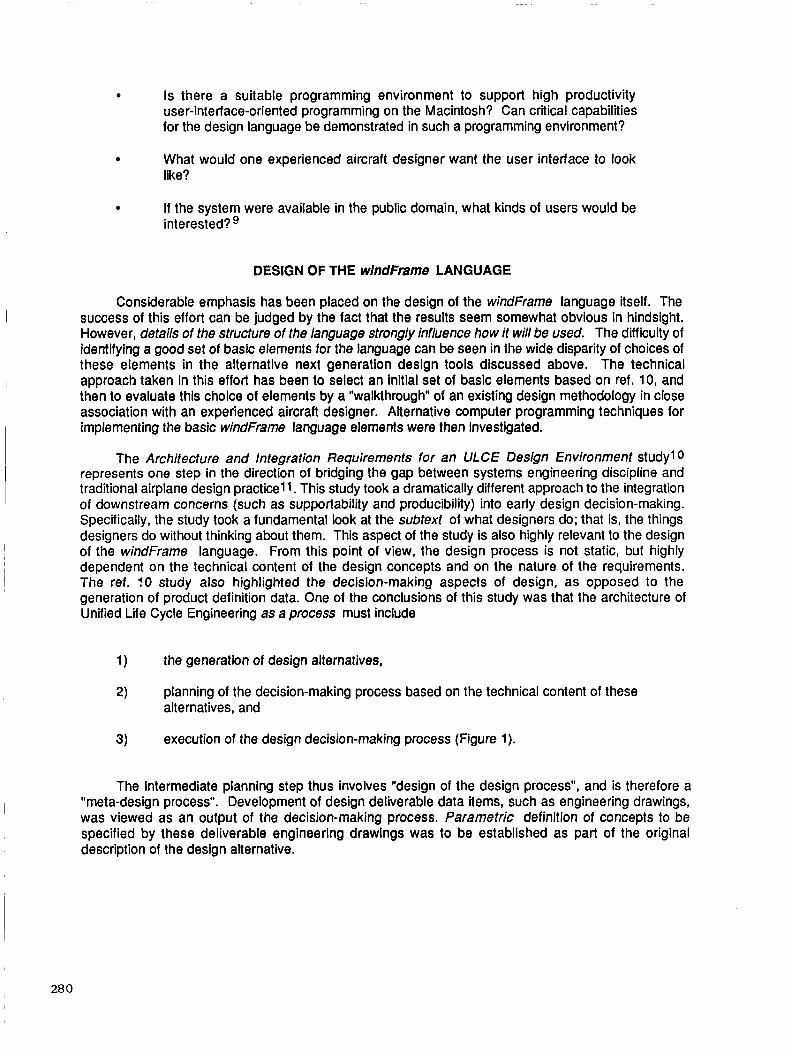
Is there a suitable programming environment to support high productivity user-interface-oriented programming on the Macintosh? Can critical capabilities for the design language be demonstrated in such a programming environment?
What would one experienced aircraft designer want the user interface to look like?
If the system were available in the public domain, what kinds of users would be interested?
DESIGN OF THE windFrame LANGUAGE
Considerable emphasis has been placed on the design of the windFrame language itself. The success of this effort can be judged by the fact that the results seem somewhat obvious in hindsight. However, details of the structure of the language strongly influence how it will be used. The difficulty of identifying a good set of basic elements for the language can be seen in the wide disparity of choices of these elements in the alternative next generation design tools discussed above. The technical approach taken in this effort has been to select an initial set of basic elements based on ref. 10, and then to evaluate this choice of elements by a "walkthrough" of an existing design methodology in close association with an experienced aircraft designer. Alternative computer programming techniques for implementing the basic windFrame language elements were then investigated.
The Architecture and Integration Requirements for an ULCE Design Environment study1 0 represents one step in the direction of bridging the gap between systems engineering discipline and traditional airplane design practice1 1. This study took a dramatically different approach to the integration of downstream concerns (such as supportability and producibility) into early design decision-making. Specifically, the study took a fundamental look at the subtext of what designers do; that is, the things designers do without thinking about them. This aspect of the study is also highly relevant to the design of the windFrame language. From this point of view, the design process is not static, but highly dependent on the technical content of the design concepts and on the nature of the requirements. The ref. ! O study also highlighted the decision-making aspects of design, as opposed to the generation of product definition data. One of the conclusions of this study was that the architecture of Unified Life Cycle Engineering as a process must include
1) the generation of design alternatives,
2) planning of the decision-making process based on the technical content of these alternatives, and
3) execution of the design decision-making process (Figure 1).
The intermediate planning step thus involves "design of the design process", and is therefore a "meta-design process". Development of design deliverable data items, such as engineering drawings, was viewed as an output of the decision-making process. Parametric definition of concepts to be specified by these deliverable engineering drawings was to be established as part of the original description of the design alternative.
280
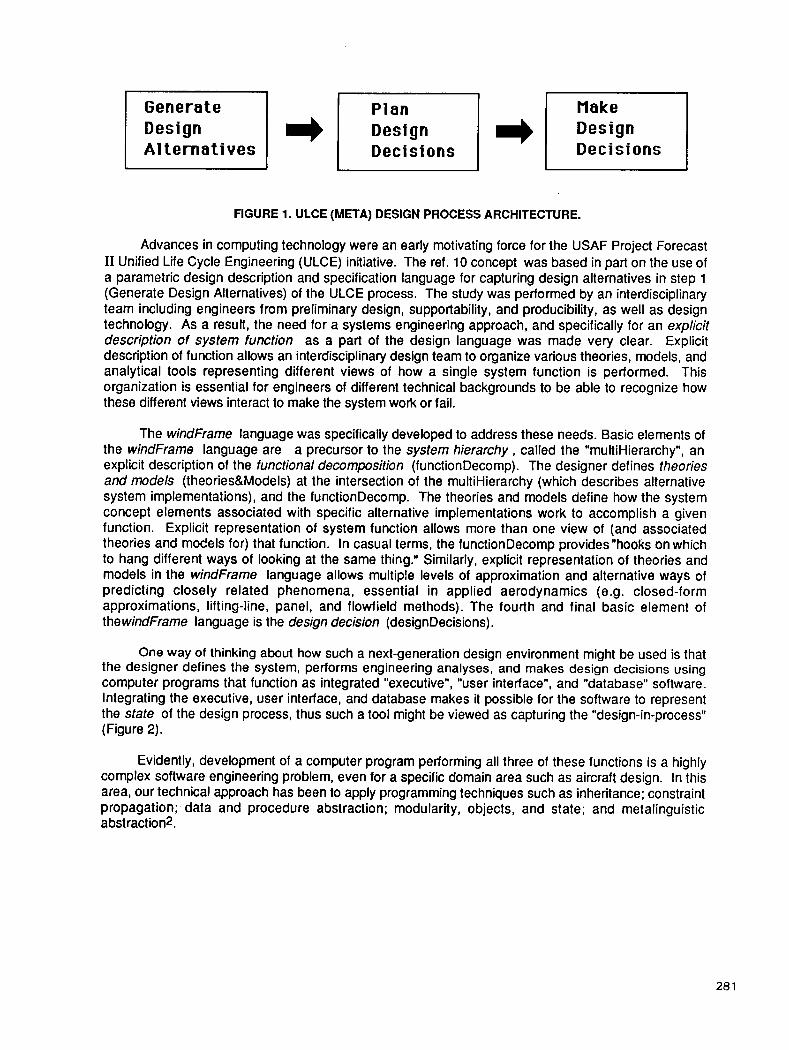
A1 ternatives Decisions Decisions
FIGURE 1. ULCE (META) DESIGN PROCESS ARCHITECTURE.
Advances in computing technology were an early motivating force for the USAF Project Forecast I1 Unified Life Cycle Engineering (ULCE) initiative. The ref. 10 concept was based in part on the use of a parametric design description and specification language for capturing design alternatives in step 1 (Generate Design Alternatives) of the ULCE process. The study was performed by an interdisciplinary team including engineers from preliminary design, supportability, and producibility, as well as design technology. As a result, the need for a systems engineering approach, and specifically for an explicit description of system function as a part of the design language was made very clear. Explicit description of function allows an interdisciplinary design team to organize various theories, models, and analytical tools representing different views of how a single system function is performed. This organization is essential for engineers of different technical backgrounds to be able to recognize how these different views interact to make the system work or fail.
The windFrame language was specifically developed to address these needs. Basic elements of the windFrame language are a precursor to the system hierarchy, called the "muItiHierarchy", an explicit description of the functional decomposition (functionDecomp). The designer defines theories and models (theories&Models) at the intersection of the multiHierarchy (which describes alternative system implementations), and the functionDecomp. The theories and models define how the system concept elements associated with specific alternative implementations work to accomplish a given function. Explicit representation of system function allows more than one view of (and associated theories and models for) that function. In casual terms, the functionDecomp provides"hooks on which to hang different ways of looking at the same thing." Similarly, explicit representation of theories and models in the windFrame language allows multiple levels of approximation and alternative ways of predicting closely related phenomena, essential in applied aerodynamics (e.g. closed-form approximations, lifting-line, panel, and flowfield methods). The fourth and final basic element of thewindFrame language is the design decision (designDecisions).
One way of thinking about how such a next-generation design environment might be used is that the designer defines the system, performs engineering analyses, and makes design decisions using computer programs that function as integrated "executive", "user interface", and "database" software. Integrating the executive, user interface, and database makes it possible for the software to represent the state of the design process, thus such a tool might be viewed as capturing the "design-in-process'' (Figure 2).
Evidently, development of a computer program performing all three of these functions is a highly complex software engineering problem, even for a specific domain area such as aircraft design. In this area, our technical approach has been to apply programming techniques such as inheritance; constraint propagation; data and procedure abstraction; modularity, objects, and state; and metalinguistic abstract io$.
28 1
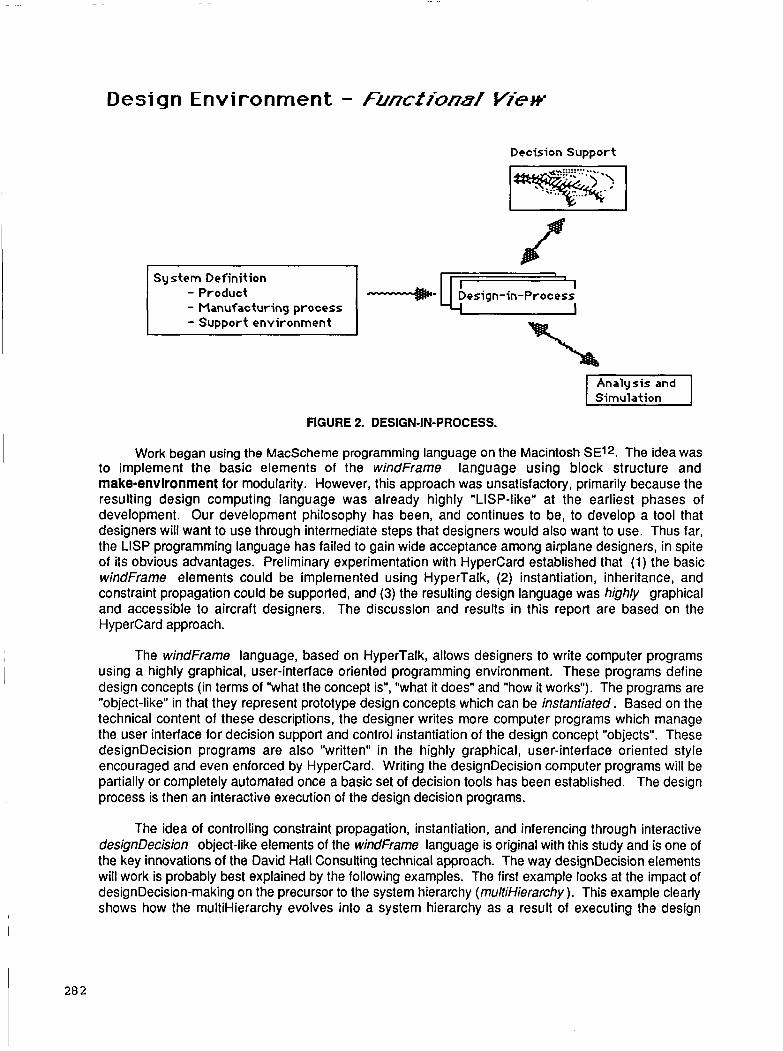
Design Environment - Funcfiim..l
S y s t e m Definition - Product - Manufacturing process - Support environment
Yi-e w
Decision Support
-- F, Design-in-Process
Analysis and
FIGURE 2. DESIGN-IN-PROCESS.
Work began using the MacScheme programming language on the Macintosh SEI? The idea was to implement the basic elements of the windFrame language using block structure and make-environment for modularity. However, this approach was unsatisfactory, primarily because the resulting design computing language was already highly "LISP-like" at the earliest phases of development. Our development philosophy has been, and continues to be, to develop a tool that designers will want to use through intermediate steps that designers would also want to use. Thus far, the LISP programming language has failed to gain wide acceptance among airplane designers, in spite of its obvious advantages. Preliminary experimentation with Hypercard established that (1) the basic windFrame elements could be implemented using HyperTalk, (2) instantiation, inheritance, and constraint propagation could be supported, and (3) the resulting design language was highly graphical and accessible to aircraft designers. The discussion and results in this report are based on the Hypercard approach.
The windFrame language, based on HyperTalk, allows designers to write computer programs using a highly graphical, user-interface oriented programming environment. These programs define design concepts (in terms of "what the concept is", "what it does" and "how it works"). The programs are "object-like" in that they represent prototype design concepts which can be instantiated. Based on the technical content of these descriptions, the designer writes more computer programs which manage the user interface for decision support and control instantiation of the design concept "objects". These designDecision programs are also "written" in the highly graphical, user-interface oriented style encouraged and even enforced by Hypercard. Writing the designDecision computer programs will be partially or completely automated once a basic set of decision tools has been established. The design process is then an interactive execution of the design decision programs.
The idea of controlling constraint propagation, instantiation, and inferencing through interactive designDecision object-like elements of the windFrame language is original with this study and is one of the key innovations of the David Hall Consulting technical approach. The way designDecision elements will work is probably best explained by the following examples. The first example looks at the impact of designDecision-making on the precursor to the system hierarchy (rnultiHierarchy ). This example clearly shows how the multiHierarchy evolves into a system hierarchy as a result of executing the design
28 2
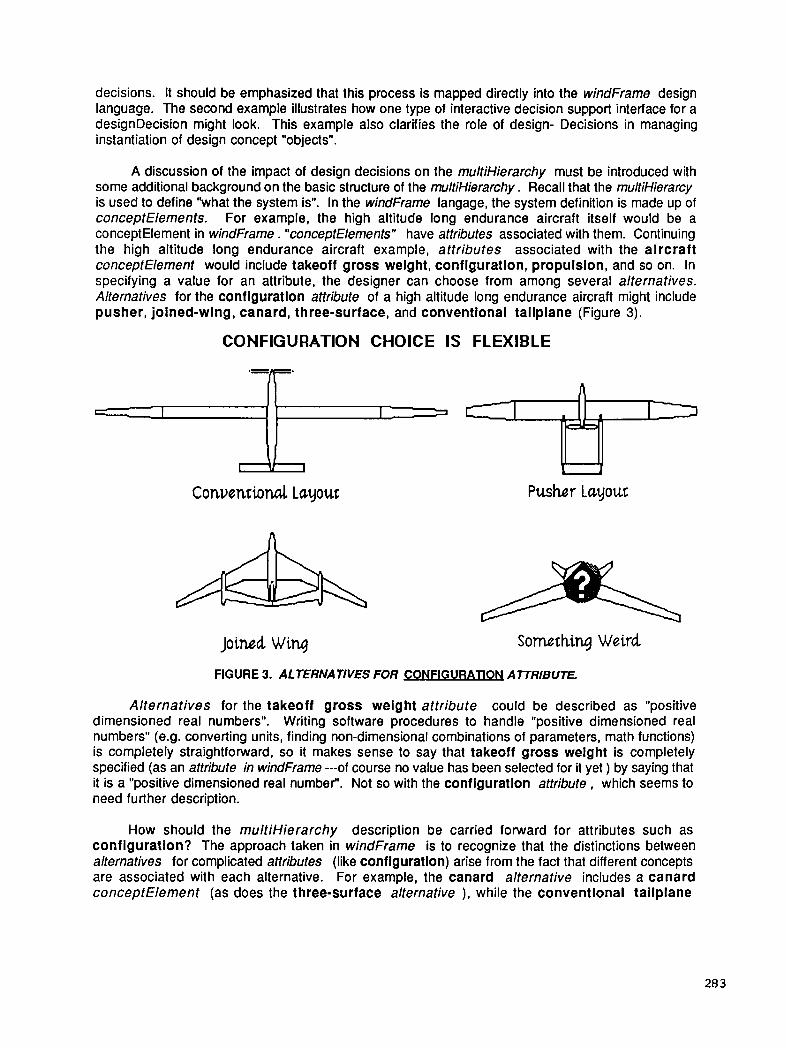
decisions. It should be emphasized that this process is mapped directly into the windf-fame design language. The second example illustrates how one type of interactive decision support interface for a designDecision might look. This example also clarifies the role of design- Decisions in managing instantiation of design concept "objects".
A discussion of the impact of design decisions on the multiHierarchy must be introduced with some additional background on the basic structure of the multiHierarchy . Recall that the multiHierarcy is used to define "what the system is". In the windFrame langage, the system definition is made up of conceptElements. For example, the high altitude long endurance aircraft itself would be a conceptElement in windFrame . "conceptElements" have attributes associated with them. Continuing the high altitude long endurance aircraft example, attributes associated with the aircraft conceptElement would include takeoff gross welght, configuration, propulsion, and so on. In specifying a value for an attribute, the designer can choose from among several alternatives. Alternatives for the conflguratlon attribute of a high altitude long endurance aircraft might include pusher, jolned-wlng, canard, three-surface, and conventional tallplane (Figure 3).
CONFIGURATION CHOICE IS FLEXIBLE
Conuentional Layout Pusbr Layout
A
Joined Wing Sometking Weird
FIGURE 3. ALTERNATIVES FOR CONFIGURATION ATTRIBUTE.
Alternatives for the takeoff gross weight attribute could be described as "positive dimensioned real numbers". Writing software procedures to handle "positive dimensioned real numbers" (e.g. converting units, finding non-dimensional combinations of parameters, math functions) is completely straightforward, so it makes sense to say that takeoff gross weight is completely specified (as an attribute in windFrame ---of course no value has been selected for it yet ) by saying that it is a "positive dimensioned real number". Not so with the conflguratlon attribute , which seems to need further description.
How should the multiHierarchy description be carried forward for attributes such as configuration? The approach taken in windFrame is to recognize that the distinctions between alternatives for complicated attributes (like conflguratlon) arise from the fact that different concepts are associated with each alternative. For example, the canard alternative includes a canard conceptElement (as does the three-surface alternative ), while the conventional tallplane
28 3

alternative does not. windFrame thus tackles specification of complicated design ideas through a conceptElement-attribute-alternative-conceptElement tree structure, the multiHierarchy which is shown in Figures 4 through 9.
The multiHierarchy evolves into a classical systems engineering tool, the "system hierarchy" 11. The designer uses the object-like designDecision elements of the. windFrame language to select among alternative design concepts. The designDecision elements of windframe manage the partial instantiation of design alternatives needed to apply the engineering analysis procedures contained in the 'theories &Models. The designDecision elements of windFrame collectively provide the designer with interactive control over constraint propagation, while keeping track of intermediate results and partially defined alternative configurations and accumulating approximations to design goals, requirements, and constraints as surfaces that delimit the design space. This information is used in windFrame to provide interactive explanation-oriented constraint propagation.
mmpifi'emni .'
a?termtiw
FIGURE 4. MULTIHIERARCHY TREE STRUCTURE.
rfiribut8
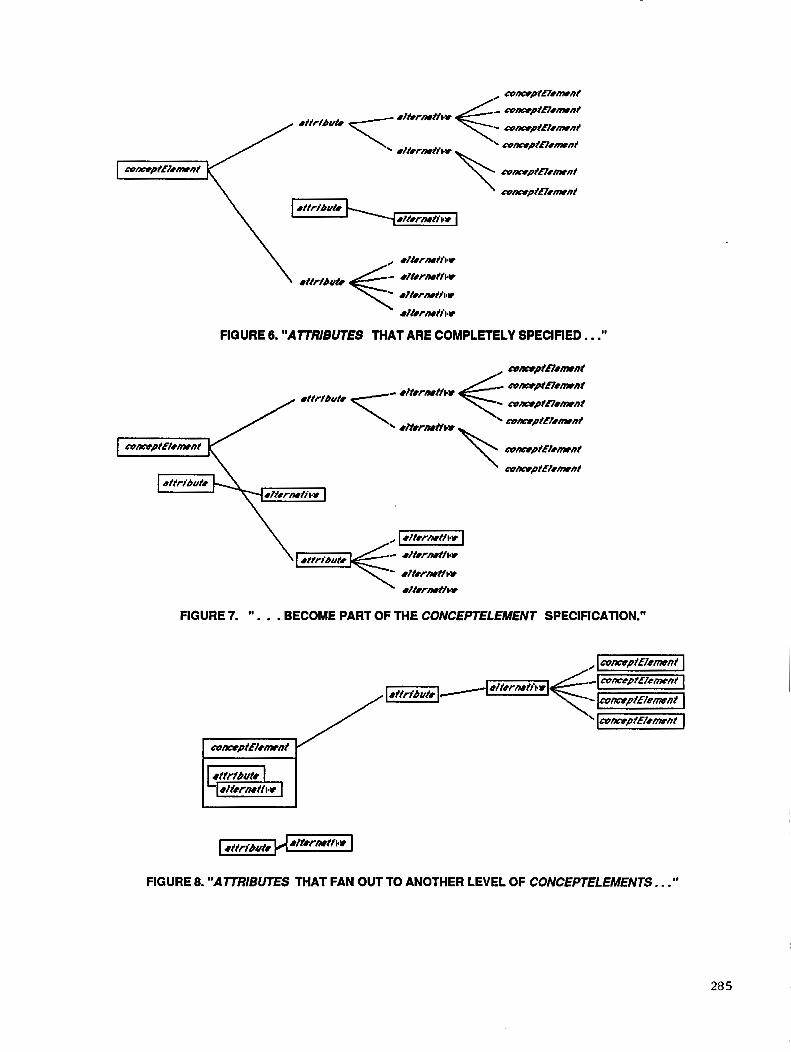
&/termttI*u \ &tfrtbuf8< - &/t0rmftl.r - rlt8rmttl.r
&/t8rmftl.w
FIGURE 6. "ATTRIBUTES THAT ARE COMPLETELY SPECIFIED . . ."
FIGURE 7. " . . . BECOME PART OF THE CONCEPTELEMENT SPECIFICATION."
FIGURE 8. "ATTRlBUTES THAT FAN OUT TO ANOTHER LEVEL OF CONCEPTELEMENTS . . ."
28 5

FIGURE 9. " . . . DEFINE THE NEXT LEVEL OF THE SYSTEM HIERARCHY."
One of the results of the design decision-making process supported by windFrame is the (aircraft) system specification. Development of the system specification is controlled by the designer through the designDecisions. Looked at from the point of view of the multiHierarchy as it evolves into the system hierarchy, designDecisions bind attributes to one of their alternatives (Figure 5).
Attributes that are completely specified by this binding (e.g., once a "positive dimensioned real number" has been chosen for takeoff gross welght, no additional specification is needed) become part of of the conceptHement specification (Figures 6 and 7). Attributes which fan out to another level of conceptHements (Figure 8) define the next level of the system hierarchy (Figure 9). An important aspect of the design of the windFrame language is that the subtle distinction is clearly made between specifying levels of the system hierarchy through the design decision-making process and specifying levels of design alternatives (by creating a multiHierarchy down to some level of description). This aspect of windFrame gives the design language enough expressive power to capture "levels of approximation"which are needed for various1 theories&Mode/s. In fact, the level of approximation of a theory/Model is essentially the amount of depth in the multiHierarchy that must be instantiated in order to apply that theory/Model.
designDecision elements of the windFrame language are used to partially instantiate "object-like" pieces of the design concepts described by the multiHierarchy and theories8iModels. Only those attributes of the design concept needed to perform an evaluation of the concept against design goals, criteria, and requirements are bound to alternative values. This binding is made in a context (in the sense of interpretation of a computer program discussed above) that is managed by the designDecision element. This context is exploratory. Not all the partially instantiated designs in this context will meet requirements. Some of them may be inconsistent or infeasible.
One type of windFrame interface that is used by the designer to control this instantiation and evaluation process has the appearance of a set of one-dimensional, two-dimensional, carpet, or other types of plots used for presenting aircraft design and performance information. Another interface, appropriate for discrete, qualitatively different alternatives, is a "trade table" 11. Both of these classes of decision support tools are familiar to designers. There are limitations to the use of these classical decision support interfaces, however. Their succesful use depends on the designer's ability to set up a design decision process that will rapidly converge on a satisfactory design solution. One of the risks inherent in the integration of new technology is that coming up with a good design process is basically the same problem as coming up with a good design.
286

The development of the windFrame language will make it practical to provide designers with some tools for "designing the design process". The technical approach is to use local optimization and parameter passing to formulate the design process as a network of interrelated decisions. Initial sensitivity and examination of design alternatives are applied to identify sequences of design decisions that have good convergence. As the design space is explored, approximation techniques can be used to build models of complex interactions between design attributes and requirements. The process comes full circle when these approximations are plotted and trade tables are made up using the "classical" decision interfaces. An "explanation" process, using both the "classical" decision interfaces and the design space approximations, can be used by the designer to "design a new design process"---at the same time the designer is designing a new type of aircraft.
The second example illustrating the role of designDecisions in windFrame is closely linked with these ideas. A prototype decision support interface for exploring the design space would consist of a collection of x-y plots of one attribute against another (Flgure 10). For example,,the attributes could be wlng loading and power loading. (The values shown in Figure 10 are screen coordinates at the location of the "design instance"). Within allowable limits on alternative values for wing loading and power loading, any point on the plot corresponds to a partial specification of a design. Of course, this information, along with appropriate fheories&Mode/s may be sufficient to evaluate these design alternatives (e.g., against FAR 23.67). Using the mouse with appropriate pull-down menus and/or Hypercard "buttons", the designer can 1) create an interface to access a partial instantiation of a design alternative in the context of this designDecision , 2) interpret computer programs to create the partial instance itself, and 3) evaluate the partial instance using appropriate theories&Mode/s. Results of these evaluations can be accumulated in the designDecision context and used as the basis to construct design space approximations.
The decision support interface in this example (Figure 10) is based on a technique for constructing multidimensional quadratic splines based on systematic evaluation of design alternatives. The simplex pattern referred to in Figure 10 (drawsimplex---top "button" on right hand side of screen and moveSimplex) is a pattern used in Experimental Design. A simplex is made up of the minimum number of points in n-dimensional space required to construct a first-order (linear) model. A "zero-dimensional'' simplex is a point, a one-dimensional simplex is a line (two endpoints), a two-dimensional simplex is a triangle (three corner-points), a three dimensional simplex is a tetrahedron (four corner-points), and so on. The n+l points in the simplex must be arranged so that substituting the points XI, . . . . , xn+l (these points are n-dimensional vectors) into the linear model results in n+l independent equations:
The equations can be inverted to give a unique solution for the coefficients ai of a linear approximation to an unknown math function F(x). The technique uses the idea that exploration of a design space usually involves evaluating designs on adjacent simplices. If the first derivatives of F are continuous across the boundaries between these adjacent simplices, then a second-order spline approximation to F can be found that fits the design points within each simplex and is continuous across the simplex boundaries. For a pattern of two simplices in two-dimensional (xi , x2) space, with the common boundary at x1=0, the spline equations are
28 7

a1 = b i a12 = b12 a22 = b22 a2 = b 2 a0 = bo
This gives 5 equations for the 8 unknowns in the two quadratic approximations (one on each simplex) :
The remaining 3 equations can be used to fit the spline near some design alternatives within the simplex boundary that are of interest. These approximation techniques are more qualitative than quantitative, in the sense that they are used by the designer to guide exploration of the design space and to dynamically estimate stability and convergence characteristics of a design process plan.
An alternative approach, accomplishing the same thing but based on different assumptions, can be derived from the ideas of Fleury 13. Fleury applies the idea of diminishing returnslo conclude that a general parameter optimization problem can be cast (at least locally) in the form:
objective: minimize w = wlxl + . . . . + wnxn
constraints: all(xl)-l + . . . + a1 + a10 2 O
A design variable yi may have to be transformed to Xi = (yi)-l depending on the local slopes of the constraints and the Fleury has also come parameters.
objective function to ensure that the “law of diminishing returns” can be applied. up with some ingenious heuristics to extend the approach to discrete design
drmwslmplmx
nowDmmlgn
mov.Slmplmr
175 85
n7 o
FIGURE 10. A DESIGNDECISION INTERFACE.
WALK-THROUGH IMPLEMENTATION. OF A HALE DESIGN
Users will have made several system-level choices prior to reaching the aircraft-related portion of the interface which starts with the chart presented in Figure 11 below. This figure is a depiction of the
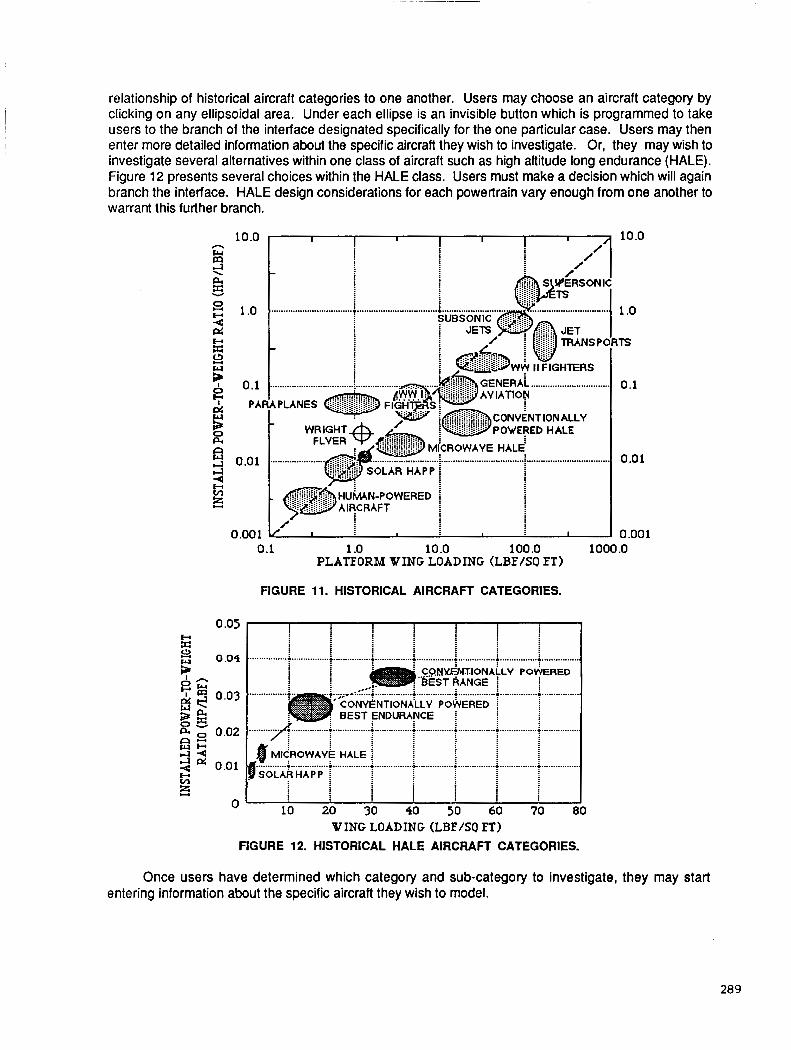
relationship of historical aircraft categories to one another. Users may choose an aircraft category by clicking on any ellipsoidal area. Under each ellipse is an invisible button which is programmed to take users to the branch of the interface designated specifically for the one particular case. Users may then enter more detailed information about the specific aircraft they wish to investigate. Or, they may wish to investigate several alternatives within one class of aircraft such as high altitude long endurance (HALE). Figure 12 presents several choices within the HALE class. Users must make a decision which will again branch the interface. HALE design considerations for each powertrain vary enough from one another to warrant this further branch.
TRANSPORTS
.................................
0.001 L/ I I 0.001
0.05 h
0.04
0.1 1 .o 10.0 100 .o PLATEORM WING LOADING (LBFISO ET)
FIGURE 11. HISTORICAL AIRCRAFT CATEGORIES.
i i i
i i 4 i i
i i i
i 1 ................. ................ ................ ................ ................ ................ ............ f
1000 .o
10 20 30 40 50 60 70 80 0'
WING LOADING (LBE/SO FT) FIGURE 12. HISTORICAL HALE AIRCRAFT CATEGORIES.
Once users have determined which category and sub-category to investigate, they may start entering information about the specific aircraft they wish to model.
289
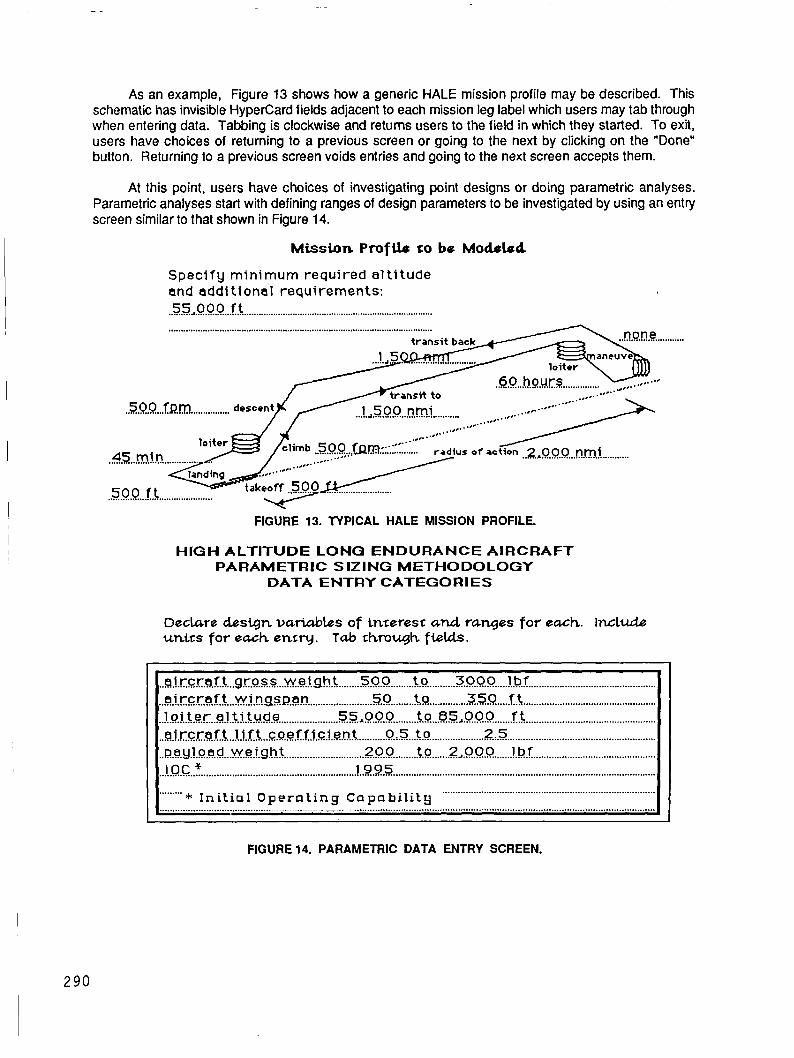
As an example, Figure 13 shows how a generic HALE mission profile may be described. This schematic has invisible Hypercard fields adjacent to each mission leg label which users may tab through when entering data. Tabbing is clockwise and returns users to the field in which they started. To exit, users have choices of returning to a previous screen or going to the next by clicking on the "Done" button. Returning to a previous screen voids entries and going to the next screen accepts them.
At this point, users have choices of investigating point designs or doing parametric analyses. Parametric analyses start with defining ranges of design parameters to be investigated by using an entry screen similar to that shown in Figure 14.
Mission Profi le EO be Modsled
Speci fy minimum requ i red a l t i t u d e and eddi t i ona l requi rements: .........,. 55 000 f t ................................................................................................. ............................................................................................................. A --I^
........................................... .......... f i r a n s i t to ...... ......................................... 500 fpm ............ ...... ......
FIGURE 13. TYPICAL HALE MISSION PROFILE.
HIGH ALTITUDE L O N G E N D U R A N C E AIRCRAFT PARAMETRIC SIZING M E T H O D O L O G Y
DATA E N T R Y CATEGORIES
DecLare destgn variables of tnreresr and ranges f o r each. Include untcs f o r each ent ry . T a b c h r o u g k fields.
...................................................
..a.tzy.!.oed..wel.g.h.t ................................................................... 200 t o 2 .I .......................................................................... 000 l b f
...............................................................................................................................................................................................
FIGURE 14. PARAMETRIC DATA ENTRY SCREEN.
I I 2 9 0
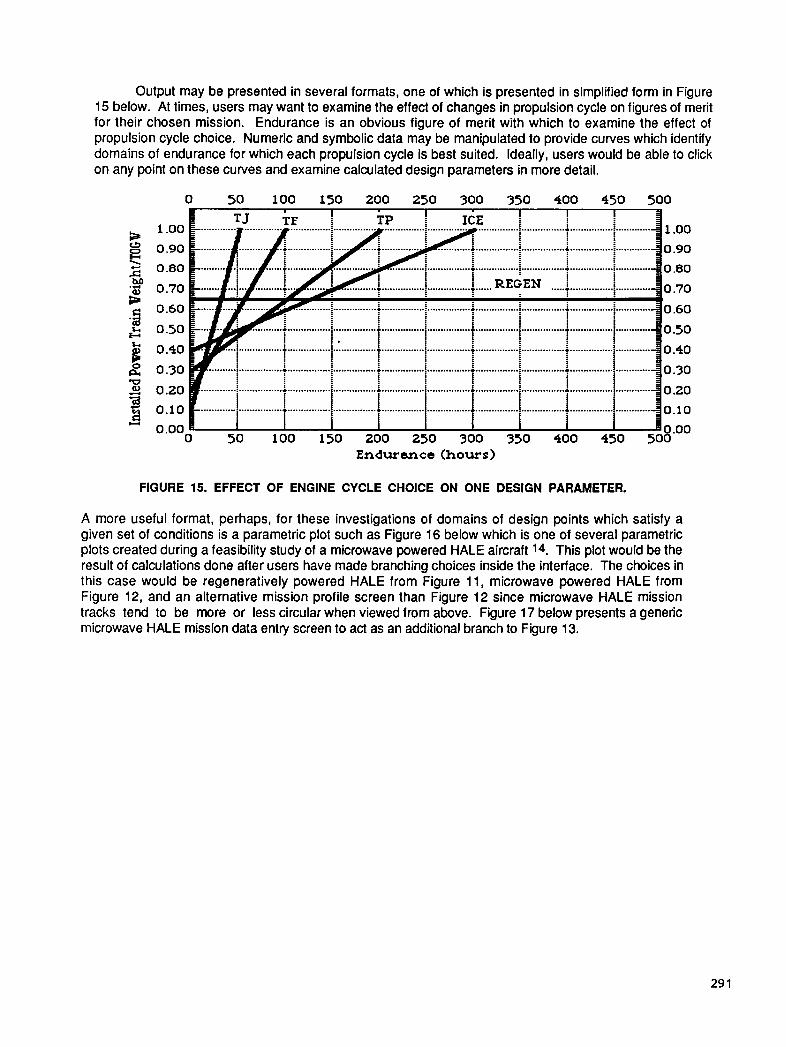
Output may be presented in several formats, one of which is presented in simplified form in Figure 15 below. At times, users may want to examine the effect of changes in propulsion cycle on figures of merit for their chosen mission. Endurance is an obvious figure of merit with which to examine the effect of propulsion cycle choice. Numeric and symbolic data may be manipulated to provide curves which identify domains of endurance for which each propulsion cycle is best suited. Ideally, users would be able to click on any point on these curves and examine calculated design parameters in more detail.
Endurance (hours)
FIGURE 15. EFFECT OF ENGINE CYCLE CHOICE ON ONE DESIGN PARAMETER.
A more useful format, perhaps, for these investigations of domains of design points which satisfy a given set of conditions is a parametric plot such as Figure 16 below which is one of several parametric plots created during a feasibility study of a microwave powered HALE aircraft 14. This plot would be the result of calculations done after users have made branching choices inside the interface. The choices in this case would be regeneratively powered HALE from Figure 11, microwave powered HALE from Figure 12, and an alternative mission profile screen than Figure 12 since microwave HALE mission tracks tend to be more or less circular when viewed from above. Figure 17 below presents a generic microwave HALE mission data entry screen to act as an additional branch to Figure 13.
29 1
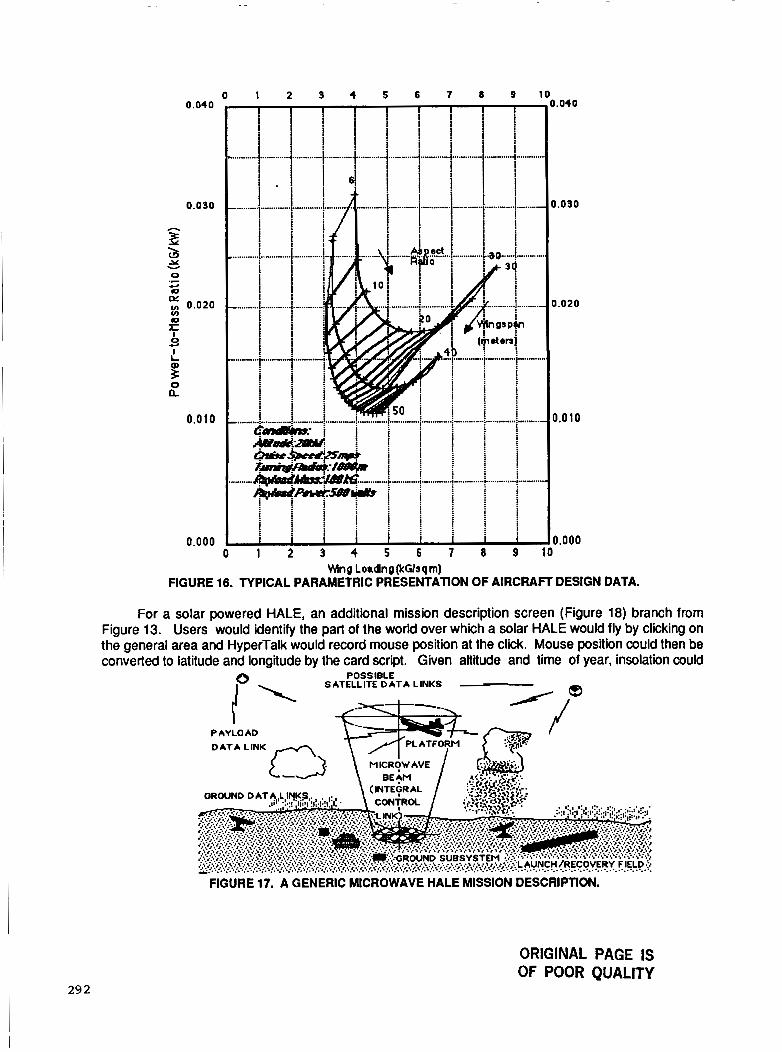
0 1 2 3 4 5 6 7 8 9 1 0.040
0.030
z \ LI) -Y
0 4 Q Dc
v) Q
v
.C
v) 0.020
f 0 4 I I
0 L
0.0 10
0.000
i .......................... p... ........
_ ....... .............. ............. I
i i ' i i ............
I
i .........................................
i i
1 ? j
1 1
civT&@as: M&;2aiid
w-
j i : ......................................
i i i
................... I ... I! ....-......
F 3 - d
........ -T
1 2 :
i i
i
f i I i i 5& i j i i
i -1- i wh$ ............. i..." ......... i .............. i ............. .i .............. : ............ $igl#wi
! ! I i
4 5 6 7 8 9 1
1.040
1.030
3.020
0.010
3.000
Wng Loading (kGlsq m) FIGURE 16. TYPICAL PARAMETRIC PRESENTATION OF AIRCRAFT DESIGN DATA.
For a solar powered HALE, an additional mission description screen (Figure 18) branch from Figure 13. Users would identify the part of the world over which a solar HALE would fly by clicking on the general area and HyperTalk would record mouse position at the click. Mouse position could then be converted to latitude and longitude by the card script. Given altitude and time of year, insolation could
POSSIBLE SATELLITE DATA LINKS
PAYLOAD DATA LINK
FIGURE 17. A GENERIC MICROWAVE HALE MISSION DESCRIPTION.
ORIGINAL PAGE IS OF POOR QUALtTY
I 29 2
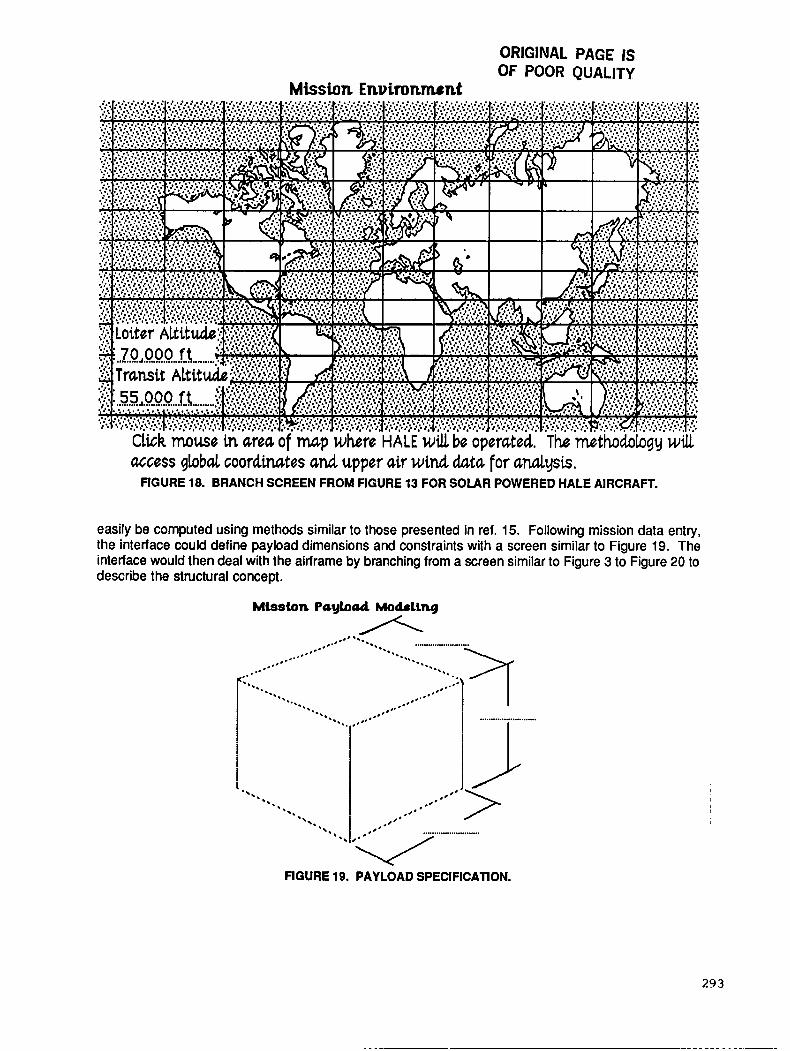
ORIGINAL PAGE IS OF POOR QUALITY
Mission Envimnmrnt
.. .... ..*.' **. ..\. ,,...'. , . *' .......................... *.
.. '. -. -... *.
access global coordinates and upper air wind data for analysis. FIGURE 18. BRANCH SCREEN FROM FIGURE 13 FOR SOLAR POWERED HALE AIRCRAFT.
.\ .\. \. '. *. **.
I
easily be computed using methods similar to those presented in ref. 15. Following mission data entry, the interface could define payload dimensions and constraints with a screen similar to Figure 19. The interface would then deal with the airframe by branching from a screen similar to Figure 3 to Figure 20 to describe the structural concept.
II- .O*.''' > , , a '
, ,8* ..........................
293
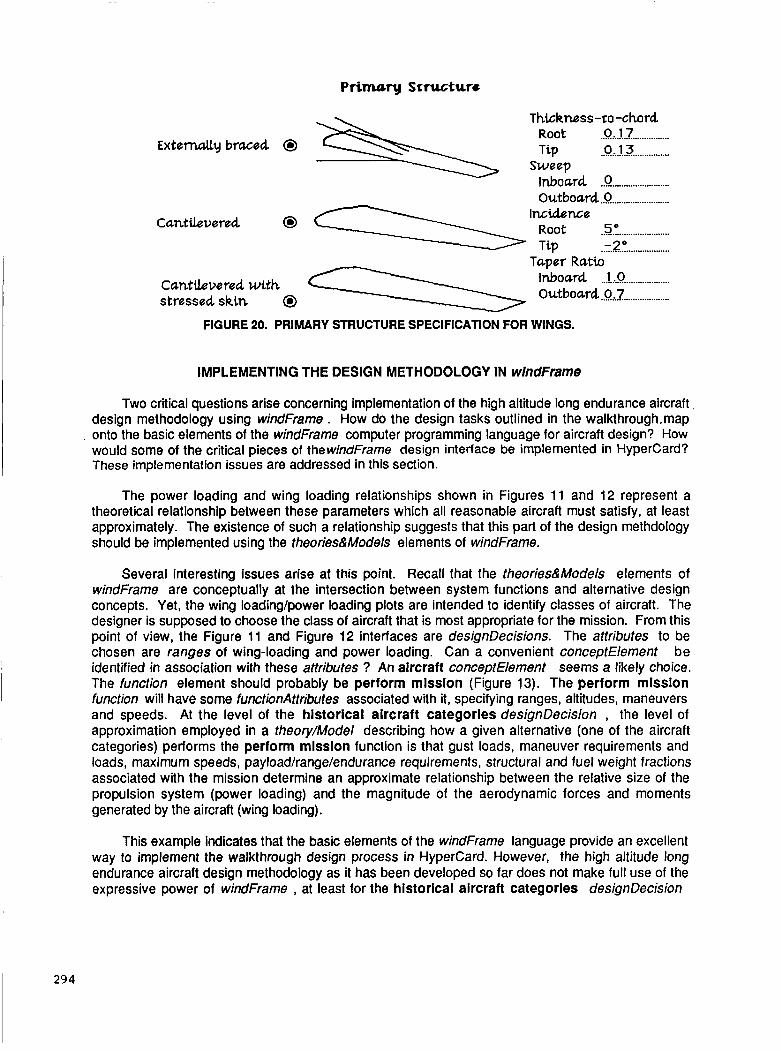
Thickness-ro -chard Root .............................. 0.17
E x t e m d y braced 0 Tip .............................. 0.13 Sweep Inboard ..Q ......................... Outboard .O .........................
.............................. 5" -2"
Cantilevered.
.............................. Taper Ratio
Inboard ..!.:.!? .................... Outboard .0...7 ....................
Cantilevered with stressed skin @
FIGURE 20. PRIMARY STRUCTURE SPECIFICATION FOR WINGS.
IMPLEMENTING THE DESIGN METHODOLOGY IN wlndFrame
Two critical questions arise concerning implementation of the high altitude long endurance aircraft design methodology using windFrame . How do the design tasks outlined in the walkthrough.map
, onto the basic elements of the windFrame computer programming language for aircraft design? How would some of the critical pieces of thewindFrarne design interface be implemented in Hypercard? These implementation issues are addressed in this section.
The power loading and wing loading relationships shown in Figures 11 and 12 represent a theoretical relationship between these parameters which all reasonable aircraft must satisfy, at least approximately. The existence of such a relationship suggests that this part of the design methdology should be implemented using the theories&Mode/s elements of windframe.
Several interesting issues arise at this point. Recall that the theories&Models elements of windframe are conceptually at the intersection between system functions and alternative design concepts. Yet, the wing loading/power loading plots are intended to identify classes of aircraft. The designer is supposed to choose the class of aircraft that is most appropriate for the mission. From this point of view, the Figure 11 and Figure 12 interfaces are designllecisions. The attributes to be chosen are ranges of wing-loading and power loading. Can a convenient conceptElement be identified in association with these attributes ? An aircraft conceptHement seems a likely choice. The function element should probably be perform mlssion (Figure 13). The perform misslon function will have some functionAttributes associated with it, specifying ranges, altitudes, maneuvers and speeds. At the level of the historical aircraft categories designDecision , the level of approximation employed in a theory/Mode/ describing how a given alternative (one of the aircraft categories) performs the perform mission function is that gust loads, maneuver requirements and loads, maximum speeds, payload/range/endurance requirements, structural and fuel weight fractions associated with the mission determine an approximate relationship between the relative size of the propulsion system (power loading) and the magnitude of the aerodynamic forces and moments generated by the aircraft (wing loading).
This example indicates that the basic elements of the windFrame language provide an excellent way to implement the walkthrough design process in Hypercard. However, the high altitude long endurance aircraft design methodology as it has been developed so far does not make full use of the expressive power of windFrame , at least for the historical aircraft categories designDecision
being considered here. The value of this expressive power can be seen if we consider a slightly different use for the same windFrarne language elements. What if the designer wanted to assess the impact of a new structural material or design concept, a new set of design criteria for gust loads, or a different approach to flying a certain mission? The same windFrarne conceptElernents, theories&Mode/s, and designDecisions could be used to determine where the new concept falls on the historical aircraft categories plot. This information could help to assess whether an existing class of aircraft might be able to play a new role, or to identify that a totally new class of aircraft is needed.
RESULTS AND CONCLUSIONS
Significant progress toward the development of windFrarne has been achieved. A carefully thought-out design for the computer programming language has been developed. This design was developed through walkthrough implementations of an existing high altitude long endurance aircraft design methodology. Used with this methodology, windFrarne provides a convenient way to integrate traditional aircraft design practice with systems engineering discipline. windFrame has also been designed to provide support for "metaDesign", a process in which new technologies and evolving requirements are rapidly integrated into design concepts by "designing the design process" concurrently with the design of the aircraft.
Design decision-making is the primary emphasis for the design approach embodied in the windFrarne computer programming language for design. The highly graphics/user interface-oriented programming style supported by Hypercard is a particularly compatible approach. Key elements of the decision support interface have been prototyped in HyperTalk and integrated with designer interface prototypes developed as part of the walkthrough implementation. Together, these Hypercard computer programs provide a prototype of the windFrarne language which can be used for concept demonstration. Interested readers may wish to obtain references 16 through 18. These references are Hypercard stacks containing demonstrations of user interfaces and other aspects of the prototype windFrarne design language. They are available through David Hall Consulting or NASNAmes Research Center Advanced Plans and Programs Office.
REFERENCES
1.
2.
3.
4.
5.
Stinton, Darrol P., The D d a n of the Aer- , Van Nostrand ReinholdCompany, New York, 1983.
Abelson, Harold & Sussman, Gerald & Julie, w u r e a nd lnte rDretat ion of ComDuter p r o a r m , The MIT Press, McGraw-Hill Book Company, Cambridge, Massachusetts, 1985.
Elias, Antonio L., "Knowledge Engineering of the Aircraft Design Process", Chapter 6 in ed Prob lem So Iving, Kowalic, J.S., ed., Prentice-Hall, Englewood Cliffs, New
Jersey, 1985.
Kolb, M.A., "A Flexible Aid for Conceptual Design based on Constraint Propagation and Component-modelling", AIAA-88-4427 ,AIAA/AHS/ASEE Aircraft Design, Systems, and Operations Meeting, Sept. '88
Rosenfeld, L., "Intelligent CAD Systems - CAEDM for the ~ O ' S " , 6th National Conference on University Programs in Computer-Aided Engineering, Design, and Manufacturing, June 1988, Atlanta, Georgia.
295

6.
7.
8.
9.
10.
11.
12.
13.
14.
15.
16.
17.
18.
Bouchard, E.E, "Applications of AI Technology to Aeronautical Systems Design", National Conference on University Programs in Computer-Aided Engineering, Design, and Manufacturing, June 1988, Atlanta, Georgia.
Floyd, Bryan, "Synergistic Information Systems", 6th National Conference on University Programs in Computer-Aided Engineering, Design, and Manufacturing, June 1988, Atlanta, Georgia.
Steinke, G., "Engineering by the Book . . . And On-Line", Mechanical Engineering, November 1985.
Anonymous, Apple M&ntosh HvpeOrd User's Guide ' , Apple Computer, Inc., Cupertino, California, 1987.
Brei, M.L., et al., Arch*- Integration Fkg!Jirements for an ULCF Des ian Fnvironment, IDA Paper P-2063, Institute for Defense Analyses, Alexandria,Virginia, April 1988.
Anonymous, V e e r i n a tdmaguwnt Gu ide, Defense System Management College, Contract MDA 903-82-C-0339, Lockheed Missiles andspace Company, lnc., October 1883.
Anonymous, m e m e Reference Manual , Semantic Microsystems, Inc., Beaverton, Oregon, 1986.
Fleury, C., and Schmit, L.,"Discrete-Continuous Variable Synthesis Using Dual Methods", AlAA Journal, v. 16, no. 12, December 1980.
Bouquet, Donald L., Hall, David W. and McElveen, R. Parker,ll, "Feasibility Study of a Carbon Dioxide Observation Platform System", NASNMArshall Space Flight Center Contractor Report, 1987.
Hall, D.W., Fortenbach, C.D., Dimiceli, E.V. and Parks, R.W., "Feasibility of Solar Powered Aircraft and Associated PowerTrains", NASA/Langley Research Center C ontractor Report 3899, 1982.
Hall: D.W., "A Guided Tour of Our Developing HALE Methodology", Hypercard stack, David Hall Consulting, Sunnyvale, CA, March 1988.
Hall, D.W., "Development of an Integrated Design System for High Altitude Long Endurance Aircraft for Microcomputer Systems", Hypercard stack, David Hall Consulting, Sunnyvale, CA, March 1988.
Hall, D.W. and Rogan, J.E., "Development of an Integrated Design System for High Altitude Long Endurance Aircraft for Microcomputer Systems", Hypercard stack, David Hall Consulting, Sunnyvale, CA, June 1988.
N89- . r 25160
DEMONSTRATION OF DECOMPOSITION AND OPTIMIZATION IN THE DESIGN OF EXPERIMENTAL
SPACE SYSTEMS
Sharon L. Padula NASA Langley Research Center
Hampton, VA
Chris A. Sandridge Virginia Pblytechnic Institute and State University
Blacksburg, VA
Raphael T. Haftka Virginia Polytechnic Institute and State University
Blacksburg, VA
Joanne L. Walsh NASA Langley Research Center
Hampton, VA
29 7

INTRODUCTION
Effcctivc dcsign stratcgics for a class of systcms which may bc tcrmcd Expcrimcntal Spacc Systcms (ESS) arc nwdcd. Thcsc systcms, which includc largc spacc antenna and obscrvatorics, space platforms. carth satcllitcs and dccp space cxplorcrs, have spccial charactcristics which makc them particularly difficult to design. This paper will argue that these same characteristics encourage the use of advanced computer-aidcd optimization and planning tochniqucs.
The broad goal of this research is to devclop optimization stratcgies for thc design of ESS. Thcsc strategies would account for the possibly conflicting requirements of mission lifc, safcty, scicntific payoffs, initial system cost, launch limitations and maintenance costs. The strategies must also preserve the coupling bctween disciplines or between subsystems. For instance, thc strategies must recognize that changes in the structural design influence the selection of materials and the design of the control system. This research is unique because it focuses on optimization of multidisciplinary system design problcms and because it emphasizes automated decomposition of these system design problems.
The specific purpose of the present paper is to describe a computer-aided planning and scheduling technique. This technique provides the designer with a way to map the flow of data between multidisciplinary analyses. The technique is important because it enables the designer to decompose the system design problem into a number of smaller subproblems. The planning and scheduling technique is demonstrated by its application to a specific preliminary design problem.
298
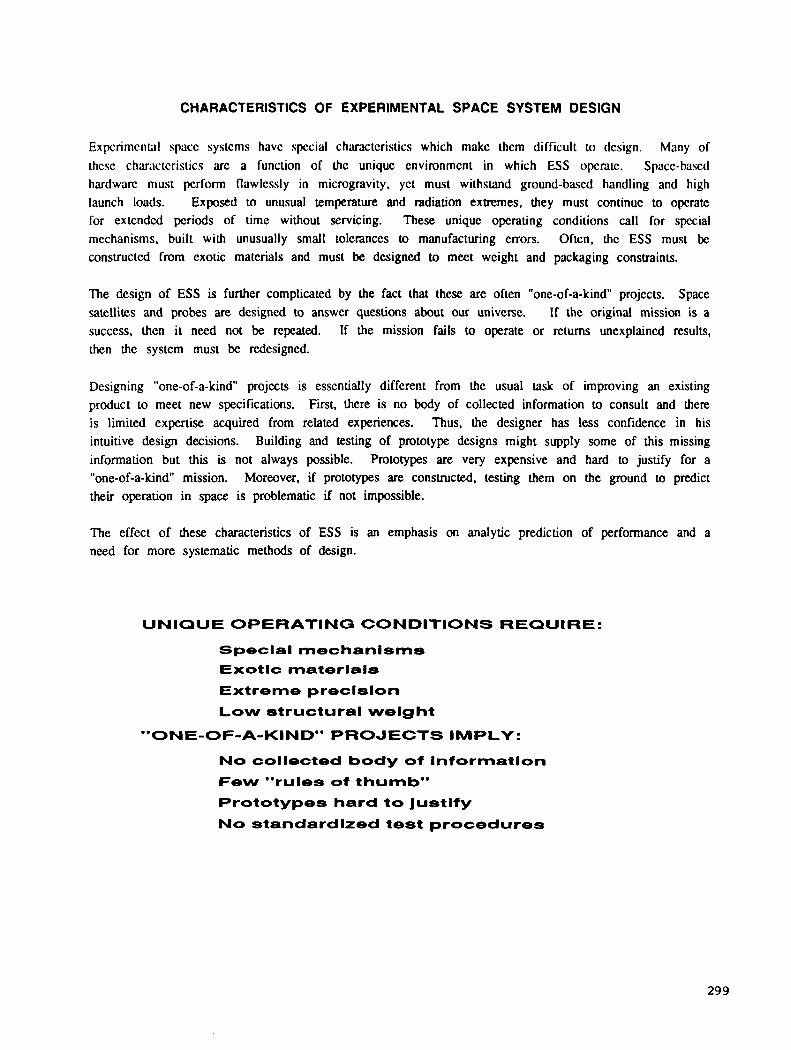
CHARACTERISTICS OF EXPERIMENTAL SPACE SYSTEM DESIGN
Expcrimcntal spacc systcms havc spccial charxtcristics which makc thcm difficult to dcsign. Many of thcsc charxtcristics arc a function of thc unique cnvironmcnt in which ESS opcritc. Spacc-bascd hardwarc must pcrform flawlcssly in microgravity. yct must withstand ground-bawl handling and high launch loads. Exposed to unusual temperature and radiation extremes, they must continue to opcratc for extcndcd pcriods of time without servicing. These unique opcrating conditions call for spccial mcchanisms, built with unusually small tolcrances to manufacturing errors. Often. thc ESS must be constructcd from exotic matcrials and must be designed to meet weight and packaging constraints.
The design of ESS is further complicated by the fact that these are often "one-of-a-kind" projects. Space satellites and probes are designed to answer questions about our universe. If the original mission is a success, then it need not be rcpeated. If the mission fails to operate or rcturns unexplaincd results, then the system must be redesigned.
Designing "one-of-a-kind" projects is essentially different from the usual task of improving an existing product to meet new specifications. First, there is no body of collected information to consult and there is limited expertise acquired from related experiences. Thus, the designer has less confidence in his intuitive design decisions. Building and testing of prototype designs might supply some of this missing information but this is not always possible. Prototypes are very expensive and hard to justify for a "one-of-a-kind" mission. Moreover. if prototypes are constructed, testing them on the ground to predict their operation in space is problematic if not impossible.
The effect of these characteristics of ESS is an emphasis on analytic prediction of performance and a need for more systematic methods of design.
UNIQUE OPERATING CONDITIONS REQUIRE:
Speclal mechanisms Exotlc materlals
Extreme preclsion
Low structural weight
"ONE-OF-A-KIND" PROJECTS IMPLY:
No collected body of Information
Few "rules of thumb"
Prototypes hard to Justify
No standardized test procedures
299
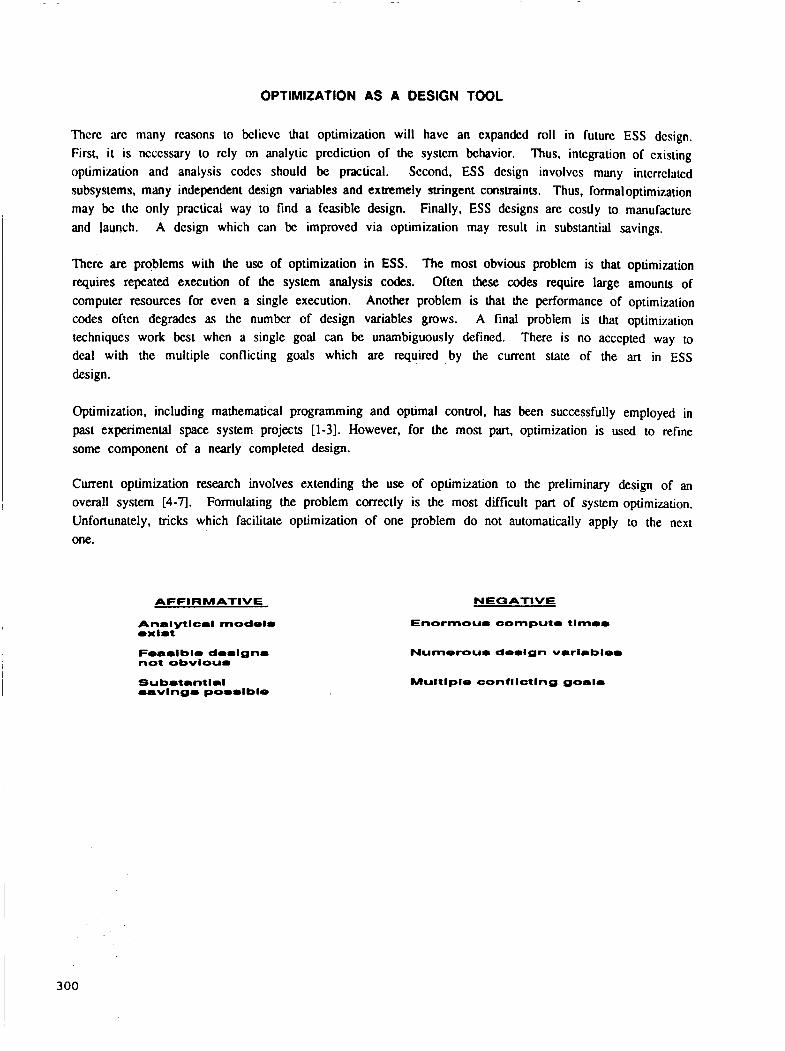
OPTIMIZATION AS A DESIGN TOOL
Thcrc arc many rca.wns to bclicvc that optimization will havc an cxpandcd roll in futurc ESS dcsiyn. First, it is ncccssary to rcly on analytic prediction of the systcm bchavior. Thus, integration of existing optimiration and analysis codcs should be practical. Sccond. ESS dcsign involvcs many intcrrclakd subsystems. many independent design variables and extremely stringent constraints. Thus, formal optimization may bc thc only practical way to find a fcasiblc design. Finally, ESS designs arc costly to manufacture and launch. A design which can bc improved via optimization may result in substantial savings.
There are problems with the use of optimization in ESS. The most obvious problem is that optimization requires repeated execution of the system analysis codes. Often these codes require large amounts of computer resources for even a single execution. Another problem is that the performance of optimization codes oftcn degrades as the number of design variables grows. A final problem is that optimization techniques work bcst when a single goal can be unambiguously defined. Thcrc is no acccptcd way to
deal with the multiple conflicting goals which are requircd by the current state of the art in ESS design.
Optimization, including mathematical programming and optimal control. has been successfully employ& in past experimental space system projects [l-31. However, for the most part, optimization is used to refine some component of a nearly completed design.
Current optimization research involves extending the use of optimization to the preliminary design of an overall system [4-71. Formulating the problem correctly is the most difficult part of system optimization. Unfortunately, tricks which facilitate optimization of one problem do not automatically apply to the next one.
AFFl RM ATlVE
Analytlcrl model- exlrt
Fearlble dorlgnr not obvlour
Subrtantlrl ravlngr porrlble
NEGATIVE
Enormour eompute timer
Numerour derlgn vrrlabler
Multiple oonflletlng goalr
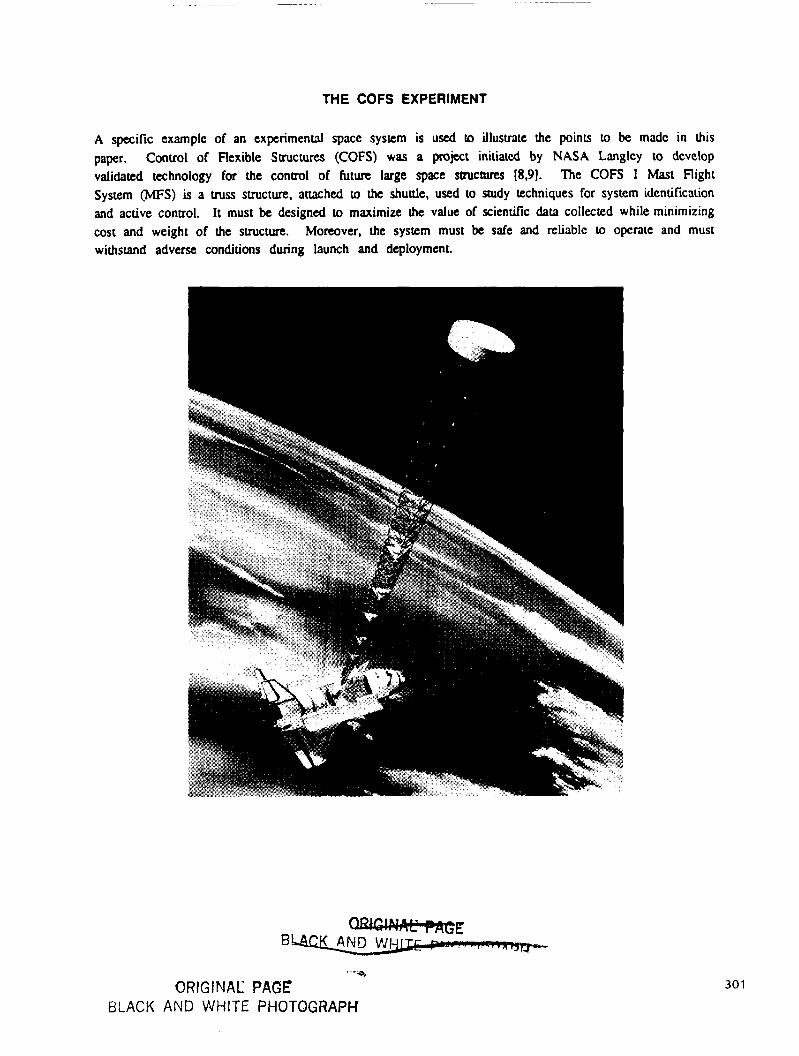
THE COFS EXPERIMENT
A specific example of an expenmend space system is used lo illusvale the points to be madc in this paper. Control of Flexible Structures (COFS) was a project initiatcd by NASA Langlcy to dcvelop validated technology for the control of future large space mctuns [8.9]. The COFS I Mast Flight System (MFS) is a truss structure, attached to the shuttle, used to study lechniques for system identification and active control. It must be designed to maximize the value of scientific data collected while minimizing cost and weight of the suuctun. Moreover, the system must be safe and reliable to operate and must withstand adverse conditions during launch and deployment.
’ “c*
ORIGINAL PAGE BLACK AND WHITE PHOTOGRAPH
301
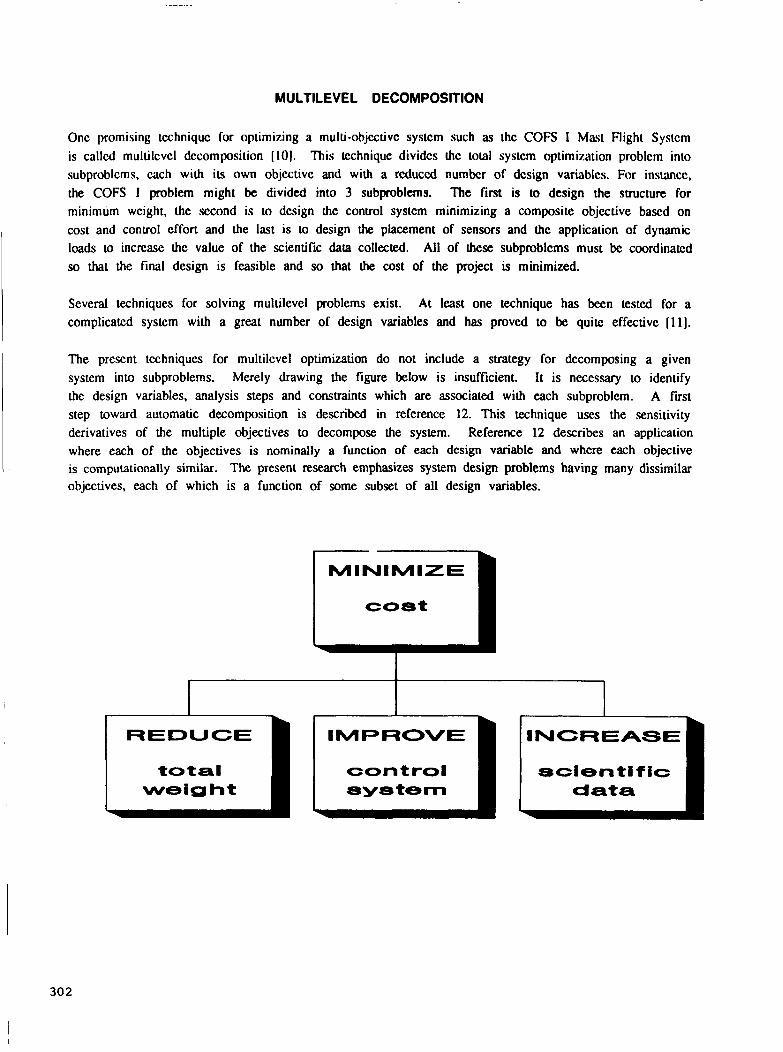
MULTILEVEL DECOMPOSITION
Onc promising tcchniquc for optimizing a multi-objcctivc systcm such a!! thc COFS I Mast Flight Systcm is callcd multilcvcl dccomposition (101. This tcchnique dividcs thc total systcm optimization problcm into subproblems. cach with its own objective and with a rcduccd numbcr of dcsign variablcs. For instance, the COFS I problem might be divided into 3 subproblems. The first is to design the structure for minimum wcight, the second is to dcsign the control system minimizing a composite objective based on cost and control effort and the last is to design h e placement of sensors and the application of dynamic loads to incrcase the value of the scientific data collected. All of these subproblems must be coordinatcd so that the final design is feasible and so that the cost of the project is minimized.
Several techniques for solving multilevel problems exist. At least one technique has been testcd for a complicated system with a great number of design variables and has proved to be quite effective [ll].
The present techniques for multilevel optimization do not include a strategy for decomposing a given system into subproblems. Merely drawing the figure below is insufficient. It is necessary to identify the design variables, analysis steps and constraints which are associated with each subproblem. A fist step toward automatic decomposition is described in reference 12. This technique uses the sensitivity derivatives of the multiple objectives to decompose the system. Reference 12 describes an application where each of the objectives is nominally a function of each design variable and where each objective is computationally similar. The present research emphasizes system design problems having many dissimilar objectives, each of which is a function of some subset of all design variables.
MINIMIZE
REDUCE IMPROVE INCREASE
control scientific weight system
30 2

PLANNING AND SCHEDULING (PbS) TECHNIQUE
This papcr cxplorcs thc usc of automatic planning and scheduling (P&S) tcchniqucs to assist in thc decomposition. Thcsc tcchniqucs wcrc originally dcvclopcd as projcct managcmcnt tools [ 131. Thcy can rcordcr a sct of tasks so that all prcrcquisitcs arc available whcn a givcn hsk is bcgun. Thc input to the P&S computer program is a list of tasks with their prerequisites. The output can be a network graph such as thc onc in thc figure.
In the nctwork graph bclow, notice that task 2 must be complctcd bcforc task 4 can bcgin. This is indicatcd by the circle at the intersection of lines which exit horizontally from the box marked 2 and entcr vertically the box marked 4. Indirectly, task 2 is also a prerequisite to task 5 because task 4 must prcccdc 5 and 2 must precede 4.
A slightly unusual fcaturc of his particular network is the fecdback path from task 7 to task 4. This indicates that tasks 4,5,6 and 7 are heir own prerequisiles. Such a set of tasks is callcd a circuit. Some P&S programs can identify circuits and temporarily replace them with a single task so that thc network graph can be completed. The presence of circuits in a network graph alerts thc project managcr that this set of tasks may have to be repeated several times before the results are satisfactory.
A planning and scheduling computer program which can handle circuits may be a useful decomposition tool. If the tasks in this network are thought of as design variables and constraints then circuits can be interpreted as optimization loops. This idea will be illustrated using the COFS I MFS example.
303

COFS I MINI-EXAMPLE
First. consider a much simplified version of the COFS I experimcnt. Assume that the problem is to design a spncc mss for testing systcm identification techniques. Thc ultimate objective is to reduce the cost of the system. Other objectives are to design a structure that can cany the required loads and which is challcnging to test bascd on its closely spaced vibrational frequencies.
minimize:
SYSTEM COST
sbbject to:
(1) STRUCTURE FEASIBLE
(2) SYSTEM I.D. INTERESTING
LOAD
304
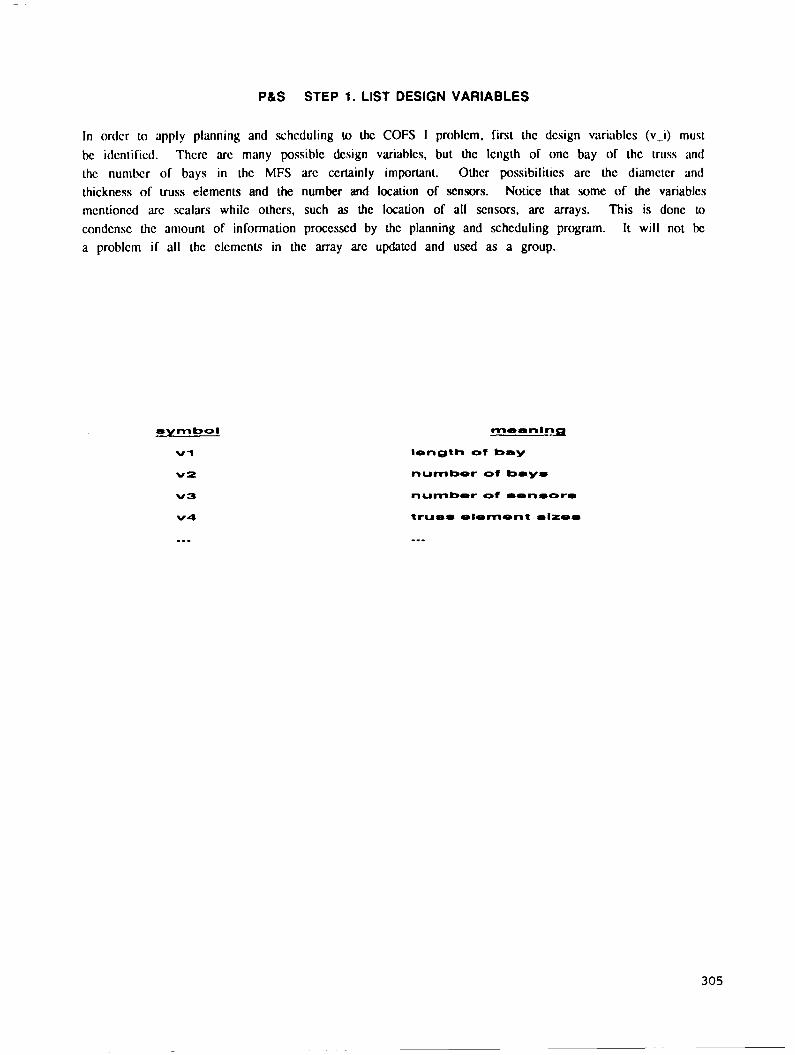
PLS STEP 1. LIST DESIGN VARIABLES
In ordcr to apply planning and schcduling U, thc COFS I problcm. first thc dcsign viiriablcs (v-i) must bc idcntil'icd. Thcrc arc many possiblc dcsign variablcs, but thc lcngth of onc bay of thc truss and thc nunibcr of bays in thc MFS arc ccrlainly important. Othcr possibilitics arc thc diamctcr and thickness of muss elements and the number and location of sensors. Notice that some of the variables mcntioncd arc scalars while olhcrs, such as thc location of all scnsors, arc arrays. This is donc to condcnsc the amount of information proccsscd by the planning and scheduling program. It will not bc a problcm if all thc clcmcnts in the array arc updatcd and used as a group.
symbol
V l
V 2
V 3
v4
meanlna
len,gth of bay
number of bayr
number of m a n r o r m
trusmm eloment m l z o r
305

PLS STEP 2. LIST BEHAVIOR VARIABLES
Thc ncxt stcp is to idcntify important quantitics which arc calculnlcd from known valucs of thc dcsign variablcs. For thc purposc of this papcr, thcsc calculatcd quimtitics will bc tcmcd bchavior variablcs (b-i), Exmplcs arc thc bcnding stiffncss of thc barn and thc cxua wcight associated with thc joints bctween elemcnu. For instance, the symbol b3 is used to represent the results of an eigenvalue analysis routinc. That is, b3 rcprcsents all of the mode shapcs and vibration frcqucncies of thc MFS.
rymbol
b l
b2
b3
meanlna
bendlng rtlffnouu
extra welght of Jolntr
mode rhapeu & frequencler
_ _ _
306
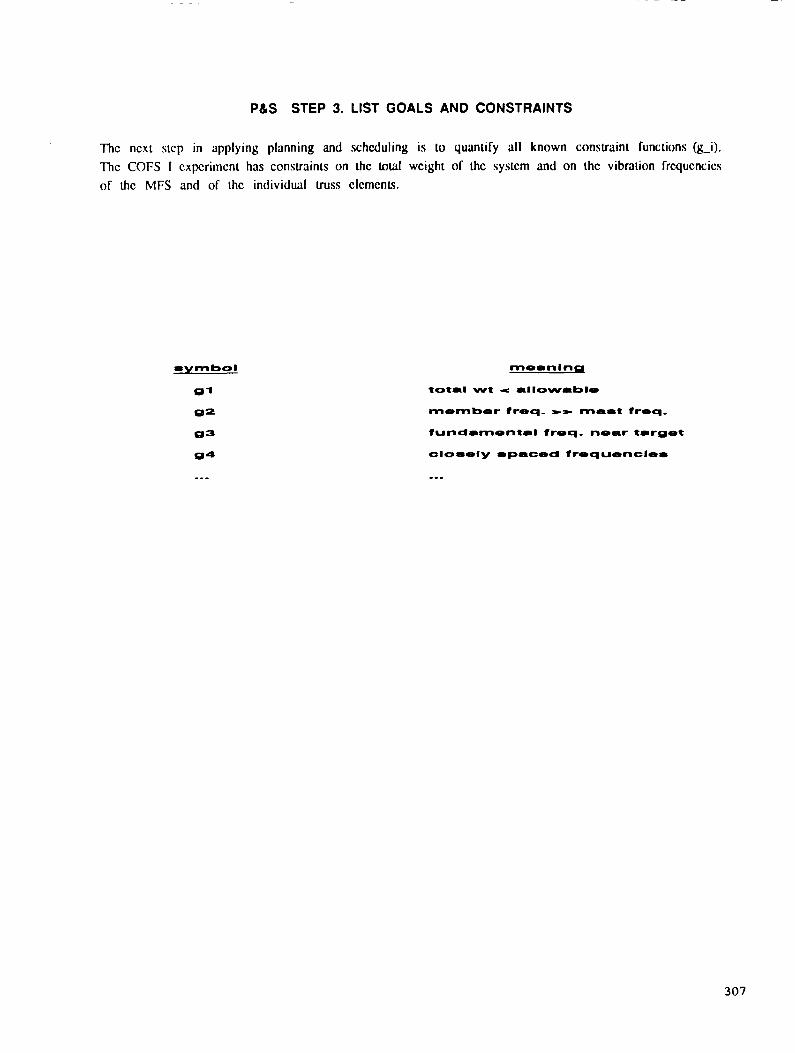
p a s STEP 3. LIST GOALS AND CONSTRAINTS
Thc ncxt strp in applying planning and schcduliny is LO quantify all known consuaint functions (g-i). Thc COFS I cxpcrimcnt has consuaints on thc Lo611 wcight of thc systcm and on thc vibration frcqucncics of Lhc MFS and of thc individual uuss clcmcnls.
rymbol
91
82
a3 a4
mean I nm
total wt e allowable
momber freq- -- mart freq.
fundamental froq- noar target
elo=ely rpaced froquenclem
307
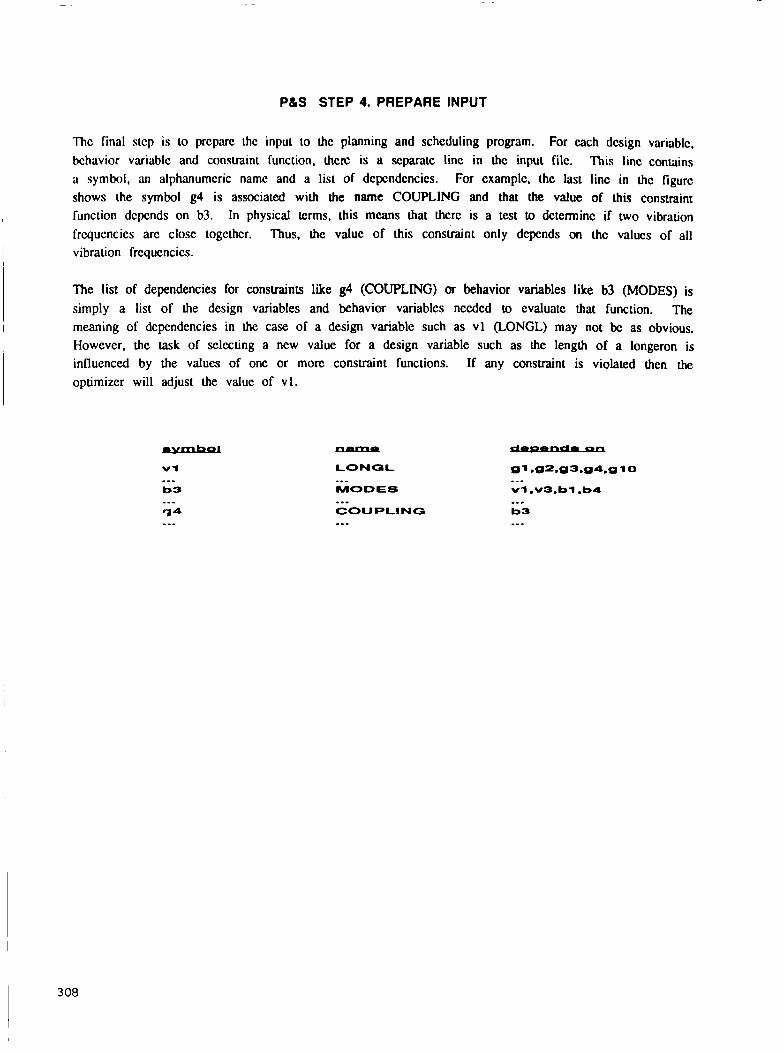
PLS STEP 4. PREPARE INPUT
Thc final stcp is to prcparc thc input to thc planning and schcduling program. For cach dcsign variablc, bchavior variablc and constraint function, thcn: is a scparatc linc in thc input file. This linc conuins a symbol, an alphanumcric name and a list of dcpcndcncics. For cxamplc. thc last line in h c fiyurc shows the symbol g4 is associated with the name COUPLING and that the value of this consmint function dcpcnds on b3. In physical terms, this means that thcrc is a test to dctcrminc if two vibration frcqucncics arc close togcthcr. Thus, the value of this constraint only dcpends on thc valucs of all vibration frcqucncics.
The list of dependencies for constraints like g4 (COUPLING) or behavior variables like b3 (MODES) is simply a list of the design variables and behavior variables necdcd to evaluatc that function. The meaning of dcpendencies in h e case of a design variable such as v l (LONGL) may not bc as obvious. However. the task of selecting a new value for a design variable such as the length of a longeron is influenced by the values of one or more constraint functions. If any constraint is violated then the optimizer will adjust the value of vl.
- LONOL
MODES
COUPLING
...
..- ---
i 3 08
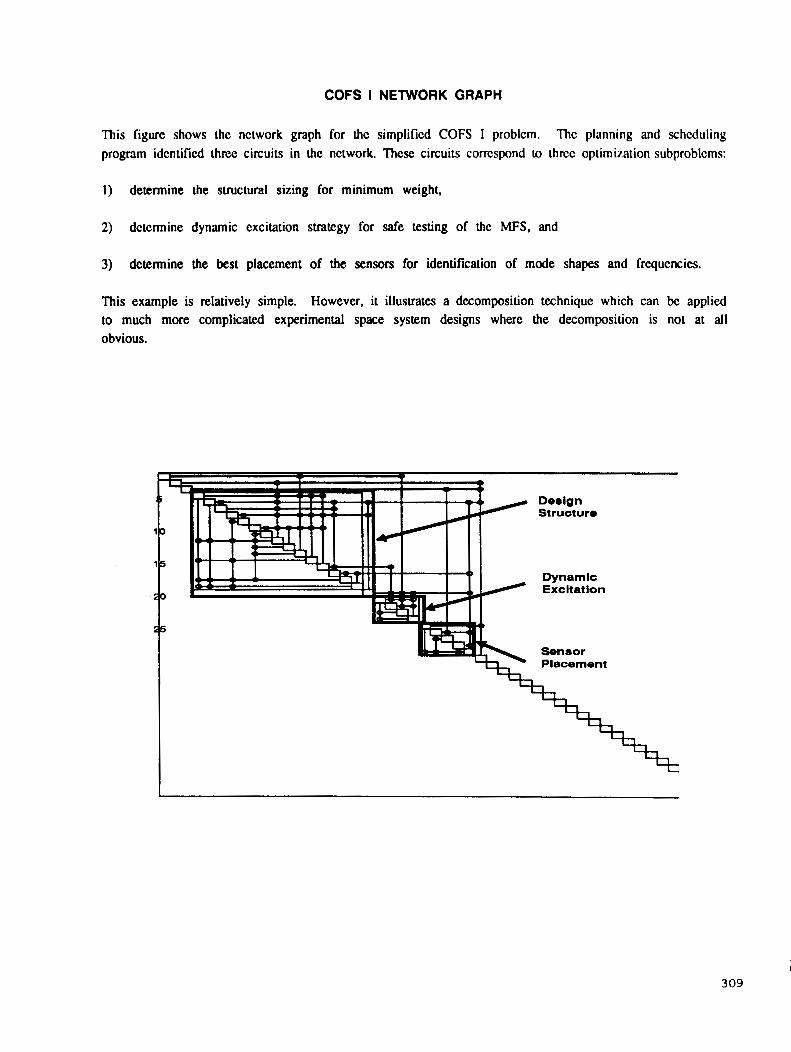
COFS I NETWORK GRAPH
This figure shows thc nctwork graph for thc simplificd COFS 1 problcm. Thc planning and schcduliny program idcntificd three circuits in the nctwork. These circuits cornspond to thrcc optimization subproblcms:
1) determine the structural sizing for minimum weight,
2) dctcrmine dynamic excitation strategy for safe testing of the MFS, and
3) determine the best placement of the sensors for identification of mode shapes and frequcncics.
This example is relatively simple. However, it illustrates a decomposition technique which can be applied to much more complicated experimental space system designs where the decomposition is not at all obvious.
Excitation
Placement
3 09
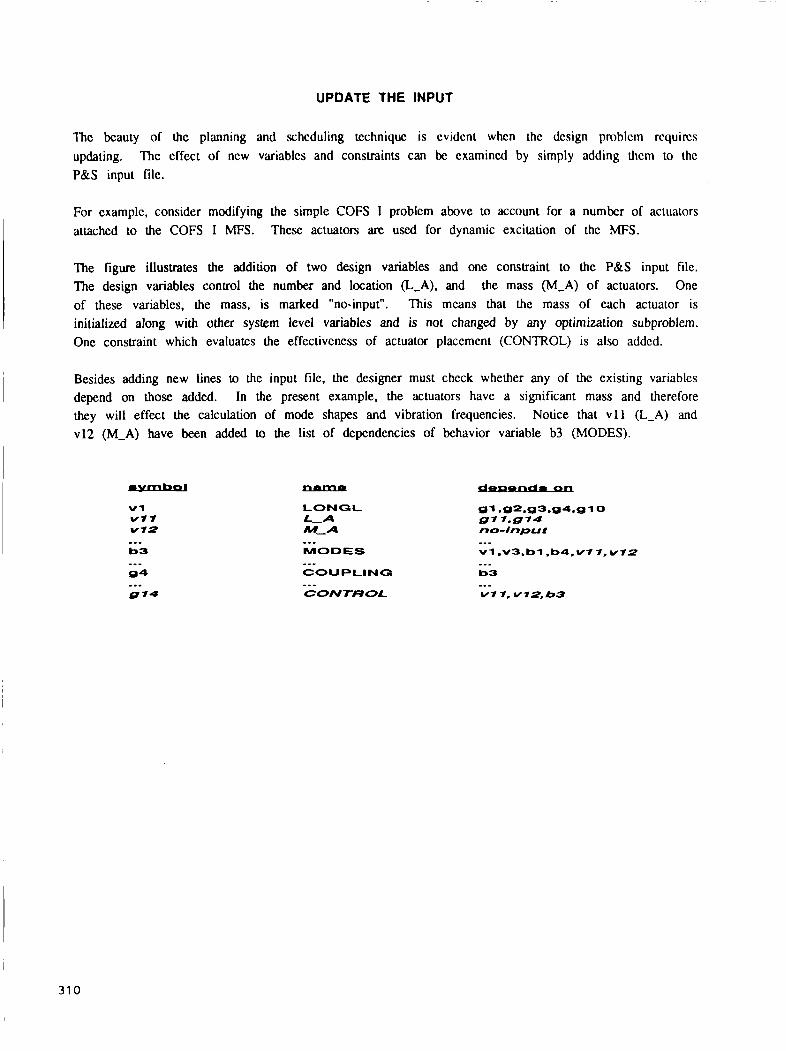
UPDATE THE INPUT
Thc bcauty of thc planning and schcduling tcchniquc is cvidcnt whcn thc dcsign pmblcm rcquircs updating. Thc effect of ncw variables and consmints can bc cxamincd by simply adding thcm to thc P&S input filc.
For example, consider modifying the simple COFS I problcm above to account for a numbcr of actuators attached to the COFS I MFS.
The figure illustrates the addition of two design variables and one constraint to the P&S input file. The design variables control the number and location &-A). and One of these variables, the mass, is marked "no-input". This means that the mass of each actuator is initialized along with other system level variables and is not changed by any optimization subproblem. Onc constraint which evaluates the effectiveness of actuator placement (CONTROL) is also addcd.
These actuators are used for dynamic excitation of the MFS.
the mass (M-A) of actuators.
Besides adding new lines to the input file, the designer must check whether any of the existing variables depend on those added. In the present example, the actuators have a significant mass and therefore they will effect the calculation of mode shapes and vibration frequencies. Notice that v l l &-A) and v12 (M-A) have been added to the list of dependencies of behavior variable b3 (MODES).
_..
CONTROL
31 0
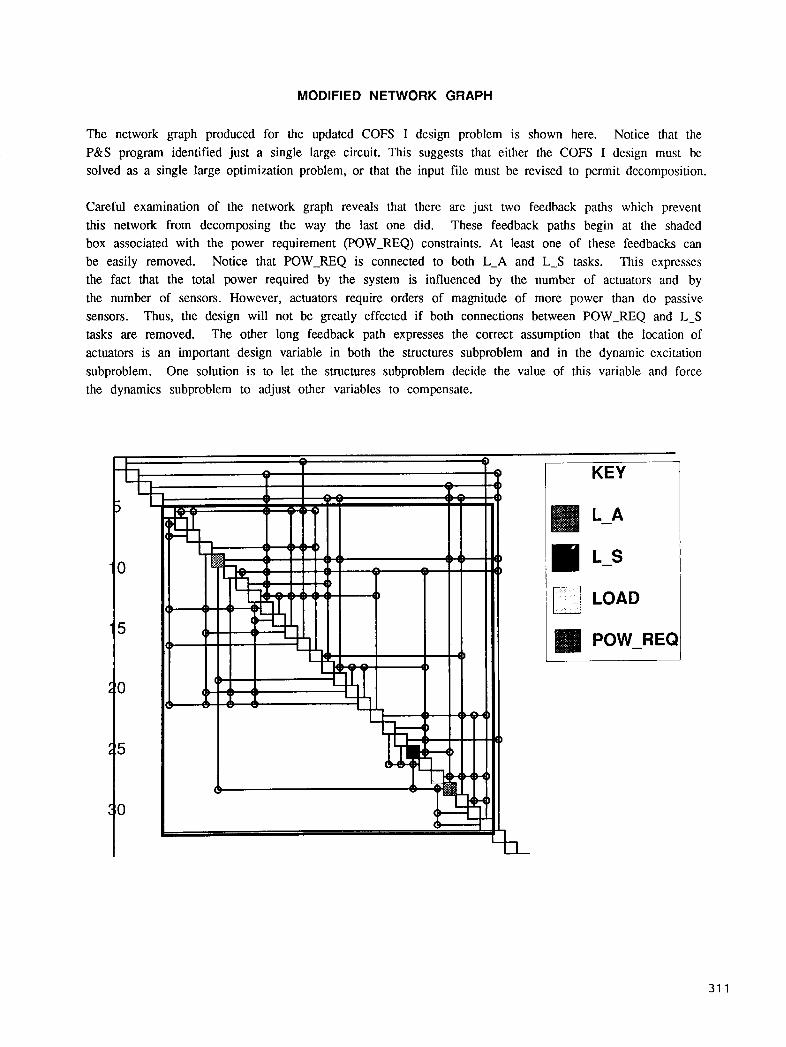
MODIFIED NETWORK GRAPH
The network graph produced for the updated COFS I design problem is shown here. Notice that the P&S program identified just a single large circuit. This suggests that either the COFS I design must be solved as a single large optimization problem, or that the input file must be revised to permit decomposition.
Careful examination of the network graph reveals that there are just two feedback paths which prevent this network from decomposing the way the last one did. These feedback paths begin at the shaded box associated with the power requirement (POW-REQ) constraints. At least one of these feedbacks can be easily removed. This expresses the fact that the total power required by the system is influenced by the number of actuators and by the number of sensors. However, actuators require orders of magnitude of more power than do passive sensors. Thus, the design will not be greatly effected if both connections between POW-REQ and L-S tasks are removed. The other long feedback path expresses the correct assumption that the location of actuators is an important design variable in both the structures subproblem and in the dynamic excitation subproblem. One solution is to let the structures subproblem decide the value of this variable and force the dynamics subproblem to adjust other variables to compensate.
Notice that POW-REQ is connected to both L-A and L S tasks.
- 3
- 0
‘ 5
20
25
20
L
8 KEY
POW-REQ
31 1

FINAL COFS I NETWORK
By gradually refining the P&S input and by adding design variables and constraints to represent the design of a control system, a final network chart was produced. This network has 6 major circuits: actuator placement, sensor placement, structures and materials design, dynamic excitation specification and a two step controls design. These are identified on the figure.
Acttin
s t r11c t 11 res
L I,)llfl'Ut =
L
T
c I
31 2
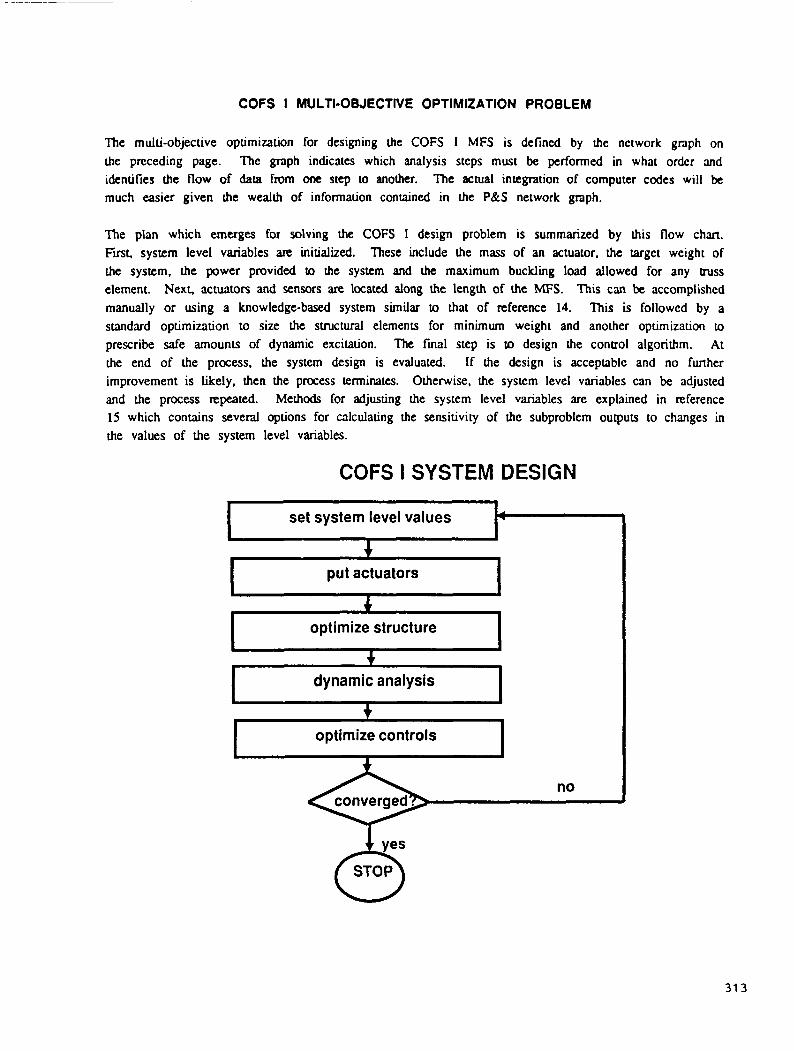
COFS I MULTI-OBJECTIVE OPTIMIZATION PROBLEM
The multi-objective optimization for designing the COFS I MFS is defined by the network gmph on the preceding page. The graph indicates which analysis steps must be performed in what order and identifies the flow of data from one step to another. The actual integration of computer codes will be much easier given the wealth of information contained in the P&S network graph.
The plan which emerges for solving the COFS I design problem is summarized by this flow chan. First. system level variables are initialized. These include the mass of an actuator, the target weight of the system, the power provided to the system and the maximum buckling load allowed for any truss element. Next, actuators and sensors are located along the length of the MFS. This can be accomplished manually or using a knowledge-based system similar to that of reference 14. This is followed by a standard optimization to size the structural elements for minimum weight and another optimization to prescribe safe amountS of dynamic excitation. At the end of the process, the system design is evaluated. If the design is acceptable and no further improvement is likely, then the process terminates. Othenvise, the system level variables can be adjusted and the process repeated. Methods for adjusting the system level variables are explained in reference 15 which contains several options for calculating the sensitivity of the subproblem outputs to changes in the values of the system level variables.
The final step is to design the control algorithm.
COFS I SYSTEM DESIGN
I put actuators I I
--
optimize structure
I--- ~ dynamic a n a l y s i s 1
I optimize controls I no I
31 3
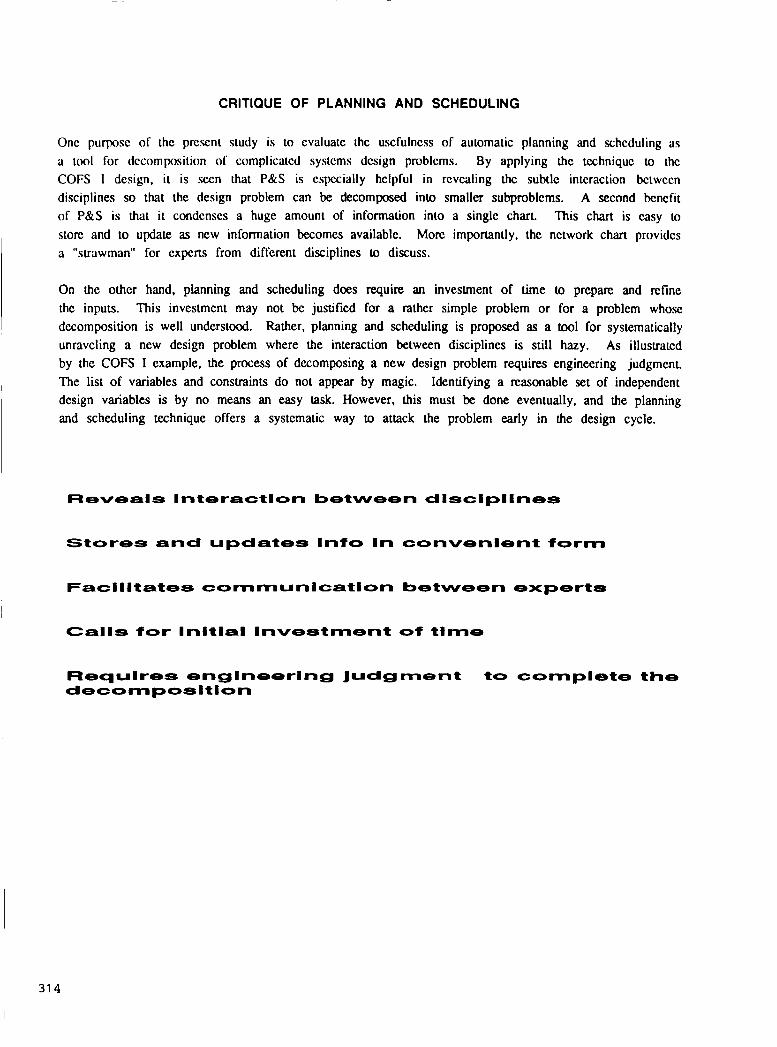
CRITIQUE OF PLANNING AND SCHEDULING
Onc purposc of thc prcscnt study is to cvaluatc thc uscfulncss of automatic planning and schcduling as a tool for dccomposition of complicatcd systcms dcsign problcms. By applying the techniquc to thc COFS 1 design, it is .mn that P&S is cspccially hclpful in rcvealing thc subtle intcraction bctwccn disciplines so that the design problem can be decomposed into smaller subproblems. A second bcncfit of P&S is that it condcnses a huge amount of information into a single chart. This chart is casy u, storc and to update as ncw information becomes available. Morc importantly. the network chart providcs a "swawman" for expert.. from different disciplines to discuss.
On the other hand, planning and scheduling does require an investment of time to prepare and refine thc inputs. This investment may not be justified for a rather simple problem or for a problem whose decomposition is well understood. Rather, planning and scheduling is proposed as a tool for systematically unraveling a new design problem where the interaction between disciplines is still hazy. As illustralcd by the COFS I example, the process of decomposing a new design problem requires engineering judgmcnt. The list of variables and constraints do not appear by magic. Identifying a reasonable set of independent design variables is by no means an easy task. However, this must be done eventually, and the planning and scheduling technique offers a systematic way to attack the problem early in the design cycle.
Reveals Interactlon between dlsclpllnes
Stores and updates Info In convenient form
Facl lltates cornrnu nlcatlon between experts
Calls for Initial Investment of time
Requlres englneerlng Judgment to complete the decornposltlon
31 4

REFERENCES
1. Sobieski. J. (compiler): Recent Experiences in Multidisciplinary Analysis and Optimization. NASA CR-2327, September 1984.
2. Grandhi, R. V. and Venkayya, V. B.: Suuctural Optimization with Frequency Constraints. AIAA Paper No. 87-0787, AIAA/ASME/ASCE/AHS 28th Structures, Structural Dynamics and Materials Conference, Monterey,CA, April 1987.
3. Walsh. J. L.: Structures. Materials Conference, Monterey,CA, April 1987.
Optimization Procedure to Control the Coupling of Vibration Modes in Flexible Space AIAA Paper No. 87-0826, AIAA/ASME/ASCE/AHS 28th Structures, Structural Dynamics and
4. Barthelemy, J.-F. M.: Engineering Systems.
Development of a Multilevel Optimization Approach to the Design of Modem NASA CR-17218, August 1983.
5. Padula, S. L. and Sobieszczanski-Sobieski, J.: A Computer Simulator for Development of Engineering System Design Methodologies. NASA TM-89109, February 1987.
6. Vanderplaats, G. N., Yang, Y. J. and Kim, D. S.: An Efficient Multilevel Optimization Method for Engineering Design. AIAA Paper NO. 88-2226, AIAA/ASME/ASCE/AHS 29th Structures, Structural Dynamics and Materials Conference, Williamsburg, VA, April 1988.
7. Mistree, F., Marinopolous. S., Jackson, D. and Shupe, J.: The Design of Aircraft using the Decision Support Problem Technique. NASA CR-4134, April 1988.
8. Wright, R. L. (compiler): NASA/DOD Control/Structures Interaction Technology 1986. NASA CR-2447, November 1986.
9. Ryan, Roben S., and Scofield, Harold N. (editors): Flexible Structures. NASA CP-2467, April 1987.
Structural Dynamics and Control Interaction of
10. Sobieszczanski-Sobieski, J.: A Linear Decomposition Method for Large Optimization Problems - A Blueprint for Development, NASA TM-83248, Feb. 1982.
11. Wrenn. G.A., and Dovi, A. R.: Multilevel/ Multidisciplinary Optimization Scheme for Sizing a Transport Aircraft Wing, AIAA Paper No. 87- 0714-CP, AIAA/ASME/ASCE/AHS 28th Structures, Structural Dynamics and Materials Conference, Monterey, CA, April 1987.
12. Bandler, John W. and Zhang, Qi-Jun: An Automatic Decomposition Approach to Optimization of Large Microwave Systems. IEEE Transactions on Microwave Theory and Techniques, Vol. Ml'T-35, December 1987, pp. 1231-1239.
13. Steward, D. V.: Systems Analysis and Management: Structure, Strategy and Design. PeuocelliBooks, Inc., New Yo&, NY, 1981.
315

14. Rogers, J . L., Fcyock, S., and Sobicszcclanski-Sobieski, I.: Sysicm for Initially Configuring a Structurc to Support Point Loads in Two Dimensions. NASA TM-100613, April 1988.
STRUTEX - A P~)totypc Know Icdgc-Bawd
15. Sobicszczanski-Sobicski, J . : AIAA Papcr No. 88-2226. AIAA/ASME/ASCE/AHS 29th SMucturcs, Suuctural Dynamics and Matcrials Conference, Williamsburg. VA. April 1988. (also available as NASA TM-100537)
On the Scnsidvity of Complex, Internally Coupled Syslcms.
31 6

N89- 25161
STRUTEX
STRUCTURE TO SUPPORT POINT LOADS IN TWO DIMENSIONS A PROTOTYPE KNOWLEDGE-BASED SYSTEM FOR INITIALLY CONFIGURING A
James L. Rogers NASA Langley Research Cen te r
Hampton, V i r g i n i a
Jaroslaw Sobieszczanski-Sobieski NASA Langley Research C e n t e r -
Hampton, V i r g i n i a
31 7

INTRODUCTION
Initial Member configuration sizing .
Engineers and managers are always concerned about reducing the costs and time involved in completing a design project. Therefore, many hours of research have been devoted to speed and sensitivity improvements in the area of structural analysis. Additional research effort has been applied to the improvement of optimization algorithms. From a numerical standpoint, these areas are nearing a point of diminishing retur'ns when using conventional computer hardware. However, one area which shows a potential for reducing design cost and time, but has had little research, is the determining and refining of an initial configuration before beginning the analysis and optimization process (figure 1). One reason is because this is a problem that is not easily solved numerically, but one that seems to require using heuristics from experienced designers.
Only recently have engineers begun making use of Artificial Intelligence (AI) tools in the area of conceptual design (refs. 1,2). To continue filling this void in the design process, a prototype knowledge-based system, called STRUTEX (ref. 3 ) , has been developed to initially configure a structure to support point loads in two dimensions. This prototype was developed for testing the application of AI tools to conceptual design as opposed to being a testbed for new methods for improving structural analysis and optimization. This system combines numerical and symbolic processing by the computer with interactive problem solving aided by the vision of the user.
This paper describes how the system is constructed to interact with the user. Of special interest is the information flow between the knowledge base and the data base under control of the algorithmic main program. Examples of computed and refined structures are presented during the explanation of the system.
- Redesign
0 Void 0 Speed 0 Optimization
0 Sensitivity Algorithms Figure 1
318

COMPONENTS OB' THE SYSTEM
5 3 - D data base
The main driver program for STRUTEX is written entirely in FORTRAN. Other components were added by linking existing software - DI-3000 (ref. 4 ) for the graphics, RIM (Relational Information Management, ref. 5) for the relational data base management, and CLIPS (C Language Production System, ref. 6) for the inference engine - to the main driver program. The data €or RIM and the knowledge base (rules) for CLIPS are maintained in different files separated from STRUTEX. EAL (Engineering Analysis Language, ref. 7) for the structural analysis, and CONMIN (Constraint Minimization, ref. 8) for the optimization are coupled in PROSSS (Programming System for Structural Synthesis, ref. 9) to perform the analysis and optimization (figure 2 ) .
Dialog Graphics
I STRUTEX I
t Ana'ysis input t-
CLIPS knowledge
I EAL I A CONMIN I analysis I - 1 optimizer
No
PROSSS
Figure 2
319
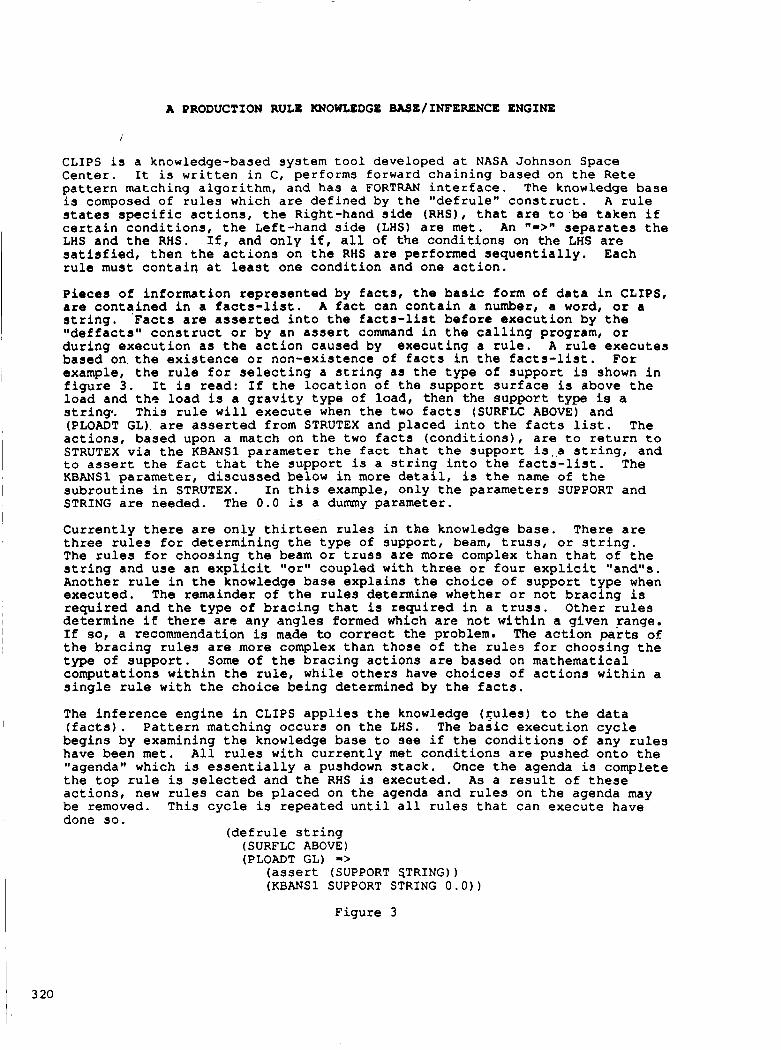
A PRODUCTION RULE KNOWLEDGE BAsE/INFERENCE ENGINE
4
C L I P S i s a knowledge-based system t o o l developed a t NASA Johnson Space C e n t e r . I t i s w r i t t e n i n C, performs forward c h a i n i n g based on t h e R e t e p a t t e r n matching a l g o r i t h m , and has a FORTRAN i n t e r f a c e . The knowledge base is composed of r u l e s w h i c h are d e f i n e d by t h e " d e f r u l e " c o n s t r u c t . A r u l e s ta tes s p e c i f i c a c t i o n s , t h e Right-hand side ( R H S ) , t h a t are t o , b e t a k e n i f c e r t a i n c o n d i t i o n s , t h e Left-hand side (LHS) a re m e t . An 11=>11 s e p a r a t e s t h e LHS and t h e RHS. I f , and o n l y if, a l l of t h e c o n d i t i o n s on t h e LHS are s a t i s f i e d , t h e n t h e a c t i o n s on t h e RHS a r e performed s e q u e n t i a l l y . Each r u l e must c o n t a i q a t l eas t one c o n d i t i o n and one a c t i o n .
Pieces of i n f o r m a t i o n r e p r e s e n t e d by f a c t s , t h e basic form of data i n CLIPS, a r e c o n t a i n e d i n a f a c t s - l i s t . A f a c t can c o n t a i n a number, a word, o r a s t r ing . F a c t s a r e asserted i n t o t h e f a c t s - l i s t b e f o r e e x e c u t i o n by t h e l 'deffacts" c o n s t r u c t o r by an a s s e r t command i n t h e c a l l i n g program, or d u r i n g e x e c u t i o n a s t h e a c t i o n caused by e x e c u t i n g a r u l e . A r u l e e x e c u t e s based on t h e e x i s t e n c e o r non-ex i s t ence of f a c t s i n t h e f a c t s - l i s t . Fo r example, t h e r u l e f o r s e l e c t i n g a s t r i n g a s t h e t y p e of s u p p o r t i s shown i n f i g u r e 3. I t i s read: I f t h e l o c a t i o n of t h e s u p p o r t s u r f a c e i s above t h e l o a d and t h e l o a d is a g r a v i t y t y p e of l o a d , t hen t h e s u p p o r t t ype is a s t r i n q . T h i s r u l e w i l l e x e c u t e when t h e two f a c t s (SURFLC ABOVE) and (PLOADT GL) are asserted from STRUTEX and p l a c e d i n t o t h e f a c t s l i s t . The a c t i o n s , based upon a match on t h e two f a c t s ( c o n d i t i o n s ) , are t o r e t u r n t o STRUTEX v i a t h e KBANSl parameter t h e f a c t t h a t t h e s u p p o r t i s . ,a s t r i n g , and t o assert t h e fac t t h a t t h e s u p p o r t i s a s t r i n g i n t o t h e f a c t s - l i s t . The KBANSl parameter, d i s c u s s e d below i n more de t a i l , is t h e name of t h e s u b r o u t i n e i n STRUTEX. I n t h i s example, o n l y t h e parameters SUPPORT and STRING are needed. T h e 0 . 0 is a dummy pa rame te r .
C u r r e n t l y there a re o n l y t h i r t e e n r u l e s i n t h e knowledge base. There a re three r u l e s f o r d e t e r m i n i n g t h e t y p e of suppor t , beam, t r u s s , o r s t r i n g . The r u l e s f o r choos ing t h e beam o r t r u s s are more complex t h a n t h a t of t h e s t r i n g a n d u s e a n e x p l i c i t l lorl l coup led wi th t h r e e o r f o u r e x p l i c i t "andlls. Another r u l e i n t h e knowledge base e x p l a i n s t h e c h o i c e of s u p p o r t t y p e when e x e c u t e d . The remainder of t h e r u l e s de t e rmine whether o r n o t b r a c i n g i s r e q u i r e d and t h e t y p e o f b r a c i n g t h a t i s r e q u i r e d i n a t r u s s . O t h e r r u l e s d e t e r m i n e i f t h e r e are any a n g l e s formed which are not w i t h i n a g iven r ange . I f so, a recommendation is made to correct the problem. The a c t i o n parts of t h e b r a c i n g r u l e s a r e more complex t h a n t h o s e of t h e r u l e s f o r choos ing t h e type of s u p p o r t . Some of t h e b r a c i n g a c t i o n s are based on ma themat i ca l computa t ions w i t h i n t h e r u l e , wh i l e o t h e r s have c h o i c e s of a c t i o n s w i t h i n a s i n g l e r u l e w i t h t h e c h o i c e b e i n g determined by t h e f ac t s .
The i n f e r e n c e e n g i n e i n CLIPS applies t h e knowledge ( r u l e s ) t o t h e data ( f a c t s ) . P a t t e r n matching o c c u r s on t h e LHS. b e g i n s by examining t h e knowledge b a s e t o see i f t h e c o n d i t i o n s of any r u l e s have been m e t . A l l r u l e s w i t h c u r r e n t l y m e t c o n d i t i o n s a re pushed o n t o t h e "agenda" which is e s s e n t i a l l y a pushdown s tack . Once t h e agenda i s complete t h e t o p r u l e is selected and t h e RHS is execu ted . A s a r e s u l t o f these a c t i o n s , new r u l e s can be p l a c e d on t h e agenda and r u l e s on t h e agenda may be removed. T h i s c y c l e is r e p e a t e d u n t i l a l l r u l e s t h a t can e x e c u t e have done so.
The basic e x e c u t i o n c y c l e
( d e f r u l e s t r i n g (SURFLC ABOVE) (PLOADT GL) =>
(assert (SUPPORT STRING) ) (KBANS1 SUPPORT STRING 0 . 0 ) )
F i g u r e 3
3 20 I .
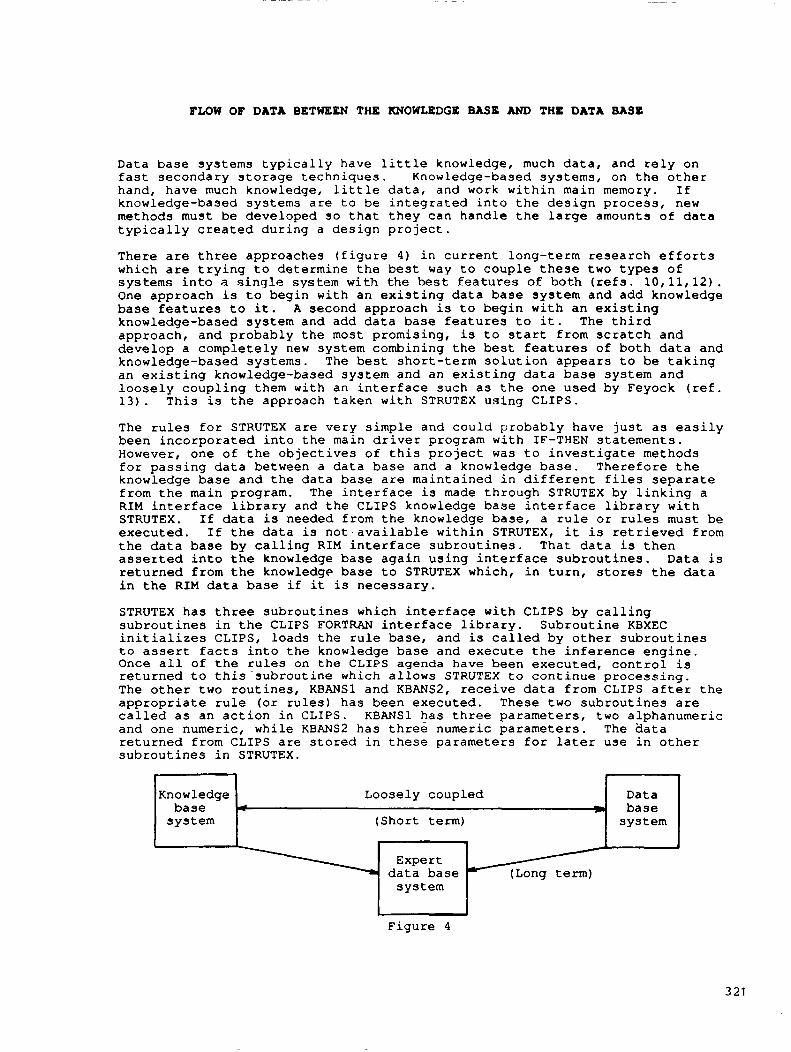
FLOW OF DATA BETWEEN THE KNOWLEDGE BASE AND THE DATA BASE
r
Knowledge Loosely coupled Data base T base
system (Short term) system
.
321
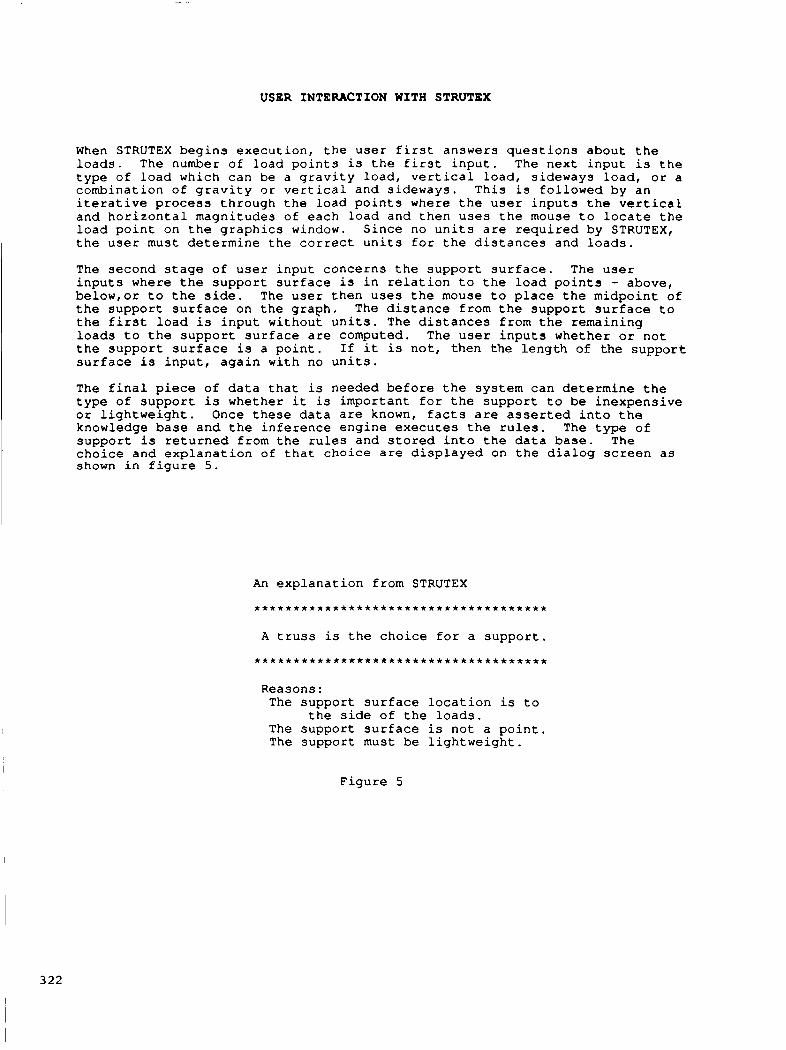
USER INTERACTION WITH STRUTEX
When STRUTEX b e g i n s e x e c u t i o n , t h e u s e r f i r s t answers q u e s t i o n s about t h e l o a d s . The number of l o a d p o i n t s i s t h e f i r s t i n p u t . T h e n e x t i n p u t i s t h e t y p e of l o a d w h i c h can be a g r a v i t y l o a d , v e r t i c a l l o a d , sideways l o a d , or a combinat ion of g r a v i t y o r v e r t i c a l and s ideways. T h i s i s fo l lowed by an i t e r a t i v e p r o c e s s th rough t h e l o a d p o i n t s where t h e u s e r i n p u t s t h e v e r t i c a l and h o r i z o n t a l magni tudes of each l o a d and t h e n u s e s t h e mouse t o l o c a t e t h e l o a d p o i n t on t h e g r a p h i c s window. S i n c e no u n i t s a r e required by STRUTEX, t h e user m u s t d e t e r m i n e t h e c o r r e c t u n i t s for t h e d i s t a n c e s and l o a d s .
The second stage of u s e r i n p u t conce rns t h e s u p p o r t s u r f a c e . The u s e r i n p u t s where t h e s u p p o r t s u r f a c e i s i n r e l a t i o n t o t h e l o a d p o i n t s - above, below,or t o t h e side. The u s e r t h e n u s e s t h e mouse t o p l a c e t h e midpo in t of t h e s u p p o r t s u r f a c e on t h e g r a p h , The d i s t a n c e from t h e s u p p o r t s u r f a c e t o t h e f i r s t l o a d is i n p u t w i thou t u n i t s . The d i s t a n c e s from t h e r ema in ing l o a d s t o t h e s u p p o r t s u r f a c e a r e computed. The u s e r i n p u t s whether or n o t t h e s u p p o r t s u r f a c e i s a p o i n t . If it is n o t , t hen t h e l e n g t h of t h e s u p p o r t s u r f a c e i s i n p u t , a g a i n w i t h no u n i t s .
The f i n a l piece o f d a t a t h a t i s needed b e f o r e t h e sys t em can d e t e r m i n e t h e t y p e of s u p p o r t is whether it i s impor t an t f o r t h e s u p p o r t t o be i n e x p e n s i v e or l i g h t w e i g h t . Once these d a t a a r e known, f ac t s are asserted i n t o t h e knowledge b a s e and t h e i n f e r e n c e e n g i n e e x e c u t e s t h e r u l e s . The t y p e of s u p p o r t is r e t u r n e d from t h e r u l e s and s t o r e d i n t o t h e d a t a base. The c h o i c e and e x p l a n a t i o n of that choice are d i s p l a y e d on t h e d i a l o g s c r e e n a s shown i n f i g u r e 5 .
An e x p l a n a t i o n from STRUTEX
. . . . . . . . . . . . . . . . . . . . . . . . . . . . . . . . . . . . .
A t r u s s is t h e c h o i c e for a s u p p o r t .
. . . . . . . . . . . . . . . . . . . . . . . . . . . . . . . . . . . . .
Reasons: The s u p p o r t s u r f a c e l o c a t i o n i s t o
t h e side of t h e l o a d s . The s u p p o r t s u r f a c e is n o t a p o i n t . The suppor t must be l i g h t w e i g h t .
F i g u r e 5
322
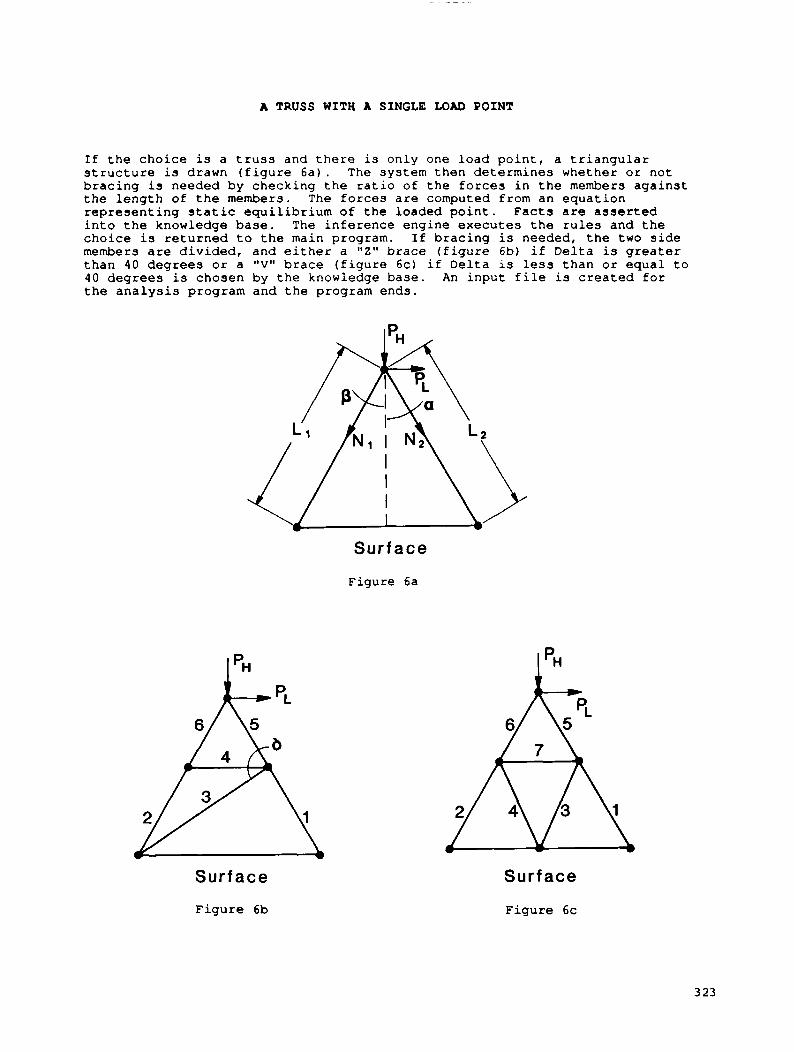
A TRUSS WITH A SINGLE LOAD POINT
I f t h e c h o i c e is a t r u s s and t h e r e is o n l y one l o a d p o i n t , a t r i a n g u l a r s t r u c t u r e i s drawn ( f i g u r e 6 a ) . The s y s t e m t h e n d e t e r m i n e s whe the r o r n o t b r a c i n g i s n e e d e d b y c h e c k i n g t h e r a t i o o f t h e f o r c e s i n t h e members a g a i n s t t h e l e n g t h o f t h e members. The f o r c e s a r e computed f rom a n e q u a t i o n r e p r e s e n t i n g s t a t i c e q u i l i b r i u m o f t h e l o a d e d p o i n t . F a c t s a r e a s s e r t e d i n t o t h e knowledge base. The i n f e r e n c e e n g i n e e x e c u t e s t h e r u l e s a n d t h e c h o i c e i s r e t u r n e d t o t h e main program. I f b r a c i n g is needed , t h e two side members are divided, a n d e i t h e r a "2" b r a c e ( f i g u r e 6b) i f D e l t a i s g r e a t e r t h a n 4 0 degrees or a "V" b r a c e ( f i g u r e 6c) i f D e l t a i s less t h a n or e q u a l t o 40 degrees i s c h o s e n b y t h e knowledge b a s e . An i n p u t f i l e i s c r e a t e d f o r t h e a n a l y s i s p rogram a n d t h e program e n d s .
Surface
F i g u r e 6a
Surface
F i g u r e 6 b
Surface
F i g u r e 6c
3 23

A TRUSS WITH MULTIPLE LOAD POINTS
If the choice is a truss and there is more than one load point, then the user must build the truss guided by recommendations from the system. user begins with the load points and the support surface. is made to first connect all the load points forming triangles whenever possible, but not connect the load points to the support surface. are added by placing the mouse on the end points. completed, there is a second recommendation for the user to connect the load points to the support surface without having a new member intersect an existing member. (The reason for using two recommendations to build the truss is discussed below.) Figure 7 displays the structure at this point in the design.
The A recommendation
Members Once this has been
5
-a
Surface Figure 7
, 3 24
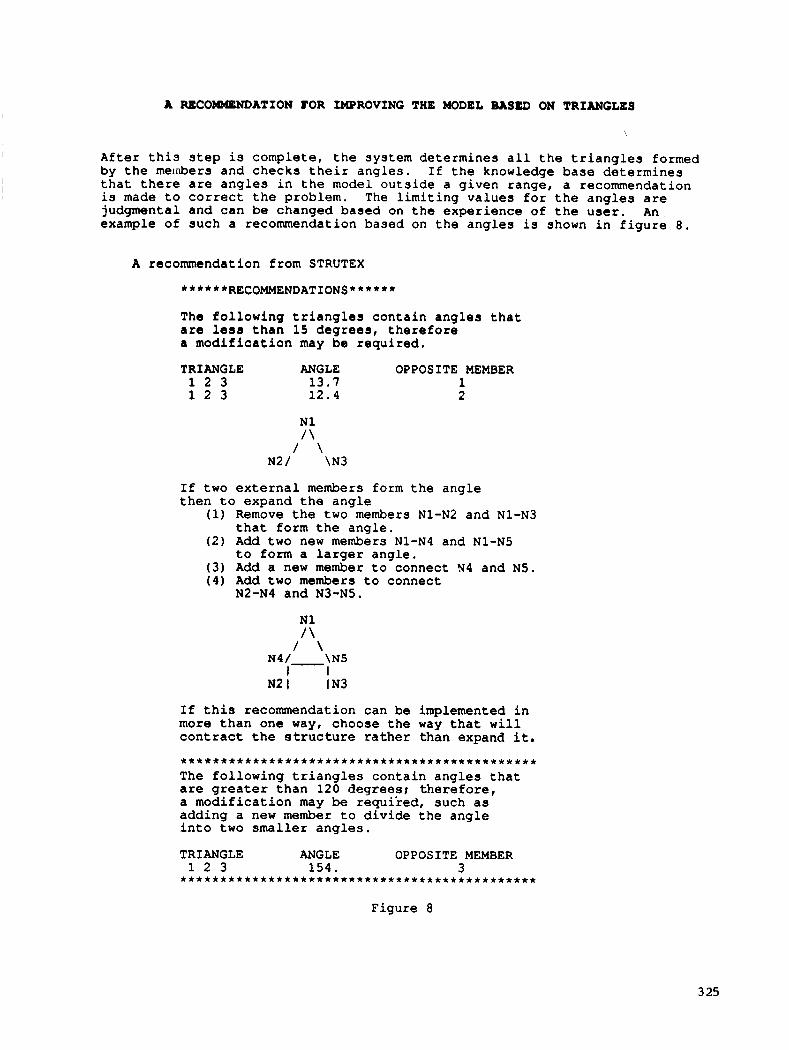
A RECOW4ENDATION FOR IMPROVING THE MODEL BASED ON TRIANGLES
After this step is complete, the system determines all the triangles formed by the members and checks their angles. If the knowledge base determines that there are angles in the model outside a given range, a recommendation is made to correct the problem. The limiting values for the angles are judgmental and can be changed based on the experience of the user. An example of such a recommendation based on the angles is shown in figure 8.
A recommendation from STRUTEX
******RECOMMENDATIONS******
The following triangles contain angles that are less than 15 degrees, therefore a modification may be required.
TRIANGLE ANGLE OPPOSITE MEMBER 1 2 3 13.7 1 1 2 3 12.4 2
N1 / \
/ \ N2 / \N3
If two external members form the angle then to expand the angle
(1) Remove the two members Nl-N2 and N1-N3 that form the angle,
(2) Add two new members Nl-N4 and Nl-N5 to form a larger angle.
(3) Add a new member to connect FJ4 and N5. (4) Add two members to connect
N2-N4 and N3-N5.
N1 / \
/ \
I I N2 I I N3
N4 / \N5
If this recommendation can be implemented in more than one way, choose the way that will contract the structure rather than expand it.
The following triangles contain angles that are greater than 120 degrees; therefore, a modification may be requiked, such as adding a new member to divide the angle into two smaller angles.
. . . . . . . . . . . . . . . . . . . . . . . . . . . . . . . . . . . . . . . . . . . . .
TRIANGLE ANGLE OPPOSITE MEMBER
. . . . . . . . . . . . . . . . . . . . . . . . . . . . . . . . . . . . . . . . . . . . . 1 2 3 154. 3
Figure 8
3 25
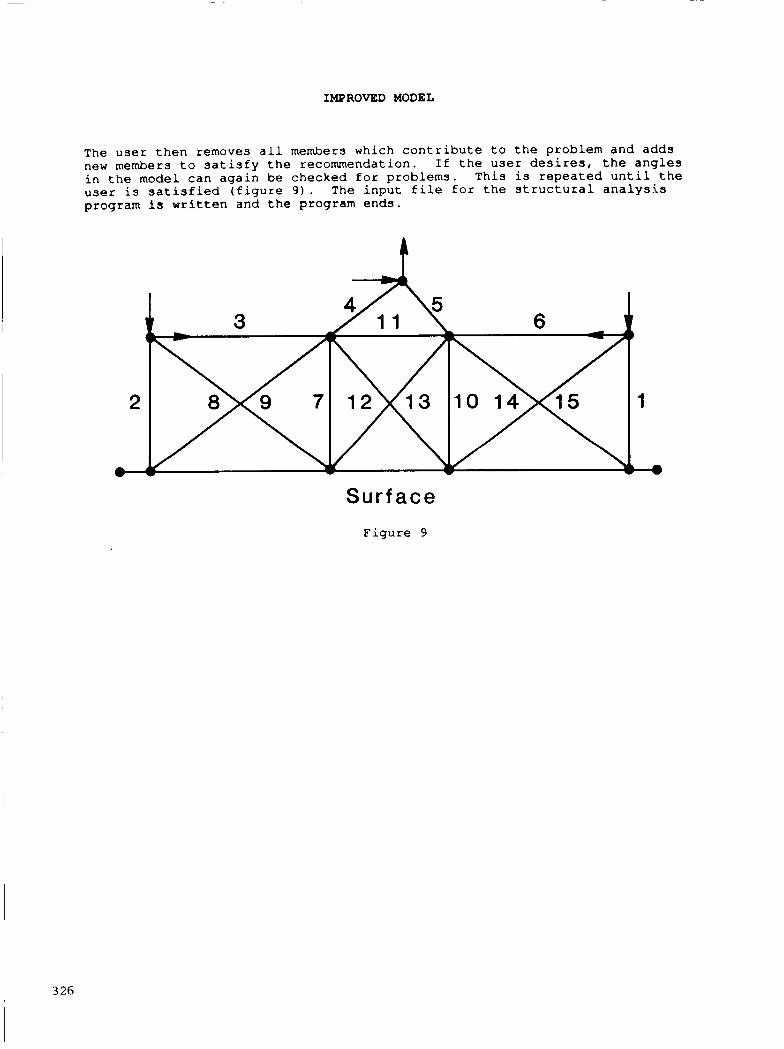
IMPROVED MODEL
The user then removes a l l members which contribute to the problem and adds new members to satisfy the recommendation. If the user desires, the angles in the model can again be checked for problems. This is repeated until the user is satisfied (figure 9). The input file for the structural analysis program is written and the program ends.
Surface
Figure 9
3 26
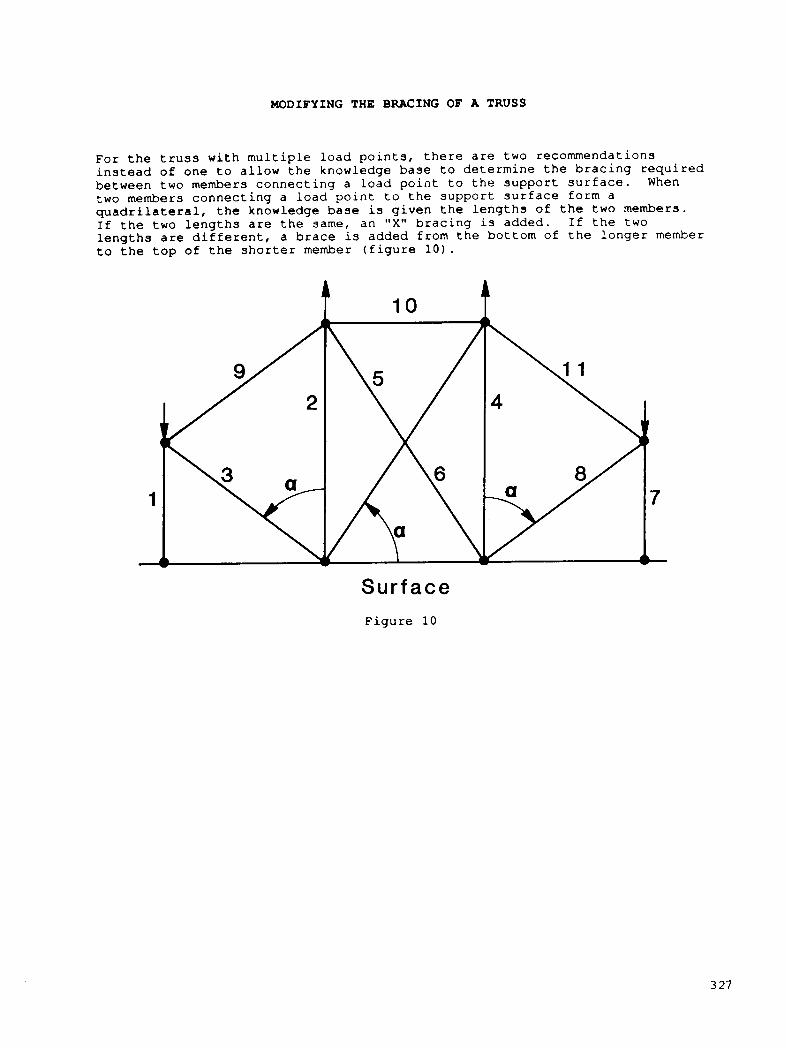
MODIFYING THE BRACING OF A TRUSS
F o r t h e t r u s s w i t h m u l t i p l e l o a d p o i n t s , t h e r e a r e two r e c o m m e n d a t i o n s i n s t e a d of o n e t o a l low t h e knowledge base t o d e t e r m i n e t h e b r a c i n g r e q u i r e d b e t w e e n two members c o n n e c t i n g a load p o i n t t o t h e s u p p o r t s u r f a c e . When t w o members c o n n e c t i n g a load p o i n t t o t h e s u p p o r t s u r f a c e f o r m a q u a d r i l a t e r a l , t h e knowledge b a s e i s g i v e n t h e l e n g t h s of t h e t w o members. I f t h e two l e n g t h s a r e t h e same, a n "X" b r a c i n g i s added. I f t h e two l e n g t h s are d i f f e r e n t , a brace i s a d d e d f r o m t h e b o t t o m of t h e l o n g e r member t o t h e t o p of t h e s h o r t e r member ( f i g u r e 1 0 ) .
1
-
10
Surface F i g u r e 10
7
L
3 27
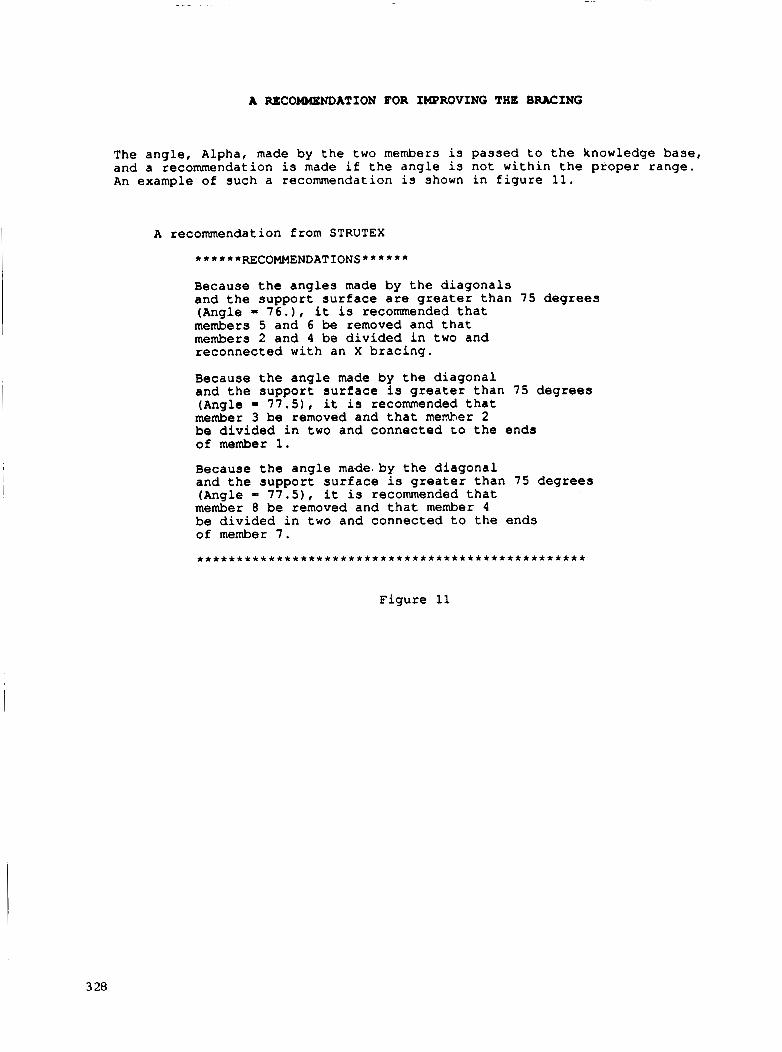
A RECObMENDATION FOR IMPROVING THE BRACING
The angle, Alpha, made by the two members is passed to the knowledge base, and a recommendation is made if the angle is not within the proper range. An example of such a recommendation is shown in figure 11.
A recommendation from STRUTEX
******RECOMMENDATIONS******
Because the angles made by the diagonals and the support surface are greater than 75 degrees (Angle = 76.) , it is recommended that members 5 and 6 be removed and that members 2 and 4 be divided in two and reconnected with an X bracing.
Because the angle made by the diagonal and the support surface is greater than 75 degrees (Angle = 7 7 . 5 ) t it is recommended that member 3 be removed and that member 2 be divided in two and connected to the ends of member 1.
Because the angle mgde.by the diagonal and the support surface is greater than 75 degrees (Angle - 7 7 . 5 ) , it is recommended that member 8 be removed and that member 4 be divided in two and connected to the ends of member 7.
. . . . . . . . . . . . . . . . . . . . . . . . . . . . . . . . . . . . . . . . . . . . . . . . .
Figure 11
3 28
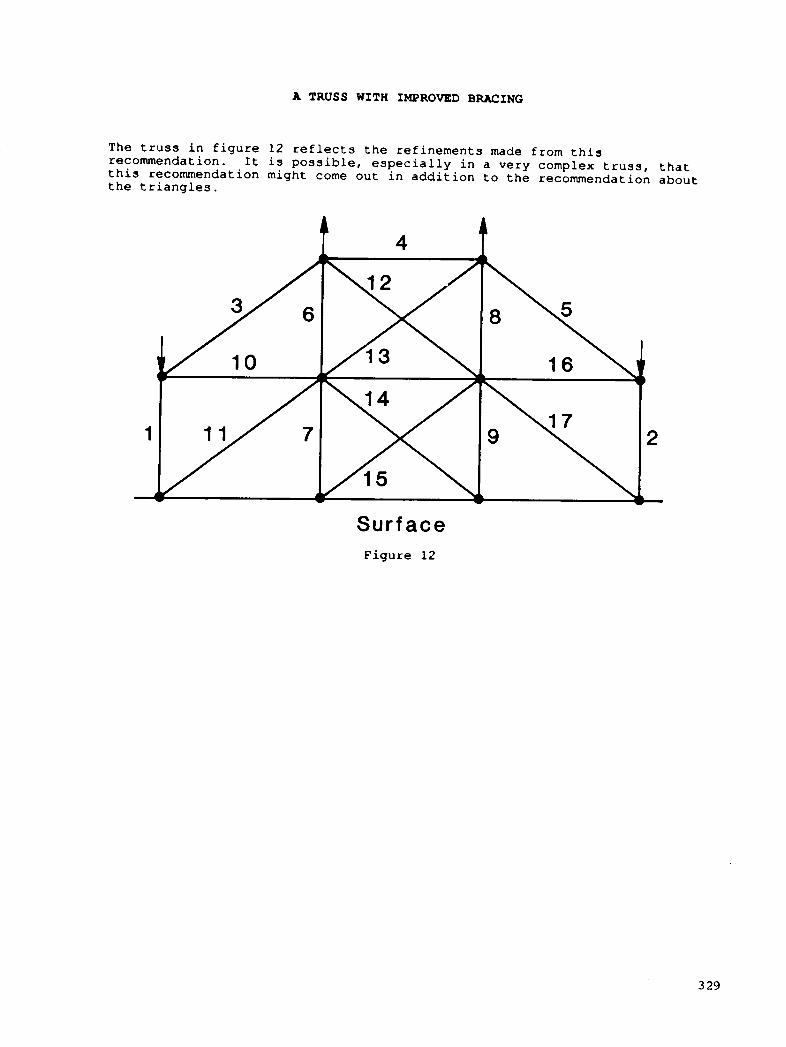
A TRUSS WITH IMPROVED BRACING
The truss in figure 12 reflects the refinements made from this recommendation. It is possible, especially in a very complex truss, that this recommendation might come out in addition to the recommendation about the triangles.
1
-
/ / \ \ Surf ace Figure 12
3 29

CONCLUSIONS
A prototype knowledge-based system has been developed to initially configure a structure to support point loads in two dimensions. There were two primary objectives for this project. The first objective was to investigate methods for passing data between a data base and a knowledge base. This was accomplished by integrating an inference engine into the system and determining the effects on the flow of data between the knowledge base and the data base. No significant problems were encountered in integrating the inference engine.
The second objective was to determine if an initial conceptual model could be improved by using symbolic processing instead of numeric processing. By applying the knowledge base, significant improvements were made to the trusses shown in the examples.. If more rules were added to the knowledge base then more improvements could be made to the model.
330

1.
REFERENCES
MacCallum, K. J.; Duffy, A.; and Green, S. : "An
2.
3.
4.
5.
6.
7.
8.
9.
10.
11.
12.
13.
Intelligent Concept Design Assistant." Proceedings of the IFIP W.G.5.2 Workinq Conference on Desiqn Theory in CAD, 1985, pp. 233-249.
Shah, J.: "Development of a Knowledge Base for an Expert System for the Design of Structural Parts.'' Proceedings of the 1985 29thComputers in Engineerinq Conference, 1985, Vol. 2, pp. 131-136.
Rogers, J., Feyock, S. and Sobieszczanski-Sobieski, J.: STRUTEX A Prototype Knowledge Based System for Initially Configuring a Structure to Support Point Loads in Two Dimensions. "Artificial Intelligence in Engineering: Design", Computational Mechanics Publications, Southampton, PP. 315-335.
DI-3000 User's Guide, Precision Visuals Inc. Document Number DI3817, Release Number 4 , March 1984.
Erickson, W. J.: "User Guide: Relational Information Management (RIM)", Report Number D6-IPAD-70023-M, Boeing Commercial Airplane Company, Seattle Washington, 1981.
Riley, G. ; Culbert, C. ; and Savely, R. T. : "CLIPS: An Expert System Tool for Delivery and Training." Proceedings of the Third Conference on AI for Space Applications, November 1987.
Whetstone, W. D.: "EISI-EAL: Engineering Analysis Language", Proceedings of the Second Conference on Computing in Civil Engineering, ASCE, 1980, PP. 276-285.
Vanaerplaats, G. N.: CONMIN A FORTRAN Program for Constrained Function Minimization. User's Manual. NASA TM X-62282, 1973.
Rogers, J. L., J r . ; Sobieski-Sobieszczanski, J.; Bhat, R. "An Implementation of the Programming Structural Synthesis System (PROSSS)", NASA TM 83180, December 1981.
Ceri, S.; Gottlob, G.; and Wiederhold, G. : "Interfacing Relational Databases and Prolog Efficiently." Proceedings of the First International Conference on Expert Database Systems, April 1-4, 1986, pp.141-153.
Nguyen,G.T.: "Prototypes and Database Samples for Expert Database Systems." Proceedinqs of the First International Conference on Expert Database Systems, April 1-4, 1986, pp.3-14.
van Biema, M.; Miranker, D. P.; and Stolfo, S.J.:" The Do-Loop Considered Harmful in Production Svstem Proarammina." Proceedings of the First International Conference 0; Expert Database Systems, April 1-4, 1986, pp. 125-138.
&
Feyock, S.; and Rogers, J. L.: "Embedded AI f o r Structural Optimization". Presented at the International Conference on Computational Engineering Science, April 10-14, 1988, Atlanta, GA.
331
N89- 25162 . I
TRUSS: AN INTELLIGENT DESIGN SYSTEM FOR AIRCRAFT WINGS
Preston R Bates" and Daniel P. Schrage
Georgia Institute of Technology Atlanta, GA
Graduate Research Assistant *
PRECEDING PAGE BLANK NOT FILMED 333
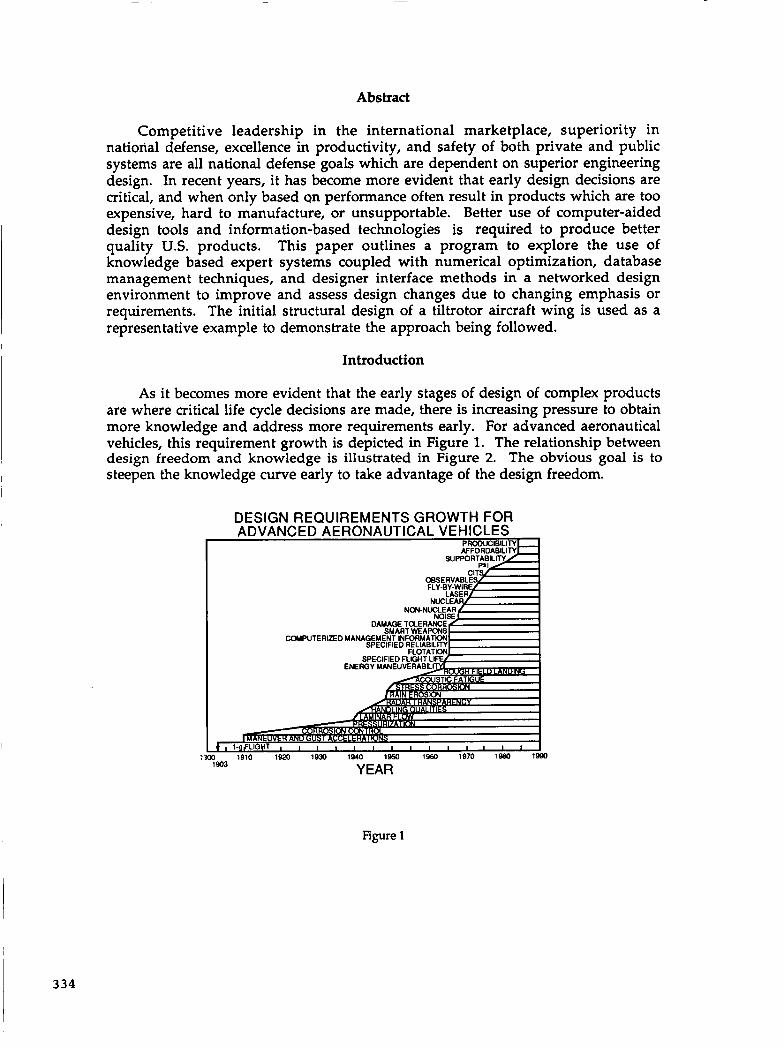
Abstract
Competitive leadership in the international marketplace, superiority in national defense, excellence in productivity, and safety of both private and public systems are all national defense goals which are dependent on superior engineering design. In recent years, it has become more evident that early design decisions are critical, and when only based Qn performance often result in products which are too expensive, hard to manufacture, or unsupportable. Better use of computer-aided design tools and information-based technologies is required to produce better quality U.S. products. This paper outlines a program to explore the use of knowledge based expert sys tems coupled with numerical optimization, database management techniques, and designer interface methods in a networked design environment to improve and assess design changes due to changing emphasis or requirements. The initial structural design of a tiltrotor aircraft wing is used as a representative example to demonstrate the approach being followed.
Introduction
As it becomes more evident that the early stages of design of complex products are where critical life cycle decisions are made, there is increasing pressure to obtain more knowledge and address more requirements early. For advanced aeronautical vehicles, this requirement growth is depicted in Figure 1. The relationship between design freedom and knowledge is illustrated in Figure 2. The obvious goal is to steepen the knowledge curve early to take advantage of the design freedom.
DESIGN REQUIREMENTS GROWTH FOR ADVANCED AERONAUTICAL VEHICLES
PRODUClBlLlTY
COMPUTERIZED MA
:!m 1910 1820 1930 19u) 1950 leso 1970 lgeg 1990
YEAR 1903
Figure 1
I 334
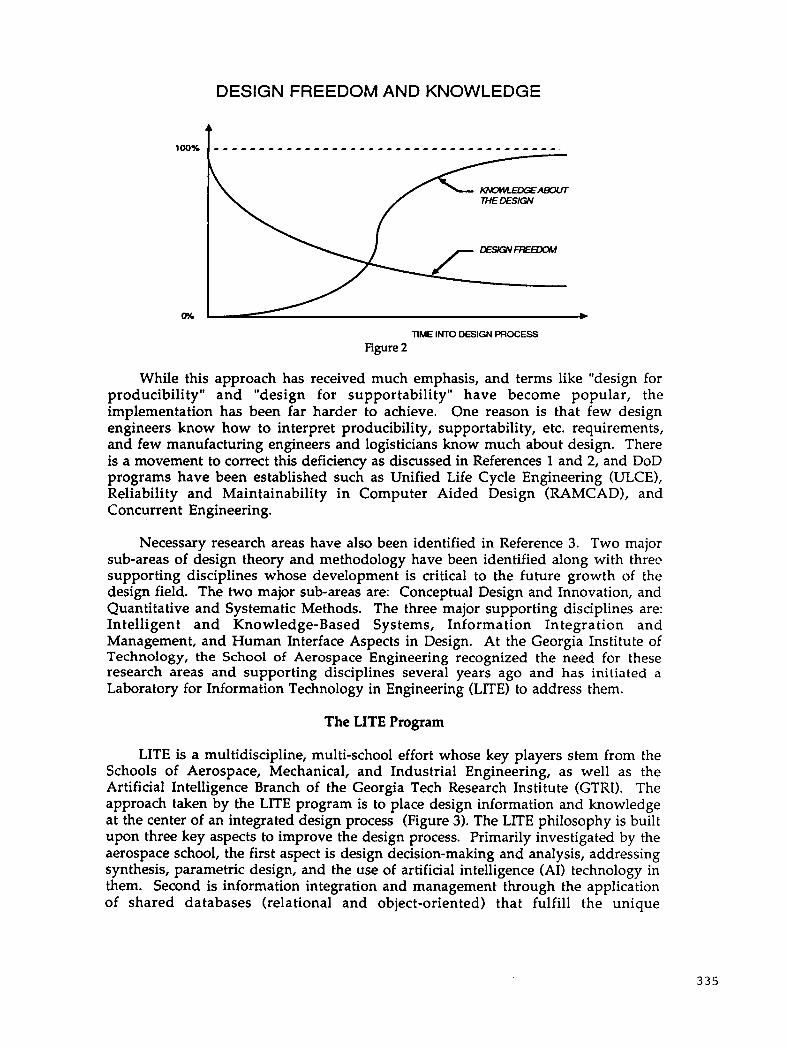
DESIGN FREEDOM AND KNOWLEDGE
100% t
nME INTO DESIGN PROCESS
Figure 2
While this approach has received much emphasis, and terms like "design for producibility" and "design for supportability" have become popular, the implementation has been far harder to achieve. One reason is that few design engineers know how to interpret producibility, supportability, etc. requirements, and few manufacturing engineers and logisticians know much about design. There is a movement to correct this deficiency as discussed in References 1 and 2, and DoD programs have been established such as Unified Life Cycle Engineering (ULCE), Reliability and Maintainability in Computer Aided Design (RAMCAD), and Concurrent Engineering.
Necessary research areas have also been identified in Reference 3. Two major sub-areas of design theory and methodology have been identified along with threc supporting disciplines whose development is critical to the future growth of the design field. The two major sub-areas are: Conceptual Design and Innovation, and Quantitative and Systematic Methods. The three major supporting disciplines are: Intelligent and Knowledge-Based Sys tems, Informa tion Integra tion and Management, and Human Interface Aspects in Design. At the Georgia Institute of Technology, the School of Aerospace Engineering recognized the need for these research areas and supporting disciplines several years ago and has initiated a Laboratory for Information Technology in Engineering (LITE) to address them.
The LITE Program
LITE is a multidiscipline, multi-school effort whose key players stem from the Schools of Aerospace, Mechanical, and Industrial Engineering, as well as the Artificial Intelligence Branch of the Georgia Tech Research Institute (GTRI). The approach taken by the LITE program is to place design information and knowledge at the center of an integrated design process (Figure 3). The LITE philosophy is built upon three key aspects to improve the design process. Primarily investigated by the aerospace school, the first aspect is design decision-making and analysis, addressing synthesis, parametric design, and the use of artificial intelligence (AI) technology in them. Second is information integration and management through the application of shared databases (relational and object-oriented) that fulfill the unique
335
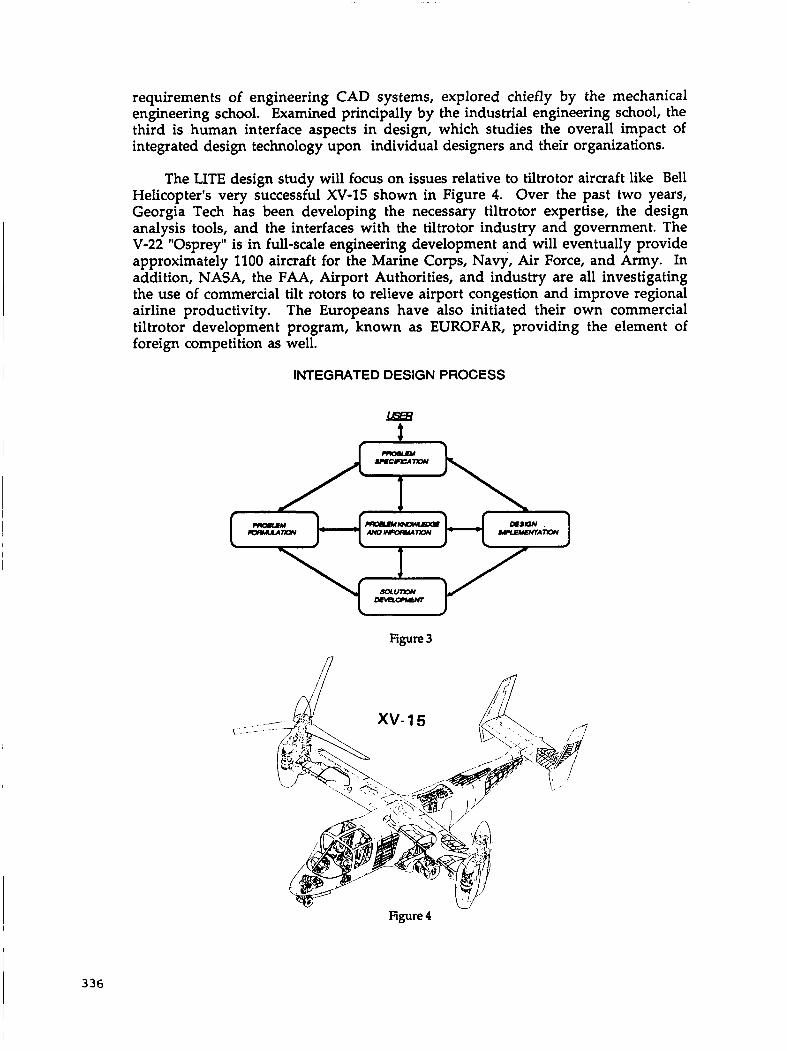
requirements of engineering CAD systems, explored chieff y by the mechanical engineering school. Examined principally by the industrial engineering school, the third is human interface aspects in design, which studies the overall impact of integrated design technology upon individual designers and their organizations.
The LITE design study will focus on issues relative to tiltrotor aircraft like Bell Helicopter's very successful XV-15 shown in Figure 4. Over the past two years, Georgia Tech has been developing the necessary tiltrotor expertise, the design analysis tools, and the interfaces with the tiltrotor industry and government. The V-22 "Osprey" is in full-scale engineering development and will eventually provide approximately 1100 aircraft for the Marine Corps, Navy, Air Force, and Army. In addition, NASA, the FAA, Airport Authorities, and industry are all investigating the use of commercial tilt rotors to relieve airport congestion and improve regional airline productivity. The Europeans have also initiated their own commercial tiltrotor development program, known as EUROFAR, providing the element of foreign competition as well.
INTEGRATED DESIGN PROCESS
- Figure 3
- Figure 4
336
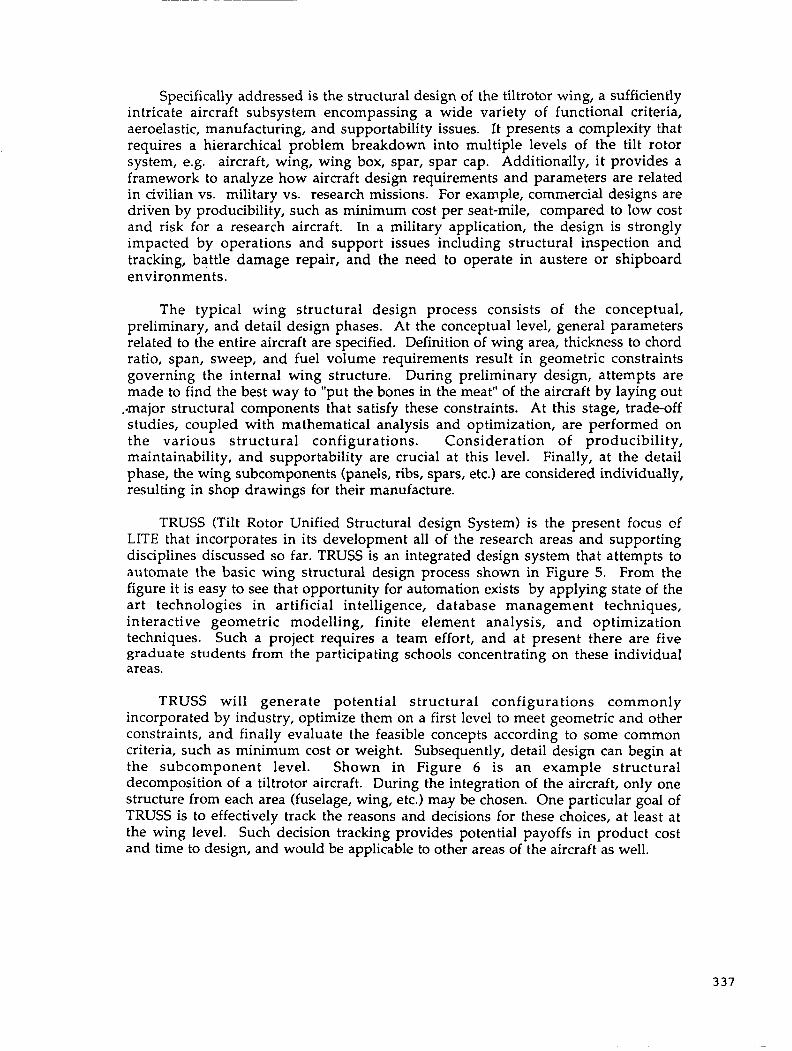
Specifically addressed is the structural design of the tiltrotor wing, a sufficiently intricate aircraft subsystem encompassing a wide variety of functional criteria, aeroelastic, manufacturing, and supportability issues. It presents a complexity that requires a hierarchical problem breakdown into multiple levels of the tilt rotor system, e.g. aircraft, wing, wing box, spar, spar cap. Additionally, it provides a framework to analyze how aircraft design requirements and parameters are related in civilian vs. military vs. research missions. For example, commercial designs are driiren by producibility, such as minimum cost per seat-mile, compared to low cost and risk for a research aircraft. In a military application, the design is strongly impacted by operations and support issues including structural inspection and tracking, battle damage repair, and the need to operate in austere or shipboard environments.
The typical wing structural design process consists of the conceptual, preliminary, and detail design phases. At the conceptual level, general parameters related to the entire aircraft are specified. Definition of wing area, thickness to chord ratio, span, sweep, and fuel volume requirements result in geometric constraints governing the internal wing structure. During preliminary design, attempts are made to find the best way to "put the bones in the meat" of the aircraft by laying out
.najor structural components that satisfy these constraints. At this stage, trade-off studies, coupled with mathematical analysis and optimization, are performed on the various structural configurations. Consideration of producibility, maintainability, and Supportability are crucial at this level. Finally, at the detail phase, the wing subcomponents (panels, ribs, spars, etc.) are considered individually, resulting in shop drawings for their manufacture.
TRUSS (Tilt Rotor Unified Structural design System) is the present focus of LITE that incorporates in its development all of the research areas and supporting disciplines discussed so far. TRUSS is an integrated design system that attempts to automate the basic wing structural design process shown in Figure 5. From the figure it is easy to see that opportunity for automation exists by applying state of the art technologies in artificial intelligence, database management techniques, interactive geometric modelling, finite element analysis, and optimization techniques. Such a project requires a team effort, and at present there are five graduate students from the participating schools concentrating on these individual areas.
TRUSS will generate potential structural configurations commonly incorporated by industry, optimize them on a first level to meet geometric and other constraints, and finally evaluate the feasible concepts according to some common criteria, such as minimum cost or weight. Subsequently, detail design can begin at the subcomponent level. Shown in Figure 6 is an example structural decomposition of a tiltrotor aircraft. During the integration of the aircraft, only one structure from each area (fuselage, wing, etc.) may be chosen. One particular goal of TRUSS is to effectively track the reasons and decisions for these choices, at least at the wing level. Such decision tracking provides potential payoffs in product cost and time to design, and would be applicable to other areas of the aircraft as well.
337
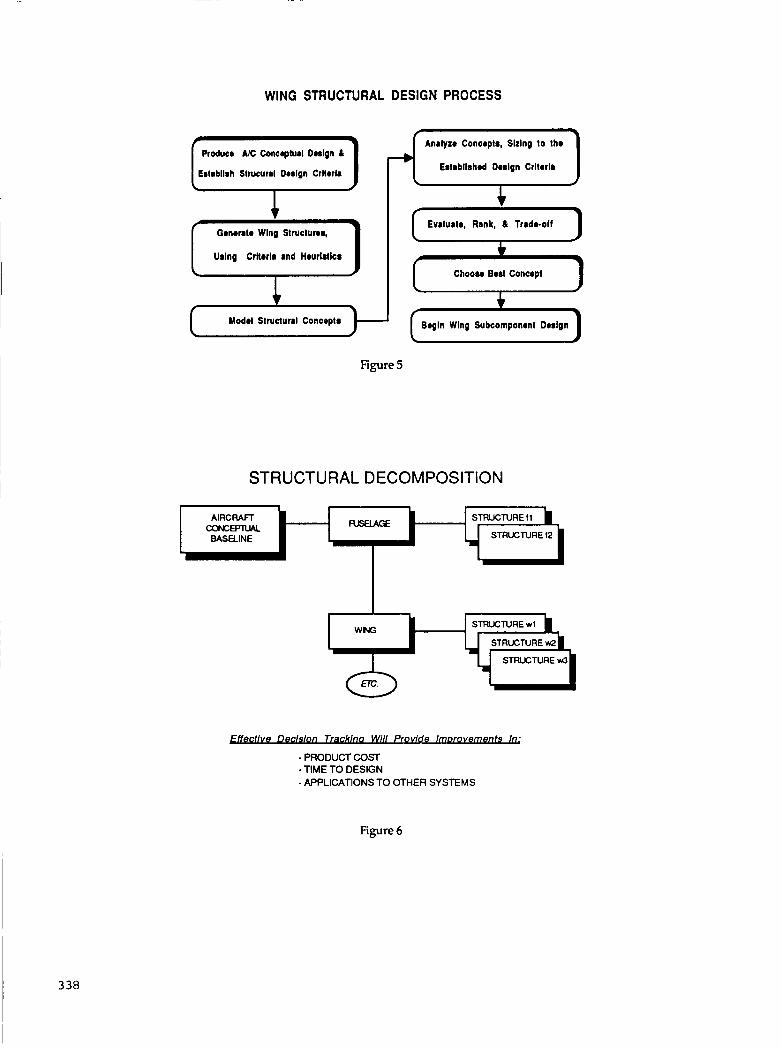
WING STRUCTURAL DESIGN PROCESS
Producr U C Conceptual D r l g n L
Estsbllih Strucurrl Drilgn Crltrrlr
Using Crltrrla and Hourlrtlcr
r Modrl Struaural Concrptr &
Analyze Concrptr, Slzlng to thr
Er t rb l l rhd Drilgn Crltrrla
Evalurtr, Rank, 6 Trrdr-off
L
1 ChoOM Beet Concrpt
1 Brgln Wing Subcomponont Drrign
Figure 5
STRUCTURAL DECOMPOSITION
AIRCRAFT STRUCTURE (1 CONCEPTUAL BASELINE STRUCTURE 12
I
STRUCTURE wl
STRUCTURE w2
STRUCTURE w3
Effective Dee- Will Provide W - PRODUCT COST -TIME TO DESIGN - APPLICATIONS TO OTHER SYSTEMS
Figure 6
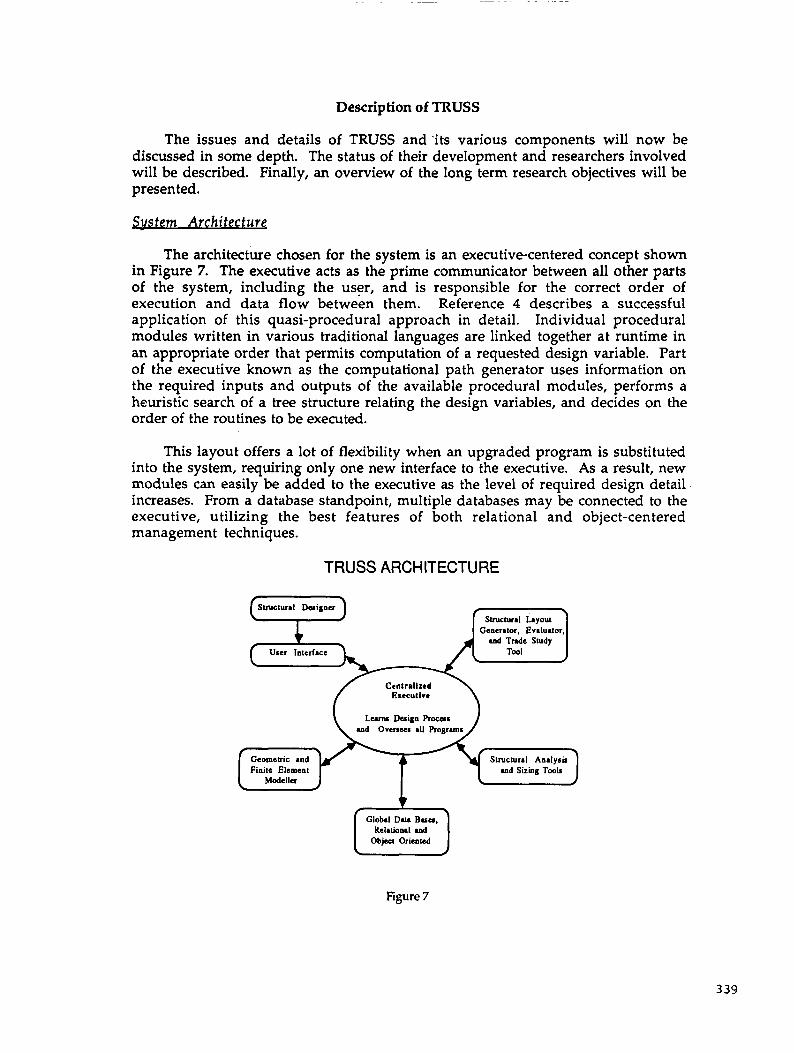
Description of TRUSS
b Generator, Evaluator. d Tnde Study
Urcr Interface Tool
The issues and details of TRUSS and .its various components will now be discussed in some depth. The status of their development and researchers involved will be described. Finally, an overview of the long term research objectives will be presented.
Relat io~l and Object Oriented
Sws tern Architecture
The architecture chosen for the system is an executive-centered concept shown in Figure 7. The executive acts as the prime communicator between all other parts of the system, including the user, and is responsible for the correct order of execution and data flow between them. Reference 4 describes a successful application of this quasi-procedural approach in detail. Individual procedural modules written in various traditional languages are linked together at runtime in an appropriate order that permits computation of a requested design variable. Part of the executive known as the computational path generator uses information on the required inputs and outputs of the available procedural modules, performs a heuristic search of a tree structure relating the design variables, and decides on the order of the routines to be executed.
This layout offers a lot of flexibility when an upgraded program is substituted into the system, requiring only one new interface to the executive. As a result, new modules can easily be added to the executive as the level of required design detail increases. From a database standpoint, multiple databases may be connected to the executive, utilizing the best features of both relational and object-centered management techniques.
TRUSS ARCHITECTURE
Figure 7
3 39

There are, however, some disadvantages of this architecture. Placing all of the responsibility on the executive slows down the transfer of information and requires more working memory, resulting in longer computing times. Some solutions to this include highly efficient database management procedures and the use of parallel processing. To quicken the research, LITE members will prototype TRUSS modules separately on different computers, resolving their own errors before trying to integrate the whole system.
The executive centered system was selected over a global database centered concept. Although a centrz.1 database architecture may provide for faster computing time, its inherent dependency on specific software requires specialized interfaces between the database and other modules. When improved software is inserted into this sys tem, multiple interfaces must be developed, causing increased system downtime and costs.
Problem Definition
Figure 8 presents the tiltrotor wing problem scope addressed by TRUSS. On the topmost levels, all aircraft wings are members of broadly defined groups. Tiltrotor wings are located under the V/STOL transport category. Further classification breaks down into mission application, functional discipline (structures, aerodynamics, aeroelasticity, flight controls, power train, etc.), and major structural materials. Next is the subsystem level (wing box, leading edge, fixed trailing edge, etc.), and finally the component level where actual pieces of structure, such as skin, ribs, and spars, can be found. These may even be further broken down into their components as well, such as web, chord, stiffener, etc. It is beyond the scope of TRUSS to address the entire problem space, so one of the branches in the hierarchy will be chosen as the initial design task. When all of the TRUSS participants have agreed upon the proper problem definition, module prototyping will begin. For example, initial development work might be identified by the shaded boxes, which indicate the material selection and structural analysis of the wing box spar in a commercial aircraft.
Proper design of TRUSS requires a detailed understanding of the tiltrotor wing structural design process, as well as a knowledge of the proper analysis tools and available design technologies. Figure 9 represents a design network of the required tasks, forms of data, and task interactions encountered in the design sequence. Once these have been identified, LITE team members construct a flowchart which places design tools, current or required, in their proper places in the sequence (Figure 10). Also represented on the flowchart are the state-of-the-art technologies required for design automation, such as artificial intelligence, interactive graphics facilities, and optimization. Such a view of the design process is not cast in concrete, and must be continuously re-examined and updated. In this manner, the causes of problems in the current design process can be pinpointed and reasonable solutions for improvements made. Interfacing issues among the different design tasks may also be identified. Once finalized into a valid form, such a flowchart can be programmed as a script into the centralized executive of TRUSS which would oversee all data interactions between the modules and the user.
3 40
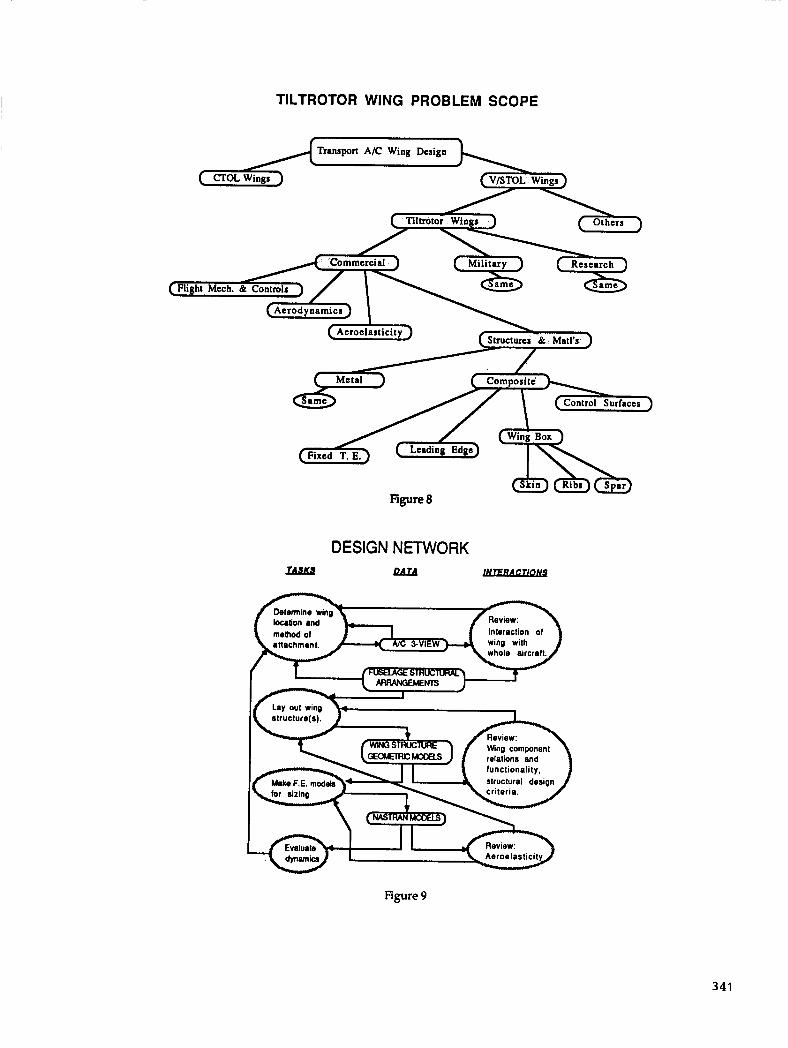
TILTROTOR WING PROBLEM SCOPE
Composite
Control Surfaces
DESIGN NETWORK xAs.u -
Interaction of
I / Lay out wing
figure 9
341
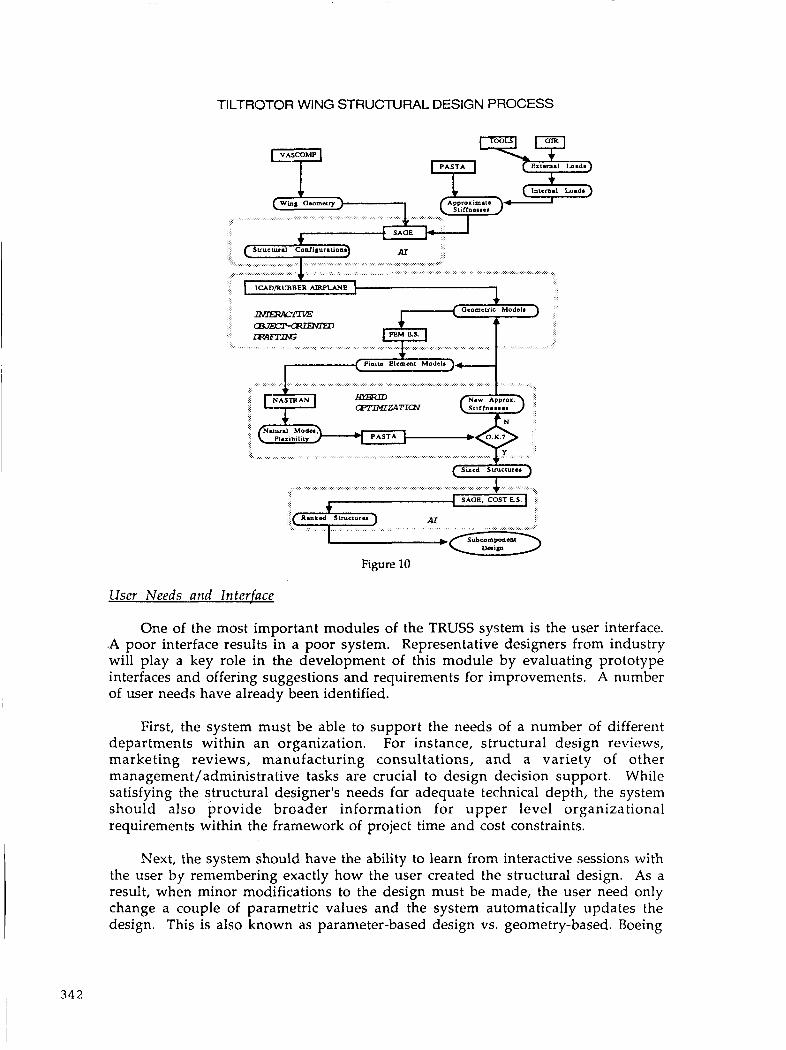
TILTROTOR WING STRUCTURAL DESIGN PROCESS
Figure 10
User Needs and Interface
One of the most important modules of the TRUSS system is the user interface. .A poor interface results in a poor system. Representative designers from industry will play a key role in the development of this module by evaluating prototype interfaces and offering suggestions and requirements for improvements. A number of user needs have already been identified.
First, the system must be able to support the needs of a number of different departments within an organization. For instance, structural design reviews, marketing reviews, manufacturing consultations, and a variety of other management/administrative tasks are crucial to design decision support. While satisfying the structural designer's needs far adequate technical depth, the system should also provide broader informa tion for upper level organizational requirements within the framework of project time and cost constraints.
Next, the system should have the ability to learn from interactive sessions with the user by remembering exactly how the user created the structural design. As a result, when minor modifications to the design must be made, the user need only change a couple of parametric values and the system automatically updates the design. This is also known as parameter-based design vs. geometry-based. Boeing
34 2

Commercial Airplane Company has successfully incorporated this feature on their wing configuration design system, CDCS, Reference 5. Still recognizing the advantages of geometric design, TRUSS will also have a drafting facility.
9
HISTORY WINDOW I 3
Finally, the system should present information to the designer in the most effective way for him to use the design data. This entails the use of user defined pop-up windows and access to the rule base, knowledge base, and databases. A sample user interface' concept for TRUSS that reflects these criteria is shown by Figure 11.
I * MATL = Titanium * TYPE = Blade-stiffened
TRUSS USER INTERFACE
Mu1 ti-Spar $ B 3 cells s 8
I MATERIALS D-BASE I FRAMES
F------.l
Wing Subcomponents Attributes
Properties Prices & sizes
Y FACT WINDOW Certainties 4 s
Constraints Design States FRAME EDITOR
WS 28 RIB
Design Decisions S hear-tied I * WEB THK = .13"
Figure 11
Database Issues
Databases are imperative tc the proposed design system. .They must serve as the repository for all information describing different design versions, and all design decisions up to any given time. All other TRUSS modules are dependent on this information to perform their required tasks. Specific data applications include material specifications and properties, geometric modelling data, meta-level and parametric descriptions of feasible structural configurations, sensitivity data, and machining specifications.
Reference 6 provides some detailed issues about the function of the database in TRUSS, some of which are discussed in the following paragraphs. Currently, one LITE team member is focusing his research specifically on the implementation of these items.
343

Modeling of complex design objects: Engineering CAD databases have requirements above and beyond those used for business applications. Engineering design problems involve large sys tems with complex interactions among their subsys tems and components. So the need arises for more advanced modelling techniques. The use of object-oriented databases with sophisticated data structures such as semantic networks, in addition to traditional relational structures, is required for these modelling tasks.
Versionlalternative control: There is seldom any single solution to a design problem, with the possibility of several optimal solutions existing that all satisfy the product requirements and constraints. Hence arises the need for the storage and arrangement of data specific to these different versions or alternatives, which may be called upon by other application programs.
Viewlconfiguration management; A system like TRUSS involves many users with different needs for design data. Even the separate modules of the system have different requirements for the same data. These differing 'views' of the design object must be supported. On one hand is an administrative view of the data where a project manager might be interested only in a few key parameters, such as system cost or production time estimates. On the other hand, the design engineer may need to know very detailed information like individual structural component weights, their raw material types, and associated costs.
Dynamic schema definition: A database schema defines the objects modelled in the database and their binding relationships. For multiple views, these schemas must be flexible for modification and extension, preferably without reloading the data base or recompiling the schemas, thus working dynamically with the system.
Concurrent control: A unified design system involves the communication among several of its modules, and among several users in a networked workstation environment. The ability to control the data of several parallel processing applications is desired from the database manager to ensure data integrity along with faster computing times. In AI terminology, such a 'blackboard' displays and modifies all data between separate application. programs acting in parallel.
Partial integrity and constraints: Design of a particular object is done in an iterative fashion. While many types of design have a preferred sequence of activities that take place, the database system should not impose constraints on this sequence. It may be necessary to allow and manage inconsistent database states.
Management utilities: These include the basic tasks of data backup, recovery, security, operational accounting and performance statis tics, and off-line storage and data archival.
Hardware and So.ftware
Significant chokepoints arise in the current design process whenever hardware or software incompatibilities exist. Reference 7 tells that such days for engineers are coming to an end. Apollo Computer, Inc. has developed a set of products which create a heterogenous networked computer environment using the best features of

different hardware. The requirements of TRUSS point toward the use of this type of design environment. To address this issue, LITE members are compiling a comprehensive listing of available programs used by industry and government organizations, the hardware they run on, and the language the source code is written in. Especially challenging is the marriage of traditional programs used in a "number crunching" environment to new AI tools and machines. The wide variety of such combinations is shown in Figure 12. The proper choice of hardware and software combinations is a primary goal of the TRUSS system planning, approach, and methodology currently in progress.
Discipline A m n y m Description
Integrated ICAD Knowledge Based CAD System Design Tools INTERGRAPH Knowledge Based CAD System Hardware Expert System GEST Generic Expert System Tool Tools Daa Base KIM Reladond Data Base Mgt Systems VBASE Object Oriented Data Base
I ORACLE [ Object Oriented Data Base Optmumuon OPT Reduced Gradient Method
I SPARS
AVID
SWEEP I CDS
NAPSAP
MIMFOOF Acroelasuc Stabilit Strucrml NA TRA Analysis ACCESS 111
APAS 111
eornemc EMPA K Modellin HESCAD
Mcdellin
Analysis Acrodvnanics I DYLOFLM
cLMAx-- USSAERO
Multispar Box Optimization Progam Flutter and Strength Optimization Program General Aviation Sizing Prognm Tiltrotor Sizing and Pc r fomnce Helicopter Sizing and Perform.mce Vehicle Sizing & Perf Evaluation Program Aerospace Vehicle Interactive Prognm Configuration Dcveloprnent Systcm Structural Weight Estimation I'rognm Naval Airship P r o p m for Sizing & Perf Generalized Tiltrotor P m p m
Proprotor Aeroelastic SLrbility P rogm
NASA Structural Analysis Program Structural Analysis and Opnmiution Automated Progam for AJC Strucrure
Aircraft Ccomeuy Generator Helicopter Geomeuy Modeller Expen System for MARC Analyzer
Goddard Mission Analysis Systcm
Dynamic L o d s of flexible Airplanes Prediction of Aerodynamic Chwdcteristics Aerodynamic Panel l a d s Pmpam
Hardware
Syrnbolics (LISP) Intcrgaph
Syrnbotics VAX 8600 (LISP) VAX Computer Vision,
Ontologic IBM PC VAX. CYBEK
(FORTRAN)
VAX VAX, CYBER VAX. CYBER
VAX (FOItTIIAN)
VAX (FORI'RAN)
IBM (FORTRAN) VAX
VAX (FORTRAN)
Figure 12
345
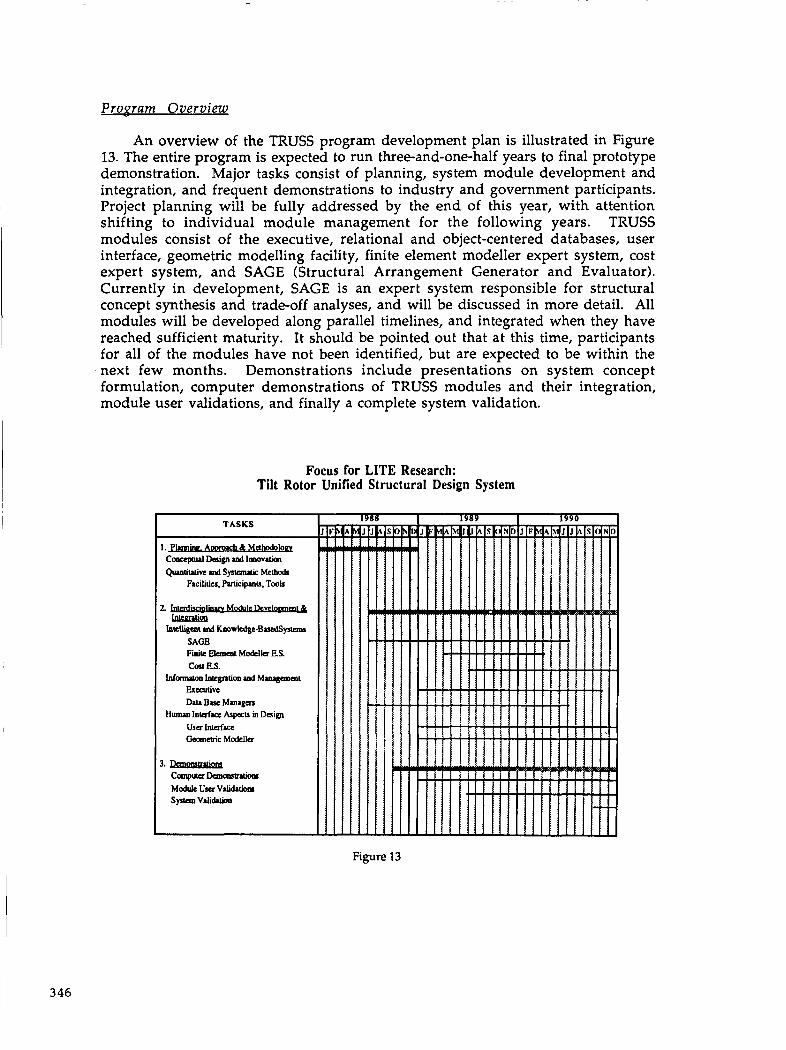
Proaram Overview
An overview of the TRUSS program development plan is illustrated in Figure 13. The entire program is expected to run three-and-one-half years to final prototype demonstration. Major tasks consist of planning, system module development and integration, and frequent demonstrations to industry and government participants. Project planning will be fully addressed by the end of this year, with attention shifting to individual module management for the following years. TRUSS modules consist of the executive, relational and object-centered databases, user interface, geometric modelling facility, finite element modeller expert system, cost expert system, and SAGE (Structural Arrangement Generator and Evaluator). Currently in development, SAGE is an expert system responsible for structural concept synthesis and trade-off analyses, and will be discussed in more detail. All modules will be developed along parallel timelines, and integrated when they have reached sufficient maturity. It should be pointed out that at this time, participants for all of the modules have not been identified, but are expected to be within the next few months. Demonstrations include presentations on system concept formulation, computer demonstrations of TRUSS modules and their integration, module user validations, and finally a complete sys tern validation.
Focus for LITE Research: Tilt Rotor Unified Structural Design System
TASKS
1. Mdhodolo~y Comeptlul Design ad lmovilion Quantiutiw lod Splanvic MelhoQ
Ficilities, Participants. Took
Figure 13
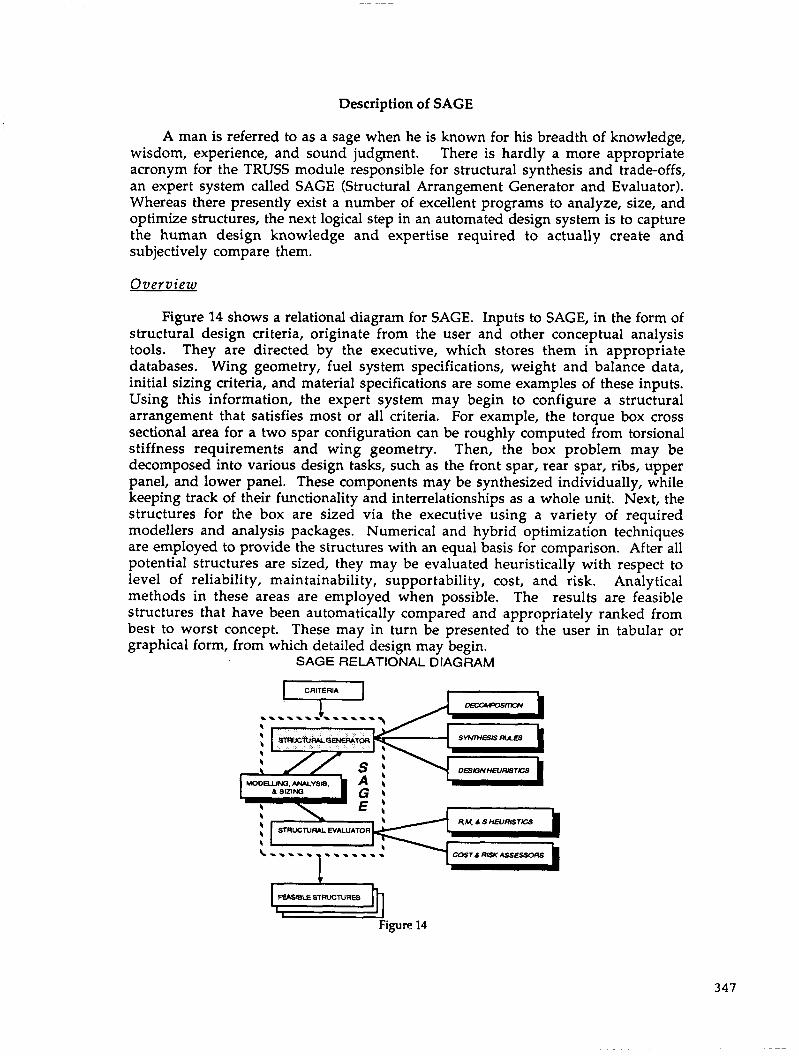
Description of SAGE
A man is referred to as a sage when he is known for his breadth of knowledge, wisdom, experience, and sound judgment. There is hardly a more appropriate acronym for the TRUSS module responsible for structural synthesis and trade-offs, an expert system called SAGE (Structural Arrangement Generator and Evaluator). Whereas there presently exist a number of excellent programs to analyze, size, and optimize structures, the next logical step in an automated design system is to capture the human design knowledge and expertise required to actually create and subjectively compare them.
0 verview
Figure 14 shows a relational diagram for SAGE. Inputs to SAGE, in the form of structural design criteria, originate from the user and other conceptual analysis tools. They are directed by the executive, which stores them in appropriate databases. Wing geometry, fuel system specifications, weight and balance data, initial sizing criteria, and material specifications are some examples of these inputs. Using this information, the expert system may begin to configure a structural arrangement that satisfies most or all criteria. For example, the torque box cross sectional area for a two spar configuration can be roughly computed from torsional stiffness requirements and wing geometry. Then, the box problem may be decomposed into various design tasks, such as the front spar, rear spar, ribs, upper panel, and lower panel. These components may be synthesized individually, while keeping track of their functionality and interrelationships as a whole unit. Next, the structures for the box are sized via the executive using a variety of required modellers and analysis packages. Numerical and hybrid optimization techniques are employed to provide the structures with an equal basis for comparison. After all potential structures are sized, they may be evaluated heuristically with respect to level of reliability, maintainability, supportability, cost, and risk. Analytical methods in these areas are employed when possible. The results are feasible structures that have been automatically compared and appropriately ranked from best to worst concept. These may in-turn be presented-io the graphical form, from which detailed design may begin.
SAGE RELATIONAL DIAGRAM
us& in tabular or
..\..\..\.\\.. Y / E i i s
9 M . 1 S HEIJRISTCS
COSTA RISKASSESSORS
FEASIBLE STFnJcnJRES
Figure 14
347
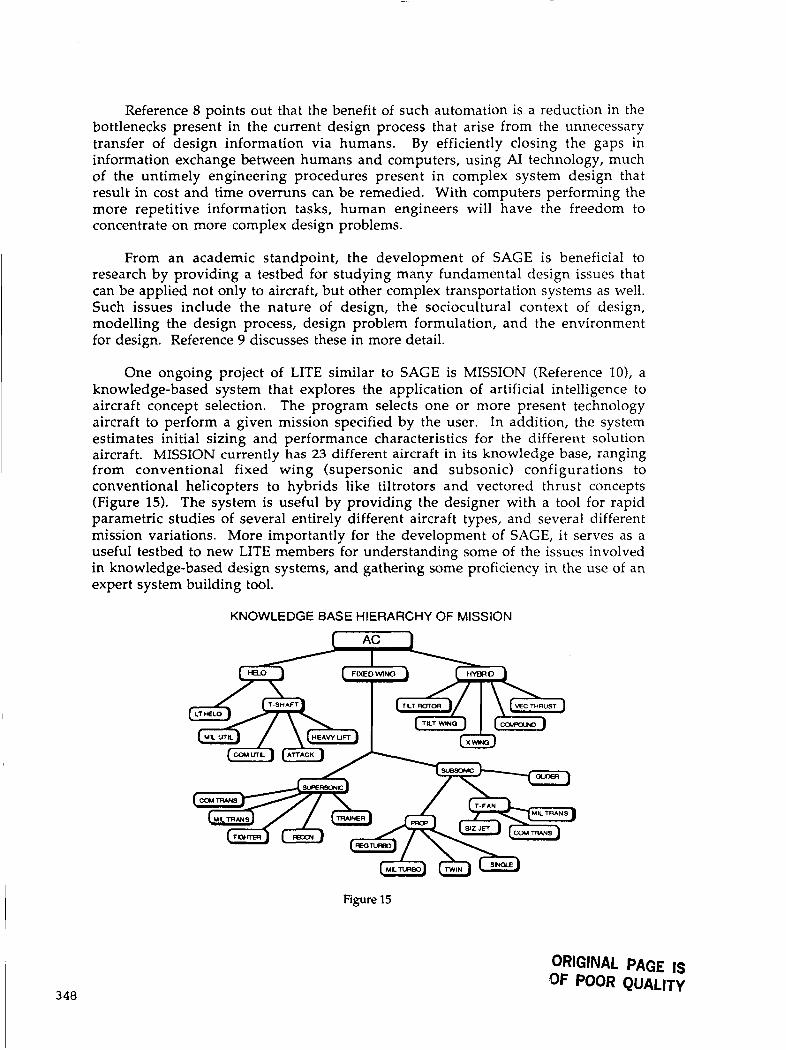
Reference 8 points out that the benefit of such automation is a reduction in the bottlenecks present in the current design process that arise from the unnecessary transfer of design information via humans. By efficiently closing the gaps in information exchange between humans and computers, using AI technology, much of the untimely engineering procedures present in complex system design that result in cost and time overruns can be remedied. With computers performing the more repetitive information tasks, human engineers will have the freedom to concentrate on more complex design problems.
From an academic standpoint, the development of SAGE is beneficial to research by providing a testbed for studying many fundamental design issues that can be applied not only to aircraft, but other complex transportation systems as well. Such issues include the nature of design, the sociocultural context of design, modelling the design process, design problem formulation, and the environment for design. Reference 9 discusses these in more detail.
One ongoing project of LITE similar to SAGE is MISSION (Reference 101, a knowledge-based sys tem that explores the application of artificial intelligence to aircraft concept selection. The program selects one or more present technology aircraft to perform a given mission specified by the user. In addition, the system estimates initial sizing and performance characteristics for the different solution aircraft. MISSION currently has 23 different aircraft in its knowledge base, ranging from conventional fixed wing (supersonic and subsonic) configurations to conventional helicopters to hybrids like tiltrotors and vectored thrust concepts (Figure 15). The system is useful by providing the designer with a tool for rapid parametric studies of several entirely different aircraft types, and several different mission variations. More importantly for the development of SAGE, it serves as a useful testbed to new LITE members for understanding some of the issues involved in knowledge-based design systems, and gathering some proficiency in the use of an expert system building tool.
Figure 15
ORIGINAL PAGE IS OF POOR QUALITY
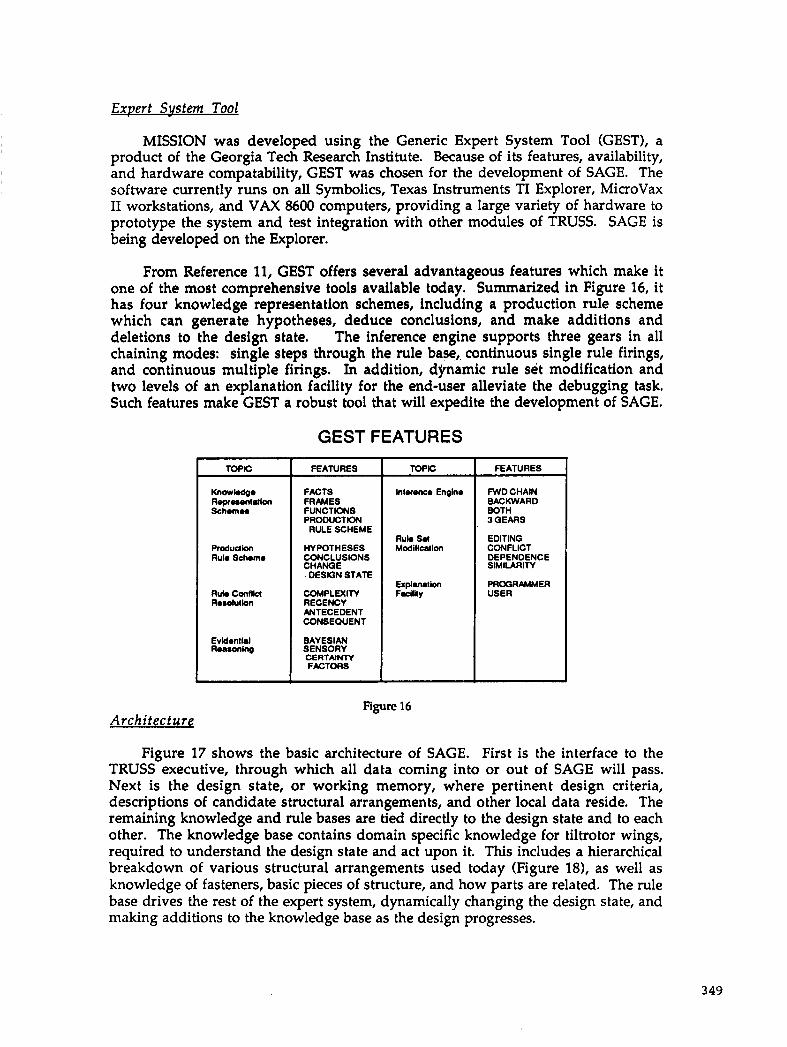
Expert System Tool
Modificalion
MISSION was developed using the Generic Expert System Tool (GEST), a product of the Georgia Tech Research Institute. Because of its features, availability, and hardware compatability, GEST was chosen for the development of SAGE. The software currently runs on all Symbolics, Texas Instruments TI Explorer, MicroVax I1 workstations, and VAX 8600 computers, providing a large variety of hardware to prototype the system and test integration with other modules of TRUSS. SAGE is being developed on the Explorer.
CONFLICT DEPENDENCE SIMILARITY
From Reference 11, GEST offers several advantageous features which make it one of the most comprehensive tools available today. Summarized in Figure 16, it has four knowledge representation schemes, including a production rule scheme which can generate hypotheses, deduce conclusions, and make additions and deletions to the design state. The inference engine supports three gears in all chaining modes: single steps through the rule base,, continuous single rule firings, and continuous multiple firings. In addition, dynamic rule set modification and two levels of an explanation facility for the end-user alleviate the debugging task. Such features make GEST a robust tool that will expedite the development of SAGE.
GEST FEATURES
TOPIC
Knowledge Representallon Schemes
FTodUdkn Rule Scheme
Rub ConflM R.sdutlofl
EvUentld FkUonlng
FEATURES
FACTS FRAMES FUNCTIONS PRODUCTlON t RULE SCHEME
HYPOTHESES CONCLUSIONS CHANGE
DESIGN STATE
COMPLEXITY RECENCY ANTECEDENT CONSEQUENT
BAYESIAN SENSORY CERTAINTY FACTORS I
FEATURES
BACKWARD
3 GEARS
Rub Sol EDITING
Architecture Figure 16
Figure 17 shows the basic architecture of SAGE. First is the interface to the TRUSS executive, through which all data coming into or out of SAGE will pass. Next is the design state, or working memory, where pertinent design criteria, descriptions of candidate structural arrangements, and other local data reside. The remaining knowledge and rule bases are tied directly to the design state and to each other. The knowledge base contains domain specific knowledge for tiltrotor wings, required to understand the design state and act upon it. This includes a hierarchical breakdown of various structural arrangements used today (Figure 181, as well as knowledge of fasteners, basic pieces of structure, and how parts are related. The rule base drives the rest of the expert system, dynamically changing the design state, and making additions to the knowledge base as the design progresses.
349
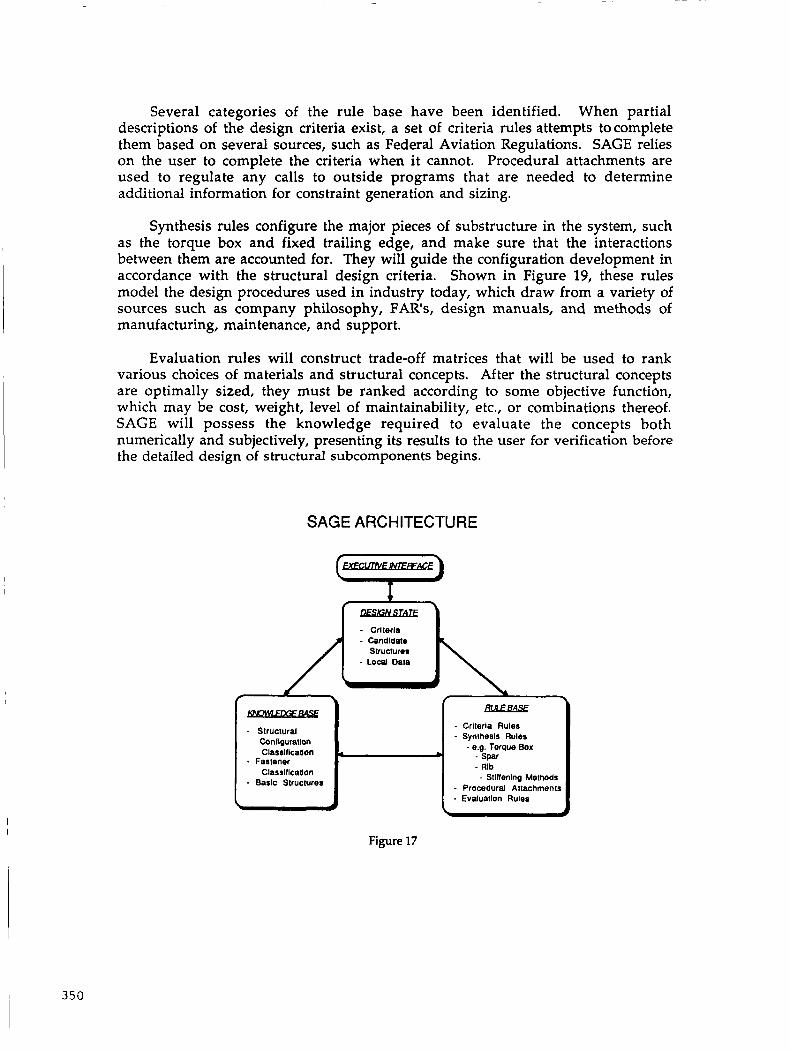
Several categories of the rule base have been identified. When partial descriptions of the design criteria exist, a set of criteria rules attempts tocomplete them based on several sources, such as Federal Aviation Regulations. SAGE relies on the user to complete the criteria when it cannot. Procedural attachments are used to regulate any calls to outside programs that are needed to determine additional information for constraint generation and sizing.
- - Crllerla ~ Candldale
SVUCrUres - Local Data
Synthesis rules configure the major pieces of substructure in the system, such as the torque box and fixed trailing edge, and make sure that the interactions between them are accounted for. They will guide the configuration development in accordance with the structural design criteria. Shown in Figure 19, these rules model the design procedures used in industry today, which draw from a variety of sources such as company philosophy, FAR'S, design manuals, and methods of manufacturing, maintenance, and support.
- Structural COnllguratlon Classlficallon - Fastener Classlllcadon
- Bask Structures
Evaluation rules will construct trade-off matrices that will be used to rank various choices of materials and structural concepts. After the structural concepts are optimally sized, they must be ranked according to some objective functidn, which may be cost, weight, level of maintainability, etc., or combinations thereof. SAGE will possess the knowledge required to evaluate the concepts both numerically and subjectively, presenting its results to the user for verification before the detailed design of structural subcomponents begins.
- Criteria Rules - Synrhesls Rules
- e.g. Torque Box II b ~ Spar
~ Rib - Stlffenlno Methods
- Procedural Attachmenls
SAGE ARCHITECTURE
Evaluatlon Rules
Figure 17
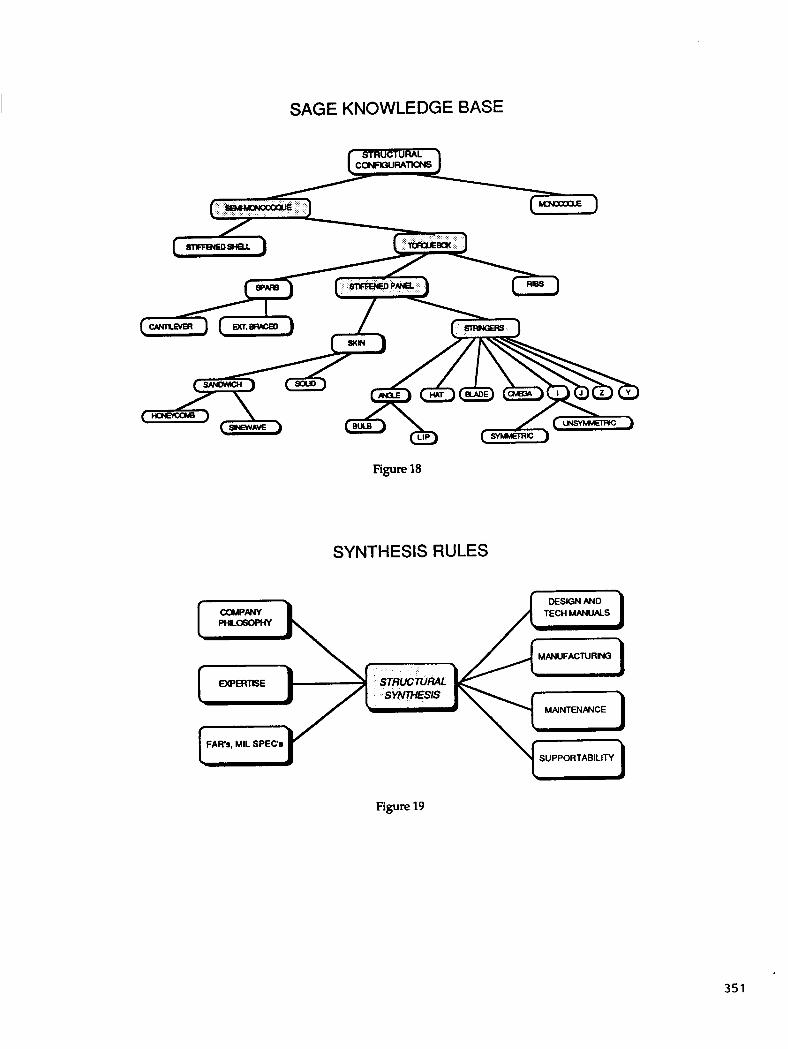
SAGE KNOWLEDGE BASE
Figure 18
SYNTHESIS RULES
I f f i N I TECH MANUALS A L L I
MANUFACNRNG
MAINTENANCE
FAR'S, MIL SPECo D \ - n SUPPORTABILITY
Figure 19
351
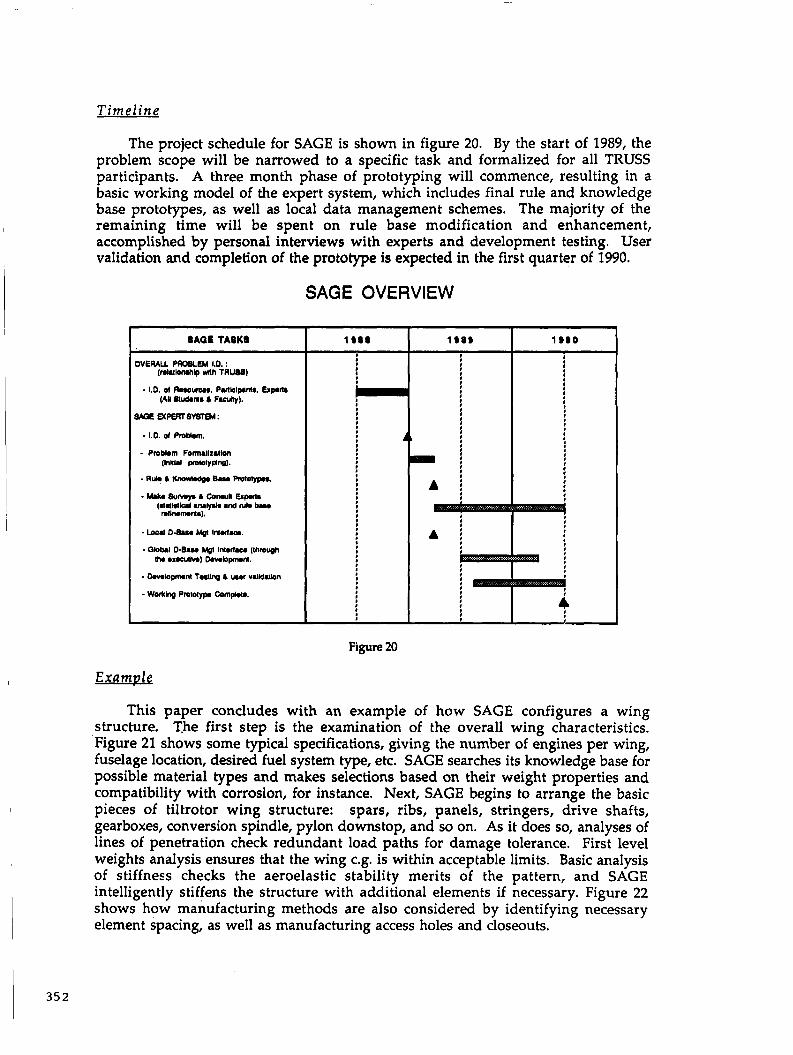
T imel ine
The project schedule for SAGE is shown in figure 20. By the start of 1989, the problem scope will be narrowed to a specific task and formalized for all TRUSS participants. A three month phase of prototyping will commence, resulting in a basic working model of the expert system, which includes final rule and knowledge base prototypes, as well as local data management schemes. The majority of the remaining time will be spent on rule base modification and enhancement, accomplished by personal interviews with experts and development testing. User validation and completion of the prototype is expected in the first quarter of 1990.
SAGE OVERVIEW
I I I 0 0
I
I , , I 0
I
I !
i sas I 1 s a 0
Figure 20
This paper concludes with an example of how SAGE configures a wing structure. T.he first step is the examination of the overall wing characteristics. Figure 21 shows some typical specifications, giving the number of engines per wing, fuselage location, desired fuel system type, etc. SAGE searches its knowledge base for possible material types and makes selections based on their weight properties and compatibility with corrosion, for instance. Next, SAGE begins to arrange the basic pieces of tiltrotor wing structure: spars, ribs, panels, stringers, drive shafts, gearboxes, conversion spindle, pylon downstop, and so on. As it does so, analyses of lines of penetration check redundant load paths for damage tolerance. First level weights analysis ensures that the wing c.g. is within acceptable limits. Basic analysis of stiffness checks the aeroelastic stability merits of the pattern, and SAGE intelligently stiffens the structure with additional elements if necessary. Figure 22 shows how manufacturing methods are also considered by identifying necessary element spacing, as well as manufacturing access holes and closeouts.
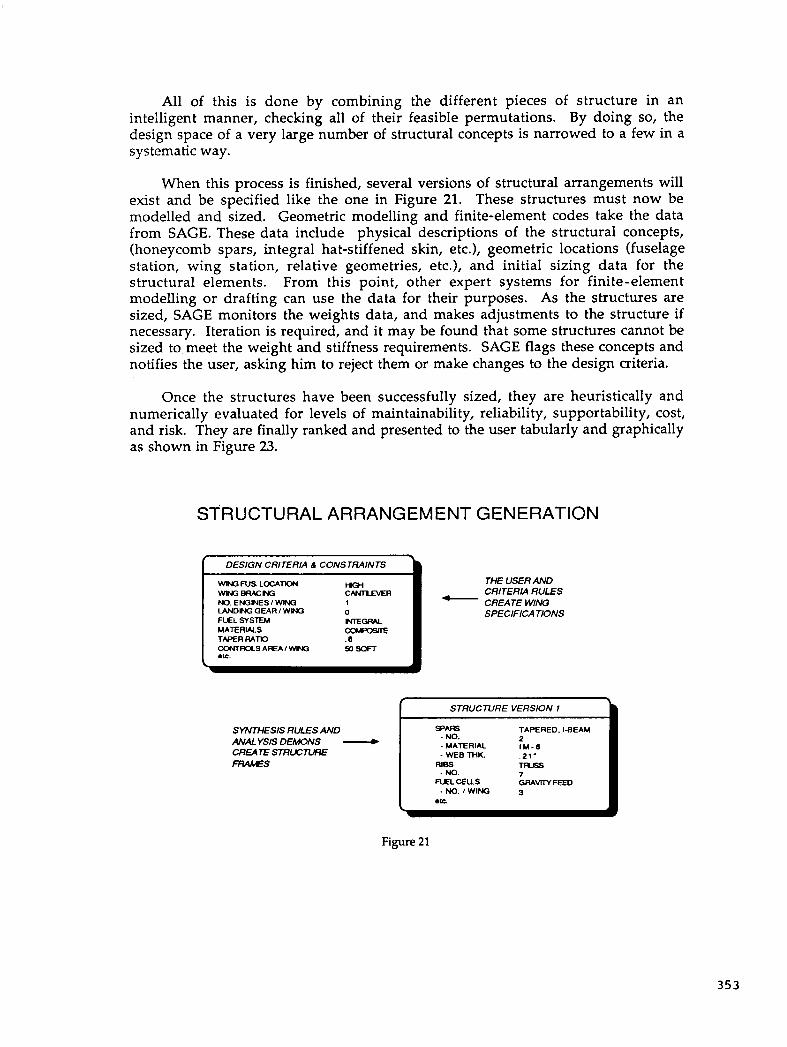
All of this is done by combining the different pieces of structure in an intelligent manner, checking all of their feasible permutations. By doing so, the design space of a very large number of structural concepts is narrowed to a few in a systematic way.
When this process is finished, several versions of structural arrangements will exist and be specified like the one in Figure 21. These structures must now be modelled and sized. Geometric modelling and finite-element codes take the data from SAGE. These data include physical descriptions of the structural concepts, (honeycomb spars, integral hat-stiffened skin, etc.), geometric locations (fuselage station, wing station, relative geometries, etc.), and initial sizing data for the structural elements. From this point, other expert systems for finite-element modelling or drafting can use the data for their purposes. As the structures are sized, SAGE monitors the weights data, and makes adjustments to the structure if necessary. Iteration is required, and it may be found that some structures cannot be sized to meet the weight and stiffness requirements. SAGE flags these concepts and notifies the user, asking him to reject them or make changes to the design criteria.
Once the structures have been successfully sized, they are heuristically and numerically evaluated for levels of maintainabili ty, reliability, supportability, cost, and risk. They are finally ranked and presented to the user tabularly and graphically as shown in Figure 23.
STRUCTURAL ARRANGEMENT GENERATION
DESIGN CRITERIA 6 CONSTRAINTS
THE USERAND CRITERIA RULES
SPEClFlCA TIONS
'AIM3 Ns LOCATK)F( Hc+( WwOBRAcffi NO EffiINES/WING LANDIMG GEAR I W I W FWL SYSTEM NlEGRAL
:-" I - CREATEWING
50 SOFT
MATERIALS TAPERRATIO CONTRaSAFU/WWG
SYNTHESIS RULES AND ANALYSIS DEMONS CREATESTRUCNRE FRAMS
r STRUCTURE VERSION 7
TAPERED, I-BEAM
TRGS - No.
. No. /WINO FWLCEUS GRAWFEED
Figure 21
353
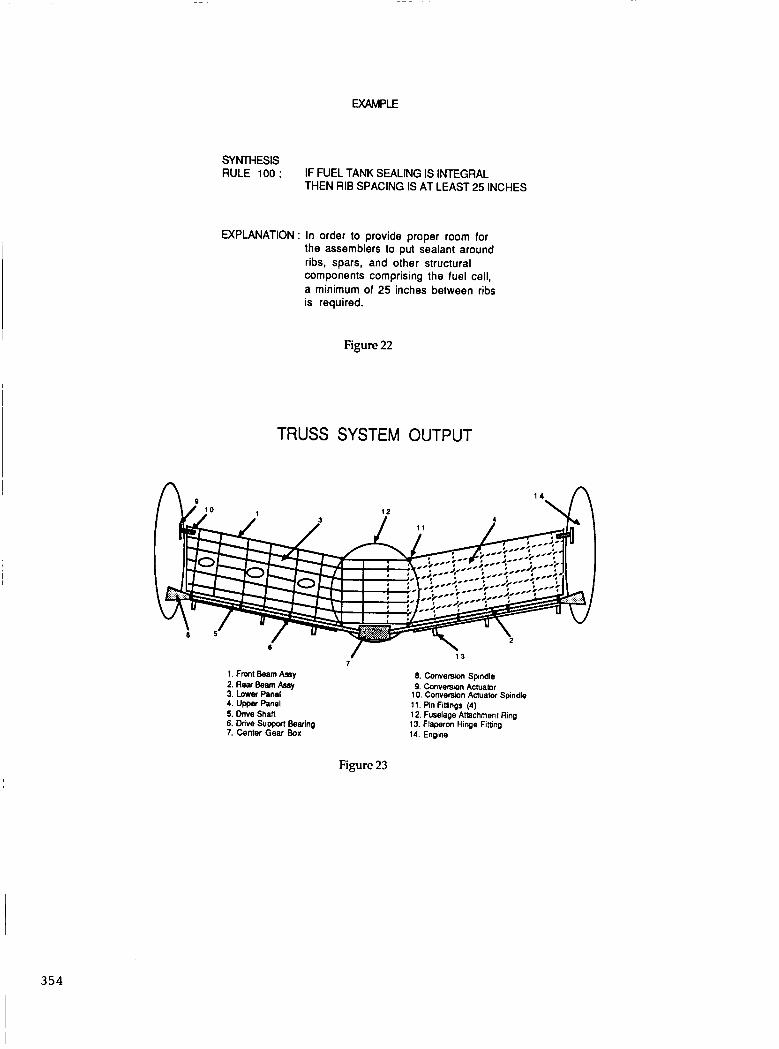
SYNTHESIS RULE 100 : IF FUEL TANK SEALING IS INTEGRAL
THEN RIB SPACING IS AT LEAST 25 INCHES
EXPLANATION: In order to provide proper room for the assemblers to put sealant around ribs, spars, and other structural components comprising the fuel cell, a minimum of 25 inches between ribs is required.
Figure 22
TRUSS SYSTEM OUTPUT
7 1. Fmnt Beam b y
3. Lower Panel 4. Upper Panel 5. Drive Shaft 6. Drive Support Bearing 7. Center Gear Box
2. Rear Beam As5y
1 3
8. Conversron Spindle 9 Conversion Actuabr
10. Conversmn Actuator Spindle 11. Pin Fimngs (4) 12. FuselaOe Attachment Ring 13. Flaperrm Hinge Fildng 14. Engine
Figure 23
354
Summary and Conclusions
This paper has reviewed TRUSS, an integrated design system that incorporates and addresses design issues currently persued by academia, government, and industry. While the program described is quite ambitious, it is the only way the proper focus can be given to this complex integration problem. The program will invoke faculty from several schools, as well as numerous graduate students. Close cooperation with industry is essential to obtain the required knowledge expertise. When the necessary hardware, software, and manpower are in place, significant research progress can rapidly be made in the field of complex systems design.
References
1.
2.
3.
4.
5.
6.
7.
8.
9.
10.
11.
Johnson, V., "Minimizing Life Cycle Cost for Subsonic Commercial Aircraft," AIAA Paper 88402,1988.
Kemp, A., "Effective Integration of Supportability Design Criteria into Computer Aided Design for the Conceptual Design Phase," AIAA Paper 884473,1988.
"Goals and Priorities for Research in Engineering Design, a Report to the Design Research Community," The American Society of Mechanical Engineers, United Engineering Center, 345 East 47th St., New York, NY 10017.
Kroo, I., Takai, M., "A Quasi-Procedural, Knowledge-Based System for Aircraft Design," AIAA Paper 884428,1988.
Britton, C., Jenkinson, W., "A Computer Aided Design System for Airplane Configuration," Computer Applications in Aircraft Design & Operation, Computational Mechanics Publications, Springer-Verlag, Berlin, Heidelberg, New York, London, Paris, Tokyo, 1987.
Staley, S., Anderson, D., "Functional Specification for CAD Databases," Computer-Aided Design Journal, 1986.
Dawson, C., "1993: A Vision of the Design Center," AIAA Paper 884451,1988.
Hedenfels, R., "Integrated, Computer-Aided Design of Aircraft," Aircraft Design Integration & Optimization, Vol. I, AGARD Conference Proceedings No. 147, 1973.
Rouse, W., Boff, K., Svstem Desien, Behavioral Perswctives on Desieners, Tools. & Oreanizations, Elsivier Science Publishing Co., Inc., New York, 1987.
Schrage, D., Bates, P., 'The Configurator and Conceptual Design for Rotary Wing Aircraft," AIAA Paper 87-2891,1987.
Gilmore, J., Ho, D., Howard, C., "GEST - The Generic Expert System Tool," Proceedings of the SPIE Applications of AI 111, Vol. 635,1986.
355
ReabTime Application of Knowledge-Based Systems
Randal W. Brumbaugh PRC System Services
Aerospace Technologies Division
Eugene L. Duke NASA Ames Research Center
Dryden Flight Research Facility Edwards, California
PRECEDING PAGE BLANN NOT FILMED 357
The Rapid Prototyping Facility (RPF): A Real-Time Application of Knowledge-Based Systems.
At the Drydcn Flight Research Facility of thc NASA Amcs Rcscarch Ccntcr, the Aircraft Automation Group is cngagcd in rcscarch airncd at applying expcrt systcms technology in a real-time flight tcst environmcnt . NASA and PRC rcscarchers have developed a facility which a l lows an cxpcrt system prototype to be rapidly and safely demons t r a t ed wi th a tcst a i rc raf t . A p p l i c a t i o n s range from monitoring and d isp lays to outer loop aircraf t c o n t r o l .
This presenta t ion is intended to document the faci l i ty deve lopment and archi tecture , demonstrate i ts utility by presenting a typical application, and detail recent accomplishments and future goals.
358
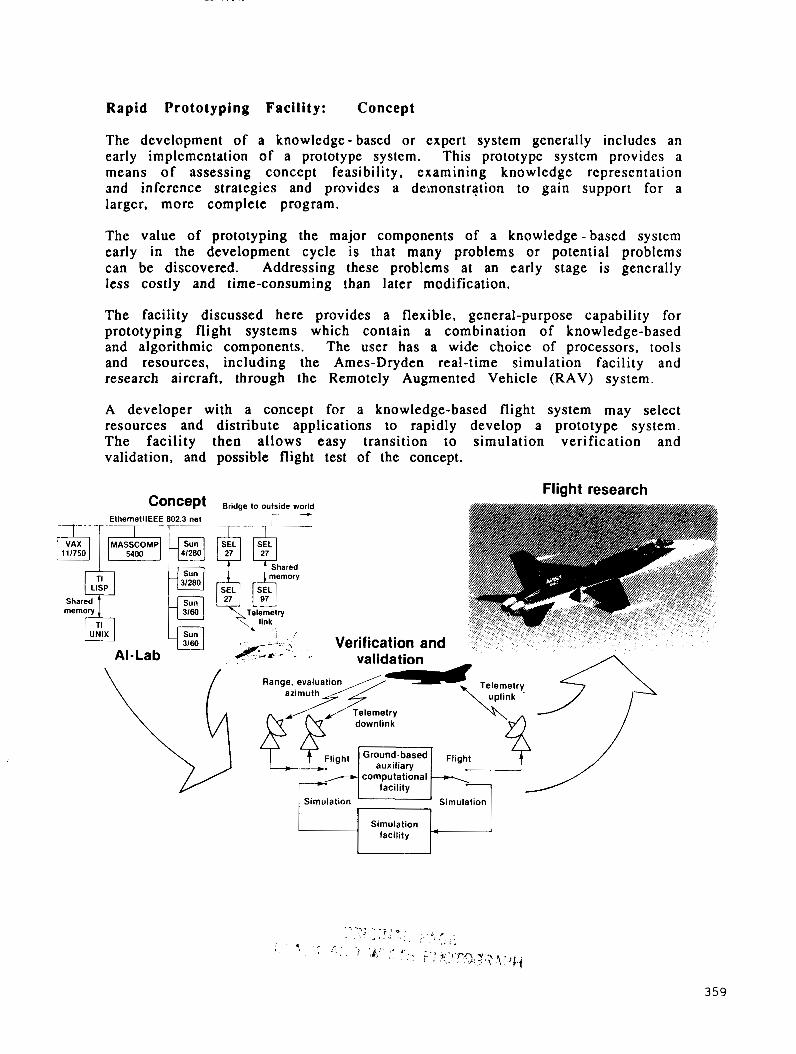
Rapid Prototyping Facility: Concept
Simulation facility
The development of a knowledge- based or cxpcrt system generally includes an early implcmentation of a prototype system. This prototype system providcs a means of assessing concept feasibility, examining knowledge represcntation and inference strategies and provides a demonstration to gain support for a larger, more complete program.
The value of prototyping the major components of a knowledge - based system early in the development cycle is that many problems or potential problems can be discovered. Addressing these problems at an early stage is generally less costly and time-consuming than later modification.
The facility discussed here provides a flexible, general-purpose capability for prototyping flight systems which contain a combination of knowledge-based and algorithmic components. The user has a wide choice of processors, tools and resources, including the Ames-Dryden real-time simulation facility and research aircraft, through the Remotely Augmented Vehicle (RAV) system.
*
A developer with a concept for a knowledge-based flight system may select resources and distribute applications to rapidly develop a prototype system. The facility then allows easy transition to simulation verification and validation, and possible flight test of the concept.
Flight research
359

Components : T h e Remotely Augmented Vehicle (RAV) System
The rapid prototyping facility is an extension of the Amcs-Drydcn RAV syslcm capability. The main elcmcnts of this facility, shown in thc figure, arc
1. A specially modified aircraft 2. An auxiliary computational facility 3. A high fidelity simulator
Each element serves a unique function in providing a path for rapid system transition from simulation to flight. It is this transition capability that provides the power of the facility to a prototype system developer.
The aircraft used requires two main modifications. The first is the addition of sensors and a high quality instrumentation and telemetry downlink system. The second is the integration of a telemetry uplink system into the onboard systems, Uplinked data may be routed to the flight control system for closed loop control, or to an onboard display system if displays are desired. Once so configured, the aircraft requires no further modifications; changes are performed by altering the auxiliary computational facility.
Range, evaluation //- Telemetry azimuth \ uplink
downlink
Ground- based auxiliary
computational facility
Simulation Simulation
Simulation facility
Specially modified aircraft Simulation facility Auxiliary computational facility
- Numeric and symbolic processors -Duptication of flight systems in
simulation facility
360
Components : T h e Remotely Augmented Vehicle (RAV) System
When the telemetry links are operating, the aircraft systems essentially become a node in a distributed processing system which includes a suite of ground based computational facilities. These may include systems for handling TM links, for displaying, recording, or processing data in real-time, o r for performing specialized tasks such as knowledge - based control or monitoring. This allows processors which cannot be physically located onboard the vehicle due to limitations in space, ruggedization or cooling, to act nearly identically to an onboard computer.
As an alternative to the flight system, the aircraft may be replaced by the simulation system. The simulation facility provides modelling of the aircraft so that systems may be verified prior to flight operation. It is a key feature, and a requirement for safety, that the interface between the simulation and the actual aircraft TM links be identical. In this way, a concept tested in the simulator is provided a path to flight test experience (see previous figure).
361

How Fast is "Real Time" ?
Any systcm which must providc a rcsponsc in a givcn t imc intcrval can bc said to be a "real-time" system. Thc lcngth of thc timc interval varics greatly, depcnding on the systcm and application. I t may even differ bctwecn components of a singlc system. A display proccssor will typically havc a slower response criterion than an aircraft flight control system, although both are parts of a larger systcm. Some systcms also have requirements such as a constant frame time, or connection to a regular clock interrupt.
The rapid prototyping facility provides for real-time response at several levels. Interactive systems must provide response at human speeds. Typically this applies to editors, compilers, and display systems. Outer-loop systems provide control of system state trajectory, and inner-loop systems are required for system stability. A trajectory guidance controller is an example of outer- loop control; a flight control system provides inner-loop functions.
The final measure of a real-time system is that it respond "in-time." The developer using the RPF chooses from computing resources and tools with different capabilities. Efficient distribution of processing is key to meeting response time specifications, but redistribution of processes is not difficult.
Real-Time Applications Within Rapid= Prototyping Facility
What does real=time mean? Interactive
Outer-loop systems - Response at human speeds (1.0-0.1 Hz)
- Response required to control system trajectory (25-1 Hz for aerospace systems)
Inner4oop systems - Response required to stabilize dynamic system
(1000-25Hz for aerospace systems) ln-time
- Response provided in time required
Goals for rapid-prototyping facility ln-time responses for tasks up to 25Hz
36 2

F l e x i b i l i t y t h r o u g h S t a n d a r d i z a t i o n
The wide sclcction and flcxibility of thc rcsourccs available in thc RPF is a rcsult of the use of standard intcrfaccs which arc widcly recognized and supported by nearly ail manufacturers. Expanding or altering the nctwork of computers is a quick and simple procedure. The use of standards also providcs access to the resources available to uscrs of the central facility computers, which contain a variety of printers, plotters and disk storage devices.
The computers are linked through a network based on a thick Ethernet/IEEE 802.3 cable. The DOD standard TCP/IP protocol is used throughout for communication. Standard utilities for virtual terminal emulation (telnet) and fi le transfer (ftp) are available to users during development. Executing processes transfer data in single precision IEEE 754 floating point format. Many processors support this format directly; others require a simple conversion routine to change the data to their local floating point format.
Communication Standards in AI-Lab
Process layer ----------- I User data buffers
I IP
I Network
I IEEE 802
ANSlllEEE Standard 7454985 IEEE Standard for Binary Floating Point Arithmetic
Transmission Control Protocol MIL=STD=I 778 Connection Oriented Transport Control Specification
Internet Protocol MIL=STD=1777 Protocol for Providing the Connectionless Mode Network Service
IEEE 802.2 Logical Link Control IEEE 802.3 CSMAlCD Media Access Control Protocol for Bus Topology
363
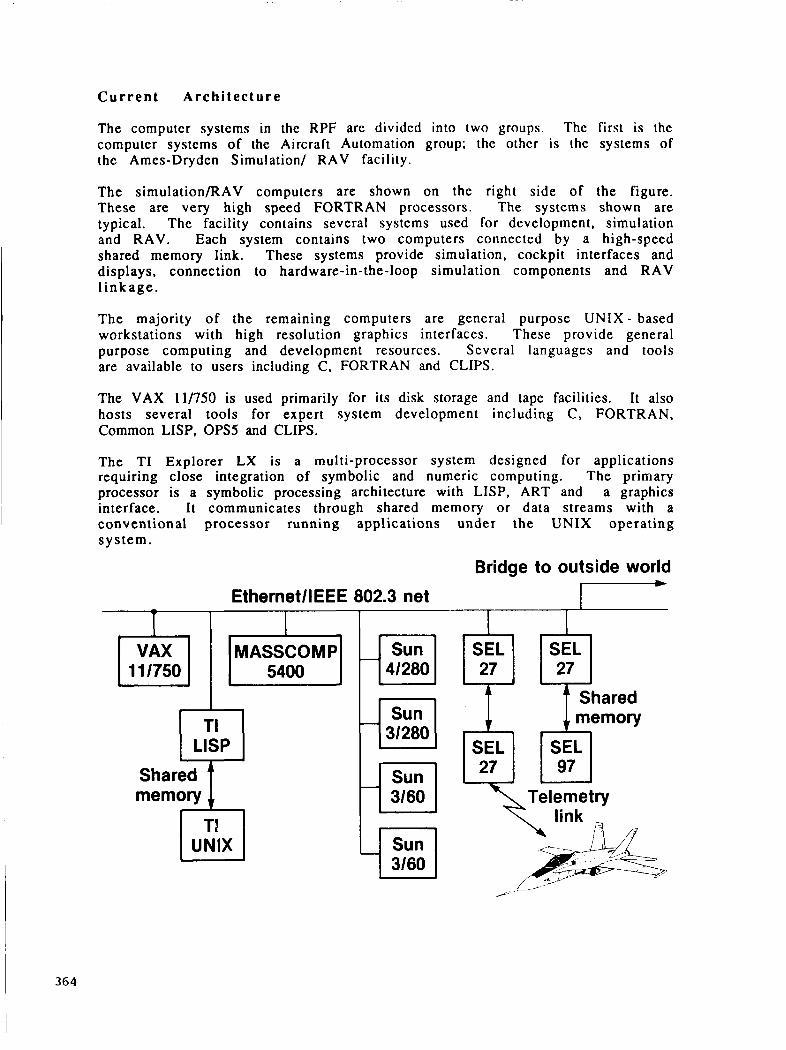
C u r r e n t A r c h i t e c t u r e
The computcr systcms in thc RPF arc dividcd into two groups. Thc first is the computcr systcms of thc Aircraft Automation group; the othcr is the systems of the Ames-Dryden Simulation/ RAV facility.
T h e s imulat ion/RAV computers are shown on the right s ide of the figure. These are very high speed FORTRAN processors. The systems shown are typical. T h e facility contains several systems used for development, simulation and RAV. Each system contains two computers connected by a high-speed shared memory link. These systems provide simulation, cockpit interfaces and displays, connection to hardware-in-the-loop simulation components and RAV l i n k a g e .
T h e majority of the remaining computers are general purpose U N I X - based workstations with high resolution graphics interfaces. These provide general purpose computing and development resources. Several languages and tools are available to users including C, FORTRAN and CLIPS.
The VAX 11/750 is used primarily for its disk storage and tape facilities. It also hosts several tools for expert system development including C, FORTRAN, Common LISP, OPS5 and CLIPS.
T h e TI Explorer LX is a multi-processor system designed for applications requiring close integration of symbolic and numeric computing, T h e primary processor is a symbolic processing architecture with LISP, ART and a graphics interface. It communicates through shared memory o r data s t reams with a conven t iona l processor running appl ica t ions unde r t h e U N I X ope ra t ing s y s t e m .
Bridge to outside world
EthernetllEEE 802.3 net I---+
piil 11 /750
I
[MASSCOM P I 5400
1
Shared memory
SEL SEL 1 2 7 1 1 2 7 1 uu
Shared memory
Telemetry link
I 364
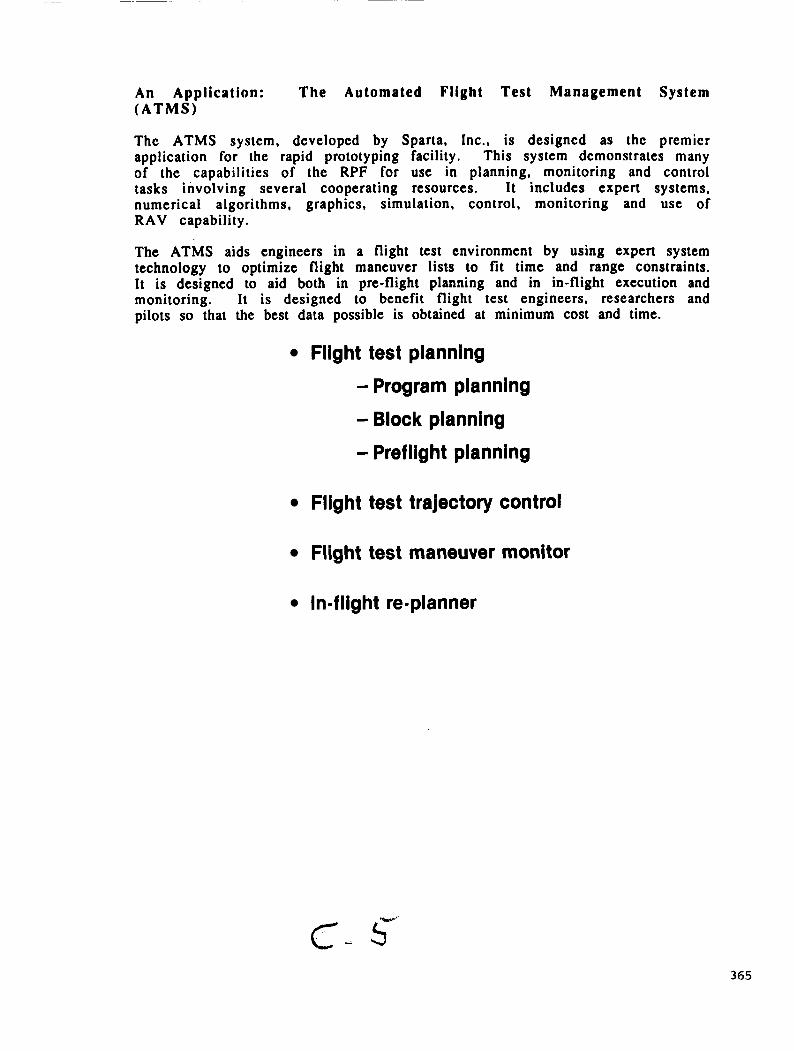
An Applicat ion: T h e Automated Fl ight T e s t Management System ( A T M S )
The ATMS system, developed by Sparta, Inc., is designed as thc premier application for the rapid prototyping facility. This system demonstrates many of the capabilities of the RPF for use in planning, monitoring and control tasks involving several cooperating resources. It includes expert systems, numerical algorithms, graphics, simulation, control, monitoring and use of RAV capability.
The ATMS aids engineers in a flight test environment by using expert system technology to optimize flight maneuver lists to fit time and range constraints. It is designed to aid both in pre-flight planning and in in-flight execution and monitoring. It is designed to benefit flight test engineers, researchers and pilots so that the best data possible is obtained at minimum cost and time.
Flight test planning
- Program planning
- Block planning
- Preflight planning
Flight test trajectory control
Flight test maneuver monitor
In-flight re-planner
365
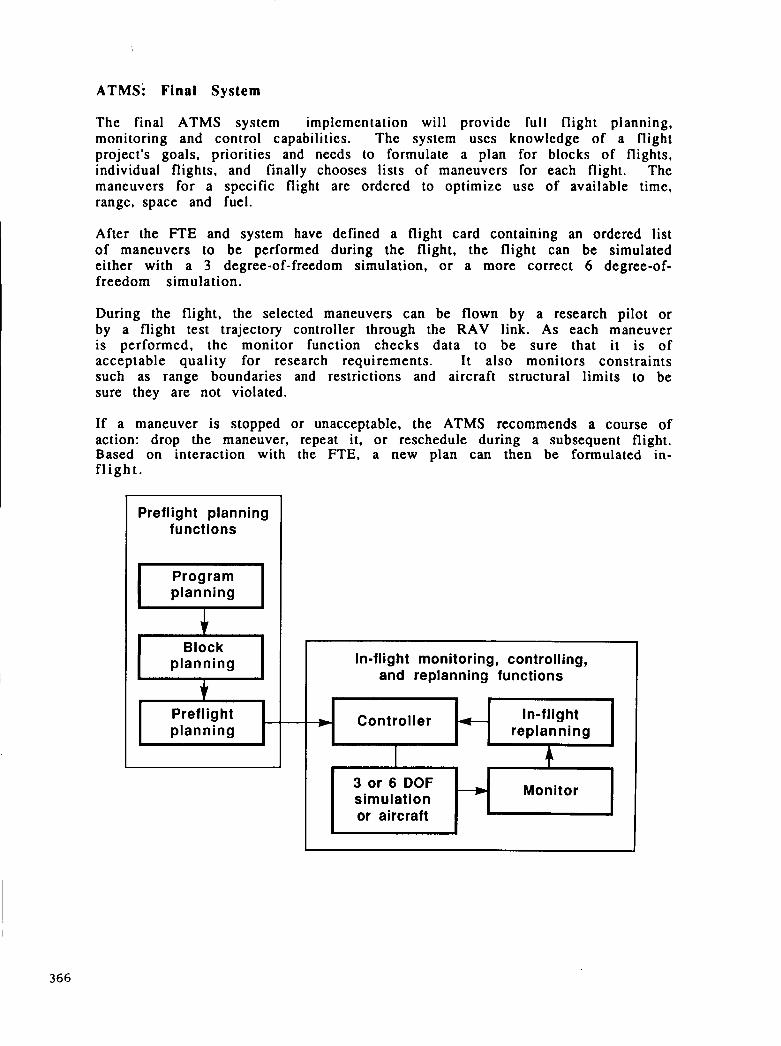
ATMS: Final System
The final ATMS system implementation will provide f u l l flight planning, monitoring and control capabilities. The system USCS knowledge of a flight project's goals, priorities and needs to formulate a plan for blocks of flights, individual flights, and finally chooses lists of maneuvers for each flight. The maneuvers for a specific flight are ordered to optimize use of available time. range, space and fuel.
After the FTE and system have defined a flight card containing an ordered list of maneuvers to be performed during the flight, the flight can be simulated either with a 3 degree-of-freedom simulation, or a more correct 6 degree-of- freedom simulation.
During the flight, the selected maneuvers can be flown by a research pilot or by a flight test trajectory controller through the RAV link. As each maneuver is performed, the monitor function checks data to be sure that i t is of acceptable quality for research requirements. It also monitors constraints such as range boundaries and restrictions and aircraft structural limits to be sure they are not violated.
If a maneuver is stopped or unacceptable, the ATMS recommends a course of action: drop the maneuver, repeat it, or reschedule during a subsequent flight. Based on interaction with the FTE, a new plan can then be formulated in- f l i g h t .
Preflight planning functions
Block planning
Preflight
In-flight monitoring, controlling, and replanning functions --
I I I A
Monitor 3 or 6 DOF simulation or aircraft
366

ATMS: Current Functions
* Preflight planning .
The current ATMS system (Phasc I ) implements a carcfully sclcctcd subsct of the final system design. The parts selected for implementation are designed to demonstrate distribution of processing, real-timc control in a simulation environment, and limited planning and monitoring capability. This system was presented in a demonstration in June, 1988..
Controller
Pref I ig ht planning functions In-flight monitoring, controlling,
and replanning functions
Monitor 3 or 6 DOF simulation
367
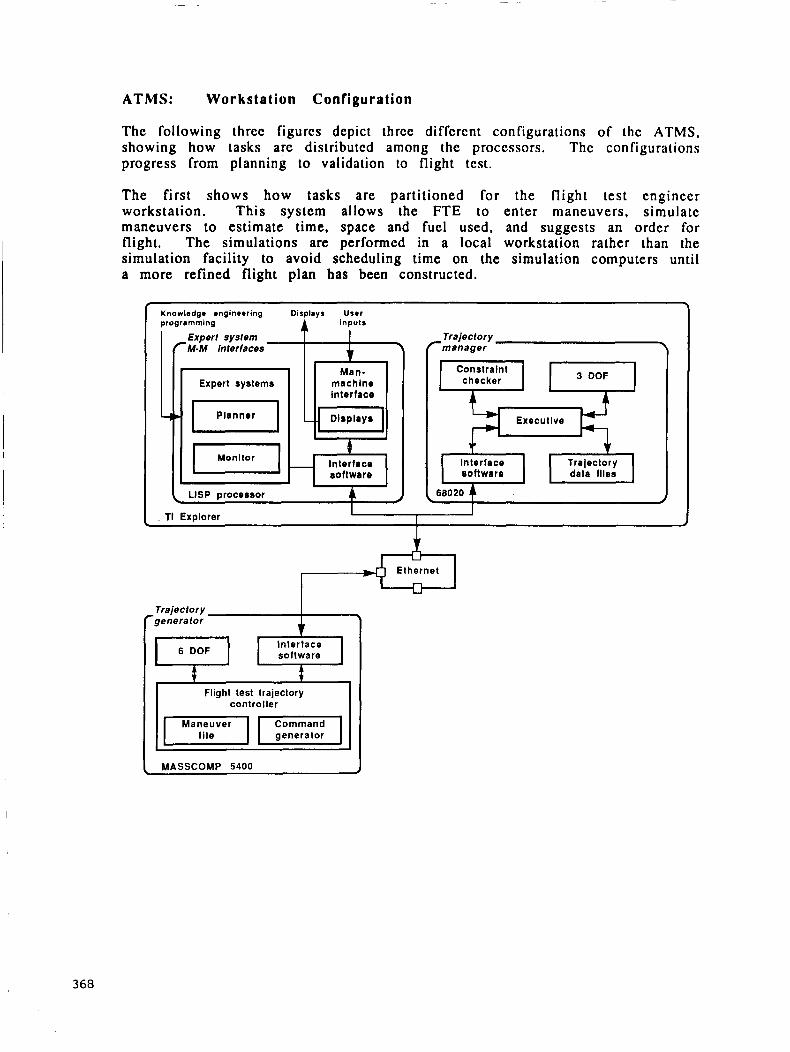
ATMS: Workstation Configuration
Experf sysfem Tralecfory r M-M interfaces \ r m a n a g e r \ f
Man- Expert systems machine checker
Interface
The following thrcc figures depict thrcc diffcrcnt configurations of the ATMS, showing how tasks are distributcd among the proccssors. The configurations progress from planning to validation to flight test.
- 3 . 0 Planner -I Dlsplays
Interface software
Monltor
- n -- LISP processor
The first shows how tasks are partitioned for the flight test engineer workstation. This system allows the FTE to enter maneuvers, simulate maneuvers to estimate time, space and fuel used, and suggests an order for flight. The simulations are performed in a local workstation rather than the simulation facility to avoid scheduling time on the simulation computers until a more refined flight plan has been constructed.
I I
Flight test trajectory controller
generator
MASSCOMP 5400 I
368
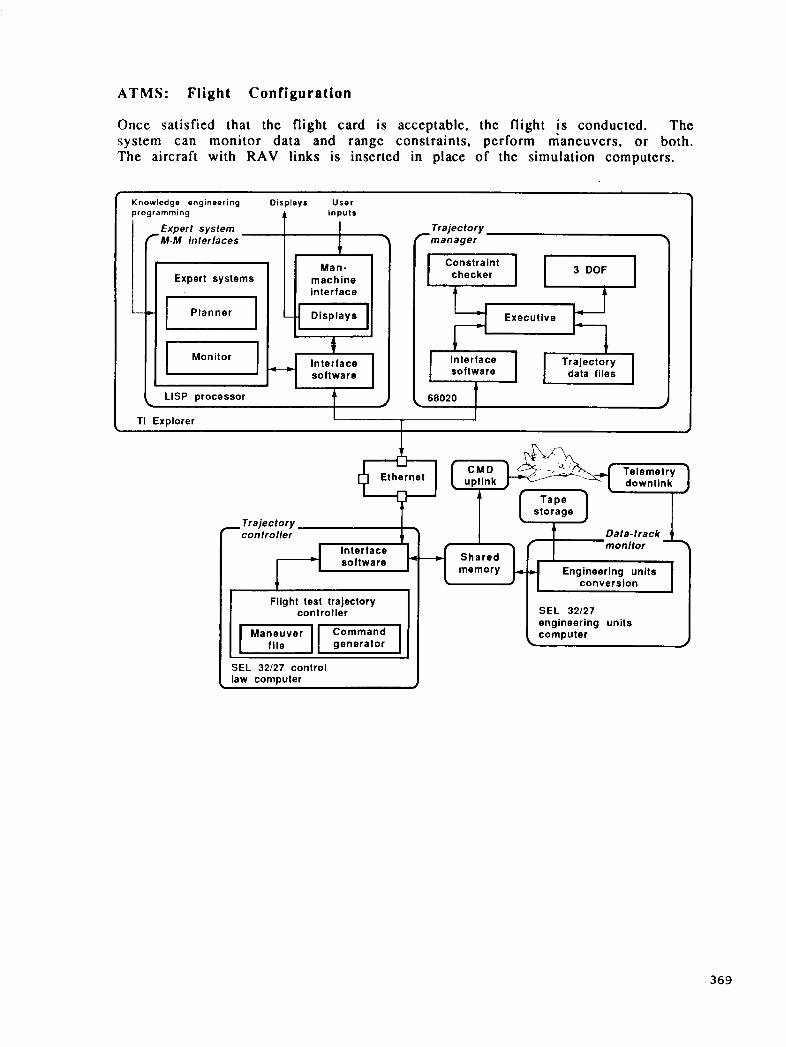
ATMS: Flight Configuration
Once satisfied that the flight card is acccptablc. the flight is conducted. The system can monitor data and rangc constraints. perform maneuvers. or both. The aircraft with RAV links is inscrtcd in place o f the simulation computers.
Knowledge engineering Displays User programming A inputs 1 fExpert system
M-M interlaces
Expert systems interface
Displays
1Ih-zk-l interface
LISP processor t
Tra jecfory r m a n a g e r -1
I I
Interface software
I J TI Explorer r
- Trajectory controller
I Flight test trajectory con t ro I ler
I Ma);zver
SEL 32/27 control law computer
1 1 G m ~ m a n d 1 generator
I I storage I I I 1
Data-track monitor
Shared memory Engineering units
conversion
SEL 32/27 engineering units I computer
369
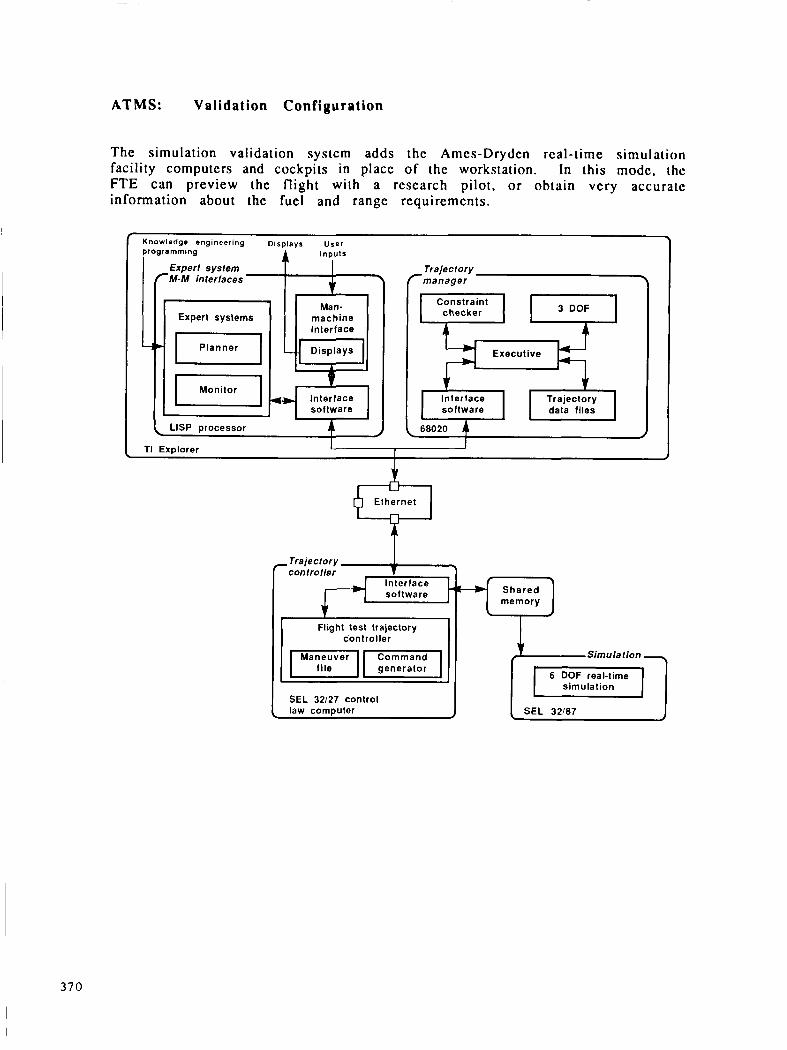
ATMS: Validation Configuration
T h e s imulat ion validation systcm a d d s thc Amcs-Dryden real- t ime s imula t ion facility computcrs and cockpi ts in place o f the workstation. In this modc, the FTE can preview the f l ight with a research pilot , o r ob ta in very accura te information about the fuel and range requirements .
Knowledge engineering DisDlavr User
programming inputs
Expert system M-M interlaces
I Expert systems machine
software
LISP processor f J
L Trajectory manager
Constraint y ‘““;I Executive F=?i
Interface Trajectory data files
68020
TI Explorer 1 I I
U
Ethernet
Trajectory controller
Interface
I I Flight test trajectory
controller
generator
SEL 32/27 control law comtwter
Shared
simulation
370
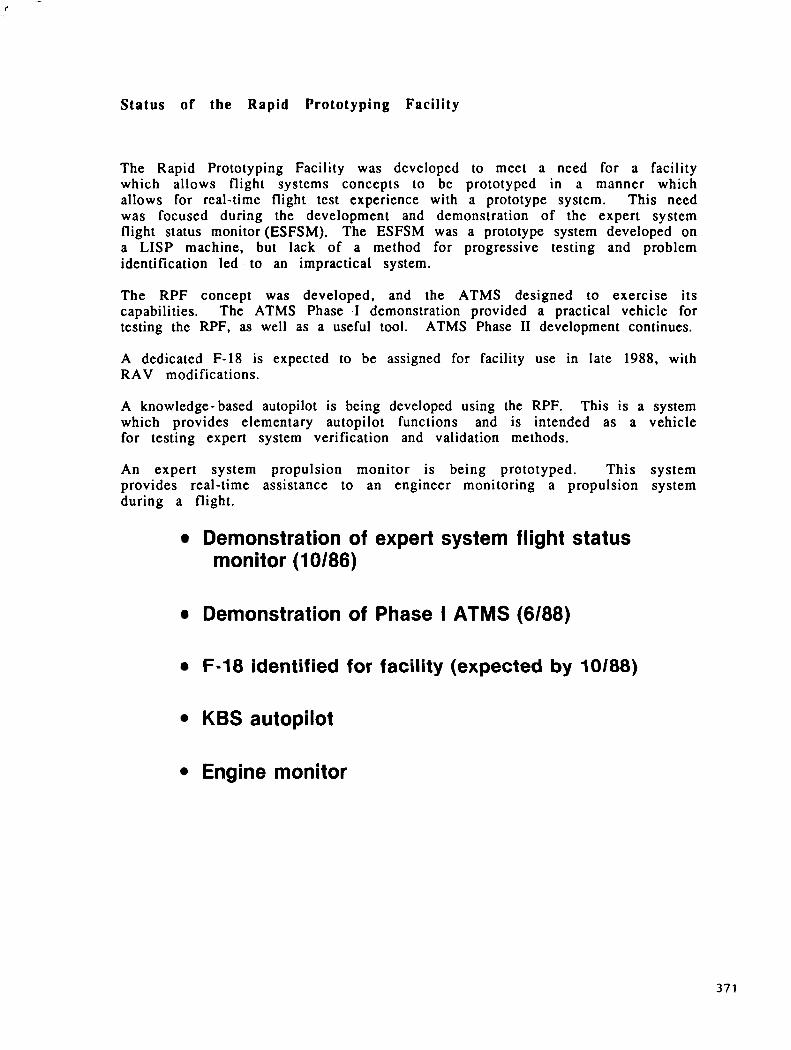
S t a t u s of t h e Rapid Prototyping Faci l i ty
The Rapid Prototyping Facility was dcvcloped to meet a nced for a facility which allows flight systcms concepts to be prototyped in a manner which allows for real-time flight test experience with a prototype systcm. This need was focused during the development and demonstration of the expert system flight status monitor(ESFSM). The ESFSM was a prototype system developed on a LISP machine, but lack of a method for progressive testing and problem identification led to an impractical system.
The RPF concept was developed, and the ATMS designed to exercise its capabilities. The ATMS Phase -1 demonstration provided a practical vehicle for testing the RPF, as well as a useful tool. ATMS Phase I1 development continues,
A dedicated F-18 is expected to be assigned for facility use in late 1988, with RAV modifications.
A knowledge-based autopilot is being developed using the RPF. This is a system which provides elementary autopilot functions and is intended as a vehicle for testing expert system verification and validation methods.
An expert system propulsion monitor is being prototyped. This system provides real-time assistance to an engineer monitoring a propulsion system during a flight.
Demonstration of expert system flight status monitor (10186)
Demonstration of Phase I ATMS (6/88)
F-18 identified for facility (expected by 10188)
KBS autopilot
Engine monitor
371
N89-25164 a .
THE DESIGNER OF THE 90's: A LIVE DEMONSTRATION
Tommy L. Green Bas i l M . Jordan, Jr.
Timothy L. Oglesby
LTV Aircraft Products Group Military Aircraft Divis ion
PRECEDING PAGE BLANK NOT FILM€D 373

THE DESIGNER OF THE 90's: A LIVE DEMONSTRATION
A LOOK BACK
Whenever we attempt t o look forward t o anticipate changes that need t o be made, we must f i r s t look back t o see where we have been, for our experience, our history, and our culture should, and does, affect our vision of t h e future. and it is wi th t h i s principle i n mind tha t we take a few brief moments t o look backward t o see what we have learned that can be applied t o t h e future.
When Orville Wright climbed in to the seat of h i s power driven, heavier than a i r machine on tha t fa te fu l day i n December of 1903 a t K i t t y Hawk, North Carolina, he represented t h e ultimate i n intimate involvement i n the design process. The Wrights conceived t h e design; they worked out t h e de ta i l s of the design; they analyzed the design both s t ructural ly and aerodynamically; they determined how t h e design could be bui l t ; they tes ted the design; and they ultimately flew the design. They knew a l l there was t o know about that machine.
With t ha t beginning, t h e era of f l igh t began, and yet the knowledge required t o f l y had only been scratched. I n a larger sense, tha t f l igh t began an era of aerodynamic reason and understanding that probably reached its zen i th i n t h e l a t e 40,s and early 50's. no one person could learn it a l l . a t such a rapid pace that the average engineer had t o begin specializing i n par t icular discipl ines so that he could remain cognizant i n a t l eas t some part of the industry. A s a result, aerospace engineering organizations were
This was both required and r ight . The 1950's brought wi th it a new innovation that made even more
sophisticated analyses possible. opportunities t o analyze configurations and structures previously thought impractical. was created: t h e Engineer/Progranrmer. The too l became a technology i n i tself , and t h e Engineer/Programmer developed large, complicated analysis systems capable of analyzing structures of almost any complexity, limited only by "cpu power." themselves bred another special is t , t h e applications user, who made it his fu l l - t ime job t o understand and execute these mammoth systems. This, too, was required and r ight .
Certainly, t h i s principle applies i n t h e area of aerospace design,
There was so much t o be learned that Theoretical understanding was progressing
I developed tha t recognized that need, and the aerospace spqcial is t was born. I
The advent of the computer opened up
With it, the need for a new, more highly specialized engineer
These systems developed by the Engineer/Programer i n
HERE WE ARE
The 1960,s and 1970's continued t h i s trend of increased specialization as computer power and affordabili ty dramatically increased so tha t today we are an aerospace engineering society that for t h e most part i s made up of individuals who are experts i n localized disciplines. significant numbers of design engineers who can embody a l l t h e disciplines into a single design. solution techniques are rapidly making the young engineer ignorant of very worthwhile "back-of-the-envelope" solutions. Furthermore, engineers i n general a re becoming insecure of a l l but the m o s t sophisticated solutions.
numbers of functional special is ts are staggering: conceptual designers,
What we lack are
As ii Tatter of fact , t h e highly sophisticated computer
The ramifications of such a ' s i t ua t ion are significant. F i r s t of a l l , t h e
374
detail designers, stress analysts, fatigue analysts, aeroelasticians, dynamicists, mass properties engineers, materials and property experts, vibroacousticians, aerodynamicists, propulsion analysts, reliability experts, maintainability experts, producibility engineera, static test engineers, dynamic test engineers, flight test engineers, ad infinitum. That in itself ie not necessarily bad, but in the design process as it is practiced in most aerospace companies today, the designer upon completion of his concept will shuffle out the design to all the different disciplines for them to weave their magic. What comes back to him is a series of u s u a l l y l a te , c o n f l i c t i n g requirements that puts the designer into the mode of iterating the requirements between the different disciplines to come out with a design that meets everyone 's requirements . Unfor tuna te ly t h e requirements of some f u n c t i o n a l d i s c i p l i n e s are n o t inc luded s i n c e members of those teams are i n such s h o r t supply t h e y cannot cover a l l t h e bases. when e v e r y t h i n g is working perfectly, however, t h e system is t e d i o u s ; t i m e consumption is odious; and t h e d e s i g n is h a r d l y i n t e g r a t e d . Furthermore, t h e d e s i g n may be unproducible.
A LOOK AHEAD
Somehow, a less costly and higher quality design must be produced that encompasses all aspects of design including producibility. Producibility is singled out here because historically design engineering has emphasized configuring and sizing the aircraft so that it can meet its defined mission. How-it will be built is someone else's problem. in the system. In addition, the other "ilities", ie., reliability and maintainability, must have their proper places in the initial phases of the design. And finally, the iteration time with all the different disciplines must be drastically ?educed.
We have decided in the Military Aircraft Division of LW Aircraft Products Group that to solve this problem, we must return more responsibility to the designer. responsibility to design in the different disciplines himself without having to depend on analysts to do it for him. specialists who work in the role of facilitator, consultant, and final analysis and checkoff.
knowledge to at least preliminarily include all the design considerations in the design. In large measure, the only limitations to his ability to finally design in the different disciplines might be final definition of loads as defined by the customer. perform major analyses such as finite elements , for example
Finally, we expect significant cost reductions using this approach, and we must provide a mechanism by which we can ensure that the improvements are reflected in the bids to the customer. t h e to further "fine tune" our design. tools that automatically include the productivity improvements that are provided.
We see this as a serious flaw
That is, we want the designer to have the ability and the
We want the analysts to act as
In short, the designer will become the integration specialist with enough
On the other hand, he will not be expected to
Otherwise, we will use the additional Therefore, we must provide estimating
375
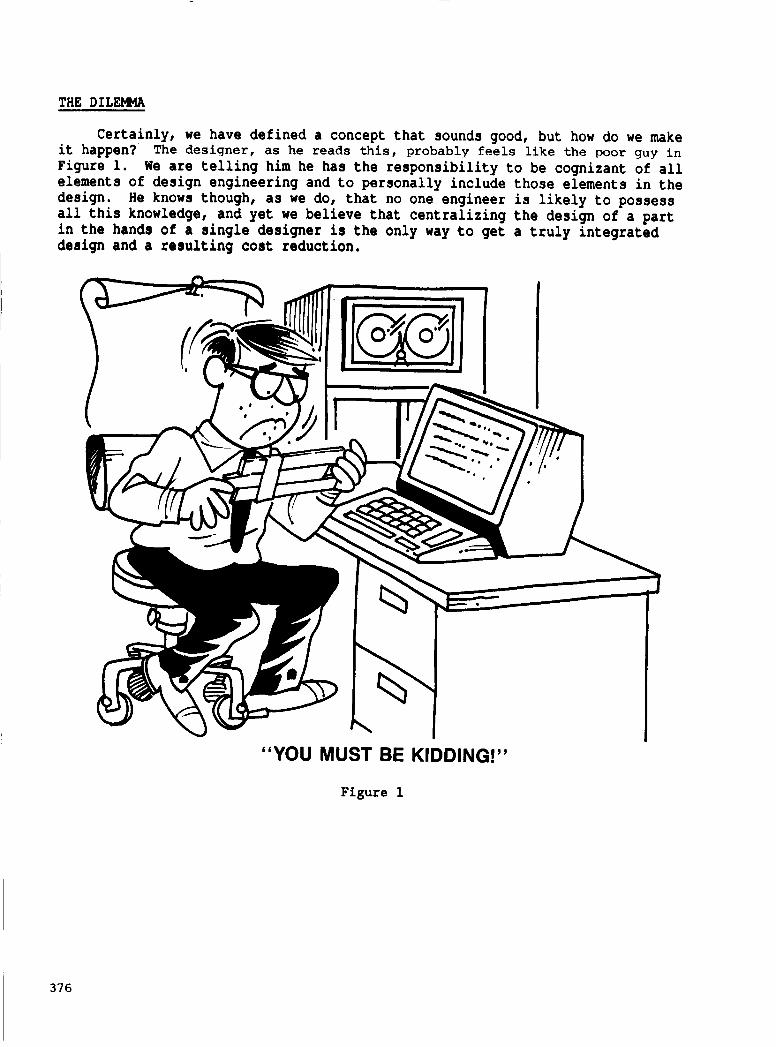
THE DILEMMA
Certainly, we have defined a concept that sounds good, but how do we make it happen? The desiqner, as he reads this, probably feels l i k e the poor guy in Figure 1. We are telling him he has the responsibility to be cognizant of all elements of design engineering and to personally include those elements in the design. He knows though, as we do, that no one engineer is likely to possess all this knowledge, and yet we believe that centralizing the design of a part in the hands of a single designer is the only way to get a truly integrated design and a resulting cost reduction.
“YOU MUST BE KIDDING!”
Figure 1
I 376
THE SOLUTION
The expert knowledge provided to him by individuals in the past must now be provided to him automatedly at his design work station as tools that he can use when he needs them. These tools must be computerized and must be provided in terminology that he can understand. provided to him using terminology that the specialist uses but instead must be provided to him using terminology that he uses. convenient to use, and they must be integrated with his own design tools.
The expert system programing languages available now on the market provide us the opportunity to accomplish these goals. these languages to capture the knowledge of our experts and, in turn, to provide that knowledge in an easy to understand way to our designers. way, we are capturing the thought processes of our experts and are coupling those thought processes with appropriate analysis tools so that the designer always has immediate access to the expert. Furthermore, our Engineering memory will never be lost as we shall always be updating these expert systems
Realizing that multiple expert systems will be required for the designer
Specifically, they must not be
The tools must be easy and
At L W we are using
In this
as d e s i g n techniques change. This , by t h e way, becomes one of the main r e s p o n s i b i l i t i e s of t he spec ia l i s t i n t h i s new des ign environment.
to have access for all the different disciplines, we want to share data between those systems. This drives us, of course, to integrated data bases, and the development of those data bases becomes an integral part of the overall system. Furthermore, the different expert systems will be providing conflicting data requirements to the d e s i g n e r , thereby n e c e s s i t a t i n g t h e need for an expert manager who w i l l h e l p him n e g o t i a t e t h e c o n f l i c t s . This is shown schematically in Figure 2 and represents probably our biggest challenge.
Finally, these tools must be brought to the designer in an easy-to-access manner that will encourage him to use them. means that the same graphics terminal must be capable of delivering both the design tools and the design graphics. In addition, the terminal should be capable of accessing multiple computers simultaneously since the tools might be resident on a different machine than the design graphics machine.
In our way of thinking, this
377
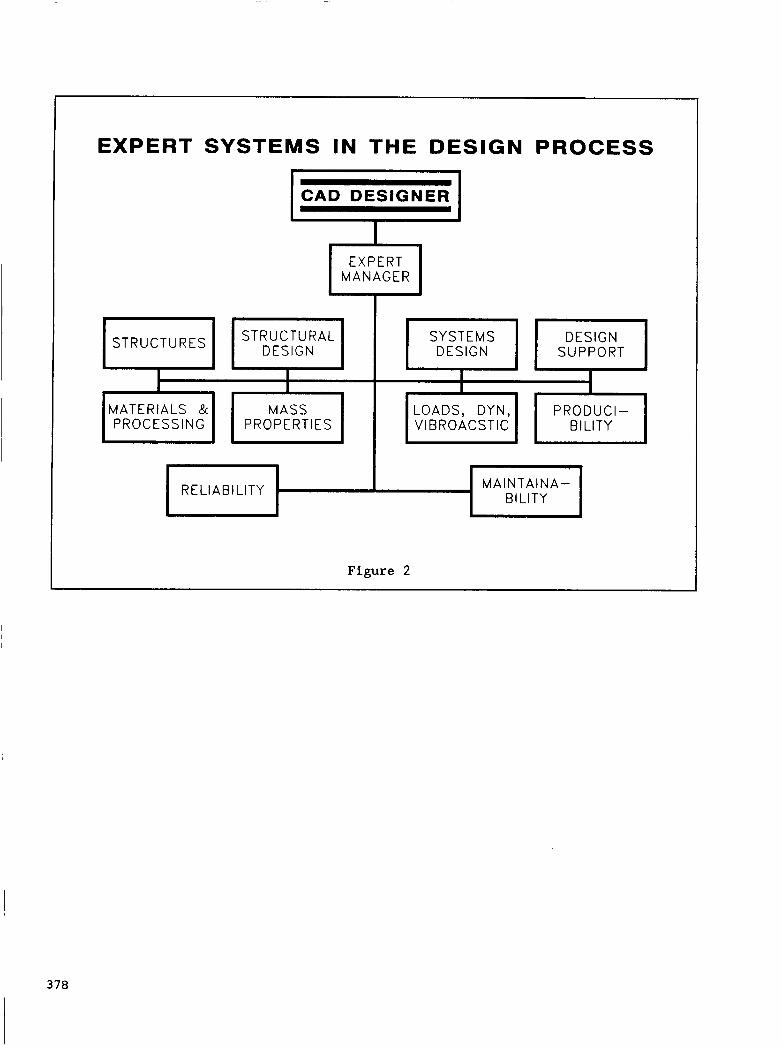
EXPERT SYSTEMS IN THE DESIGN
I I I
MATERIALS & MASS PROCESSING PROPERTIES
PROCESS
I I
LOADS, DYN, PRODUCI- VI BROACSTIC BlLlTY
I I CAD DESIGNER
Figure 2
378
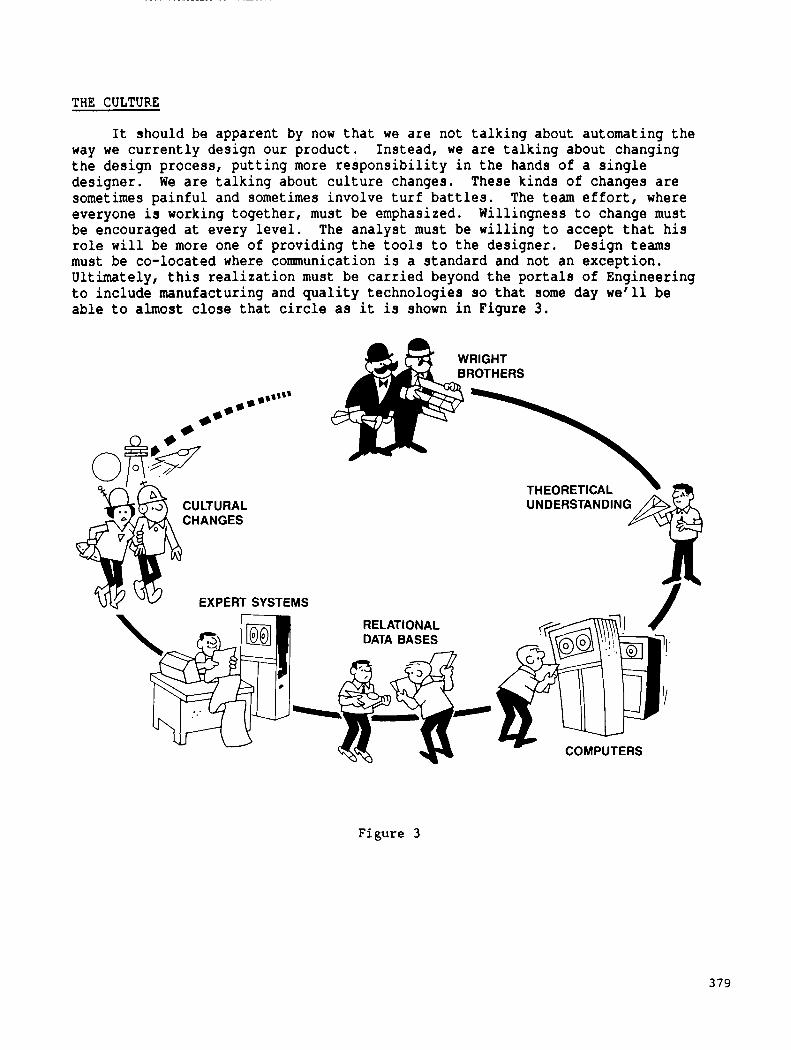
THE CULTURE
It should be apparent by now that we are not talking about automating the way we currently design our product. the design process, putting more responsibility in the hands of a single designer. sometimes painful and sometimes involve turf battles. everyone is working together, must be emphasized. be encouraged at every level. role will be more one of providing the tools to the designer. must be co-located where communication is a standard and not an exception. Ultimately, this realization must be carried beyond the portals of Engineering to include manufacturing and quality technologies so that some day we'll be able to almost close that circle as it is shown in Figure 3 .
Instead, we are talking about changing
These kinds of changes are We are talking about culture changes. The team effort, where
Willingness to change must The analyst must be willing to accept that his
Design teams
EXPERT SYSTEMS
CULTURAL CHANGES
EXPERT SYSTEMS
UNDERSTANDING THEORETICAL
RELATIONAL DATA BASES
Figure 3
379

THE LTV AIRCRAFT PRODUCTS GROUP EXPERIENCE
The remainder of t h i s paper de ta i l s our experiences i n developing the tools t o meet the goals previously described. We s ta r ted from scratch w i t h a new o r g a n i z a t i o n , Computer I n t e g r a t e d E n g i n e e r i n g ( C I E ) , i n April of 1986, and we obviously have a long way t o go. We believe, however, we have glimpsed the future, and t h i s paper i s our f i rs t attempt t o share that w i t h the rest of the industry . The Medium
The design too ls that we are currently constructing are targeted t o be ut i l ized by t h e designer concurrently w i t h the design graphics environment. As a resul t , we had t o find a way t o deliver tools t o a s s i s t the design process a t the design graphics workstation. One assumption we made i s tha t Engineering w i l l continue for the next several years t o use IBM mainframe based design graphics packages u n t i l graphics workstations themselves become powerful enough and software mature enough t o perform design graphics tasks locally i n a cost effect ive manner. This seems reasonable since most major aerospace companies currently use IBM mainframe based design graphics packages for production work. CADAM, marketed by CADAM I n c o r p o r a t e d , and WAD/NCAL, which i s a proprietary product of the Northrop C o r p o r a t i o n , are t h e des ign graphics software packages currently i n production usage by LTV APG Engineering for 2-D drafting and 3-D r e s p e c t i v e l y .
The f irst approach we investigated as a solution t o the problem of simultaneously delivering C I E tools and design graphics was tha t of u t i l i z ing the IBM 5080 equivalent graphics terminal which i s the normal device used t o display t h e design graphics. We hoped that t h i s terminal could concurrently display t h e C I E too ls wi th the design graphics. text window i s supported on the IBM 5080 i n addition t o the high performance g r a p h i c s capabili ty u t i l i zed by t h e design graphics, access t o the graphics capabili ty of t h e 5080 device i s restr ic ted t o a single software package a t a time. conclusion w a s t h a t t h e IRM 5080 e q u i v a l e n t t e r m i n a l i t s e l f c o u l d be used o n l y i f the design graphics package was exited, the C I E too l was executed t o completion, and t h e design graphics package was re-entered. as an unacceptable limit on the interact ivi ty between t h e design graphics and the C I E tools .
independent graphics terminal for execution of C I E tools . the designer w i t h two independent graphics display screens and two separate keyboards for entry in to each system. undesirable due t o t h e loss of integration between t h e design graphics and the tools . physical space, but i s much more d i f f i cu l t for t h e designer t o operate than a single screen and keyboard functioning i n an integrated environment.
A t h i r d approach investigated was ut i l izat ion of an engineering workstation tha t could emulate an IBM 5080 graphics terminal i n software. T h i s approach has the added advantage that workstations have powerful windowing tools tha t allow for the development of systems w i t h extremely responsive user interfaces. market; however, they a l l have the common problem tha t software emulation of an IBM 5080 is a compute intensive task which typical ly cannot be performed even half as f a s t a s a hardware implementation without an unreasonably high
Although a simultaneous 3270
Virtually a l l our tools require graphics display capabili ty. The f ina l
Th i s was deemed
Another approach we considered was the provision of each designer wi th an Th i s would provide
This approach was deemed highly
Providing separate screens and keyboards not only consumes extra
There are several such products currently on the
380
investment in the workstation platform. productivity of the designer, provision of a slower design graphics terminal is hardly progress.
IBM 5080 equivalent graphics terminal and a workstation. At the time we originally discovered it, this product, called a CommSet 1080, was still under development as a joint effort by Spectragraphics Corporation and Digital Equipment Corporation (DEC). We obtained an evaluation machine and tested it with great success, This product consists of a standard DEC Color VAXstation 2000 and a standard Spectragraphics 1080GX. DEC VAX computers are already in use in many places within LTV. The VAXstation 2000 has the capability to run, within the constraints of VT220 or Tektronix 4014 termha1 emulation, any software developed for any VAX computer within LTV without modification. The other half of the ComnSet 1080 product is the Spectragraphics 108OGX. device was already in use in several locations within LTV as an IBM 5080-002A equivalent terminal, The ComnSet 1080 provides the user with a complete engineering workstation which can simultaneously display and use information from several different sources. graphics terminal session utilizing the IBM 5080 equivalent capability implemented in hardware by Spectragraphics. the designer allows the majority of the CIE tools to run locally on the workstation, providing e x c e l l e n t response t i m e to the des igner . of each workstation is roughly equivalent to that of a DEC VAX 111780. the workstation is directly connected to the network, it can easily exchange information with or provide terminal sessions to host VAX systems or IBM mainframes. vendor evaluation equipment to implement a preliminary sizing application developed for Structural Design. has allowed the designer exactly the desired capability to simultaneously display and manipulate information from the design as well as from CIE tools that can be run locally on the workstation. possible to provide a full performance IBM 5080 equivalent graphics terminal in a workstation windowing environment.
We have concluded, there fore , that the requirements w e had for d e l i v e r i n g the tools to the designer can be met. requirements, and we are sure that more vendors will be entering this market. In the environment we have defined, simultaneous accessibility to multiple software applications on multiple hardware platforms is an absolute must, and the technology is now available to support that need.
Since our goal is to increase the
A unique product was found that combines a hardware implementation of an
This
One window on the Workstation can be a design
Provision of a workstation for
The CPU power Since
We demonstrated the feasibility of this approach utilizing the
The windowing capability of the workstation
The CommSet 1080 makes it
Currently, the ConmrSet 1080 meets those
The Tools
Having defined a philosophy and identified a medium to implement that philosophy, all that remains is to present those tools we are currently developing for the designer. The intent of all these tools is to give the designer the capability to perfom more of the design himself and to design in from the beginning reliability, maintainability, and producibility considerations.
is software designed to provide him with the capability to draw. theory of design is left to the designer's experience and intuition. though some graphics software offers application and analysis programs to assist the designer with his tasks, these programs are usually benign in that they offer virtually no instruction or reasoning as to their use or
The principle tool used by the designer in the development of "drawings" Hence, the
Even
38 1
application. The tools being developed are designed t o a s s i s t the designer i n making
the correct decision for a given set of circumstances. A very large portion of the time used t o develop a piece of software i s devoted t o being certain the user interface i s understandable by the user. I n most of our cases, when an analysis or application is accessed by the designer, the logic for i ts use i s part of t h e program. A l l software applying the "expert system" technology
tha t par t icular solution. logical or heurist ic, are provided as a matter of course. under development are summarized as follows.
PRELIMINARY SIZING: This ser ies of programs o f f e r s p r e l i m i n a r y s i z i n g based on Tension-field and Shear res is tant analysis of beams w i t h f l a t shear webs, lug s t r e s s analysis, and joint loads analysis. p r e l i m i n a r y is used to d e s c r i b e t h e a n a l y s i s , t h e methodoloqy i s as valid as the loads tha t are being supplied. analysis procedure is applied wi th in LTV, but for the most part i s an exact par i ty of procedures described i n numerous sources. However, instead of providing t h e designer w i t h raw code, t h e program i s prefaced wi th a description of the code, a definit ion by question and answer sessions t o assure understanding, and an exclamation of the output.
Physical and mechanical data are assembled as common reference for any program tha t might require materials type information. Our materials data base has been limited t o those materials most commonly used by our organization. Those include aluminums: 2xxx series, 5xxx ser ies for cryogenics, 6xxx series for welding, and several 7xxx ser ies for s t ruc tura l applications; titaniums, Ti6-4 and Ti10-2-3; steels t o include s ta inless , high nickel, and inconel; composites t o include fiberglass, kevlar, graphite, bismaldeide, and polyimide. Mechanical data for composites such as areal weight, resin content, density, and f iber volumes are readily available t o the user be they a peram doing a query or a program seeking specific information. Similar types of data a re stored for metals such tha t rapid accurate access i s possible. applicable material and/or process specifications cross-referenced t o LTV specifications, the Military specifications, and the vendor specifications. The intent of t h i s software i s t o supply needed data t o the users i n a very timely manner, but just as important is t h e need t o provide the same
principle intent i s assurance that the par t being referenced by t h e designer i s a part tha t i s a standard (whenever possible) for our company. Our data base t h u s f a r i s limited t o fasteners, simple f i t t i ngs , and simple brackets.
For instance, querying a base for a l l fasteners t ha t have hex heads would produce several hundred types (which i s i n most cases unacceptable t o the user); on t h e other hand, i f t he query said "give me a l is t of a l l fasteners that have HEX heads, have SHEAR strengths greater than 6000 lbs, but l e s s than 7000 lbs, must be workable i n a 900 deg. F environment", then the l is t would be greatly reduced, and a selection could be eas i ly made that would st i l l be from a l is t of standard parts. design and manufacturing act ivi ty costs.
approach i s used t o select fasteners t o be used for metal t o metal, metal t o composite, or composite t o composite mechanically fastened joints.
I
provides , as an i n t e g r a l p a r t of t h e code, t h e set of r u l e s r e q u i r e d to o b t a i n I n addition, the source of a l l rules, be they
Tools currently
Even though the term
The program emulates the way i n which the
MATERIALS DATA BASE:
I
Other a t t r i bu te s of t h e data include the
I information t o a l l users; i .e., standardization. I
I STANDARDS PARTS DATA BASE: Similar t o the MATERIALS DATA BASE, the
I The key t o the base i s establishing t h e c a l l s t ha t w i l l make the part unique.
Using standard par ts obviously reduces both
RELIABILITY EXPERT SYSTEM: An expert system using the backward chaining
38 2

Fasteners as related t o s t ructural r e l i a b i l i t y , account €or about 60% of the a i r c ra f t s t ruc tura l maintenance items. The software uses a commercially available expert system shel l , a re la t ional data base, and an internally developed knowledge base (about 250 ru les ) , the l a t t e r being unique t o LTV. T h i s system when applied w i l l eliminate most of the problems associated wi th improper selection of fasteners. fasteners include: type of joint-single or double shear; fastener configuration-single or m u l t i row; application-safety of f l igh t , primary or secondary structure; location on vehicle-internal, i n ducts, on the surface, f u e l ce l l s ; type of installation-wet or dry, blind or open.; acoustic environment and others as would apply t o the successful selection of fasteners. knowledge base of our company and the industry a t a point i n the design process when it is most needed. re ta in t h e knowledge that much more experienced personnel have observed. these more experienced personnel r e t i r e or are promoted in to managerial positions, t h e i r knowledge i s retained.
MAINTAINABILITY EXPERT SYSTEM: MAINTAINABILITY i s primarily interested i n the time required t o remove, repair, and replace a particular item. on t h e f ina l configuration of the vehicle and, as a result , t he i r a b i l i t y t o assess t h e maintenance factors only occurs near the end of the design phase, However, many examples, specifications, and requirements ex is t i n journals, design handbooks, and technical orders. The challenge for the maintainability engineer i s t o move that information t o the designer a t a stage when the design can effect ively be changed and i n a form that i s useful t o the designer. This expert system through a series of ca l l s and a combination of question and answer sessions allows t h e designer, using the Hypertext technique, t o "leaf" through large volumes of information and find the b i t of information tha t i s specifically applicable t o h i s component.
consideration i n any design, t h i s module, CAPES, i s one of the more important tools available t o the designer. The concept employed i s t o provide t h e designer with t h e capabili ty of choosing the leas t expensive method of manufacturing a particular part; i . e . , should the part be a forging, bar, extrusion, plate, or composite. Each selection i s dependent on the available manufacturing equipment, t h e ava i lab i l i ty of material, type of material, and i f the par t i s a standard. constantly upgraded t o ref lect new manufacturing techniques and processes. Our ultimate goal i n developing t h i s par t icular application i s t o elevate manufacturing design considerations t o t h e same level as configuration design considerations.
technology tha t his tor ical ly i s best performed by an expert i n the f ie ld . The acoustics expert system attempts t o capture the knowledge tha t has been stored by t h e expert and present that knowledge i n an easy-to-understand manner t o the designer. In t h i s system, basic s t ruc tura l elements such as st iffened beams (metal or non-metal) or sandwich panels subjected t o noise emitted from turbofan, turbo jet (w or w/o afterburner) , wakes/cavities, or unducted fans can be analyzed t o determine the e f fec ts of acoustics or t o s ize the structure t o withstand t h e environment. The program provides t h e designer or project manager guidance as t o the severity of t h e acoustic environment and helps i n t h e design of a particular part if t h e software indicates a potential problem.
Some of t h e c r i t e r i a used for selecting
The expert system allows us t o provide t o the designer t h e
By using t h i s type of system, we are able t o As
Unlike the RELIABILITY function,
Thei r function depends almost en t i re ly
COST AND PRODUCIBILITY EXPERT SYSTEM: With cost a very prime
This software is customized for LTV and must be
ACOUSTICS EXPERT SYSTEM: Acoustic design analysis is a d i f f i c u l t
38 3
SCHEDULING SYSTEM: Numerous scheduling systems, more commonly ca l led PROJECT/PROGRAM MANAGEMENT SYSTEMS, are available on the market. We are acquiring and modifying one of these systems to meet our specific requirements. nwordsn or nmeaningsn. scheduling as opposed to hand-developed manually supported schedules that usually are only valid the minute they are prepared. information necessary to assess the progress of a project, information to the drawing level coupled to any organization that supplies data must be available. he must have intermediate check points within the drawing achedule that allow him t o determine progress. More importantly, PROJECT MANAGEMENT SYSTEMS provide the derigner, the lead person, the supervisor, project or program manager the capability of doing awhat ifn studies in real-time, thereby allowing the person to manage (as opposed to reacting). Similarly, tho designers (or the pereon who is doing the task) must have and understan? the activities thdy art&-tasked to do and when they are tasked to do them,and what happens when they do not. Even though this software will more than pay for itse1f;just satisfying a need within the design community, it can be and will be a lot more than that. below, it will unite Engineering and Manufacturing into a more cohesive unit, giving Manufacturing insight into what Engineering is doing and Engineering insight into how its decisions affect Manufacturing. To compete i n today's marketplace, integration of all technologies is mandatory, and integrated scheduling is a big part of that.
DRAWING TRACKING SYSTEM: With any project that requires even a few drawings, specifications, or procedures, the requirement to maintain configuration control of the product, to know where and when the,data is being used, and to provide visibility t o the users of "things to come" i s of the utmost importance to the effectiveness of the project and the company. Our drawing tracking 3ystem is being devised to provide control at the earliest possible time of the activity. Specifically, when the designer determines from his schedule that a drawing of the part should begin, he provides the parameters that make the drawing unique ( e . g . , the part i s a forging to be machined that is the cap of a spar which is the front spar of the vertical tail which is part of the aircraft). The same scheme used for the Work Breakdown Structure for the vehicle will be used to collect charges necessary to prepare the drawing and all supporting data necessary to build the part. such that designation, sign-off , release, traceability, accessibility, availability, and maintainability of individual deliverable items are simple and effective.
discretion of the designer. for an ENGINEERING EXPERT will become more important. the functional requirements conflict, the designer must be provided assistance in making decisions. As previously stated, this represents probably our biggest challenge, but it is a challenge that must be addressed.
Primarily, we are changing the input/output screens to use our These systems are designed to provide real-time
To effectively provide
For the lead designer or lead supervisor to effectively manage,
Along with the Drawing Tracking System described
All phases of the DRAWING TRACKING SYSTEM are electronic in nature
ENGINEERING EXPERT: Integration of these tools presently remains at the As we continue to develop design tools, the need
In those cases where
384

THE CONCLUSION - I The United States Aerospace industry is on the verge of a new plateau,
and that plateau can be summarized in one word, INTEGRATION:
scheduling, and, we believe, integration of all design functions within a single discipline. We believe that to compete in an international market, this will be essential. for that conclusion, and we at LTV are working diligently to employ that belief in our design process. We hope that the paper has been helpful in stimulating your own thinking, and we welcome any comments that you might have on this subject.
integration of I manufacturing and engineering, integration of data bases, integration of
We have attempted in this paper to express our logic
385

SESSION 4: AEROELASTIC TAILORING
Chairmen: B. A. Rommel and T. A. Weisshar
PRECEDING PAGE BLANK NOT FILMED
38 7

N890 25165 . *
STRUCTURAL T A I L O R I N G OF COUNTER ROTATION PROPFANS
NAS3-23941
K . W . BROWN PRATT & WHITNEY AIRCRAFT
EAST HARTFORD, CT
AND
D . A . HOPKINS NASA LEWIS RESEARCH CENTER
CLEVELAND, OHIO
PRECEDING PAGE BLANK NOT FILMED
389
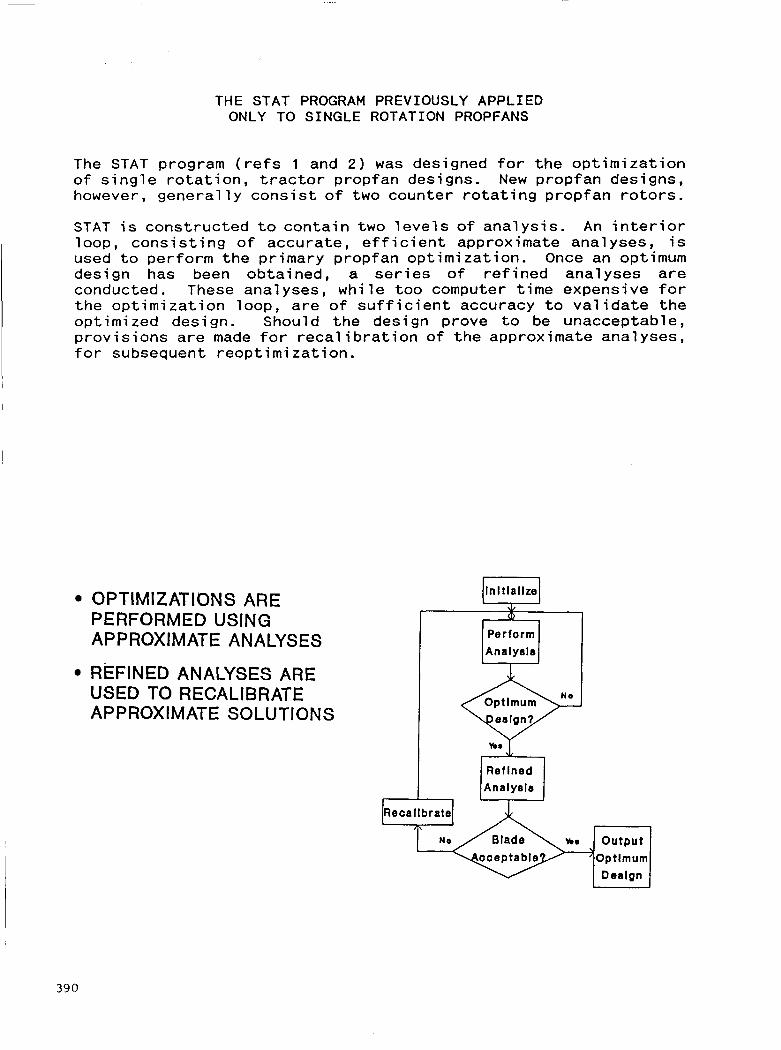
THE STAT PROGRAM PREVIOUSLY APPLIED ONLY TO SINGLE ROTATION PROPFANS
The STAT program ( r e f s 1 and 2 ) was designed f o r the op t im iza t i on o f s i n g l e r o t a t i o n , t r a c t o r propfan designs. New propfan designs, however, genera l l y cons i s t o f two counter r o t a t i n g propfan r o t o r s .
STAT i s constructed t o conta in two l e v e l s o f analys is . An i n t e r i o r loop, cons i s t i ng o f accurate, e f f i c i e n t approximate analyses, i s used t o perform the primary propfan opt imizat ion. Once an optimum design has been obtained, a se r ies o f re f i ned analyses are conducted. These analyses, wh i le too computer t ime expensive f o r the op t im iza t i on loop, are o f s u f f i c i e n t accuracy t o v a l i d a t e the optimized design. Should the design prove t o be unacceptable, p rov is ions are made f o r r e c a l i b r a t i o n o f the approximate analyses, f o r subsequent reopt im iza t ion .
OPTIMIZATIONS ARE PERFORMED USING APPROXIMATE ANALYSES
REFINED ANALYSES ARE USED TO RECALIBRATE APPROXIMATE SOLUTIONS
In It la I Ize
Per tor rn
n o
Retlned Ana lye le
I 390
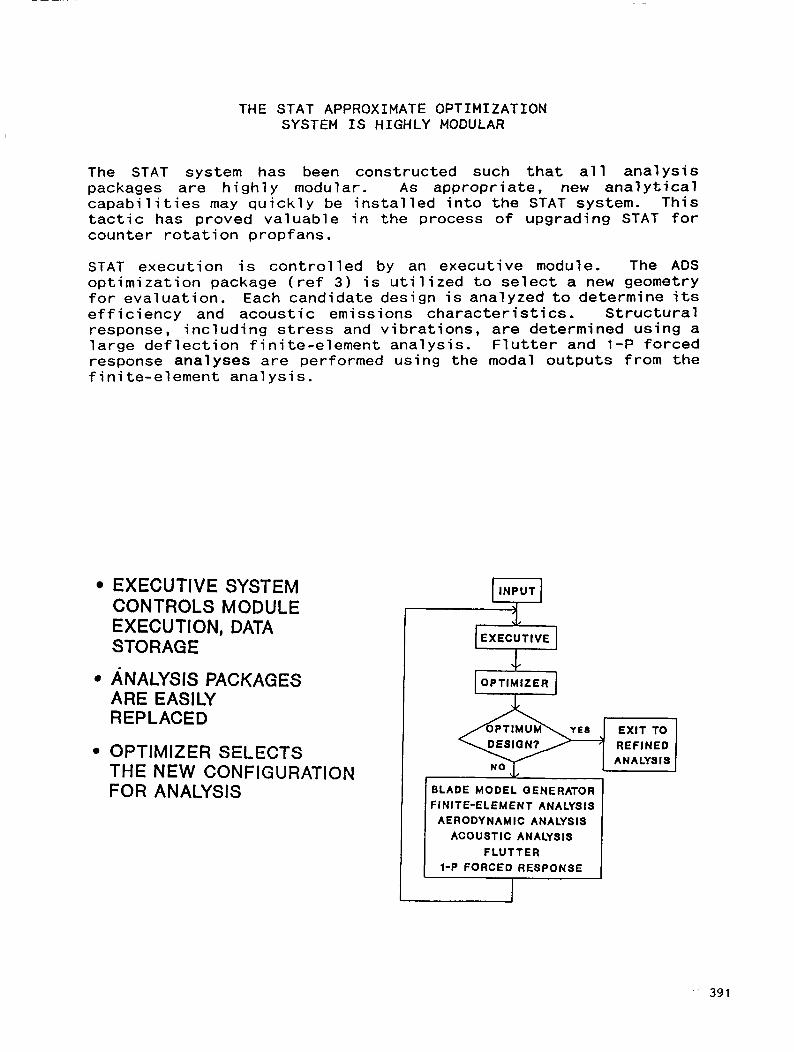
THE STAT APPROXIMATE OPTIMIZATION SYSTEM I S HIGHLY MODULAR
The STAT system has been constructed such t h a t a l l ana lys is packages are h i g h l y modular. As appropriate, new a n a l y t i c a l c a p a b i l i t i e s may q u i c k l y be i n s t a l l e d i n t o the STAT system. This t a c t i c has proved valuable i n the process o f upgrading STAT f o r counter r o t a t i o n propfans.
STAT execut ion i s c o n t r o l l e d by an executive module. The ADS op t im iza t i on package ( r e f 3) i s u t i l i z e d t o s e l e c t a new geometry f o r evaluat ion. Each candidate design i s analyzed t o determine i t s e f f i c i e n c y and acoust ic emissions cha rac te r i s t i cs , S t r u c t u r a l response, i nc lud ing s t ress and v ib ra t ions , are determined us ing a la rge d e f l e c t i o n f i n i t e -e lemen t analysis. F l u t t e r and l-P forced response analyses are performed using the modal outputs from the f i n i t e -e lemen t ana lys is .
EXECUTIVE SYSTEM CONTROLS MODULE EXECUTION, DATA STORAGE
8 ANALYSIS PACKAGES ARE EASILY REP LACED
OPTIMIZER SELECTS THE NEW CONFIGURATION FOR ANALYSIS
L EXECUTIVE
BLADE MODEL OENERATOR F I N I T €-E L EM EN T AN A LYS I S
AERODYNAMIC ANALYSIS ACO U ST I C AN A LYS I S
FLUTTER l-P FORCED RESPONSE
39 1

STAT HAS BEEN ENHANCED TO OPTIMIZE COUNTER ROTATION PROPFANS
To provide f o r the capabi 1 i t y t o opt imize counter ro ta t i on propfans, many of the STAT modules required s i g n i f i c a n t upgrading. The capab i l i t y t o input data f o r a rear r o t o r was added t o STAT, whi le preserving the single-stage opt imizat ion capab i l i t y . Counter r o t a t i o n c a p a b i l i t i e s were added t o the STAT aerodynamic analysis. A second f in i te-e lement analysis was added t o account f o r the rear ro to r . The acoustics analysis was upgraded from a regression analys is t o a closed-form ana ly t i ca l procedure. The STAT ob jec t ive func t ion was enhanced t o proper ly evaluate the cost o f counter r o t a t i o n propfan conf igurat ions.
INPUTS - TWO BLADES
AERODYNAMICS - ANALYSIS FOR TWO-STAGE ROTOR
FINITE-ELEMENT ANALYSIS - TWO SEPARATE ANALYSES ARE CONDUCTED
ACOUSTICS - IMPROVED ANALYSIS
OBJECTIVE FUNCTION - ENHANCED FOR TWO- STAGE ROTOR
39 2
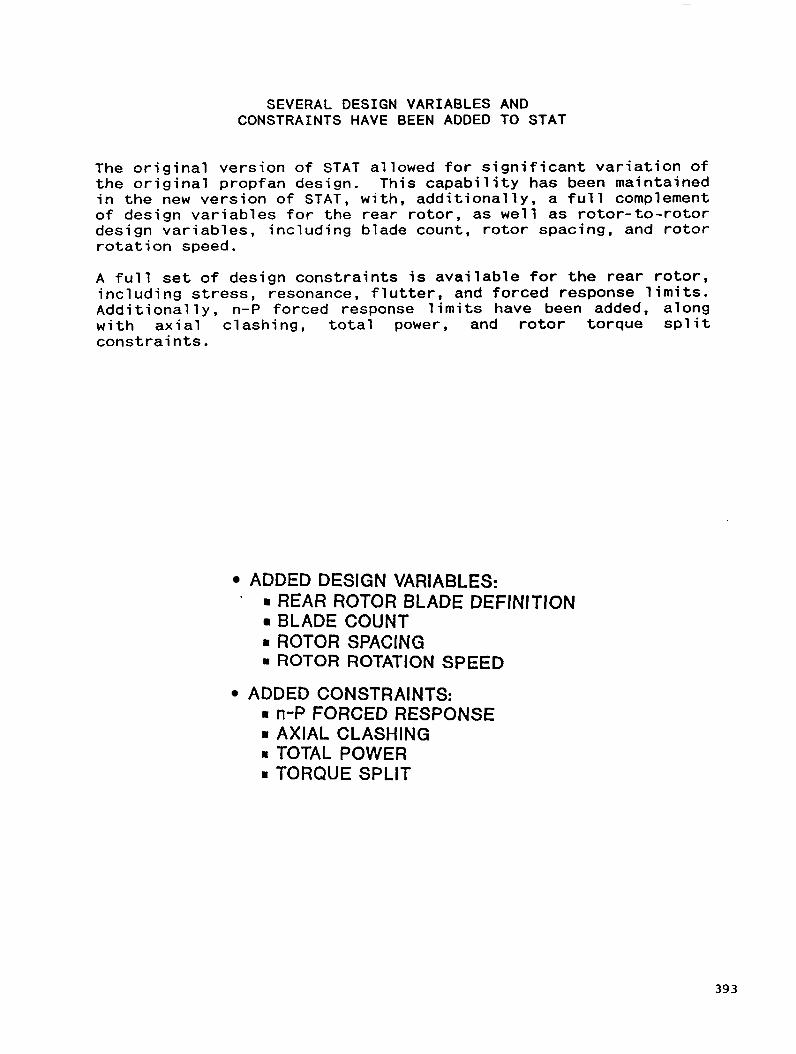
SEVERAL DESIGN VARIABLES AND CONSTRAINTS HAVE BEEN ADDED TO STAT
The o r i g i n a l version o f STAT allowed f o r s i g n i f i c a n t v a r i a t i o n o f the o r i g i n a l propfan design. This capab i l i t y has been maintained i n the new version o f STAT, with, add i t i ona l l y , a f u l l complement o f design var iab les f o r the rear ro to r , as we l l as ro to r - to - ro to r design var iab les, inc lud ing blade count, r o t o r spacing, and r o t o r r o t a t i o n speed.
A f u l l s e t o f design const ra in ts i s ava i lab le f o r the rear ro to r , inc lud ing s t ress , resonance, f l u t t e r , and forced response l i m i t s . Add i t i ona l l y , n-P forced response l i m i t s have been added, along w i t h a x i a l c lashing, t o t a l power, and r o t o r torque s p l i t cons t ra in ts .
ADDED DESIGN VARIABLES: *
m REAR ROTOR BLADE DEFINITION BLADE COUNT I ROTOR SPACING m ROTOR ROTATION SPEED
ADDED CONSTRAINTS: m n-P FORCED RESPONSE I AXIAL CLASHING I TOTAL POWER m TORQUE SPLIT
393
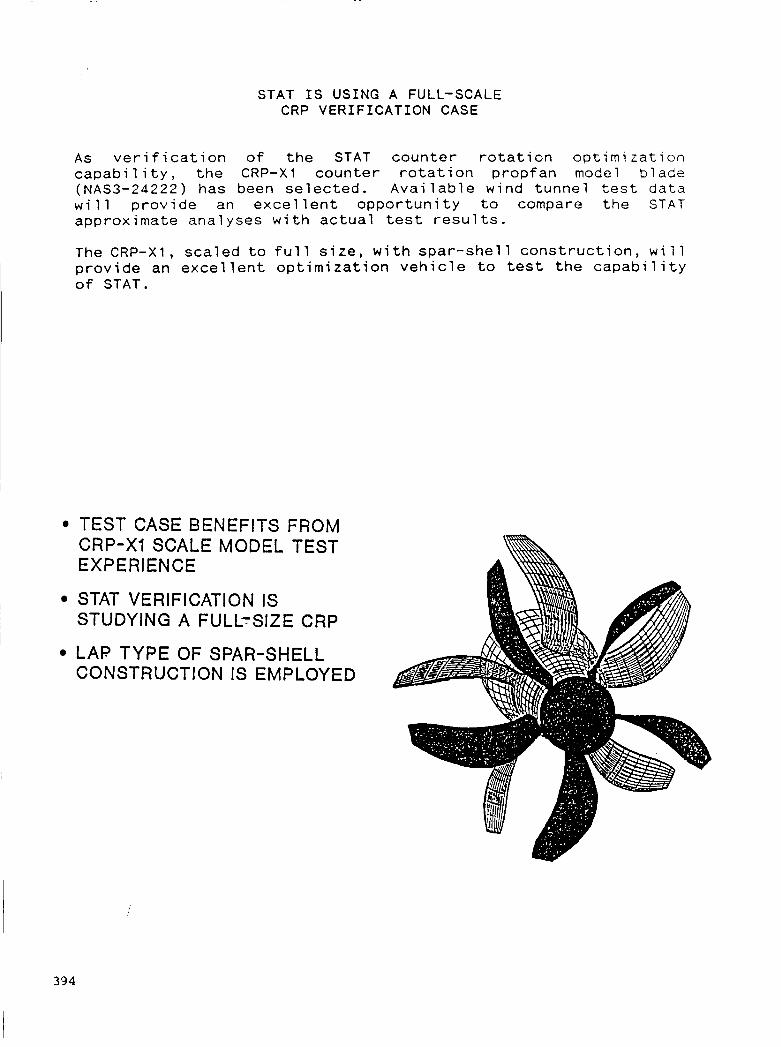
STAT IS USING A FULL-SCALE CRP VERIFICATION CASE
As verification of the STAT counter rotation optimi zation capability, the CRP-X1 counter rotation propfan model b l a d e (NAS3-24222) has been selected. Available wind tunnel test data will provide an excellent opportunity to compare the S T A T approximate analyses with actual test results.
The CRP-X1, scaled to full size, with spar-shell construction, will provide an excellent optimization vehicle to test the capability o f STAT.
TEST CASE BENEFITS FROM CRP-X1 SCALE MODEL TEST EXPERIENCE
I STAT VERIFICATION IS STUDYING A FULL-SIZE CRP
LAP TYPE OF SPAR-SHELL CONSTRUCTION IS EMPLOYED
I 394
I
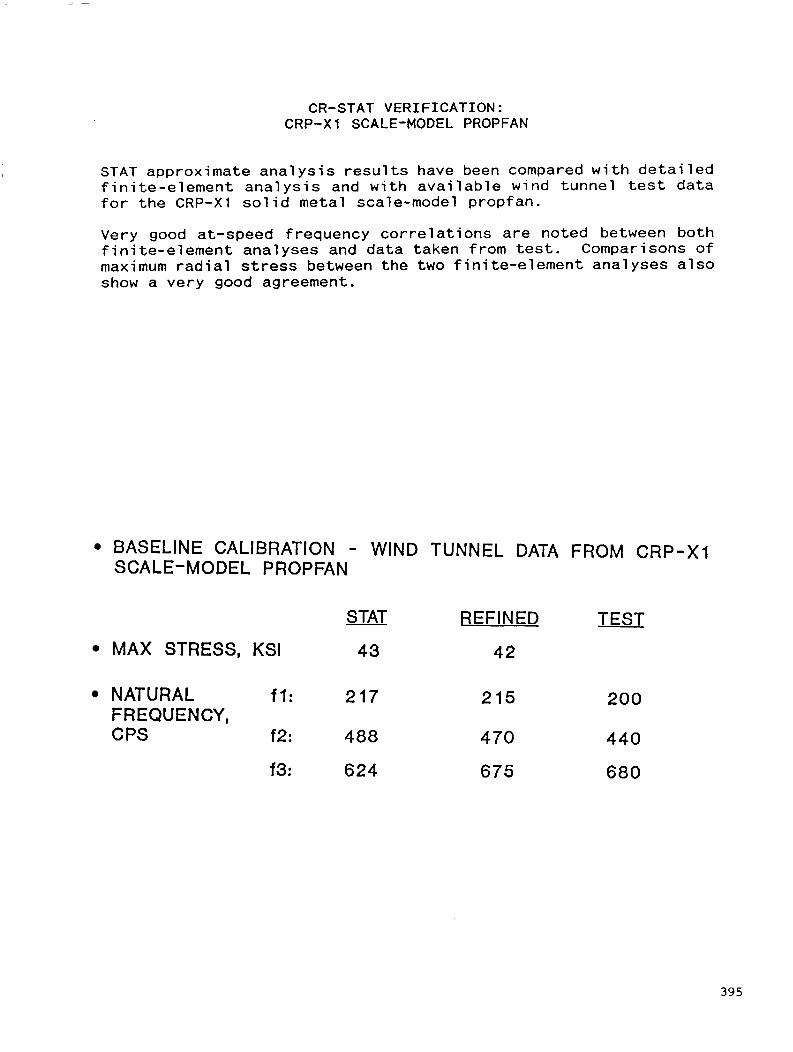
CR-STAT VERIF ICATION: CRP-X1 SCALE-MODEL PROPFAN
STAT approximate analysis results have been compared with detailed finite-element analysis and with available wind tunnel test data for the CRP-X1 solid metal scale-model propfan.
Very good at-speed frequency correlations are noted between both finite-element analyses and data taken from test. Comparisons o f maximum radial stress between the two finite-element analyses also show a very good agreement.
BASELINE CALIBRATION - WIND TUNNEL DATA FROM CRP-X1 SCALE-MODE L PROP FAN
TEST STAT REFINED
MAX STRESS, KSI 43 42
NATURAL f l : 217 215 200 FREQUENCY, CPS f 2: 488 470 440
f3: 624 675 680
395
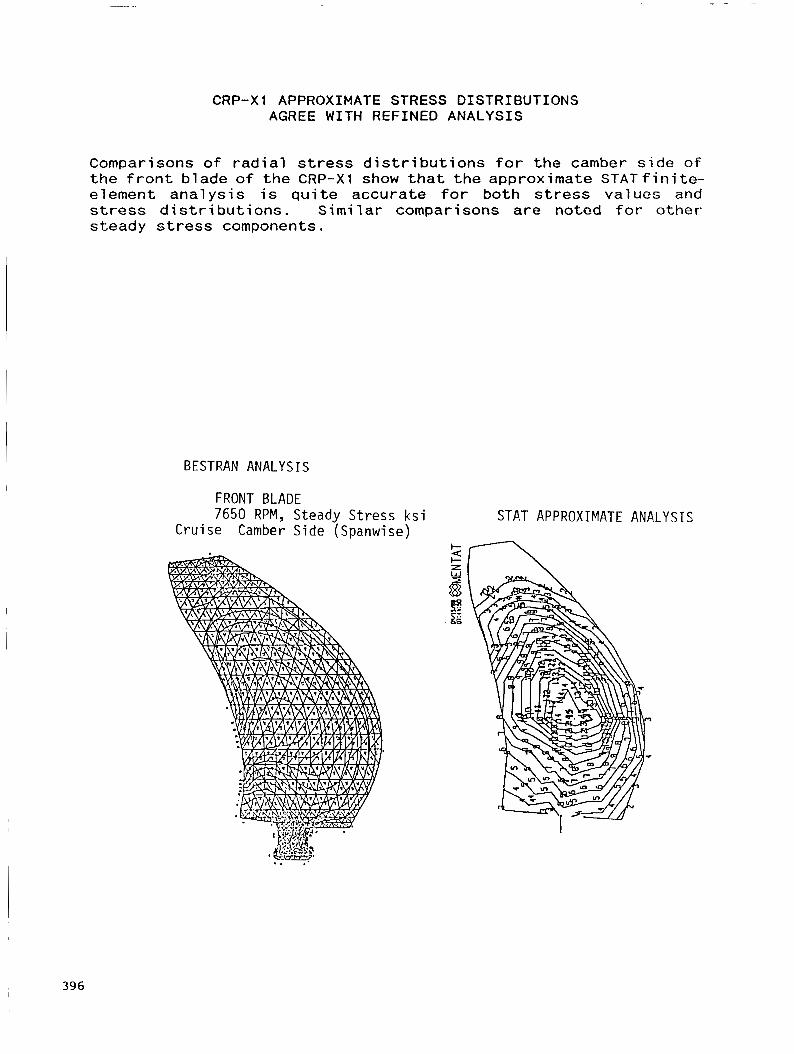
CRP-X1 APPROXIMATE STRESS DISTRIBUTIONS AGREE WITH REFINED ANALYSIS
Comparisons o f r a d i a l s t ress d i s t r i b u t i o n s f o r t h e camber s i d e o f the f r o n t blade o f the CRP-X1 show t h a t t h e approximate STATf in i te - element ana lys is i s q u i t e accurate f o r both s t r e s s values and stress d i s t r i b u t i o n s . S i m i l a r comparisons a r e noted f o r other steady s t r e s s components.
BESTRAN ANALYSIS
FRONT BLADE 7650 RPM, Steady Stress ksi
Cruise Camber Side (Spanwise) L
STAT APPROXIMATE ANAL YSIS
396
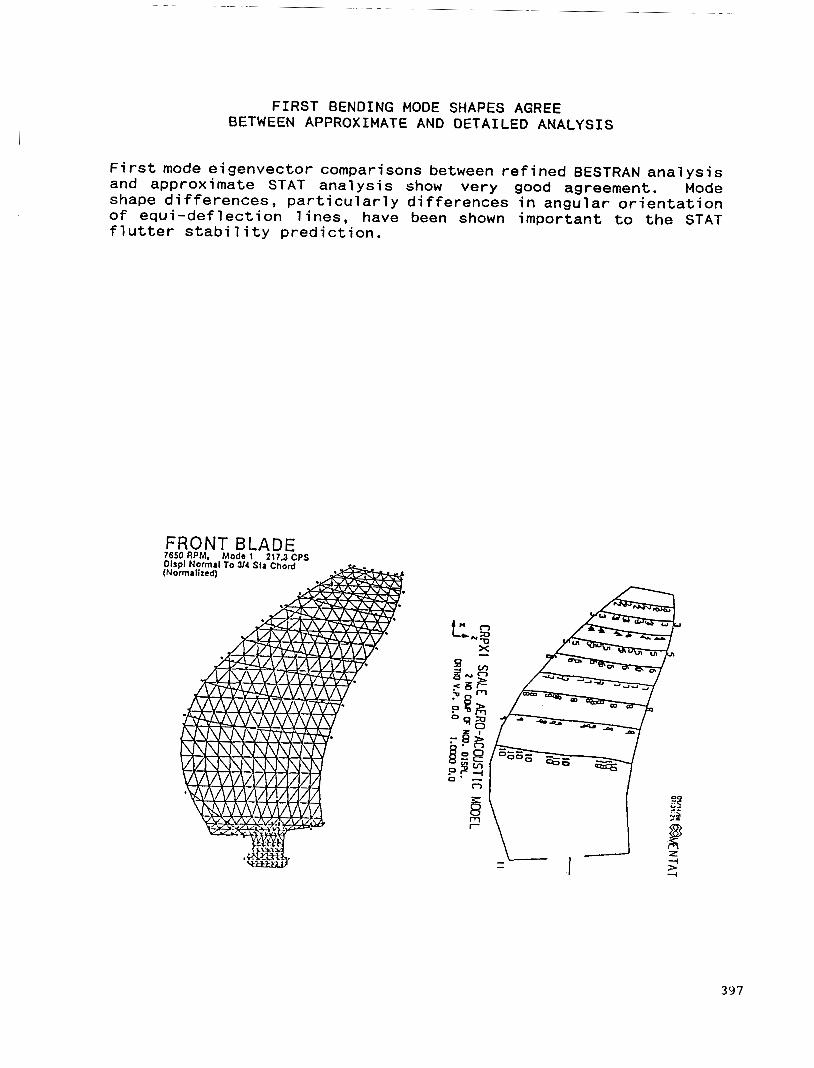
FIRST BENDING MODE SHAPES AGREE BETWEEN APPROXIMATE AND DETAILED ANALYSIS
F i r s t mode e igenvector comparisons between r e f i n e d BESTRAN a n a l y s i s and approximate STAT ana lys is show very good agreement. Mode shape d i f fe rences , p a r t i c u l a r l y d i f f e r e n c e s i n angular o r i e n t a t i o n o f equ i -de f lec t ion l i n e s , have been shown important t o t h e STAT f l u t t e r s t a b i l i t y p r e d i c t i o n .
FRONT BLADE 7650 RPM, Mode 1 217.3 CPS Olspl Normal To 314 Sla Chord (Normalized)
397
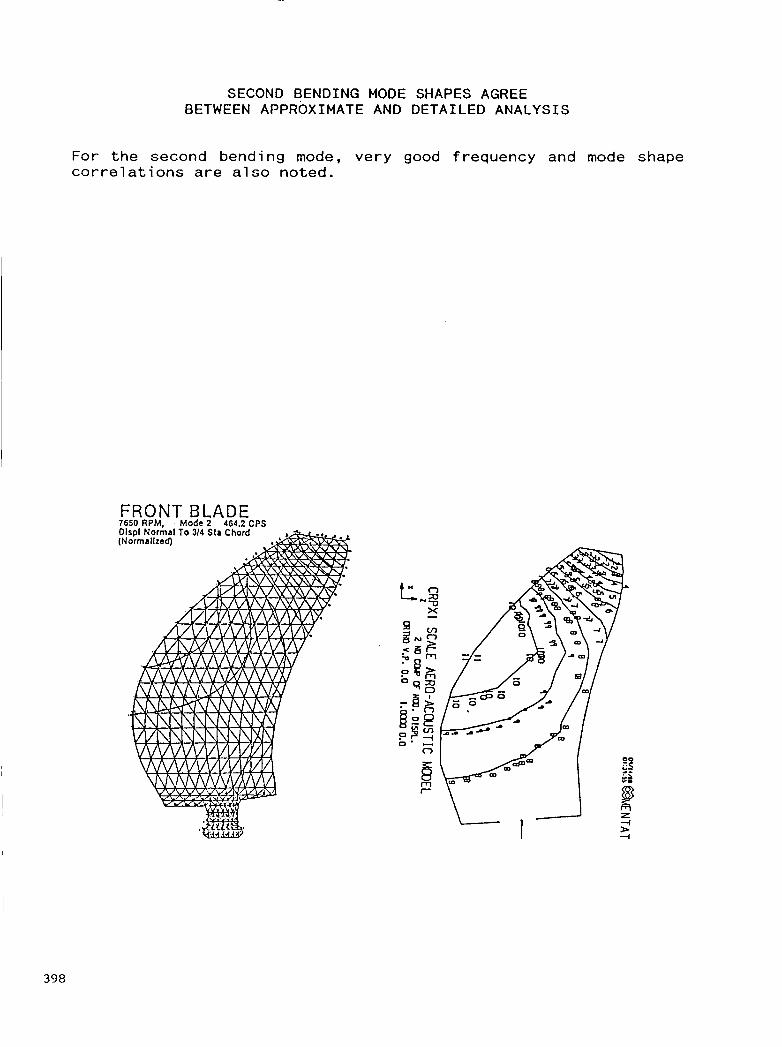
SECOND BENDING MODE SHAPES AGREE BETWEEN APPROXIMATE AND DETAILED ANALYSIS
For the second bending mode, very good frequency and mode shape correlations are also noted.
FRONT BLADE 7650 R P M , Mode 2 464.2 CPS Dlspl Normal To 314 S la Chord (Normallzed)
398

F I R S T TORSION MODE SHAPES AGREE BETWEEN APPROXIMATE AND DETAILED ANALYSIS
Very good correlations are also noted for the first torsion mode. For higher modes, larger differences occur. However, for approximate optimizations, the STAT analysis gives a dependable level of accuracy.
FRONT BLADE 7650 RPM, Mode 3 677.2 CPS Displ Normal To 3/4 Sla Chord (Norma Itzed)
399
A FULL-SIZE CRP OPTIMIZATION I S I N PROGRESS
The geometry o f the CRP-X1 counter ro ta t i on propfan has been expanded t o a 12-foot diameter, f u l l - s i z e ro to r . A metal spar, f iberg lass she l l const ruct ion has been employed f o r t h i s fu l l - s i ze CRP opt imizat ion. Several bugs i n the s,ystem have been removed, and we are cu r ren t l y near ly ready t o run t h i s f u l l scale counter ro ta t i on propfan opt imizat ion.
CRP-X1 GEOMETRY HAS BEEN SCALED TO FULL SIZE
SPAR-SHELL COMPOSITE CONSTRUCTION WILL BE EMPLOY ED
THE OPTIMIZATION IS NEARLY READY TO RUN
1 400

CONCLUSIONS
I n conclusion, t he STAT program has been enhanced f o r t he t a i l o r i n g o f counter r o t a t i o n propfans. Due t o the modular nature o f STAT’S construct ion, t h i s enhancement was possible by enhancing on ly the separate analys is modules, w i th only minor system modi f i ca t ions requ i red.
The new STAT approximate analyses have shown exce l len t co r re la t i ons w i th ava i lab le CRP t e s t data. A f u l l - sca le CRP opt im iza t ion i s cu r ren t l y being performed.
STAT’S MODULAR FORM ALLOWED CONVERSION TO CRP OPTIMIZATION
STAT APPROXIMATE ANALYSES GIVE GOOD CORRELATION
WE WILL SOON HAVE CRP OPTIMIZATION RESULTS
WITH BOTH DETAILED ANALYSIS AND TEST
401
REFERENCES
1 . Brown, K . W . ; Harvey, P. R.; and Chamis, C. C.: S t r u c t u r a l T a i l o r i n g o f Advanced Turboprops. AIAA/ASME/ASCE/AHS 28th St ructures, S t ruc tu ra l Dynamics, and Mater ia ls Conference, Monterey, Ca., A p r i l , 1987.
2. Brown, K . W . : S t r u c t u r a l T a i l o r i n g o f Advanced Turboprops (STAT). NASA CR 180861, 1988.
3. Vanderplaats, G. N.; Sugimoto, H.; and Sprague, C. M.: ADS-1: A New General Purpose Opt imizat ion Program. A I A A 24th St ructures, S t r u c t u r a l Dynamics, and Ma te r ia l s Conference, Lake Tahoe, Nevada, May, 1983.
402 I

N89- 25166 COMPOSITE SIZING AND PLY ORIENTATION FOR
STIFFNESS REQUIREMENTS USING A LARGE FINITE ELEMENT STRUCTURAL MODEL
N. A. Radovcich and D. P. Gentile Lockheed Aeronautical Systems Company
Burbank, California 91520
403
SUMMARY
A NASTRAN bulk dataset preprocessor was developed to facilitate the integration
The NASCOMP system generates delta stiffness and delta mass of filamentary composite laminate properties into composite structural resizing for stiffness requirements. matrices for input to the flutter derivative program. derivative calculations, and stiffness and mass matrix updates are controlled by engineer defined processes under an operating system called CBUS. design variable grid system permits high fidelity resizing without excessive computer cost.
The flutter baseline analysis,
A multi-layered
The NASCOMP system uses ply layup drawings for basic input. The aeroelastic resizing for stiffness capability was used during an actual design exercise.
INTRODUCTION
Design of efficient structures is a classic problem for high performance and fuel efficient aircraft. materials to be used in the design process. Current aircraft designs are focusing on composites.
This is highlighted by the continuing search for more efficient
Aircraft designs require structural sizings which satisfy aeroelastic requirements within the airplane flight envelope. this with lowest possible structural weight.
The more successful designs achieve
It is not uncommon to separate the structure sizing process into two phases: (1) sizing for strength,fatigue, and buckling, and (2) sizing for flutter, deflection
derivatives requirements. The latter are grouped together as design for stiffness, and the structural sizing increment over the strength sized structure is known as the stiffness weight increment. loads is not the same as satisfying flutter requirements, the methodology and approach are the same. However, stiffness weight increment loses some of its meaning.
I constraints, tailoring for loads alleviation, and aircraft flexible stability
While tailoring the structure characteristics to reduce
Current aircraft designs incorporate aircraft structural arrangements for fuselage, wing, canards, vertical and horizontal surfaces, which often preclude adequate structural representation by the more traditional EI/GJ based models used in dynamic analyses. Consequently, dynamic analyses require more complex structural ,modeling details which were once reserved only for stress analyses.
One major problem with the finite element approach is the timely availability of a strength sized design early in the design process. finite element model is a labor intensive process. Second, the sizing of the finite element model requires first rigid loads and then flexible loads.
First, the fabrication of the
This procedure
404
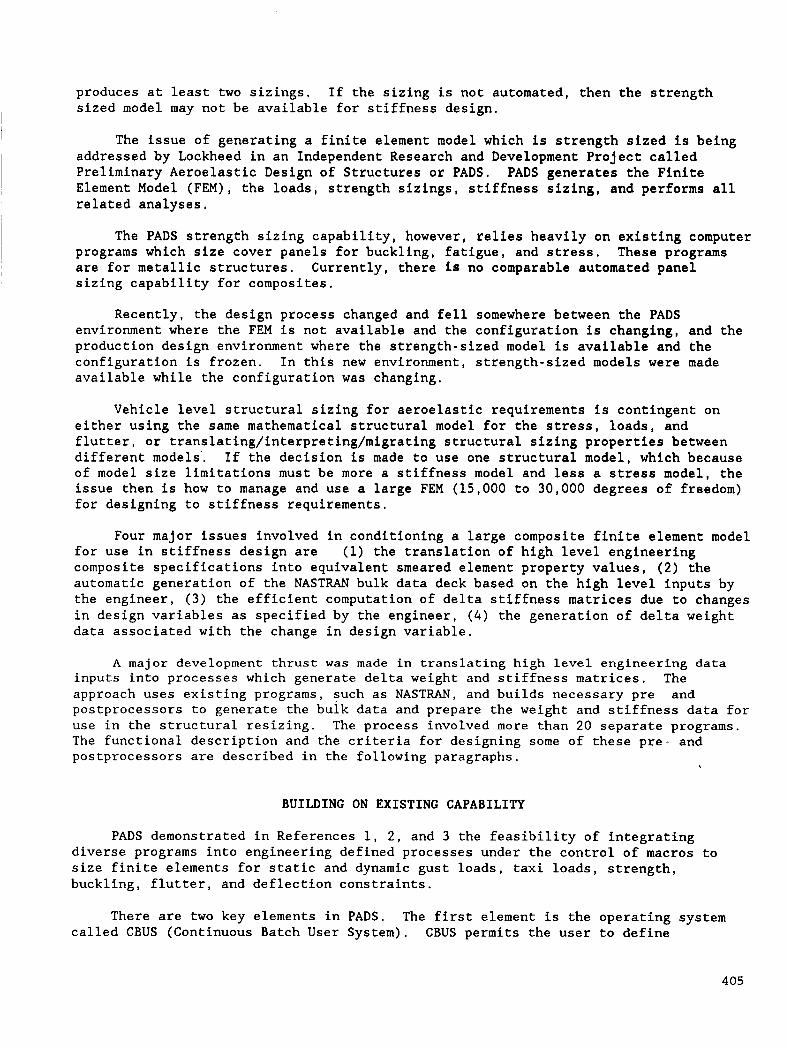
produces at least two sizings. sized model may not be available for stiffness design.
If the sizing is not automated, then the strength
The issue of generating a finite element model which is strength sized is being addressed by Lockheed in an Independent Research and Development Project called Preliminary Aeroelastic Design of Structures or PADS. Element Model (FEM), the loads, strength sizings, stiffness sizing, and performs all related analyses.
PADS generates the Finite
The PADS strength sizing capability, however, relies heavily on existing computer programs which size cover panels for buckling, fatigue, and stress. These programs are for metallic structures. sizing capability for composites.
Currently, there is no comparable automated panel
Recently, the design process changed and fell somewhere between the PADS environment where the FEM is not available and the configuration is changing, and the production design environment where the strength-sized model is available and the configuration is frozen. In this new environment, strength-sized models were made available while the configuration was changing.
Vehicle level structural sizing for aeroelastic requirements is contingent on either using the same mathematical structural model for the stress, loads, and flutter, or translating/interpreting/migrating structural sizing properties between different models’. If the decision is made to use one structural model, which because of model size limitations must be more a stiffness model and less a stress model, the issue then is how to manage and use a large FEM (15,000 to 30,000 degrees of freedom) for designing to stiffness requirements.
Four major issues involved in conditioning a large composite finite element model for use in stiffness design are composite specifications into equivalent smeared element property values, ( 2 ) the automatic generation of the NASTRAN bulk data deck based on the high level inputs by the engineer, ( 3 ) the efficient computation of delta stiffness matrices due to changes in design variables as specified by the engineer, ( 4 ) the generation of delta weight data associated with the change in design variable.
(1) the translation of high level engineering
A major development thrust was made in translating high level engineering data inputs into processes which generate delta weight and stiffness matrices. approach uses existing programs, such as NASTRAN, and builds necessary pre and postprocessors to generate the bulk data and prepare the weight and stiffness data for use in the structural resizing. The process involved more than 20 separate programs. The functional description and the criteria for designing some of these pre- and postprocessors are described in the following paragraphs.
The
BUILDING ON EXISTING CAPABILITY
PADS demonstrated in References 1, 2 , and 3 the feasibility of integrating diverse programs into engineering defined processes under the control of macros to size finite elements for static and dynamic gust loads, taxi loads, strength, buckling, flutter, and deflection constraints.
There are two key elements in PADS. The first element is the operating system called CBUS (Continuous Batch User System). CBUS permits the user to define
405
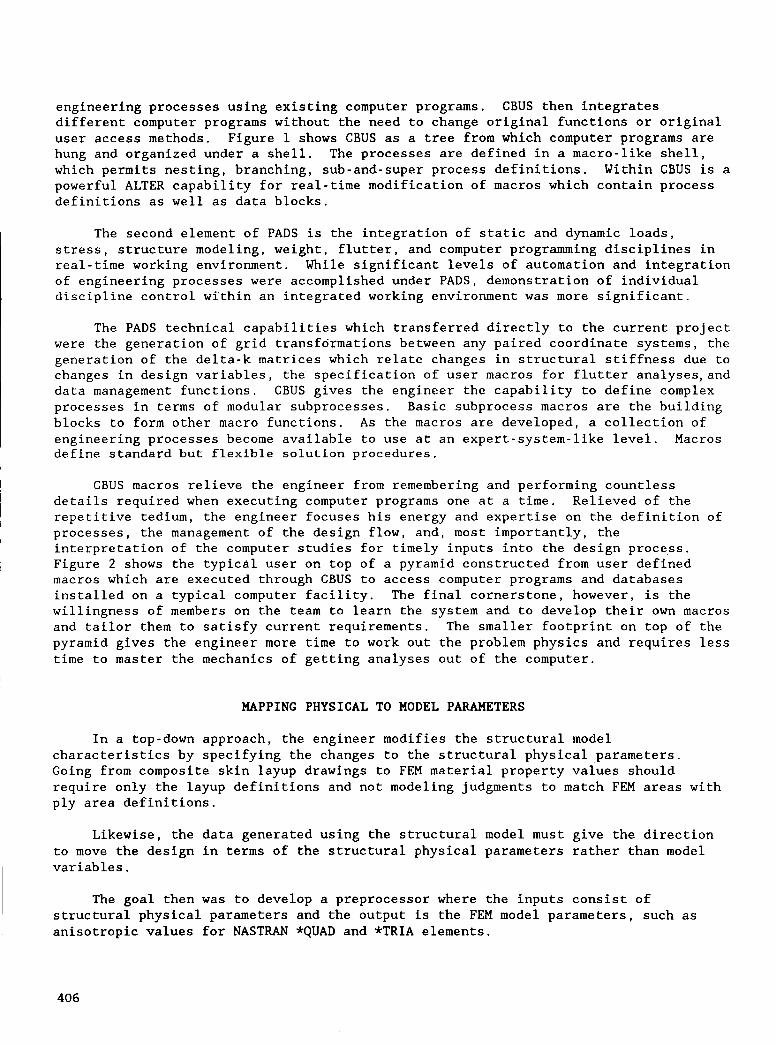
engineering processes using existing computer programs. CBUS then integrates different computer programs without the need to change original functions or original user access methods. hung and organized under a shell. The processes are defined in a macro-like shell, which permits nesting, branching, sub-and-super process definitions. Within CBUS is a powerful ALTER capability for real-time modification of macros which contain process definitions as well as data blocks.
Figure 1 shows CBUS as a tree from which computer programs are
The second element of PADS is the integration of static and dynamic loads, stress, structure modeling, weight, flutter, and computer programming disciplines in real-time working environment. While significant levels of automation and integration of engineering processes were accomplished under PADS, demonstration of individual discipline control within an integrated working environment was more significant.
The PADS technical capabilities which transferred directly to the current project were the generation of grid transformations between any paired coordinate systems, the generation of the delta-k matrices which relate changes in structural stiffness due to changes in design variables, the specification of user macros for flutter analyses,and data management functions. CBUS gives the engineer the capability to define complex processes in terms of modular subprocesses. Basic subprocess macros are the building blocks to form other macro functions. As the macros are developed, a collection of engineering processes become available to use at an expert-system-like level. Macros define standard but flexible solution procedures.
CBUS macros relieve the engineer from remembering and performing countless details required when executing computer programs one at a time. Relieved of the repetitive tedium, the engineer focuses his energy and expertise on the definition of processes, the management of the design flow, and, most importantly, the interpretation of the computer studies for timely inputs into the design process. Figure 2 shows the typical user on top of a pyramid constructed from user defined macros which are executed through CBUS to access computer programs and databases installed on a typical computer facility. The final cornerstone, however, is the willingness of members on the team to learn the system and to develop their own macros and tailor them to satisfy current requirements. The smaller footprint on top of the pyramid gives the engineer more time to work out the problem physics and requires less time to master the mechanics of getting analyses out of the computer.
MAPPING PHYSICAL TO MODEL PARAMETERS
In a top-down approach, the engineer modifies the structural model characteristics by specifying the changes to the structural physical parameters. Going from composite skin layup drawings to FEM material property vaiues should require only the layup definitions and not modeling judgments to match FEM areas with ply area definitions.
Likewise, the data generated using the structural model must give the direction to move the design in terms of the structural physical parameters rather than model variables.
The goal then was to develop a preprocessor where the inputs consist of structural physical parameters and the output is the FEM model parameters, such as anisotropic values for NASTRAN *QUAD and *TRIA elements.
406
PROCESS SHELL
Figure 1. CBUS as an Integrating System
Figure 2. CBUS/PADS System Architecture
407
The end product is a change in structural stiffness for a change in a design variable, which is defined in terms of the structure physical parameters. formulation of delta stiffnesses is just a special application of mapping of physical parameters to model parameters, the mechanization details are critical relative to defining computer resource requirements.
While the
So far, the mapping of physical parameters to model parameters has focused on the sizing specification. which are used to optimize a design. been limited to t/c variations.
There are geometric mappings from the physical to the model The general category of shape optimization has
The formulation of the FEM property values directly from structural physical parameters is necessary not only for the baseline structure but also for perturbations of the baseline configuration.
I In summary, the mapping of physical parameters to FEM model parameters must
I 0 Use as input the ply layup drawings
~
0 Map ply level changes directly into the FEM.
0 Map ply level changes directly into the FEM for definition of delta stiffness and mass matrices.
I 0 Accommodate FEM models in excess of 20,000 degrees of freedom.
0 Map t/c changes to the FEM geometry.
0 Accommodate automation.
0 Accommodate the integration of strength sizing in the future.
AEROELASTIC STRUCTURAL SIZING OVERVIEW
Structural sizing for aeroelastic requirements involves a number of disciplines; namely, flutter, dynamic and static loads, stress, and stability and control. One way to move the design to best satisfy each discipline requirement is to generate structural sizing derivatives relative to the goals of each discipline. Even when the weighting of one discipline goal against the other for purposes of reaching a best design is known, the overall process in the academic sense is extremely complex. The issue becomes manageable, however, in practical designs when the engineer recognizes the loosely coupled interactions between one or more of these disciplines.
I
The need to generate strength-related derivatives are eliminated by allowing the internal loads within the structure to remain fixed while the individual structural elements are sized for those loads. Once the new sizing has been generated, new flexible loads are computed and new internal loads are then derived. Structural sizing which is compatible with internal loads converges within three loads/strength sizing cycles. Once the structure has been sized for flexible loads, the impact of the structural design on flutter margins and control effectiveness is established. Aeroelastic tailoring to reduce the loads can also be evaluated at this time.
~
408
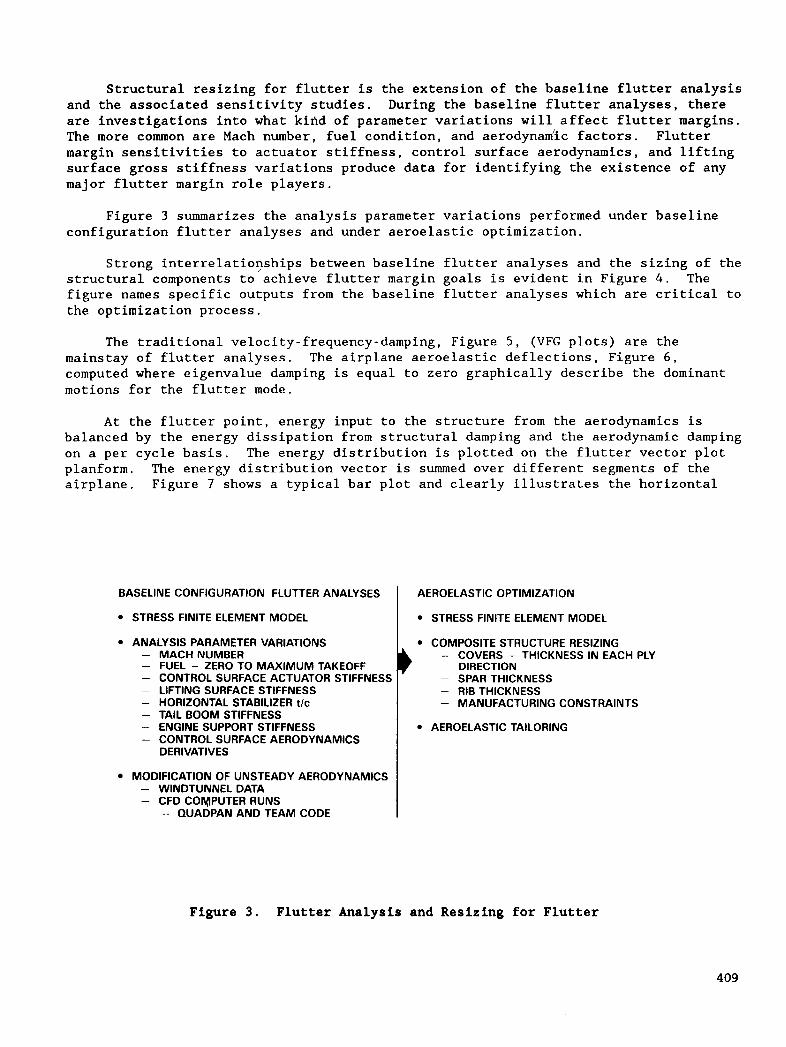
Structural resizing for flutter is the extension of the baseline flutter analysis and the associated sensitivity studies. are investigations into what kind of parameter variations will affect flutter margins. The more common are Mach number, fuel condition, and aerodynadic factors. Flutter margin sensitivities to actuator stiffness, control surface aerodynamics, and lifting surface gross stiffness variations produce data for identifying the existence of any major flutter margin role players.
During the baseline flutter analyses, there
Figure 3 summarizes the analysis parameter variations performed under baseline configuration flutter analyses and under aeroelastic optimization.
Strong interrelationships between baseline flutter analyses and the sizing of the structural components to achieve flutter margin goals is evident in Figure 4 . The figure names specific outputs from the baseline flutter analyses which are critical to the optimization process.
The traditional velocity-frequency-damping, Figure 5, (VFG plots) are the mainstay of flutter analyses. The airplane aeroelastic deflections, Figure 6 , computed where eigenvalue damping is equal to zero graphically describe the dominant motions for the flutter mode.
At the flutter point, energy input to the structure from the aerodynamics is
The energy distribution is plotted on the flutter vector plot balanced by the energy dissipation from structural damping and the aerodynamic damping on a per cycle basis. planform. The energy distribution vector is summed over different segments of the airplane. Figure 7 shows a typical bar plot and clearly illustrates the horizontal
BASELINE CONFIGURATION FLUTTER ANALYSES
STRESS FINITE ELEMENT MODEL
ANALYSIS PARAMETER VARIATIONS - MACHNUMBER - FUEL - ZERO TO MAXIMUM TAKEOFF - CONTROL SURFACE ACTUATOR STIFFNESS - LIFTING SURFACE STIFFNESS - HORIZONTAL STABILIZER t/c - TAIL BOOM STIFFNESS - ENGINE SUPPORT STIFFNESS - CONTROL SURFACE AERODYNAMICS
DERIVATIVES
MODIFICATION OF UNSTEADY AERODYNAMICS - WINDTUNNEL DATA - CFD COMPUTER RUNS
-- QUADPAN AND TEAM CODE
AEROELASTIC OPTIMIZATION
STRESS FINITE ELEMENT MODEL
COMPOSITE STRUCTURE RESIZING - COVERS - THICKNESS IN EACH PLY
- SPAR THICKNESS - RIB THICKNESS - MANUFACTURING CONSTRAINTS
DIRECTION 1
AEROELASTIC TAILORING
Figure 3 . Flutter Analysis and Resizing for Flutter
409
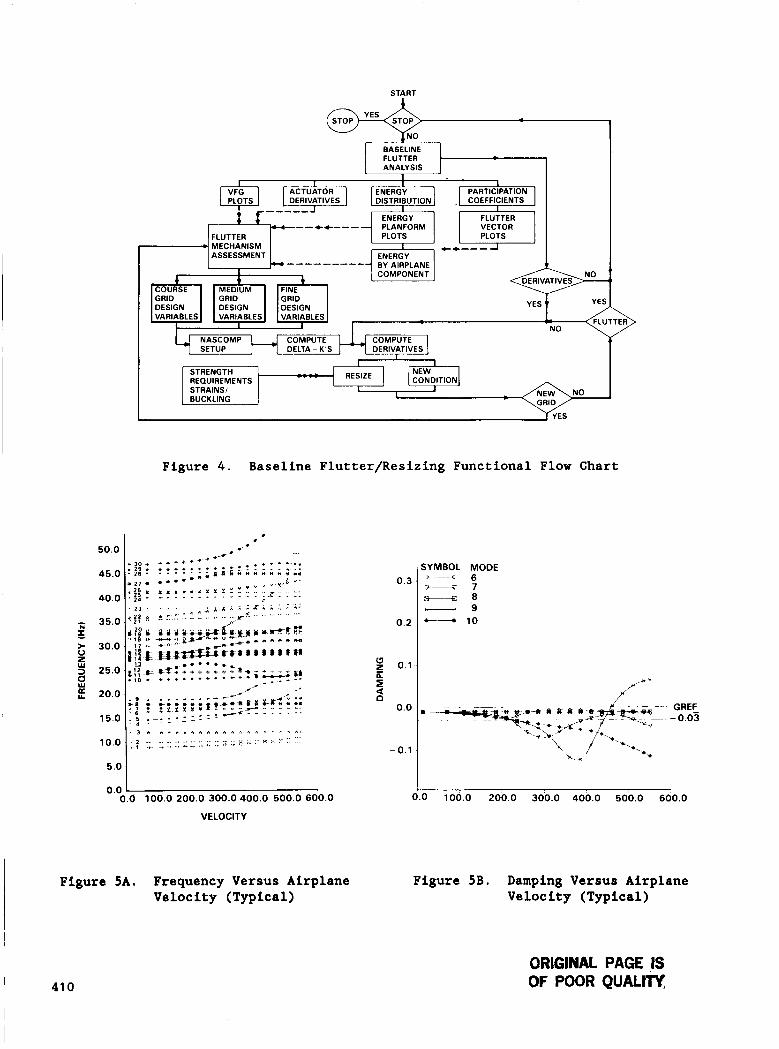
START 1
50.0
45.0
40.0
- 35.0 E. > 30.0 0
=) 25.0
20.0
E s
15.0
I
COEFFICIENTS DERIVATIVES DISTRIBUTION
MECHANISM AFLUTTER ASSESSMENT I DERIVATIVES -.',--- -...- ".I."
DESIGN DESIGN DESIGN
1 VARIABLES VARIABLES VARIABLES
NASCOMP SETUP DERIVATIVES
I RESIZE STRENGTH
REQUIREMENTS I STRAINS/ I
BUCKLING
I 1
NEW CONDITION
I
Figure 4. Baseline Flutter/Resizing Functional Flow Chart
> 3 d 0 0 * * 0 0 0 n l n l l * l . . + n ,
10.0 .................. - ........ v ?-':: ::: 1 _+ ...... 2.- A I . .. - .= '7 ....
5.0
0.0 0.6 100.0 200.0 300.0 400.0 500.0 600.0
VELOCITY
Figure SA. Frequency Versus Airplane Velocity (Typical)
I 0.0 100.0 200.0 300.0 400.0 500.0 600.0
Figure 5B. Damping Versus Airplane Velocity (Typical)
I 41 0
ORLGINAL PAGE IS OF POOR QUALm
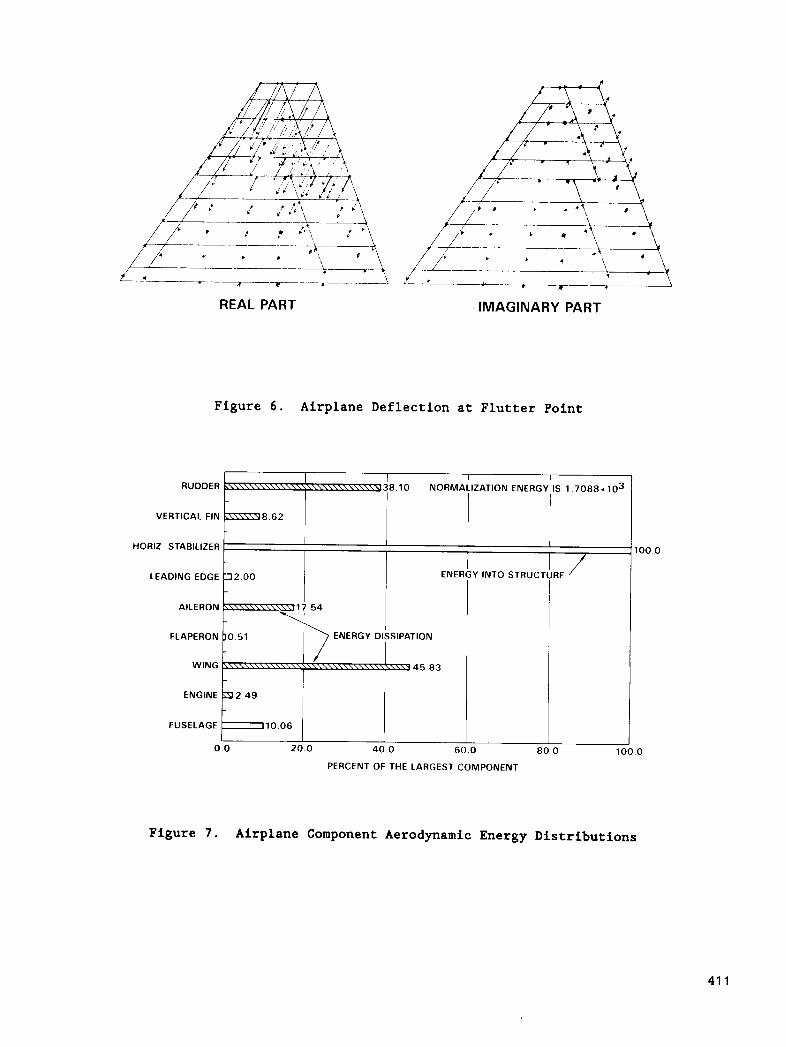
\
VERTICAL FIN
HORIZ. STABILIZER
REAL PART
>\\\\\V 8 62 -
IMAGINARY PART
Figure 6. Airplane Deflection at Flutter Point
i8 10 NORMALIZATION ENERGY IS 1 7088. lo3 1 I
I I
ENEF Y INTO STRUCTURE ’
I I I
0 0 20.0 40 0 60 0 80 0 i a PERCENT OF THE LARGEST COMPONENT
100.0
.O
Figure 7. Airplane Component Aerodynamic Energy Distributions
41 1
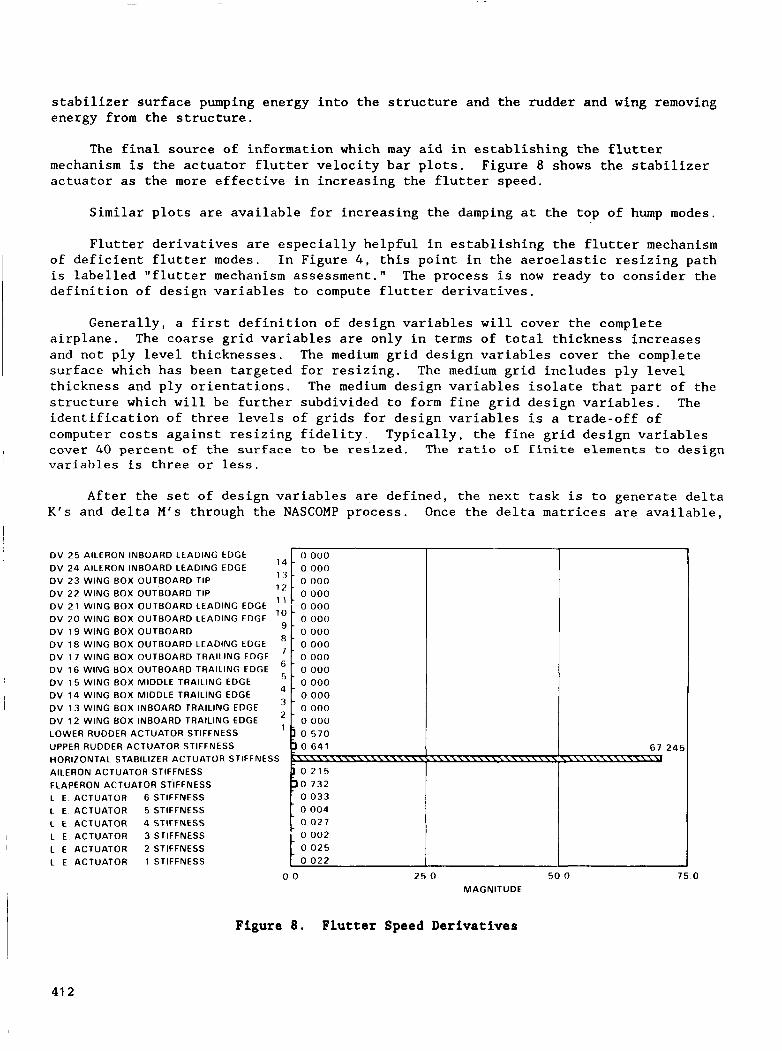
stabilizer surface pumping energy into the structure and the rudder and wing removing energy from the structure.
G - 5
The final source of information which may aid in establishing the flutter mechanism is the actuator flutter velocity bar plots. Figure 8 shows the stabilizer actuator as the more effective in increasing the flutter speed.
0 000 0 000 o 000
-
Similar plots are available for increasing the damping at the top of hump modes.
Flutter derivatives are especially helpful in establishing the flutter mechanism of deficient flutter modes. In Figure 4 , this point in the aeroelastic resizing path is labelled "flutter mechanism assessment." The process is now ready to consider the definition of design variables to compute flutter derivatives.
Generally, a first definition of design variables will cover the complete airplane. The coarse grid variables are only in terms of total thickness increases and not ply level thicknesses. The medium grid design variables cover the complete surface which has been targeted for resizing. thickness and ply orientations. The medium design variables isolate that part of the structure which will be further subdivided to form fine grid design variables. The identification of three levels of grids for design variables is a trade-off of computer costs against resizing fidelity. Typically, the fine grid design variables cover 40 percent of the surface to be resized. The ratio of finite elements to design variables is three or less.
The medium grid includes ply level
After the set of design variables are defined, the next task is to generate delta K's and delta M's through the NASCOMP process. Once the delta matrices are available,
D V 2 5 AILERON INBOARD LEADING EDGE DV 2 4 AILERON INBOARD LEADING EDGE DV 23 WING BOX OUTBOARD TIP DV 2 2 WING BOX OUTBOARD TIP D V 2 1 WING BOX OUTBOARD LEADING EDGE D V 2 0 WING BOX OUTBOARD LEADING EDGE D V 1 9 WING BOX OUTBOARD DV 1 8 WING BOX OUTBOARD LEADING EDGE DV 17 WING BOX OUTBOARD TRAILING EDGE DV 1 6 WING BOX OUTBOARD TRAILING EDGE D V 1 5 WING BOX MIDDLE TRAILING EDGE DV 1 4 WING BOX MIDDLE TRAILING EDGE DV 1 3 WING BOX INBOARD TRAILING EDGE DV 1 2 WING BOX INBOARD TRAILING EDGE LOWER RUDDER ACTUATOR STIFFNESS UPPER RUDDER ACTUATOR STIFFNESS HORIZONTAL S TAB1 Ll ZER ACTUATOR ST IFF NESS AILERON ACTUATOR STIFFNESS FLAPERON ACTUATOR STIFFNESS L E ACTUATOR 6 STIFFNESS L E ACTUATOR 5 STIFFNESS C E ACTUATOR 4 STIFFNESS L E ACTUATOR 3STlFFNESS L E ACTUATOR 2 STIFFNESS L E ACTUATOR 1 STIFFNESS
6 7 24!
0 0 2 5 0 50 0 MAGNITUDE
1 5 . 0
Figure 8. Flutter Speed Derivatives
41 2
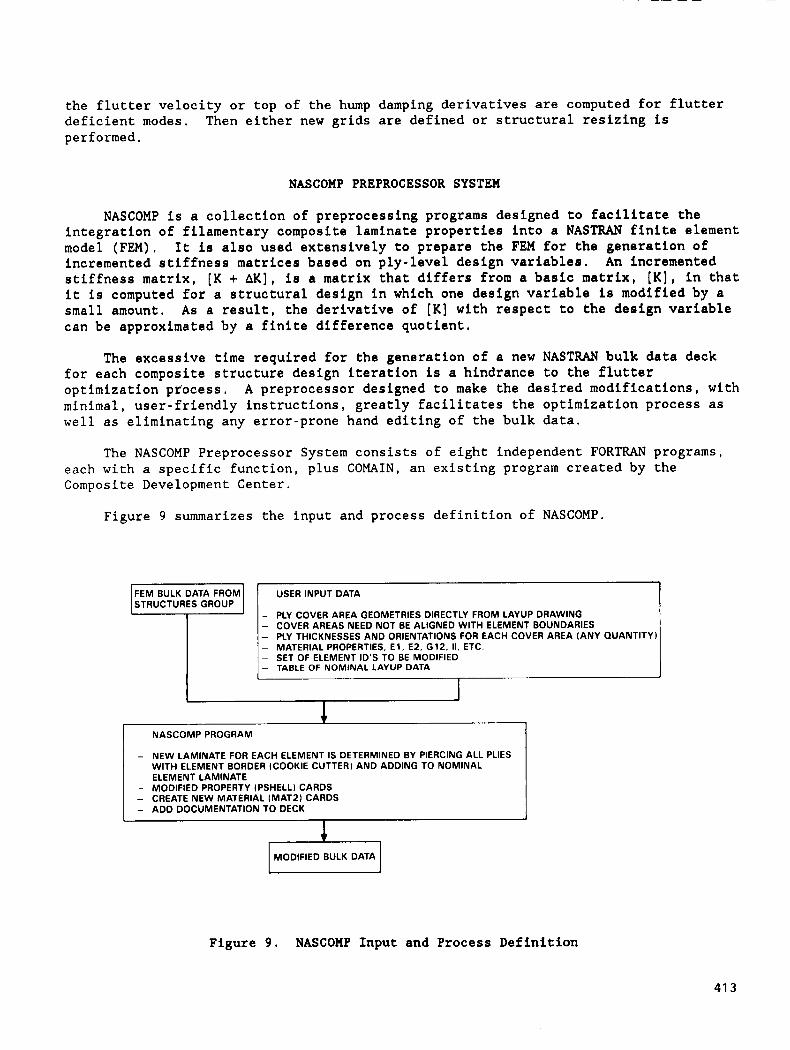
the flutter velocity or top of the hump damping derivatives are computed for flutter deficient modes. performed.
Then either new grids are defined or structural resizing is
NASCOMP PREPROCESSOR SYSTEM
NASCOMP is a collection of preprocessing programs designed to facilitate the integration of filamentary composite laminate properties into a NASTRAN finite element model (FEM). incremented stiffness matrices based on ply-level design variables. stiffness matrix, [K + AK], is a matrix that differs from a basic matrix, [K], in that it is computed for a structural design in which one design variable is modified by a small amount, As a result, the derivative of [K] with respect to the design variable can be approximated by a finite difference quotient.
It is also used extensively to prepare the FEM for the generation of An incremented
The excessive time required for the generation of a new NASTRAN bulk data deck for each composite structure design iteration is a hindrance to the flutter optimization process, minimal, user-friendly instructions, greatly facilitates the optimization process as well as eliminating any error-prone hand editing of the bulk data.
A preprocessor designed to make the desired modifications, with
The NASCOMP Preprocessor System consists of eight independent FORTRAN programs, each with a specific function, plus COMAIN, an existing program created by the Composite Development Center.
Figure 9 summarizes the input and process definition of NASCOMP.
1 USER INPUT DATA
- PLY COVER AREA GEOMETRIES DIRECTLY FROM LAYUP DRAWING - COVER AREAS NEED NOT BE ALIGNED WITH ELEMENT BOUNDARIES - PLY THICKNESSES AND ORIENTATIONS FOR EACH COVER AREA (ANY QUANTITY - MATERIAL PROPERTIES, E l , E2, G12, II. ETC. - SET OF ELEMENT ID’S TO BE MODIFIED - TABLE OF NOMINAL LAYUP DATA
1 NASCOMP PROGRAM
- NEW LAMINATE FOR EACH ELEMENT IS DETERMINED BY PIERCING ALL PLIES WITH ELEMENT BORDER (COOKIE CUTTER) AND ADDING TO NOMINAL ELEMENT LAMINATE
- MODIFIED PROPERTY (PSHELLI CARDS - CREATE NEW MATERIAL (MAT21 CARDS - ADD DOCUMENTATION TO DECK
I
I MODIFIED BULK DATA I I 1
Figure 9. NASCOMP Input and Process Definition
41 3
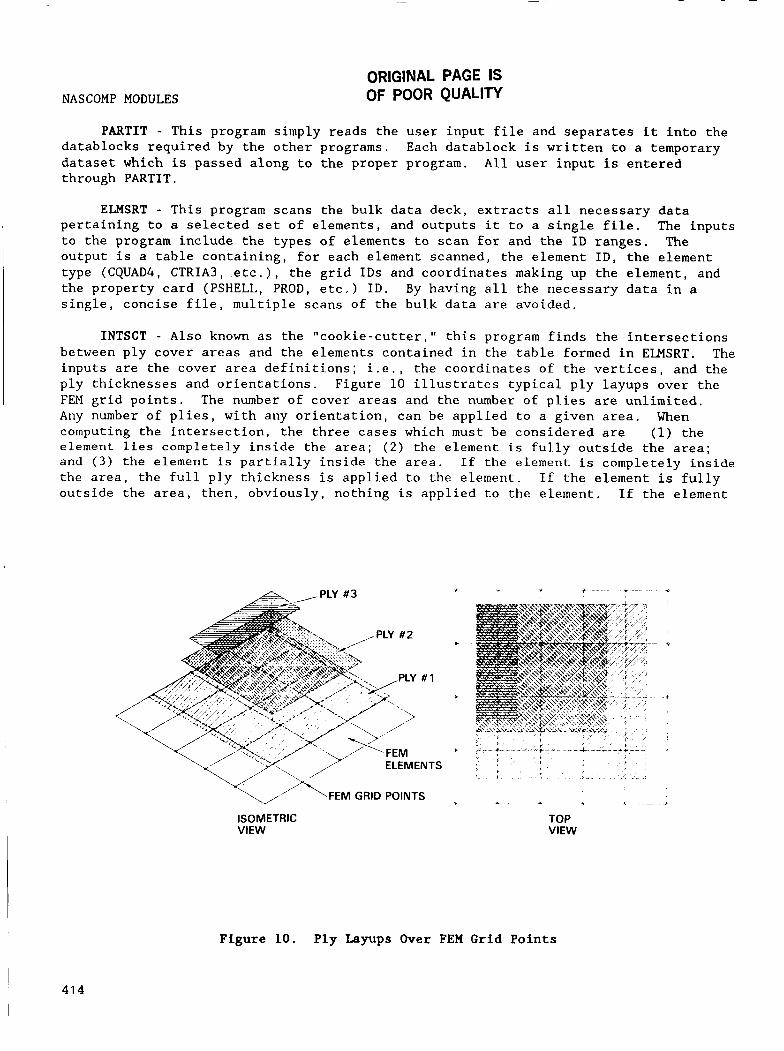
NASCOMP MODULES ORIGINAL PAGE IS OF POOR QUALITY
PARTIT - This program simply reads the user input file and separates it into the datablocks required by the other programs. dataset which is passed along to the proper program. through PARTIT.
Each datablock is written to a temporary All user input is entered
ELMSRT - This program scans the bulk data deck, extracts all necessary data pertaining to a selected set of elements, and outputs it to a single file. The inputs to the program include the types of elements to scan for and the ID ranges. The output is a table containing, for each element scanned, the element ID, the element type (CQUAD4, CTRIA3, etc.), the grid IDS and coordinates making up the element, and the property card (PSHELL, PROD, etc.) ID. By having all the necessary data in a single, concise file, multiple scans of the bulk data are avoided.
INTSCT - Also known as the "cookie-cutter," this program finds the intersections between ply cover areas and the elements contained in the table formed in ELMSRT. The inputs are the cover area definitions; i.e., the coordinates of the vertices, and the ply thicknesses and orientations. FEM grid points. The number of cover areas and the number o f plies are unlimited. Any number of plies, with any orientation, can be applied to a given area. When computing the intersection, the three cases which must be considered are (1) the element lies completely inside the area; (2) the element is fully outside the area; and ( 3 ) the element is partially inside the area. the area, the full ply thickness is applied to the element. outside the area, then, obviously, nothing is applied to the element. If the element
Figure 10 illustrates typical ply layups over the
If the element is completely inside If the element is fully
t - v
- -
ELEMENTS
L >
ISOMETRIC VIEW
TOP VIEW
Figure 10. Ply Layups Over FEM Grid Points
41 4
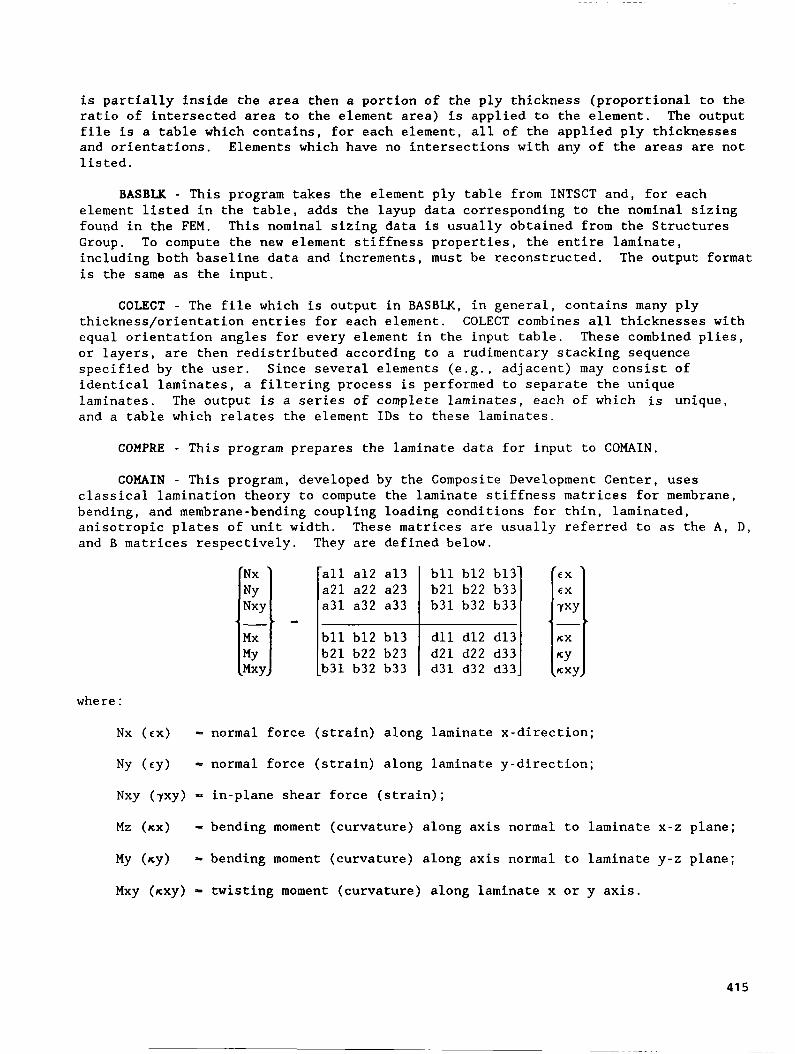
is partially inside the area then a portion of the ply thickness (proportional to the ratio of intersected area to the element area) is applied to the element. The output file is a table which contains, for each element, all of the applied ply thicknesses and orientations. Elements which have no intersections with any of the areas are not listed.
all a12 a13 a21 a22 a23 a31 a32 a33
bll b12 b13 b21 b22 b23 b31 b32 b33
BASBLK - This program takes the element ply table from INTSCT and, for each element listed in the table, adds the layup data corresponding to the nominal sizing found in the FEM. Group. To compute the new element stiffness properties, the entire laminate, including both baseline data and increments, must be reconstructed. is the same as the input.
This nominal sizing data is usually obtained from the Structures
The output format
bll b12 b13 b21 b22 b33 b31 b32 b33
dll d12 d13 d21 d22 d33 d31 d32 d33
COLECT - The file which is output in BASBLK, in general, contains many ply thickness/orientation entries for each element. COLECT combines all thicknesses with equal orientation angles for every element in the input table. These combined plies, or layers, are then redistributed according to a rudimentary stacking sequence specified by the user. Since several elements (e.g., adjacent) may consist of identical laminates, a filtering process is performed to separate the unique laminates. The output is a series of complete laminates, each of which is unique, and a table which relates the element IDS to these laminates.
COMPRE - This program prepares the laminate data for input to COMAIN.
COMAIN - This program, developed by the Composite Development Center, uses classical lamination theory to compute the laminate stiffness matrices for membrane, bending, and membrane-bending coupling loading conditions for thin, laminated, anisotropic plates of unit width. These matrices are usually referred to as the A , D, and B matrices respectively. They are defined below.
where :
Nx (ex) - normal force (strain) along laminate x-direction; Ny (cy) = normal force (strain) along laminate y-direction;
Nxy (7xy) - in-plane shear force (strain); Mz (nx) - bending moment (curvature) along axis normal to laminate x-z plane; My (ny) = bending moment (curvature) along axis normal to laminate y-z plane;
Mxy (nxy) - twisting moment (curvature) along laminate x or y axis.
41 5
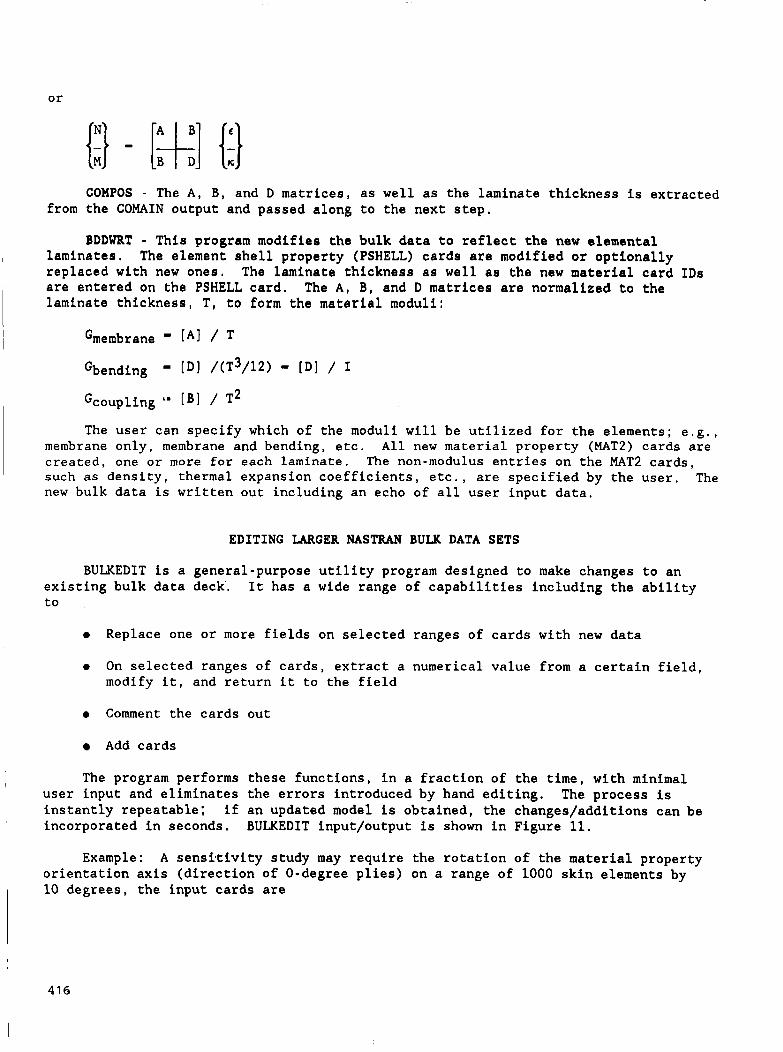
or
COMPOS - The A, B, and D matrices, as well as the laminate thickness is extracted from the COMAIN output and passed along to the next step.
BDDWRT - This program modifies the bulk data to reflect the new elemental laminates. replaced with new ones. The laminate thickness as well as the new material card IDS are entered on the PSHELL card, The A , B, and D matrices are normalized to the laminate thickness, T, to form the material moduli:
I The element shell property (PSHELL) cards are modified or optionally
Gmembrane [ A ] 1
The user can specify which of the moduli will be utilized for the elements; e.g., membrane only, membrane and bending, etc. All new material property (MAT2) cards are created, one or more for each laminate. The non-modulus entries on the MAT2 cards, such as density, thermal expansion coefficients, etc., are specified by the user. The new bulk data is written out including an echo of all user input data.
EDITING LARGER NASTRAN BULK DATA SETS
BULKEDIT is a general-purpose utility program designed to make changes to an existing bulk data deck. to
It: has a wide range of capabilities including the ability
e Replace one or more fields on selected ranges of cards with new data
e On selected ranges of cards, extract a numerical value from a certain field, modify it, and return it to the field
e Comment the cards out
Add cards
The program performs these functions, in a fraction of the time, with minimal user input and eliminates the errors introduced by hand editing. instantly repeatable; incorporated in seconds. BULKEDIT input/output is shown in Figure 11.
The process is if an updated model is obtained, the changes/additions can be
Example: A sensitivity study may require the rotation of the material property orientation axis (direction of 0-degree plies) on a range of 1000 skin elements by 10 degrees, the input cards are
I
41 6
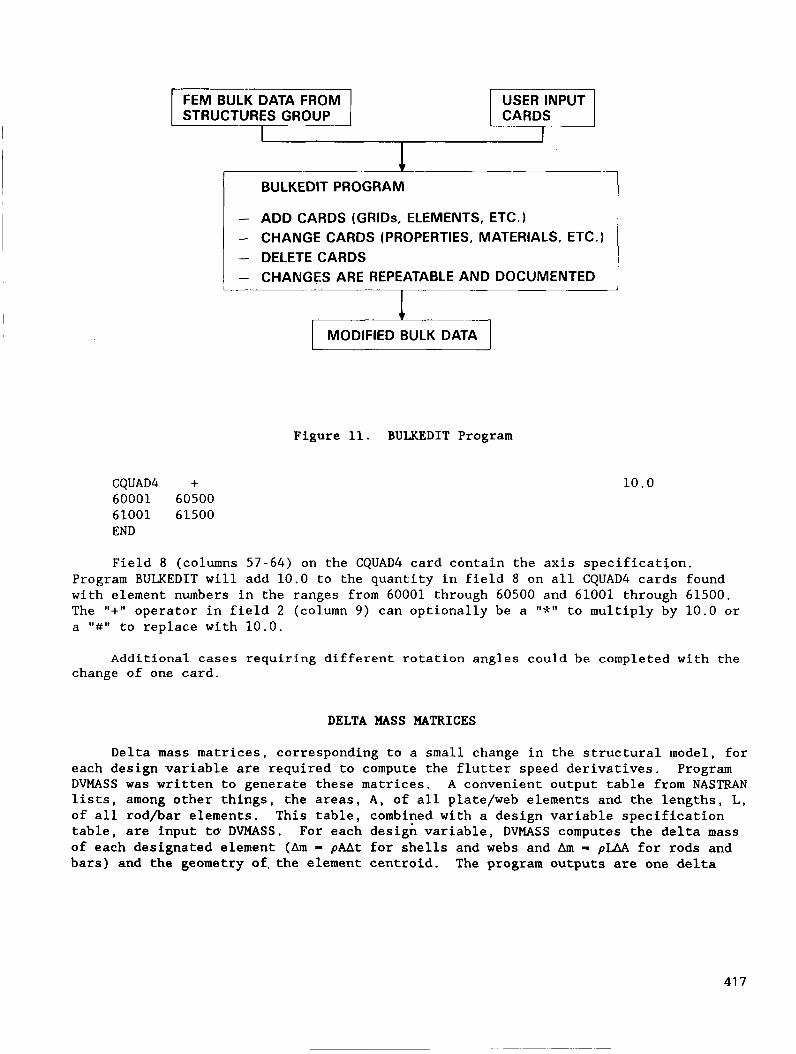
FEM BULK DATA FROM STRUCTURES GROUP
BULKEDIT PROGRAM
- - - DELETE CARDS
ADD CARDS (GRIDS, ELEMENTS, ETC.) CHANGE CARDS (PROPERTIES, MATERIALS, ETC.)
, - CHANGES ARE REPEATABLE AND DOCUMENTED
USER INPUT
CQUAD4 + 60001 60500 61001 61500 END
Figure 11. BULKEDIT Program
10.0
Field 8 (columns 57-64) on the CQUAD4 card contain the axis specification. Program BULKEDIT will add 10.0 to the quantity in field 8 on all CQUAD4 cards found with element numbers in the ranges from 60001 through 60500 and 61001 through 61500. The 11+1 , operator in field 2 (column 9) can optionally be a It*" to multiply by 10.0 or a 1 1 # 1 1 to replace with 10.0.
Additional cases requiring different rotation angles could be completed with the change of one card.
DELTA MASS MATRICES
Delta mass matrices, corresponding to a small change in the structural model, for each design variable are required to compute the flutter speed derivatives. DVMASS was written to generate these matrices. A convenient output table from NASTRAN lists, among other things, the areas, A , of all plate/web elements and the lengths, L , of all rodbar elements. This table, combined with a design variable specification table, are input t6' DVMASS. of each designated element (Am - pAAt for shells and webs and Am - pLAA for rods and bars) and the geometry of,the element centroid.
Program
For each design variable, DVMASS computes the delta mass
The program outputs are one delta
41 7
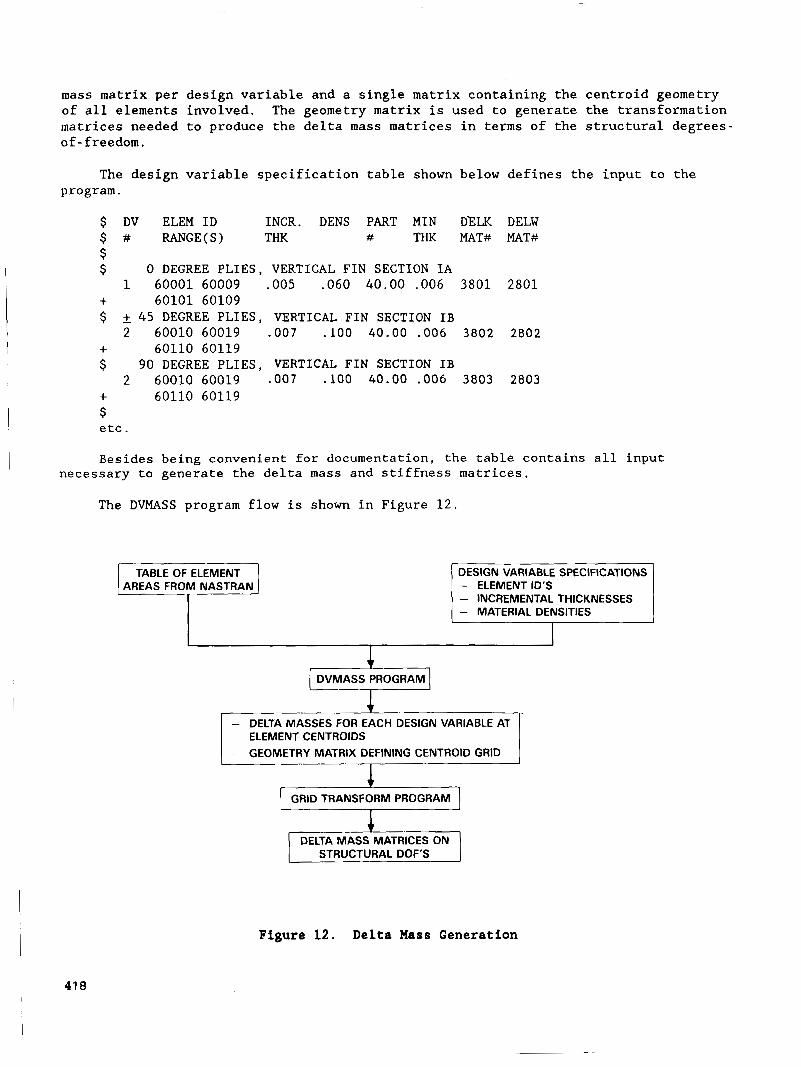
mass matrix per of all elements matrices needed of - freedom.
design variable and a single matrix containing the centroid geometry involved. to produce the delta mass matrices in terms of the structural degrees-
The geometry matrix is used to generate the transformation
The design variable specification table shown below defines the input to the program.
$ DV ELEM ID INCR. DENS PART MIN DXLK DELW $ # RANGE(S) THK # THK MAT# MAT#
$ 0 DEGREE PLIES, VERTICAL FIN SECTION IA
+ 60101 60109 $ 2 45 DEGREE PLIES, VERTICAL FIN SECTION IB
+ 60110 60119 $ 90 DEGREE PLIES, VERTICAL FIN SECTION IB
+ 60110 60119 $ etc.
$
1 60001 60009 .005 .060 40.00 .006 3 8 0 1 2 8 0 1
2 60010 60019 .007 . l o 0 40.00 .006 3802 2802
2 60010 60019 .007 .lo0 40.00 .006 3803 2803
I Besides being convenient f o r documentation, the table contains all input necessary to generate the delta mass and stiffness matrices.
The DVMASS program flow is shown in Figure 1 2 .
DESIGN VARIABLE SPECIFICATIONS - ELEMENT ID'S - INCREMENTAL THICKNESSES I - MATERIAL DENSITIES
+ DVMASS PROGRAM
1
1
- DELTA MASSES FOR EACH DESIGN VARIABLE AT ELEMENT CENTROIDS
- GEOMETRY MATRIX DEFINING CENTROID GRID
GRID TRANSFORM PROGRAM
I DELTA MASS MATRICES ON
Figure 12. Delta Mass Generation
418
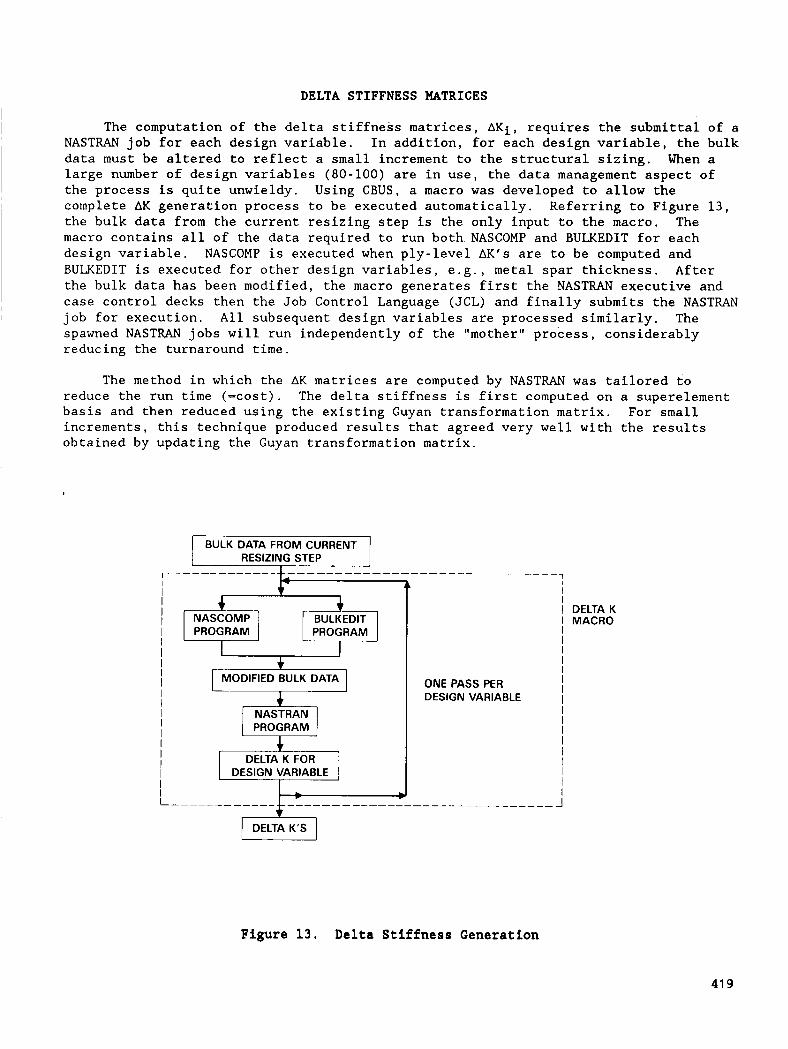
DELTA STIFFNESS MATRICES
The computation of the delta stiffness matrices, AKi, requires the submittal of a NASTRAN job for each design variable. In addition, for each design variable, the bulk data must be altered to reflect a small increment to the structural sizing. When a large number of design variables (80-100) are in use, the data management aspect of the process is quite unwieldy. Using CBUS, a macro was developed to allow the complete AK generation process to be executed automatically. the bulk data from the current resizing step is the only input to the macro. The macro contains all of the data required to run both NASCOMP and BULKEDIT for each design variable. BULKEDIT is executed for other design variables, e.g., metal spar thickness. After the bulk data has been modified, the macro generates first the NASTRAN executive and case control decks then the Job Control Language (JCL) and finally submits the NASTRAN job for execution. All subsequent design variables are processed similarly. The spawned N A S T W jobs will run independently of the "mother" process, considerably reducing the turnaround time.
Referring to Figure 1 3 ,
NASCOMP is executed when ply-level AK's are to be computed and
The method in which the AK matrices are computed by NASTRAN was tailored to reduce the run time (-cost). The delta stiffness is first computed on a superelement basis and then reduced using the existing Guyan transformation matrix. For small increments, this technique produced results that agreed very well with the results obtained by updating the Guyan transformation matrix.
* I I
I
MODIFIED BULK DATA I
I PROGRAM I I I I I I
i DELTA K I MACRO I I
I I
I I
ONE PASS PER DESIGN VARIABLE I
!
Figure 13. Delta Stiffness Generation
41 9

FLUTTER SPEED DERIVATIVES
The delta stiffness matrices, AK, and the corresponding delta mass matrices, AM, one for each design variable, are used to compute the flutter derivatives (Figure 1 4 ) . At the present time, there is the capability to compute derivatives for two types of modes, at the flutter crossing and at the top of the hump mode. The derivatives at the flutter crossing, the point where the mode in neutrally stable are
- The derivative of the flutter crossing speed with respect to the - 6V 6mi design variable i. [KEAS/lb]
= The derivative of the flutter crossing frequency with respect to the design variable i. [Hz/lb]
- 6f 6mi
The derivatives at the top of the hump mode, the point of minimum damping, are
= ' The derivative of the top of the hump speed with respect to the design - 6V 6mi variable i. [ KEAS/lb]
k- 6mi - The derivative of the damping value at the top of the hump with respect
to the design variable i. [Dercent damping/lb]
Computing the flutter derivafiv'es has traditionally been a two step process: perform a flutter analysis to get the frequency and damping versus speed data (VFG plots); then manually select the critical modes and compute the derivatives.
lth FLUTTER SPEED CONDITION (Vp ff. Mf)
FLUTTER SPEED DER I VAT1 V ES
Figure, 14. Flutter Speed Derivatives
~ 4 20
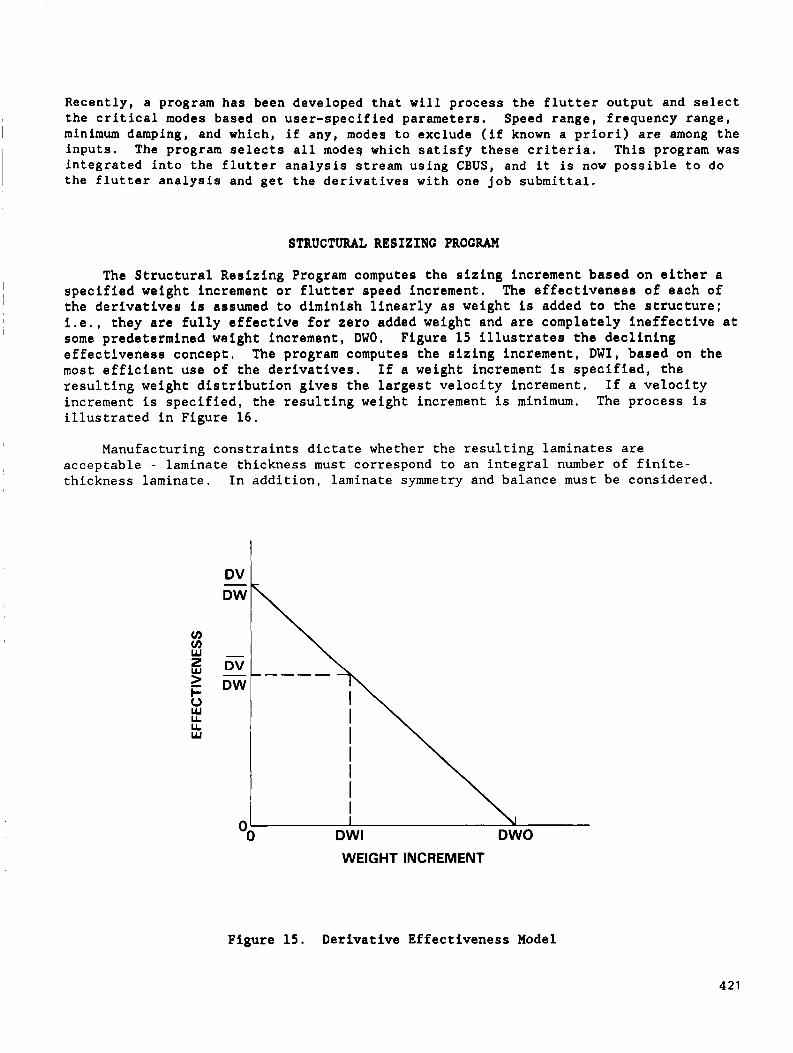
Recently, a program has been developed that will process the flutter output and select the critical modes based on user-specified parameters. Speed range, frequency range, minimum damping, and which, if any, modes to exclude (if known a priori) are among the inputs. The program selects all modes which satisfy these criteria. This program was integrated into the flutter analysis stream using CBUS, and it is now possible to do the flutter analysis and get the derivatives with one job submittal.
STRUCTURAL RESIZING PROGRAM
The Structural Resizing Program computes the sizing increment based on either a specified weight increment or flutter speed increment. The effectiveness of each of the derivatives is assumed to diminish linearly as weight is added to the structure; i.e., they are fully effective for zero added weight and are completely ineffective at some predetermined weight increment, DWO. Figure 15 illustrates the declining effectiveness concept. The program computes the sizing increment, DWI, based on the most efficient use of the derivatives. resulting weight distribution gives the largest velocity increment. If a velocity increment is specified, the resulting weight increment is minimum. The process is illustrated in Figure 16.
If a weight increment is specified, the
, Manufacturing constraints dictate whether the resulting laminates are acceptable - laminate thickness must correspond to an integral number of finite- thickness laminate. In addition, laminate symmetry and balance must be considered.
I
WEIGHT INCREMENT
Figure 15. Derivative Effectiveness Model
421

FLUTTER SPEED DERIVATIVES ONE FLUTTER MODE
- STRESS CONSTRAINTS - DERIVATIVE EFFECTIVENESSES STRUCTURAL
RESIZING PROGRAM
4 - AW OR AV CONSTRAINT - MANUFACTURING CONSTRAINTS
NO ACCEPT Ce- DESIGN VARIABLE
, I r I
Figure 16. S t r u c t u r a l Resizing Program
UPDATED MASS AND STIFFNESS MATRICES
After the r e s i z e increment has been determined us ing the r e s i z i n g program, the new s t i f f n e s s and mass matr ices are generated. The r e s i z e program outputs the incremental thicknesses t o be appl ied t o each design v a r i a b l e . These increments a r e then input t o the s t i f f n e s s update macro ( see Figure 1 7 ) . The macro generates a l l of the necessary con t ro l cards f o r the BULKEDIT program and the NASCOMP programs. Similar t o the Del ta K genera t ion process , the update macro modifies the bulk da t a as requi red and spawns a s i n g l e batch j o b . The bulk da t a i s saved f o r use i n genera t ing a new s e t of AKs. The f i r s t s t e p of t he job i s the execut ion of NASTRAN t o compute the updated s t i f f n e s s matr ix . The second s t e p is a FAMAS program t h a t w i l l generate the updated mass matr ix . The mass matr ix is computed by adding an incremental mass matrix t o the nominal mass matr ix . The incremental mass matr ix i s c a l c u l a t e d using mul t ip les of the d e l t a mass matr ices (Am's) based on the r e s i z i n g increment.
I
EXAMPLES AND RESULTS
I Dual Rudder V e r t i c a l S t a b i l i z e r
The i n i t i a l design of the dual rudder ver t ica l s t a b i l i z e r w a s s t r e n g t h s i z e d f o r loads . The design, however, w a s d e f i c i e n t i n f l u t t e r margin requirements by more than 100 KEAS. The s t r u c t u r a l r e s i z i n g f o r s t i f f n e s s goal was t o hold the weight cons tan t ,
I keep the s t r a i n margins a t o r below the i n i t i a l design levels and raise the f l u t t e r
422
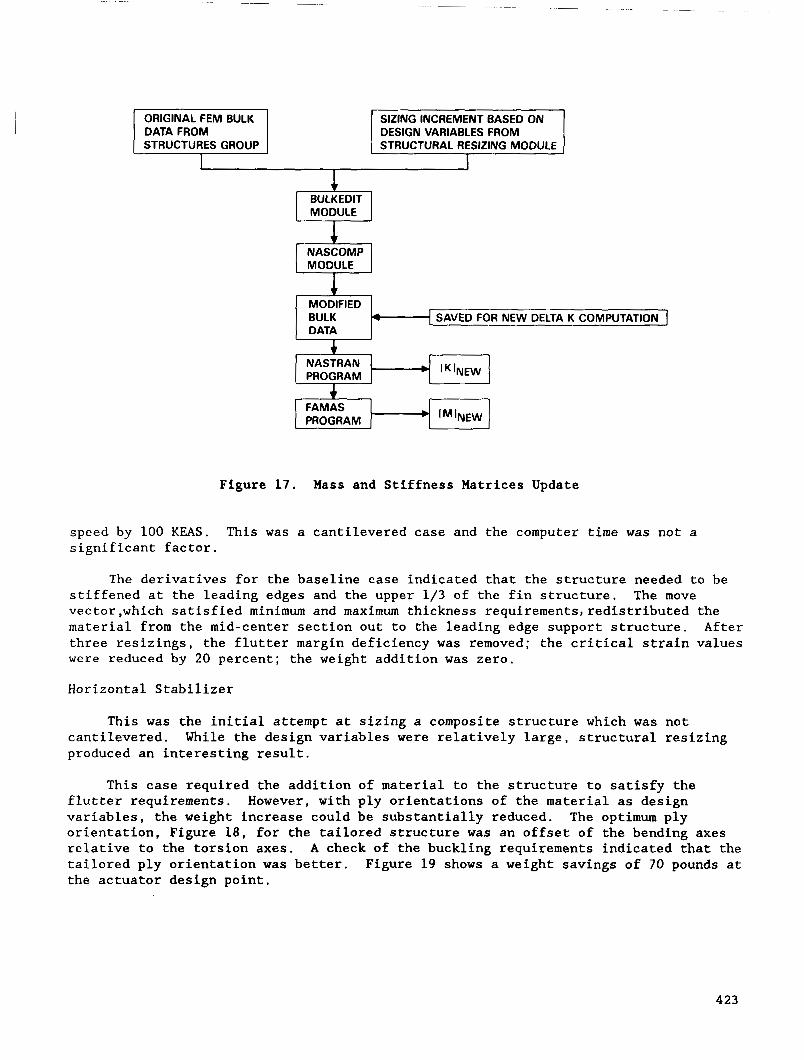
ORIGINAL FEM BULK DATA FROM
MODIFIED
DATA 1 BULK
SIZING INCREMENT BASED ON DESIGN VARIABLES FROM STRUCTURAL RESIZING MODULE
4 {SAVED FOR NEW DELTA K COMPUTATION I
[ K ~ N E W NASTRAN PROGRAM
FAMAS PROGRAM
Figure 17. Mass and Stiffness Matrices Update
speed by 100 KEAS. significant factor.
This was a cantilevered case and the computer time was not a
The derivatives for the baseline case indicated that the structure needed to be stiffened at the leading edges and the upper 1/3 of the €in structure. vector,which satisfied minimum and maximum thickness requirements, redistributed the material from the mid-center section out to the leading edge support structure. After three resizings, the flutter margin deficiency was removed; the critical strain values were reduced by 20 percent; the weight addition was zero.
The move
Horizontal Stabilizer
This was the initial attempt at sizing a composite structure which was not cantilevered. While the design variables were relatively large, structural resizing produced an interesting result.
This case required the addition of material to the structure to satisfy the flutter requirements. However, with ply orientations of the material as design variables, the weight increase could be substantially reduced. The optimum ply orientation, Figure 18, for the tailored structure was an offset of the bending axes relative to the torsion axes. A check of the buckling requirements indicated that the tailored ply orientation was better. Figure 19 shows a weight savings of 70 pounds at the actuator design point.
423
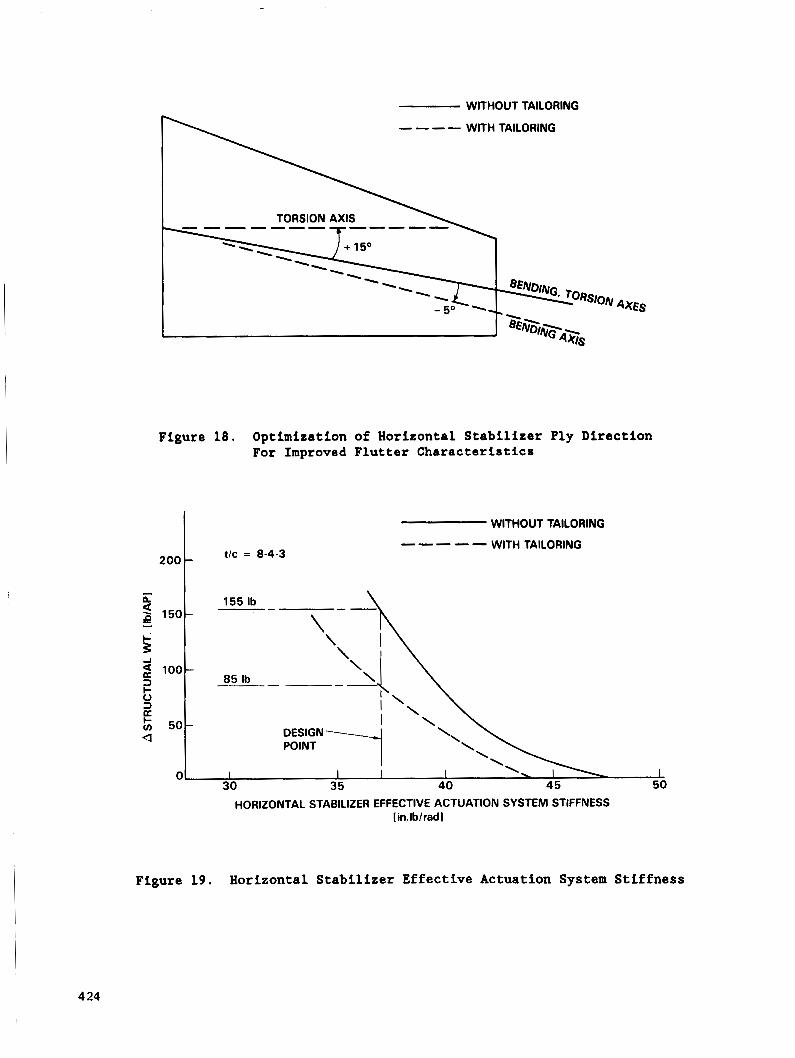
WITHOUT TAILORING
WITH TAILORING
Figure 18. Optimization of Horizontal Stabilizer Ply Direction For Improved Flutter Characteristics
t l ~ = 8-4-3
155 Ib
85 Ib
WITHOUT TAILORING
WITH TAILORING -----
I - \ '\ DESIGN
POINT
OL I I I 1 35 40 45 50 30
HORIZONTAL STABILIZER EFFECTIVE ACTUATION SYSTEM STIFFNESS I in.lb/rad I
Figure 19. Horizontal Stabilizer Effective Actuation System Stiffness
I 4 24
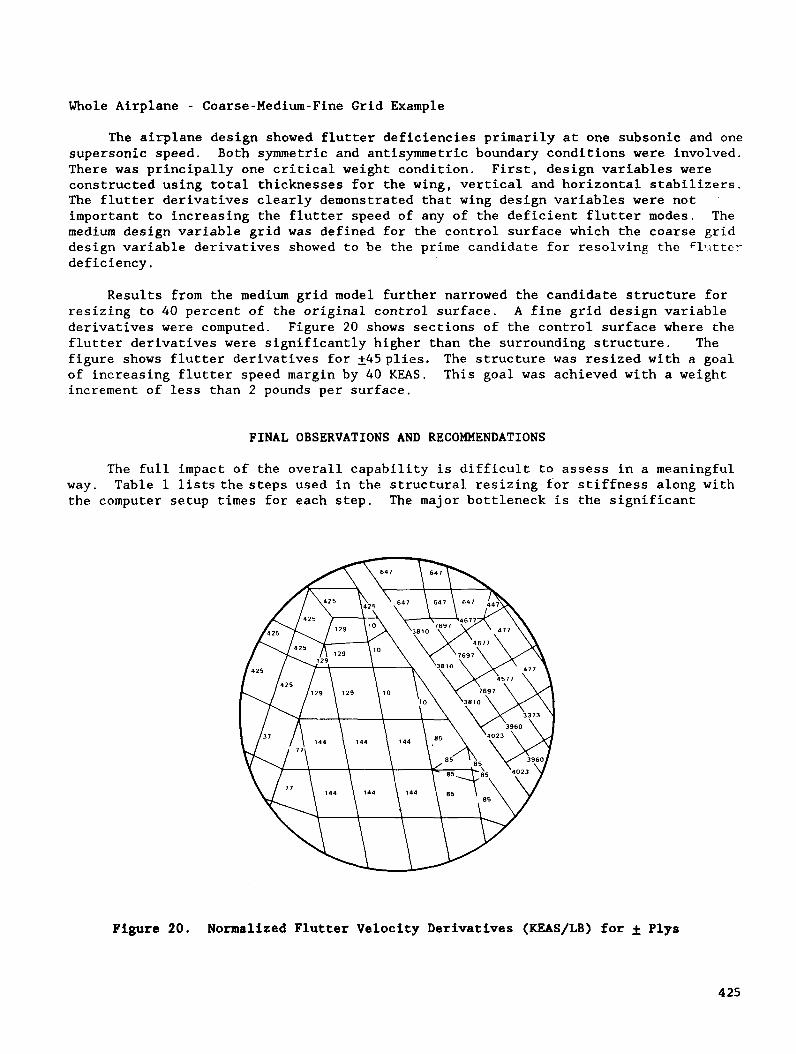
Whole Airplane - Coarse-Medium-Fine Grid Example
The airplane design showed flutter deficiencies primarily at one subsonic and one supersonic speed. Both symmetric and antisymmetric boundary conditions were involved. There was principally one critical weight condition. constructed using total thicknesses for the wing, vertical and horizontal stabilizers. The flutter derivatives clearly demonstrated that wing design variables were not important to increasing the flutter speed of any of the deficient flutter modes. The medium design variable grid was defined for the control surface which the coarse grid design variable derivatives showed to be the prime candidate for resolving the f l 7 i t t e r
deficiency.
First, design variables were
Results from the medium grid model further narrowed the candidate structure for resizing t o 40 percent of the original control surface. A fine grid design variable derivatives were computed. Figure 20 shows sections of the control surface where the flutter derivatives were significantly higher than the surrounding structure. The figure shows flutter derivatives for +45plies. The structure was resized with a goal of increasing flutter speed margin by 40 KEAS. This goal was achieved with a weight increment of less than 2 pounds per surface.
FINAL OBSERVATIONS AND RECOMMENDATIONS
The full impact of the overall capability is difficult to assess in a meaningful Table 1 liststhe steps used in the structural resizing f-or stiffness along with way.
the computer setup times for each step. The major bottleneck is the significant
Figure 20. Normalized Flutter Velocity Derivatives (KEAS/LB) for & Plys
4 25

TABLE 1. DESIGN TO STIFFNESS TABLE SUMMARY
GENERAL MODEL STATISTICS
NASTRAN Gset DOF - 24000 A s e t D O F e 400
VIBRATION DOF- 370 FLUTTER DOF- 50
DESIGN VARIABLES- 80 TO 1 0 0
STEP TASK SOFTWARE CONDITIONS OUTPUTS SETUP TIMES CPU TIMES ~~ ~~~~~ ~~ ~
1 FLUTTER FLUTTER MACRO 4 MACH NUMBERS VFG. VECTOR 4 MINUTES 80 CPU BASELINE CONTROLLED BY 5 FUEL CONDITIONS PLOTS, FOR SETUP MINUTES
30 FREE FOR- SYM AND ANTISYM ENERGY MATTED INPUTS- PLOTS, PER RUN TITLES VEL RANGE 80 FLUTTER MACH, FUEL, DERIVATIVES DERIVATIVES
PER RUN (IBM 3081)
2 SENSITIVITY FLUTTER MACRO SAME AS STEP 1 ACTUATOR 6 MINUTES 1 0 TO 50 CPU STUDIES SAME AS STEP 1 STIFFNESS, FOR SETUP MINUTES
AERO- PER RUN DEPENDS ON DYNAMIC THE TASK FACTOR, PER RUN CONTROL SURF H.M.. A.C. SHIFT, CANTILEVERED ANALYSIS, MODE TRACKING
I I
3 DESIGN SIMPLE BATCH VARIABLE PROGRAMS FOR DEFINITIONS PLOTTING FEM
GRID, ELEMENTS
PREPARATION OF INPUT DATA FOR NASCOMP. DELTA MASS, ETC. PROGRAMS
COARSE WHOLE AIRPLANE GRID
MEDIUM SURFACE GRID
FINE SURFACE GRID
80 TO 100 DESIGN VARIABLES FOR EACH GRID
2 PERSON LESS THAN 20 DAYS PER MINUTES GRID TOTAL
CADAM
4 26

TABLE 1. DESIGN TO STIFFNESS TABLE SUMMARY (Continued)
~ ~~
CPU TIMES STEP TASK SOFTWARE CONDITIONS OUTPUTS SETUP TIMES
4 DELTA DVMASS BATCH DATA FROM OUTPUTS BO 30 MINUTES LESS THAN MASS PROGRAM STEP 3 TO 100 DELTA SETUP 5 MINUTES MATRICES MASS TOTAL
MATRICES
5 DELTA DELTAK MACRO DATA FROM OUTPUTS 80 60 MINUTES 400 TO 500 STIFFNESS (UNDER CBUS) STEP 3 TO 100 DELTA SETUP CPU MINUTES MATRICES IS A MOTHER STIFFNESS TOTAL
JOB WHICH MATRICES GENERATES80 TO 100 NASTRAN JOBS
6 FLUTTER FLUTTER MACRO SAME AS STEP 1 FLUTTER PART OF 12 MINUTES FOR FIRST DERIVATIVES ___ VELOCITY STEP 1
OPTION-COMPUTED DERIVATIVES OR 3 MINUTES FLUTTER WHEN FLUTTER MODAL FLUTTER POINTS OR TOP OF DAMPING MODEiHUMP HUMP MODES DERIVATIVES APPEAR THEN 3
MINUTES FOR EACH ADDITIONAL
7 RESIZE BATCH/INTER OPTIONS TO SET DESIGN 30 MINUTES LESS THAN STRUCTURE ACTIVE DERIVATIVE VARIABLES 2 MINUTES
PROGRAMS EFFECTIVENESS INCREMENTS FACTORS, ACTIVE/ INACTIVE DESIGN VARIABLES, MULTIPLE CONDI TIONS, WEIGHT ONIOFF. VELOCITY/ OR WEIGHT TARGET INCREMENTS
30 MINUTES 8 UPDATE UPDATE MACRO USES OUTPUT UPDATED 30 MINUTES STIFFNESS FROM STEP 7 STIFFNESS MATRIX SIMILAR TO MATRIX
MASS EXCEPT SUBMITS UPDATED MATRIX ONE NASTRAN MASS MATRIX
DELTAK MACRO
JOB
427
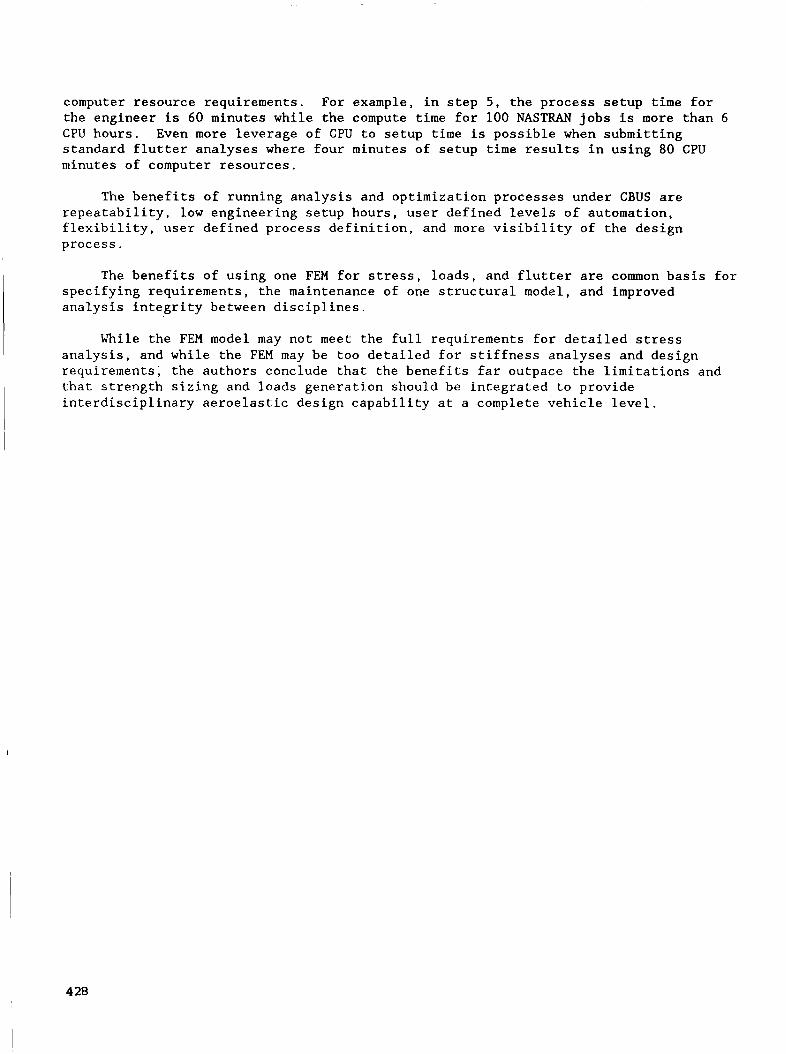
computer resource requirements. For example, in step 5, the process setup time for the engineer is 60 minutes while the compute time for 100 NASTRAN jobs is more than 6 CPU hours. Even more leverage of CPU to setup time is possible when submitting standard flutter analyses where four minutes of setup time results in using 80 CPU minutes of computer resources.
The benefits of running analysis and optimization processes under CBUS are repeatability, low engineering setup hours, user defined levels of automation, flexibility, user defined process definition, and more visibility of the design process.
The benefits of using one FEM for stress, loads, and flutter are common basis for specifying requirements, the maintenance of one structural model, and improved analysis integrity between disciplines.
While the FEM model may not meet the full requirements for detailed stress analysis, and while the FEM may be too detailed for stiffness analyses and design requirements, the authors conclude that the benefits far outpace the limitations and that strength sizing and loads generation should be integrated to provide interdisciplinary aeroelastic design capability at a complete vehicle level.
4 28

REFERENCES
1. Radovcich, N. A., "Preliminary Aeroelastic Design of Structures (PADS) Methods Development and Application," presented at the 56th AGARD Structures and Materials Panel Meeting, London, United Kingdom, April 1983.
2. Radovcich, N. A., "Some Experiences in Aircraft Aeroelastic Design Using Preliminary Aeroelastic Design of Structures (PADS)," presented at NASA Symposium on Recent Experiences in Multidisciplinary Analysis and Optimization, NASA Langley, April 24-26, 1984.
3. Radovcich, N. A., et al., "Study For the Optimization of a Transport Aircraft Wing For Maximum Fuel Efficiency," NASA CR-172551, January 1985.
4 29
N890 25167 AEROELASTIC TAILORING AND INTEGRATED WING DESIGN
Mike Love and Jon Bohlmann
GENERAL DYNAMICS Fort Worth Division
Copyright 0 1988 by General Dynamics Corporation. All rights reserved. Published by the National Aeronautics and Space Administration. with permission.
PRECEDING PAGE BLANK NOT FILMED 431
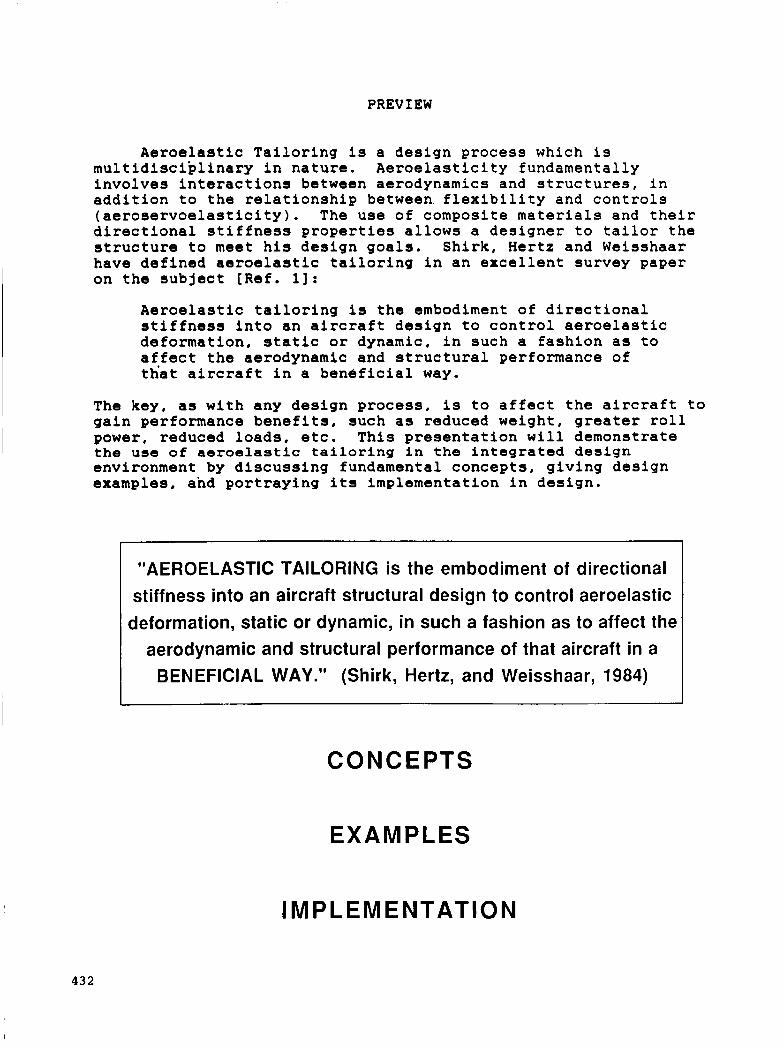
PREVIEW
432
Aeroelastic Tailoring is a design process which is multidisciplinary in nature. Aeroelasticity fundamentally involves interactions between aerodynamics and structures, in addition to the relationship between flexibility and controls (aeroservoelasticity). The use of composite materials and their directional stiffness properties allows a designer to tailor the structure to meet his design goals. Shirk, Hertz and Weisshaar have defined aeroelastic tailoring in an excellent survey paper on the subject [Ref. 11:
Aeroelastic tailoring is the embodiment of directional stiffness into an aircraft design to control aeroelastic deformation, static or dynamic, in such a fashion as to affect the aerodynamic and structural performance of that aircraft in a beneficial way.
The key, as with any design process, is to affect the aircraft to gain performance benefits, such as reduced weight, greater roll power, reduced loads, etc. This presentation will demonstrate the use of aeroelastic tailoring in the integrated design environment by discussing fundamental concepts, giving design examples, and portraying its implementation in design.
"AEROELASTIC TAILORING is the embodiment of directional stiffness into an aircraft structural design to control aeroelastic
deformation, static or dynamic, in such a fashion as to affect the aerodynamic and structural performance of that aircraft in a
BENEFICIAL WAY." (Shirk, Hertz, and Weisshaar, 1984)
CONCEPTS
EXAMPLES
IMPLEMENTATION
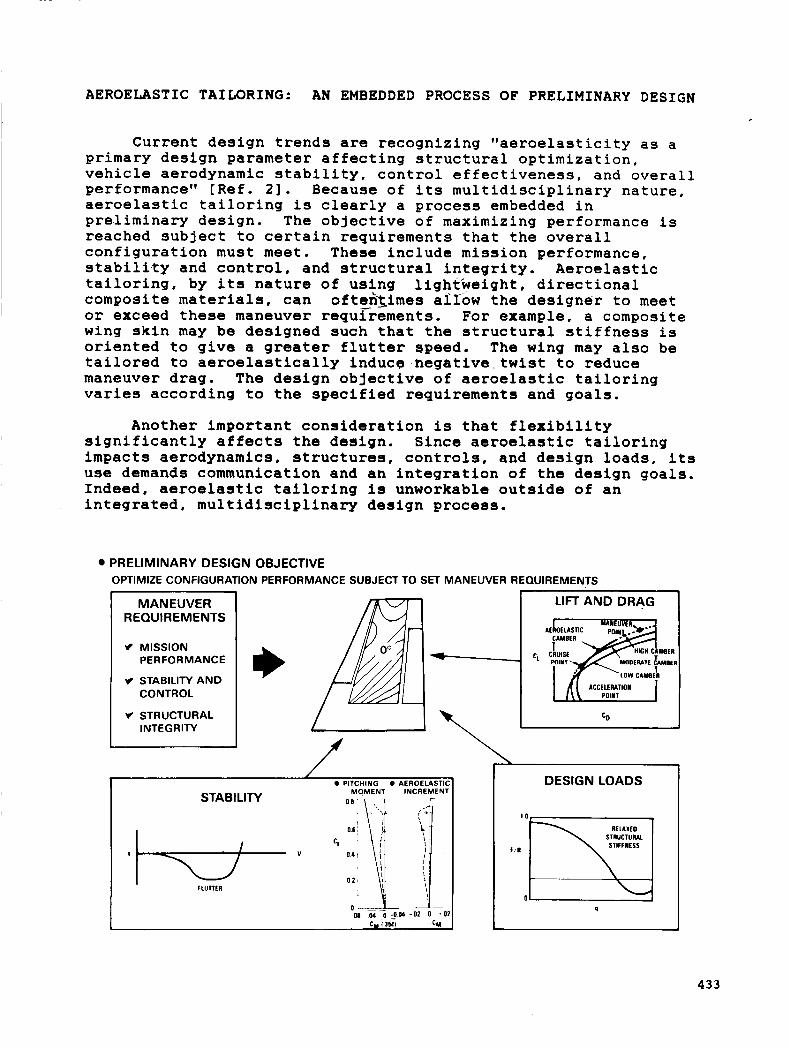
AEROELASTIC TAILORING: AN EMBEDDED PROCESS OF PRELIMINARY DESIGN
Current design trends are recognizing "aeroelasticity as a primary design parameter affecting structural optimization, vehicle aerodynamic stability, control effectiveness, and overall performance" [Ref. 21. Because of its multidisciplinary nature, aeroelastic tailoring is clearly a process embedded in preliminary design. The objective of maximizing performance is reached subject to certain requirements that the overall configuration must meet. These include mission performance, stability and control, and structural integrity. Aeroelastic tailoring, by its nature of using lightweight, directional composite materials, can oftenximes allow the designer to meet or exceed these maneuver requrrements. For example, a composite wing skin may be designed such that the structural stiffness is oriented to give a greater flutter speed. The wing may also be tailored to aeroelastically induce negative twist to reduce maneuver drag. The design objective of aeroelastic tailoring varies according to the specified requirements and goals.
Another important consideration is that flexibility significantly affects the design. Since aeroelastic tailoring impacts aerodynamics, structures, controls, and design loads, its use demands communication and an integration of the design goals. Indeed, aeroelastic tailoring is unworkable outside of an integrated, multidisciplinary design process.
PRELIMINARY DESIGN OBJECTIVE OPTIMIZE CONFIGURATION PERFORMANCE SUBJECT TO SET MANEUVER REQUIREMENTS
MANEUVER R EQUlR EMENTS
r) MISSION PERFORMANCE
r) STABILITY AND CONTROL
V STRUCTURAL INTEGRITY
f I , 0 PITCHING 0 AEROEIASTIC
MOMENT INCREMENT STABILITY 0 8 , -, c L o 6 \ j
I V 0 4 1 I I
1 I I I
I
I
0 2 1 i FLUTTER 1 I
- 0 - _ O( 04 0 10" -02 0 -02
CM 13521 C M
CD I c DESIGN LOADS
433
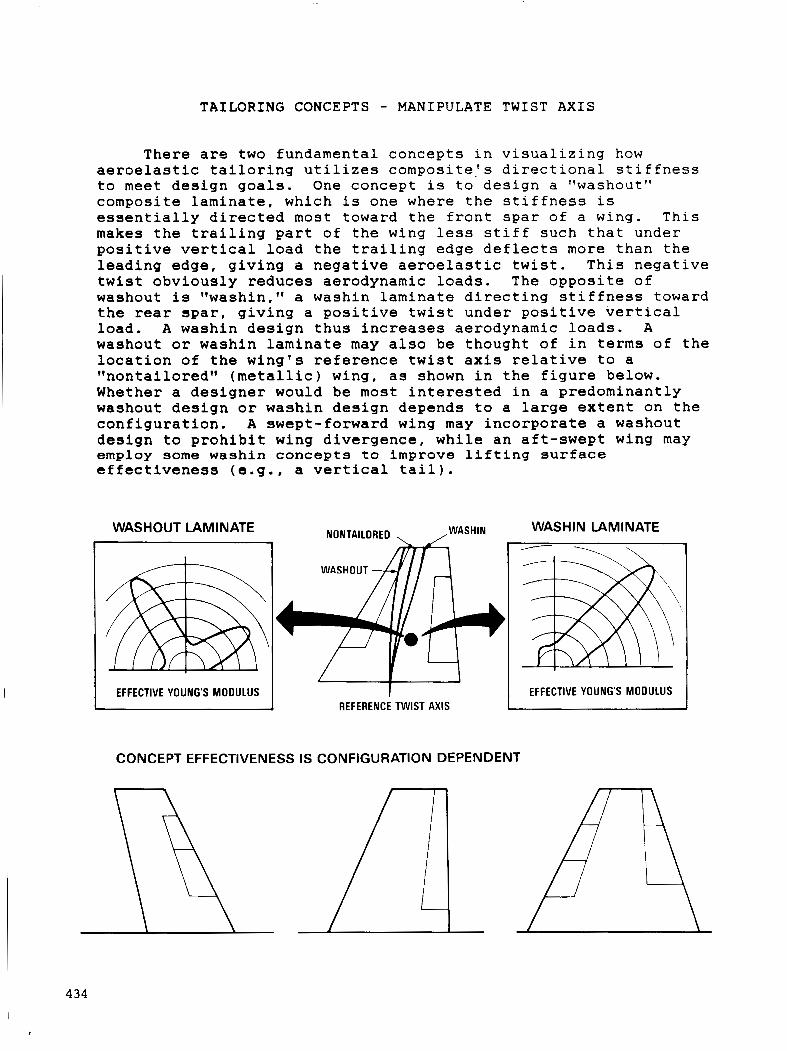
_-
TAILORING CONCEPTS - MANIPULATE TWIST AXIS
There are two fundamental concepts in visualizing how aeroelastic tailoring utilizes compositevls directional stiffness to meet design goals. One concept is to design a "washout" composite laminate, which is one where the stiffness is essentially directed most toward the front spar of a wing. This makes the trailing part of the wing less stiff such that under positive vertical load the trailing edge deflects more than the leading edge, giving a negative aeroelastic twist. This negative twist obviously reduces aerodynamic loads. The opposite of washout is "washin," a washin laminate directing stiffness toward the rear spar, giving a positive twist under positive vertical load. A washin design thus increases aerodynamic loads. A washout or washin laminate may also be thought of in terms of the location of the wing's reference twist axis relative to a vlnontailoredll (metallic) wing, as shown in the figure below. Whether a designer would be most interested in a predominantly washout design or washin design depends to a large extent on the configuration. A swept-forward wing may incorporate a washout design to prohibit wing divergence, while an aft-swept wing may employ some washin concepts t o improve l i f t i n g surface effectiveness (e.g., a vertical tail).
WASHOUT LAMINATE WASHIN NONTAILORED , / WASHIN LAMINATE
EFFECTIVE YOUNG'S MODULUS EFFECTIVE YOUNG'S MODULUS REFERENCE TWIST AXIS
CONCEPT EFFECTIVE N ESS IS CON Fl GU RAT1 0 N DEPEN DENT
434
I
L

OPTIMIZATION METHODS ARE KEY TO DESIGN STUDIES
It is obviously not sufficient for the designer to merely determine how to use aeroelastic tailoring in a fundamental sense. The makeup of the composite wing skin must be determined more exactly, along with assessing its interactions with such issues as, for example, wing planform shape. A s stated by McCullers [Ref. 31 , the design of a compQsite laminate "requires the determination of the number of plies and the orientation of each ply for the material(s) selected, which increases the magnitude and complexity of the design problem. Therefore, although optimization techniques are very useful in metal design problems, they are almost essential for the efficient design of composite structures." Computational methods using optimization algorithms allow one to design a tailored structure to determine structural feasibility and predict the weight required for a given geometric and controls configuration. These two issues are primary tasks of structural design in the preliminary design process. The variance in flexibility achievable in composites necessitates a converged structural design in order to establish valid parametric trades of planform, wing design, controls, and tailoring concepts.
0 CONVERGED PRELIMINARY STRUCTURAL DESIGNS
v STRUCTURAL FEASIBILITY - STRENGTH
- FLUl-fER
- CONTROL
v WEIGHT PREDICTION - ANALYSIS DETAILS
- LAMINATE REQUIREMENTS
- DESIGN DETAILS
PARAMETRIC GEOMETRIC TRADE STUDIES
DESIGNS THAT EXCEED TARGET DRAG LfVELS AT BOTH M 9 9 .% 1 6
0 3
0 2
0 1
0 0 1 2 3 4 5 -6 7 8 9
TWIST IOECREESI
WING DESIGN
DEPTH PLANFORM
CONTROL SURFACE
THICKNESS-TO-CHORD
435
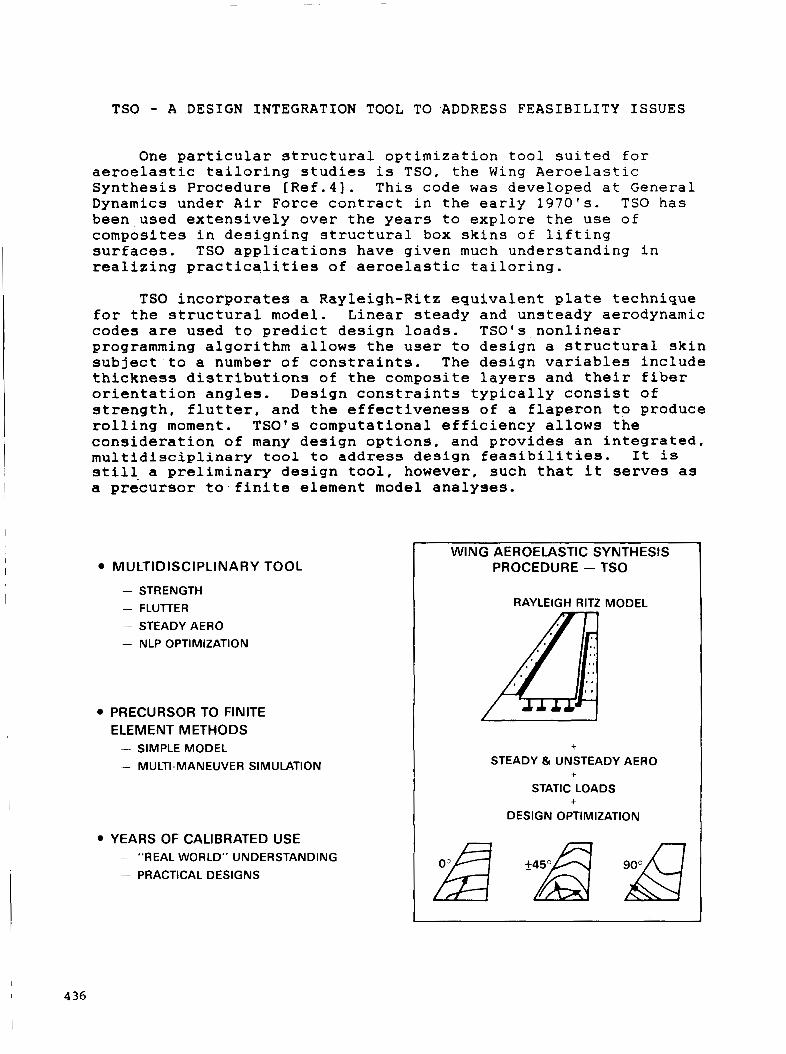
TSO - A DESIGN INTEGRATION TOOL TO ADDRESS FEASIBILITY ISSUES
One particular structural optimization tool suited f o r aeroelastic tailoring studies is TSO, the Wing Aeroelastic Synthesis Procedure rRef.41. This code was developed at General Dynamics under Air Force contract in the early 1970's. TSO has been used extensively over the years to explore the use of composites in designing structural box skins of lifting surfaces. TSO applications have given much understanding in realizing practicalities of aeroelastic tailoring.
TSO incorporates a Rayleigh-Ritz equivalent plate technique for the structural model. Linear steady and unsteady aerodynamic codes are used to predict design loads. TSO's nonlinear programming algorithm allows the user to design a structural skin subject to a number of constraints. The design variables include thickness distributions of the composite layers and their fiber orientation angles. Design constraints typically consist of strength, flutter, and the effectiveness of a flaperon to produce rolling moment. TSO's computational efficiency allows the consideration of many design options, and provides an integrated, multidisciplinary tool to address design feasibilities. It is still a preliminary design tool, however, such that it serves as a precursor to finite element model analyses.
MULTIDISCIPLINARY TOOL
- STRENGTH - FLUTTER - STEADY AERO - NLP OPTIMIZATION
PRECURSOR TO FINITE ELEMENT METHODS - SIMPLE MODEL - M U LTI - M A N E UV E R SI M U LATlO N
YEARS OF CALIBRATED USE - "REAL WORLD" UNDERSTANDING
- PRACTICAL DESIGNS
WING AEROELASTIC SYNTHESIS PROCEDURE - TSO
RAYLEIGH RlTZ MODEL
+ STEADY & UNSTEADY AERO
STATIC LOADS
DESIGN OPTIMIZATION
+
+
O0 A f450A 9oox7

WEIGHT PREDICTION ADDRESSED THROUGH EXPERIENCE
Despite TSO's ability to aeroelastically tailor the skin of a wing or other lifting surfaces for a set of design requirements, it lacks the structural detail of finite element methods. This means that TSO cannot adequately address such design details as buckling or bolted joints. Damage tolerance and manufacturing provide other considerations that affect the makeup of a composite laminate. Such details can have' a direct impact on the aeroelastic tailored design produced by TSO. Hence, previous design experience is incorporated into TSO through the use of strain limits, laminate ply percentages, shape functions and min and max gage thicknesses. Bolted joint details and low velocity impact considerations, for example, may be addressed by limiting fiber strains relative to fracture criteria. An envelope of acceptable laminate ply percentages is generally developed to account for ply stacking sequence effects in the sense of potential fracture mechanisms. Constraints have been formulated in TSO's penalty function scheme to address this issue. Weight for design details such as fasteners, sealants, and understructure are estimated through historical data. Buckling must be dealt with on the finite element level of analysis, and its impact to structural design is not to be taken lightly.
ANALYSIS DETAILS
BOLTED JOINTS (STRAIN LIMITS)
f
J 0 LAMINATE REQUIREMENTS
v DAMAGE TOLERANCE - STRAIN LIMITS - PERCENTAGE CONSTRAINTS
v MANUFACTURING - SHAPE FUNCTIONS - THICKNESS CONSTRAINTS
DESIGN DETAILS (FASTENERS, SEALANT, ETC.)
BUCKLING (?)
/ - a 2
/ Y
' I
437

WASHIN DESIGN INFLUENCED BY MATERIAL PROPERTIES
Let us turn now to three examples that demonstrate design sensitivities derived from implementing aeroelastic tailoring. The results in these examples were taken from TSO design studies of typical fighter aircraft configurations.
This first example is that of a vertical tail with a rudder control surface. The purpose of the study is to determine the effectiveness of various materials on the structural weight for a design criteria of strength, flutter, and primarily for rudder yaw effectiveness. The driving variable in the study was the lamina longitudinal stiffness which is governed by fiber stiffness. A washin laminate design is required to provide the necessary rudder effectiveness at a minimum weight. The graph illustrates a savings in structural weight for an increase in fiber stiffness. Also, the laminate becomes less directional (less washin) with the increase in stiffness. Since increased washin tendencies generally give better rudder effectiveness, the benefits of the greater stiffness are a trade between structural weight and rudder effectiveness. The designer could opt to waive the weight savings associated with a higher stiffness material and reinvest the weight to increase rudder effectiveness. Perhaps another trade might result in the necessity for the lower modulus material versus the requirements for aircraft control.
ACTUATOR
ROOT ATTACHMENT
0 FIBER STIFFNESS
- Stiffness Increase
- Implied Effectiveness
Gives a Less Washin Laminate
and Weight Benefits
0 VERTICAL TAIL (MIN. WEIGHT)
- Rudder Effectiveness - Flutter - Strength
36
z 0
34 2 I- z w a
-32 o
a 30 2
0 0
W W
$ 70 -
50 , ' , . I . , . 28 14 16 1 8 20 22 24 26
STIFFNESS (Ell, MSI)
4 38
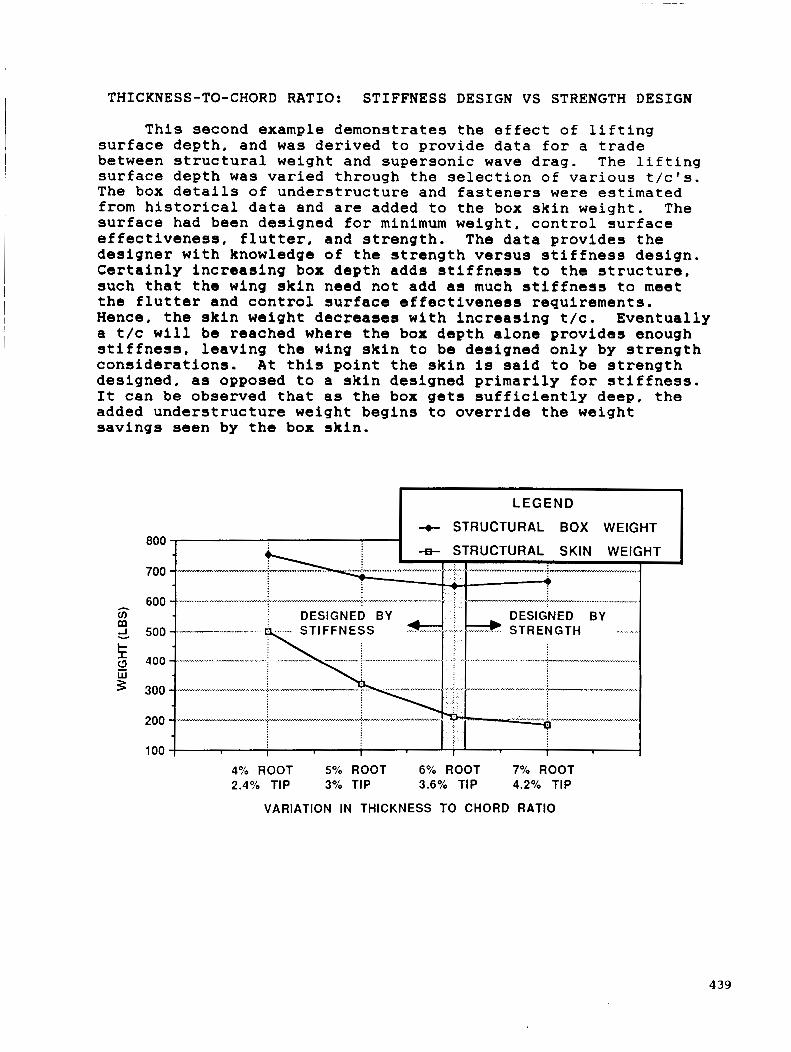
THICKNESS-TO-CHORD RATIO: STIFFNESS DESIGN VS STRENGTH DESIGN
This second example demonstrates the effect of lifting surface depth, and was derived to provide data for a trade between structural weight and supersonic wave drag. The lifting surface depth was varied through the selection of various t/c's. The box details of understructure and fasteners were estimated from historical data and are added to the box skin weight. The surface had been designed for minimum weight, control surface effectiveness, flutter, and strength. The data provides the designer with knowledge of the strength versus stiffness design. Certainly increasing box depth adds stiffness to the structure, such that the wing skin need not add as much stiffness to meet the flutter and control surface effectiveness requirements. Hence, the skin weight decreases with increasing t/c. Eventually a t/c will be reached where the box depth alone provides enough stiffness, leaving the wing skin to be designed only by strength considerations. At this point the skin is said to be strength designed, as opposed to a skin designed primarily for stiffness. It can be observed that as the box gets sufficiently deep, the added understructure weight begins to override the weight savings seen by the box skin.
LEGEND
+- STRUCTURAL BOX WEIGHT
-I+ STRUCTURAL SKIN WEIGHT 800
ROOT 7% ROOT 2.4% TIP 3% TIP 3.6% TIP 4.2% TIP
VARIATION IN THICKNESS TO CHORD RATIO
439
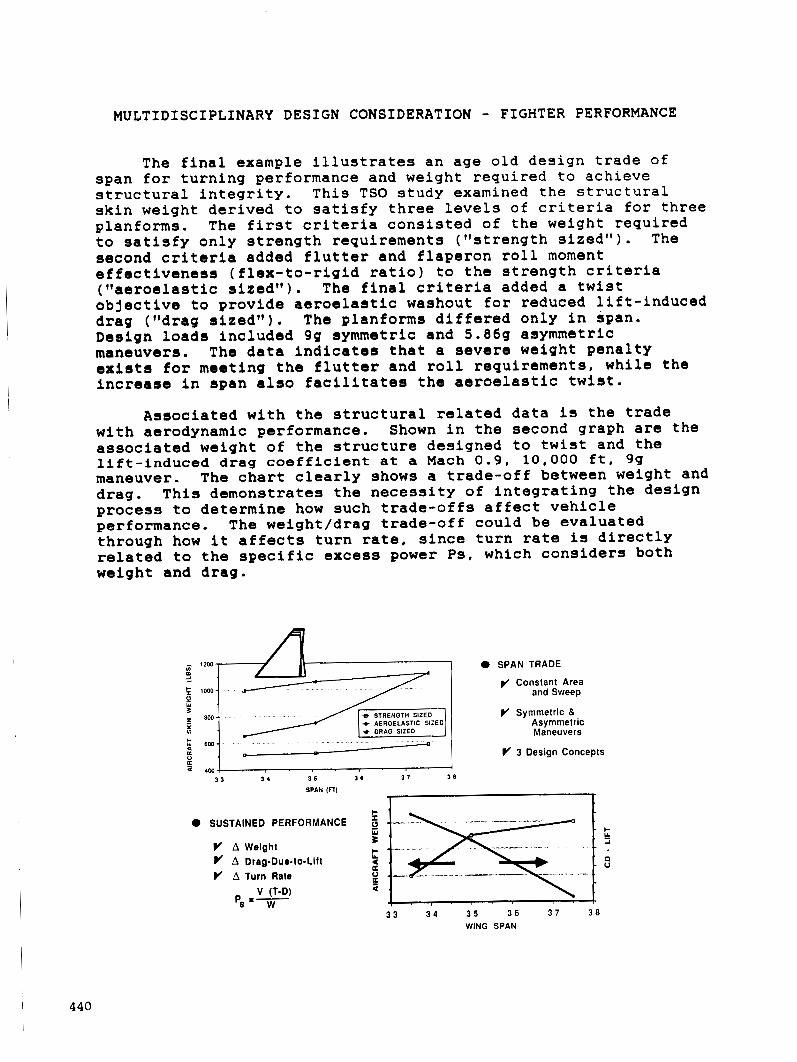
MULTIDISCIPLINARY DESIGN CONSIDERATION - FIGHTER PERFORMANCE
I 440
The final example illustrates an age old design trade of
This TSO study examined the structural span for turning performance and weight required to achieve structural integrity. skin weight derived to satisfy three levels of criteria for three planforms. The first criteria consisted of the weight required to satisfy only strength requirements ("strength sized"). second criteria added flutter and flaperon roll moment effectiveness (flex-to-rigid ratio) to the strength criteria (ftaeroelastic sized"). objective to provide aeroelastic washout for reduced lift-induced drag ("drag sizedtt). Design loads included 9g symmetric and 5.869 asymmetric maneuvers. exists for meeting the flutter and roll requirements, while the increase in span also facilitates the aeroelastic twist.
The
The final criteria added a twist
The planforms differed only in span.
The data indicates that a severe weight penalty
Associated with the structural related data is the trade with aerodynamic performance. associated weight of the structure designed to twist and the lift-induced drag coefficient at a Mach 0.9, 10,000 ft, 9g maneuver. drag. process to determine how such trade-offs affect vehicle performance. The weight/drag trade-off could be evaluated through how it affects turn rate, since turn rate is directly related to the specific excess power Ps, which considers both weight and drag.
Shown in the second graph are the
The chart clearly shows a trade-off between weight and This demonstrates the necessity of integrating the design
0 SPAN TRADE a 12w-
Y Constant Area and Sweep
Y Symmetric & Asymmetric Maneuvers
3 Design Concepts
+ AEROELASTIC SIZED
E ( 4 W 7 . . , . I . ,
3 1 1 4 3 5 1 6 1 7 3 8 SPAN in)
0 SUSTAINED PERFORMANCE
Y A Weight
Y A Turn Rate A Drag-Due-to-Lift
V (T-D) W Ps =-
E c Y * E 0
f 3 3 3 4 3 5 36 3 7 3 8
WING SPAN

OPTIMAL DESIGN - A RESULT OF SIMULATION
The previous examples demonstrated the need to integrate the design process while being able to simulate the impacts of various design options on the aeroelastic performance of the vehicle. Many factors enter the picture to adequately address multidisciplinary and integrated issues during optimization. As a result, it is important to be able to computationally simulate many multidisciplinary influences as accurately as possible so that sensitivity data may be generated. The figure below cites several examples of important design considerations. The underlying reason for considering these implications during design is that optimization techniques will exploit weaknesses in the computational simulation. For example, if the structure is preliminarily designed to only symmetric loads, significant redesign will be required later since asymmetric loads stre.ss the wing in critical areas as well.
0 WING DESIGN
v Camber Enhances Steady Aeroelastic Deflections
v Twist Reduces Steady Aeroelastic Deflections
0 CONTROLS CONFIGURATION
v Upwash and Downwash Within Entire Vehicle
v Control Surface Blending for Optimal Maneuver
LOADS
P‘ Symmetric and Asymmetric Applied Loads p’ Internal Loads (Equilibrium, Fuel Pressure, etc.)
0 MODELS
P’ Aerodynamics - Mesh Size v Structures - Accurate Idealization v Design - Manufacturing and Performance
BOTTOM LINE - Optimization Techniques Exploit Simulation Weaknesses
44 1
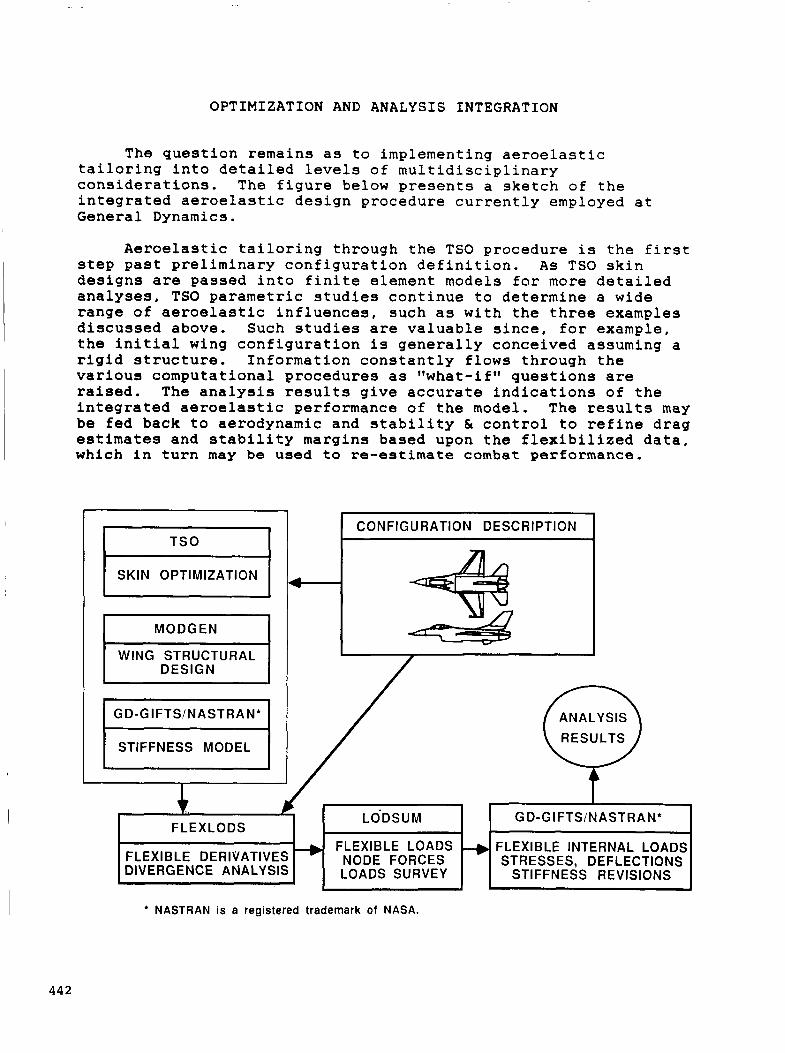
OPTIMIZATION AND ANALYSIS INTEGRATION
FLEXLODS
FLEXIBLE DERIVATIVES DIVERGENCE ANALYSIS
The question remains as to implementing aeroelastic tailoring into detailed levels of multidisciplinary considerations. The figure below presents a sketch of the integrated aeroelastic design procedure currently employed at General Dynamics.
FLEXIBLE LOADS + * NODE FORCES LOADS SURVEY
Aeroelastic tailoring through the TSO procedure is the f i r s t step past preliminary configuration definition. As TSO skin designs are passed into finite element models for more detailed analyses, TSO parametric studies continue to determine a wide range of aeroelastic influences, such as with the three examples discussed above. Such studies are valuable since, for example, the initial wing configuration is generally conceived assuming a rigid structure. Information constantly flows through the various computational procedures as "what-if" questions are raised. The analysis results give accurate indications of the integrated aeroelastic performance of the model. The results may be fed back to aerodynamic and stability 61 control to refine drag estimates and stability margins based upon the flexibilized data, which In turn may be used to re-estimate combat performance.
TSO I I SKIN OPTIMIZATION
~ ~ ~~
WING STRUCTURAL
I DESIGN I / n ANALYSIS [ RESULTS )
Y GD-GIFTS/NASTRAN*
FLEXIBLE INTERNAL LOADS STRESSES, DEFLECTIONS
STIFFNESS REVISIONS
44 2

LESSONS LEARNED IMPLEMENTING TSO
In summary, much has been learned from TSO over the years in determining aeroelastic tailoring's place in the integrated design process. Indeed, it has become apparent that aeroelastic tailoring is and should be deeply embedded in design. Aeroelastic tailoring can have tremendous effects on the design loads, and design loads affect every aspect of the design process. While optimization enables the evaluation of design sensitivities, valid computational simulations are required to make these sensitivities valid. Aircraft maneuvers simulated must adequately cover the plane's intended flight envelope, realistic design criteria must be included, and models among the various disciplines must be calibrated among themselves and with any hard-core (e.g., wind tunnel) data available. The information gained and benefits derived from aeroelastic tailoring provide a focal point f o r the various disciplines to become involved and communicate with one another to reach the best design possible.
AEROELASTIC TAILORING IS AN EMBEDDED PROCESS OF DESIGN
0 OPTIMIZATION ENABLES EVALUATION OF DESIGN SENSITIVITIES
0 VALID SENSITIVITIES ARE DERIVED FROM VALID SIMULATIONS
v Aircraft Maneuvers Must Be Broad Spectrum Design Criteria Must Be Accounted For
p' Discipline Models Must Be Calibrated
0 AEROELASTIC TAILORING APPLICATIONS INTEGRATE WING DESIGN
v Multiple Disciplines are Involved v Communication is Required
443
REFERENCES
1. Shirk, M.H., Hertz, T.J., and Weisshaar, T.A., "Aeroelastic Tailoring - Theory, Practice, and Promise," Journal of Aircraft, Vol. 23, No. 1, January 1986, pp. 6-18.
2. Wilson, E.G., Jr . , "Static Aeroelasticity in the Design of Modern Fighters,'' AGARD Report No. 725: "Static Aeroelasticity in Combat Aircraft," January 1986.
3. McCullers, L.A., "Automated Design of Advanced Composite
SymDosiyn, AMD-Vol. 7, November 1974, pp. 119-133. Structures," Proceedinas of the ASME Structural Optlmlzation . .
4. McCullers, L.A., and Lynch, R.W., "Dynamic Characteristics of Advanced Filamentary Composite Structures, Volume I1 - Aeroelastic Synthesis Procedure Development," AFFDL-TR-73-111, September 1974.
444

INTEGRATED AERODYNAMIC-STRUCTURAL DESIGN OF A FORWARD-SWEPT TRANSPORT WING
R. T. Haftka, B. Grossman, P. J. Kao, D. M. Polen Department of Aerospace and Ocean Engineering
Virginia Polytechnic Institute and State University Blacksburg, Virginia,
and
J. Sobieszczans ki-Sobies ki Interdisciplinary Research Office NASA Langley Research Center
Hampton, Virginia
445

OVERALL GOALS
The introduction of composite materials is having a profound effect on aircraft design. Since these materials permit the designer to tailor material properties to improve structural, aerody- namic and acoustic performance, they require an integrated multidisciplinary design process. Fur- thermore, because of the complexity of the design process numerical optimization methods are required.
The utilization of integrated multidisciplinary design procedures for improving aircraft design is not currently feasible because of software coordination problems and the enormous computa- tional burden. Even with the expected rapid growth of supercomputers and parallel architectures, these tasks will not be practical without the development of efficient methods for cross-disciplinary sensitivities and efficient optimization procedures.
taneous aerodynamic and structural wing design as a prototype for design integration. A sequence of integrated wing design procedures has been developed in order to investigate various aspects of the design process.
I The present research is part of an on-going effort which is focused on the processes of simul-
0 NEED
composite materials
a aircraft complexity
0 PAY-OFF
better designs
0 DIFFICULTIES
computational cost
0 software coordination
446
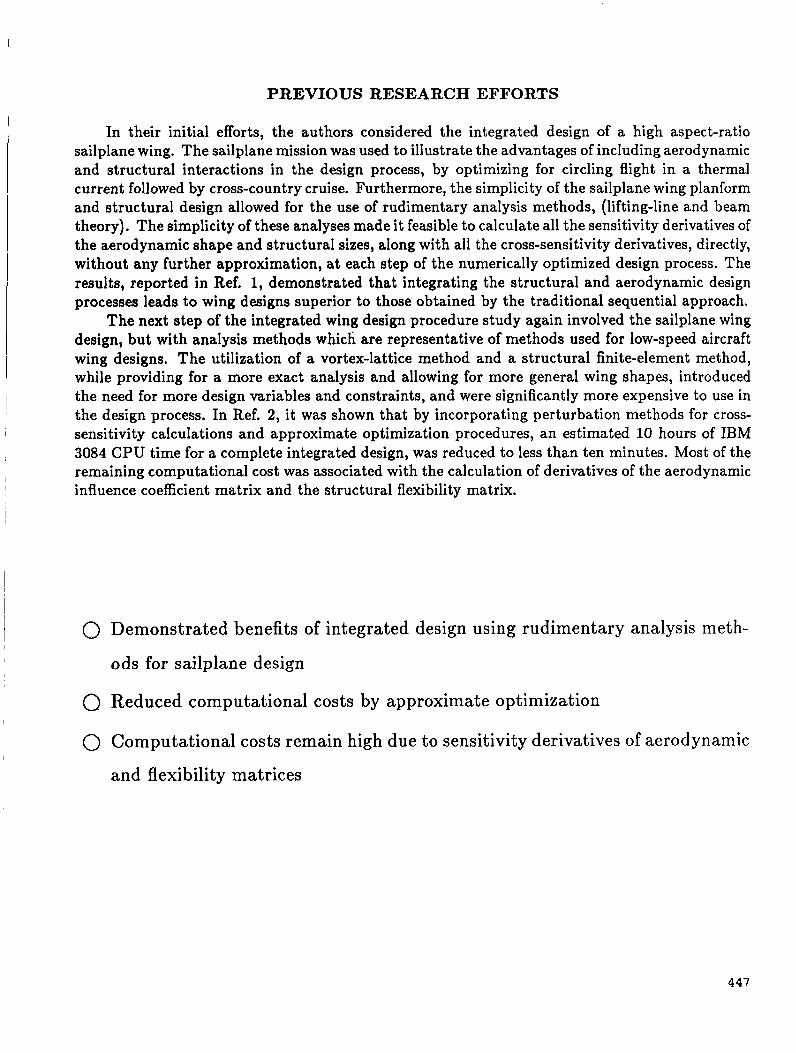
PREVIOUS RESEARCH EFFORTS
In their initial efforts, the authors considered the integrated design of a high aspect-ratio sailplane wing. The sailplane mission was used to illustrate the advantages of including aerodynamic and structural interactions in the design process, by optimizing for circling flight in a thermal current followed by cross-country cruise. Furthermore, the simplicity of the sailplane wing planform and structural design allowed for the use of rudimentary analysis methods, (lifting-line and beam theory). The simplicity of these analyses made it feasible to calculate all the sensitivity derivatives of the aerodynamic shape and structural sizes, along with all the cross-sensitivity derivatives, directly, without any further approximation, at each step of the numerically optimized design process. The results, reported in Ref. 1, demonstrated that integrating the structural and aerodynamic design processes leads to wing designs superior to those obtained by the traditional sequential approach.
The next step of the integrated wing design procedure study again involved the sailplane wing design, but with analysis methods which are representative of methods used for low-speed aircraft wing designs. The utilization of a vortex-lattice method and a structural finite-element method, while providing for a more exact analysis and allowing for more general wing shapes, introduced the need for more design variables and constraints, and were significantly more expensive to use in the design process. In Ref. 2, it was shown that by incorporating perturbation methods for cross- sensitivity calcuIations and approximate optimization procedures, an estimated 10 hours of IBM 3084 CPU time for a complete integrated design, was reduced to less than ten minutes. Most of the remaining computational cost was associated with the calculation of derivatives of the aerodynamic
I I influence coefficient matrix and the structural flexibility matrix.
0 Demonstrated benefits of integrated design using rudimentary analysis meth-
ods for sailplane design
Q Reduced computational costs by approximate optimization
0 Computational costs remain high due to sensitivity derivatives of aerodynamic
and flexibility matrices
447

PRESENT OBJECTIVE
The present paper represents the third step of this study. The objective here is to develop an integrated wing design procedure for a subsonic transport aircraft. We still use vortex-lattice aerodynamics (so that we are restricted to subsonic speeds) and finite-element structural analy- sis. Even with basic aerodynamic design variables, (planform shape and twist distribution), the increased complexity of an integrated transport design over the previous sailplane wing design requires further computational reductions. We consider two approaches for reducing the computa- tional burden of multidisciplinary optimization:
i. the development of efficient methods for cross-sensitivity calculation; and ii. the use of approximate optimization procedures.
The sensitivity calculation is based on a modular sensitivity method (Ref. 3) for computing sensitivity derivatives of a system via partial derivatives of the output with respect to input and to design variables of each component of the system. This modular approach, corresponds to the abstraction of a system as an assembly of interacting black bozee. This method was developed for calculating system sensitivity without modifying disciplinary black-box software packages, Ref. 4. It allows for the calculation of sensitivity derivatives of a system with a higher accuracy and, in most cases, at a lower cost than with conventional finite differencing. The system sensitivity derivatives may be used to guide a formal optimization and a Newton’s method solution of the coupled interdisciplinary equations describing the system behavior. Within this framework, we show that the sensitivities can be computed without the expensive calculation of the derivatives of the aerodynamic influence coefficient matrix, and the derivatives of the structural flexibility matrix.
Furthermore, the same process enables the determination of the sensitivity of the aeroelastic divergence dynamic pressure without the determination of the derivatives of the aerodynamic influ- ence coefficient matrix and flexibility matrix. This feature should be useful, not only in problems of complete integrated aircraft design, but also in aeroelastic tailoring applications.
0 Develop an integrated design procedure for a transport aircraft
0 Utilize a modular sensitivity analysis
0 Reduce computational costs

WING DESIGN VARIABLES
We consider the optimum design of an aircraft wing. The objective function can be the structural weight of the wing, an aerodynamic performance index such as the lift-to-drag ratio, LID or a combination thereof. In the present study we minimize the structural weight of the wing. The design variables associated with the aerodynamic design include the planform shape parameters defined on the figure below, and the twist schedule along the span.
For the present, preliminary study of integrated structural-aerodynamic design, we assume the airfoil shape to be supplied, along with known section characteristics. The design variables associated with the structural design are the structural sizes including panel thicknesses and spar- cap cross-sectional areas. The finite-element model of the wing is shown schematically in the figure below. Additionally, composite material ply orientations in the cover panels are used as design variables.
I I
449
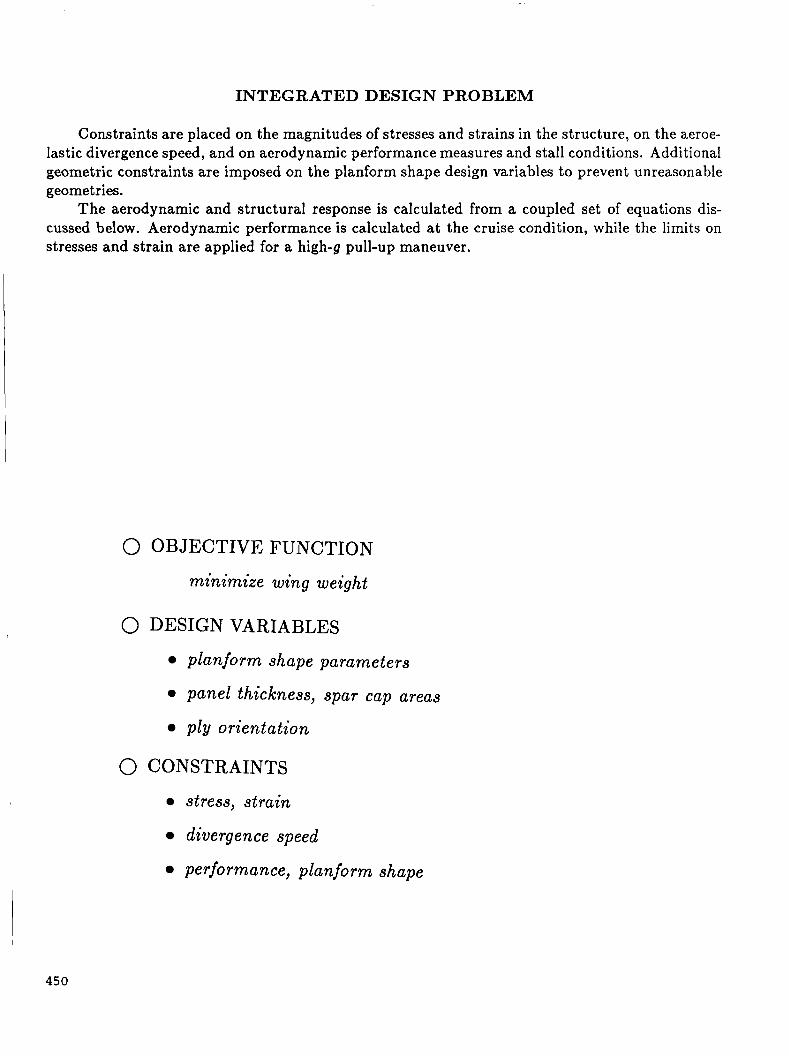
INTEGRATED DESIGN PROBLEM
Constraints are placed on the magnitudes of stresses and strains in the structure, on the aeroe- lastic divergence speed, and on aerodynamic performance measures and stall conditions. Additional geometric constraints are imposed on the planform shape design variables to prevent unreasonable geometries.
The aerodynamic and structural response is calculated from a coupled set of equations dis- cussed below. Aerodynamic performance is calculated at the cruise condition, while the limits on stresses and strain are applied for a high-g pull-up maneuver.
0 OBJECTIVE FUNCTION
minimize wing weight
0 DESIGN VARIABLES
planform shape parameters
a panel thickness, spar cap areas
p l y orientation
0 CONSTRAINTS
stress, strain
divergence speed
performance, planform shape
450

AEROELASTIC FORMULATION
The aeroelastic analysis of the wing is simplified by making several assumptions. We assume that the effect of the aerodynamics on structural deformations can be approximated by lumping the aerodynamic forces at nr structural grid points (called here the load set), and including only the vertical components of the loads. The vector of vertical aerodynamic loads is denoted as Fa. We assume that the overall aircraft response affects the wing only through the root angle of attack a. Finally, we assume that the effect of structural deformations on the aerodynamic response can be approximated in terms of the vector of vertical displacements 8 at the load set.
The vertical aerodynamic loads a t the load set, Fa, are determined from an aerodynamic analysis procedure. For low speed wing designs, we utilize a vortex lattice method (e.g., Ref. 5 ) to compute the lift and the induced drag. The wing is discretized into panels, with each panel containing an element of a horseshoe vortex of strength 7j. By enforcing flow tangency at each panel, a vector of circulation strengths I' may be computed from eq. (l), below, where p is a vector of design parameters and V is a matrix of influence coefficients. The aerodynamic forces are computed from a local application of the Kutta-Joukowski theorem, and compressibility effects are included through a Gbthert transformation. The profile drag for each wing section is calculated from the measured airfoil drag polar. The load vector Fa is then obtained as eq. (2). Altogether we combine equations (1) and (2) as eq. (3), below. The angle of attack is obtained from the overall vertical equilibrium of the aircraft as eq. (4), where N is a summation vector, n is the load factor and W is the weight of the aircraft.
0 aerodynamic equations
F u = fib, a, 6)
0 vertical equilibrium equation
1 f&, F,) = znW - PF, = o
(3)
(4)
45 1
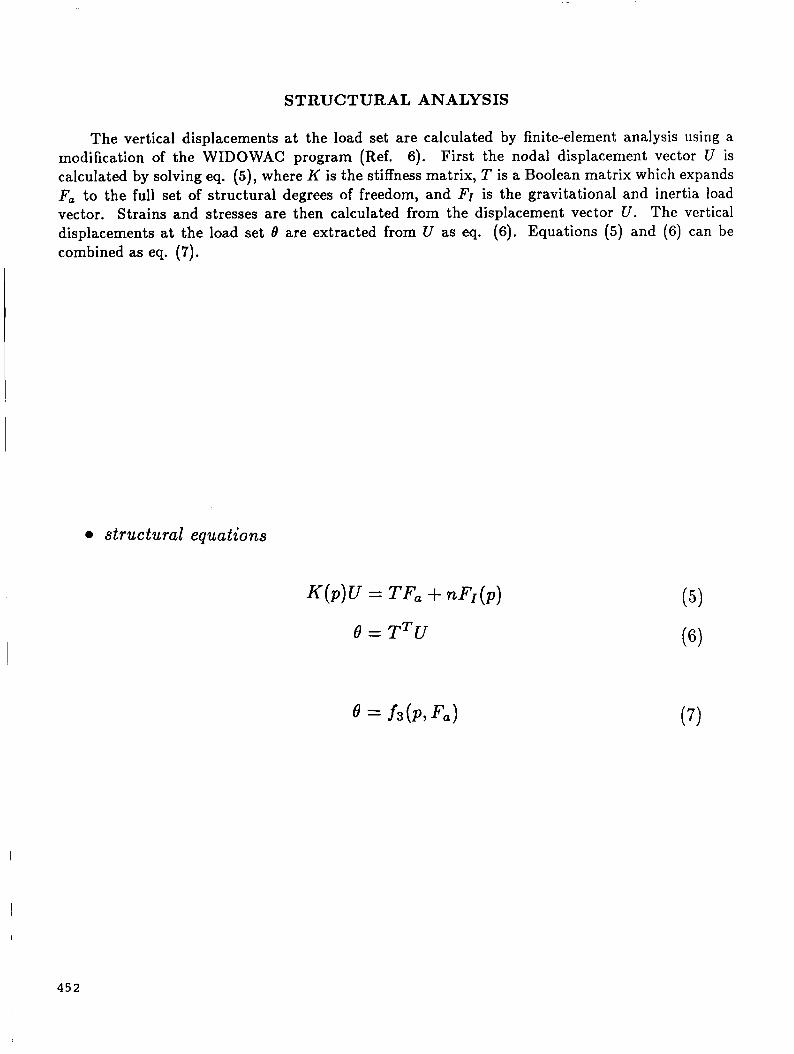
STRUCTURAL ANALYSIS
The vertical displacements at the load set are calculated by finite-element analysis using a modification of the WIDOWAC program (Ref. 6). First the nodal displacement vector U is calculated by solving eq. ( 5 ) , where K is the stiffness matrix, T is a Boolean matrix which expands Fa to the full set of structural degrees of freedom, and FI is the gravitational and inertia load vector. Strains and stresses are then calculated from the displacement vector U. The vertical displacements at the load set 8 are extracted from U as eq. (6). Equations ( 5 ) and (6) can be combined as eq. (7).
0 structural equations
452

I SOLUTION PROCEDURE
Equations (3), (4) and (7) are a set of nonlinear coupled equations for the vector of vertical aerodynamic loads, Fa, the wing root angle of attack, a and the vector of vertical displacements, 6. For the analysis problem, the vector of design parameters, p, is given. Reference 3 presented a modular sensitivity analysis of such coupled interdisciplinary equations. The modular approach permits treating the individual discipline analysis procedures as black bozes that do not need to be changed in the integration procedure. Here we employ a similar approach for the sensitivity analysis below, with fi representing an aerodynamic black boz and f3 a structural black bos. We also use the same approach for the solution of the system via Newton’s method.
Given an initial estimate for the solution 3’00, a’, 8’ we use Newton’s method to improve that estimate. The iterative process may be written as eq. (8)’ where AY, Af and J are defined in eqs. (9), (10)’ and (11). The Jacobian is given in terms of the dynamic pressure q, the incremental aerodynamic force vector, qR, the aerodynamic influence coefficient matrix, qA and the flexibil- ity matrix S. The incremental aerodynamic force vector is defined such that its component gri represents the change in Fad due to a unit change in a, and the aerodynamic influence coefficient matrix, is defined such that its component qaii represents the change in F4i due to unit change in 6j . Similarly, the flexibility matrix, is such that s i j is the change in 8i due to a unit change in F4i.
0 solution by Newton’s method
where
JAY = A f
A Y = { AFa t ; } (9)
453
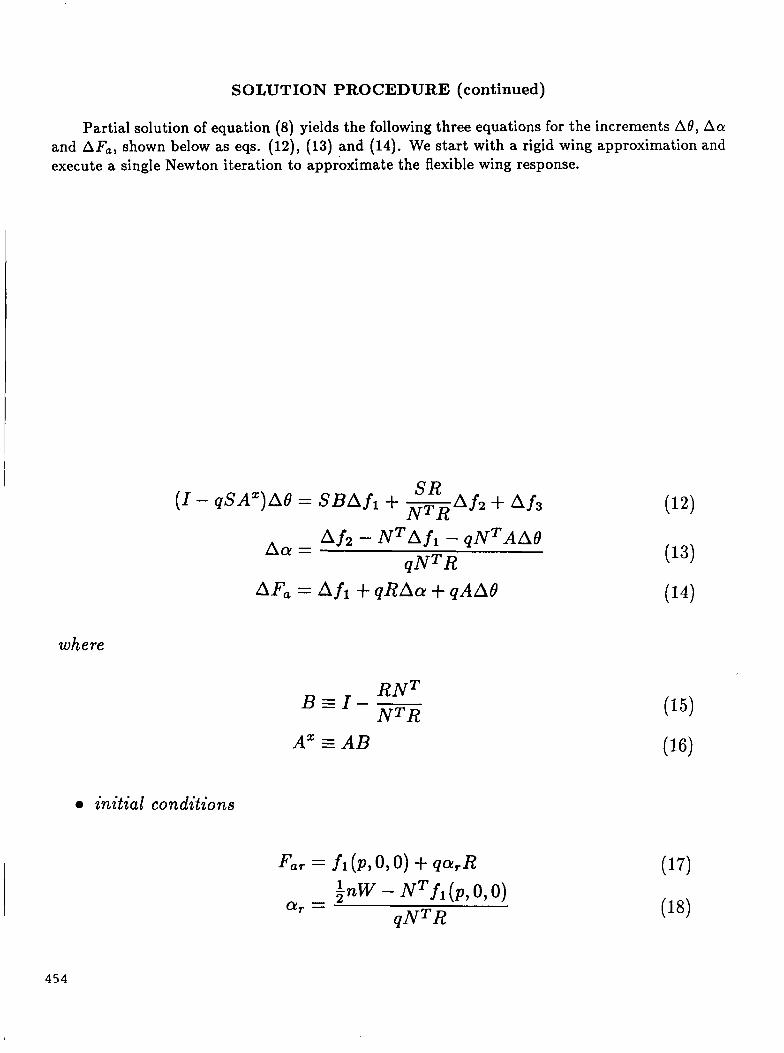
SOLUTION PROCEDURE (continued)
Partial solution of equation (8) yields the following three equations for the increments Ad, A a and AFa, shown below as eqs. (12), (13) and (14). We start with a rigid wing approximation and execute a single Newton iteration to approximate the flexible wing response.
where
A a = Af2 - N T A f l - qNTAAB qNTR
R N ~ B = I - - N T R
A” AB
0 initial conditions
I 454
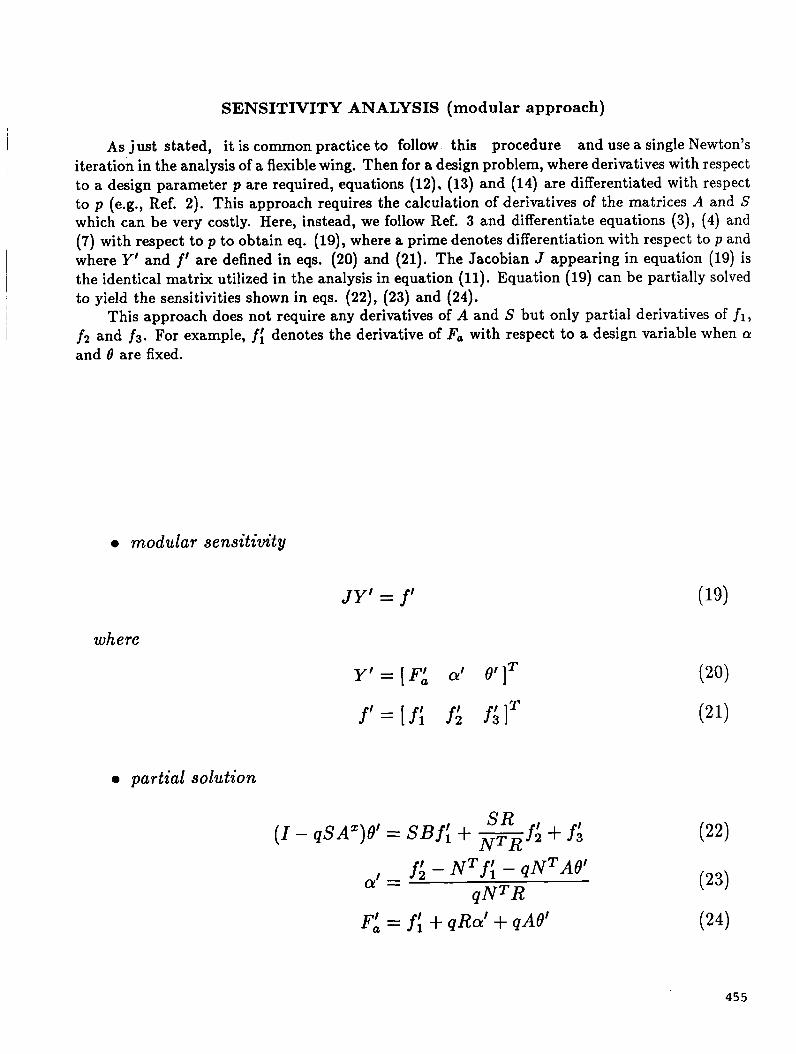
SENSITIVITY ANALYSIS (modular approach)
which can be very costly. Here, instead, we follow Ref. 3 and differentiate equations (3), (4) and (7) with respect to p to obtain eq. (19), where a prime denotes differentiation with respect to p and where Y' and f' are defined in eqs. (20) and (21). The Jacobian J appearing in equation (19) is the identical matrix utilized in the analysis in equation (11). Equation (19) can be partially solved
0 modular sensitivity
JY'= f'
where
a partial solution
S R ( I - qSAZ)B' = ssf: + mf; + f4 f; - N T I f l - qNTAB'
qNTR cy' =
455

SENSITIVITY ANALYSIS (tradit ional approach)
By contrast, the more traditional approach (e.g., Ref. 2) to the derivative calculation is obtained by differentiating the aeroelastic analysis equations, such as eqs. (12) to (14) with respect to p as shown in eq. (25). This complicated expression can be shown to be equivalent to eq. (22). However, the traditional approach which employs eq. (25) requires the expensive calculation of the derivatives of the aerodynamic influence coefficient matrix, A’ and the derivatives of the flexibility matrix S’.
S R S’R R + m A f 2 + S(-)’A f 2 + --.---A f; N T R N T R
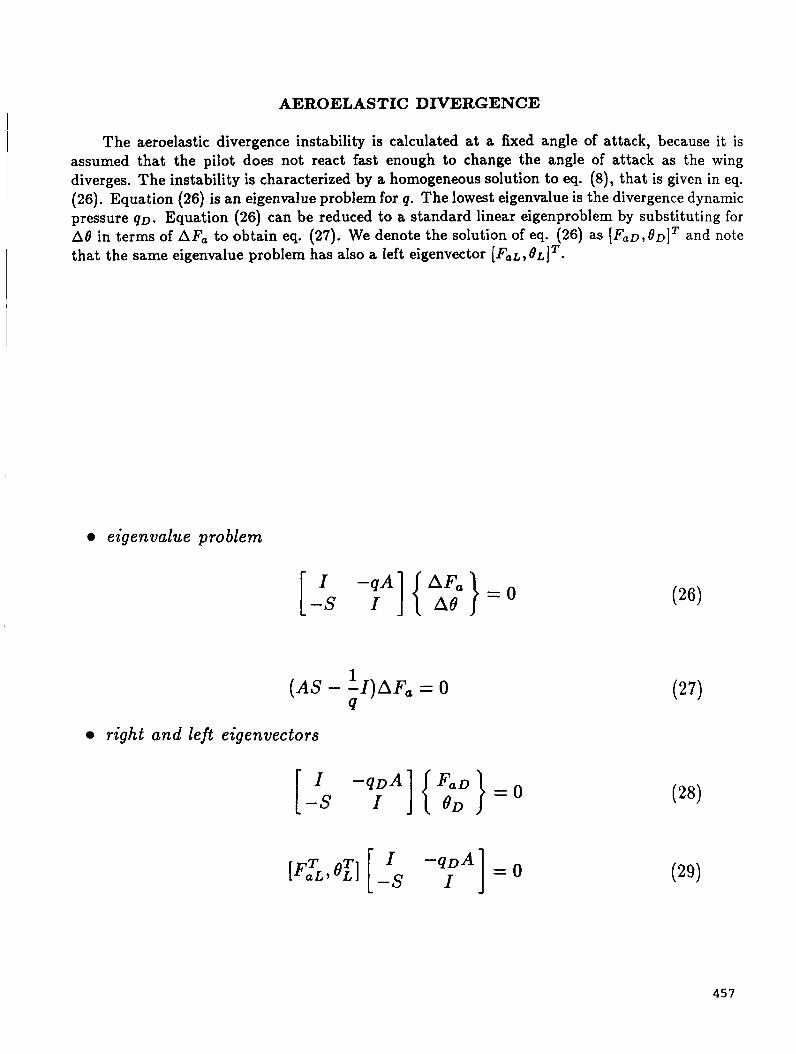
AEROELASTIC DIVERGENCE
The aeroelastic divergence instability is calculated at a fixed angle of attack, because it is assumed that the pilot does not react fast enough to change the angle of attack as the wing diverges. The instability is characterized by a homogeneous solution to eq. (8), that is given in eq. (26). Equation (26) is an eigenvalue problem for q. The lowest eigenvalue is the divergence dynamic pressure q D . Equation (26) can be reduced to a standard linear eigenproblem by substituting for A0 in terms of AFa to obtain eq. (27). We denote the solution of eq. (26) as [Fa~,BglT and note that the same eigenvalue problem has also a left eigenvector [FaL, 8 ~ 1 ~ .
eigenvalue problem
1
9 (AS - - I )AFa = 0
right and left eigenvectors
[ -S I - 9 D A ] r { :DD} = O
457

DIVERGENCE SENSITIVITY
To find the derivative of the divergence dynamic pressure qD with respect to a design parameter p , we differentiate eq. (28) at q = qD with respect to p and obtain eq. (30). We premultiply eq. (28) by the left eigenvector, [FzL,Bz], defined by eq. (29) and obtain eqs. (31) and (32). Equation (32) contains derivatives of A and S with respect to p which we have managed to avoid before, However, the corresponding terms can be simplified. Using the definition of S, eq. (ll), we note the relationship in eq. (33).
To see how S'FaD can be calculated without obtaining S' consider a more generic case. Let f be a function of a vector X , and let D be another vector. Let XO be a particular choice for X , then eq. (34) provides us with a way of calculating the product a f / a X ( X o ) times D without calculating the individual components of a f / a X . Therefore, to calculate S'F,D we start by calculating the derivative of f3 to a perturbation in Fa in the form of F,D (because we use linear structural analysis this is the response of the structure to F,o). Then we calculate the derivative of this response with respect to p assuming that Fa0 is fixed. The term A'BD in eq. (32) is treated in a similar way.
'
I - ( q D A ) ' ] 0 { 7 D D } = o
obtain
or
to eficiently find S'F,D
with

APPROXIMATE OPTIMIZATION PROBLEM
The optimization problem addressed in this paper is to minimize the structural weight W of the wing subject to aerodynamic, performance and structural constraints. It can be written as eq. (35), where g1,g2 and g3 denote aerodynamic, performance, and structural constraints, respectively. The vector of circulation strengths r is calculated from eq. (1) and the nodal displacement vector, U, is calculated from eq. ( 5 ) .
Even with the more efficient sensitivity analysis, a fully coupled structural-aerodynamic anal- ysis and sensitivity is quite expensive. Thus, it is not feasible to optimize the design problem by directly connecting an optimization algorithm with the analysis procedure. Instead, a sequential approximate optimization algorithm is considered to be the best approach (e.g., Ref. 7). This approach replaces the original objective function and constraints with approximations based upon nominal values and derivatives at an initial point. Move limits are used to prevent the design from moving outside the bound of validity of the approximations.
The approximate optimization problem is based on a linear approximation of the aerodynamic and structural constraints about a candidate design point PO. That is, the approximate constraints gla and g3a are given in eq. (36), where Ap = p - P O . The performance constraints are typically quite nonlinear and inexpensive to calculate, so they are calculated exactly from the linear approximation to the aerodynamic solution. The approximate optimization problem is given then in eq. (37), where E represents a vector of move limits imposed to guarantee the quality of the approximation.
0 optimization problem
minimize W(p) such that g l ( r , p ) 2 O
!73(u, P ) 2 0 0 approximate constraints
0 approximate optimization problem
minimize W ( p ) such that g l , ( p ) 2 O
459

APPROXIMATE OPTIMIZATION PROCEDURE
The approximate optimization problem is solved sequentially as shown in the flowchart below, until the change in the design is smaller than a specified tolerance or the improvement in the objective functionis smaller than another tolerance.After anoptimum is found, a new approximation is constructed there, and the process is repeated until convergence is achieved. The optimizer used is the NEWSUMT-A program, Ref. 8, which is based on an extended interior penalty function procedure, and allows for various levels of constraint and objective function approximations.
I 1 lNITIALp~ESIGN
ANALYSIS AND SENSITIVITY I I
APPROXIMATE ANALYSIS OPTIMIZATION
FINAL ANALYSIS
460
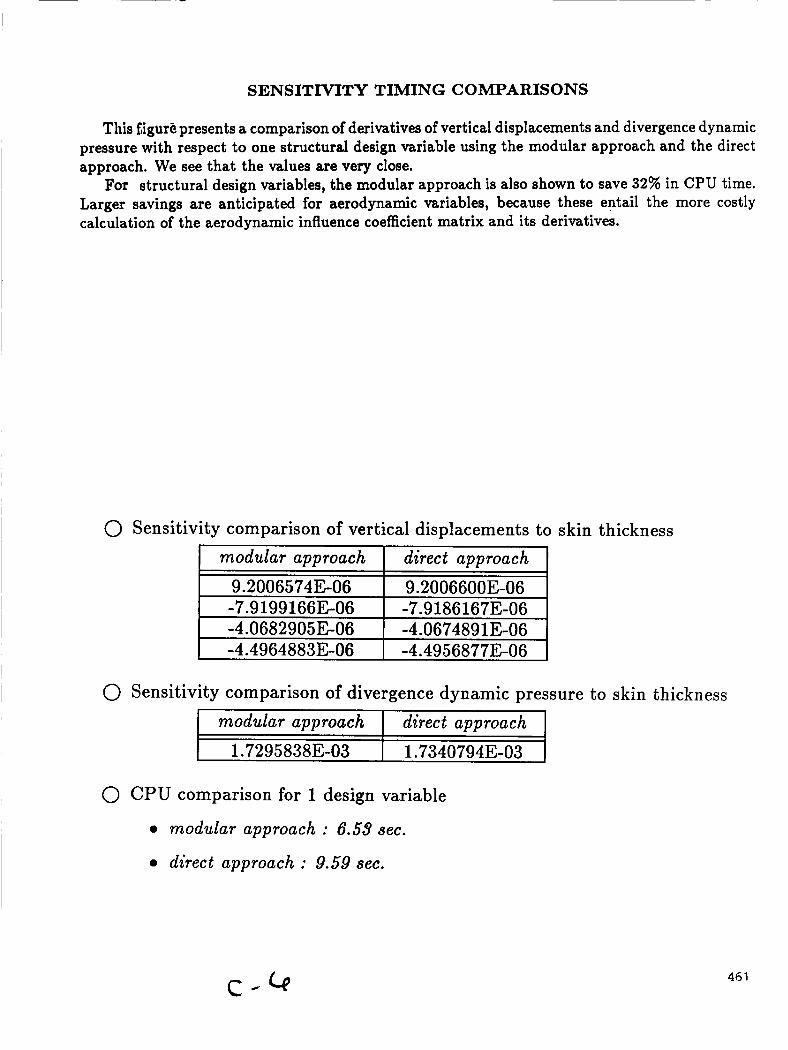
SENSITIVITY TIMING COMPARISONS
9.20065743-06 -7.91991663-06 -4.0 68 2 9 0 5 3-06
This figure presents a comparison of derivatives of vertical displacements and divergence dynamic pressure with respect to one structural design variable using the modular approach and the direct approach. We see that the values are very close.
For structural design variables, the modular approach is also shown to save 32% in CPU time. Larger savings are anticipated for aerodynamic variables, because these entail the more costly calculation of the aerodynamic influence coefficient matrix and its derivatives.
9.20066003-06 -7.91861673-06 -4.0 6 748 9 1 3-06
0 Sensitivity comparison of vertical displacements to skin thickness modular approach I direct approach
I -4.49648833-06 I -4.49568773-06 I 0 Sensitivity comparison of divergence dynamic pressure to skin thickness
I modular approach I direct approach I I * - _ _
1.72958383-03 I 1.73407943-03
0 CPU comparison for 1 design variable
0 modular approach : 6.58 sec.
a direct approach : 9.59 sec.
46 1
CONCLUDING REMARKS
I This paper focused on the processes of simultaneous aerodynamic and structural wing design as a prototype for design integration. The research concentrated on the major difficulty associated with multidisciplinary design optimization processes, their enormous computational costs. Methods were presented for reducing this computational burden through the development of efficient methods for cross-sensitivity calculations and the implementation of approximate optimization procedures. Utilizing a modular sensitivity analysis approach, we showed that the sensitivities can be computed without the expensive calculation of the derivatives of the aerodynamic influence coefficient matrix, and the derivatives of the structural flexibility matrix. The same process was used to efficiently evaluate the sensitivities of the wing divergence constraint, which should be particularly useful, not only in problems of complete integrated aircraft design, but also in aeroelastic tailoring applications.
0 Modular approach applied to integrated design
I 0 Improved divergence sensitivity
0 Computational efficiency of the modular approach
462

ACKNOWLEDGMENT
The Virginia Polytechnic Institute portion of this research was funded by the NASA Langley Research Center under grant NAG-1-603 and by the National Science Foundation under grant DMC-8615336.
REFERENCES
1. Grossman, B., Strauch, G. J., Eppard, W. M., Gurdal, 2. and Haftka, R. T., “Integrated Aerodynamic-Structural Design of a Sailplane Wing”, AIAA Paper No. 86-2623, Oct. 1986.
2. Haftka, R. T., Grossman, B., Eppard, W. M. and Kao, P. J., “Efficient Optimization of In- tegrated Aerodynamic-S tructural Design”, Proceedings of 2nd Intl. Conf on Inverse Design Concepts and Optimization in Engineering Sciences, Oct. 1987, pp. 369-386.
3. Sobieszczanski-Sobieski, J., “On the Sensitivity of Complex, Internally Coupled Systems”, AIAA Paper No. 88-2378, presented at the AIAA/ ASME/ ASCE/ AHS 29th Structures,
I
~
I Structural Dynamics and Materials Conference, Apr. 1988. 4. Steward, D. V., Systems Analysis and Management, P. B. I., publishers, 1981. 5. Bertin, J. J. and Smith, M. L., Aerodynamics for Engineers, Prentice Hall Inc., 1979. 6. Haftka, R. T. and Starnes, J. H. Jr., “WIDOWAC: Wing Design Optimization with Aeroelastic
7. Schmit, L. A. and Farshi, B., “Some Approximation Concepts for Structural Synthesis”, AIAA
8. Grandhi, R. V., Thareja, R. and Haftka, R. T., “NEWSUMT-A: A General Purpose Program for Constrained Optimization Using Constraint Approximations”, ASME J. Mech., Trans. & Automation in Design, 107, 1985, pp. 94-99.
Constraints-Program Manual”, NASA TM X-3071, 1974.
J. , 12, 1974, pp. 692-699.
463
N89- 25169 STATIC AEROELASTIC ANALYSIS AND TAILORING
OF MISSILE CONTROL FINS
S. C. McIntosh, Jr. McIntosh Structural Dynamics, Inc.
Mountain View, California
M. F. E. Dillenius Nielsen Engineering & Research, Inc.
Mountain View, California
PRECEDING PAGE BLANK NOT FILMED 465
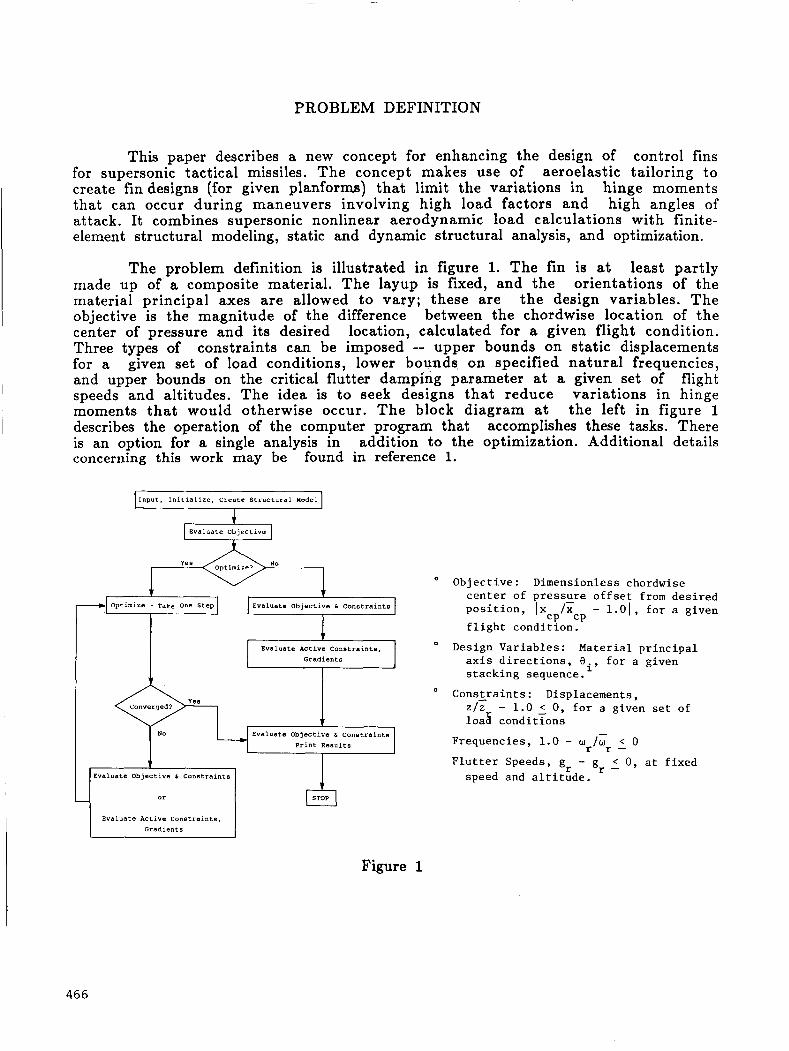
P R 0 B LEM D EF IN IT10 N
This paper describes a new concept for enhancing the design of control fins for supersonic tactical missiles. The concept makes use of aeroelastic tailoring to create findesigns (for given planforms) that limit the variations in hinge moments that can occur during maneuvers involving high load factors and high angles of attack. It combines supersonic nonlinear aerodynamic load calculations with finite- element structural modeling, static and dynamic structural analysis, and optimization.
The problem definition is illustrated in figure 1. The fin is a t least partly made up of a composite material. The layup is fixed, and the orientations of the material principal axes are allowed to vary; these are the design variables. The objective is the magnitude of the difference between the chordwise location of the center of pressure and its desired location, calculated for a given flight condition. Three types of constraints can be imposed -- upper bounds on static displacements for a given set of load conditions, lower bounds on specified natural frequencies, and upper bounds on the critical flutter damping parameter at a given set of flight speeds and altitudes. The idea is to seek designs that reduce variations in hinge moments that would otherwise occur. The block diagram a t the left in figure 1 describes the operation of the computer program that accomplishes these tasks. There is an option for a single analysis in addition to the optimization. Additional details concerning this work may be found in reference 1.
Input. Initialize, Create Structural Hodel
optimize - T ~ L ~ one Step Evaluate Objective 6 Constraints
I Evaluate Objective 6 Constraints I No Print Results I I
I
Evaluate Objective L Constraints
Evaluate Active Constraints, Gradients
Objective: Dimensionless chordwise center of pressure offset from desired position, Ixcp/X - 1.01, for a given flight condition.
Design Variables: Material principal axis directions, Bi, for a given stacking sequence.
' ConsLraints: Displacements, z / z - 1.0 5 0, for a given set of loa8 conditions
Frequencies, 1.0 - w /o < 0
Flutter Speeds, gr - gr 5 0, at fixed speed and altitude.
CP
r r -
Figure 1
466
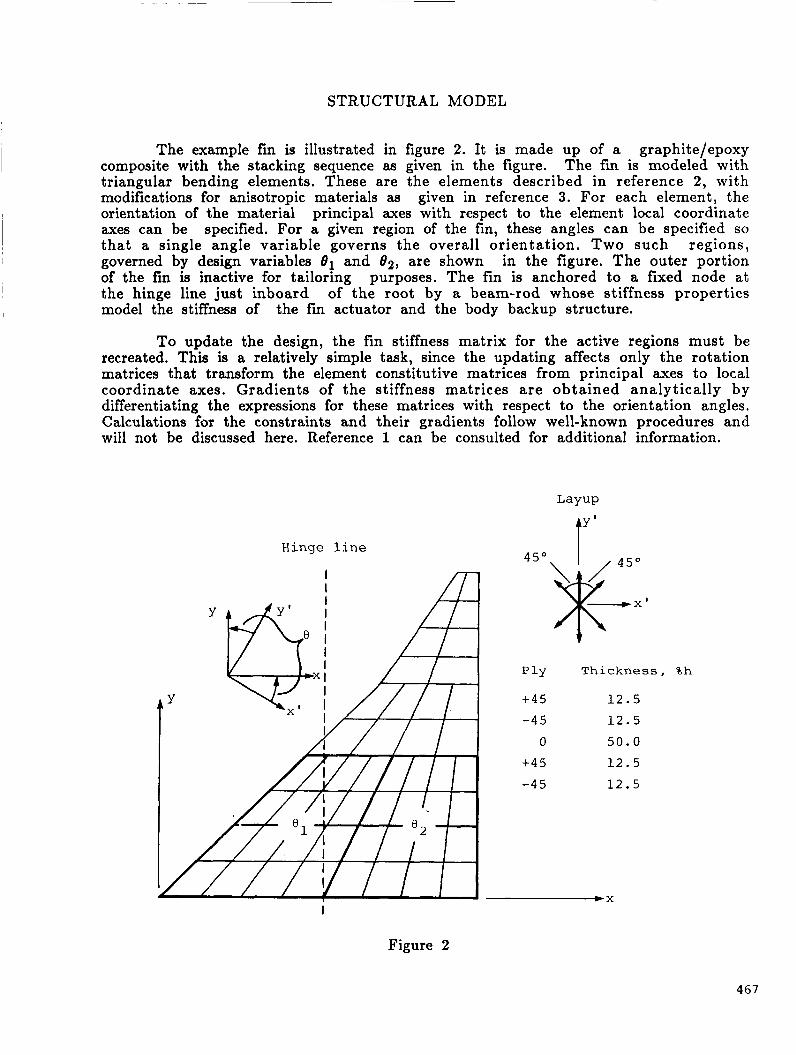
STRUCTURAL MODEL
The example fin is illustrated in figure 2. It is made up of a graphite/epoxy composite with the stacking sequence as given in the figure. The fin is modeled with triangular bending elements. These are the elements described in reference 2, with modifications for anisotropic materials as given in reference 3. For each element, the orientation of the material principal axes with respect to the element local coordinate axes can be specified. For a given region of the fin, these angles can be specified so that a single angle variable governs the overall orientation. Two such regions, governed by design variables $1 and $2, are shown in the figure. The outer portion of the fin is inactive for tailoring purposes. The fin is anchored to a fixed node at the hinge line just inboard of the root by a beam-rod whose stiffness properties model the stiffness of the fin actuator and the body backup structure.
To update the design, the fin stiffness matrix for the active regions must be recreated. This is a relatively simple task, since the updating affects only the rotation matrices that transform the element constitutive matrices from principal axes to local coordinate axes. Gradients of the stiffness matrices are obtained analytically by differentiating the expressions for these matrices with respect to the orientation angles. Calculations for the constraints and their gradients follow well-known procedures and will not be discussed here. Reference 1 can be consulted for additional information.
Hinge line
p 1Y Thickness,
+45 1 2 . 5
-45 1 2 . 5
0 5 0 . 0
+4 5 1 2 . 5
-4 5 1 2 . 5
%h
I
Figure 2
467
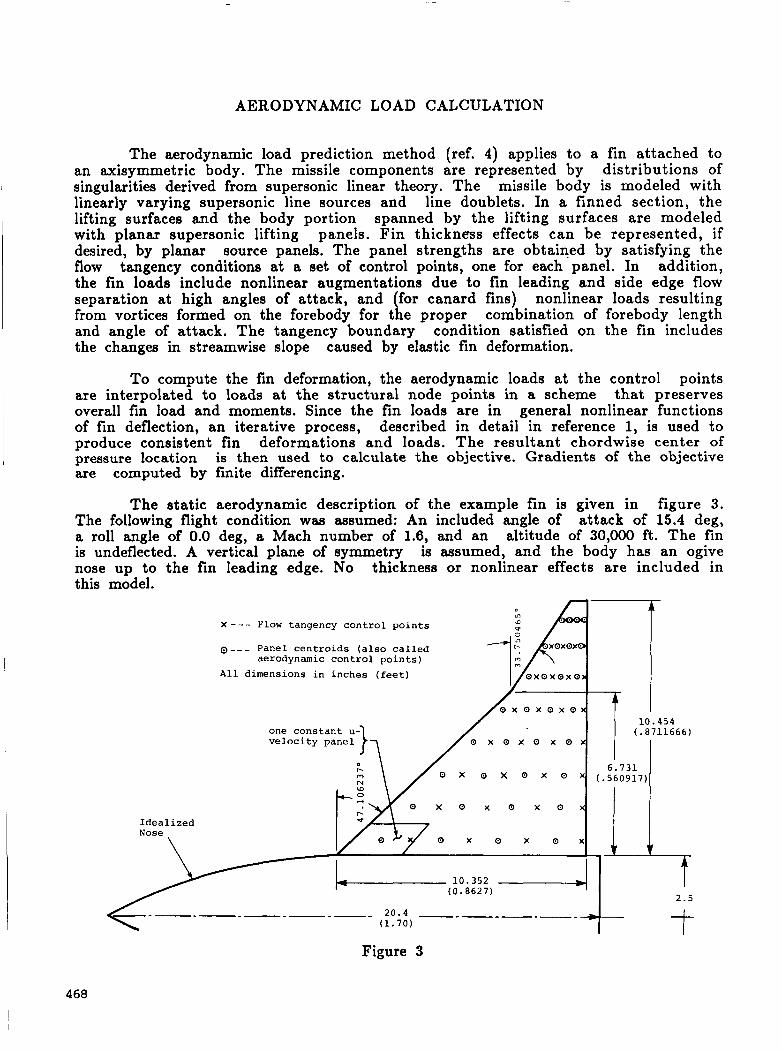
AERODYNAMIC LOAD CALCULATION
The aerodynamic load prediction method (ref. 4) applies to a fin attached to an axisymmetric body. The missile components are represented by distributions of singularities derived from supersonic linear theory. The missile body is modeled with linearly varying supersonic line sources and line doublets. In a finned section, the lifting surfaces and the body portion spanned by the lifting surfaces are modeled with planar supersonic lifting panels. Fin thickness effects can be represented, if desired, by planar source panels. The panel strengths are obtained by satisfying the flow addition, the fin loads include nonlinear augmentations due to fin leading and side edge flow separation at high angles of attack, and (for canard fins) nonlinear loads resulting from vortices formed on the forebody for the proper combination of forebody length and angle of attack. The tangency boundary condition satisfied on the fin includes the changes in streamwise slope
tangency conditions at a set of control points, one for each panel. In
caused by elastic fin deformation.
To compute the fin deformation, the aerodynamic loads at the control points that preserves
general nonlinear functions described in detail in reference 1, is used to
deformations and loads. The resultant chordwise center of is then used to calculate the objective. Gradients of the objective
I are interpolated to loads at the structural node points in a scheme overall fin load and moments. Since the fin loads are in of fin deflection, an iterative process, produce consistent fin pressure location are computed by finite differencing.
The static aerodynamic description of the example fin is given in figure 3. attack of 15.4 deg,
altitude of 30,000 ft. The fin is assumed, and the body has an ogive
thickness or nonlinear effects are included in
The following flight condition was assumed: An included angle of a roll angle of 0.0 deg, a Mach number of 1.6, and an is undeflected. A vertical plane of symmetry nose up to the fin leading edge. No this model.
' XOXOX ' / . I X - - - F l o w t a n g e n c y c o n t r o l p o i n t s a
@ - - - P a n e l c e n t r o i d s (a lso c a l l e d
All d i m e n s i o n s i n i n c h e s ( f e e t ) o x o x o x o n
aerodynamic c o n t r o l p o i n t s )
A 0 x 0 x o x o x
10.454
6 . 7 3 1
o x o x o x o
0 x 0 x 0 x 0 x ( - 5 6 0 9 1 7 )
v e l o c i t y p a n e l
I. I? N W 0
O X O X Q X O F.
o x o x o x
10.352 -4 (0 .8627)
2.5
I d e a l i z e d Nose
t _---_-_---- 20.4 ----- --- (1 .70)
Figure 3
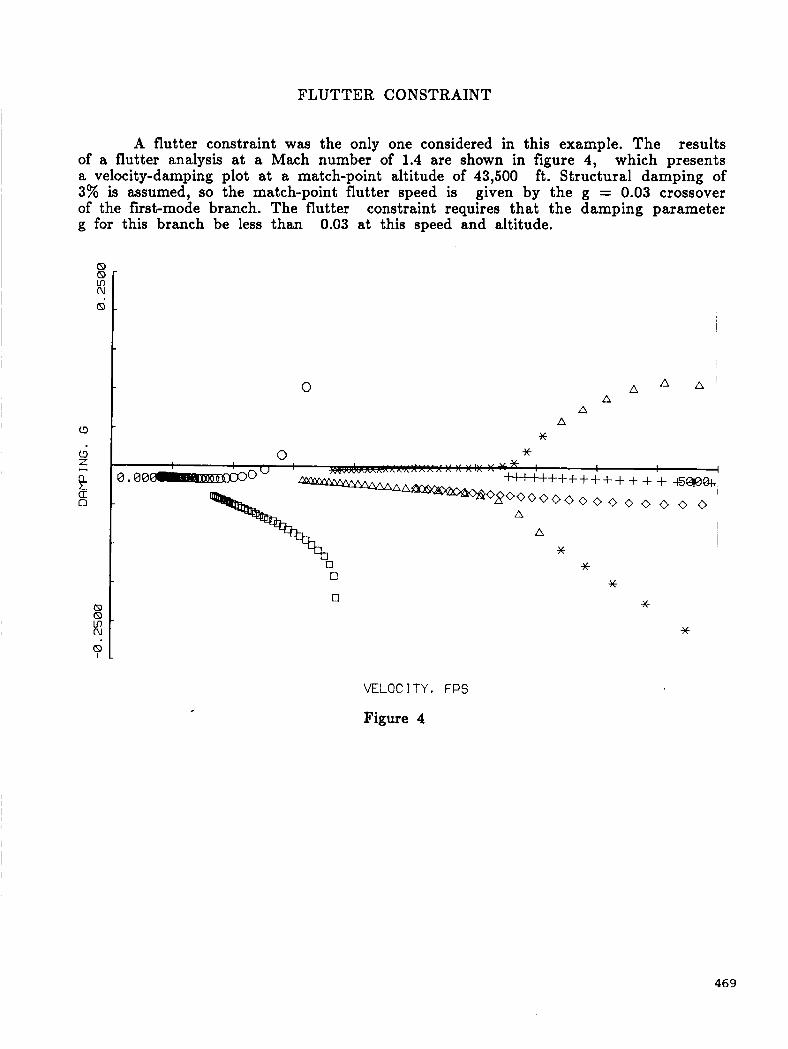
FLUTTER CONSTRAINT
A flutter constraint was the only one considered in this example. The results which presents
ft. Structural damping of given by the g = 0.03 crossover
constraint requires that the damping parameter
of a flutter analysis at a Mach number of 1.4 are shown in figure 4, a velocity-damping plot at a match-point altitude of 43,500 3% is assumed, so the match-point flutter speed is of the first-mode branch. The flutter g for this branch be less than 0.03 at this speed and altitude.
8 8 Ln N
8
c3 Z I
!+ a: 0
0 A A ' A A
A A * *
0 I X X I
A
A I * * 0
[I] * * 0
VELOCITY, FPS
Figure 4
*
469
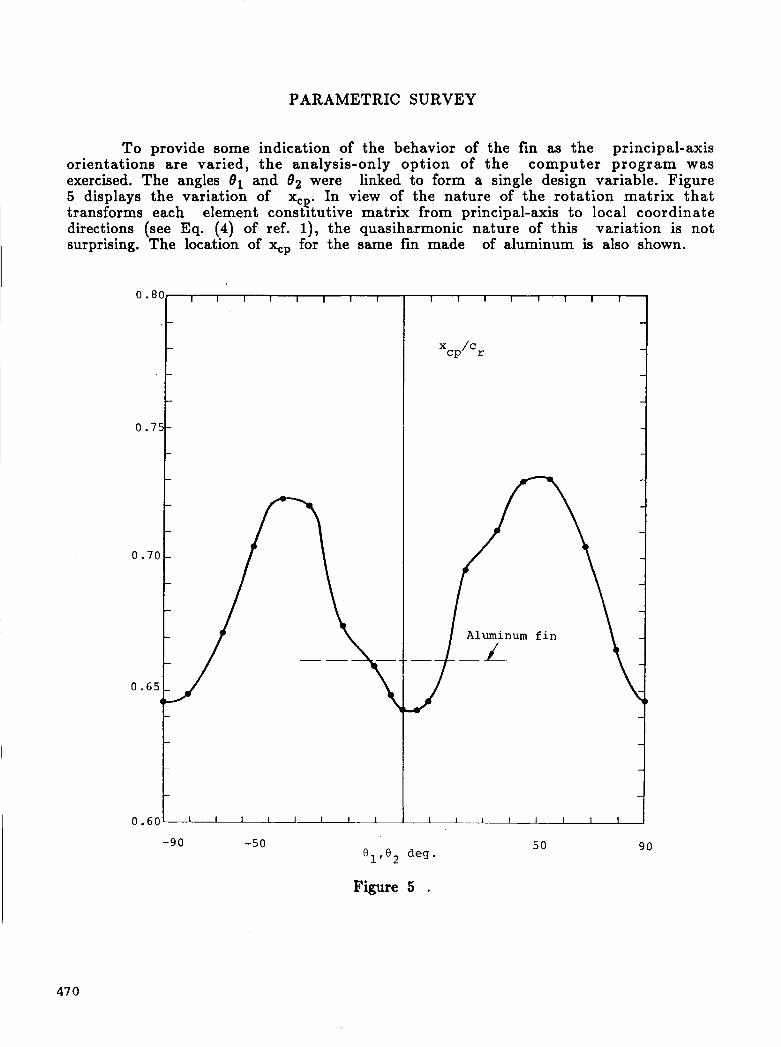
PARAMETRIC SURVEY
To provide some indication of the behavior of the fin as the principal-axis orientations are varied, the analysis-only option of the computer program was exercised. The angles 81 and 82 were linked to form a single design variable. Figure 5 displays the variation of xCp. In view of the nature of the rotation matrix that transforms each element constitutive matrix from principal-axis to local coordinate directions (see Eq. (4) of ref. l), the quasiharmonic nature of this variation is not surprising. The location of xcp for the same fin made of aluminum is also shown.
0.60
Figure 5 .
5 0 90
47 0
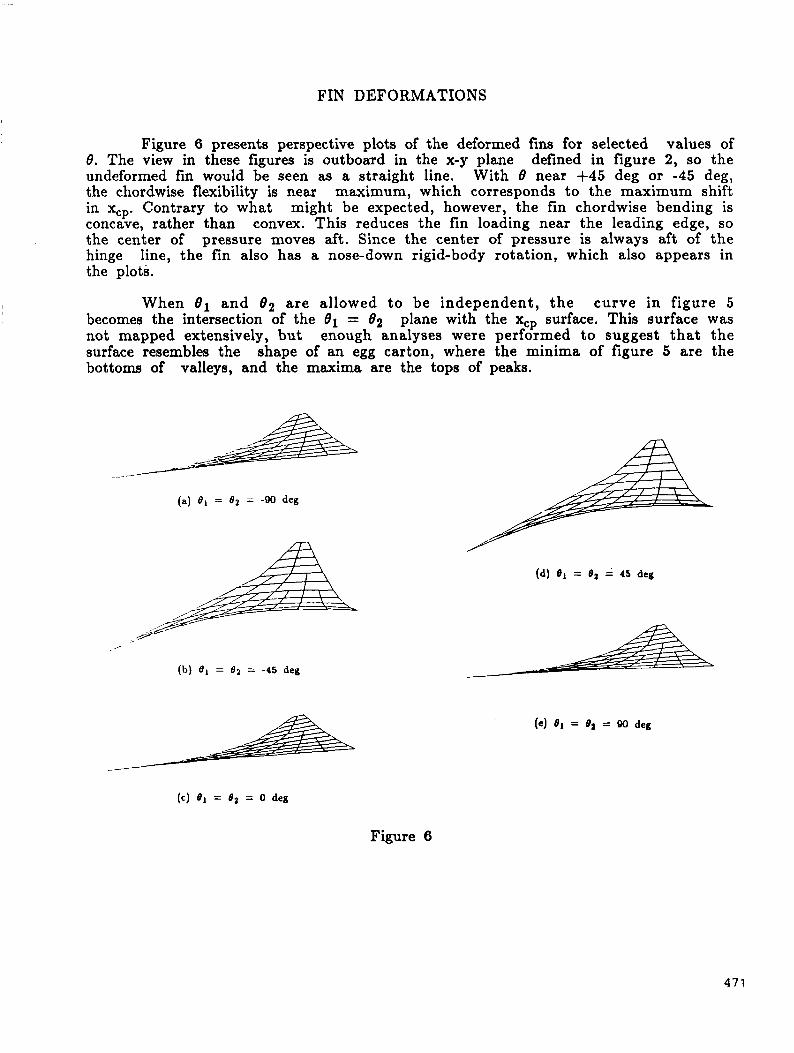
FIN DEFORMATIONS
Figure 6 presents perspective plots of the deformed fins for selected values of 8. The view in these figures is outboard in the x-y plane defined in figure 2, so the undeformed fin would be seen as a straight line. With 8 near +45 deg or -45 deg, the chordwise flexibility is near maximum, which corresponds to the maximum shift in xcp. Contrary to what might be expected, however, the fin chordwise bending is concave, rather than convex. This reduces the fin loading near the leading edge, so the center of pressure moves aft. Since the center of pressure is always aft of the hinge line, the fin also has a nose-down rigid-body rotation, which also appears in the plots.
When 81 and 8 2 are allowed to be independent, the curve in figure 5 plane with the xcp surface. This surface was
enough analyses were performed to suggest that the shape of an egg carton, where the minima of figure 5 are the
becomes the intersection of the 81 = 02 not mapped extensively, but surface resembles the bottoms of valleys, and the maxima are the tops of peaks.
(a) e, = e2 = -90 deg
,
(b) e1 = e2 = -45 deg
(d) el = e2 = 4s deg
(c) B , = B2 = 0 deg
Figure 6
47 1
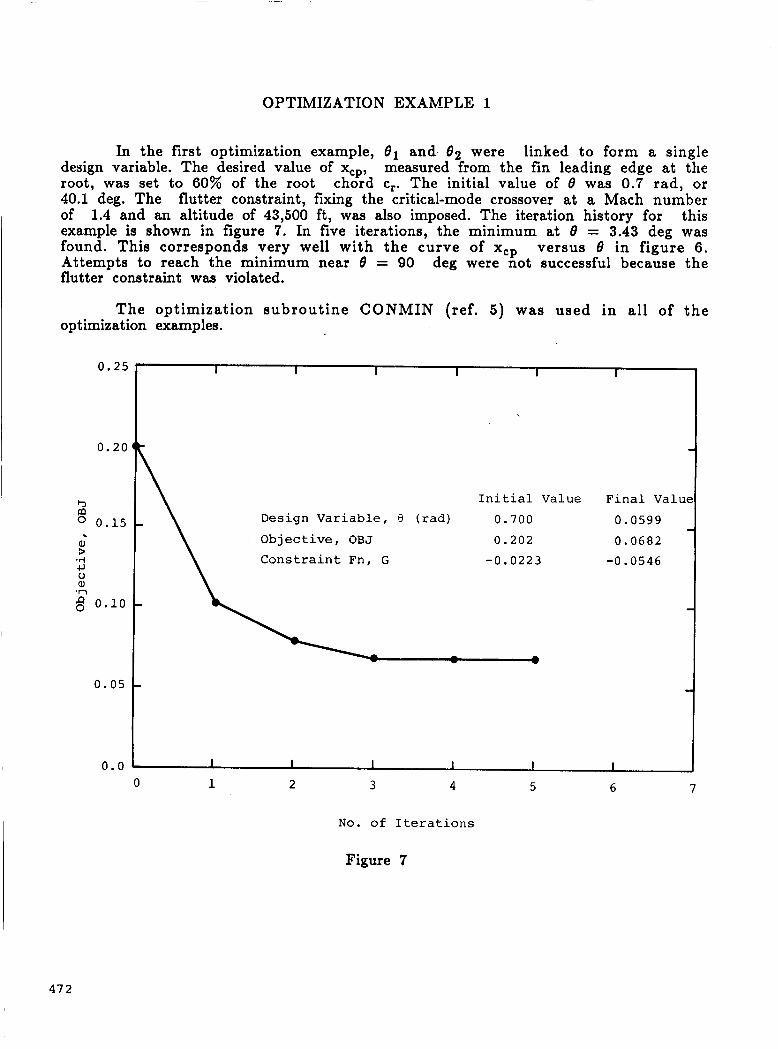
OPTIMIZATION EXAMPLE 1
Initial Value Final Value Design Variable, 8 (rad) 0.700 0.0599
' Objective, OBJ 0.202 0.0682
Constraint Fn, G -0.0223 -0.0546
-
-
- - 0
In the first optimization example, 81 and 82 were linked to form a single design variable. The desired value of qp, measured from the fin leading edge at the root, was set to 60% of the root chord c,. The initial value of 8 was 0.7 rad, or 40.1 deg. The flutter constraint, fixing the critical-mode crossover at a Mach number of this example is shown in figure 7. In five iterations, the minimum at 8 = 3.43 deg was found. This corresponds very well with the curve of xCp versus 8 in figure 6. Attempts to reach the minimum near 8 = 90 deg were not successful because the flutter constraint was violated.
1.4 and an altitude of 43,500 ft, was also imposed. The iteration history for
The optimization subroutine CONMIN (ref. 5) was used in all of the optimization examples.
0.25
0.20
b m 0.15 .
$
Q 0.10
4J 0 cu -n
0.05
0.0
2 3 4 5 6 7 0 1
No. of Iterations
Figure 7
47 2

OPTIMIZATION EXAMPLE 2
0.15
b
An iteration history for the second optimization example is shown in figure 8. Here 81 and 82 were unlinked, and the flutter constraint was removed. The initial values of 81 and 82 were 0 deg and 45 deg, respectively. Convergence was achieved in five clearly the valley near the origin in design space suggested by figure 5.
iterations with 81 = 0.334 deg and 82 = 1.53 deg. This is
I I I 1 I I
- - Initial Value Final Value
c
a,
c, u a, .n 'n 0
.5 0.10
0.05
0.0 0 1 2 3 4 5 6 7
No. of Iterations
Figure 8
473
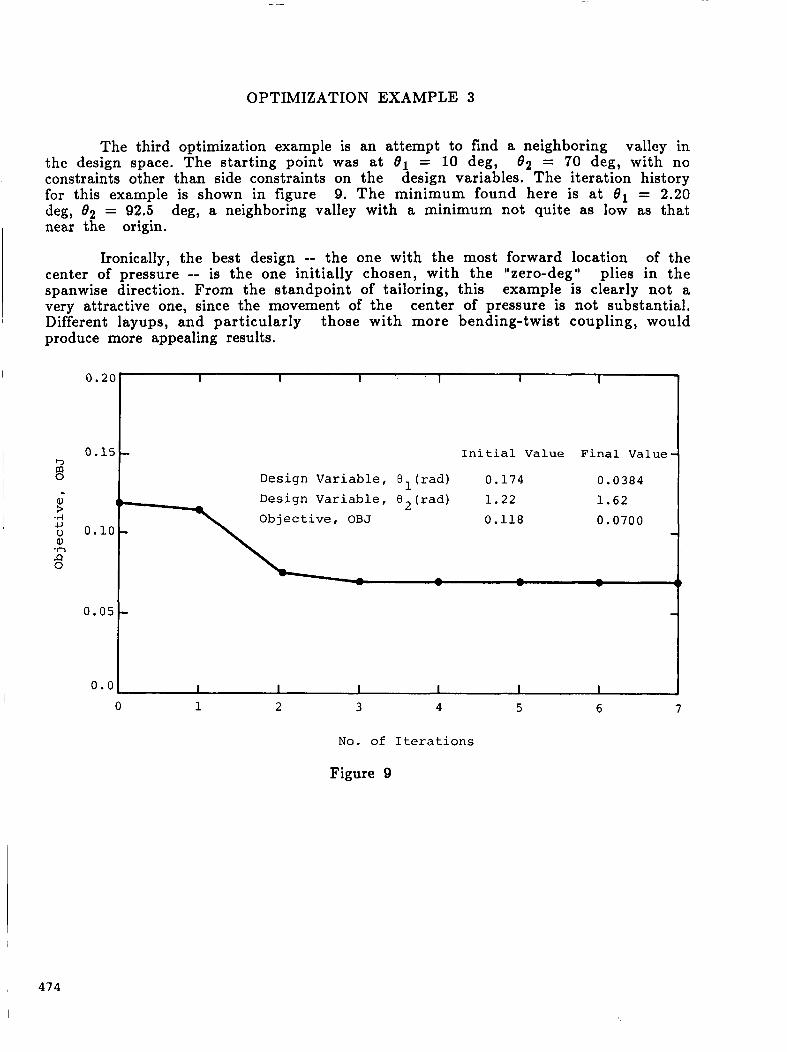
OPTIMIZATION EXAMPLE 3
The third optimization example is an attempt to find a neighboring valley in the design space. The starting point was a t 01 = 10 deg, 02 = 70 deg, with no constraints other than side constraints on the design variables. The iteration history for this example is shown in figure 9. The minimum found here is at 01 = 2.20 deg, 02 = 92.5 deg, a neighboring valley with a minimum not quite as low as that near the origin.
Ironically, the best design -- the one with the most forward location of the center of pressure -- is the one initially chosen, with the "zero-deg" plies in the spanwise direction. From the standpoint of tailoring, this example is clearly not a very attractive one, since the movement of the center of pressure is not substantial, Different layups, and particularly those with more bending-twist coupling, would produce more appealing results.
0.2t
0.15 b 0
al + -rl c,
al -n Q 0
m
.
u 0.1c
0.05
0.0
I I 1 ' I I - 1
I n i t i a l Value F i n a l Value
Design V a r i a b l e , 8 ( r a d ) 0 . 1 7 4 0 . 0 3 8 4
Design V a r i a b l e , €12(rad) 1 . 2 2 1 . 6 2 O b j e c t i v e , O B J 0 .118 0 . 0 7 0 0
- - - - - -
0 1 2 3 4 5 6 7
N o . of I t e r a t i o n s
Figure 9
474
REFERENCES
1. Dillenius, M. F. E. and McIntosh, S. C., Jr.: Aeroelastic Procedure for Controlling Hinge Moments. AIAA Paper 88-0528, presented at the AIAA 26th Aerospace Sciences Meeting (Reno, Nevada), January 1988.
2. Przemieniecki, J. S.: Theory of Matrix Structural Analysis. McGraw Hill, New York, 1968.
3. Zienkiewicz, 0. C.: 1977.
The Finite Element Method. McGraw-Hill (UK), London,
4. Dillenius, M. F. E.: Program LRCDM2, Improved Aerodynamics Prediction Program for Supersonic Canard-Tail Missiles with Axisymmetric Bodies. NASA CR- 3883, April 1985.
5. Vanderplaats, G. N.: CONMIN - A Fortran Program for Constrained Function Minimization. User's Manual. NASA TM X-62,282, August 1973. Addendum, May 1978.
ACKNOWLEDGEMENTS
The work described in this paper was performed as a Phase I Small Business Innovation Research (SBIR) project sponsored under NAVAIR Contract N00019-86- C-0032 and is being continued as a Phase I1 SBIR project under NAVAIR Contract N00019-88-C-0071.
475
EFFECTS OF NONLINEAR AERODYNAMICS AND STATIC AEROELASTICITY ON MISSION PERFORMANCE CALCULATIONS FOR A FIGXTER AIRCRAFT
Gary L. G i l e s NASA Langley Research Center
Hampton, VA
Kenneth E. Tatum Planning Research Corporation
Hampton, VA
Willard E. FOSS, Jr. NASA Langley Research Center
Hampton, VA
JeREcu)HVG PAGE BLANK NOT Fll.ME0
477
INTRODUCTION
During conceptual design studies of advanced aircraft, the usual practice is to use linear theory to calculate the aerodynamic characteristics of
developments and improvements in computational methods, especially computational fluid dynamics (CFD), provide significantly improved capability to generate detailed analysis data for the use of all disciplines involved in the evaluation of a proposed aircraft design.
This paper describes a multidisciplinary application of such analysis methods to calculate the effects of nonlinear aerodynamics and static aeroelasticity on the mission performance of a fighter aircraft concept. The aircraft configuration selected for study was defined in a previous study using linear aerodynamics and rigid geometry. The.results from the previous study are used as a basis of comparison for the data generated herein. Aerodynamic characteristics are calculated using two different nonlinear theories, potential flow and rotational (Euler) flow. The aerodynamic calculations are performed in an iterative procedure with an equivalent plate structural analysis method to obtain lift and drag data for a flexible (nonrigid) aircraft. These s tat ic aeroelastic data are then used in calculating the combat and mission performance characteristics of the aircraft. Comparisons are given between data obtained using conventional methods in the earlier study and the data obtained herein using more rigorous analytical methods.
I candidate rigid (nonflexible) geometric external shapes. Recent
Status Aircraft conceptual design studies based on linear aerodynamic theory and rigid geometric shape
Objective To calculate the effects of nonlinear aerodynamics and static aeroelasticity on the mission performance of a fighter aircraft concept
Outline Configuration definition Analytical tools and procedures Static aeroelastic results Mission performance results
478
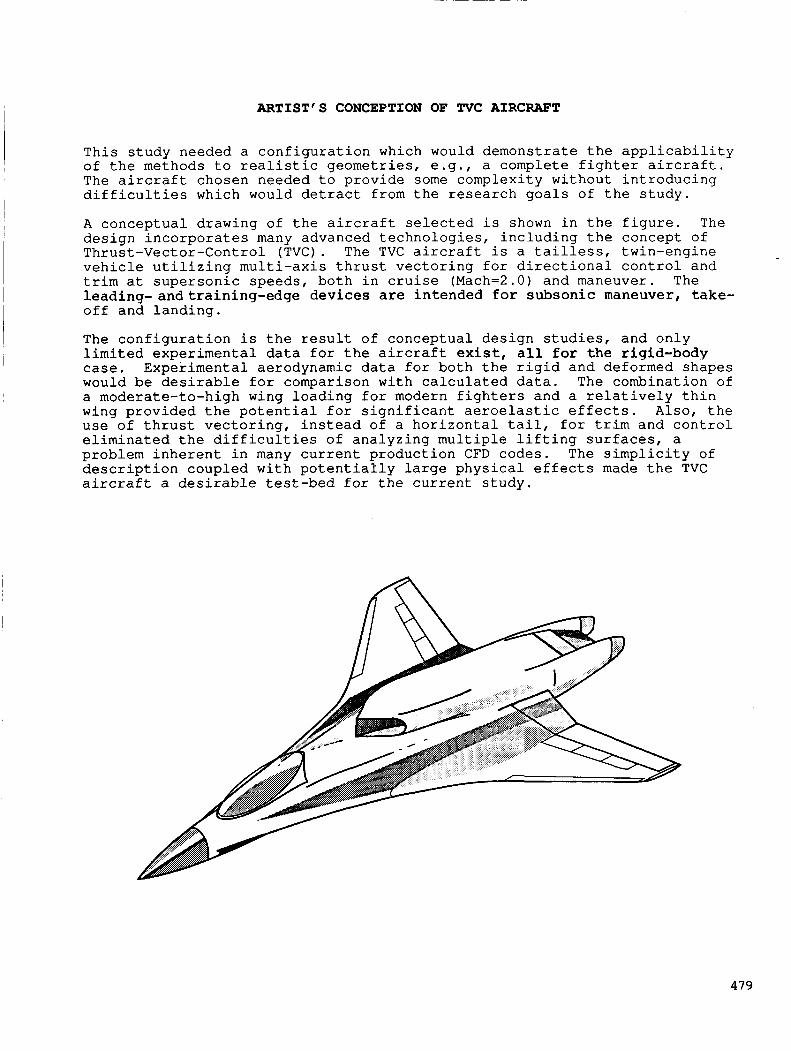
ARTIST'S CONCEPTION OF TVC AIRCRAFT
This study needed a configuration which would demonstrate the applicability of the methods to realistic geometries, e.g., a complete fighter aircraft. The aircraft chosen needed to provide some complexity without introducing difficulties which would detract from the research goals of the study.
A conceptual drawing of the aircraft selected is shown in the figure. The design incorporates many advanced technologies, including the concept of Thrust-Vector-Control (TVC). The TVC aircraft is a tailless, twin-engine vehicle utilizing multi-axis thrust vectoring for directional control and trim at supersonic speeds, both in cruise (Mach=2.0) and maneuver. The leading- andt ra in ing-edge devices are intended €o r subsonic maneuver, take- off and landing.
The configuration is the result of conceptual design studies, and only limited experimental data for the aircraft e x i s t , a l l f o r t h e rigid-body case. Experimental aerodynamic data for both the rigid and deformed shapes would be desirable for comparison with calculated data. The combination of a moderate-to-high wing loading for modern fighters and a relatively thin wing provided the potential for significant aeroelastic effects. Also, the use of thrust vectoring, instead of a horizontal tail, for trim and control eliminated the difficulties of analyzing multiple lifting surfaces, a problem inherent in many current production CFD codes. The simplicity of description coupled with potentially large physical effects made the TVC aircraft a desirable test-bed for the current study.
479
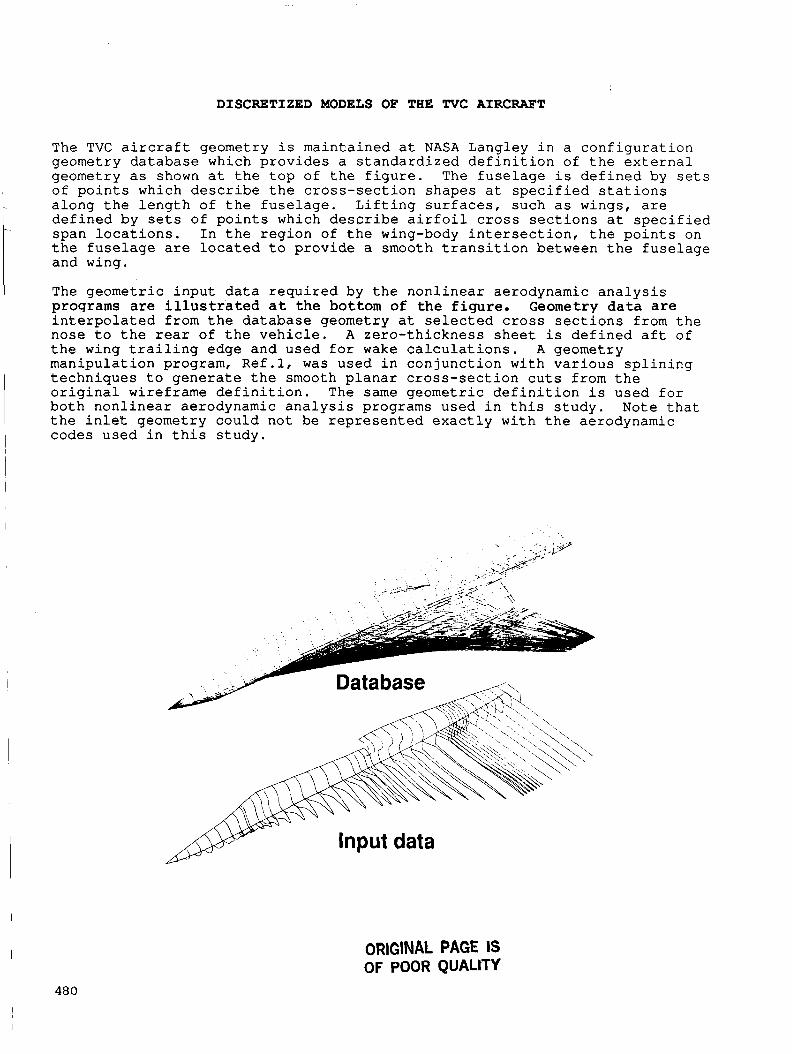
DISCRETIZED MODELS OF THE TVC AIRCRAFT
defined by s e t s of po in t s which descr ibe a i r f o i l c ross sec t ions a t spec i f i ed span loca t ions . I n t h e region of t h e wing-body i n t e r s e c t i o n , t h e po in t s on t h e fuse lage a r e loca ted t o provide a smooth t r a n s i t i o n between t h e fuselage and wing.
The geometric input da t a requi red by t h e nonl inear aerodynamic ana lys i s proqrams are i l l u s t r a t e d a t the bottom of the figure. Geometry data are i n t e rpo la t ed from t h e database geometry a t s e l ec t ed c ross sec t ions from t h e
ORIGINAL PAGE IS OF POOR QUALtTY
480
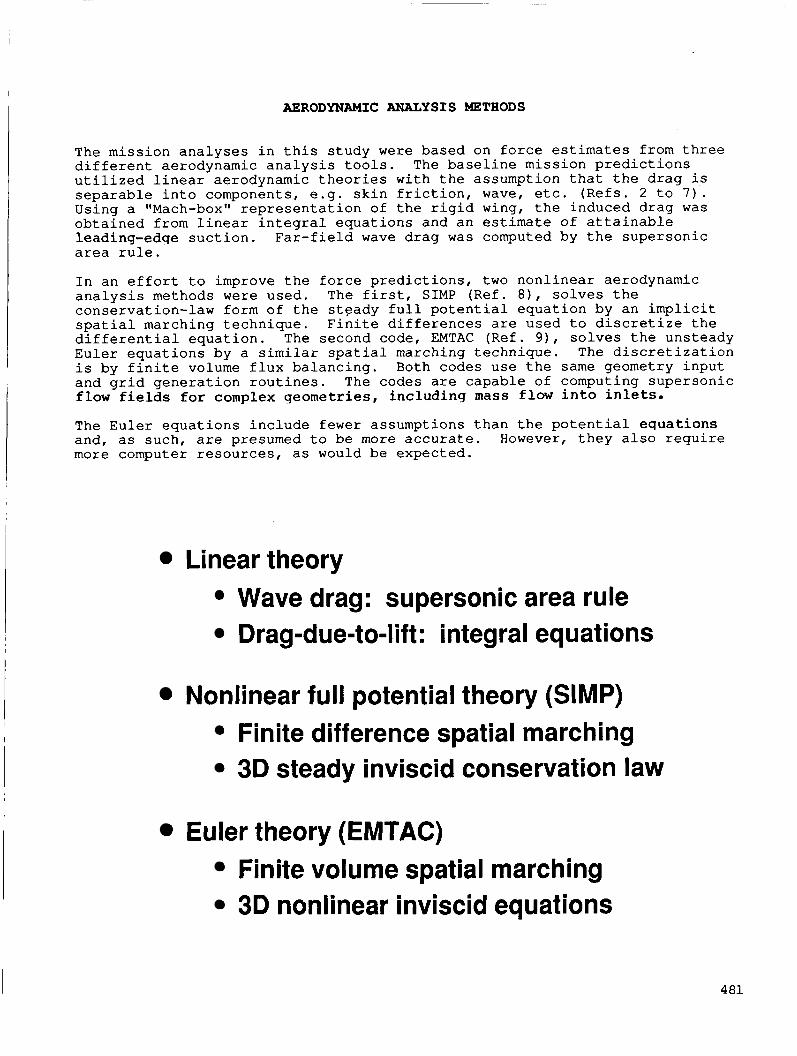
AERODYNAMIC ANALYSIS METHODS
The m i s s i o n a n a l y s e s i n t h i s s t u d y were based on f o r c e estimates f rom t h r e e d i f f e r e n t ae rodynamic a n a l y s i s t o o l s . u t i l i z e d l i n e a r ae rodynamic t h e o r i e s w i t h t h e a s s u m p t i o n t h a t t h e drag i s separable i n t o components , e .g . s k i n f r i c t i o n , wave, e t c . ( R e f s . 2 t o 7 ) . Us ing a "Mach-box" r e p r e s e n t a t i o n o f t h e r i g i d wing, t h e i n d u c e d drag w a s o b t a i n e d f r o m l i n e a r i n t e g r a l e q u a t i o n s a n d a n estimate of a t t a i n a b l e l ead ing -edge s u c t i o n . F a r - f i e l d wave drag was computed by t h e s u p e r s o n i c area r u l e .
The b a s e l i n e m i s s i o n p r e d i c t i o n s
I n a n e f f o r t t o improve t h e f o r c e p r e d i c t i o n s , two n o n l i n e a r aerodynamic a n a l y s i s methods were u s e d . The f i r s t , SIMP (Ref . 8), s o l v e s t h e c o n s e r v a t i o n - l a w form of t h e s t e a d y f u l l p o t e n t i a l e q u a t i o n by a n i m p l i c i t s p a t i a l march ing t e c h n i q u e . F i n i t e d i f f e r e n c e s are u s e d t o d i scre t ize t h e d i f f e r e n t i a l e q u a t i o n . The second code , EMTAC ( R e f . 91, solves t h e u n s t e a d y E u l e r e q u a t i o n s b y a s imi la r spa t i a l march ing t e c h n i q u e . The d i s c r e t i z a t i o n i s by f i n i t e volume f l u x b a l a n c i n g . a n d g r i d g e n e r a t i o n r o u t i n e s . The c o d e s are capable o f comput ing s u p e r s o n i c f l o w f ie lds for complex geometries, i n c l u d i n g mass f l o w i n t o i n l e t s .
The E u l e r e q u a t i o n s i n c l u d e f ewer a s s u m p t i o n s t h a n t h e p o t e n t i a l e q u a t i o n s and , as such , are presumed t o be more a c c u r a t e . However, t h e y a l s o r e q u i r e more computer r e s o u r c e s , as would be e x p e c t e d .
Both c o d e s u s e t h e s a m e geometry i n p u t
Linear theory Wave drag: supersonic area rule Drag-due-to-lift: integral equations
Nonlinear full potential theory (SIMP) Finite difference spatial marching 3D steady inviscid conservation law
Euler theory (EMTAC) Finite volume spatial marching 3D nonlinear inviscid equations
4 81
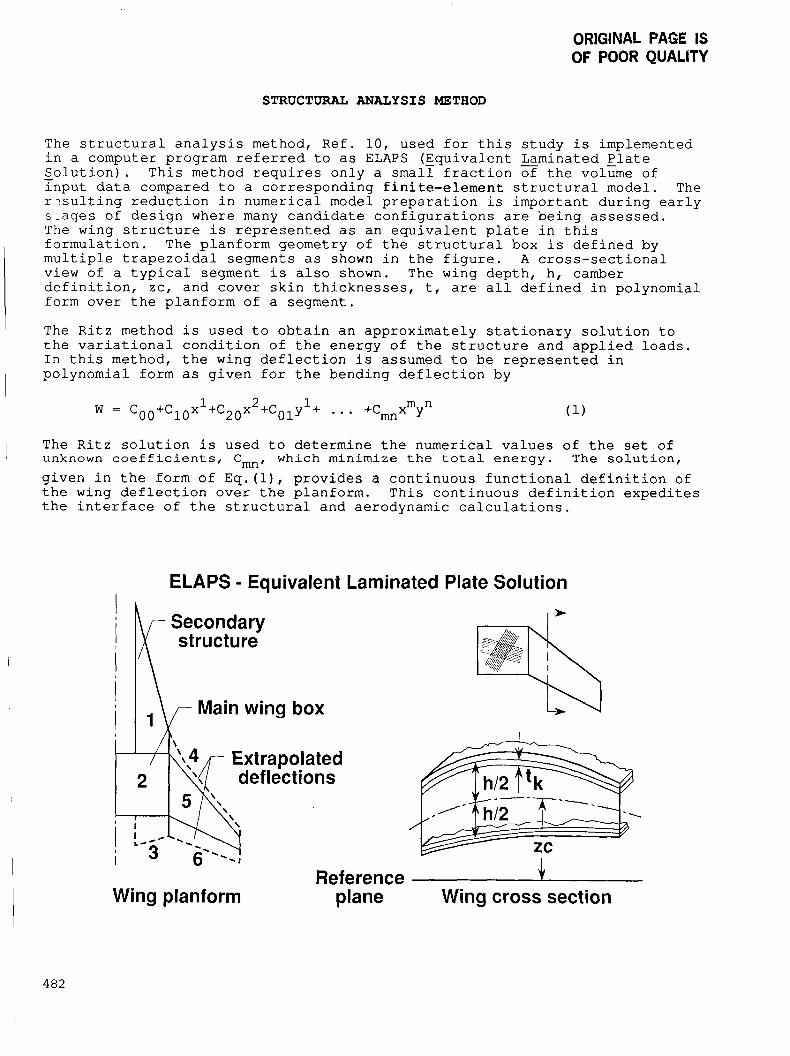
ORIGINAL PACE IS OF POOR QUALITY
STRUCTURAL ANALYSIS METHOD
The s t r u c t u r a l a n a l y s i s method, R e f . 1 0 , u s e d f o r t h i s s t u d y i s implemented i n a computer program r e f e r r e d t o a s ELAPS ( E q u i v a l e n t Lamina ted Plate - S o l u t i o n ) . T h i s method r e q u i r e s o n l y a s m a l l f r a c t i o n o f t h e volume o f i n p u t da ta compared t o a c o r r e s p o n d i n g f i n i t e - e l e m e n t s t r u c t u r a l model . The r ? s u l t i n g r e d u c t i o n i n n u m e r i c a l model p r e p a r a t i o n i s i m p o r t a n t d u r i n g e a r l y s:ages of d e s i g n where many c a n d i d a t e c o n f i g u r a t i o n s a re b e i n g assessed. The wing s t r u c t u r e i s r e p r e s e n t e d as an e q u i v a l e n t p l a t e i n t h i s f o r m u l a t i o n . The p l a n f o r m geometry o f t h e s t r u c t u r a l box i s d e f i n e d by m u l t i p l e t r a p e z o i d a l segments as shown i n t h e f i g u r e . A c r o s s - s e c t i o n a l view o f a t y p i c a l segment i s a l s o shown. The wing d e p t h , h , camber d e f i n i t i o n , z c , and c o v e r s k i n t h i c k n e s s e s , t , are a l l d e f i n e d i n po lynomia l form o v e r t h e p l a n f o r m o f a segment .
The R i t z method i s u s e d t o o b t a i n a n a p p r o x i m a t e l y s t a t i o n a r y s o l u t i o n t o t h e v a r i a t i o n a l c o n d i t i o n o f t h e e n e r g y of t h e s t r u c t u r e a n d appl ied l o a d s . I n t h i s method, t h e wing d e f l e c t i o n i s assumed t o b e r e p r e s e n t e d i n p o l y n o m i a l form as g i v e n f o r t h e b e n d i n g d e f l e c t i o n by
(1) w = coo+clox 1 +Czox 2 +co ly l ' . . . +cmnx m n y
The R i t z s o l u t i o n i s u s e d t o d e t e r m i n e t h e n u m e r i c a l v a l u e s of t h e set of unknown c o e f f i c i e n t s , Cmn, w h i c h m i n i m i z e t h e t o t a l e n e r g y . The s o l u t i o n , g i v e n i n t h e form of E q . ( l ) , p r o v i d e s a c o n t i n u o u s f u n c t i o n a l d e f i n i t i o n of t h e wing d e f l e c t i o n o v e r t h e p l a n f o r m . T h i s c o n t i n u o u s d e f i n i t i o n e x p e d i t e s t h e i n t e r f a c e o f t h e s t r u c t u r a l and aerodynamic c a l c u l a t i o n s .
ELAPS - Equivalent Laminated Plate Solution I
Secondary structure
Main wing box
Reference * Wing planform plane Wing cross section
482

MISSION ANALYSIS METHOD
A computer program which calculates the mission radius and maneuverability characteristics of combat aircraft, Ref. 11, is used in this study. This program has been used at the Langley Research Center to assess mission performance of proposed configurations and to indicate associated research programs which would be expected to yield the most beneficial improvements, Ref. 12. The program can be used (1) in an analysis mode to determine the performance characteristics of a given configuration or ( 2 ) in a sizing mode to determine the configuration size in terms of takeoff gross weight, wing loading, and thrust-to-weight ratio that best meets all the mission performance constraints. Only the analysis mode is used in this study.
A variety of military missions can be specified by using a desired combination of modules to calculate performance data for take-off, climb, cruise, loiter, dash, combat, descent, reserves, and landing segments of a mission profile. The definition of the.a'ircraft is given in terms of propulsion system characteristics, aerodynamic characteristics, along with size and weight of the vehicle. The propulsion characteristics are precomputed, usually from data supplied by an engine manufacturer. The aerodynamic characteristics are represented in terms of lift and drag coefficients as functions of aircraft angle of attack and flight Mach number. The size of the aircraft is defined in terms of the wing area, the size and number of engines, and the take-off gross weight.
Program used at Langley Research Center to calculate mission radius and maneuverability characteristics of mi I itary aircraft
Flight segments used Takeoff Climb Cruise Loiter Dash Combat Descent Reserves Landing
Inputs to program Propulsion
Aerodynamics
Aircraft size
(engine decks)
(CLand CD vs. a and M)
(wing area, takeoff gross weight)
483
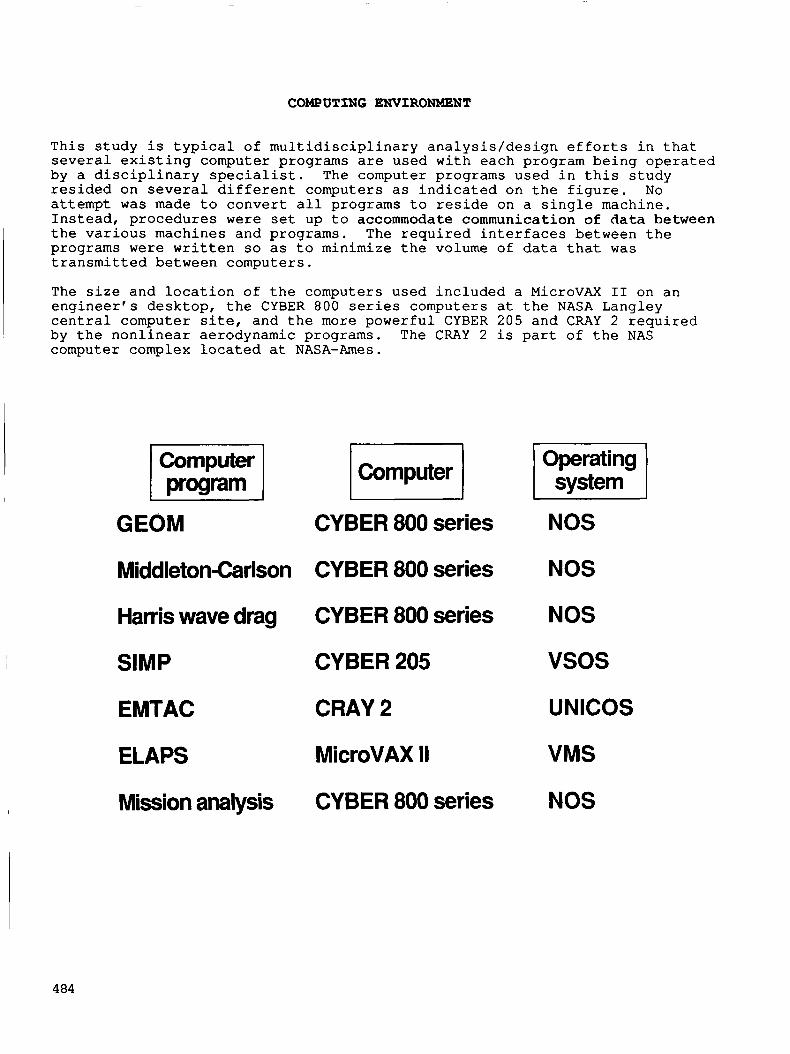
COMPUTING ENVIRONMENT
This study is typical of multidisciplinary analysis/design efforts in that several existing computer programs are used with each program being operated by a disciplinary specialist. The computer programs used in this study resided on several different computers as indicated on the figure. No attempt was made to convert all programs to reside on a single machine. Instead, procedures were set up to accommodate communication of data between the various machines and programs, The required interfaces between the programs were written so as to minimize the volume of data that was transmitted between computers.
The size and location of the computers used included a MicroVAX I1 on an engineer's desktop, the CYBER 800 series computers at the NASA Langley central computer site, and the more powerful CYBER 205 and CRAY 2 required by the nonlinear aerodynamic programs. The CRAY 2 is part of the NAS computer complex located at NASA-Ames.
Computer Operating system
GEOM
MiddletonCarlson
Harris wave drag
SIMP
EMTAC
ELAPS
Mission analysis
CYBER 800 series
CYBER 800 series
CYBER 800 series
CYBER 205
CRAY 2
MicroVAX II
CYBER 800 series
NOS
NOS
NOS
vsos UNICOS
VMS
NOS
4 84
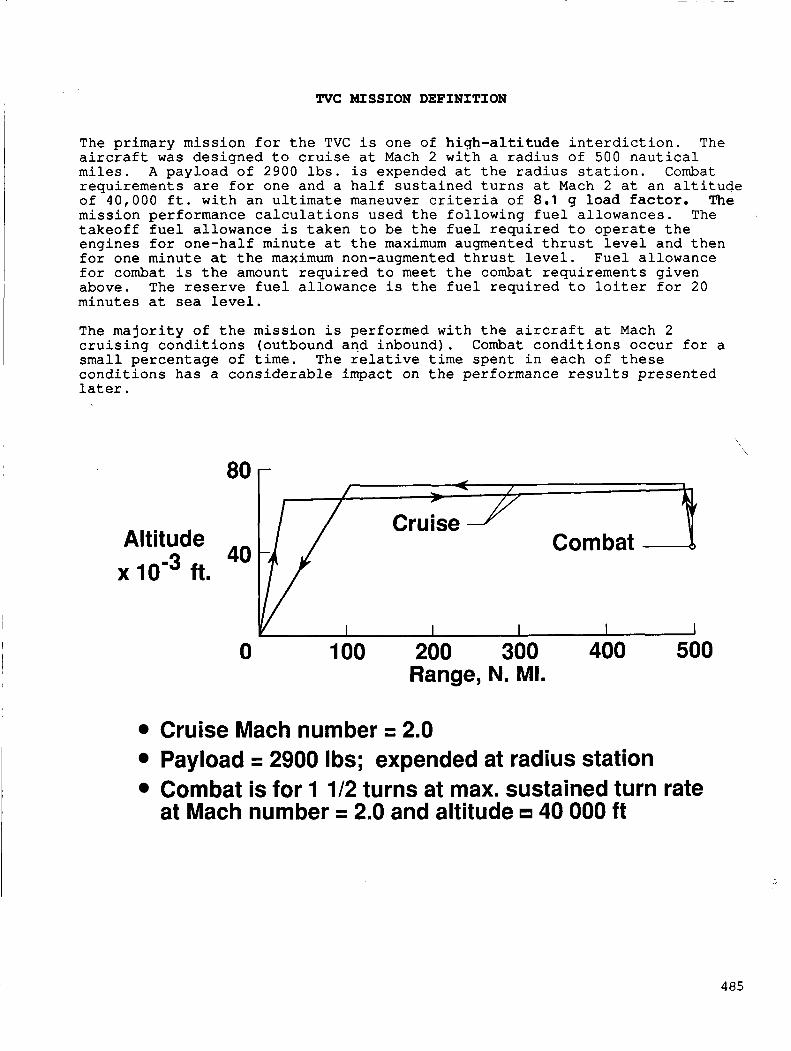
TVC MISSION DEFINITION
The p r imary m i s s i o n f o r t h e TVC i s one of h i q h - a l t i t u d e i n t e r d i c t i o n . The a i r c r a f t w a s d e s i g n e d t o c r u i s e a t Mach 2 w i t h a r a d i u s o f 500 n a u t i c a l m i l e s . A p a y l o a d o f 2900 lbs . i s expended a t t h e r a d i u s s t a t i o n . Combat r e q u i r e m e n t s are f o r one and a h a l f s u s t a i n e d t u r n s a t Mach 2 a t an a l t i t u d e of 4 0 , 0 0 0 f t . w i t h an u l t i m a t e maneuver c r i t e r i a of 8.1 g load f a c t o r . The m i s s i o n per formance c a l c u l a t i o n s used t h e f o l l o w i n g f u e l a l l o w a n c e s . The t a k e o f f f u e l a l lowance i s t a k e n t o be t h e f u e l r e q u i r e d t o o p e r a t e t h e e n g i n e s f o r one-ha l f minu te a t t h e maximum augmented t h r u s t l e v e l and t h e n f o r one minu te a t t h e maximum non-augmented t h r u s t l e v e l . F u e l a l lowance f o r combat i s t h e amount r e q u i r e d t o meet t h e combat r e q u i r e m e n t s g i v e n above , The r e s e r v e f u e l a l lowance i s t h e f u e l r e q u i r e d t o l o i t e r f o r 20 minu tes a t sea l e v e l .
The m a j o r i t y o f t h e m i s s i o n i s per formed wi th t h e a i r c r a f t a t Mach 2 c r u i s i n g c o n d i t i o n s (outbound and inbound) . Combat c o n d i t i o n s o c c u r f o r a small p e r c e n t a g e of t i m e . The r e l a t i v e t i m e s p e n t i n each o f t h e s e c o n d i t i o n s h a s a c o n s i d e r a b l e impact on t h e per formance r e s u l t s p r e s e n t e d l a t e r .
\
80 - I - / i
/ r
Cruise Y’ Altitude Combat x 10-3 ft.
I I I I 1 0 100 200 300 400 500
Range, N. MI.
Cruise Mach number = 2.0 Payload = 2900 Ibs; expended at radius station Combat is for 1 1/2 turns at max. sustained turn rate at Mach number = 2.0 and altitude 40 000 ft
485

FLEXIBLE WING AERO/STRUCTURAL ANALYSIS PROCEDURE
A flow chart of the iterative procedure to arrive at the aeroelastically deformed shape of a wing at a specified flight condition is shown in the figure. A detailed discussion of the original development of this procedure is given in reference 13. The process is initiated with the geometric shape determined during the conceptual design studies taken to be the shape of the flexible aircraft at cruise. This baseline shape is analyzed at cruise to yield the jig (fabrication) shape, and at maneuver for an initial estimate of the elastic maneuver loads. Application of these maneuver loads to the jig shape produces an initial approximation to to the elastic maneuver shape. approximation and applying these loads to the jig shape. aerodynamic load analysis the maneuver lift is maintained by adjusting the aircraft angle of attack. Convergence is achieved when the calculated air loads are consistent with the structural deflection from the jig shape. The converged aerodynamic characteristics are then used in mission analysis calculations.
The continuous definition of the deformed wing shape used in ELAPS expedites the interface between the aerodynamics and structures programs. equivalent load vector corresponding to the number of unknown displacement function coefficients, Eq. 1, is required for analysis of the equivalent plate structure. This load vector is formed by integrating the product of the aerodynamic pressure and displacement function terms over each portion of the aerodynamic grid on the wing surface. In the structures-to- aero interface, these continuous, analytic definitions of displacements are evaluated at each point of the aerodynamic input geometry and used directly to generate a deformed configuration.
Iteration proceeds by computing loads on the current maneuver shape At each
An
Procedure Assume shape I Cruise loads Maneuver loads I
I . _
I I I /
I Initial maneuver shape I 1 I
No Are loads consistent '-1 with shape?
7 - 7 Mission analysis
486
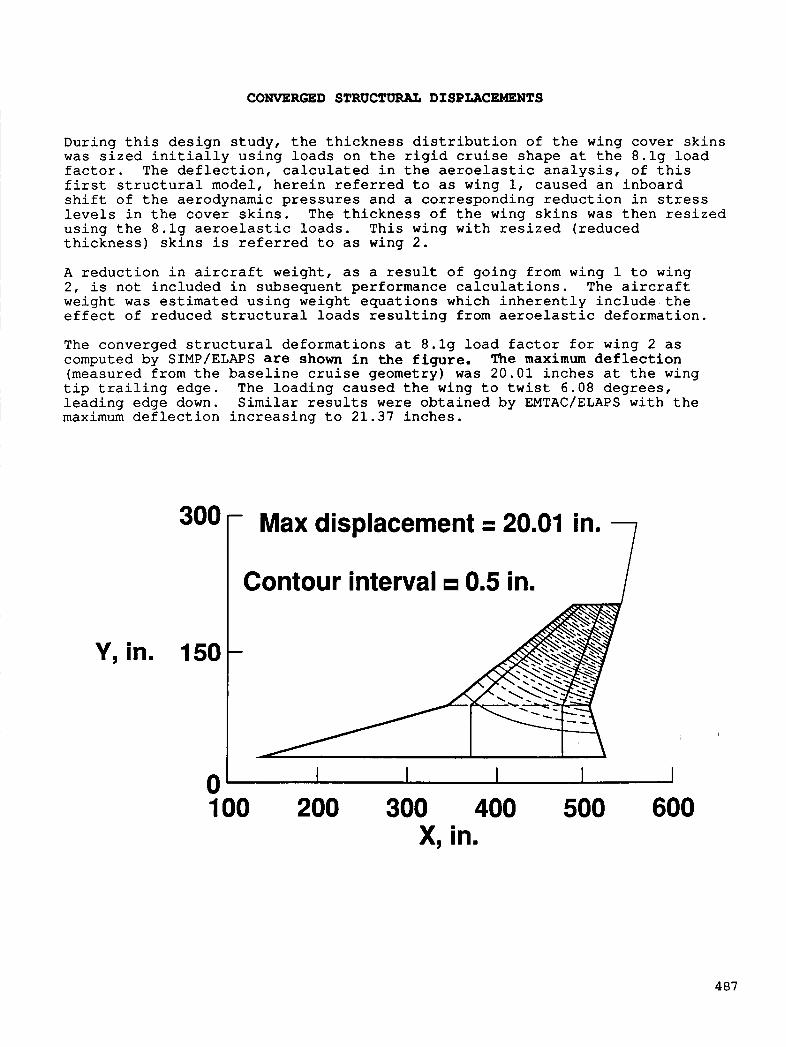
CONVERGED STRUCTURAL DISPLACEMENTS
Dur ing t h i s d e s i g n s t u d y , t h e t h i c k n e s s d i s t r i b u t i o n of t h e wing c o v e r s k i n s w a s s i z e d i n i t i a l l y u s i n g loads on t h e r i g i d c r u i s e s h a p e a t t h e 8 . l g l o a d f ac to r , The d e f l e c t i o n , c a l c u l a t e d i n t h e aeroelastic a n a l y s i s , o f t h i s f i r s t s t r u c t u r a l model , h e r e i n referred t o as wing 1, c a u s e d a n i n b o a r d s h i f t o f t h e aerodynamic p r e s s u r e s a n d a c o r r e s p o n d i n g r e d u c t i o n i n stress levels i n t h e c o v e r s k i n s . The t h i c k n e s s of t h e wing s k i n s w a s t h e n r e s i z e d u s i n g t h e 8 . l g aeroelastic loads. T h i s wing w i t h r e s i z e d ( r e d u c e d t h i c k n e s s ) s k i n s i s referred t o as wing 2 .
A r e d u c t i o n i n a i r c ra f t we igh t , as a r e s u l t of g o i n g f r o m wing 1 t o wing 2 , i s n o t i n c l u d e d i n s u b s e q u e n t pe r fo rmance c a l c u l a t i o n s . The a i r c ra f t we igh t w a s estimated u s i n g we igh t e q u a t i o n s which i n h e r e n t l y i n c l u d e t h e e f fec t o f r e d u c e d s t r u c t u r a l loads r e s u l t i n g f rom aeroelastic d e f o r m a t i o n .
The conve rged s t r u c t u r a l d e f o r m a t i o n s a t 8 . l g load f a c t o r f o r wing 2 as computed by SIMP/ELAPS are shown i n the figure. The maximum d e f l e c t i o n (measured f r o m t h e b a s e l i n e c r u i s e geometry) was 2 0 . 0 1 i n c h e s a t t h e wing
l e a d i n g edge down. S i m i l a r r e s u l t s were o b t a i n e d by EMTAC/ELAPS w i t h t h e maximum d e f l e c t i o n i n c r e a s i n g t o 2 1 . 3 7 i n c h e s .
, t i p t r a i l i n g edge. The l o a d i n g c a u s e d t h e wing t o t w i s t 6 .08 degrees,
~
= 20801 7 300 Max displacement r I Contour interval 085 in. I
0 ' I I I I 100 200 300 400 500 600
X, in.
487
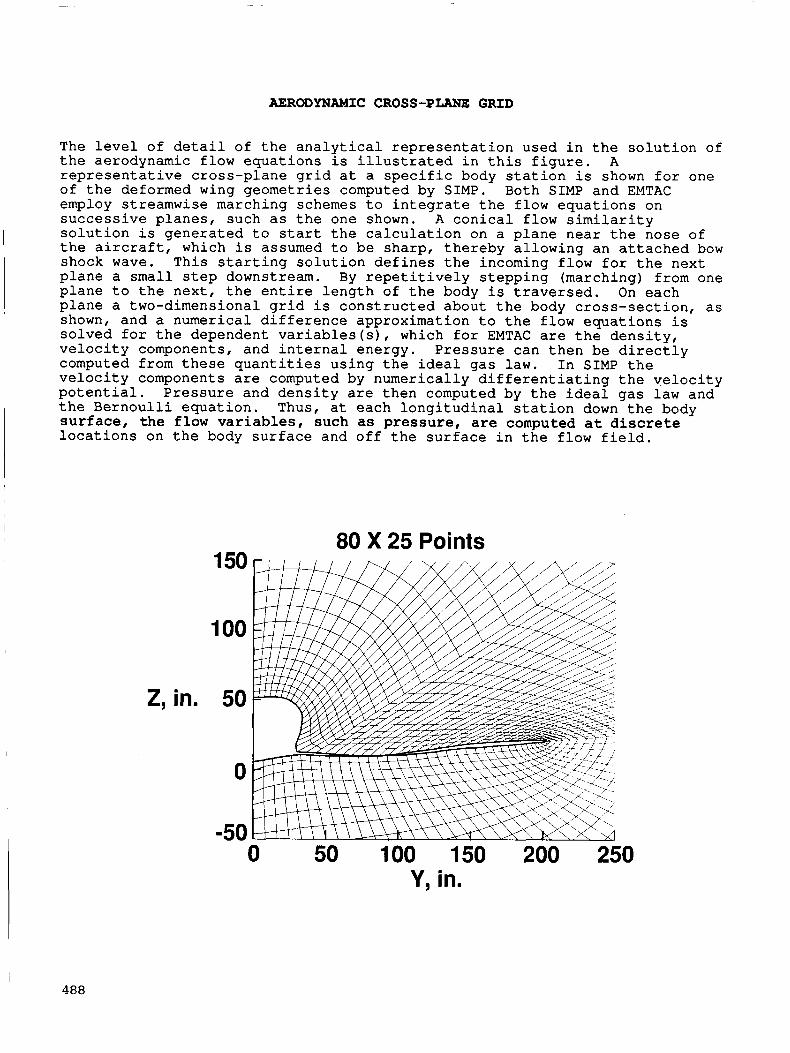
AERODYNAMIC CROSS-PLANE GRID
The l e v e l o f d e t a i l o f t h e a n a l y t i c a l r e p r e s e n t a t i o n used i n t h e s o l u t i o n of t h e aerodynamic f l o w e q u a t i o n s i s i l l u s t r a t e d i n t h i s f i g u r e . A r e p r e s e n t a t i v e c r o s s - p l a n e g r i d a t a specif ic body s t a t i o n i s shown f o r one o f t h e deformed wing g e o m e t r i e s computed by SIMP. Both SIMP and EMTAC employ streamwise marching schemes t o i n t e g r a t e t h e f low e q u a t i o n s on s u c c e s s i v e p l a n e s , such as t h e one shown. A c o n i c a l f low s i m i l a r i t y s o l u t i o n i s g e n e r a t e d t o s t a r t t h e c a l c u l a t i o n on a p l a n e n e a r t h e nose of t h e a i r c ra f t , which i s assumed t o be sharp, t h e r e b y a l l o w i n g an a t t a c h e d bow shock wave. T h i s s t a r t i n g s o l u t i o n d e f i n e s t h e incoming f low f o r t h e nex t plane a small s tep downstream. By r e p e t i t i v e l y s t e p p i n g (marching) f rom one p l a n e t o t h e n e x t , t h e e n t i r e l e n g t h of t h e body i s t r a v e r s e d . On each plane a two-dimensional g r id i s c o n s t r u c t e d abou t t h e body c r o s s - s e c t i o n , as shown, and a numer i ca l d i f f e r e n c e approx ima t ion t o t h e f low e q u a t i o n s i s s o l v e d f o r t h e dependent v a r i a b l e s ( s ) , which f o r EMTAC are t h e d e n s i t y , v e l o c i t y components, and i n t e r n a l ene rgy . P r e s s u r e can t h e n be d i r e c t l y computed from t h e s e q u a n t i t i e s u s i n g t h e ideal gas l a w . I n SIMP t h e v e l o c i t y components are computed by n u m e r i c a l l y d i f f e r e n t i a t i n g t h e v e l o c i t y p o t e n t i a l . P r e s s u r e and d e n s i t y are t h e n computed by t h e idea l gas l a w and t h e B e r n o u l l i e q u a t i o n . surface, the flow variables, such as pressure, are computed at discrete l o c a t i o n s on t h e body s u r f a c e and o f f t h e s u r f a c e i n t h e f low f i e l d .
Thus, a t each l o n g i t u d i n a l s t a t i o n down t h e body
80 X 25 Points 150
100
2, in. 50
0
-50 0 50 100 150 200 250
Y, in.
488
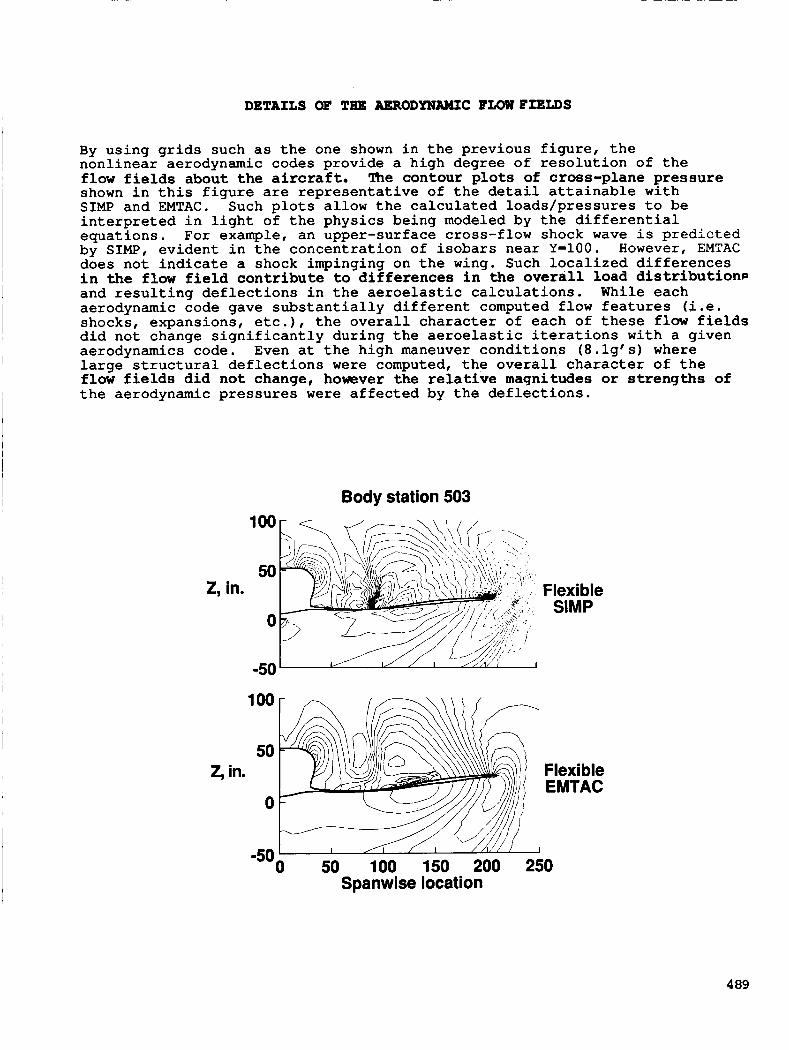
DETAILS OF THE AERODYNAMIC FLOW FIELDS
By using grids such as the one shown in the previous figure, the nonlinear aerodynamic codes provide a high degree of resolution of the flow fields about the aircraft. !l!he contour plots of cross-plane pressure shown in this figure are representative of the detail attainable with SIMP and EMTAC. Such plots allow the calculated loads/pressures to be interpreted in light of the physics being modeled by the differential equations. For example, an upper-surface cross-flow shock wave is predicted by SIMP, evident in the concentration of isobars near Y-100. However, EMTAC does not indicate a shock impinging on the wing. Such localized differences in the flow field contribute to differences in the overall load distribution- and resulting deflections in the aeroelastic calculations. While each aerodynamic code gave substantially different computed flow features (i.e. shocks, expansions, etc.), the overall character of each of these flow fields did not change significantly during the aeroelastic iterations with a given aerodynamics code. Even at the high maneuver conditions (8.lg's) where large structural deflections were computed, the overall character of the flow fields did not change, however the relative magnitudes or strengths of the aerodynamic pressures were affected by the deflections.
Body station 503
in.
100r ,-
Flexible SIMP
z, in. Flexible EMTAC
n
50 100 150 200 250 Spanwise location
4 89
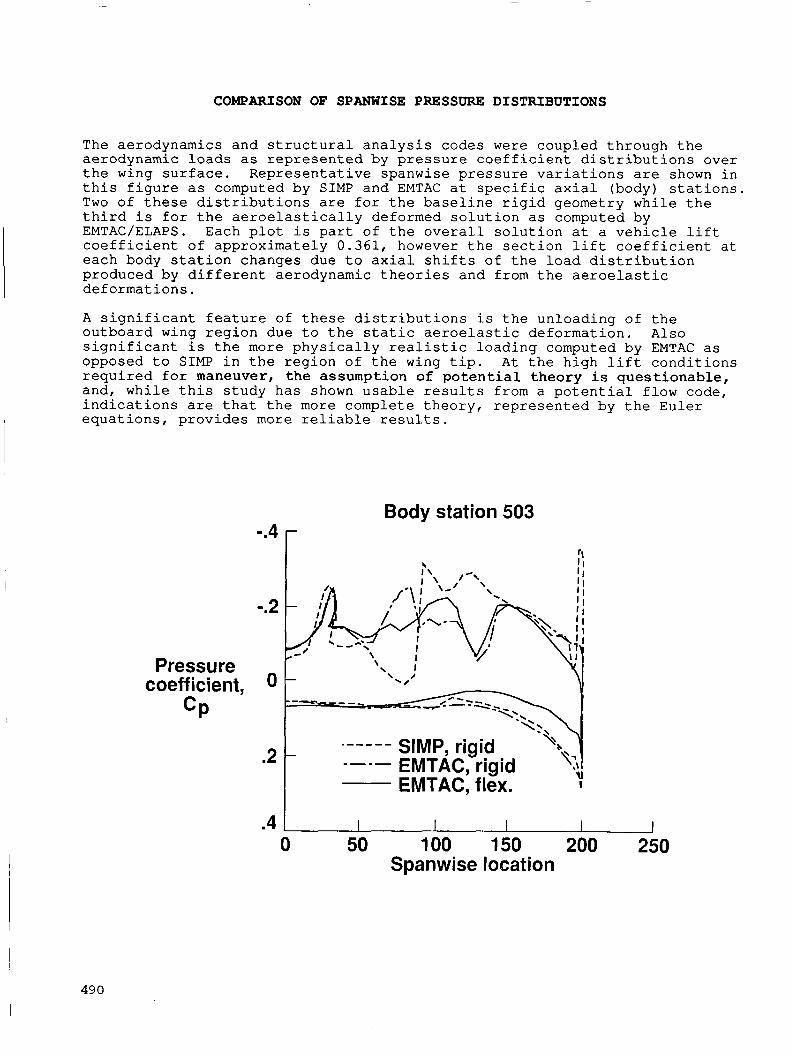
COMPARISON OF SPANWISE PRESSURE DISTRIBUTIONS
The aerodynamics and structural analysis codes were coupled through the aerodynamic loads as represented by pressure coefficient distributions over the wing surface. Representative spanwise pressure variations are shown in this figure as computed by SIMP and EMTAC at specific axial (body) stations. Two of these distributions are for the baseline rigid geometry while the third is for the aeroelastically deformed solution as computed by EMTAC/ELAPS. Each plot is part of the overall solution at a vehicle lift coefficient of approximately 0.361, however the section lift coefficient at each body station changes due to axial shifts of the load distribution produced by different aerodynamic theories and from the aeroelastic deformations.
A significant feature of these distributions is the unloading of the outboard wing region due to the static aeroelastic deformation. Also significant is the more physically realistic loading computed by EMTAC as opposed to SIMP in the region of the wing tip. At the high lift conditions required for maneuver, the assumption of potential theory is questionable, and, while this study has shown usable results from a potential flow code, indications are that the more complete theory, represented by the Euler
~ equations, provides more reliable results.
Body station 503 -.4 r
-.2
0 Pressure
coefficient , CP
.2
490
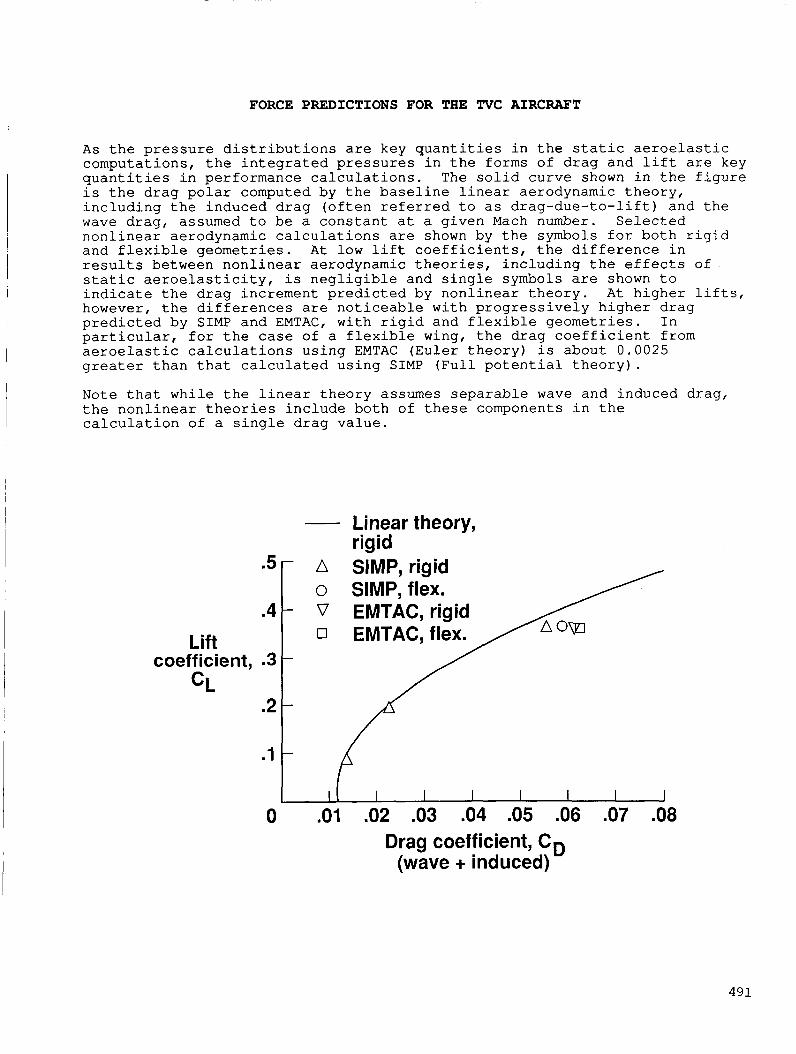
FORCE PREDICTIONS FOR THE TVC AIRCRAFT
A s t h e p r e s s u r e d i s t r i b u t i o n s are key q u a n t i t i e s i n t h e s t a t i c a e r o e l a s t i c c o m p u t a t i o n s , t h e i n t e g r a t e d p r e s s u r e s i n t h e fo rms o f drag a n d l i f t are key q u a n t i t i e s i n p e r f o r m a n c e c a l c u l a t i o n s . The s o l i d c u r v e shown i n t h e f i g u r e i s t h e drag p o l a r computed by t h e b a s e l i n e l i n e a r ae rodynamic t h e o r y , i n c l u d i n g t h e i n d u c e d drag ( o f t e n r e f e r r e d t o as d r a g - d u e - t o - l i f t ) a n d t h e wave drag, assumed t o be a c o n s t a n t a t a g i v e n Mach number. S e l e c t e d n o n l i n e a r ae rodynamic c a l c u l a t i o n s are shown by t h e symbols f o r b o t h r i g i d a n d f l e x i b l e g e o m e t r i e s . A t low l i f t c o e f f i c i e n t s , t h e d i f f e r e n c e i n r e s u l t s be tween n o n l i n e a r ae rodynamic t h e o r i e s , i n c l u d i n g t h e effects o f s t a t i c a e r o e l a s t i c i t y , i s n e g l i g i b l e a n d s i n g l e symbols are shown t o i n d i c a t e t h e drag i n c r e m e n t predicted by n o n l i n e a r t h e o r y . A t h i g h e r l i f t s , however , t h e d i f f e r e n c e s are n o t i c e a b l e w i t h p r o g r e s s i v e l y h i g h e r drag predicted b y SIMP a n d EMTAC, w i t h r i g i d a n d f l e x i b l e g e o m e t r i e s . I n p a r t i c u l a r , f o r t h e case o f a f l e x i b l e wing, t h e drag c o e f f i c i e n t f rom aeroe las t ic c a l c u l a t i o n s u s i n g EMTAC ( E u l e r t h e o r y ) i s a b o u t 0 . 0 0 2 5 greater t h a n t h a t c a l c u l a t e d u s i n g SIMP ( F u l l p o t e n t i a l t h e o r y ) .
Note t h a t w h i l e t h e l i n e a r t h e o r y assumes separable wave a n d i n d u c e d d r a g , t h e n o n l i n e a r t h e o r i e s i n c l u d e b o t h of t h e s e components i n t h e c a l c u l a t i o n o f a s i n g l e drag v a l u e .
.4
Lift 1 coefficient, -3
CL I
A 0 V 0
Linear theory, rigid SIMP, rigid SIMP, flex. /
0 .01 .02 .03 .04 .05 .06 .07 .08 Drag coefficient, CD
(wave + induced)
491
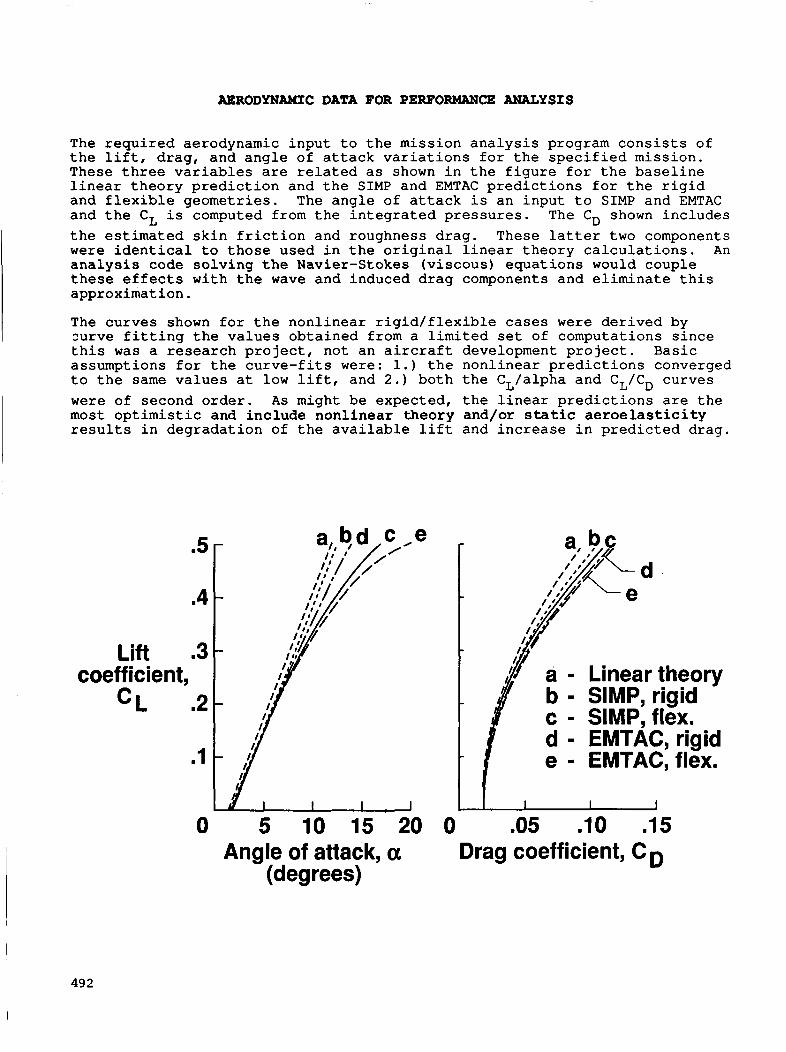
AERODYNAUIC DATA FOR PERFORMANCE ANALYSIS
The required aerodynamic input t o the mission analysis program consis ts of the l i f t , drag, and angle of a t tack var ia t ions f o r the specif ied mission. These three variables a re re la ted a s shown i n the f igure for the baseline l i nea r theory prediction and the SIMP and EMTAC predictions fo r the r i g i d and f l ex ib l e geometries. The angle of a t tack i s an input t o SIMP and EMTAC and the CL i s computed f r o m the integrated pressures. The CD shown includes the estimated s k i n f r i c t i o n and roughness drag. These l a t t e r two components were iden t i ca l t o those used i n t h e or ig ina l l inear theory calculat ions. An analysis code solving t h e Wavier-Stokes (viscous) equations would couple these e f f e c t s w i t h t h e wave and induced drag components and eliminate t h i s approximation.
The curves shown fo r t h e nonlinear r ig id / f l ex ib l e cases were derived by x r v e f i t t i n g the values obtained from a l imited s e t of computations since t h i s was a research project , not an a i r c r a f t development pro jec t . Basic assumptions fo r t h e curve-fi ts were: 1.) the nonlinear predictions convergec t o the same values a t low l i f t , and 2 . ) both t h e CL/alpha and CL/CD curves were of second order. A s might be expected, t h e l inear predictions a re the most opt imist ic and include nonlinear theory and/or s ta t ic ae roe la s t i c i ty r e s u l t s i n degradation of the available l i f t and increase i n predicted drag.
.5
.4
Lift .3 coefficient,
CL .2
.I
0 L
/ e
I 5 10 15 20
Angle of attack, a (degrees)
/ if I
a - Lineartheory b - SIMP, rigid c - SIMP,flex. d - EMTAC, rigid e - EMTAC,flex. I
0 .05 . 10 . 15 Drag coefficient, C D
49 2
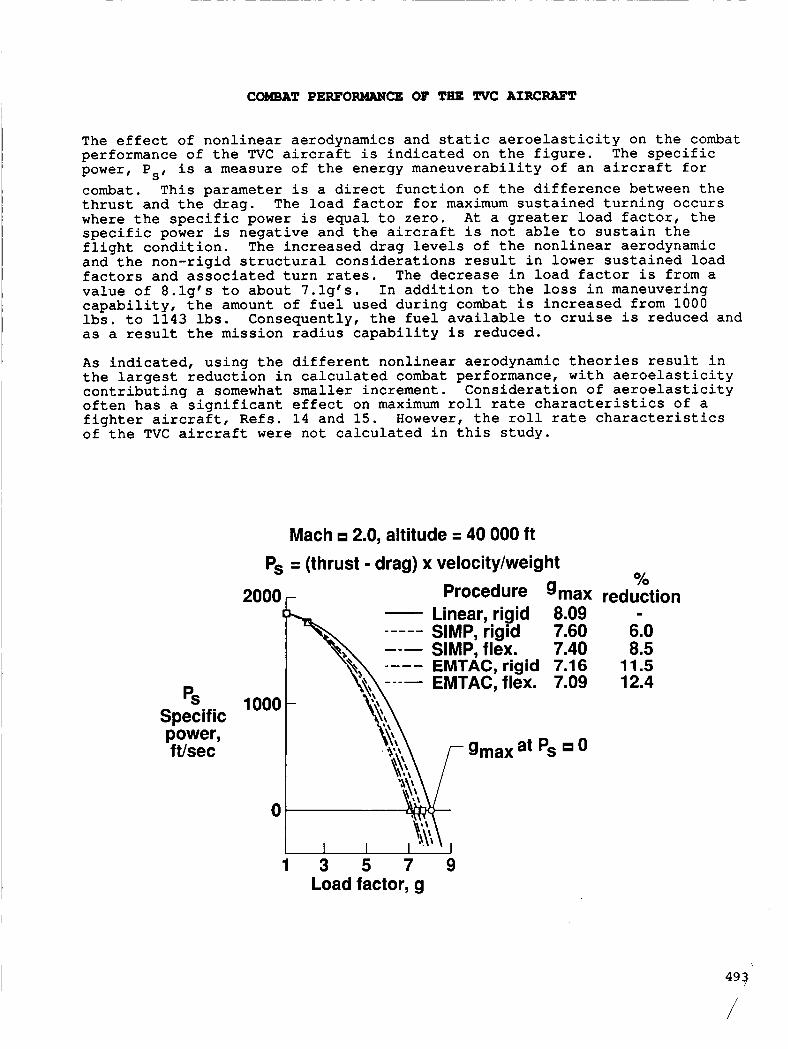
CObdBAT PERFORMANCE OF TEE TVC AIRCRAFT
The effect of nonlinear aerodynamics and static aeroelasticity on the combat performance of the TVC aircraft is indicated on the figure. The specific power, P,, is a measure of the energy maneuverability of an aircraft for combat. This parameter is a direct function of the difference between the thrust and the drag. The load factor for maximum sustained turning occurs where the specific power is equal to zero. At a greater load factor, the specific power is negative and the aircraft is not able to sustain the flight condition. The increased drag levels of the nonlinear aerodynamic and the non-rigid structural considerations result in lower sustained load factors and associated turn rates. The decrease in load factor is from a value of 8.19,s to about 7.19's. In addition to the loss in maneuvering capability, the amount of fuel used during combat is increased from 1000 lbs. to 1143 lbs. Consequently, the fuel available to cruise is reduced and as a result the mission radius capability is reduced.
As indicated, using the different nonlinear aerodynamic theories result in the largest reduction in calculated combat performance, with aeroelasticity contributing a somewhat smaller increment. Consideration of aeroelasticity often has a significant effect on maximum roll rate characteristics of a fighter aircraft, Refs. 14 and 15. However, the roll rate characteristics of the TVC aircraft were not calculated in this study.
Mach 2.0, altitude = 40 000 ft Ps = (thrust - drag) x velocity/weight
YO
Linear, rigid 8.09 I
----- SIMP, rigid 7.60 6.0 --- SIMP, flex. 7.40 8.5
EMTAC, rigid 7.16 11.5 EMTAC, flex. 7.09 12.4
2000 - Procedure gmaX reduction
PS Specific power, ftlsec gmax at Ps 0
1 3 5 7 9 Load factor, g
493
1
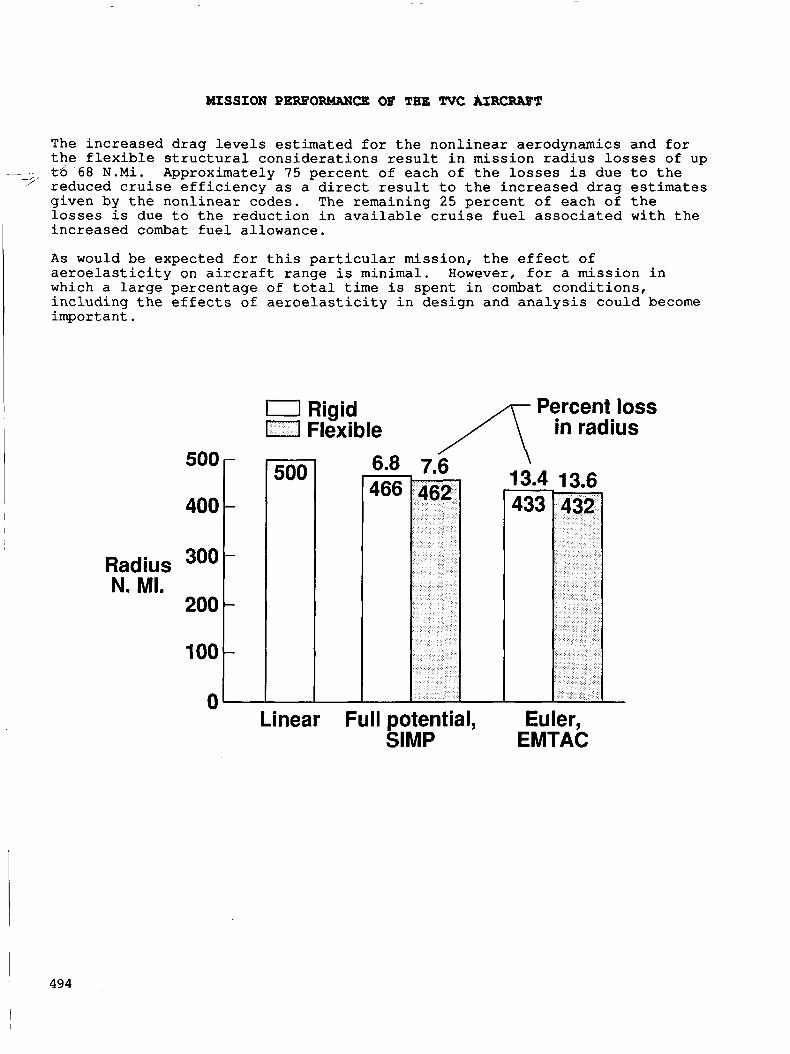
MISSION PERFORMANCE OF THE TVC AIRCRAFT
The increased drag levels estimated for the nonlinear aerodynamics and for the f lex ib le s t ruc tura l considerations r e su l t i n m i s s i o n radius losses of up I d 68 N . M i .
7' reduced cruise efficiency as a d i rec t r e su l t t o t h e increased drag estimates given b y t h e nonlinear codes. The remaining 25 percent of each of t he losses i s due t o the reduction i n available c ru ise fue l associated w i t h the increased combat fue l allowance.
- Approximately 75 percent of each of t h e losses is due t o t h e
As would be expected for t h i s par t icu lar mission, t h e e f f ec t of aeroe las t ic i ty on a i r c r a f t range i s minimal. However, f o r a mission i n which a large percentage of t o t a l time i s spent i n combat conditions, including the e f f ec t s of aeroe las t ic i ty i n design and analysis could become important.
0 Rigid Percent loss U Flexible A in radius
400 t 300 1 Radius
N. MI. *oat loot
500
Linear Full potential, Euler, SIMP EMTAC
494
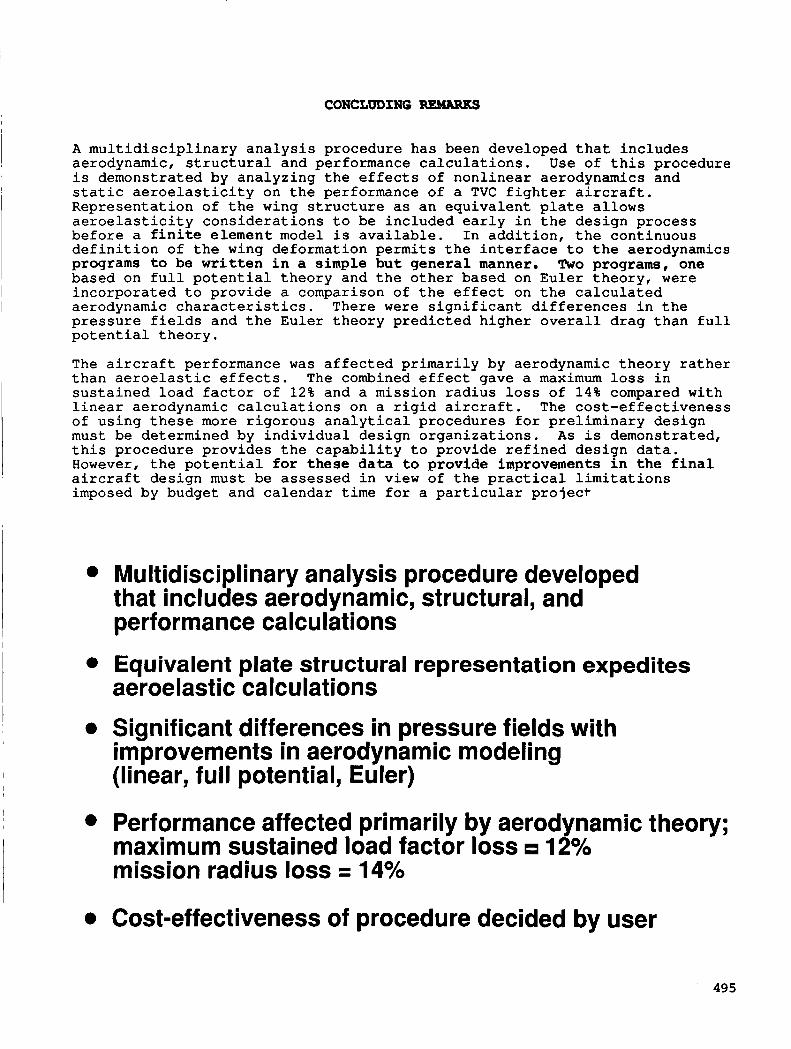
CONCLUDING REMARKS
A multidisciplinary analysis procedure has been developed that includes aerodynamic, structural and performance calculations. Use of this procedure is demonstrated by analyzing the effects of nonlinear aerodynamics and static aeroelasticity on the performance of a TVC fighter aircraft. Representation of the wing structure as an equivalent plate allows aeroelasticity considerations to be included early in the design process before a finite element model is available. In addition, the continuous definition of the wing deformation permits the interface to the aerodynamics programs to be written in a simple but general manner. Two programs, one based on full potential theory and the other based on Euler theory, were incorporated to provide a comparison of the effect on the calculated aerodynamic characteristics. There were significant differences in the pressure fields and the Euler theory predicted higher overall drag than full potential theory.
The aircraft performance was affected primarily by aerodynamic theory rather than aeroelastic effects. The combined effect gave a maximum loss in sustained load factor of 12% and a mission radius loss of 14% compared with linear aerodynamic calculations on a rigid aircraft. The cost-effectiveness of using these more rigorous analytical procedures for preliminary design must be determined by individual design organizations. As is demonstrated, this procedure provides the capability to provide refined design data. However, the potential for these data to provide improvements in the final aircraft design must be assessed in view of the practical limitations imposed by budget and calendar time for a particular project
e
0
e
e
e
Multidisciplinary analysis procedure developed that includes aerodynamic, structural, and performance calculations
Equivalent plate structural representation expedites aeroelastic calculations
Significant differences in pressure fields with improvements in aerodynamic modeling (linear, full potential, Euler)
Performance affected primarily by aerodynamic theory; maximum sustained load factor loss 12% mission radius loss = 14%
Cost-effectiveness of procedure decided by user
495
REFERENCES
1. Hall, J. F.; Neuhart, D. H.; and Walkley, K . B. : An Interactive Graphics Program for Manipulation and Display of Panel Method Geometry. NASA CR 166098, March 1983.
Boundary-Layer Skin Friction in the Presence of Severe Aerodynamic Heating at Mach Numbers from 2.8 to 7.0. NACA TN 3391, 1955.
2. Sommer, S. C.; and Short, B. J.: Free-Flight Measurements of Turbulent-
1 3. Harris, R. V., Jr.: An Analysis and Correlation of Aircraft Wave Drag.
4. Carlson, H. W.; and Middleton, W. D.: A Numerical Method for the Design
NASA TM X-947, 1964.
of Camber Surfaces of Supersonic Wings With Arbitrary Planforms. NASA TN D-2341, 1964.
5. Sorrells, R. B.; and Miller, D. S.: Numerical Method for Design of Minimum-Drag Supersonic Wing Camber With Constraints on Pitching Moment and Surface Deformation. NASA TN D-7097, 1972.
6 . Carlson, H. W.; and Miller, D. S.: Numerical Methods for the Design and Analysis of Wings at Supersonic Speeds. NASA TN D-7713, 1974.
7. Middleton, W. D.; and Lundry, J. L.: A System for Aerodynamic Design and Analysis of Supersonic Aircraft. NASA CR 3351-3354, 1980.
8. Shankar, V.; Szema, K-Y; and Bonner, E.: Full Potential Methods for Analysis/Design of Complex Aerospace Configurations. May 1986.
Computations Over Aerospace Configurations Using an Euler Marching Solver. NASA CR 4085, July 1987.
Representation for Aircraft Structural Analysis. NASA TM 89105, February 1987.
of Mission Radius and Maneuverability Characteristics of Fighter Aircraft. NASA TP 1837, March 1981.
NASA CR 3982,
9. Szema, K-Y; Chakravarthy, S.; and Shankar, V.: Supersonic Flow
10. Giles, G. L.: Further Generalization of an Equivalent Plate
11. FOSS, W. E., Jr.: A Computer Technique for Detailed Analysis
12. Coen, P. G.; and FOSS, W. E., Jr.: Computer Sizing of Fighter Aircraft. NASA TM 86351, January 1985.
13. Tatum, K. E.; and Giles, G. L.: Integrating Nonlinear Aerodynamic and Structural Analysis for a Fighter Configuration. AIAA Paper No. 87-2863. Presented at the 1987 AIAA/AHS/ASEE Aircraft Design, Systems and Operations Meeting, St. Louis, Missouri, Sept. 14-16, 1987.
January 1986.
Conference Proceedings No. 403, July 1987.
14. Static Aeroelasticity in Combat Aircraft. AGARD Report No. 725,
15. Static Aeroelastic Effects on High Performance Aircraft. AGARD
1 496
N89- 25171 OPTIMUM STRUCTURAL DESIGN
WITH STATIC AEROELASTIC CONSTRAINTS
2 3 K. B. Bowman ! R. V. Grandhi , and F. E. Eastep
* 1 Aerospace Engineer, Air Force Wright Aeronautical Lab., WPAFB, Ohio
2 Assistant Professor, Mechanical Systems Engineering, Wright State University, Dayton, Ohio
J Professor, Aerospace Engineering, University of Dayton, Dayton, Ohio
* Now the Wright Research Development Center
497
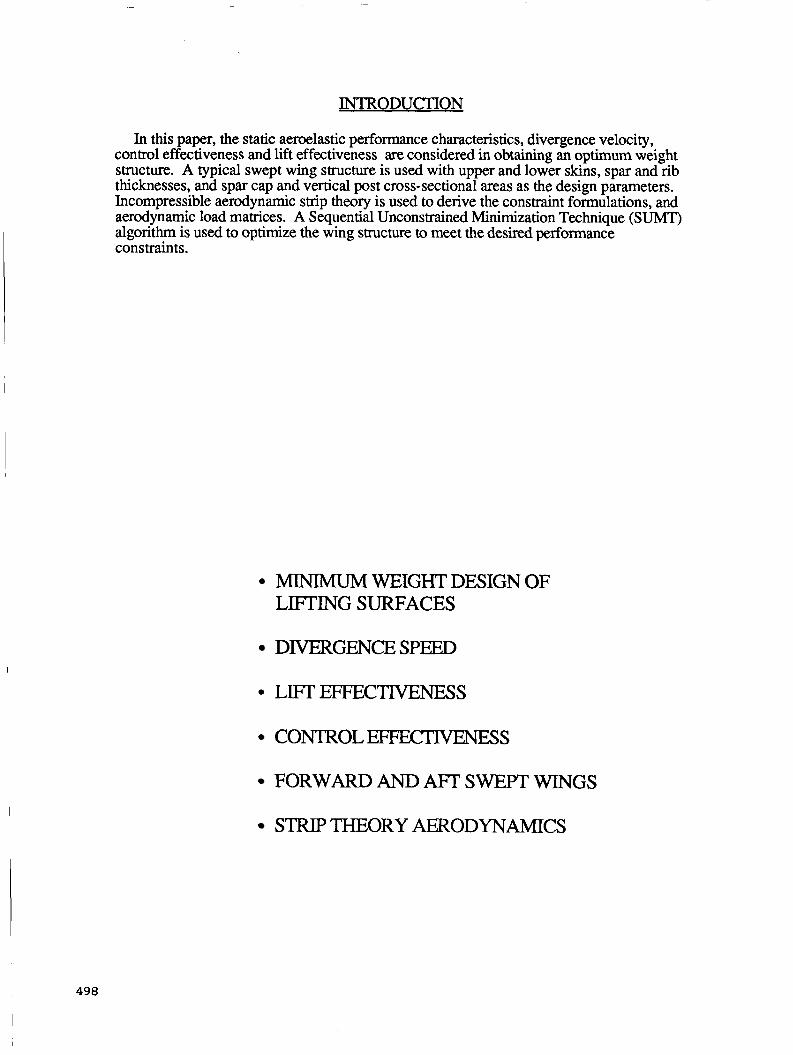
INTRODUCTION
In this paper, the static aeroelastic performance characteristics, divergence velocity, control effectiveness and lift effectiveness are considered in obtaining an optimum weight structure. A typical swept wing structure is used with upper and lower skins, spar and rib thicknesses, and spar cap and vertical post cross-sectional areas as the design parameters. Incompressible aerodynamic strip theory is used to derive the constraint formulations, and aerodynamic load matrices. A Sequential Unconstrained Minimization Technique (SUMT) algorithm is used to optimize the wing structure to meet the desired performance constraints .
MINIMUM WEIGHT DESIGN OF LIFI'ING SURFACES
DIVERGENCESPEED
C O N T R O L ~ S
FORWARD AND AFT SWEPT WINGS
STRIP THEORY AERODYNAMICS
498
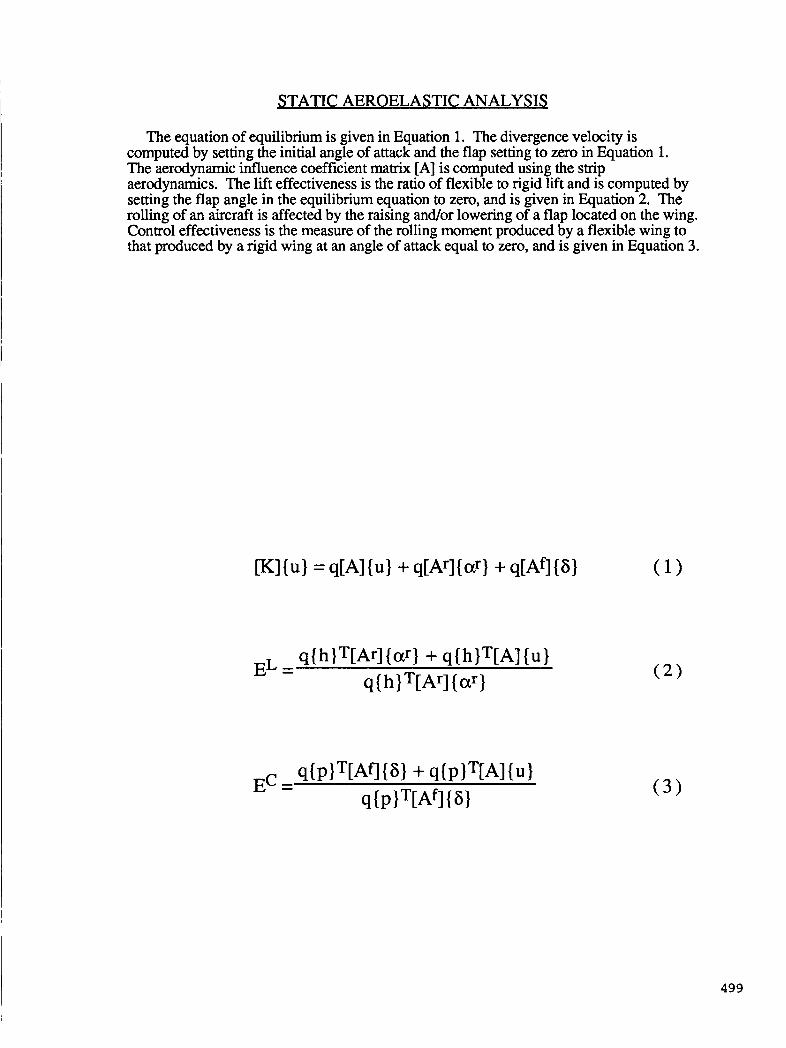
STATIC AEROELASTIC ANALYSIS
The equation of equilibrium is given in Equation 1. The divergence velocity is computed by setting the initial angle of attack and the flap setting to zero in Equation 1. The aerodynamic influence coefficient matrix [A] is computed using the strip aerodynamics. The lift effectiveness is the ratio of flexible to rigid lift and is computed by setting the flap angle in the equilibrium equation to zero, and is given in Equation 2. The rolling of an aircraft is affected by the raising and/or lowering of a flap located on the wing. Control effectiveness is the measure of the rolling moment produced by a flexible wing to that produced by a rigid wing at an angle of attack equal to zero, and is given in Equation 3.
L j -
499

SENSITIVITY ANALYSIS
Mathematical optimization techniques involve computation of the search direction for finding the optimum. This involves gradients of the constraints and the objective function with respect to the design variables. In the following, gradients of the aeroelastic behavior constraints are given. Calculation of the objective function gradient with respect to the design variables is straight forward. The divergence gradients are computed using the left and right eigenvectors. The aerodynamic matrices do not vary with the design variables.
ds- - dx
dx - (h}T[Ar]{ar}
(4 )
500
OPTIMIZATION PROBLEM
The structural weight was minimized with limitations on divergence velocity, lift effectiveness and control effectiveness. The design variables were upper and lower skin thicknesses, cross-sectional areas of vertical posts and spar caps, and spar and rib thicknesses. Lower bounds were imposed on the design variables. The optimization problem was solved using quadratic extended interior penalty function method with Newton's method of unconstrained minimization. The computer program NEWSUMT-A was used.
Minimize the structural weight, f(x) subject to
gj(x) = Gj(x) - Gj 2 0 j = 1, 2, ..., m and
( 7 )
501
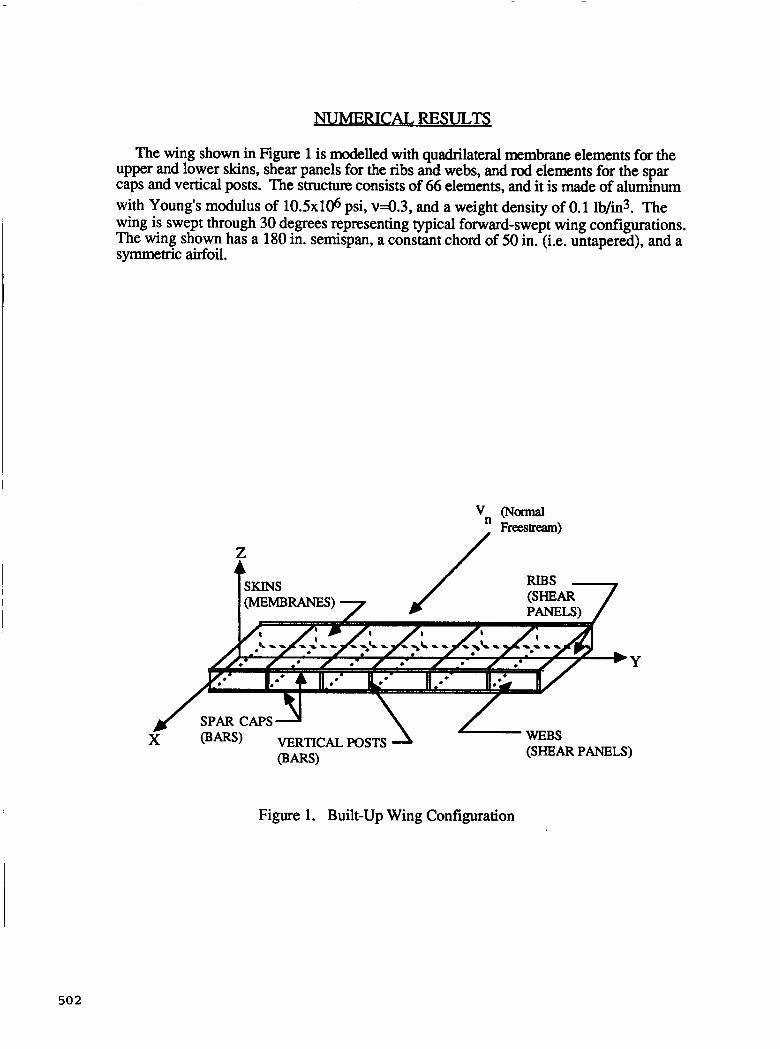
NUMERICAL, RESULB
The wing shown in Figure 1 is modelled with quadrilateral membrane elements for the upper and lower skins, shear panels for the ribs and webs, and rod elements for the spar caps and vertical posts. The structure consists of 66 elements, and it is made of aluminum with Young's modulus of 10.5~106 psi, ~ 4 . 3 , and a weight density of 0.1 lb/in3. The wing is swept through 30 degrees representing typical forward-swept wing configurations. The wing shown has a 180 in. semispan, a constant chord of 50 in. (i.e. untapered), and a symmetric airfoil.
Y
(SHEAR PANELS) PARS) VERTICAL POSTS PARS)
Figure 1. Built-up Wing Configuration
50 2
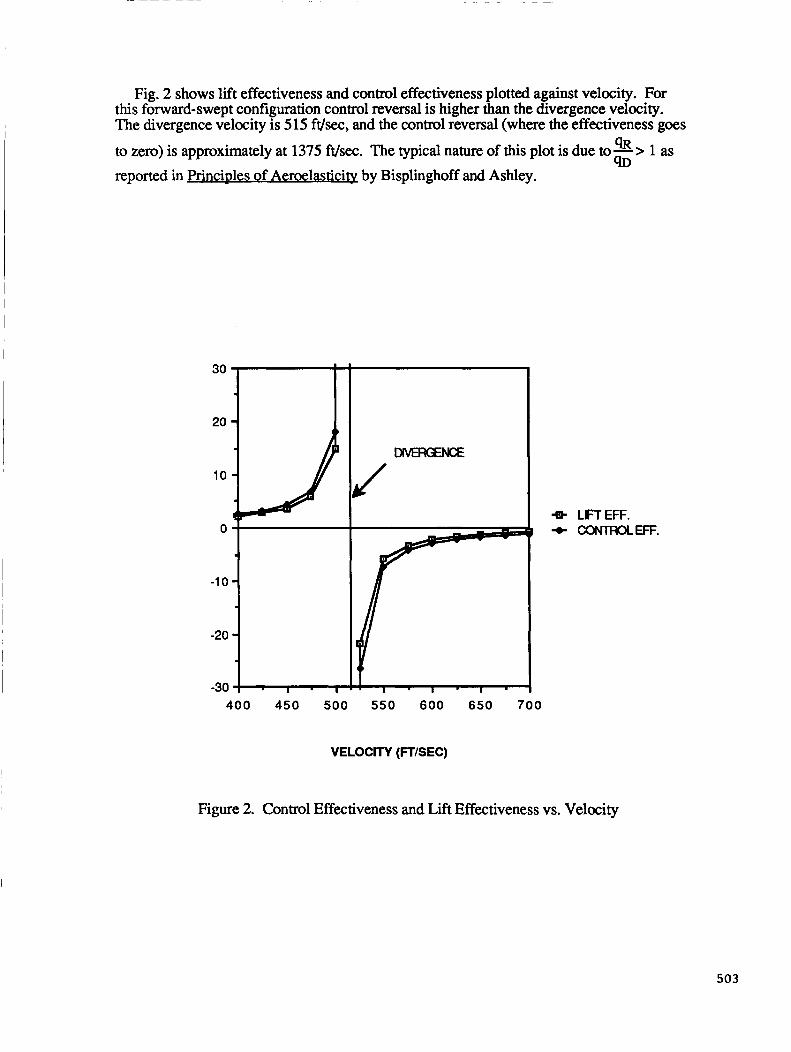
Fig. 2 shows lift effectiveness and control effectiveness plotted against velocity. For this forward-swept configuration control reversal is higher than the divergence velocity. The divergence velocity is 515 ft/sec, and the control reversal (where the effectiveness goes to zero) is approximately at 1375 ft/sec. The typical nature of this plot is due to - > 1 as reported in Principles of Aeroelasticity by Bisplinghoff and Ashley.
4R 9D
30
20
10
400 450 50C
J 4 LIFT EFF.
I + CONTROLEFF.
550 600 650 700
VELOCITY (FT/SEC)
Figure 2. Control Effectiveness and Lift Effectiveness vs. Velocity
503
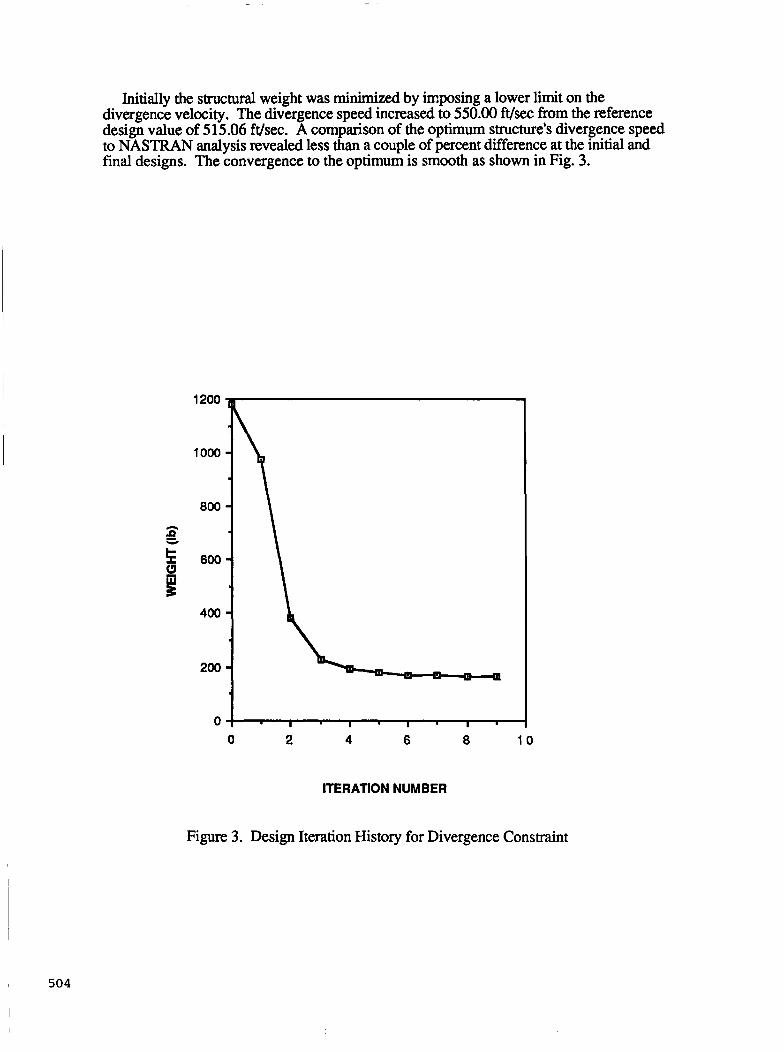
Initially the structural weight was minimized by imposing a lower limit on the divergence velocity. The divergence speed increased to 550.00 ft/sec from the reference design value of 515.06 ft/sec. A comparison of the optimum structure's divergence speed to NASTRAN analysis revealed less than a couple of percent difference at the initial and final designs. The convergence to the optimum is smooth as shown in Fig. 3.
0 2 4 6 8 10
ITERATION NUMBER
Figure 3. Design Iteration History for Divergence Constraint
504

2 . 4
2.2
2
11.8 Ii ti
1 . 6
1 . 4
1 . 2
The lift effectiveness and control effectiveness were calculated at the flight speed of 373.96 ft/sec, and were monitored as the divergence speed was increased. Several divergence velocities were considered for minimizing the structural weight. Fig. 4 shows the optimum weight vs. divergence velocity. The divergence speed lower limit was increased from 500 to 675 ft/sec. The optimum weight monotonically increased with the divergence velocity requirement. Lift effectiveness and control effectiveness both decreased with an increase in the divergence speed as shown in Fig. 4.
o Weight 0 Control eff.
Lift eff. - 245
- 220
- 195 4 - i5
- i 7 0 ki
- 145
- 120
Fig. 4 Optimum Weight, Lift Effectiveness and Control Effectiveness vs. Divergence Velocity
505

I The wing was optimized with two constraints imposed at a time to explore the opposite trend of the effectiveness values and divergence speeds with the increase of structural weight. The structure was optimized such that the divergence velocity be above 550 ft/sec and lift effectiveness above 2.0. The initial weight of the structure with all design variables set to 1.0 was 1180.80 lbs and the optimum structure had a divergence value of 560.57 ft/sec, a lift effectiveness of 2.7 1 , and a weight of 225.46 lbs. Optimization with control effectiveness in place of lift effectiveness yielded a divergence of 550.03 ft/sec, a control effectiveness of 3.18, and a weight of 168.17 lbs.
constraint values as mentioned above, the structure was optimized and converged to an optimum design after six iterations. The final weight was 249.63 lbs with a divergence speed of 573.36 ft/sec, a lift effectiveness of 2.53, and a control effectiveness of 2.62. Table 1 presents the optimum performance values obtained for different combinations of constraints.
Finally all three constraints were applied to this wing concurrently. Retaining the same
Table 1. ODtimization Results
506
CONCLUSIONS
The divergence velocity of forward-swept wing configurations is the primary characteristic that must be improved. An increase in the structural stiffness of a wing will prevent a low divergence speed, but results in an increase of aircraft weight. Also an increase in divergence velocity affected the decrease of lift effectiveness and control effectiveness. Optimization of a wing for the three static aeroelastic constraints involves careful selection of the constraint limits. The studied wing had an initial weight of 1180.9 lbs, and lift and control effectiveness values of 1.1 1 and 1.12 respectively. Following the optimization process that set constraint limits on the effectiveness values of 2.0 and 550.0 ft/sec on divergence speed, the wing weighed 249.63 lbs, satisfying all constraints. The above results demonstrate the capability and feasibilty of optimizing for all three constraints concurrently, rather than one at a time.
MINIMUM WEIGHT DESIGN IS PERFORMED FOR STATIC AEROELASTIC CONSTRAINTS
INCREASE IN DIVERGENCE SPEED RESULTS IN A DECREASE OF EFFECTIVENESS VALUES
CAREFUL SELECTION OF STATIC AEROELASTIC CONSTRAINT VALUES WILL RESULT IN SUCCESSFUL OPTIMIZATION
PRESENT APPROACH USED NEWSUMT-A PROGRAM
ULTIMATE GOAL IS TO DEVELOP OPTIMALITY TECHNIQUES
507
BIBLIOGRAPHY
1.
2.
3.
4.
5.
6.
I 7.
8.
, 9.
10.
Bisplinghoff, R.L, Ashley, H., Principles of Aeroelasticity, John Wiley and Sons, Inc., New York, 1962, pp. 196.
Bisplinghoff, R.L, Ashley, H., and R. L. Halfman, Aeroelasticity, Addison- Wesley Publishing Company, Massachusetts, 1957, pp. 11-13,474 - 506.
Bohlmann, J.D., Eckstrom, C.V., and Weisshaar, T.A., "Aeroelastic Tailoring for Oblique Wing Lateral Trim," A W A S W A S W A H S 29th Structures, Structural Dyn&cs and Materials Conference, Williamsburg, Virginia, AIAA-88-2263, April 18-20, 1988.
Eastep, F.E., "Structural Optimization With Static Aeroelastic Constraints," Flight Dynamics Laboratory, Wright-Patterson Air Force Base, December 1987.
Eastep, F.E., Venkayya, V.B., and Tischler, V.A., "Divergence Speed Degradation of Forward Swept Wings With Damaged Composite Skin," Journal of Aircrafr, Vol. 21, No. 11, November 1984, pp 921-923.
Grandhi, R.V., Thareja, R., and Haftka, R.T., "NEWSUMT - A: A General Purpose Program for Constrained Optimization Using Constraint Approximations," ASME Journal of Mechanisms, Transmissions, and Automation in Design, Vol.
Lerner, E. and MarkoWitz, J., "An Efficient Structural Resizing Procedure for Meeting Static Aeroelastic Design Objectives," W A S M E 19th Stxuctures, Structural Dynamics and Materials Conference, Bethesda, Md., Paper 78-47 1,
107, March 1985, pp 94-99.
April 3-5, 1978, pp. 65-71.
Schmit, L.A., and Thornton, W.A., "Synthesis of an Airfoil at Supersonic Mach Number," NASA-CR-144, 1,4, 1965
Shirk, M.H., Hertz, T.J., and Weisshaar, T.A., "A Survey of Aeroelastic Tailoring- Theory, Practice, and Promise," Journal of Aircraft, Vol. 23, No. 1, January 1986, pp 6-18.
Weisshaar, T.A, "Forward Swept Wing Static Aeroelasticity," AFFDL-TR-79- 3087, Air Force Flight Dynamics Laboratory, June 1979.
5 08
N89-25112 * a
OPTIMUM DESIGN OF SWEPT-FORWARD HIGH-ASPECT-RATIO GRAPHITE-EPOXY WINGS
M . J . Shuart NASA Langley Research Center
Hampton, Virginia
R , T . Haftka
Blacksburg, Virginia Virginia Polytechnic I n s t i t u t e and State University
R . L . Campbell NASA Langley Research Center
Hampton, Virginia
509
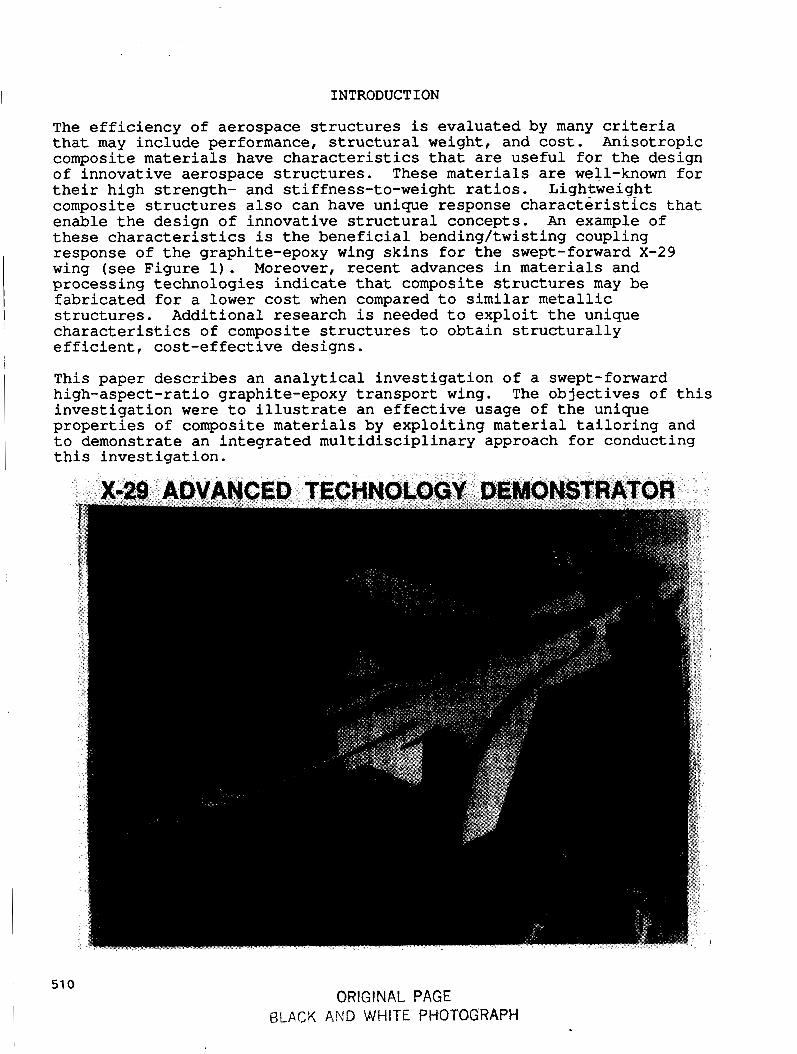
INTRODUCTION
The efficiency of aerospace structures is evaluated by many criteria that may include performance, structural weight, and cost. Anisotropic composite materials have characteristics that are useful for the design of innovative aerospace structures. These materials are well-known for their high strength- and stiffness-to-weight ratios. Lightweight composite structures also can have unique response characteristics that enable the design of innovative structural concepts. An example of these characteristics is the beneficial bending/twisting coupling response of the graphite-epoxy wing skins for the swept-forward X-29 wing (see Figure 1). Moreover, recent advances in materials and processing technologies indicate that composite structures may be fabricated for a lower cost when compared to similar metallic structures. Additional research is needed to exploit the unique characteristics of composite structures to obtain structurally efficient, cost-effective designs.
This paper describes an analytical investigation of a swept-forward high-aspect-ratio graphite-epoxy transport wing. investigation were to illustrate an effective usage of the unique properties of composite materials by exploiting material tailoring and to demonstrate an integrated multidisciplinary approach for conducting this investigation.
The objectives of this
51 0 ORIGINAL PAGE
I BLACK AND WHITE PHOTOGRAPH
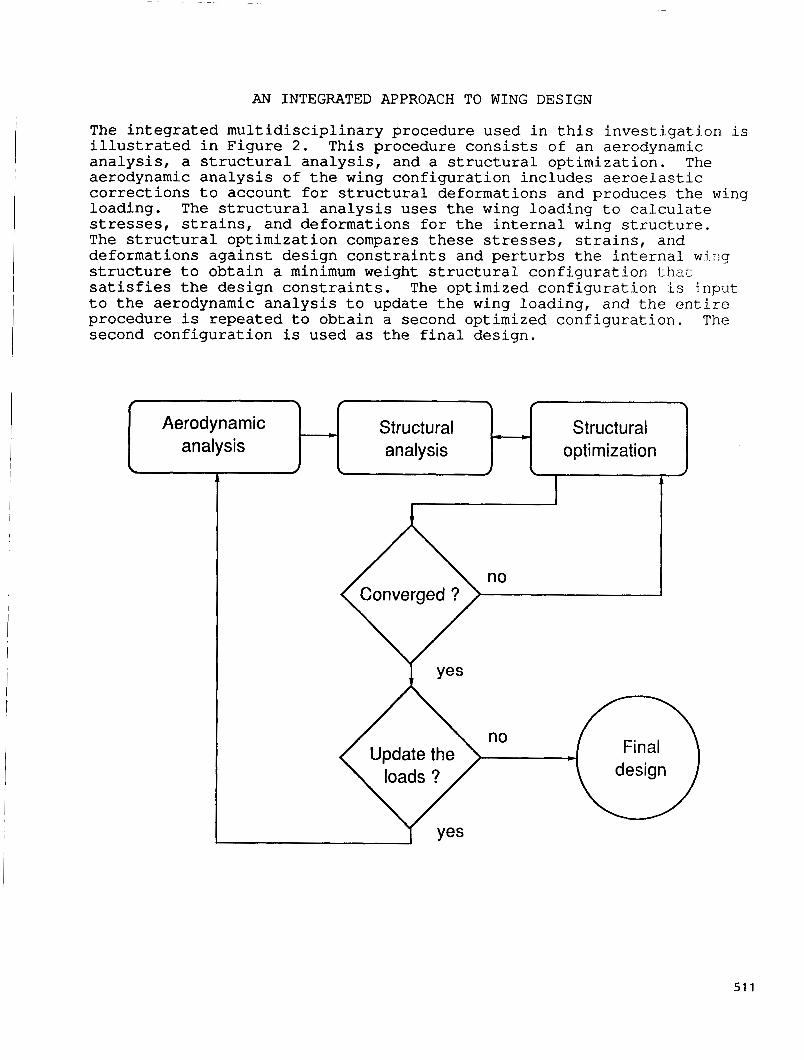
AN INTEGRATED APPROACH TO WING D E S I G N
Aerodynamic __c Structural - analysis analysis
The i n t e g r a t e d m u l t i d i s c i p l i n a r y procedure used i n t h i s i n v e s t i g a t i o n i s i l l u s t r a t e d i n F igu re 2 . T h i s procedure c o n s i s t s of an aerodynamic a n a l y s i s , a s t r u c t u r a l a n a l y s i s , and a s t r u c t u r a l op t imiza t ion . T h e aerodynamic a n a l y s i s of t h e wing c o n f i g u r a t i o n i n c l u d e s a e r o e l a s t i c c o r r e c t i o n s t o account f o r s t r u c t u r a l deformations and produces t h e wing loading . The s t r u c t u r a l a n a l y s i s u ses t h e wing load ing t o c a l c u l a t e stresses, s t r a i n s , and deformations f o r the i n t e r n a l wing s t r u c t u r e . The s t r u c t u r a l op t imiza t ion compares t h e s e stresses, s t r a i n s , arid deformations a g a i n s t des ign c o n s t r a i n t s and p e r t u r b s t he i n t e r n a l w i r i g s t r u c t u r e t o o b t a i n a minimum weight s t r u c t u r a l c o n f i g u r a t i o n that satisfies t h e des ign c o n s t r a i n t s . t o t h e aerodynamic a n a l y s i s t o update t h e wing loading , and t h e e n t i r e procedure is repeated t o o b t a i n a second opt imized c o n f i g u r a t i o n . The second c o n f i g u r a t i o n is used as the f i n a l des ign .
The opt imized c o n f i g u r a t i o n i s h p u t
Structural optimization
no
51 1
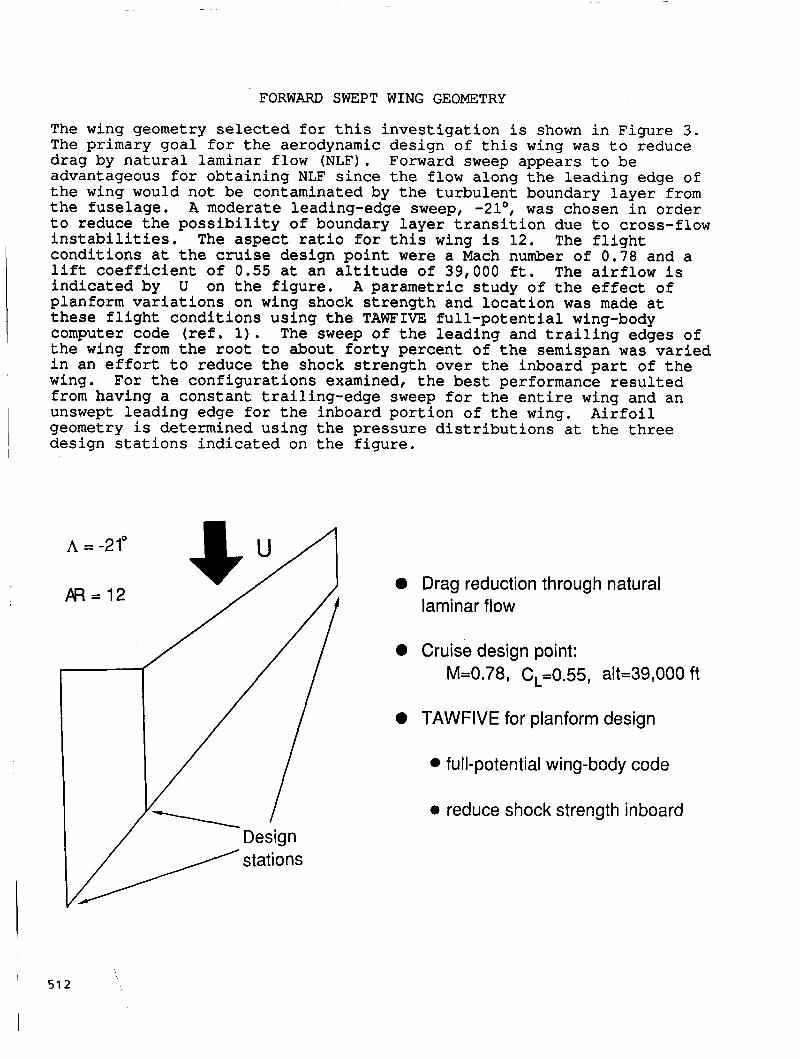
FORWARD SWEPT WING GEOMETRY
The wing geometry selected for this investigation is shown in Figure 3 . The primary goal for the aerodynamic design of this wing was to reduce drag by natural laminar flow (NLF). Forward sweep appears to be advantageous for obtaining NLF since the flow along the leading edge of the wing would not be contaminated by the turbulent boundary layer from the fuselage. A moderate leading-edge sweep, -21°, was chosen in order to reduce the possibility of boundary layer transition due to cross-flow instabilities. conditions at the cruise design point were a Mach number of 0.78 and a lift coefficient of 0.55 at an altitude of 39,000 ft. The airflow is indicated by U on the figure. A parametric study of the effect of planform variations on wing shock strength and location was made at these flight conditions using the TAWFIVE full-potential wing-body computer code (ref. 1). The sweep of the leading and trailing edges of the wing from the root to about forty percent of the semispan was varied in an effort to reduce the shock strength over the inboard part of the wing. For the configurations examined, the best performance resulted from having a constant trailing-edge sweep for the entire wing and an unswept leading edge for the inboard portion of the wing. geometry is determined using the pressure distributions at the three design stations indicated on the figure.
The aspect ratio for this wing is 12. The flight
Airfoil 1
A = -21"
P R 4 2 0 Drag reduction through natural
laminar flow
0 Cruise design point: M=0.78, C,=0.55, alt=39,000 ft
0 TAWFIVE for planform design
full-potential wing-body code
0 reduce shock strength inboard Design / stations
51 2
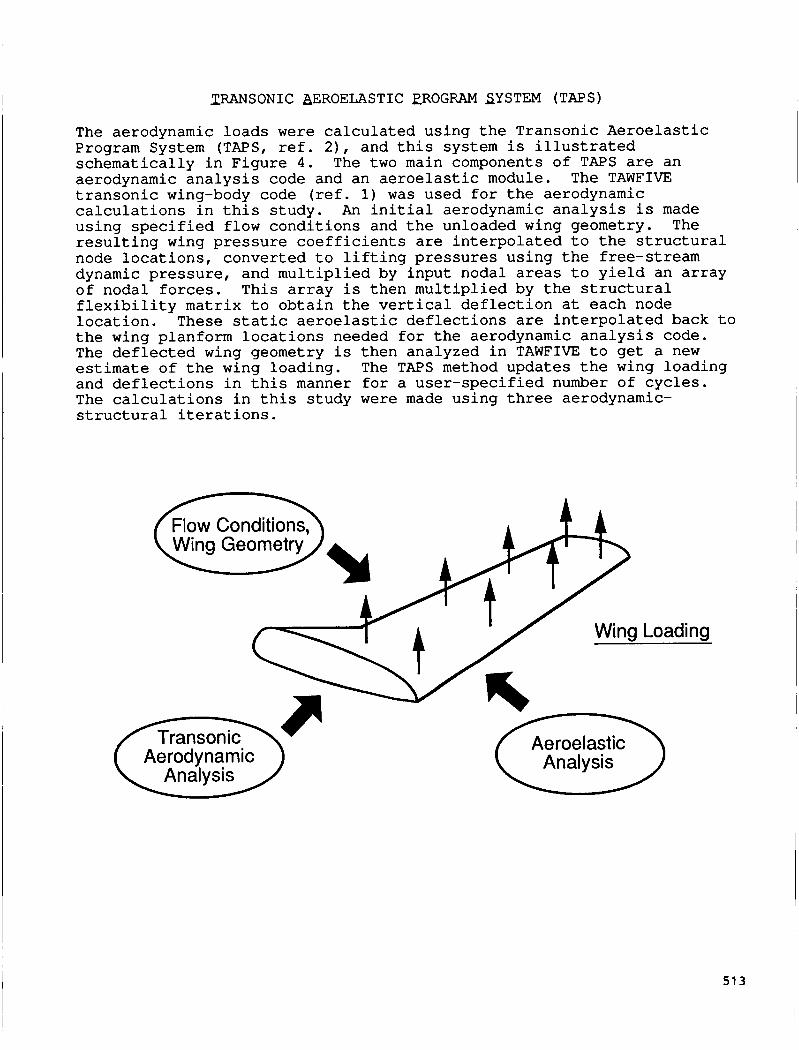
ZFVWSONIC AEROELASTIC PROGRAM SYSTEM (TAPS)
The aerodynamic l o a d s w e r e c a l c u l a t e d us ing t h e Transonic A e r o e l a s t i c Program System (TAPS, ref. 2 ) , and t h i s system is i l l u s t r a t e d schemat i ca l ly i n F igu re 4 . The two main components of TAPS are an aerodynamic a n a l y s i s code and an a e r o e l a s t i c module. The TAWFIVE t r a n s o n i c wing-body code (ref. 1) w a s used f o r t h e aerodynamic c a l c u l a t i o n s i n t h i s s tudy . An i n i t i a l aerodynamic a n a l y s i s i s made u s i n g specified f low c o n d i t i o n s and t h e unloaded wing geometry. The r e s u l t i n g wing p r e s s u r e c o e f f i c i e n t s are i n t e r p o l a t e d t o t h e s t r u c t u r a l node l o c a t i o n s , conver ted t o l i f t i n g p r e s s u r e s u s i n g t h e free-stream dynamic p r e s s u r e , and m u l t i p l i e d by i n p u t nodal areas t o y i e l d an a r r a y o f nodal f o r c e s . T h i s a r r a y is then m u l t i p l i e d by the s t r u c t u r a l f l e x i b i l i t y m a t r i x t o o b t a i n t h e ver t ical d e f l e c t i o n a t each node l o c a t i o n . These s t a t i c a e r o e l a s t i c d e f l e c t i o n s are i n t e r p o l a t e d back t o t h e wing planform l o c a t i o n s needed f o r t he aerodynamic a n a l y s i s code. The deflected wing geometry is then analyzed i n TAWFIVE t o get a new estimate of the wing loading . The TAPS method updates the wing load ing and d e f l e c t i o n s i n t h i s manner f o r a u s e r - s p e c i f i e d number o f c y c l e s . The c a l c u l a t i o n s i n t h i s s tudy w e r e made us ing three aerodynamic- s t r u c t u r a l i t e r a t i o n s .
Flow Conditions,
A a n s o [ Aerodynamic 1 \An al y s is/ . .. "'I a s u
51 3
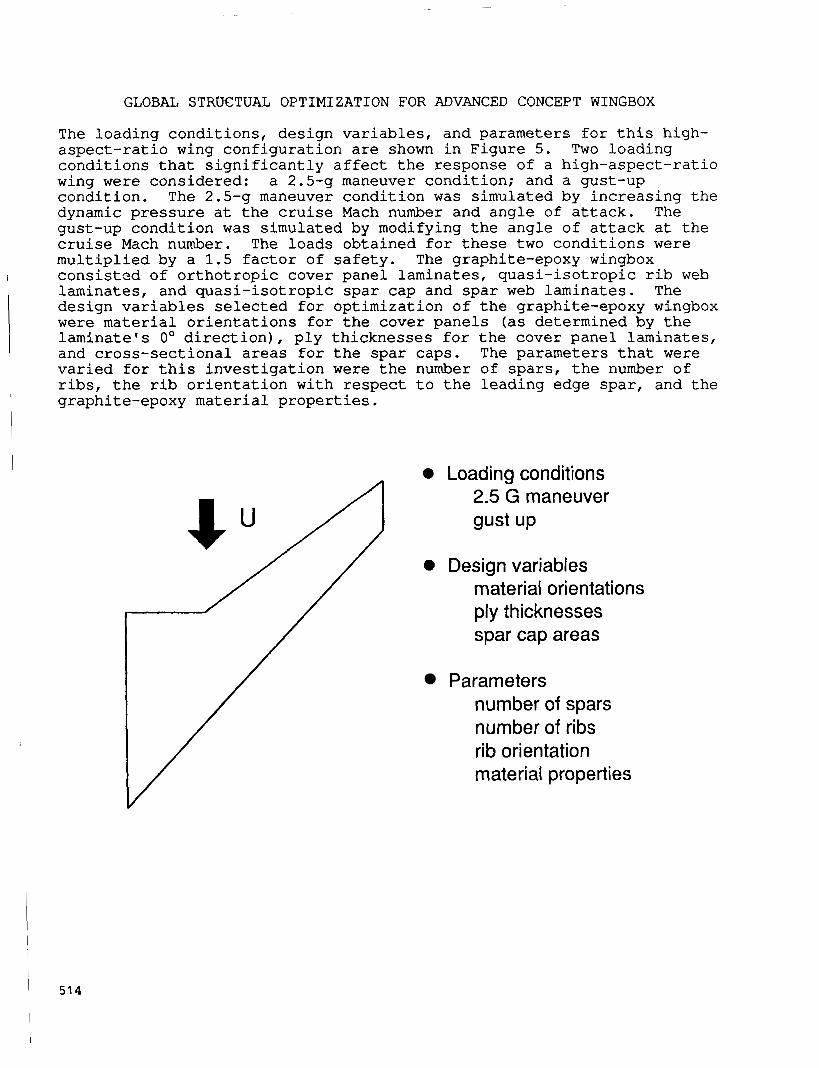
GLOBAL STRUCTUAL OPTIMIZATION FOR ADVANCED CONCEPT WINGBOX
The loading conditions, design variables, and parameters for this high- aspect-ratio wing configuration are shown in Figure 5. conditions that significantly affect the response of a high-aspect-ratio wing were considered: a 2.5-g maneuver condition; and a gust-up condition. The 2.5-g maneuver condition was simulated by increasing the dynamic pressure at the cruise Mach number and angle of attack. gust-up condition was simulated by modifying the angle of attack at the cruise Mach number. The loads obtained for these two conditions were multiplied by a 1.5 factor of safety. The graphite-epoxy wingbox consistzd of orthotropic cover panel laminates, quasi-isotropic rib web laminates, and quasi-isotropic spar cap and spar web laminates. The design variables selected for optimization of the graphite-epoxy wingbox were material orientations for the cover panels (as determined by the laminate's 0' direction), ply thicknesses for the cover panel laminates, and cross-sectional areas for the spar caps. The parameters that were varied for this investigation were the number of spars, the number of ribs, the rib orientation with respect to the leading edge spar, and the
Two loading
The
I graphite-epoxy material properties.
0 Loading conditions 2.5 G maneuver gust up
0 Design variables material orientations ply thicknesses spar cap areas
Parameters number of spars number of ribs rib orientation material properties
' 514

BENDING STIFFNESS VARIATIONS FOR AN ORTHOTROPIC LAMINATE
The tailorability of an orthotropic graphite-epoxy laminate is illustrated in Figure 6. The laminate described on the figure has 80 percent 0' plies, 10 percent k45' plies, and 10 percent 90' plies when the 0' direction is parallel to the x-axis (8=0"). The bending/torsional stiffnesses for this laminate change dramatically as the angle 180'. For example, the D11 bending stiffness value is more than an order of magnitude greater than all other values for 8=0' but is approximately the same as the D26 and D66 bending stiffness values for 8=70°. Also, the bending-torsion coupling term D16 critical for a forward-swept wing changes sign as 8 is varied. In the present study, the wing tip was constrained to have zero twist deformation by the structural optimization module to guard against unfavorable bending- torsion coupling leading to aeroelastic instabilities. results in a selection of 8 that uses anisotropy to cancel the unfavorable geometrical coupling inherent in a forward-swept wing.
8 between the x-axis and the 0' direction varies from 0' to
This constraint
t X 40 X IO3
Bending 20 stiffness, in.-lb
0
For 8 = 0" : 80% 0" plies I 0% ~ 5 " plies 10% 90" plies
-20 1 I 1 I I
0 45 90 135 180
Theta, 8, deg
51 5
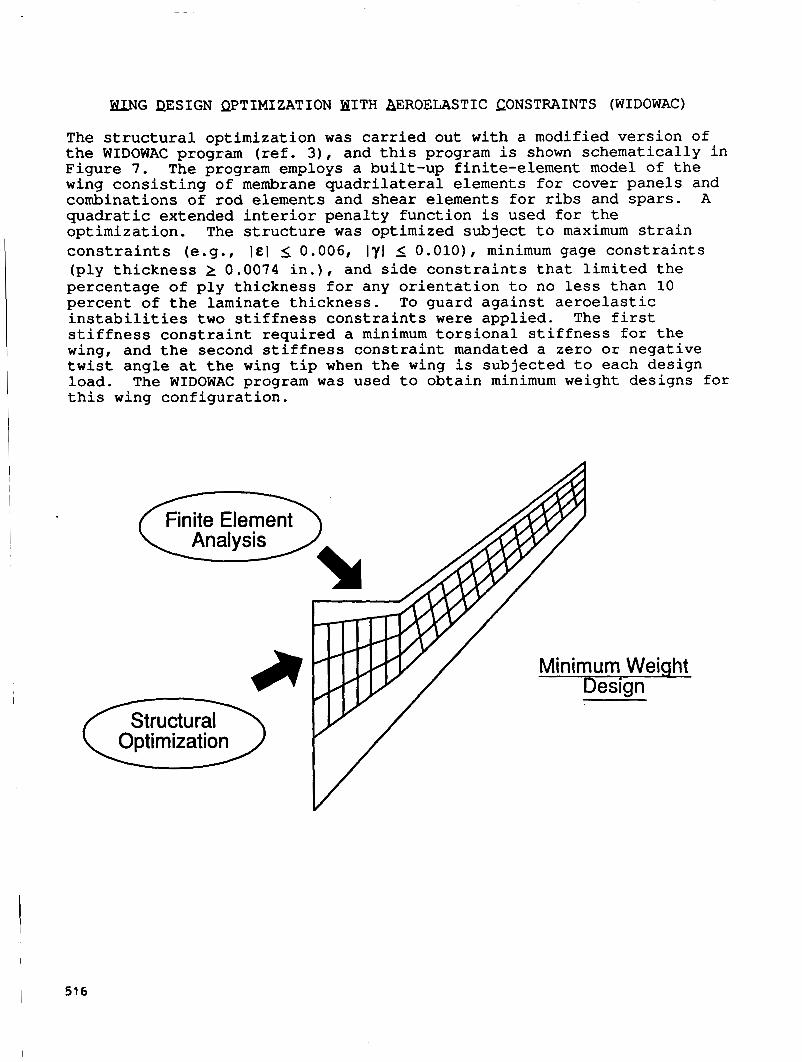
U G PESIGN QPTIMIZATION HITH BEROELASTIC CONSTRAINTS (WIDOWAC)
The structural optimization was carried out with a modified version of the WIDOWAC program (ref. 3 ) , and this program is shown schematically in Figure 7 . wing consisting of membrane quadrilateral elements for cover panels and combinations of rod elements and shear elements for ribs and spars. quadratic extended interior penalty function is used for the optimization. constraints (e.g., I & / I0.006, IyI I O . O l O ) , minimum gage constraints (ply thickness 2 0.0074 in.), and side constraints that limited the percentage of ply thickness for any orientation to no less than 10 percent of the laminate thickness. To guard against aeroelastic instabilities two stiffness constraints were applied. The first stiffness constraint required a minimum torsional stiffness for the wing, and the second stiffness constraint mandated a zero or negative twist angle at the wing tip when the wing is subjected to each design load. this wing configuration.
The program employs a built-up finite-element model of the
A
The structure was optimized subject to maximum strain
The WIDOWAC program was used to obtain minimum weight designs for
\ Analysis
Structural Optimization
V /
Minimum Weight - Design
I 51 6

2-SPAR MODEL
Three wingbox models were used t o inves t iga te the e f f e c t s of wingbox configuration on t h e configuration weight. a s the 2-spar model, t h e 4-spar model, and t h e multi-spar/multi-rib model. These models were used t o obtain results f o r configurations fabr ica ted using either a state-of-the-art damage-tolerant graphite- epoxy mater ia l o r an improved graphite-epoxy mater ia l . The state-of the-ar t graphite-epoxy mater ia l i s referred t o a s t he standard mater ia l . The improved mater ia l i s not current ly avai lable but i s assumed t o have s t i f f n e s s and s t rength propert ies t h a t a r e 20% grea te r than t h e respect ive proper t ies f o r the standard mater ia l . The 2-spar model i s i l l u s t r a t e d i n Figure 8 . T h i s model i s used t o represent a wingbox conf igura t ion having leading and t r a i l i n g edge spars and having r i b s spaced 30 i n . apa r t . The configuration has a t o t a l of twenty r i b s . T h i s configuration i s typ ica l of current wingbox configurations fo r t ranspor t a i r c r a f t .
These models a r e re fer red t o
Leading edge spar
Trailing edge spar
51 7
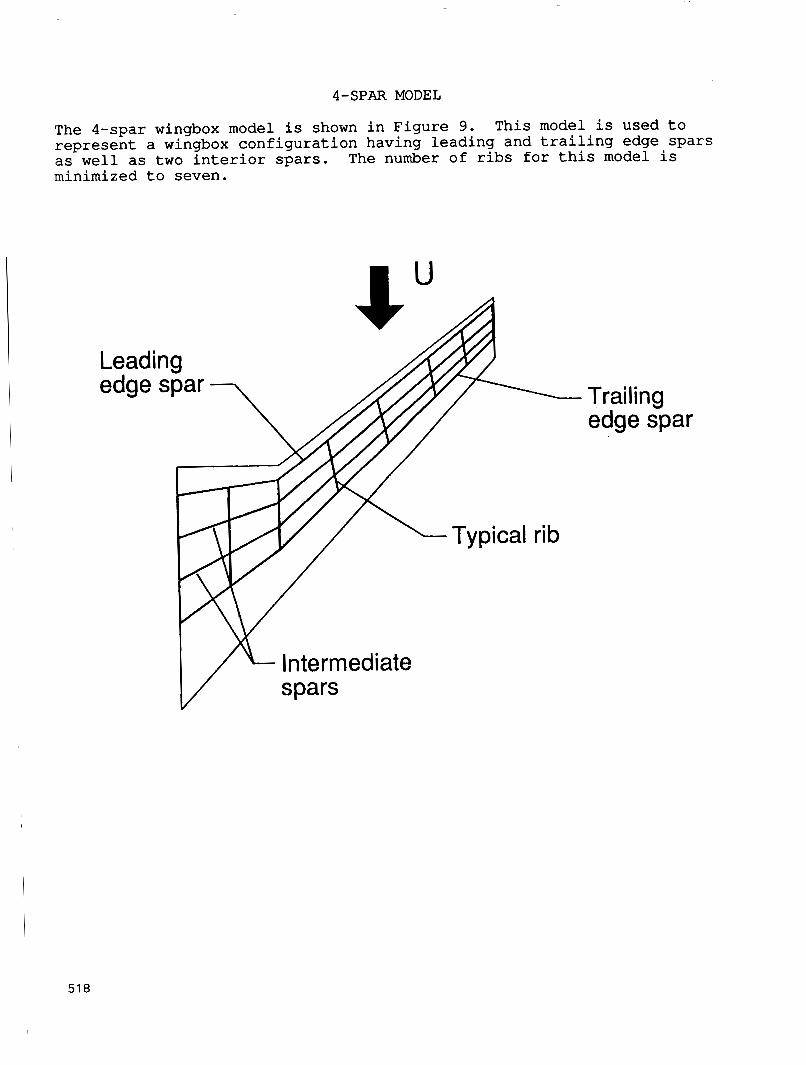
4-SPAR MODEL
The 4-spar wingbox model is shown in Figure 9. represent a wingbox configuration having leading and trailing edge spars as well as two interior spars. minimized to seven.
This model is used to
The number of ribs for this model is
Trailing edge spar
V spars
51 8
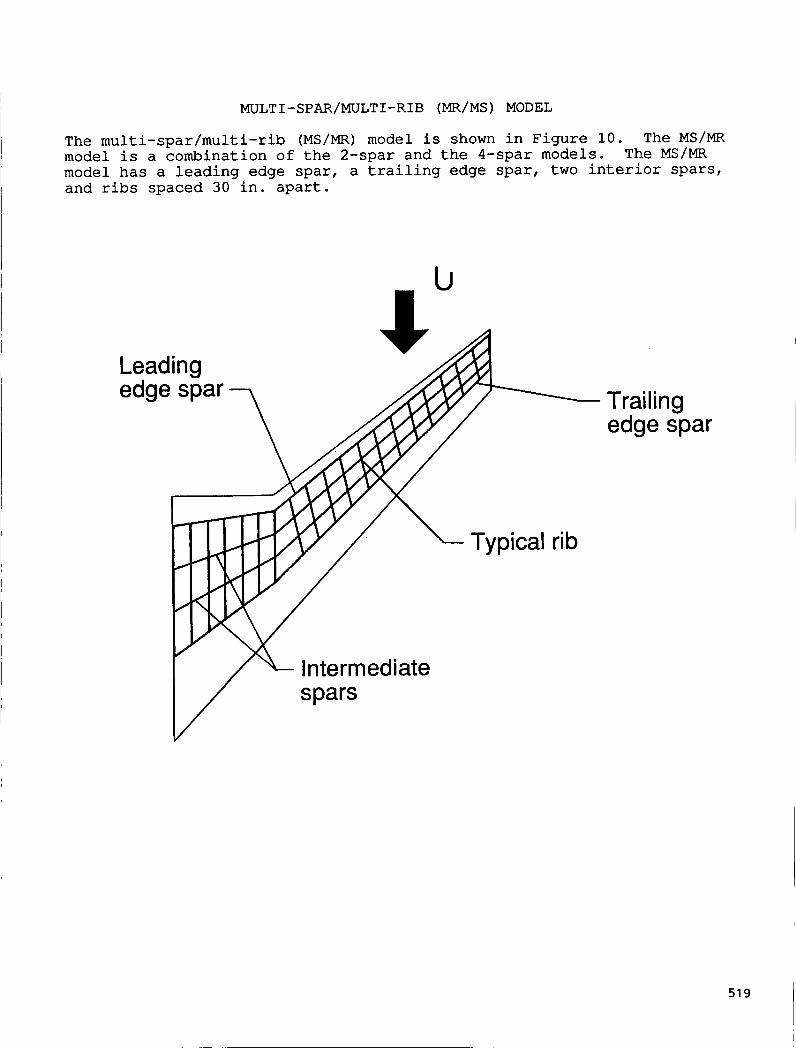
I I
I MULTI-SPAR/MULTI-RIB (MEX/MS) MODEL
The multi-spar/multi-rib (MS/MR) model is shown in Figure 10. The MS/MR model is a combination of the 2-spar and the 4-spar models. model has a leading edge spar, a trailing edge spar, two interior spars, and ribs spaced 30 in. apart.
The MS/MR
L e
I n term ed i ate v
Trailing edge spar
I n term ed i ate spars spars
Trailing edge spar
!pica1 rib
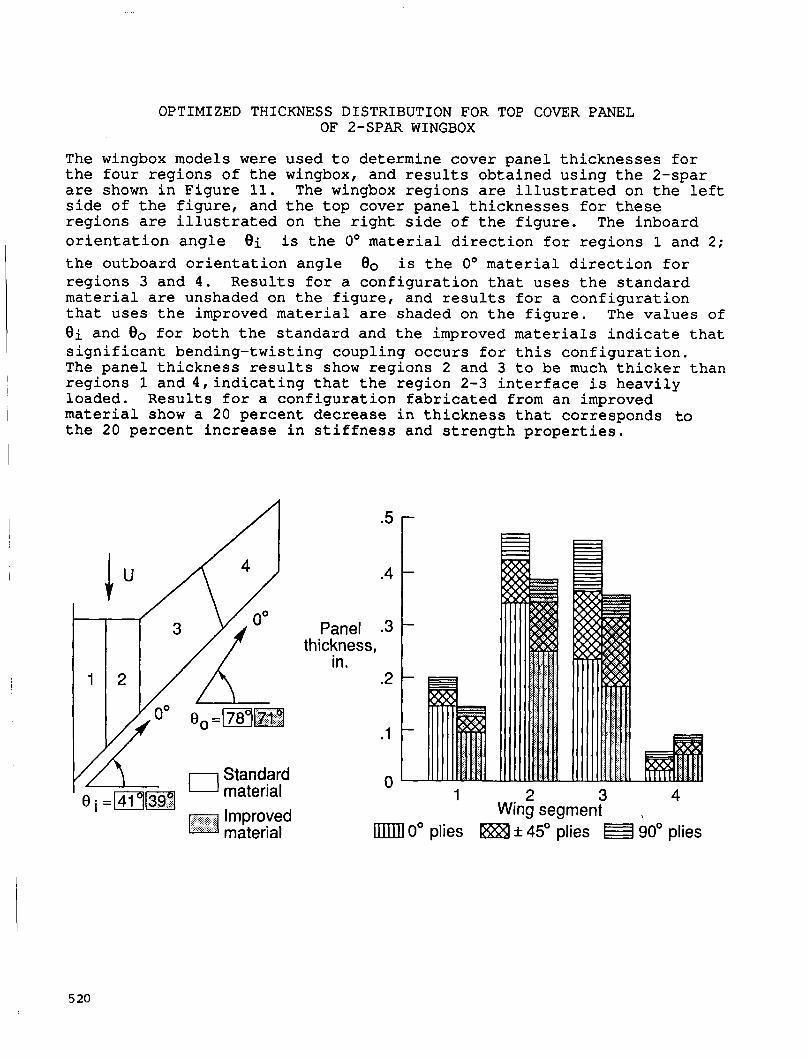
OPTIMIZED THICKNESS DISTRIBUTION FOR TOP COVER PANEL OF 2-SPAR WINGBOX
The wingbox models were used t o determine cover pane l t h i c k n e s s e s f o r t h e f o u r r e g i o n s of t h e wingbox, and r e s u l t s ob ta ined u s i n g t h e 2-spar are shown i n F igu re 11. The wingbox r eg ions are i l l u s t r a t e d on the l e f t side of t he figure, and t h e t o p cover pane l t h i c k n e s s e s f o r these reg ions are i l l u s t r a t e d on t h e r i g h t side of t h e f i g u r e . The inboard o r i e n t a t i o n a n g l e 8 i i s t h e 0' material d i r e c t i o n f o r r eg ions 1 and 2; t h e outboard o r i e n t a t i o n ang le 80 i s t h e 0' material d i r e c t i o n f o r r eg ions 3 and 4 . R e s u l t s f o r a c o n f i g u r a t i o n t h a t uses t h e s t a n d a r d material are unshaded on t h e f i g u r e , and r e s u l t s f o r a c o n f i g u r a t i o n t h a t u ses t h e improved material are shaded on t h e f i g u r e . The va lues of 8 i and 80 f o r b o t h t h e s t anda rd and t h e improved materials i n d i c a t e t h a t s i g n i f i c a n t bending- twis t ing coupl ing occurs f o r t h i s c o n f i g u r a t i o n . The pane l t h i c k n e s s r e s u l t s show reg ions 2 and 3 t o be much th i cke r t h a n r eg ions 1 and 4 , i n d i c a t i n g t h a t t h e reg ion 2-3 i n t e r f a c e i s h e a v i l y loaded . R e s u l t s f o r a c o n f i g u r a t i o n fabricated from an improved material show a 20 p e r c e n t decrease i n t h i c k n e s s t h a t corresponds t o t h e 20 p e r c e n t i n c r e a s e i n s t i f f n e s s and s t r e n g t h p r o p e r t i e s .
/1 n Standard - material I
Improved material
Panel .3 thickness,
in. .2
.I
1 0
r ) 3 4 L
Wing segment ,
mm10" plies f 45' plies B 90' plies
5 20
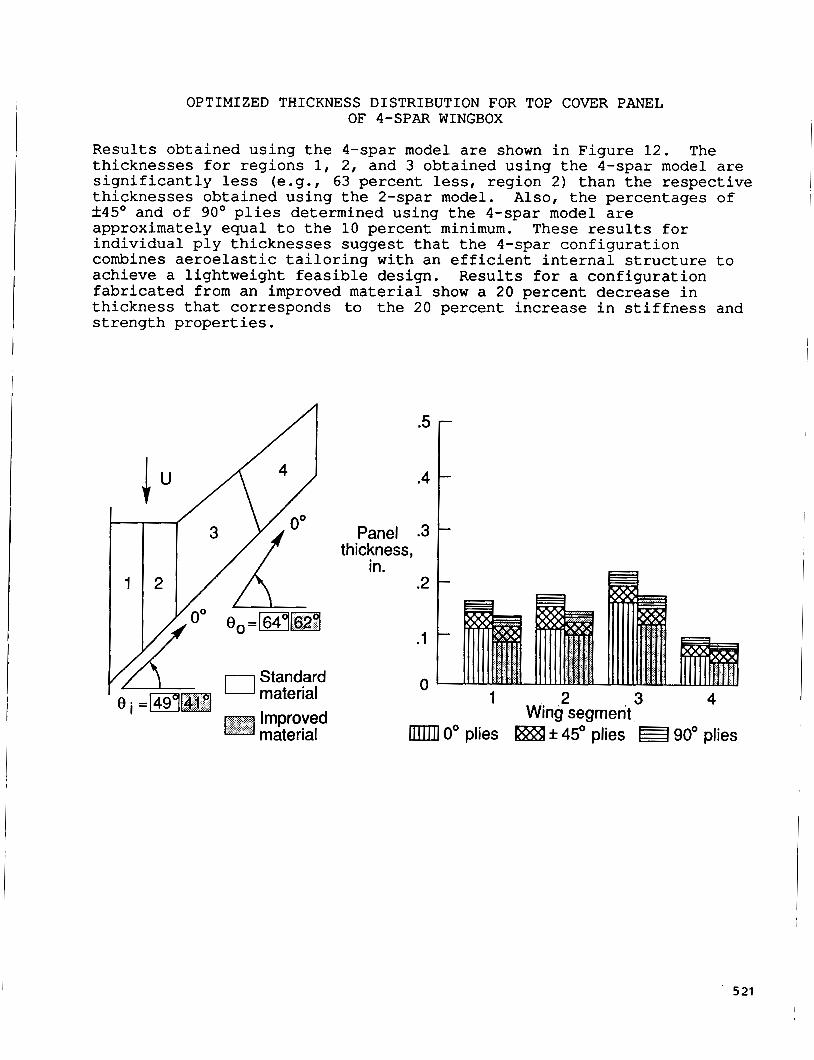
OPTIMIZED THICKNESS DISTRIBUTION FOR TOP COVER PANEL OF 4-SPAR WINGBOX
Results obtained using the 4-spar model are shown in Figure 12. thicknesses for regions 1, 2, and 3 obtained using the 4-spar model are significantly less (e.g., 63 percent less, region 2) than the respective thicknesses obtained using the 2-spar model. f45' and of 90' plies determined using the 4-spar model are approximately equal to the 10 percent minimum. individual ply thicknesses suggest that the 4-spar configuration combines aeroelastic tailoring with an efficient internal structure to achieve a lightweight feasible design. fabricated from an improved material show a 20 percent decrease in thickness that corresponds to the 20 percent increase in stiffness and
The
Also, the percentages of
These results for
Results for a configuration
strength properties.
.5
.4
Panel -3 thickness,
in. .2
.1
0 1 2 3 4 Wing segment
521
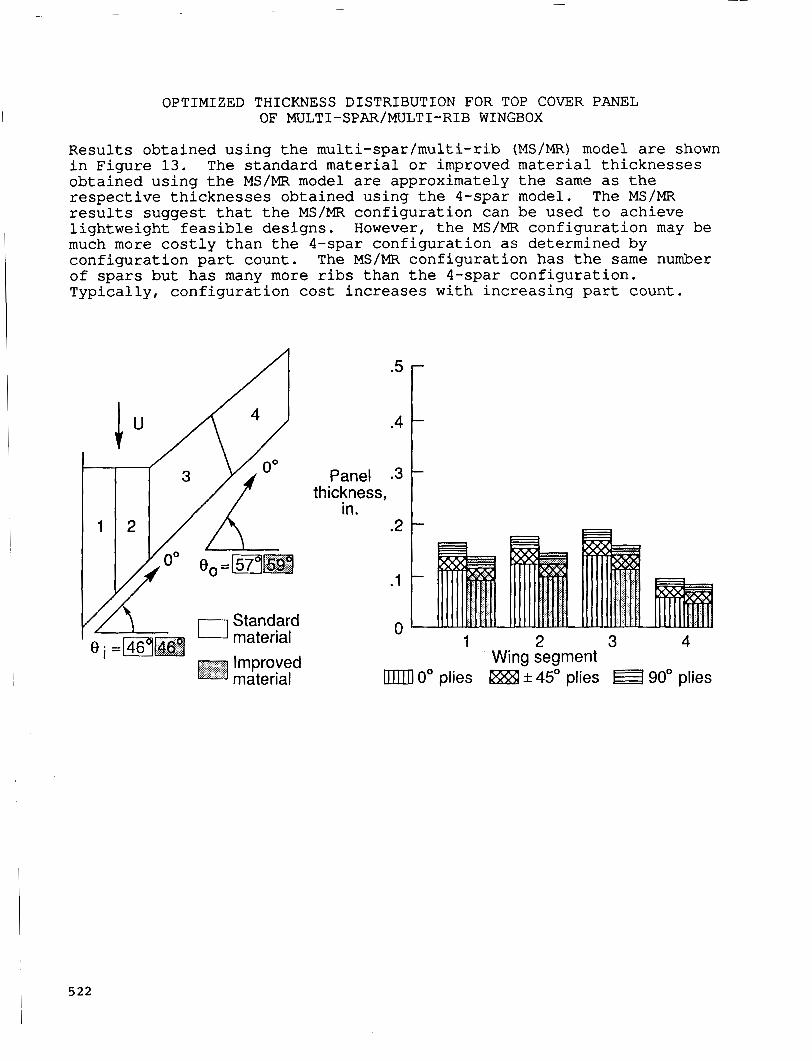
OPTIMIZED THICKNESS DISTRIBUTION FOR TOP COVER PANEL OF MULTI-SPAR/MULTI-RIB WINGBOX
Results obtained using the multi-spar/multi-rib (MS/MR) model are shown in Figure 13. obtained using the MS/MR model are approximately the same as the respective thicknesses obtained using the 4-spar model. results suggest that the MS/MR configuration can be used to achieve lightweight feasible designs. much more costly than the 4-spar configuration as determined by configuration part count. of spars but has many more ribs than the 4-spar configuration. Typically, configuration cost increases with increasing part count.
The standard material or improved material thicknesses
The MS/MR
However, the MS/MR configuration may be
The MS/MR configuration has the same number
1
iu -
2
1 n Standard
0 Improved material
.5
.4
Panel -3
.2
thickness, in.
.1
0 1 2 3 4
Wing segment mm] 0" plies * 45" plies W 90" plies
522
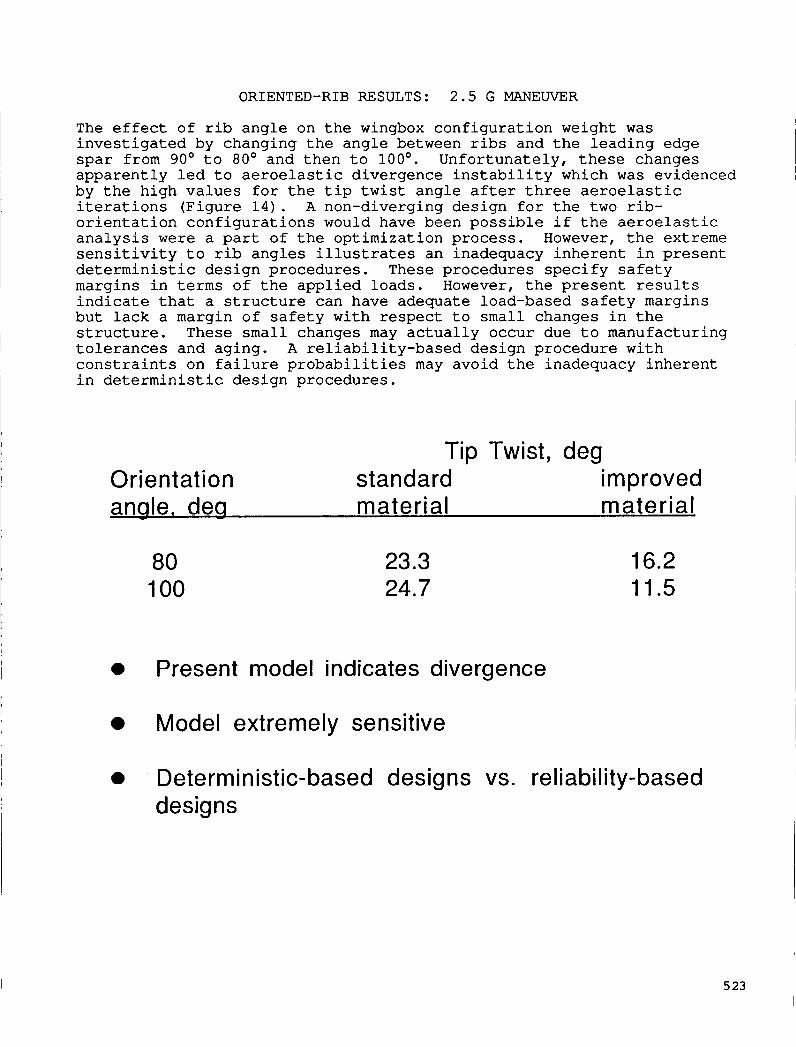
ORIENTED-RIB RESULTS: 2 .5 G MANEUVER
The effect of r i b ang le on t h e wingbox c o n f i g u r a t i o n weight w a s investigated by changing t h e ang le between r ibs and t h e l e a d i n g edge s p a r from 90' t o 80' and t h e n t o 100'. Unfo r tuna te ly , these changes a p p a r e n t l y led t o a e r o e l a s t i c d ivergence i n s t a b i l i t y which w a s evidenced by the h igh v a l u e s f o r t h e t i p t w i s t ang le a f te r three a e r o e l a s t i c i t e r a t i o n s (F igu re 1 4 ) . A non-diverging des ign f o r t h e two r ib- o r i e n t a t i o n c o n f i g u r a t i o n s would have been p o s s i b l e i f t h e a e r o e l a s t i c a n a l y s i s w e r e a par t of t h e op t imiza t ion p rocess . However, t h e extreme s e n s i t i v i t y t o r i b ang le s i l l u s t r a t e s an inadequacy i n h e r e n t i n p r e s e n t d e t e r m i n i s t i c des ign procedures . These procedures s p e c i f y s a f e t y margins i n terms of t h e a p p l i e d loads . However, t h e p r e s e n t r e s u l t s i n d i c a t e t h a t a s t r u c t u r e can have adequate load-based s a f e t y margins b u t lack a margin o f s a f e t y w i t h r e s p e c t t o small changes i n t h e s t r u c t u r e . These s m a l l changes may a c t u a l l y occur due t o manufactur ing t o l e r a n c e s and ag ing . A r e l i a b i l i t y - b a s e d des ign procedure w i t h c o n s t r a i n t s on f a i l u r e p r o b a b i l i t i e s may avoid t he inadequacy i n h e r e n t i n d e t e r m i n i s t i c des ign procedures .
Tip Twist, deg Orientation standard improved anale, deg material material
80 100
23.3 24.7
16.2 11.5
0 Present model indicates divergence
Model extremely sensitive
0 Deterministic-based designs vs. reliability-based designs
5 23 I
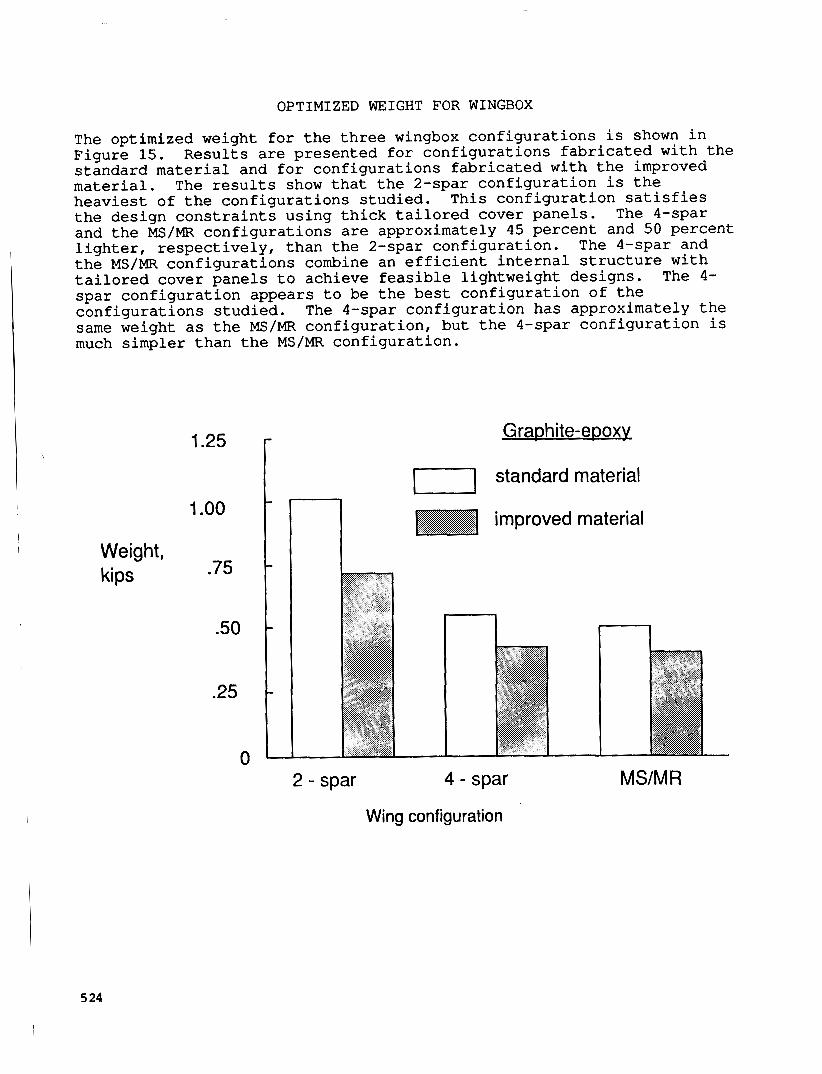
OPTIMIZED WEIGHT FOR WINGBOX
The opt imized weight f o r t h e three wingbox c o n f i g u r a t i o n s is shown i n F igu re 15. s t a n d a r d material and f o r c o n f i g u r a t i o n s fabricated wi th t he improved material. heaviest of t h e c o n f i g u r a t i o n s s t u d i e d . T h i s c o n f i g u r a t i o n satisfies t h e des ign c o n s t r a i n t s u s i n g t h i c k t a i l o r e d cover p a n e l s . The 4-spar and the MS/MR c o n f i g u r a t i o n s are approximately 45 p e r c e n t and 50 pe rcen t l ighter , r e s p e c t i v e l y , t h a n t h e 2-spar conf igu ra t ion . The 4-spar and t h e MS/MR c o n f i g u r a t i o n s combine an e f f i c i e n t i n t e r n a l s t r u c t u r e w i t h t a i l o r e d cover p a n e l s t o achieve feasible l i gh twe igh t des igns . s p a r c o n f i g u r a t i o n appears t o be the best c o n f i g u r a t i o n o f t h e c o n f i g u r a t i o n s s t u d i e d . The 4-spar c o n f i g u r a t i o n has approximately the same weight as t h e MS/MR conf igu ra t ion , b u t t he 4-spar c o n f i g u r a t i o n is much simpler t h a n t h e MS/MR c o n f i g u r a t i o n .
R e s u l t s are p r e s e n t e d f o r c o n f i g u r a t i o n s fabricated w i t h t h e
The r e s u l t s show t h a t t h e 2-spar c o n f i g u r a t i o n is t h e
The 4-
1.25
1 .oo
Weight, kips .75
.50
.25
0
1 Graph ite-eDoxv
-1 standard material
imp roved mat e rial
1
2 - spar 4 - spar
Wing configuration
1
MS/MR
5 24
CONCLUDING REMARKS
An analytical investigation of a swept-forwatd high-aspect-ratio graphite-epoxy transport wing has been described. An integrated multidisciplinary procedure was discussed that included an aerodynamic analysis, a structural analysis, and a structural optimization. ' This procedure was used to study 2-spar, 4-sparr and multi-spar/multi-rib (MS/MR) wingbox configurations. Results were obtained for configuration fabricated from either a state-of-the-art damage-tolerant graphite-epoxy material or an improved graphite-epoxy material. had stiffnesses and strengths that were 20 percent greater than the corresponding properties for the state-of-the-art material.
The integrated procedure demonstrated the tailorability of composite structures for advanced concept wingbox configurations. Improved materials, tailorability, and efficient internal structure led to lightweight feasible designs. to rib orientation. spar may lead to an aeroelastic divergence instability. The 4-spar and MS/MR configurations had approximately the same weight and were significantly lighter than the 2-spar configuration. configuration was the best of the configurations considered because the 4-spar configuration is both lightweight and simple.
The improved material
The designs appeared to be very sensitive Ribs oriented at 80' or at 100' to the leading edge
The 4-spar
REFERENCES
1. Melson, N. D.; and Streett, C. L.: TAWFIVE: A User's Guide. NASA TM-84619, September 1983.
Calculated Effects of Varying Reynolds Number and Dynamic Pressure on Flexible Wings at Transonic Speeds. Experiences in Multidisciplinary Analysis and Optimization, NASA CP 2327, 1984, pp. 309-327.
3 . Haftka, Rafael T; and Starnes, James H., Jr.: WIDOWAC(Wing Design Optimization with Aeroelastic Constraints): Program Manual. NASA TM X-3071, October 1974.
2. Campbell, R. L.: Recent
5 25 ,
Report Documentation Page 1. Report No. 2. Government Accession No.
NASA CP-3031, P a t 1
4. Title and Subtitle
Recent Advances i n Mul t id i sc ip l ina ry Analysis and Optimization
7. Author(s1
Jean-Franqois M. Barthelemy, Edi tor
3. Recipient's Catalog No.
5. Report Date
Apri l 1989
6. Performing Organization Code
8. Performing Organization Report No.
L-16568 10. Work Unit No.
5 06 -4 3 -4 1-01
Conference Publ ica t ion 12. Sponsoring Agency Name and Address National Aeronautics and Space Administration
9. Performing Organization Name and Address
NASA Langley Research Center Hampton, Vi rg in ia 23665-5225
- 11. Contract or Grant No.
- 13. Tvoe of Reoort and Period Covered
16. Abstract
Washington, DC 20546-0001
Wright Research Development Center Wriqht Pa t te rson AFB, OH 45433
and
This th ree-par t document con ta ins a c o l l e c t i o n of t e c h n i c a l papers presented a t thc Second NASA/Air Force Symposium on Recent Advances i n Mul t id i sc ip l ina ry Analysis and Optimization, held September 28-30, 1988 i n Hampton, Virginia . The t o p i c s covered include: Hel icopter Design, Aeroe la s t i c Ta i lo r ing , Control of Aeroe las t ic S t r u c t u r e s , Dynamics and Control of F l e x i b l e S t ruc tu res , S t r u c t u r a l Design, Design of Large Engineering Systems, Applicat ion of A r t i f i c i a l Intell igenCc Shape Optimization, Software Development and Implementation, and S e n s i t i v i t y Analysis.
14. Sponsoring Agency Code
s pagel 21. No. of pages
542
18. Distribution Statement
Unclas s i f i ed - Unlimited
Subject Category 05
22. Price
A23 19. Security Classif. (of this report)
Unclass i f ied
NASA FORM 1626 OCT 86 For sale by the National Technical Information Service, Springfield, Virginia 22161-2171 NASA-L*ng'*y* lodo
20. Security Classif. (of t
Unclass i f ied