Paris CH4 AQABA draft 14062021 preprint clean - ACP - Recent
29
1 Shipborne measurements of methane and carbon dioxide in the Middle East and Mediterranean areas and contribution from oil and gas emissions Jean-Daniel Paris 1,3 , Aurélie Riandet 1,* , Efstratios Bourtsoukidis 2,3 , Marc Delmotte 1 , Antoine Berchet 1 , Jonathan Williams 2,3 , Lisa Ernle 2 , Ivan Tadic 2 , Hartwig Harder 2 , Jos Lelieveld 2,3 5 1 Laboratoire des Sciences du Climat et de l’Environnement, CEA-CNRS-UVSQ, UMR8212, IPSL, Gif-sur-Yvette, France 2 Department of Atmospheric Chemistry, Max Planck Institute for Chemistry, Mainz 55128, Germany 3 Climate and Atmosphere Research Centre (CARE-C), The Cyprus Institute, Nicosia, 2121, Cyprus *Now at Aix Marseille Université, CNRS, Avignon Université, IRD, IMBE, Aix-en-Provence, France Correspondence to: Jean-Daniel Paris ([email protected]) 10 Abstract. The increase of atmospheric methane (CH4) and carbon dioxide (CO2), two main anthropogenic greenhouse gases, is largely driven by fossil sources. Sources and sinks remain insufficiently characterised in the Mediterranean and Middle East areas, where very few in situ measurements area available. We measured the atmospheric mixing ratios of CH4 and CO2 by ship in the region in July and August 2017. High mixing ratios were observed over the Suez Canal, Red Sea and Arabian Gulf, while generally lower mixing ratios were observed over the Gulfs of Aden and Oman. We probe the origin of CO2 and CH4 15 excess mixing ratio by using correlations with light alkanes and through the use of a Lagrangian model coupled to two different emission inventories of anthropogenic sources. We find that the CO2 and especially the CH4 enhancements are mainly linked to nearby oil and gas (O&G) activities over the Arabian Gulf, and a mixture of other sources over the Red Sea. The isomeric ratio of pentane is shown to be a useful indicator of the O&G component of atmospheric CH4 at the regional level. Upstream emissions linked to oil in the Northern Arabian Gulf seem to be underestimated while gas-related emissions in the Southern 20 Gulf are overestimated in our simulations. Our results highlight the need for improvement of inventories in the area to better characterize the changes in magnitude and the complex distribution of the O&G sources in the Middle East. 1. Introduction Methane (CH4) and carbon dioxide (CO2) are potent anthropogenic greenhouse gases (GHG). The CH4 atmospheric mole fraction has increased by 150% since the pre-industrial era (Saunois et al., 2020). Over a 100-year horizon, CH4 has a global 25 warming potential 28 times larger than CO2. Roughly half of CH4 sources are of natural origin (mainly from wetlands, with contributions from fires and geologic sources). The remainder is anthropogenic, mainly linked to fossil fuels, agriculture (including enteric fermentation in ruminants, manure management and rice paddies) and waste management. The increasing anthropogenic emissions are driven equally by fossil fuel sources and agricultural sources (Jackson et al., 2020).
-
Upload
khangminh22 -
Category
Documents
-
view
0 -
download
0
Transcript of Paris CH4 AQABA draft 14062021 preprint clean - ACP - Recent
1
Shipborne measurements of methane and carbon dioxide in the Middle East and Mediterranean areas and contribution from oil and gas emissions Jean-Daniel Paris1,3, Aurélie Riandet1,*, Efstratios Bourtsoukidis2,3, Marc Delmotte1, Antoine Berchet1, Jonathan Williams2,3, Lisa Ernle2, Ivan Tadic2, Hartwig Harder2, Jos Lelieveld2,3 5 1Laboratoire des Sciences du Climat et de l’Environnement, CEA-CNRS-UVSQ, UMR8212, IPSL, Gif-sur-Yvette, France 2Department of Atmospheric Chemistry, Max Planck Institute for Chemistry, Mainz 55128, Germany 3Climate and Atmosphere Research Centre (CARE-C), The Cyprus Institute, Nicosia, 2121, Cyprus
*Now at Aix Marseille Université, CNRS, Avignon Université, IRD, IMBE, Aix-en-Provence, France
Correspondence to: Jean-Daniel Paris ([email protected]) 10
Abstract. The increase of atmospheric methane (CH4) and carbon dioxide (CO2), two main anthropogenic greenhouse gases,
is largely driven by fossil sources. Sources and sinks remain insufficiently characterised in the Mediterranean and Middle East
areas, where very few in situ measurements area available. We measured the atmospheric mixing ratios of CH4 and CO2 by
ship in the region in July and August 2017. High mixing ratios were observed over the Suez Canal, Red Sea and Arabian Gulf,
while generally lower mixing ratios were observed over the Gulfs of Aden and Oman. We probe the origin of CO2 and CH4 15
excess mixing ratio by using correlations with light alkanes and through the use of a Lagrangian model coupled to two different
emission inventories of anthropogenic sources. We find that the CO2 and especially the CH4 enhancements are mainly linked
to nearby oil and gas (O&G) activities over the Arabian Gulf, and a mixture of other sources over the Red Sea. The isomeric
ratio of pentane is shown to be a useful indicator of the O&G component of atmospheric CH4 at the regional level. Upstream
emissions linked to oil in the Northern Arabian Gulf seem to be underestimated while gas-related emissions in the Southern 20
Gulf are overestimated in our simulations. Our results highlight the need for improvement of inventories in the area to better
characterize the changes in magnitude and the complex distribution of the O&G sources in the Middle East.
1. Introduction
Methane (CH4) and carbon dioxide (CO2) are potent anthropogenic greenhouse gases (GHG). The CH4 atmospheric mole
fraction has increased by 150% since the pre-industrial era (Saunois et al., 2020). Over a 100-year horizon, CH4 has a global 25
warming potential 28 times larger than CO2. Roughly half of CH4 sources are of natural origin (mainly from wetlands, with
contributions from fires and geologic sources). The remainder is anthropogenic, mainly linked to fossil fuels, agriculture
(including enteric fermentation in ruminants, manure management and rice paddies) and waste management. The increasing
anthropogenic emissions are driven equally by fossil fuel sources and agricultural sources (Jackson et al., 2020).
2
CO2 concentration in the atmosphere has increased by 47% since the preindustrial era and reached 407.38±0.10 ppm in 2018 30
(Dlugokencky and Tans, 2019; Le Quéré et al., 2018; Friedlingstein et al., 2019). Its increase is caused primarily by the use of
fossil fuel, cement production and land use change, and is partly mitigated by uptake in terrestrial ecosystems and the ocean.
Over the last decade (2009-2018) CO2 sources have been dominated by fossil fuels (9.5±0.5 GtC yr−1) with a significant source
from land use change (1.5±0.7 GtC yr−1). CO2 is removed from the atmosphere by sinks in the ocean (2.5±0.6 GtC yr−1) and
land ecosystems (3.2±0.6 GtC yr−1; Friedlingstein et al., 2020). Atmospheric CO2 is expected to continue its growth despite 35
widespread adoption of climate policies as oil and gas consumption trends suggest a continued increase in fossil CO2 emission
(Jackson et al., 2019).
The 2015 Paris agreement has set the objective to limit global temperatures below 1.5°C. To reach this objective, a corridor of
compliant emission pathways has been designed, that require not only strong reductions in CO2 emissions but also in
anthropogenic CH4 emissions (Jones et al., 2018; Nisbet et al., 2020). Regarding CH4, a wide array of measures is necessary 40
(Nisbet et al., 2020), with potentially high mitigation impact in the energy, agricultural and waste management sectors (Rogelj
et al., 2018). Rapid and efficient mitigation options are readily available for methane emissions. 80% of economically feasible
abatement reside in the oil and gas (O&G) sector (Ocko et al., 2021). IEA (2020) reviewed a number of efficient, cost-effective
abatement options for O&G sector and found that 40% of O&G methane emissions could be avoided at a zero net cost.
Fossil fuel production and use is responsible for the release of 112 Mt CH4 yr-1 to the atmosphere, representing 33% of the 45
total anthropogenic emission of CH4 (Saunois et al., 2020). Considering fossil fuel emissions alone, 68% of the emissions is
linked to O&G while the rest is associated to coal mining. Emission of CH4 arises at each step from the production site to the
consumption site. For the oil industry, methane emissions occur essentially as indirect emissions, as venting or incomplete
combustion during flaring and during transport and refining (IEA, 2020). For the gas industry, emission of CH4 occurs at all
stage of the life cycle as fugitive emission (leaks from valves, connectors and compressors, intentional venting) but also as 50
incomplete combustion during flaring (GIE-MARCOGAZ, 2019). Alvarez et al. (2018) found that in the United States a large
fraction of the net emission is associated with the production, transport and processing.
Large uncertainties remain associated to the magnitude and spatial and temporal distribution of CH4 sources (Saunois et al.,
2020). After a pause between 2000 and 2007, CH4 in the atmosphere has resumed its increase. Constraints from current
available observations on the respective contribution to its sources and sinks do not allow a definitive explanation of this 55
pattern (Saunois et al., 2017; Saunois et al., 2020; Turner et al., 2019, Nisbet et al., 2020). Schwietzke et al. (2016) highlighted
the strong underestimation of O&G emissions in current inventories (see also Saunois et al., 2020 and references therein).
Based on ice core 13CH4 measurements, Hmiel et al. (2020) found that fossil fuel methane sources could be underestimated by
as much as 25-40%. The largest uncertainty remains associated to CH4 emissions during the extraction of O&G, with global
estimates ranging from 46 to 98 Mt CH4 yr-1 (Höglund-Isaksson et al., 2015). This uncertainty is critically related to the 60
diversity of country-specific and site-specific emission factors used. In the US, emissions associated to O&G production where
underestimated by a factor 2 (Alvarez et al., 2018), mainly linked to underestimation in upstream (production) emissions.
Furthermore, the spatial and temporal distribution of sources is poorly known. In the Barnett Shale area (USA), Zavala-Araiza
3
et al. (2015) found that 10% of the O&G facilities accounted for 90% of the emissions. Assessment of regional emissions
distribution can be provided by mobile measurements targeting facilities. 65
CO2 emissions linked to O&G production and use represent 53% of total CO2 emissions over the period 2008-2017 (Le Quéré
et al., 2018; not including land use change). Unlike CH4, CO2 emissions are to a large extent induced by fuel usage for energy
consumption rather than production. In the near future, CO2 emissions are expected to continue increasing, driven by a strong
demand in Asia (Jackson et al., 2019).
A large fraction of global O&G extraction occurs in the Eastern Mediterranean and Middle East region (EMME). Middle East 70
is the main crude oil production region (32% of world total) with 24.16 million barrel per day, and 17,5% of global natural gas
production with 701.12 billion standard cubic meters produced in 2019 (OPEC, 2020). The main O&G fields are located in
the Arabian Gulf and neighboring countries, as well as in the Gulf of Suez and the Nile Delta. Gas fields have been recently
discovered in the Levantine Sea. CH4 emissions reported by the EDGAR inventory for countries neighboring the
Mediterranean Sea and Middle East, amount respectively to 16 Mt CH4 yr-1 (6.0% of global emissions), and to 21 Mt CH4 yr-75 1 (8.3% of global emissions) (Janssens-Maenhout et al., 2017). Across the different inventories reported in Saunois et al. (2020)
for the Middle East, the spread represents 18% of the mean emission intensity, reflecting a significant uncertainty on country-
level emissions. Increasing CH4 emissions in the Middle East and Africa have been proposed as a contribution to the post-
2007 CH4 increase (McNorton et al., 2018).
According to the inventory data compiled by Friedlingstein et al., (2019), Mediterranean countries and Middle East CO2 80
emissions represent respectively 6.8% and 5.6% of global emissions. CO2 emissions for EMME have increased from 662 MtC
yr-1 to 831 MtC yr-1 over the period 2009-2018, essentially driven by fossil fuel use in Middle-Eastern countries. This represent
an annual growth rate of 2.5%, significantly higher than the 1.3% yr-1 increase rate of global emissions. CO2 emissions from
the Middle East are mostly arising from domestic consumption, while the emission transfers linked to international trade are
negligible (-2±7 MtC yr-1; Peters et al., 2012). However, inventories may underestimate by a factor 2 emissions from the main 85
urban centers of the Middle East (Yang et al., 2020).
The EMME region is a transitional zone between mid-latitude climates and subtropical area, located in the high-pressure
subtropical ridge (Lelieveld et al., 2012). The northern part of EMME is under a westerlies regime with Eastern Mediterranean
located in the outflow from European airmasses in the lower troposphere (Lelieveld et al., 2002), while the southern part
experiences trade winds. The EMME region includes a large extent of deserts as well as densely populated areas. Despite the 90
region’s important contribution to anthropogenic GHG emission, very few atmospheric measurements of the distribution of
GHG are available in the area (Ricaud et al., 2018), limiting the possibility to reduce uncertainties on regional emissions rates.
The Middle East remains undersampled, especially by the in-situ surface networks (Ciais et al., 2014). It also offers fewer
cloudy days than other mid-latitude locations, thus enhancing the potential of satellite passive measurements (Yang et al.,
2020). 95
What are the typical CO2 and CH4 mixing ratios around the Arabian peninsula? What are the main drivers for the observed
variability and can we link this variability to sources? To what extent can we confirm or inform the inventories based on the
4
measurements, and more specifically the O&G component of these inventories? This paper aims at better understanding the
drivers of variability for these species in the area, and to relate this variability to regional sources.
To address these questions, CO2 and CH4 mixing ratio measurements were performed during a ship cruise across the 100
Mediterranean Sea, Red Sea and Arabian Gulf in summer 2017. Large-scale, ship-borne measurements of CH4 and CO2
atmospheric concentrations have been previously performed for a wide variety of purpose including measuring emission from
O&G platforms (see e.g. Yacovitch et al., 2020), assessing nation-wide emissions in the UK and Ireland (Helfter et al., 2019)
or disentangling regional sources in the Arctic (Berchet et al. 2020).
Here we build on the work of Bourtsoukidis et al. (2019) who characterized light alkanes in relation to the various hydrocarbon 105
sources in the region. We compare these results to a simulation of the anthropogenic component of CO2 and CH4 excess during
the cruise using a Lagrangian particle dispersion model.
Section 2 details the AQABA (Air Quality and climate change in the Arabian Basin) campaign, as well as the measurement
and modelling methodology. Section 3 presents measurements data and discusses how these data compare with simulations of
CH4 and CO2 enhancements linked to anthropogenic activities. 110
2. Methods
2.1. Campaign and Platform
The AQABA campaign took place in summer 2017 from June 24 to September 3. The scientific purpose of the campaign was
to investigate the atmospheric composition and chemical processes over the Arabian Basin (Pfannerstill et al., 2019; Wang et
al., 2020; Bourtsoukidis et al., 2019; Bourtsoukidis et al., 2020; Tadic et al., 2020; Celik et al., 2020). The ship departed from, 115
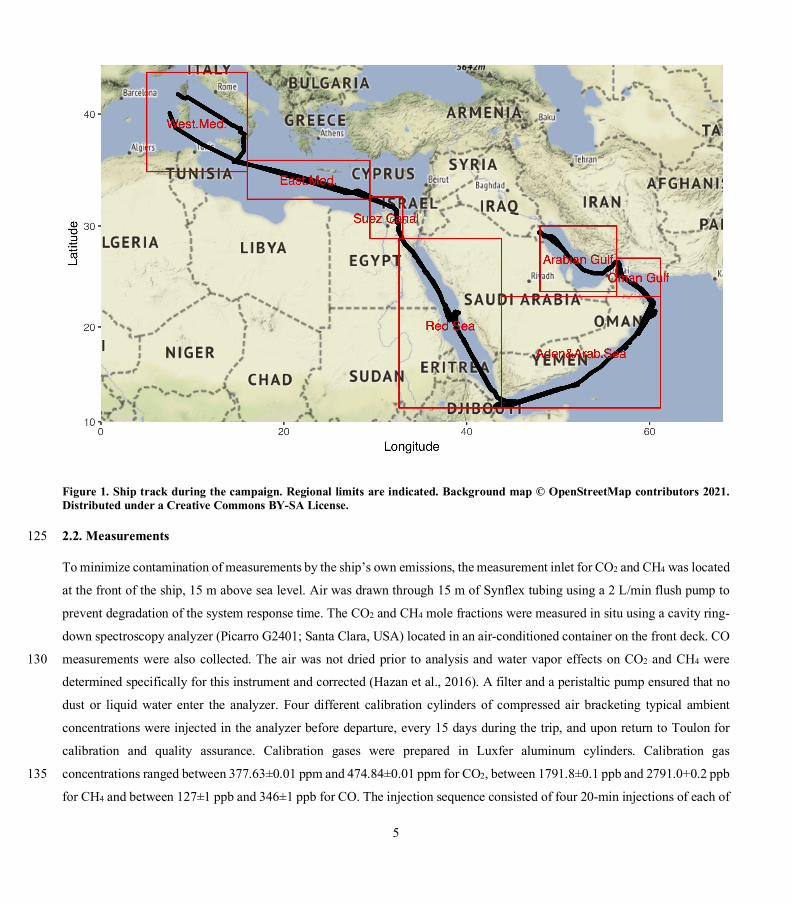
and returned to La Seyne sur Mer, near Toulon, France. Fig. 1 shows the ship’s route and calling ports. The ship traveled
through the Suez Canal and the Red Sea, then around the Arabian Peninsula and through the Persian Gulf (also named Arabian
Gulf) to Kuwait, where it anchored for 3 days (from July 31 to August 3) at the port. The ship eventually returned and reached
La Seyne sur Mer by approximately the same route on September 2. Several calls occurred at various ports on the way. The
ship used was the Kommandor Iona, a UK-based, 76-m long dynamic positioning research and survey vessel. The mean speed 120
of the vessel during the campaign was 3.4±1.8 m s-1.
5
Figure 1. Ship track during the campaign. Regional limits are indicated. Background map © OpenStreetMap contributors 2021. Distributed under a Creative Commons BY-SA License.
2.2. Measurements 125
To minimize contamination of measurements by the ship’s own emissions, the measurement inlet for CO2 and CH4 was located
at the front of the ship, 15 m above sea level. Air was drawn through 15 m of Synflex tubing using a 2 L/min flush pump to
prevent degradation of the system response time. The CO2 and CH4 mole fractions were measured in situ using a cavity ring-
down spectroscopy analyzer (Picarro G2401; Santa Clara, USA) located in an air-conditioned container on the front deck. CO
measurements were also collected. The air was not dried prior to analysis and water vapor effects on CO2 and CH4 were 130
determined specifically for this instrument and corrected (Hazan et al., 2016). A filter and a peristaltic pump ensured that no
dust or liquid water enter the analyzer. Four different calibration cylinders of compressed air bracketing typical ambient
concentrations were injected in the analyzer before departure, every 15 days during the trip, and upon return to Toulon for
calibration and quality assurance. Calibration gases were prepared in Luxfer aluminum cylinders. Calibration gas
concentrations ranged between 377.63±0.01 ppm and 474.84±0.01 ppm for CO2, between 1791.8±0.1 ppb and 2791.0+0.2 ppb 135
for CH4 and between 127±1 ppb and 346±1 ppb for CO. The injection sequence consisted of four 20-min injections of each of
6
the four gases. An additional target gas of ambient concentration was injected twice daily to assess measurement accuracy.
Precision of the G2401 (expressed as continuous measurement repeatability) is typically better than 0.03 ppm CO2, 0.3 ppb
CH4 and 8 ppb CO (Yver-Kwok et al., 2015). Calibrations were quite stable and consistently exhibited a within-run standard
deviation of 0.03 ppm CO2, 0.3 ppb CH4 and 10 ppb CO with little change during the trip. The data has been processed and 140
quality-controlled following ICOS (Integrated Carbon Observing System) standard procedure (Hazan et al., 2016), including
the propagation of the calibration and threshold-based filters. The concentrations measured from calibration cylinders between
two calibration sequences show a mean drift of 0.05 ppm and 0.5 ppb CH4, significantly below the drifts typically observed at
fixed observatories (Hazan et al., 2016). Target injections showed a small residual bias (after calibration) below 0.05 ppm CO2
and 0.3 ppb CH4. The measured target values for CO vary within ±10 ppb sd. The processed data is reported as 1-min averages. 145
Alkanes were measured using Gas Chromatography-Flame Ionization Detector (GC-FID; Bourtsoukidis et al., 2019). GC-FID
sampling intervals were 10-30 minutes, with uncertainties ranging between 5 and 10%. Detailed description of the GC-FID
measurements can be found in Bourtsoukidis et al. (2019).
Meteorological parameters such as wind speed and direction, pressure and temperature as well as GPS position and course,
were acquired from a meteorological station (Shipborne European Common Automatic Weather Station, EUCAWS) at the 150
starboard side of the front deck of the ship.
2.3. Stack contamination data filter
As the sampling inlet was situated at the front of the boat, measurements can be occasionally influenced by the ship’s stack
emissions. We assume that this influence is mainly depending on the relative wind direction, where a tailwind is likely to bring
smoke from the boat’s chimney back onto the instrument and thus contaminate the measurements. We flagged 1-min measured 155
concentrations using a binary index indicated possible presence/absence of stack contamination as in Tadic et al. (2019).
Different values of angle sector around the stern were tested to filter data using relative wind direction and speed. 16% of data
were flagged as potentially contaminated by the ship and not considered in the following analysis.
2.4. Lagrangian modelling
Atmospheric transport was investigated using the FLEXible PARTicle dispersion model (Flexpart) v9 Lagrangian particle 160
dispersion model (Pisso et al., 2019) in receptor-oriented mode (Seibert & Frank, 2004). Flexpart calculates the trajectories of
a large number of tracer particles using the mean winds interpolated from the analysis fields plus random motions representing
turbulence (Stohl and Thomson, 1999). Results presented here use ECMWF analysis fields at 1° resolution. Here, the backward
method is used to analyse transport pathways from source regions to the receptor position. Each simulation consists of 10,000
particles released every hour. Released particles were followed up to 14 days backward in time. Potential emission sensitivity 165
is considered when particles reside below the boundary layer height as retrieved from the ECMWF analysis. Potential emission
sensitivities are then convolved with gridded surface fluxes from emission inventories to simulate mixing ratios at the ship
position during the cruise.
7
2.5. Emission inventories
For simplicity, our simulation uses surface emission of CO2 and CH4 that include only anthropogenic emissions. Data are taken 170
from the Emission Database for Global Atmospheric Research (EDGAR) v4.3.2 for the year 2012 (Janssens-Maenhout et al.,
2017; Janssens-Maenhout et al., 2019). EDGAR estimates country total emissions for a variety of species including CO2 and
CH4 based on international emission factors and activity data. Maps are eventually generated at a resolution of 0.1°x0.1°
according to spatial proxies. For fossil fuels exploitation for examples, spatial proxies combine observed flaring and
cartography of infrastructures. Our Flexpart simulations calculate contributions detailed by sector and by country following 175
the typology of the EDGAR database.
The Evaluating the Climate and Air Quality Impacts of Short-Lived Pollutants (ECLIPSE) baseline version CLE 5a (Höglund-
Isaksson, 2012) is also used for comparative simulations of CH4 using Flexpart (CO2 is not provided as gridded data). ECLIPSE
derives from the GAINS model used for scenario analysis. ECLIPSE maps emissions a resolution of 0.5°x0.5° according to
spatial proxies different from EDGAR. 180
3. Results and discussion
3.1. Spatial Distribution of CH4 and CO2 along the cruise
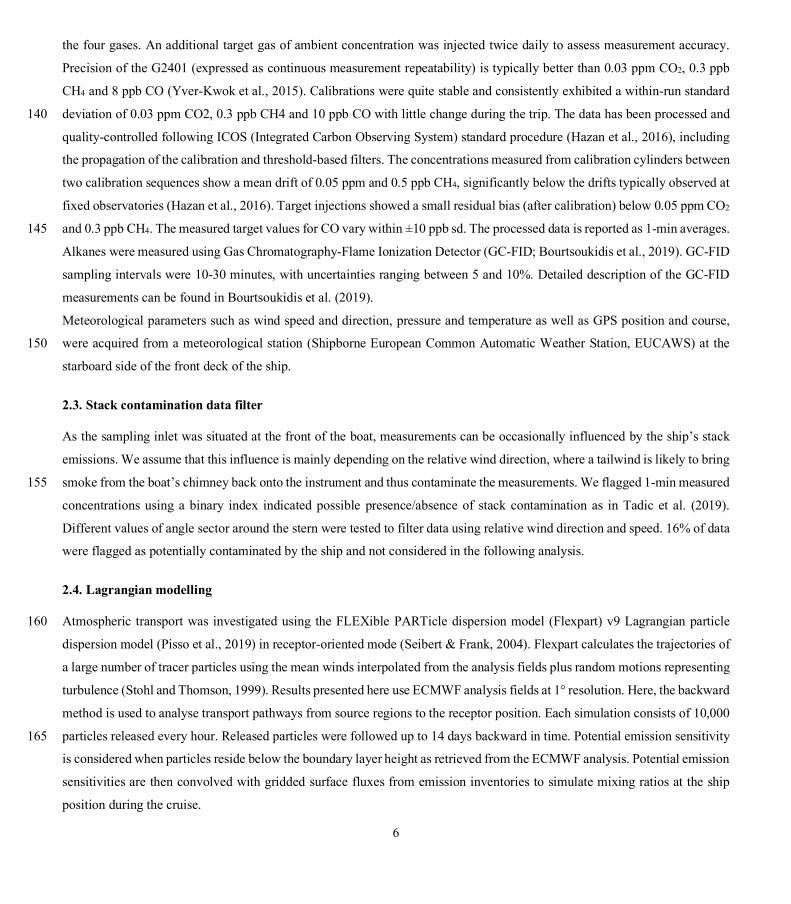
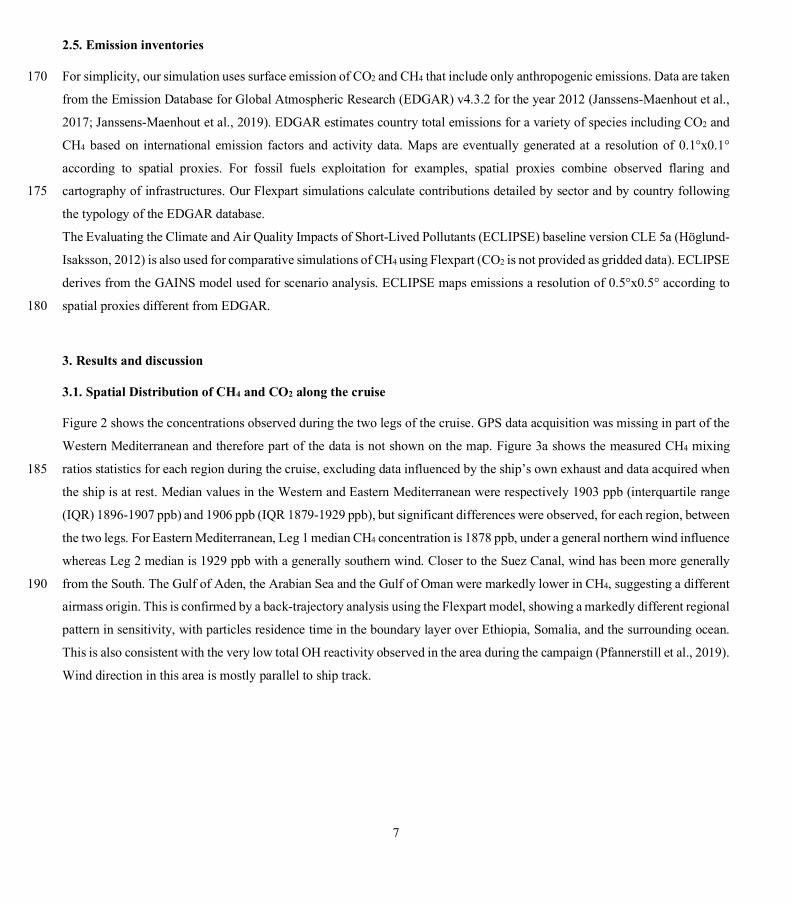
Figure 2 shows the concentrations observed during the two legs of the cruise. GPS data acquisition was missing in part of the
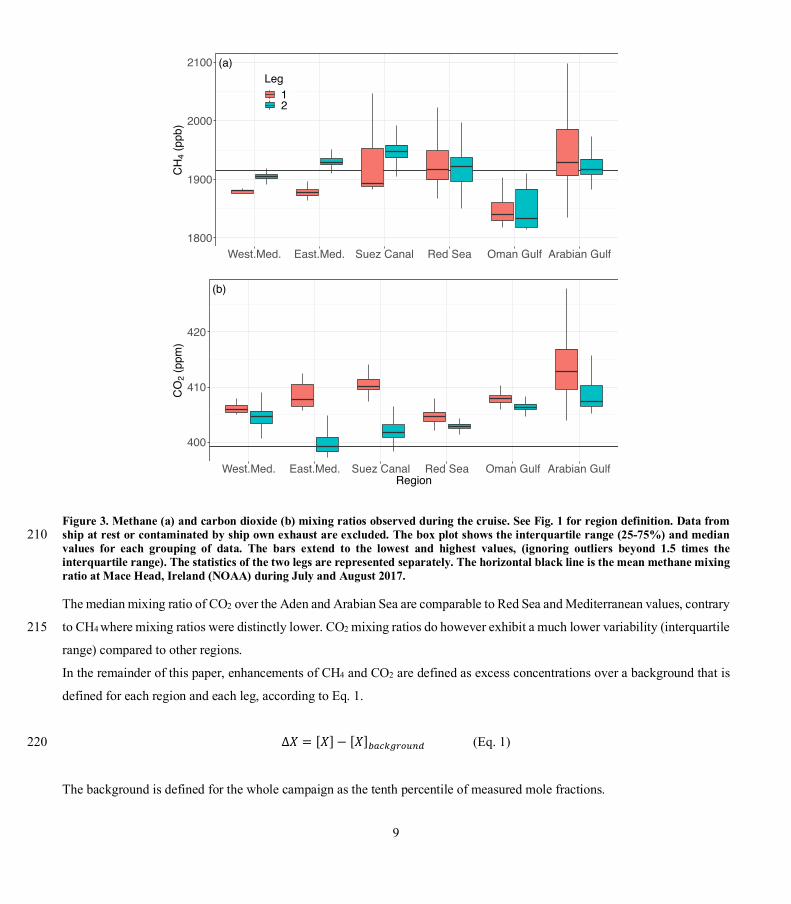
Western Mediterranean and therefore part of the data is not shown on the map. Figure 3a shows the measured CH4 mixing
ratios statistics for each region during the cruise, excluding data influenced by the ship’s own exhaust and data acquired when 185
the ship is at rest. Median values in the Western and Eastern Mediterranean were respectively 1903 ppb (interquartile range
(IQR) 1896-1907 ppb) and 1906 ppb (IQR 1879-1929 ppb), but significant differences were observed, for each region, between
the two legs. For Eastern Mediterranean, Leg 1 median CH4 concentration is 1878 ppb, under a general northern wind influence
whereas Leg 2 median is 1929 ppb with a generally southern wind. Closer to the Suez Canal, wind has been more generally
from the South. The Gulf of Aden, the Arabian Sea and the Gulf of Oman were markedly lower in CH4, suggesting a different 190
airmass origin. This is confirmed by a back-trajectory analysis using the Flexpart model, showing a markedly different regional
pattern in sensitivity, with particles residence time in the boundary layer over Ethiopia, Somalia, and the surrounding ocean.
This is also consistent with the very low total OH reactivity observed in the area during the campaign (Pfannerstill et al., 2019).
Wind direction in this area is mostly parallel to ship track.
8
195
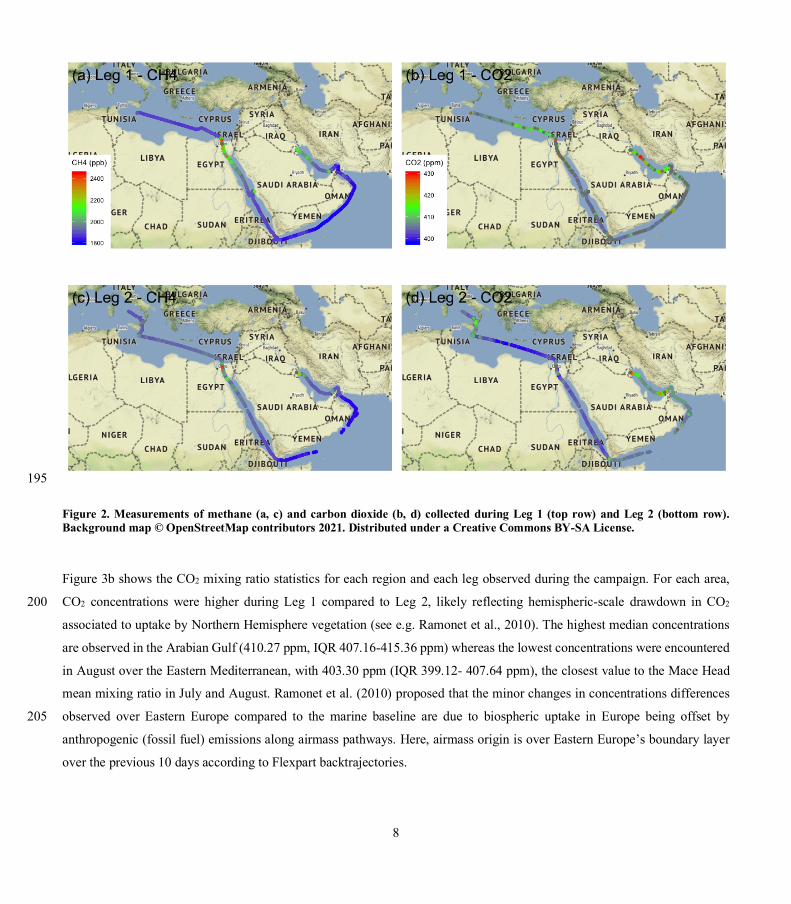
Figure 2. Measurements of methane (a, c) and carbon dioxide (b, d) collected during Leg 1 (top row) and Leg 2 (bottom row). Background map © OpenStreetMap contributors 2021. Distributed under a Creative Commons BY-SA License.
Figure 3b shows the CO2 mixing ratio statistics for each region and each leg observed during the campaign. For each area,
CO2 concentrations were higher during Leg 1 compared to Leg 2, likely reflecting hemispheric-scale drawdown in CO2 200
associated to uptake by Northern Hemisphere vegetation (see e.g. Ramonet et al., 2010). The highest median concentrations
are observed in the Arabian Gulf (410.27 ppm, IQR 407.16-415.36 ppm) whereas the lowest concentrations were encountered
in August over the Eastern Mediterranean, with 403.30 ppm (IQR 399.12- 407.64 ppm), the closest value to the Mace Head
mean mixing ratio in July and August. Ramonet et al. (2010) proposed that the minor changes in concentrations differences
observed over Eastern Europe compared to the marine baseline are due to biospheric uptake in Europe being offset by 205
anthropogenic (fossil fuel) emissions along airmass pathways. Here, airmass origin is over Eastern Europe’s boundary layer
over the previous 10 days according to Flexpart backtrajectories.
9
Figure 3. Methane (a) and carbon dioxide (b) mixing ratios observed during the cruise. See Fig. 1 for region definition. Data from ship at rest or contaminated by ship own exhaust are excluded. The box plot shows the interquartile range (25-75%) and median 210 values for each grouping of data. The bars extend to the lowest and highest values, (ignoring outliers beyond 1.5 times the interquartile range). The statistics of the two legs are represented separately. The horizontal black line is the mean methane mixing ratio at Mace Head, Ireland (NOAA) during July and August 2017.
The median mixing ratio of CO2 over the Aden and Arabian Sea are comparable to Red Sea and Mediterranean values, contrary
to CH4 where mixing ratios were distinctly lower. CO2 mixing ratios do however exhibit a much lower variability (interquartile 215
range) compared to other regions.
In the remainder of this paper, enhancements of CH4 and CO2 are defined as excess concentrations over a background that is
defined for each region and each leg, according to Eq. 1.
∆𝑋 = [𝑋] − [𝑋]'()*+,-./0 (Eq. 1) 220
The background is defined for the whole campaign as the tenth percentile of measured mole fractions.
1800
1900
2000
2100
West.Med. East.Med. Suez Canal Red Sea Oman Gulf Arabian Gulf
CH
4 (pp
b)
Leg12
(a)
400
410
420
West.Med. East.Med. Suez Canal Red Sea Oman Gulf Arabian GulfRegion
CO
2 (pp
m)
(b)
10
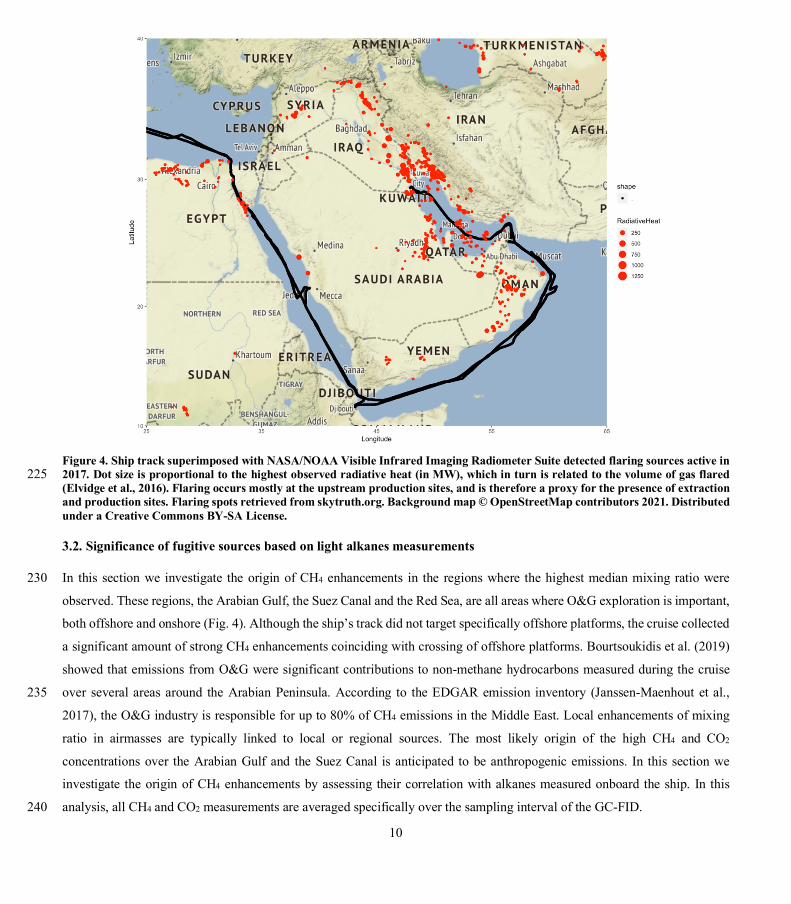
Figure 4. Ship track superimposed with NASA/NOAA Visible Infrared Imaging Radiometer Suite detected flaring sources active in 2017. Dot size is proportional to the highest observed radiative heat (in MW), which in turn is related to the volume of gas flared 225 (Elvidge et al., 2016). Flaring occurs mostly at the upstream production sites, and is therefore a proxy for the presence of extraction and production sites. Flaring spots retrieved from skytruth.org. Background map © OpenStreetMap contributors 2021. Distributed under a Creative Commons BY-SA License.
3.2. Significance of fugitive sources based on light alkanes measurements
In this section we investigate the origin of CH4 enhancements in the regions where the highest median mixing ratio were 230
observed. These regions, the Arabian Gulf, the Suez Canal and the Red Sea, are all areas where O&G exploration is important,
both offshore and onshore (Fig. 4). Although the ship’s track did not target specifically offshore platforms, the cruise collected
a significant amount of strong CH4 enhancements coinciding with crossing of offshore platforms. Bourtsoukidis et al. (2019)
showed that emissions from O&G were significant contributions to non-methane hydrocarbons measured during the cruise
over several areas around the Arabian Peninsula. According to the EDGAR emission inventory (Janssen-Maenhout et al., 235
2017), the O&G industry is responsible for up to 80% of CH4 emissions in the Middle East. Local enhancements of mixing
ratio in airmasses are typically linked to local or regional sources. The most likely origin of the high CH4 and CO2
concentrations over the Arabian Gulf and the Suez Canal is anticipated to be anthropogenic emissions. In this section we
investigate the origin of CH4 enhancements by assessing their correlation with alkanes measured onboard the ship. In this
analysis, all CH4 and CO2 measurements are averaged specifically over the sampling interval of the GC-FID. 240
11
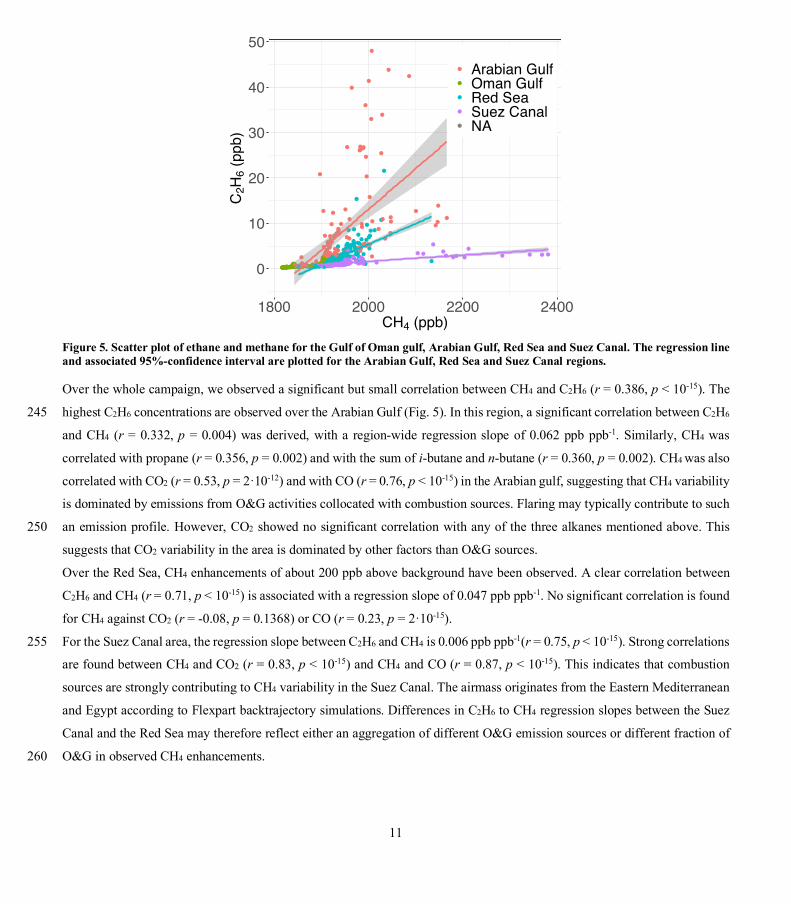
Figure 5. Scatter plot of ethane and methane for the Gulf of Oman gulf, Arabian Gulf, Red Sea and Suez Canal. The regression line and associated 95%-confidence interval are plotted for the Arabian Gulf, Red Sea and Suez Canal regions.
Over the whole campaign, we observed a significant but small correlation between CH4 and C2H6 (r = 0.386, p < 10-15). The
highest C2H6 concentrations are observed over the Arabian Gulf (Fig. 5). In this region, a significant correlation between C2H6 245
and CH4 (r = 0.332, p = 0.004) was derived, with a region-wide regression slope of 0.062 ppb ppb-1. Similarly, CH4 was
correlated with propane (r = 0.356, p = 0.002) and with the sum of i-butane and n-butane (r = 0.360, p = 0.002). CH4 was also
correlated with CO2 (r = 0.53, p = 2·10-12) and with CO (r = 0.76, p < 10-15) in the Arabian gulf, suggesting that CH4 variability
is dominated by emissions from O&G activities collocated with combustion sources. Flaring may typically contribute to such
an emission profile. However, CO2 showed no significant correlation with any of the three alkanes mentioned above. This 250
suggests that CO2 variability in the area is dominated by other factors than O&G sources.
Over the Red Sea, CH4 enhancements of about 200 ppb above background have been observed. A clear correlation between
C2H6 and CH4 (r = 0.71, p < 10-15) is associated with a regression slope of 0.047 ppb ppb-1. No significant correlation is found
for CH4 against CO2 (r = -0.08, p = 0.1368) or CO (r = 0.23, p = 2·10-15).
For the Suez Canal area, the regression slope between C2H6 and CH4 is 0.006 ppb ppb-1(r = 0.75, p < 10-15). Strong correlations 255
are found between CH4 and CO2 (r = 0.83, p < 10-15) and CH4 and CO (r = 0.87, p < 10-15). This indicates that combustion
sources are strongly contributing to CH4 variability in the Suez Canal. The airmass originates from the Eastern Mediterranean
and Egypt according to Flexpart backtrajectory simulations. Differences in C2H6 to CH4 regression slopes between the Suez
Canal and the Red Sea may therefore reflect either an aggregation of different O&G emission sources or different fraction of
O&G in observed CH4 enhancements. 260
●●●●
●
●●
●● ●●●● ●
● ●●
●
●
●
●
●
●●
●●●
●
●●●
●●
●●●●
●●●●●●
●
●●●●●●●●
●
●●●●●●●
● ●●●●●
●●●
●●
●●●
●●●●●●●●●●●
●●●●●●● ●●●●●●●●●●●●●●●●●●●●●●●●●●●●●●●●●●●●●●●●
●●●●●●●●●●●●●●● ● ●● ●●●●●●●●●●●●●●●●● ●
●● ●●●●●●●●●●●●●●●●●●●●●● ●●●●●●●●●●●●●●●●●●●●●●●●●●●●●●●●●●●●●●●●●●●●●●●●●●●●●●●●●●●●●●●●●●●●●●●●●●●● ●●●●● ● ●●●●●●●●●●●●●●●●●●●●● ●●● ●●●●●●●●●●●●●●●●●●●●●●● ●●●●●●●●●●●●●●●●● ●●●●
●
●●●● ● ●●●● ●
●
●●●●●●
●●●●●●●●●●●●
●●●
●
●
●●●●●●
●●●●●●●
● ●●
●●●●●●
●
●●●
●
●
●
●
●●●●●●
●
●
●
●
●
●
●
●
●●
●
●
●
●
●
●●
●
●
●●
●●●
●
●●
●●
●
●●●●
●●●
●●●●●●●●●●●
●
●●
●●
●
●
●
●
●●●●●
●●●
●●
●●●●●●●●●●●●●●●●●●●●●●●●●●●● ● ●●●●●●●●●●●●●●●●●●●●●●●●●
●●●●●●●
●
●●●●
●
●●●●●●●
●●
●●●
●●●
●●
● ●
●
●
●●
●●●●●
●●●
●
●●●●●
●
●●
●
●
●●●●●●●●●● ● ●●
●●●●● ●●● ●●●●●●●
●
●●●
● ● ● ●●●
●●●● ●●●●●
●●
●●●●●●●●●●●●●●●●●●●●●●●●●0
10
20
30
40
50
1800 2000 2200 2400CH4 (ppb)
C2H
6 (pp
b)
●
●
●
●
●
Arabian GulfOman GulfRed SeaSuez CanalNA
12
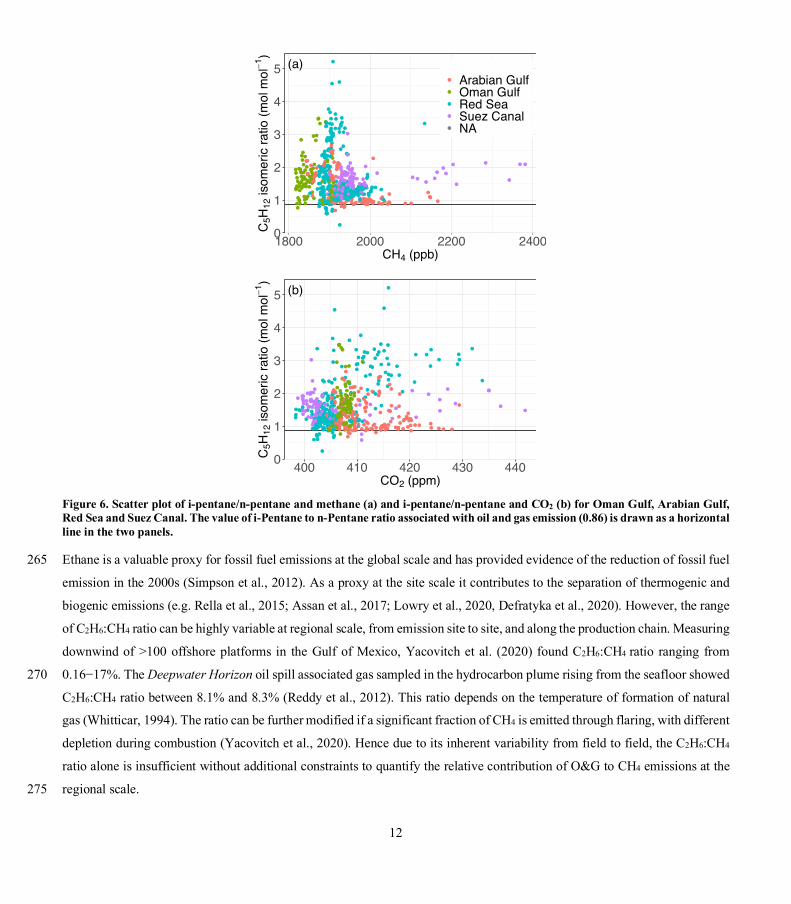
Figure 6. Scatter plot of i-pentane/n-pentane and methane (a) and i-pentane/n-pentane and CO2 (b) for Oman Gulf, Arabian Gulf, Red Sea and Suez Canal. The value of i-Pentane to n-Pentane ratio associated with oil and gas emission (0.86) is drawn as a horizontal line in the two panels.
Ethane is a valuable proxy for fossil fuel emissions at the global scale and has provided evidence of the reduction of fossil fuel 265
emission in the 2000s (Simpson et al., 2012). As a proxy at the site scale it contributes to the separation of thermogenic and
biogenic emissions (e.g. Rella et al., 2015; Assan et al., 2017; Lowry et al., 2020, Defratyka et al., 2020). However, the range
of C2H6:CH4 ratio can be highly variable at regional scale, from emission site to site, and along the production chain. Measuring
downwind of >100 offshore platforms in the Gulf of Mexico, Yacovitch et al. (2020) found C2H6:CH4 ratio ranging from
0.16−17%. The Deepwater Horizon oil spill associated gas sampled in the hydrocarbon plume rising from the seafloor showed 270
C2H6:CH4 ratio between 8.1% and 8.3% (Reddy et al., 2012). This ratio depends on the temperature of formation of natural
gas (Whitticar, 1994). The ratio can be further modified if a significant fraction of CH4 is emitted through flaring, with different
depletion during combustion (Yacovitch et al., 2020). Hence due to its inherent variability from field to field, the C2H6:CH4
ratio alone is insufficient without additional constraints to quantify the relative contribution of O&G to CH4 emissions at the
regional scale. 275
●
●
●
●
●●
●
●
● ●
●
●●
●
●
●
●●
●
● ●●●●●
●●
●●
●
●●
●
●●●●●●●●●● ●
●●● ●●●●●●
●
●●
●
●●●●
●●●
●●●●●●●●
●●
●●●●●●●●●●●●
●●●●●●
●●
●
●●●●
●
●
●
●
●●
●
●●●
●
●●●
●
●
●●
●
●
●
●
●
●
●
●
●
●
●
●
●
●
●
●
●
●
●
●
●●
●
●
●●
●
●
●●
●
●
●
●
●
●
●
●
●
●●●
●
●●
●●
●
●
●
●
●
●
●
●
●
●●
●
●
●
●●
●
●
●●●
●●●
●
●
●
●
●
●
●
●
●
●
●
●●●
●
●●
●●●●●●●●●
●
●
●
●●
●
●●
●
●
●●
●
●
●
●
●
●●
●
●
●
●
●●
●
●
●
●
●
●●
●●
●
●
●
●
●
●
●●
●
●
●
●
●
●
●
●
●
●
●●
●●
●
●●
●
●
●
●
●
●●
●
●
●
●
●
●
●
●
●
●●●
●●●● ●
●●●
●
●
●
●
●●●●●●●●●
●
●
●
●
●
●
●●
● ●
●
●●
●
●
●
●
●●●
●●
●
●
●
●
●
●●
●
●
●●
●●
●
●
●
●
●
●
●
●●
●●
●●●●
●●
●●●●●●
●
●
●●
●
●
●
●
●
●
●
●●
●●●●
●
●●
●
● ●●●●
●
●● ●●●● ●●●●
●●●●●●●● ● ●
●●● ● ●● ●●
●
●●
●●
●
●
●●●●
● ●●●●
●
●●●●●●●
●●●
●●
●●
●
●●
●
●●●
●
●
●●●●
●
●●●●
●
●●
●●
●
●
●
●
●
●
●
●
●
●●
●
●
●
●
●
●
●●●
●
●
●
●
●●
●●
●●●●
●●●
●
●●●●
●
●●●
●
●
●
●
●
●●●
●
●
●
●
●
●●●●●●●●
●●●●●●●●●
●●●●●● ●
●●
●
●● ●●●●●
●●
●
●●●
●
●
●●
●
●
●
●●
● ●
●
●●●●●●
●●
●●
●
●
●●●●●
●●
●
●●
●● ●●
●
●●
●
●
●
● ● ●●●
●
●
●
● ●
● ●●●●
●
●
●
●●
●
●
●
●●
●●
●
●
●
●●
●●
●●●
●
●
●
●
0
1
2
3
4
5
1800 2000 2200 2400CH4 (ppb)
C5H
12 is
omer
ic ra
tio (m
ol m
ol-1
)
●
●
●
●
●
Arabian GulfOman GulfRed SeaSuez CanalNA
(a)
●
●
●
●
●●
●
●
● ●
●
●●
●
●
●
●●
●
● ●●● ● ●
●●
●●
●
●●
●
●●●●●●●●●●●
●●●●● ●●●●
●
●●
●
●●●●
●●
●
●●●●●●●●●●
●●●●●●●●●●●●●●●●●●
●●●
●●●●
●
●
●
●
●●
●
●●●
●
●●●
●
●
●●
●
●
●
●
●
●
●
●
●
●
●
●
●
●
●
●
●
●
●
●
●●
●
●
●●
●
●
●●
●
●
●
●
●
●
●
●
●
●●
●
●
●●
●●
●
●
●
●
●
●
●
●
●
●●
●
●
●
●●
●
●
●●●
●●●
●
●
●
●
●
●
●
●
●
●
●
●●●
●
●●
●●●●●●●●●
●
●
●
●●
●
●●
●
●
●●
●
●
●
●
●
●●
●
●
●
●
●●
●
●
●
●
●
●●
●●
●
●
●
●
●
●
●●
●
●
●
●
●
●
●
●
●
●
●●
●●
●
●●
●
●
●
●
●
●●
●
●
●
●
●
●
●
●
●
●●●
●●
●●●
●●●●
●
●
●
●●●●●●●●●●
●
●
●
●
●
●●
●●
●
●●
●
●
●
●
●●●
●●
●
●
●
●
●
●●
●
●
●●
●●
●
●
●
●
●
●
●
●●
●●
●●●●
●●
●●● ●●
●●
●
●●
●
●
●
●
●
●
●
●●
● ●●
●
●
●●
●
● ●●●
●●
●● ● ● ●● ●●●●
●●●●●●●
● ● ●● ●● ●●●●●
●
●●
●●
●
●
●●●●
● ●●●●
●
●●●●●●●
●●●
●●
●●
●
●●
●
●●●
●
●
●●●●
●
● ●●●
●
● ●
●●
●
●
●
●
●
●
●
●
●
●●
●
●
●
●
●
●
●●●
●
●
●
●
●●
●●
●●●●
●●●
●
●●●●
●
●●●
●
●
●
●
●
●●●
●
●
●
●
●
●●●●●
●●●●●●●●
●●●
●
●●●●●●●
●●●
●● ●●●●●
●●
●
●●●
●
●
●●
●
●
●
●●
●●
●
●●●●●●
●●
●●
●
●
●●●●●
●●
●
●●
●● ●●
●
●●
●
●
●
● ● ●●●
●
●
●
●●
●●●● ●
●
●
●
●●
●
●
●
●●
●●
●
●
●
●●
●●
●●●
●
●
●
●
0
1
2
3
4
5
400 410 420 430 440CO2 (ppm)
C5H
12 is
omer
ic ra
tio (m
ol m
ol-1
)
(b)
13
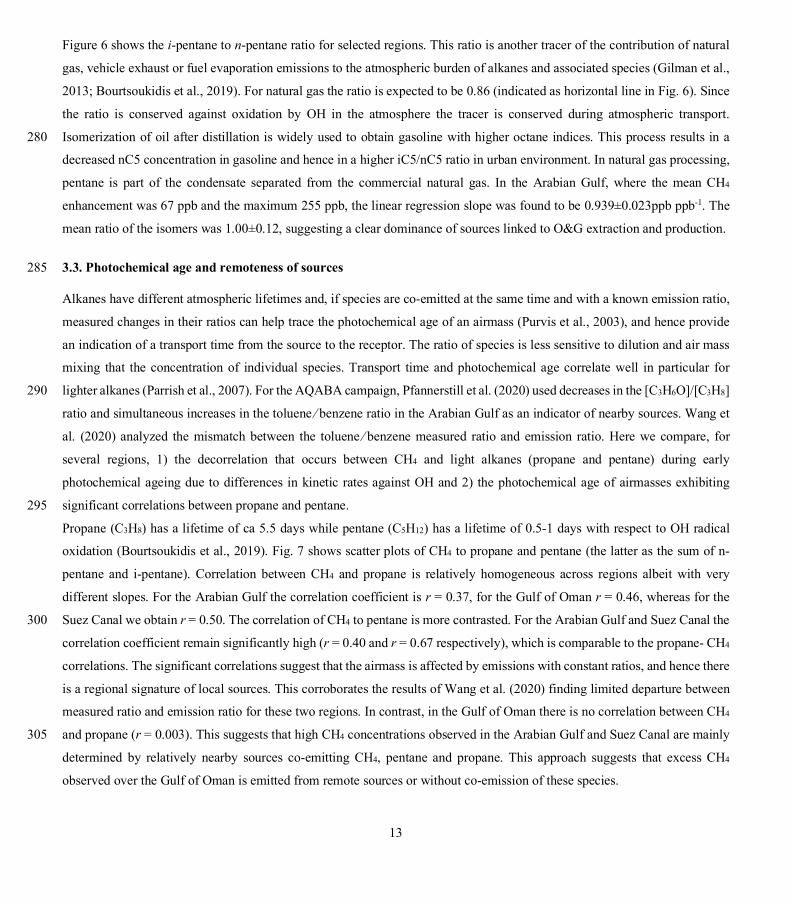
Figure 6 shows the i-pentane to n-pentane ratio for selected regions. This ratio is another tracer of the contribution of natural
gas, vehicle exhaust or fuel evaporation emissions to the atmospheric burden of alkanes and associated species (Gilman et al.,
2013; Bourtsoukidis et al., 2019). For natural gas the ratio is expected to be 0.86 (indicated as horizontal line in Fig. 6). Since
the ratio is conserved against oxidation by OH in the atmosphere the tracer is conserved during atmospheric transport.
Isomerization of oil after distillation is widely used to obtain gasoline with higher octane indices. This process results in a 280
decreased nC5 concentration in gasoline and hence in a higher iC5/nC5 ratio in urban environment. In natural gas processing,
pentane is part of the condensate separated from the commercial natural gas. In the Arabian Gulf, where the mean CH4
enhancement was 67 ppb and the maximum 255 ppb, the linear regression slope was found to be 0.939±0.023ppb ppb-1. The
mean ratio of the isomers was 1.00±0.12, suggesting a clear dominance of sources linked to O&G extraction and production.
3.3. Photochemical age and remoteness of sources 285
Alkanes have different atmospheric lifetimes and, if species are co-emitted at the same time and with a known emission ratio,
measured changes in their ratios can help trace the photochemical age of an airmass (Purvis et al., 2003), and hence provide
an indication of a transport time from the source to the receptor. The ratio of species is less sensitive to dilution and air mass
mixing that the concentration of individual species. Transport time and photochemical age correlate well in particular for
lighter alkanes (Parrish et al., 2007). For the AQABA campaign, Pfannerstill et al. (2020) used decreases in the [C3H6O]/[C3H8] 290
ratio and simultaneous increases in the toluene ⁄ benzene ratio in the Arabian Gulf as an indicator of nearby sources. Wang et
al. (2020) analyzed the mismatch between the toluene ⁄ benzene measured ratio and emission ratio. Here we compare, for
several regions, 1) the decorrelation that occurs between CH4 and light alkanes (propane and pentane) during early
photochemical ageing due to differences in kinetic rates against OH and 2) the photochemical age of airmasses exhibiting
significant correlations between propane and pentane. 295
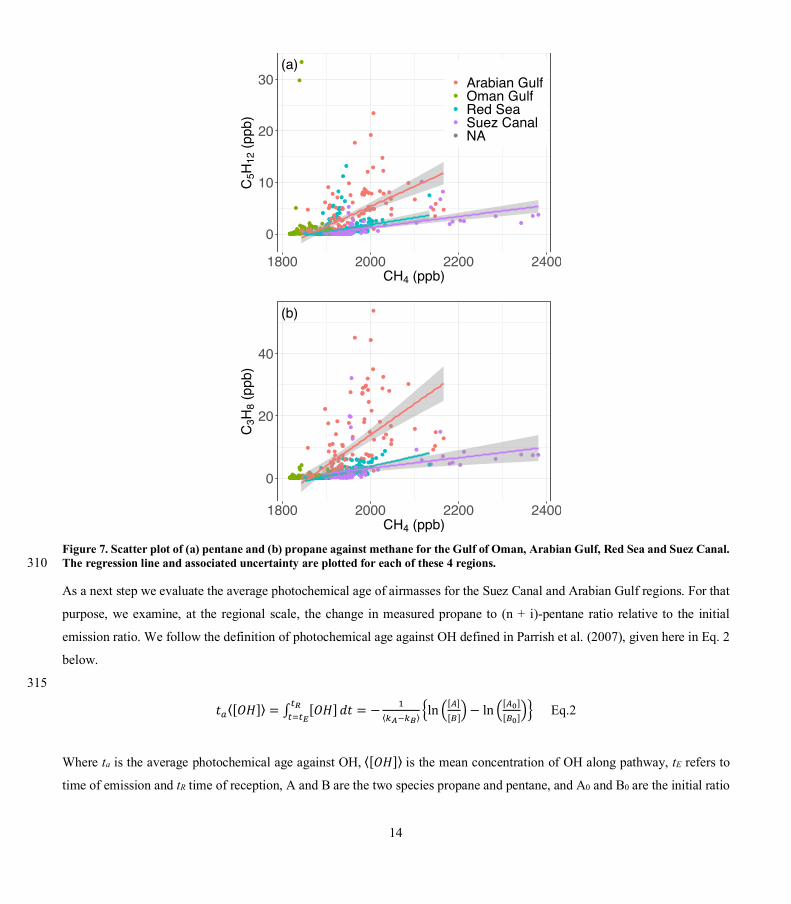
Propane (C3H8) has a lifetime of ca 5.5 days while pentane (C5H12) has a lifetime of 0.5-1 days with respect to OH radical
oxidation (Bourtsoukidis et al., 2019). Fig. 7 shows scatter plots of CH4 to propane and pentane (the latter as the sum of n-
pentane and i-pentane). Correlation between CH4 and propane is relatively homogeneous across regions albeit with very
different slopes. For the Arabian Gulf the correlation coefficient is r = 0.37, for the Gulf of Oman r = 0.46, whereas for the
Suez Canal we obtain r = 0.50. The correlation of CH4 to pentane is more contrasted. For the Arabian Gulf and Suez Canal the 300
correlation coefficient remain significantly high (r = 0.40 and r = 0.67 respectively), which is comparable to the propane- CH4
correlations. The significant correlations suggest that the airmass is affected by emissions with constant ratios, and hence there
is a regional signature of local sources. This corroborates the results of Wang et al. (2020) finding limited departure between
measured ratio and emission ratio for these two regions. In contrast, in the Gulf of Oman there is no correlation between CH4
and propane (r = 0.003). This suggests that high CH4 concentrations observed in the Arabian Gulf and Suez Canal are mainly 305
determined by relatively nearby sources co-emitting CH4, pentane and propane. This approach suggests that excess CH4
observed over the Gulf of Oman is emitted from remote sources or without co-emission of these species.
14
Figure 7. Scatter plot of (a) pentane and (b) propane against methane for the Gulf of Oman, Arabian Gulf, Red Sea and Suez Canal. The regression line and associated uncertainty are plotted for each of these 4 regions. 310
As a next step we evaluate the average photochemical age of airmasses for the Suez Canal and Arabian Gulf regions. For that
purpose, we examine, at the regional scale, the change in measured propane to (n + i)-pentane ratio relative to the initial
emission ratio. We follow the definition of photochemical age against OH defined in Parrish et al. (2007), given here in Eq. 2
below.
315
𝑡(⟨[𝑂𝐻]⟩ = ∫ [𝑂𝐻]78797:
𝑑𝑡 = − <⟨*=>*?⟩
@ln C[D][E]F − ln C[DG]
[EG]FH Eq.2
Where ta is the average photochemical age against OH, ⟨[𝑂𝐻]⟩ is the mean concentration of OH along pathway, tE refers to
time of emission and tR time of reception, A and B are the two species propane and pentane, and A0 and B0 are the initial ratio
●●●●
●●●
●● ●●●● ●
●
●
●
●
●●
●●●●
●●●●● ●● ●●●●●●●●●●●●
● ●●● ●●●●●●●●●●●●●●●●●●●●●●●●
●●●●●●●●●●●●●●●●●●●●● ●●●●●●●●●●●●●●●●●●●●●●●●●●●●●●●●●●●●●●●
●●●●●●●●●●●●●
●●●
●
●●
●
●
●
●
●
●●●●●●●●●●
●
●
●
●
●
●
●●●●●
●●●●
●
●●●●●●● ●●●
● ●●●
●
●●●●●●●●●●●●●●●●●●●●●●●●●●●●●●
●●●●●●●●●●●●●●●●●●●●●●●●●●●●●●●●●●●●●●●●●●● ●●●●●
●
●
●
●●●●●●●●●●●●●●●●●●●
●●●●
●●●●●●●●●●●●●●
●
●●●
●
●●●
●●
●
●
●
●●●
●
●●●●●●●●●●●
●
●●●● ● ●●● ● ●
●●●●●●●●●●●●●●●●●●●●●
●
●
●
●●●●
●
●
●
●●●●
●
●●
●
●
●●
●●●●
●●
●●
● ●●●●●●
●●●
●
●
●
●
●
●
●
●
●●●
●
●
●
●
● ●
●
●
●
●
●
●●
●
●
●
●● ●●●●●●●●●●●●●●●●●●●●
●●●●
●
●
●
●
●●●●●●●●●
●●●●●●
●●●●●●●●●
●●●●●●●●●●●●● ● ●●●●●●●●●●●●●●●●●●●
●
●●●●● ●●●● ●●●●●●●●●●●●●●●●●●●●●●● ●●●
● ●●
●●
●
●●●●●
●●● ●●●●●●
●
●
●●
●
●●●●●●●●●● ● ●●
●●
●
●
●
●
●● ●●●●
●●●●●
●●
● ●● ●●
●
●●●● ●● ●●●●
●●●●●●●●●●●●●●●●●●●●●●●●●●0
10
20
30
1800 2000 2200 2400CH4 (ppb)
C5H
12 (p
pb)
●
●
●
●
●
Arabian GulfOman GulfRed SeaSuez CanalNA
(a)
●●●●
●●
●
●● ●
●●●●
●●
●
●
●
●
●
●●●
●●●
●● ●● ●●●●●●●●●●●●
●●●●●●●●●
●●●●●●●●● ●●●●
●●●●●●
●●●●●●●●●●●●●●
●●●●●●● ●●●●●●●●●●●●●●●●●●●●●●●●●●●●●●●●●●●●●●●●●●●●●●●●●
●●●●●●
●●●
●●●●●
●●●●
●
●●●●●● ●
●
●●
●
●●●●●●●●●●●●●●●●● ●●●●
●●●●
●●●●●●●●●●●●●●●●●●●●●●●●●●●●●●●●●●●●●●●●●●●●●●●●●●●●●●●●●●●●●●●●●●●●●●●● ●●●●● ●
●●●●●●●●●●●●●●●●●●●●●●●● ●●●●●●●●●●●●●●●●●●●●●●● ●●
●●●
●●●●●●●●●●●● ●●●●
●
●●●● ● ●●● ● ●
●
●●●
●●●●●●●●●●●●●●●●●
●
●
●
●●●●
●
●
●
●●●●●●● ●
●●●
●●●
●●
●●
●●
●
●
●●●●
●●●
●
●
●
●
●
●
●
●
●
●●
●
●
●
●
● ●
●
●
●●
●
●●
●
●●
●
● ●●●●●●●●●●●●●
●●●●●●
●●●
●
●
●
●
●
●●●●●●●●●
●●●
●●●●●●●
●●●●●●●●●●●●●●●●●●● ● ●●●●●●
●●●●●●●●●●●●●●●●●●● ●
●●● ●●●●
●●●●
●●●●●●●●
●●
●●●●● ●●●
● ●●
●●●
●●●●
●
●●●●
●●●●●
●●●
●
●
●●●●●●●●●● ●●●●●
●●● ●●● ●●●●
●
●
●
●
●
●●
●●
●●●
●
●●●● ●●●●●
●●
●●●●●●●●●●●●●●●●●●●●●●●●●0
20
40
1800 2000 2200 2400CH4 (ppb)
C3H
8 (pp
b)
(b)
15
at the time of emission. We evaluate the mean ratio of concentration between species at the regional scale as the regression 320
slope between the two species. The regression slope of pentane against propane is 0.149 mol mol-1 for the Suez Canal and
0.378 mol mol-1 for the Arabian Gulf. The ratio of species at the time of origin is approximated by the emission ratio from the
EDGAR v4.3.2 inventory for volatile organic compounds (Huang et al., 2017). The inventory-based emission ratio is 0.460
mol mol-1 for the total emissions of Middle East countries and 0.435 mol mol-1 for Egypt. Overall this value varies within a
limited span (ranging from 0.347 mol mol-1 for Kuwait to 0.682 mol mol-1 for Iran) across countries with significant emissions 325
of these two species. We use kinetic rate coefficients as reported by Pfannerstill et al. (2019, their Table S1) and assume a
mean OH concentration of 7.5×10⁶ molecules cm-3 following Wang et al. (2020). This approach yields a photochemical age
for our airmasses of 1.5 days for the Suez Canal and 0.28 days for the Arabian Gulf. At a median true wind speed of 3.9 m s-1
(as observed over the Arabian Gulf and over the Suez Canal), this suggests that sources are distant on average by 206 km and
38 km respectively for the Suez Canal and the Arabian Gulf. 330
However, this crude approach to the assessment of remoteness of sources of CH4 excesses in the Arabian Gulf and the Red
Sea is not sufficient on its own and should be compared to tagged transport simulations.
3.4. Tagged tracer simulation of anthropogenic methane
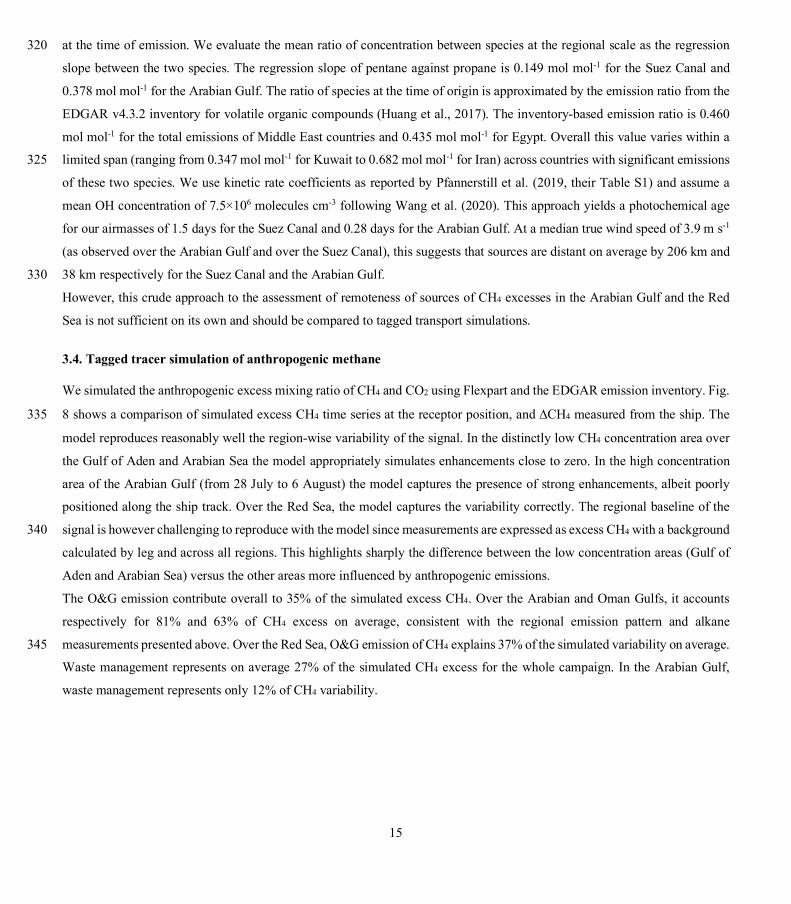
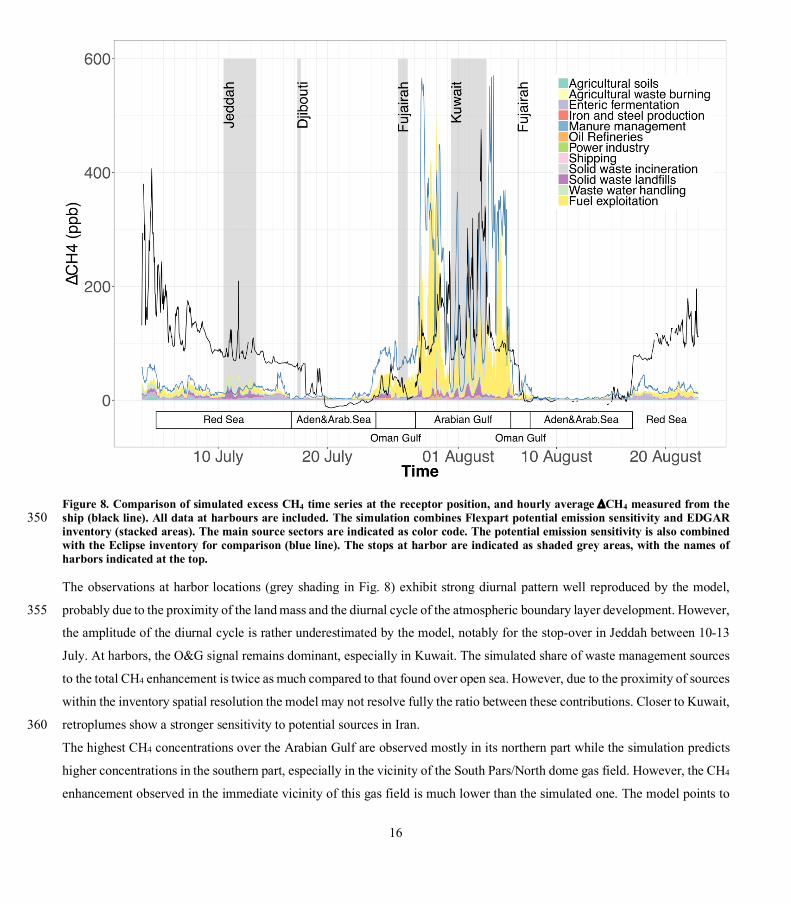
We simulated the anthropogenic excess mixing ratio of CH4 and CO2 using Flexpart and the EDGAR emission inventory. Fig.
8 shows a comparison of simulated excess CH4 time series at the receptor position, and DCH4 measured from the ship. The 335
model reproduces reasonably well the region-wise variability of the signal. In the distinctly low CH4 concentration area over
the Gulf of Aden and Arabian Sea the model appropriately simulates enhancements close to zero. In the high concentration
area of the Arabian Gulf (from 28 July to 6 August) the model captures the presence of strong enhancements, albeit poorly
positioned along the ship track. Over the Red Sea, the model captures the variability correctly. The regional baseline of the
signal is however challenging to reproduce with the model since measurements are expressed as excess CH4 with a background 340
calculated by leg and across all regions. This highlights sharply the difference between the low concentration areas (Gulf of
Aden and Arabian Sea) versus the other areas more influenced by anthropogenic emissions.
The O&G emission contribute overall to 35% of the simulated excess CH4. Over the Arabian and Oman Gulfs, it accounts
respectively for 81% and 63% of CH4 excess on average, consistent with the regional emission pattern and alkane
measurements presented above. Over the Red Sea, O&G emission of CH4 explains 37% of the simulated variability on average. 345
Waste management represents on average 27% of the simulated CH4 excess for the whole campaign. In the Arabian Gulf,
waste management represents only 12% of CH4 variability.
16
Figure 8. Comparison of simulated excess CH4 time series at the receptor position, and hourly average DCH4 measured from the ship (black line). All data at harbours are included. The simulation combines Flexpart potential emission sensitivity and EDGAR 350 inventory (stacked areas). The main source sectors are indicated as color code. The potential emission sensitivity is also combined with the Eclipse inventory for comparison (blue line). The stops at harbor are indicated as shaded grey areas, with the names of harbors indicated at the top.
The observations at harbor locations (grey shading in Fig. 8) exhibit strong diurnal pattern well reproduced by the model,
probably due to the proximity of the land mass and the diurnal cycle of the atmospheric boundary layer development. However, 355
the amplitude of the diurnal cycle is rather underestimated by the model, notably for the stop-over in Jeddah between 10-13
July. At harbors, the O&G signal remains dominant, especially in Kuwait. The simulated share of waste management sources
to the total CH4 enhancement is twice as much compared to that found over open sea. However, due to the proximity of sources
within the inventory spatial resolution the model may not resolve fully the ratio between these contributions. Closer to Kuwait,
retroplumes show a stronger sensitivity to potential sources in Iran. 360
The highest CH4 concentrations over the Arabian Gulf are observed mostly in its northern part while the simulation predicts
higher concentrations in the southern part, especially in the vicinity of the South Pars/North dome gas field. However, the CH4
enhancement observed in the immediate vicinity of this gas field is much lower than the simulated one. The model points to
17
an ‘O&G exploitation’ source type in the Northwestern half of the Arabian Gulf for the strongest CH4 enhancements observed.
In a wide US survey of 8000 facilities, Lyon et al. (2016) found that super-emitter sites were 3 times more frequently associated 365
to oil than the gas assets, and 90% of sources were from tank vents and hatches used in oil storage. Our study would suggest
an underestimation of oil upstream emissions by the inventories, and an overestimation of leak rates in the upstream natural
gas industry.
370
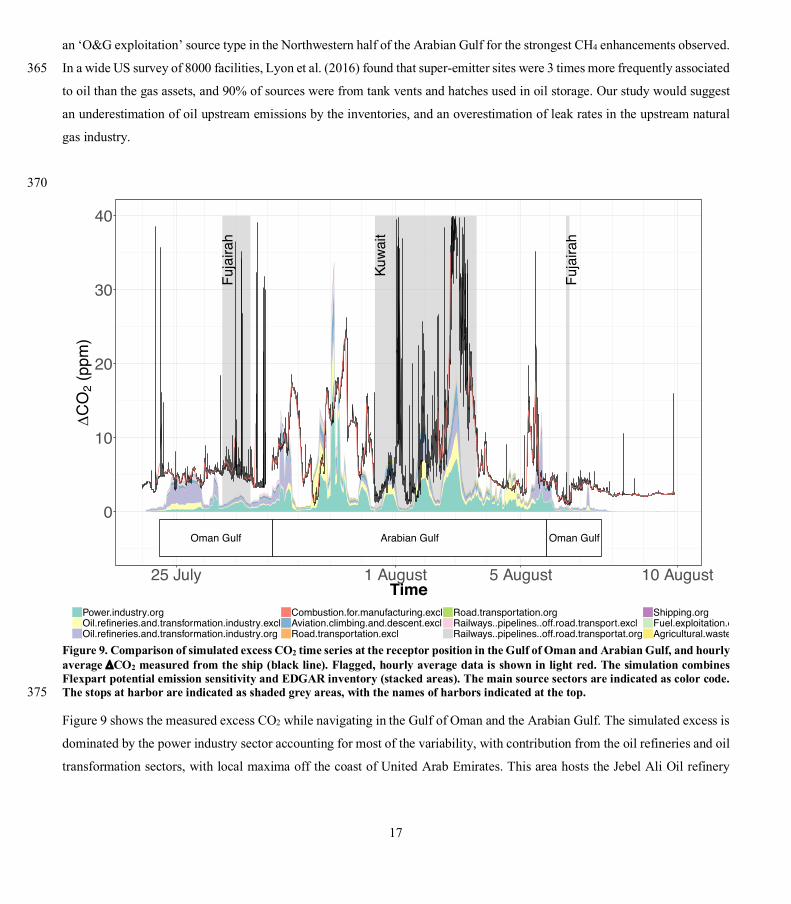
Figure 9. Comparison of simulated excess CO2 time series at the receptor position in the Gulf of Oman and Arabian Gulf, and hourly average DCO2 measured from the ship (black line). Flagged, hourly average data is shown in light red. The simulation combines Flexpart potential emission sensitivity and EDGAR inventory (stacked areas). The main source sectors are indicated as color code. The stops at harbor are indicated as shaded grey areas, with the names of harbors indicated at the top. 375
Figure 9 shows the measured excess CO2 while navigating in the Gulf of Oman and the Arabian Gulf. The simulated excess is
dominated by the power industry sector accounting for most of the variability, with contribution from the oil refineries and oil
transformation sectors, with local maxima off the coast of United Arab Emirates. This area hosts the Jebel Ali Oil refinery
Fuja
irah
Kuwa
it
Fuja
irah
Oman Gulf Arabian Gulf Oman Gulf
0
10
20
30
40
25 July 1 August 5 August 10 AugustTime
DCO
2 (pp
m)
Power.industry.orgOil.refineries.and.transformation.industry.exclOil.refineries.and.transformation.industry.org
Combustion.for.manufacturing.exclAviation.climbing.and.descent.exclRoad.transportation.excl
Road.transportation.orgRailways..pipelines..off.road.transport.exclRailways..pipelines..off.road.transportat.org
Shipping.orgFuel.exploitation.exclAgricultural.waste.burning.org
18
dedicated to the production of liquefied petroleum gas, naphtha and a variety of fuel types as well as, further South, the Takreer
Abu Dhabi Oil Refinery (retrieved from https://www.industryabout.com/arabian-peninsula-industrial-map). 380
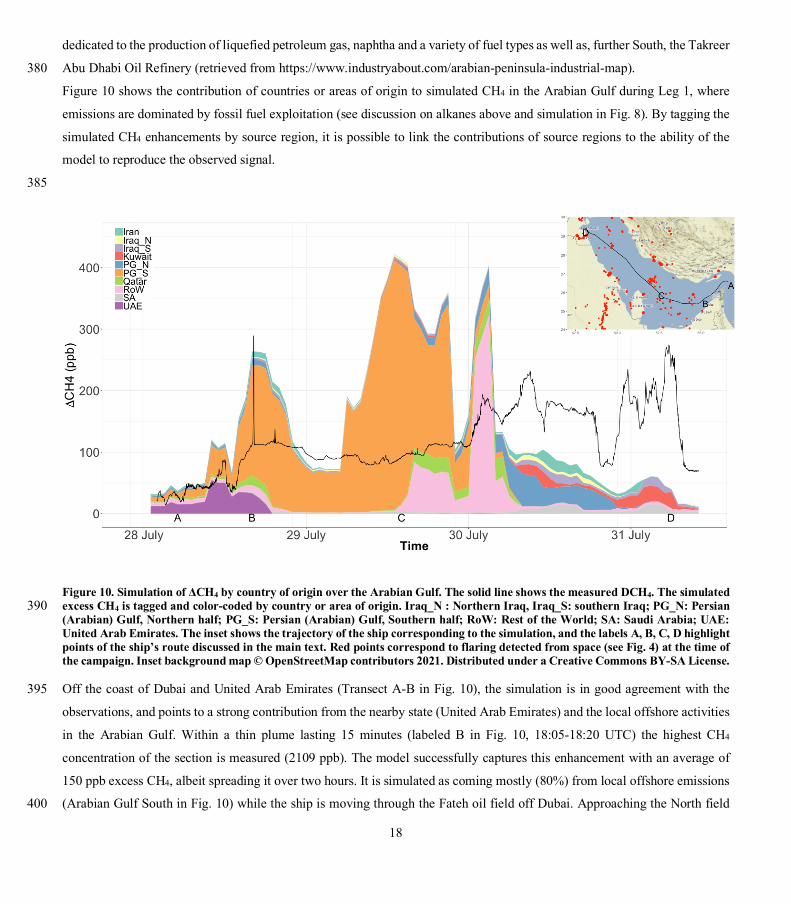
Figure 10 shows the contribution of countries or areas of origin to simulated CH4 in the Arabian Gulf during Leg 1, where
emissions are dominated by fossil fuel exploitation (see discussion on alkanes above and simulation in Fig. 8). By tagging the
simulated CH4 enhancements by source region, it is possible to link the contributions of source regions to the ability of the
model to reproduce the observed signal.
385
Figure 10. Simulation of ΔCH4 by country of origin over the Arabian Gulf. The solid line shows the measured DCH4. The simulated excess CH4 is tagged and color-coded by country or area of origin. Iraq_N : Northern Iraq, Iraq_S: southern Iraq; PG_N: Persian 390 (Arabian) Gulf, Northern half; PG_S: Persian (Arabian) Gulf, Southern half; RoW: Rest of the World; SA: Saudi Arabia; UAE: United Arab Emirates. The inset shows the trajectory of the ship corresponding to the simulation, and the labels A, B, C, D highlight points of the ship’s route discussed in the main text. Red points correspond to flaring detected from space (see Fig. 4) at the time of the campaign. Inset background map © OpenStreetMap contributors 2021. Distributed under a Creative Commons BY-SA License.
Off the coast of Dubai and United Arab Emirates (Transect A-B in Fig. 10), the simulation is in good agreement with the 395
observations, and points to a strong contribution from the nearby state (United Arab Emirates) and the local offshore activities
in the Arabian Gulf. Within a thin plume lasting 15 minutes (labeled B in Fig. 10, 18:05-18:20 UTC) the highest CH4
concentration of the section is measured (2109 ppb). The model successfully captures this enhancement with an average of
150 ppb excess CH4, albeit spreading it over two hours. It is simulated as coming mostly (80%) from local offshore emissions
(Arabian Gulf South in Fig. 10) while the ship is moving through the Fateh oil field off Dubai. Approaching the North field 400
19
off the coast of Qatar (point C, and during 29 July), however, CH4 is strongly overestimated by the model, with simulated
enhancements of more than 400 ppb having no equivalent pattern in the measurement. This strong enhancement is due, in the
model, to local offshore emissions (southern part of the Arabian Gulf) associated to the South Pars/North Dome gas field.
South Pars/North Field is the largest gas field in the world, shared between Iran and Qatar (Conti et al., 2016). In the Northern
part of the Arabian Gulf (transect from C to D) significant CH4 enhancements are measured and the model fails at reproducing 405
these enhancements, although it suggests local emissions (Northern Persian Gulf and Kuwait) are dominant, consistent with
the photochemical age of airmasses (Sect. 3.3).
3.5. Model-data comparison
Can we confirm or verify the inventories based on the measurements? The entire dataset (excluding data flagged as
contaminated and stationary measurements at harbors) has a correlation of r = 0.13. The agreement improves during nighttime 410
with r = 0.22. Overall the simulation represents well the variability of CH4 at the synoptic scale. The first order discrepancies
arise from the difference in background between regions, since here the background used to offset the CH4 measurements is
calculated for the whole campaign. While the measured DCH4 is an excess over a pre-defined background, the simulated excess
CH4 integrate anthropogenic surface sources during 14 days prior to reaching the receptor. Therefore, in order to compare
these two quantities, the mismatch between the boundary conditions of the model (i.e. CH4 of the airmass prior to the 14 days 415
before measurement) and the background defined for the measurement data introduces a varying offset. However, the
simulated time series can be considered as an indication of the geographical or sectoral origin of the observed excess mixing
ratio.
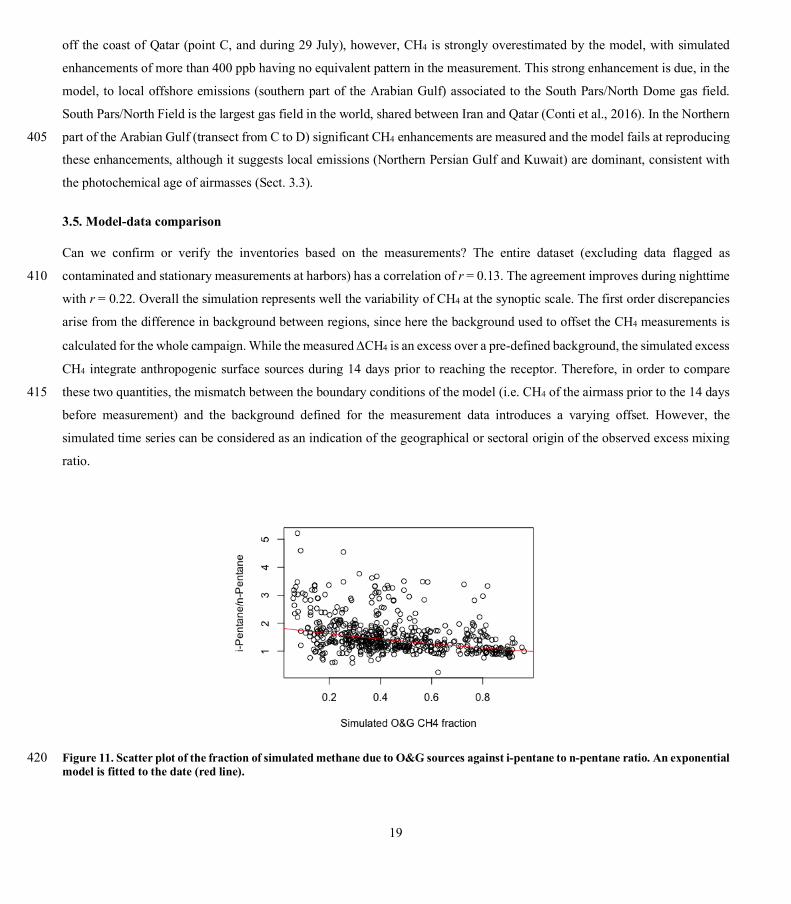
Figure 11. Scatter plot of the fraction of simulated methane due to O&G sources against i-pentane to n-pentane ratio. An exponential 420 model is fitted to the date (red line).
20
Figure 11 provides a comparison of the fractional contribution of O&G exploitation sources to simulated CH4 excess with the
i- to n-pentane ratio (see Sect. 3.2). We find that an exponential decrease model can fit the data with a significant correlation
r = -0.38 (p < 10-16). This exponential model yields an estimated i- to n-pentane ratio of 0.99 when the simulation fraction of
O&G is 100%, whereas absence of O&G exploitation would yield a ratio of 1.84. This confirms that the fraction of emissions 425
linked to O&G exploitation in the model is consistent with our expectations according to the isomeric ratio of pentane
(Bourtsoukidis et al., 2019).
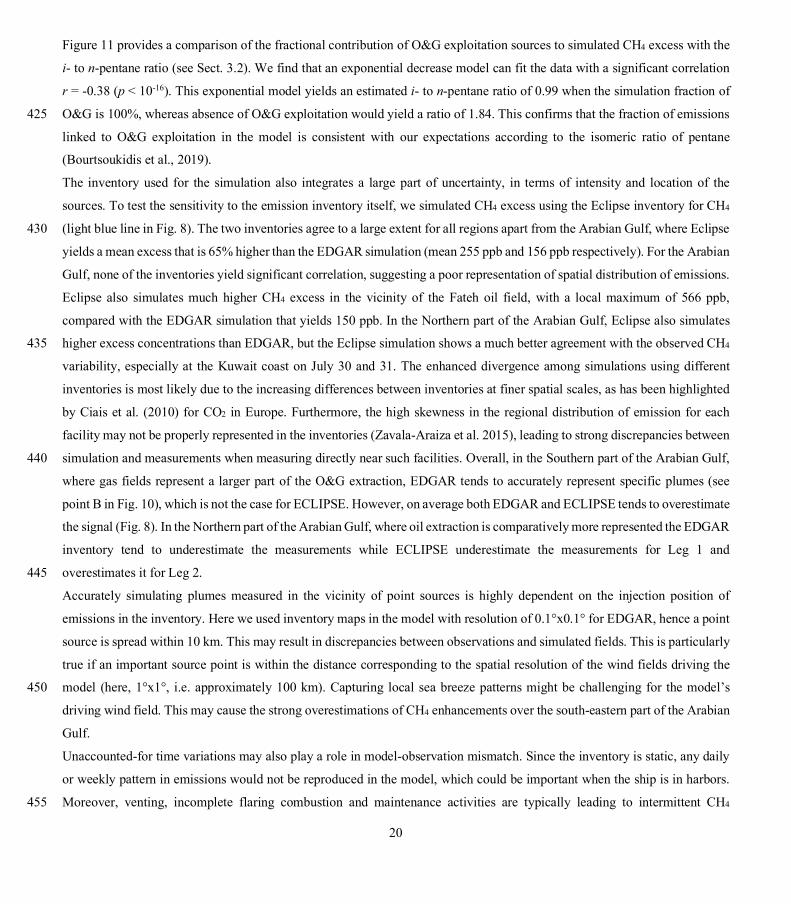
The inventory used for the simulation also integrates a large part of uncertainty, in terms of intensity and location of the
sources. To test the sensitivity to the emission inventory itself, we simulated CH4 excess using the Eclipse inventory for CH4
(light blue line in Fig. 8). The two inventories agree to a large extent for all regions apart from the Arabian Gulf, where Eclipse 430
yields a mean excess that is 65% higher than the EDGAR simulation (mean 255 ppb and 156 ppb respectively). For the Arabian
Gulf, none of the inventories yield significant correlation, suggesting a poor representation of spatial distribution of emissions.
Eclipse also simulates much higher CH4 excess in the vicinity of the Fateh oil field, with a local maximum of 566 ppb,
compared with the EDGAR simulation that yields 150 ppb. In the Northern part of the Arabian Gulf, Eclipse also simulates
higher excess concentrations than EDGAR, but the Eclipse simulation shows a much better agreement with the observed CH4 435
variability, especially at the Kuwait coast on July 30 and 31. The enhanced divergence among simulations using different
inventories is most likely due to the increasing differences between inventories at finer spatial scales, as has been highlighted
by Ciais et al. (2010) for CO2 in Europe. Furthermore, the high skewness in the regional distribution of emission for each
facility may not be properly represented in the inventories (Zavala-Araiza et al. 2015), leading to strong discrepancies between
simulation and measurements when measuring directly near such facilities. Overall, in the Southern part of the Arabian Gulf, 440
where gas fields represent a larger part of the O&G extraction, EDGAR tends to accurately represent specific plumes (see
point B in Fig. 10), which is not the case for ECLIPSE. However, on average both EDGAR and ECLIPSE tends to overestimate
the signal (Fig. 8). In the Northern part of the Arabian Gulf, where oil extraction is comparatively more represented the EDGAR
inventory tend to underestimate the measurements while ECLIPSE underestimate the measurements for Leg 1 and
overestimates it for Leg 2. 445
Accurately simulating plumes measured in the vicinity of point sources is highly dependent on the injection position of
emissions in the inventory. Here we used inventory maps in the model with resolution of 0.1°x0.1° for EDGAR, hence a point
source is spread within 10 km. This may result in discrepancies between observations and simulated fields. This is particularly
true if an important source point is within the distance corresponding to the spatial resolution of the wind fields driving the
model (here, 1°x1°, i.e. approximately 100 km). Capturing local sea breeze patterns might be challenging for the model’s 450
driving wind field. This may cause the strong overestimations of CH4 enhancements over the south-eastern part of the Arabian
Gulf.
Unaccounted-for time variations may also play a role in model-observation mismatch. Since the inventory is static, any daily
or weekly pattern in emissions would not be reproduced in the model, which could be important when the ship is in harbors.
Moreover, venting, incomplete flaring combustion and maintenance activities are typically leading to intermittent CH4 455
21
emission. In a study of black carbon emissions from flaring in Siberia, Petäjä et al. (2020, their Sect. 3.8.2) found that
accounting for actual times of flaring instead of using annual means can significantly improve the simulation of downwind
atmospheric measurements.
Since our study is focusing on anthropogenic emissions and given low natural emissions in the Eastern Mediterranean and
Middle East area (Saunois et al., 2020) we used only anthropogenic inventories in our study. However, some level of sensitivity 460
to natural fluxes can be expected. The CO2 sink would affect concentrations downwind of large forested areas, for example
around the Eastern Mediterranean basin. But biogenic sinks are not likely to play a role in the desert dominated regions of the
Arabian Peninsula.
O&G extraction at the country level varies from year to year, and the life cycle of individual productive fields evolves over
several years. As a result, changes over time of the emission spatial pattern and intensity as reported in inventories for specific 465
years may affect the accuracy of the simulation. Here, our simulation uses the EDGAR inventory for year 2012. Oil production
in the Middle East increased by 10.8% between 2012 and 2017, while gas production increased by 19.2% (Dudley et al., 2019).
According to the most recent available update of the inventory (EDGAR v5.0), O&G emissions have increased by 8.61% for
countries bordering the Arabian Gulf between 2012 and 2015, the latest available year. In order to investigate the potential
evolution of the oil extraction activity the evolution of flaring activity between 2012 and 2017 has been investigated. Flaring 470
data is obtained from VIIRS Skytruth nightlight product (Elvidge et al., 2016) for the Middle East. Flaring has shown a twofold
increase in intensity (in terms of number of hotspots detected from space) over the period, which suggests that the 8.61%
increase in inventory O&G emissions from the neighboring countries is not sufficient to match the increase in extraction
activity. The spatial distribution of the flaring has not varied significantly over the period. In addition to flaws in the inventory
for its base year, accounting for increased activity over the period 2012-2017 would lead to further overestimations between 475
model and observations linked to O&G activity in the Arabian Gulf. This therefore does not contribute to explaining the model
overestimation, especially in the Southern part of the Arabian Gulf.
Conclusion
The AQABA campaign provided a first overview of the regional distribution of CH4 and CO2. Three distinct elements are
identified in the distribution of GHG during the campaign. The Mediterranean is dominated by European emissions. The Gulf 480
of Aden and the Arabian Sea are in an air mass relatively poor in GHG, with air masses originating from Eastern Africa. The
Red Sea and the Oman and Arabian Gulfs showed high CO2 and CH4 concentrations.
The C2H6:CH4 and i-pentane to n-pentane ratios suggest that over the Red Sea, Oman and Arabian Gulfs, CH4 enhancements
are originating from O&G emissions, especially in the latter area. Repeated CH4 enhancements over the Suez Canal, Red Sea,
Arabian Gulf are also unambiguously identified as emitted from local O&G extraction/exploitation (Arabian Gulf). This is 485
clearly supported by a Lagrangian simulation based on the EDGAR inventory, showing that 81% of excess CH4 over the
22
Arabian Gulf is due to the exploitation of O&G. The CO2 variability is dominated in this area by anthropogenic emissions,
with a dominant contribution from the power industry and the oil refining and transformation sectors.
While the model predicts a dominant contribution from O&G exploitation to CH4 enhancements, in agreement with the light
alkanes’ measurements, only weak quantitative agreement has been found between modelled and measured CH4. This is most 490
likely explained by a combination of factors including error in the inventory, poor dilution in the model in the vicinity of the
sources, poor distribution of the point source intensities and lack of representation of temporal variations in emission patterns.
A similar simulation using a different inventory (ECLIPSE) tended to overestimate the measured CH4 close to sources in the
Southern Arabian Gulf. Despite these compounded uncertainties our study provides strong indication that inventories
overestimate part of the regional upstream O&G emissions in middle-eastern countries neighboring the Arabian Gulf, 495
especially linked to gas extraction. On the opposite, in the Northern Arabian Gulf with comparatively more oil fields the
measured methane is generally underestimated by the simulations. Increase in O&G emissions in the Middle East compared
to the reference year of the inventories would further enhance overestimations but could partly explain the underestimation for
the Northern Arabian Gulf area. Our study also shows that the inventories must be improved for the spatial distribution of
emissions in this area whose emissions are dominated by the sector of O&G extraction, transport and transformation. 500
Separating on-shore from off-shore emissions would require a dedicated modelling study investigating local atmospheric
circulation combined with atmospheric composition measurements.
More targeted measurements investigating specifically offshore and onshore extraction sites will enable a better understanding
of the distribution of emission in the area. Assessing emissions from individual wells and processing facilities with dedicated
measurements and combining these estimates at the regional level would be necessary to improve further our knowledge of 505
actual O&G emissions in the Middle East. Combining CH4 and alkane measurements offers the potential to 1) separate the
O&G component of measured CH4 from other sources and 2) to investigate at the regional and local level the fraction of
emissions linked to each phase of O&G value chain, from extraction to end-usage through storage, transport and processing.
Data availability
The data is available on reasonable request directly from the authors. 510
Authors contribution
JDP conceived this study and wrote the manuscript. AR, AB and JDP performed and analysed the Flexpart simulations. EB,
JW and LE did the alkane measurements. JDP and MD did the greenhouse gas measurements. IT provided complementary
data. HH was the chief of mission. JL was the PI of the campaign. All contributed to the manuscript.
23
Competing interests 515
The authors declare that they have no conflict of interest.
Acknowledgements
Max Planck Institute for Chemie, Mainz, organized the AQABA campaign and chartered the ship. Thanks to Marcel Dorf,
Dieter Scharffe, Charlotte Beall, Claus Koeppel, and many other participants to the cruise for their crucial contribution. Jean
Sciare enabled the presence of our measurements during the campaign. Olivier Laurent, Céline Lett and Laurence Vialettes 520
(ICOS teams at LSCE) were key contributors in designing and implementing the measurement setup. Thanks to Hays Ships
and the R/V Kommandor Iona crew for their successful and friendly implementation of the cruise. We acknowledge the
EMME-CARE project from the European Union’s Horizon 2020 Research and Innovation Programme (grant agreement No.
856612), as well as matching co-funding by the Government of the Republic of Cyprus.
References 525
Alvarez, R. A., Zavala-Araiza, D., Lyon, D. R., Allen, D. T., Barkley, Z. R., Brandt, A. R., Davis, K. J., Herndon, S. C., Jacob,
D. J., Karion, A., Kort, E. A., Lamb, B. K., Lauvaux, T., Maasakkers, J. D., Marchese, A. J., Omara, M., Pacala, S. W., Peischl,
J., Robinson, A. L., Shepson, P. B., Sweeney, C., Townsend-Small, A., Wofsy, S. C., and Hamburg, S. P.: Assessment of
methane emissions from the U.S. oil and gas supply chain, Science, 361, 186–188, https://doi.org/10.1126/science.aar7204,
2018. 530
Assan, S., Baudic, A., Guemri, A., Ciais, P., Gros, V., and Vogel, F. R.: Characterization of interferences to in situ observations
of δ13CH4 and C2H6 when using a cavity ring-down spectrometer at industrial sites, Atmos. Meas. Tech., 10, 2077–2091,
https://doi.org/10.5194/amt-10-2077-2017, 2017.
Berchet, A., Pison, I., Crill, P. M., Thornton, B., Bousquet, P., Thonat, T., Hocking, T., Thanwerdas, J., Paris, J.-D., and
Saunois, M.: Using ship-borne observations of methane isotopic ratio in the Arctic Ocean to understand methane sources in 535
the Arctic, Atmos. Chem. Phys., 20, 3987–3998, https://doi.org/10.5194/acp-20-3987-2020, 2020.
Bourtsoukidis, E., Ernle, L., Crowley, J. N., Lelieveld, J., Paris, J.-D., Pozzer, A., Walter, D., and Williams, J.: Non-methane
hydrocarbon (C2–C8) sources and sinks around the Arabian Peninsula, Atmos. Chem. Phys., 19, 7209–7232,
https://doi.org/10.5194/acp-19-7209-2019, 2019.
Bourtsoukidis, E., Pozzer, A., Sattler, T., V. N. Matthaios, L. Ernle, A. Edtbauer, H. Fischer, T. Könemann, S. Osipov, J.-D. 540
Paris, E. Y. Pfannerstill, C. Stönner, I. Tadic, D. Walter, N. Wang, J. Lelieveld & J. Williams, The Red Sea Deep Water is a
potent source of atmospheric ethane and propane. Nat. Commun. 11, 447 (2020). https://doi.org/10.1038/s41467-020-14375-
0
24
Celik, S., Drewnick, F., Fachinger, F., Brooks, J., Darbyshire, E., Coe, H., Paris, J.-D., Eger, P. G., Schuladen, J., Tadic, I.,
Friedrich, N., Dienhart, D., Hottmann, B., Fischer, H., Crowley, J. N., Harder, H., and Borrmann, S.: Influence of vessel 545
characteristics and atmospheric processes on the gas and particle phase of ship emission plumes: in situ measurements in the
Mediterranean Sea and around the Arabian Peninsula, Atmos. Chem. Phys., 20, 4713–4734, https://doi.org/10.5194/acp-20-
4713-2020, 2020.
Ciais, P., Paris, J. D., Marland, G., Peylin, P., Piao, S. L., Levin, I., Pregger, T., Scholz, Y., Friedrich, R., Rivier, L.,
Houwelling, S., Schulze, E. D., and members of the CARBOEUROPE synthesis team: The European carbon balance, Part 1: 550
fossil fuel emissions, Global Change Biol., 16, 1395–1408, 2010.
Conti, J., Holtberg, P., Diefenderfer, J., LaRose, A., Turnure, J. T., and Westfall, L. International Energy Outlook 2016 With
Projections to 2040. United States: N. p., doi:10.2172/1296780, 2016.
Dlugokencky, E. and Tans, P.: Trends in atmospheric carbon dioxide, National Oceanic & Atmospheric Administration, Earth
System Research Laboratory (NOAA/ESRL), available at: http:// www.esrl.noaa.gov/gmd/ccgg/trends/global.html, last 555
accessed: 26 July 2018.
Dudley, B.: Statistical Review of World Energy 68th Edition; Technical Report; BP p.l.c.: London, UK, 2019.
Elvidge, C.D., Zhizhin, M., Baugh, K., Hsu, F.-C., Ghosh, T. Methods for Global Survey of Natural Gas Flaring from Visible
Infrared Imaging Radiometer Suite Data. Energies 9, 14, 2016.
Etiope, G. & Ciccioli, P. Earth's Degassing: A Missing Ethane and Propane Source. Science 323, 459 478-478, 560
doi.org/10.1126/science.1165904, 2009.
Friedlingstein, P., Jones, M. W., O'Sullivan, M., Andrew, R. M., Hauck, J., Peters, G. P., Peters, W., Pongratz, J., Sitch, S., Le
Quéré, C., Bakker, D. C. E., Canadell, J. G., Ciais, P., Jackson, R. B., Anthoni, P., Barbero, L., Bastos, A., Bastrikov, V.,
Becker, M., Bopp, L., Buitenhuis, E., Chandra, N., Chevallier, F., Chini, L. P., Currie, K. I., Feely, R. A., Gehlen, M., Gilfillan,
D., Gkritzalis, T., Goll, D. S., Gruber, N., Gutekunst, S., Harris, I., Haverd, V., Houghton, R. A., Hurtt, G., Ilyina, T., Jain, A. 565
K., Joetzjer, E., Kaplan, J. O., Kato, E., Klein Goldewijk, K., Korsbakken, J. I., Landschützer, P., Lauvset, S. K., Lefèvre, N.,
Lenton, A., Lienert, S., Lombardozzi, D., Marland, G., McGuire, P. C., Melton, J. R., Metzl, N., Munro, D. R., Nabel, J. E. M.
S., Nakaoka, S.-I., Neill, C., Omar, A. M., Ono, T., Peregon, A., Pierrot, D., Poulter, B., Rehder, G., Resplandy, L., Robertson,
E., Rödenbeck, C., Séférian, R., Schwinger, J., Smith, N., Tans, P. P., Tian, H., Tilbrook, B., Tubiello, F. N., van der Werf, G.
R., Wiltshire, A. J., and Zaehle, S.: Global Carbon Budget 2019, Earth Syst. Sci. Data, 11, 1783–1838, 570
https://doi.org/10.5194/essd-11-1783-2019, 2019.
GIE-MARCOGAZ, Potential ways the gas industry can contribute to the reduction of methane emissions, Report for the
Madrid Forum, 5-6 June 2019. https://www.gie.eu/index.php/gie-publications/methane-emission-report-2019/27786-gie-
marcogaz-report-for-the-madrid-forum-potential-way-gas-industry-can-contribute-to-the-reduction-of-methane-
emissions/file 575
Gilman, J. B., Lerner, B. M., Kuster, W. C., and de Gouw, J. A.: Source Signature of Volatile Organic Compounds from Oil
and Natural Gas Operations in Northeastern Colorado, Environ. Sci. Technol., 47, 1297-1305, 10.1021/es304119a, 2013.
25
Hazan, L., Tarniewicz, J., Ramonet, M., Laurent, O., & Abbaris, A. (2016). Automatic processing of atmospheric CO 2 and
CH 4 mole fractions at the ICOS Atmosphere Thematic Centre. Atmospheric Measurement Techniques, 9(9), 4719-4736.
Helfter, C., Mullinger, N., Vieno, M., O'Doherty, S., Ramonet, M., Palmer, P. I., and Nemitz, E.: Country-scale greenhouse 580
gas budgets using shipborne measurements: a case study for the UK and Ireland, Atmos. Chem. Phys., 19, 3043–3063,
https://doi.org/10.5194/acp-19-3043-2019, 2019.
Höglund-Isaksson, L.: Global anthropogenic methane emissions 2005–2030: technical mitigation potentials and costs, Atmos.
Chem. Phys., 12, 9079–9096, https://doi.org/10.5194/acp-12-9079-2012, 2012.
Huang, G., Brook, R., Crippa, M., Janssens-Maenhout, G., Schieberle, C., Dore, C., Guizzardi, D., Muntean, M., Schaaf, E., 585
and Friedrich, R.: Speciation of anthropogenic emissions of non-methane volatile organic compounds: a global gridded data
set for 1970–2012, Atmos. Chem. Phys., 17, 7683–7701, https://doi.org/10.5194/acp-17-7683-2017, 2017.
IEA, Methane Tracker 2020, IEA, Paris https://www.iea.org/reports/methane-tracker-2020, 2020.
Jackson R B, Friedlingstein P, Andrew R M, Canadell J G, Le Quéré C and Peters G P Persistent fossil fuel growth threatens
the Paris Agreement and planetary health, Environ. Res. Lett. 14 121001, 2019. 590
Jackson, R. B., Saunois, M., Bousquet, P., Canadell, J. G., Poulter, B., Stavert, A. R., Bergamaschi, P., Niwa, Y., Segers, A.,
and Tsuruta, A.: Increasing anthropogenic methane emissions arise equally from agricultural and fossil fuel sources, Environ.
Res. Lett., 15, 071002, https://doi.org/10.1088/1748-9326/ab9ed2, 2020.
Janssens-Maenhout, G., Crippa, M., Guizzardi, D., Muntean, M., Schaaf, E., Olivier, J.G.J., Peters, J.A.H.W., Schure, K.M.,
Fossil CO2 and GHG emissions of all world countries, EUR 28766 EN, Publications Office of the European Union, 595
Luxembourg, ISBN 978-92-79-73207-2, doi:10.2760/709792, JRC107877, 2017.
Janssens-Maenhout, G., Crippa, M., Guizzardi, D., Muntean, M., Schaaf, E., Dentener, F., Bergamaschi, P., Pagliari, V.,
Olivier, J. G. J., Peters, J. A. H. W., van Aardenne, J. A., Monni, S., Doering, U., Petrescu, A. M. R., Solazzo, E., and Oreggioni,
G. D.: EDGAR v4.3.2 Global Atlas of the three major greenhouse gas emissions for the period 1970–2012, Earth Syst. Sci.
Data, 11, 959–1002, https://doi.org/10.5194/essd-11-959-2019, 2019. 600
Jones, A., J.M. Haywood, and C.D. Jones, 2018: Can reducing black carbon and methane below RCP2.6 levels keep global
warming below 1.5 °C? Atmos. Sci. Letters, doi:10.1002/asl.821.
Lelieveld, J., Hadjinocolaou, P., Kostopoulou, E., Chenoweth, J., El Maayar, M., Giannakopoulos, C., Hannides, C., Langa,
M.A., Tanarhte, M., Tyrlis, E., Xoplaki, E., Climate change and impacts in the eastern Mediterranean and Middle East. Clim.
Change 114, 667–687, 2012. 605
Lelieveld, J., Berresheim, H., Borrmann, S., Crutzen, P. J., Dentener, F. J., Fischer, H., Feichter, J., Flatau, P. J., Heland, J.,
Holzinger, R., Korrmann, R., Lawrence, M. G., Levin, Z., Markowicz, K. M., Mihalopoulos, N., Minikin, A., Ramanathan,
V., de Reus, M., Roelofs, G. J., Scheeren, H. A., Sciare, J., Schlager, H., Schultz, M., Siegmund, P., Steil, B., Stephanou, E.
G., Stier, P., Traub, M., Warneke, C., Williams, J., and Ziereis, H.: Global air pollution crossroads over the Mediterranean,
Science, 298, 794–799, doi:10.1126/science.1075457, 2002. 610
26
Lowry, D., R. E. Fisher, J. L. France, M. Coleman, M. Lanoisellé, G. Zazzeri, E. G. Nisbet, J. T. Shaw, G. Allen, J. Pitt, R. S.
Ward, Environmental baseline monitoring for shale gas development in the UK: Identification and geochemical
characterization of local source emissions of methane to atmosphere, Sci. Total Env., 708, 134600,
https://doi.org/10.1016/j.scitotenv.2019.134600, 2020.
Lyon, D. R., Alvarez, R. A., Zavala-Araiza, D., Brandt, A. R., Jack- son, R. B., and Hamburg, S. P.: Aerial Surveys of Elevated 615
Hydrocarbon Emissions from Oil and Gas Production Sites, Environ. Sci. Technol., 50, 4877–4886,
doi:10.1021/acs.est.6b00705, 2016.
McNorton, J., Wilson, C., Gloor, M., Parker, R. J., Boesch, H., Feng, W., Hossaini, R., and Chipperfield, M. P.: Attribution of
recent increases in atmospheric methane through 3-D inverse modelling, Atmos. Chem. Phys., 18, 18149–18168,
https://doi.org/10.5194/acp-18-18149-2018, 2018. 620
Nisbet, E. G., Fisher, R. E., Lowry, D., France, J. L., Allen, G., Bakkaloglu, S., T. J. Broderick, M. Cain, M. Coleman, J.
Fernandez1, G. Forster, P. T. Griffiths, C. P. Iverach, B. F. J. Kelly, M. R. Manning, P. B. R. Nisbet-Jones, J. A. Pyle, A.
Townsend-Small, A. al-Shalaan, N. Warwick, and G. Zazzeri. Methane mitigation: methods to reduce emissions, on the path
to the Paris agreement. Rev. Geophys., 58, e2019RG000675. doi.org/10.1029/2019RG000675, 2020
OPEC, Annual statistical bulletin, 2020. https://asb.opec.org/index.html. Accessed 9 december 2020. 625
Petäjä, T., Duplissy, E.-M., Tabakova, K., Schmale, J., Altstädter, B., Ancellet, G., Arshinov, M., Balin, Y., Baltensperger, U.,
Bange, J., Beamish, A., Belan, B., Berchet, A., Bossi, R., Cairns, W. R. L., Ebinghaus, R., El Haddad, I., Ferreira-Araujo, B.,
Franck, A., Huang, L., Hyvärinen, A., Humbert, A., Kalogridis, A.-C., Konstantinov, P., Lampert, A., MacLeod, M., Magand,
O., Mahura, A., Marelle, L., Masloboev, V., Moisseev, D., Moschos, V., Neckel, N., Onishi, T., Osterwalder, S., Ovaska, A.,
Paasonen, P., Panchenko, M., Pankratov, F., Pernov, J. B., Platis, A., Popovicheva, O., Raut, J.-C., Riandet, A., Sachs, T., 630
Salvatori, R., Salzano, R., Schröder, L., Schön, M., Shevchenko, V., Skov, H., Sonke, J. E., Spolaor, A., Stathopoulos, V. K.,
Strahlendorff, M., Thomas, J. L., Vitale, V., Vratolis, S., Barbante, C., Chabrillat, S., Dommergue, A., Eleftheriadis, K.,
Heilimo, J., Law, K. S., Massling, A., Noe, S. M., Paris, J.-D., Prévôt, A. S. H., Riipinen, I., Wehner, B., Xie, Z., and
Lappalainen, H. K.: Overview: Integrative and Comprehensive Understanding on Polar Environments (iCUPE) – concept and
initial results, Atmos. Chem. Phys., 20, 8551–8592, https://doi.org/10.5194/acp-20-8551-2020, 2020. 635
Peters, G. P., Davis, S. J., and Andrew, R.: A synthesis of carbon in international trade, Biogeosciences, 9, 3247–3276,
https://doi.org/10.5194/bg-9-3247-2012, 2012.
Parrish, D. D., Stohl, A., Forster, C., Atlas, E. L., Blake, D. R., Goldan, P. D., Kuster, W. C., and de Gouw, J. A.: Effects of
mixing on evolution of hydrocarbon ratios in the troposphere, J. Geophys. Res., 112, D10S34, doi:10.1029/2006JD007584,
2007. 640
Pfannerstill, E. Y., Wang, N., Edtbauer, A., Bourtsoukidis, E., Crowley, J. N., Dienhart, D., Eger, P. G., Ernle, L., Fischer, H.,
Hottmann, B., Paris, J.-D., Stönner, C., Tadic, I., Walter, D., Lelieveld, J., and Williams, J.: Shipborne measurements of total
OH reactivity around the Arabian Peninsula and its role in ozone chemistry, Atmos. Chem. Phys., 19, 11501–11523,
https://doi.org/10.5194/acp-19-11501-2019, 2019.
27
Pisso, I., Sollum, E., Grythe, H., Kristiansen, N. I., Cassiani, M., Eckhardt, S., Arnold, D., Morton, D., Thompson, R. L., Groot 645
Zwaaftink, C. D., Evangeliou, N., Sodemann, H., Haimberger, L., Henne, S., Brunner, D., Burkhart, J. F., Fouilloux, A.,
Brioude, J., Philipp, A., Seibert, P., and Stohl, A.: The Lagrangian particle dispersion model FLEXPART version 10.4, Geosci.
Model Dev., 12, 4955–4997, https://doi.org/10.5194/gmd-12-4955-2019, 2019.
Purvis, R. M., Lewis, A. C., Carney, R. A., McQuaid, J. B., Arnold, S. R., Methven, J., Barjat, H., Dewey, K., Kent, J., Monks,
P. S., Carpenter, L. J., Brough, N., Penkett, S. A., and Reeves, C. E.: Rapid uplift of nonmethane hydrocarbons in a cold front 650
over central Europe, J. Geophys. Res.-Atmos., 108, 4224, doi:10.1029/2002JD002521, 2003.
Ramonet, M., Ciais, P., Aalto, T., Aulagnier, C., Chevallier, F., Cipriano, D., Conway, T., Haszpra, L., Kazan, V., Meinhardt,
F., Paris, J.-D., Schmid, M., Simmonds, P., Xueref-Rémy, I., and Necki, J.: A recent build-up of atmospheric CO2 over Europe.
Part 1: observed signals and possible explanations, Tellus B, 62, 1–13, https://doi.org/10.1111/j.1600-0889.2009.00442.x,
2010. 655
Reddy, C. M., Arey, J. S., Seewald, J. S., Sylva, S. P., Lemkau, K. L., Nelson, R. K., Carmichael, C. A., McIntyre, C. P.,
Fenwick, J., Ventura, G. T., van Mooy, B. A. S., & Camilli, R. Composition and fate of gas and oil released to the water
column during the Deepwater Horizon oil spill, Proc. Nat. Acad. Sci., 109(50), 20,229–20,234, doi:10.1073/pnas.1101242108,
2012.
Rella, C. W., Hoffnagle, J., He, Y., and Tajima, S.: Local- and regional-scale measurements of CH4, 13CH4, and C2H6 in the 660
Uintah Basin using a mobile stable isotope analyzer, Atmos. Meas. Tech., 8, 4539–4559, https://doi.org/10.5194/amt-8-4539-
2015, 2015.
Ricaud, P., Zbinden, R., Catoire, V., Brocchi, V., Dulac, F., Hamonou, E., Canonici, J., El Amraoui, L., Massart, S., Piguet,
B., Dayan, U., Nabat, P., Sciare, J., Ramonet, M., Delmotte, M., di Sarra, A., Sferlazzo, D., Di Iorio, T., Piacentino, S.,
Cristofanelli, P., Mihalopoulos, N., Kouvarakis, G., Pikridas, M., Savvides, C., Mamouri, R.-E., Nisantzi, A., Hadjimitsis, D., 665
Attié, J.-L., Ferré, H., Kangah, Y., Jaidan, N., Guth, J., Jacquet, P., Jaidan, J., Guth, P., Robert, C., Bourdon, A., Bourdinot,
J.-F., Etienne, J.-C., Krysztofiak, G., Theron, P., Chevrier, S., The GLAM airborne campaign across the Mediterranean Basin.
Bull. Am. Met. Soc. 99.2 (2018): 361-380. doi:10.1175/BAMS-D-16-0226.1, 2018.
Rogelj J. et al., Chapter 2: Mitigation pathways compatible with 1.5°C in the context of sustainable development in Global
Warming of 1.5 °C, 2018, in Global Warming of 1.5 °C. http://ipcc.ch/report/sr15/ 670
Saunois, M., Bousquet, P., Poulter, B., Peregon, A., Ciais, P., Canadell, J. G., Dlugokencky, E. J., Etiope, G., Bastviken, D.,
Houweling, S., Janssens-Maenhout, G., Tubiello, F. N., Castaldi, S., Jackson, R. B., Alexe, M., Arora, V. K., Beerling, D. J.,
Bergamaschi, P., Blake, D. R., Brailsford, G., Bruhwiler, L., Crevoisier, C., Crill, P., Covey, K., Frankenberg, C., Gedney, N.,
Höglund-Isaksson, L., Ishizawa, M., Ito, A., Joos, F., Kim, H.-S., Kleinen, T., Krummel, P., Lamarque, J.-F., Langenfelds, R.,
Locatelli, R., Machida, T., Maksyutov, S., Melton, J. R., Morino, I., Naik, V., O'Doherty, S., Parmentier, F.-J. W., Patra, P. 675
K., Peng, C., Peng, S., Peters, G. P., Pison, I., Prinn, R., Ramonet, M., Riley, W. J., Saito, M., Santini, M., Schroeder, R.,
Simpson, I. J., Spahni, R., Takizawa, A., Thornton, B. F., Tian, H., Tohjima, Y., Viovy, N., Voulgarakis, A., Weiss, R., Wilton,
D. J., Wiltshire, A., Worthy, D., Wunch, D., Xu, X., Yoshida, Y., Zhang, B., Zhang, Z., and Zhu, Q.: Variability and quasi-
28
decadal changes in the methane budget over the period 2000–2012, Atmos. Chem. Phys., 17, 11135–11161,
https://doi.org/10.5194/acp-17-11135-2017, 2017. 680
Saunois, M., Stavert, A. R., Poulter, B., Bousquet, P., Canadell, J. G., Jackson, R. B., Raymond, P. A., Dlugokencky, E. J.,
Houweling, S., Patra, P. K., Ciais, P., Arora, V. K., Bastviken, D., Bergamaschi, P., Blake, D. R., Brailsford, G., Bruhwiler,
L., Carlson, K. M., Carrol, M., Castaldi, S., Chandra, N., Crevoisier, C., Crill, P. M., Covey, K., Curry, C. L., Etiope, G.,
Frankenberg, C., Gedney, N., Hegglin, M. I., Höglund-Isaksson, L., Hugelius, G., Ishizawa, M., Ito, A., Janssens-Maenhout,
G., Jensen, K. M., Joos, F., Kleinen, T., Krummel, P. B., Langenfelds, R. L., Laruelle, G. G., Liu, L., Machida, T., Maksyutov, 685
S., McDonald, K. C., McNorton, J., Miller, P. A., Melton, J. R., Morino, I., Müller, J., Murguia-Flores, F., Naik, V., Niwa, Y.,
Noce, S., O'Doherty, S., Parker, R. J., Peng, C., Peng, S., Peters, G. P., Prigent, C., Prinn, R., Ramonet, M., Regnier, P., Riley,
W. J., Rosentreter, J. A., Segers, A., Simpson, I. J., Shi, H., Smith, S. J., Steele, L. P., Thornton, B. F., Tian, H., Tohjima, Y.,
Tubiello, F. N., Tsuruta, A., Viovy, N., Voulgarakis, A., Weber, T. S., van Weele, M., van der Werf, G. R., Weiss, R. F.,
Worthy, D., Wunch, D., Yin, Y., Yoshida, Y., Zhang, W., Zhang, Z., Zhao, Y., Zheng, B., Zhu, Q., Zhu, Q., and Zhuang, Q.: 690
The Global Methane Budget 2000–2017, Earth Syst. Sci. Data, 12, 1561–1623, https://doi.org/10.5194/essd-12-1561-2020,
2020.
Seibert, P. and Frank, A.: Source-receptor matrix calculation with a Lagrangian particle dispersion model in backward mode,
Atmos. Chem. Phys., 4, 51–63, https://doi.org/10.5194/acp-4-51-2004, 2004.
Schwietzke, S., Sherwood, O. A., Bruhwiler, L. M. P., Miller, J. B., Etiope, G., Dlugokencky, E. J., Michel, S. E., Arling, V. 695
A., Vaughn, B. H., White, J. W. C., and Tans, P. P.: Upward revision of global fossil fuel methane emissions based on isotope
database, Nature, 538, 88–91, https://doi.org/10.1038/nature19797, 2016.
Simpson, I. J., Sulbaek Andersen, M. P., Meinardi, S., Bruhwiler, L., Blake, N. J., Helmig, D., Rowland, F. S., and Blake, D.
R.: Long-term decline of global atmospheric ethane concentrations and implications for methane, Nature, 488, 490–494,
doi:10.1038/nature11342, 2012. 700
Tadic, I., Crowley, J. N., Dienhart, D., Eger, P., Harder, H., Hottmann, B., Martinez, M., Parchatka, U., Paris, J.-D., Pozzer,
A., Rohloff, R., Schuladen, J., Shenolikar, J., Tauer, S., Lelieveld, J., and Fischer, H.: Net ozone production and its relationship
to nitrogen oxides and volatile organic compounds in the marine boundary layer around the Arabian Peninsula, Atmos. Chem.
Phys., 20, 6769–6787, https://doi.org/10.5194/acp-20-6769-2020, 2020.
Wang, N., Edtbauer, A., Stönner, C., Pozzer, A., Bourtsoukidis, E., Ernle, L., Dienhart, D., Hottmann, B., Fischer, H., 705
Schuladen, J., Crowley, J. N., Paris, J.-D., Lelieveld, J., and Williams, J.: Measurements of carbonyl compounds around the
Arabian Peninsula: overview and model comparison, Atmos. Chem. Phys., 20, 10807–10829, https://doi.org/10.5194/acp-20-
10807-2020, 2020.
Whiticar, M. Correlation of Natural Gases with Their Sources. In The Petroleum System – From Source to Trap; Magoon, L.
B., Dow, W. G., Eds.; AAPG; pp 261−283, 1994. 710
Yacovitch, T. I., Daube, C., & Herndon, S. C., Methane emissions from offshore oil and gas platforms in the Gulf of
Mexico. Environmental Science & Technology, 54(6), 3530-3538. https://dx.doi.org/10.1021/acs.est.9b07148, 2020.
29
Yang, E. G., Kort, E. A., Wu, D., Lin, J. C., Oda, T., Ye, X., & Lauvaux, T.: Using space-based observations and Lagrangian
modeling to evaluate urban carbon dioxide emissions in the Middle East. J. Geophys. Res., 125, e2019JD031922.
https://doi.org/10.1029/2019JD031922, 2020. 715
Yver Kwok, C., Laurent, O., Guemri, A., Philippon, C., Wastine, B., Rella, C. W., Vuillemin, C., Truong, F., Delmotte, M.,
Kazan, V., Darding, M., Lebègue, B., Kaiser, C., Xueref-Rémy, I., and Ramonet, M.: Comprehensive laboratory and field
testing of cavity ring-down spectroscopy analyzers measuring H2O, CO2, CH4 and CO, Atmos. Meas. Tech., 8, 3867–3892,
https://doi.org/10.5194/amt-8-3867-2015, 2015.
Zavala-Araiza, D., Lyon, D. R., Alvarez, R. A., Davis, K. J., Harriss, R., Herndon, S. C., Karion, A., Kort, E. A., Lamb, B. K., 720
Lan, X., Marchese, A. J., Pacala, S. W., Robinson, A. L., Shepson, P. B., Sweeney, C., Talbot, R., Townsend-Small, A.,
Yacovitch, T. I., Zimmerle, D. J., and Hamburg, S. P.: Reconciling divergent estimates of oil and gas methane emissions, P.
Natl. Acad. Sci. USA, 112, 15597–15602, doi:10.1073/pnas.1522126112, 2015.
Zhang, F., Chen, Y., Tian, C., Lou, D., Li, J., Zhang, G., and Matthias, V.: Emission factors for gaseous and particulate
pollutants from offshore diesel engine vessels in China, Atmos. Chem. Phys., 16, 6319-6334, https://doi.org/10.5194/acp-16-725
6319-2016, 2016.


![Puschkin und Tiflis: Kaukasische Spuren (preprint) [Pushkin and Tbilisi: Caucasian Traces (preprint)]](https://static.fdokumen.com/doc/165x107/6315cc26511772fe45108470/puschkin-und-tiflis-kaukasische-spuren-preprint-pushkin-and-tbilisi-caucasian.jpg)