Archaea in the Gulf of Aqaba: Archaea in the Gulf of Aqaba
15
See discussions, stats, and author profiles for this publication at: https://www.researchgate.net/publication/26653295 Archaea in the Gulf of Aqaba Article in FEMS Microbiology Ecology · August 2009 DOI: 10.1111/j.1574-6941.2009.00721.x · Source: PubMed CITATIONS 21 READS 56 10 authors, including: Some of the authors of this publication are also working on these related projects: Bridging in Biodiversity (BIBS; http://www.bbib.org/bibs-project.html) part of Berlin Brandenburg Institute of Biodiversity (http://www.bbib.org/) View project Branko Rihtman The University of Warwick 13 PUBLICATIONS 31 CITATIONS SEE PROFILE Lena Hazanov Technion - Israel Institute of Technology 3 PUBLICATIONS 31 CITATIONS SEE PROFILE Anton F Post Marine Biological Laboratory 103 PUBLICATIONS 5,066 CITATIONS SEE PROFILE All content following this page was uploaded by Branko Rihtman on 01 December 2016. The user has requested enhancement of the downloaded file. All in-text references underlined in blue are linked to publications on ResearchGate, letting you access and read them immediately.
Transcript of Archaea in the Gulf of Aqaba: Archaea in the Gulf of Aqaba

Seediscussions,stats,andauthorprofilesforthispublicationat:https://www.researchgate.net/publication/26653295
ArchaeaintheGulfofAqaba
ArticleinFEMSMicrobiologyEcology·August2009
DOI:10.1111/j.1574-6941.2009.00721.x·Source:PubMed
CITATIONS
21
READS
56
10authors,including:
Someoftheauthorsofthispublicationarealsoworkingontheserelatedprojects:
BridginginBiodiversity(BIBS;http://www.bbib.org/bibs-project.html)partofBerlinBrandenburg
InstituteofBiodiversity(http://www.bbib.org/)Viewproject
BrankoRihtman
TheUniversityofWarwick
13PUBLICATIONS31CITATIONS
SEEPROFILE
LenaHazanov
Technion-IsraelInstituteofTechnology
3PUBLICATIONS31CITATIONS
SEEPROFILE
AntonFPost
MarineBiologicalLaboratory
103PUBLICATIONS5,066CITATIONS
SEEPROFILE
AllcontentfollowingthispagewasuploadedbyBrankoRihtmanon01December2016.
Theuserhasrequestedenhancementofthedownloadedfile.Allin-textreferencesunderlinedinbluearelinkedtopublicationsonResearchGate,lettingyouaccessandreadthemimmediately.

R E S E A R C H A R T I C L E
Archaea in theGulfofAqabaDanny Ionescu1,2, Sigrid Penno1,6, Maya Haimovich1, Branko Rihtman1, Aram Goodwin3, DanielSchwartz4, Lena Hazanov5,6, Mark Chernihovsky1,6, Anton F. Post1,6 & Aharon Oren1
1Department of Plant and Environmental Sciences, The Institute of Life Sciences, The Hebrew University of Jerusalem, Jerusalem, Israel; 2The School
for Marine Sciences, The Ruppin Academic Center, Emek-Hefer, Israel; 3Earth Sciences Institute, The Hebrew University of Jerusalem, Jerusalem, Israel;4The Faculty of Biology, The Technion, Haifa, Israel; 5Mina and Everard Goodman Faculty of Life Sciences, Bar-Ilan University, Ramat Gan, Israel; and6H. Steinitz Marine Biology Laboratory, The Interuniversity Institute for Marine Sciences, Eilat, Israel
Correspondence: Danny Ionescu,
Department of Plant and Environmental
Sciences, The Institute of Life Sciences, The
Hebrew University of Jerusalem, 91904
Jerusalem, Israel. Tel.: 1972 2 658 5135;
fax: 1972 2 658 4425;
e-mail: [email protected]
Received 10 December 2008; revised 8 April
2009; accepted 1 June 2009.
Final version published online 6 July 2009.
DOI:10.1111/j.1574-6941.2009.00721.x
Editor: Patricia Sobecky
Keywords
Archaea; Crenarchaeota; Euryarchaeota; Gulf
of Aqaba; inorganic CO2 uptake.
Abstract
Using a polyphasic approach, we examined the presence of Archaea in the Gulf of
Aqaba, a warm marine ecosystem, isolated from major ocean currents and subject
to pronounced seasonal changes in hydrography. Catalyzed reported deposition
FISH analyses showed that Archaea make up to 4 20% of the prokaryotic
community in the Gulf. A spatial separation between the two major phyla of
Archaea was observed during summer stratification. Euryarchaeota were found
exclusively in the upper 200 m, whereas Crenarchaeota were present in greater
numbers in layers below the summer thermocline. 16S rRNA gene-based denatur-
ing gradient gel electrophoresis confirmed this depth partitioning and revealed
further diversity of Crenarchaeota and Euryarchaeota populations along depth
profiles. Phylogenetic analysis showed pelagic Crenarchaeota and Euryarchaeota to
differ from coral-associated Archaea from the Gulf, forming distinct clusters
within the Marine Archaea Groups I and II. Endsequencing of fosmid libraries of
environmental DNA provided a tentative identification of some members of the
archaeal community and their role in the microbial community of the Gulf.
Incorporation studies of radiolabeled leucine and bicarbonate in the presence of
different inhibitors suggest that the archaeal community participates in auto-
trophic CO2 uptake and contributes little to the heterotrophic activity.
Introduction
Well over a decade ago, it became evident that Archaea are
abundant in the open sea. Fuhrman et al. (1992) obtained
the first archaeal 16S rRNA gene sequences from marine
pelagic clone libraries. Using a targeted PCR approach,
DeLong (1992) showed that Archaea are abundantly found
in the coastal waters of North America. Phylogenetic analy-
sis placed these newly found marine Archaea both in the
Crenarchaeota and in the Euryarchaeota.
It is now well established that Archaea form an important
component within the marine prokaryoplankton across all
latitudes, but they are most abundant in colder layers of the
intermediate and deep waters (Karner et al., 2001; Herndl
et al., 2005). Planktonic marine Archaea are diverse, and
several groups of marine Crenarchaeota and Euryarchaeota
can be distinguished on the basis of their 16S rRNA gene
sequences (DeLong et al., 1994; Fuhrman & Davis, 1997;
Massana et al., 1997; McInerney et al., 1997; Fuhrman &
Ouverney, 1998; DeLong et al., 1999; Church et al., 2003;
DeLong, 2003; Lin et al., 2006; Kirchman et al., 2007). In the
deep pelagic waters of the Pacific Ocean, Crenarchaeota were
found in numbers similar to those of the Bacteria (Karner
et al., 2001). Recently, an autotrophic ammonium-oxidizing
marine Crenarchaeote was isolated and characterized, im-
plying a role for Archaea in nitrification (Konneke et al.,
2005). Ammonium-oxidizing Archaea are widely distribu-
ted in the world oceans (Francis et al., 2005). Representa-
tives of the Korarchaeota and Nanoarchaeota, two additional
phyla of the Archaea, have not been detected so far in the
marine prokaryoplankton.
The Gulf of Aqaba, in the northernmost part of the Red
Sea, is a narrow deep basin with an average width of 14 km
and a total length of 180 km. The Gulf is fed by a thermo-
haline current of warm surface waters, and annual deep water
temperatures never decline below 20.7 1C. Annual events
FEMS Microbiol Ecol 69 (2009) 425–438 c� 2009 Federation of European Microbiological SocietiesPublished by Blackwell Publishing Ltd. All rights reserved
MIC
ROBI
OLO
GY
EC
OLO
GY

of deep convective mixing occur during winter and often
reach down to over 600 m (Genin et al., 1995; Lindell & Post,
1995), thus causing a homogenous distribution of microbial
communities. The hydrography and the oligotrophic nature
of the Gulf together ensure year-round oxic conditions
throughout the water column. As the presence and con-
tribution of Archaea in warm marine basins has never been
ascertained, the Gulf of Aqaba is a suitable location to test
the hypothesis that temperature is a major determinant of
the community structure of marine Archaea.
Embarking on a polyphasic approach, we characterized
planktonic Archaea populations in the Gulf of Aqaba and
examined their abundance, distribution and diversity by
catalyzed reported deposition FISH (CARD FISH; Perntha-
ler et al., 2002), denaturing gradient gel electrophoresis
(DGGE), 16S rRNA gene sequence analysis and endsequen-
cing of fosmid clone libraries of environmental DNA from
the Gulf. Furthermore, we have measured incorporation of
radiolabeled bicarbonate and leucine in the presence of
different inhibitors in an attempt to assess the possible role
of Archaea in primary and heterotrophic productivity in the
Gulf. We show that planktonic Archaea are a quantitatively
significant and highly diverse component of the prokaryo-
plankton community in the Gulf of Aqaba, and provide
evidence that they may contribute to the autotrophic CO2
fixation in the deep water.
Materials and methods
Sampling procedures
Water was sampled at station A, 291280N, 341550E, in the
Gulf of Aqaba (seafloor depth 735 m) on March 30, 2003,
August 21, 2003, March 20, 2007, May 17, 2007, and April
29, 2008, using a Rosette sampler with 12 L Niskin bottles
(General Oceanics). Continuous readings of temperature,
salinity, light penetration and chlorophyll a concentration
were collected using a CTD (Seacat SBE19, Seabird Electro-
nics) equipped with a LiCOR light sensor (LI192A) and a
fluorimeter (Seapoint). Duplicate samples for dissolved
oxygen determination were withdrawn from each Niskin
bottle, immediately fixed and concentrations were deter-
mined by the Winkler titration method using an automatic
titrator (Metrohm).
Samples for CARD FISH analysis were taken in May
2007. Water was sampled at various depths from the surface
to 730 m (5 m above the bottom). Formaldehyde at a
final concentration of 4% was added to duplicate 50 mL
samples from each depth. After 2 h of fixation, two 15 mL
subsamples from each duplicate were filtered on polycarbo-
nate Whatman filters (0.22mm, +25 mm). A polyester
backing filter (0.45mm, +25 mm) was used for support.
Filters were air-dried and either analyzed immediately or
kept frozen at � 20 1C until further processing.
For 16S rRNA gene sequence analyses water was sampled
from depths o 400 m using Niskin bottles and from
shallower depths using an aseptic approach according to
the procedure described by Zobell (1946). In principle, a
glass bottle is sealed immediately after being autoclaved
using a rubber cork through which a sealed glass pipette is
inserted. A series of such bottles inside their holders was
lowered into the water. The impact of a messenger weight
breaks the glass capillary, allowing water from the desired
depth to flow in, and at the same time releases a messenger
to operate the bottle below. Upon resurfacing, the water was
transferred to 500 mL screw cap sterile bottles. The entire
amount of water up to 500 mL was filtered on a polycarbo-
nate Whatman filter (0.22mm, +25 mm) and was used for
genomic DNA extraction.
Samples for fosmid libraries were taken from 20 m
depth in March 2003 and from 20 and 140 m depth in
August 2003. Seawater (20 L, prefiltered over a 6mm mesh)
was filtered under gentle vacuum (o 15 mm Hg) onto
0.45 mm polysulfone filters (Supor-450, +47 mm, Gelman).
The filters were placed in 4 mL DNA extraction buffer
(750 mM sucrose, 400 mM NaCl, 20 mM EDTA, 50 mM
Tris-HCl, pH 9) in cryovial tubes, frozen in liquid nitrogen
and stored at � 20 1C.
Leucine and NaH14CO3 uptake measurements
Quadruplicate 50 mL samples from each of the evaluated
depths were taken for leucine uptake and bicarbonate
fixation experiments and wrapped in an aluminum foil to
prevent light-driven primary production in the samples.
Ampicillin and streptomycin were added to half of the
samples to a final concentration of 50mg mL�1 each and left
in the dark before further processing. The samples were
incubated with a final concentration of 0.02 mM of 3H-
labeled leucine (specific activity 109 Ci mmol�1)10.18 mM
of unlabeled leucine or with 5 mM NaH14CO3 (specific
activity 4.0 mCi mmol�1) with or without antibiotics as
described above. After incubation for 24 h at 24 1C, the
samples were fixed with 2% formaldehyde, proteins were
precipitated with 5% cold TCA and the samples were filtered
on nitrile acetate filters (0.22mm, +25 mm, Osmonics).
The filters were then placed in scintillation vials with 5 mL of
Ultima Gold (PerkinElmer) scintillation liquid and counted
in a Packard Tri-Carb 2200CA liquid scintillation analyzer.
Bacterial production was estimated using the following
equation:
mgC L�1 h�1 ¼Leuðmmol Leu L�1 h�1Þ � 131:2
� ð%LeuÞ�1 � ðC : ProteinÞ � IDð1Þ
FEMS Microbiol Ecol 69 (2009) 425–438c� 2009 Federation of European Microbiological SocietiesPublished by Blackwell Publishing Ltd. All rights reserved
426 D. Ionescu et al.
where 131.2 is the molecular weight of leucine, %Leu is the
proportion of leucine in total protein, assumed to be 0.073
(Simon & Azam, 1989), C : Protein is the ratio of cellular
carbon to protein, assumed to be 0.86 (Simon & Azam,
1989), and ID represents isotope dilution, assumed to be 2
in oligotrophic samples; however, due to the dilution of the
labeled leucine dilution we applied, this factor was not taken
into consideration.
For dark inorganic carbon (Ci) incorporation counts per
minute (CPM) were translated to disintegrations per minute
(DPM) using commercially available standards. For calcu-
lating the incorporated 14C labeled Ci, we used an estimated
value of 2.5 mM total inorganic carbon for the Gulf of
Aqaba.
CARD FISH preparation and analysis
CARD FISH was carried out with slight modifications
according to Pernthaler et al. (2002). Subsamples of each
filter were embedded in 0.1% low-melting-point agarose
and were left to dry on glass slides face up. After the samples
were dehydrated and removed from the glass using 96%
ethanol, they were left to air dry. Endogenous peroxidases
were inactivated by placing the filters for 10 min in 0.01 M
HCl, after which they were washed with 1� phosphate-
buffered saline (PBS). Cells were permeabilized using
10 mg mL�1 lysozyme in 0.05 M EDTA, 0.1 M Tris (pH 8)
for 30 min at 37 1C. Samples intended for labeling with
archaeal probes were further treated with 60 U mL�1 achro-
mopeptidase in 0.01 M NaCl and 0.01 M Tris-HCl (pH 8.0)
for 30 min at 37 1C (Sekar et al., 2003; Ishii et al., 2004). Up
to five filter pieces were placed in 0.5 mL Eppendorf tubes
with 300 mL hybridization buffer [0.9 M NaCl, 20 mM Tris-
HCl (pH 7.5), 10% dextran sulfate, 0.02% sodium dodecyl
sulfate (SDS), formamide at the concentration indicated in
Table 1, 1% blocking reagent] (Roche) and 3 mL probe
(50 ng mL�1) (Table 1). Following a hybridization period of
4 h at 37 1C, the filters were washed at 37 1C in prewarmed
washing buffer [3 mM NaCl, 5 mM EDTA (pH 8.0), 20 mM
Tris-HCl (pH 7.5), 0.01% SDS, formamide as indicated in
Table 1] for 10 min. Excess buffer was removed by absorp-
tion with blotting paper and filters were incubated for
15 min in 1� PBS. The filters were transferred to 1 mL
amplification buffer [1�PBS, pH 7.6, 10% dextran sulfate,
0.1% blocking reagent (Roche), 2 M NaCl] to which 10 mL
of freshly prepared 0.15% H2O2 and 3 mL of tyramides
prelabeled with Alexa488 succinimidyl ester dye (Molecular
Probes) were added. CARD incubation was carried out in
the dark at 37 1C for 15 min, after which the filter pieces were
washed in the dark for 15 min in 1�PBS, twice in double
distilled water (DDW) and were let to air dry. The dried filter
pieces were counterstained with 50mL (500 ng mL�1) 40,60-
diamidino-2-phenylindole (DAPI; Sigma) for 5 min, fol-
lowed by 5 min in DDW and 5 min in 80% ethanol. Before
mounting, filters were air dried in the dark for 1 h. Filter
pieces were mounted on glass slides using 1 : 1 (v : v)
VectraShield (Vector Labs) and PPDA [1 : 9 v : v 100 mM
paraphenylene diamine (pH 8.6) : glycerol] and viewed
under an epifluorescent microscope (Nikon Eclipse 80i
equipped with a CCD camera).
Denaturating gradient gel electrophoresis(DGGE)
Filters prepared for DNA extraction were incubated
for 10 min in 0.5 mL lysis buffer (0.1 M Tris, 0.05 M
EDTA, 100 mM NaCl, 1% SDS, pH 8) at 100 1C in a dry
heating block, after which 0.5 mL of 25 : 24 : 1 (v : v : v)
phenol : chloroform : isoamylalcohol was added and the
samples were briefly vortexed. Following a 5 min incuba-
tion at room temperature, the tubes were centrifuged for
5 min at 20 000 g. The upper phase was re-extracted using
24 : 1 (v : v) chloroform : isoamylalcohol. DNA was precipi-
tated by adding three volumes of anhydrous ethanol and
1% (final volume) 3 M sodium acetate (pH 5.5), followed
by 30 min at � 80 1C. After a 20 min centrifugation at
21 000 g, the pellet was washed in 75% ethanol, recollected
by centrifugation and dissolved in 50 mL of molecular-
grade water.
The DNA was then amplified by PCR, using a Bio-
er-thermocycler. We used an initial 5 min denaturation step
at 94 1C, 35 cycles of 1 min denaturation at 94 1C, 1 min
annealing at 55 1C, 1 min elongation at 72 1C and a final
elongation step of 10 min at 72 1C. The primers used are
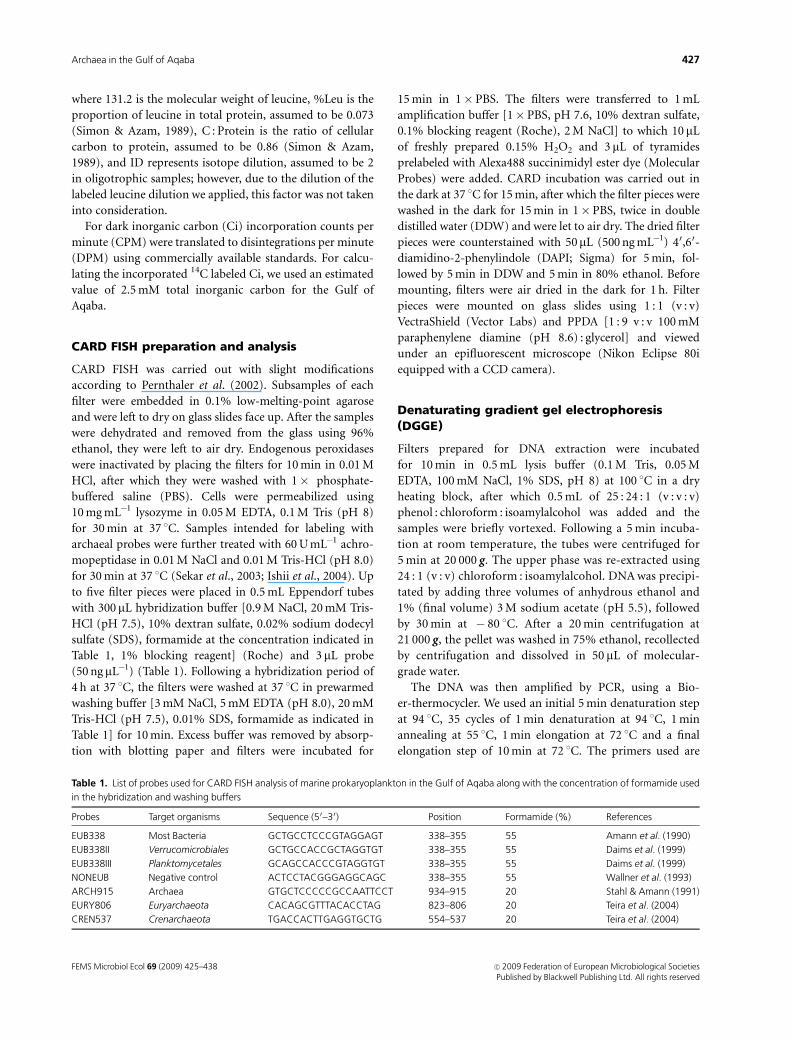
Table 1. List of probes used for CARD FISH analysis of marine prokaryoplankton in the Gulf of Aqaba along with the concentration of formamide used
in the hybridization and washing buffers
Probes Target organisms Sequence (50–30) Position Formamide (%) References
EUB338 Most Bacteria GCTGCCTCCCGTAGGAGT 338–355 55 Amann et al. (1990)
EUB338II Verrucomicrobiales GCTGCCACCGCTAGGTGT 338–355 55 Daims et al. (1999)
EUB338III Planktomycetales GCAGCCACCCGTAGGTGT 338–355 55 Daims et al. (1999)
NONEUB Negative control ACTCCTACGGGAGGCAGC 338–355 55 Wallner et al. (1993)
ARCH915 Archaea GTGCTCCCCCGCCAATTCCT 934–915 20 Stahl & Amann (1991)
EURY806 Euryarchaeota CACAGCGTTTACACCTAG 823–806 20 Teira et al. (2004)
CREN537 Crenarchaeota TGACCACTTGAGGTGCTG 554–537 20 Teira et al. (2004)
FEMS Microbiol Ecol 69 (2009) 425–438 c� 2009 Federation of European Microbiological SocietiesPublished by Blackwell Publishing Ltd. All rights reserved
427Archaea in the Gulf of Aqaba

given in Table 2. Primers 7F and 518R were used to amplify
crenarchaeotal sequences, primers 498F and 934R were used
to amplify euryarchaeotal sequences and primers 340F and
934R were used to amplify general archaeal sequences. All
forward primers contained a GC clamp (Table 2). The PCR
products were then loaded onto a vertical 6% acryl amide
gel with a 30–60% formamide urea gradient (100% denatur-
ing conditions are 40% formamide and 7 M urea).
Calculation of the pair-wise similarities of densitometric
profiles was based on Jaccard’s similarity coefficient and
Pearson’s correlation coefficient (Michener & Sokal, 1957)
to construct dendrograms using the Unweighted Pair-Group
Method Analysis (FINGERPRINT2s software, BioRad).
Genomic DNA extraction and 16S rRNA genesequence analysis
DNA was extracted as described above. PCR was carried out
using a company-made master mix (ABgene). Primers
(Table 2) were added to a final concentration of 1 mM. The
PCR reaction was carried out in a thermocycler (MJ
Research) starting with a 5 min initial denaturation at
95 1C, followed by 35 cycles of 1 min at 94 1C, 1 min at
55 1C and 1 min at 72 1C. The reaction was completed by a
5 min elongation step at 72 1C. The PCR products were
cloned using the pGEM-T kit (Promega) according to the
manufacturer’s instructions. A set of 96 clones covering all
sampled depths was sequenced. For identification the se-
quences were submitted for BLASTN analysis at the NCBI
GenBank and were aligned using the CLUSTALW algorithm. A
set of 170 archaeal 16S rRNA gene sequences including the
results from the Gulf of Aqaba, and 133 additional archaeal
sequences representing the major archaeal groups, were
plotted as a minimum evolution tree using the MEGA 4.0
software (Tamura et al., 2007). The distance matrix was
calculated using the maximum composite likelihood algo-
rithm and the results were validated using a bootstrap
analysis. Gulf of Aqaba sequences used in the phylogenetic
analysis have been submitted to the GenBank databases
under accession numbers EU263022–EU263058.
Fosmid library construction and analysis
Frozen filters were thawed on ice and used for genomic
DNA extraction. To obtain high-molecular-weight DNA
(4 40 000 bp), mechanical stress and shear forces were
minimized by avoiding vortexing and intensive pipetting
and using wide bore tips. Genomic DNA was extracted
according to Penno et al. (2006). Between 8 and 15 mg of
environmental DNA of c. 40 kb length were used for fosmid
library construction using the CopyControlTM Fosmid
Library Production Kit with the pCCFOS1TM vector (Epi-
centre Biotechnologies) following the manufacturer’s in-
structions. Individual fosmid clones were picked and
grown in 96-well growth blocks in Luria–Bertani (LB)
medium with 12.5 mg mL�1 chloramphenicol overnight at
37 1C and 350 r.p.m. horizontal shaking. After inoculation of
fresh LB/chloramphenicol medium containing 0.1% induc-
tion solution (Epicentre Biotechnologies) with 1/10 of the
overnight culture, the clones were grown for an additional
5 h under the above-mentioned conditions. Cells were
pelleted by centrifugation at 1500 g for 8 min and the pellets
were resuspended in 50 mM Tris HCl (pH 8), 10 mM EDTA
and 0.1 mg mL�1 RNAse A. Fosmid DNA was extracted
using alkaline lysis. Briefly, cell lysis was carried out for
5 min in 0.2 N NaOH and 0.1% SDS, followed by neutraliza-
tion with 3 M potassium acetate (pH 5.2 after adjusting with
acetic acid). After centrifugation at 1800 g for 20 min, the
cell lysate was transferred to a 96-well 0.66 mm polystyrene
glass fiber filter plate (Corning) placed on top of a 96-well
Costar polystyrene plate (Corning). Assembled plates were
centrifuged for 5 min at 1500 g. The fosmid DNA was
precipitated in the 96-well Costar plates by adding
0.7 volume isopropanol. After an overnight incubation
at � 20 1C, the DNA was pelleted by centrifugation at
2800 g for 40 min. The pellets were washed with 70%
ethanol and air dried for 10 min. Fosmid clones were
Table 2. List of primers used to amplify archaeal 16S rRNA genes
Primers Specificity Sequence (50–30) References
21F Archaea TTCCGGTTGATCCYGCCGGA DeLong (1992)
958R Archaea YCCGGCGTTGAMTCCAATT DeLong (1992)
A1 Euryarchaeota TCYGKTTGATCCYGSCRGAG Embley et al. (1992)
A1100 Euryarchaeota TGGGTCTCGCTCGTTG Embley et al. (1992)
7F Crenarchaeota TTCCGGTTGATCCYGCCGGACC Perevalova et al. (2003)
518R Crenarchaeota GCTGGTWTTACCGCGGCGGCTGA Perevalova et al. (2003)
340F Archaea CCTACGGGGYGCASCAG Øvreas et al. (1997)
934R Archaea GTGCTCCCCCGCCAATTCCT Raskin et al. (1994)
498F Euryarchaeota AAGGGCYGGGCAAG Burggraf et al. (1994)
GC clamp DGGE CGCCCGCCGCGCGCGGCGGGCGGGGCGGGGGCACGGGGGG
Primers 7F, 340F and 498F were synthesized with a GC clamp at the 50 end to be used for DGGE.
FEMS Microbiol Ecol 69 (2009) 425–438c� 2009 Federation of European Microbiological SocietiesPublished by Blackwell Publishing Ltd. All rights reserved
428 D. Ionescu et al.

sequenced from both ends using the T7 and pCC1TM/
pEpiFOSTM RP-2 (Epicentre Biotechnologies) primers. The
resulting sequences were submitted to the NCBI GenBank
for identification using BLASTX. Only sequences 4 100 bp
length and BLAST tophits with e-valueso 1.00E� 03 and
score values 4 30 were included in the analysis. Sequences
with archaeal BLAST tophits have been submitted to GenBank
(accession numbers FI901681 – FI901797).
Results
Hydrographic properties
Water samples were collected at five different time points at
station A in the Gulf of Aqaba, reflecting diverse hydro-
graphic conditions. In March 2007 the water column was
mixed down to the sea floor (735 m) with a constant
temperature of 21 1C throughout. In April 2008, May 2007
and August 2003, the water column became stratified, with
a more pronounced thermocline as summer progressed
(Fig. 1). The water column was fully oxygenated at the five
sampling times and salinity was constant at 40.5–40.7%(salinity data were not available for April 2008). In situ
fluorescence measurements, representing chlorophyll a con-
centration, showed high, uniform values in the mixed upper
part of the water column and declined to background levels
below the thermocline during stratification. A deep chlor-
ophyll maximum existed at 45 m in May 2007 (Fig. 1), and it
typically deepens during summer (e.g. 110 m by August in
2003). Analysis of inorganic N species was carried out for all
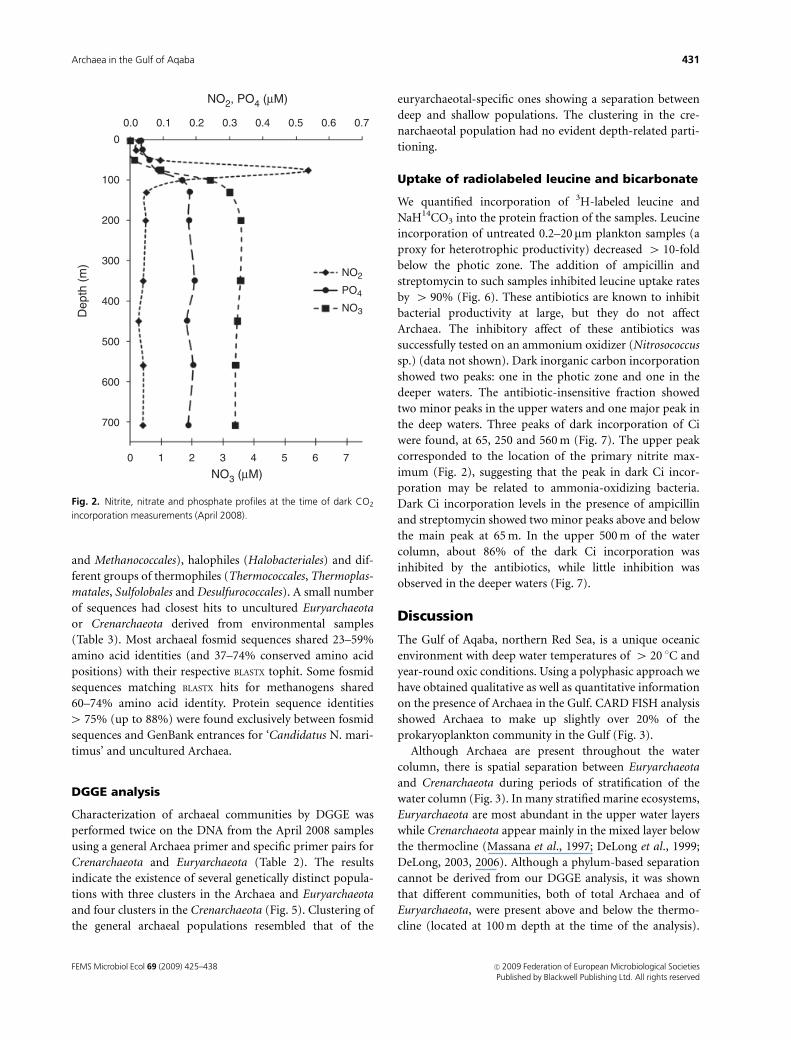
water samples. Figure 2 depicts the data obtained in April
2008, showing a peak in NO2 at a depth of 75 m.
CARD FISH community analysis
Application of CARD FISH using a universal probe (Table 1)
to enumerate both Bacteria and Archaea in samples from the
Gulf of Aqaba resulted in labeling of 4 90% of the DAPI cell
counts. Using specific probes, we showed that Archaea
contributed 20–40% of the prokaryoplankton (Fig. 3).
Likewise, samples labeled with a general Archaea probe were
a close match to the combined counts obtained with
Archaea-specific probes distinguishing Crenarchaeota and
Euryarchaeota (Table 1). An experiment using the FISH
technique without the CARD amplification yielded few
visible Archaea (data not shown). Compared with the total
cell numbers, both the bacterial and the archaeal commu-
nities showed similar trends, with the highest numbers
around the deep chlorophyll maximum and close to the
sediment (Fig. 3a). However, the ratio between Archaea and
Bacteria throughout the water column did not follow any
clear pattern (Fig. 3b). No Euryarchaeota were observed
below the thermocline of the stratified column in May 2007
(Fig. 3c). In most cases, the sum of labeled Euryarchaeota
and Crenarchaeota matched total Archaea numbers labeled
with the general probe.
Phylogenetic analysis of 16S rRNA genes
16S rRNA gene sequences from all samples along the mixed
water column were submitted to BLASTN searches and phylo-
genetic analyses and identified members of both Euryarch-
aeota and Crenarchaeota (Fig. 4). All Euryarchaeota
sequences resulted from PCR products obtained with a
general archaeal primer pair. Although the Euryarchaeota-
specific primers yielded PCR products for several reference
strains and environmental samples from hypersaline envir-
onments (data not shown), they did not amplify 16S rRNA
gene fragments from the Gulf of Aqaba. Crenarchaeota
sequences were obtained using both Crenarchaeota-specific
as well as general Archaea primers (Table 2). The best BLASTN
matches were always to uncultured marine Archaea.
Phylogenetic analyses of 170 16S rRNA gene sequences
representing the major known archaeal groups clearly place
the Gulf of Aqaba sequences in two separate clusters: one
within the Euryarchaeota and one within the Crenarchaeota
lineage with distinct groups not related to any known
species (Fig. 4). The crenarchaeotal sequences form a
distinct cluster within the Marine Group I (MGI) most
closely related to the MGI a and b subgroups. Most of the
euryarchaeotal sequences group within the Marine Group II
(MGII) as a distinct cluster branching off the MCII bsubgroup (Fig. 4). Others cluster together with uncultured
archaeal sequences isolated from corals in the Red Sea within
the MCII b subgroup. One Gulf of Aqaba euryarchaeotal
sequence clusters in the MGII a subgroup branching deeply
away from other members of this subgroup. Euryarchaeotal
and crenarchaeotal environmental clone sequences shared
between 91–98% and 92–99% identity, respectively, with
sequences from the NCBI database. Plotting the sequences
using the neighbor joining and maximum parsimony algo-
rithms implemented in the MEGA 4.0 package resulted in
similar tree topologies and did not alter the clustering
pattern shown in Fig. 4 (data not shown).
Archaeal fosmid library clones
Three fosmid libraries of Gulf of Aqaba environmental
DNA, two from 20 m depth (winter mixed vs. summer
stratified column) and one from 140 m depth (stratified
column), were screened to determine sequence distributions
over the microbial community. Among a total of 4 6000
fosmid clones analyzed, we identified 118 Archaea sequences
(237–907 bp in length) that showed best BLAST hits (e-values
ranging from 1E� 06 to 1E� 118) to Archaea (Table 3).
Out of a total of prokaryotic sequences (n = 2484), Archaea-
like sequences comprised c. 5% of the total. The Archaea-
like sequences showed affinity with both the Euryarchaeota
FEMS Microbiol Ecol 69 (2009) 425–438 c� 2009 Federation of European Microbiological SocietiesPublished by Blackwell Publishing Ltd. All rights reserved
429Archaea in the Gulf of Aqaba

(41%) and Crenarchaeota (56%). The c. 1 : 3 ratio for
Crenarchaeota- and Euryarchaeota-like sequences identified
in the fosmid libraries corresponded to ratios obtained for
16S clone libraries (Fig. 4). The closest archaeal matches
based on protein BLAST searches against the nr database of
GenBank identified these sequences as relatives of ‘Candida-
tus Nitrosopumilus maritimus’ as well as functional groups
such as the methanogens (Methanopyrales, Methanosarcinales
Oxygen (µmol L–1)
Temperature (°C)
Temperature (°C)
Temperature (°C)
Temperature (°C)
Oxygen (µmol L–1)
Oxygen (µmol L–1)
Oxygen (µmol L–1)
Fluorescence (AU)
Fluorescence (AU)
Fluorescence (AU)
Dep
th (
m)
Dep
th (
m)
Dep
th (
m)
Dep
th (
m)
Dep
th (
m)
Dep
th (
m)
April 2008
March 2007
May 2007
August 2003
Fluorescence (AU)
Salinity (‰)
Salinity (‰)
Salinity (‰)
Fig. 1. Temperature, salinity (left panels), chlorophyll
fluorescence and oxygen (right panels) profiles of the water
column at station A in the Gulf of Aqaba at the various
sampling times: sampling for fosmid libraries generation,
August 2003; sampling for archaeal 16S rRNA gene
amplification, March 2007; sampling for CARD FISH analysis,
May 2007; sampling for productivity measurements,
April 2008.
FEMS Microbiol Ecol 69 (2009) 425–438c� 2009 Federation of European Microbiological SocietiesPublished by Blackwell Publishing Ltd. All rights reserved
430 D. Ionescu et al.
and Methanococcales), halophiles (Halobacteriales) and dif-
ferent groups of thermophiles (Thermococcales, Thermoplas-
matales, Sulfolobales and Desulfurococcales). A small number
of sequences had closest hits to uncultured Euryarchaeota
or Crenarchaeota derived from environmental samples
(Table 3). Most archaeal fosmid sequences shared 23–59%
amino acid identities (and 37–74% conserved amino acid
positions) with their respective BLASTX tophit. Some fosmid
sequences matching BLASTX hits for methanogens shared
60–74% amino acid identity. Protein sequence identities
4 75% (up to 88%) were found exclusively between fosmid
sequences and GenBank entrances for ‘Candidatus N. mari-
timus’ and uncultured Archaea.
DGGE analysis
Characterization of archaeal communities by DGGE was
performed twice on the DNA from the April 2008 samples
using a general Archaea primer and specific primer pairs for
Crenarchaeota and Euryarchaeota (Table 2). The results
indicate the existence of several genetically distinct popula-
tions with three clusters in the Archaea and Euryarchaeota
and four clusters in the Crenarchaeota (Fig. 5). Clustering of
the general archaeal populations resembled that of the
euryarchaeotal-specific ones showing a separation between
deep and shallow populations. The clustering in the cre-
narchaeotal population had no evident depth-related parti-
tioning.
Uptake of radiolabeled leucine and bicarbonate
We quantified incorporation of 3H-labeled leucine and
NaH14CO3 into the protein fraction of the samples. Leucine
incorporation of untreated 0.2–20 mm plankton samples (a
proxy for heterotrophic productivity) decreased 4 10-fold
below the photic zone. The addition of ampicillin and
streptomycin to such samples inhibited leucine uptake rates
by 4 90% (Fig. 6). These antibiotics are known to inhibit
bacterial productivity at large, but they do not affect
Archaea. The inhibitory affect of these antibiotics was
successfully tested on an ammonium oxidizer (Nitrosococcus
sp.) (data not shown). Dark inorganic carbon incorporation
showed two peaks: one in the photic zone and one in the
deeper waters. The antibiotic-insensitive fraction showed
two minor peaks in the upper waters and one major peak in
the deep waters. Three peaks of dark incorporation of Ci
were found, at 65, 250 and 560 m (Fig. 7). The upper peak
corresponded to the location of the primary nitrite max-
imum (Fig. 2), suggesting that the peak in dark Ci incor-
poration may be related to ammonia-oxidizing bacteria.
Dark Ci incorporation levels in the presence of ampicillin
and streptomycin showed two minor peaks above and below
the main peak at 65 m. In the upper 500 m of the water
column, about 86% of the dark Ci incorporation was
inhibited by the antibiotics, while little inhibition was
observed in the deeper waters (Fig. 7).
Discussion
The Gulf of Aqaba, northern Red Sea, is a unique oceanic
environment with deep water temperatures of 4 20 1C and
year-round oxic conditions. Using a polyphasic approach we
have obtained qualitative as well as quantitative information
on the presence of Archaea in the Gulf. CARD FISH analysis
showed Archaea to make up slightly over 20% of the
prokaryoplankton community in the Gulf (Fig. 3).
Although Archaea are present throughout the water
column, there is spatial separation between Euryarchaeota
and Crenarchaeota during periods of stratification of the
water column (Fig. 3). In many stratified marine ecosystems,
Euryarchaeota are most abundant in the upper water layers
while Crenarchaeota appear mainly in the mixed layer below
the thermocline (Massana et al., 1997; DeLong et al., 1999;
DeLong, 2003, 2006). Although a phylum-based separation
cannot be derived from our DGGE analysis, it was shown
that different communities, both of total Archaea and of
Euryarchaeota, were present above and below the thermo-
cline (located at 100 m depth at the time of the analysis).
NO2, PO4 (µM)
0.0
0
100
200
300NO2
NO3
PO4400
Dep
th (
m)
500
600
700
0 1 2 3 4
NO3 (µM)5 6 7
0.1 0.2 0.3 0.4 0.5 0.6 0.7
Fig. 2. Nitrite, nitrate and phosphate profiles at the time of dark CO2
incorporation measurements (April 2008).
FEMS Microbiol Ecol 69 (2009) 425–438 c� 2009 Federation of European Microbiological SocietiesPublished by Blackwell Publishing Ltd. All rights reserved
431Archaea in the Gulf of Aqaba

The spatial separation among the Crenarchaeota is less clear
and appears not to be depth related (Fig. 5).
An apparent contradiction arises when comparing the
archaeal abundance estimated from fosmid library screening
(5%) with the CARD FISH results (20%). This discrepancy
may be founded in the nature of the different analyses.
Fosmid library construction and screening constitute a shot-
gun approach, which, in principle, is free of bias, but
1.0E+05
0
100
200
Dep
th (
m)
Dep
th (
m)
Dep
th (
m)
300
400
500
600
700
0
0.0 10.0 20.0 30.0 40.0 50.0 60.0 70.0 80.0 90.0 100.0
100
200
300
400
500
600
700
0
100
200
300
400
500
600
700
EubacteriaArchaea
Total DAPI counts
Eubacteria
Archaea
Archaea and Eubacteria
Euryarchaea
Archaea
Crenarchaea
2.1E+06 4.1E+06 6.1E+06Cells mL–1
8.1E+06 1.0E+07 1.2E+07 1.4E+07
1.0E+05 1.1E+06 2.1E+06Cells mL–1
Percent of DAPI-labeled cells
3.1E+06 4.1E+06 5.1E+06
(a)
(b)
(c)
Fig. 3. CARD FISH analysis results of the
prokaryoplankton community in the Gulf of
Aqaba: Archaea, Bacteria and total DAPI counts
per milliliter (a); percent of total DAPI counts
labeled with the general archaeal and general
bacterial probe (b); Euryarchaeota and
Crenarchaeota cells per milliliter as compared
with the total Archaea counts (c).
FEMS Microbiol Ecol 69 (2009) 425–438c� 2009 Federation of European Microbiological SocietiesPublished by Blackwell Publishing Ltd. All rights reserved
432 D. Ionescu et al.

establishing taxonomic relationships is compounded by the
breadth of the (ever expanding) databases. The major
emphasis on 16S rRNA gene sequences in diversity assess-
ments is more straightforward than the use of functional
genes. Thus, deciphering random archaeal sequences relies
largely on the current status of genome sequences. To date,
there are c. 65 archaeal genomes available vs. 4 1000
bacterial ones (data taken from NCBI GenBank). Therefore,
Fig. 4. A minimum evolution
phylogenetic tree of all major
Archaea groups and the archaeal
sequences from the Gulf of Aqaba.
Distances were calculated using
the maximum composite
likelihood algorithm as embedded
in the MEGA 4.0 software. Bootstrap
values (1000 replicates) over 50%
are shown next to the relevant
branches. MGI, Marine Group I;
GoAqPCG, Gulf of Aqaba Pelagic
Crenarchaeota Group; SCG, Soil
Crenarchaeota Group; MBG,
Marine Benthic Group; MHVG,
Marine Hydrothermal Vent
Group; MCG, Miscellaneous
Crenarchaeota Group; T/A/M/Mp/H,
Thermococcales, Archaeoglobales,
Methanococcales, Methanopyrales
and Haloarcula, respectively;
SAGMEG, South Africa Gold
Mine Euryarchaeota Group;
TMEG, Terrestrial Miscellaneous
Euryarchaeotal Group; MGII, Marine
Group II; GoAqPEG, Gulf of Aqaba
Pelagic Euryarchaeota Group; MGIII,
Marine Group III.
FEMS Microbiol Ecol 69 (2009) 425–438 c� 2009 Federation of European Microbiological SocietiesPublished by Blackwell Publishing Ltd. All rights reserved
433Archaea in the Gulf of Aqaba

it is quite possible that additional archaeal sequences may
‘hide’ among the 49% unidentified BLAST results from our
fosmid library screening.
With the exception of few euryarchaeotal sequences
obtained from the Gulf of Aqaba, all of the sequences
cluster in unique clades within known crenarchaeotal and
euryarchaeotal groups. As in other examined marine envir-
onments the MGI and MGII groups are the dominant
archaeal populations (Massana et al., 1997). The formation
of the unique clusters GoAqPCG (Gulf of Aqaba Pelagic
Crenarchaeota Group) and GoAqPEG (Gulf of Aqaba
Pelagic Euryarchaeota Group) (Fig. 4) may be due to the
source of the water in the Gulf. The Red Sea is connected to
the Indian Ocean (Gulf of Aden) via the Bab-el-Mandeb
straits, which form a shallow water barrier only c. 140 m
deep, allowing only surface water to enter the Red Sea. The
incoming waters are driven north mainly by winds and a
thermohaline current. The entrance to the Gulf of Aqaba is
blocked by the even shallower straits of Tiran that allow
only the upper c. 80 m of water to enter the Gulf. The
existence of two shallow barriers between the Gulf of Aden
and the Gulf of Aqaba leads to a severe selection of surface-
related Archaea, which in turn may have diverged into a
unique community specific only to the Gulf of Aqaba. We
have compared the sequences obtained from the Gulf of
Aqaba in this study with those obtained during the Global
Ocean Sampling expedition (Shaw et al., 2008) and found
no preferential similarity between Archaea from the Indian
Ocean and those from the Gulf of Aqaba (data not shown).
This may be due to a divergence progress that becomes
more apparent the further we go from the source of the
waters. However, as no data are available regarding archaeal
diversity in other parts of the Red Sea, this hypothesis
cannot be supported yet. Teske & Sørensen (2008) have
analyzed the phylogenetic relations between various
Archaea groups, most of which have been plotted in Fig. 4.
Their analysis has shown that the archaeal communities
group according to their local environment rather than
their geographical position. Considering this we may not
necessarily expect the archaeal population in the Gulf of
Aqaba to resemble that in the Gulf of Aden, but rather a
marine community with a similar ecological function.
Siboni et al. (2008) have published a large number of
sequences from coral-associated Archaea from the Gulf of
Aqaba. These sequences, although from the same geogra-
phical location, cluster separately from the pelagic
sequences obtained in this study. This further supports the
theory of functional and not geographical clustering.
Table 3. List of most fosmid clones with archaeal matches found using BLASTX search
e-value Number of times Phylum Closest BLAST match
3.00E� 76 11 Crenarchaeota Nitrosopumilus maritimus SCM1
1.00E� 46 6 Euryarchaeota Methanococcoides burtonii DSM 6242
5.10E� 77 5 Euryarchaeota Uncultured Marine Group II euryarchaeote 37F11
4.10E� 53 5 Euryarchaeota Natronomonas pharaonis DSM 2160
3.00E� 32 5 Euryarchaeota Methanosarcina acetivorans C2A
2.10E� 67 5 Euryarchaeota Methanoculleus marisnigri JR1
1.00E� 118 4 Euryarchaeota Uncultured Marine Group II euryarchaeote DeepAnt-JyKC7
6.00E� 52 4 Euryarchaeota Methanosarcina barkeri str. Fusaro
2.00E� 29 4 Euryarchaeota Haloquadratum walsbyi DSM 16790
5.00E150 3 Euryarchaeota Uncultured Marine Group II euryarchaeote HF70_39H11
2.00E� 10 3 Euryarchaeota Pyrococcus horikoshii OT3
7.00E� 41 3 Euryarchaeota Pyrococcus abyssi GE5
1.00E� 36 3 Euryarchaeota Methanothermobacter thermautotrophicus str. Delta H
8.10E� 34 3 Euryarchaeota Methanosaeta thermophila PT
2.00E� 44 3 Euryarchaeota Methanopyrus kandleri AV19
3.00E� 17 3 Euryarchaeota Methanocaldococcus jannaschii DSM 2661
4.00E� 17 3 Euryarchaeota Halorubrum lacusprofundi ATCC 49239
4.00E� 21 3 Euryarchaeota Haloarcula marismortui ATCC 43049
8.00E� 18 2 Crenarchaeota Cenarchaeum symbiosum
1.00E� 09 2 Euryarchaeota Thermoplasma volcanium GSS1
1.00E� 25 2 Euryarchaeota Thermococcus kodakarensis KOD1
1.00E� 17 2 Euryarchaeota Pyrococcus furiosus DSM 3638
1.00E� 06 2 Crenarchaeota Pyrobaculum aerophilum str. IM2
4.10E� 34 2 Euryarchaeota Methanospirillum hungatei JF-1
9.00E� 39 2 Euryarchaeota Archaeoglobus fulgidus DSM 4304
7.10E� 49 1 Crenarchaeota Pyrobaculum arsenaticum DSM 13514
BLAST e-value and identity of the closest match are given as well as the number of times this organisms showed up as best BLAST match.
FEMS Microbiol Ecol 69 (2009) 425–438c� 2009 Federation of European Microbiological SocietiesPublished by Blackwell Publishing Ltd. All rights reserved
434 D. Ionescu et al.

All data obtained from 16S rRNA gene sequencing using
different archaeal-specific primers yielded sequences close to
other uncultured marine Archaea whose ecological role is still
unknown. However, fosmid analysis identified most Archaea
as members of functional groups such as the methanogens,
halophiles or thermophiles, leaving only 19% with a closest
match to uncultured marine Archaea (Table 3). Given the
very low sequence similarity between fosmid archaeal se-
quences and closest BLAST matches (except for uncultured
Archaea and Candidatus N. maritimus) and the low number
of database entrances for functional protein sequences of
uncultured Archaea, the identification of methanogens,
halophiles or thermophiles and therefore their presence in
the Gulf is strongly questioned and rather unlikely.
To estimate the possible role of Archaea in heterotrophic
and autotrophic processes, we introduced an approach
based on the use of antibiotics that supposedly do not affect
Archaea, assessing their effect on the incorporation of3H-leucine and H14CO3
�. Heterotrophic production as mea-
sured by leucine incorporation was significantly higher in
the photic zone (c. 75 m, data not shown) than in the deeper
waters. In the upper 30 m, the addition of ampicillin and
streptomycin lowered the rate of leucine incorporation by
85–90% (Fig. 6); whether the remaining 10–15% can be
attributed to archaeal activity or to bacteria not affected by
the inhibitors cannot be ascertained on the basis of our data.
In deeper waters, there was no clear trend in the effect of the
antibiotics on leucine incorporation (Fig. 6, inset). In the
upper water layers most of the dark CO2 incorporation was
inhibited by the antibiotics, but most of the activity in the
deeper waters was not affected. At least some of this activity
may be attributed to autotrophic ammonia-oxidizing
Crenarchaeota, such as have been documented from various
Fig. 5. DGGE dendrograms for total Archaea, Crenarchaeota and
Euryarchaeota. The lane images are computer generated from the
original DGGE gels for densitometric analysis. Depths represent the
origin of the samples.
0
0
0
0.05 0.1 0.15 0.2
µg C L–1 day–1
0
100
200
300
Dep
th (
m)
400
500
600
700
100
200
300No inhibitors
With inhibitors
400
500
600
700
1 2
Fig. 6. Heterotrophic productivity as calculated from leucine uptake
experiments performed with and without bacterial inhibitors in April
2008. The insert shows a magnification of the results deeper than
50 m depth.
FEMS Microbiol Ecol 69 (2009) 425–438 c� 2009 Federation of European Microbiological SocietiesPublished by Blackwell Publishing Ltd. All rights reserved
435Archaea in the Gulf of Aqaba

marine environments (Treusch et al., 2005; Wuchter et al.,
2006; Beman et al., 2007; Lam et al., 2007). This agrees with
our CARD FISH results, showing that the majority of the
Crenarchaeota were present in the deeper waters (Fig. 3).
Additional support for the existence of ammonia-oxidizing
Archaea in the Gulf of Aqaba was obtained from the fosmid
library screening, as multiple significant BLAST hits were most
similar to the archaeal ammonia oxidizer Candidatus N.
maritimus (Table 3). Ammonia-oxidizing Archaea as well as
ammonia oxidation itself were found to exist in corals from
the Gulf of Aqaba (Siboni et al., 2008). Although there is no
close similarity between the coral and pelagic Archaea found
in the Gulf of Aqaba, this further supports that Archaea-
mediated ammonia oxidation is a common process that is
probably present in the pelagic part of the Gulf as well.
While we do not claim that the use of ampicillin and
streptomycin enables a full differentiation between activities
due to Archaea and to Bacteria, the data obtained suggest
that interesting information can be obtained in such studies
using different inhibitors. More in-depth controlled studies
will be required to fully evaluate the validity of the approach.
The spatial distribution of the Archaea in the Gulf as
observed by the CARD FISH analysis as well as by the DGGE
analysis may also be function related. Given that the Archaea
in the Gulf all originate from Red Sea surface waters, the
descent and establishment of the Crenarchaeota community
in deeper areas may be related to available, necessary
nutrients. This could also account for the unique clusters
obtained by the 16S rRNA gene sequences. As previously
crenarchaeotal ammonia oxidation has been described to
occur in deep waters, which, in this case, are blocked from
entering the Gulf of Aqaba, the pelagic Crenarchaeota in the
Gulf may be a less common, opportunistic ammonia-
oxidizing Archaea. Because DGGE does not provide quanti-
tative information, we cannot deduce anything regarding
the contribution of each depth-related cluster to the total
archaeal community, and therefore the existence of other
Crenarchaeota or Euryarchaeota in shallower or deeper
waters, respectively, is not surprising.
It appears that the archaeal community in the Gulf of
Aqaba is unique, a speciation that may have been caused by
the selection of shallow water species. However, regardless of
this speciation, a special differentiation is noticed between
Crenarchaeota and Euryarchaeota. Further studies are
needed to determine the nature of this separation as well as
the changes that occur in the archaeal communities along
the Red Sea.
Acknowledgements
We would like to acknowledge the State of Niedersachsen
(Germany) for supporting the CARD FISH analysis, which
was initiated as part of a marine microbiology course project
with students Kirsten Oesterwind and Stefan Thiele
(University of Osnabruck) and Nathalie Vaisman (the
Hebrew University of Jerusalem). We thank Rita B. Dom-
ingues for her constructive criticism, and Ilana Berman-
Frank for access to her fluorescent microscope. Katherina
Hammar provided assistance in fosmid sequence analyses.
We acknowledge the National Monitoring Program at the
IUI for oceanographic data. Financial support was available
from the Moshe Shilo Minerva Center for Marine Biogeo-
chemistry (A.F.P., A.O.), the Bridging the Rift Foundation
(D.I., A.O.), Niedersachsen State Fund at the Hebrew Uni-
versity, grant 135/05 by the Israel Science Foundation
(A.F.P.). Fosmid clone sequencing received support of the
MBL Gruss-Lipper Fund, Woods Hole, MA (A.F.P.).
References
Amann R, Binder BJ, Olson RJ, Chisholm SW, Devereux R &
Stahl DA (1990) Combination of 16S rRNA-targeted
oligonucleotide probes with flow cytometry for analyzing
mixed microbial populations. Appl Environ Microb 56:
1919–1925.
Beman JM, Roberts JK, Wegley L, Rohwer F & Francis AC (2007)
Distribution and diversity of ammonia monooxygenase genes
associated with corals. Appl Environ Microb 73: 5642–5647.
0
0
100
200
300
400
No inhibitors
With inhibitors
Dep
th (
m)
500
600
700
1 2 3
µg C L–1 day–1
4 5 6 7
Fig. 7. Dark uptake of H14CO3� in the presence and absence of ampicillin
and streptomycin, as measured in April 2008.
FEMS Microbiol Ecol 69 (2009) 425–438c� 2009 Federation of European Microbiological SocietiesPublished by Blackwell Publishing Ltd. All rights reserved
436 D. Ionescu et al.

Burggraf S, Mayer T, Amann R, Schadhauser S, Woese CR &
Stetter KO (1994) Identifying members of the domain Archaea
with rRNA-targeted oligonucleotide probes. Appl Environ
Microb 60: 3112–3119.
Church MJ, DeLong EF, Ducklow HW, Karner MB, Preston CM
& Karl DM (2003) Abundance and distribution of planktonic
archaea and bacteria in the waters west of the Antarctic
Peninsula. Limnol Oceanogr 48: 1893–1902.
Daims H, Bruhl A, Amann R, Schleifer KH & Wagner M (1999)
The domain-specific probe EUB338 is insufficient for the
detection of all Bacteria: development and evaluation of a more
comprehensive probe set. Syst Appl Microbiol 22: 434–444.
DeLong EF (1992) Archaeal in coastal marine environments.
P Natl Acad Sci USA 89: 5685–5689.
DeLong EF (2003) Oceans of archaea. ASM News 69: 503–511.
DeLong EF (2006) Archaeal mysteries of the deep revealed. P Natl
Acad Sci USA 103: 6417–6418.
DeLong EF, Wu KY, Prezelin BB & Jovine RVM (1994) High
abundance of archaea in Antarctic marine picoplankton.
Nature 371: 695–697.
DeLong EF, Taylor LT, Marsh TL & Preston CM (1999)
Visualization and enumeration of marine planktonic archaea
and bacteria by using polyribonucleotide probes and
fluorescence in situ hybridization. Appl Environ Microb 65:
5554–5556.
Embley TM, Finlay BJ, Thomas RH & Dyal PL (1992) The use of
rRNA sequences and fluorescent probes to investigate the
phylogenetic positions of the anaerobic ciliate Metopus
palaeformis and its archaeobacterial endosymbiont. J Gen
Microbiol 138: 1479–1487.
Francis CA, Roberts KJ, Beman JM, Santoro AE & Oakley BB
(2005) Ubiquity and diversity of ammonia-oxidizing archaea
in water columns and sediments of the ocean. P Natl Acad Sci
USA 102: 14683–14688.
Fuhrman JA & Davis AA (1997) Widespread archaea and novel
bacteria from the deep sea as shown by 16S rRNA gene
sequencing. Mar Ecol-Prog Ser 150: 275–285.
Fuhrman JA & Ouverney CC (1998) Marine microbial diversity
studied via 16S rRNA sequences: coastal cloning results and
counting of native archaea with fluorescent single cell probes.
Aquat Ecol 32: 3–15.
Fuhrman JA, McCallum K & Davis AA (1992) Novel major
archaebacterial group from marine plankton. Nature 356:
148–149.
Genin A, Lazar B & Brenner S (1995) Vertical mixing and coral
death in the Red Sea following the eruption of Mount
Pinatubo. Nature 377: 507–510.
Herndl JG, Reinthaer T, Teira E, van Aken H, Veth C, Pernthaler A
& Pernthaler J (2005) Contribution of Archaea to total
prokaryotic production in the Deep Atlantic Ocean. Appl
Environ Microb 71: 2303–2309.
Ishii K, Mußmann M, MacGregor BJ & Amann R (2004) An
improved fluorescence in situ hybridization protocol for the
identification of bacteria and archaea in marine sediments.
FEMS Microbiol Ecol 50: 203–213.
Karner MB, DeLong EF & Karl DM (2001) Archaeal dominance
in the mesopelagic zone of the Pacific Ocean. Nature 409:
507–510.
Kirchman DL, Elifantz H, Dittel AI, Malmstrom RR &
Cottrell MT (2007) Standing stocks of Archaea and Bacteria
in the western Arctic Ocean. Limnol Oceanogr 52:
495–507.
Konneke M, Bernhard AE, de la Torre JR, Walker CB, Waterbury
JB & Stahl DA (2005) Isolation of an autotrophic ammonia-
oxidizing marine archaeon. Nature 437: 543–546.
Lam P, Jensesn MM, Lavik G, McGinnis DF, Muller B, Schubert
CJ, Amann R, Thamdrup B & Kuypers MMM (2007) Linking
crenarchaeotal and bacterial nitrification to anammox in the
Black Sea. P Natl Acad Sci USA 104: 7104–7109.
Lin X, Wakeham SG, Putnam IF, Astor YM, Scranton MI,
Chistoserdov AY & Taylor GT (2006) Comparison of vertical
distributions of prokaryotic assemblages in the anoxic Cariaco
Basin and Black Sea by use of fluorescence in situ
hybridization. Appl Environ Microb 72: 2679–2690.
Lindell D & Post AF (1995) Ultraphytoplankton succession is
triggered by deep winter mixing in the Gulf of Aqaba (Eilat),
Red Sea. Limnol Oceanogr 40: 1130–1141.
Massana R, Murray A, Preston CM & DeLong EF (1997) Vertical
distribution and phylogenetic characterization of marine
planktonic archaea in the Santa Barbara channel. Appl Environ
Microb 63: 50–56.
McInerney JO, Mullarkey M, Wernecke ME & Powell R (1997)
Phylogenetic analysis of Group I marine archaeal rRNA
sequences emphasizes the hidden diversity within the primary
group archaea. P Roy Soc Lond B Bio 264: 1663–1669.
Michener CD & Sokal RR (1957) A quantitative approach to a
problem in classification. Evolution 11: 130–262.
Øvreas L, Forney L, Daae FL & Torsvik V (1997) Distribution of
bacterioplankton in meromictic Lake Saelenvannet, as
determined by denaturing gradient gel electrophoresis of PCR
amplified gene fragments coding for 16S rRNA. Appl Environ
Microb 63: 3367–3373.
Penno S, Lindell D & Post AF (2006) Diversity of Synechococcus
and Prochlorococcus populations determined from DNA
sequences of the N-regulatory gene ntcA. Environ Microbiol 8:
1200–1211.
Perevalova AA, Lebedinsky AV, Bonch-Osmolovskaya EA &
Chernykh NA (2003) Detection of hyperthermophilic archaea
of the genus Desulfurococcus by hybridization with
oligonucleotide probes. Microbiology 72: 340–346.
Pernthaler A, Pernthaler J & Amann R (2002) Fluorescence
in situ hybridization and catalyzed reporter deposition for
identification of marine bacteria. Appl Environ Microb 68:
3094–3101.
Raskin L, Stromley JM, Rittmann BE & Stahl DA (1994) Group
specific 16S rRNA hybridization probes to describe natural
communities of methanogens. Appl Environ Microb 60:
1232–1240.
Sekar R, Pernthaler A, Pernthaler J, Warneke F, Posch T & Amann
R (2003) An improved protocol for quantification of
FEMS Microbiol Ecol 69 (2009) 425–438 c� 2009 Federation of European Microbiological SocietiesPublished by Blackwell Publishing Ltd. All rights reserved
437Archaea in the Gulf of Aqaba

freshwater Actinobacteria by fluorescence in situ hybridization.
Appl Environ Microb 69: 2928–2935.
Shaw AK, Halpern AL, Beeson K, Tran B, Venter JC & Martiny JB
(2008) It’s all relative: ranking the diversity of aquatic bacterial
communities. Environ Microbiol 10: 2200–2210.
Siboni N, Ben-Dov E, Sivan A & Kushmaro A (2008) Global
distribution and diversity of coral-associated Archaea and
their possible role in the coral holobiont nitrogen cycle.
Environ Microbiol 10: 2979–2990.
Simon M & Azam F (1989) Protein content and protein synthesis
rates of planktonic marine bacteria. Mar Ecol-Prog Ser 51:
201–213.
Stahl DA & Amann R (1991) Development and application of
nucleic acid probes. Nucleic Acid Techniques in Bacterial
Systematics (Stackebrandt E & Goodfellow M, eds),
pp. 205–247. John Wiley & Sons, Chichester.
Tamura K, Dudley J, Nei M & Kumar S (2007) MEGA4:
Molecular Evolutionary Genetics Analysis (MEGA) software
version 4.0. Mol Biol Evol 24: 1596–1599.
Teira E, Reinthaler T, Pernthaler A, Pernthaler J & Herndl GJ
(2004) Combining catalyzed reporter deposition-fluorescence
in situ hybridization and microautoradiography to detect
substrate utilization by Bacteria and Archaea in the deep
ocean. Appl Environ Microb 70: 4411–4414.
Teske A & Sørensen KB (2008) Uncultured archaea in deep
marine subsurface sediments: have we caught them all?
ISME J 2: 3–18.
Treusch HA, Leininger S, Kletzin A, Schuster CS, Klenk HP &
Schleper C (2005) Novel genes for nitrite reductase and Amo-
related proteins indicate a role of uncultivated mesophilic
Crenarchaeota in nitrogen cycling. Environ Microbiol 7:
1985–1995.
Wallner G, Amann R & Beisker W (1993) Optimizing fluorescent
in situ hybridization with rRNA-targeted oligonucleotide
probes for flow cytometric identification of microorganisms.
Cytometry 14: 136–143.
Wuchter C, Abbas B, Coolen JLM et al. (2006) Archaeal
nitrification in the ocean. P Natl Acad Sci USA 103:
12317–12322.
Zobell CE (1946) Marine Microbiology. A Monograph on
Hydrobacteriology. Chronica Botanica Company,
Waltham.
FEMS Microbiol Ecol 69 (2009) 425–438c� 2009 Federation of European Microbiological SocietiesPublished by Blackwell Publishing Ltd. All rights reserved
438 D. Ionescu et al.