Using the business cycle to your advantage (Economics for Business, Ch4 draft)
17
1 Chapter 4 Managing the changing economic environment 1 Few businessmen have learned the importance of economic forces on business as severely as Basil O'Hagan. He started what became a well-known chain of Irish pubs in South Africa, which grew to 61 outlets by 1999. An aggressive debt-driven expansion of the franchise came to a halt when interest rates reached a high of 24% in 1999 and the firm ran into cash flow problems. He did not anticipate the rising interest rate and the effect it would have on the cash flow of the firm, instead relying on earlier vague promises of his funders to help him out of any trouble. In July 1999 banks refused to advance further credit, despite O'Hagan's insistence that the business was sound. He was sequestrated and the company liquidated. His net wealth before the catastrophe was in excess of R100 million (more than R220 million in today's money). Soon afterwards he lost almost everything – all of this happened because he failed to recognise the relevant economic forces and how they would impact on his cash flow. 1 Why economic forces should inform strategy The story of O'Hagan is no exception. Disasters like this happen every day in business, most likely because executives underestimate the potency of economic forces or because they believe that there is little they can do to predict and manage the impact of these forces. Corporate strategist, Richard Lynch, estimates that economic forces contribute between 16% and 53% to a firm's profitability, depending on the nature of the business, which suggests that the economy cannot be ignored. Furthermore, executives are not mere victims of economic forces. Recent research by Peter Navarro (2006) has revealed that there are many firms who have the economic intelligence to consistently outwit their competition simply by anticipating the changes in the economy. The secret to using economic forces to your advantage is explained by legendary ice hockey player Wayne Gretzky who said: “I skate to where the puck is going to be, not where it has been.” While it is not possible to anticipate the economy perfectly, if you know what to look for, you can take your firm to where the economy "is going to be" while consistently improving two critical variables: market share and cash flow (not profit). What this chapter aims to show, is that it is indeed possible to anticipate and correctly respond to economic forces. It will give you a set of basic tools that you can use to make intelligent strategic and operational decisions that keeps your firm ahead of both your competitors and the economic cycle. 1 This chapter assumes that you are familiar with the concepts of Chapters 2 and 3. If not review the ideas found in sections xx of Chapter 2 and sections xx of Chapter 3.
Transcript of Using the business cycle to your advantage (Economics for Business, Ch4 draft)
1
Chapter 4 Managing the changing economic environment
1
Few businessmen have learned the importance of economic forces on business as severely as
Basil O'Hagan. He started what became a well-known chain of Irish pubs in South Africa,
which grew to 61 outlets by 1999. An aggressive debt-driven expansion of the franchise came
to a halt when interest rates reached a high of 24% in 1999 and the firm ran into cash flow
problems. He did not anticipate the rising interest rate and the effect it would have on the
cash flow of the firm, instead relying on earlier vague promises of his funders to help him out
of any trouble.
In July 1999 banks refused to advance further credit, despite O'Hagan's insistence that the
business was sound. He was sequestrated and the company liquidated. His net wealth before
the catastrophe was in excess of R100 million (more than R220 million in today's money).
Soon afterwards he lost almost everything – all of this happened because he failed to
recognise the relevant economic forces and how they would impact on his cash flow.
1 Why economic forces should inform strategy
The story of O'Hagan is no exception. Disasters like this happen every day in business, most
likely because executives underestimate the potency of economic forces or because they
believe that there is little they can do to predict and manage the impact of these forces.
Corporate strategist, Richard Lynch, estimates that economic forces contribute between 16%
and 53% to a firm's profitability, depending on the nature of the business, which suggests that
the economy cannot be ignored. Furthermore, executives are not mere victims of economic
forces. Recent research by Peter Navarro (2006) has revealed that there are many firms who
have the economic intelligence to consistently outwit their competition simply by anticipating
the changes in the economy.
The secret to using economic forces to your advantage is explained by legendary ice hockey
player Wayne Gretzky who said: “I skate to where the puck is going to be, not where it has
been.” While it is not possible to anticipate the economy perfectly, if you know what to look
for, you can take your firm to where the economy "is going to be" while consistently
improving two critical variables: market share and cash flow (not profit).
What this chapter aims to show, is that it is indeed possible to anticipate and correctly
respond to economic forces. It will give you a set of basic tools that you can use to make
intelligent strategic and operational decisions that keeps your firm ahead of both your
competitors and the economic cycle.
1 This chapter assumes that you are familiar with the concepts of Chapters 2 and 3. If not review the ideas found
in sections xx of Chapter 2 and sections xx of Chapter 3.

2
2 Fundamentals of the business cycle
In the previous chapter we covered some of the many important indicators of economic
performance. These indicators are quite difficult to keep track of, but fortunately there is one
indicator that binds them together. This indicator is the business cycle, which shows how
economic activity changes over time.
Some people only track the country's GDP to get an idea of the business cycle, but this is
misleading. The business cycle tracks economic activity throughout the economy and should
reflect what is happening with economic activity in general. Simply tracking one indicator
(such as GDP) can sometimes make it appear as if economic activity is declining, when it is
in fact only one or two large sectors that are in decline while the rest of the economy is doing
fine. Only when the majority of the indicators are moving in the same direction can we
confidently draw conclusions about economic activity.
So, the business cycle is really a composite of many different indicators of economic activity
calculated by the South African Reserve Bank. By compiling all these indicators into what
they call a coincident business cycle indicator, they allow us to make sense of what is
happening in the economy, without the need to track a large number of separate indicators
(more about these indicators later in the chapter).
2.1 Phases of the business cycle
The business cycle consists of two main phases: the upswing and downswing phases. These
phases are determined by the turning points of the cycle. As the economy moves from a peak
to a trough, it experiences a downswing phase, and as it then moves from a trough to the next
peak it experiences an upswing phase.
Each phase can then be further divided into two smaller phases as figure 4.1 shows.
Figure 4.1: Phases of the business cycle
Despite the cycles, one would generally expect economic activity in a healthy economy to
follow an upward trend in the long run, as indicated by the rising trend line in figure 4.1.
When economic activity expands and breaks through the trend line, the economy experiences
a boom. Eventually, the economy slumps as economic activity slows down but still remains
above the trend line. If this slowdown continues, economic activity declines so much that it
Upswing:
Boom
Downswing:
Slump
Downswing:
Recession
Upswing:
Recovery
Time
Economic
activity
Turning
point: peak
Turning
point: trough
3
drops below the trend line and the economy enters into a recession. Fortunately, after some
time the economy recovers as the decline reverses, but the increase in economic activity
remains below the trend line.
The South African Reserve Bank only dates the turning points of the business cycle, since it
is very difficult to exactly determine the transition from recovery to boom or from slump to
recession. Even dating the turning points remains challenging; many different methods exist
which give different results (see Bosch & Ruch, 2012). The South African Reserve Bank
currently dates the business cycle turning points as given in the table below:
Table 4.1: The business cycle in South Africa in recent years (as at June 2013)
Upswing period
Duration of
upswing
(months)
Downswing period
Duration of
downswing
(months)
Length of
cycle
(months)
Apr 1986 – Feb 1989 35 Mar 1989 - May 1993 51 86
Jun 1993 - Nov 1996 42 Dec 1996 - Aug 1999 33 75
Sept 1999 - Nov 2007 99 Dec 2007 - Aug 2009 21 120
Sep 2010 - present
Source: SARB Quarterly Bulletin
In an ideal theoretical world the business cycle follows a specific chain of events (what
economists call 'stylised facts'). In reality things are not as precise, but knowing these stylised
facts helps us to form informed expectations and adjust our decisions accordingly.
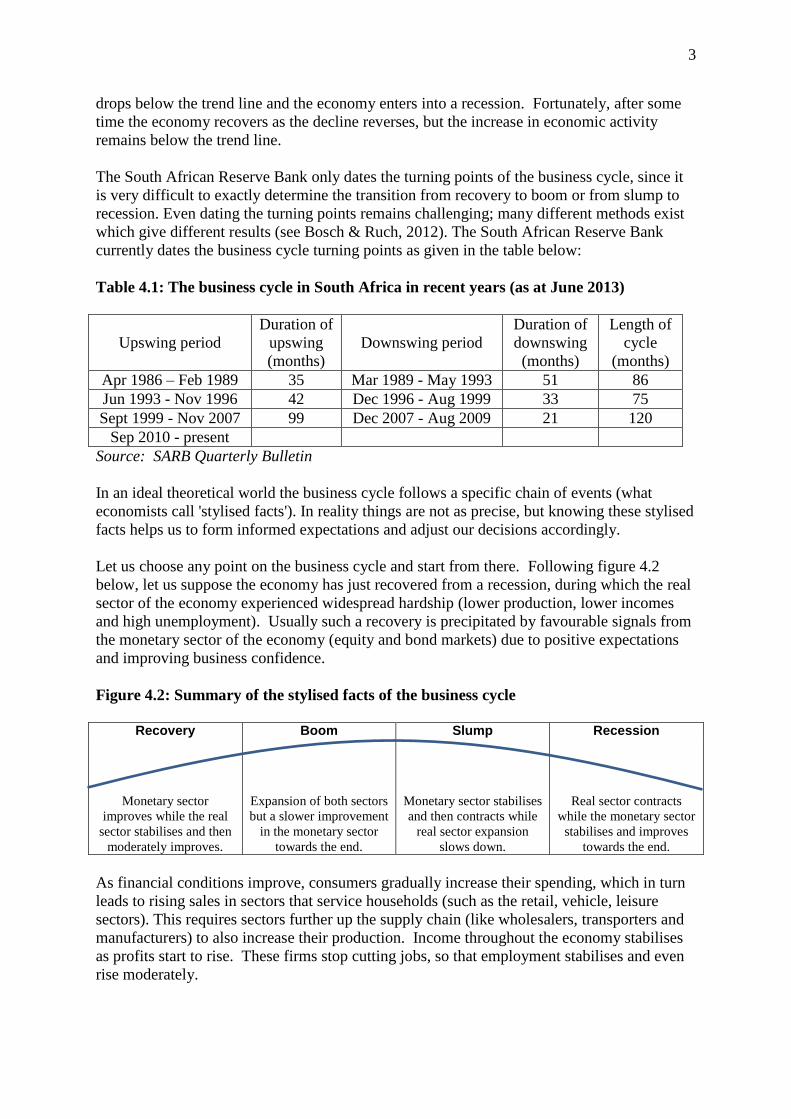
Let us choose any point on the business cycle and start from there. Following figure 4.2
below, let us suppose the economy has just recovered from a recession, during which the real
sector of the economy experienced widespread hardship (lower production, lower incomes
and high unemployment). Usually such a recovery is precipitated by favourable signals from
the monetary sector of the economy (equity and bond markets) due to positive expectations
and improving business confidence.
Figure 4.2: Summary of the stylised facts of the business cycle
Recovery Boom Slump Recession
Monetary sector
improves while the real
sector stabilises and then
moderately improves.
Expansion of both sectors
but a slower improvement
in the monetary sector
towards the end.
Monetary sector stabilises
and then contracts while
real sector expansion
slows down.
Real sector contracts
while the monetary sector
stabilises and improves
towards the end.
As financial conditions improve, consumers gradually increase their spending, which in turn
leads to rising sales in sectors that service households (such as the retail, vehicle, leisure
sectors). This requires sectors further up the supply chain (like wholesalers, transporters and
manufacturers) to also increase their production. Income throughout the economy stabilises
as profits start to rise. These firms stop cutting jobs, so that employment stabilises and even
rise moderately.

4
If this recovery continues long enough, the economy enters a boom period. The ever rising
spending now puts strain on the production capacity of firms, so they start to increase their
fixed investment in order to add the necessary capacity (more factories, stores, equipment
etc.). This requires further employment, so that unemployment starts to fall at a faster rate
while incomes accelerate. At this point, everything seems to be going well as economic
growth rises and unemployment falls. Business profits rise and this is reflected in continued
positive developments in the monetary sector (e.g. rising share prices in the equity market).
But the boom brings its own problems. Eventually firms cannot keep up with the rising
spending, and shortages and delays occur. This increases costs which, combined with the
high demand for products, start to cause prices to rise at a faster rate so that the inflation rate
increases. The country's imports also rise faster than its exports as rising incomes create a
demand for luxury goods, and rising fixed investment create a demand for capital goods. The
current account now moves to a deficit (or an existing deficit widens). The higher inflation
and widening current account deficit are signs that the economy is overheating, and heading
for a slowdown. During extended booms, consumers also go on debt-fuelled shopping
sprees, while some firms engage in speculative investments, which (like a pyramid scheme)
can only succeed as long as the good times continue. But the good times always come to an
end. Warnings of the coming slowdown come from the monetary sector as the financial
markets start to stabilise and even contract, as some of the speculative investments fail, debt
becomes unsustainable and expectations of a contraction spread.
The process now works in reverse as the economy moves from a boom to a slump. The real
sector shows slower growth as increasing costs and delays hamper faster expansion. Incomes
rise at a slower rate, which impacts on sales of product. Profits decline because the sales are
not growing fast enough to compensate for firms' spending on the fixed investment projects
which they started during the boom period. Firms may halt some of their expansion plans
and stop employing more workers, so eventually employment and incomes stabilise. Lower
profits and increasingly negative expectations ultimately lead to a worsening of the monetary
sector, which further harms spending by households.
The upside of the slowdown in economic activity is that the economy starts to cool down.
Lower spending gives firms a chance to catch up with the demand for their products, and as a
result the inflation rate stabilises. Lower spending on luxury goods and the cancellation of
some expansion plans means that there is less need for imported luxury goods and
technology. As imports slow down, the current account deficit stabilises (the deficit may
even fall depending on whether other countries still need our exports).
However, if the slowdown continues, the economy enters into a recession and economic
activity declines throughout the economy. Lower incomes lead to lower spending, which
forces firms to cut jobs in order to stay profitable. Some firms will be hit hard by lower sales
and many will be liquidated. This leads to higher unemployment, which aggravates the
already declining income. In severe cases, the economic growth rate will turn negative. The
fall in inflation continues due to the lack of demand for products in the economy, and the
current account may return to a surplus as the need for imported products disappear.
Usually, this decline cannot continue for long as expectations of a recovery appear, and are
reflected in slight improvements in the monetary sector. But in rare cases, the symptoms of a
recession worsen and the economy descends into a depression. During a depression, there is
so little demand for products, that the fall in inflation becomes deflation. Instead of the
5
monetary sector improving, in a depression we see continued drops in the prices of financial
assets and possibly bank failures. Matters become so bad that nobody in the private sector
expects things to improve.
The worst depression in recent times was the Great Depression (1929-1939) though the world
came very close to a depression following the Financial Crisis (2007-2009). Fortunately,
after the Great Depression we learned a number of valuable lessons – one being that the
economic authorities (like the government and central bank) can intervene to help stabilise
severe swings in the business cycle and create expectations of a brighter future.
2.2 Policy responses to the business cycle
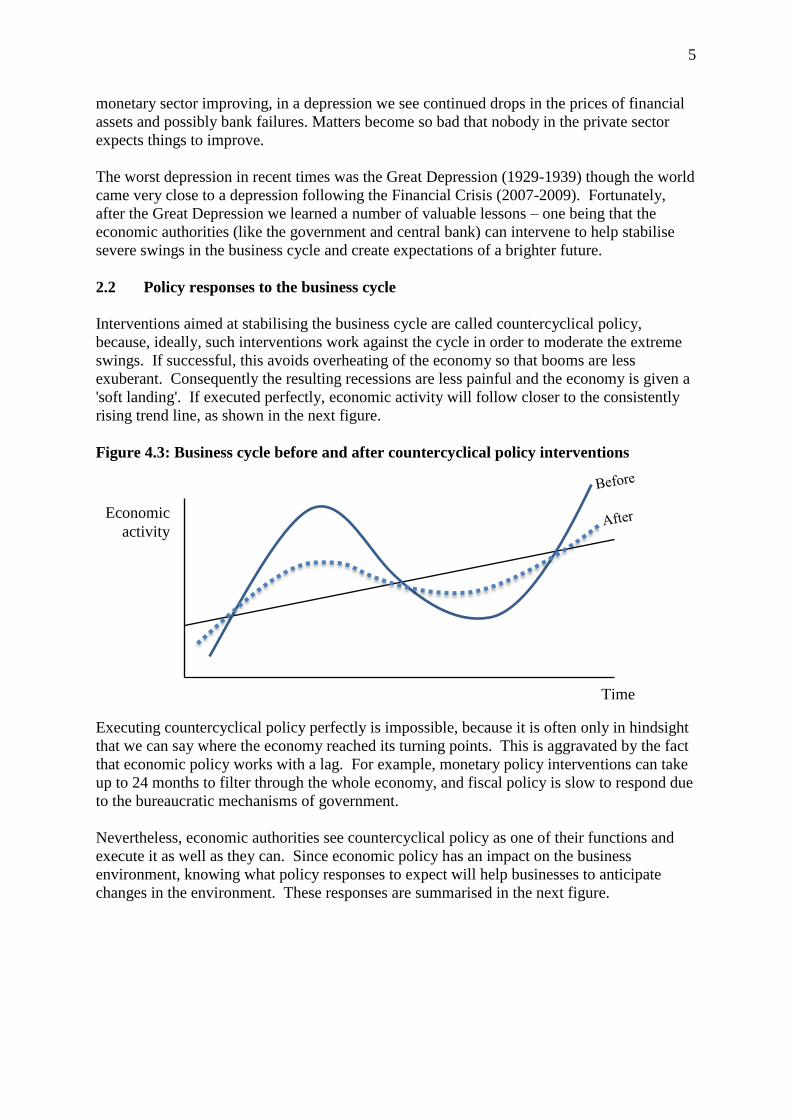
Interventions aimed at stabilising the business cycle are called countercyclical policy,
because, ideally, such interventions work against the cycle in order to moderate the extreme
swings. If successful, this avoids overheating of the economy so that booms are less
exuberant. Consequently the resulting recessions are less painful and the economy is given a
'soft landing'. If executed perfectly, economic activity will follow closer to the consistently
rising trend line, as shown in the next figure.
Figure 4.3: Business cycle before and after countercyclical policy interventions
Executing countercyclical policy perfectly is impossible, because it is often only in hindsight
that we can say where the economy reached its turning points. This is aggravated by the fact
that economic policy works with a lag. For example, monetary policy interventions can take
up to 24 months to filter through the whole economy, and fiscal policy is slow to respond due
to the bureaucratic mechanisms of government.
Nevertheless, economic authorities see countercyclical policy as one of their functions and
execute it as well as they can. Since economic policy has an impact on the business
environment, knowing what policy responses to expect will help businesses to anticipate
changes in the environment. These responses are summarised in the next figure.
Time
Economic
activity
6
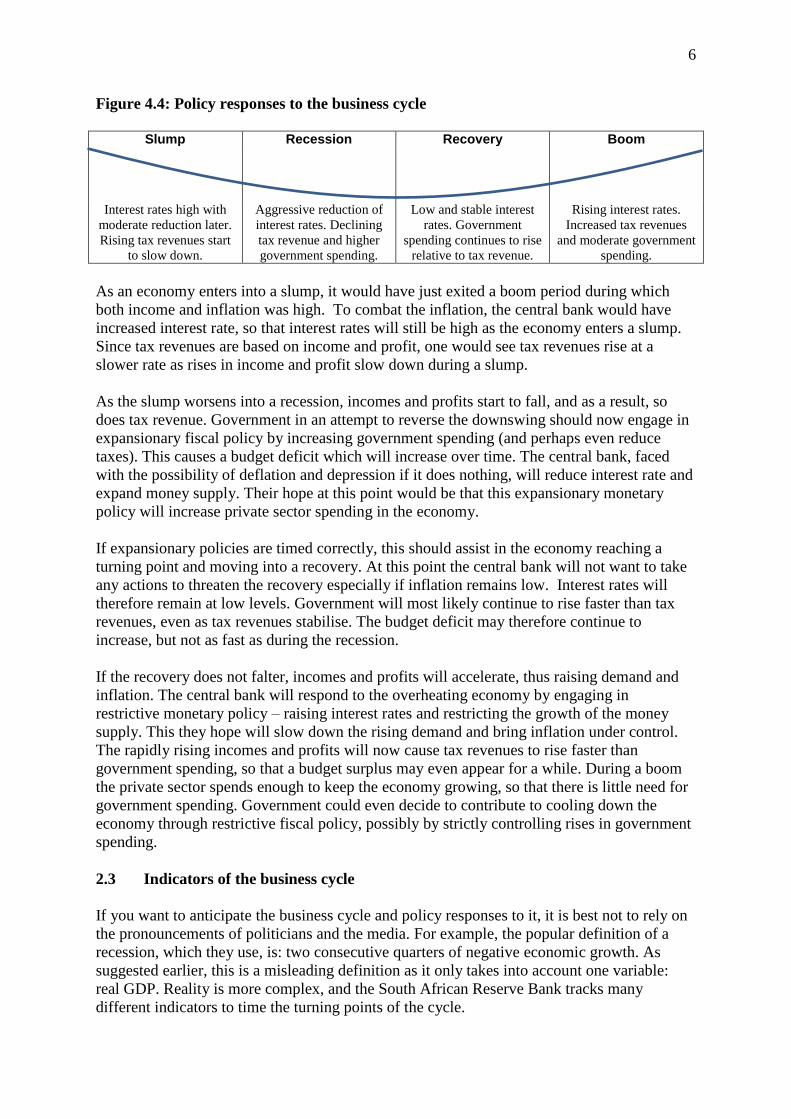
Figure 4.4: Policy responses to the business cycle
Slump Recession Recovery Boom
Interest rates high with
moderate reduction later.
Rising tax revenues start
to slow down.
Aggressive reduction of
interest rates. Declining
tax revenue and higher
government spending.
Low and stable interest
rates. Government
spending continues to rise
relative to tax revenue.
Rising interest rates.
Increased tax revenues
and moderate government
spending.
As an economy enters into a slump, it would have just exited a boom period during which
both income and inflation was high. To combat the inflation, the central bank would have
increased interest rate, so that interest rates will still be high as the economy enters a slump.
Since tax revenues are based on income and profit, one would see tax revenues rise at a
slower rate as rises in income and profit slow down during a slump.
As the slump worsens into a recession, incomes and profits start to fall, and as a result, so
does tax revenue. Government in an attempt to reverse the downswing should now engage in
expansionary fiscal policy by increasing government spending (and perhaps even reduce
taxes). This causes a budget deficit which will increase over time. The central bank, faced
with the possibility of deflation and depression if it does nothing, will reduce interest rate and
expand money supply. Their hope at this point would be that this expansionary monetary
policy will increase private sector spending in the economy.
If expansionary policies are timed correctly, this should assist in the economy reaching a
turning point and moving into a recovery. At this point the central bank will not want to take
any actions to threaten the recovery especially if inflation remains low. Interest rates will
therefore remain at low levels. Government will most likely continue to rise faster than tax
revenues, even as tax revenues stabilise. The budget deficit may therefore continue to
increase, but not as fast as during the recession.
If the recovery does not falter, incomes and profits will accelerate, thus raising demand and
inflation. The central bank will respond to the overheating economy by engaging in
restrictive monetary policy – raising interest rates and restricting the growth of the money
supply. This they hope will slow down the rising demand and bring inflation under control.
The rapidly rising incomes and profits will now cause tax revenues to rise faster than
government spending, so that a budget surplus may even appear for a while. During a boom
the private sector spends enough to keep the economy growing, so that there is little need for
government spending. Government could even decide to contribute to cooling down the
economy through restrictive fiscal policy, possibly by strictly controlling rises in government
spending.
2.3 Indicators of the business cycle
If you want to anticipate the business cycle and policy responses to it, it is best not to rely on
the pronouncements of politicians and the media. For example, the popular definition of a
recession, which they use, is: two consecutive quarters of negative economic growth. As
suggested earlier, this is a misleading definition as it only takes into account one variable:
real GDP. Reality is more complex, and the South African Reserve Bank tracks many
different indicators to time the turning points of the cycle.

7
It is more accurate to pay attention to the SARB's coincident business cycle indicator, which
is an index that reflects changes in economic activity as they happen. The coincident
indicator coincides with the business cycle, and appears in the figure below, with the shaded
area showing the most recent downswing phase of the business cycle.
Figure 4.5: Coincident business cycle indicator (2002-2013)
Source: South African Reserve Bank
While the coincident indicator gives a fairly accurate idea of the current state of economic
activity, it is of little use to businesses that want to anticipate and prepare for future changes
in the business cycle. For this purpose, the SARB publishes a leading business cycle
indicator, which changes in advance of changes in the business cycle.
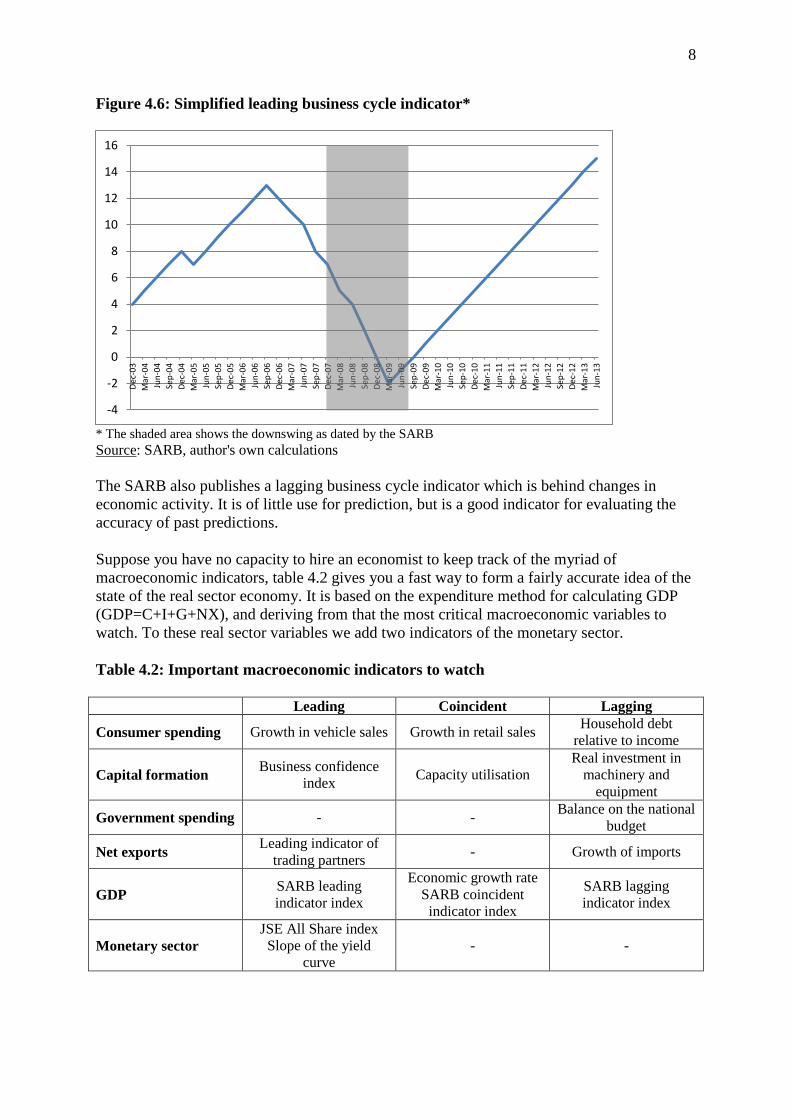
The leading business cycle indicator is not always accurate. Most economists have found that
a simplified leading business cycle indicator, containing the two main indicators of financial
conditions, works as well or even better than the published leading indicator. As explained
earlier, the monetary sector tends to lead the business cycle, so that we can reduce the leading
indicator to a combination of an indicator of the equity market (JSE All Share Index) and the
bond market (slope of the yield curve). (The yield curve shows the interest rate for financial
instruments of different levels of maturity, from short-term to long-term. It will be discussed
in more detail in a later chapter on the monetary sector.) As seen in figure 4.6, this simplified
leading indicator already signalled the coming downswing almost 18 months before the peak
turning point was reached. It also signalled a recovery almost six months before the trough
was reached.
Someone who relied on the popular definition of a recession (two consecutive quarters of
negative economic growth) would only have realised that there is a downswing early in 2009,
more than one year after it started and only six months before the recovery would start! This
would have been too late for a person with the responsibility of guiding a firm through a
difficult economic environment.
8
Figure 4.6: Simplified leading business cycle indicator*
* The shaded area shows the downswing as dated by the SARB
Source: SARB, author's own calculations
The SARB also publishes a lagging business cycle indicator which is behind changes in
economic activity. It is of little use for prediction, but is a good indicator for evaluating the
accuracy of past predictions.
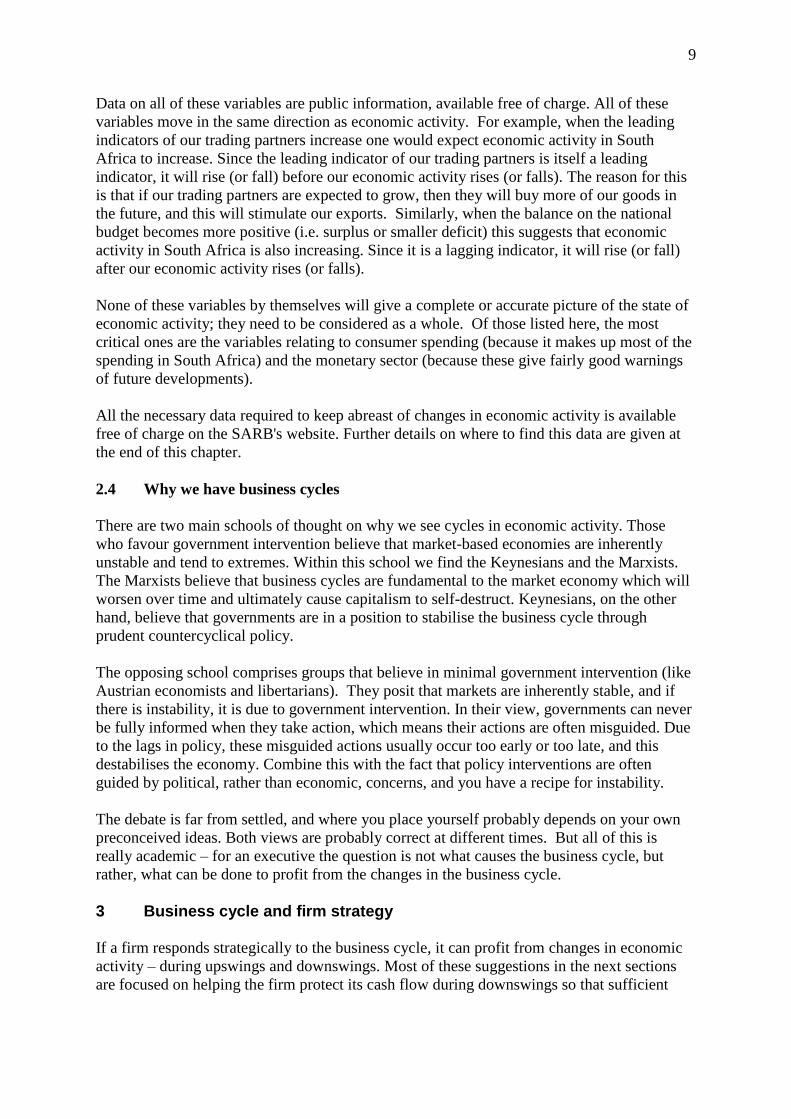
Suppose you have no capacity to hire an economist to keep track of the myriad of
macroeconomic indicators, table 4.2 gives you a fast way to form a fairly accurate idea of the
state of the real sector economy. It is based on the expenditure method for calculating GDP
(GDP=C+I+G+NX), and deriving from that the most critical macroeconomic variables to
watch. To these real sector variables we add two indicators of the monetary sector.
Table 4.2: Important macroeconomic indicators to watch
Leading Coincident Lagging
Consumer spending Growth in vehicle sales Growth in retail sales Household debt
relative to income
Capital formation Business confidence
index Capacity utilisation
Real investment in
machinery and
equipment
Government spending - - Balance on the national
budget
Net exports Leading indicator of
trading partners - Growth of imports
GDP SARB leading
indicator index
Economic growth rate
SARB coincident
indicator index
SARB lagging
indicator index
Monetary sector
JSE All Share index
Slope of the yield
curve
- -
-4
-2
0
2
4
6
8
10
12
14
16Dec-03
Mar-04
Jun-04
Sep-04
Dec-04
Mar-05
Jun-05
Sep-05
Dec-05
Mar-06
Jun-06
Sep-06
Dec-06
Mar-07
Jun-07
Sep-07
Dec-07
Mar-08
Jun-08
Sep-08
Dec-08
Mar-09
Jun-09
Sep-09
Dec-09
Mar-10
Jun-10
Sep-10
Dec-10
Mar-11
Jun-11
Sep-11
Dec-11
Mar-12
Jun-12
Sep-12
Dec-12
Mar-13
Jun-13
9
Data on all of these variables are public information, available free of charge. All of these
variables move in the same direction as economic activity. For example, when the leading
indicators of our trading partners increase one would expect economic activity in South
Africa to increase. Since the leading indicator of our trading partners is itself a leading
indicator, it will rise (or fall) before our economic activity rises (or falls). The reason for this
is that if our trading partners are expected to grow, then they will buy more of our goods in
the future, and this will stimulate our exports. Similarly, when the balance on the national
budget becomes more positive (i.e. surplus or smaller deficit) this suggests that economic
activity in South Africa is also increasing. Since it is a lagging indicator, it will rise (or fall)
after our economic activity rises (or falls).
None of these variables by themselves will give a complete or accurate picture of the state of
economic activity; they need to be considered as a whole. Of those listed here, the most
critical ones are the variables relating to consumer spending (because it makes up most of the
spending in South Africa) and the monetary sector (because these give fairly good warnings
of future developments).
All the necessary data required to keep abreast of changes in economic activity is available
free of charge on the SARB's website. Further details on where to find this data are given at
the end of this chapter.
2.4 Why we have business cycles
There are two main schools of thought on why we see cycles in economic activity. Those
who favour government intervention believe that market-based economies are inherently
unstable and tend to extremes. Within this school we find the Keynesians and the Marxists.
The Marxists believe that business cycles are fundamental to the market economy which will
worsen over time and ultimately cause capitalism to self-destruct. Keynesians, on the other
hand, believe that governments are in a position to stabilise the business cycle through
prudent countercyclical policy.
The opposing school comprises groups that believe in minimal government intervention (like
Austrian economists and libertarians). They posit that markets are inherently stable, and if
there is instability, it is due to government intervention. In their view, governments can never
be fully informed when they take action, which means their actions are often misguided. Due
to the lags in policy, these misguided actions usually occur too early or too late, and this
destabilises the economy. Combine this with the fact that policy interventions are often
guided by political, rather than economic, concerns, and you have a recipe for instability.
The debate is far from settled, and where you place yourself probably depends on your own
preconceived ideas. Both views are probably correct at different times. But all of this is
really academic – for an executive the question is not what causes the business cycle, but
rather, what can be done to profit from the changes in the business cycle.
3 Business cycle and firm strategy
If a firm responds strategically to the business cycle, it can profit from changes in economic
activity – during upswings and downswings. Most of these suggestions in the next sections
are focused on helping the firm protect its cash flow during downswings so that sufficient
10
cash is available to take advantage of the opportunities during the upswing. In the process,
the firm's profitability and market share will gradually improve.
3.1 A functional view
Since a firm is not a homogenous unit, but made up of many functions, this section will show
how each function should respond to the movements in the business cycle. The functions
covered here are: purchasing and inventory management, marketing and advertising, pricing,
capital expenditure, corporate finance, acquisitions and divestitures and human resources.
One of the last things a firm want to be saddled with is large amounts of unsold inventory
lying in warehouses during a recession (which drains cash) or too little inventory as the
economy booms (which causes loss of market share). To manage this situation, a firm needs
to anticipate movements in the business cycle by acting proactively in advance of these
movements. As with all the other functions, you will note that the suggestions made here are
often the opposite of what firms usually do (since most simply react to the business cycle).
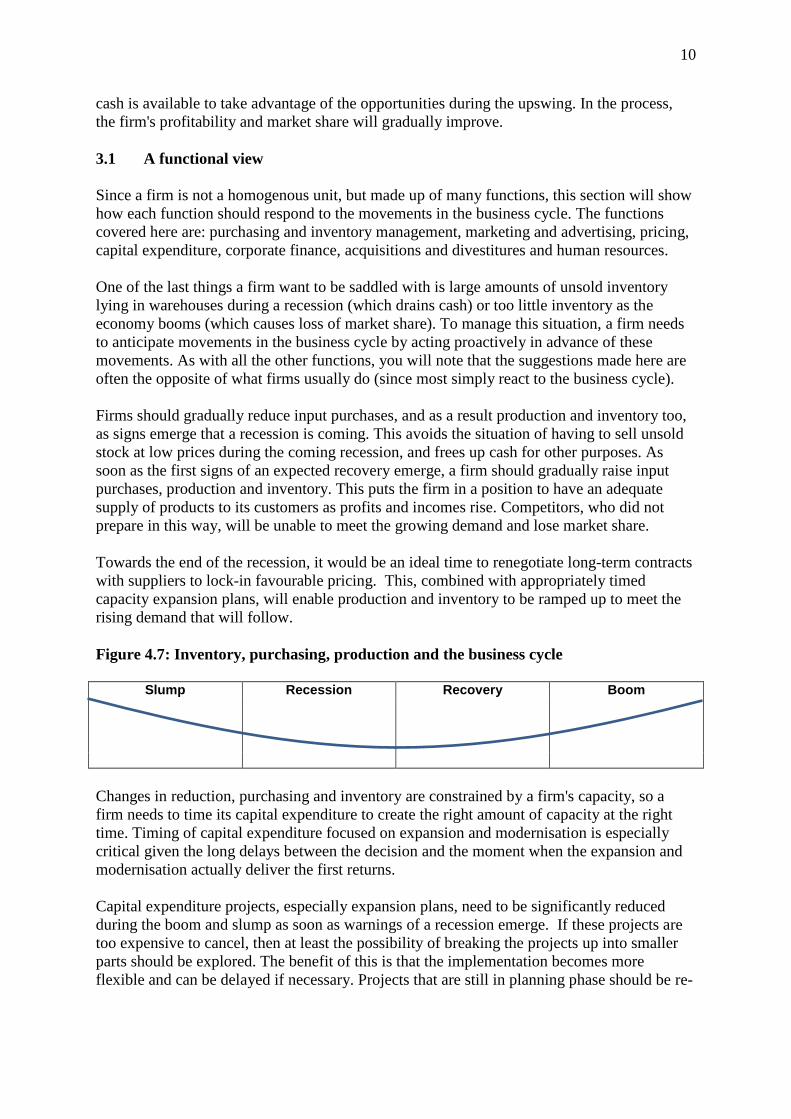
Firms should gradually reduce input purchases, and as a result production and inventory too,
as signs emerge that a recession is coming. This avoids the situation of having to sell unsold
stock at low prices during the coming recession, and frees up cash for other purposes. As
soon as the first signs of an expected recovery emerge, a firm should gradually raise input
purchases, production and inventory. This puts the firm in a position to have an adequate
supply of products to its customers as profits and incomes rise. Competitors, who did not
prepare in this way, will be unable to meet the growing demand and lose market share.
Towards the end of the recession, it would be an ideal time to renegotiate long-term contracts
with suppliers to lock-in favourable pricing. This, combined with appropriately timed
capacity expansion plans, will enable production and inventory to be ramped up to meet the
rising demand that will follow.
Figure 4.7: Inventory, purchasing, production and the business cycle
Slump Recession Recovery Boom
Changes in reduction, purchasing and inventory are constrained by a firm's capacity, so a
firm needs to time its capital expenditure to create the right amount of capacity at the right
time. Timing of capital expenditure focused on expansion and modernisation is especially
critical given the long delays between the decision and the moment when the expansion and
modernisation actually deliver the first returns.
Capital expenditure projects, especially expansion plans, need to be significantly reduced
during the boom and slump as soon as warnings of a recession emerge. If these projects are
too expensive to cancel, then at least the possibility of breaking the projects up into smaller
parts should be explored. The benefit of this is that the implementation becomes more
flexible and can be delayed if necessary. Projects that are still in planning phase should be re-
11
evaluated. All this will allow the firm to reduce debt and build up the necessary cash reserves
to exploit the opportunities presented by the recession and following recovery.
When the recession occurs, capital expenditure should be increased so that the firm has the
capacity in time for the rising demand that will accompany the subsequent upswing.
Upgrades, modernisation and R&D are also best done during a recession when a reduction in
capacity has the lowest opportunity cost (in terms of lost sales). This will be made possible
by the cash accumulation that would have taken place in anticipation of the recession. While
competitors will struggle to keep up with demand due to inadequate capacity, the proactive
firm will gain market share as it is able to adequately supply the market with innovative and
high quality products.
During a recession, many distressed rival firms may be selling off assets and capacity at
lower prices. A firm who managed its cash flow in preparation for a downswing will find that
it can often buy the best assets and so add to its capacity at a much lower cost. Similarly, a
recession is also an excellent time to renegotiate soon-to-expire leases or negotiate lower new
leases at significantly lower prices.
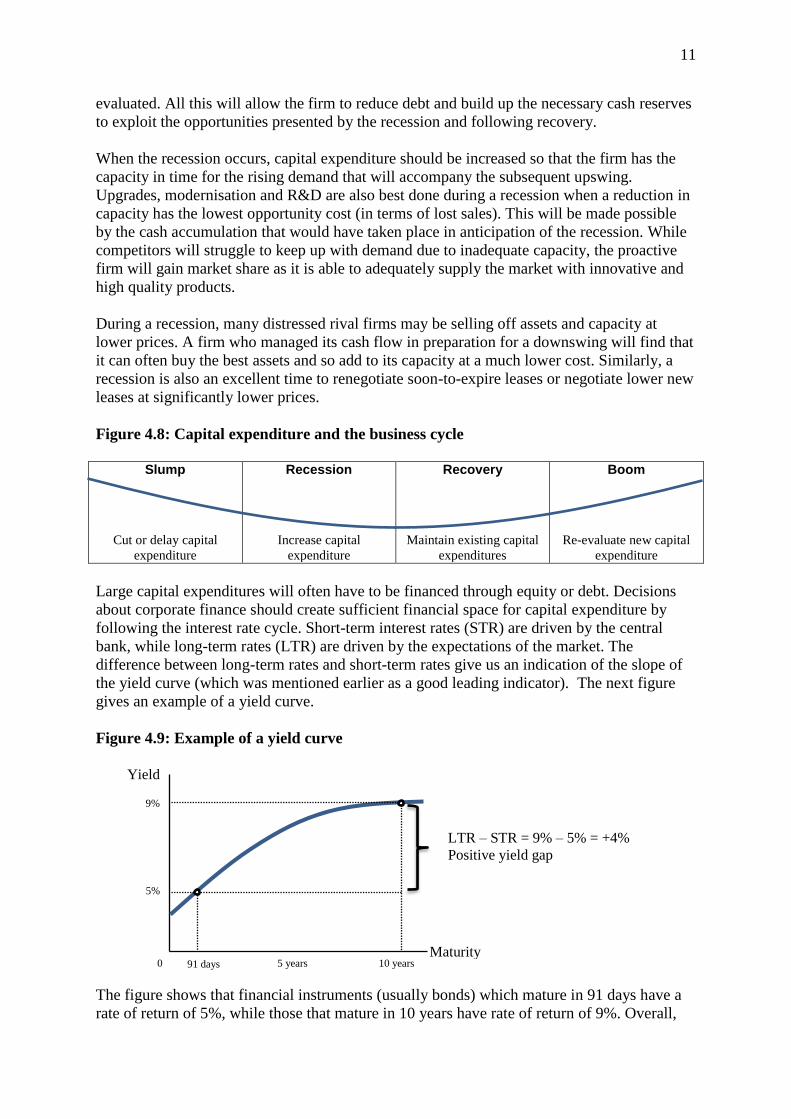
Figure 4.8: Capital expenditure and the business cycle
Slump Recession Recovery Boom
Cut or delay capital
expenditure
Increase capital
expenditure
Maintain existing capital
expenditures
Re-evaluate new capital
expenditure
Large capital expenditures will often have to be financed through equity or debt. Decisions
about corporate finance should create sufficient financial space for capital expenditure by
following the interest rate cycle. Short-term interest rates (STR) are driven by the central
bank, while long-term rates (LTR) are driven by the expectations of the market. The
difference between long-term rates and short-term rates give us an indication of the slope of
the yield curve (which was mentioned earlier as a good leading indicator). The next figure
gives an example of a yield curve.
Figure 4.9: Example of a yield curve
The figure shows that financial instruments (usually bonds) which mature in 91 days have a
rate of return of 5%, while those that mature in 10 years have rate of return of 9%. Overall,
Yield
Maturity 10 years 5 years 91 days 0
5%
9%
LTR – STR = 9% – 5% = +4%
Positive yield gap

12
the rate rises in this case for financial instruments with longer maturities. The SARB
determines the slope of the yield curve by the difference in the rates on 10-year government
bonds (LTR) and 91-day Treasury Bills (STR). The difference gives us the slope of the yield
curve (or yield gap) which can be either positive (upward sloping) or negative (downward
sloping).
One important decision to make is whether to rely on short-term or long-term debt in order to
minimise financing costs. Since the slope of the yield curve changes in advance of the
business cycle, it follows a predictable pattern which tells us whether short-term or long-term
debt will be more favourable to the firm. The change in the yield curve over the business
cycle is given in the next figure.
Figure 4.10: Yield curve and the business cycle
Boom Slump Recession Recovery
STR > LTR
Increasingly negative
yield gap
Negative yield gap
getting smaller, until
yield curve flattens
STR < LTR
Increasingly positive
yield gap
Positive yield gap getting
smaller, until yield curve
flattens
What all this implies is that short-term debt is most attractive from around the end of a slump
until the end of a recovery, while long-term debt is most attractive from the start of a boom
until close to the end of a slump. A firm should, if at all possible try to lock in, for as long as
possible, the low interest rates that prevail at the trough of the business cycle, and it should
resist invitations from banks to lock-in the high interest rates that prevail at the peak of the
cycle.
If equity is considered for funding, that too should be timed according to the business cycle.
The performance of the equity market (the JSE Securities Exchange in South Africa) is a
leading indicator as mentioned earlier. That means that share prices reach their peak around
9-12 months before the peak of the business cycle. To acquire the maximum amount of funds
from a share issue, new shares should be issued in the early and middle stages of the boom.
Figure 4.11: Corporate finance and the business cycle
Slump Recession Recovery Boom
Long-term debt Short-term debt Short-term debt Equity issues
Long-term debt
The marketing function should align itself with the firm's expansion plans and the other
functions relevant to production. A firm will sabotage its strategic response to the business
cycle if it cuts inventory and production while raising marketing expenditure. Also, it is of no
use to modernise and expand capacity if there is insufficient marketing.
Marketing spending should be cut during the late boom period as soon as a downswing is
anticipated. At this point, firms ignorant of the business cycle will be expanding their
13
marketing functions aggressively and increasing advertising spending. This is misguided for
two reasons: (1) if most firms are doing this, the attention space of customers is becoming
overcrowded so that advertising will yield diminishing returns; and (2) it eats up valuable
cash that will soon be needed to benefit from the coming slowdown.
As the economy enters into a recession, it is time to expand marketing spending. This seems
counterintuitive, but research shows that spending on marketing and advertising delivers the
best returns during recessions. This is because most firms have little cash to advertise, so the
few firms that do advertise find that their messages stand out more clearly. Advertising
agencies will also be finding it difficult to obtain new business, which makes it possible to
negotiate more favourable contracts with them. As a result the firm will not only gain more
market share, but also at a lower cost.
To make advertising more effective during a recession, it is best to change the product
offering and marketing message to focus on value. The customers gained in this way can then
be retained during the boom through loyalty programmes and by designing offerings more
appealing to an environment of rising wealth.
Some competitors will be exiting certain market segments or reducing their product offerings
during a recession in order to survive. Even if they don't, many of them will be retrenching
staff, which will cause them to neglect customers and their quality to suffer. If some of these
customers, product lines or segments are potentially lucrative during an upswing, this
presents an opportunity for substantial market share gains by focusing marketing efforts on
these now neglected areas.
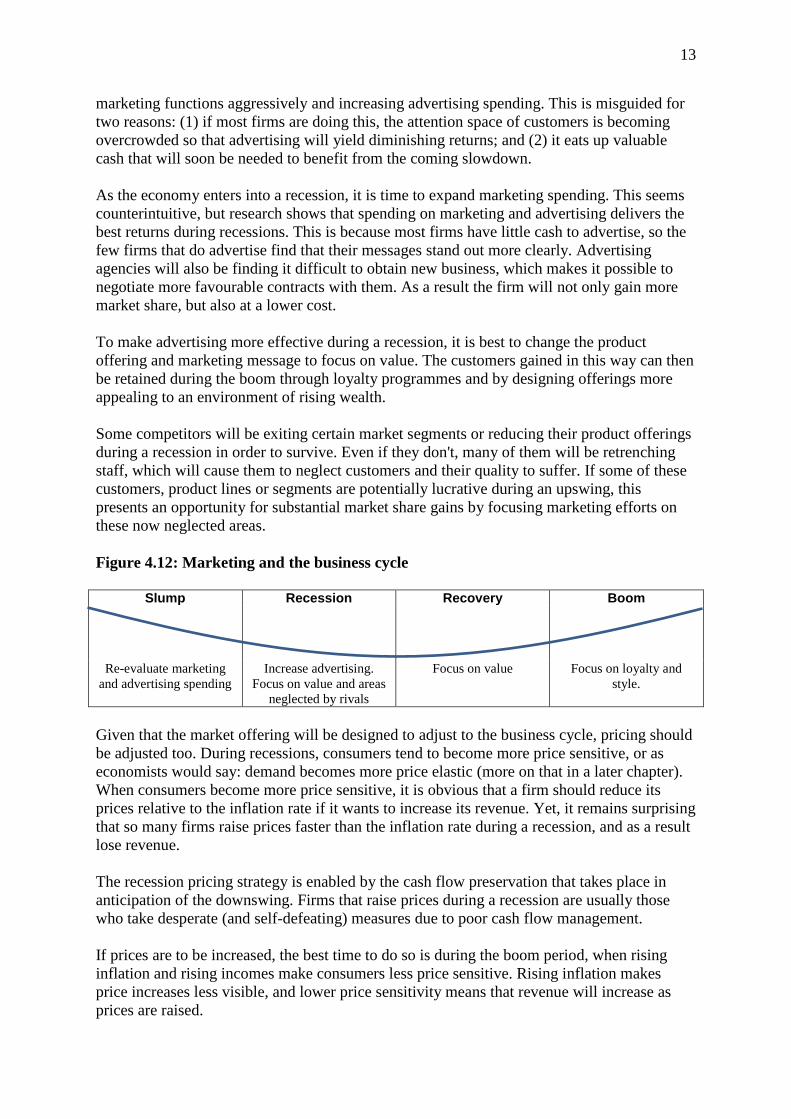
Figure 4.12: Marketing and the business cycle
Slump Recession Recovery Boom
Re-evaluate marketing
and advertising spending
Increase advertising.
Focus on value and areas
neglected by rivals
Focus on value Focus on loyalty and
style.
Given that the market offering will be designed to adjust to the business cycle, pricing should
be adjusted too. During recessions, consumers tend to become more price sensitive, or as
economists would say: demand becomes more price elastic (more on that in a later chapter).
When consumers become more price sensitive, it is obvious that a firm should reduce its
prices relative to the inflation rate if it wants to increase its revenue. Yet, it remains surprising
that so many firms raise prices faster than the inflation rate during a recession, and as a result
lose revenue.
The recession pricing strategy is enabled by the cash flow preservation that takes place in
anticipation of the downswing. Firms that raise prices during a recession are usually those
who take desperate (and self-defeating) measures due to poor cash flow management.
If prices are to be increased, the best time to do so is during the boom period, when rising
inflation and rising incomes make consumers less price sensitive. Rising inflation makes
price increases less visible, and lower price sensitivity means that revenue will increase as
prices are raised.

14
Figure 4.13: Pricing and the business cycle
Slump Recession Recovery Boom
Maintain price increases
in line with inflation
Cut prices relative to the
inflation rate
Maintain price increases
in line with inflation
Raise price increases in
line with inflation
Acquisitions and divestitures can be timed in such a way that high-potential firms are
acquired at a low price, while unwanted business units are sold at a high price. Again, this
follows the equity market cycle, which leads the business cycle.
Equity prices are at their lowest at the end of recession and beginning of a recovery. This
will also be the time when many firms will be in financial trouble, which makes it the ideal
point at which to buy high-potential firms at the lowest prices. A firm which followed the
suggestions above will find itself with sufficient cash and good standing with banks so that it
can execute these acquisitions. Research by McKinsey Consulting confirms this: they found
that successful firms make most of their acquisitions during recessions.
One way to secure additional cash is to sell unwanted business units at high prices. Equity
prices are at their highest during the early to middle parts of a boom, and this is the ideal time
to exploit the over-optimism in the market and sell off non-core business (even if those non-
core business units are performing well) at a premium.
Figure 4.14: Acquisitions, divestitures and the business cycle
Slump Recession Recovery Boom
Explore potential
acquisition opportunities
Buy troubled but high-
potential firms
Audit the business to
identify non-core units
Sell unnecessary business
units
Without the right people, none of these suggestions can be properly executed, but again,
timing is everything with human resources decisions. When the signs of a coming recession
appear, a firm should slow down and carefully evaluate recruitment (especially of
administrative staff). As the slowdown occurs, it is time to consider workforce reductions and
flexible work and compensation arrangements. This frees up cash, which will be used during
the recession to select the best talent from a deep pool of unemployed and unsatisfied and
overworked staff at other firms. The firm should especially be on the lookout for talented
R&D, marketing and sales staff that are being let go at rival firms. These new employees can
then be incentivised to stay through "golden handcuffs" like bonuses or profit sharing
schemes that deliver benefits over time.
Training should not take place during the boom when training providers are charging
excessive fees. It is much better to train workers during the later parts of a recession and
recovery when most training providers are looking for work and charging lower fees. Also,
cross-training of employees should take place during the recovery phase to prepare them for
15
the flexible work arrangements and possible cutbacks that will follow in the slump and
recession.
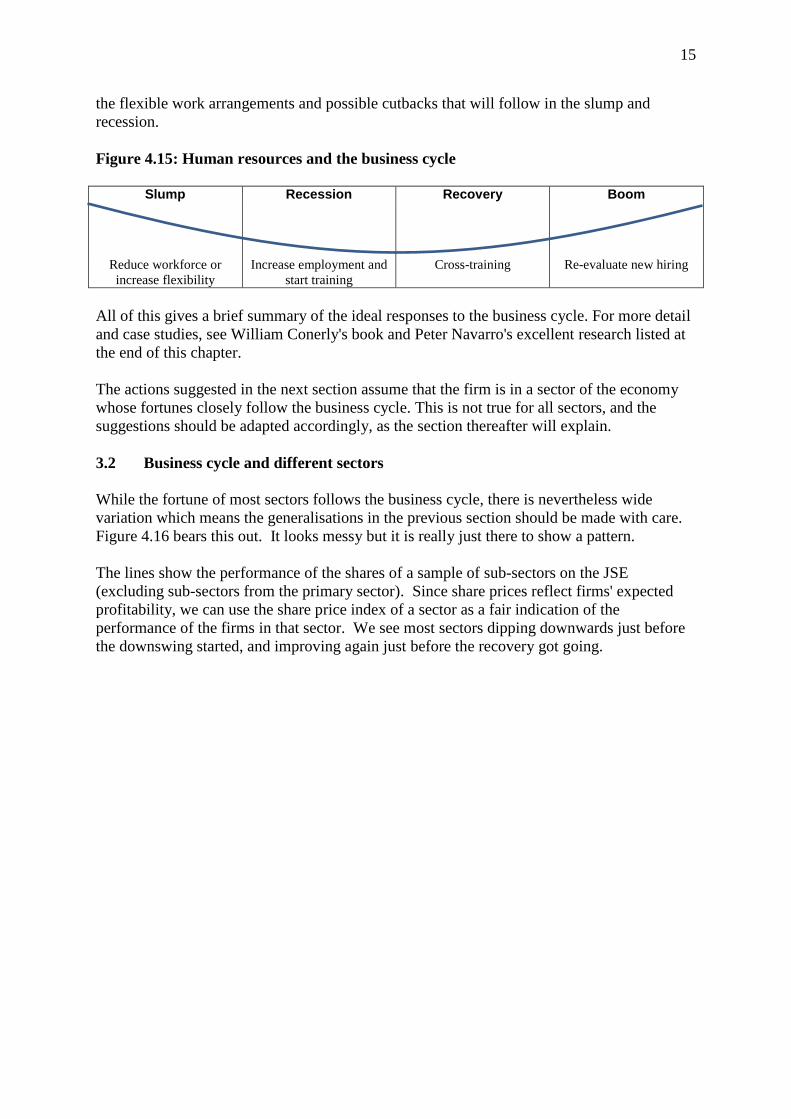
Figure 4.15: Human resources and the business cycle
Slump Recession Recovery Boom
Reduce workforce or
increase flexibility
Increase employment and
start training
Cross-training Re-evaluate new hiring
All of this gives a brief summary of the ideal responses to the business cycle. For more detail
and case studies, see William Conerly's book and Peter Navarro's excellent research listed at
the end of this chapter.
The actions suggested in the next section assume that the firm is in a sector of the economy
whose fortunes closely follow the business cycle. This is not true for all sectors, and the
suggestions should be adapted accordingly, as the section thereafter will explain.
3.2 Business cycle and different sectors
While the fortune of most sectors follows the business cycle, there is nevertheless wide
variation which means the generalisations in the previous section should be made with care.
Figure 4.16 bears this out. It looks messy but it is really just there to show a pattern.
The lines show the performance of the shares of a sample of sub-sectors on the JSE
(excluding sub-sectors from the primary sector). Since share prices reflect firms' expected
profitability, we can use the share price index of a sector as a fair indication of the
performance of the firms in that sector. We see most sectors dipping downwards just before
the downswing started, and improving again just before the recovery got going.

16
Figure 4.16: Sector variation and the business cycle
Note however, that there are a number of sectors that did not change very much during the
downswing, and that some improved faster than others during the recovery. The greatest
variation in performance is evident in the boom period just before the downswing.
The following sectors appear to be most sensitive to the business cycle
Industrial metals
Automobiles and parts
Electronic and electrical equipment
Travel and leisure
The following sectors are most insensitive to the business cycle. Firms in these sectors may
not need to reduce capital expenditure, production, inventory and human resources during a
recession. They may simply need to be more cautious about such decisions in anticipation of
a downswing:
Food producers
Food and drug retailers
Beverages
Consumer goods and services
Telecommunications
Media
4 Some caution
When trying to anticipate the business cycle, do not expect to be exactly right all the time.
Sometimes the indicators give false signals; sometimes the signals come too early. That is
why it is important to make gradual adjustments if possible. It is impossible to get the timing

17
perfectly right, so it is best not to try. It is best to aim to be vaguely right, than ending up
being exactly wrong. The cost of aiming for perfect timing is usually being too late to
respond, and as we saw this can be disastrous in terms of cash flow and market share.
Since there will sometimes be false signals coming from the economic data, it is best to take
small steps when making decisions about human resources, marketing or corporate finance. It
would also be preferable to aim for modularity when making decisions about capital
expenditure. Not all expansions and modernisations are all-or-nothing decisions, and can
often be approach in smaller parts.
Everything discussed in this chapter can also be applied to personal investment decisions. It
is beyond the scope of this chapter to delve into that, but you can see Wentzel (2009) for an
overview of these ideas.
By the way, at the time of writing the story of Basil O'Hagan is looking more positive again.
He started a new chain of Irish pubs, and has now learned to watch his cash flow and, of
course, the economy…
5 Further reading
For more information about Basil O'Hagan see:
http://old.leadershiponline.co.za/articles/other/411-the-comeback-kid
Economic data:
Relevant economic data on the business cycle can be found at the South African Reserve
Bank's website (www.resbank.co.za) – click on the "Research" link and select "Statistics".
Under "Statistics" you will find information on the composite business cycle indicators and
will be able to do an "online statistical query" for other economic data.
Other useful data sources are Statistics South Africa (www.statssa.org.za) and Trading
Economics (www.tradingeconomics.com) is a user-friendly source for comparable
international data.
Other useful sources on business cycles:
Bosch, A. & Ruch, F. 2012. An Alternative Business Cycle Dating Procedure for South
Africa. South African Reserve Bank Working Paper WP/12/06.
Conerly, W.B. 2007. Businomics. Platinum Press.
Navarro, P. 2006. The well-timed strategy. Wharton School Publishing.
Navarro, P. 2009. Recession-proofing your organization. Sloan Management Review,
Spring, 45-51.
Wentzel, A. 2009. Ecos for budding millionaires, FM Campus, 31 July.