The Association between Audit Business Scale Advantage ...
30
51 CHINA JOURNAL OF ACCOUNTING RESEARCH, Vol 1 Issue 1 © LexisNexis, 2008 Ziye Zhao 1 Shanghai University of Finance and Economics e Association between Audit Business Scale Advantage and Audit Quality of Asset Write-downs Abstract is paper examines whether the scale advantage of auditing firms can be used as an alternative indicator of audit quality when the evaluation of audit quality is costly. The adoption of asset impairment recognition in China has brought about a considerable impact on financial reporting of Chinese 1 The authors are grateful for the organizers of the 1st China Journal of Accounting Research Symposium. We thank Dr. Wu Xi and Mr. Guo Jinlong for their constructive comments. We appreciate valuable comments from the referees and the editors. We also appreciate insightful suggestions given by Dr. Chen shimin from the Hong Kong Polytechnic University, Dr. Li zengquan from the Shanghai University of Finance and Economics and Dr. Xia lijun from the Shanghai University of Finance and Economics. is research is sponsored by Shanghai Educational Development Foundation (Grant no. 2008CG43). We also gratefully acknowledge the financial support of the major project of the Key Research Institute of Humanities and Social Science under the Ministry of Education (Grant no. 05JJD630027). Zhao ziye, Institute of Accounting and Finance, Shanghai University of Finance and Economics. Email address: [email protected]. Zhang bin, School of Management, Yangzhou University. Bin Zhang Yangzhou University
-
Upload
khangminh22 -
Category
Documents
-
view
0 -
download
0
Transcript of The Association between Audit Business Scale Advantage ...

51CHINA JOURNAL OF ACCOUNTING RESEARCH, Vol 1 Issue 1 © LexisNexis, 2008
Ziye Zhao1 Shanghai University of Finance and Economics
The Association between Audit Business Scale Advantage and Audit Quality of Asset Write-downs
Abstract
This paper examines whether the scale advantage of auditing firms can be used as an alternative indicator of audit quality when the evaluation of audit quality is costly. The adoption of asset impairment recognition in China has brought about a considerable impact on financial reporting of Chinese
1 The authors are grateful for the organizers of the 1st China Journal of Accounting Research Symposium. We thank Dr. Wu Xi and Mr. Guo Jinlong for their constructive comments. We appreciate valuable comments from the referees and the editors. We also appreciate insightful suggestions given by Dr. Chen shimin from the Hong Kong Polytechnic University, Dr. Li zengquan from the Shanghai University of Finance and Economics and Dr. Xia lijun from the Shanghai University of Finance and Economics.
This research is sponsored by Shanghai Educational Development Foundation (Grant no. 2008CG43). We also gratefully acknowledge the financial support of the major project of the Key Research Institute of Humanities and Social Science under the Ministry of Education (Grant no. 05JJD630027).
Zhao ziye, Institute of Accounting and Finance, Shanghai University of Finance and Economics. Email address: [email protected].
Zhang bin, School of Management, Yangzhou University.
Bin ZhangYangzhou University

ZIYE ZHAO AND BIN ZHANG52
listing companies in recent years. This new accounting practice provided a special environment, which was subjected to less endogeneity problems than usual, to test the relationship between the scale of auditing business and audit quality. Prior research reported empirical evidence that both market value and firm characteristics are empirically related to write-downs, reflected in the four dimensions return relevance, price relevance, persistence and determinant. Using these four dimensions, we investigated whether audit business scale advantage (ABSA) affect audit quality of asset write-downs.
We contribute to the literature with the following findings. First, auditors’ business scale is positively related to return relevance of write-downs. Second, auditors with ABSA not only enhance the relevance between impairments and economic variables but also weaken the relation between impairments and managerial variables; however, the results appear in only a few of the firm-specific variables. Third, results are mixed when we test the ABSA effect on price-relevance and persistence dimensions. Fourth, the ABSA effect is stronger when the complexity of asset write-downs requires some inside information to comprehend the nature of action. Adding to the main finding, we also found the ABSA effect became weaker when we proxy ABSA with raw data of companies’ business scale instead of the top five auditors in business scale. Taken together, our results show that the ABSA effect does exist in auditing of assets write-downs, although with weak evidence. Our results also indicated rational auditor choice based on quality of service in China’s audit market. We identified some unique factors from stakeholders’ cooperative structuring actions in China audit market as potential explanations to the market rationality.
Key words: auditing, asset write-downs, accounting discretion
Introduction
Researchers have increasingly paid attention to alternative indicators of audit quality in order. In searching for indicators of quality, audit business scale is easier to observe than specific audit adjustments. China has progressed in its accounting practice of asset impairment. Such an institutional setting offered advantages in cross checking the suitability of using Audit Business Scale Advantage (ABSA) as a suitable indicator of audit quality. First, relative to the rapid development in accounting standards, the incumbent auditors generally remained stable. This test setting minimizes endogenous problems, which is common to auditing research. Second, it allows us to test audit quality in both economic and managerial dimensions. Prior research suggested that asset write-downs are empirically related to several firm characteristics. Third, researchers can rely on rich data
THE ASSOCIATION BETWEEN AUDIT BUSINESS SCALE ADVANTAGE AND AUDIT qUALITY OF ASSET WRITE-DOWNS 53
to test whether valuation implications of auditing quality exists when asset impairment accounting has exerted far-reaching influences on capital market reaction to companies’ report earnings. Fourth, the disclosure of the majority part of write-down information is mandated in China. This offered us a direct sample to identify the factors that may relate to the variation of an ABSA effect across firms.
Based on sample data of listed firms in China, we found that audit business scale is weakly related to auditing quality of assets write-downs. Although significant results appear in only a few dimensions, they provide insights into the conditions of ABSA’s effect in the Chinese audit market. The results also remind us to consider the positive effect of cooperative constructing actions taken by all stakeholders in the audit market.
The remainder of the paper proceeds as follows. The next section provides a theoretical analysis of ABSA effect on the auditing quality of asset write-downs, including discussion of related literature in China’s institutional settings and the reasons why we focus on asset write-downs. The third section describes the research design including framework discussion, definition of variables, test models and data source, followed by a section where empirical results are analyzed. The final section concludes the paper.
Analysis of Relationship between Audit Business Scale and Audit Quality
Investigation of ABSA effect may have several significant implications. Most importantly, if ABSA could be used as a proxy of auditing quality, then the adverse selection problem due to the difficulty of observing audit quality will be reduced. Prior, research has developed many basic testable hypothesizes and theories in the process of seeking answers to auditing related questions. Lack of research in this area motivated us to find evidence about whether an ABSA effect exists in China’s audit market. Currently, the answer is far from clear, partly because predications of the extant theories are mixed, and also because the different institutional settings reveal in more uncertainties and reduce the probability of observing an ABSA effect.
1. Audit Theory and Audit Business Scale EffectDeAngelo (1981) posits that when clients provide auditors with quasi-rents, auditors are likely to engage opportunistic behavior. However, the more clients they have, the lower their motivation for opportunistic behaviors will be, as their potential losses from such behavior tends to be much higher. Based on her theory, we would expect enhanced audit quality from auditors with business scale advantage. An alternative theory is that auditors with
ZIYE ZHAO AND BIN ZHANG54
more wealth have higher risk to lose in litigation. Therefore, the audit service provided by wealthier auditors should carry higher quality (Dye 1993). Empirical evidence exists to support both theories. For example, the stock market reaction is more pronounced when a company switches to a big auditor than to a small auditor (Eichenseher et al, 1989). Similarly, Teoh and Wong (1993) find that the earnings response coefficients of companies hiring larger auditors are higher than that of the other companies. Moreover, large auditors standardize procedures in determining discretionary accruals and decrease chances of under-pricing in IPOs (Francis et al, 1999; Balvers et al, 1988). However, the relationship between audit business scale and audit quality may be confounded by several factors, such as the risk of clients mentioned by Bar-Yosef and Sarath (2005). If this is pervasive, it would hinder the likelihood of observing an ABSA effect. In fact, DeFond et al (1999) finds that audit quality and market share may diverge into opposite directions.
2. Cooperative Constructing and the Basis of ABSA EffectEvidence that ABSA is positively related to audit quality, allows audit business scale to be used as an indicator of audit quality thereby reducing the cost of assessing quality. The following sections provide analysis of the basic conditions of an ABSA effect in China’s audit market.
(1) Enhancement of Business Liquidity and Market Competition under the Reformed Auditing Regulation
China has progressed in improving business l iquidity and market competition in audit market, given that liquidity and competition are two key conditions of an ABSA effect. First, the reformation and privatization of the entire audit industry was successfully completed. Second, audit firms voluntarily joined together to boost their scale following the advocacy of government policies. CPA firms expanded their business in different ways, including establishing new firms after merging; absorbing another firm; establishing subsidiaries and recruiting professional employees. Under the new regulation, both the market liquidity and competition have been dramatically improved.
(2) Quasi-rent Effect of Cooperative RegulatingPrior research suggests that regulators are capable of punishing opportunistic behavior and protecting investors in China’s capital market (Chen and Yuan 2004; Pistor and Xu 2005; Chen et al, 2008). Evidence was revealed in 2002, when five CPA firms were disqualified because of violation of industrial rules or suspicion of fraudulent business by market regulators (including Chinese Institute of Certified Public Accountants; Ministry of Finance People’s
THE ASSOCIATION BETWEEN AUDIT BUSINESS SCALE ADVANTAGE AND AUDIT qUALITY OF ASSET WRITE-DOWNS 55
Republic of China and China securities regulatory commission)2. The penalty for this misconduct cost each dishonest auditor the closure of their entire audit business. Such a punishment scheme results in a higher cost and a bigger loss to a larger firm. Therefore, recent audit market regulation would promote an ABSA effect.
(3) Establishment of Civil Litigation and Compensation SystemAuditors may take audit business scale into consideration and issue reports cautiously, given that a loss from litigation is positively related with the wealth possessed by the company. On January 15th, 2002, the Supreme Court of the People’s Republic of China issued an interpretation on conditions under which companies can be sued by investors for their misleading financial statement in supporting the prosecution of such unethical behavior. The notice directed the implementation of legal procedures, and clarified the definition of false statements and conditions of lawsuit and court jurisdiction on these cases. The notice enhanced legislative protection to investors, and deterred opportunistic auditors from freely violating the auditing rules.
3. Interference Factors of ABSA EffectAlthough supported by auditing policies and regulations, interference factors need to be noted which could make it hard to observe an ABSA effect.
First, the improvement of audit business liquidity may be affected by the rigidity of the original audit trading system. Moreover, we need more information besides local traffic conditions; arrangement of employees and effective field survey to evaluate the cost of business liquidity. It would be harder to observe an ABSA effect when the system to determine liquidity cost becomes more complicated.
Second, researchers may need to focus on the characteristics of the Chinese audit market since market concentration of China is lower compared to the United States. Evidence shows that an ABSA effect is quite obvious when the top four auditors dominated the market. The evidence of an ABSA effect may be hard to find in China because the trajectory of market concentration is lower than that in the United States3.
Third, the expansion of two audit firms may be different even if their
2 See document Finance and Accounting No.[2002] 1031, title: “Answer to the opinions of annual inspection of auditors’ qualification of auditing in China’s stock market”.
3 We identify the top 10 auditors from the Top 100 Auditors for 2006 announced by CICPA and find that the total market share (calculated by annual revenue) of these largest auditors is lower than 60%.
ZIYE ZHAO AND BIN ZHANG56
business scales are currency similar. Some large auditors expanded their business by mergers, while others rely on natural growth of their own business. Integration after merger has a great influence on the new auditor’s audit quality. For example, Wu(2006) shows whether the goal of business expansion can be fulfilled depends upon the integration and efficiency of resources allocated to auditors. Moreover, we may evaluate the effect of business expansion after investigating the difference between management cultures, incentive effect of new employees and the synergistic effect of audit skills. It is difficult to measure these factors’ so it is still unknown, whether audit business scale is correlated with audit quality.
4. Asset Write-downs and Research OpportunityTo enhance communication between companies and investors without reducing the reliability of information, China carried out a series of development and reformation in the accounting area. Asset impairment accounting provides us with a research opportunity since it is an important accrual item of financial report. Auditor switching is unlikely with regard to new standards of asset impairment, given that the cost of switching because of one accrual item. This research setting enables us to åcontrol the endogenous problem of research into audit quality.
(1) Far-reaching Influence of Asset Write-downs on Financial ReportsSince 1998, accounting standards require China’s listed companies to recognize asset impairment for accounts receivable, inventories, and short and long-term investments. By 2001, the recognition of asset impairments was extended to cover four new categories: fixed assets, constructions in progress, intangible assets, and commission loans. Since then, asset write-downs affect about 80% of the asset items and influence financial reports extensively. To measure the depth of asset impairments’ influence on the financial reports, we examined the median of write-downs and found it was 15% of the absolute value of earnings before impairment provisions. The large magnitudes of write-downs demonstrated their importance.
We find also that auditors emphasize that asset write-downs are important concerns mentioned in audit opinions over a period from 1998 to 2005. Table 1 provides descriptive information about such audit opinions4.
4 There is subjectivity in our understanding of information of write-downs in audit opinion, so Table 1 is based on incomplete statistics.

THE ASSOCIATION BETWEEN AUDIT BUSINESS SCALE ADVANTAGE AND AUDIT qUALITY OF ASSET WRITE-DOWNS 57
Table 1: Audit Explanatory Paragraphs and Asset Write-downsPanel A: Information about write-downs in audit explanatory paragraphs
No. of audit opinions in which information of write-downs are disclosed
The percentage of write-down opinions to all modified opinions of the same year
No. of audit opinions in which the amount of write-downs are disclosed
Total amount of asset write-downs disclosed in modified opinions(billion) RM
1998 24 19.35% 9 0.891999 43 27.56% 24 1.822000 52 33.12% 34 3.702001 52 35.14% 31 3.052002 50 35.46% 37 0.712003 27 27.00% 20 2.902004 40 27.78% 35 6.112005 29 18.24% 28 7.14Total 317 28.08% 218 26.32
Panel B: Categories of Write-down Information Disclosed in Audit OpinionsReminding of large-scale asset impairments
Large-scalereversals andwrite-outscompared to net income
Insufficient evidence, difficult tojudge
Accounting policies of asset write-downs
Likely under-write-down
Presentzero- impairment items,no comments
Presentzero- impairment items, difficult to judge
Presentzero- impairment items, likelyunder-write-down
1998-2000FrequencyProportiona
4024.84%
53.11%
4930.43%
1911.80%
106.21%
74.35%
3119.25%
2001-2005FrequencyProportion
8131.76%
62.35%
10741.96%
2911.37%
124.71%
51.96%
155.88%
TotalFrequencyProportion
12129.09%
112.64%
15637.50%
4811.54%
225.29%
122.88%
4611.06%
a: Frequency of write-down event divided by number of total observations.
Panel A of table 1 shows that there are 317 modified opinions’ explanatory paragraphs concerning asset write-downs. These account for about 30% of all modified opinions from 1998-2005. Meanwhile, auditors raised doubts on about 25 billion RM of asset impairments in 218 audit opinions. Panel B shows several categories of opinions of write-downs. The total number of observations in Panel B is

ZIYE ZHAO AND BIN ZHANG58
higher than that in Panel A because one company can receive many opinions of write-downs. The opinions title ‘It is hard to determine whether assets write-downs are fair because there is insufficient evidence’ account for more than one third of all the observations, and demonstrate the opportunity for manipulation in asset impairments. Accounting for about 30% of all opinions, this type of opinion was widely used by auditors to draw attention to large-scale asset impairments. Moreover, there is evidence suggesting the difficulty of auditing long lived assets, i.e. we have noticed the proportion of both these two types of opinions to have increased after 2001, when the new four items of assets were added into asset impairment accounting.
(2) Empirical Relationship between Asset Write-downs and Corporate Market Value
An important reason for considering the value relevance of asset write-downs is that companies may measure impairments of assets and communicate private information by asset write-downs. Based on a sample of China listed firms that adopted write-downs, Yang et al (2005) find that asset write-downs are positively related to companies’ annual buy-and-hold returns from 1999-2001. Alciatore et al (2000) find similar evidence from the U.S. petroleum industry, with the market anticipating asset impairments before losses are recognized. Based on Zhang (2005) and Zhou and Lu (2007)’s research design and the empirical relationship between asset write-downs and corporate market value, researchers can test whether value relevance of asset write-downs become stronger when being audited by auditors with business scale advantage.
(3) Empirical Relation between Assets Write-downs and Firm Characteristics
Researchers have concentrated on the determinants of asset write-downs. Wilson (1996) suggests the manipulated component of accounting accruals is involved. Both the asset impairment hypothesis and opportunistic hypothesis have supporting evidence from the extant literature. In terms of the asset impairment hypothesis, some literature shows that asset write-downs are related to changes in the underlying economics (Francis et al 1996; Li 2001; Riedl 2004). Moreover, management can communicate their private information about future performance and transfer operating burden to outside stakeholders (Strong and Meyer 1987; Francis et al 1996; Frantz 1999; Chen et al 2004). The opportunistic hypothesis states that companies may recognize asset impairments to achieve report incentives, including meeting the compensation plan, smoothing earnings, showing management’s abilities in improving performance and meeting regulatory requirements (Zucca and Campbell 1992; Elliott and Shaw 1988; Francis et al, 1996; Riedl 2004; Li 2001; Cai and Zhang 2004). In our test period, about 90% percent of China’s listed firms recognized asset impairments. Therefore, in addition to evaluating the auditor’s professional expertise dimension of audit quality from the relation between asset write-downs and economic realities, but we can also test the auditor independence dimension of auditor quality
THE ASSOCIATION BETWEEN AUDIT BUSINESS SCALE ADVANTAGE AND AUDIT qUALITY OF ASSET WRITE-DOWNS 59
through the correlation between asset impairment and report incentives.
5. Possible Contributions of ResearchThis research contributes to the accounting literatures about China in three ways. First, more evidence of an ABSA effect is helpful because extant research results has mixed prediction in general. We can simultaneously observe ABSA effect in write-downs’ value relevance, persistence and discretion, given that China has developed its asset impairment accounting. Second, the disclosure of write-downs in China is both detailed and systematic. Such an institutional setting allows us to test the ABSA effect in a big sample and provides us with an opportunity to explore relevant factors connected to it. Third, the results may help us understand the forces that strengthen or weaken the ABSA effect in China’s audit market.
Research Methodology
1. Test Mechanism and Dimensions of ABSA EffectAccording to information value relevance, companies may recognize that asset impairments communicates private information about asset values and decreasing future cash flows. Prior research has shown that write-downs are related to corporate market value (Yang et al, 2005; Alciatore et al, 2000). Auditing with high quality will be detected by the capital market, and the value relevance of write-downs will be improved when there is information asymmetry. The higher is the audit business scale, the more valuable information the write-downs convey if the ABSA effect does exist. Applying the value-relevance models to this circumstance, the association between write-downs and corporate market value will increase when audit business scale increases. If testing in determinant models, we should observe a stronger association between write-downs and economic factors, and a weaker association between write-downs and report incentives as audit business scale increases.
The ABSA effect will be tested in two ways. In the interaction test, the interaction between audit business scale and write-downs will be examined. In the group test, all of the sample will be divided into two groups by audit business scale, and the multiple of write-downs in the advantage group will be compared to that in the common group. We will present results of both of these two test solutions as each test has its own advantages and disadvantages.
The ABSA effect will be tested in four dimensions. First, the association between audit business scale and return relevance of write-downs will be investigated. Since auditing is beneficial to the improvement of information relevance as well as the protection of information reliability, the return relevance of the item being audited reflects audit quality. This logic is the fundamental basis underlying the validity of our tests. The second test dimension is price relevance which focuses on the firm value derived from accounting information. The price relevance model
ZIYE ZHAO AND BIN ZHANG60
provides additional information to the return relevance model as the beginning price significantly influences how investors predict future earnings (Kothari and Zimmerman 1995; Barth et al, 2001). Third, we focus on the ABSA effect in persistence of write-downs. The discretionary portion of write-downs could reduce the relationship of write-downs and ex post realization. In the persistence dimension, whether auditor scale affects the association between write-downs and ex post earnings will be tested. Finally, we investigate the ABSA effect on the reporting incentives from two aspects. One is whether audit business scale helps to improve the explanatory power of economic factors to write-downs, the other is whether audit business scale curbs managerial reporting incentives to write-downs.
Although each test focuses on different relationships, the four test dimensions are interrelated. Return relevance and price relevance focus on the interaction among auditors, management and information users. The other two dimensions cover interaction between auditors and management. Therefore, results of the last two dimensions directly affect the results of the first two dimensions. In terms of return relevance and price relevance, the tests focus on perceived audit quality of write-downs, and in terms of persistence and determinant, the tests focus on audit quality in write-downs’ ex post realization and fairness. Since the test of each dimension provides additional results to complement other dimensions, the results help us understand the strength of the ABSA effect. The concordance of realization, fairness and impairment judgment improve perceived audit quality of write-downs. Therefore, the robustness of the findings relies on the consistency of results of all four tests.
2. Proxies for Audit Business Scale AdvantageHow the ABSA variables are designed is important since the main research purpose is to test the ABSA effect in auditing write-downs. In this research, ABSA will be designed in various ways to minimize noise since markets perceive ABSA based on all publicly available information.
First, we rank auditors by number of clients and classify them into the Top 5 group and the Common group. Similarly, we rank the top 5 and non top 5 group according to the audit revenue or total assets of clients, SC is a dummy variable with a value of 1 if a company hires an auditor in the Top 5 group, and 0 otherwise5. When dummy variables are used as indicators of ABSA, our models
5 We employ top 5 instead of other numbers due to two reasons. First, using a small number of ranking auditors may reduce the influence of auditors’ making noise to the research results. Second, we find that the number of 6th auditor’s clients equal to the number of the 7th auditor’s in 2001; the number of 8th auditor’s clients equal to the number of the 9th auditor’s in 2002; the number of 10th auditor’s clients equal to the number of the 11th auditor’s in 2002. The top 5 is therefore suitable level in such a situation.
THE ASSOCIATION BETWEEN AUDIT BUSINESS SCALE ADVANTAGE AND AUDIT qUALITY OF ASSET WRITE-DOWNS 61
focus on testing advantage of several top auditors. Such a classification method was inspired by the long tail theory which presents that several hot products with famous brands dominate the market while the total share of all the other products are low (Anderson 2006). It seems that this effect exists too in the audit market. Additional benefits of using dummy variable SC is that we can partition the samples into two groups and then compare the multiples of write-downs of each. Our comparison tests are less likely to suffer from multicollinearity that was common in interaction tests. The disadvantage of using this dummy variable is that we may lose some information about audit business scale.
Second, for sensitivity tests, we rank auditors into five groups and use group numbers as indicators of ABSA. We also use the raw data of audit business scale to re-test our models. The groups SC range from 0-4 and group 0 is the top group. Considering the problem of heterodesiticity, we employ the natural logarithm of audit revenue and the total asset of the clients.
Third, to overcome concerns about accuracy of perceived cost of audit business scale, we separate the samples into three groups according to the Top 100 auditors disclosed by the Chinese Institute of Certified Public Accountants. Joint Venture Advantage group covers auditors established by Big 4 international CPA firms and local CPA firms. Local advantage group consists of auditors that meet 3 conditions: First, the auditor is included in the list of Top 100 auditors disclosed by the CICPA. Second, both audit revenue and number of CPA of the auditors are in the Top 20. Third, the auditors are not covered by Joint Venture advantage group6. Both Joint Venture Advantage group and Local advantage group are compared to Local Common group composed of local auditors without ABSA. To measure the market share of auditors, we mark auditor code by the names of auditors disclosed by Wind Database. The marking of auditor code is based on 3 rules. First, when one auditor appears with similar names or has changed name, all such observations are marked as one auditor code. Second, when auditor A with the qualification of auditing of listed firms merged with auditor B without qualification of auditing of listed firms, the new auditor’s code takes that of auditor A. Third, if both of the merged auditors with qualification of auditing of listed firms, then the new condition is given a new code.
3. Research ModelsSince China’s listed firms disclosed detailed information of asset write-downs in their annual reports, the association study method is used to test ABSA effect in
6 The first year of Top 100 information disclosed by the CICPA on the internet is 2002. Therefore, the information of 2002 is a proxy for that of the 2001. Both total revenue and number of CPA are disclosed in Top 100 information. These two criterions are simultaneously used to identify audit business scale advantage.
ZIYE ZHAO AND BIN ZHANG62
value relevance of write-downs. As suggested by Kothari and Zimmerman (1995), a return model is used to test whether audit business scale affect the association of write-downs with the change in stock value over a year. We also use a price model to test whether audit business scale affects the relation between write-downs and the ending market value of a company over a year. Return and price models are based on literature that not only provides basic models but also support the value relevance of earnings (including write-downs) in China’s stock market (Easton and Harris 1991; Easton et al, 1993; Ohlson 1995; Eccher and Healy 2000; Chen et al, 2001; Chen and Wang 2004; Yang et al, 2005).
(1) Return Relevance Model:RETURN = + 1FWPSP_O + 2FWPSP_B + 3WPSP + 4SIZE + 5SC + 6SC WPSP +
(2) Price Relevance Model:PRICE = + 1FWPS_O + 2FWPS_B + 3WPS + 4SIZE + 5BVPS 6SC + 7SC WPS +
Based on literature that concentrates on earnings persistence (Sloan 1996; Richardson et al, 2005), a persistence model is employed to test whether audit business scale affects write-downs and earnings of the next year.
(3) Persistence Model:FUPER = + 1OITA + 2BITA + 3WITA + 4SC + 5SC WITA +
RETURN is an annual buy-and-hold return using the month of official financial statements publication in China as the ending month of the calculation period7. We calculate RETURN by the following formula:
RETURN = (1 + monthly returns with cash flow dividends reinvested)
FWPSP_O, FWPSP_B, and WPSP represent three earnings components. FWPSP_O is recurring income (before write-downs) per share divided by the beginning stock price and FRPSP_B is nonrecurring income (before write-downs) per share divided by the beginning stock price8. WPSP is the amount of write-
7 April is the official month of financial statement publication of China. The end of April is also the end of our research year. The end of the last April is the beginning of the research year.
8 Recurring income before write-downs=operating income-other income+bad debt provisions+inventory impairments. Nonrecurring income before write-downs=net income-operating income+write-downs.

THE ASSOCIATION BETWEEN AUDIT BUSINESS SCALE ADVANTAGE AND AUDIT qUALITY OF ASSET WRITE-DOWNS 63
downs per share divided by the beginning stock price9. The value of write-downs is positive in the incentive model but negative in all other models. Therefore, in both value relevance and persistence models, a significantly positive ß3 suggests the usefulness of the write-downs information as perceived by investors. SIZE is the natural logarithm of total assets. The price model includes the ending stock price P, the three earnings components per share, namely FRPS_O, FRPS_B, and RPS, and net asset per share BVPS. The definitions of the three earnings components are the same as those in the return model. FUPER is net income of period t+1 divided by beginning total asset. OITA, BITA, and WITA are respectively recurring income before write-downs, nonrecurring income before write-downs and write-downs in period t. All three variables are divided by beginning total asset. In all three models, we include three year dummies to control for stock market fluctuations. SC is audit business scale advantage measured by the proxies introduced in section 3.2. A significantly positive interaction term of SC and write-downs suggests that an ABSA effect does exist.
Our last model is based on literature that focus is on determinants of asset write-downs (Francis et al. 1996; Li 2001; Riedl 2004).
(4) Determinants of asset write-downs:WDTA = + 1INDROA + 2INDGROW + 3INDMTA + 4SALE + 5OCF + 6MTA
+ 7MI + 9ST + 10AVST + 11MGT + 12DEC + 13INC + 14LEV + 15SIZE + 16SC + 17SC SALE + 18SC OCF + 19SC MTA + 20SC MI + 21SC ST + 22SC AVST + 22SC MGT + 23SC DEC + 24SC INC +
WDTA is the amount of write-downs divided by the beginning total assets. Economic factors measure the status of the underlying economics. INDROA, INDGROW, and INDMTA capture the prospect of the industries; they represent median changes from period t-1 to period t in industry returns on assets, growth of sales, and market value divided by book value of total assets10. ΔSALE, ΔOCF, ΔMTA, and ΔMI are four economic factors to measure firm-specific changes in asset value. They represent sales growth, growth of market value divided by total assets, and changes in operating cash flows and main operating income from period t-1 to period t divided by the beginning total assets11. We expect ß1 to ß7
9 We may slightly overestimate the amount of impairment recognized by companies since we use the data from asset write-down tables as proxy for write-downs.
10 We use market value divided by book value of total assets instead of market to book ratio because some companies’ net assets are negative.
11 We cannot calculate operating income before write-downs in 2001 without overestimation because write-downs in 2000 are not available. Therefore, we use changes in main operating income instead of operating income.
ZIYE ZHAO AND BIN ZHANG64
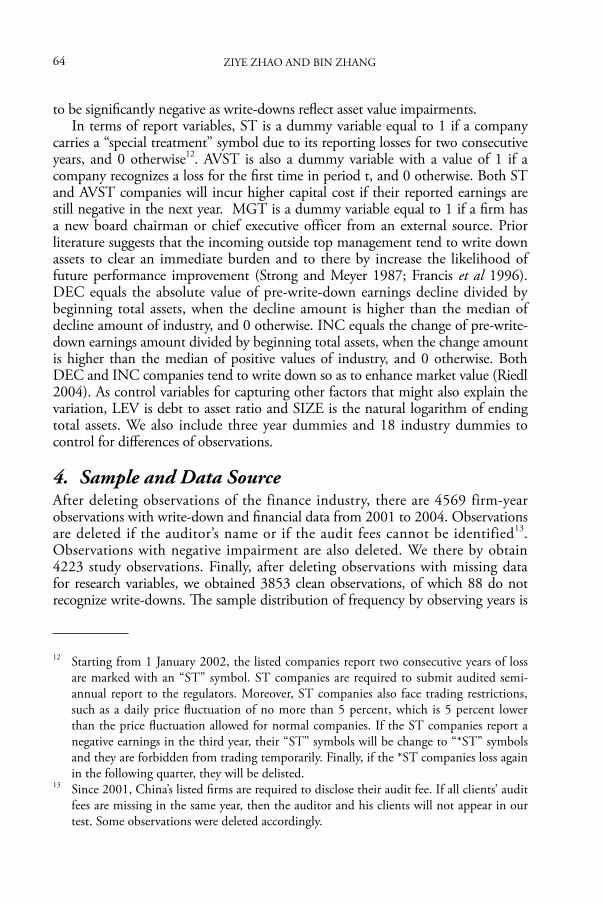
to be significantly negative as write-downs reflect asset value impairments.In terms of report variables, ST is a dummy variable equal to 1 if a company
carries a “special treatment” symbol due to its reporting losses for two consecutive years, and 0 otherwise12. AVST is also a dummy variable with a value of 1 if a company recognizes a loss for the first time in period t, and 0 otherwise. Both ST and AVST companies will incur higher capital cost if their reported earnings are still negative in the next year. MGT is a dummy variable equal to 1 if a firm has a new board chairman or chief executive officer from an external source. Prior literature suggests that the incoming outside top management tend to write down assets to clear an immediate burden and to there by increase the likelihood of future performance improvement (Strong and Meyer 1987; Francis et al 1996). DEC equals the absolute value of pre-write-down earnings decline divided by beginning total assets, when the decline amount is higher than the median of decline amount of industry, and 0 otherwise. INC equals the change of pre-write-down earnings amount divided by beginning total assets, when the change amount is higher than the median of positive values of industry, and 0 otherwise. Both DEC and INC companies tend to write down so as to enhance market value (Riedl 2004). As control variables for capturing other factors that might also explain the variation, LEV is debt to asset ratio and SIZE is the natural logarithm of ending total assets. We also include three year dummies and 18 industry dummies to control for differences of observations.
4. Sample and Data SourceAfter deleting observations of the finance industry, there are 4569 firm-year observations with write-down and financial data from 2001 to 2004. Observations are deleted if the auditor’s name or if the audit fees cannot be identified13. Observations with negative impairment are also deleted. We there by obtain 4223 study observations. Finally, after deleting observations with missing data for research variables, we obtained 3853 clean observations, of which 88 do not recognize write-downs. The sample distribution of frequency by observing years is
12 Starting from 1 January 2002, the listed companies report two consecutive years of loss are marked with an “ST” symbol. ST companies are required to submit audited semi-annual report to the regulators. Moreover, ST companies also face trading restrictions, such as a daily price fluctuation of no more than 5 percent, which is 5 percent lower than the price fluctuation allowed for normal companies. If the ST companies report a negative earnings in the third year, their “ST” symbols will be change to “*ST” symbols and they are forbidden from trading temporarily. Finally, if the *ST companies loss again in the following quarter, they will be delisted.
13 Since 2001, China’s listed firms are required to disclose their audit fee. If all clients’ audit fees are missing in the same year, then the auditor and his clients will not appear in our test. Some observations were deleted accordingly.

THE ASSOCIATION BETWEEN AUDIT BUSINESS SCALE ADVANTAGE AND AUDIT qUALITY OF ASSET WRITE-DOWNS 65
698, 966, 1056 and 1133, respectively for each of the four years. Research data are selected from the Wind database, including the amount of
write-downs, audit fee, name of auditor and financial data. We obtain monthly returns with cash flow dividends reinvested and stock prices from the CSMAR database. To avoid outlier effects, we winsorize all continuous variables by year at the minimum and maximum 1 percent levels and present the outlier-adjusted descriptive statistics of all variables in Table 2.
Table 2: Descriptive StatisticsVariable Sample Standard
deviationMean Median Minimum Maximum
WDTA 3853 0.028 0.013 0.005 0.000 0.228 INDROA 3853 0.005 -0.005 -0.006 -0.027 0.021 INDGROW 3853 0.077 0.173 0.162 -0.068 0.469 INDBTA 3853 0.066 -0.258 -0.266 -0.419 0.077 ΔSALE 3853 0.592 0.253 0.163 -0.773 5.194 ΔOCF 3853 0.105 0.008 0.008 -0.376 0.423 ΔMTA 3853 0.223 -0.230 -0.261 -0.718 0.659 ΔMI 3853 0.047 0.018 0.012 -0.109 0.239 ST 3853 0.196 0.040 0.000 0.000 1.000 AVST 3853 0.290 0.093 0.000 0.000 1.000 MGT 3853 0.348 0.141 0.000 0.000 1.000 DEC 3853 0.025 0.009 0.000 0.000 0.173 INC 3853 0.050 0.020 0.000 0.000 0.373 LEV 3853 0.207 0.485 0.482 0.072 1.881 SIZE 3853 0.881 21.139 21.071 19.048 23.955 RETURN 3853 0.234 -0.212 -0.235 -0.761 0.647 PRICE 3853 4.218 8.119 7.250 1.410 25.570 FWPSP_O 3853 0.033 0.020 0.016 -0.100 0.149 FWPSP_B 3853 0.016 -0.004 -0.002 -0.087 0.063 FWPS_O 3853 0.318 0.219 0.173 -0.657 1.474 FWPS_B 3853 0.145 -0.036 -0.022 -0.716 0.489 BVPS 3853 1.490 2.995 2.852 -2.194 8.080 WPSP 3853 0.020 -0.008 -0.002 -0.199 0.000 WPS 3853 0.148 -0.068 -0.024 -1.292 0.000 FUPER 3853 0.075 0.014 0.021 -0.379 0.200 OITA 3853 0.058 0.040 0.035 -0.130 0.274 BITA 3853 0.028 -0.006 -0.005 -0.126 0.121 WDTA: amount of write-downs over beginning total assets; INDROA: median annual change in industry returns on assets; INDGROW: median annual change in industry sales growth; INDMTA: median change in corporate market value over total assets of industry; ΔSALE: sales growth; ΔOCF: annual change in operating cash flow divided by beginning total assets; ΔMTA: growth of corporate market value over total assets; ΔMI: annual change in main operating income divided by beginning

ZIYE ZHAO AND BIN ZHANG66
total assets; ST: equal to 1 if a firm is titled with “ST” because of reporting losses for two consecutive years, and 0 otherwise; AVST: equal to 1 if a firm suffers a loss for the first time, and 0 otherwise; MGT: coded 1 if there is a new chairman of boards or CEO coming from an external source, and 0 otherwise; DEC: equal to annual change in earnings before write-downs if this change is lower than median of negative changes in industry; and otherwise; INC: equal to annual change in earnings before write-downs if this change is higher than median of positive changes in industry; LEV: debt to asset ratio; SIZE: the natural logarithm of ending total assets; RETURN: annual buy-and-hold return using the official month of financial statements publication in China as the ending month of calculation period; PRICE: closing stock price on the last trading day of the official month of financial statements publication in China; FWPSP_O: pre-write-down operating income per share divided by beginning stock price; FWPSP_B: pre-write-down non-operating income per share divided by beginning stock price; FWPS_O: pre-write-down operating income per share; FWPS_B: pre-write-down non-operating income per share; BVPS: net assets per share; WPSP: write-downs per share divided by beginning stock price; negative; WPS: write-downs per share, negative; FUPER: net income of period t+1 divided by total assets of period t; OITA: pre-write-down operating income divided by beginning total assets; BITA: pre-write-down non-operating income divided by beginning total assets.
Even after being winsorized, the mean value of write-downs divided by beginning total assets is still larger than 1%, and the median value is about 0.5%. The magnitude of asset write-downs is lower than the restructure charge of listed firms in the United States. However, the far-reaching influence of write-downs on financial reports cannot be neglected.
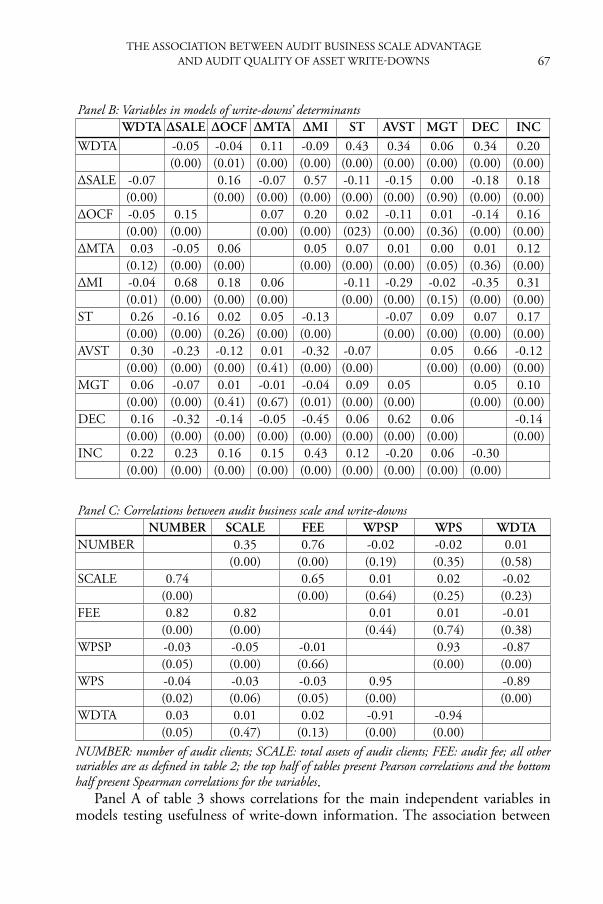
Table 3 presents correlations for variables.
Table 3: Correlations for Main Research VariablesPanel A: Variables in models of information’s usefulness
RETURN PRICE FUPER WPSP WPS WDTARETURN 0.53 0.39 0.21 0.18 -0.19
(0.00) (0.00) (0.00) (0.00) (0.00)PRICE 0.56 0.30 0.22 0.10 -0.14
(0.00) (0.00) (0.00) (0.00) (0.00)FUPER 0.42 0.39 0.29 0.27 -0.27
(0.00) (0.00) (0.00) (0.00) (0.00)WPSP 0.15 0.27 0.26 0.93 -0.87
(0.00) (0.00) (0.00) (0.00) (0.00)WPS 0.13 0.05 0.20 0.95 -0.89
(0.00) (0.00) (0.00) (0.00) (0.00)WDTA -0.15 -0.08 -0.19 -0.91 -0.94
(0.00) (0.00) (0.00) (0.00) (0.00)
THE ASSOCIATION BETWEEN AUDIT BUSINESS SCALE ADVANTAGE AND AUDIT qUALITY OF ASSET WRITE-DOWNS 67
Panel B: Variables in models of write-downs’ determinantsWDTA ∆SALE ∆OCF ∆MTA ∆MI ST AVST MGT DEC INC
WDTA -0.05 -0.04 0.11 -0.09 0.43 0.34 0.06 0.34 0.20(0.00) (0.01) (0.00) (0.00) (0.00) (0.00) (0.00) (0.00) (0.00)
ΔSALE -0.07 0.16 -0.07 0.57 -0.11 -0.15 0.00 -0.18 0.18(0.00) (0.00) (0.00) (0.00) (0.00) (0.00) (0.90) (0.00) (0.00)
ΔOCF -0.05 0.15 0.07 0.20 0.02 -0.11 0.01 -0.14 0.16(0.00) (0.00) (0.00) (0.00) (023) (0.00) (0.36) (0.00) (0.00)
ΔMTA 0.03 -0.05 0.06 0.05 0.07 0.01 0.00 0.01 0.12(0.12) (0.00) (0.00) (0.00) (0.00) (0.00) (0.05) (0.36) (0.00)
ΔMI -0.04 0.68 0.18 0.06 -0.11 -0.29 -0.02 -0.35 0.31(0.01) (0.00) (0.00) (0.00) (0.00) (0.00) (0.15) (0.00) (0.00)
ST 0.26 -0.16 0.02 0.05 -0.13 -0.07 0.09 0.07 0.17(0.00) (0.00) (0.26) (0.00) (0.00) (0.00) (0.00) (0.00) (0.00)
AVST 0.30 -0.23 -0.12 0.01 -0.32 -0.07 0.05 0.66 -0.12(0.00) (0.00) (0.00) (0.41) (0.00) (0.00) (0.00) (0.00) (0.00)
MGT 0.06 -0.07 0.01 -0.01 -0.04 0.09 0.05 0.05 0.10(0.00) (0.00) (0.41) (0.67) (0.01) (0.00) (0.00) (0.00) (0.00)
DEC 0.16 -0.32 -0.14 -0.05 -0.45 0.06 0.62 0.06 -0.14(0.00) (0.00) (0.00) (0.00) (0.00) (0.00) (0.00) (0.00) (0.00)
INC 0.22 0.23 0.16 0.15 0.43 0.12 -0.20 0.06 -0.30(0.00) (0.00) (0.00) (0.00) (0.00) (0.00) (0.00) (0.00) (0.00)
Panel C: Correlations between audit business scale and write-downsNUMBER SCALE FEE WPSP WPS WDTA
NUMBER 0.35 0.76 -0.02 -0.02 0.01(0.00) (0.00) (0.19) (0.35) (0.58)
SCALE 0.74 0.65 0.01 0.02 -0.02(0.00) (0.00) (0.64) (0.25) (0.23)
FEE 0.82 0.82 0.01 0.01 -0.01(0.00) (0.00) (0.44) (0.74) (0.38)
WPSP -0.03 -0.05 -0.01 0.93 -0.87(0.05) (0.00) (0.66) (0.00) (0.00)
WPS -0.04 -0.03 -0.03 0.95 -0.89(0.02) (0.06) (0.05) (0.00) (0.00)
WDTA 0.03 0.01 0.02 -0.91 -0.94(0.05) (0.47) (0.13) (0.00) (0.00)
NUMBER: number of audit clients; SCALE: total assets of audit clients; FEE: audit fee; all other variables are as defined in table 2; the top half of tables present Pearson correlations and the bottom half present Spearman correlations for the variables.
Panel A of table 3 shows correlations for the main independent variables in models testing usefulness of write-down information. The association between

ZIYE ZHAO AND BIN ZHANG68
write-downs and value indicators such as return, price and net income in period t+1 suggests that information about asset impairments are useful. Panel B presents correlations for variables in determinant models. It is obvious that write-downs are related to the majority of the incentive variables; however, the relation between write-downs and economic factors is weaker than that of the report incentive variables. Panel C presents a weak relationship between audit business scale and write-downs. Potentially the result could be masked by the multicollinearity problem induced by an interaction between write-downs and audit business scale.
Empirical Results
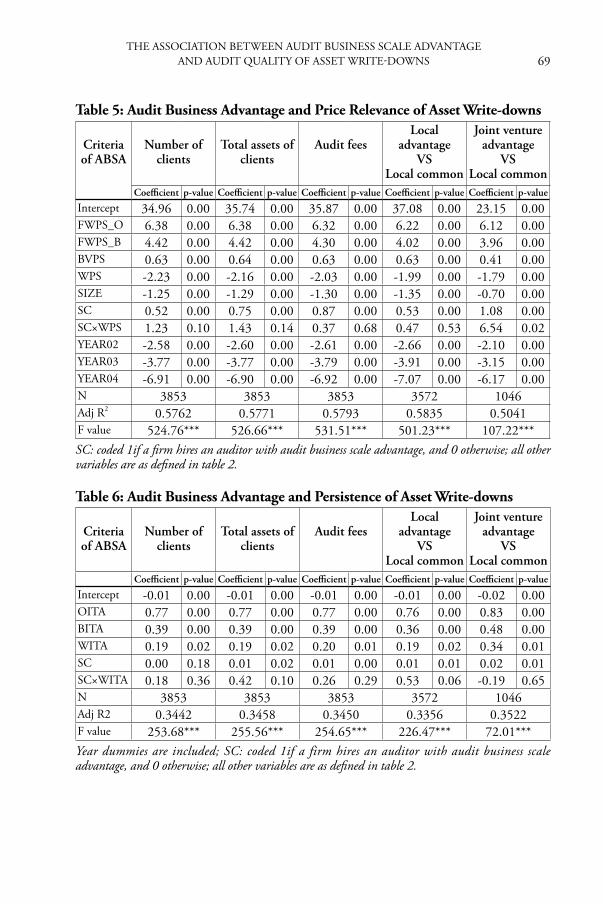
Table 4 presents results of five return relevance models in which SC are dummy variables. In the first three models, audit business scale is identified by number of clients, total assets of clients and audit fees respectively. The fourth model tests for an ABSA effect between local advantage samples and local common samples. The 5th model tests for an ABSA effect between joint venture group advantage group and local common group. Table 5 to Table 7 employ the same tests as Table 4 with different dependent variables, including ending price, net income in period t+1 and write-downs divided by beginning total assets. We focus on the interaction effects between audit business scale advantage and write-downs, and report White-corrected p-value in the tables.
Table 4: Audit Business Advantage and Return Relevance of Asset Write-downs
Criteria of ABSA
Number of clients
Total assets of clients
Audit feesLocal
advantage VS
Local common
Joint venture advantage
VSLocal common
Coefficient p-value Coefficient p-value Coefficient p-value Coefficient p-value Coefficient p-value
Intercept -0.71 0.00 -0.70 0.00 -0.71 0.00 -0.66 0.00 -1.26 0.00 FWPSP_O 2.98 0.00 2.97 0.00 2.97 0.00 2.93 0.00 2.33 0.00 FWPSP_B 1.63 0.00 1.59 0.00 1.61 0.00 1.58 0.00 1.61 0.00 WPSP 0.07 0.72 0.12 0.48 0.09 0.59 0.09 0.60 0.27 0.21 SIZE 0.02 0.00 0.02 0.00 0.02 0.00 0.02 0.00 0.05 0.00 SC 0.00 0.56 0.02 0.04 0.01 0.15 0.01 0.35 0.02 0.39 SC×WPSP 0.72 0.02 0.92 0.03 0.97 0.01 0.93 0.01 1.21 0.37 YEAR02 0.00 0.66 0.00 0.70 0.00 0.72 0.00 0.86 0.03 0.09 YEAR03 0.09 0.00 0.09 0.00 0.09 0.00 0.09 0.00 0.11 0.00 YEAR04 -0.20 0.00 -0.20 0.00 -0.20 0.00 -0.20 0.00 -0.20 0.00 N 3853 3853 3853 3572 1046Adj R2 0.3849 0.3852 0.3851 0.3776 0.4189F value 268.83*** 269.17*** 269.07*** 241.74*** 84.70***SC: coded 1if a firm hires an auditor with audit business scale advantage, and 0 otherwise; all other variables are as defined in table 2.
THE ASSOCIATION BETWEEN AUDIT BUSINESS SCALE ADVANTAGE AND AUDIT qUALITY OF ASSET WRITE-DOWNS 69
Table 5: Audit Business Advantage and Price Relevance of Asset Write-downs
Criteria of ABSA
Number of clients
Total assets of clients
Audit feesLocal
advantage VS
Local common
Joint venture advantage
VSLocal common
Coefficient p-value Coefficient p-value Coefficient p-value Coefficient p-value Coefficient p-value
Intercept 34.96 0.00 35.74 0.00 35.87 0.00 37.08 0.00 23.15 0.00 FWPS_O 6.38 0.00 6.38 0.00 6.32 0.00 6.22 0.00 6.12 0.00 FWPS_B 4.42 0.00 4.42 0.00 4.30 0.00 4.02 0.00 3.96 0.00 BVPS 0.63 0.00 0.64 0.00 0.63 0.00 0.63 0.00 0.41 0.00 WPS -2.23 0.00 -2.16 0.00 -2.03 0.00 -1.99 0.00 -1.79 0.00 SIZE -1.25 0.00 -1.29 0.00 -1.30 0.00 -1.35 0.00 -0.70 0.00 SC 0.52 0.00 0.75 0.00 0.87 0.00 0.53 0.00 1.08 0.00 SC×WPS 1.23 0.10 1.43 0.14 0.37 0.68 0.47 0.53 6.54 0.02 YEAR02 -2.58 0.00 -2.60 0.00 -2.61 0.00 -2.66 0.00 -2.10 0.00 YEAR03 -3.77 0.00 -3.77 0.00 -3.79 0.00 -3.91 0.00 -3.15 0.00 YEAR04 -6.91 0.00 -6.90 0.00 -6.92 0.00 -7.07 0.00 -6.17 0.00 N 3853 3853 3853 3572 1046Adj R2 0.5762 0.5771 0.5793 0.5835 0.5041F value 524.76*** 526.66*** 531.51*** 501.23*** 107.22***SC: coded 1if a firm hires an auditor with audit business scale advantage, and 0 otherwise; all other variables are as defined in table 2.
Table 6: Audit Business Advantage and Persistence of Asset Write-downs
Criteria of ABSA
Number of clients
Total assets of clients
Audit feesLocal
advantage VS
Local common
Joint venture advantage
VSLocal common
Coefficient p-value Coefficient p-value Coefficient p-value Coefficient p-value Coefficient p-value
Intercept -0.01 0.00 -0.01 0.00 -0.01 0.00 -0.01 0.00 -0.02 0.00 OITA 0.77 0.00 0.77 0.00 0.77 0.00 0.76 0.00 0.83 0.00 BITA 0.39 0.00 0.39 0.00 0.39 0.00 0.36 0.00 0.48 0.00 WITA 0.19 0.02 0.19 0.02 0.20 0.01 0.19 0.02 0.34 0.01 SC 0.00 0.18 0.01 0.02 0.01 0.00 0.01 0.01 0.02 0.01 SC×WITA 0.18 0.36 0.42 0.10 0.26 0.29 0.53 0.06 -0.19 0.65 N 3853 3853 3853 3572 1046Adj R2 0.3442 0.3458 0.3450 0.3356 0.3522F value 253.68*** 255.56*** 254.65*** 226.47*** 72.01***Year dummies are included; SC: coded 1if a firm hires an auditor with audit business scale advantage, and 0 otherwise; all other variables are as defined in table 2.
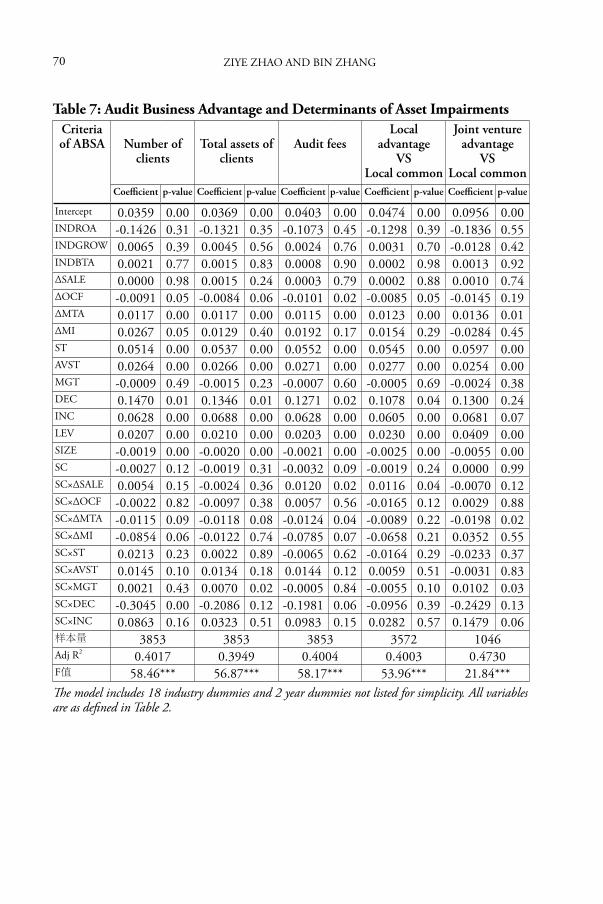
ZIYE ZHAO AND BIN ZHANG70
Table 7: Audit Business Advantage and Determinants of Asset ImpairmentsCriteria of ABSA Number of
clientsTotal assets of
clientsAudit fees
Local advantage
VSLocal common
Joint venture advantage
VSLocal common
Coefficient p-value Coefficient p-value Coefficient p-value Coefficient p-value Coefficient p-value
Intercept 0.0359 0.00 0.0369 0.00 0.0403 0.00 0.0474 0.00 0.0956 0.00 INDROA -0.1426 0.31 -0.1321 0.35 -0.1073 0.45 -0.1298 0.39 -0.1836 0.55 INDGROW 0.0065 0.39 0.0045 0.56 0.0024 0.76 0.0031 0.70 -0.0128 0.42 INDBTA 0.0021 0.77 0.0015 0.83 0.0008 0.90 0.0002 0.98 0.0013 0.92 ΔSALE 0.0000 0.98 0.0015 0.24 0.0003 0.79 0.0002 0.88 0.0010 0.74 ΔOCF -0.0091 0.05 -0.0084 0.06 -0.0101 0.02 -0.0085 0.05 -0.0145 0.19 ΔMTA 0.0117 0.00 0.0117 0.00 0.0115 0.00 0.0123 0.00 0.0136 0.01 ΔMI 0.0267 0.05 0.0129 0.40 0.0192 0.17 0.0154 0.29 -0.0284 0.45 ST 0.0514 0.00 0.0537 0.00 0.0552 0.00 0.0545 0.00 0.0597 0.00 AVST 0.0264 0.00 0.0266 0.00 0.0271 0.00 0.0277 0.00 0.0254 0.00 MGT -0.0009 0.49 -0.0015 0.23 -0.0007 0.60 -0.0005 0.69 -0.0024 0.38 DEC 0.1470 0.01 0.1346 0.01 0.1271 0.02 0.1078 0.04 0.1300 0.24 INC 0.0628 0.00 0.0688 0.00 0.0628 0.00 0.0605 0.00 0.0681 0.07 LEV 0.0207 0.00 0.0210 0.00 0.0203 0.00 0.0230 0.00 0.0409 0.00 SIZE -0.0019 0.00 -0.0020 0.00 -0.0021 0.00 -0.0025 0.00 -0.0055 0.00 SC -0.0027 0.12 -0.0019 0.31 -0.0032 0.09 -0.0019 0.24 0.0000 0.99 SC×ΔSALE 0.0054 0.15 -0.0024 0.36 0.0120 0.02 0.0116 0.04 -0.0070 0.12 SC×ΔOCF -0.0022 0.82 -0.0097 0.38 0.0057 0.56 -0.0165 0.12 0.0029 0.88 SC×ΔMTA -0.0115 0.09 -0.0118 0.08 -0.0124 0.04 -0.0089 0.22 -0.0198 0.02 SC×ΔMI -0.0854 0.06 -0.0122 0.74 -0.0785 0.07 -0.0658 0.21 0.0352 0.55 SC×ST 0.0213 0.23 0.0022 0.89 -0.0065 0.62 -0.0164 0.29 -0.0233 0.37 SC×AVST 0.0145 0.10 0.0134 0.18 0.0144 0.12 0.0059 0.51 -0.0031 0.83 SC×MGT 0.0021 0.43 0.0070 0.02 -0.0005 0.84 -0.0055 0.10 0.0102 0.03 SC×DEC -0.3045 0.00 -0.2086 0.12 -0.1981 0.06 -0.0956 0.39 -0.2429 0.13 SC×INC 0.0863 0.16 0.0323 0.51 0.0983 0.15 0.0282 0.57 0.1479 0.06 样本量 3853 3853 3853 3572 1046Adj R2 0.4017 0.3949 0.4004 0.4003 0.4730F值 58.46*** 56.87*** 58.17*** 53.96*** 21.84***The model includes 18 industry dummies and 2 year dummies not listed for simplicity. All variables are as defined in Table 2.
THE ASSOCIATION BETWEEN AUDIT BUSINESS SCALE ADVANTAGE AND AUDIT qUALITY OF ASSET WRITE-DOWNS 71
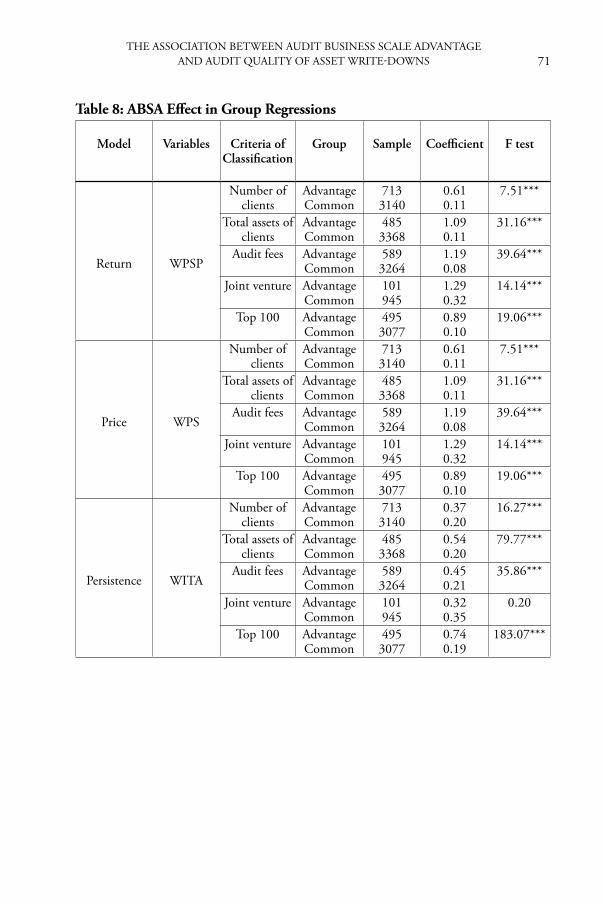
Table 8: ABSA Effect in Group Regressions
Model Variables Criteria ofClassification
Group Sample Coefficient F test
Return WPSP
Number of clients
AdvantageCommon
7133140
0.610.11
7.51***
Total assets of clients
AdvantageCommon
4853368
1.090.11
31.16***
Audit fees AdvantageCommon
5893264
1.190.08
39.64***
Joint venture AdvantageCommon
101945
1.290.32
14.14***
Top 100 AdvantageCommon
4953077
0.890.10
19.06***
Price WPS
Number of clients
AdvantageCommon
7133140
0.610.11
7.51***
Total assets of clients
AdvantageCommon
4853368
1.090.11
31.16***
Audit fees AdvantageCommon
5893264
1.190.08
39.64***
Joint venture AdvantageCommon
101945
1.290.32
14.14***
Top 100 AdvantageCommon
4953077
0.890.10
19.06***
Persistence WITA
Number of clients
AdvantageCommon
7133140
0.370.20
16.27***
Total assets of clients
AdvantageCommon
4853368
0.540.20
79.77***
Audit fees AdvantageCommon
5893264
0.450.21
35.86***
Joint venture AdvantageCommon
101945
0.320.35
0.20
Top 100 AdvantageCommon
4953077
0.740.19
183.07***

ZIYE ZHAO AND BIN ZHANG72
Model Variables Criteria ofClassification
Group Sample Coefficient F test
Determinants
ΔMTA Number of clients
AdvantageCommon
7133140
0.00130.0117
31.14***
Total assets of clients
AdvantageCommon
4853368
-0.00340.0121
70.16***
Audit fees AdvantageCommon
5893264
-0.00160.0117
49.54***
Joint venture AdvantageCommon
101945
-0.01810.0137
62.60***
Top 100 AdvantageCommon
4953077
0.00180.0124
29.08***
DEC Number of clients
AdvantageCommon
7133140
-0.15620.1471
197.76***
Total assets of clients
AdvantageCommon
4853368
-0.03930.1303
60.77***
Audit fees AdvantageCommon
5893264
-0.07050.1244
79.29***
Joint venture AdvantageCommon
101945
-0.09420.1274
21.19***
Top 100 AdvantageCommon
4953077
0.01680.1075
16.27***
All variables are as defined in Table 2.
1. ABSA Effect in Models of Information’s UsefulnessThe results of Table 4 to Table 6 present four important findings. First, China’s listed firms report earnings with strong value relevance, since coefficients of both operating income and non-operating income before write-downs are positive and significant in the association models.14 Second, coefficients of SC*WPSP are positively significant in four of the five return models, which indicates that return relevance of write-downs rises as the audit business scale increases. Third, only two of the price models’ results are consistent with an ABSA effect. Therefore, each association between audit business scale and write-downs in price model is much weaker than that of the return model. Meanwhile, the persistence models’ performance is the same as the price models. Fourth, the relation between audit business scale and write-downs is weaker if we relax the selection criteria of the Advantage group. For example, we find that an ABSA effect remains in tests of Joint Venture Advantage only if we add a condition that bad debt impairment dominates the write-downs. This condition is based on research of Cai and Zhang (2004), that requires, a firm’s accounts receivable divided by total assets to be higher than the average level (median) of the industry, and also that the proportion of bad debt impairment to total
14 P-value is lower than 10%, two tailed.
THE ASSOCIATION BETWEEN AUDIT BUSINESS SCALE ADVANTAGE AND AUDIT qUALITY OF ASSET WRITE-DOWNS 73
write-downs is higher than 50%.15 We added group tests to take into account the possible multicollinearity and present results in Table 8. In return models, the multiple of write-downs in advantage group is higher than that of the common group, and the difference between advantage group and common group is obvious in price and persistence models. The results are consistent with our predictions.16
2. ABSA Effect in Determinants of Asset ImpairmentThe usefulness of impairment information is related to two factors. The first is whether asset impairment is fairly estimated and audited by auditors with professional judgment. The second is whether report incentives are regulated by auditors with independent judgment. Table 7 shows whether audit business scale affects the relation between impairment factors and write-downs. We found that both economic variables and report variables can explain asset impairment when SC is equal to 0. The result is consistent with prior researches (Francis et al 1996; Riedl 2004; Li 2001). We may have underestimated capture the explanatory power of economics factors, given that the variables cannot fully economic reality. We believe that China’s listed firms disclose valuable information about asset impairments. However, the limitation of modeling and empirical testing restricts the power of revealing this reality.
In terms of economic factors, SC enhances the association between WDTA and ΔMTA in most of the models, which indicates a weak ABSA effect in auditors’ professional judgment. In terms of reporting incentive variables, we found that SC enhances the association between WDTA and DEC. This suggests that auditors focus on firms with declining earnings. We also find that results of other report variables are mixed. For example, when SC is idendified by number of clients, ST is positively related to WDTA. Therefore, the evidence in determinants of write-downs is weak. Since some variables’ VIF values reached six, we employ a group test on ΔMTA and DEC to address the possible multicollinearity problem. The results in Table 8 reinforced our results in the interaction tests.
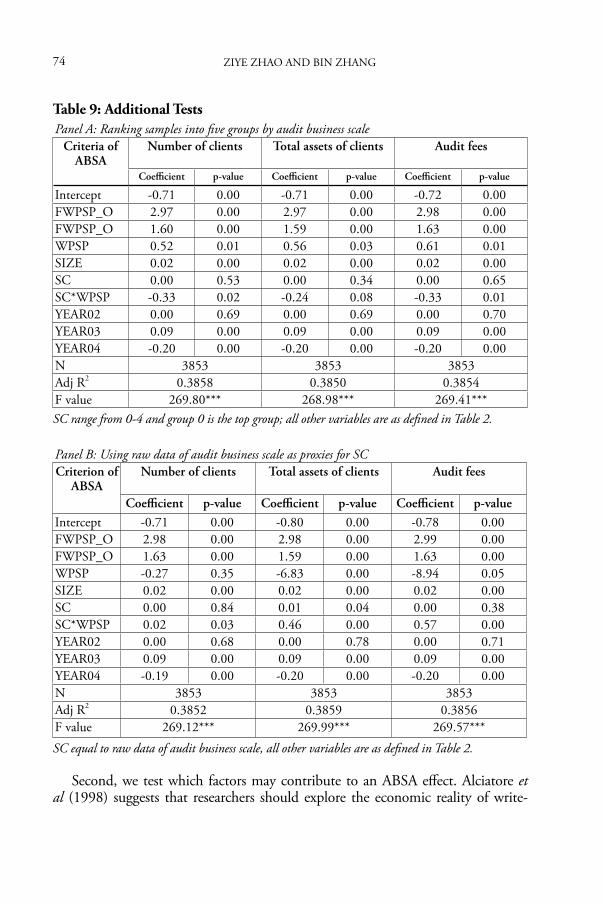
3. Additional TestsTwo additional tests are conducted in this section. First, we change the definitions of SC to test the general suitability and robustness of the ABSA effect. We rank audit business scale into five groups and use group numbers as the research variable. We also use the raw data of audit business scale as the indicator of ABSA and results of return models are presented in Table 9. We find that an ABSA effect still exists in the return models. However, the results on other dimensions are mixed.
15 Since our models cannot fully catch advantages of the Big 4 auditors, we may underestimate the ABSA effect of Big 4 CPA firms. That is to say, we cannot deny ABSA effect in the Big 4 CPA firms because we know little about real advantages of the Big 4 and our models cannot fully catch advantages of the Big 4 auditors.
16 Since we employ F test in group test without White-adjusted test, ABSA effect is observed only if both interaction tests and group tests are consistent with predictions.
ZIYE ZHAO AND BIN ZHANG74
Table 9: Additional TestsPanel A: Ranking samples into five groups by audit business scale
Criteria of ABSA
Number of clients Total assets of clients Audit fees
Coefficient p-value Coefficient p-value Coefficient p-value
Intercept -0.71 0.00 -0.71 0.00 -0.72 0.00 FWPSP_O 2.97 0.00 2.97 0.00 2.98 0.00 FWPSP_O 1.60 0.00 1.59 0.00 1.63 0.00 WPSP 0.52 0.01 0.56 0.03 0.61 0.01 SIZE 0.02 0.00 0.02 0.00 0.02 0.00 SC 0.00 0.53 0.00 0.34 0.00 0.65 SC*WPSP -0.33 0.02 -0.24 0.08 -0.33 0.01 YEAR02 0.00 0.69 0.00 0.69 0.00 0.70 YEAR03 0.09 0.00 0.09 0.00 0.09 0.00 YEAR04 -0.20 0.00 -0.20 0.00 -0.20 0.00 N 3853 3853 3853Adj R2 0.3858 0.3850 0.3854F value 269.80*** 268.98*** 269.41***SC range from 0-4 and group 0 is the top group; all other variables are as defined in Table 2.
Panel B: Using raw data of audit business scale as proxies for SCCriterion of
ABSANumber of clients Total assets of clients Audit fees
Coefficient p-value Coefficient p-value Coefficient p-valueIntercept -0.71 0.00 -0.80 0.00 -0.78 0.00 FWPSP_O 2.98 0.00 2.98 0.00 2.99 0.00 FWPSP_O 1.63 0.00 1.59 0.00 1.63 0.00 WPSP -0.27 0.35 -6.83 0.00 -8.94 0.05 SIZE 0.02 0.00 0.02 0.00 0.02 0.00 SC 0.00 0.84 0.01 0.04 0.00 0.38 SC*WPSP 0.02 0.03 0.46 0.00 0.57 0.00 YEAR02 0.00 0.68 0.00 0.78 0.00 0.71 YEAR03 0.09 0.00 0.09 0.00 0.09 0.00 YEAR04 -0.19 0.00 -0.20 0.00 -0.20 0.00 N 3853 3853 3853Adj R2 0.3852 0.3859 0.3856F value 269.12*** 269.99*** 269.57***
SC equal to raw data of audit business scale, all other variables are as defined in Table 2.
Second, we test which factors may contribute to an ABSA effect. Alciatore et al (1998) suggests that researchers should explore the economic reality of write-

THE ASSOCIATION BETWEEN AUDIT BUSINESS SCALE ADVANTAGE AND AUDIT qUALITY OF ASSET WRITE-DOWNS 75
downs. That will help us understand the market reaction of write-downs events. Therefore, we search listed firms’ financial reports with key word “reason of impairment” and classify information of write-downs by assets.17 We find that listed firms explain why their cash flow of assets decreases, which is consistent with asset impairment standards. In terms of bad debt impairment, firms focus on risks of receiving; in terms of fixed assets, firms focus on whether the asset is vulnerable to technological change. Since both auditing and disclosure are beneficial to the usefulness of information, we predict that ABSA effect will be easier to observe if investors require more information about write-downs. To confirm such a prediction, we employed the following tests. First, we delete samples containing “reason of impairment” and retest the value relevance models. Second, we test ABSA effect in the Top five write-down industries. Third, we test for an ABSA effect when bad debt impairments dominate write-downs.18 We present these results when SC is identified by number of clients in Table 10.
Table 10Panel A: Return modelSamples Deleting samples
with “reason of impairment”
Top 5 industry by amount of
write-downs
Bad debt impairment dominating
Deleting auditors processed mergers
Coefficient p-value Coefficient p-value Coefficient p-value Coefficient p-value
截距 -0.78 0.00 -0.58 0.00 -1.03 0.00 -0.62 0.00 FWPSP_O 3.07 0.00 3.15 0.00 2.51 0.00 3.21 0.00 FWPSP_B 1.79 0.00 2.49 0.00 1.37 0.00 1.84 0.00 WPSP -0.01 0.97 -0.21 0.42 0.35 0.09 0.43 0.12 SIZE 0.03 0.00 0.02 0.04 0.04 0.00 0.02 0.00 SC 0.02 0.18 0.00 0.90 0.01 0.53 0.01 0.29 SC×WPSP 0.92 0.02 1.15 0.06 0.56 0.21 0.47 0.43 YEAR02 0.00 0.66 0.03 0.09 0.03 0.05 -0.01 0.59 YEAR03 0.10 0.00 0.10 0.00 0.10 0.00 0.10 0.00 YEAR04 -0.19 0.00 -0.20 0.00 -0.20 0.00 -0.19 0.00 N 2942 1239 1225 2120Adj R2 0.3918 0.3723 0.4168 0.3862F value 211.55*** 82.59*** 98.19*** 132.97***
17 We heavily underestimate the samples with key word “reason of impairment” because firms could disclose information of write-downs by many kinds of key words besides “reason of impairment”.
18 In terms of Top 5 industries, the medians of write-downs divided by beginning total asset are higher than those of the other industries.

ZIYE ZHAO AND BIN ZHANG76
Panel B: Price modelSamples Deleting samples
with “reason of impairment”
Top 5 industry by amount of
write-downs
Bad debt impairment dominating
Deleting auditors processed mergers
Coefficient p-value Coefficient p-value Coefficient p-value Coefficient p-value
截距 34.61 0.00 36.04 0.00 23.25 0.00 34.87 0.00 FWPS_O 6.68 0.00 7.08 0.00 6.91 0.00 6.73 0.00 FWPS_B 4.85 0.00 6.35 0.00 3.63 0.00 5.16 0.00 BVPS 0.59 0.00 0.69 0.00 0.38 0.00 0.74 0.00 WPS -2.40 0.00 -2.55 0.00 -1.61 0.00 -2.26 0.00 SIZE -1.24 0.00 -1.28 0.00 -0.69 0.00 -1.27 0.00 SC 0.68 0.00 0.53 0.03 0.75 0.00 0.42 0.01 SC×WPS 3.04 0.00 1.87 0.12 1.96 0.05 1.01 0.37 YEAR02 -2.55 0.00 -2.76 0.00 -2.02 0.00 -2.50 0.00 YEAR03 -3.74 0.00 -4.00 0.00 -3.25 0.00 -3.46 0.00 YEAR04 -6.92 0.00 -7.61 0.00 -6.24 0.00 -6.81 0.00 N 2942 1239 1225 2120Adj R2 0.5751 0.5885 0.5210 0.5839F value 399.12*** 178.03*** 134.13*** 265.92***
Panel C: Persistence modelSamples Deleting samples
with “reason of impairment”
Top 5 industry by amount of
write-downs
Bad debt impairment dominating
Deleting auditors processed mergers
Coefficient p-value Coefficient p-value Coefficient p-value Coefficient p-value
截距 -0.01 0.00 -0.01 0.06 -0.02 0.00 -0.02 0.00 OITA 0.81 0.00 0.75 0.00 0.85 0.00 0.79 0.00 BITA 0.45 0.00 0.41 0.00 0.47 0.00 0.48 0.00 WITA 0.12 0.19 0.11 0.43 0.37 0.00 0.04 0.75 SC 0.00 1.00 0.00 0.76 0.01 0.14 0.00 0.31 SC*WITA 0.25 0.29 0.19 0.56 -0.03 0.93 0.48 0.09 YEAR02 0.01 0.01 0.01 0.32 0.01 0.05 0.01 0.00 YEAR03 0.00 0.29 0.00 0.68 0.00 0.89 0.01 0.03 YEAR04 -0.01 0.00 -0.02 0.01 -0.01 0.19 -0.01 0.04 N 2942 1239 1225 2120Adj R2 0.3599 0.2901 0.3576 0.3498F value 207.70*** 64.24*** 86.16*** 127.96***All variables are as defined in Table 2.
We found that the results of SC×WPSP are the same as those with full samples. However, the ABSA effect in price models is stronger than models with total samples.
Finally, we test whether the trajectory of audit business scale advantage affects ABSA effect. We deleted auditors merging in 1997-1999 and we find that the results

THE ASSOCIATION BETWEEN AUDIT BUSINESS SCALE ADVANTAGE AND AUDIT qUALITY OF ASSET WRITE-DOWNS 77
are mixed19. Therefore, we cannot make any definite conclusion based on this test.
4. Sensitivity TestsFor the robustness check, we conducted the following sensitivity tests. First, we identified audit business scale advantage by research period instead of single year, and observed that results are not significantly different. Second, we delete observations with modified opinions for 2001 and retest for an ABSA effect. We deleted these samples because firms with modified opinions may be different from other firms regarding their financial status. 2001 is the beginning year of the requirement of long lived asset’ write-downs. The results are shown in Table 11.
Table 11: Sensitivity TestsModel Interaction
itemCriterion of
ABSASC’s
definitionSample Coefficient
(p-value)
Return SC*WPSP
Number of clients
Top 55 groupsRaw data
2861 1.03(0.16)-0.48(0.03)0.02(0.43)
Total assets of clients
Top 55 groupsRaw data
2861 3.05(0.04)-0.34(0.09)0.74(0.02)
Audit fees Top 55 groupsRaw data
2861 1.53(0.16)-0.25(0.22)0.65(0.12)
Price SC*WPS
Number of clients
Top 55 groupsRaw data
2861 0.40(0.75)-0.63(0.28)0.01(0.77)
Total assets of clients
Top 55 groupsRaw data
2861 3.01(0.15)0.35(0.38)0.21(0.76)
Audit fees Top 55 groupsRaw data
2861 0.23(0.87)0.12(0.77)0.18(0.81)
Persistence SC*WITA
Number of clients
Top 55 groupsRaw data
2861 0.45(0.18)-0.21(0.03)0.02(0.04)
Total assets of clients
Top 55 groupsRaw data
2861 0.38(0.17)-0.18(0.03)0.23(0.02)
Audit fees Top 55 groupsRaw data
2861 0.25(0.38)-0.21(0.03)0.30(0.05)
All variables are as defined in Table 2.
19 The data of mergers is from the appendix 2 of 《Who audits China’s Audit Market? (Analysis of audit market in 2000)》, Chief Accountant Office, China Securities Regulatory Commission, Beijing, Chinese Financial and Economics Publications.
ZIYE ZHAO AND BIN ZHANG78
After deleting unwanted observations from our sample, we found that ABSA effect is weaker in the return model with audit fees but is stronger in the persistence models. The results do not show there is no ABSA effect on the contrary, when taken together, we find some evidence of an ABSA effect, though our models do not fully capture economic reality. However, all tested dimensions are partly consistent with our predictions. While the results for three dimensions varied, We believe that is disparity is attributable to the divergence of investors’ understanding of write-downs, modeling limitations in capturing real motivations, incentives and other economic factors. The disparity in the statistical results should not affect the conclusion on regarding ABSA. Tentatively, we make the inference that the ABSA effect exists with some limitations, and the magnitude of the scale advantage varies with the model design and variable definitions.
Conclusions
The evolvtion of China’s auditing gives us an opportunity to gather data to test for an ABSA effect. More specifically, we investigated whether the scale of audit business is positively related to audit quality. By examining the audit of asset write-downs, we found that the quality of this task was positively related to the scale of the auditors business. Despite a wear association in some tests, we conclude that the quality of write-down judgements made by larger scale auditors was better received, and an ABSA effect exists in China’s audit market.
After confirming that an ABSA effect is found on some dimensions of audit quality of asset write-downs, we asked two questions. First, what is the wealth effect of all stakeholders in the audit market? It seems that clients benefit if they use audit business scale as an indicator of audit quality given that it is costly to observe audit quality. This research investigates whether audit business scale is appropriate proxy for audit quality. We do not claim that larger audit firms are always better. How market perceives audit quality with information asymmetry is still an open research question.
Second, what are the real forces undermine the ABSA effect in China’s audit market? This paper looked at the cooperative constructions process participated by stakeholders in China audit market, and factored in the enhancement of business liquidity and competition under the guidance of audit market policy. quasi-rent effects of cooperative regulation and the establishment of civil litigation and compensation system were considerate also. Nevertheless, this paper is exploratory analysis of the issue and further research on this topic is recommended.

THE ASSOCIATION BETWEEN AUDIT BUSINESS SCALE ADVANTAGE AND AUDIT qUALITY OF ASSET WRITE-DOWNS 79
References
1. 陈冬华、章铁生和李翔,2008, 法律环境、政府管制与隐性契约,经济研究,第3期, 第60-72页。
2. 李增泉,2001,我国上市公司资产减值政策的实证研究,中国会计与财务研究,第3卷第4期, 第114-157页。
3. 克里斯 • 安德森,2006, 长尾理论,乔江涛译,北京,中信出版社。4. 吴溪,2006, 会计师事务所合并与质量控制:基于中天勤合并案例的经验分
析,会计研究,第10期,第79-85页,第96页。5. 张奇峰,2005, 政府管制提高会计师事务所的声誉吗?来自中国证券市场的经
验证据,管理世界,第12期,第14-23页。 周海平、吕长江,2007, 会计师事务所规模会改变投资者对审计质量的判断
吗?中国会计与财务研究,第9卷第3期,第47-84页。6. 蔡祥、张海燕,2004, 资产减值准备的计提、追溯与市场效应,中国会计与财
务研究,第6卷第3期,第31-56页。7. Alciatore, M., Dee, C., Easton, P., Spear, N., 1998, Asset write-downs: a decade of
research, Journal of Accounting Literature 17, pp1-39.8. Alciatore, M., Easton, P. and Spear, N., 2000, Accounting for the Impairment of Long-
Lived Assets: Evidence from the Petroleum Industry, Journal of Accounting and Economics 29, pp151-172.
9. Balvers, R., Mcdonald, B. and Miller, R., 1988, Underpricing of new issues and the choice of auditors as a signal of investment banker reputation, The Accounting Review 63, pp605-622.
10. Bar-Yosef, S. and Sarath, B., 2005, Auditor Size, market segmentation and litigation patterns: a theoretical analysis, Review of Accounting Studies 10(1), pp59-92.
11. Chen, C., Chen, S. and Su, X., 2001, Is accounting information value-relevant in the emerging Chinese stock market? Journal of International Accounting, Auditing, and Taxation 10, pp1-22.
12. Chen, J., Chen, S. Su, X. and Wang, Y., 2004, Incentives for and consequences of initial voluntary asset write-downs in the emerging Chinese market, Journal of International Accounting Research 3, pp43-61.
13. Chen, S. and Wang, Y., 2004, Evidence from China on value-relevance of operating income vs below-the-line items, The International Journal of Accounting 39, pp339-364.
14. Chen, K. and Yuan, H., 2004, Earnings management and capital resources allocation: evidence from China accounting-based regulation of rights issues, The Accounting Review 79, pp645-665.
15. DeAngelo, L., 1981, Auditor size and audit quality, Journal of Accounting and Economics 3, pp183-199.
16. DeFond, M., Wong, T. and Li, S., 2000, The impact of improved auditor independence on auditor market concentration in China, Journal of Accounting and Economics 28, pp269-305.
17. Dye, R., 1993, Auditing standards, legal liability and auditor wealth, Journal of Political Economy 101, pp887-914.
18. Easton, P., Eddey, P. and Harris, T., 1993, An investigation of revaluation of tangible long lived assets, Journal of Accounting Research 31(supplement), pp138.
19. Easton, P. and Harris, T., 1991, Earnings as an explanatory variable for returns, Journal of Accounting Research 29, pp19-36.
ZIYE ZHAO AND BIN ZHANG80
20. Eccher, E. and Healy, P., 2000, The role of international accounting standards in transitional economies: A study of the People’s Republic of China, Working paper: MIT.
21. Eichenseher, J., Hagigi, M. and Shields, D., 1989, Market reaction to auditor changes by OTC companies, Auditing: A Journal of Practice and Theory 11, pp16-31.
22. Elliott, J. and Shaw, W., 1988, Write-offs as accounting procedures to manager perceptions, Journal of Accounting Research 26 (supplement), pp91-119.
23. Francis, J., Hanna, D. and Vincent, L., 1996, Causes and effects of discretionary asset write-offs, Journal of Accounting Research 34 (supplement), pp117-134.
24. Frantz, P., 1999, Discretionary write-downs, write-offs, and other restructuring provisions: A signaling approach, Accounting and Business Research 29(2), pp109-121.
25. Kothari, S. and Zimmerman, J., 1995, Price and return models, Journal of Accounting and Economics 20, pp155-192.
26. Ohlson, J., 1995, Earnings, book values, and dividends in equity valuation, Contemporary Accounting Research (Spring), pp 661-687.
27. Pistor, K. and Xu, C., 2005, Governing stock markets in transition economics: lessons from China, American Law & Economics Review 7(1), pp184-210.
28. Richardson, S., Sloan, R., Soliman, M. and Tuna, I. 2005, Accrual reliability, earnings persistence and stock prices, Journal of Accounting and Economics 39, pp437-485.
29. Riedl, E., 2004, An examination of long-lived asset impairments, Accounting Review 79, pp823-852.
30. Sloan, R., 1996, Do stock prices fully reflect information in accruals and cash flows about future earnings? The Accounting Review (July), pp289-315.
31. Strong, J. and Meyer, J., 1987, Asset write-downs: Managerial incentives and security returns, Journal of Finance 42, pp643-661.
32. Teoh, S. and Wong, T., 1993, Perceived auditor quality and the earnings response coefficient, The Accounting Review 68(2), pp346-366.
33. Wilson, G., 1996, Discussion: write-offs: Manipulation or impairment? Journal of Accounting Research 34, pp171-177.
34. Yang, Z., Rohrback, K. and Chen, S., 2005, The impact of standard-setting on relevance and reliability of accounting information: Lower of cost or market accounting reforms in China, The Journal of Multinational Financial Management and Accounting 16(3), pp194-228.
35. Zucca, L. and Campbell, D., 1992, A closer look at discretionary write-downs of impaired assets, Accounting Horizons (September), pp30-41.