Preprint - ESSD
34
1 AWESOME: Archive for Water Erosion and Sediment Outflow MEasurements Jinshi Jian 1,3 ★ , Xuan Du 4 ★ , Juying Jiao 1,2# , Xiaohua Ren 5 , Karl Auerswald 6 , Ryan D. Stewart 7 , Zeli Tan 8 , Jianlin Zhao 9 , Daniel L. Evans 10 , Guangju Zhao 1,2 , Nufang Fang 1 , Wenyi Sun 1,2 , Chao Yue 1,2 , Ben Bond-Lamberty 2 5 1. State Key Laboratory of Soil Erosion and Dryland Farming on the Loess Plateau, Northwest A&F University, Yangling, 712100, China 2. Institute of Soil and Water Conservation, Chinese Academy of Sciences & Ministry of Water Resources, 26 Xinong Road, Xianyang 712100, China 3. Pacific Northwest National Laboratory, Joint Global Change Research Institute at the University of 10 Maryland–College Park, 5825 University Research Court, Suite 3500, College Park, MD 20740, USA 4. Department of Hydraulic Engineering, Yangling Vocational & Technical College, Yang Ling, Shaanxi, China 5. Institute of Soil and Water Conservation, Northwest A&F University, Yangling, 712100, Shaanxi, China 15 6. Aquatic Systems Biology Unit, Technical University of Munich, 85354 Freising, Germany 7. School of Plant and Environmental Sciences, Virginia Tech, Blacksburg, VA, USA 8. Pacific Northwest National Laboratory, Richland, WA, USA 9. Department of Geology Engineering and Geomatics, Chang'an University, Yantalu 126, Xi'an 710054, China 20 10. School of Water, Energy and Environment, Cranfield University, Cranfield, Bedfordshire, MK43 0AL, UK # Correspondence to: Juying Jiao ([email protected]) ★ These authors contributed equally to this work 25 https://doi.org/10.5194/essd-2022-87 Open Access Earth System Science Data Discussions Preprint. Discussion started: 9 March 2022 c Author(s) 2022. CC BY 4.0 License.
-
Upload
khangminh22 -
Category
Documents
-
view
0 -
download
0
Transcript of Preprint - ESSD
1
AWESOME: Archive for Water Erosion and Sediment Outflow MEasurements Jinshi Jian1,3★, Xuan Du4★, Juying Jiao1,2#, Xiaohua Ren5, Karl Auerswald6, Ryan D. Stewart7, Zeli Tan8, Jianlin Zhao9, Daniel L. Evans10, Guangju Zhao1,2, Nufang Fang1, Wenyi Sun1,2, Chao Yue1,2, Ben Bond-Lamberty2 5
1. State Key Laboratory of Soil Erosion and Dryland Farming on the Loess Plateau, Northwest A&F University, Yangling, 712100, China
2. Institute of Soil and Water Conservation, Chinese Academy of Sciences & Ministry of Water Resources, 26 Xinong Road, Xianyang 712100, China
3. Pacific Northwest National Laboratory, Joint Global Change Research Institute at the University of 10 Maryland–College Park, 5825 University Research Court, Suite 3500, College Park, MD 20740, USA
4. Department of Hydraulic Engineering, Yangling Vocational & Technical College, Yang Ling, Shaanxi, China
5. Institute of Soil and Water Conservation, Northwest A&F University, Yangling, 712100, Shaanxi, China 15
6. Aquatic Systems Biology Unit, Technical University of Munich, 85354 Freising, Germany 7. School of Plant and Environmental Sciences, Virginia Tech, Blacksburg, VA, USA 8. Pacific Northwest National Laboratory, Richland, WA, USA 9. Department of Geology Engineering and Geomatics, Chang'an University, Yantalu 126, Xi'an
710054, China 20 10. School of Water, Energy and Environment, Cranfield University, Cranfield, Bedfordshire, MK43
0AL, UK
# Correspondence to: Juying Jiao ([email protected])
★ These authors contributed equally to this work 25
https://doi.org/10.5194/essd-2022-87
Ope
n A
cces
s Earth System
Science
DataD
iscussio
ns
Preprint. Discussion started: 9 March 2022c© Author(s) 2022. CC BY 4.0 License.
2
Abstract
Soil erosion is a major threat to soil resources, causing environmental degradation and contributing to poverty in many parts of the world. Many field experiments have been performed over the past century to study spatio-temporal patterns of soil erosion caused by surface runoff under different environmental 30 conditions. However, these data have never been integrated together in a way that can inform efforts to understand and model soil erosion at different spatial and temporal scales. Here, we designed a database titled AWESOME: Archive for Water Erosion and Sediment Outflow Measurements (Jian et al., 2022). The AWESOME database compiles field measurements of annual soil erosion and sediment yield caused by surface runoff, with data derived from sites around the globe. It includes four soil 35 erosion-related indicators (surface runoff, annual erosion, annual sediment yield, and soil nutrient loss) and more than sixty variables for meta-data that describe the location, climate, soil properties, experimental design (e.g., soil erosion measurement method, field scale, replication), and bibliographic information (e.g., author name and year of publication). Currently, measurements from 1985 geographic sites with unique combinations of longitude and latitude, representing 75 countries, have been compiled 40 into AWESOME. We provide an example of linking AWESOME with an external climate dataset, and identify correlations between soil erosion and several environmental variables. Annual soil erosion rates were most influenced by vegetation type and soil texture group. Annual soil erosion rates exhibited significant negative relationships with plant coverage, soil clay content, soil pH, and soil organic carbon content, and significant positive relationships with annual precipitation and soil bulk density. AWESOME 45 aims to be a freely available, and global framework for compiling field soil erosion and subsequent sediment yield measurements, and to provide data sources to support statistical evaluations, model validation and applications, as well as a better understanding of spatial and temporal patterns of soil erosion.
Keywords: soil loss, soil truncation, nutrient movement, data collection, data inventory 50
https://doi.org/10.5194/essd-2022-87
Ope
n A
cces
s Earth System
Science
DataD
iscussio
ns
Preprint. Discussion started: 9 March 2022c© Author(s) 2022. CC BY 4.0 License.
3
1. Introduction
Soil is an essential natural resource for sustainable development that is continually threatened by erosion and associated land degradation processes (Borrelli et al., 2017; Poesen, 2017). Soil 55 erosion is a geomorphic process that occurs when soil particles, soil aggregates, organic matter, and rock fragments detach from their original position and are transported to other locations (Du et al., 2021; Morgan, 1988; Toy et al., 2002). The agents of soil erosion (including sheet erosion, rill erosion, and tillage erosion in this study, collectively termed soil erosion hereafter) are both abiotic (e.g., water, wind, natural hazards), biotic (e.g., tree throw) and anthropogenic (e.g., tillage 60 erosion) and may have significant consequences for carbon cycling (Berhe et al., 2007; Ito, 2007; Lal, 2003; Tan et al., 2020; Van Oost et al., 2007; Wang et al., 2017; Yue et al., 2016).
Human activities, including cropland cultivation, mining, building construction, and deforestation, have substantially increased erosion rates (Borrelli et al., 2017; García-Ruiz et al., 2015; Poesen, 2017; Vanwalleghem et al., 2017). In China, population growth and demographic shifts have 65 increased the demand for food and other resources, leading to changes in land-use, particularly cultivation intensity, which affects soil erosion (Guo et al., 2015; Xu et al., 2010; Zhang et al., 2012; Zhao et al., 2013). As another example, large-scale farmland expansion in previously forested and grass-covered prairies of the United States of America led to severe soil loss and degradation of agricultural land in the 1930s, mainly by wind erosion, resulting in widespread 70 ecosystem damage and economic losses. One outcome of this devastation was the initiation of seminal programs to measure soil erosion by wind and particularly by water (Baumhardt et al. 2015; Schubert et al., 2004).
A multitude of field experiments have followed from these early measurement campaigns, and have quantified erosion across climates, soil types, land use practices and management techniques. 75 Some have utilized runoff plots, with natural rain, while others used tracers, watershed studies or other approaches. Studies using runoff plots with natural rain can be found for many countries and regions including the USA (>10,000 plot years), Europe (>8,000 plot years), and Brazil (>2500 plot years) (Poesen, 2017). These experiments have led to more than 30,000 peer-reviewed studies (searched at https://www.sciencedirect.com using “Erosion, runoff” as keywords, Figure 1a). 80 Many of these studies have also been compiled together to assess soil erosion processes at regional-to-global scales. For example, annual soil erosion rates from plots on the Chinese Loess Plateau were collected to estimate topsoil losses and to analyze the effects of conservation measures on erosion (Zhao et al., 2016). Later, measurements from erosion plots all over China were collected by Zhao et al. (2021) to analyze how sheet and rill erosion processes were affected by topography, 85 land use, and precipitation. Similarly, Auerswald et al. (2009) compiled 1076 field soil erosion measurements from 27 papers to quantify the extent and variability of soil erosion in Germany.
https://doi.org/10.5194/essd-2022-87
Ope
n A
cces
s Earth System
Science
DataD
iscussio
ns
Preprint. Discussion started: 9 March 2022c© Author(s) 2022. CC BY 4.0 License.
4
Based on an analysis of more than 200 papers, Maetens et al. (2012a) compared plot-scale soil erosion rates from 227 sites in Europe and the Mediterranean. The authors also evaluated the effects of soil conservation techniques in reducing surface runoff and soil loss (Maetens et al., 90 2012b). Soil erosion rates have also been compiled to estimate soil lifespans (Evans et al., 2020) and to analyze soil erosion rates under different environmental conditions using a meta-analysis (García-Ruiz et al., 2015). Montgomery (2007) compiled 1673 soil erosion measurements from studies across the globe and showed that erosion rates from conventionally managed croplands were 1-2 orders of magnitude greater than that under natural vegetation. Recently, a database 95 named “Global Applications of Soil Erosion Modelling Tracker, GASEMT”, was developed using data systematically extracted from 1697 articles to analyze soil erosion rates simulated by more than 25 models over the past decades (Borrelli et al., 2021).
However, those efforts either focused on answering specific questions (e.g., Evans et al., 2020), a specific region (e.g. Auerswald et al. 2009; Cerdan et al. 2010; Zhao et al., 2016, 2021), or relied 100 on model calculations rather than physical measurements (Borrelli et al., 2021). There has not yet been a published effort that compiles erosion and sediment yield measurements from published articles into a single coherent dataset. Such a database could be used to support evaluation and parameterization of erosion models, statistical analysis, non-point pollution evaluation, as well as cropland management recommendation. It can also be used to perform synthesis analyses, support 105 statistical meta-analyses, and may inspire future efforts to better understand spatial and temporal patterns of soil erosion.
To bridge this gap, we developed a database: Archive for Water Erosion and Sediment Outflow MEasurements (hereafter named AWESOME; Jian et al., 2022) for compiling and understanding historical soil erosion measurements. Based on the annual soil erosion measurements compiled 110 from multiple articles, we also analyzed environmental factors governing annual soil erosion rates globally. We note that many other types of erosion, such as wind erosion, gravity erosion, and freeze-thaw erosion, are widely present in the world, but their influencing factors are different from those of water erosion, making it difficult to including them in the same data framework. Therefore, AWESOME only compiled data on water erosion, specifically, splash erosion (caused 115 by raindrop, it is the first stage in the erosion process), sheet erosion (loss of fine soil particles that contain nutrients and organic matter, occurs when the intensity of rainfall is greater than the soil infiltration capacity), rill erosion (as rill erosion continues to develop, when the water concentrates deeper in the soil and starts forming faster-flowing channels (can be up to 30cm deep) and cause detachment and transportation of soil particles), and tillage erosion (occurring in cultivated fields 120 due to the movement of soil by tillage).
https://doi.org/10.5194/essd-2022-87
Ope
n A
cces
s Earth System
Science
DataD
iscussio
ns
Preprint. Discussion started: 9 March 2022c© Author(s) 2022. CC BY 4.0 License.
5
2. Methods
We designed the database AWESOME following Findable, Accessible, Interoperable, and Reusable (FAIR) protocols (Wilkinson et al., 2016). All data, quality assurance/quality control (QA/QC, details please see section 2.5) code, and analysis code are immediately available through 125 a GitHub repository (see section 2.6), and each release will be issued a DOI through Zenodo to ensure reusability. The version follows an “x.y.z” format, where x is the major version number, y is the minor version number, and z is the patch number. The major version number is updated only if the database changes its structure; we expect this to happen at a decadal time step. We update the minor version number whenever the database has a significant data update; this would usually 130 occur annually. The patch number is likely to be updated yearly, or whenever the database has an important documentation update or data correction. We also made efforts to ensure interoperability so that AWESOME can be easily linked to external datasets.
2.1 Publication collection
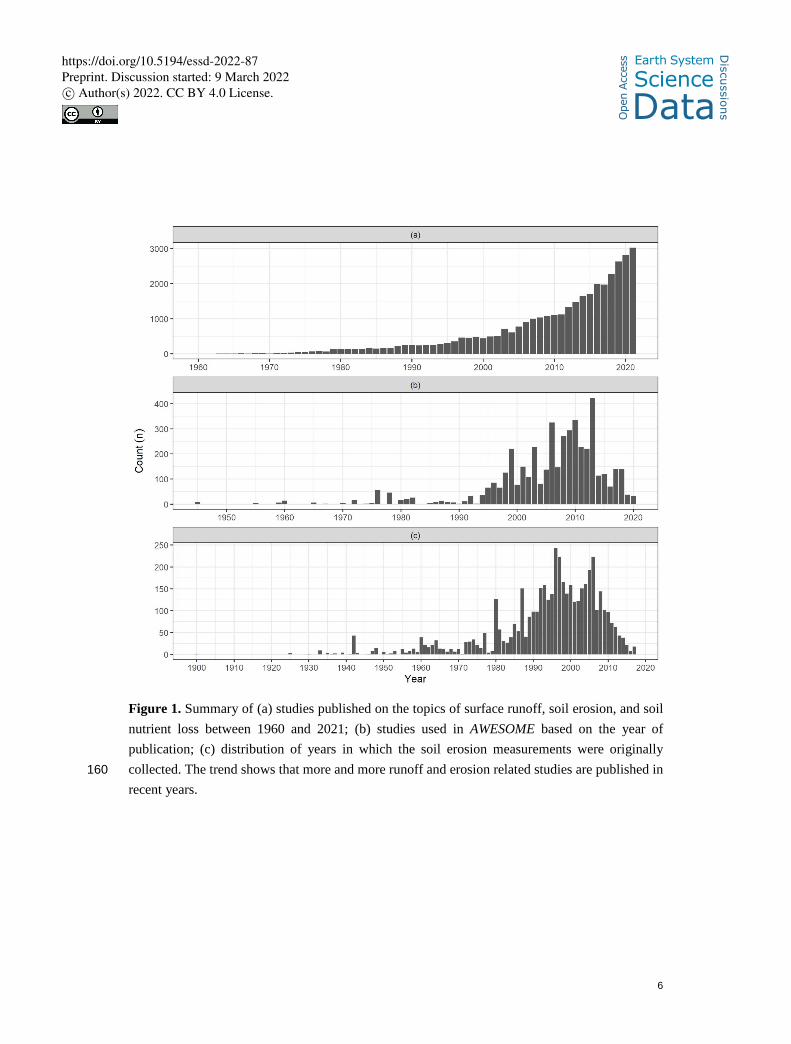
Publications since 1960 were collected from an online literature search using “runoff, erosion” as 135 keywords in ScienceDirect (https://www.sciencedirect.com/). We had no restrictions on literature types, and included both peer-reviewed articles and non-peer-reviewed articles such as theses, dissertations, and conference collections. We mostly included studies that were published in English or Chinese language journals (due to the contributors’ proficiency in these two languages). During this initial literature screening phase, the following criteria were used to determine whether 140 an article should be included in the database: (1) annual soil erosion or sediment yield were measured in the field by runoff plots, erosion pins, tracer, or field survey (types and constraints of included data are indicated in Table 1), meaning that laboratory studies, rainfall simulation experiments, and model outputs were excluded; and (2) annual soil erosion or sediment yield were reported in units that could be converted to t ha-1 yr-1. We included no other filtering criteria or 145 restrictions to the literature. Only approximately 5% of papers reporting annual soil erosion or sediment yield data met those criteria and could be included in AWESOME (Figure 1b). Note that we did not include a constraint for soil nutrient loss data (NL, e.g., soil organic carbon loss, total nitrogen loss, total phosphorus data could be collected depending on which data were reported in the literature) because a variety of NL types and units were reported (Table 2). As AWESOME has 150 only one variable for NL data, only data from one type of NL were collected if a paper reported multiple NL types (i.e., nitrogen loss related data were collected if available, otherwise reported phosphorus loss data were collected; if both nitrogen and phosphorus loss data were not available, then recorded carbon loss data were collected, in another word, we have a hierarchy of N > P > C, and only data from one element were took). 155
https://doi.org/10.5194/essd-2022-87
Ope
n A
cces
s Earth System
Science
DataD
iscussio
ns
Preprint. Discussion started: 9 March 2022c© Author(s) 2022. CC BY 4.0 License.
6
Figure 1. Summary of (a) studies published on the topics of surface runoff, soil erosion, and soil nutrient loss between 1960 and 2021; (b) studies used in AWESOME based on the year of publication; (c) distribution of years in which the soil erosion measurements were originally collected. The trend shows that more and more runoff and erosion related studies are published in 160 recent years.
https://doi.org/10.5194/essd-2022-87
Ope
n A
cces
s Earth System
Science
DataD
iscussio
ns
Preprint. Discussion started: 9 March 2022c© Author(s) 2022. CC BY 4.0 License.
7
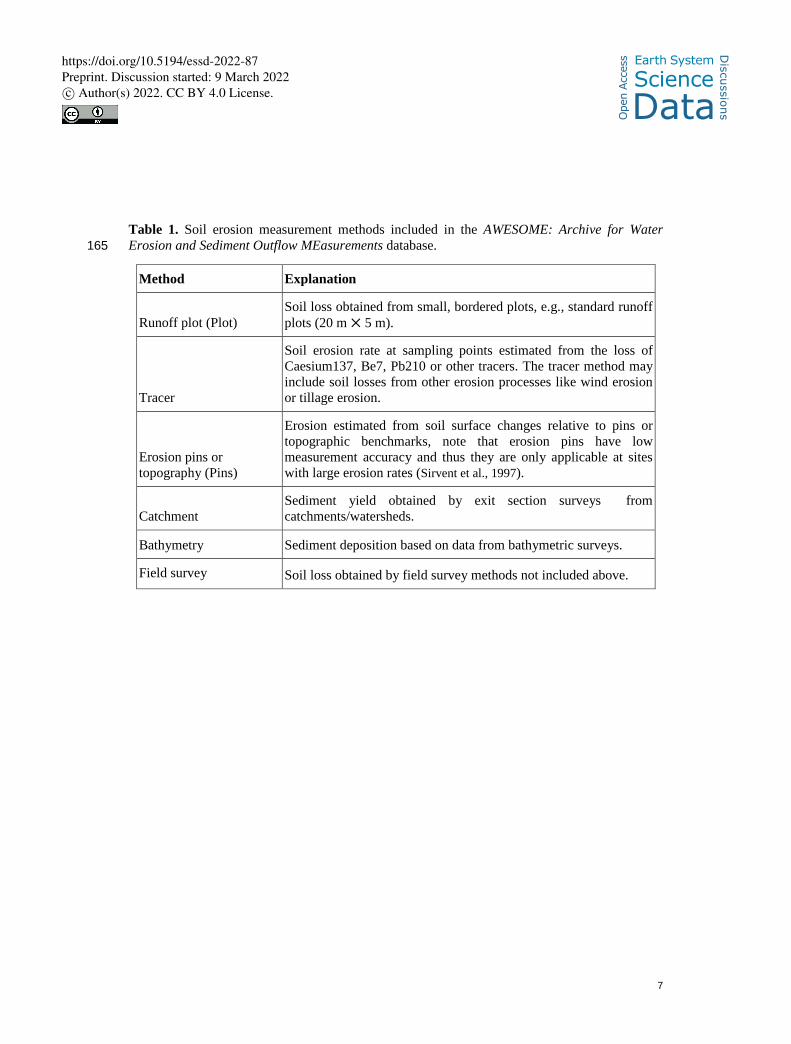
Table 1. Soil erosion measurement methods included in the AWESOME: Archive for Water Erosion and Sediment Outflow MEasurements database. 165
Method Explanation
Runoff plot (Plot) Soil loss obtained from small, bordered plots, e.g., standard runoff plots (20 m ⨉ 5 m).
Tracer
Soil erosion rate at sampling points estimated from the loss of Caesium137, Be7, Pb210 or other tracers. The tracer method may include soil losses from other erosion processes like wind erosion or tillage erosion.
Erosion pins or topography (Pins)
Erosion estimated from soil surface changes relative to pins or topographic benchmarks, note that erosion pins have low measurement accuracy and thus they are only applicable at sites with large erosion rates (Sirvent et al., 1997).
Catchment Sediment yield obtained by exit section surveys from catchments/watersheds.
Bathymetry Sediment deposition based on data from bathymetric surveys.
Field survey Soil loss obtained by field survey methods not included above.
https://doi.org/10.5194/essd-2022-87
Ope
n A
cces
s Earth System
Science
DataD
iscussio
ns
Preprint. Discussion started: 9 March 2022c© Author(s) 2022. CC BY 4.0 License.
8
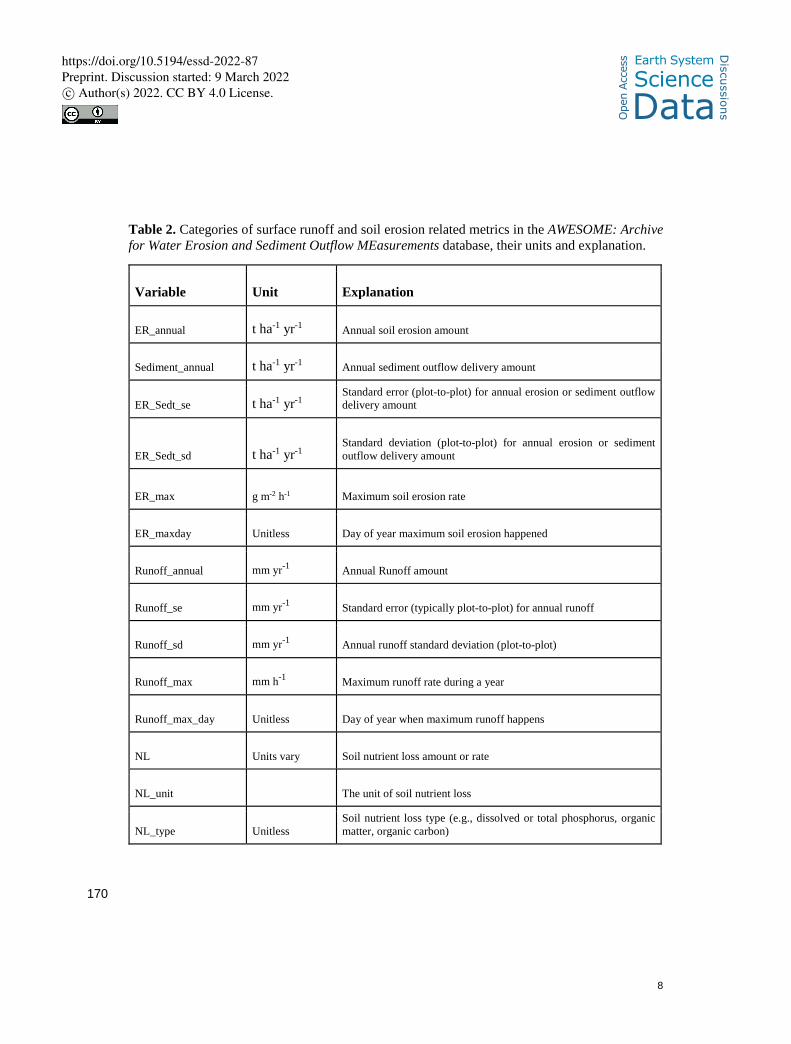
Table 2. Categories of surface runoff and soil erosion related metrics in the AWESOME: Archive for Water Erosion and Sediment Outflow MEasurements database, their units and explanation.
Variable Unit Explanation
ER_annual t ha-1 yr-1 Annual soil erosion amount
Sediment_annual t ha-1 yr-1 Annual sediment outflow delivery amount
ER_Sedt_se t ha-1 yr-1 Standard error (plot-to-plot) for annual erosion or sediment outflow delivery amount
ER_Sedt_sd t ha-1 yr-1 Standard deviation (plot-to-plot) for annual erosion or sediment outflow delivery amount
ER_max g m-2 h-1 Maximum soil erosion rate
ER_maxday Unitless Day of year maximum soil erosion happened
Runoff_annual mm yr-1 Annual Runoff amount
Runoff_se mm yr-1 Standard error (typically plot-to-plot) for annual runoff
Runoff_sd mm yr-1 Annual runoff standard deviation (plot-to-plot)
Runoff_max mm h-1 Maximum runoff rate during a year
Runoff_max_day Unitless Day of year when maximum runoff happens
NL Units vary Soil nutrient loss amount or rate
NL_unit The unit of soil nutrient loss
NL_type Unitless Soil nutrient loss type (e.g., dissolved or total phosphorus, organic matter, organic carbon)
170
https://doi.org/10.5194/essd-2022-87
Ope
n A
cces
s Earth System
Science
DataD
iscussio
ns
Preprint. Discussion started: 9 March 2022c© Author(s) 2022. CC BY 4.0 License.
9
We also included cited papers since 1945 from four meta-analysis papers (i.e., Auerswald et al., 2009; Evans et al., 2020; García-Ruiz et al., 2015; Zhao et al., 2019). To date we have collected and processed data from 601 papers including measurements taken between 1900 and 2017 (Figure 1c). When site location (latitude and longitude) was not reported, we estimated site coordinates according to the site name or the maps provided in the paper. For the soil erosion-related indicators 175 (i.e., surface runoff, soil erosion, sediment yield, and NL), data were either directly read from tables or digitized from figures. We used Data Thief (version III) (Flower et al., 2016) whenever we had to obtain the values from figures. Replications, standard error (SE), and standard deviation (SD) information were usually directly obtained from the original papers. However, sometimes confidence interval (CI), or coefficient of variation (CV) were reported rather than SD; in these 180 instances, we calculated SD using equations 2 and 3 cited in Jian et al (2020a). We also recorded the time information when the experiments were initiated or data were collected if available (‘Study_midyear’ in AWESOME). The middle year was recorded if the experiment covered a period of time (e.g., if an experiment was conducted between 1980 and 1990, 1985 was recorded as ‘Study_midyear’). The earliest data date back to 1900, but few measurements were available 185 before 1960, and most data were centered between 1980 and 2010 (Figure 1c).
Note that different methods can capture distinct processes that contribute to soil loss and hence the type of measurement should be considered before pooling data in subsequent analyses. For example, runoff plot data usually only include soil losses from sheet erosion, interrill, and rill processes. Tracer data, by contrast, include all causes of soil loss, e.g., water erosion, tillage 190 erosion, wind erosion, and harvest erosion, and they also include sedimentation processes. Therefore, papers using tracer methods were only included in the database if the sites were located in a region dominated by water erosion or if the study clarified that soil erosion by water was measured. Erosion pins usually also include only soil loss from interrill and rill processes but may be biased by soil consolidation while topographic marks like lynches or elevation distances 195 between trees and the surrounding field also include other processes, particularly tillage erosion.
https://doi.org/10.5194/essd-2022-87
Ope
n A
cces
s Earth System
Science
DataD
iscussio
ns
Preprint. Discussion started: 9 March 2022c© Author(s) 2022. CC BY 4.0 License.
10
2.2 Database structure design
The database AWESOME (i.e., AWESOME.xlsx file in the GitHub repository) has 12 data sheets; the core is the AWESOME data sheet, with four soil erosion – related indicators – surface runoff, 200 soil erosion, sediment yield, and NL (Table 2) – and 65 meta-data variables (Table 3, to save space, we have listed only 13 out of 65 variables). The “DataBase_variables” data sheet describes all variables in the AWESOME data sheet. The “CountryCode” sheet holds the international country code for the usage of Site_ID. The “Quality_flag” sheet describes the quality control flag of measurements collected from papers (see Table 4 for details). The “Meas_method” sheet describes 205 soil erosion measurement methods reported in papers (see Table 1 for details). The “IGBP” sheet describes all 20 International Geosphere–Biosphere Programme (IGBP) vegetation types (Townshend, 1992) reported in papers (details for the description of all IGBP types could be find at the IGBP datasheet in the AWESOME.xlsx file). The “Manipulation” sheet includes description and comments about 16 manipulation types used in the AWESOME (see Table 5 for details). The 210 “ReferenceList” sheet holds all reference details for all papers we compiled into the AWESOME; and the “LiteratureSearch” sheet describes literature search details for the AWESOME, such that users can reproduce the literature search results based on the description.
https://doi.org/10.5194/essd-2022-87
Ope
n A
cces
s Earth System
Science
DataD
iscussio
ns
Preprint. Discussion started: 9 March 2022c© Author(s) 2022. CC BY 4.0 License.
11
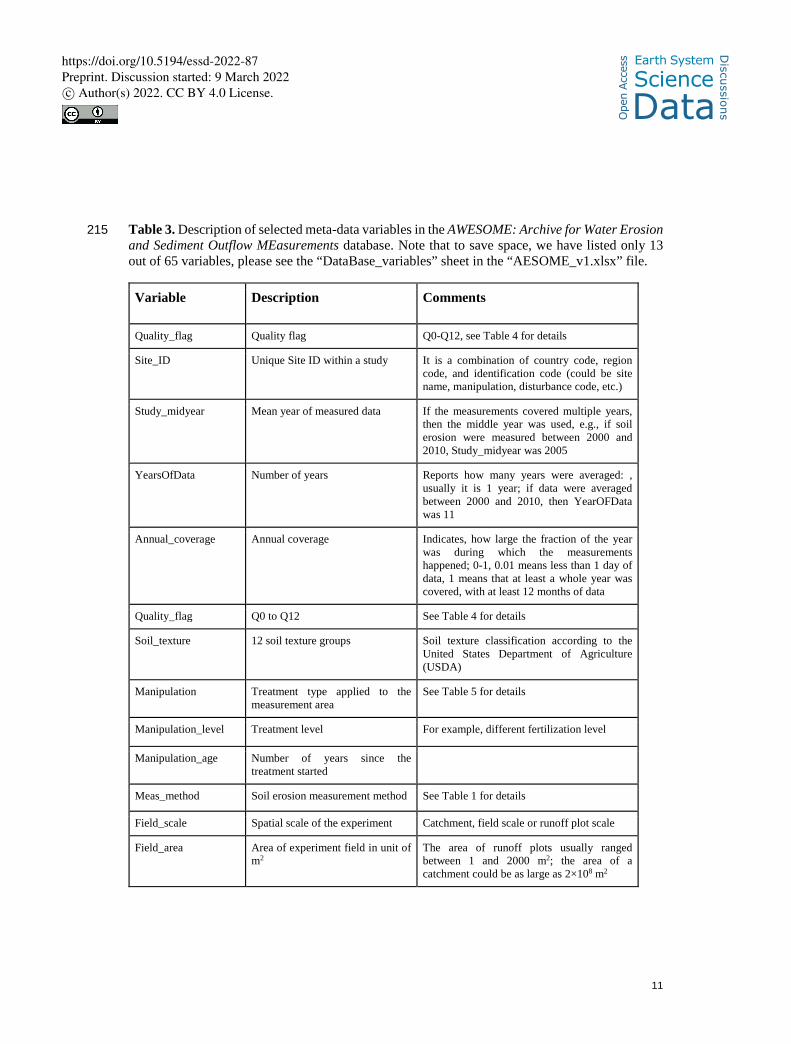
Table 3. Description of selected meta-data variables in the AWESOME: Archive for Water Erosion 215 and Sediment Outflow MEasurements database. Note that to save space, we have listed only 13 out of 65 variables, please see the “DataBase_variables” sheet in the “AESOME_v1.xlsx” file.
Variable Description Comments
Quality_flag Quality flag Q0-Q12, see Table 4 for details
Site_ID Unique Site ID within a study It is a combination of country code, region code, and identification code (could be site name, manipulation, disturbance code, etc.)
Study_midyear Mean year of measured data If the measurements covered multiple years, then the middle year was used, e.g., if soil erosion were measured between 2000 and 2010, Study_midyear was 2005
YearsOfData Number of years Reports how many years were averaged: , usually it is 1 year; if data were averaged between 2000 and 2010, then YearOFData was 11
Annual_coverage Annual coverage Indicates, how large the fraction of the year was during which the measurements happened; 0-1, 0.01 means less than 1 day of data, 1 means that at least a whole year was covered, with at least 12 months of data
Quality_flag Q0 to Q12 See Table 4 for details
Soil_texture 12 soil texture groups Soil texture classification according to the United States Department of Agriculture (USDA)
Manipulation Treatment type applied to the measurement area
See Table 5 for details
Manipulation_level Treatment level For example, different fertilization level
Manipulation_age Number of years since the treatment started
Meas_method Soil erosion measurement method See Table 1 for details
Field_scale Spatial scale of the experiment Catchment, field scale or runoff plot scale
Field_area Area of experiment field in unit of m2
The area of runoff plots usually ranged between 1 and 2000 m2; the area of a catchment could be as large as 2×10⁸ m2
https://doi.org/10.5194/essd-2022-87
Ope
n A
cces
s Earth System
Science
DataD
iscussio
ns
Preprint. Discussion started: 9 March 2022c© Author(s) 2022. CC BY 4.0 License.
12
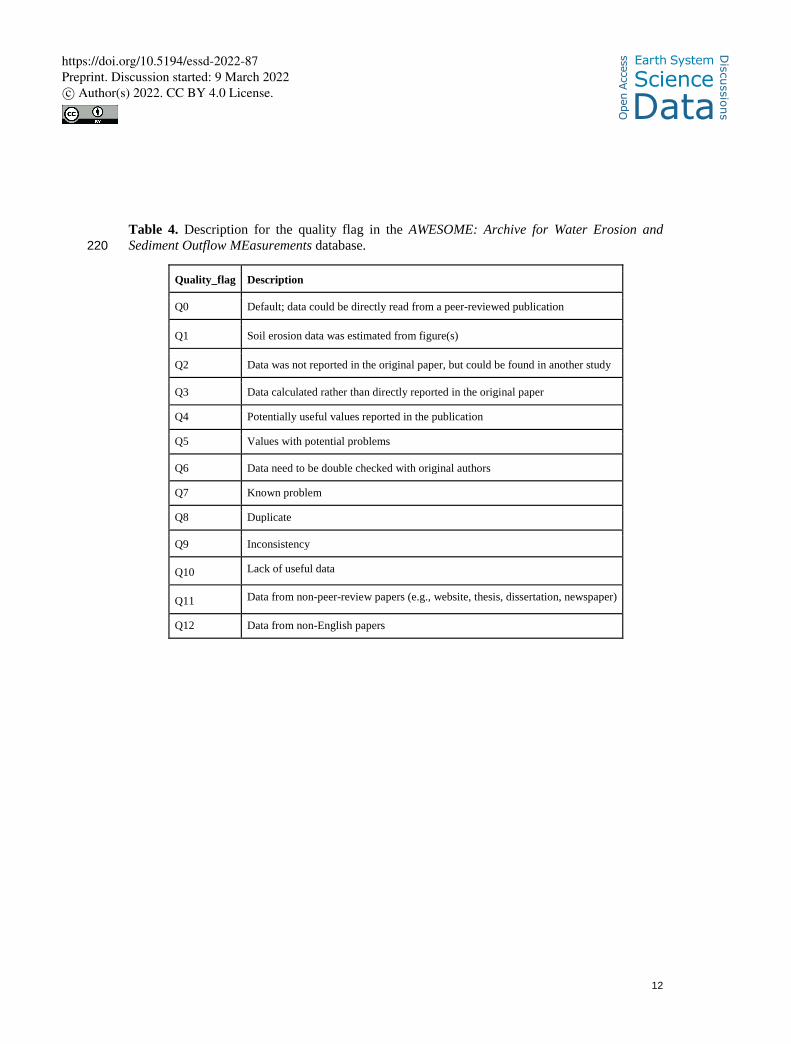
Table 4. Description for the quality flag in the AWESOME: Archive for Water Erosion and Sediment Outflow MEasurements database. 220
Quality_flag Description
Q0 Default; data could be directly read from a peer-reviewed publication
Q1 Soil erosion data was estimated from figure(s)
Q2 Data was not reported in the original paper, but could be found in another study
Q3 Data calculated rather than directly reported in the original paper
Q4 Potentially useful values reported in the publication
Q5 Values with potential problems
Q6 Data need to be double checked with original authors
Q7 Known problem
Q8 Duplicate
Q9 Inconsistency
Q10 Lack of useful data
Q11 Data from non-peer-review papers (e.g., website, thesis, dissertation, newspaper)
Q12 Data from non-English papers
https://doi.org/10.5194/essd-2022-87
Ope
n A
cces
s Earth System
Science
DataD
iscussio
ns
Preprint. Discussion started: 9 March 2022c© Author(s) 2022. CC BY 4.0 License.
13
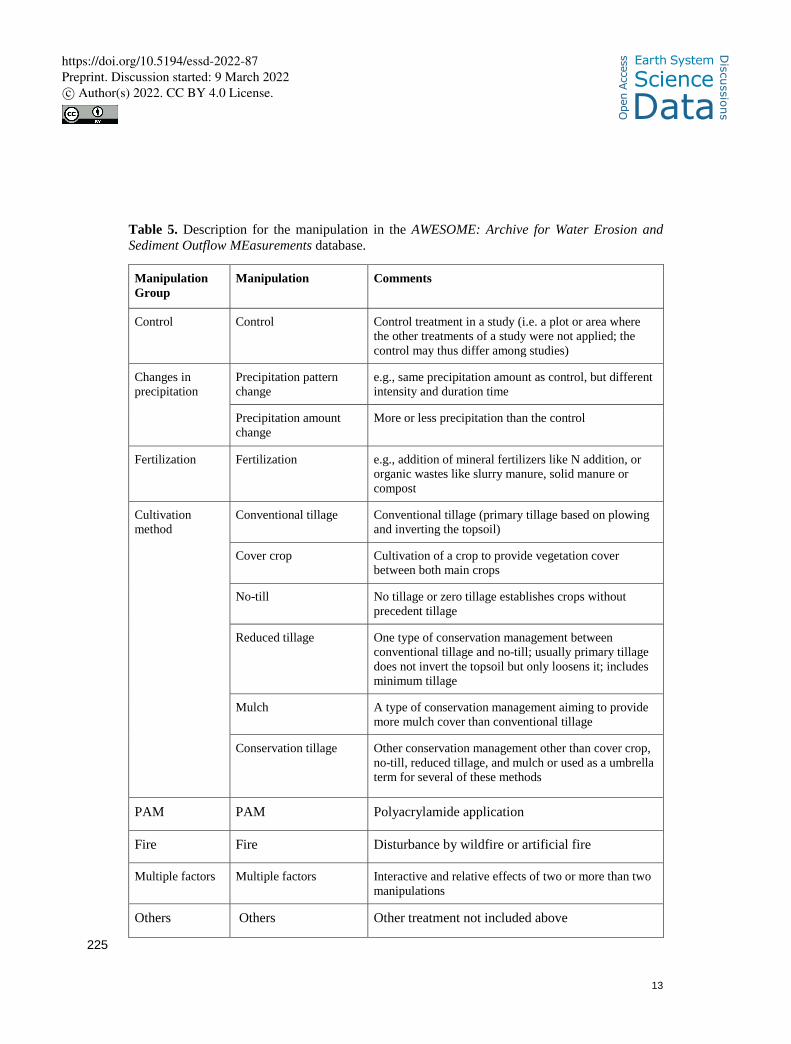
Table 5. Description for the manipulation in the AWESOME: Archive for Water Erosion and Sediment Outflow MEasurements database.
Manipulation Group
Manipulation Comments
Control Control Control treatment in a study (i.e. a plot or area where the other treatments of a study were not applied; the control may thus differ among studies)
Changes in precipitation
Precipitation pattern change
e.g., same precipitation amount as control, but different intensity and duration time
Precipitation amount change
More or less precipitation than the control
Fertilization Fertilization e.g., addition of mineral fertilizers like N addition, or organic wastes like slurry manure, solid manure or compost
Cultivation method
Conventional tillage Conventional tillage (primary tillage based on plowing and inverting the topsoil)
Cover crop Cultivation of a crop to provide vegetation cover between both main crops
No-till No tillage or zero tillage establishes crops without precedent tillage
Reduced tillage One type of conservation management between conventional tillage and no-till; usually primary tillage does not invert the topsoil but only loosens it; includes minimum tillage
Mulch A type of conservation management aiming to provide more mulch cover than conventional tillage
Conservation tillage Other conservation management other than cover crop, no-till, reduced tillage, and mulch or used as a umbrella term for several of these methods
PAM PAM Polyacrylamide application
Fire Fire Disturbance by wildfire or artificial fire
Multiple factors Multiple factors Interactive and relative effects of two or more than two manipulations
Others Others Other treatment not included above
225
https://doi.org/10.5194/essd-2022-87
Ope
n A
cces
s Earth System
Science
DataD
iscussio
ns
Preprint. Discussion started: 9 March 2022c© Author(s) 2022. CC BY 4.0 License.
14
2.3 Soil erosion, surface runoff, sediment yield, and NL measurements
Surface runoff, soil erosion, and NL measurements are core data in the AWESOME database:
● Soil erosion: annual soil erosion rate in units of t ha-1 yr-1, measured using runoff plots, erosion pins, tracers, or field survey methods.
● Sediment yield: if the study area is a catchment and the soil loss is monitored by a gauging 230 station or a bathymetry method, data integrate over all erosion processes by water (interrill, rill, ephemeral gully and gully erosion) but also sedimentation processes along the flow path to the measuring station. Therefore, the soil loss data were recorded as sediment yield.
● Surface runoff: annual runoff in units of mm yr-1. ● NL: because a variety of NL types were reported in papers, NL was organized in a different 235
way, where the “NL” variable holds values, the “NL_unit” holds the unit of measurement reported in the original paper, and the “NL_type” variable records the NL type reported in the original paper.
It should be noted that AWESOME has been designed to hold surface runoff, soil erosion, and sediment yield measurements in terms of annual masses. 240
2.4 Meta-data
Meta-data (Table 3) includes descriptive data about sites and experimental design. Measurement methods of soil erosion or sediment yield. Quality control flag, and manipulation are further described in Tables 1, Table 4, and Table 5. Specifically, Table 1 describes soil erosion or sediment yield measurement methods reported in the literature; Table 4 describes 12 quality control flags to 245 help the developer record necessary information for quality control. Table 5 describes manipulation information, which is useful for the further analysis about how treatment affects surface runoff and soil erosion.
2.5 Data quality control
We carefully checked the data compiled into AWESOME with the original papers to ensure that 250 extracted information was accurate. Data from each paper was read by at least two contributors: it was first carefully read by the data collector, and any useful records were compiled into AWESOME, after which a data quality checker compared the data in the database against the original paper. We also contacted the corresponding author whenever we had questions about the data in a paper or found potential problems. Mendeley was used (https://www.mendeley.com) to 255 ensure papers were not compiled into the database multiple times by different contributors. We paid attention to the methods sections, results, figures, tables, and supplemental information, where
https://doi.org/10.5194/essd-2022-87
Ope
n A
cces
s Earth System
Science
DataD
iscussio
ns
Preprint. Discussion started: 9 March 2022c© Author(s) 2022. CC BY 4.0 License.
15
most of the surface runoff, soil erosion, sediment yield, NL information, and meta-data were located. In addition, we developed an R markdown file (AWESOME_validation.Rmd in the Github repository) to examine the data quality of all numeric variables in the AWESOME, and a second 260 markdown file (AWESOME.Rmd) to generate all figures (Figure 1 to Figure 6) and describe the study analyses. These files were created using R (version 4.1.2; R Core Team, 2020). For the latitude and longitude inputs, we plotted sites by individual countries (currently a total of 75 countries, Figure 2), then compared the sites with that country’s boundaries to ensure that no sites fell outside. For any sites that appeared to be mislocated, we went back to the original paper and 265 corrected the coordinates in the database. For all numeric variables in the AWESOME (except "Unique_ID" and "Study_number"), we plotted histograms for each variable, and checked whether anomalous values were included in the database.
2.6. Usage notes
We suggest that users download the data and code directly from Zenodo 270 (http://doi.org/10.5281/zenodo.6324809), as Zenodo provides the DOI and generates the same results for all users. Another advantage of using data and code from Zenodo is that it avoids any run errors caused by the addition of new measurements when the database is updated. On the other hand, the data and code in GitHub are for development purposes. In addition, as new records are added to the database, output results may differ from those generated using older versions, and 275 may even cause run errors. The users are encouraged to contact the AWESOME development team if encounter problems when using the data from Zenodo for analysis.
2.7. Statistical analysis
We performed statistical analyses on annual soil erosion data from runoff plots, since those measurements constitute the core part of the AWESOME database. We first plotted the mean and 280 standard error (SE) of annual soil erosion rates for different environmental contexts (e.g., vegetation type, soil texture, measurement method) to identify any soil erosion differences among environmental contexts. We next used linear regression and analyzed the relationship between the logarithm of annual erosion rate and 16 environmental factors: annual precipitation, annual temperature, annual evaporation, soil sand content, soil silt content, soil clay content, soil bulk 285 density, soil pH, soil carbon content, soil nitrogen, soil carbon to nitrogen ratio, soil saturated conductivity, sites’ slope length, sites’ slope, area of experiment field, and plant coverage (Table 6). We used R’s ‘lm’ function to analyze the relationship between annual soil erosion and these numeric environmental factors.
Annual soil erosion data were not evenly distributed across the global ranges of annual 290 precipitation, annual temperature, plant coverage etc. (for example, most annual soil erosion data
https://doi.org/10.5194/essd-2022-87
Ope
n A
cces
s Earth System
Science
DataD
iscussio
ns
Preprint. Discussion started: 9 March 2022c© Author(s) 2022. CC BY 4.0 License.
16
were measured at sites with MAP between 400 mm and 1000 mm). To resolve this problem, we followed the method provided by Jian et al. (2020b, 2020c) and aggregated annual soil erosion rates in evenly distributed classes. We then weighted the linear regression by the sample size.
295
https://doi.org/10.5194/essd-2022-87
Ope
n A
cces
s Earth System
Science
DataD
iscussio
ns
Preprint. Discussion started: 9 March 2022c© Author(s) 2022. CC BY 4.0 License.
17
3 Results
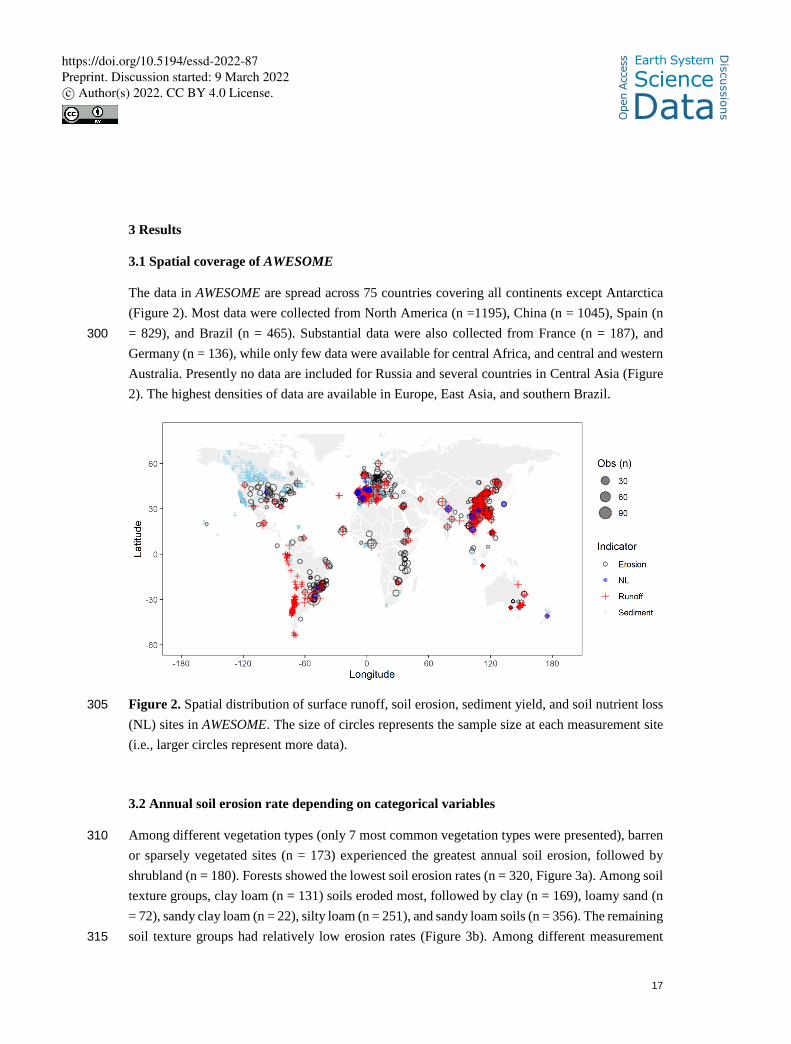
3.1 Spatial coverage of AWESOME
The data in AWESOME are spread across 75 countries covering all continents except Antarctica (Figure 2). Most data were collected from North America (n =1195), China (n = 1045), Spain (n = 829), and Brazil (n = 465). Substantial data were also collected from France (n = 187), and 300 Germany (n = 136), while only few data were available for central Africa, and central and western Australia. Presently no data are included for Russia and several countries in Central Asia (Figure 2). The highest densities of data are available in Europe, East Asia, and southern Brazil.
Figure 2. Spatial distribution of surface runoff, soil erosion, sediment yield, and soil nutrient loss 305 (NL) sites in AWESOME. The size of circles represents the sample size at each measurement site (i.e., larger circles represent more data).
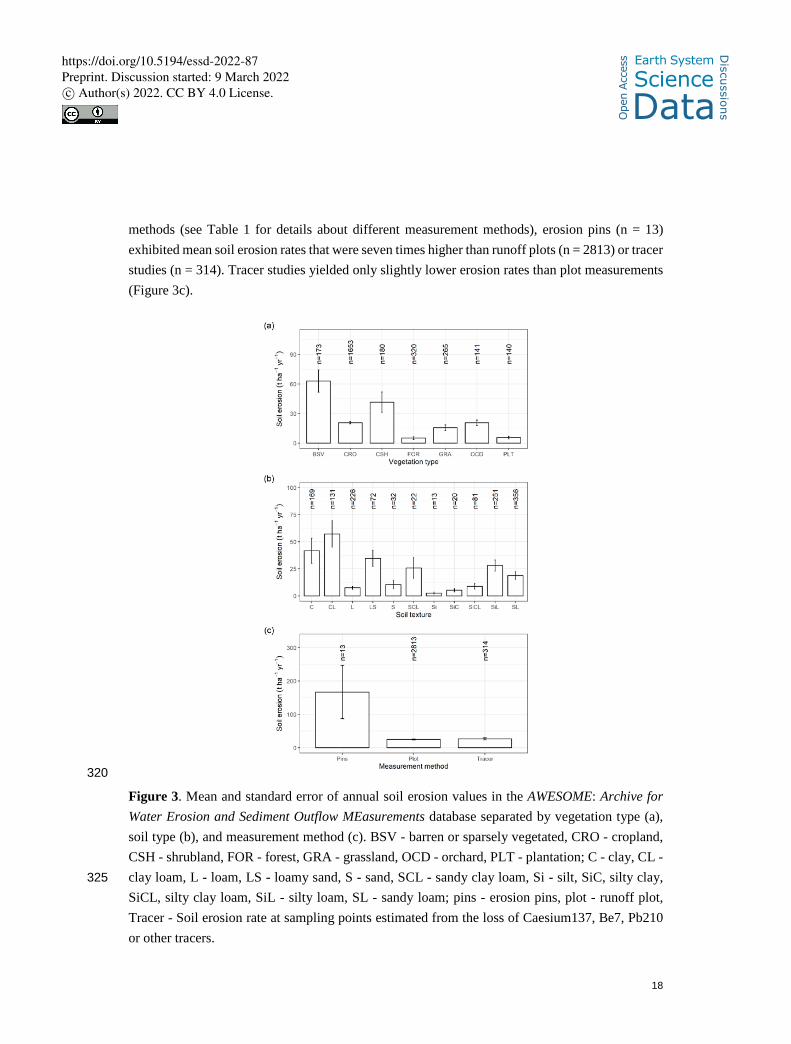
3.2 Annual soil erosion rate depending on categorical variables
Among different vegetation types (only 7 most common vegetation types were presented), barren 310 or sparsely vegetated sites (n = 173) experienced the greatest annual soil erosion, followed by shrubland (n = 180). Forests showed the lowest soil erosion rates (n = 320, Figure 3a). Among soil texture groups, clay loam (n = 131) soils eroded most, followed by clay (n = 169), loamy sand (n = 72), sandy clay loam (n = 22), silty loam (n = 251), and sandy loam soils (n = 356). The remaining soil texture groups had relatively low erosion rates (Figure 3b). Among different measurement 315
https://doi.org/10.5194/essd-2022-87
Ope
n A
cces
s Earth System
Science
DataD
iscussio
ns
Preprint. Discussion started: 9 March 2022c© Author(s) 2022. CC BY 4.0 License.
18
methods (see Table 1 for details about different measurement methods), erosion pins (n = 13) exhibited mean soil erosion rates that were seven times higher than runoff plots (n = 2813) or tracer studies (n = 314). Tracer studies yielded only slightly lower erosion rates than plot measurements (Figure 3c).
320
Figure 3. Mean and standard error of annual soil erosion values in the AWESOME: Archive for Water Erosion and Sediment Outflow MEasurements database separated by vegetation type (a), soil type (b), and measurement method (c). BSV - barren or sparsely vegetated, CRO - cropland, CSH - shrubland, FOR - forest, GRA - grassland, OCD - orchard, PLT - plantation; C - clay, CL - clay loam, L - loam, LS - loamy sand, S - sand, SCL - sandy clay loam, Si - silt, SiC, silty clay, 325 SiCL, silty clay loam, SiL - silty loam, SL - sandy loam; pins - erosion pins, plot - runoff plot, Tracer - Soil erosion rate at sampling points estimated from the loss of Caesium137, Be7, Pb210 or other tracers.
https://doi.org/10.5194/essd-2022-87
Ope
n A
cces
s Earth System
Science
DataD
iscussio
ns
Preprint. Discussion started: 9 March 2022c© Author(s) 2022. CC BY 4.0 License.
19
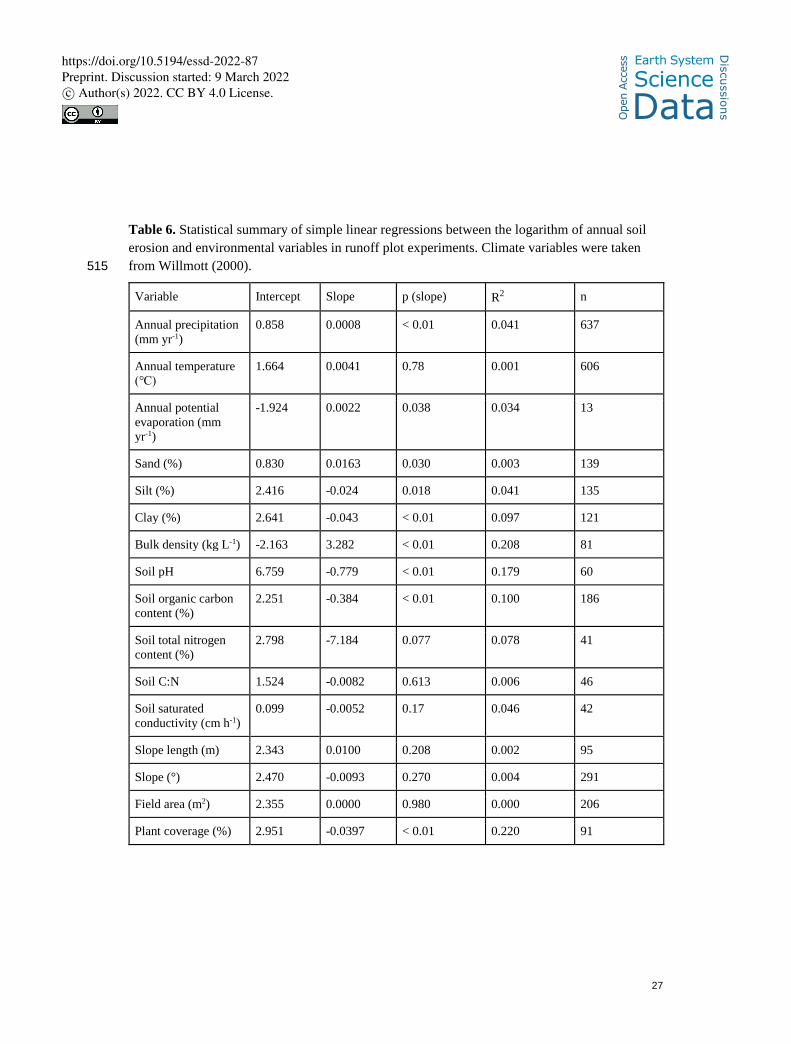
3.3 Annual soil erosion affected by continuous environmental variables
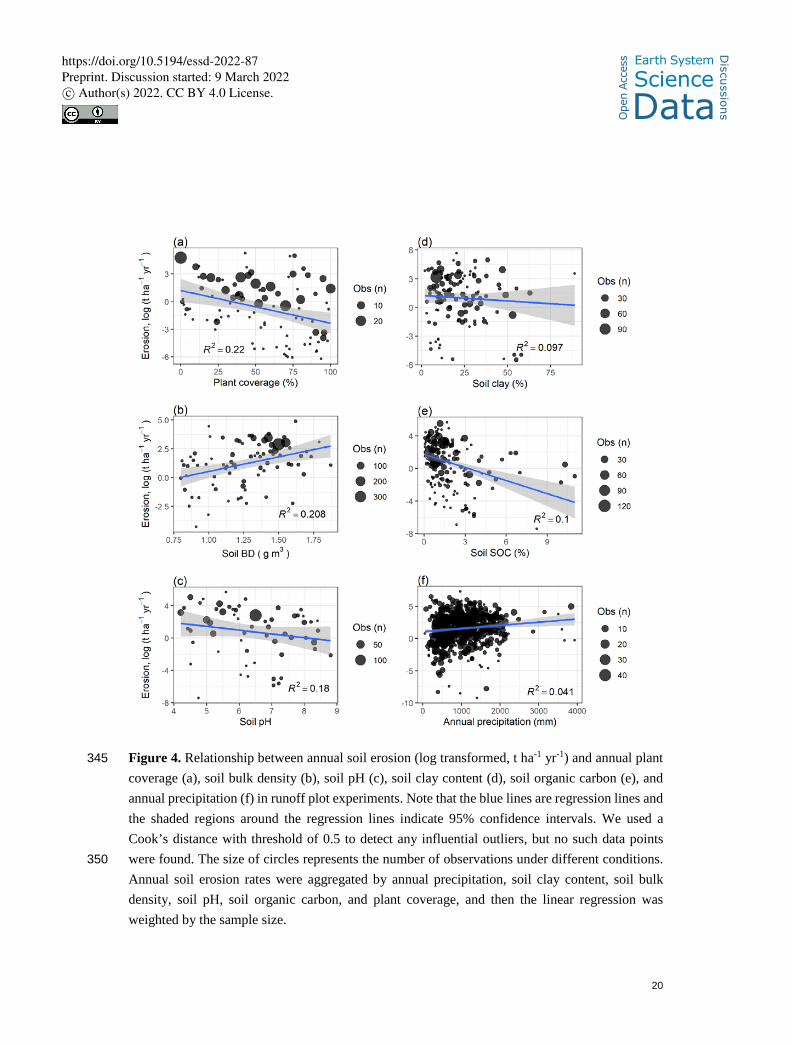
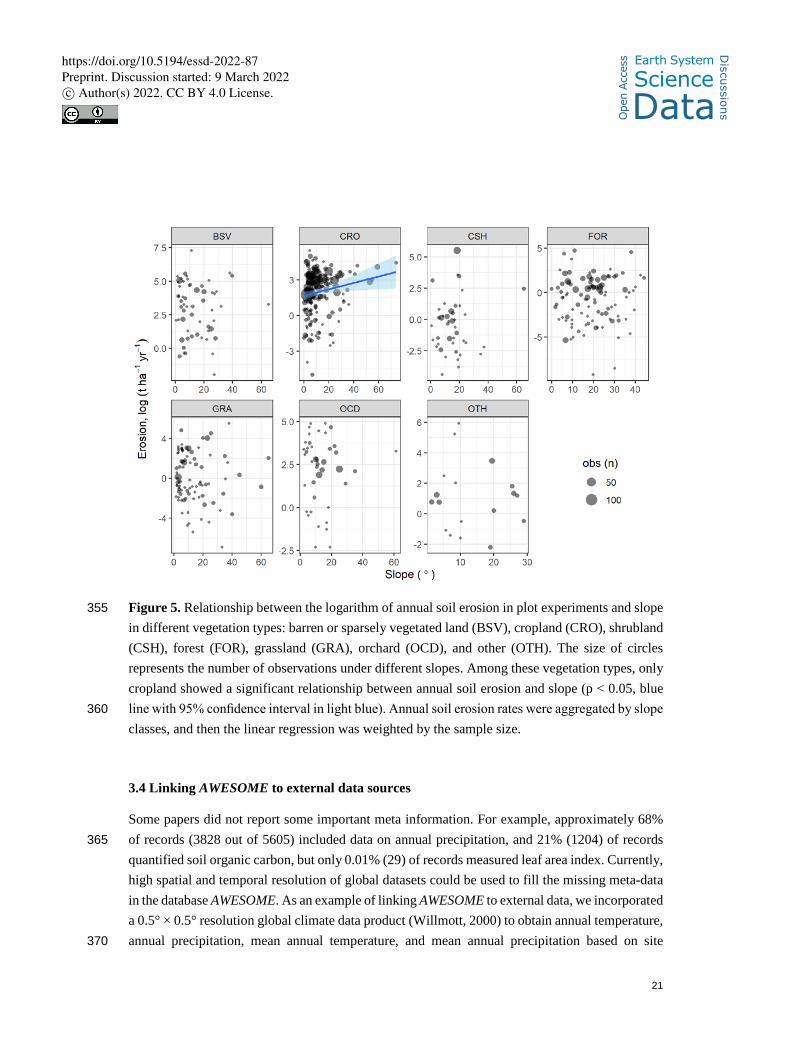
Six environmental variables were significantly (p < 0.05) related to log-transformed soil erosion 330 rates (Figure 4), specifically plant coverage (R2 = 0.22), soil BD (R2 = 0.21), soil pH (R2 = 0.18), soil clay content (R2 = 0.10), soil SOC (R2 = 0.10), and annual precipitation (R2 = 0.04). Surprisingly, we did not find any significant relationship between annual soil erosion and surface slope (Table 6). We tested whether this relationship was masked by vegetation types and found that erosion rates were positively correlated with slope only in croplands (Figure 5). We also tested 335 soil texture groups, but the relationship between annual soil erosion and slope was not masked by the soil texture groups (results not shown). Other variables exhibited no significant relationship with annual soil erosion rates (Table 6), although we did not have enough data (n=14) to test whether the relationship between annual soil erosion rate and annual evaporation was masked by other variables. It is important to note that we recorded soil erosion and sediment yield data 340 separately, and the mean value of annual erosion from AWESOME is 28 t ha-1 yr-1 (n = 3496), which is about twice that of the mean annual sediment yield (12 t ha-1 yr-1, n = 1868).
https://doi.org/10.5194/essd-2022-87
Ope
n A
cces
s Earth System
Science
DataD
iscussio
ns
Preprint. Discussion started: 9 March 2022c© Author(s) 2022. CC BY 4.0 License.
20
Figure 4. Relationship between annual soil erosion (log transformed, t ha-1 yr-1) and annual plant 345 coverage (a), soil bulk density (b), soil pH (c), soil clay content (d), soil organic carbon (e), and annual precipitation (f) in runoff plot experiments. Note that the blue lines are regression lines and the shaded regions around the regression lines indicate 95% confidence intervals. We used a Cook’s distance with threshold of 0.5 to detect any influential outliers, but no such data points were found. The size of circles represents the number of observations under different conditions. 350 Annual soil erosion rates were aggregated by annual precipitation, soil clay content, soil bulk density, soil pH, soil organic carbon, and plant coverage, and then the linear regression was weighted by the sample size.
https://doi.org/10.5194/essd-2022-87
Ope
n A
cces
s Earth System
Science
DataD
iscussio
ns
Preprint. Discussion started: 9 March 2022c© Author(s) 2022. CC BY 4.0 License.
21
Figure 5. Relationship between the logarithm of annual soil erosion in plot experiments and slope 355 in different vegetation types: barren or sparsely vegetated land (BSV), cropland (CRO), shrubland (CSH), forest (FOR), grassland (GRA), orchard (OCD), and other (OTH). The size of circles represents the number of observations under different slopes. Among these vegetation types, only cropland showed a significant relationship between annual soil erosion and slope (p < 0.05, blue line with 95% confidence interval in light blue). Annual soil erosion rates were aggregated by slope 360 classes, and then the linear regression was weighted by the sample size.
3.4 Linking AWESOME to external data sources
Some papers did not report some important meta information. For example, approximately 68% of records (3828 out of 5605) included data on annual precipitation, and 21% (1204) of records 365 quantified soil organic carbon, but only 0.01% (29) of records measured leaf area index. Currently, high spatial and temporal resolution of global datasets could be used to fill the missing meta-data in the database AWESOME. As an example of linking AWESOME to external data, we incorporated a 0.5° × 0.5° resolution global climate data product (Willmott, 2000) to obtain annual temperature, annual precipitation, mean annual temperature, and mean annual precipitation based on site 370
https://doi.org/10.5194/essd-2022-87
Ope
n A
cces
s Earth System
Science
DataD
iscussio
ns
Preprint. Discussion started: 9 March 2022c© Author(s) 2022. CC BY 4.0 License.
22
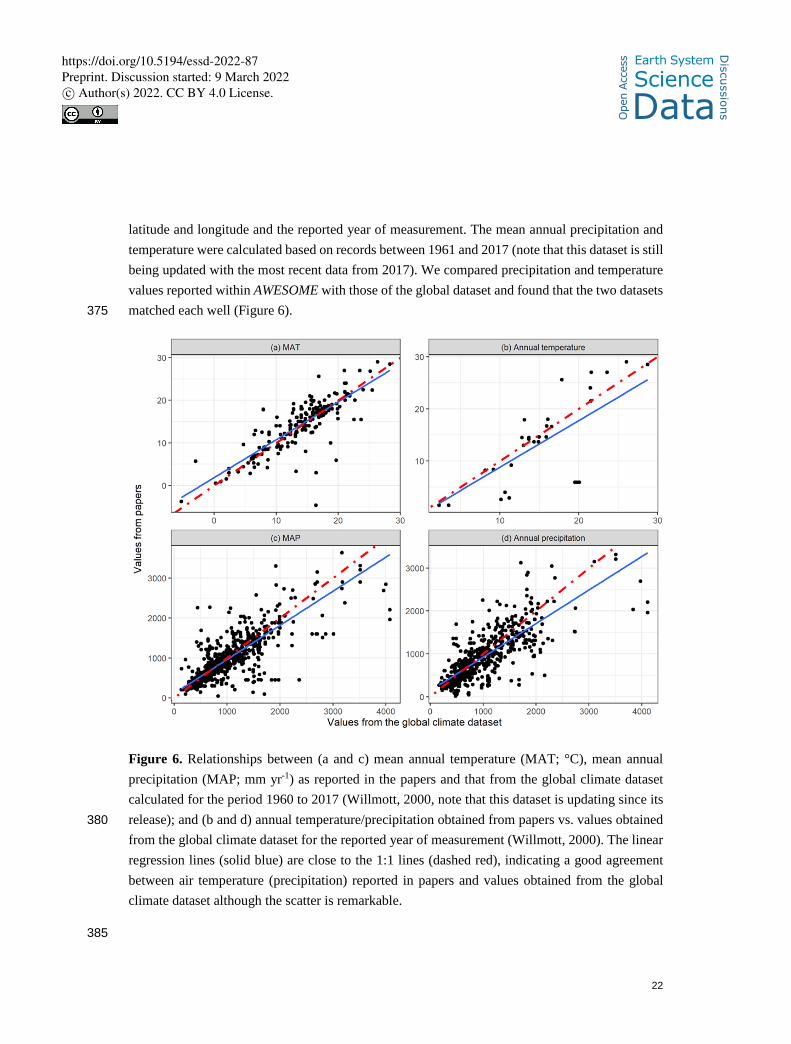
latitude and longitude and the reported year of measurement. The mean annual precipitation and temperature were calculated based on records between 1961 and 2017 (note that this dataset is still being updated with the most recent data from 2017). We compared precipitation and temperature values reported within AWESOME with those of the global dataset and found that the two datasets matched each well (Figure 6). 375
Figure 6. Relationships between (a and c) mean annual temperature (MAT; °C), mean annual precipitation (MAP; mm yr-1) as reported in the papers and that from the global climate dataset calculated for the period 1960 to 2017 (Willmott, 2000, note that this dataset is updating since its release); and (b and d) annual temperature/precipitation obtained from papers vs. values obtained 380 from the global climate dataset for the reported year of measurement (Willmott, 2000). The linear regression lines (solid blue) are close to the 1:1 lines (dashed red), indicating a good agreement between air temperature (precipitation) reported in papers and values obtained from the global climate dataset although the scatter is remarkable.
385
https://doi.org/10.5194/essd-2022-87
Ope
n A
cces
s Earth System
Science
DataD
iscussio
ns
Preprint. Discussion started: 9 March 2022c© Author(s) 2022. CC BY 4.0 License.
23
4. Discussion
4.1. Use and benefits of AWESOME
The AWESOME database, even at its present state of development, demonstrates that an enormous quantity of soil erosion measurement is available worldwide. Collected and made available through AWESOME, these data can now be used for hypotheses testing, model development and 390 model validation. Moreover, many current erosion models have limited data available for verification. The AWESOME database can alleviate this problem by providing sufficient observations for users to retain robust and independent datasets for model development versus model validation.
In this paper we included a couple of examples of using AWESOME for analyses. While not 395 intended to be comprehensive, these examples nonetheless revealed several insights. For example, the comparison of methods showed that tracer studies and runoff plot studies yield similar soil losses. This is surprising at first glance, given that plot studies only capture sheet and rill erosion on slopes of rather short length while tracer studies include all forms of erosion like water or tillage erosion (van Oost et al. 2000, Öttl et al. 2021), wind erosion (Li et al. 2007, Breshears et al 2003) 400 or the loss of soil due to the harvest of root crops (Ruysschaert et al. 2007, Kuhwald et al. 2022). Hence a much larger total soil loss may be expected from tracer studies compared to plot studies. Two things likely contribute to this finding. First, all forms of erosion other than water erosion and tillage erosion are usually tolerable in most areas and can reach relevant numbers only under certain conditions (e g. the soil loss due to harvest of root crops requires that root crops are grown 405 in relevant amount; wind erosion is relevant only in areas of strong winds). Tillage erosion, which can be in the same order of magnitude as water erosion or even much higher (van Oost et al. 2000, Öttl et al. 2021), relocates soil only within a field and must become zero if the entire field or several fields are included in a study area. In consequence, the large-scale soil loss quantified by tracers may indeed be dominated by water erosion. 410
Comparing the data obtained from runoff plots with data obtained with erosion pins showed the opposite result to the comparison above. Although both methods should only capture sheet and rill erosion, and thus lead to similar soil loss rates, these two measurement types provided very different estimates: erosion measured by pins was seven times the amount of erosion measured by runoff plots. This result may be due to a strong bias inherent to one or both methods. The pin-415 based measurements can suffer bias due to consolidation of the tilled soil after installation of the pins, which can wrongly indicate soil losses. This process is even more likely for studies that did not follow the recommendation that data collection should not be initiated until the pins have been in the soil for a period of at least three months to one year (Haigh 1977). An alternative explanation
https://doi.org/10.5194/essd-2022-87
Ope
n A
cces
s Earth System
Science
DataD
iscussio
ns
Preprint. Discussion started: 9 March 2022c© Author(s) 2022. CC BY 4.0 License.
24
is that erosion pin measurements within AWESOME captured cases with very high erosion rates 420 (Sirvent et al., 1997). Identifying the different causes of this discrepancy was not within the scope of this study, yet additional comparisons of rainfall, slope gradient, soil and land use between pin and plot studies should make it easy to either accept or reject the hypothesis that the discrepancy is caused by installing erosion pins only on sites that are highly prone to erosion.
Similar comparisons could be made with bathymetry data to prove the common assumption that 425 most of the sediment is trapped within a lake or a reservoir. Whether this is really the case or whether relevant amounts leave the water bodies or are deposited already within the catchment are presently unknown. Individual bathymetry studies cannot answer this question because they always reflect a certain situation while the large data availability of AWESOME allows for a more general assessment of the method. 430
In the outlet of a catchment, the sediment yield indicates the net loss of sediment from an area, which is usually smaller than the erosion volume because a certain amount of eroded soil will be deposited during transportation (Cai, 2001; Zhao et al., 2016). These results therefore suggest that distinguishing soil erosion and sediment yield data is very important in macro scale soil erosion modeling, and mixing them may cause significant underestimations of soil erosion at large scales 435 (Tan et al., 2018). Separating soil erosion and sediment yield data may also explain why we did not find any significant relationship between soil erosion and slope length (L) and area of experiment field (Table 6), as the maximum slope length of a runoff plot in the AWESOME is ~500m, which is arguably not long enough to capture soil deposition processes.
Comparison of catchment data and plot data will allow for the development of general rules for 440 sediment delivery ratios. Such rules exist already (Walling 1983, Ferro and Minacapilli 1995) but they are inconsistent because they were always developed within limited regions (Walling 1983). It remains thus unknown to which regions one rule may be extended and where another rule would be advantageous. The global dataset AWESOME allows developing rules that take climate and other drivers on large scales into account as well. 445
Another advantage of AWESOME is that it can easily be complemented by other data. We have, again as a proof of concept, shown this process for climate data. This is important for at least two reasons. First, studies often collect distinct parameters from one another, which means that even within a comprehensive database such as AWESOME there are instances where some parameters can have few observations and be restricted to certain conditions. In our analysis 450 evapotranspiration was such a parameter, with only 14 studies in the database that reported this parameter. The increasing availability of global datasets allows complementing the erosion data with other data. For our proof of concept, we only used the data by Willmott (2000) but many
https://doi.org/10.5194/essd-2022-87
Ope
n A
cces
s Earth System
Science
DataD
iscussio
ns
Preprint. Discussion started: 9 March 2022c© Author(s) 2022. CC BY 4.0 License.
25
more options exist. For instance, soil data are provided by SoilGrids (https://soilgrids.org) and more climate data including evapotranspiration could be taken from the CEDA archive 455 (https://data.ceda.ac.uk/badc/cru/data), or NOAA (https://www.esrl.noaa.gov/psd/data/gridded/). The second reason for complementing the studies with external data, in particular climate data, results from the fact that climate data are inconsistently reported in different studies. The methods of measurements may differ, and, especially when it comes to MAP and MAT, the period of averaging differs among studies and only few calculate standardized MAP and MAT for normal 460 meteorological periods (e.g. 1961 to 1990; 1991 to 2020). These differences may bias comparisons. Using external data (e.g. Fick and Hijmans 2017) can help to overcome such inconsistencies and allow the user to select the appropriate period of interest.
The comparison of climate data captured in the AWESOME database directly from studies agreed well with climate data taken from Willmott (2000), but there were some data points whose 465 differences between datasets was clearly larger than what could be expected due to methodological differences. These points are indicative of errors that are included in the database. Such errors can never be excluded because they may already exist in the original publication or they may have happened while entering the data into AWESOME. Our QA/QC procedure had two different people checking the imported data points, we tried to minimize such errors. Nonetheless, potential sources 470 of error include mis-estimation of study locations in older papers that were conducted before the global positioning system GPS and easy methods to measure location became available, often only location names were given. By comparison with other data, AWESOME allows the user to identify deviating data, and potentially even discover the underlying reasons for the differences. The external precipitation data from Willmott (2000) were significantly correlated with that reported 475 in the studies themselves where available. We presume that linking AWESOME with other external data sources, e.g., leaf area index, vegetation type, climate type, and soil properties, can lead to increased explanatory power for spatial and temporal variability of annual soil erosion.
4.2. Forecasting global soil erosion
Previous studies have documented that high variability in erosion rates makes global annual soil 480 erosion estimation extremely challenging (García-Ruiz et al., 2015). The first estimation of global soil erosion dates back to the 1990s, when Myers (1993) reported that global soil erosion every year was approximately 75 Pg; and Lal (2003) reported that global soil erosion could be as large as 201 Pg. However, recent estimates (Borrelli et al., 2017, 2020) based on the Revised Universal Soil Loss Equation (RUSLE) showed that the previous estimates by Myers (1993) and Lal (2003) 485 are at least two to five times overestimated. However, the RUSLE model was developed based on soil erosion measurements of runoff plots in the USA, and studies have demonstrated that RUSLE may not be suitable when directly applied in some regions. For instance, Liu et al., (1994) showed
https://doi.org/10.5194/essd-2022-87
Ope
n A
cces
s Earth System
Science
DataD
iscussio
ns
Preprint. Discussion started: 9 March 2022c© Author(s) 2022. CC BY 4.0 License.
26
that the Universal Soil Loss Equation (USLE) likely underestimates soil erosion at sites with steep slopes; Tan et al., (2022) finds that the RUSLE model which uses slope length in the 490 parameterization may significantly overestimate soil erosion in mountain regions. AWESOME provides the opportunity to address these uncertainties and better estimate global annual soil erosion using statistical modeling approaches.
In recent decades, statistical modeling based on integrated global datasets has been used to upscale site-scale measurements into global scale estimates. For example, based on a comprehensive soil 495 respiration database (Bond-Lamberty and Thomson, 2010; Jian et al., 2021), statistical models have been developed to estimate global soil respiration (Jian et al., 2018a; 2018c; Stell et al., 2021). Although such attempts exist regionally (e.g. in Europe; Cerdan et al. 2010), to our knowledge such an effort has not been undertaken to estimate global soil erosion. Here, based on AWESOME, our analysis shows that annual soil erosion is highly correlated with environmental factors; a single 500 factor could explain between 3%-22% of soil erosion variability (Figure 4 and Table 6). We therefore reiterate that AWESOME could be a suitable basis for supporting future efforts to estimate global soil erosion using statistical modeling.
By including both older and more recent studies, this approach may even allow users to reconstruct time series in order to provide regionally differentiated experimental data on changes in erosion 505 over time due to climate change. The effect of climate change on erosion rates is still an open question that is difficult to answer because climate change involves not only alters precipitation patterns (Burt et al. 2016; Auerswald et al. 2019) but also induces interacting changes in plant development (Nearing et al. 2004, Auerswald and Menzel 2021). Presently, our knowledge results only from the application of models using measured data like rain properties or plant development 510 while experimental evidence on the soil loss itself is missing.
https://doi.org/10.5194/essd-2022-87
Ope
n A
cces
s Earth System
Science
DataD
iscussio
ns
Preprint. Discussion started: 9 March 2022c© Author(s) 2022. CC BY 4.0 License.
27
Table 6. Statistical summary of simple linear regressions between the logarithm of annual soil erosion and environmental variables in runoff plot experiments. Climate variables were taken from Willmott (2000). 515
Variable Intercept Slope p (slope) R2 n
Annual precipitation (mm yr-1)
0.858 0.0008 < 0.01 0.041 637
Annual temperature (℃)
1.664 0.0041 0.78 0.001 606
Annual potential evaporation (mm yr-1)
-1.924 0.0022 0.038 0.034 13
Sand (%) 0.830 0.0163 0.030 0.003 139
Silt (%) 2.416 -0.024 0.018 0.041 135
Clay (%) 2.641 -0.043 < 0.01 0.097 121
Bulk density (kg L-1) -2.163 3.282 < 0.01 0.208 81
Soil pH 6.759 -0.779 < 0.01 0.179 60
Soil organic carbon content (%)
2.251 -0.384 < 0.01 0.100 186
Soil total nitrogen content (%)
2.798 -7.184 0.077 0.078 41
Soil C:N 1.524 -0.0082 0.613 0.006 46
Soil saturated conductivity (cm h-1)
0.099 -0.0052 0.17 0.046 42
Slope length (m) 2.343 0.0100 0.208 0.002 95
Slope (°) 2.470 -0.0093 0.270 0.004 291
Field area (m2) 2.355 0.0000 0.980 0.000 206
Plant coverage (%) 2.951 -0.0397 < 0.01 0.220 91
https://doi.org/10.5194/essd-2022-87
Ope
n A
cces
s Earth System
Science
DataD
iscussio
ns
Preprint. Discussion started: 9 March 2022c© Author(s) 2022. CC BY 4.0 License.
28
4.3. Future improvements and the power of open science
AWESOME has good spatial coverage, with sites widely spread across continents except Antarctica. However, sites are still unevenly distributed, with most data coming from North America, Europe, and Eastern China (Figure 2). One of the reasons for this uneven distribution is 520 because only papers published in English or Chinese were collected in AWESOME. There are however plenty of data published in other languages (e.g., Russian, Portuguese, and Spanish). AWESOME provides a framework for compiling data from papers published in other languages, and cooperating with scientists with broader linguistic expertise would only enhance the site's spatial representativeness of AWESOME in the future. 525
For the purpose of reducing cooperation barriers, maximizing the impact of this work, and recognizing the publicly-funded nature of most of the original scientific studies used, we have decided to share this work at the present database development stage. We aim to receive feedback from the community about how to improve the data structure to ensure optimal usage. In addition, the large number of potentially relevant papers that have been, or will be, published makes it 530 important to expand the development team. Thus, we welcome and invite scientists and data users who are interested in developing AWESOME to download the dataset and consider contributing published or unpublished data. Our long-term goal is to update AWESOME by including measurements from newly published papers annually.
Data and code availability 535
The data and source code are available through GitHub (https://github.com/jinshijian/AWESOME) and Zenodo (Jian et al., 2022) (https://doi.org/10.5281/zenodo.6324809). The code is described in detail with user instructions. All data processing and data visualization were conducted using R (version 4.1.2).
Conclusion 540
Soil erosion is a process marked by high spatio-temporal variability wherein individual erosion events may differ by several orders of magnitude. Obtaining reliable averages of soil erosion rates requires long measurement periods from sites covering different environmental conditions. Given that the number of events per year is limited, these periods of time are usually much longer than what can be reasonably financed and maintained by field experiments. An additional problem is 545 that the experiment sites are often not representative of actual land-use and topographic conditions. We have addressed both of these limitations by combining published field annual soil erosion measurements from sites across different environments into a database titled AWESOME: Archive for Water Erosion and Sediment Outflow MEasurements. Currently, annual soil erosion
https://doi.org/10.5194/essd-2022-87
Ope
n A
cces
s Earth System
Science
DataD
iscussio
ns
Preprint. Discussion started: 9 March 2022c© Author(s) 2022. CC BY 4.0 License.
29
measurements from 1985 geographic sites across the world have been compiled into AWESOME. 550 In conclusion, we have shown that the effort of such a database is a useful resource for the research community to analyze the spatio-temporal variability of soil erosion as well as the driving variables, and the database also provides opportunities for estimating global soil erosion.
Acknowledgements
Xuan Du was supported by the Exploration of soil moisture survey and landscape vegetation 555 irrigation and drainage decision tool for urban green space in Yangling, supported by the Yangling Vocational & Technical College, under grant number: BG2021005. Jinshi Jian was supported by the Strategic Priority Research Program of Chinese Academy of Sciences under contract XDA20040202 and the US Department of Energy, Office of Science, Biological and Environmental Research as part of the Terrestrial Ecosystem Sciences Program, under contract 560 DE-AC05-76RL01830. Juying Jiao was supported by the Strategic Priority Research Program of Chinese Academy of Sciences under contract XDA20040202 and the National Science Foundation of China (No.42077078). Ryan Stewart was supported by the Virginia Agricultural Experiment Station and the Hatch Program of the National Institute of Food and Agriculture, U.S. Department of Agriculture. Dan Evans was supported by a 75th Anniversary Research Fellowship from 565 Cranfield University. Zeli Tan was supported by the US DOE’s Earth System Modeling programme through the Energy Exascale Earth System Model (E3SM) project. Chao Yue was supported by the Strategic Priority Research Program of Chinese Academy of Sciences (grant no. XDB40020305). This database can be used for research, academic, individual, or commercial usage, and can be sold or repackaged without written permission. 570
Author contributions
Xuan Du and Jinshi Jian conceived the design of the data framework, extracted and integrated the data from papers to the AWESOME. Xuan Du and Jinshi Jian drafted the manuscript, and all authors revised and approved the manuscript.
Competing interests 575
The authors declare no conflicts of interest.
https://doi.org/10.5194/essd-2022-87
Ope
n A
cces
s Earth System
Science
DataD
iscussio
ns
Preprint. Discussion started: 9 March 2022c© Author(s) 2022. CC BY 4.0 License.
30
References
Auerswald, K., Fiener, P., and Dikau, R. Rates of sheet and rill erosion in Germany - A meta-analysis. Geomorphology, 111(3-4), 182-193, doi:10.1016/j.geomorph.2009.04.018, 2009.
Auerswald, K., Fischer, F., Winterrath, T., Brandhuber R. Rain erosivity map for Germany derived from 580 contiguous radar rain data. Hydrol. Earth Syst. Sc., 23, 1819–1832, https://doi.org/10.5194/hess-23-1-2019, 2019.
Auerswald K., Menzel A. Change in erosion potential of crops due to climate change. Agr. Forest Meteorol. 300, 108338, https://doi.org/10.1016/j.agrformet.2021.108338, 2021.
Baumhardt, R. L., Stewart, B. A., and Sainju U. M. North American soil degradation: processes, 585 practices, and mitigating strategies. Sustainability, 7, 2936-2960, doi:10.3390/su7032936, 2015.
Berhe, A. A., Harte, J., Harden, J. W., and Torn, M. S.: The significance of the erosion-induced terrestrial carbon sink, Bioscience, 57(4), 337–346, doi:10.1641/B570408, 2007.
Bond-Lamberty, B., and Thomson, A. A global database of soil respiration data, Biogeosciences, 7, 1915–1926, https://doi.org/10.5194/bg-7-1915-2010, 2010. 590
Borrelli, P., Robinson, D. A., Fleischer, L. R., Lugato, E., Ballabio, C., Alewell, C., Meusburger, K., Modugno, S., Schütt, B., Ferro, V., Bagarello, V., Oost, K. V., Montanarella, L., and Panagos, P.: An assessment of the global impact of 21st century land use change on soil erosion, Nat. Commun., 8(1), 2013, doi:10.1038/s41467-017-02142-7, 2017.
Borrelli, P., Robinson, D.A., Panagos, P., Lugato, E., Yang, J.E., Alewell, C., Wuepper, D., Montanarella, 595 L., and Ballabio, C. Land use and climate change impacts on global soil erosion by water (2015-2070). Proc. Natl. Acad. Sci. U.S.A., 117(36), 21994-22001, doi:10.1073/pnas.2001403117/-/DCSupplemental, 2020.
Borrelli, P., Alewell, C., Alvarez, P., Anache, J. A. A., Baartman, J., Ballabio, C., ... and Panagos, P. Soil erosion modelling: A global review and statistical analysis. Sci. Total Environ., 146494, 600 https://doi.org/10.1016/j.scitotenv.2021.146494, 2021.
Breshears, D.D., Whicker, J.J., Johansen, M.P., and Pinder III, J.E. Wind and water erosion and transport in semi-arid shrubland, grassland and forest ecosystems: Quantifying dominance of horizontal wind-driven transport. Earth Surface Processes and Landforms 28(11), pp. 1189-1209, 2003.
Burt T., Boardman J., Foster I., Howden N. More rain, less soil: long‐term changes in rainfall intensity 605 with climate change. Earth Surf. Proc. Land. 41, 563-566. https://doi.org/10.1002/esp.3868, 2016.
Cai, Q.: Soil erosion and management on the Loess Plateau, J. Geogr. Sci., 11(1), 53–70, 2001.
Cerdan, O., Govers, G., Le Bissonnais, Y., Van Oost, K., Poesen, J., Saby, N., Gobin, A., Vacca, A., Quinton, J., Auerswald, K., Klik, A., Kwaad, F.J.P.M., Raclot, D., Ionita, I., Rejman, J., Rousseva, S., Muxart, T., Roxo, M.J., and Dostal, T.: Rates and spatial variations of soil erosion in Europe: a study based 610 on erosion plot data. Geomorphology, 122: 167–177, http://dx.doi.org/10.1016/j.geomorph.2010.06.011, 2010.
Du, X., Jian, J. Du, C., and Stewart, R.D.: Conservation management decreases surface runoff and soil erosion. Int. Soil Water Cons., https://doi.org/10.1016/j.iswcr.2021.08.001, 2021.
https://doi.org/10.5194/essd-2022-87
Ope
n A
cces
s Earth System
Science
DataD
iscussio
ns
Preprint. Discussion started: 9 March 2022c© Author(s) 2022. CC BY 4.0 License.
31
Evans, D. L., Quinton, J. N., Davies, J. A. C., Zhao, J., and Govers, G.: Soil lifespans and how they can 615 be extended by land use and management change. Environ. Res. Lett., 15(9), 0940b2, https://doi.org/10.1088/1748-9326/aba2fd, 2020.
Ferro, V., Minacapilli, M. Sediment delivery processes at basin scale. Hydrological Sciences Journal 40(6), pp. 703-717, 1995.
Fick, S. E. and Hijmans, R. J.: WorldClim 2: new 1‐km spatial resolution climate surfaces for global land 620 areas, Int. J. Climatol., 37 (12), https://doi.org/10.1002/joc.5086, 2017.
Flower, A., McKenna, J. W., and Upreti, G.: Validity and reliability of graphclick and datathief III for data extraction., Behav. Modif., 40(3), 396–413, doi:10.1177/0145445515616105, 2016.
García-Ruiz, J. M., Beguería, S., Nadal-Romero, E., González-Hidalgo, J. C., Lana-Renault, N., and Sanjuán, Y.: A meta-analysis of soil erosion rates across the world, Geomorphology, 239, 160–173, 625 doi:10.1016/j.geomorph.2015.03.008, 2015.
Guo, Q., Hao, Y., and Liu, B.: Rates of soil erosion in China: A study based on runoff plot data, Catena, 124, 68–76, doi:10.1016/j.catena.2014.08.013, 2015.
Haigh M.J. 1977. The use of erosion pins in the study of slope evolution. British Geomorphological Research Group, Technical Bulletin 18, pp 31-49. 630
Ito, A.: Simulated impacts of climate and land-cover change on soil erosion and implication for the carbon cycle, 1901 to 2100, Geophys. Res. Lett., 34(9), doi:10.1029/2007GL029342, 2007.
Jian, J., Steele, M. K., Thomas, R. Q., Day, S. D., and Hodges, S.C.: Constraining estimates of global soil respiration by quantifying sources of variability, Global Change Biol., 24, 4143–4159, https://doi.org/10.1111/gcb.14301, 2018a. 635
Jian, J., Steele, M. K., Day, S. D., and Thomas, R. Q.: Future global soil respiration rates will swell despite regional decreases in temperature sensitivity caused by rising temperature, Earths Future, 6, 1539–1554, https://doi.org/10.1029/2018EF000937, 2018b.
Jian, J., Du, X., and Stewart, R. D.: A database for global soil health assessment, Sci. Data, 7(1), 16, doi:10.1038/s41597-020-0356-3, 2020a. 640
Jian, J., Du, X., Reiter, M. S., and Stewart, R. D.: A meta-analysis of global cropland soil carbon changes due to cover cropping. Soil Biol. Biochem., 143, 107735. https://doi.org/10.1016/j.soilbio.2020.107735, 2020b.
Jian, J., Gough, C., Sihi, D., Hopple, M. A., and Bond‐Lamberty, B.: Collar properties and measurement time confer minimal bias overall on annual soil respiration estimates in a global database. J. Geophys. 645 Res.-Biogeo., 125(12), e2020JG006066. https://doi.org/10.1029/2020JG006066, 2020c.
Jian, J., Vargas, R., Anderson-Teixeira, K., Stell, E., Herrmann, V., Horn, M., Kholod, N., Manzon, J., Marchesi, R., Paredes, D., and Bond-Lamberty, B. A restructured and updated global soil respiration database (SRDB-V5). Earth Syst. Sci. Data, 13(2), 255-267, https://doi.org/10.5194/essd-13-255-2021, 2021. 650
Jian, J., Du, X., Jiao, J., Ren, X., Auerswald, K., Stewart, R.D., Tan, Z., Zhao, J., Evans, D.L., Zhao, G., Fang, N., Sun, W., Yue, C., and Bond-Lamberty, B.: Jinshijian/AWESOME: Archive for Water Erosion and Sediment Outflow MEasurements (v2.0.0). Zenodo [data set],
https://doi.org/10.5194/essd-2022-87
Ope
n A
cces
s Earth System
Science
DataD
iscussio
ns
Preprint. Discussion started: 9 March 2022c© Author(s) 2022. CC BY 4.0 License.
32
https://doi.org/10.5281/zenodo.6324809, 2022.
Kuhwald, M., Busche, F., Saggau, P., Duttmann, R. Is soil loss due to crop harvesting the most 655 disregarded soil erosion process? A review of harvest erosion. Soil Till. Res. 215,105213, https://doi.org/10.1016/j.still.2021.105213, 2022.
Lal, R.: Soil erosion and the global carbon budget. Environ. Int., 29(4), 437–450, doi:10.1016/S0160-4120(02)00192-7, 2003.
Li, J., Okin, G.S., Alvarez, L., and Epstein, H. Quantitative effects of vegetation cover on wind erosion 660 and soil nutrient loss in a desert grassland of southern New Mexico, USA. Biogeochemistry 85(3), pp. 317-332, 2007.
Liu, B. Y., Nearing, M. A., and Risse, L. M. Slope gradient effects on soil loss for steep slopes. T. ASAE, 37(6), 1835-1840, 1994.
Maetens, W., Poesen, J., and Vanmaercke, M.: How effective are soil conservation techniques in reducing 665 plot runoff and soil loss in Europe and the Mediterranean? Earth-Sci. Rev. 115, 21–36. https://doi.org/10.1016/j.earscirev.2012.08.003, 2012a.
Maetens, W., Vanmaercke, M., Poesen, J., Jankauskas, B., Jankauskiene, and G., Ionita, I.: Effects of land use on annual runoff and soil loss in Europe and the Mediterranean: A meta-analysis of plot data. Prog. Phys. Geogr. 36, 599–653. https://doi.org/10.1177/0309133312451303, 2012b. 670
Montgomery, D.R.: Soil erosion and agricultural sustainability. Proc. Natl. Acad. Sci. USA. 104, 13268–72. https://doi.org/10.1073/pnas.0611508104, 2007.
Morgan, R. P. C.: Soil erosion and conservation, Soil Sci., 145(6), 461, doi:10.1097/00010694-198806000-00011, 1988.
Myers, N. Gaia: an atlas of planet management. Garden City, New York: Achor and Doubleday, 675
1993.
Nearing, M.A., Pruski, F.F., and O'Neal, M.R. Expected climate change impacts on soil erosion rates: A review. J. Soil Water Conserv. 59, 43-50, 2004.
Öttl, L.K., Wilken, F., Auerswald, K., Sommer, M., Wehrhan, M., and Fiener, P. Tillage erosion as an important driver of in-field biomass patterns in an intensively used hummocky landscape. Land 680 Degradation and Development 32(10), pp. 3077-3091, 2021.
Poesen, J.: Soil erosion in the Anthropocene: Research needs, Earth Surf. Proc. Land., 43(1), 64–84, doi:10.1002/esp.4250, 2017.
R Core Team, R.: R: A language and environment for statistical computing, R Foundation for Statistical Computing, Vienna, Austria., 2020. 685
Ruysschaert, G., Poesen, J., Auerswald, K., Verstraeten, G., Govers, G. Soil losses due to potato harvesting at the regional scale in Belgium. Soil Use and Manage., 23(2), pp. 156–161, 2007.
Schubert, S. D., Suarez, M. J., Pegion, P. J., Koster, R. D. and Bacmeister, J. T.: On the cause of the 1930s Dust Bowl., Science, 303(5665), 1855–1859, doi:10.1126/science.1095048, 2004.
Sirvent, J., Desir, G., Gutierrez, M., Sancho, C., and Benito, G.: Erosion rates in badland areas recorded 690 by collectors, erosion pins and profilometer techniques (Ebro Basin, NE-Spain). Geomorphology, 18 (2):
https://doi.org/10.5194/essd-2022-87
Ope
n A
cces
s Earth System
Science
DataD
iscussio
ns
Preprint. Discussion started: 9 March 2022c© Author(s) 2022. CC BY 4.0 License.
33
61-75, https://doi.org/10.1016/S0169-555X(96)00023-2, 1997.
Stell, E., Warner, D., Jian, J., Bond‐Lamberty, B., and Vargas, R.: Spatial biases of information influence global estimates of soil respiration: how can we improve global predictions? Global Chang. Biol., 0, 1-16, DOI: 10.1111/gcb.15666, 2021. 695
Tan, Z., Leung, L. R., Li, H. Y., and Tesfa, T.: Modeling sediment yield in land surface and earth system models: Model comparison, development, and evaluation. J. Adv. Model. Earth Sy., 10(9), 2192-2213, https://doi.org/10.1029/2017MS001270, 2018.
Tan, Z., Leung, L. R., Li, H.-Y., Tesfa, T., Zhu, Q. and Huang, M.: A substantial role of soil erosion in the land carbon sink and its future changes., Glob. Chang. Biol., 26, 2642–2655, doi:10.1111/gcb.14982, 700 2020.
Tan, Zeli, Leung, L. R., Li, H‐Y, and Cohen, S.: Representing global soil erosion and sediment flux in Earth System Models. J. Adv. Model. Earth Sy., 14(1), https://doi.org/10.1029/2021MS002756, 2022.
Townshend, J. R. G. (ed.): Improved global data for land applications. A proposal for a new high resolution data set. Report of the Land Cover Working Group of IGBP-DIS, Global Change Report 705 (Sweden), 1992.
Toy, T. J., Foster, G. R. and Renard, K. G.: Soil Erosion: Processes, Prediction, Measurement, and Control. John Wiley & Sons., 2002.
Van Oost, K., Govers, G., and Desmet, P. Evaluating the effects of changes in landscape structure on soil erosion by water and tillage. Landscape Ecology 15(6), pp. 577-589, 2000. 710
Van Oost, K., Quine, T. A. A, Govers, G., De Gryze, S., Six, J., Harden, J.W., Ritchie, J.C., McCarty, G.W., Heckrath, G., Kosmas, C., Giraldez, J. V, da Silva, J.R.M., and Merckx, R.: The impact of agricultural soil erosion on the global carbon cycle. Science 318, 626–629. https://doi.org/10.1126/science.1145724, 2007.
Vanwalleghem, T., Gómez, J. A., Infante Amate, J., González de Molina, M., Vanderlinden, K., Guzmán, 715 G., Laguna, A. and Giráldez, J. V.: Impact of historical land use and soil management change on soil erosion and agricultural sustainability during the Anthropocene, Anthropocene, 17, 13–29, doi:10.1016/j.ancene.2017.01.002, 2017.
Walling, D.E. The sediment delivery problem. Journal of Hydrology 65(1-3), pp. 209-237, 1983.
Wang, Z., Hoffmann, T., Six, J., Kaplan, J.O., Govers, G., Doetterl, S., and Van Oost, K.: Human-720 induced erosion has offset one-third of carbon emissions from land cover change. Nat. Clim. Chang. 7, 345–349. https://doi.org/10.1038/nclimate3263, 2017.
Wilkinson, M. D., Dumontier, M., Aalbersberg, I. J. J., Appleton, G., Axton, M., Baak, A., Blomberg, N., Boiten, J.-W., da Silva Santos, L. B., Bourne, P. E., Bouwman, J., Brookes, A. J., Clark, T., Crosas, M., Dillo, I., Dumon, O., Edmunds, S., Evelo, C. T., Finkers, R., Gonzalez-Beltran, A. and Mons, B.: The 725 FAIR guiding principles for scientific data management and stewardship., Sci. Data, 3, 160018, doi:10.1038/sdata.2016.18, 2016.
Willmott, C. J.: Terrestrial Air Temperature and Precipitation: Monthly and Annual Time Series (1950-
1996), WWW URL: http://climate.geog.udel.edu/〜climate/html_pages/README.ghcn_ts.html, 2000.
Xu, X. Z., Xu, Y., Chen, S. C., Xu, S. G. and Zhang, H. W.: Soil loss and conservation in the black soil 730
https://doi.org/10.5194/essd-2022-87
Ope
n A
cces
s Earth System
Science
DataD
iscussio
ns
Preprint. Discussion started: 9 March 2022c© Author(s) 2022. CC BY 4.0 License.
34
region of Northeast China: a retrospective study, Environ. Sci. Policy, 13(8), 793–800, doi:10.1016/j.envsci.2010.07.004, 2010.
Yue, Y., Ni, J., Ciais, P., Piao, S., Wang, T., Huang, M., Borthwick, A. G. L., Li, T., Wang, Y., Chappell, A. and Van Oost, K.: Lateral transport of soil carbon and land-atmosphere CO2 flux induced by water erosion in China, Proc. Natl. Acad. Sci. USA, 113(24), 6617–6622, doi:10.1073/pnas.1523358113, 2016. 735
Zhang, S., Li, Q., Zhang, X., Wei, K., Chen, L. and Liang, W.: Effects of conservation tillage on soil aggregation and aggregate binding agents in black soil of Northeast China, Soil Till. Res., 124, 196–202, doi:10.1016/j.still.2012.06.007, 2012.
Zhao, G., Mu, X., Wen, Z., Wang, F. and Gao, P.: Soil erosion, conservation, and eco-environment changes in the loess plateau of China, Land Degrad. Dev., doi:10.1002/ldr.2246, 2013. 740
Zhao, J., Van Oost, K., Chen, L., and Govers, G. Moderate topsoil erosion rates constrain the magnitude of the erosion-induced carbon sink and agricultural productivity losses on the Chinese Loess Plateau. Biogeosciences, 13(16), 4735-4750, doi:10.5194/bg-13-4735-2016, 2016.
Zhao, J., Yang, Z., Govers, G. Soil and water conservation measures reduce soil and water losses in China but not down to background levels: Evidence from erosion plot data. Geoderma, 337 , 729-741, 745 https://doi.org/10.1016/j.geoderma.2018.10.023, 2019.
Zhao, J., Wang, Z., Dong, Y., Yang, Z., and Govers, G. How soil erosion and runoff are related to land use, topography and annual precipitation: Insights from a meta-analysis of erosion plots in China. Sci. Total Environ., 149665, https://doi.org/10.1016/j.scitotenv.2021.149665, 2021.
https://doi.org/10.5194/essd-2022-87
Ope
n A
cces
s Earth System
Science
DataD
iscussio
ns
Preprint. Discussion started: 9 March 2022c© Author(s) 2022. CC BY 4.0 License.


![Štrajn, Varja (2013). ''Racionalizem kot temelj gramatične razlage jezika''. [Rationalism as the Basis of Grammatical Explanation of Language'']. Analiza 17 (4): 95 - 115. [preprint](https://static.fdokumen.com/doc/165x107/631e78154c5c8fb3a00e3353/strajn-varja-2013-racionalizem-kot-temelj-gramaticne-razlage-jezika-rationalism.jpg)


![[preprint version] Clausal complementation in Kildin, Skolt and North Saami](https://static.fdokumen.com/doc/165x107/631d7ca2dc32ad07f3071921/preprint-version-clausal-complementation-in-kildin-skolt-and-north-saami.jpg)