FLUXNET-CH4: A global, multi-ecosystem dataset ... - ESSD
112
1 FLUXNET-CH4: A global, multi-ecosystem dataset and analysis 1 of methane seasonality from freshwater wetlands 2 3 Kyle B. Delwiche 1 , Sara Helen Knox 2 , Avni Malhotra 1 , Etienne Fluet-Chouinard 1 , Gavin 4 McNicol 1 , Sarah Feron 1,3 , Zutao Ouyang 1 , Dario Papale 4,5 , Carlo Trotta 5 , Eleonora Canfora 5 , 5 You-Wei Cheah 6 , Danielle Christianson 6 , Ma. Carmelita R. Alberto 7 , Pavel Alekseychik 8 , Mika 6 Aurela 9 , Dennis Baldocchi 1 , Sheel Bansal 11 , David P. Billesbach 12 , Gil Bohrer 13 , Rosvel 7 Bracho 14 , Nina Buchmann 15 , David I. Campbell 16 , Gerardo Celis 17 , Jiquan Chen 18 , Weinan 8 Chen 19 , Housen Chu 2 , Higo J Dalmagro 21 , Sigrid Dengel 6 , Ankur R Desai 22 , Matteo Detto 23 , Han 9 Dolman 24 , Elke Eichelmann 25 , Eugenie Euskirchen 26 , Daniela Famulari 27 , Kathrin Fuchs 28 , 10 Mathias Goeckede 29 , Sébastien Gogo 3 , Mangaliso J. Gondwe 31 , Jordan P Goodrich 16 , Pia 11 Gottschalk 32 , Scott L. Graham 33 , Martin Heimann 29 , Manuel Helbig 34,35 , Carole Helfter 36 , Kyle 12 S. Hemes 1,37 , Takashi Hirano 38 , David Hollinger 39 , Lukas Hörtnagl 15 , Hiroki Iwata 4 , Adrien 13 Jacotot 3 , Gerald Jurasinski 41 , Minseok Kang 42 , Kuno Kasak 43 , John King 44 , Janina Klatt 45 , 14 Franziska Koebsch 41 , Ken W Krauss 46 , Derrick Y.F. Lai 47 , Annalea Lohila 9,48 , Ivan 15 Mammarella 48 , Giovanni Manca 49 , Luca Belelli Marchesini 5 , Jaclyn Hatala Matthes 51 , Trofim 16 Maximon 52 , Lutz Merbold 53 , Bhaskar Mitra 54 , Timothy H. Morin 55 , Eiko Nemitz 36 , Mats B. 17 Nilsson 56 , Shuli Niu 19 , Walter C Oechel 57 , Patricia Y. Oikawa 58 , Keisuke Ono 59 , Matthias 18 Peichl 56 , Olli Peltola 9 , Michele L. Reba 6 , Andrew D. Richardson 61,62 , William Riley 6 , Benjamin 19 R. K. Runkle 63 , Youngryel Ryu 64 , Torsten Sachs 32 , Ayaka Sakabe 65 , Camilo Rey Sanchez 1 , 20 Edward A Schuur 66 , Karina VR Schäfer 67 , Oliver Sonnentag 68 , Jed P. Sparks 69 , Ellen Stuart- 21 Haëntjens 7 , Cove Sturtevant 71 , Ryan C. Sullivan 72 , Daphne J. Szutu 1 , Jonathan E Thom 73 , 22 Margaret S. Torn 6 , Eeva-Stiina Tuittila 74 , Jessica Turner 75 , Masahito Ueyama 76 , Alex C. 23 Valach 1 , Rodrigo Vargas 77 , Andrej Varlagin 78 , Alma Vazquez-Lule 77 , Joseph G. Verfaillie 1 , 24 Timo Vesala 48 , George L Vourlitis 79 , Eric J. Ward 46 , Christian Wille 32 , Georg Wohlfahrt 8 , Guan 25 Xhuan Wong 81 , Zhen Zhang 82 , Donatella Zona 57, 83 , Lisamarie Windham-Myers 84 , Benjamin 26 Poulter 85 , Robert B. Jackson 1, 37, 86 27 28 29 30 1 Department of Earth System Science, Stanford University, Stanford, California 31 2 Department of Geography, The University of British Columbia, Vancouver, British Columbia, Canada 32 3 Department of Physics, University of Santiago de Chile, Santiago, Chile 33 4 Dipartimento per la Innovazione nei Sistemi Biologici, Agroalimentari e Forestali, Università degli Studi della 34 Tuscia, Largo dell'Universita, Viterbo, Italy e Forestali, Universita 35 5 euroMediterranean Center on Climate Change CMCC, Lecce, Italy 36 6 Earth and Environmental Sciences Area, Lawrence Berkeley National Lab, Berkeley, California 37 7 International Rice Research Institute, Los Banos, Laguna, Philippines 38 8 Natural Resources Institute Finland (LUKE), Helsinki, Finland 39 9 Finnish Meteorological Institute, PO Box 501, 00101 Helsinki, Finland 40 10 Department of Environmental Science, Policy and Management, University of California, Berkeley, CA, USA 41 11 U.S. Geological Survey, Northern Prairie Wildlife Research Center, 8711 37th St Southeast, Jamestown, ND 42 58401 USA 43 12 University of Nebraska-Lincoln, Department of Biological Systems Engineering, Lincoln, NE 68583, USA 44 13 Department of Civil, Environmental & Geodetic Engineering, Ohio State University 45 14 School of Forest Resources and Conservation, University of Florida, Gainesville FL, 32611 46
-
Upload
khangminh22 -
Category
Documents
-
view
0 -
download
0
Transcript of FLUXNET-CH4: A global, multi-ecosystem dataset ... - ESSD

1
FLUXNET-CH4: A global, multi-ecosystem dataset and analysis 1
of methane seasonality from freshwater wetlands 2
3
Kyle B. Delwiche1, Sara Helen Knox2, Avni Malhotra1, Etienne Fluet-Chouinard1, Gavin 4 McNicol1, Sarah Feron1,3, Zutao Ouyang1, Dario Papale4,5, Carlo Trotta5, Eleonora Canfora5, 5 You-Wei Cheah6, Danielle Christianson6, Ma. Carmelita R. Alberto7, Pavel Alekseychik8, Mika 6 Aurela9, Dennis Baldocchi1, Sheel Bansal11, David P. Billesbach12, Gil Bohrer13, Rosvel 7 Bracho14, Nina Buchmann15, David I. Campbell16, Gerardo Celis17, Jiquan Chen18, Weinan 8 Chen19, Housen Chu2, Higo J Dalmagro21, Sigrid Dengel6, Ankur R Desai22, Matteo Detto23, Han 9 Dolman24, Elke Eichelmann25, Eugenie Euskirchen26, Daniela Famulari27, Kathrin Fuchs28, 10 Mathias Goeckede29, Sébastien Gogo3, Mangaliso J. Gondwe31, Jordan P Goodrich16, Pia 11 Gottschalk32, Scott L. Graham33, Martin Heimann29, Manuel Helbig34,35, Carole Helfter36, Kyle 12 S. Hemes1,37, Takashi Hirano38, David Hollinger39, Lukas Hörtnagl15, Hiroki Iwata4, Adrien 13 Jacotot3, Gerald Jurasinski41, Minseok Kang42, Kuno Kasak43, John King44, Janina Klatt45, 14 Franziska Koebsch41, Ken W Krauss46, Derrick Y.F. Lai47, Annalea Lohila9,48, Ivan 15 Mammarella48, Giovanni Manca49, Luca Belelli Marchesini5, Jaclyn Hatala Matthes51, Trofim 16 Maximon52, Lutz Merbold53, Bhaskar Mitra54, Timothy H. Morin55, Eiko Nemitz36, Mats B. 17 Nilsson56, Shuli Niu19, Walter C Oechel57, Patricia Y. Oikawa58, Keisuke Ono59, Matthias 18 Peichl56, Olli Peltola9, Michele L. Reba6, Andrew D. Richardson61,62, William Riley6, Benjamin 19 R. K. Runkle63, Youngryel Ryu64, Torsten Sachs32, Ayaka Sakabe65, Camilo Rey Sanchez1, 20 Edward A Schuur66, Karina VR Schäfer67, Oliver Sonnentag68, Jed P. Sparks69, Ellen Stuart-21 Haëntjens7, Cove Sturtevant71, Ryan C. Sullivan72, Daphne J. Szutu1, Jonathan E Thom73, 22 Margaret S. Torn6, Eeva-Stiina Tuittila74, Jessica Turner75, Masahito Ueyama76, Alex C. 23 Valach1, Rodrigo Vargas77, Andrej Varlagin78, Alma Vazquez-Lule77, Joseph G. Verfaillie1, 24 Timo Vesala48, George L Vourlitis79, Eric J. Ward46, Christian Wille32, Georg Wohlfahrt8, Guan 25 Xhuan Wong81, Zhen Zhang82, Donatella Zona57, 83, Lisamarie Windham-Myers84, Benjamin 26 Poulter85, Robert B. Jackson1, 37, 86 27
28 29 30 1 Department of Earth System Science, Stanford University, Stanford, California 31 2 Department of Geography, The University of British Columbia, Vancouver, British Columbia, Canada 32 3 Department of Physics, University of Santiago de Chile, Santiago, Chile 33 4 Dipartimento per la Innovazione nei Sistemi Biologici, Agroalimentari e Forestali, Università degli Studi della 34 Tuscia, Largo dell'Universita, Viterbo, Italy e Forestali, Universita 35 5 euroMediterranean Center on Climate Change CMCC, Lecce, Italy 36 6 Earth and Environmental Sciences Area, Lawrence Berkeley National Lab, Berkeley, California 37 7 International Rice Research Institute, Los Banos, Laguna, Philippines 38 8 Natural Resources Institute Finland (LUKE), Helsinki, Finland 39 9 Finnish Meteorological Institute, PO Box 501, 00101 Helsinki, Finland 40 10 Department of Environmental Science, Policy and Management, University of California, Berkeley, CA, USA 41 11 U.S. Geological Survey, Northern Prairie Wildlife Research Center, 8711 37th St Southeast, Jamestown, ND 42 58401 USA 43 12 University of Nebraska-Lincoln, Department of Biological Systems Engineering, Lincoln, NE 68583, USA 44 13 Department of Civil, Environmental & Geodetic Engineering, Ohio State University 45 14 School of Forest Resources and Conservation, University of Florida, Gainesville FL, 32611 46

2
15 Department of Environmental Systems Science, Institute of Agricultural Sciences, ETH Zurich, 8092 Zurich, 47 Switzerland 48 16 School of Science, University of Waikato, Hamilton, New Zealand 49 17 Agronomy Department, University of Florida, Gainesville FL, 32601 50 18 Department of Geography, Environment, and Spatial Sciences, Michigan State University, East Lansing, MI 51 48823, USA 52 19 Institute of Geographic Sciences and Natural Resources Research, Chinese Academy of Sciences, Beijing 100101, 53 PR China. 54 20 Climate and Ecosystem Sciences Division, Lawrence Berkeley National Lab, Berkeley, CA 94702, USA 55 21 Universidade de Cuiaba, Cuiaba, Mato Grosso, Brazil 56 22 Dept of Atmospheric and Oceanic Sciences, University of Wisconsin-Madison, Madison, WI 53706 USA 57 23 Department of Ecology and Evolutionary Biology, Princeton University, Princeton NJ, USA 58 24 Department of Earth Sciences, Vrije Universiteit, Amsterdam, Netherlands 59 25 School of Biology and Environmental Science, University College Dublin, Ireland 60 26 University of Alaska Fairbanks, Institute of Arctic Biology, Fairbanks, AK, USA 61 27 C NR - institute for Mediterranean Agricultural and Forest Systems, Piazzale Enrico Fermi, 1 Portici (Napoli) 62 Italy 63 28 Institute of Meteorology and Climate Research - Atmospheric Environmental Research, Karlsruhe Institute of 64 Technology (KIT Campus Alpin), 82467 Garmisch-Partenkirchen, Germany 65 29 Max Planck Institute for Biogeochemistry, Jena, Germany 66 30 ISTO, Université d’Orléans, CNRS, BRGM, UMR 7327, 45071, Orléans, France 67 31 Okavango Research Institute, University of Botswana, Maun, Botswana. 68 32 GFZ German Research Centre for Geosciences, Telegrafenberg, 14473 Potsdam, Germany 69 33 Manaaki Whenua - Landcare Research, Lincoln, NZ 70 34 Université de Montréal, Département de géographie, Université de Montréal, Montréal, QC H2V 0B3, 71 35 Canada & Dalhousie University, Department of Physics and Atmospheric Science, Halifax, NS B2Y 1P3, Canada 72 36 UK Centre for Ecology and Hydrology, Edinburgh, UK 73 37 Woods Institute for the Environment, Stanford University, Stanford, California 74 38 Research Faculty of Agriculture, Hokkaido University, Sapporo, Japan 75 39 Northern Research Station, USDA Forest Service, Durham, NH 03824, USA 76 40 Department of Environmental Science, Faculty of Science, Shinshu University 77 41 University of Rostock, Rostock, Germany 78 42 National Center for Agro Meteorology, Seoul, South Korea 79 43 Department of Geography, University of Tartu, Vanemuise st 46, Tartu, 51410, Estonia 80 44 Department of Forestry and Environmental Resources, North Carolina State University, Raleigh, NC, USA 81 45 Vegetation Ecology, Institute of Ecology and Landscape, Department Landscape Architecture, Weihenstephan-82 Triesdorf University of Applied Sciences, Am Hofgarten 1, 85354 Freising, Germany 83 46 U.S. Geological Survey, Wetland and Aquatic Research Center, Lafayette LA 84 47 Department of Geography and Resource Management, The Chinese University of Hong Kong, Shatin, New 85 Territories, Hong Kong SAR, China 86 48 Institute for Atmospheric and Earth System Research/Physics, Faculty of Science, University of Helsinki, 87 Helsinki, Finland 88 49 European Commission, Joint Research Centre (JRC), Ispra, Italy. 89 50 Dept. of Sustainable Agro-Ecosystems and Bioresources, Research and Innovation Centre, Fondazione Edmund 90 Mach, San Michele all'Adige , Italy 91 51 Department of Biological Sciences, Wellesley College, Wellesley, MA 02481, USA 92 52 Institute for Biological Problems of the Cryolithozone, RAS, Yakutsk, REp. Yakutia. 93 53 Mazingira Centre, International Livestock Research Institute (ILRI), Old Naivasha Road, PO Box 30709, 00100 94 Nairobi, Kenya 95 54 Northern Arizona University, School of Informatics, Computing and Cyber Systems 96 55 Environmental Resources Engineering, SUNY College of Environmental Science and Forestry 97 56 Dept. of Forest Ecology and Management, Swedish University of Agricultural Sciences, 901 83 Umeå, Sweden 98 57 Dept. Biology, San Diego State University, San Diego, CA 92182, USA 99 58 Department of Earth and Environmental Sciences, Cal State East Bay, Hayward CA 94542 USA 100 59 National Agriculture and Food Research Organization, Tsukuba, Japan 101 60 USDA-ARS Delta Water Management Research Unit, Jonesboro, Arkansas 72401, United States 102

3
61 School of Informatics, Computing & Cyber Systems, Northern Arizona University, Flagstaff, AZ 86011, USA 103 62 Center for Ecosystem Science and Society, Northern Arizona University, Flagstaff, AZ 86011, USA 104 63 Department of Biological & Agricultural Engineering, University of Arkansas, Fayetteville, Arkansas 72701, 105 United States 106 64 Department of Landscape Architecture and Rural Systems Engineering, Seoul National University, South Korea 107 65 Hakubi center, Kyoto University, Kyoto, Japan 108 66 Department of Biological Sciences, Northern Arizona University, Flagstaff, AZ, USA 109 67 Dept of Earth and Environmental Science, Rutgers University Newark, NJ 110 68 Université de Montréal, Département de géographie, Université de Montréal, Montréal, QC H2V 0B3, Canada 111 69 Department of Ecology and Evolution, Cornell 112 70 U.S. Geological Survey, California Water Science Center, 6000 J Street, Placer Hall, Sacramento, CA, 95819 113 71 National Ecological Observatory Network, Battelle, 1685 38th St Ste 100, Boulder, Colorado, 80301, USA 114 72 Environmental Science Division, Argonne National Laboratory, Lemont, IL, USA 115 73 Space Sciences and Engineering Center, University of Wisconsin-Madison, Madison, WI 53706 USA 116 74 School of Forest Sciences, University of Eastern Finland, Joesnuu, Finland 117 75 Freshwater and Marine Science, University of Wisconsin-Madison 118 76 Graduate School of Life and Environmental Sciences, Osaka Prefecture University 119 77 Department of Plant and Soil Sciences, University of Delaware, Newark, DE, USA 120 78 A.N. Severtsov Institute of Ecology and Evolution, Russian Academy of Sciences 121 79 California State University San Marcos, San Marcos, CA, USA 122 80 University of Innsbruck, Department of Ecology, Sternwartestr. 15, 6020 Innsbruck, AUSTRIA 123 81 Sarawak Tropical Peat Research Institute, Sarawak, Malaysia 124 82 Department of Geographical Sciences, University of Maryland, College Park, MD 20740, USA 125 83 Department of Animal and Plant Sciences, University of Sheffield, Western Bank, Sheffield, S10 2TN, United 126 Kingdom 127 84 U.S. Geological Survey,Water Mission Area, 345 Middlefield Road, Menlo Park, CA, 94025 128 85 Biospheric Sciences Laboratory, NASA Goddard Space Flight Center, Greenbelt, Maryland 129 86 Precourt Institute for Energy, Stanford University, Stanford, California 130 131 132 133
Correspondence to: Kyle B. Delwiche ([email protected]) 134
135 Abstract. Methane (CH4) emissions from natural landscapes constitute roughly half of global CH4 contributions to 136 the atmosphere, yet large uncertainties remain in the absolute magnitude and the seasonality of emission quantities 137 and drivers. Eddy covariance (EC) measurements of CH4 flux are ideal for constraining ecosystem-scale CH4 138 emissions due to quasi-continuous and high temporal resolution of CH4 flux measurements, coincident carbon dioxide, 139 water, and energy flux measurements, lack of ecosystem disturbance, and increased availability of datasets over the 140 last decade. Here, we 1) describe the newly published dataset, FLUXNET-CH4 Version 1.0, the first, open source 141 global dataset of CH4 EC measurements (available at https://fluxnet.org/data/fluxnet-ch4-community-product/). 142 FLUXNET-CH4 includes half-hourly and daily gap-filled and non gap-filled aggregated CH4 fluxes and 143 meteorological data from 79 sites globally: 42 freshwater wetlands, 6 brackish and saline wetlands, 7 formerly drained 144 ecosystems, 7 rice paddy sites, 2 lakes, and 15 uplands. Then, we 2) evaluate FLUXNET-CH4 representativeness for 145 freshwater wetland coverage globally, because the majority of sites in FLUXNET-CH4 Version 1.0 are freshwater 146 wetlands which are a substantial source of total atmospheric CH4 emissions; and 3) provide the first global estimates 147 of the seasonal variability and seasonality predictors of freshwater wetland CH4 fluxes. Our representativeness analysis 148 suggests that the freshwater wetland sites in the dataset cover global wetland bioclimatic attributes (encompassing 149 energy, moisture, and vegetation-related parameters) in arctic, boreal, and temperate regions, but only sparsely cover 150 humid tropical regions. Seasonality metrics of wetland CH4 emissions vary considerably across latitudinal bands. In 151 freshwater wetlands (except those between 20° S to 20° N) the spring onset of elevated CH4 emissions starts three 152 days earlier, and the CH4 emission season lasts 4 days longer, for each degree C increase in mean annual air 153

4
temperature. On average, the spring onset of increasing CH4 emissions lags soil warming by one month, with very 154 few sites experiencing increased CH4 emissions prior to the onset of soil warming. In contrast, roughly half of these 155 sites experience the spring onset of rising CH4 emissions prior to the spring increase in gross primary productivity 156 (GPP). The timing of peak summer CH4 emissions does not correlate with the timing for either peak summer 157 temperature or peak GPP. Our results provide seasonality parameters for CH4 modeling, and highlight seasonality 158 metrics that cannot be predicted by temperature or GPP (i.e., seasonality of CH4 peak). FLUXNET-CH4 is a powerful 159 new resource for diagnosing and understanding the role of terrestrial ecosystems and climate drivers in the global CH4 160 cycle; and future additions of sites in tropical ecosystems and site-years of data collection will provide added value to 161 this database. All seasonality parameters are available at https://doi.org/10.5281/zenodo.4672601. Additionally, raw 162 FLUXNET-CH4 data used to extract seasonality parameters can be downloaded from https://fluxnet.org/data/fluxnet-163 ch4-community-product/, and a complete list of the 79 individual site data DOIs is provided in Table 2 in the Data 164 Availability section of this document. 165
166 167 168 169 170
1 Introduction 171
Methane (CH4) has a global warming potential that is 28 times larger than carbon dioxide (CO2) on a 100-172 year time scale (Myhre et al., 2013), and its atmospheric concentration has increased by >1000 ppb since 1800 173 (Etheridge et al., 1998). While atmospheric CH4 concentrations are substantially lower than those of CO2, CH4 has 174 contributed 20-25% as much radiative forcing as CO2 since 1750 (Etminan et al., 2016). Despite its importance to 175 global climate change, natural CH4 sources and sinks remain poorly constrained, and with uncertain attribution to the 176 various biogenic and anthropogenic sources (Saunois et al., 2016, 2020). Bottom-up and top-down estimates differ 177 by 154 Tg/yr (745 versus 591 Tg/yr, respectively); much of this difference arises from natural sources (Saunois et al., 178 2020). Vegetated wetlands and inland water bodies account for most natural CH4 emissions, as well as the majority 179 of uncertainty in bottom-up emissions estimates (Saunois et al., 2016). Better diagnosis and prediction of terrestrial 180 CH4 sources to the atmosphere requires high frequency and continuous measurements of CH4 exchange across a 181 continuum of time (hours to years) and space (meters to kilometers) scales. 182
Tower-based eddy covariance (EC) measurements provide ecosystem-scale CH4 fluxes at high temporal 183 resolution across years, are coupled with measurements of key CH4 drivers such as temperature, water and recent 184 substrate input (inferred from CO2 flux), and thus help constrain bottom-up CH4 budgets and improve CH4 predictions. 185 Although EC towers began measuring CO2 fluxes in the late 1970s (Desjardins 1974; Anderson et al., 1984), and 186 some towers began measuring CH4 in the 1990s (Verma et al., 1992), most CH4 flux EC measurements began within 187 the last decade (2010s). Given that many EC CH4 sites are relatively new, the flux community has only recently 188 compiled them for global synthesis efforts (e.g., Chang et al., in press) and is still working to standardize CH4 flux 189 measurements and establish gap-filling protocols (Nemitz et al., 2018; Knox et al., 2019). Furthermore, the growth of 190 EC networks for CH4 fluxes has sometimes taken place in a relatively ad hoc fashion, often at sites that were already 191 measuring CO2 fluxes or where higher CH4 fluxes were expected, potentially introducing bias. The representativeness 192 and spatial distribution of CO2 flux tower networks have been assessed to evaluate its ability to upscale fluxes 193 regionally (Hargrove et al., 2003; Hoffman et al., 2013; Papale et al., 2015; Villarreal et al., 2018, 2019) and globally 194 (Jung et al., 2009; 2020). However, a relatively sparse coverage of CH4 flux towers prompts the question of how well 195 the current observation network provides a sufficient sampling of global or ecosystem-specific bioclimatic conditions. 196

5
Broad-scale wetland CH4 seasonality estimates, such as when fluxes increase, peak, and decrease and the 197 predictors of seasonality, remain relatively unconstrained across wetlands globally. These key seasonality metrics 198 vary considerably across high-emitting systems such as wetlands and other aquatic systems (Desjardins, 1974; Dise, 199 1992; Melloh and Crill 1996; Wik et al., 2013; Zona et al., 2016; Treat et al., 2018). Few continuous CH4 flux datasets 200 across representative site-years make it difficult to establish trends in seasonal dynamics, though monthly or annually 201 aggregated estimates of CH4 fluxes from different seasons do exist for high latitudes (Zona et al., 2016; Treat et al., 202 2018). Seasonal variability in freshwater wetland CH4 fluxes is expected to be driven by changes in air and soil 203 temperature, soil moisture (including water table dynamics), and recent carbon substrate availability, which influence 204 the rates of CH4 production and consumption (Lai, 2009; Bridgham et al., 2013; Dean et al., 2018). Temperature has 205 widely been found to strongly affect CH4 flux (Chu et al., 2014; Yvon-Durocher et al., 2014; Sturtevant et al., 2016), 206 but the relationship is complex (Chang et al., 2020) and varies seasonally (Koebsch et al., 2015; Helbig et al., 2017). 207 CH4 flux is also driven by inundation depth since anoxic conditions are typically necessary for methanogenesis (Lai, 208 2009; Bridgham et al., 2013), though CH4 production under bulk-oxic conditions has been observed (Angle et al., 209 2017). Substrate availability influences CH4 production potential and is linked with gross primary productivity (GPP) 210 because recent photosynthate fuels methanogenesis though this relationship can vary by ecosystem type, plant 211 functional type and biome (Megonigal et al., 1999; Chanton et al., 2008; Hatala et al., 2012; Lai et al., 2014; Malhotra 212 and Roulet, 2015; Sturtevant et al., 2016). In process models, the seasonality of CH4 emissions from wetlands globally 213 is primarily constrained by inundation (Poulter et al., 2017), with secondary within-wetland influences from 214 temperature and availability of carbon (C) substrates (Melton et al., 2013; Castro-Morales et al., 2018). Bottom-up 215 and top-down global CH4 estimates continue to disagree on total CH4 flux magnitudes and seasonality, including the 216 timing of annual peak emissions (Spahni et al., 2011; Saunois et al., 2020). Thus, the variability and predictors of 217 wetland CH4 seasonality globally remain a knowledge gap that high-frequency and long-term EC data can help fill. 218
Here, we first describe Version 1.0 of the FLUXNET-CH4 dataset (available at 219 https://fluxnet.org/data/fluxnet-ch4-community-product/). Version 1.0 of the dataset expands and formalizes the 220 publication of data scattered among regional flux networks as described previously in Knox et al. (2019). FLUXNET-221 CH4 includes half-hourly and daily gap-filled and non gap-filled aggregated CH4 fluxes and meteorological data from 222 79 sites globally: 42 freshwater wetlands, 6 brackish and saline wetlands, 7 formerly drained ecosystems, 7 rice paddy 223 sites, 2 lakes, and 15 upland ecosystems. FLUXNET-CH4 includes an additional 2 wetland sites (RU-Vrk and SE-224 St1), but they are not available under the CC BY 4.0 data policy and thus are excluded from this analysis. Since the 225 majority of sites in FLUXNET-CH4 Version 1.0 (hereafter referred to solely as “FLUXNET-CH4”) are freshwater 226 wetlands, which are a substantial source of total atmospheric CH4 emissions, we use the subset of data from freshwater 227 wetlands to evaluate the representativeness of freshwater wetland coverage in the FLUXNET-CH4 dataset relative to 228 wetlands globally, and provide the first assessment of global variability and predictors of freshwater wetland CH4 flux 229 seasonality. We quantify a suite of CH4 seasonality metrics and evaluate temperature and GPP (a proxy for recent 230 substrate input) as predictors of seasonality across four latitudinal bands (northern, temperate, subtropical, and 231 tropical). Due to a lack of high-temporal resolution water table data at all sites, our analyses are unable to evaluate the 232 critical role of water table on CH4 seasonality. Here we provide parameters for better understanding and modeling 233 seasonal variability in freshwater wetland CH4 fluxes and generate new hypotheses and data resources for future 234 syntheses. 235
2. Methods 236
2.1 FLUXNET-CH4 dataset 237
2.1.1 History and data description 238
The FLUXNET-CH4 dataset was initiated by the Global Carbon Project (GCP) in 2017 to better constrain 239 the global CH4 budget (https://www.globalcarbonproject.org/methanebudget/index.htm). Beginning with a kick off 240
6
meeting in May 2018 in Washington DC, hosted by Stanford University, we coordinated with the AmeriFlux 241 Management Project, the European Ecosystem Fluxes Database, and the ICOS Ecosystem Thematic Centre (ICOS-242 ETC) to avoid duplication of efforts, as most sites are part of different regional networks (albeit with different data 243 products). We collected and standardized data for FLUXNET-CH4 with assistance from the regional flux networks, 244 AmeriFlux’s “Year of Methane”, FLUXNET, the EU’s Readiness of ICOS for Necessities of Integrated Global 245 Observations (RINGO) project, and a U.S. Geological Survey Powell Center working group. FLUXNET-CH4 is a 246 community-led project, so while we developed it with assistance from FLUXNET, we do not necessarily use standard 247 FLUXNET data variables, formats, or methods. 248
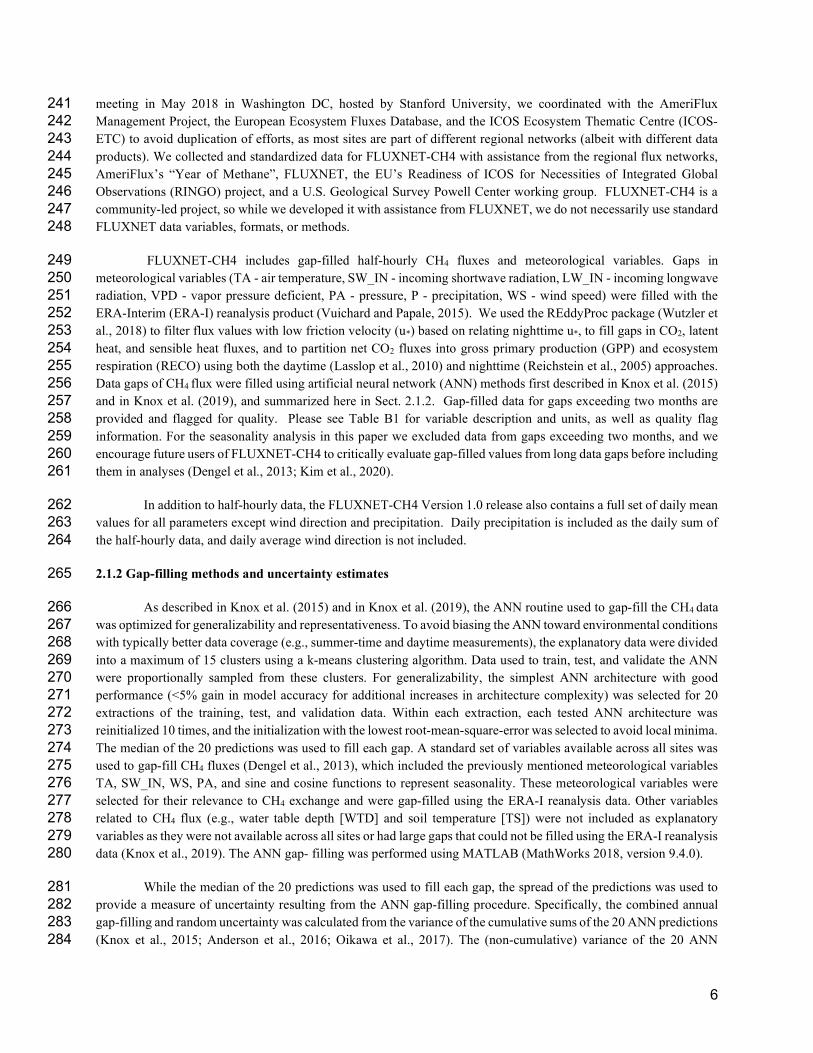
FLUXNET-CH4 includes gap-filled half-hourly CH4 fluxes and meteorological variables. Gaps in 249 meteorological variables (TA - air temperature, SW_IN - incoming shortwave radiation, LW_IN - incoming longwave 250 radiation, VPD - vapor pressure deficient, PA - pressure, P - precipitation, WS - wind speed) were filled with the 251 ERA-Interim (ERA-I) reanalysis product (Vuichard and Papale, 2015). We used the REddyProc package (Wutzler et 252 al., 2018) to filter flux values with low friction velocity (u*) based on relating nighttime u*, to fill gaps in CO2, latent 253 heat, and sensible heat fluxes, and to partition net CO2 fluxes into gross primary production (GPP) and ecosystem 254 respiration (RECO) using both the daytime (Lasslop et al., 2010) and nighttime (Reichstein et al., 2005) approaches. 255 Data gaps of CH4 flux were filled using artificial neural network (ANN) methods first described in Knox et al. (2015) 256 and in Knox et al. (2019), and summarized here in Sect. 2.1.2. Gap-filled data for gaps exceeding two months are 257 provided and flagged for quality. Please see Table B1 for variable description and units, as well as quality flag 258 information. For the seasonality analysis in this paper we excluded data from gaps exceeding two months, and we 259 encourage future users of FLUXNET-CH4 to critically evaluate gap-filled values from long data gaps before including 260 them in analyses (Dengel et al., 2013; Kim et al., 2020). 261
In addition to half-hourly data, the FLUXNET-CH4 Version 1.0 release also contains a full set of daily mean 262 values for all parameters except wind direction and precipitation. Daily precipitation is included as the daily sum of 263 the half-hourly data, and daily average wind direction is not included. 264
2.1.2 Gap-filling methods and uncertainty estimates 265
As described in Knox et al. (2015) and in Knox et al. (2019), the ANN routine used to gap-fill the CH4 data 266 was optimized for generalizability and representativeness. To avoid biasing the ANN toward environmental conditions 267 with typically better data coverage (e.g., summer-time and daytime measurements), the explanatory data were divided 268 into a maximum of 15 clusters using a k-means clustering algorithm. Data used to train, test, and validate the ANN 269 were proportionally sampled from these clusters. For generalizability, the simplest ANN architecture with good 270 performance (<5% gain in model accuracy for additional increases in architecture complexity) was selected for 20 271 extractions of the training, test, and validation data. Within each extraction, each tested ANN architecture was 272 reinitialized 10 times, and the initialization with the lowest root-mean-square-error was selected to avoid local minima. 273 The median of the 20 predictions was used to fill each gap. A standard set of variables available across all sites was 274 used to gap-fill CH4 fluxes (Dengel et al., 2013), which included the previously mentioned meteorological variables 275 TA, SW_IN, WS, PA, and sine and cosine functions to represent seasonality. These meteorological variables were 276 selected for their relevance to CH4 exchange and were gap-filled using the ERA-I reanalysis data. Other variables 277 related to CH4 flux (e.g., water table depth [WTD] and soil temperature [TS]) were not included as explanatory 278 variables as they were not available across all sites or had large gaps that could not be filled using the ERA-I reanalysis 279 data (Knox et al., 2019). The ANN gap- filling was performed using MATLAB (MathWorks 2018, version 9.4.0). 280
While the median of the 20 predictions was used to fill each gap, the spread of the predictions was used to 281 provide a measure of uncertainty resulting from the ANN gap-filling procedure. Specifically, the combined annual 282 gap-filling and random uncertainty was calculated from the variance of the cumulative sums of the 20 ANN predictions 283 (Knox et al., 2015; Anderson et al., 2016; Oikawa et al., 2017). The (non-cumulative) variance of the 20 ANN 284

7
predictions was also used to provide gap-filling uncertainty for each half-hourly gap-filled value. While this output is 285 useful for data-model comparisons, it cannot be used to estimate cumulative annual gap-filling error because gap-286 filling error is not random, which is why the cumulative sums of the 20 ANN predictions are used to estimate annual 287 gap-filling error. 288
Random errors in EC fluxes follow a double exponential (Laplace) distribution with the standard deviation 289 varying with flux magnitude (Richardson et al., 2006; Richardson et al., 2012). For half-hourly CH4 flux 290 measurements, random error was estimated using the residuals of the median ANN predictions, providing a 291 conservative “upper limit” estimate of the random flux uncertainty (Moffat et al., 2007; Richardson et al., 2008). The 292 annual cumulative uncertainty at 95% confidence was estimated by adding the cumulative gap-filling and random 293 measurement uncertainties in quadrature (Richardson and Hollinger, 2007; Anderson et al., 2016). Annual 294 uncertainties in CH4 flux for individual site-years are provided in Table B2. Throughout this paper, we include 295 uncertainties on individual site years when discussing single years of data. In sites with multiple years of data, we 296 report the standard deviation of the multiple years. 297
2.1.3 Dataset structure and site metadata 298
FLUXNET-CH4 contains two comma-separated data files per site at half-hourly and daily resolutions which 299 are available for download at https://fluxnet.org/data/fluxnet-ch4-community-product/, along with a file containing 300 select site metadata. Each site has a unique FLUXNET-CH4 DOI. All data from the 79 sites used in this analysis are 301 available under CC BY 4.0 (https://creativecommons.org/licenses/by/4.0/) copyright license (FLUXNET-CH4 has an 302 additional 2 sites available under the FLUXNET Tier 2 license (https://fluxnet.org/data/data-policy/), though these 303 sites are not included in our analysis). 304
Metadata (Table B3) include site coordinates, ecosystem classification based on site literature, 305 presence/absence and dominance for specific vegetation types, and DOI link, as well as calculated data such as annual 306 and quarterly CH4 flux values. FLUXNET-CH4 Version 1.0 sites were classified based on site-specific literature as 307 fen, bog, swamp, marsh, salt marsh, lake, mangrove, rice paddy/field, wet tundra, upland, or drained ecosystems that 308 previously could have been wetlands, seasonally flooded pastures, or agricultural areas. To the extent possible, we 309 followed classification systems of previous wetland CH4 syntheses (Olefeldt et al., 2013; Turetsky et al., 2014; Treat 310 et al., 2018). Drained systems are former wetlands that have subsequently been drained but may maintain a relatively 311 shallow water table, which can contribute to occasional methane emissions, although we do not have specific water 312 table depth information at all drained sites. Upland ecosystems are further divided into alpine meadows, grasslands, 313 needleleaf forests, mixed forest, crops, tundra, and urban. Freshwater wetland classifications follow hydrological 314 definitions of bog (ombrotrophic), fen (minerotrophic), wet tundra, marshes and swamps, and were designated as per 315 primary literature on the site. For all sites, vegetation was classified for presence or absence of brown mosses (all 316 species from the division Bryophyta except those in the class Sphagnopsida), Sphagnum mosses (any species from 317 class Sphagnopsida), ericaceous shrubs, trees (of any height) and aerenchymatous species (mostly Order Poales but 318 includes exceptions). These categories closely follow Treat et al., (2018), except that aerenchymatous species had to 319 be expanded beyond Cyperaceae to incorporate wetlands globally. Presence/absence of vegetation groups was 320 designated based on species lists in primary literature from the site. Out of the vegetation groups present, the dominant 321 (most abundant) group is also reported and is based on information provided by lead site investigators. 322
In addition to the variable description table (Table B1) and the site metadata (Table B3), we provide several 323 more tables to complement our analysis. Table B4 includes the climatic data used in the representativeness analysis. 324 Table 5 provides seasonality parameters for CH4 flux, air temperature, soil temperature (from the probe closest to the 325 ground surface), and GPP. For sites with multiple soil temperature probes, the full set of soil temperature parameters 326 are in Table B6. Table B7 contains the soil temperature probe depths. Table B2 contains the annual CH4 flux and 327 uncertainty. All Appendix B tables are also available at https://doi.org/10.5281/zenodo.4672601. 328

8
329
2.1.4 Annual CH4 fluxes 330
Annual CH4 fluxes were calculated from gap-filled data for site-years with data gaps shorter than two 331 consecutive months, or for sites above 20° N where >2 month data gaps occurred outside of the highest CH4-emission 332 months of May 1 through October 31. Since we did not sum gap-filled values for >2 month gaps during the winter, 333 annual sums from these years will be an underestimate since winter fluxes can be important (Zona et al., 2016; Treat 334 et al., 2018). Several sites had less than one year of data, and we report gap-filled CH4 flux annual sums for sites with 335 between six months and one year of data (BW-Gum = 228 days, CH-Oe2 = 200 days, JP-Swl = 210 days, US-EDN = 336 182 days). While these sums will be an underestimate of annual CH4 flux since they do not span a full year (and we 337 therefore do not use them in the seasonality analysis), their relative magnitude can still be informative. For example, 338 site JP-SWL is a lake site, and even with less than a year of data the summed CH4 flux of 66 g C m-2 is relatively high 339 (Taoka et al., 2020). In addition to sites with short time series, the annual CH4 sum for site ID-Pag represents 365 days 340 spanning June 2016 to June 2017. 341
2.1.5 Subset analysis on freshwater wetland CH4 flux 342
In addition to the FLUXNET-CH4-wide description of site class distributions and annual CH4 fluxes, we 343 also include a subset analysis on freshwater wetlands, given that it is the dominant ecosystem type in our dataset and 344 an important global CH4 source (Saunois et al., 2016). First, we analyze freshwater wetland representativeness, and 345 subsequently the seasonality of their CH4 emissions. Freshwater wetlands included in the seasonality and 346 representativeness analysis are indicated in Table B3, column “IN_SEASONALITY_ANALYSIS”. 347
348
2.2 Wetland representativeness 349
2.2.1 Principal Component Analysis 350
To compare the FLUXNET-CH4 site distribution to the global wetland distribution, we evaluated their 351 representativeness in the entire global wetland cover along four bioclimatic gradients. Only freshwater wetland sites 352 were included in this analysis. Coastal sites were excluded because salinity, an important control on CH4 production, 353 could not be evaluated across the tower network due to a lack of global gridded salinity data (Bartlett et al., 1987; 354 Poffenbarger et al., 2011). The four bioclimatic variables used were: mean annual air temperature (MAT), latent heat 355 flux (LE), enhanced vegetation index (EVI), and simple ratio water index (SRWI; data sources in Table B4). We use 356 EVI because it is a more direct measurement than GPP from global gridded products and is considered a reasonable 357 proxy for GPP (Sims et al., 2006). Together, these environmental variables account for, or are, proxies for key controls 358 of CH4 production, oxidation at the surface, and transport (Bridgham et al., 2013). We use a principal components 359 analysis (PCA) to visualize the site distribution across the four environmental drivers at once. For this analysis, we 360 consider the annual average bioclimatic conditions over 2003-2015. In the PCA output, we evaluate the coverage of 361 the 42 freshwater sites over 0.25° grid cells containing >5% wetland mean cover in Wetland Area and Dynamics for 362 Methane Modeling (WAD2M; Zhang et al., 2020; Zhang et al., 2021) for the same time period. 363
2.2.2 Global Dissimilarity and Constituency Analysis 364
To further identify geographical gaps in the coverage of the FLUXNET-CH4 Version 1.0 network, we 365 quantified the dissimilarity of global wetlands from the tower network, using a similar approach to that taken for CO2 366 flux towers (Meyer and Pebesma 2020). We calculated the 4-dimensional Euclidean distance from the four bioclimatic 367 variables between every point at the land surface to every tower location at the FLUXNET-CH4 network. We then 368 divided these distances by the average distance between towers to produce a dissimilarity index. Dissimilarity scores 369

9
<1 represent areas whose nearest tower is closer than the average distance among towers, while areas with scores >1 370 are more distant. Lastly, we identified the importance of an individual tower in the network by estimating the 371 geographical area to which it is most analogous in bioclimate space. We divided the world’s land surface according 372 to closest towers in bioclimatic space. The area to which each tower is nearest is defined as the tower’s constituency. 373
2.3 Wetland CH4 seasonality 374
To examine freshwater wetland CH4 seasonality across the global range of sites in FLUXNET-CH4, we 375 extracted seasonality parameters for CH4, temperature, and GPP using Timesat, a software package designed to 376 analyze seasonality of environmental systems (Jönsson and Eklundh, 2002; Jönsson and Eklundh, 2004; Eklundh 377 and Jönsson, 2015). Timesat calculates several seasonality parameters, including baseline flux, peak flux, and the 378 slope of spring flux increase and fall decrease (Fig. 1). We also calculate parameters such as amplitude (peak flux - 379 baseline, which is the average of spring and fall baselines; (“e” - ((“a” + “b”)/2) in Fig. 1), and relative peak timing ( 380 ( “g” - “f” ) / (“h” - “f”) in Fig. 1). Timesat uses a double-logistic fitting function to create a series of localized fits 381 centered on data minima and maxima. Localized fits are minimized using a merit function and the Levenberg-382 Marquardt method (Madsen et al., 2004; Nielsen, 1999). These localized fits are then merged using a global 383 function to create a smooth fit over the full time interval. To fit CH4 time-series in Timesat, we used gap-filled data 384 after removing gaps exceeding two months. We do not report Timesat parameters when large gaps occur during CH4 385 emissions spring increase, peak, or fall decrease. 386
We estimate ‘start of elevated emissions season’ when CH4 emissions begin to increase in the spring ( “f” 387 in Fig. 1), and ‘end of elevated emissions season’ when the period of elevated CH4 flux ends in the fall (“h” in Fig. 388 1), as the intercept between the Timesat fitted baseline parameter and shoulder-season slope (similar to Gu et al., 389 2009). To extract seasonality parameters with Timesat, sites need a sufficiently pronounced seasonality, a 390 sufficiently long time period, and minimal data gaps (we note that while Timesat is capable of fitting two peaks per 391 year, all the freshwater wetland sites have a single annual peak). We excluded site-years in restored wetlands when 392 wetlands were still under construction. Of the 42 freshwater wetland sites in FLUXNET-CH4 Version 1.0, 36 had 393 sufficient data series to extract seasonality parameters. These 36 wetlands had 141 site-years of data total, which we 394 fit with the double-logistic fitting method which followed site data well (representative examples in Fig. 2). For 395 extratropical sites in the Southern Hemisphere, we shifted all data by 182 days so that maximum solar insolation 396 seasonality would be congruent across the globe. 397
We also used Timesat to extract seasonality metrics for GPP, partitioned using the daytime-based approach 398 (Lasslop et al., 2010) (GPP_DT), air temperature (TA), and soil temperature (TS_1, TS_2, etc). For sites where 399 winter soil temperatures fall significantly below 0 °C, Timesat fits a soil temperature “start of elevated season” date 400 to periods when the soil is still frozen. In order for Timesat to define the soil temperature seasonality within the 401 thawed season, we converted all negative soil temperatures to zero (simply removing these values results in too 402 many missing values for Timesat to fit). Many sites have more than one soil temperature probe, so we extracted 403 separate seasonality metrics from each individual probe (although we used the metrics from the shallowest 404 temperature probe in our analysis). Tables B4 contain the Timesat seasonality parameters used in the seasonality 405 analysis. We did not include water table depth in the seasonality analysis because many sites either lack water table 406 depth measurements or have sparse data. 407

10
408
Figure 1: TIMESAT parameter description. (a) and (b) base values (Timesat reports the average of these two values), (c) 409 and (d) slopes of seasonal curves (lines drawn between 20% and 80% of the amplitude), (e) peak value, and day of year 410 (DOY) for the start (f), peak (g), and end (h) of the elevated methane (CH4) emissions season. Data points are the mean 411 daily gap-filled CH4 fluxes from site JP-Bby in 2015. 412
413
414
415
Figure 2: Examples of Timesat fits for two FLUXNET-CH4 sites, (a) RU-Che and (b) JP-Bby. Methane (CH4) flux data 416 showing daily average flux tower data, with several high outliers excluded to improve the plot (dark gray), gap-filled 417

11
values (light gray), and Timesat-fitted curve (dark red line) for sites JP-Bby and RU-Che. Timesat captures the size and 418 shape of peaks (note different scale on y-axes). CH4 = methane. 419
420
We regressed the CH4 seasonality parameters from Timesat against annual temperature, annual water table 421 depth, and Timesat seasonality parameters for air temperature, soil temperature, and GPP (proxy for recent carbon 422 input available as substrate) using linear mixed-effect modeling with the lmer command (with site as a random 423 effect) from the R (R Core Team 2018, version 3.6.2) package lmerTest (Kuznetsova et al., 2017). For these 424 regressions we present the marginal R2 outputs from lmer, which represent the variance explained only by the fixed 425 effects. Mixed-effect modeling was necessary to account for the non-independence between measurements taken at 426 the same site during different years (Zona et al., 2016; Treat et al., 2018). We also compared how seasonality 427 metrics varied across latitudinal bands by dividing sites into northern (> 60° N), temperate (between 40° N and 60° 428 N), subtropical (absolute value between 20° and 40° latitude, with site NZ-KOP being the only Southern hemisphere 429 site), and tropical (absolute value below 20°). Site-year totals for the northern, temperate, subtropical, and tropical 430 bands were n = 57, 36, 39, and 9, respectively. We used the Kruskal-Wallis test to establish whether groups (either 431 across quarters or across latitudes) were from similar distributions, and the post hoc multiple comparison “Dwass, 432 Steel, Critchlow, and Fligner” procedure for inter-group comparisons. Kruskal-Wallis and post-hoc tests were 433 implemented in Python Version 3.7.4, using stats from scipy for Kruskal-Wallis and posthoc_dscf from 434 scikit_posthocs. 435
We also compared quarterly CH4 flux sums by dividing data into quarterly periods: 436 January/February/March (JFM), April/May/June (AMJ), July/August/September (JAS), and 437 October/November/December (OND). For the sake of simplicity, we chose to compare quarterly periods rather than 438 site-specific growing/non-growing season periods so that all time periods would be the same length. Quarterly sums 439 were computed from the gap-filled CH4 fluxes when the longest continuous data gap within the quarter did not 440 exceed 30 days, leading to site-year counts of 67, 92, 95, 72 for JFM, AMJ, JAS, and OND, respectively. We 441 compared quarterly CH4 fluxes across latitudinal bands both for the total CH4 flux, and for the quarterly percentage 442 of the annual CH4 flux. Quarterly statistics were also conducted with the Kruskal-Wallis test and the post hoc 443 multiple comparison “Dwass, Steel, Critchlow, and Fligner” procedure implemented in Python. Quarterly values 444 are provided in Table B3, and the sum of mean quarterly CH4 flux does not always equal mean annual CH4 flux 445 because some quarters either do not have data, or have data gaps that exceed 30 days. 446 447
3. Results and Discussion 448
3.1 FLUXNET-CH4 dataset 449
3.1.1 Dataset description 450
Version 1.0 of the FLUXNET-CH4 dataset contains 79 unique sites, 293 total site-years of data, and 201 451 site-years with sufficient data to estimate annual CH4 emissions. A synthesis paper, published prior to the public data 452 release of FLUXNET-CH4 Version 1.0, had 60 unique sites and 139 site-years with annual CH4 emissions estimates 453 (Knox et al., 2019). Freshwater wetlands make up the majority of sites (n = 42), and the dataset also includes five salt 454 marshes and one mangrove wetland. Notable additions to FLUXNET-CH4 from the previous unpublished dataset 455 used in Knox et al., (2019) include six tropical sites (between 20° S and 20° N), including one site in South America, 456 two sites in southern Africa, and three sites in Southeast Asia. The 15 upland sites include six needleleaf forests, three 457 crop sites (excluding rice), two alpine meadows, one grassland, one mixed forest, one tundra, and one urban site. The 458 drained sites represent former wetlands that have been artificially drained for use as grasslands (n = 3) or croplands 459

12
(n = 3). FLUXNET-CH4 sites span the globe, though are concentrated in North America and Europe (Fig. 3). Table 460 B3 includes characteristics of all sites in the dataset. 461
462
Figure 3. Global map of FLUXNET-CH4 Version 1.0 site locations colored by site type. Insets (a)-(d) show sites that were 463 too closely located to distinguish in the global map. 464

13
465
Figure 4. Histogram of annual methane fluxes (FCH4, g C m-2 yr-1) grouped by site type. 466
Sites represent a range of ecosystem types, latitudes, median fluxes, and seasonality patterns (Table 1). 467 Across all FLUXNET-CH4 sites, mean average annual CH4 flux is positively skewed with a median flux of 9.5 g C 468 m-2 yr-1, a mean flux of 16.9 g C m-2 yr-1, and numerous annual CH4 fluxes exceeding 60 g C m-2 yr-1. Marshes and 469 swamps have the highest median flux, and upland, salt marsh, and tundra sites have the lowest (Fig. 4). Lake 470 emissions are highly variable due to one high-flux lake site (JP-SWL). Flux data at many sites show strong 471 seasonality in CH4 emissions, but data coverage is also lower outside the growing season (Table 1). Data coverage 472 is lowest during the JFM quarter (on average 20% of half-hourly time periods contain flux data) reflecting the 473 predominance of Northern hemisphere sites and the practical difficulties in maintaining EC tower sites during colder 474 winter months (Table 1). Bogs, fens, and marshes have pronounced seasonality, with fluxes being highest in the 475 AMJ and JAS quarters. In contrast, CH4 fluxes from uplands, drained sites, and salt marshes are more uniform and 476 low year-round. 477
Table 1: Summary table of sites grouped by ecosystem class reporting annual mean flux (Ann_Flux) and standard 478 deviation from inter-annual variability (Ann_Flux_SD), site-years of data, % data cover per quarter, and median (med.) 479 flux across site class. JFM= January, February, March; AMJ = April, May, June; JAS = July, August, September; OND 480 = October, November, December. 481
# of Sites
# of Site-Years
Ann_Flux g C m-2 year-1
Ann_Flux_SD g C m-2 year-1
JFM cover-age (%)
AMJ cover-age (%)
JAS cover-age (%)
OND cover-age (%)
JFM flux (med.)
AMJ flux (med.)
JAS flux (med.)
OND flux (med.)
Salt marsh 5 10 2.9 4.7 7 42 50 37 1.5 1.7 2.1 1.6
Wet tundra
11 39 3.8 1.8 8 28 40 18 0.4 2.6 8.1 3.2
14
Upland 15 47 4.0 10.5 23 35 39 28 1.2 0.5 1.4 0.8
Drained 7 20 6.3 7.1 22 39 39 29 4.6 3.6 5.1 3.6
Bog 7 32 10.5 6.4 8 27 37 18 7.2 11.0 24.8 9.5
Mangrove 1 3 11.1 0.5 46 28 30 41 3.2 7.2 22.5 14.1
Rice 7 20 14.4 8.8 16 37 45 27 3.2 11.9 43.1 4.2
Fen 8 40 20.5 16.0 29 43 40 30 2.8 14.2 26.0 6.4
Swamp 6 15 26.4 19.9 24 34 29 19 14.7 24.9 31.0 24.4
Lake 2 4 28.2 33.4 15 13 27 36 0.2 47.6 90.2 40.3
Marsh 10 42 40.8 20.7 22 43 53 30 13.5 55.0 85.8 36.1
482
483
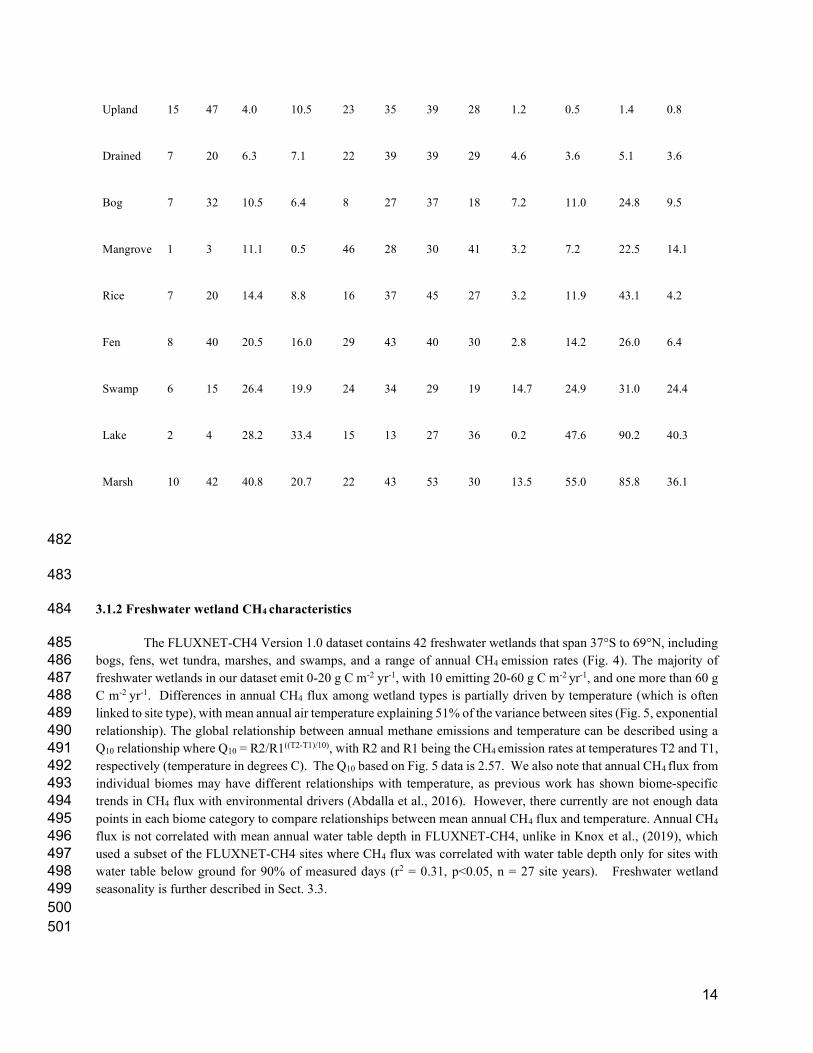
3.1.2 Freshwater wetland CH4 characteristics 484
The FLUXNET-CH4 Version 1.0 dataset contains 42 freshwater wetlands that span 37°S to 69°N, including 485 bogs, fens, wet tundra, marshes, and swamps, and a range of annual CH4 emission rates (Fig. 4). The majority of 486 freshwater wetlands in our dataset emit 0-20 g C m-2 yr-1, with 10 emitting 20-60 g C m-2 yr-1, and one more than 60 g 487 C m-2 yr-1. Differences in annual CH4 flux among wetland types is partially driven by temperature (which is often 488 linked to site type), with mean annual air temperature explaining 51% of the variance between sites (Fig. 5, exponential 489 relationship). The global relationship between annual methane emissions and temperature can be described using a 490 Q10 relationship where Q10 = R2/R1((T2-T1)/10), with R2 and R1 being the CH4 emission rates at temperatures T2 and T1, 491 respectively (temperature in degrees C). The Q10 based on Fig. 5 data is 2.57. We also note that annual CH4 flux from 492 individual biomes may have different relationships with temperature, as previous work has shown biome-specific 493 trends in CH4 flux with environmental drivers (Abdalla et al., 2016). However, there currently are not enough data 494 points in each biome category to compare relationships between mean annual CH4 flux and temperature. Annual CH4 495 flux is not correlated with mean annual water table depth in FLUXNET-CH4, unlike in Knox et al., (2019), which 496 used a subset of the FLUXNET-CH4 sites where CH4 flux was correlated with water table depth only for sites with 497 water table below ground for 90% of measured days (r2 = 0.31, p<0.05, n = 27 site years). Freshwater wetland 498 seasonality is further described in Sect. 3.3. 499
500 501

15
502 Figure 5: Relationship between mean annual wetland methane (CH4) flux (g C m-2 yr-1, logarithmic scale) and mean 503 annual air temperature (°C) for each freshwater wetland site, with wetland type indicated by symbol. Markers represent 504 individual site means, with vertical error bars representing the standard deviation of interannual variability. 505
506
507
3.1.3 Upland, rice and urban CH4 characteristics 508
Upland agricultural sites are characterized by a lack of seasonal pattern in CH4 emissions, relatively low flux, 509 and sometimes negative daily flux (i.e., CH4 uptake) averages. All of the upland non-agricultural sites in FLUXNET-510 CH4 Version 1.0 are net (albeit weak) CH4 sources except for the needleleaf forest site US-Ho1, which has mean 511 annual CH4 flux of -0.1 ± 0.1 g C m-2 yr-1 (see Table B3 for site acronyms and metadata). The average agricultural site 512 emissions are 1.3 ± 0.8 g C m-2 yr-1 and non-agricultural site emissions are 1.6 ± 1.2 g C m-2 yr-1 across sites. 513
Rice sites (n = 7) have average annual emissions across all sites of 16.7 ± 7.7 g C m-2 yr-1 and are characterized 514 by strong seasonal patterns, with either one or more CH4 emission peaks per year depending on the number of rice 515 seasons and field water management. One peak is typically observed during the reproductive period for the 516 continuously flooded sites with one rice season (i.e., US-HRC, JP-MSE) (Iwata et al., 2018; Runkle et al., 2019; 517 Hwang et al., 2020). For sites with only one rice season but with single or multiple drainage and re-flooding periods, 518 a secondary peak may appear before the reproductive peak (i.e., KR-CRK, IT-Cas, and US-HRA; Meijide et al., 2011; 519 Runkle et al., 2019; Hwang et al., 2020). Two reproductive peaks appear for sites with two rice seasons (i.e., PH-RiF), 520 and each reproductive peak may be accompanied by a secondary peak due to drainage events (Alberto et al., 2015). 521 Even sites with one, continuously flooded rice season may experience a second peak if the field is flooded during the 522 fallow season to provide habitat for migrating birds (e.g., US-Twt; Knox et al., 2016). 523
The dataset has one year of urban data from site UK-LBT in London, England. UK-LBT observes CH4 fluxes 524 from a 190 m tall communications tower in the center of London, and has a mean annual CH4 flux of 46.5 ± 5.6 g C 525 m-2 yr-1. This flux is more than twice as high as the mean annual CH4 flux across all FLUXNET-CH4 sites, 16.9 g C 526 m-2 yr-1. The London site has higher CH4 emissions in the winter compared to summer, which is attributed to a seasonal 527 increase in natural gas usage (Helfter et al., 2016.) 528

16
3.1.4 Saltwater and mangrove wetland CH4 characteristics 529
Three of the five saltwater wetlands in FLUXNET-CH4 (US-Edn, US-MRM, and US-Srr) have a very low 530 mean annual CH4 flux (see Table B2 for individual site-year CH4 flux sums and associated uncertainty) and minimal 531 seasonality. Two other FLUXNET-CH4 saltwater sites (US-La1 and US-StJ) have significantly higher fluxes, with 532 annual sums of 12.6 ± 0.6 and 9.6 ± 1.0 g C m-2 yr-1, respectively, while the mangrove site HK-MPM has annual mean 533 fluxes of 11.1 ± 0.5 g C m-2 yr-1. This range of CH4 fluxes across different saltwater ecosystems could be valuable for 534 exploring the effect of salinity and different biogeochemical pathways of CH4 production, oxidation, and transport of 535 CH4 (Bartlett et al., 1987; Poffenbarger et al., 2011). Saltwater wetlands along the coast have unique CH4 dynamics 536 attributable to the presence of abundant electron acceptors, most importantly sulphates, which inhibit methanogenesis 537 (Pattnaik et al., 2000; Mishra et al., 2003; Weston et al., 2006), but at low concentrations can have no effect (Chambers 538 et al., 2011) or even increase methanogenesis (Weston et al., 2011). In fact, estuarine wetlands with moderate salinity 539 can still be significant sources of CH4 (Liu et al., 2020). Even under sulfate-rich conditions, high CH4 production can 540 be found via methylotrophic methanogenesis (Dalcin Martins et al. 2017; Seyfferth et al., 2020,) or because the 541 processes of sulfate reduction and methanogenesis are spatially separated (Koebsch et al., 2019). Consequently, 542 representing the biophysical drivers of ecosystem-scale CH4 fluxes in non-freshwater wetlands is challenging and may 543 represent a combination of competing or confounding effects (Vazquez-Lule and Vargas 2021). 544
545
3.2 Wetland Representativeness 546
We evaluated the representativeness of freshwater wetland sites in the FLUXNET-CH4 Version 1.0 dataset 547 against wetlands globally based on bioclimatic conditions of our sites. When evaluating bioclimatic variables 548 individually, the distribution across the network was significantly different from the global distribution (alpha > 0.05; 549 two-tailed Kolmogorov-Smirnov tests; see Table B4). 550
When considering the four bioclimatic variables, MAT, LE, EVI and SRWI in a PCA, we found that our 551 tower network generally samples the bioclimatic conditions of global wetland cover, but some noticeable gaps remain 552 (Fig. 6). Three clusters of the world’s wetland-dense regions are identified, but are not equally sampled by the network. 553 A cluster of low temperature wetlands is sampled by a large number of high-latitude sites. The other two wetland 554 clusters are not as well sampled: a high temperature and LE cluster is represented only by two towers (ID-Pag and 555 MY-MLM), while drier and temperate and subtropical wetlands including large swathes of the Sahel in Africa only 556 have a site in Botswana (BW-Npw) as their closest-analog tower. 557 558

17
559
Figure 6: Principal Component Analysis displaying the distribution of freshwater wetland sites (points) along the two main 560 principal components together accounting for 91.9% of variance. Tower sites are represented as points with shapes 561 indicating their wetland type and color shade representing the annual methane (CH4) flux (gray points represent sites for 562 which <6 months of flux data was available to estimate annual budget). Sites codes are labeled in blue text for selected sites 563 deviating from average conditions. Loading variables are represented by the arrows: mean annual temperature (MAT), 564 simple ratio water index (SRWI), latent heat flux (LE) and enhanced vegetation index (EVI). The background shades of 565 gray are a qualitative representation of the density of global wetland pixels and their distribution in the PCA climate-space, 566 with darker color representing higher densities (excluding Greenland and Antarctica). Only grid cells with >5% average 567 wetland fraction according to the WAD2M over 2000-2018 are included (Zhang et al., 2020). The loading variables are 568 represented by the arrows: mean annual temperature (MAT), simple ratio water index (SRWI), latent heat flux (LE) and 569 enhanced vegetation index (EVI). 570
571
Evaluating the bioclimatic dissimilarity of global wetlands to the FLUXNET-CH4 network shows the least 572 captured regions are in the tropics (Fig. 7A). Sparse coverage in the tropics also means that the few existing towers 573 occupy a critical place in the network, particularly as tropical wetlands are the largest CH4 emitters (Bloom et al., 574 2017; Poulter et al., 2017). Highly dissimilar wetlands are limited in extent and distributed across all latitudes, but the 575 average dissimilarity is higher in north temperate (55° to 65°) and tropical (-5° to 5°) latitudes (Fig. 7B). To evaluate 576 the importance of individual towers in the network, we estimated the geographical area to which it is most analogous 577 in bioclimate-space (Fig. 7C). We found that some towers have disproportionately large constituencies (i.e., wetland 578 areas that share the same closest bioclimatic analog tower). Towers in Indonesia (ID-Pag), Brazilian Pantanal (BR-579 Npw), and Botswana floodplains (BW-Nxr) represent the closest climate analog for much of the tropics (678, 300 and 580 284 thousand km2, respectively) while CA-SCB represents a vast swath (291 thousand km2) of boreal/arctic regions 581 (Fig. 7D). 582
583

18
584
Figure 7: (a) Distance in bioclimatic space between global land surface and the FLUXNET-CH4 Version 1.0 tower network 585 (gray areas indicate no mapped wetlands). The Euclidean distance was computed on the four bioclimatic variables and was 586 then standardized by the average distance within-network. Most of the land surface has a dissimilarity score lower than 1, 587 meaning these areas are closer than the average tower distance (lower dissimilarity score means a similar bioclimate to that 588 represented by towers in the network). However, this pattern reflects more the sparsity of the tower network than a 589 similarity of the land surface to the network. Areas with <5% coverage by wetlands were excluded to focus on wetland-590 dense regions. (b) Latitudinal distribution of dissimilarity score, (c) Map of the four largest tower constituencies, (d) 591 Scatterplot of wetland area in each tower constituency plotted against the average dissimilarity score (point) and +/- 592 standard deviation (error bar). 593
Our assessment of wetland CH4 tower coverage determines the ability of our dataset to represent global 594 wetland distributions and highlights some clear representation gaps in the network, particularly in tropical and humid 595 regions. Other geographic regions such India, China and Australia, where towers exist but are not included in the 596 current network should be prioritized when expanding the network, even though they are not among the most distant 597 areas to the current network. Similar representativeness assessments have been developed for CO2 tower networks to 598 identify gaps and priorities for expansion (Jung et al., 2009). To improve the geographic coverage of the network for 599 representing global-scale fluxes, locations for new tower sites can be targeted to cover bio-climatically distant areas 600 from the current network (Villarreal et al., 2019). Candidate regions for expansion that are both high CH4 emitting 601 (Saunois et al., 2020) as well as located in under-sampled climates are: African Sahel, Amazon basin, Congo basin, 602 South-East Asia. Climatic conditions over boreal and arctic biomes are generally better represented (primarily at lower 603 elevations), but there is scope to expand the network in wetland-dense regions like the Hudson Bay Lowlands and 604 Northern Siberian Lowlands. Moreover, establishing sites in other ecosystem types, especially lakes and reservoirs 605 (see Deemer et al. 2016, Bastviken et al. 2011, Matthews et al. 2020) in most climatic zones would help capture CH4 606 fluxes from these ecosystems. 607
Understanding the representativeness of the network is essential when inferring general patterns of flux 608 magnitude, seasonality, and drivers from the tower data (Villarreal et al., 2018). We produced a first-order 609

19
representativeness of average bioclimatic conditions, but temporal representativeness (across seasons, climate 610 anomalies and extreme events) is particularly needed given the episodic nature of CH4 fluxes (Chu et al., 2017; 611 Mahecha et al., 2017; Göckede et al., 2019). 612
Assessing representation of wetland CH4 sites is complicated by the fact that wetlands occupy only a fraction 613 of most landscapes (except wetland dense regions such as Northern Siberian Lowlands, Hudson Bay Lowlands, Congo 614 basin, etc.) and that not all relevant factors affecting CH4 production and consumption could be considered in our 615 analysis. For instance, our assessment of representation did not consider wetland types as such maps are limited by 616 the inherent difficulties in remotely sensing wetland features (Gallant, 2015). The attribution of representativeness is 617 further complicated by the fact that many EC tower locations are subject to small-scale variability within the field of 618 view, or footprint, of the sensor. Consequently, the individual time steps within EC flux time series may represent a 619 mixture of different wetland types, or different fractions of wetland contribution to the total CH4 flux, varying with 620 wind direction, atmospheric stability, or season (Chu et al 2021). This further complicates upscaling efforts. 621 Additionally, this representativeness analysis did not apply weights to the drivers to reflect their varying influence on 622 CH4 flux. Such weights can be included in future versions as they are generated by a cross-validated machine learning 623 approach (Jung et al., 2020). Future efforts could include the dissimilarity index from this analysis as a metric of 624 extrapolation in a CH4 flux upscaling effort. 625
626
3.3 Freshwater wetland flux seasonality 627
3.3.1 Seasonal flux comparisons by latitudinal bands 628
CH4 flux and seasonality varied substantially across latitudinal bands (northern, temperate, subtropical, and 629 tropical) (Fig. 8). Annual CH4 fluxes for temperate, and subtropical sites were significantly higher than for northern 630 sites (8.7 ± 5.0, 29.7 ± 25.2, 40.1 ± 14.6, and 24.5 ± 20.7 g C m-2 yr-1 for northern, temperate, subtropical, and tropical, 631 respectively, p<0.0001 using Kruskal Wallis and post hoc comparisons; Fig. 8a), and tropical sites were similar to all 632 other latitudinal bands likely because of their small sample size. The ratio of seasonal amplitude to peak flux provides 633 a measure of the relative seasonal increase in emissions compared with baseline, where a ratio of zero indicates no 634 seasonal change in amplitude, a ratio of one indicates the off-season flux is zero, and values over one means the off-635 season baseline CH4 fluxes were negative (i.e., uptake). Average amplitude to peak flux ratios were similar across all 636 latitudinal bands (0.9 ± 0.1, 0.9 ± 0.1, 0.9 ± 0.1, 1.0 ± 0.7, for northern, temperate, subtropical, and tropical, 637 respectively; Fig. 8b). The spring increase in CH4 emissions began later in northern sites compared with temperate 638 and subtropical sites (end of May versus April, respectively, p=0.001; Fig. 8c), while tropical sites vary widely in 639 elevated emission season start date. Northern sites also had shorter elevated CH4 flux season lengths (138 ± 24 days) 640 compared to temperate sites (162 ± 32 days), and both were shorter than subtropical sites (209 ± 43 days; p<0.0001; 641 Fig. 8e). On average, CH4 flux peaked earlier for temperate sites compared to northern (p = 0.008) and subtropical 642 sites (p = 0.02; mid to late July compared with early August; Fig. 8f), while tropical sites again vary widely. Given 643 their unique seasonality, and low number of site-years (n = 9), tropical systems are discussed separately in Sect. 3.3.3, 644 and not included in the comparisons in the remainder of this section. While our results on CH4 seasonality corroborate 645 expected trends for these latitudinal bands, they provide some of the first estimates of CH4 seasonality parameters and 646 ranges across a global distribution of sites. 647 648 649

20
650 651 Figure 8: (a) Annual methane (CH4) flux (g C m-2 yr-1), (b) Ratio of seasonal amplitude to seasonal peak, where values of 0 652 indicate uniform annual CH4 flux, values of one indicate zero off-season fluxes, and values exceeding one indicate negative 653 off-season fluxes, (c) CH4 flux (FCH4) elevated emissions season start by day of year (DOY), (d) FCH4 elevated emissions 654 season end by DOY, (e) Length of elevated CH4 flux season (days), and (f) DOY of peak FCH4. Northern (dark blue, solid 655 line), Temperate (blue, dashed line), Sub-tropical (green, dot-dash line) and Tropical (light green, solid line) wetlands 656 plotted using the kernel density function. Each panel has lines that represent latitudinal bands as follows: northern (> 60°), 657 temperate (between 40° and 60°), subtropical (between 20° and 40°), and tropical (< 20°), though the site-year totals vary 658 between these groups (n = 57, n = 36, n = 39, and n = 9 respectively). All total CH4 flux values and elevated season start 659 values are positive, and the apparent continuation of the data distribution into negative values is an artifact of the kernel 660 density function. Southern Hemisphere sites below 20° S were shifted by 182 days to make summer the middle of the year 661 for comparability with Northern Hemisphere sites. 662 663
We found that latitudinal groups showed strong differences in absolute CH4 flux across quarters, and narrower 664 differences in percentage of annual CH4 flux (Fig. 9a versus 9b). Thus, the AMJ quarter had a similar relative 665 contribution to the annual CH4 flux across latitudes, regardless of the absolute annual CH4 flux. CH4 fluxes (Fig. 9a) 666 were highest during JAS for northern, temperate, and subtropical sites and highest in AMJ and JAS for temperate sites 667 (p<0.01). Though CH4 fluxes in northern sites are most commonly measured during warm summer months (Sachs et 668 al., 2010; Parmentier et al., 2011), fluxes in JFM and OND (50% of the yearly duration) on average make up 18.1 ± 669 3.6%, 15.3 ± 0.1%, and 31.2 ± 0.1% (northern, temperate, subtropical, respectively) of annual emissions. This pattern 670 indicates that a substantial fraction of annual CH4 fluxes occurs during cooler months. The contribution of non-671

21
growing season CH4 emissions to annual CH4 fluxes has previously been described for arctic and boreal regions (Zona 672 et al., 2016; Treat et al., 2018) and our analysis suggests comparable contributions in temperate and subtropical 673 systems for the same quarterly periods. 674
675 676 677
678 679 Figure 9: (a) Quarterly contribution to total annual CH4 flux in g C m-2, and (b) percentage of annual CH4 flux. Sites 680 were divided into northern (> 60° N), temperate (40° N - 60° N), and subtropical (20° N - 40° N). Quarters with 681 continuous data gaps exceeding 30 days were excluded. We used the following quarterly periods: 682 January/February/March (JFM), April/May/June (AMJ), July/August/September (JAS), and 683 October/November/December (OND). Tropical sites are discussed separately in Sect. 3.3.3 because of their unique 684 seasonality and low number of sites. 685 686
3.3.2 Predictors of CH4 flux phenology 687
The start of the elevated CH4 flux season, and how long the elevated flux season lasts, correlated strongly 688 with mean annual air temperature (Fig. 10; p<0.0001 for each). Methane flux began to increase roughly two months 689 earlier in the warmest systems (mean annual temperature > 20 °C) compared to the coldest (mean annual 690 temperature near -10 °C), though several of the warmer sites had high variability. Our data suggest that the CH4 691 season started 2.8 ± 0.5 days earlier for every degree Celsius increase in mean annual temperature (Fig. 10a). In 692 contrast, the end of the CH4 emission season was not correlated with mean annual temperature, but a positive trend 693 existed despite high variability in warmest and coldest sites (Fig. 10b). The high variability seen in the end of CH4 694 season at northern sites is important to note and would likely be better resolved by incorporating other seasonality or 695 phenological characteristics, such as moisture, active layer depth, and plant community composition (e.g., Kittler et 696 al., 2017). Plants with aerenchymatous tissue, for example, influence the timing of plant-mediated CH4 flux and are 697 a key source of uncertainty while predicting CH4 seasonality for northern wetlands (Xu et al., 2016, Kwon et al., 698 2017). Despite the relative lack of trend with season end date, the season length was still positively correlated with 699 mean annual temperature, with the warmest sites having roughly three more months of seasonally elevated CH4 700 emissions than the coldest sites (Fig. 10c). CH4 season length increased 3.6 ± 0.6 days for every degree Celsius 701 increase in mean annual temperature (note that these relationships are correlations, and we cannot disentangle 702

22
causality with this analysis). Temperature is highly correlated with other parameters (i.e., radiation, days of snow 703 cover, etc.), so CH4 flux is also likely to correlate with other environmental parameters. 704
705
Figure 10. The (a) start of the elevated methane (CH4) emission season (y = -2.8x + 130, with ‘x’ in °C and ‘y’ in day of 706 year (DOY)), (b) the end of the elevated emission season in DOY, and (c) the length of the emission season with mean 707 annual site air temperature (y = 3.6x + 176.6, with ‘x’ in °C and ‘y’ in days). Each point represents a site-year of data and 708 all reported r2 are significant to p < 0.0001. Tropical sites are discussed separately in Sect. 3.3.3. 709
Although the spring onset of increasing CH4 emissions correlated with mean annual air temperature, on 710 average it lagged the spring increase in the shallowest soil temperatures by 31 ± 40 days (Fig. 11, lag is significantly 711 different than zero, p < 0.001), with very few instances of CH4 emissions beginning before seasonal soil 712 temperatures increase (and by 20 ± 50 days for the deepest temperature probes). In contrast, for roughly half of the 713 sites, CH4 emission increased prior to seasonal GPP (a proxy for fresh substrate availability) increases. This 714 suggests that the initiation of increased CH4 fluxes at the beginning of the season was not limited by availability of 715 substrate derived from recent photosynthate. Additionally, the onset of CH4 fluxes tended to occur closer to the 716 onset of soil temperature increase for cooler temperature sites (sites with later start dates tend to be cooler; Fig. 11a). 717 This result is likely attributable to the direct influence of increased temperature on microbial processes (Chadburn et 718 al., 2020), as well as the indirect influences of snow melt, both via release of CH4 from the snowpack as well as a 719 higher water table leading to more CH4 production (Hargreaves et al., 2001; Tagesson et al., 2012; Mastepanov et 720 al., 2013; Helbig et al., 2017). These observed trends hold for the entire temperature or GPP range of freshwater 721 wetland sites, but are not necessarily applicable within individual latitudinal bands. 722
723
724
23
Figure 11. Relationship between the onset of the onset of the methane (CH4) emission season to (a) the beginning of the air 725 warming by day of year (DOY), (b) soil warming at the shallowest probe depth per site by DOY, and (c) gross primary 726 productivity (GPP) increase for the subset of sites with soil temperature data by DOY. Each point represents a site-year 727 of data. Dashed lines represent a 1:1 relationship, solid lines are significant (p < 0.05) regression fits. On average, the 728 CH4 emission season lags the soil temperature increase by 31 ± 40 days, and is more synchronous with GPP. 729
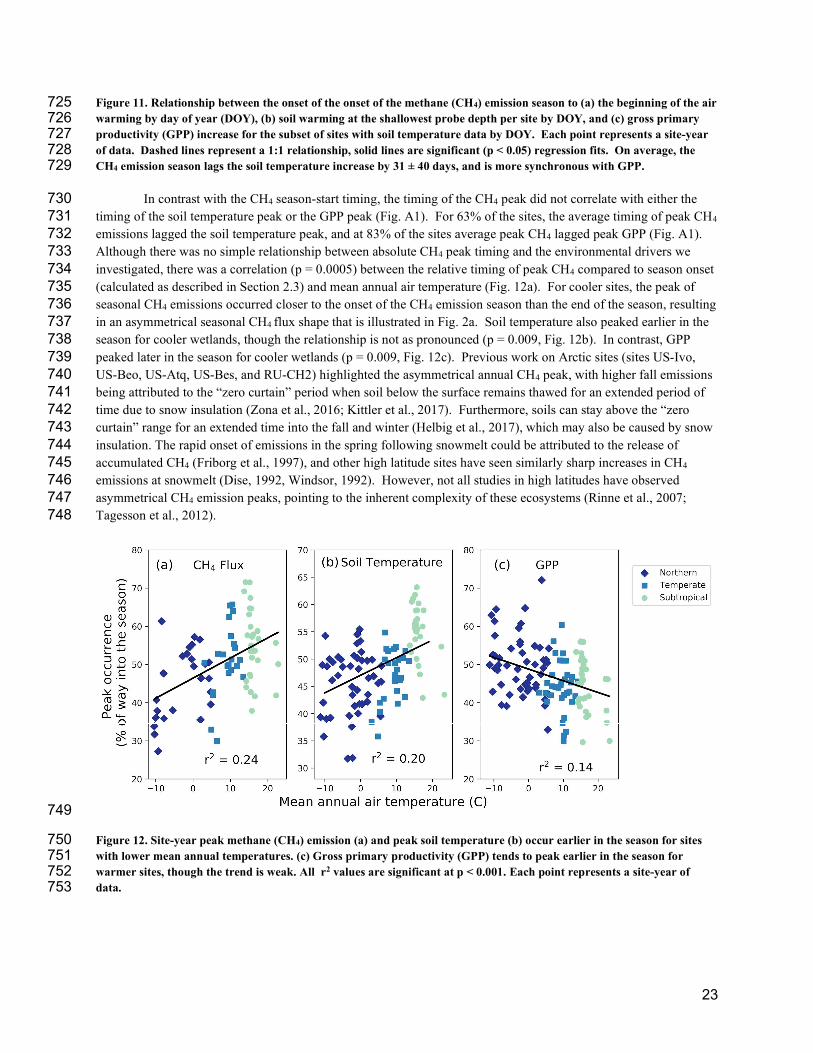
In contrast with the CH4 season-start timing, the timing of the CH4 peak did not correlate with either the 730 timing of the soil temperature peak or the GPP peak (Fig. A1). For 63% of the sites, the average timing of peak CH4 731 emissions lagged the soil temperature peak, and at 83% of the sites average peak CH4 lagged peak GPP (Fig. A1). 732 Although there was no simple relationship between absolute CH4 peak timing and the environmental drivers we 733 investigated, there was a correlation (p = 0.0005) between the relative timing of peak CH4 compared to season onset 734 (calculated as described in Section 2.3) and mean annual air temperature (Fig. 12a). For cooler sites, the peak of 735 seasonal CH4 emissions occurred closer to the onset of the CH4 emission season than the end of the season, resulting 736 in an asymmetrical seasonal CH4 flux shape that is illustrated in Fig. 2a. Soil temperature also peaked earlier in the 737 season for cooler wetlands, though the relationship is not as pronounced (p = 0.009, Fig. 12b). In contrast, GPP 738 peaked later in the season for cooler wetlands (p = 0.009, Fig. 12c). Previous work on Arctic sites (sites US-Ivo, 739 US-Beo, US-Atq, US-Bes, and RU-CH2) highlighted the asymmetrical annual CH4 peak, with higher fall emissions 740 being attributed to the “zero curtain” period when soil below the surface remains thawed for an extended period of 741 time due to snow insulation (Zona et al., 2016; Kittler et al., 2017). Furthermore, soils can stay above the “zero 742 curtain” range for an extended time into the fall and winter (Helbig et al., 2017), which may also be caused by snow 743 insulation. The rapid onset of emissions in the spring following snowmelt could be attributed to the release of 744 accumulated CH4 (Friborg et al., 1997), and other high latitude sites have seen similarly sharp increases in CH4 745 emissions at snowmelt (Dise, 1992, Windsor, 1992). However, not all studies in high latitudes have observed 746 asymmetrical CH4 emission peaks, pointing to the inherent complexity of these ecosystems (Rinne et al., 2007; 747 Tagesson et al., 2012). 748
749
Figure 12. Site-year peak methane (CH4) emission (a) and peak soil temperature (b) occur earlier in the season for sites 750 with lower mean annual temperatures. (c) Gross primary productivity (GPP) tends to peak earlier in the season for 751 warmer sites, though the trend is weak. All r2 values are significant at p < 0.001. Each point represents a site-year of 752 data. 753

24
3.3.3 Uniqueness of tropical wetlands 754
Tropical wetlands typically do not experience the large swings in temperature and GPP that contribute to 755 CH4 flux seasonality in temperate and northern sites. Indeed, the relatively constant high temperatures and high 756 GPP in tropical ecosystems may lead to the lower ratio between seasonal amplitude and peak CH4 flux compared 757 with temperate and northern sites (Fig. 8b). Tropical flux sites have historically been under-studied, leading to a 758 lack of synthesized information about these ecosystems. FLUXNET-CH4 has five tropical wetland sites (latitude 759 between 20° S and 20° N), and one tropical rice site, representing 13 site-years of data. These sites are especially 760 insightful as they provide the first estimates of CH4 fluxes from tropical, large seasonal floodplain systems. 761 762 We found a broad range of annual CH4 fluxes across tropical sites in FLUXNET-CH4 Version 1.0. Annual 763 CH4 flux emissions from two Southeast Asian flooded peat forests were relatively low, 0.01 ± 0.1 and 9.5 ± 0.6 g C 764 m-2 yr-1 for ID-PAG and MY-MLM, respectively, which is consistent with annual CH4 fluxes measured at another 765 peat forest in Indonesia (Deshmukh et al., 2020). In contrast, mean annual CH4 flux for a seasonally flooded swamp 766 in the Brazilian Pantanal region (BR-NPW) was over twice as high as MY-MLM, at 19.2 ± 2.5 g C m-2 yr-1. 767 Similarly high annual CH4 fluxes were observed at the two Botswana swamp sites in the Okavango Delta (51.7 ± 768 10.6 and 47.3 ± 3.7 g C m-2 yr-1 for BW-GUM and BW-NXR, respectively), one of which is seasonally inundated 769 and surrounded by grassland (BW-NXR) and the other is a permanently flooded lagoon covered in a floating 770 papyrus mat (BW-GUM). The relatively low fluxes found at the two Southeast Asian peat forest sites indicate that 771 these ecosystems may be smaller CH4 sources than expected, given their location in the humid tropics. Even the 772 higher-emitting tropical sites in Brazil and Botswana are still well within the range of annual CH4 flux typical in 773 cooler latitudes (Fig. 1). 774
In addition to having highly variable CH4 flux magnitudes, the tropical sites differ from each other in their 775 seasonality. CH4 flux hit a minimum around July for two sites (BW-GUM, latitude 18.965 °S and MY-MLM, latitude 776 1.46 °N), while CH4 flux increased through July and the subsequent months for the other Botswana site, BW-NXR 777 (latitude 19.548 °S). Site ID-Pag (latitude 2.32 °S) had minimal seasonality, whereas the flooded forest site in Brazil 778 (BR-NPW, latitude 16.49 °S ) had near-zero fluxes from approximately July to January, and consistently high fluxes 779 for the remainder of the year. The rice site PH-RiF (latitude 14.14 °N) had two annual CH4 flux peaks, which is 780 consistent with some other rice sites and likely reflects management practices. Baseline CH4 flux values also differed, 781 with the two Botswana sites having the highest off-season fluxes (29 and 133 nmol m-2 s-1 for BW-NXR and BW-782 GUM, respectively, estimated by Timesat), MY-MLM having an intermediate baseline CH4 flux (16 nmol m-2 s-1, 783 estimated by Timesat), and the remainder of the sites having essentially zero flux at baseline. While more tropical 784 wetland data will be needed to extract broad scale conclusions about these ecosystems, the six tropical sites in 785 FLUXNET-CH4 provide an important starting point for synthesis studies and highlight tropical wetland CH4 786 variability. 787
788
4.0 Data Availability 789
Half-hourly and daily aggregations are available for download at https://fluxnet.org/data/fluxnet-ch4-790 community-product/, along with a table containing site metadata compiled from Table B3. Variable descriptions and 791 units are provided in Table B1, and at https://fluxnet.org/data/fluxnet-ch4-community-product/. Each site has a unique 792 FLUXNET-CH4 DOI as listed in Table B3. All site data used in this analysis are available under the CC BY 4.0 793 (https://creativecommons.org/licenses/by/4.0/) copyright policy (2 additional sites in FLUXNET-CH4 are available 794 under the more restrictive Tier 2 data policy, https://fluxnet.org/data/data-policy/; these sites are not used in our 795 analysis). The individual site DOIs are provided below in Table 2. All seasonality parameters used in these analyses 796 are available at https://doi.org/10.5281/zenodo.4672601. 797
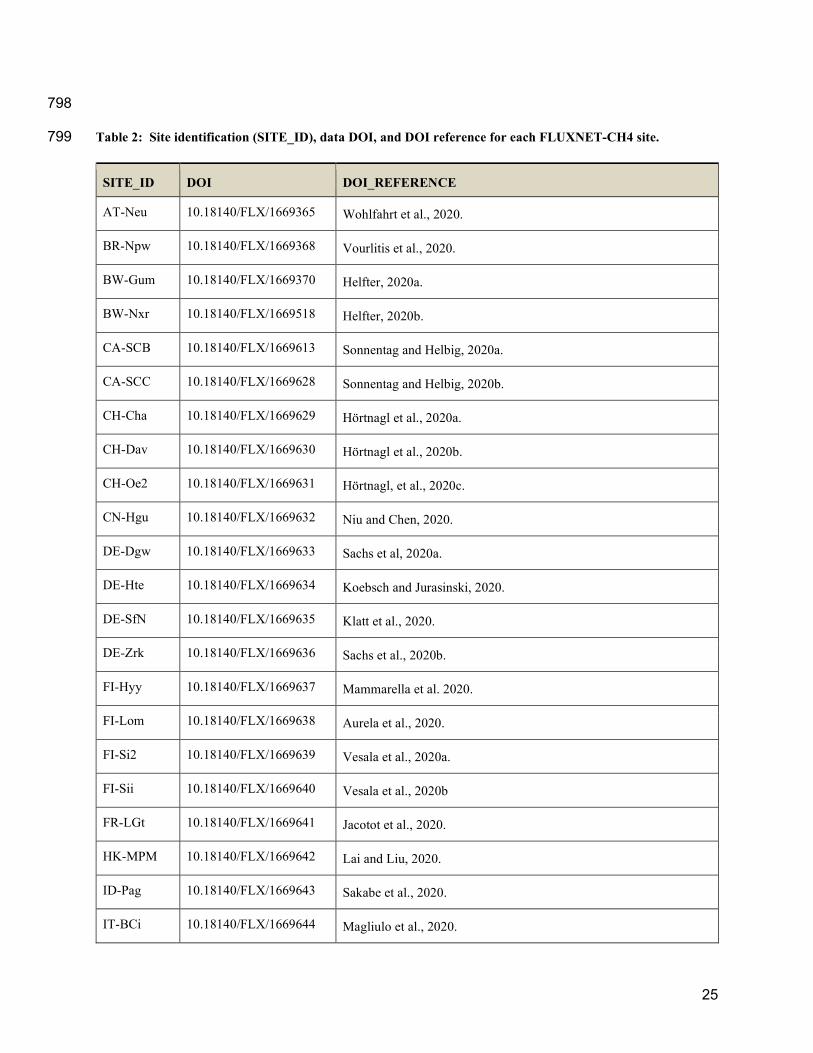
25
798
Table 2: Site identification (SITE_ID), data DOI, and DOI reference for each FLUXNET-CH4 site. 799
SITE_ID DOI DOI_REFERENCE
AT-Neu 10.18140/FLX/1669365 Wohlfahrt et al., 2020.
BR-Npw 10.18140/FLX/1669368 Vourlitis et al., 2020.
BW-Gum 10.18140/FLX/1669370 Helfter, 2020a.
BW-Nxr 10.18140/FLX/1669518 Helfter, 2020b.
CA-SCB 10.18140/FLX/1669613 Sonnentag and Helbig, 2020a.
CA-SCC 10.18140/FLX/1669628 Sonnentag and Helbig, 2020b.
CH-Cha 10.18140/FLX/1669629 Hörtnagl et al., 2020a.
CH-Dav 10.18140/FLX/1669630 Hörtnagl et al., 2020b.
CH-Oe2 10.18140/FLX/1669631 Hörtnagl, et al., 2020c.
CN-Hgu 10.18140/FLX/1669632 Niu and Chen, 2020.
DE-Dgw 10.18140/FLX/1669633 Sachs et al, 2020a.
DE-Hte 10.18140/FLX/1669634 Koebsch and Jurasinski, 2020.
DE-SfN 10.18140/FLX/1669635 Klatt et al., 2020.
DE-Zrk 10.18140/FLX/1669636 Sachs et al., 2020b.
FI-Hyy 10.18140/FLX/1669637 Mammarella et al. 2020.
FI-Lom 10.18140/FLX/1669638 Aurela et al., 2020.
FI-Si2 10.18140/FLX/1669639 Vesala et al., 2020a.
FI-Sii 10.18140/FLX/1669640 Vesala et al., 2020b
FR-LGt 10.18140/FLX/1669641 Jacotot et al., 2020.
HK-MPM 10.18140/FLX/1669642 Lai and Liu, 2020.
ID-Pag 10.18140/FLX/1669643 Sakabe et al., 2020.
IT-BCi 10.18140/FLX/1669644 Magliulo et al., 2020.

26
IT-Cas 10.18140/FLX/1669645 Manca and Goded, 2020.
JP-BBY 10.18140/FLX/1669646 Ueyama et al., 2020.
JP-Mse 10.18140/FLX/1669647 Iwata, 2020a.
JP-SwL 10.18140/FLX/1669648 Iwata, 2020b.
KR-CRK 10.18140/FLX/1669649 Ryu et al., 2020.
MY-MLM 10.18140/FLX/1669650 Tang et al., 2020.
NL-Hor 10.18140/FLX/1669651 Dolman et al., 2020a.
NZ-Kop 10.18140/FLX/1669652 Campbell and Goodrich, 2020.
PH-RiF 10.18140/FLX/1669653 Alberto and Wassmann, 2020.
RU-Ch2 10.18140/FLX/1669654 Goeckede, 2020.
RU-Che 10.18140/FLX/1669655 Merbold et al., 2020.
RU-Cok 10.18140/FLX/1669656 Dolman et al., 2020b.
RU-Fy2 10.18140/FLX/1669657 Varlagin, 2020.
SE-Deg 10.18140/FLX/1669659 Nilsson and Peichl, 2020.
UK-LBT 10.18140/FLX/1670207 Helfter, 2020c.
US-A03 10.18140/FLX/1669661 Billesbach and Sullivan, 2020a.
US-A10 10.18140/FLX/1669662 Billesbach and Sullivan, 2020b.
US-Atq 10.18140/FLX/1669663 Zona and Oechel, 2020a.
US-Beo 10.18140/FLX/1669664 Zona and Oechel, 2020b.
US-Bes 10.18140/FLX/1669665 Zona and Oechel, 2020c.
US-Bi1 10.18140/FLX/1669666 Rey-Sanchez et al., 2020a.
US-Bi2 10.18140/FLX/1669667 Rey-Sanchez et al., 2020b.
US-BZB 10.18140/FLX/1669668 Euskirchen and Edgar, 2020a.
US-BZF 10.18140/FLX/1669669 Euskirchen and Edgar, 2020b.
US-BZS 10.18140/FLX/1669670 Euskirchen and Edgar, 2020c.

27
US-CRT 10.18140/FLX/1669671 Chen and Chu, 2020a.
US-DPW 10.18140/FLX/1669672 Hinkle and Bracho, 2020.
US-EDN 10.18140/FLX/1669673 Oikawa, 2020.
US-EML 10.18140/FLX/1669674 Schuur, 2020.
US-Ho1 10.18140/FLX/1669675 Richardson and Hollinger, 2020.
US-HRA 10.18140/FLX/1669676 Runkle et al., 2020.
US-HRC 10.18140/FLX/1669677 Reba et al., 2020.
US-ICs 10.18140/FLX/1669678 Euskirchen et al., 2020d.
US-Ivo 10.18140/FLX/1669679 Zona and Oechel, 2020d.
US-LA1 10.18140/FLX/1669680 Holm et al., 2020a.
US-LA2 10.18140/FLX/1669681 Holm et al., 2020b.
US-Los 10.18140/FLX/1669682 Desai and Thom, 2020a.
US-MAC 10.18140/FLX/1669683 Sparks, 2020.
US-MRM 10.18140/FLX/1669684 Schafer, 2020.
US-Myb 10.18140/FLX/1669685 Matthes et al., 2020.
US-NC4 10.18140/FLX/1669686 Noormets et al., 2020.
US-NGB 10.18140/FLX/1669687 Torn and Dengel, 2020a.
US-NGC 10.18140/FLX/1669688 Torn and Dengel, 2020b.
US-ORv 10.18140/FLX/1669689 Bohrer and Morin, 2020a.
US-OWC 10.18140/FLX/1669690 Bohrer et al., 2020b.
US-PFa 10.18140/FLX/1669691 Desai and Thom, 2020b.
US-Snd 10.18140/FLX/1669692 Detto et al., 2020.
US-Sne 10.18140/FLX/1669693 Short et al., 2020.
US-Srr 10.18140/FLX/1669694 Windham-Myers et al., 2020.
US-StJ 10.18140/FLX/1669695 Vazquez-Lule and Vargas, 2020.

28
US-Tw1 10.18140/FLX/1669696 Valach et al., 2020a.
US-Tw3 10.18140/FLX/1669697 Chamberlain et al., 2020.
US-Tw4 10.18140/FLX/1669698 Eichelmann et al., 2020.
US-Tw5 10.18140/FLX/1669699 Valach et al., 2020b.
US-Twt 10.18140/FLX/1669700 Knox et al., 2020.
US-Uaf 10.18140/FLX/1669701 Iwata et al., 2020c.
US-WPT 10.18140/FLX/1669702 Chen and Chu, 2020b.
800
801
802
5.0 Conclusions 803
The breadth and scope of CH4 flux data in the FLUXNET-CH4 dataset make it possible to study the global 804 patterns of CH4 fluxes, particularly for global freshwater wetlands which release a substantial fraction of 805 atmospheric CH4. To help data users understand seasonal patterns within the dataset, we provide the first global 806 estimates of CH4 flux patterns and predictors in CH4 seasonality using freshwater wetland data. In the seasonality 807 analysis, we find that, on average, the seasonal increase in CH4 emissions begins about three months earlier and lasts 808 about four months longer at the warmest sites compared with the coolest sites. We also find that the beginning of the 809 CH4 emission season lags the beginning of seasonal soil warming by approximately one month, with almost no 810 instances of CH4 emissions increasing before temperature increases. Additionally, roughly half the sites have CH4 811 emissions increasing prior to GPP increase; highlighting the importance of substrate versus temperature limitations 812 on wetland CH4 emissions. Furthermore, relative to warmer climates, wetland CH4 emissions in cooler climates 813 increase faster in the warming season and decrease slower in the cooling season. This phenomenon has previously 814 been noted on a regional scale and we show that it persists at the global scale. Constraining the seasonality of CH4 815 fluxes on a global scale can help improve the accuracy of global wetland models. 816
FLUXNET-CH4 is an important new resource for the research community, but critical data gaps and 817 opportunities remain. The current FLUXNET-CH4 dataset is biased towards sites in boreal and temperate regions, 818 which influence the relationships presented in our analyses. Tropical ecosystems are estimated to account for 64% of 819 potential natural CH4 emissions (<30° N, Saunois et al., 2020) but only account for 13% of the FLUXNET-CH4 820 sites in the dataset. Unsurprisingly, tropical sites in our network do not represent the range of bioclimatic wetland 821 conditions present in the tropics. Therefore, while maintaining flux towers in tropical ecosystems is challenging, it is 822 necessary to further constrain the global CH4 cycle. Coastal wetlands are also poorly represented in FLUXNET-CH4 823 even though there is evidence of substantial CH4 emissions from these ecosystems, so better representation across 824 salinity gradients is warranted. Lastly, the average time series for FLUXNET-CH4 Version 1.0 is relatively short, 825 only 3.7 site-years on average compared with 7.2 for CO2 sites in FLUXNET (Pastorello et al., 2020). Adding 826 additional site-years of data from existing sites, as a complement to adding new sites, will increase the community’s 827 ability to explain interannual variability in CH4 emission and seasonality. Nevertheless, FLUXNET-CH4 is an 828 important and unprecedented resource with which to diagnose and understand drivers of the global CH4 cycle. 829

29
Author contribution 830
Kyle B. Delwiche oversaw the data release, performed the seasonality analysis, gathered metadata, and 831 prepared the manuscript with contributions from all co-authors. Sara Helen Knox gathered and standardized the 832 data, and gap-filled the CH4 flux data. Avni Malhotra prepared the manuscript and gathered metadata. Etienne 833 Fluet-Chouinard did the representativeness analysis and prepared the manuscript. Gavin McNicol gathered data and 834 prepared the manuscript. Robert B. Jackson oversaw the data collection, processing, analysis, and release. Danielle 835 Christianson and You-Wei Cheah oversaw the FLUXNET-CH4 dataset release on fluxnet.org. Dario Papale, 836 Eleonora Canfora, and Carlo Trotta did the data collection, curation, and pre-processing for all of the sites outside 837 North and South America. Remaining co-authors contributed eddy-covariance data to FLUXNET-CH4 dataset 838 and/or participated in editing the manuscript. 839
Competing interests 840
The authors declare that they have no conflict of interest. 841
Acknowledgements 842
We acknowledge primary support from the Gordon and Betty Moore Foundation (Grant GBMF5439, “Advancing 843 Understanding of the Global Methane Cycle”; Stanford University) and from the John Wesley Powell Center for 844 Analysis and Synthesis of the U.S. Geological Survey (“Wetland FLUXNET Synthesis for Methane” working 845 group). Benjamin R. K. Runkle was supported by the U.S. National Science Foundation CBET CAREER Award 846 1752083. Ankur R. Desai acknowledges support of the DOE AmeriFlux Network Management Project. Masahito 847 Ueyama was supported by ArCS II (JPMXD1420318865) and JSPS KAKENHI (20K21849). Dario Papale and Nina 848 Buchmann acknowledge the support of the RINGO (GA 730944) H2020 EU project. Nina Buchmann and Kathrin 849 Fuchs acknowledge the SNF project M4P (40FA40_154245/1) and InnoFarm (407340_172433). Nina Buchmann 850 acknowledges support from the SNF for ICOS-CH Phases 1 and 2 (20FI21_148992, 20FI20_173691). Carlo Trotta 851 acknowledges the support of the E-SHAPE (GA 820852) H2020 EU project. William J. Riley was supported by the 852 US Department of Energy, BER, RGCM, RUBISCO project under contract no. DEAC02-05CH11231. Jessica 853 Turner acknowledges support from NSF GRFP (DGE-1747503) and NTL LTER (DEB-1440297). Minseok Kang 854 was supported by the National Research Foundation of Korea (NRF-2018 R1C1B6002917). Carole Helfter 855 acknowledges the support of the UK Natural Environment Research Council (the Global Methane Budget project, 856 grant number NE/N015746/1). Rodrigo Vargas acknowledges support from the National Science Foundation 857 (1652594). Dennis Baldocchi acknowledges the California Department of Water Resources for a funding contract 858 from the California Department of Fish and Wildlife and the United States Department of Agriculture (NIFA grant 859 #2011-67003-30371), as well as the U.S. Department of Energy’s Office of Science (AmeriFlux contract #7079856) 860 for funding the AmeriFlux core sites. US-A03 and US-A10 are operated by the Atmospheric Radiation 861 Measurement (ARM) user facility, a U.S. Department of Energy Office of Science user facility managed by the 862 Biological and Environmental Research Program (doi:10.5439/1025039, doi:10.5439/1025274, 863 doi:10.5439/1095578). Work at ANL was supported by the U.S. Department of Energy, Office of Science, Office of 864 Biological and Environmental Research, under contract DE-AC02-06CH11357. Any use of trade, firm, or product 865 names is for descriptive purposes only and does not imply endorsement by the U.S. Government. The CH-Dav, DE-866 SfN, FI-Hyy, FI-Lom, FI-Sii, FR-LGt, IT-BCi, SE-Deg and SE-Sto sites are part of the ICOS European Research 867 Infrastructure. Oliver Sonnentag acknowledges funding by the Canada Research Chairs, Canada Foundation for 868 Innovation Leaders Opportunity Fund, and Natural Sciences and Engineering Research Council Discovery Grant 869 Programs for work at CA-SCC and CA-SCB. Benjamin Poulter acknowledges support from the NASA Carbon 870 Cycle and Ecosystems Program. Derrick Lai acknowledges the support of the Research Grants Council of the Hong 871 Kong Special Administrative Region, China (Project No. CUHK 458913).We thank Nathaniel Goenawan for his 872 help with the representativeness analysis. 873

30
References 874
Abdalla, M., Hastings, A., Truu, J., Espenberg, M., Mander, Ü, Smith, P. Emissions of methane from northern 875 peatlands: a review of management impacts and implications for future management options. Ecol. Evol., 6, 876 7080-7102. https://doi.org/10.1002/ece3.2469. 877
Alberto, M. C. R., Wassmann, R., Gummert, M., Buresh, R. J., Quilty, J. R., Correa, T. Q., Centeno, C. A. R., & 878 Oca, G. M. Straw incorporated after mechanized harvesting of irrigated rice affects net emissions of CH4 and 879 CO2 based on eddy covariance measurements. Field Crop. Res., 184, 162–175. 880 https://doi.org/10.1016/j.fcr.2015.10.004. 2015. 881
Alberto, M., & Wassmann, R. FLUXNET-CH4 PH-RiF Philippines Rice Institute flooded. Philippines. 882 https://doi:10.18140/FLX/1669653. 2020. 883
Anderson, D. E., Verma, S. B., & Rosenberg, N. J. Eddy correlation measurements of CO2, latent heat, and sensible 884 heat fluxes over a crop surface. Bound. Lay. Meteorol., 29(3), 263–272. https://doi.org/10.1007/bf00119792. 885 1984. 886
Anderson, F. E., Bergamaschi, B., Sturtevant, C., Knox, S., Hastings, L., Windham-Myers, L., Detto, M., Hestir, E. 887 L., Drexler, J., Miller, R. L., Matthes, J. H., Verfaillie, J., Baldocchi, D., Snyder, R. L., & Fujii R. Variation of 888 energy and carbon fluxes from a restored temperate freshwater wetland and implications for carbon market 889 verification protocols. J. of Geophys. Res. – Biogeo., 121(3), 777–795. https://doi.org/10.1002/2015JG003083. 890 2016. 891
Angle, J. C., Morin, T. H., Solden, L. M., Narrowe, A. B., Smith, G. J., Borton, M. A., Rey-Sanchez, C., Daly, R. 892 A., Mirfenderesgi, G., Hoyt, D. W., Riley, W. J., Miller, C. S., Bohrer, G., & Wrighton, K. C. Methanogenesis 893 in oxygenated soils is a substantial fraction of wetland methane emissions. Nat. Comm., 8(1), 1567. 894 https://doi.org/10.1038/s41467-017-01753-4. 2017. 895
Aurela, M., Lohila, A., J.-P., Hatakka, J., Rainne, J., Mäkelä, T., & Lauria, T. FLUXNET-CH4 FI-Lom 896 Lompolojankka. Finland. https://doi:10.18140/FLX/1669638. 2020. 897
Bartlett, K. B., Bartlett, D. S., Harriss, R. C., & Sebacher, D. I. Methane emissions along a salt marsh salinity 898 gradient. Biogeochemistry, 4(3), 183–202. https://doi.org/10.1007/bf02187365. 1987. 899
Bastviken, D., Tranvik, L. J., Downing, J. A., Crill, P. M., & Enrich-Prast, A. Freshwater methane emissions offset 900 the continental carbon sink. Science, 331(6013), 50. https://doi.org/10.1126/science.1196808. 2011. 901
Billesbach, D., & Sullivan, R. FLUXNET-CH4 US-A03 ARM-AMF3-Oliktok. United States. https:// 902 doi:10.18140/FLX/1669661. 2020a. 903
Billesbach, D., & Sullivan, R. FLUXNET-CH4 US-A10 ARM-NSA-Barrow. United States. 904 https://doi:10.18140/FLX/1669662. 2020b. 905
Bloom, A. A., Bowman, K. W., Lee, M., Turner, A. J., Schroeder, R., Worden, J. R., Weidner, R., McDonald, K. 906 C., & Jacob, D. J. A global wetland methane emissions and uncertainty dataset for atmospheric chemical 907 transport models (WetCHARTs version 1.0). Geosci. Model Dev., 10, 2141-2156. 908 https://doi.org/10.5194/gmd-10-2141-2017. 2017. 909
Bridgham, S. D., Cadillo-Quiroz, H., Keller, J. K., & Zhuang, Q. Methane emissions from wetlands: 910 biogeochemical, microbial, and modeling perspectives from local to global scales. Glob. Change Biol., 19(5), 911 1325–1346. https://doi.org/10.1111/gcb.12131. 2013. 912
Bohrer, G., & Morin, T. H. FLUXNET-CH4 US-ORv Olentangy River Wetland Research Park. United States. 913 https://doi:10.18140/FLX/1669689. 2020a. 914
Bohrer, G., Kerns, J., Morin, T. H., Rey-Sanchez, A. C., Villa, J., & Ju, Y. FLUXNET-CH4 US-OWC Old Woman 915 Creek. United States. https://doi:10.18140/FLX/1669690. 2020b. 916
Campbell, D., & Goodrich, J. FLUXNET-CH4 NZ-Kop Kopuatai. New Zealand. 917 https://doi:10.18140/FLX/1669652. 2020. 918
Castro-Morales, K., Kleinen, T., Kaiser, S., Zaehle, S., Kittler, F., Kwon, M. J., Beer, C., & Göckede, M. Year-919 round simulated methane emissions from a permafrost ecosystem in Northeast Siberia. Biogeosciences, 15(9), 920 2691–2722. https://doi.org/10.5194/bg-15-2691-2018. 2018. 921
Chadburn, S. E., Aalto, T., Aurela, M., Baldocchi, D., Biasi, C., Boike, J., Burke, E. J., Comyn‐Platt, E., Dolman, 922 A. J., Duran‐Rojas, & Others. Modeled microbial dynamics explain the apparent temperature sensitivity of 923 wetland methane emissions. Global Biogeochemical Cycles, 34(11). https://doi.org/10.1029/2020gb006678. 924 2020. 925

31
Chamberlain, S. D., Oikawa, P., Sturtevant, C., Szutu, D., Verfaillie, J., & Baldocchi, D. FLUXNET-CH4 US-Tw3 926 Twitchell Alfalfa. United States. https://doi:10.18140/FLX/1669697. 2020. 927
Chambers, L. G., Ramesh Reddy, K., & Osborne, T. Z. Short-Term Response of Carbon Cycling to Salinity Pulses 928 in a Freshwater Wetland. Soil Sci. Soc. Am. J., 75(5), 2000–2007. https://doi.org/10.2136/sssaj2011.0026. 929 2011. 930
Chang, K. Y., W. J. Riley, S. H. Knox, R. B. Jackson, G. McNicol, B. Poulter, M. Aurela, D. Baldocchi, S. Bansal, 931 G. Bohrer, D. I. Campbell, A. Cescatti, H. Chu, K. B. Delwiche, A. Desai, E. Euskirchen, T. Friborg, M. 932 Goeckede, G. Holm, M. Kang, T. Keenan, K. W. Krauss, A. Lohila, I. Mammarella, A. Miyata, M. B. Nilsson, 933 A. Noormets, D. Papale, B. R. K. Runkle, Y. Ryu, T. Sachs, K. V. R. Schäfer, H. P. Schmid, N. Shurpali, O. 934 Sonnentag, A. C. I. Tang, M. S. Torn, C. Trotta, M. Ueyama, R. Vargas, T. Vesala, L. Windham-Myers, Z. 935 Zhang, & D. Zona. Global wetland methane emissions have hysteretic responses to seasonal temperature. 936 Nature Communications [In press]. 2021 937
Chanton, J. P., Glaser, P. H., Chasar, L. S., Burdige, D. J., Hines, M. E., Siegel, D. I., Tremblay, L. B., & Cooper, 938 W. T. Radiocarbon evidence for the importance of surface vegetation on fermentation and methanogenesis in 939 contrasting types of boreal peatlands. Global Biogeochem. Cy., 22(4). https://doi.org/10.1029/2008gb003274. 940 2008. 941
Chen, J., & Chu, H. FLUXNET-CH4 US-CRT Curtice Walter-Berger cropland. United States. 942 https://doi:10.18140/FLX/1669671. 2020a. 943
Chen, J., & Chu, H. FLUXNET-CH4 US-WPT Winous Point North Marsh. United States. 944 https://doi:10.18140/FLX/1669702. 2020b. 945
Chu, H., Chen, J., Gottgens, J. F., Ouyang, Z., John, R., Czajkowski, K., & Becker, R. Net ecosystem methane and 946 carbon dioxide exchanges in a Lake Erie coastal marsh and a nearby cropland. J. Geophys. Res.: Biogeo., 947 119(5), 722–740. https://doi.org/10.1002/2013JG002520. 2014. 948
Chu, H., Baldocchi, D. D., John, R., Wolf, S., & Reichstein, M. Fluxes all of the time? A primer on the temporal 949 representativeness of FLUXNET. Journal of Geophysical Research: Biogeosciences, 122(2), 289–307. 950 https://doi.org/10.1002/2016JG003576. 2017. 951
Chu, H., Luo, X., Ouyang, Z., Chan, W. S., Dengel, S., Biraud, S. C., Torn, M. S., Metzger, S., Kumar, J., Arain, M. 952 A., & Others. Representativeness of Eddy-Covariance flux footprints for areas surrounding AmeriFlux sites. 953 Agricultural and Forest Meteorology, 301-302, 108350. https://doi.org/10.1016/j.agrformet.2021.108350. 954 2021. 955
Dalcin Martins, P., Hoyt, D. W., Bansal, S., Mills, C. T., Tfaily, M., Tangen, B. A., Finocchiaro, R. G., Johnston, 956 M. D., McAdams, B. C., Solensky, M. J., Smith, G. J., Chin, Y.-P., & Wilkins, M. J. Abundant carbon 957 substrates drive extremely high sulfate reduction rates and methane fluxes in Prairie Pothole Wetlands. Global 958 Change Biology, 23(8), 3107–3120. https://doi.org/10.1111/gcb.13633. 2017. 959
Dean, J. F., Middelburg, J. J., Röckmann, T., Aerts, R., Blauw, L. G., Egger, M., Jetten, M. S. M., de Jong, A. E. E., 960 Meisel, O. H., Rasigraf, O., Slomp, C. P., in’t Zandt, M. H., & Dolman, A. J. Methane Feedbacks to the Global 961 Climate System in a Warmer World. Rev. Geophys., 56(1), 207–250. https://doi.org/10.1002/2017rg000559. 962 2018. 963
Deemer, B. R., Harrison, J. A., Li, S., Beaulieu, J. J., DelSontro, T., Barros, N., Bezerra-Neto, J. F., Powers, S. M., 964 Dos Santos, M. A., & Vonk, J. A. Greenhouse Gas Emissions from Reservoir Water Surfaces: A New Global 965 Synthesis. Bioscience, 66(11), 949–964. https://doi.org/10.1093/biosci/biw117. 2016. 966
Dengel, S., Zona, D., Sachs, T., Aurela, M., Jammet, M., Parmentier, F.-J. W., Oechel, W., & Vesala, T. Testing the 967 applicability of neural networks as a gap-filling method using CH4 flux data from high latitude wetlands. 968 Biogeosciences, 10, 8185–8200. https://doi.org/10.5194/bg-10-8185-2013. 2013. 969
Deshmukh, C. S., Julius, D., Evans, C. D., Nardi, Susanto, A. P., Page, S. E., Gauci, V., Laurén, A., Sabiham, S., 970 Agus, F., Asyhari, A., Kurnianto, S., Suardiwerianto, Y., & Desai, A. R. Impact of forest plantation on 971 methane emissions from tropical peatland. Glob. Change Biol., 26, 2477-2495. 972 https://doi.org/10.1111/gcb.15019. 2020. 973
Desai, A. R., & Thom, J. FLUXNET-CH4 US-Los Lost Creek. United States. https://doi:10.18140/FLX/1669682. 974 2020a. 975
Desai, A. R., & Thom, J. FLUXNET-CH4 US-PFa Park Falls/WLEF. United States. 976 https://doi:10.18140/FLX/1669691. 2020b. 977
Desjardins, R. L. A technique to measure CO2 exchange under field conditions. Int. J. Biometeorol., 18(1), 76–83. 978 https://doi.org/10.1007/bf01450667. 1974. 979
Detto, M., Sturtevant, C., Oikawa, P., Verfaillie, J., & Baldocchi, D. FLUXNET-CH4 US-Snd Sherman Island. 980 United States. https://doi:10.18140/FLX/1669692. 2020. 981

32
Dise, N. Winter fluxes of methane from Minnesota peatlands. Biogeochemistry, 17(2). 982 https://doi.org/10.1007/bf00002641. 1992. 983
Dolman, H., Hendriks, D., Parmentier, F.-J., Marchesini, L. B., Dean, J., & van Huissteden, K. FLUXNET-CH4 984 NL-Hor Horstermeer. Netherlands. https://doi:10.18140/FLX/1669651. 2020a. 985
Dolman, H., van der Molen, H., Parmentier, F.-J., Marchesini, L. B., Dean, J., van Huissteden, K., & Maximov, T. 986 FLUXNET-CH4 RU-Cok Chokurdakh. Russian Federation. https://doi:10.18140/FLX/1669656. 2020b. 987
Eichelmann, E., Knox, S., Rey Sanchez, C., Valach, A., Sturtevant, C., Szutu, D., Verfaillie, J., & Baldocchi, D. 988 FLUXNET-CH4 US-Tw4 Twitchell East End Wetland. United States. https://doi:10.18140/FLX/1669698. 989 2020. 990
Eklundh, L., & Jönsson, P. TIMESAT: A Software Package for Time-Series Processing and Assessment of 991 Vegetation Dynamics. Remote Sensing Time Series (pp. 141–158). https://doi.org/10.1007/978-3-319-15967-992 6_7. 2015. 993
Etheridge, D. M., Steele, L. P., Francey, R. J., & Langenfelds, R. L. Atmospheric methane between 1000 A.D. and 994 present: Evidence of anthropogenic emissions and climatic variability. J. Geophys. Res. – Atmos., 103(D13), 995 15979–15993. https://doi.org/10.1029/98jd00923. 1998. 996
Etminan, M., Myhre, G., Highwood, E. J., & Shine, K. P. Radiative forcing of carbon dioxide, methane, and nitrous 997 oxide: A significant revision of the methane radiative forcing. Geophys. Res. Lett., 43(24), 12,614–12,623. 998 https://doi.org/10.1002/2016gl071930. 2016. 999
Euskirchen, E., & Edgar, C. FLUXNET-CH4 US-BZB Bonanza Creek Thermokarst Bog. United States. 1000 https://doi:10.18140/FLX/1669668. 2020a. 1001
Euskirchen, E., & Edgar, C. FLUXNET-CH4 US-BZF Bonanza Creek Rich Fen. United States. 1002 https://doi:10.18140/FLX/1669669. 2020b. 1003
Euskirchen, E., & Edgar, C. FLUXNET-CH4 US-BZS Bonanza Creek Black Spruce. United States. 1004 https://doi:10.18140/FLX/1669670. 2020c. 1005
Euskirchen, E., Bret-Harte, M., & Edgar, C Marion Bret-Harte. FLUXNET-CH4 US-ICs Imnavait Creek 1006 Watershed Wet Sedge Tundra. United States. https://doi:10.18140/FLX/1669678. 2020d. 1007
Gallant, A. The Challenges of Remote Monitoring of Wetlands. Remote Sensing, 7(8), 10938–10950. 1008 https://doi.org/10.3390/rs70810938. 2015. 1009
Göeckede, M., Kittler, F., & Schaller, C. Quantifying the impact of emission outbursts and non-stationary flow on 1010 eddy covariance CH4 flux measurements using wavelet techniques. Biogeosciences, 16(16), 3113–3131. 1011 https://doi.org/10.5194/bg-16-3113-2019. 2019. 1012
Goeckede, M. FLUXNET-CH4 RU-Ch2 Chersky reference. Russian Federation. 1013 https://doi:10.18140/FLX/1669654. 2020. 1014
Gu, L., Post, W. M., Baldocchi, D. D., Andrew Black, T., Suyker, A. E., Verma, S. B., Vesala, T., & Wofsy, S. C. 1015 Characterizing the Seasonal Dynamics of Plant Community Photosynthesis Across a Range of Vegetation 1016 Types. In: Noormets A. (eds) Phenology of Ecosystem Processes. Springer, New York, NY. pp. 35–58. 1017 https://doi.org/10.1007/978-1-4419-0026-5_2. 2009. 1018
Hargreaves, K. J., Fowler, D., Pitcairn, C. E. R., & Aurela, M. Annual methane emission from Finnish mires 1019 estimated from eddy covariance campaign measurements. Theor. Appl. Climatol., 70, 203–213. 1020 https://doi.org/10.1007/s007040170015. 2001. 1021
Hargrove, W. W., Hoffman, F. M., & Law, B. E. New analysis reveals representativeness of the AmeriFlux 1022 network. Eos, Transactions American Geophysical Union, 84(48), 529. 1023 https://doi.org/10.1029/2003EO480001. 2003. 1024
Hatala, J. A., Detto, M., & Baldocchi, D. D. Gross ecosystem photosynthesis causes a diurnal pattern in methane 1025 emission from rice. Geophys. Res. Lett., 39(6). https://doi.org/10.1029/2012gl051303. 2012. 1026
Helbig, M., Quinton, W. L., & Sonnentag, O. Warmer spring conditions increase annual methane emissions from a 1027 boreal peat landscape with sporadic permafrost. Environ. Res. Lett., 12(11), 115009. 1028 https://doi.org/10.1088/1748-9326/aa8c85. 2017. 1029
Helfter, C., Tremper, A. H., Halios, C. H., Kotthaus, S., Bjorkegren, A., Grimmond, C. S. B., Barlow, J. F., & 1030 Nemitz, E. Spatial and temporal variability of urban fluxes of methane, carbon monoxide and carbon dioxide 1031 above London, UK. Atmos. Chem. Phys. 16, 10543-10557. https://doi.org/10.5194/acp-2016-216-ac1. 2016. 1032
Helfter, C. FLUXNET-CH4 BW-Gum Guma. Botswana. https://doi:10.18140/FLX/1669370. 2020a. 1033 Helfter, C. FLUXNET-CH4 BW-Nxr Nxaraga. Botswana. https://doi:10.18140/FLX/1669518. 2020b. 1034 Helfter, C. FLUXNET-CH4 UK-LBT London_BT. United Kingdom. https://doi:10.18140/FLX/1670207. 2020c. 1035 Hinkle, C. R., & Bracho, R. FLUXNET-CH4 US-DPW Disney Wilderness Preserve Wetland. United States. 1036
https://doi:10.18140/FLX/1669672. 2020. 1037

33
Hoffman, F. M., Kumar, J., Mills, R. T., & Hargrove, W. W. Representativeness-based sampling network design for 1038 the State of Alaska. Landscape Ecol., 28(8), 1567–1586. https://doi.org/10.1007/s10980-013-9902-0. 2013. 1039
Hollinger, D. Y., and A. D. Richardson. Uncertainty in Eddy Covariance Measurements and Its Application to 1040 Physiological Models. Tree Physiology 25 (7): 873–85. https://doi.org/10.1093/treephys/25.7.873. 2005. 1041
Holm, G. O., Perez, B. C., McWhorter, D. E., Krauss, K. W., Raynie, R. C., & Killebrew, C. J. FLUXNET-CH4 1042 US-LA1 Pointe-aux-Chenes Brackish Marsh. United States. https://doi:10.18140/FLX/1669680. 2020a. 1043
Holm, G. O., Perez, B. C., McWhorter, D. E., Krauss, K. W., Raynie, R. C., & Killebrew, C. J. FLUXNET-CH4 1044 US-LA2 Salvador WMA Freshwater Marsh. United States. https://doi:10.18140/FLX/1669681. 2020b. 1045
Hörtnagl, L., Feigenwinter, I. Fuchs, K., Merbold, L., Buchmann, N., Eugster, W., Zeeman, M., Pluess, P., Käslin, 1046 F., Meier, P., Koller, P., & Baur, T. FLUXNET-CH4 CH-Cha Chamau. Switzerland. 1047 https://doi:10.18140/FLX/1669629. 2020a. 1048
Hörtnagl, Lukas, Werner Eugster, Lutz Merbold, Nina Buchmann, Mana Gharun, Sophia Etzold, Rudolf Haesler, 1049 Matthias Haeni, Philip Meier, Florian Käslin, Thomas Baur, & Peter Pluess. FLUXNET-CH4 CH-Dav Davos. 1050 Switzerland. https://doi:10.18140/FLX/1669630. 2020b. 1051
Hörtnagl, Lukas, Regine Maier, Werner Eugster, Nina Buchmann, Carmen Emmel, Patrick Koller, Thomas Baur, 1052 Peter Pluess, Florian Käslin, & Philip Meier. FLUXNET-CH4 CH-Oe2 Oensingen crop. Switzerland. 1053 https://doi:10.18140/FLX/1669631. 2020c. 1054
Hwang, Y., Ryu, Y., Huang, Y., Kim, J., Iwata, H., & Kang, M. Comprehensive assessments of carbon dynamics in 1055 an intermittently-irrigated rice paddy. Agr. Forest Met., 285–286, 107933. 1056 https://doi.org/10.1016/j.agrformet.2020.107933. 2020. 1057
Iwata, H., Mano, M., Ono, K., Tokida, T., Kawazoe, T., Kosugi, Y., Sakabe, A., Takahashi, K., & Miyata, A. 1058 Exploring sub-daily to seasonal variations in methane exchange in a single-crop rice paddy in central Japan. 1059 Atmos. Environ., 179, 156–165. https://doi.org/10.1016/j.atmosenv.2018.02.015. 2018. 1060
Iwata, Hiroki. FLUXNET-CH4 JP-Mse Mase rice paddy field. Japan. https://doi:10.18140/FLX/1669647. 2020a. 1061 Iwata, Hiroki. FLUXNET-CH4 JP-SwL Suwa Lake. Japan. https://doi:10.18140/FLX/1669648. 2020b. 1062 Iwata, Hiroki, Masahito Ueyama, & Yoshinobu Harazono. FLUXNET-CH4 US-Uaf University of Alaska, 1063
Fairbanks. United States. https://doi:10.18140/FLX/1669701. 2020c. 1064 Jacotot, Adrien, Sébastien Gogo, & Fatima Laggoun-Défarge. FLUXNET-CH4 FR-LGt La Guette. France. 1065
https://doi:10.18140/FLX/1669641. 2020. 1066 Jung, M., Reichstein, M., & Bondeau, A. Towards global empirical upscaling of FLUXNET eddy covariance 1067
observations: validation of a model tree ensemble approach using a biosphere model. Biogeosciences, 6(10), 1068 2001–2013. https://doi.org/10.5194/bg-6-2001-2009. 2009. 1069
Jung, M., Schwalm, C., Migliavacca, M., Walther, S., Camps-Valls, G., Koirala, S., Anthoni, P., Besnard, S., 1070 Bodesheim, P., Carvalhais, N., Chevallier, F., Gans, F., Goll, D. S., Haverd, V., Kohler, P., Ichii, K., Jain, A. 1071 K., Liu, J., Lombardozzi, D., Nabel, J. E. M. S., Nelson, J. A., O’Sullivan, M., Pallandt, M., Papale, D., Peters, 1072 W., Pongrats, J., Rodenbeck, C., Sitch, S. Tramontana, G., Walker, A., Weber, U., & Reichstein, M. Scaling 1073 carbon fluxes from eddy covariance sites to globe: synthesis and evaluation of the FLUXCOM approach. 1074 Biogeosciences, 17(5), 1343–1365. https://doi.org/10.5194/bg-17-1343-2020. 2020. 1075
Kim, Y., Johnson, M. S., Knox, S. H., Andrew Black, T., Dalmagro, H. J., Kang, M., Kim, J., & Baldocchi, D. Gap‐1076 filling approaches for eddy covariance methane fluxes: A comparison of three machine learning algorithms and 1077 a traditional method with principal component analysis. Glob. Change Biol., 26(3), 1499–1518. 1078 https://doi.org/10.1111/gcb.14845. 2020. 1079
Kittler, F., Heimann, M., Kolle, O., Zimov, N., Zimov, S., & Göckede, M. Long-Term Drainage Reduces CO 2 1080 Uptake and CH 4 Emissions in a Siberian Permafrost Ecosystem: Drainage impact on Arctic carbon cycle. 1081 Global Biogeochem. Cy., 31(12), 1704–1717. https://doi.org/10.1002/2017GB005774. 2017. 1082
Klatt, Janina, Hans Peter Schmid, Matthias Mauder, & Rainer Steinbrecher. FLUXNET-CH4 DE-SfN Schechenfilz 1083 Nord. Germany. https://doi:10.18140/FLX/1669635. 2020. 1084
Knox, S. H., Sturtevant, C., Matthes, J. H., Koteen, L., Verfaillie, J., & Baldocchi, D. Agricultural peatland 1085 restoration: effects of land-use change on greenhouse gas (CO2 and CH4) fluxes in the Sacramento-San 1086 Joaquin Delta. Glob. Change Biol., 21(2), 750–765. https://doi.org/10.1111/gcb.12745. 2015. 1087
Knox, S. H., Matthes, J. H., Sturtevant, C., Oikawa, P. Y., Verfaillie, J., & Baldocchi, D. Biophysical controls on 1088 interannual variability in ecosystem-scale CO2and CH4exchange in a California rice paddy. J. Geophys. Res.-1089 Biogeo., 121(3), 978–1001. https://doi.org/10.1002/2015jg003247. 2016. 1090
Knox, S. H., Jackson, R. B., Poulter, B., McNicol, G., Fluet-Chouinard, E., Zhang, Z., Hugelius, G., Bousquet, P., 1091 Canadell, J. G., Saunois, M., Papale, D., Chu, H., Keenan, T. F., Baldocchi, D., Torn, M. S., Mammarella, I., 1092 Trotta, C., Aurela, M., Bohrer, G., Campbell, D.I., Cescatti, A., Chamberlain, S., Chen, J., Chen, W., Dengel, 1093

34
S., Desai, A.R., Euskirchen, E., Friborg, T., Gasbarra, D., Goded, I., Goeckede, M., Heimann, M., Helbig, M., 1094 Hirano, T., Hollinger, D.Y., Iwata, H., & Others. FLUXNET-CH4 Synthesis Activity: Objectives, 1095 Observations, and Future Directions. B. Am. Meterol. Soc., 100(12), 2607–2632. https://doi.org/10.1175/bams-1096 d-18-0268.1. 2019. 1097
Knox, Sara, Jaclyn Hatala Matthes, Joseph Verfaillie, & Dennis Baldocchi. FLUXNET-CH4 US-Twt Twitchell 1098 Island. United States. https://doi:10.18140/FLX/1669700. 2020. 1099
Koebsch, F., Jurasinski, G., Koch, M., Hofmann, J., & Glatzel, S. Controls for multi-scale temporal variation in 1100 ecosystem methane exchange during the growing season of a permanently inundated fen. Agr. Forest 1101 Meteorol., 204, 94–105. https://doi.org/10.1016/j.agrformet.2015.02.002. 2015. 1102
Koebsch, F., Winkel, M., Liebner, S., Liu, B., Westphal, J., Schmiedinger, I., Spitzy, A., Gehre, M., Jurasinski, G., 1103 Köhler, S., & Others. Sulfate deprivation triggers high methane production in a disturbed and rewetted coastal 1104 peatland. Biogeosciences, 16, 1937–1953. https://doi.org/10.5194/bg-16-1937-2019. 2019. 1105
Koebsch, Franziska, & Gerald Jurasinski. FLUXNET-CH4 DE-Hte Huetelmoor. Germany. 1106 https://doi:10.18140/FLX/1669634. 2020. 1107
Kuznetsova A., Brockhoff P.B., & Christensen R. H. B. “lmerTest Package: Tests in Linear Mixed 1108 Effects Models.” Journal of Statistical Software, 82(13), 1-26. 1109 https://doi.org/10.18637/jss.v082.i13. 2017. 1110
Kwon, M. J., Beulig, F., Ilie, I., Wildner, M., Küsel, K., Merbold, L., Mahecha, M. D., Zimov, N., Zimov, S. A., 1111 Heimann, M., Schuur, E. A. G., Kostka, J. E., Kolle, O., Hilke, I., & Göckede, M. Plants, microorganisms, and 1112 soil temperatures contribute to a decrease in methane fluxes on a drained Arctic floodplain. Global Change 1113 Biology, 23(6), 2396–2412. https://doi.org/10.1111/gcb.13558. 2017. 1114
Lai, D. Y. F. Methane Dynamics in Northern Peatlands: A Review. Pedosphere, 19(4), 409–421. 1115 https://doi.org/10.1016/s1002-0160(09)00003-4. 2009. 1116
Lai, D. Y. F., Roulet, N. T., & Moore, T. R. The spatial and temporal relationships between CO2 and CH4 1117 exchange in a temperate ombrotrophic bog. Atmos. Environ, 89, 249–259. 1118 https://doi.org/10.1016/j.atmosenv.2014.02.034. 2014. 1119
Lai, Derrick Y.F., & Jiangong Liu. FLUXNET-CH4 HK-MPM Mai Po Mangrove. Hong Kong. 1120 https://doi:10.18140/FLX/1669642. 2020. 1121
Lasslop, G., Reichstein, M., Papale, D., Richardson, A. D., Arneth, A., Barr, A., Stoy, P., & Wohlfahrt, G. 1122 Separation of net ecosystem exchange into assimilation and respiration using a light response curve approach: 1123 critical issues and global evaluation. Glob. Change Biol., 16(1), 187–208. https://doi.org/10.1111/j.1365-1124 2486.2009.02041.x. 2010. 1125
Liu, J., Zhou, Y., Valach, A., Shortt, R., Kasak, K., Rey‐Sanchez, C., Hemes, K. S., Baldocchi, D., & Lai, D. Y. F. 1126 Methane emissions reduce the radiative cooling effect of a subtropical estuarine mangrove wetland by half. 1127 Glob. Change Biol., 26(9), 4998–5016. https://doi.org/10.1111/gcb.15247. 2020. 1128
Madsen, K., Nielsen, H. B., & Tingleff, O. Methods for non-linear least squares problems. Informatics and 1129 Mathematical Modelling, Technical Univeristy of Denmark. 2nd Edition. 2004. 1130
Magliulo, Vincenzo, Paul Di Tommasi, Daniela Famulari, Daniele Gasbarra, Luca Vitale, Antonio Manco, 1131 Ferdinando di Matteo, Andrea Esposito, & Maurizio Tosca. FLUXNET-CH4 IT-BCi Borgo Cioffi. Italy. 1132 https://doi:10.18140/FLX/1669644. 2020. 1133
Mahecha, M. D., Gans, F., Sippel, S., Donges, J. F., Kaminski, T., Metzger, S., Migliavacca, M., Papale, D., 1134 Rammig, A., & Zscheischler, J. Detecting impacts of extreme events with ecological in situ monitoring 1135 networks. Biogeosciences, 14(18), 4255–4277. https://doi.org/10.5194/bg-14-4255-2017. 2017. 1136
Malhotra, A., & Roulet, N. T. Environmental correlates of peatland carbon fluxes in a thawing landscape: do 1137 transitional thaw stages matter? Biogeosciences, 12(10), 3119–3130. https://doi.org/10.5194/bg-12-3119-2015. 1138 2015. 1139
Mammarella, Ivan, Timo Vesala, Petri Keronen, Pasi Kolari, Samuli Launiainen, Jukka Pumpanen, Üllar Rannik, 1140 Erkki Siivola, Janne Levula, & Toivo Pohja. FLUXNET-CH4 FI-Hyy Hyytiala. Finland. 1141 https://doi:10.18140/FLX/1669637. 2020. 1142
Manca, Giovanni, & Ignacio Goded. FLUXNET-CH4 IT-Cas Castellaro. Italy. https://doi:10.18140/FLX/1669645. 1143 2020. 1144
Mastepanov, M., Sigsgaard, C., Tagesson, T., Ström, L., Tamstorf, M. P., Lund, M., & Christensen, T. R. 1145 Revisiting factors controlling methane emissions from high-Arctic tundra. Biogeosciences, 10(7), 5139–5158. 1146 https://doi.org/10.5194/bg-10-5139-2013. 2013. 1147

35
Matthes, Jaclyn Hatala, Cove Sturtevant, Patty Oikawa, Samuel D Chamberlain, Daphne Szutu, Ariane Arias Ortiz, 1148 Joseph Verfaillie, & Dennis Baldocchi. FLUXNET-CH4 US-Myb Mayberry Wetland. United States. 1149 https://doi:10.18140/FLX/1669685. 2020. 1150
Matthews, E., Johnson, M. S., Genovese, V., Du, J., & Bastviken, D. Methane emission from high latitude lakes: 1151 methane-centric lake classification and satellite-driven annual cycle of emissions. Sci. Rep.- UK, 10(1), 12465. 1152 https://doi.org/10.1038/s41598-020-68246-1. 2020. 1153
Megonigal, J. P., Whalen, S. C., Tissue, D. T., Bovard, B. D., Allen, A. S., & Albert, D. B. A Plant-Soil-1154 Atmosphere Microcosm for Tracing Radiocarbon from Photosynthesis through Methanogenesis. Soil Sci. Soc. 1155 Am. J. 63(3), 665–671. https://doi.org/10.2136/sssaj1999.03615995006300030033x. 1999. 1156
Meijide, A., Manca, G., Goded, I., Magliulo, V., Di Tommasi, P., Seufert, G., & Cescatti, A. Seasonal trends and 1157 environmental controls of methane emissions in a rice paddy field in Northern Italy. Biogeosciences, 8(12), 1158 3809. https://doi.org/10.5194/bg-8-3809-2011. 2011. 1159
Melloh, R. A., & Crill, P. M. Winter methane dynamics in a temperate peatland. Global Biogeochem. Cy., 10(2), 1160 247–254. https://doi.org/10.1029/96gb00365. 1996. 1161
Melton, J. R., Wania, R., Hodson, E. L., Poulter, B., Ringeval, B., Spahni, R., Bohn, T., Avis, C. A., Beerling, D. J., 1162 Chen, G., Eliseev, A. V., Denisov, S. N., Hopcroft, P. O., Lettenmaier, D. P., Riley, W. J., Singarayer, J. S., 1163 Subin, Z. M., Tian, H., Zürcher, S., & Others. Present state of global wetland extent and wetland methane 1164 modelling: conclusions from a model inter-comparison project (WETCHIMP). Biogeosciences, 10(2), 753–1165 788. https://doi.org/10.5194/bg-10-753-2013. 2013. 1166
Merbold, Lutz, Corinna Rebmann, & Chiara Corradi. FLUXNET-CH4 RU-Che Cherski. Russian Federation. 1167 https://doi:10.18140/FLX/1669655. 2020. 1168
Meyer, H., & Pebesma, E. Predicting into unknown space? Estimating the area of applicability of spatial prediction 1169 models. arXiv [stat.ML]. arXiv. http://arxiv.org/abs/2005.07939. 2020. 1170
Mishra, S. R., Pattnaik, P., Sethunathan, N., & Adhya, T. K. Anion-Mediated Salinity Affecting Methane 1171 Production in a Flooded Alluvial Soil. Geomicrobiol. J., 20(6), 579–586. https://doi.org/10.1080/713851167. 1172 2003. 1173
Moffat, A. M., Papale, D., Reichstein, M., Hollinger, D. Y., Richardson, A. D., Barr, A. G., Beckstein, C., Braswell, 1174 B. H., Churkina, G., Desai, A. R., Falge, E., Gove, J. H., Heimann, M., Hui, D., Jarvis, A. J., Kattge, J., 1175 Noormets, A., & Stauch, V. J. Comprehensive comparison of gap-filling techniques for eddy covariance net 1176 carbon fluxes. Agr. Forest Meteorol., 147(3), 209–232. https://doi.org/10.1016/j.agrformet.2007.08.011. 2007. 1177
Myhre, G., D. Shindell, F.-M. Bréon, W. Collins, J. Fuglestvedt, J. Huang, D. Koch, J.-F. Lamarque, D. Lee, B. 1178 Mendoza, T. Nakajima, A. Robock, G. Stephens, T. Takemura and H. Zhang. Anthropogenic and Natural 1179 Radiative Forcing Supplementary Material. In Stocker, T.F., D. Qin, G.-K. Plattner, M. Tignor, S.K. Allen, J. 1180 Boschung, A. Nauels, Y. Xia, V. Bex and P.M. Midgley (Ed.), Climate Change 2013: The Physical Science 1181 Basis. Contribution of Working Group I to the Fifth Assessment Report of the Intergovernmental Panel on 1182 Climate Change. 2013. 1183
Nemitz, E., Mammarella, I., Ibrom, A., Aurela, M., Burba, G. G., Dengel, S., Gielen, B., Grelle, A., Heinesch, B., 1184 Herbst, M., Hörtnagl, L., Klemedtsson, L., Lindroth, A., Lohila, A., McDermitt, D. K., Meier, P., Merbold, L., 1185 Nelson, D., Nicolini, G., & Others. Standardisation of eddy-covariance flux measurements of methane and 1186 nitrous oxide. Int. Agrophy., 32(4), 517–549. https://doi.org/10.1515/intag-2017-0042. 2018. 1187
Nielsen, H. B. Damping parameter in Marquardt’s method. Department of Mathematical Modeling, IMM, Technical 1188 University of Denmark. Technical Report, IMM-REP-1999-05. 1999. 1189
Nilsson, Mats B., & Matthias Peichl. FLUXNET-CH4 SE-Deg Degero. Sweden. 1190 https://doi:10.18140/FLX/1669659. 2020. 1191
Niu, Shuli, & Weinan Chen. FLUXNET-CH4 CN-Hgu Hongyuan. China. https://doi:10.18140/FLX/1669632. 2020. 1192 Noormets, Asko, John King, Bhaskar Mitra, Guofang Miao, Maricar Aguilos, Kevan Minick, Prajaya Prajapati, 1193
Jean-Christophe Domec, Jonathan Furst, & Maxwell Wightman. FLUXNET-CH4 US-NC4 1194 NC_AlligatorRiver. United States. https://doi:10.18140/FLX/1669686. 2020. 1195
Oikawa, P. Y., Jenerette, G. D., Knox, S. H., Sturtevant, C., Verfaillie, J., Dronova, I., Poindexter, C. M., 1196 Eichelmann, E., & Baldocchi, D. D. Evaluation of a hierarchy of models reveals importance of substrate 1197 limitation for predicting carbon dioxide and methane exchange in restored wetlands. J. Geophys. Res.-Biogeo., 1198 122(1), 145–167. https://doi.org/10.1002/2016JG003438. 2017. 1199
Oikawa, Patty. FLUXNET-CH4 US-EDN Eden Landing Ecological Reserve. United States. 1200 https://doi:10.18140/FLX/1669673. 2020. 1201

36
Olefeldt, D., Turetsky, M. R., Crill, P. M., & McGuire, A. D. Environmental and physical controls on northern 1202 terrestrial methane emissions across permafrost zones. Glob. Change Biol., 19(2), 589–603. 1203 https://doi.org/10.1111/gcb.12071. 2013. 1204
Papale, D., Andrew Black, T., Carvalhais, N., Cescatti, A., Chen, J., Jung, M., Kiely, G., Lasslop, G., Mahecha, M. 1205 D., Margolis, H., Merbold, L., Montagnani, L., Moors, E., Olesen, J. E., Reichstein, M., Tramontana, G., van 1206 Gorsel, E., Wohlfahrt, G., & Ráduly, B. Effect of spatial sampling from European flux towers for estimating 1207 carbon and water fluxes with artificial neural networks. J. Geophys. Res.-Biogeo., 120(10), 1941–1957. 1208 https://doi.org/10.1002/2015jg002997. 2015. 1209
Parmentier, F. J. W., van Huissteden, J., van der Molen, M. K., Schaepman-Strub, G., Karsanaev, S. A., Maximov, 1210 T. C., & Dolman, A. J. Spatial and temporal dynamics in eddy covariance observations of methane fluxes at a 1211 tundra site in northeastern Siberia. J. Geophys. Res., 116(G3), 1368. https://doi.org/10.1029/2010JG001637. 1212 2011. 1213
Pastorello, G., Trotta, C., Canfora, E., Chu, H., Christianson, D., Cheah, Y.-W., Poindexter, C., Chen, J., 1214 Elbashandy, A., Humphrey, M., Isaac, P., Polidori, D., Ribeca, A., van Ingen, C., Zhang, L., Amiro, B., 1215 Ammann, C., Arain, M. A., Ardö, J., & Others. The FLUXNET2015 dataset and the ONEFlux processing 1216 pipeline for eddy covariance data. Scientific Data, 7(1), 225. https://doi.org/10.1038/s41597-020-0534-3. 2020. 1217
Pattnaik, P., Mishra, S. R., Bharati, K., Mohanty, S. R., Sethunathan, N., & Adhya, T. K. Influence of salinity on 1218 methanogenesis and associated microflora in tropical rice soils. Microbiol. Res., 155(3), 215–220. 1219 https://doi.org/10.1016/S0944-5013(00)80035-X. 2000. 1220
Poffenbarger, H. J., Needelman, B. A., & Patrick Megonigal, J. Salinity Influence on Methane Emissions from 1221 Tidal Marshes. Wetlands, 31(5), 831–842. https://doi.org/10.1007/s13157-011-0197-0. 2011. 1222
Poulter, B., Bousquet, P., Canadell, J. G., Ciais, P., Peregon, A., Saunois, M., Arora, V. K., Beerling, D. J., Brovkin, 1223 V., Jones, C. D., Joos, F., Gedney, N., Ito, A., Kleinen, T., Koven, C. D., McDonald, K., Melton, J. R., Peng, 1224 C., Peng, S., & Others. Global wetland contribution to 2000–2012 atmospheric methane growth rate dynamics. 1225 Environ. Res. Lett., 12(9), 094013. https://doi.org/10.1088/1748-9326/aa8391. 2017. 1226
Reba, Michele, Benjamin Runkle, & Kosana Suvocarev. FLUXNET-CH4 US-HRC Humnoke Farm Rice Field – 1227 Field C. United States. https://doi:10.18140/FLX/1669677. 2020. 1228
Reichstein, M., Falge, E., Baldocchi, D., Papale, D., Aubinet, M., Berbigier, P., Bernhofer, C., Buchmann, N., 1229 Gilmanov, T., Granier, A., Grunwald, T., Havrankova, K., Ilvesniemi, H., Janous, D., Knohl, A., Laurila, T., 1230 Lohila, A., Loustau, D., Matteucci, G., & Others. On the separation of net ecosystem exchange into 1231 assimilation and ecosystem respiration: review and improved algorithm. Glob. Change Biol., 11(9), 1424–1232 1439). https://doi.org/10.1111/j.1365-2486.2005.001002.x. 2005. 1233
Rey-Sanchez, Camilo, Daphne Szutu, Robert Shortt, Samuel D. Chamberlain, Joseph Verfaillie, & Dennis 1234 Baldocchi. FLUXNET-CH4 US-Bi1 Bouldin Island Alfalfa. United States. https://doi:10.18140/FLX/1669666. 1235 2020a. 1236
Rey-Sanchez, Camilo, Daphne Szutu, Kyle Hemes, Joseph Verfaillie, & Dennis Baldocchi. FLUXNET-CH4 US-1237 Bi2 Bouldin Island corn. United States. https://doi:10.18140/FLX/1669667. 2020b. 1238
Richardson, A. D., Hollinger, D. Y., Burba, G. G., Davis, K. J., Flanagan, L. B., Katul, G. G., William Munger, J., 1239 Ricciuto, D. M., Stoy, P. C., Suyker, A. E., Verma, S. B., & Wofsy, S. C. A multi-site analysis of random error 1240 in tower-based measurements of carbon and energy fluxes. Agr. Forest Meteorol., 136(1), 1–18. 1241 https://doi.org/10.1016/j.agrformet.2006.01.007. 2006. 1242
Richardson, A. D., & Hollinger, D. Y. A method to estimate the additional uncertainty in gap-filled NEE resulting 1243 from long gaps in the CO2 flux record. Agr. Forest Meteorol., 147(3), 199–208. 1244 https://doi.org/10.1016/j.agrformet.2007.06.004. 2007. 1245
Richardson, A. D., Mahecha, M. D., Falge, E., Kattge, J., Moffat, A. M., Papale, D., Reichstein, M., Stauch, V. J., 1246 Braswell, B. H., Churkina, G., Kruijt, B., & Hollinger, D. Y. Statistical properties of random CO2 flux 1247 measurement uncertainty inferred from model residuals. Agr. Forest Meteorol., 148(1), 38–50. 1248 https://doi.org/10.1016/j.agrformet.2007.09.001. 2008. 1249
Richardson, A. D., Aubinet, M., Barr, A. G., Hollinger, D. Y., Ibrom, A., Lasslop, G., & Reichstein, M. Uncertainty 1250 quantification. Eddy Covariance: A Practical Guide to Measurement and Data Analysis. (eds) Aubinet, M., 1251 Vesala, T., Papale, D. Springer Atmospheric Sciences. 2012. 1252
Richardson, Andrew D, & David Y Hollinger. FLUXNET-CH4 US-Ho1 Howland Forest (main tower). United 1253 States. https://doi:10.18140/FLX/1669675. 2020. 1254
Rinne, J., Riutta, T., Pihlatie, M., Aurela, M., Haapanala, S., Tuovinen, J.-P., Tuittila, E.-S., & Vesala, T. Annual 1255 cycle of methane emission from a boreal fen measured by the eddy covariance technique. Tellus B, 59(3), 449–1256 457. https://doi.org/10.1111/j.1600-0889.2007.00261.x. 2007. 1257

37
Runkle, B. R. K., Suvočarev, K., Reba, M. L., Reavis, C. W., Smith, S. F., Chiu, Y.-L., & Fong, B. Methane 1258 Emission Reductions from the Alternate Wetting and Drying of Rice Fields Detected Using the Eddy 1259 Covariance Method. Envir. Sci. Tech., 53(2), 671–681. https://doi.org/10.1021/acs.est.8b05535. 2019. 1260
Runkle, Benjamin, Michele Reba, & Kosana Suvocarev. FLUXNET-CH4 US-HRA Humnoke Farm Rice Field – 1261 Field A. United States. https://doi:10.18140/FLX/1669676. 2020. 1262
Ryu, Youngryel, Minseok Kang, & Jongho Kim. FLUXNET-CH4 KR-CRK Cheorwon Rice paddy. Korea, 1263 Republic of. https://doi:10.18140/FLX/1669649. 2020. 1264
Sachs, T., Giebels, M., Boike, J., & Kutzbach, L. Environmental controls on CH4 emission from polygonal tundra 1265 on the microsite scale in the Lena river delta, Siberia: CONTROLS ON TUNDRA CH4 FLUX AND 1266 SCALING. Glob. Change Biol., 16(11) 3096 – 3110. https://doi.org/10.1111/j.1365-2486.2010.02232.x. 2010. 1267
Sachs, Torsten, Christian Wille, & Eric Larmanou. FLUXNET-CH4 DE-Dgw Dagowsee. Germany. 1268 https://doi:10.18140/FLX/1669633. 2020a. 1269
Sachs, Torsten, Christian Wille, Eric Larmanou, & Daniela Franz. FLUXNET-CH4 DE-Zrk Zarnekow. Germany. 1270 https://doi:10.18140/FLX/1669636. 2020b. 1271
Sakabe, Ayaka, Masayuki Itoh, Takashi Hirano, & Kitso Kusin. FLUXNET-CH4 ID-Pag Palangkaraya undrained 1272 forest. Indonesia. https://doi:10.18140/FLX/1669643. 2020. 1273
Saunois, M., Bousquet, P., Poulter, B., Peregon, A., Ciais, P., Canadell, J. G., Dlugokencky, E. J., Etiope, G., 1274 Bastviken, D., Houweling, S., Janssens-Maenhout, G., Tubiello, F. N., Castaldi, S., Jackson, R. B., Alexe, M., 1275 Arora, V. K., Beerling, D. J., Bergamaschi, P., Blake, D. R., & Others. The global methane budget 2000–2012. 1276 Earth Syst. Sci. Data, 8, 697-751. https://doi.org/10.5194/essd-8-697-2016. 2016. 1277
Saunois, M., Stavert, A. R., Poulter, B., Bousquet, P., Canadell, J. G., Jackson, R. B., Raymond, P. A., 1278 Dlugokencky, E. J., Houweling, S., Patra, P. K., Ciais, P., Arora, V. K., Bastviken, D., Bergamaschi, P., Blake, 1279 D. R., Brailsford, G., Bruhwiler, L., Carlson, K. M., Carrol, M., & Others. The Global Methane Budget 2000–1280 2017. Earth Syst. Sci. Data, 12, 1561-1623. https://doi.org/10.5194/essd-12-1561-2020. 2020. 1281
Schafer, Karina. FLUXNET-CH4 US-MRM Marsh Resource Meadowlands Mitigation Bank. United States. 1282 https://doi:10.18140/FLX/1669684. 2020. 1283
Schuur, E.A. FLUXNET-CH4 US-EML Eight Mile Lake Permafrost thaw gradient, Healy Alaska. United States. 1284 https://doi:10.18140/FLX/1669674. 2020. 1285
Seyfferth, A. L., Bothfeld, F., Vargas, R., Stuckey, J. W., Wang, J., Kearns, K., Michael, H. A., Guimond, J., Yu, 1286 X., & Sparks, D. L. Spatial and temporal heterogeneity of geochemical controls on carbon cycling in a tidal 1287 salt marsh. Geochim. Cosmochim. Ac., 282, 1–18. https://doi.org/10.1016/j.gca.2020.05.013. 2020. 1288
Shortt, Robert, Kyle Hemes, Daphne Szutu, Joseph Verfaillie, & Dennis Baldocchi. FLUXNET-CH4 US-Sne 1289 Sherman Island Restored Wetland. United States. https://doi:10.18140/FLX/1669693. 2020. 1290
Sims, D. A., Rahman, A. F., Cordova, V. D., El-Masri, B. Z., Baldocchi, D. D., Flanagan, L. B., Goldstein, A. H., 1291 Hollinger, D. Y., Misson, L., Monson, R. K., Oechel, W. C., Schmid, H. P., Wofsy, S. C., & Xu, L. On the use 1292 of MODIS EVI to assess gross primary productivity of North American ecosystems. J. Geophys. Res.-Biogeo. 1293 111(G4). https://doi.org/10.1029/2006jg000162. 2006. 1294
Sonnentag, Oliver, & Manuel Helbig. FLUXNET-CH4 CA-SCB Scotty Creek Bog. Canada. 1295 https://doi:10.18140/FLX/1669613. 2020a. 1296
Sonnentag, Oliver, & Manuel Helbig. FLUXNET-CH4 CA-SCC Scotty Creek Landscape. Canada. https:// 1297 doi:10.18140/FLX/1669628. 2020b. 1298
Spahni, R., Wania, R., Neef, L., van Weele, M., Pison, I., Bousquet, P., Frankenberg, C., Foster, P. N., Joos, F., 1299 Prentice, I. C., & van Velthoven, P. Constraining global methane emissions and uptake by ecosystems. In 1300 Biogeosciences, 8(6), 1643–1665. https://doi.org/10.5194/bg-8-1643-2011. 2011. 1301
Sparks, Jed P. FLUXNET-CH4 US-MAC MacArthur Agro-Ecology. United States. 1302 https://doi:10.18140/FLX/1669683. 2020. 1303
Sturtevant, C. S., Ruddell, B. L., Knox, S. H., Verfaillie, J. G., Matthes, J. H., Oikawa, P. Y., & Baldocchi, D. D. 1304 Identifying scale-emergent, nonlinear, asynchronous processes of wetland methane exchange. J. Geophys. 1305 Res.-Biogeo., 121, 188–204. https://doi.org/10.1002/2015JG003054. 2016. 1306
Tagesson, T., Mölder, M., Mastepanov, M., Sigsgaard, C., Tamstorf, M. P., Lund, M., Falk, J. M., Lindroth, A., 1307 Christensen, T. R., & Ström, L. Land-atmosphere exchange of methane from soil thawing to soil freezing in a 1308 high-Arctic wet tundra ecosystem. Glob. Change Biol., 18(6), 1928–1940. https://doi.org/10.1111/j.1365-1309 2486.2012.02647.x. 2012. 1310

38
Tang, Angela Che Ing, Guan Xhuan Wong, Lulie Melling, Edward Baran Aeries, Joseph Wenceslaus Waili, Kevin 1311 Kemudang Musin, Kim San Lo, & Frankie Kiew. FLUXNET-CH4 MY-MLM Maludam National Park. 1312 Malaysia. https://doi:10.18140/FLX/1669650. 2020. 1313
Taoka, T., Iwata, H., Hirata, R., Takahashi, Y., Miyabara, Y., & Itoh, M. Environmental Controls on Diffusive and 1314 Ebullitive Methane Emission at a Sub-Daily Time Scale in the Littoral Zone of a Mid-Latitude Shallow Lake. 1315 J. Geophys. Res.-Biogeo., 125(9), https://doi.org/10.1029/2020JG005753. 2020. 1316
Torn, Margaret, & Sigrid Dengel. FLUXNET-CH4 US-NGB NGEE Arctic Barrow. United States. https:// 1317 doi:10.18140/FLX/1669687. 2020a. 1318
Torn, Margaret, & Sigrid Dengel. FLUXNET-CH4 US-NGC NGEE Arctic Council. United States. 1319 https://doi:10.18140/FLX/1669688. 2020b. 1320
Treat, C. C., Anthony Bloom, A., & Marushchak, M. E. Nongrowing season methane emissions-a significant 1321 component of annual emissions across northern ecosystems. Glob. Change Biol., 24(8), 3331–3343. 1322 https://doi.org/10.1111/gcb.14137. 2018. 1323
Turetsky, M. R., Kotowska, A., Bubier, J., Dise, N. B., Crill, P., Hornibrook, E. R. C., Minkkinen, K., Moore, T. R., 1324 Myers-Smith, I. H., Nykänen, H., Olefeldt, D., Rinne, J., Saarnio, S., Shurpali, N., Tuittila, E.-S., Waddington, 1325 J. M., White, J. R., Wickland, K. P., & Wilmking, M. A synthesis of methane emissions from 71 northern, 1326 temperate, and subtropical wetlands. Glob. Change Biol., 20(7), 2183–2197. 1327 https://doi.org/10.1111/gcb.12580. 2014. 1328
Ueyama, Masahito, Takashi Hirano, & Yasuhiro Kominami. FLUXNET-CH4 JP-BBY Bibai bog. Japan. 1329 https://doi:10.18140/FLX/1669646. 2020. 1330
Valach, Alex, Daphne Szutu, Elke Eichelmann, Sara Knox, Joseph Verfaillie, & Dennis Baldocchi. FLUXNET-CH4 1331 US-Tw1 Twitchell Wetland West Pond. United States. https://doi:10.18140/FLX/1669696. 2020a. 1332
Valach, Alex, Kuno Kasak, Daphne Szutu, Joseph Verfaillie, & Dennis Baldocchi. FLUXNET-CH4 US-Tw5 East 1333 Pond Wetland. United States. https://doi:10.18140/FLX/1669699. 2020b. 1334
Varlagin, Andrej. FLUXNET-CH4 RU-Fy2 Fyodorovskoye dry spruce. Russian Federation. 1335 https://doi:10.18140/FLX/1669657. 2020. 1336
Vazquez-Lule, Alma, & Rodrigo Vargas. FLUXNET-CH4 US-StJ St Jones Reserve. United States. 1337 https://doi:10.18140/FLX/1669695. 2020. 1338
Vázquez-Lule, A., & Vargas, R. Biophysical drivers of net ecosystem and methane exchange across phenological 1339 phases in a tidal salt marsh. Agricultural and Forest Meteorology, 300, 108309. 1340 https://doi.org/10.1016/j.agrformet.2020.108309. 2021. 1341
Verma, S. B., Ullman, F. G., Billesbach, D., Clement, R. J., Kim, J., & Verry, E. S. Eddy correlation measurements 1342 of methane flux in a northern peatland ecosystem. Bound. Lay. Meteorol., 58(3), 289–304. 1343 https://doi.org/10.1007/BF02033829. 1992. 1344
Vesala, Timo, Eeva-Stiina Tuittila, Ivan Mammarella, & Pavel Alekseychik. FLUXNET-CH4 FI-Si2 Siikaneva-2 1345 Bog. Finland. https://doi:10.18140/FLX/1669639. 2020a. 1346
Vesala, Timo, Eeva-Stiina Tuittila, Ivan Mammarella, & Janne Rinne. FLUXNET-CH4 FI-Sii Siikaneva. Finland. 1347 https://doi:10.18140/FLX/1669640. 2020b. 1348
Villarreal, S., Guevara, M., Alcaraz-Segura, D., Brunsell, N. A., Hayes, D., Loescher, H. W., & Vargas, R. 1349 Ecosystem functional diversity and the representativeness of environmental networks across the conterminous 1350 United States. Agr. Forest Meteorol., 262, 423–433. https://doi.org/10.1016/j.agrformet.2018.07.016. 2018. 1351
Villarreal, S., Guevara, M., Alcaraz‐Segura, D., & Vargas, R. Optimizing an Environmental Observatory Network 1352 Design Using Publicly Available Data. J. Geophys. Res.-Biogeo., 124(7), 1812–1826. 1353 https://doi.org/10.1029/2018JG004714. 2019. 1354
Vourlitis, George, Higo Dalmagro, Jose de S. Nogueira, Mark Johnson, & Paulo Arruda. FLUXNET-CH4 BR-Npw 1355 Northern Pantanal Wetland. Brazil. https://doi:10.18140/FLX/1669368. 2020. 1356
Vuichard, N., & Papale, D. Filling the gaps in meteorological continuous data measured at FLUXNET sites with 1357 ERA-Interim reanalysis. Earth Syst. Sci. Data, 7(2), 157–171. https://doi.org/10.5194/essd-7-157-2015. 2015. 1358
Weston, N. B., Dixon, R. E., & Joye, S. B. Ramifications of increased salinity in tidal freshwater sediments: 1359 Geochemistry and microbial pathways of organic matter mineralization. J. Geophys. Res., 111(G1). 1360 https://doi.org/10.1029/2005jg000071. 2006. 1361
Weston, N. B., Vile, M. A., Neubauer, S. C., & Velinsky, D. J. Accelerated microbial organic matter mineralization 1362 following salt-water intrusion into tidal freshwater marsh soils. Biogeochemistry, 102, 135–151. 1363 https://doi.org/10.1007/s10533-010-9427-4. 2011. 1364
Wik, M., Crill, P. M., Varner, R. K., & Bastviken, D. Multiyear measurements of ebullitive methane flux from three 1365 subarctic lakes. J. Geophys. Res.-Biogeo. 118(3), 1307–1321. https://doi.org/10.1002/jgrg.20103. 2013. 1366

39
Windham-Myers, Lisamarie, Ellen Stuart-Haëntjens, Brian Bergamaschi, Sara Knox, Frank Anderson, & Kyle 1367 Nakatsuka. FLUXNET-CH4 US-Srr Suisun marsh - Rush Ranch. United States. 1368 https://doi:10.18140/FLX/1669694. 2020. 1369
Wohlfahrt, Georg, Albin Hammerle, & Lukas Hörtnagl. FLUXNET-CH4 AT-Neu Neustift. Austria. 1370 https://doi:10.18140/FLX/1669365. 2020. 1371
Wutzler, T., Lucas-Moffat, A., Migliavacca, M., Knauer, J., Sickel, K., Šigut, L., Menzer, O., & Reichstein, M. 1372 Basic and extensible post-processing of eddy covariance flux data with REddyProc. Biogeosciences, 15, 5015–1373 5030. https://doi.org/10.5194/bg-2018-56-sc1. 2018. 1374
Xu, X., Riley, W. J., Koven, C. D., Billesbach, D. P., -W. Chang, R. Y., Commane, R., Euskirchen, E. S., Hartery, 1375 S., Harazono, Y., Iwata, H., McDonald, K. C., Miller, C. E., Oechel, W. C., Poulter, B., Raz-Yaseef, N., 1376 Sweeney, C., Torn, M., Wofsy, S. C., Zhang, Z., & Zona, D. A multi-scale comparison of modeled and 1377 observed seasonal methane emissions in northern wetlands. Biogeosciences, 13(17), 5043–5056. 1378 https://doi.org/10.5194/bg-13-5043-2016. 2016. 1379
Yvon-Durocher, G., Allen, A. P., Bastviken, D., Conrad, R., Gudasz, C., St-Pierre, A., Thanh-Duc, N., & del 1380 Giorgio, P. A. Methane fluxes show consistent temperature dependence across microbial to ecosystem scales. 1381 Nature, 507(7493), 488–491. https://doi.org/10.1038/nature13164. 2014. 1382
Zhang, Z. Fluet-Choinard, E., Jensen, K, McDonald, K, Hugelius, G, Gumbricht, T., Carrol, M., Prigent, C., 1383 Bartsch, A., & Poulter, B. Development of a global dataset of Wetland Area and Dynamics for Methane 1384 Modeling (WAD2M) [Data set]. Zenodo. http://doi.org/10.5281/zenodo.3998454. 2020. 1385
Zhang, Z. Fluet-Choinard, E., Jensen, K, McDonald, K, Hugelius, G, Gumbricht, T., Carrol, M., Prigent, C., 1386 Bartsch, A., & Poulter, B. Development of a global dataset of Wetland Area and Dynamics for Methane 1387 Modeling (WAD2M). Earth Syst. Sci. Data [In press]. 2021. 1388
Zona, D., Gioli, B., Commane, R., Lindaas, J., Wofsy, S. C., Miller, C. E., Dinardo, S. J., Dengel, S., Sweeney, C., 1389 Karion, A., Chang, R. Y.-W., Henderson, J. M., Murphy, P. C., Goodrich, J. P., Moreaux, V., Liljedahl, A., 1390 Watts, J. D., Kimball, J. S., Lipson, D. A., & Oechel, W. C. Cold season emissions dominate the Arctic tundra 1391 methane budget. P. Natl. A. Sci. USA., 113(1), 40–45. https://doi.org/10.1073/pnas.1516017113. 2016. 1392
Zona, Donatella, & Walter C Oechel. FLUXNET-CH4 US-Atq Atqasuk. United States. 1393 https://doi:10.18140/FLX/1669663. 2020a. 1394
Zona, Donatella, & Walter C Oechel. FLUXNET-CH4 US-Beo Barrow Environmental Observatory (BEO) tower. 1395 United States. https://doi:10.18140/FLX/1669664. 2020b. 1396
Zona, Donatella, & Walter C Oechel. FLUXNET-CH4 US-Bes Barrow-Bes (Biocomplexity Experiment South 1397 tower). United States. https://doi:10.18140/FLX/1669665. 2020c. 1398
Zona, Donatella, & Walter C Oechel. FLUXNET-CH4 US-Ivo Ivotuk. United States. 1399 https://doi:10.18140/FLX/1669679. 2020d. 1400

40
APPENDIX A 1401
1402
1403
1404
Figure A1: Peak methane (CH4) flux timing versus peak gross primary productivity (GPP) timing (A) and peak soil 1405 temperature timing by day of year (B). Points represent site average and error bars represent standard deviations. Dotted 1406 line represents 1:1 relationship. 1407
1408

41
APPENDIX B 1409
1410
Table B1: Data variable names, descriptions, and units 1411
FLUXNET-CH4 Data Variables 1412
This webpage describes data variables and file formatting for the FLUXNET-CH4 Community Product. 1413
1. Data Variable: Base names 1414
Base names indicate fundamental quantities that are either measured or calculated/derived. They can also 1415 indicate quantified quality information. 1416
Table 1. Base names for data variables 1417
Variable Description Units
TIMEKEEPING
TIMESTAMP_START
ISO timestamp start of averaging period, used in half-hourly data
YYYYMMDDHHMM
TIMESTAMP_END ISO timestamp end of averaging period, used in half-hourly data YYYYMMDDHHMM
TIMESTAMP ISO timestamp used in daily aggregation files YYYYMMDD
MET_RAD
SW_IN Shortwave radiation, incoming W m-2
SW_OUT Shortwave radiation, outgoing W m-2
LW_IN Longwave radiation, incoming W m-2
LW_OUT Longwave radiation, outgoing W m-2
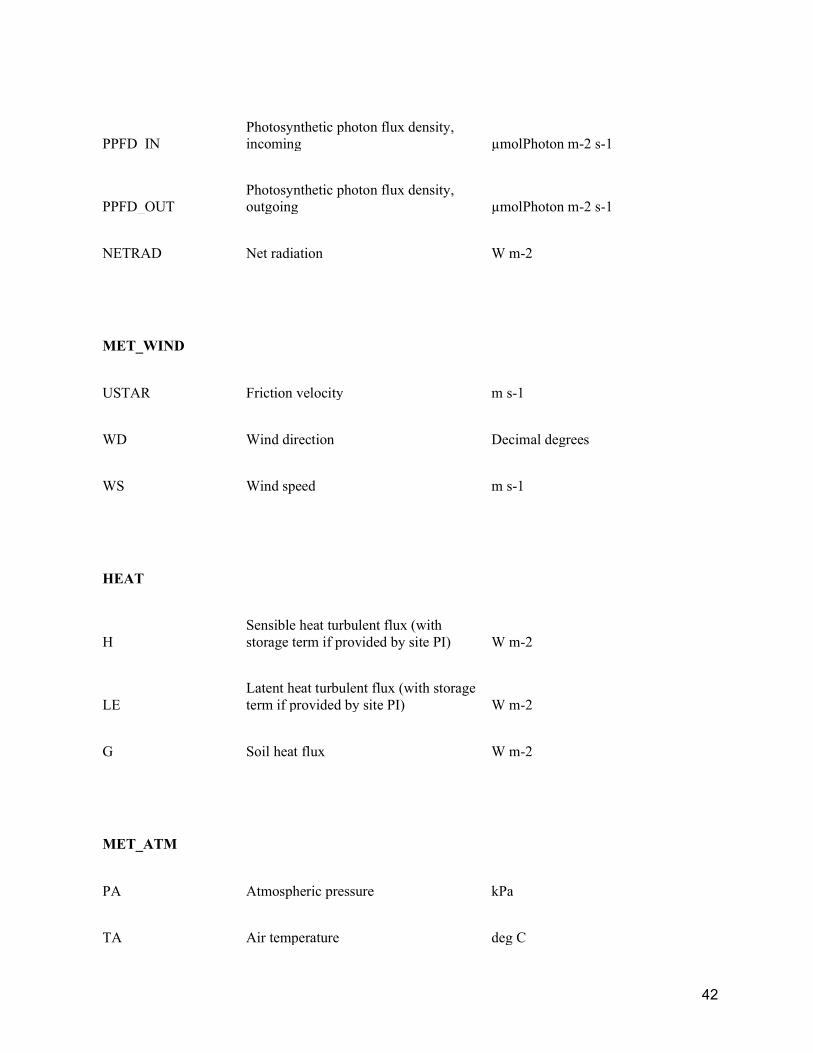
42
PPFD_IN Photosynthetic photon flux density, incoming µmolPhoton m-2 s-1
PPFD_OUT Photosynthetic photon flux density, outgoing µmolPhoton m-2 s-1
NETRAD Net radiation W m-2
MET_WIND
USTAR Friction velocity m s-1
WD Wind direction Decimal degrees
WS Wind speed m s-1
HEAT
H Sensible heat turbulent flux (with storage term if provided by site PI) W m-2
LE Latent heat turbulent flux (with storage term if provided by site PI) W m-2
G Soil heat flux W m-2
MET_ATM
PA Atmospheric pressure kPa
TA Air temperature deg C

43
VPD Vapor Pressure Deficit hPa
RH Relative humidity, range 0-100 %
MET_PRECIP
P Precipitation mm
PRODUCTS
NEE Net Ecosystem Exchange µmolCO2 m-2 s-1
GPP Gross primary productivity µmolCO2 m-2 s-1
RECO Ecosystem respiration µmolCO2 m-2 s-1
GASES
FCH4 Methane (CH4) turbulent flux (no storage correction) nmolCH4 m-2 s-1
MET_SOIL
TS Soil temperature deg C
WTD Water table depth (negative values indicate below the surface) m
1418

44
2. Data Variable: Qualifiers 1419
Qualifiers are suffixes appended to variable base names that provide additional information about the 1420 variable. For example, the _DT qualifier in the variable label GPP_DT indicates that gross primary 1421 production (GPP) has been partitioned using the flux partitioning method from Lasslop et al. 2010. 1422
Multiple qualifiers can be added, and they must follow the order in which they are presented here. 1423
2.1. Qualifiers: General 1424
General qualifiers indicate additional information about a variable. 1425
· _F : Variable has been gap-filled by the FLUXNET-CH4 team. Gaps in meteorological variables 1426 (including air temperature (TA), incoming shortwave (SW_IN) and longwave (LW_IN) radiation, vapor 1427 pressure deficit (VPD), pressure (PA), precipitation (P), and wind speed (WS) ) were filled with ERA-1428 Interim (ERA-I) reanalysis data ((Vuichard and Papale 2015)). Other variables were filled using the MDS 1429 approach in REddyProc (see Delwiche et al. 2020 for more details). 1430
· _DT : Variable acquired using the flux partitioning method from (Lasslop et al. 2010), with values 1431 estimated by fitting the light-response curve. 1432
· _NT : Variable acquired using the flux partitioning method from (Reichstein et al. 2005), with values 1433 estimated from night-time data and extrapolated to day time. 1434
· _RANDUNC: Random uncertainty introduced from several different sources including errors 1435 associated with the flux measurement system (gas analyzer, sonic anemometer, data acquisition system, 1436 flux calculations), errors associated with turbulent transport, and statistical errors relating to the location 1437 and activity of the sites of flux exchange (“footprint heterogeneity”) (Hollinger and Richardson 2005). 1438
· _ANNOPTLM : Gap-filled variable using an artificial neural net routine from Matlab with the 1439 Levenberg-Marquardt algorithm as the training function, and parameters optimized across runs (more 1440 detail in (Sara Helen Knox et al. 2016; Sara H. Knox et al. 2019)). 1441
· _UNC : Uncertainty introduced from ANNOPTLM gap-filling routine, as described in Knox et al. 1442 2016 and Knox et al. 2019. 1443
· _QC : Reports quality checks on FCH4 gap-filled data (_ANNOPTLM) based on length of data gap. 1444 1 = data gap shorter than 2 months, 3 = data gap exceeds 2 months which could lead to poor quality gap-1445 filled data. Nondimensional. 1446
1447
2.2. Qualifiers: Positional (_V) 1448
Positional qualifiers are used to indicate relative positions of observations at the site. For FLUXNET-CH4, 1449 positional qualifiers are used to distinguish soil temperature probes for sites with more than one probe. 1450 Probe depths for each positional qualifier per site are included in the metadata file included with data 1451 download and also in Table B7 of Delwiche et al. 2020. For sites where the original database file release 1452 in Ameriflux, AsiaFlux, or EuroFlux contains multiple probes at the same _V depth, we average values 1453 and report only the average for each _V position. The one exception to this is site US-UAF where the 1454 original positional qualifier from the data we downloaded from Ameriflux had different depths for the 1455
45
same qualifier. We still averaged the probe data, so _V qualifiers from US-UAF represent an average of 1456 more than one depth. 1457
3.0 Missing data 1458
Missing data are reported using -9999. Data for all days in a leap year are reported. 1459
4.0 References 1460
Hollinger, D. Y., and A. D. Richardson. 2005. “Uncertainty in Eddy Covariance Measurements and Its 1461 Application to Physiological Models.” Tree Physiology 25 (7): 873–85. 1462
Knox, Sara Helen, Jaclyn Hatala Matthes, Cove Sturtevant, Patricia Y. Oikawa, Joseph Verfaillie, and 1463 Dennis Baldocchi. 2016. “Biophysical Controls on Interannual Variability in Ecosystem-Scale 1464 CO2and CH4exchange in a California Rice Paddy.” Journal of Geophysical Research: 1465 Biogeosciences. https://doi.org/10.1002/2015jg003247. 1466
Knox, Sara H., Robert B. Jackson, Benjamin Poulter, Gavin McNicol, Etienne Fluet-Chouinard, Zhen 1467 Zhang, Gustaf Hugelius, et al. 2019. “FLUXNET-CH4 Synthesis Activity: Objectives, Observations, 1468 and Future Directions.” Bulletin of the American Meteorological Society 100 (12): 2607–32. 1469
Lasslop, Gitta, Markus Reichstein, Dario Papale, Andrew D. Richardson, Almut Arneth, Alan Barr, Paul 1470 Stoy, and Georg Wohlfahrt. 2010. “Separation of Net Ecosystem Exchange into Assimilation and 1471 Respiration Using a Light Response Curve Approach: Critical Issues and Global Evaluation.” Global 1472 Change Biology. https://doi.org/10.1111/j.1365-2486.2009.02041.x. 1473
Reichstein, Markus, Eva Falge, Dennis Baldocchi, Dario Papale, Marc Aubinet, Paul Berbigier, Christian 1474 Bernhofer, et al. 2005. “On the Separation of Net Ecosystem Exchange into Assimilation and 1475 Ecosystem Respiration: Review and Improved Algorithm.” Global Change Biology. 1476 https://doi.org/10.1111/j.1365-2486.2005.001002.x. 1477
Vuichard, N., and D. Papale. 2015. “Filling the Gaps in Meteorological Continuous Data Measured at 1478 FLUXNET Sites with ERA-Interim Reanalysis.” Earth System Science Data. 1479 https://doi.org/10.5194/essd-7-157-2015. 1480

Table B2 Site year annual sums and uncertainties
SITE_ID Year Ann_Flux_g_C_m-2
Ann_Flux_Uncertainty_g_C_m-2
Mean_Soil_Temp_C
Mean_Water_Table_Depth_m
1 AT-Neu 2010 0.38 0.03 8.65 NaN2 AT-Neu 2011 0.25 0.02 8.61 NaN3 AT-Neu 2012 NaN NaN 9.39 NaN4 BR-Npw 2013 NaN NaN NaN NaN5 BR-Npw 2014 NaN NaN 25.95 NaN6 BR-Npw 2015 20.95 1.18 26.2 -0.477 BR-Npw 2016 17.48 1.14 25.31 -0.418 BW-Gum 2018 51.73 10.59 NaN NaN9 BW-Nxr 2018 47.32 3.70 NaN NaN
10 CA-SCB 2014 10.42 0.66 9.6 -0.1511 CA-SCB 2015 NaN NaN 5.58 -0.112 CA-SCB 2016 12.12 0.31 5.38 -0.1513 CA-SCB 2017 9.48 0.27 6.32 -0.2114 CA-SCC 2013 NaN NaN 7.2 NaN15 CA-SCC 2014 4.94 0.12 4.38 NaN16 CA-SCC 2015 6.76 0.15 3.15 NaN17 CA-SCC 2016 6.76 0.12 NaN NaN18 CH-Cha 2012 2.13 0.38 11.88 NaN19 CH-Cha 2013 2.30 0.36 10.89 NaN20 CH-Cha 2014 3.46 0.40 12.2 NaN21 CH-Cha 2015 3.93 0.68 11.93 NaN22 CH-Cha 2016 NaN NaN 12.28 NaN23 CH-Dav 2016 1.21 0.40 4.33 NaN24 CH-Dav 2017 NaN NaN 4.41 NaN25 CH-Oe2 2018 0.29 0.13 12.32 NaN26 CN-Hgu 2015 NaN NaN NaN NaN27 CN-Hgu 2016 0.81 0.16 7.26 NaN28 CN-Hgu 2017 0.82 0.45 7.66 NaN29 DE-Dgw 2015 NaN NaN NaN NaN30 DE-Dgw 2016 7.51 0.22 NaN NaN31 DE-Dgw 2017 10.42 0.16 NaN NaN32 DE-Dgw 2018 NaN NaN NaN NaN33 DE-Hte 2011 59.85 6.39 NaN -0.4134 DE-Hte 2012 36.83 3.46 NaN -0.2135 DE-Hte 2013 49.72 2.34 NaN -0.2536 DE-Hte 2014 NaN NaN 13.26 -0.1937 DE-Hte 2015 51.37 1.75 10.78 -0.2638 DE-Hte 2016 50.77 2.09 9.8 -0.2539 DE-Hte 2017 46.61 1.40 10.39 -0.440 DE-Hte 2018 41.62 2.52 6.12 -0.2241 DE-SfN 2012 NaN NaN NaN -0.08

42 DE-SfN 2013 3.62 0.93 10.32 -0.0543 DE-SfN 2014 NaN NaN 8.16 NaN44 DE-Zrk 2013 NaN NaN 13.03 NaN45 DE-Zrk 2014 NaN NaN 11.67 NaN46 DE-Zrk 2015 30.76 1.00 10.85 NaN47 DE-Zrk 2016 31.14 1.23 11.28 0.1248 DE-Zrk 2017 29.10 0.87 10.84 0.3149 DE-Zrk 2018 31.10 1.20 10.54 0.2550 FI-Hyy 2016 NaN NaN 5.41 NaN51 FI-Lom 2006 13.77 0.76 4.47 052 FI-Lom 2007 17.22 0.25 4.33 0.0453 FI-Lom 2008 15.52 0.22 3.79 0.0654 FI-Lom 2009 17.63 0.27 3.98 0.0255 FI-Lom 2010 13.78 0.29 3.71 0.0356 FI-Si2 2012 9.27 1.17 9.4 0.0657 FI-Si2 2013 10.22 1.17 10.47 0.1358 FI-Si2 2014 NaN NaN 7.7 0.159 FI-Si2 2015 NaN NaN 8.18 0.0960 FI-Si2 2016 NaN NaN 7.67 0.0961 FI-Sii 2013 14.58 0.32 6.45 0.0462 FI-Sii 2014 12.93 0.78 6.42 0.0363 FI-Sii 2015 NaN NaN 6.92 -0.0264 FI-Sii 2016 16.56 0.68 5.87 -0.0165 FI-Sii 2017 8.63 0.23 8.4 0.0666 FI-Sii 2018 9.46 1.10 6.68 0.1167 FR-LGt 2017 NaN NaN 10.45 -0.2468 FR-LGt 2018 2.45 0.60 10.87 -0.2269 HK-MPM 2016 11.62 0.61 25.06 -0.6170 HK-MPM 2017 10.60 0.30 23.14 -0.6471 HK-MPM 2018 11.04 0.59 NaN -0.872 ID-Pag* 2016 0.09 0.07 NaN NaN73 ID-Pag* 2017 0.09 0.09 NaN NaN74 IT-BCi 2017 NaN NaN 17.16 NaN75 IT-BCi 2018 NaN NaN 17.36 NaN76 IT-Cas 2009 25.44 1.46 9.62 NaN77 IT-Cas 2010 17.80 1.26 12.37 NaN78 JP-BBY 2015 9.53 0.29 10.12 079 JP-BBY 2016 16.42 0.45 10.02 080 JP-BBY 2017 19.61 0.65 9.33 -0.0381 JP-BBY 2018 NaN NaN 9.79 -0.0482 JP-Mse 2012 9.50 1.97 14.52 0.0383 JP-SwL 2016 66.68 4.29 NaN 1.9184 KR-CRK 2015 NaN NaN 14.41 0.0285 KR-CRK 2016 29.12 0.91 12.48 0.03

86 KR-CRK 2017 25.84 0.86 13.94 0.0287 KR-CRK 2018 28.82 1.15 11.32 0.0288 MY-MLM 2014 9.55 0.59 26.8 -0.0989 MY-MLM 2015 NaN NaN 26.9 -0.0190 NL-Hor 2007 NaN NaN 12.4 NaN91 NL-Hor 2008 NaN NaN 10.37 NaN92 NL-Hor 2009 NaN NaN 11.61 NaN93 NK-Kop 2012 23.98 1.38 12.17 -0.0894 NK-Kop 2013 15.33 0.43 12.68 -0.1395 NK-Kop 2014 15.67 0.39 12.38 -0.1196 NK-Kop 2015 14.37 2.66 12.46 -0.197 PH-RiF 2012 NaN NaN 27.78 NaN98 PH-RiF 2013 12.41 0.99 28.17 NaN99 PH-RiF 2014 NaN NaN 27.47 NaN
100 RU-Ch2 2014 6.99 0.14 -4.21 NaN101 RU-Ch2 2015 5.86 0.14 -4.87 NaN102 RU-Ch2 2016 NaN NaN -2.88 NaN103 RU-Che 2014 3.84 0.14 -3.31 NaN104 RU-Che 2015 4.19 0.22 -3.28 NaN105 RU-Che 2016 4.24 0.19 -1.65 NaN106 RU-Cok 2008 NaN NaN NaN NaN107 RU-Cok 2009 NaN NaN NaN NaN108 RU-Cok 2010 NaN NaN NaN NaN109 RU-Cok 2011 NaN NaN NaN NaN110 RU-Cok 2012 NaN NaN -0.46 NaN111 RU-Cok 2013 NaN NaN -5.73 NaN112 RU-Cok 2014 NaN NaN -4.82 NaN113 RU-Cok 2015 4.45 0.15 -4.4 NaN114 RU-Cok 2016 NaN NaN -11.1 NaN115 RU-Fy2 2015 NaN NaN 9.83 NaN116 RU-Fy2 2016 2.69 0.59 6.88 0.68117 RU-Fy2 2017 2.17 0.52 6.1 0.19118 RU-Fy2 2018 5.66 1.37 6.48 0.79119 SE-Deg 2014 11.24 1.98 5.02 -0.02120 SE-Deg 2015 11.11 0.08 5.04 0.02121 SE-Deg 2016 11.19 0.15 5.19 -0.01122 SE-Deg 2017 NaN NaN 4.19 0123 SE-Deg 2018 9.42 0.09 5.49 -0.03124 UK-LBT 2011 NaN NaN NaN NaN125 UK-LBT 2012 NaN NaN NaN NaN126 UK-LBT 2013 50.50 0.97 NaN NaN127 UK-LBT 2014 42.57 2.25 NaN NaN128 US-A03 2015 NaN NaN -6.65 NaN129 US-A03 2016 NaN NaN -6.14 NaN

130 US-A03 2017 7.26 2.58 -4.48 NaN131 US-A03 2018 4.35 0.62 -4.93 NaN132 US-A10 2012 NaN NaN NaN NaN133 US-A10 2013 NaN NaN NaN NaN134 US-A10 2014 NaN NaN NaN NaN135 US-A10 2015 NaN NaN NaN NaN136 US-A10 2016 NaN NaN NaN NaN137 US-A10 2017 NaN NaN NaN NaN138 US-A10 2018 NaN NaN NaN NaN139 US-Atq 2013 NaN NaN -5.65 NaN140 US-Atq 2014 1.80 0.19 -4.48 NaN141 US-Atq 2015 1.75 0.11 -0.43 NaN142 US-Atq 2016 1.75 0.00 NaN NaN143 US-Beo 2013 NaN NaN -2.67 NaN144 US-Beo 2014 2.74 0.05 -4.95 NaN145 US-Bes 2013 NaN NaN -6.01 NaN146 US-Bes 2014 3.32 0.04 -5.69 NaN147 US-Bes 2015 3.06 0.54 -6.24 NaN148 US-Bi1 2016 NaN NaN 15.62 NaN149 US-Bi1 2017 NaN NaN 17.17 NaN150 US-Bi1 2018 0.69 0.29 16.82 NaN151 US-Bi2 2017 0.86 0.20 20.42 NaN152 US-Bi2 2018 1.69 0.29 17.12 NaN153 US-BZB 2014 8.02 4.61 4.03 NaN154 US-BZB 2015 7.52 0.82 3.9 NaN155 US-BZB 2016 11.61 2.25 4.89 NaN156 US-BZF 2014 6.61 0.63 4.32 NaN157 US-BZF 2015 10.82 0.90 3.99 NaN158 US-BZF 2016 NaN NaN 5.93 NaN159 US-BZS 2015 0.68 0.68 0.48 NaN160 US-BZS 2016 0.89 0.27 0.67 NaN161 US-CRT 2011 2.21 0.15 11.49 -0.92162 US-CRT 2012 2.21 0.11 12.38 -1.45163 US-DPW 2013 NaN NaN NaN NaN164 US-DPW 2014 58.91 0.69 NaN NaN165 US-DPW 2015 NaN NaN NaN NaN166 US-DPW 2016 43.60 1.29 NaN NaN167 US-DPW 2017 43.60 0.06 NaN NaN168 US-EDN 2018 -0.04 0.06 NaN NaN169 US-EML 2015 NaN NaN 5.71 NaN170 US-EML 2016 1.04 0.08 3.07 NaN171 US-EML 2017 0.36 0.27 3.8 NaN172 US-EML 2018 0.36 0.07 NaN NaN173 US-Ho1 2012 NaN NaN NaN -0.43

174 US-Ho1 2013 -0.05 0.02 NaN -0.33175 US-Ho1 2014 -0.04 0.02 NaN -0.38176 US-Ho1 2015 -0.16 0.01 NaN -0.48177 US-Ho1 2016 -0.22 0.01 NaN -0.57178 US-Ho1 2017 -0.24 0.01 NaN -0.56179 US-Ho1 2018 -0.24 0.01 NaN NaN180 US-HRA 2017 -0.24 0.56 NaN NaN181 US-HRC 2017 -0.24 0.81 NaN NaN182 US-ICs 2014 NaN NaN -1.55 NaN183 US-ICs 2015 NaN NaN -0.62 NaN184 US-ICs 2016 NaN NaN -1.48 NaN185 US-Ivo 2013 NaN NaN 3.19 NaN186 US-Ivo 2014 5.05 0.22 0.02 NaN187 US-Ivo 2015 3.89 0.27 0.47 NaN188 US-Ivo 2016 5.77 0.55 -1.01 NaN189 US-LA1 2011 NaN NaN 18.92 NaN190 US-LA1 2012 12.68 0.63 24.23 NaN191 US-LA2 2011 12.68 0.19 NaN NaN192 US-LA2 2012 48.42 1.57 23.09 NaN193 US-LA2 2013 43.34 1.32 23.19 NaN194 US-Los 2014 6.66 1.48 8.3 -0.06195 US-Los 2015 5.51 0.40 5.65 -0.1196 US-Los 2016 8.67 0.35 6.3 -0.07197 US-Los 2017 6.00 0.33 5.5 -0.09198 US-Los 2018 5.71 0.37 4.29 -0.19199 US-MAC 2013 5.71 2.68 NaN NaN200 US-MAC 2014 26.37 1.69 23.18 -0.71201 US-MAC 2015 15.40 0.85 23.29 -0.55202 US-MRM 2012 0.30 0.19 11.16 NaN203 US-MRM 2013 0.37 0.14 8.99 NaN204 US-Myb 2010 NaN NaN NaN 0.95205 US-Myb 2011 33.83 0.72 17.18 1.23206 US-Myb 2012 64.20 0.58 16.25 1.12207 US-Myb 2013 59.81 0.92 15.7 1.19208 US-Myb 2014 58.97 0.68 11.27 1.24209 US-Myb 2015 60.85 0.55 NaN 1.3210 US-Myb 2016 45.72 0.48 NaN 1.22211 US-Myb 2017 30.32 0.84 18.5 1.35212 US-Myb 2018 29.33 0.55 17.05 1.19213 US-NC4 2012 38.28 1.70 17.12 NaN214 US-NC4 2013 18.60 3.88 NaN NaN215 US-NC4 2014 26.98 0.60 18.02 NaN216 US-NC4 2015 23.37 2.30 16.27 NaN217 US-NC4 2016 62.20 2.78 16.35 NaN

218 US-NGB 2012 NaN NaN NaN NaN219 US-NGB 2013 NaN NaN NaN NaN220 US-NGB 2014 NaN NaN NaN NaN221 US-NGB 2015 NaN NaN NaN NaN222 US-NGB 2016 NaN NaN NaN NaN223 US-NGB 2017 2.31 0.11 NaN NaN224 US-NGB 2018 2.52 0.22 NaN NaN225 US-NGC 2017 2.52 0.06 NaN NaN226 US-NGC 2018 2.52 0.05 NaN NaN227 US-ORv 2011 3.53 0.54 16.64 NaN228 US-ORv 2012 9.11 0.45 14.23 NaN229 US-ORv 2013 7.70 0.41 13.19 NaN230 US-ORv 2014 8.46 0.26 12 NaN231 US-ORv 2015 NaN NaN 13.36 NaN232 US-OWC 2015 NaN NaN 22.11 0.9233 US-OWC 2016 113.99 3.25 21.19 0.54234 US-PFa 2010 NaN NaN NaN NaN235 US-PFa 2011 0.34 0.05 NaN NaN236 US-PFa 2012 0.30 0.04 NaN NaN237 US-PFa 2013 0.31 0.05 NaN NaN238 US-PFa 2014 NaN NaN NaN NaN239 US-PFa 2015 0.63 0.03 NaN NaN240 US-PFa 2016 0.85 0.02 NaN NaN241 US-PFa 2017 0.80 0.06 NaN NaN242 US-PFa 2018 NaN NaN NaN NaN243 US-Snd 2010 NaN NaN 16.85 NaN244 US-Snd 2011 NaN NaN 14.96 NaN245 US-Snd 2012 6.34 0.25 16.06 NaN246 US-Snd 2013 6.04 0.48 16.59 -0.65247 US-Snd 2014 3.23 0.36 17.52 -0.78248 US-Snd 2015 3.23 0.21 NaN NaN249 US-Sne 2016 NaN NaN 17.85 -0.2250 US-Sne 2017 45.96 0.40 17.05 0.16251 US-Sne 2018 39.63 0.66 16.83 0.09252 US-Srr 2014 0.71 0.10 NaN NaN253 US-Srr 2015 0.88 0.11 NaN NaN254 US-Srr 2016 0.86 0.10 16.3 -0.18255 US-Srr 2017 0.86 0.11 NaN NaN256 US-StJ 2016 9.55 1.04 11.66 -0.26257 US-Tw1 2011 26.09 2.70 14.01 NaN258 US-Tw1 2012 NaN NaN 11.58 0.24259 US-Tw1 2013 33.93 1.78 11.92 0.25260 US-Tw1 2014 49.60 1.67 13.14 0.25261 US-Tw1 2015 54.80 2.58 12.79 0.33
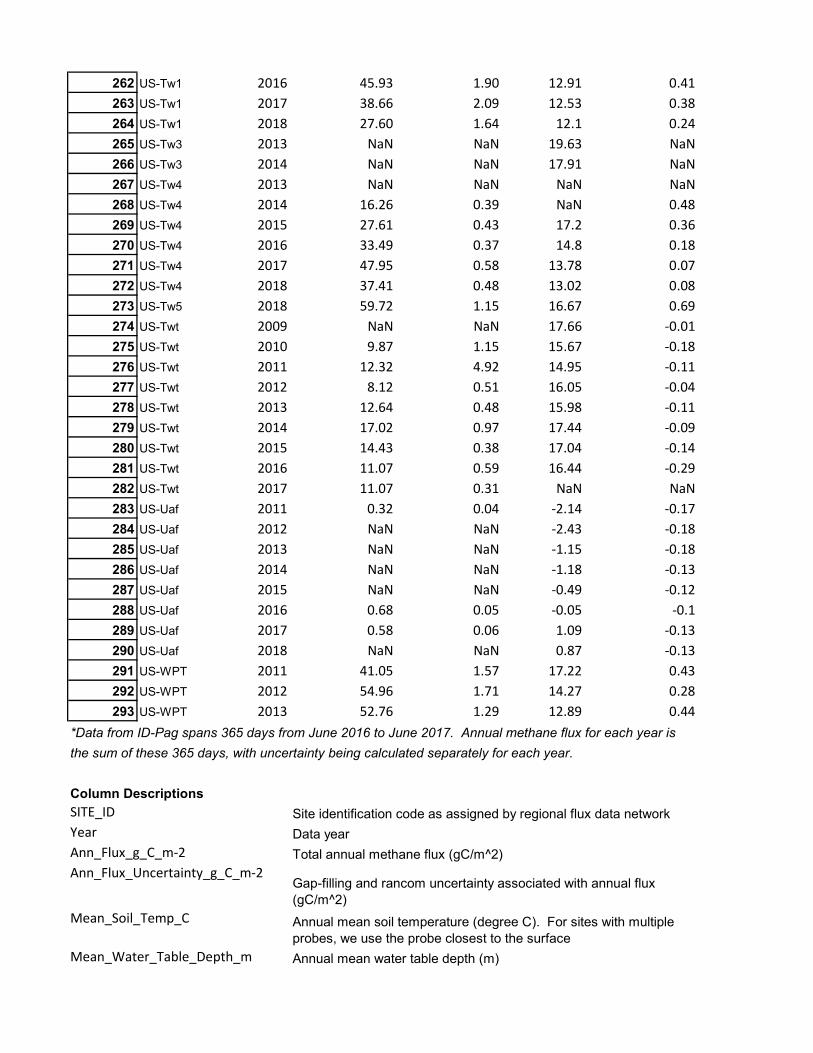
262 US-Tw1 2016 45.93 1.90 12.91 0.41263 US-Tw1 2017 38.66 2.09 12.53 0.38264 US-Tw1 2018 27.60 1.64 12.1 0.24265 US-Tw3 2013 NaN NaN 19.63 NaN266 US-Tw3 2014 NaN NaN 17.91 NaN267 US-Tw4 2013 NaN NaN NaN NaN268 US-Tw4 2014 16.26 0.39 NaN 0.48269 US-Tw4 2015 27.61 0.43 17.2 0.36270 US-Tw4 2016 33.49 0.37 14.8 0.18271 US-Tw4 2017 47.95 0.58 13.78 0.07272 US-Tw4 2018 37.41 0.48 13.02 0.08273 US-Tw5 2018 59.72 1.15 16.67 0.69274 US-Twt 2009 NaN NaN 17.66 -0.01275 US-Twt 2010 9.87 1.15 15.67 -0.18276 US-Twt 2011 12.32 4.92 14.95 -0.11277 US-Twt 2012 8.12 0.51 16.05 -0.04278 US-Twt 2013 12.64 0.48 15.98 -0.11279 US-Twt 2014 17.02 0.97 17.44 -0.09280 US-Twt 2015 14.43 0.38 17.04 -0.14281 US-Twt 2016 11.07 0.59 16.44 -0.29282 US-Twt 2017 11.07 0.31 NaN NaN283 US-Uaf 2011 0.32 0.04 -2.14 -0.17284 US-Uaf 2012 NaN NaN -2.43 -0.18285 US-Uaf 2013 NaN NaN -1.15 -0.18286 US-Uaf 2014 NaN NaN -1.18 -0.13287 US-Uaf 2015 NaN NaN -0.49 -0.12288 US-Uaf 2016 0.68 0.05 -0.05 -0.1289 US-Uaf 2017 0.58 0.06 1.09 -0.13290 US-Uaf 2018 NaN NaN 0.87 -0.13291 US-WPT 2011 41.05 1.57 17.22 0.43292 US-WPT 2012 54.96 1.71 14.27 0.28293 US-WPT 2013 52.76 1.29 12.89 0.44
*Data from ID-Pag spans 365 days from June 2016 to June 2017. Annual methane flux for each year is
the sum of these 365 days, with uncertainty being calculated separately for each year.
Column Descriptions
SITE_ID Site identification code as assigned by regional flux data network
Year Data year
Ann_Flux_g_C_m-2 Total annual methane flux (gC/m^2)
Ann_Flux_Uncertainty_g_C_m-2
Mean_Soil_Temp_C
Mean_Water_Table_Depth_m Annual mean water table depth (m)
Annual mean soil temperature (degree C). For sites with multiple probes, we use the probe closest to the surface
Gap-filling and rancom uncertainty associated with annual flux (gC/m^2)

Tabl
e B3
-A:
Site
met
adat
a, s
elec
t dat
a, a
nd D
OI l
inks
SITE
_ID
SITE
_NAM
ESI
TE_P
ERSO
NN
ELCO
UN
TRY
LAT
LON
DAT
A_D
OI
YEA
R_S
TART
YEA
R_EN
DU
TC_O
FFSE
TO
RIG
INAL
_DAT
A_SO
URC
E1
AT-N
euN
eust
iftG
eorg
Woh
lfahr
tAu
stria
47.1
1711
.318
10.1
8140
/FLX
/166
9365
2010
2012
1Eu
roFl
ux2
BR-N
pwN
orth
ern
Pant
anal
Wet
land
Geo
rge
Vour
litis
Braz
il-1
6.49
8-5
6.41
210
.181
40/F
LX/1
6693
6820
1320
16-4
Amer
iFlu
x3
BW-G
umG
uma
Caro
le H
elft
erBo
tsw
ana
-18.
965
22.3
7110
.181
40/F
LX/1
6693
7020
1820
182
Euro
Flux
4BW
-Nxr
Nxa
raga
Caro
le H
elft
erBo
tsw
ana
-19.
548
23.1
7910
.181
40/F
LX/1
6695
1820
1820
182
Euro
Flux
5CA
-SCB
Scot
ty C
reek
Bog
Oliv
er S
onne
ntag
, M
anue
l Hel
big
Cana
da61
.309
-121
.298
10.1
8140
/FLX
/166
9613
2014
2017
-7Am
eriF
lux
6CA
-SCC
Scot
ty C
reek
Lan
dsca
peO
liver
Son
nent
ag,
Man
uel H
elbi
gCa
nada
61.3
08-1
21.2
9910
.181
40/F
LX/1
6696
2820
1320
16-7
Amer
iFlu
x7
CH-C
haCh
amau
Nin
a Bu
chm
ann
Switz
erla
nd47
.210
8.41
010
.181
40/F
LX/1
6696
2920
1220
161
Euro
Flux
8CH
-Dav
Dav
osN
ina
Buch
man
nSw
itzer
land
46.8
159.
856
10.1
8140
/FLX
/166
9630
2016
2017
1Eu
roFl
ux9
CH-O
e2O
ensin
gen
crop
Nin
a Bu
chm
ann
Switz
erla
nd47
.286
7.73
410
.181
40/F
LX/1
6696
3120
1820
181
Euro
Flux
10CN
-Hgu
Hon
gyua
nSh
uli N
iu, W
eina
n Ch
enCh
ina
32.8
4510
2.59
010
.181
40/F
LX/1
6696
3220
1520
178
Euro
Flux
11D
E-D
gwD
agow
see
Tors
ten
Sach
sG
erm
any
53.1
5113
.054
10.1
8140
/FLX
/166
9633
2015
2018
1Eu
roFl
ux12
DE-
Hte
Hue
telm
oor
Ger
ald
Jura
sins
kiG
erm
any
54.2
1012
.176
10.1
8140
/FLX
/166
9634
2011
2018
1Eu
roFl
ux13
DE-
SfN
Sche
chen
filz
Nor
dH
ans P
eter
Sch
mid
Ger
man
y47
.806
11.3
2810
.181
40/F
LX/1
6696
3520
1220
141
Euro
Flux
14D
E-Zr
kZa
rnek
owTo
rste
n Sa
chs
Ger
man
y53
.876
12.8
8910
.181
40/F
LX/1
6696
3620
1320
181
Euro
Flux
15FI
-Hyy
Hyy
tiala
Tim
o Ve
sala
, Iva
n M
amm
arel
laFi
nlan
d61
.847
24.2
9510
.181
40/F
LX/1
6696
3720
1620
162
Euro
Flux
16FI
-Lom
Lom
polo
jank
kaAn
nale
a Lo
hila
Finl
and
67.9
9724
.209
10.1
8140
/FLX
/166
9638
2006
2010
2Eu
roFl
ux17
FI-S
i2Si
ikan
eva-
2 Bo
g
Tim
o Ve
sala
, Iva
n M
amm
arel
la, E
eva-
Stiin
a Tu
ittila
Finl
and
61.8
3724
.197
10.1
8140
/FLX
/166
9639
2012
2016
2Eu
roFl
ux18
FI-S
iiSi
ikan
eva
Tim
o Ve
sala
, Iva
n M
amm
arel
la, E
eva-
Stiin
a Tu
ittila
Finl
and
61.8
3324
.193
10.1
8140
/FLX
/166
9640
2013
2018
2Eu
roFl
ux19
FR-L
Gt
La G
uett
e
Adrie
n Ja
coto
t, Sé
bast
ien
Gog
o, F
atim
a La
ggou
n-D
éfar
ge,
Laur
ent P
erde
reau
Fran
ce47
.323
2.28
410
.181
40/F
LX/1
6696
4120
1720
181
Euro
Flux

20H
K-M
PMM
ai P
o M
angr
ove
Der
rick
Lai,
Jiang
ong
Liu
Hon
g Ko
ng22
.498
114.
029
10.1
8140
/FLX
/166
9642
2016
2018
8Eu
roFl
ux21
ID-P
agPa
lang
kara
ya u
ndra
ined
fore
stTa
kash
i Hira
noIn
done
sia
-2.3
2011
3.90
010
.181
40/F
LX/1
6696
4320
1620
177
Euro
Flux
22IT
-BCi
Borg
o Ci
offi
Vinc
enzo
Mag
liulo
Italy
40.5
2414
.957
10.1
8140
/FLX
/166
9644
2017
2018
1Eu
roFl
ux23
IT-C
asCa
stel
laro
Gio
vann
i Man
ca,
Igna
cio
God
ed, C
arst
en
Gru
enin
g, A
na M
eijid
eIta
ly45
.070
8.71
810
.181
40/F
LX/1
6696
4520
0920
101
Euro
Flux
24JP
-BBY
Biba
i bog
Mas
ahito
Uey
ama
Japa
n43
.323
141.
811
10.1
8140
/FLX
/166
9646
2015
2018
9As
iaFl
ux25
JP-M
seM
ase
rice
padd
y fie
ldAk
ira M
iyat
aJa
pan
36.0
5414
0.02
710
.181
40/F
LX/1
6696
4720
1220
129
Asia
Flux
26JP
-Sw
LSu
wa
Lake
Hiro
ki Iw
ata
Japa
n36
.047
138.
108
10.1
8140
/FLX
/166
9648
2016
2016
9As
iaFl
ux27
KR-C
RKCh
eorw
on R
ice
padd
yYo
ungr
yel R
yu,
Min
seok
Kan
gKo
rea
38.2
0112
7.25
110
.181
40/F
LX/1
6696
4920
1520
189
Asia
Flux
28
MY-
MLM
Mal
udam
Nat
iona
l Par
k
Ange
la C
. I. T
ang,
Gua
n Xh
uan
Won
g, L
ulie
M
ellin
gM
alay
sia1.
454
111.
149
10.1
8140
/FLX
/166
9650
2014
2015
8As
iaFl
ux29
NL-
Hor
Hor
ster
mee
rH
an D
olm
anN
ethe
rland
s52
.240
5.07
110
.181
40/F
LX/1
6696
5120
0720
091
Euro
Flux
30N
Z-Ko
pKo
puat
aiD
ave
Cam
pbel
lN
ew Z
eala
nd-3
7.38
817
5.55
410
.181
40/F
LX/1
6696
5220
1220
1513
OzF
lux
31PH
-RiF
Phili
ppin
es R
ice
Inst
itute
flo
oded
Ma.
Car
mel
ita A
lber
toPh
ilipp
ines
14.1
4112
1.26
510
.181
40/F
LX/1
6696
5320
1220
148
Euro
Flux
32RU
-Ch2
Cher
sky
refe
renc
eM
atth
ias G
oeck
ede
Russ
ia68
.617
161.
351
10.1
8140
/FLX
/166
9654
2014
2016
11Eu
roFl
ux33
RU-C
heCh
ersk
iM
atth
ias
Goe
cked
eRu
ssia
68.6
1316
1.34
110
.181
40/F
LX/1
6696
5520
1420
1611
Euro
Flux
34RU
-Cok
Chok
urda
khH
an D
olm
anRu
ssia
70.8
2914
7.49
410
.181
40/F
LX/1
6696
5620
0820
1611
Euro
Flux
35RU
-Fy2
Fyod
orov
skoy
e dr
y sp
ruce
Andr
ej V
arla
gin
Russ
ia56
.448
32.9
0210
.181
40/F
LX/1
6696
5720
1520
183
Euro
Flux
36SE
-Deg
Deg
ero
Mat
thia
s Pei
chl,
Mat
s N
ilsso
nSw
eden
64.1
8219
.557
10.1
8140
/FLX
/166
9659
2014
2018
1Eu
roFl
ux37
UK-
LBT
Lond
on_B
TCa
role
Hel
fter
UK
51.5
22-0
.139
10.1
8140
/FLX
/167
0207
2011
2014
0Eu
roFl
ux38
US-
A03
ARM
-AM
F3-O
likto
kRy
an S
ulliv
an, D
avid
Co
ok, D
avid
Bill
esba
chU
SA70
.495
-149
.882
10.1
8140
/FLX
/166
9661
2015
2018
-9Am
eriF
lux
39
US-
A10
ARM
-NSA
-Bar
row
Ryan
Sul
livan
, Dav
id
Cook
, Dav
id B
illes
bach
USA
71.3
24-1
56.6
1510
.181
40/F
LX/1
6696
6220
1220
18-9
Amer
iFlu
x40
US-
Atq
Atqa
suk
Don
atel
la Z
ona
USA
70.4
70-1
57.4
0910
.181
40/F
LX/1
6696
6320
1320
16-9
Amer
iFlu
x

41U
S-Be
oBa
rrow
Env
ironm
enta
l O
bser
vato
ry (B
EO) t
ower
Don
atel
la Z
ona
USA
71.2
81-1
56.6
1210
.181
40/F
LX/1
6696
6420
1320
14-8
Amer
iFlu
x42
US-
Bes
Barr
ow-B
es (B
ioco
mpl
exity
Ex
perim
ent S
outh
tow
er)
Don
atel
la Z
ona
USA
71.2
81-1
56.5
9710
.181
40/F
LX/1
6696
6520
1320
15-8
Amer
iFlu
x43
US-
Bi1
Boul
din
Isla
nd A
lfalfa
Den
nis B
aldo
cchi
USA
38.0
99-1
21.4
9910
.181
40/F
LX/1
6696
6620
1620
18-8
Amer
iFlu
x44
US-
Bi2
Boul
din
Isla
nd c
orn
Den
nis
Bald
occh
iU
SA38
.109
-121
.535
10.1
8140
/FLX
/166
9667
2017
2018
-8Am
eriF
lux
45U
S-BZ
BBo
nanz
a Cr
eek
Ther
mok
arst
Bo
gEu
geni
e Eu
skirc
hen
USA
64.6
96-1
48.3
2110
.181
40/F
LX/1
6696
6820
1420
16-9
Amer
iFlu
x46
US-
BZF
Bona
nza
Cree
k Ri
ch F
enEu
geni
e Eu
skirc
hen
USA
64.7
04-1
48.3
1310
.181
40/F
LX/1
6696
6920
1420
16-9
Amer
iFlu
x47
US-
BZS
Bona
nza
Cree
k Bl
ack
Spru
ceEu
geni
e Eu
skirc
hen
USA
64.6
96-1
48.3
2410
.181
40/F
LX/1
6696
7020
1520
16-9
Amer
iFlu
x48
US-
CRT
Curt
ice
Wal
ter-
Berg
er c
ropl
and
Jique
n Ch
en, H
ouse
n Ch
uU
SA41
.628
-83.
347
10.1
8140
/FLX
/166
9671
2011
2012
-5Am
eriF
lux
49
US-
DPW
Dis
ney
Wild
erne
ss P
rese
rve
Wet
land
Char
less
Ros
s H
inkl
e,
Rosv
el B
rach
o, S
cott
G
raha
m, B
rian
Bens
cote
rU
SA28
.052
-81.
436
10.1
8140
/FLX
/166
9672
2013
2017
-5Am
eriF
lux
50U
S-ED
NEd
en L
andi
ng E
colo
gica
l Re
serv
ePa
tty
Oik
awa
USA
37.6
16-1
22.1
1410
.181
40/F
LX/1
6696
7320
1820
18-8
Amer
iFlu
x51
US-
EML
Eigh
t Mile
Lak
e Pe
rmaf
rost
th
aw g
radi
ent,
Hea
ly A
lask
a.Te
d Sc
huur
USA
63.8
78-1
49.2
5410
.181
40/F
LX/1
6696
7420
1520
18-9
Amer
iFlu
x52
US-
Ho1
How
land
For
est (
mai
n to
wer
)An
drew
Ric
hard
son,
D
avid
Hol
linge
rU
SA45
.204
-68.
740
10.1
8140
/FLX
/166
9675
2012
2018
-5Am
eriF
lux
53U
S-H
RAH
umno
ke F
arm
Ric
e Fi
eld
– Fi
eld
ABe
njam
in R
unkl
eU
SA34
.585
-91.
752
10.1
8140
/FLX
/166
9676
2017
2017
-6Am
eriF
lux
54U
S-H
RCH
umno
ke F
arm
Ric
e Fi
eld
– Fi
eld
CBe
njam
in R
unkl
eU
SA34
.589
-91.
752
10.1
8140
/FLX
/166
9677
2017
2017
-6Am
eriF
lux
55
US-
ICs
Imna
vait
Cree
k W
ater
shed
Wet
Se
dge
Tund
raEu
geni
e Eu
skirc
hen
USA
68.6
06-1
49.3
1110
.181
40/F
LX/1
6696
7820
1420
16-9
Amer
iFlu
x56
US-
Ivo
Ivot
ukD
onat
ella
Zon
aU
SA68
.487
-155
.750
10.1
8140
/FLX
/166
9679
2013
2016
-9Am
eriF
lux
57U
S-LA
1Po
inte
-aux
-Che
nes
Brac
kish
M
arsh
Ken
Krau
ssU
SA29
.501
-90.
445
10.1
8140
/FLX
/166
9680
2011
2012
-6Am
eriF
lux
58U
S-LA
2Sa
lvad
or W
MA
Fres
hwat
er
Mar
shKe
n Kr
auss
USA
29.8
59-9
0.28
710
.181
40/F
LX/1
6696
8120
1120
13-6
Amer
iFlu
x59
US-
Los
Lost
Cre
ekAn
kur D
esai
USA
46.0
83-8
9.97
910
.181
40/F
LX/1
6696
8220
1420
18-6
Amer
iFlu
x

60U
S-M
ACM
acAr
thur
Agr
o-Ec
olog
yJe
d Sp
arks
, Sam
Ch
ambe
rlain
USA
27.1
63-8
1.18
710
.181
40/F
LX/1
6696
8320
1320
15-5
Amer
iFlu
x61
US-
MRM
Mar
sh R
esou
rce
Mea
dow
land
s M
itiga
tion
Bank
Karin
a Sc
häfe
rU
SA40
.816
-74.
044
10.1
8140
/FLX
/166
9684
2012
2013
5Am
eriF
lux
62U
S-M
ybM
aybe
rry
Wet
land
Den
nis B
aldo
cchi
USA
38.0
50-1
21.7
6510
.181
40/F
LX/1
6696
8520
1020
18-8
Amer
iFlu
x63
US-
NC4
NC_
Allig
ator
Rive
rAs
ko N
oorm
ets
USA
35.7
88-7
5.90
410
.181
40/F
LX/1
6696
8620
1220
16-5
Amer
iFlu
x64
US-
NG
BN
GEE
Arc
tic B
arro
wM
arga
ret T
orn
USA
71.2
80-1
56.6
0910
.181
40/F
LX/1
6696
8720
1220
18-9
Amer
iFlu
x65
US-
NG
CN
GEE
Arc
tic C
ounc
ilM
arga
ret T
orn
USA
64.8
61-1
63.7
0110
.181
40/F
LX/1
6696
8820
1720
18-9
Amer
iFlu
x66
US-
ORv
Ole
ntan
gy R
iver
Wet
land
Re
sear
ch P
ark
Gil
Bohr
erU
SA40
.020
-83.
018
10.1
8140
/FLX
/166
9689
2011
2015
-5Am
eriF
lux
67U
S-O
WC
Old
Wom
an C
reek
Gil
Bohr
erU
SA41
.380
-82.
512
10.1
8140
/FLX
/166
9690
2015
2016
-5Am
eriF
lux
68U
S-PF
aPa
rk F
alls
/WLE
FAn
kur D
esai
USA
45.9
46-9
0.27
210
.181
40/F
LX/1
6696
9120
1020
18-6
Amer
iFlu
x69
US-
Snd
Sher
man
Isla
ndD
enni
s Bal
docc
hiU
SA38
.037
-121
.754
10.1
8140
/FLX
/166
9692
2010
2015
-8Am
erifl
ux70
US-
Sne
Sher
man
Isla
nd R
esto
red
Wet
land
Den
nis B
aldo
cchi
USA
38.0
37-1
21.7
5510
.181
40/F
LX/1
6696
9320
1620
18-8
Amer
iFlu
x71
US-
Srr
Suis
un m
arsh
- Ru
sh R
anch
Lisa
mar
ie W
indh
am-
Mye
rsU
SA38
.201
-122
.026
10.1
8140
/FLX
/166
9694
2014
2017
-8Am
eriF
lux
72U
S-St
JSt
Jone
s Res
erve
Rodr
igo
Varg
asU
SA39
.088
-75.
437
10.1
8140
/FLX
/166
9695
2016
2016
-5Am
eriF
lux
73U
S-Tw
1Tw
itche
ll W
etla
nd W
est P
ond
Den
nis B
aldo
cchi
USA
38.1
07-1
21.6
4710
.181
40/F
LX/1
6696
9620
1120
18-8
Amer
iFlu
x74
US-
Tw3
Twitc
hell
Alfa
lfaD
enni
s Bal
docc
hiU
SA38
.116
-121
.647
10.1
8140
/FLX
/166
9697
2013
2014
-8Am
eriF
lux
75U
S-Tw
4Tw
itche
ll Ea
st E
nd W
etla
ndD
enni
s Bal
docc
hiU
SA38
.103
-121
.641
10.1
8140
/FLX
/166
9698
2013
2018
-8Am
eriF
lux
76U
S-Tw
5Ea
st P
ond
Wet
land
Den
nis B
aldo
cchi
USA
38.1
07-1
21.6
4310
.181
40/F
LX/1
6696
9920
1820
18-8
Amer
iFlu
x77
US-
Twt
Twitc
hell
Isla
ndD
enni
s Bal
docc
hiU
SA38
.109
-121
.653
10.1
8140
/FLX
/166
9700
2009
2017
-8Am
eriF
lux
78U
S-U
afU
nive
rsity
of A
lask
a, F
airb
anks
Mas
ahito
Uey
ama
USA
64.8
66-1
47.8
5610
.181
40/F
LX/1
6697
0120
1120
18-9
Amer
iFlu
x79
US-
WPT
Win
ous P
oint
Nor
th M
arsh
Jique
n Ch
en, H
ouse
n Ch
uU
SA41
.465
-82.
996
10.1
8140
/FLX
/166
9702
2011
2013
-5Am
eriF
lux
Colu
mn
Des
crip
tions
SITE
_ID
Site
iden
tific
atio
n co
de a
s as
sign
ed b
y re
gion
al fl
ux d
ata
netw
ork
SITE
_NAM
ESi
te n
ame
dete
rmin
ed b
y si
te p
erso
nnel
SITE
_PER
SON
NEL
Peop
le a
ssoc
iate
d w
ith s
ite F
LUXN
ET-C
H4 d
ata
COU
NTR
YSi
te c
ount
ryLA
TLa
titud
eLO
NLo
ngitu
de

DAT
A_D
OI
DO
I lin
k fo
r site
FLU
XNET
-CH4
dat
aYE
AR_S
TART
Year
dat
a be
gins
YEAR
_EN
DYe
ar d
ata
ends
UTC
_OFF
SET
Site
dat
a of
fset
from
Coo
rdin
ated
Uni
vers
al T
ime
(in h
ours
)O
RIG
INAL
_DAT
A_SO
URC
ERe
gion
al n
etw
ork
host
ing
the
site
met
hane
dat
a th
at w
as in
corp
orat
ed in
to F
LUXN
ET-C
H4
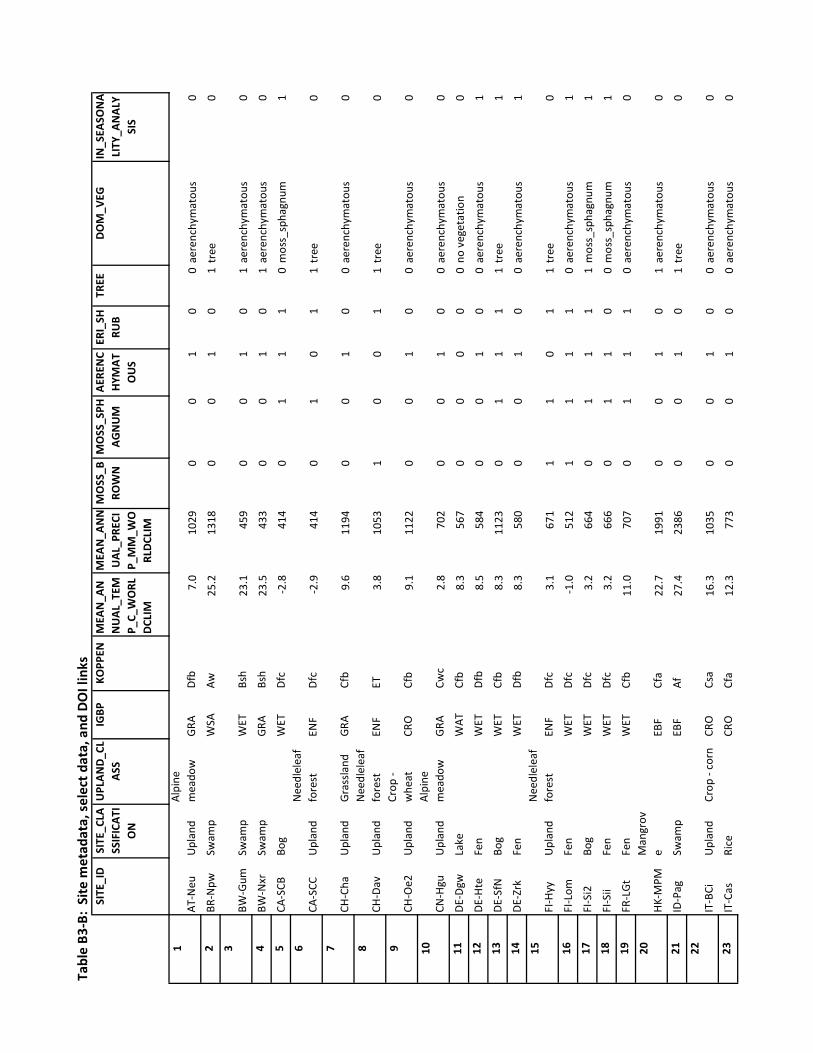
Tabl
e B3
-B:
Site
met
adat
a, s
elec
t dat
a, a
nd D
OI l
inks
SITE
_ID
SITE
_CLA
SSIF
ICAT
IO
N
UPL
AND
_CL
ASS
IGBP
KOPP
ENM
EAN
_AN
NU
AL_
TEM
P_C_
WO
RLD
CLIM
MEA
N_A
NN
UAL
_PRE
CIP_
MM
_WO
RLD
CLIM
MO
SS_B
ROW
NM
OSS
_SPH
AG
NU
MA
EREN
CH
YMA
TO
US
ERI_
SHRU
BTR
EED
OM
_VEG
IN_S
EASO
NA
LITY
_AN
ALY
SIS
1AT
-Neu
Upl
and
Alpi
ne
mea
dow
GRA
Dfb
7.0
1029
00
10
0ae
renc
hym
atou
s0
2BR
-Npw
Swam
pW
SAAw
25.2
1318
00
10
1tr
ee0
3BW
-Gum
Swam
pW
ETBs
h23
.145
90
01
01
aere
nchy
mat
ous
04
BW-N
xrSw
amp
GRA
Bsh
23.5
433
00
10
1ae
renc
hym
atou
s0
5CA
-SCB
Bog
WET
Dfc
-2.8
414
01
11
0m
oss_
spha
gnum
16
CA-S
CCU
plan
dN
eedl
elea
f fo
rest
ENF
Dfc
-2.9
414
01
01
1tr
ee0
7CH
-Cha
Upl
and
Gra
ssla
ndG
RACf
b9.
611
940
01
00
aere
nchy
mat
ous
08
CH-D
avU
plan
dN
eedl
elea
f fo
rest
ENF
ET3.
810
531
00
11
tree
09
CH-O
e2U
plan
dCr
op -
whe
atCR
OCf
b9.
111
220
01
00
aere
nchy
mat
ous
010
CN-H
guU
plan
dAl
pine
m
eado
wG
RACw
c2.
870
20
01
00
aere
nchy
mat
ous
011
DE-
Dgw
Lake
WAT
Cfb
8.3
567
00
00
0no
veg
etat
ion
012
DE-
Hte
Fen
WET
Dfb
8.5
584
00
10
0ae
renc
hym
atou
s1
13D
E-Sf
NBo
gW
ETCf
b8.
311
230
11
11
tree
114
DE-
Zrk
Fen
WET
Dfb
8.3
580
00
10
0ae
renc
hym
atou
s1
15FI
-Hyy
Upl
and
Nee
dlel
eaf
fore
stEN
FD
fc3.
167
11
10
11
tree
016
FI-L
omFe
nW
ETD
fc-1
.051
21
11
10
aere
nchy
mat
ous
117
FI-S
i2Bo
gW
ETD
fc3.
266
40
11
11
mos
s_sp
hagn
um1
18FI
-Sii
Fen
WET
Dfc
3.2
666
01
10
0m
oss_
spha
gnum
119
FR-L
Gt
Fen
WET
Cfb
11.0
707
01
11
0ae
renc
hym
atou
s0
20H
K-M
PMM
angr
ove
EBF
Cfa
22.7
1991
00
10
1ae
renc
hym
atou
s0
21ID
-Pag
Swam
pEB
FAf
27.4
2386
00
10
1tr
ee0
22IT
-BCi
Upl
and
Crop
- co
rnCR
OCs
a16
.310
350
01
00
aere
nchy
mat
ous
023
IT-C
asRi
ceCR
OCf
a12
.377
30
01
00
aere
nchy
mat
ous
0

24JP
-BBY
Bog
WET
Dfb
6.7
1153
01
11
0ae
renc
hym
atou
s1
25JP
-Mse
Rice
CRO
Cfa
14.1
1305
00
10
0ae
renc
hym
atou
s0
26JP
-Sw
LLa
keW
ATD
fb10
.211
410
01
00
aere
nchy
mat
ous
027
KR-C
RKRi
ceCR
OD
wa
9.9
1234
00
10
0ae
renc
hym
atou
s0
28M
Y-M
LMSw
amp
EBF
Af26
.934
010
00
01
tree
029
NL-
Hor
Dra
ined
Gra
ssla
ndG
RACf
b9.
782
70
01
00
aere
nchy
mat
ous
030
NZ-
Kop
Bog
EBF
Cfb
13.9
1343
01
10
0ae
renc
hym
atou
s1
31PH
-RiF
Rice
CRO
Am26
.920
100
01
00
aere
nchy
mat
ous
032
RU-C
h2W
et
tund
raW
ETD
fc-1
2.3
172
00
11
0ae
renc
hym
atou
s1
33RU
-Che
Dra
ined
WET
Dfc
-12.
317
20
01
10
aere
nchy
mat
ous
034
RU-C
okW
et
tund
raO
SHD
fc-1
4.1
210
01
11
0m
oss_
spha
gnum
035
RU-F
y2U
plan
dN
eedl
elea
f fo
rest
ENF
Dfb
4.3
694
01
01
1tr
ee0
36SE
-Deg
Fen
GRA
Dfc
1.7
620
01
11
0m
oss_
spha
gnum
137
UK-
LBT
Upl
and
Urb
anU
RBCf
b11
.064
60
00
00
no v
eget
atio
n0
38U
S-A0
3W
et
tund
raBS
VET
-11.
914
40
11
00
mos
s_sp
hagn
um0
39U
S-A1
0W
et
tund
raBS
VET
-12.
010
70
11
00
mos
s_sp
hagn
um0
40U
S-At
qW
et
tund
raW
ETET
-10.
313
31
01
10
aere
nchy
mat
ous
141
US-
Beo
Wet
tu
ndra
WET
ET-1
1.9
109
11
10
0ae
renc
hym
atou
s1
42U
S-Be
sW
et
tund
raW
ETET
-12.
010
90
11
00
aere
nchy
mat
ous
143
US-
Bi1
Dra
ined
Crop
- al
falfa
CRO
Csa
15.5
382
00
10
0ae
renc
hym
atou
s0
44U
S-Bi
2D
rain
edCr
op -
corn
CRO
Csa
15.5
380
00
10
0ae
renc
hym
atou
s0
45U
S-BZ
BBo
gW
ETD
fd-2
.429
20
11
10
eri_
shru
b1
46U
S-BZ
FFe
nW
ETD
fd-2
.529
41
11
00
aere
nchy
mat
ous
147
US-
BZS
Upl
and
Nee
dlel
eaf
fore
stEN
FD
fd-2
.429
21
00
01
tree
048
US-
CRT
Upl
and
Crop
- so
yCR
OD
fa9.
785
50
01
00
aere
nchy
mat
ous
049
US-
DPW
Mar
shW
ETCw
a22
.112
230
01
00
aere
nchy
mat
ous
1

50U
S-ED
NSa
lt m
arsh
WET
Csa
14.9
403
00
10
0ae
renc
hym
atou
s0
51U
S-EM
LU
plan
dTu
ndra
OSH
ET-3
.342
11
01
10
aere
nchy
mat
ous
052
US-
Ho1
Upl
and
Nee
dlel
eaf
fore
stEN
FD
fb5.
710
690
00
01
tree
053
US-
HRA
Rice
CRO
Cfa
16.8
1290
00
10
0ae
renc
hym
atou
s0
54U
S-H
RCRi
ceCR
OCf
a16
.812
900
01
00
aere
nchy
mat
ous
055
US-
ICs
Wet
tu
ndra
WET
ET-8
.924
20
01
10
aere
nchy
mat
ous
156
US-
Ivo
Wet
tu
ndra
WET
ET-8
.524
71
01
10
aere
nchy
mat
ous
157
US-
LA1
Salt
mar
shW
ETCf
a20
.415
960
01
00
aere
nchy
mat
ous
058
US-
LA2
Mar
shW
ETCf
a20
.016
160
01
00
aere
nchy
mat
ous
159
US-
Los
Fen
WET
Dfb
4.1
833
00
11
1er
i_sh
rub
160
US-
MAC
Dra
ined
Gra
ssla
ndW
ETCw
a22
.712
070
01
00
aere
nchy
mat
ous
061
US-
MRM
Salt
mar
shW
ETCf
a12
.012
110
01
00
aere
nchy
mat
ous
062
US-
Myb
Mar
shW
ETCs
a15
.434
60
01
00
aere
nchy
mat
ous
163
US-
NC4
Swam
pW
ETCf
a16
.513
220
01
01
aere
nchy
mat
ous
164
US-
NG
BW
et
tund
raSN
OET
-11.
910
90
11
00
mos
s_sp
hagn
um0
65U
S-N
GC
Wet
tu
ndra
GRA
ET-3
.141
30
11
10
eri_
shru
b0
66U
S-O
RvM
arsh
WET
Cfa
11.0
954
00
10
0ae
renc
hym
atou
s1
67U
S-O
WC
Mar
shW
ETD
fb9.
989
80
01
00
aere
nchy
mat
ous
168
US-
PFa
Upl
and
Mix
ed
fore
stM
FD
fb4.
382
60
00
01
tree
069
US-
Snd
Dra
ined
Gra
ssla
ndG
RACs
a15
.534
00
01
00
aere
nchy
mat
ous
070
US-
Sne
Mar
shG
RACs
a15
.534
00
01
00
aere
nchy
mat
ous
171
US-
Srr
Salt
mar
shW
ETCs
a15
.454
10
01
00
aere
nchy
mat
ous
072
US-
StJ
Salt
mar
shW
ETCf
a13
.011
330
01
00
aere
nchy
mat
ous
073
US-
Tw1
Mar
shW
ETCs
a15
.437
10
01
00
aere
nchy
mat
ous
174
US-
Tw3
Dra
ined
Crop
- al
falfa
CRO
Csa
15.4
371
00
10
0ae
renc
hym
atou
s0

75U
S-Tw
4M
arsh
WET
Csa
15.4
370
00
10
0ae
renc
hym
atou
s1
76U
S-Tw
5M
arsh
WET
Csa
15.4
371
00
10
0ae
renc
hym
atou
s1
77U
S-Tw
tRi
ceCR
OCs
a15
.337
20
01
00
aere
nchy
mat
ous
078
US-
Uaf
Bog
ENF
Dw
c-2
.829
81
11
11
mos
s_sp
hagn
um1
79U
S-W
PTM
arsh
WET
Dfa
9.9
881
00
10
0ae
renc
hym
atou
s1
Colu
mn
Des
crip
tions
SITE
_ID
Site
iden
tific
atio
n co
de a
s as
sign
ed b
y re
gion
al fl
ux d
ata
netw
ork
SITE
_CLA
SSIF
ICAT
ION
Site
cla
ssifi
catio
n ba
sed
on li
tera
ture
des
crip
tion
of s
ites
UPL
AND
_CLA
SSFo
r upl
and
site
s, c
ateg
ory
of u
plan
d ty
peIG
BPIn
tern
atio
nal G
eosp
here
–Bio
sphe
re P
rogr
amm
e (IG
BP) e
cosy
stem
sur
face
cla
ssifi
catio
nKO
PPEN
Kopp
en c
limat
e zo
ne a
bbre
viat
ion
AERE
NCH
YMAT
OU
S
ERI_
SHRU
B
TREE
DO
M_V
EGIN
_SEA
SON
ALIT
Y_AN
ALYS
ISIs
site
in fr
eshw
ater
wet
land
sea
sona
lity
anal
ysis
? 1
= ye
s, 0
= n
o.
MO
SS_S
PHAG
NU
M
MEA
N_A
NN
UAL
_TEM
P_C_
WO
RLD
CLIM
Mea
n an
nual
pre
cipi
tatio
n fr
om W
orld
Clim
2 G
loba
l Clim
ate
Dat
aM
EAN
_AN
NU
AL_P
RECI
P_M
M_W
ORL
DCL
IMM
ean
annu
al p
reci
pita
tion
from
Wor
ldCl
im2
Glo
bal C
limat
e D
ata
MO
SS_B
ROW
N
Dom
inan
t veg
etat
ion
type
in to
wer
foot
prin
t. D
om_v
eg p
rovi
ded
to A
vni M
alho
tra
by s
ite p
erso
nnel
via
sur
vey,
exc
ept 1
5 si
tes
whe
re P
Is d
id n
ot a
nsw
er a
nd A
vni M
alho
tra
estim
ated
dom
inan
t veg
etat
ion
type
bas
ed o
n si
te-li
tera
ture
Pres
ence
/abs
ence
(1/0
) aer
ench
ymat
ous
vege
tatio
n. P
rese
nce/
abse
nce
desi
gnat
ed b
y Av
ni M
alho
tra
usin
g si
te-
liter
atur
e
Pres
ence
/abs
ence
(1/0
) sph
agnu
m m
oss.
Pre
senc
e/ab
senc
e de
sign
ated
by
Avni
Mal
hotr
a us
ing
site
-lite
ratu
re
Pres
ence
/abs
ence
(1/0
) bro
wn
mos
s. P
rese
nce/
abse
nce
desi
gnat
ed b
y Av
ni M
alho
tra
usin
g si
te-li
tera
ture
Pres
ence
/abs
ence
(1/0
) eric
aceo
us s
hrub
s. P
rese
nce/
abse
nce
desi
gnat
ed b
y Av
ni M
alho
tra
usin
g si
te-li
tera
ture
Pres
ence
/abs
ence
(1/0
) tre
es. P
rese
nce/
abse
nce
desi
gnat
ed b
y Av
ni M
alho
tra
usin
g si
te-li
tera
ture

Tabl
e B3
-C:
Site
met
adat
a, s
elec
t dat
a, a
nd D
OI l
inks
SITE
_ID
Mea
n_A
ir_Te
mp_
CM
ean_
Air_
Tem
p_st
dev_
C
Ann_
Flux
_g_
CH4-
C_m
-2
Ann_
Flux
_std
ev_g
_CH
4-C_
m-2
JFM
_flu
x_g_
CH4-
C_m
-2
JFM
_flu
x_s
tdev
_g_C
H4-
C_m
-2
AMJ_
flux_
g_CH
4-C_
m-2
AM
J_flu
x_st
dev_
g_CH
4-C_
m-2
JAS_
flux_
g_CH
4-C_
m-2
JAS_
flux_
stde
v_g_
CH4-
C_m
-2
ON
D_f
lux_
g_CH
4-C_
m-
2
ON
D_f
lux_
stde
v_g_
CH4-
C_m
-2
1AT
-Neu
6.60
0.51
0.32
0.09
0.03
0.05
0.04
0.16
0.07
0.09
0.01
2BR
-Npw
25.4
40.
7319
.21
2.45
9.68
1.46
8.52
1.15
0.01
0.16
0.15
3BW
-Gum
22.7
951
.73
19.3
24
BW-N
xr23
.06
47.3
28.
8816
.90
18.0
95
CA-S
CB-0
.75
1.92
10.6
71.
342.
960.
706.
580.
771.
160.
116
CA-S
CC-0
.24
2.04
6.15
1.05
1.79
0.45
3.41
0.67
7CH
-Cha
9.74
0.54
2.95
0.88
0.75
0.18
0.99
0.37
0.60
0.28
0.61
0.25
8CH
-Dav
4.37
0.09
1.21
0.28
0.05
0.37
0.21
0.13
0.24
9CH
-Oe2
11.0
00.
290.
140.
1310
CN-H
gu3.
771.
310.
820.
010.
230.
040.
280.
150.
1511
DE-
Dgw
9.72
0.38
8.97
2.06
0.07
0.06
1.49
0.57
4.15
0.76
2.51
1.05
12D
E-H
te10
.04
0.54
48.1
17.
412.
980.
7217
.18
3.66
24.2
84.
076.
171.
4613
DE-
SfN
8.28
0.72
3.62
0.43
0.10
0.23
1.67
0.43
0.72
0.25
14D
E-Zr
k9.
550.
5130
.53
0.96
1.18
0.24
12.2
71.
5516
.18
1.47
1.51
0.56
15FI
-Hyy
4.36
-0.0
216
FI-L
om-0
.35
0.78
15.5
81.
830.
930.
223.
750.
519.
491.
251.
680.
2417
FI-S
i25.
140.
849.
740.
672.
710.
595.
831.
151.
190.
0818
FI-S
ii4.
720.
4212
.43
3.36
0.68
0.11
3.34
0.75
6.79
2.90
1.58
0.42
19FR
-LG
t11
.07
0.37
2.45
0.02
1.09
0.85
0.29
20H
K-M
PM23
.75
0.10
11.0
90.
510.
972.
330.
525.
560.
342.
950.
2621
ID-P
ag26
.57
0.19
0.09
0.00
0.19
0.13
-0.2
40.
0522
IT-B
Ci16
.69
0.39
-5.1
8-2
.69
23IT
-Cas
12.5
80.
5821
.62
5.40
0.60
5.59
3.71
15.3
12.
240.
420.
1224
JP-B
BY7.
110.
4415
.19
5.15
1.60
0.39
2.61
0.97
8.27
2.60
3.67
0.03
25JP
-Mse
13.7
59.
501.
597.
420.
4526
JP-S
wL
11.6
766
.68
39.8
618
.53
27KR
-CRK
10.9
60.
4627
.92
1.81
0.92
0.15
8.81
0.92
16.6
91.
771.
250.
1128
MY-
MLM
27.0
90.
119.
553.
282.
600.
021.
622.
3429
NL-
Hor
10.7
50.
6030
NZ-
Kop
13.6
80.
2817
.34
4.46
3.99
0.84
3.03
1.63
3.63
0.52
5.87
0.30
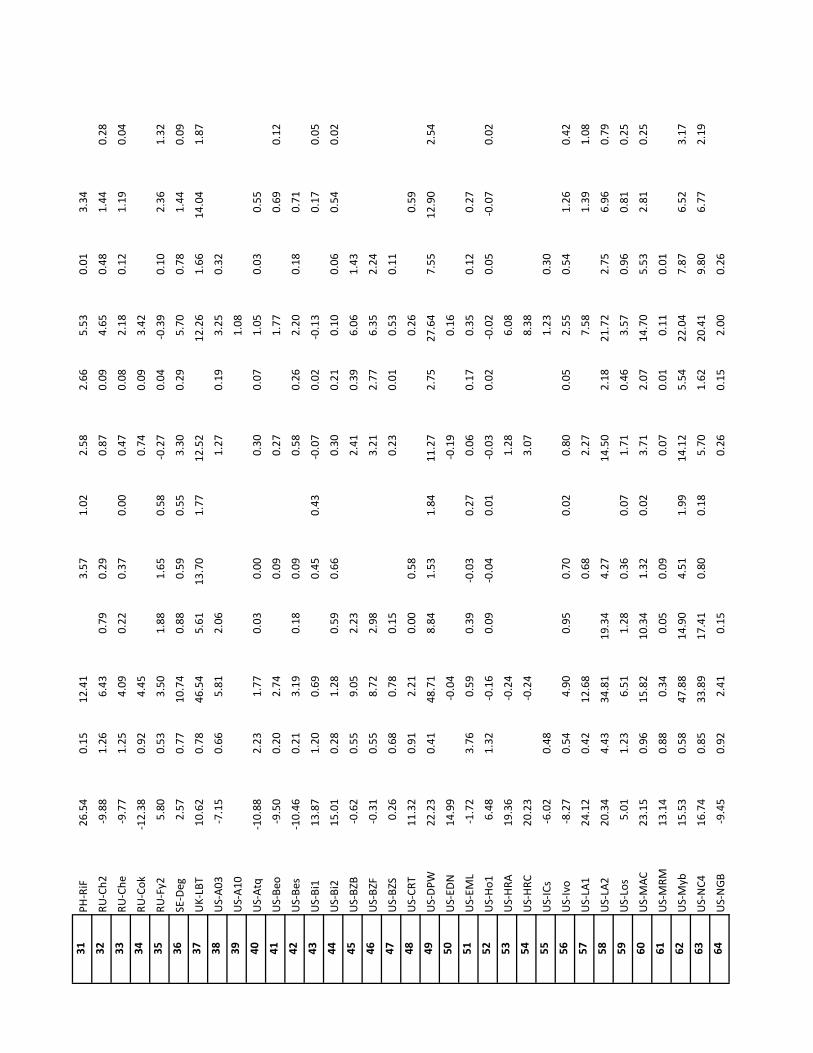
31PH
-RiF
26.5
40.
1512
.41
3.57
1.02
2.58
2.66
5.53
0.01
3.34
32RU
-Ch2
-9.8
81.
266.
430.
790.
290.
870.
094.
650.
481.
440.
2833
RU-C
he-9
.77
1.25
4.09
0.22
0.37
0.00
0.47
0.08
2.18
0.12
1.19
0.04
34RU
-Cok
-12.
380.
924.
450.
740.
093.
4235
RU-F
y25.
800.
533.
501.
881.
650.
58-0
.27
0.04
-0.3
90.
102.
361.
3236
SE-D
eg2.
570.
7710
.74
0.88
0.59
0.55
3.30
0.29
5.70
0.78
1.44
0.09
37U
K-LB
T10
.62
0.78
46.5
45.
6113
.70
1.77
12.5
212
.26
1.66
14.0
41.
8738
US-
A03
-7.1
50.
665.
812.
061.
270.
193.
250.
3239
US-
A10
1.08
40U
S-At
q-1
0.88
2.23
1.77
0.03
0.00
0.30
0.07
1.05
0.03
0.55
41U
S-Be
o-9
.50
0.20
2.74
0.09
0.27
1.77
0.69
0.12
42U
S-Be
s-1
0.46
0.21
3.19
0.18
0.09
0.58
0.26
2.20
0.18
0.71
43U
S-Bi
113
.87
1.20
0.69
0.45
0.43
-0.0
70.
02-0
.13
0.17
0.05
44U
S-Bi
215
.01
0.28
1.28
0.59
0.66
0.30
0.21
0.10
0.06
0.54
0.02
45U
S-BZ
B-0
.62
0.55
9.05
2.23
2.41
0.39
6.06
1.43
46U
S-BZ
F-0
.31
0.55
8.72
2.98
3.21
2.77
6.35
2.24
47U
S-BZ
S0.
260.
680.
780.
150.
230.
010.
530.
1148
US-
CRT
11.3
20.
912.
210.
000.
580.
260.
5949
US-
DPW
22.2
30.
4148
.71
8.84
1.53
1.84
11.2
72.
7527
.64
7.55
12.9
02.
5450
US-
EDN
14.9
9-0
.04
-0.1
90.
1651
US-
EML
-1.7
23.
760.
590.
39-0
.03
0.27
0.06
0.17
0.35
0.12
0.27
52U
S-H
o16.
481.
32-0
.16
0.09
-0.0
40.
01-0
.03
0.02
-0.0
20.
05-0
.07
0.02
53U
S-H
RA19
.36
-0.2
41.
286.
0854
US-
HRC
20.2
3-0
.24
3.07
8.38
55U
S-IC
s-6
.02
0.48
1.23
0.30
56U
S-Iv
o-8
.27
0.54
4.90
0.95
0.70
0.02
0.80
0.05
2.55
0.54
1.26
0.42
57U
S-LA
124
.12
0.42
12.6
80.
682.
277.
581.
391.
0858
US-
LA2
20.3
44.
4334
.81
19.3
44.
2714
.50
2.18
21.7
22.
756.
960.
7959
US-
Los
5.01
1.23
6.51
1.28
0.36
0.07
1.71
0.46
3.57
0.96
0.81
0.25
60U
S-M
AC23
.15
0.96
15.8
210
.34
1.32
0.02
3.71
2.07
14.7
05.
532.
810.
2561
US-
MRM
13.1
40.
880.
340.
050.
090.
070.
010.
110.
0162
US-
Myb
15.5
30.
5847
.88
14.9
04.
511.
9914
.12
5.54
22.0
47.
876.
523.
1763
US-
NC4
16.7
40.
8533
.89
17.4
10.
800.
185.
701.
6220
.41
9.80
6.77
2.19
64U
S-N
GB
-9.4
50.
922.
410.
150.
260.
152.
000.
26

65U
S-N
GC
1.21
0.82
2.52
0.00
0.86
0.41
66U
S-O
Rv12
.20
0.92
7.20
2.51
0.88
0.10
2.55
0.93
3.14
1.16
0.99
0.17
67U
S-O
WC
13.0
21.
7211
3.99
31.0
366
.03
10.0
79.
8168
US-
PFa
5.42
1.24
0.54
0.25
0.15
0.05
0.39
0.19
0.00
0.00
69U
S-Sn
d14
.76
1.16
4.71
1.71
2.00
1.79
1.11
0.74
1.35
0.61
1.74
1.14
70U
S-Sn
e15
.04
0.45
42.8
04.
482.
440.
7114
.95
5.12
12.6
110
.68
4.71
3.54
71U
S-Sr
r15
.93
0.45
0.83
0.08
0.09
0.06
0.31
0.04
0.42
0.09
0.08
0.07
72U
S-St
J13
.96
9.55
1.40
5.24
2.92
73U
S-Tw
115
.16
0.74
39.5
111
.03
4.92
1.91
10.1
33.
7418
.02
4.08
7.11
2.49
74U
S-Tw
316
.04
0.87
0.29
75U
S-Tw
415
.52
0.56
32.5
411
.74
4.39
1.75
9.49
4.83
12.7
86.
075.
891.
8376
US-
Tw5
15.0
359
.72
21.4
929
.78
8.45
77U
S-Tw
t14
.26
1.71
12.0
72.
753.
071.
101.
050.
595.
493.
151.
730.
4078
US-
Uaf
-2.8
71.
030.
530.
190.
070.
330.
1279
US-
WPT
11.4
00.
9949
.59
7.48
1.66
0.22
16.3
13.
9928
.75
3.05
3.26
0.12
Colu
mn
Des
crip
tions
SITE
_ID
Site
iden
tific
atio
n co
de a
s as
sign
ed b
y re
gion
al fl
ux d
ata
netw
ork
Mea
n_Ai
r_Te
mp_
CM
ean
annu
al a
ir te
mpe
ratu
re, c
alcu
late
d fr
om fl
ux to
wer
var
iabl
e TA
_F (C
)An
n_Fl
ux_g
_CH
4-C_
m-2
Mea
n an
nual
met
hane
flux
(g C
H4-
C/m
2/ye
ar)
JFM
_flu
x_g_
CH4-
C_m
-2M
ean
met
hane
flux
in Ja
nuar
y, F
ebru
ary,
Mar
ch (g
CH4-
C/m
2/ye
ar)
AMJ_
flux_
g_CH
4-C_
m-2
Mea
n m
etha
ne fl
ux in
Apr
il, M
ay, J
une
(gCH
4-C/
m2/
year
)JA
S_flu
x_g_
CH4-
C_m
-2M
ean
met
hane
flux
in Ju
ly, A
ugus
t, Se
ptem
ber (
gCH
4-C/
m2/
year
)O
ND
_flu
x_g_
CH4-
C_m
-2M
ean
met
hane
flux
in O
ctob
er, N
ovem
ber,
Dec
embe
r (gC
H4-
C/m
2/ye
ar)
Mea
n_Ai
r_Te
mp_
stde
v_C
Stan
dard
dev
iatio
n of
ann
ual a
ir te
mpe
ratu
re (C
)An
n_Fl
ux_s
tdev
_g_C
H4-
C_m
-2St
anda
rd d
evia
tion
of a
nnua
l met
hane
flux
(gCH
4-C/
m2/
year
)JF
M_f
lux_
stde
v_g_
CH4-
C_m
-2St
anda
rd d
evia
tion
of m
etha
ne fl
ux in
Janu
ary,
Feb
ruar
y, M
arch
(gCH
4-C/
m2/
year
)AM
J_flu
x_st
dev_
g_CH
4-C_
m-2
Stan
dard
dev
iatio
n of
met
hane
flux
in A
pril,
May
, Jun
e (g
CH4-
C/m
2/ye
ar)
JAS_
flux_
stde
v_g_
CH4-
C_m
-2St
anda
rd d
evia
tion
of m
etha
ne fl
ux in
July
, Aug
ust,
Sept
embe
r (gC
H4-
C/m
2/ye
ar)
ON
D_f
lux_
stde
v_g_
CH4-
C_m
-2St
anda
rd d
evia
tion
of m
etha
ne fl
ux in
Oct
ober
, Nov
embe
r, D
ecem
ber (
gCH
4-C/
m2/
year
)
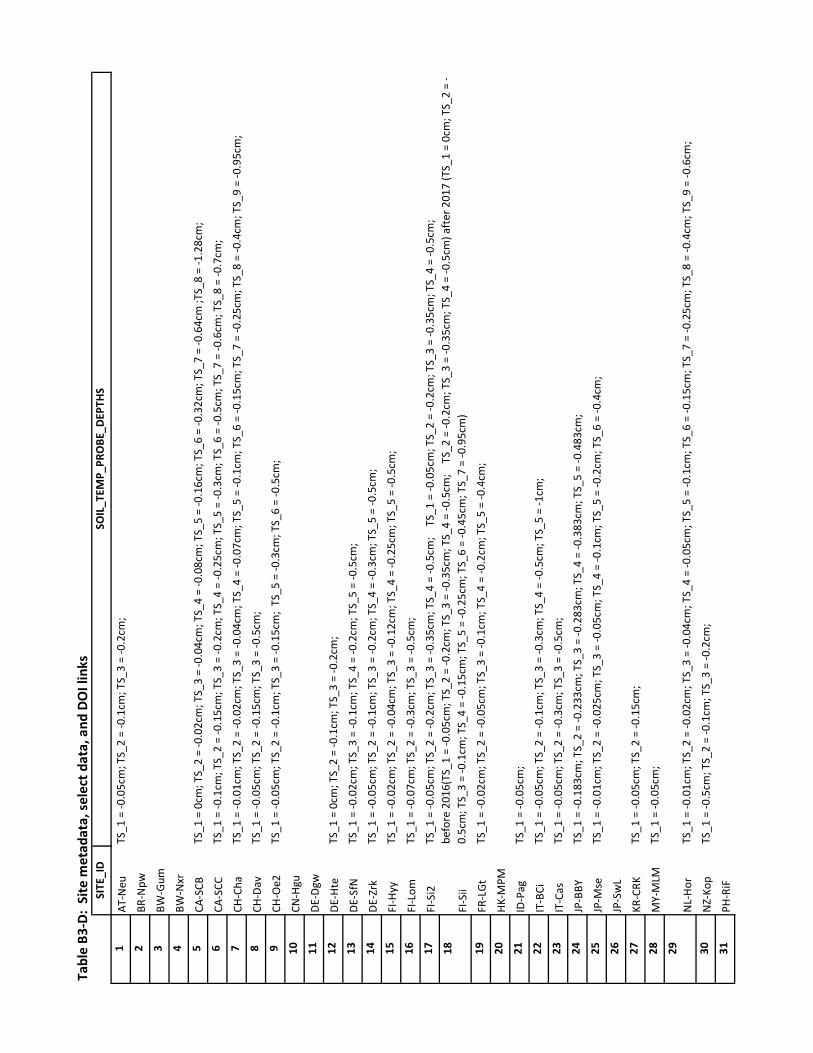
Tabl
e B3
-D:
Site
met
adat
a, s
elec
t dat
a, a
nd D
OI l
inks
SITE
_ID
SOIL
_TEM
P_PR
OBE
_DEP
THS
1AT
-Neu
TS_1
= -0
.05c
m; T
S_2
= -0
.1cm
; TS_
3 =
-0.2
cm;
2BR
-Npw
3BW
-Gum
4BW
-Nxr
5CA
-SCB
TS_1
= 0
cm; T
S_2
= -0
.02c
m; T
S_3
= -0
.04c
m; T
S_4
= -0
.08c
m; T
S_5
= -0
.16c
m; T
S_6
= -0
.32c
m; T
S_7
= -0
.64c
m ;T
S_8
= -1
.28c
m;
6CA
-SCC
TS_1
= -0
.1cm
; TS_
2 =
-0.1
5cm
; TS_
3 =
-0.2
cm; T
S_4
= -0
.25c
m; T
S_5
= -0
.3cm
; TS_
6 =
-0.5
cm; T
S_7
= -0
.6cm
; TS_
8 =
-0.7
cm;
7CH
-Cha
TS_1
= -0
.01c
m; T
S_2
= -0
.02c
m; T
S_3
= -0
.04c
m; T
S_4
= -0
.07c
m; T
S_5
= -0
.1cm
; TS_
6 =
-0.1
5cm
; TS_
7 =
-0.2
5cm
; TS_
8 =
-0.4
cm; T
S_9
= -0
.95c
m;
8CH
-Dav
TS_1
= -0
.05c
m; T
S_2
= -0
.15c
m; T
S_3
= -0
.5cm
;9
CH-O
e2TS
_1 =
-0.0
5cm
; TS_
2 =
-0.1
cm; T
S_3
= -0
.15c
m;
TS_5
= -0
.3cm
; TS_
6 =
-0.5
cm;
10CN
-Hgu
11D
E-D
gw12
DE-
Hte
TS_1
= 0
cm; T
S_2
= -0
.1cm
; TS_
3 =
-0.2
cm;
13D
E-Sf
NTS
_1 =
-0.0
2cm
; TS_
3 =
-0.1
cm; T
S_4
= -0
.2cm
; TS_
5 =
-0.5
cm;
14D
E-Zr
kTS
_1 =
-0.0
5cm
; TS_
2 =
-0.1
cm; T
S_3
= -0
.2cm
; TS_
4 =
-0.3
cm; T
S_5
= -0
.5cm
;15
FI-H
yyTS
_1 =
-0.0
2cm
; TS_
2 =
-0.0
4cm
; TS_
3 =
-0.1
2cm
; TS_
4 =
-0.2
5cm
; TS_
5 =
-0.5
cm;
16FI
-Lom
TS_1
= -0
.07c
m; T
S_2
= -0
.3cm
; TS_
3 =
-0.5
cm;
17FI
-Si2
TS_1
= -0
.05c
m; T
S_2
= -0
.2cm
; TS_
3 =
-0.3
5cm
; TS_
4 =
-0.5
cm;
TS_
1 =
-0.0
5cm
; TS_
2 =
-0.2
cm; T
S_3
= -0
.35c
m; T
S_4
= -0
.5cm
;18
FI-S
iibe
fore
201
6(TS
_1 =
-0.0
5cm
; TS_
2 =
-0.2
cm; T
S_3
= -0
.35c
m; T
S_4
= -0
.5cm
; T
S_2
= -0
.2cm
; TS_
3 =
-0.3
5cm
; TS_
4 =
-0.5
cm) a
fter
201
7 (T
S_1
= 0c
m; T
S_2
= -
0.5c
m; T
S_3
= -0
.1cm
; TS_
4 =
-0.1
5cm
; TS_
5 =
-0.2
5cm
; TS_
6 =
-0.4
5cm
; TS_
7 =
-0.9
5cm
)19
FR-L
Gt
TS_1
= -0
.02c
m; T
S_2
= -0
.05c
m; T
S_3
= -0
.1cm
; TS_
4 =
-0.2
cm; T
S_5
= -0
.4cm
;20
HK-
MPM
21ID
-Pag
TS_1
= -0
.05c
m;
22IT
-BCi
TS_1
= -0
.05c
m; T
S_2
= -0
.1cm
; TS_
3 =
-0.3
cm; T
S_4
= -0
.5cm
; TS_
5 =
-1cm
;23
IT-C
asTS
_1 =
-0.0
5cm
; TS_
2 =
-0.3
cm; T
S_3
= -0
.5cm
;24
JP-B
BYTS
_1 =
-0.1
83cm
; TS_
2 =
-0.2
33cm
; TS_
3 =
-0.2
83cm
; TS_
4 =
-0.3
83cm
; TS_
5 =
-0.4
83cm
;25
JP-M
seTS
_1 =
-0.0
1cm
; TS_
2 =
-0.0
25cm
; TS_
3 =
-0.0
5cm
; TS_
4 =
-0.1
cm; T
S_5
= -0
.2cm
; TS_
6 =
-0.4
cm;
26JP
-Sw
L27
KR-C
RKTS
_1 =
-0.0
5cm
; TS_
2 =
-0.1
5cm
;28
MY-
MLM
TS_1
= -0
.05c
m;
29N
L-H
orTS
_1 =
-0.0
1cm
; TS_
2 =
-0.0
2cm
; TS_
3 =
-0.0
4cm
; TS_
4 =
-0.0
5cm
; TS_
5 =
-0.1
cm; T
S_6
= -0
.15c
m; T
S_7
= -0
.25c
m; T
S_8
= -0
.4cm
; TS_
9 =
-0.6
cm;
30N
Z-Ko
pTS
_1 =
-0.5
cm; T
S_2
= -0
.1cm
; TS_
3 =
-0.2
cm;
31PH
-RiF

32RU
-Ch2
TS_1
= -0
.04c
m; T
S_2
= -0
.08c
m; T
S_3
= -0
.16c
m;
33RU
-Che
TS_1
= -0
.04c
m; T
S_2
= -0
.08c
m; T
S_3
= -0
.16c
m;
34RU
-Cok
35RU
-Fy2
36SE
-Deg
TS_1
= -0
.02c
m; T
S_2
= -0
.05c
m; T
S_3
= -0
.1cm
; TS_
4 =
-0.1
5cm
; TS_
5 =
-0.3
cm; T
S_6
= -0
.5cm
;37
UK-
LBT
38U
S-A0
3TS
_1 =
-0.0
25cm
; TS_
2 =
-0.1
cm; T
S_3
= -0
.3cm
;39
US-
A10
TS_1
= -0
.025
cm; T
S_2
= -0
.1cm
; TS_
3 =
-0.3
cm;
40U
S-At
q41
US-
Beo
42U
S-Be
s43
US-
Bi1
TS_1
= -0
.02c
m; T
S_2
= -0
.04c
m; T
S_3
= -0
.08c
m; T
S_4
= -0
.16c
m; T
S_5
= -0
.32c
m;
44U
S-Bi
2TS
_1 =
-0.0
2cm
; TS_
2 =
-0.0
4cm
; TS_
3 =
-0.0
8cm
; TS_
4 =
-0.1
6cm
; TS_
5 =
-0.3
2cm
;45
US-
BZB
TS_1
= -0
.075
cm; T
S_2
= -0
.05c
m;
46U
S-BZ
FTS
_1 =
-0.0
75cm
; TS_
2 =
-0.0
5cm
;47
US-
BZS
48U
S-CR
T49
US-
DPW
50U
S-ED
NTS
_1 =
-0.2
5cm
; TS_
2 =
-0.1
5cm
; TS_
3 =
-0.0
5cm
; TS_
4 =
0cm
; TS_
5 =
0.05
cm; T
S_6
= 0.
1cm
; TS_
7 =
0.2c
m; T
S_8
= 0.
3cm
;51
US-
EML
TS_1
= -0
.05c
m; T
S_2
= -0
.1cm
; TS_
3 =
-0.2
cm; T
S_4
= -0
.4cm
;52
US-
Ho1
TS_1
= -0
.05c
m; T
S_2
= -0
.1cm
;53
US-
HRA
54U
S-H
RC55
US-
ICs
TS_1
= -0
.075
cm; T
S_2
= -0
.05c
m;
56U
S-Iv
oTS
_1 =
-0.0
5cm
; TS_
2 =
-0.1
cm; T
S_3
= -0
.15c
m; T
S_4
= -0
.3cm
; TS_
5 =
-0.4
cm;
57U
S-LA
1TS
= -0
.1cm
;58
US-
LA2
TS =
-0.1
cm;
59U
S-Lo
sTS
_1 =
0cm
; TS_
2 =
-0.0
5cm
; TS_
3 =
-0.1
cm; T
S_4
= -0
.2cm
; TS_
5 =
-0.5
cm;
60U
S-M
AC61
US-
MRM
62U
S-M
ybTS
_1 =
-0.0
2cm
; TS_
2 =
-0.0
4cm
; TS_
3 =
-0.0
8cm
; TS_
4 =
-0.1
6cm
; TS_
5 =
-0.3
2cm
;63
US-
NC4
TS_1
= -0
.05c
m; T
S_2
= -0
.2cm
;64
US-
NG
B65
US-
NG
C

66U
S-O
RvTS
_1 =
-0.0
8cm
;67
US-
OW
CTS
_1 =
-0.0
5cm
; TS_
2 =
-0.3
cm;
68U
S-PF
a69
US-
Snd
TS_1
= -0
.08c
m; T
S_2
= -0
.16c
m; T
S_3
= na
ncm
; TS_
4 =
nanc
m; T
S_5
= na
ncm
; TS_
6 =
nanc
m;
70U
S-Sn
eTS
_1 =
-0.0
1cm
; TS_
2 =
-0.0
2cm
; TS_
3 =
-0.0
8cm
; TS_
4 =
-0.1
6cm
; TS_
5 =
-0.3
2cm
;71
US-
Srr
72U
S-St
JTS
_2 =
-0.0
5cm
; TS_
3 =
-0.1
cm;
73U
S-Tw
1TS
_1 =
-0.0
2cm
; TS_
2 =
-0.0
4cm
; TS_
3 =
-0.0
8cm
; TS_
4 =
-0.1
6cm
; TS_
5 =
-0.3
2cm
;74
US-
Tw3
TS_1
= -0
.02c
m; T
S_2
= -0
.04c
m; T
S_3
= -0
.08c
m; T
S_4
= -0
.16c
m; T
S_5
= -0
.32c
m;
75U
S-Tw
4TS
_1 =
-0.0
2cm
; TS_
2 =
-0.0
4cm
; TS_
3 =
-0.0
8cm
; TS_
4 =
-0.1
6cm
; TS_
5 =
-0.3
2cm
;76
US-
Tw5
TS_1
= -0
.02c
m; T
S_2
= -0
.1cm
; TS_
3 =
-0.0
2cm
; TS_
4 =
-0.0
8cm
; TS_
5 =
-0.1
6cm
;77
US-
Twt
TS_1
= -0
.02c
m; T
S_2
= -0
.04c
m; T
S_3
= -0
.08c
m; T
S_4
= -0
.16c
m; T
S_5
= -0
.32c
m;
78U
S-U
afTS
_1 =
-0.0
9cm
; TS_
2 =
-0.1
83cm
; TS_
3 =
-0.2
83cm
; TS_
4 =
-0.3
67cm
; TS_
5 =
-0.5
cm; T
S_6
= -0
.6cm
; TS_
7 =
-0.7
5cm
; TS_
8 =
-0.9
25cm
; TS_
9 =
-1cm
;79
US-
WPT
TS_1
= -0
.1cm
; TS_
2 =
-0.3
cm;
Colu
mn
Des
crip
tions
SITE
_ID
Site
iden
tific
atio
n co
de a
s as
sign
ed b
y re
gion
al fl
ux d
ata
netw
ork
Dep
th o
f soi
l tem
pera
ture
pro
be (m
), w
ith n
egat
ive
valu
es b
eing
und
er th
e su
rfac
eSO
IL_T
EMP_
PRO
BE_
DEP
THS

Table B4: Bioclimatic predictor data used in the Principal Component Analysis (PCA)
SITE_ID
Enhanced_Vegetation_Index_(EVI)
Wong_Simple_Ratio_Water_Index_(SRWI)
Latent_Heat_(LE)
Mean_Annual_Temperature_(MAT)
1 BR-Npw 0.31 0.86 87.6 25.32 BW-Gum 0.28 0.87 60.9 233 BW-Nxr 0.22 0.82 52.6 23.54 CA-SCB 0.16 1.2 27.4 -2.75 DE-Hte 0.28 1.01 40.2 8.66 DE-SfN 0.41 1.03 48.5 8.27 DE-Zrk 0.33 1.05 42.5 8.28 FI-Lom 0.2 1.27 23.6 -1.59 FI-Si2 0.27 1.12 31.6 3.3
10 FI-Sii 0.27 1.12 31.6 3.311 FR-LGt 0.4 0.97 50 10.812 ID-Pag 0.5 1.1 119.7 27.213 JP-BBY 0.25 1.21 45.4 6.514 MY-MLM 0.42 1.17 116.6 26.915 NZ-Kop 0.53 1.06 71.2 13.916 RU-Ch2 -0.01 1.25 20 -12.117 RU-Cok 0.04 1.18 16.8 -14.218 SE-Deg 0.27 1.12 29 219 US-A03 -0.07 1.28 16.1 -11.420 US-Atq -0.1 1.31 16.9 -10.221 US-BZB 0.17 1.09 26 -2.822 US-BZF 0.17 1.09 26 -2.823 US-DPW 0.32 0.88 71.8 22.224 US-ICs -0.04 1.3 18.5 -8.825 US-Ivo -0.08 1.34 18.4 -7.726 US-LA2 0.37 0.98 69.9 2027 US-Los 0.29 1.1 46.6 428 US-Myb 0.23 0.86 51 15.529 US-NC4 0.34 0.96 68.4 16.530 US-NGC 0.1 1.24 22.3 -3.231 US-ORv 0.32 0.99 50.8 10.632 US-OWC 0.27 1.05 55.8 9.933 US-Sne 0.23 0.86 51 15.534 US-Tw1 0.26 0.91 51 15.535 US-Tw4 0.26 0.91 51 15.536 US-Tw5 0.26 0.91 51 15.537 US-Uaf 0.22 1.1 25.3 -2.838 US-WPT 0.27 0.96 55.8 9.8
Column DescriptionsSITE_ID Site identification code as assigned by regional flux
Enhanced_Vegetation_Index_(EVI)
Latent_Heat_(LE)
Mean_Annual_Temperature_(MAT)
References
1
2
3
4
Latent heat in W m-2 from FLUXCOM (Jung et al., 2019), 2003-2013 monthly dataMean annual temperature (C) from BioClim (Fick & Hijman 2017), 2001-2018 monthly data
Didan, K. MOD13A3 MODIS/Terra vegetation Indices Monthly L3 Global 1km SIN Grid V006 [Data set]. NASA EOSDIS Land Processes DAAC. 2015.Fick, S.E. & R.J. Hijmans. WorldClim 2: new 1km spatial resolution climate surfaces for global land areas. International Journal of Climatology, 37(12): 4302-4315. 2017.Jung, M., Koirala, S., Weber, U., Ichii, K., Gans, F., Camps-Valls, G., Papale, D., Schwalm, C., Tramontana, G., & Reichstein, M. The FLUXCOM ensemble of global land-atmosphere energy fluxes. Scientific Data, 6(74). doi:10.1038/s41597-019-0076-8. 2019.Vermote. E. MOD09A1 MODIS Surface Reflectance 8-Day L3 Global 500m SIN Grid V006. NASA EOSDIS Land Processes DAAC. http://doi.org/10.5067/MODIS/MOD09A1.006 (Terra). 2015.
Wong_Simple_Ratio_Water_Index_(SRWI)
Enhanced vegetation index (unitless) from MOD13A3 (Didan 2015), 2001-2018 monthly data
Simple Ratio Water Index (unitless) from MOD09A1 (Vermote 2015), ~2001-2018 monthly data

Tabl
e B5
-A T
imes
at o
utpu
t for
FCH
4, G
PP_D
T, T
A, a
nd T
S (T
S fr
om s
hallo
wes
t pro
be a
t eac
h si
te)
SITE
_ID
Year
Star
t_FC
H4
_(D
OY)
End_
FC
H4_
(DO
Y)Ba
se_v
alue
_FCH
4_(n
mol
CH
4/m
2/s)
Am
pl_F
CH4_
(nm
olCH
4/m
2/s)
Peak
_FCH
4_
(DO
Y)Pe
ak_v
alue
_FC
H4_
(nm
olCH
4/m
2/s)
1AT
-Neu
2010
NaN
NaN
NaN
NaN
NaN
NaN
2AT
-Neu
2011
NaN
NaN
NaN
NaN
NaN
NaN
3AT
-Neu
2012
NaN
NaN
NaN
NaN
NaN
NaN
4BR
-Npw
2014
NaN
NaN
NaN
NaN
NaN
NaN
5BR
-Npw
2015
NaN
NaN
NaN
NaN
NaN
NaN
6BR
-Npw
2016
192.
734
5.8
-2.0
154.
827
0.0
152.
87
BW-G
um20
1834
.115
1.1
132.
918
6.2
89.0
319.
18
BW-G
um20
1923
0.4
NaN
134.
220
2.1
281.
933
6.3
9BW
-Nxr
2018
65.1
NaN
29.2
208.
728
7.5
237.
910
CA-S
CB20
1413
8.8
299.
117
.572
.322
2.4
89.8
11CA
-SCB
2015
NaN
NaN
NaN
NaN
NaN
NaN
12CA
-SCB
2016
109.
229
0.4
11.8
82.0
207.
993
.813
CA-S
CB20
1711
9.0
300.
414
.058
.922
1.5
72.9
14CA
-SCC
2013
NaN
NaN
NaN
NaN
203.
444
.815
CA-S
CC20
1412
8.4
313.
13.
140
.121
5.0
43.3
16CA
-SCC
2015
98.0
303.
91.
754
.621
0.9
56.3
17CA
-SCC
2016
102.
7N
aN1.
7N
aN20
8.0
59.6
18D
E-D
gw20
15N
aNN
aNN
aNN
aNN
aNN
aN19
DE-
Dgw
2016
NaN
NaN
NaN
NaN
NaN
NaN
20D
E-D
gw20
17N
aNN
aNN
aNN
aNN
aNN
aN21
DE-
Hte
2011
NaN
NaN
NaN
NaN
NaN
NaN
22D
E-H
te20
1282
.633
0.1
20.3
201.
820
5.5
222.
123
DE-
Hte
2013
101.
9N
aN29
.9N
aN20
1.1
378.
724
DE-
Hte
2014
NaN
338.
538
.3N
aN20
4.8
314.
125
DE-
Hte
2015
75.1
322.
429
.227
7.7
202.
030
6.9
26D
E-H
te20
1683
.928
9.7
21.5
347.
820
2.0
369.
327
DE-
Hte
2017
90.0
304.
518
.327
2.7
194.
029
0.9
28D
E-H
te20
1885
.625
8.1
21.0
322.
019
6.0
343.
029
DE-
SfN
2012
79.6
340.
74.
310
.221
7.0
14.5

30D
E-Sf
N20
13N
aNN
aN2.
73.
030
1.9
5.7
31D
E-Sf
N20
14N
aNN
aNN
aNN
aNN
aNN
aN32
DE-
Zrk
2013
NaN
NaN
NaN
NaN
NaN
NaN
33D
E-Zr
k20
14N
aNN
aNN
aNN
aNN
aNN
aN34
DE-
Zrk
2015
87.0
273.
09.
324
2.5
208.
725
1.9
35D
E-Zr
k20
1610
7.9
274.
09.
922
4.2
187.
323
4.2
36D
E-Zr
k20
1711
0.0
270.
111
.220
3.6
190.
021
4.8
37D
E-Zr
k20
1888
.126
1.0
8.5
250.
819
6.0
259.
238
FI-L
om20
0614
2.8
288.
87.
811
1.0
215.
111
8.9
39FI
-Lom
2007
139.
327
0.6
10.9
165.
021
4.5
175.
940
FI-L
om20
0813
4.0
284.
810
.812
7.7
211.
513
8.5
41FI
-Lom
2009
121.
529
1.0
12.1
132.
321
5.0
144.
442
FI-L
om20
1013
7.1
282.
813
.410
1.6
214.
011
5.0
43FI
-Si2
2012
NaN
NaN
NaN
NaN
220.
680
.044
FI-S
i220
13N
aNN
aNN
aNN
aN21
1.1
77.4
45FI
-Si2
2014
NaN
280.
77.
2N
aN21
2.8
111.
146
FI-S
i220
15N
aN30
9.5
9.5
NaN
212.
072
.247
FI-S
i220
16N
aNN
aNN
aNN
aNN
aNN
aN48
FI-S
ii20
1312
3.8
307.
67.
210
4.3
202.
511
1.5
49FI
-Sii
2014
118.
8N
aN2.
3N
aN21
5.1
112.
750
FI-S
ii20
15N
aNN
aNN
aNN
aN23
6.0
112.
751
FI-S
ii20
1611
4.5
311.
38.
912
1.1
214.
013
0.0
52FI
-Sii
2017
118.
930
0.4
6.5
57.1
203.
063
.653
FI-S
ii20
1811
6.3
295.
17.
553
.818
7.0
61.3
54H
K-M
PM20
16N
aNN
aNN
aNN
aNN
aNN
aN55
HK-
MPM
2017
NaN
NaN
NaN
NaN
NaN
NaN
56H
K-M
PM20
18N
aNN
aNN
aNN
aNN
aNN
aN57
ID-P
ag20
1627
4.1
NaN
-2.8
5.1
NaN
2.3
58JP
-BBY
2015
166.
7N
aN18
.3N
aN23
7.7
71.4
59JP
-BBY
2016
NaN
324.
918
.310
5.7
244.
312
4.0
60JP
-BBY
2017
138.
532
3.1
15.2
130.
123
6.0
145.
361
JP-B
BY20
18N
aN33
2.1
17.8
74.7
221.
092
.662
JP-M
se20
12N
aNN
aNN
aNN
aNN
aNN
aN63
KR-C
RK20
15N
aNN
aNN
aNN
aNN
aNN
aN

64KR
-CRK
2016
NaN
NaN
NaN
NaN
NaN
NaN
65KR
-CRK
2017
NaN
NaN
NaN
NaN
NaN
NaN
66KR
-CRK
2018
NaN
NaN
NaN
NaN
NaN
NaN
67M
Y-M
LM20
1422
9.6
562.
415
.519
.864
.235
.368
MY-
MLM
2015
NaN
NaN
NaN
NaN
NaN
NaN
69N
Z-Ko
p20
12-9
4.5
227.
636
.928
.317
6.2
65.2
70N
Z-Ko
p20
137.
225
1.5
21.1
61.7
182.
082
.871
NZ-
Kop
2014
10.0
228.
422
.642
.716
1.0
65.2
72N
Z-Ko
p20
15-8
.5N
aN23
.034
.715
0.0
57.8
73PH
-RiF
2012
154.
230
3.9
4.0
62.9
239.
166
.974
PH-R
iF20
1330
4.1
455.
05.
354
.038
0.3
59.3
75PH
-RiF
2014
133.
926
5.7
6.1
121.
817
8.3
127.
976
PH-R
iF20
15N
aNN
aN3.
856
.3N
aN60
.177
RU-C
h220
1415
0.8
312.
20.
770
.221
6.5
70.9
78RU
-Ch2
2015
153.
3N
aN8.
0N
aN20
9.0
56.1
79RU
-Ch2
2016
NaN
NaN
NaN
NaN
218.
868
.380
RU-C
he20
14N
aNN
aNN
aNN
aNN
aNN
aN81
RU-C
he20
15N
aNN
aNN
aNN
aNN
aNN
aN82
RU-C
he20
16N
aNN
aNN
aNN
aNN
aNN
aN83
SE-D
eg20
14N
aNN
aNN
aN80
.820
4.2
91.7
84SE
-Deg
2015
103.
331
8.7
5.1
73.7
211.
378
.885
SE-D
eg20
1610
2.5
324.
14.
374
.320
5.3
78.7
86SE
-Deg
2017
NaN
NaN
NaN
NaN
NaN
NaN
87SE
-Deg
2018
117.
232
7.6
6.9
50.9
192.
057
.888
US-
Atq
2013
NaN
NaN
NaN
NaN
NaN
NaN
89U
S-At
q20
1414
5.7
328.
70.
913
.221
5.0
14.1
90U
S-At
q20
1515
3.3
264.
01.
018
.619
3.2
19.6
91U
S-Be
o20
13N
aNN
aNN
aNN
aNN
aNN
aN92
US-
Beo
2014
157.
035
6.3
0.4
23.0
211.
423
.493
US-
Bes
2013
NaN
NaN
NaN
NaN
NaN
NaN
94U
S-Be
s20
1415
7.3
312.
60.
634
.320
6.5
34.9
95U
S-Be
s20
1514
6.8
283.
80.
635
.019
3.1
35.7
96U
S-BZ
B20
14N
aNN
aNN
aNN
aN22
6.9
67.5
97U
S-BZ
B20
15N
aNN
aNN
aNN
aN21
9.4
68.4

98U
S-BZ
B20
16N
aNN
aNN
aNN
aN22
6.1
98.4
99U
S-BZ
F20
14N
aNN
aNN
aNN
aN23
1.6
57.7
100
US-
BZF
2015
NaN
NaN
NaN
NaN
179.
087
.010
1U
S-BZ
F20
16N
aNN
aNN
aNN
aN22
0.1
119.
110
2U
S-BZ
S20
15N
aNN
aNN
aNN
aNN
aNN
aN10
3U
S-BZ
S20
16N
aNN
aNN
aNN
aNN
aNN
aN10
4U
S-D
PW20
1315
1.7
364.
016
.439
5.0
240.
741
1.4
105
US-
DPW
2014
98.9
332.
534
.533
8.0
228.
937
2.4
106
US-
DPW
2015
NaN
376.
325
.0N
aN24
8.6
247.
310
7U
S-D
PW20
1684
.238
9.2
23.5
184.
323
7.0
207.
810
8U
S-H
RA20
17N
aNN
aNN
aNN
aNN
aNN
aN10
9U
S-H
RC20
18N
aNN
aNN
aNN
aNN
aNN
aN11
0U
S-IC
s20
14N
aNN
aNN
aNN
aNN
aNN
aN11
1U
S-IC
s20
15N
aNN
aNN
aNN
aNN
aNN
aN11
2U
S-IC
s20
1613
8.2
302.
10.
218
.020
0.5
18.2
113
US-
Ivo
2013
NaN
400.
01.
929
.923
8.9
31.9
114
US-
Ivo
2014
158.
530
1.8
6.7
30.0
226.
836
.711
5U
S-Iv
o20
1515
6.8
278.
06.
919
.423
1.1
26.3
116
US-
Ivo
2016
164.
735
2.4
6.1
32.5
232.
038
.711
7U
S-LA
120
12N
aNN
aNN
aNN
aNN
aNN
aN11
8U
S-LA
220
1262
.8N
aN38
.822
5.7
229.
226
4.5
119
US-
LA2
2013
NaN
NaN
25.1
193.
221
6.2
218.
312
0U
S-Lo
s20
1412
7.1
309.
84.
035
.121
9.3
39.1
121
US-
Los
2015
143.
432
4.4
3.2
34.6
220.
737
.812
2U
S-Lo
s20
1614
3.8
310.
13.
375
.819
3.6
79.1
123
US-
Los
2017
134.
125
5.2
3.6
58.3
185.
061
.912
4U
S-Lo
s20
1814
3.0
288.
83.
052
.419
1.0
55.4
125
US-
MAC
2013
NaN
NaN
NaN
NaN
NaN
NaN
126
US-
MAC
2014
NaN
NaN
NaN
NaN
NaN
NaN
127
US-
MAC
2015
NaN
NaN
NaN
NaN
NaN
NaN
128
US-
Myb
2010
NaN
NaN
NaN
NaN
NaN
NaN
129
US-
Myb
2011
72.4
369.
318
.317
4.2
253.
519
2.5
130
US-
Myb
2012
97.2
345.
318
.936
6.6
214.
738
5.5
131
US-
Myb
2013
46.8
336.
339
.026
5.4
220.
230
4.3

132
US-
Myb
2014
57.4
334.
737
.127
6.9
206.
031
4.0
133
US-
Myb
2015
23.7
330.
021
.628
5.7
201.
030
7.3
134
US-
Myb
2016
36.9
306.
021
.921
6.0
191.
023
7.9
135
US-
Myb
2017
175.
833
2.2
30.5
191.
723
5.0
222.
213
6U
S-M
yb20
1833
.132
2.6
28.8
99.3
169.
012
8.1
137
US-
NC4
2012
132.
930
7.9
9.5
323.
823
2.2
333.
313
8U
S-N
C420
1397
.236
5.1
4.3
113.
324
0.7
117.
513
9U
S-N
C420
1411
0.6
332.
3-0
.118
1.8
253.
918
1.6
140
US-
NC4
2015
68.4
414.
1-0
.812
2.5
245.
012
1.7
141
US-
NC4
2016
128.
435
0.6
2.7
373.
625
9.0
376.
214
2U
S-O
Rv20
11N
aN29
7.3
7.3
15.2
178.
522
.414
3U
S-O
Rv20
1212
0.1
269.
18.
365
.218
9.7
73.4
144
US-
ORv
2013
72.4
308.
49.
027
.418
9.4
36.4
145
US-
ORv
2014
87.6
292.
29.
132
.420
1.0
41.5
146
US-
ORv
2015
86.0
NaN
8.9
38.5
170.
047
.414
7U
S-O
WC
2015
NaN
NaN
NaN
NaN
NaN
NaN
148
US-
OW
C20
16N
aNN
aNN
aNN
aN21
9.2
882.
814
9U
S-Sn
e20
16N
aNN
aNN
aNN
aNN
aNN
aN15
0U
S-Sn
e20
1776
.233
7.1
14.9
244.
218
7.8
259.
015
1U
S-Sn
e20
1860
.634
1.6
21.4
168.
322
2.6
189.
815
2U
S-Sr
r20
14N
aNN
aNN
aNN
aNN
aNN
aN15
3U
S-Sr
r20
15N
aNN
aNN
aNN
aNN
aNN
aN15
4U
S-Sr
r20
16N
aNN
aNN
aNN
aNN
aNN
aN15
5U
S-Sr
r20
17N
aNN
aNN
aNN
aNN
aNN
aN15
6U
S-St
J20
16N
aNN
aNN
aNN
aNN
aNN
aN15
7U
S-Tw
120
1114
0.5
352.
436
.310
4.5
233.
814
0.8
158
US-
Tw1
2012
NaN
309.
628
.124
3.5
242.
927
1.6
159
US-
Tw1
2013
33.4
307.
142
.211
4.3
218.
015
6.5
160
US-
Tw1
2014
174.
633
1.5
65.3
253.
224
0.0
318.
516
1U
S-Tw
120
1562
.333
0.3
63.8
204.
120
7.0
267.
916
2U
S-Tw
120
1632
.332
3.8
48.5
160.
022
1.0
208.
516
3U
S-Tw
120
1727
.830
5.0
43.1
138.
122
6.0
181.
116
4U
S-Tw
120
1815
5.0
314.
938
.712
7.5
228.
016
6.3
165
US-
Tw4
2014
93.8
461.
327
.436
.522
6.8
63.8

166
US-
Tw4
2015
114.
533
4.1
39.8
86.5
228.
212
6.3
167
US-
Tw4
2016
42.8
357.
143
.210
1.8
215.
614
4.9
168
US-
Tw4
2017
110.
731
8.8
55.1
201.
222
2.0
256.
316
9U
S-Tw
420
1863
.023
7.3
53.0
165.
117
3.0
218.
117
0U
S-Tw
520
18N
aN33
1.9
26.5
339.
319
6.9
365.
817
1U
S-Tw
t20
09N
aNN
aNN
aNN
aNN
aNN
aN17
2U
S-Tw
t20
10N
aNN
aNN
aNN
aNN
aNN
aN17
3U
S-Tw
t20
11N
aNN
aNN
aNN
aNN
aNN
aN17
4U
S-Tw
t20
12N
aNN
aNN
aNN
aNN
aNN
aN17
5U
S-Tw
t20
13N
aNN
aNN
aNN
aNN
aNN
aN17
6U
S-Tw
t20
14N
aNN
aNN
aNN
aNN
aNN
aN17
7U
S-Tw
t20
15N
aNN
aNN
aNN
aNN
aNN
aN17
8U
S-Tw
t20
16N
aNN
aNN
aNN
aNN
aNN
aN17
9U
S-U
af20
1115
7.6
NaN
0.8
2.1
242.
02.
818
0U
S-U
af20
1215
1.8
NaN
0.7
1.6
265.
92.
318
1U
S-U
af20
1316
7.0
NaN
0.8
1.4
267.
02.
218
2U
S-U
af20
1418
2.2
NaN
0.9
3.2
247.
04.
118
3U
S-U
af20
1517
6.0
NaN
0.8
3.5
245.
04.
318
4U
S-U
af20
1618
4.7
NaN
0.9
7.3
248.
08.
218
5U
S-U
af20
1718
2.0
NaN
0.9
6.0
248.
06.
818
6U
S-U
af20
1815
8.5
NaN
0.9
4.9
250.
05.
818
7U
S-W
PT20
1110
3.5
294.
15.
635
5.3
207.
136
0.9
188
US-
WPT
2012
90.0
296.
59.
038
0.5
195.
638
9.5
189
US-
WPT
2013
72.5
297.
07.
534
3.3
220.
035
0.8
Colu
mn
Des
crip
tions
SITE
_ID
Site
iden
tific
atio
n co
de a
s as
sign
ed b
y re
gion
al fl
ux d
ata
netw
ork
Year
Dat
a ye
arSt
art_
FCH
4_(D
OY)
Seas
on s
tart
for e
leva
ted
met
hane
flux
es (D
OY)
, poi
nt "
f" in
Fig
ure
1En
d_FC
H4_
(DO
Y)Se
ason
end
for e
leva
ted
met
hane
flux
es (D
OY)
, poi
nt "
h" in
Fig
ure
1Ba
se_v
alue
_FCH
4_(n
mol
CH4/
m2/
s)Ba
selin
e m
etha
ne fl
ux d
urin
g no
n-el
evat
ed s
easo
n (n
mol
CH
4 /m
2/ s
), av
erag
e of
poi
nts
"a"
and
"b"
in F
igur
e 1

Ampl
_FCH
4_(n
mol
CH4/
m2/
s)
Peak
_FCH
4_(D
OY)
Day
of m
axim
um e
leva
ted
met
hane
flux
(DO
Y), p
oint
"g"
in F
igur
e 1
Peak
_val
ue_F
CH4_
(nm
olCH
4/m
2/s)
Max
imum
val
ue o
f met
hane
flux
(nm
ol C
H4/
m2/
s), p
oint
"e"
in F
igur
e 1
Ampl
itude
of m
etha
ne fl
ux d
urin
g el
evat
ed fl
ux s
easo
n (n
mol
CH
4/m
2/s)
, diff
eren
ce b
etw
een
poin
t "e
" in
Fig
ure
1 an
d Ba
se_v
alue
_FCH
4

Tabl
e B5
-B T
imes
at o
utpu
t for
FCH
4, G
PP_D
T, T
A, a
nd T
S (T
S fr
om s
hallo
wes
t pro
be a
t eac
h si
te)
SITE
_ID
Year
Star
t_G
PP_D
T_(D
OY)
End_
GPP
_D
T_(D
OY)
Base
_val
ue_G
PP_D
T_(µ
mol
CO2/
m2/
s)
Ampl
_GPP
_DT_
(µm
olCO
2/m
2/s)
Peak
_GPP
_DT_
(DO
Y)Pe
ak_v
alue
_GPP
_DT_
(µm
olCO
2/m
2/s)
1AT
-Neu
2010
61.3
933
2.24
-0.2
29.
7517
5.90
9.53
2AT
-Neu
2011
76.7
130
3.74
0.18
11.3
616
7.90
11.5
43
AT-N
eu20
1284
.67
305.
480.
299.
7517
9.00
10.0
44
BR-N
pw20
1459
.47
367.
832.
035.
1024
2.90
7.13
5BR
-Npw
2015
61.5
438
5.15
2.05
5.15
228.
007.
206
BR-N
pw20
1683
.78
375.
612.
444.
7420
3.00
7.19
7BW
-Gum
2018
NaN
NaN
NaN
NaN
NaN
NaN
8BW
-Gum
2019
NaN
NaN
NaN
NaN
NaN
NaN
9BW
-Nxr
2018
NaN
NaN
NaN
NaN
NaN
NaN
10CA
-SCB
2014
127.
5326
6.07
0.10
2.69
210.
002.
7911
CA-S
CB20
1560
.15
275.
150.
103.
3519
9.40
3.45
12CA
-SCB
2016
123.
0427
7.07
0.05
3.66
191.
903.
7113
CA-S
CB20
1711
3.78
274.
630.
042.
9920
2.00
3.02
14CA
-SCC
2013
126.
4327
3.72
0.20
3.21
198.
803.
4115
CA-S
CC20
1413
0.06
269.
310.
303.
2219
4.30
3.52
16CA
-SCC
2015
104.
4126
9.97
0.28
4.54
196.
904.
8217
CA-S
CC20
1610
6.89
284.
750.
093.
6719
1.00
3.76
18D
E-D
gw20
1513
.43
348.
620.
040.
4022
7.30
0.44
19D
E-D
gw20
1631
.35
294.
270.
040.
4916
7.60
0.52
20D
E-D
gw20
1780
.56
293.
500.
040.
4619
1.00
0.50
21D
E-H
te20
1111
1.70
280.
460.
056.
8717
0.10
6.92
22D
E-H
te20
1212
2.64
296.
520.
317.
1120
0.10
7.42
23D
E-H
te20
1313
3.51
293.
970.
296.
1020
6.40
6.39
24D
E-H
te20
1437
.51
277.
700.
275.
5016
0.00
5.77
25D
E-H
te20
1512
7.82
303.
300.
275.
3519
1.00
5.61
26D
E-H
te20
1611
7.96
328.
490.
165.
3918
4.00
5.55
27D
E-H
te20
1712
3.83
301.
590.
115.
7117
7.00
5.82
28D
E-H
te20
1812
1.03
334.
060.
066.
9919
0.00
7.05
29D
E-Sf
N20
12-1
3.79
320.
940.
374.
3416
8.10
4.71

30D
E-Sf
N20
1364
.35
316.
650.
313.
9619
8.00
4.27
31D
E-Sf
N20
1443
.97
335.
840.
414.
1019
3.00
4.51
32D
E-Zr
k20
1311
0.23
283.
500.
094.
3018
6.30
4.39
33D
E-Zr
k20
1486
.61
309.
760.
063.
5618
0.40
3.62
34D
E-Zr
k20
1599
.44
264.
190.
103.
5418
6.60
3.64
35D
E-Zr
k20
1690
.31
301.
900.
134.
3821
8.00
4.51
36D
E-Zr
k20
1792
.93
303.
860.
114.
0718
0.00
4.18
37D
E-Zr
k20
1810
5.21
314.
580.
066.
9021
2.00
6.96
38FI
-Lom
2006
147.
7526
1.40
0.06
5.89
197.
405.
9539
FI-L
om20
0714
5.82
257.
550.
066.
3619
7.90
6.43
40FI
-Lom
2008
151.
6125
8.87
0.06
7.24
200.
007.
3041
FI-L
om20
0914
7.57
262.
550.
026.
5519
7.00
6.57
42FI
-Lom
2010
153.
9426
2.64
0.03
6.39
199.
006.
4143
FI-S
i220
1233
.66
276.
850.
071.
5220
9.00
1.59
44FI
-Si2
2013
106.
7833
8.07
0.13
1.63
182.
901.
7645
FI-S
i220
1440
.93
290.
000.
132.
1914
6.00
2.32
46FI
-Si2
2015
113.
2426
7.77
0.13
1.93
197.
002.
0647
FI-S
i220
1643
.90
284.
850.
131.
8516
6.00
1.98
48FI
-Sii
2013
118.
9828
2.46
-0.0
33.
7018
5.70
3.67
49FI
-Sii
2014
100.
3029
4.41
0.00
2.43
199.
702.
4450
FI-S
ii20
1584
.64
321.
890.
062.
6320
4.30
2.69
51FI
-Sii
2016
118.
7028
4.09
0.09
3.43
200.
003.
5252
FI-S
ii20
1711
7.46
290.
520.
053.
0420
6.00
3.09
53FI
-Sii
2018
113.
6329
5.59
0.04
2.32
185.
002.
3654
HK-
MPM
2016
NaN
NaN
NaN
NaN
NaN
NaN
55H
K-M
PM20
17N
aNN
aNN
aNN
aNN
aNN
aN56
HK-
MPM
2018
NaN
NaN
NaN
NaN
NaN
NaN
57ID
-Pag
2016
NaN
NaN
NaN
NaN
NaN
NaN
58JP
-BBY
2015
123.
6430
4.32
0.23
5.32
203.
405.
5659
JP-B
BY20
1611
4.13
302.
430.
037.
9420
3.20
7.98
60JP
-BBY
2017
119.
9030
0.38
0.03
7.58
199.
807.
6161
JP-B
BY20
1896
.26
311.
580.
015.
4421
7.00
5.45
62JP
-Mse
2012
144.
6326
6.88
0.63
9.81
209.
7010
.44
63KR
-CRK
2015
134.
9926
7.83
0.10
10.6
820
2.10
10.7
8

64KR
-CRK
2016
137.
2126
2.37
0.06
12.4
419
8.80
12.5
065
KR-C
RK20
1714
3.28
266.
250.
1312
.20
193.
5012
.33
66KR
-CRK
2018
138.
9726
3.80
0.17
10.9
619
8.00
11.1
367
MY-
MLM
2014
179.
9743
7.86
8.48
2.67
272.
6011
.16
68M
Y-M
LM20
1519
4.24
NaN
8.76
8.31
271.
1017
.07
69N
Z-Ko
p20
1238
.67
334.
881.
332.
5019
4.80
3.83
70N
Z-Ko
p20
1358
.12
351.
651.
502.
6119
0.00
4.10
71N
Z-Ko
p20
1442
.25
355.
001.
412.
7820
9.00
4.18
72N
Z-Ko
p20
1544
.32
366.
211.
193.
2819
3.00
4.47
73PH
-RiF
2012
NaN
NaN
NaN
NaN
NaN
NaN
74PH
-RiF
2013
NaN
NaN
NaN
NaN
NaN
NaN
75PH
-RiF
2014
NaN
NaN
NaN
NaN
NaN
NaN
76PH
-RiF
2015
NaN
NaN
NaN
NaN
NaN
NaN
77RU
-Ch2
2014
142.
9125
2.79
0.02
5.10
210.
305.
1178
RU-C
h220
1515
7.47
247.
95-0
.02
5.00
202.
604.
9779
RU-C
h220
1614
5.27
257.
90-0
.04
4.15
201.
504.
1180
RU-C
he20
1416
1.74
258.
770.
145.
5120
6.90
5.65
81RU
-Che
2015
157.
0425
0.25
0.01
5.39
203.
305.
4082
RU-C
he20
1614
0.55
258.
30-0
.10
6.94
188.
606.
8483
SE-D
eg20
1411
5.38
285.
940.
022.
7819
6.30
2.79
84SE
-Deg
2015
113.
5027
8.71
0.02
2.69
203.
402.
7085
SE-D
eg20
1611
8.80
290.
270.
022.
3219
5.50
2.35
86SE
-Deg
2017
121.
8627
6.14
0.02
2.45
199.
002.
4787
SE-D
eg20
1811
8.54
276.
630.
001.
7218
8.00
1.72
88U
S-At
q20
1333
.24
256.
460.
033.
0516
1.70
3.09
89U
S-At
q20
1413
9.11
244.
880.
091.
7719
4.30
1.86
90U
S-At
q20
1513
2.75
243.
970.
083.
4119
1.00
3.48
91U
S-Be
o20
1339
.33
285.
280.
010.
8815
9.80
0.88
92U
S-Be
o20
1488
.23
261.
540.
021.
9920
0.00
2.02
93U
S-Be
s20
1349
.45
269.
440.
040.
8418
7.90
0.87
94U
S-Be
s20
1417
4.64
262.
250.
041.
6022
0.70
1.64
95U
S-Be
s20
1516
0.53
248.
820.
042.
5319
8.40
2.57
96U
S-BZ
B20
14N
aNN
aNN
aNN
aNN
aNN
aN97
US-
BZB
2015
NaN
NaN
NaN
NaN
NaN
NaN
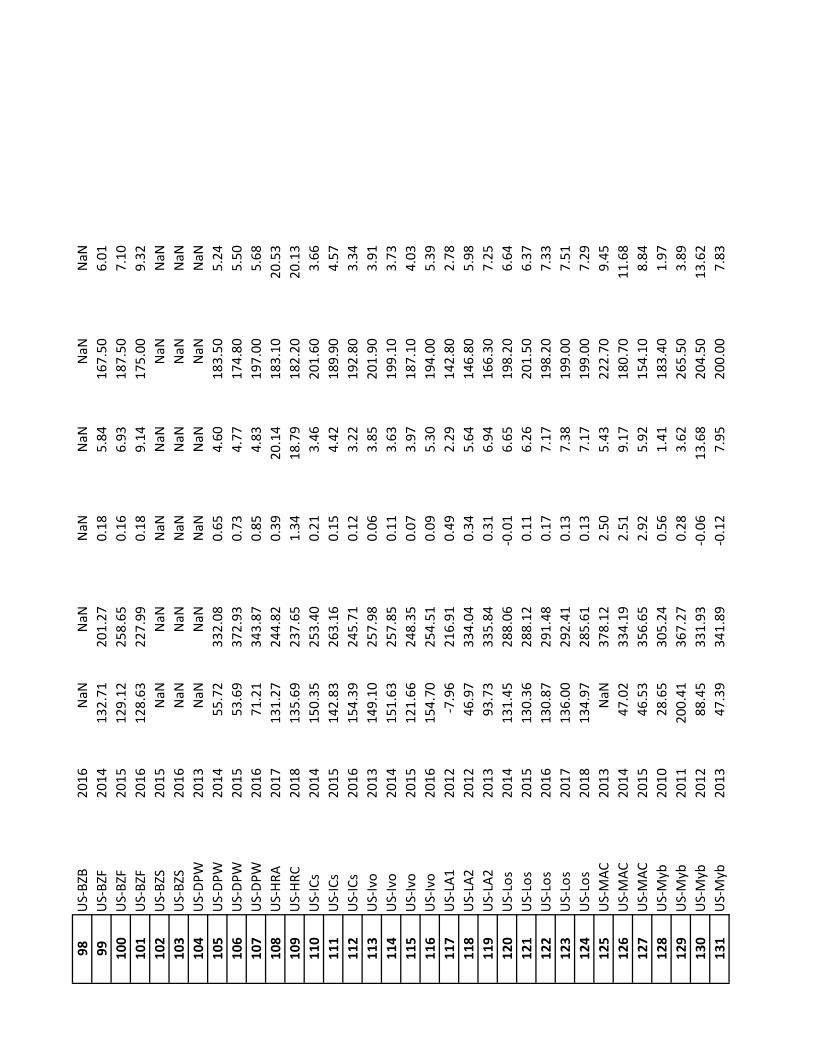
98U
S-BZ
B20
16N
aNN
aNN
aNN
aNN
aNN
aN99
US-
BZF
2014
132.
7120
1.27
0.18
5.84
167.
506.
0110
0U
S-BZ
F20
1512
9.12
258.
650.
166.
9318
7.50
7.10
101
US-
BZF
2016
128.
6322
7.99
0.18
9.14
175.
009.
3210
2U
S-BZ
S20
15N
aNN
aNN
aNN
aNN
aNN
aN10
3U
S-BZ
S20
16N
aNN
aNN
aNN
aNN
aNN
aN10
4U
S-D
PW20
13N
aNN
aNN
aNN
aNN
aNN
aN10
5U
S-D
PW20
1455
.72
332.
080.
654.
6018
3.50
5.24
106
US-
DPW
2015
53.6
937
2.93
0.73
4.77
174.
805.
5010
7U
S-D
PW20
1671
.21
343.
870.
854.
8319
7.00
5.68
108
US-
HRA
2017
131.
2724
4.82
0.39
20.1
418
3.10
20.5
310
9U
S-H
RC20
1813
5.69
237.
651.
3418
.79
182.
2020
.13
110
US-
ICs
2014
150.
3525
3.40
0.21
3.46
201.
603.
6611
1U
S-IC
s20
1514
2.83
263.
160.
154.
4218
9.90
4.57
112
US-
ICs
2016
154.
3924
5.71
0.12
3.22
192.
803.
3411
3U
S-Iv
o20
1314
9.10
257.
980.
063.
8520
1.90
3.91
114
US-
Ivo
2014
151.
6325
7.85
0.11
3.63
199.
103.
7311
5U
S-Iv
o20
1512
1.66
248.
350.
073.
9718
7.10
4.03
116
US-
Ivo
2016
154.
7025
4.51
0.09
5.30
194.
005.
3911
7U
S-LA
120
12-7
.96
216.
910.
492.
2914
2.80
2.78
118
US-
LA2
2012
46.9
733
4.04
0.34
5.64
146.
805.
9811
9U
S-LA
220
1393
.73
335.
840.
316.
9416
6.30
7.25
120
US-
Los
2014
131.
4528
8.06
-0.0
16.
6519
8.20
6.64
121
US-
Los
2015
130.
3628
8.12
0.11
6.26
201.
506.
3712
2U
S-Lo
s20
1613
0.87
291.
480.
177.
1719
8.20
7.33
123
US-
Los
2017
136.
0029
2.41
0.13
7.38
199.
007.
5112
4U
S-Lo
s20
1813
4.97
285.
610.
137.
1719
9.00
7.29
125
US-
MAC
2013
NaN
378.
122.
505.
4322
2.70
9.45
126
US-
MAC
2014
47.0
233
4.19
2.51
9.17
180.
7011
.68
127
US-
MAC
2015
46.5
335
6.65
2.92
5.92
154.
108.
8412
8U
S-M
yb20
1028
.65
305.
240.
561.
4118
3.40
1.97
129
US-
Myb
2011
200.
4136
7.27
0.28
3.62
265.
503.
8913
0U
S-M
yb20
1288
.45
331.
93-0
.06
13.6
820
4.50
13.6
213
1U
S-M
yb20
1347
.39
341.
89-0
.12
7.95
200.
007.
83

132
US-
Myb
2014
86.8
031
0.73
0.16
8.20
168.
008.
3613
3U
S-M
yb20
1576
.10
323.
190.
177.
3120
2.00
7.47
134
US-
Myb
2016
24.1
132
8.43
0.00
4.03
176.
004.
0313
5U
S-M
yb20
1767
.46
395.
16-0
.24
5.79
202.
005.
5513
6U
S-M
yb20
1883
.66
331.
31-0
.25
10.5
020
1.00
10.2
513
7U
S-N
C420
12N
aNN
aNN
aNN
aNN
aNN
aN13
8U
S-N
C420
1394
.35
304.
810.
786.
9718
1.00
7.75
139
US-
NC4
2014
97.5
135
4.46
0.64
6.09
173.
706.
7314
0U
S-N
C420
1592
.03
315.
080.
749.
7318
5.00
10.4
714
1U
S-N
C420
1699
.57
326.
980.
928.
2218
3.00
9.14
142
US-
ORv
2011
88.7
731
6.45
-0.0
67.
3918
0.40
7.33
143
US-
ORv
2012
93.5
030
3.39
0.27
9.29
181.
009.
5514
4U
S-O
Rv20
1310
7.62
305.
230.
3610
.11
192.
4010
.46
145
US-
ORv
2014
109.
3129
9.17
0.24
10.1
419
0.00
10.3
814
6U
S-O
Rv20
1510
5.01
301.
560.
279.
6419
4.00
9.91
147
US-
OW
C20
15N
aN30
1.35
0.26
6.72
151.
306.
9814
8U
S-O
WC
2016
116.
0530
9.20
0.30
6.44
204.
006.
7314
9U
S-Sn
e20
16-2
1.79
306.
160.
347.
9919
0.30
8.34
150
US-
Sne
2017
NaN
NaN
NaN
NaN
NaN
NaN
151
US-
Sne
2018
84.6
337
0.31
0.32
2.43
202.
002.
7515
2U
S-Sr
r20
1447
.02
307.
530.
786.
0417
5.60
6.83
153
US-
Srr
2015
35.5
032
0.88
0.33
7.96
158.
608.
2915
4U
S-Sr
r20
1644
.76
318.
870.
388.
8617
0.80
9.24
155
US-
Srr
2017
56.7
530
9.79
0.30
10.4
618
5.00
10.7
615
6U
S-St
J20
1612
0.72
280.
751.
3012
.01
193.
8013
.31
157
US-
Tw1
2011
NaN
NaN
NaN
NaN
NaN
NaN
158
US-
Tw1
2012
102.
1232
5.54
0.00
12.8
321
6.10
12.8
315
9U
S-Tw
120
1398
.35
338.
02-0
.18
13.1
120
8.40
12.9
316
0U
S-Tw
120
1495
.66
326.
270.
1210
.46
208.
0010
.58
161
US-
Tw1
2015
105.
5334
4.13
0.26
9.88
215.
0010
.13
162
US-
Tw1
2016
91.8
231
3.13
-0.0
110
.10
209.
0010
.09
163
US-
Tw1
2017
93.3
632
9.76
-0.0
411
.26
214.
0011
.22
164
US-
Tw1
2018
119.
0436
3.78
-0.0
212
.73
217.
0012
.70
165
US-
Tw4
2014
160.
0436
3.23
0.00
4.70
236.
604.
70

166
US-
Tw4
2015
57.2
233
5.89
0.01
8.11
213.
008.
1316
7U
S-Tw
420
1676
.15
311.
330.
178.
2218
5.00
8.39
168
US-
Tw4
2017
100.
1933
2.90
0.14
8.76
214.
008.
9016
9U
S-Tw
420
1898
.39
337.
780.
0411
.84
206.
0011
.88
170
US-
Tw5
2018
115.
9432
1.33
1.77
6.68
231.
108.
4517
1U
S-Tw
t20
0914
9.98
293.
010.
2012
.46
212.
0012
.66
172
US-
Twt
2010
141.
1031
1.91
0.10
13.7
122
4.40
13.8
117
3U
S-Tw
t20
1115
8.51
288.
690.
1214
.22
215.
9014
.34
174
US-
Twt
2012
166.
8430
8.78
0.21
12.3
123
3.00
12.5
217
5U
S-Tw
t20
1313
8.24
272.
380.
2716
.71
202.
0016
.98
176
US-
Twt
2014
148.
1428
1.40
0.16
15.0
120
5.00
15.1
717
7U
S-Tw
t20
1513
7.11
277.
230.
1711
.52
218.
0011
.68
178
US-
Twt
2016
169.
1428
9.90
0.29
13.8
022
4.00
14.0
817
9U
S-U
af20
1111
4.56
283.
490.
126.
0419
6.90
6.17
180
US-
Uaf
2012
88.0
327
1.24
0.18
6.58
187.
306.
7618
1U
S-U
af20
1312
4.13
271.
610.
225.
7919
2.10
6.01
182
US-
Uaf
2014
84.6
326
9.30
0.14
5.32
188.
005.
4618
3U
S-U
af20
1590
.52
264.
290.
095.
1719
6.00
5.25
184
US-
Uaf
2016
103.
0627
0.75
0.14
4.66
192.
004.
8018
5U
S-U
af20
1710
2.29
275.
580.
146.
1019
8.00
6.25
186
US-
Uaf
2018
111.
6529
1.46
0.04
5.60
190.
005.
6418
7U
S-W
PT20
1113
4.98
285.
590.
247.
4320
6.10
7.67
188
US-
WPT
2012
129.
0429
3.67
0.06
6.97
205.
907.
0318
9U
S-W
PT20
1313
4.87
278.
120.
056.
2020
0.90
6.24
Colu
mn
Des
crip
tions
SITE
_ID
Site
iden
tific
atio
n co
de a
s as
sign
ed b
y re
gion
al fl
ux d
ata
netw
ork
Year
Dat
a ye
arSt
art_
GPP
_DT_
(DO
Y)Se
ason
sta
rt fo
r ele
vate
d G
PP_D
T (D
OY)
, poi
nt "
f" in
Fig
ure
1En
d_G
PP_D
T_(D
OY)
Seas
on e
nd fo
r ele
vate
d G
PP_D
T flu
xes
(DO
Y), p
oint
"h"
in F
igur
e 1
Base
_val
ue_G
PP_D
T_(µ
mol
CO2/
m2/
s)Ba
selin
e G
PP_D
T flu
x du
ring
non-
elev
ated
sea
son
(µm
ol C
O2/
m2/
s), a
vera
ge o
f poi
nts
"a"
and
"b"
in F
igur
e 1

Ampl
_GPP
_DT_
(µm
olCO
2/m
2/s)
Peak
_GPP
_DT_
(DO
Y)D
ay o
f max
imum
ele
vate
d G
PP_D
T flu
x (D
OY)
, poi
nt "
g" in
Fig
ure
1Pe
ak_v
alue
_GPP
_DT_
(µm
olCO
2/m
2/s)
Max
imum
val
ue o
f GPP
_DT
flux
(µm
ol C
O2/
m2/
s), p
oint
"e"
in F
igur
e 1
Ampl
itude
of G
PP_D
T flu
x du
ring
elev
ated
flux
sea
son
(µm
ol C
O2/
m2/
s), d
iffer
ence
bet
wee
n po
int "
e" in
Fig
ure
1 an
d Ba
se_v
alue
_GPP
_DT

Tabl
e B5
-C T
imes
at o
utpu
t for
FCH
4, G
PP_D
T, T
A, a
nd T
S (T
S fr
om s
hallo
wes
t pro
be a
t eac
h si
te)
SITE
_ID
Year
Star
t_TA
_(D
OY)
End_
TA_(
DO
Y)Ba
se_v
alue
_TA
_(C)
Ampl
_TA_
(C)
Peak
_TA_
(DO
Y)Pe
ak_v
alue
_TA
_(C)
1AT
-Neu
2010
43.1
735
1.66
-4.8
420
.94
195.
9016
.10
2AT
-Neu
2011
18.4
735
9.91
-5.0
820
.55
198.
5015
.47
3AT
-Neu
2012
38.0
336
6.62
-5.5
722
.35
197.
2016
.78
4BR
-Npw
2014
NaN
NaN
NaN
NaN
NaN
NaN
5BR
-Npw
2015
NaN
NaN
NaN
NaN
NaN
NaN
6BR
-Npw
2016
7.49
348.
6719
.56
7.53
211.
0027
.10
7BW
-Gum
2018
NaN
NaN
NaN
NaN
NaN
NaN
8BW
-Gum
2019
NaN
NaN
NaN
NaN
NaN
NaN
9BW
-Nxr
2018
NaN
NaN
NaN
NaN
NaN
NaN
10CA
-SCB
2014
60.2
333
5.31
-23.
3341
.29
197.
4017
.96
11CA
-SCB
2015
45.1
136
0.83
-21.
7539
.11
186.
4017
.37
12CA
-SCB
2016
49.7
733
5.79
-18.
8837
.28
193.
9018
.40
13CA
-SCB
2017
64.6
832
7.30
-18.
4535
.95
201.
0017
.50
14CA
-SCC
2013
67.5
733
8.23
-21.
0839
.13
203.
8018
.05
15CA
-SCC
2014
54.1
433
7.83
-22.
2740
.98
196.
7018
.72
16CA
-SCC
2015
46.4
135
9.38
-20.
0937
.86
187.
1017
.77
17CA
-SCC
2016
47.3
135
0.23
-18.
7637
.65
194.
0018
.89
18D
E-D
gw20
1572
.47
347.
562.
1816
.25
203.
8018
.42
19D
E-D
gw20
1664
.46
324.
691.
3417
.37
205.
4018
.71
20D
E-D
gw20
1743
.79
375.
32-0
.17
18.4
720
2.20
18.3
021
DE-
Hte
2011
NaN
NaN
NaN
NaN
NaN
NaN
22D
E-H
te20
1250
.34
352.
490.
7717
.03
207.
6017
.80
23D
E-H
te20
1383
.53
365.
301.
6417
.09
202.
5018
.73
24D
E-H
te20
1448
.71
352.
472.
8615
.82
213.
0018
.68
25D
E-H
te20
1557
.62
366.
352.
5915
.33
211.
0017
.92
26D
E-H
te20
1667
.53
323.
102.
7516
.01
211.
0018
.76
27D
E-H
te20
1758
.94
370.
071.
8116
.22
212.
0018
.02
28D
E-H
te20
1874
.55
368.
020.
9119
.14
203.
0020
.05
29D
E-Sf
N20
1254
.86
355.
18-2
.09
20.2
519
6.30
18.1
630
DE-
SfN
2013
64.6
434
4.04
-0.3
518
.57
202.
8018
.22
31D
E-Sf
N20
14N
aNN
aNN
aNN
aNN
aNN
aN

32D
E-Zr
k20
13N
aNN
aNN
aNN
aNN
aNN
aN33
DE-
Zrk
2014
NaN
NaN
NaN
NaN
NaN
NaN
34D
E-Zr
k20
1549
.71
355.
392.
1315
.33
203.
4017
.46
35D
E-Zr
k20
1663
.30
323.
761.
8516
.45
204.
0018
.31
36D
E-Zr
k20
1745
.25
372.
480.
4717
.44
205.
0017
.91
37D
E-Zr
k20
1875
.77
358.
90-0
.10
18.7
819
0.00
18.6
838
FI-L
om20
0672
.49
355.
63-1
2.19
26.6
719
5.00
14.4
839
FI-L
om20
0756
.24
372.
50-1
1.01
22.6
019
3.40
11.5
940
FI-L
om20
0873
.45
348.
05-1
0.36
22.3
020
0.40
11.9
541
FI-L
om20
0956
.72
356.
29-1
3.61
27.0
920
5.00
13.4
842
FI-L
om20
1054
.81
346.
00-1
6.10
27.8
120
0.00
11.7
143
FI-S
i220
1270
.38
349.
74-6
.91
22.7
219
9.10
15.8
144
FI-S
i220
1388
.15
369.
48-5
.99
23.7
418
8.60
17.7
645
FI-S
i220
1453
.29
350.
42-4
.39
21.5
020
0.30
17.1
146
FI-S
i220
1539
.64
359.
19-5
.00
19.3
921
2.00
14.3
947
FI-S
i220
1642
.62
345.
02-6
.72
23.1
719
9.00
16.4
548
FI-S
ii20
1389
.28
363.
91-5
.74
22.2
418
9.10
16.5
049
FI-S
ii20
1452
.05
339.
85-4
.36
21.5
220
0.90
17.1
550
FI-S
ii20
1534
.40
357.
72-5
.42
19.6
620
9.50
14.2
551
FI-S
ii20
1655
.00
320.
65-5
.24
20.9
019
5.00
15.6
652
FI-S
ii20
1761
.62
377.
27-6
.32
20.9
320
8.00
14.6
153
FI-S
ii20
1874
.22
378.
66-8
.98
27.3
719
5.00
18.3
954
HK-
MPM
2016
53.5
937
8.86
15.9
713
.27
198.
1029
.24
55H
K-M
PM20
1749
.13
357.
3216
.27
13.0
721
5.60
29.3
456
HK-
MPM
2018
42.1
138
3.02
15.2
514
.05
199.
0029
.30
57ID
-Pag
2016
NaN
NaN
NaN
NaN
NaN
NaN
58JP
-BBY
2015
56.1
835
5.66
-5.3
025
.89
209.
5020
.58
59JP
-BBY
2016
46.0
634
8.04
-7.1
328
.01
212.
0020
.89
60JP
-BBY
2017
44.6
536
1.65
-7.4
728
.20
208.
7020
.73
61JP
-BBY
2018
45.6
336
7.94
-7.5
527
.12
210.
0019
.57
62JP
-Mse
2012
54.4
835
1.81
1.48
24.5
921
9.90
26.0
863
KR-C
RK20
15N
aNN
aNN
aNN
aNN
aNN
aN64
KR-C
RK20
16N
aNN
aNN
aNN
aNN
aNN
aN65
KR-C
RK20
17N
aNN
aNN
aNN
aNN
aNN
aN

66KR
-CRK
2018
NaN
NaN
NaN
NaN
NaN
NaN
67M
Y-M
LM20
1417
.51
365.
8025
.97
1.95
179.
4027
.91
68M
Y-M
LM20
15N
aNN
aNN
aNN
aNN
aNN
aN69
NZ-
Kop
2012
50.8
434
7.05
9.12
9.72
219.
9018
.84
70N
Z-Ko
p20
1339
.31
352.
939.
318.
2820
9.60
17.6
071
NZ-
Kop
2014
53.4
535
2.71
9.08
9.68
215.
0018
.76
72N
Z-Ko
p20
1551
.01
357.
778.
5510
.41
212.
0018
.96
73PH
-RiF
2012
NaN
NaN
NaN
NaN
NaN
NaN
74PH
-RiF
2013
NaN
NaN
NaN
NaN
NaN
NaN
75PH
-RiF
2014
NaN
NaN
NaN
NaN
NaN
NaN
76PH
-RiF
2015
NaN
NaN
NaN
NaN
NaN
NaN
77RU
-Ch2
2014
62.0
733
9.91
-31.
5846
.02
208.
4014
.44
78RU
-Ch2
2015
54.0
934
0.02
-34.
3747
.59
204.
4013
.23
79RU
-Ch2
2016
56.4
437
3.19
-34.
3848
.39
201.
9014
.00
80RU
-Che
2014
61.3
533
9.96
-31.
5445
.92
208.
0014
.37
81RU
-Che
2015
53.1
934
0.10
-34.
2847
.55
204.
3013
.26
82RU
-Che
2016
55.8
837
2.30
-34.
2948
.37
201.
7014
.08
83SE
-Deg
2014
69.5
732
7.67
-5.2
421
.42
201.
0016
.18
84SE
-Deg
2015
29.6
935
2.18
-7.3
819
.31
213.
9011
.93
85SE
-Deg
2016
54.6
933
1.26
-7.3
420
.99
197.
1013
.65
86SE
-Deg
2017
61.8
735
3.17
-8.3
521
.32
210.
0012
.98
87SE
-Deg
2018
74.3
637
3.70
-11.
3426
.53
193.
0015
.18
88U
S-At
q20
13N
aNN
aNN
aNN
aNN
aNN
aN89
US-
Atq
2014
70.0
536
0.75
-25.
8132
.20
203.
406.
3890
US-
Atq
2015
84.0
734
7.24
-26.
0734
.70
196.
708.
6391
US-
Beo
2013
NaN
NaN
NaN
NaN
NaN
NaN
92U
S-Be
o20
1463
.26
351.
27-2
2.70
25.6
120
3.20
2.91
93U
S-Be
s20
13N
aNN
aNN
aNN
aNN
aNN
aN94
US-
Bes
2014
76.6
235
7.34
-24.
7426
.57
208.
301.
8395
US-
Bes
2015
82.6
634
4.05
-25.
1629
.49
203.
304.
3296
US-
BZB
2014
65.0
533
9.25
-17.
1232
.08
189.
6014
.95
97U
S-BZ
B20
1552
.17
340.
04-1
7.27
33.8
618
1.60
16.5
898
US-
BZB
2016
35.7
032
1.04
-16.
8833
.52
192.
5016
.64
99U
S-BZ
F20
1464
.65
341.
50-1
6.78
31.9
819
0.50
15.2
0

100
US-
BZF
2015
52.1
934
0.98
-16.
9333
.41
181.
5016
.48
101
US-
BZF
2016
34.6
032
1.31
-16.
5733
.21
194.
0016
.63
102
US-
BZS
2015
46.2
434
3.61
-17.
4134
.59
180.
2017
.18
103
US-
BZS
2016
32.5
532
0.26
-15.
9133
.02
193.
8017
.11
104
US-
DPW
2013
59.4
536
1.72
16.3
010
.86
220.
8027
.16
105
US-
DPW
2014
38.6
632
6.75
15.9
911
.79
210.
3027
.78
106
US-
DPW
2015
33.6
238
1.23
15.9
39.
9821
1.80
25.9
110
7U
S-D
PW20
1645
.53
367.
0915
.72
12.8
120
3.00
28.5
310
8U
S-H
RA20
17N
aNN
aNN
aNN
aNN
aNN
aN10
9U
S-H
RC20
18N
aNN
aNN
aNN
aNN
aNN
aN11
0U
S-IC
s20
14N
aNN
aNN
aNN
aNN
aNN
aN11
1U
S-IC
s20
15N
aNN
aNN
aNN
aNN
aNN
aN11
2U
S-IC
s20
1668
.13
328.
76-1
6.90
26.3
419
6.80
9.44
113
US-
Ivo
2013
93.1
336
0.42
-23.
3636
.20
193.
6012
.84
114
US-
Ivo
2014
69.0
034
1.89
-21.
4430
.70
193.
509.
2611
5U
S-Iv
o20
1590
.83
326.
77-2
1.52
31.9
418
8.60
10.4
211
6U
S-Iv
o20
1690
.00
339.
98-2
1.61
31.3
319
7.00
9.72
117
US-
LA1
2012
31.0
530
2.54
19.0
78.
8517
7.60
27.9
211
8U
S-LA
220
1235
.18
316.
8716
.70
11.5
519
7.40
28.2
511
9U
S-LA
220
1371
.41
321.
1715
.91
13.3
221
0.60
29.2
312
0U
S-Lo
s20
1458
.01
365.
46-1
4.20
33.1
019
5.40
18.8
912
1U
S-Lo
s20
1550
.36
367.
57-1
0.76
29.3
720
3.50
18.6
012
2U
S-Lo
s20
1639
.16
356.
37-9
.11
29.0
720
9.40
19.9
612
3U
S-Lo
s20
1730
.73
345.
36-9
.80
28.0
921
2.00
18.2
912
4U
S-Lo
s20
1869
.61
336.
03-9
.75
29.7
619
7.00
20.0
212
5U
S-M
AC20
13N
aNN
aNN
aNN
aNN
aNN
aN12
6U
S-M
AC20
1442
.39
323.
9617
.10
9.77
211.
2026
.87
127
US-
MAC
2015
39.4
832
8.01
16.9
49.
6220
0.60
26.5
612
8U
S-M
yb20
10N
aNN
aNN
aNN
aNN
aNN
aN12
9U
S-M
yb20
1131
.10
331.
808.
1512
.63
223.
6020
.78
130
US-
Myb
2012
16.5
435
8.52
7.18
13.4
721
4.90
20.6
613
1U
S-M
yb20
1324
.44
342.
297.
2613
.44
197.
0020
.70
132
US-
Myb
2014
11.5
235
3.52
8.78
12.7
621
1.00
21.5
413
3U
S-M
yb20
15-0
.97
325.
628.
8813
.12
228.
0021
.99

134
US-
Myb
2016
-3.3
435
1.73
7.96
12.9
720
8.00
20.9
313
5U
S-M
yb20
1727
.35
345.
828.
3013
.88
214.
0022
.19
136
US-
Myb
2018
44.4
033
2.57
9.03
11.4
621
8.00
20.4
913
7U
S-N
C420
1257
.32
339.
289.
0117
.49
208.
7026
.50
138
US-
NC4
2013
69.2
735
2.37
6.79
19.0
120
4.60
25.7
913
9U
S-N
C420
1449
.17
367.
685.
4118
.30
206.
3023
.71
140
US-
NC4
2015
64.4
339
2.18
6.92
19.4
220
2.00
26.3
314
1U
S-N
C420
1653
.97
350.
618.
1419
.07
215.
0027
.21
142
US-
ORv
2011
63.9
635
8.28
0.50
25.0
719
5.20
25.5
714
3U
S-O
Rv20
1232
.88
351.
310.
8424
.92
195.
9025
.76
144
US-
ORv
2013
51.2
135
5.78
-2.4
425
.94
203.
6023
.50
145
US-
ORv
2014
51.3
037
0.00
-4.3
527
.96
196.
0023
.61
146
US-
ORv
2015
62.5
239
3.56
-4.5
827
.87
199.
0023
.29
147
US-
OW
C20
15N
aNN
aNN
aNN
aNN
aNN
aN14
8U
S-O
WC
2016
56.1
936
5.00
2.20
22.6
521
1.80
24.8
514
9U
S-Sn
e20
16N
aNN
aNN
aNN
aNN
aNN
aN15
0U
S-Sn
e20
179.
2334
4.35
7.29
14.5
221
7.90
21.8
015
1U
S-Sn
e20
1849
.63
357.
437.
1413
.97
220.
9021
.11
152
US-
Srr
2014
50.5
633
7.45
10.7
410
.06
217.
3020
.80
153
US-
Srr
2015
4.98
323.
359.
4912
.20
235.
3021
.69
154
US-
Srr
2016
-6.2
334
6.21
8.26
11.7
021
1.90
19.9
615
5U
S-Sr
r20
1717
.23
346.
397.
9413
.42
216.
0021
.36
156
US-
StJ
2016
67.3
334
7.07
3.01
23.3
721
4.00
26.3
715
7U
S-Tw
120
1159
.53
328.
037.
8213
.46
222.
1021
.28
158
US-
Tw1
2012
18.5
235
6.80
6.67
14.8
821
6.30
21.5
615
9U
S-Tw
120
1329
.27
344.
797.
0914
.34
196.
8021
.43
160
US-
Tw1
2014
14.7
434
9.77
8.52
13.6
120
4.00
22.1
316
1U
S-Tw
120
157.
0532
4.07
8.19
13.4
522
2.00
21.6
316
2U
S-Tw
120
164.
4035
0.56
7.22
13.8
920
3.00
21.1
116
3U
S-Tw
120
1725
.14
343.
297.
2415
.12
206.
0022
.36
164
US-
Tw1
2018
50.8
433
7.80
7.43
13.3
721
1.00
20.8
016
5U
S-Tw
420
1415
.67
348.
818.
6513
.44
206.
8022
.09
166
US-
Tw4
2015
5.29
324.
608.
4913
.42
224.
8021
.90
167
US-
Tw4
2016
2.66
347.
627.
5814
.06
201.
0021
.64

168
US-
Tw4
2017
30.7
933
7.78
7.88
15.1
120
8.00
22.9
916
9U
S-Tw
420
1844
.48
331.
608.
2613
.08
213.
0021
.33
170
US-
Tw5
2018
76.2
833
8.55
9.15
12.6
120
8.50
21.7
617
1U
S-Tw
t20
09N
aNN
aNN
aNN
aNN
aNN
aN17
2U
S-Tw
t20
10N
aNN
aNN
aNN
aNN
aNN
aN17
3U
S-Tw
t20
11N
aNN
aNN
aNN
aNN
aNN
aN17
4U
S-Tw
t20
12N
aNN
aNN
aNN
aNN
aNN
aN17
5U
S-Tw
t20
13N
aNN
aNN
aNN
aNN
aNN
aN17
6U
S-Tw
t20
14N
aNN
aNN
aNN
aNN
aNN
aN17
7U
S-Tw
t20
15N
aNN
aNN
aNN
aNN
aNN
aN17
8U
S-Tw
t20
16N
aNN
aNN
aNN
aNN
aNN
aN17
9U
S-U
af20
1159
.01
330.
80-2
3.42
38.4
519
1.90
15.0
218
0U
S-U
af20
1243
.13
317.
75-2
3.94
38.5
719
2.30
14.6
318
1U
S-U
af20
1364
.43
344.
15-2
2.12
39.6
319
5.90
17.5
118
2U
S-U
af20
1449
.85
342.
99-2
0.55
34.1
919
0.00
13.6
518
3U
S-U
af20
1551
.31
346.
65-1
9.52
34.9
018
2.00
15.3
818
4U
S-U
af20
1627
.33
325.
47-2
0.83
36.1
319
3.00
15.3
118
5U
S-U
af20
1759
.18
357.
64-2
2.10
38.3
019
1.00
16.2
018
6U
S-U
af20
1835
.38
354.
57-2
1.58
36.7
419
6.00
15.1
618
7U
S-W
PT20
1162
.29
362.
57-1
.13
26.3
119
9.10
25.1
818
8U
S-W
PT20
1234
.86
355.
23-0
.44
25.5
319
8.40
25.0
918
9U
S-W
PT20
1364
.19
341.
07-1
.92
24.4
920
5.00
22.5
7
Colu
mn
Des
crip
tion
SITE
_ID
Site
iden
tific
atio
n co
de a
s as
sign
ed b
y re
gion
al fl
ux d
ata
netw
ork
Year
Dat
a ye
arSt
art_
TA_(
DO
Y)Se
ason
sta
rt fo
r ele
vate
d TA
(DO
Y), p
oint
"f"
in F
igur
e 1
End_
TA_(
DO
Y)Se
ason
end
for e
leva
ted
TA (D
OY)
, poi
nt "
h" in
Fig
ure
1Ba
se_v
alue
_TA_
(C)
Base
line
TA d
urin
g no
n-el
evat
ed s
easo
n (C
), av
erag
e of
poi
nts
"a"
and
"b"
in F
igur
e 1
Ampl
_TA_
(C)
Peak
_TA_
(DO
Y)D
ay o
f max
imum
ele
vate
d TA
(DO
Y), p
oint
"g"
in F
igur
e 1
Peak
_val
ue_T
A_(C
)M
axim
um v
alue
of T
A (C
) poi
nt "
e" in
Fig
ure
1
Ampl
itude
of T
Adur
ing
elev
ated
tem
pera
ture
sea
son
(C),
diff
eren
ce b
etw
een
poin
t "e"
in F
igur
e 1
and
Base
_val
ue_T
A

Tabl
e B5
-D T
imes
at o
utpu
t for
FCH
4, G
PP_D
T, T
A, a
nd T
S (T
S fr
om s
hallo
wes
t pro
be a
t eac
h si
te)
SITE
_ID
Year
Prob
e_n
ame
Soil_
tem
p_de
pth_
mSt
art_
TS_(
DO
Y)En
d_TS
_(D
OY)
Base
_val
ue_
TS_(
C)Am
pl_T
S_(C
)Pe
ak_T
S_(
DO
Y)Pe
ak_v
alue
_TS_
(C)
1AT
-Neu
2010
TS_1
-0
.05
61.3
233
9.44
0.15
17.5
420
0.90
17.7
02
AT-N
eu20
11TS
_1
-0.0
551
.04
328.
840.
4016
.37
201.
0016
.77
3AT
-Neu
2012
TS_1
-0
.05
61.1
234
1.88
0.73
17.5
720
2.90
18.3
04
BR-N
pw20
14N
aNN
aNN
aNN
aNN
aNN
aNN
aNN
aN5
BR-N
pw20
15N
aNN
aNN
aNN
aNN
aNN
aNN
aNN
aN6
BR-N
pw20
16TS
_1
NaN
18.4
134
3.22
22.4
15.
9818
8.00
28.4
07
BW-G
um20
18N
aNN
aNN
aNN
aNN
aNN
aNN
aNN
aN8
BW-G
um20
19N
aNN
aNN
aNN
aNN
aNN
aNN
aNN
aN9
BW-N
xr20
18N
aNN
aNN
aNN
aNN
aNN
aNN
aNN
aN10
CA-S
CB20
14TS
_1
0.00
105.
9429
2.18
-0.6
320
.62
196.
6019
.99
11CA
-SCB
2015
TS_1
0.
0010
6.92
287.
14-0
.39
17.2
318
6.80
16.8
412
CA-S
CB20
16TS
_1
0.00
101.
6428
4.09
-0.3
119
.07
193.
2018
.77
13CA
-SCB
2017
TS_1
0.
0010
7.44
289.
72-0
.25
17.6
719
8.00
17.4
214
CA-S
CC20
13N
aNN
aNN
aNN
aNN
aNN
aNN
aNN
aN15
CA-S
CC20
14TS
_1
-0.1
012
3.36
287.
06-0
.55
15.6
420
3.00
15.0
916
CA-S
CC20
15TS
_1
-0.1
011
3.88
285.
22-0
.28
16.2
618
9.20
15.9
817
CA-S
CC20
16TS
_1
-0.1
010
8.09
260.
12-0
.33
18.3
719
0.90
18.0
418
DE-
Dgw
2015
NaN
NaN
NaN
NaN
NaN
NaN
NaN
NaN
19D
E-D
gw20
16N
aNN
aNN
aNN
aNN
aNN
aNN
aNN
aN20
DE-
Dgw
2017
NaN
NaN
NaN
NaN
NaN
NaN
NaN
NaN
21D
E-H
te20
11N
aNN
aNN
aNN
aNN
aNN
aNN
aNN
aN22
DE-
Hte
2012
TS_3
-0
.20
76.9
634
4.01
4.98
12.2
621
5.50
17.2
323
DE-
Hte
2013
TS_3
-0
.20
60.9
237
7.99
3.96
11.9
920
7.90
15.9
524
DE-
Hte
2014
TS_1
0.
00N
aN32
7.83
8.52
8.34
205.
6016
.87
25D
E-H
te20
15TS
_1
0.00
62.9
236
0.55
5.17
11.6
718
7.40
16.8
426
DE-
Hte
2016
TS_1
0.
0071
.87
NaN
4.94
12.3
617
5.60
17.3
027
DE-
Hte
2017
TS_1
0.
0061
.55
343.
324.
5011
.76
186.
0016
.26
28D
E-H
te20
18N
aNN
aNN
aNN
aNN
aNN
aNN
aNN
aN29
DE-
SfN
2012
TS_1
-0
.02
NaN
372.
590.
0023
.55
206.
5015
.29
30D
E-Sf
N20
13TS
_1
-0.0
255
.84
381.
500.
9213
.62
216.
4014
.54
31D
E-Sf
N20
14N
aNN
aNN
aNN
aNN
aNN
aNN
aNN
aN

32D
E-Zr
k20
13N
aNN
aNN
aNN
aNN
aNN
aNN
aNN
aN33
DE-
Zrk
2014
TS_1
-0
.05
54.7
936
1.65
4.36
13.9
320
2.30
18.2
934
DE-
Zrk
2015
TS_1
-0
.05
58.2
935
9.29
4.28
13.2
421
5.50
17.5
235
DE-
Zrk
2016
TS_1
-0
.05
72.8
133
2.00
4.28
14.9
320
0.40
19.2
036
DE-
Zrk
2017
TS_1
-0
.05
69.1
035
1.44
4.40
14.7
219
9.00
19.1
237
DE-
Zrk
2018
TS_1
-0
.05
84.4
733
6.14
4.83
12.3
220
3.00
17.1
438
FI-L
om20
06TS
_1
-0.0
711
4.15
290.
83-0
.11
13.4
220
4.80
13.3
139
FI-L
om20
07TS
_1
-0.0
712
6.84
302.
050.
1113
.05
200.
0013
.16
40FI
-Lom
2008
TS_1
-0
.07
135.
6229
6.74
0.16
12.7
320
2.90
12.8
841
FI-L
om20
09TS
_1
-0.0
711
7.16
291.
860.
1411
.73
214.
0011
.87
42FI
-Lom
2010
TS_1
-0
.07
129.
9131
8.54
0.05
12.1
320
8.00
12.1
843
FI-S
i220
12TS
_1
-0.0
5N
aN32
3.46
0.00
19.8
520
4.60
16.0
244
FI-S
i220
13TS
_1
-0.0
510
6.90
341.
05-0
.05
16.0
419
9.40
15.9
845
FI-S
i220
14TS
_1
-0.0
510
4.63
331.
10-0
.04
17.0
720
8.50
17.0
346
FI-S
i220
15TS
_1
-0.0
576
.49
352.
34-0
.87
16.3
121
1.00
15.4
447
FI-S
i220
16TS
_1
-0.0
510
2.64
329.
42-0
.88
16.4
820
6.00
15.6
048
FI-S
ii20
13N
aNN
aNN
aNN
aNN
aNN
aNN
aNN
aN49
FI-S
ii20
14N
aNN
aNN
aNN
aNN
aNN
aNN
aNN
aN50
FI-S
ii20
15N
aNN
aNN
aNN
aNN
aNN
aNN
aNN
aN51
FI-S
ii20
16N
aNN
aNN
aNN
aNN
aNN
aNN
aNN
aN52
FI-S
ii20
17N
aNN
aNN
aNN
aNN
aNN
aNN
aNN
aN53
FI-S
ii20
18N
aNN
aNN
aNN
aNN
aNN
aNN
aNN
aN54
HK-
MPM
2016
TS_2
N
aNN
aN56
6.87
0.00
7.79
219.
8028
.92
55H
K-M
PM20
17TS
_2
NaN
NaN
NaN
0.00
8.73
218.
5029
.13
56H
K-M
PM20
18TS
_2
NaN
NaN
NaN
0.00
7.23
204.
9028
.66
57ID
-Pag
2016
NaN
NaN
NaN
NaN
NaN
NaN
NaN
NaN
58JP
-BBY
2015
TS_1
-0
.18
87.8
334
0.83
0.94
21.5
921
8.10
22.5
359
JP-B
BY20
16TS
_1
-0.1
880
.75
330.
600.
3622
.19
217.
8022
.55
60JP
-BBY
2017
TS_1
-0
.18
80.3
834
7.77
0.20
21.7
521
3.80
21.9
561
JP-B
BY20
18TS
_1
-0.1
878
.28
355.
380.
5020
.38
222.
0020
.88
62JP
-Mse
2012
TS_1
-0
.01
60.3
834
8.86
2.15
23.7
621
1.80
25.9
163
KR-C
RK20
15N
aNN
aNN
aNN
aNN
aNN
aNN
aNN
aN64
KR-C
RK20
16N
aNN
aNN
aNN
aNN
aNN
aNN
aNN
aN65
KR-C
RK20
17N
aNN
aNN
aNN
aNN
aNN
aNN
aNN
aN

66KR
-CRK
2018
NaN
NaN
NaN
NaN
NaN
NaN
NaN
NaN
67M
Y-M
LM20
14TS
N
aNN
aN35
8.37
25.0
63.
9719
4.50
29.0
368
MY-
MLM
2015
TS
NaN
27.3
2N
aN25
.57
1.97
172.
7027
.55
69N
Z-Ko
p20
12TS
_1
-0.5
062
.54
360.
298.
308.
3921
9.80
16.7
070
NZ-
Kop
2013
TS_1
-0
.50
45.6
336
7.00
8.41
7.64
210.
5016
.04
71N
Z-Ko
p20
14TS
_1
-0.5
056
.88
365.
688.
168.
7921
9.00
16.9
572
NZ-
Kop
2015
TS_1
-0
.50
56.4
937
1.82
7.73
9.36
214.
0017
.09
73PH
-RiF
2012
NaN
NaN
NaN
NaN
NaN
NaN
NaN
NaN
74PH
-RiF
2013
NaN
NaN
NaN
NaN
NaN
NaN
NaN
NaN
75PH
-RiF
2014
NaN
NaN
NaN
NaN
NaN
NaN
NaN
NaN
76PH
-RiF
2015
NaN
NaN
NaN
NaN
NaN
NaN
NaN
NaN
77RU
-Ch2
2014
TS_1
-0
.04
138.
7626
3.76
-0.1
314
.42
206.
6014
.29
78RU
-Ch2
2015
TS_1
-0
.04
143.
8826
9.56
-0.1
413
.97
193.
3013
.83
79RU
-Ch2
2016
TS_1
-0
.04
126.
9827
3.54
-0.1
611
.64
200.
2011
.48
80RU
-Che
2014
TS_1
-0
.04
138.
0526
7.57
-0.1
215
.04
208.
0014
.92
81RU
-Che
2015
TS_1
-0
.04
143.
8527
4.68
-0.1
714
.81
193.
7014
.64
82RU
-Che
2016
TS_1
-0
.04
126.
7227
4.03
-0.1
912
.95
200.
4012
.76
83SE
-Deg
2014
TS_1
-0
.02
111.
8530
3.55
-0.5
317
.22
201.
6016
.69
84SE
-Deg
2015
TS_1
-0
.02
104.
2531
0.59
-0.2
815
.20
207.
2014
.91
85SE
-Deg
2016
TS_1
-0
.02
108.
1430
6.39
-0.1
914
.88
200.
3014
.68
86SE
-Deg
2017
TS_1
-0
.02
133.
3832
6.87
-0.2
012
.35
215.
0012
.15
87SE
-Deg
2018
TS_1
-0
.02
111.
6731
0.21
-0.1
714
.70
198.
0014
.52
88U
S-At
q20
13N
aNN
aNN
aNN
aNN
aNN
aNN
aNN
aN89
US-
Atq
2014
TS_1
N
aN10
.75
139.
53-0
.20
8.07
61.0
07.
8690
US-
Atq
2015
NaN
NaN
NaN
NaN
NaN
NaN
NaN
NaN
91U
S-Be
o20
13N
aNN
aNN
aNN
aNN
aNN
aNN
aNN
aN92
US-
Beo
2014
TS_1
N
aN15
5.09
270.
13-0
.04
4.87
211.
104.
8393
US-
Bes
2013
TS_1
N
aN14
3.22
261.
99-0
.05
5.65
201.
305.
6094
US-
Bes
2014
TS_1
N
aN15
1.79
282.
29-0
.10
3.92
198.
503.
8295
US-
Bes
2015
TS_1
N
aN14
0.45
270.
98-0
.11
4.76
195.
304.
6596
US-
BZB
2014
TS_1
-0
.08
123.
1129
8.35
-0.4
415
.35
215.
8014
.91
97U
S-BZ
B20
15TS
_1
-0.0
810
7.82
295.
60-0
.38
14.0
421
0.20
13.6
798
US-
BZB
2016
TS_1
-0
.08
125.
0929
2.39
-0.3
316
.39
214.
3016
.06
99U
S-BZ
F20
14TS
_1
-0.0
896
.05
322.
79-1
.56
16.1
220
5.40
14.5
6

100
US-
BZF
2015
TS_1
-0
.08
108.
3933
1.07
-1.2
014
.88
197.
5013
.68
101
US-
BZF
2016
TS_1
-0
.08
95.5
031
5.89
-1.0
317
.18
205.
1016
.15
102
US-
BZS
2015
TS_1
N
aN11
6.48
275.
22-0
.07
4.87
202.
904.
7910
3U
S-BZ
S20
16TS
_1
NaN
119.
0727
8.90
-0.0
55.
5820
8.40
5.54
104
US-
DPW
2013
NaN
NaN
NaN
NaN
NaN
NaN
NaN
NaN
105
US-
DPW
2014
NaN
NaN
NaN
NaN
NaN
NaN
NaN
NaN
106
US-
DPW
2015
NaN
NaN
NaN
NaN
NaN
NaN
NaN
NaN
107
US-
DPW
2016
NaN
NaN
NaN
NaN
NaN
NaN
NaN
NaN
108
US-
HRA
2017
NaN
NaN
NaN
NaN
NaN
NaN
NaN
NaN
109
US-
HRC
2018
NaN
NaN
NaN
NaN
NaN
NaN
NaN
NaN
110
US-
ICs
2014
TS_1
-0
.08
147.
2726
3.08
-0.0
85.
4720
5.60
5.39
111
US-
ICs
2015
TS_1
-0
.08
141.
6125
5.70
-0.0
26.
1219
5.20
6.10
112
US-
ICs
2016
TS_1
-0
.08
146.
7526
5.86
-0.0
55.
6720
6.20
5.62
113
US-
Ivo
2013
NaN
NaN
NaN
NaN
NaN
NaN
NaN
NaN
114
US-
Ivo
2014
TS_1
-0
.05
136.
9226
4.34
-0.2
010
.84
195.
7010
.64
115
US-
Ivo
2015
TS_1
-0
.05
139.
4225
7.06
-0.1
414
.86
185.
6014
.72
116
US-
Ivo
2016
TS_1
-0
.05
133.
6026
2.43
-0.1
08.
9019
7.30
8.80
117
US-
LA1
2012
TS_1
-0
.10
29.1
533
1.44
15.5
913
.50
197.
2029
.08
118
US-
LA2
2012
TS_1
-0
.10
36.6
533
6.05
15.0
414
.35
193.
2029
.39
119
US-
LA2
2013
TS_1
-0
.10
65.7
937
7.93
14.7
016
.06
201.
5030
.76
120
US-
Los
2014
TS_1
0.
0013
6.18
417.
401.
958.
2624
4.30
10.2
212
1U
S-Lo
s20
15TS
_1
0.00
148.
2342
2.27
2.43
7.76
258.
7010
.19
122
US-
Los
2016
TS_1
0.
0013
5.20
415.
752.
478.
0825
5.10
10.5
612
3U
S-Lo
s20
17TS
_1
0.00
141.
1541
4.62
1.89
7.45
256.
009.
3412
4U
S-Lo
s20
18TS
_1
0.00
169.
8342
1.79
1.46
7.42
260.
008.
8812
5U
S-M
AC20
13N
aNN
aNN
aNN
aNN
aNN
aNN
aNN
aN12
6U
S-M
AC20
14N
aNN
aNN
aNN
aNN
aNN
aNN
aNN
aN12
7U
S-M
AC20
15N
aNN
aNN
aNN
aNN
aNN
aNN
aNN
aN12
8U
S-M
yb20
10N
aNN
aNN
aNN
aNN
aNN
aNN
aNN
aN12
9U
S-M
yb20
11TS
_3
-0.0
8N
aN32
9.50
12.1
28.
8623
1.70
20.9
813
0U
S-M
yb20
12TS
_3
-0.0
835
.60
372.
219.
3910
.96
216.
1020
.36
131
US-
Myb
2013
TS_3
-0
.08
34.3
835
4.74
9.25
11.2
821
0.90
20.5
213
2U
S-M
yb20
14TS
_3
-0.0
826
.04
365.
889.
6412
.28
210.
0021
.93
133
US-
Myb
2015
TS_3
-0
.08
17.3
434
0.72
9.77
11.8
521
2.00
21.6
2

134
US-
Myb
2016
TS_3
-0
.08
5.05
357.
829.
6111
.19
201.
0020
.80
135
US-
Myb
2017
TS_3
-0
.08
27.3
135
2.90
9.86
13.1
021
4.00
22.9
613
6U
S-M
yb20
18TS
_3
-0.0
836
.27
326.
1010
.20
10.7
220
7.00
20.9
213
7U
S-N
C420
12TS
_1
-0.0
542
.43
336.
037.
8715
.75
215.
4023
.62
138
US-
NC4
2013
TS_1
-0
.05
59.9
636
8.85
6.92
16.8
321
0.50
23.7
413
9U
S-N
C420
14TS
_1
-0.0
554
.42
362.
346.
7316
.81
208.
5023
.54
140
US-
NC4
2015
TS_1
-0
.05
68.1
338
7.31
8.27
16.0
620
5.00
24.3
314
1U
S-N
C420
16TS
_1
-0.0
552
.97
351.
389.
4115
.04
220.
0024
.45
142
US-
ORv
2011
NaN
NaN
NaN
NaN
NaN
NaN
NaN
NaN
143
US-
ORv
2012
TS
NaN
57.4
235
2.55
4.36
20.6
120
3.90
24.9
714
4U
S-O
Rv20
13TS
N
aN63
.67
356.
742.
9319
.98
210.
8022
.90
145
US-
ORv
2014
TS
NaN
68.1
136
4.96
2.11
20.1
720
5.30
22.2
814
6U
S-O
Rv20
15TS
N
aN68
.77
387.
781.
7721
.26
206.
0023
.04
147
US-
OW
C20
15N
aNN
aNN
aNN
aNN
aNN
aNN
aNN
aN14
8U
S-O
WC
2016
TS_1
-0
.05
0.00
0.00
0.00
0.00
211.
2023
.91
149
US-
Sne
2016
NaN
NaN
NaN
NaN
NaN
NaN
NaN
NaN
150
US-
Sne
2017
TS_1
-0
.01
46.0
733
7.92
10.3
313
.14
212.
7023
.47
151
US-
Sne
2018
TS_1
-0
.01
48.4
132
5.09
10.2
812
.15
217.
3022
.43
152
US-
Srr
2014
NaN
NaN
NaN
NaN
NaN
NaN
NaN
NaN
153
US-
Srr
2015
NaN
NaN
NaN
NaN
NaN
NaN
NaN
NaN
154
US-
Srr
2016
TS_1
N
aNN
aN32
6.29
10.0
310
.71
200.
5020
.74
155
US-
Srr
2017
TS_1
N
aN11
.34
346.
857.
2213
.71
199.
5020
.93
156
US-
StJ
2016
TS_2
-0
.05
68.3
734
7.38
4.05
16.2
221
3.70
20.2
715
7U
S-Tw
120
11N
aNN
aNN
aNN
aNN
aNN
aNN
aNN
aN15
8U
S-Tw
120
12TS
_1
-0.0
250
.54
359.
965.
9911
.52
225.
2017
.51
159
US-
Tw1
2013
TS_1
-0
.02
35.8
033
7.57
4.39
14.5
920
6.60
18.9
716
0U
S-Tw
120
14TS
_1
-0.0
241
.23
395.
416.
6710
.89
208.
3017
.56
161
US-
Tw1
2015
TS_1
-0
.02
50.6
634
2.55
9.02
7.83
235.
0016
.85
162
US-
Tw1
2016
TS_1
-0
.02
34.5
736
1.06
8.78
7.94
218.
0016
.72
163
US-
Tw1
2017
TS_1
-0
.02
41.1
734
3.75
7.55
10.2
222
8.00
17.7
716
4U
S-Tw
120
18TS
_1
-0.0
260
.47
327.
436.
7010
.42
222.
0017
.12
165
US-
Tw4
2014
NaN
NaN
NaN
NaN
NaN
NaN
NaN
NaN
166
US-
Tw4
2015
TS_1
-0
.02
15.9
332
7.22
10.0
411
.56
199.
4021
.60
167
US-
Tw4
2016
TS_1
-0
.02
9.56
358.
758.
1611
.29
201.
7019
.45

168
US-
Tw4
2017
TS_1
-0
.02
38.3
534
7.31
8.07
11.5
221
1.90
19.5
916
9U
S-Tw
420
18TS
_1
-0.0
258
.11
344.
878.
0010
.93
218.
0018
.93
170
US-
Tw5
2018
TS_1
-0
.02
NaN
414.
830.
008.
8922
2.20
18.3
717
1U
S-Tw
t20
09N
aNN
aNN
aNN
aNN
aNN
aNN
aNN
aN17
2U
S-Tw
t20
10N
aNN
aNN
aNN
aNN
aNN
aNN
aNN
aN17
3U
S-Tw
t20
11N
aNN
aNN
aNN
aNN
aNN
aNN
aNN
aN17
4U
S-Tw
t20
12N
aNN
aNN
aNN
aNN
aNN
aNN
aNN
aN17
5U
S-Tw
t20
13N
aNN
aNN
aNN
aNN
aNN
aNN
aNN
aN17
6U
S-Tw
t20
14N
aNN
aNN
aNN
aNN
aNN
aNN
aNN
aN17
7U
S-Tw
t20
15N
aNN
aNN
aNN
aNN
aNN
aNN
aNN
aN17
8U
S-Tw
t20
16N
aNN
aNN
aNN
aNN
aNN
aNN
aNN
aN17
9U
S-U
af20
11TS
_1
-0.0
986
.20
372.
46-1
2.29
21.9
519
9.60
9.67
180
US-
Uaf
2012
TS_1
-0
.09
73.7
733
8.53
-11.
8320
.86
202.
409.
0318
1U
S-U
af20
13TS
_1
-0.0
910
9.63
395.
51-1
0.08
20.5
220
0.40
10.4
418
2U
S-U
af20
14TS
_1
-0.0
976
.07
365.
40-1
0.94
19.9
420
6.00
9.00
183
US-
Uaf
2015
TS_1
-0
.09
80.9
942
3.19
-9.7
719
.76
190.
0010
.00
184
US-
Uaf
2016
TS_1
-0
.09
77.3
831
5.75
-7.7
419
.13
198.
0011
.39
185
US-
Uaf
2017
TS_1
-0
.09
84.8
838
0.17
-7.3
919
.08
196.
0011
.69
186
US-
Uaf
2018
TS_1
-0
.09
96.0
433
3.33
-5.6
017
.72
199.
0012
.11
187
US-
WPT
2011
TS_1
-0
.10
80.9
534
2.17
5.27
19.2
720
2.60
24.5
418
8U
S-W
PT20
12TS
_1
-0.1
040
.29
345.
573.
7021
.60
197.
4025
.30
189
US-
WPT
2013
TS_1
-0
.10
74.6
134
0.47
3.73
18.2
320
7.20
21.9
6
Colu
mn
Des
crip
tions
SITE
_ID
Site
iden
tific
atio
n co
de a
s as
sign
ed b
y re
gion
al fl
ux d
ata
netw
ork
Year
Dat
a ye
arPr
obe_
nam
eTe
mpe
ratu
re p
robe
nam
e as
giv
en in
dat
a fil
esSo
il_te
mp_
dept
h_m
Dep
th o
f soi
l tem
pera
ture
pro
be (m
), w
ith n
egat
ive
valu
es b
eing
und
er th
e su
rfac
eSt
art_
TS_(
DO
Y)Se
ason
sta
rt fo
r ele
vate
d TS
(DO
Y), p
oint
"f"
in F
igur
e 1
End_
TS_(
DO
Y)Se
ason
end
for e
leva
ted
TS (D
OY)
, poi
nt "
h" in
Fig
ure
1Ba
se_v
alue
_TS_
(C)
Base
line
TS d
urin
g no
n-el
evat
ed s
easo
n (C
), av
erag
e of
poi
nts
"a"
and
"b"
in F
igur
e 1
Ampl
_TS_
(C)
Ampl
itude
of T
S du
ring
elev
ated
tem
pera
ture
sea
son
(C),
diff
eren
ce b
etw
een
poin
t "e"
in F
igur
e 1
and
Base
_val
ue_T
S

Peak
_TS_
(DO
Y)D
ay o
f max
imum
ele
vate
d TS
(DO
Y), p
oint
"g"
in F
igur
e 1
Peak
_val
ue_T
S_(C
)M
axim
um v
alue
of T
S (C
) poi
nt "
e" in
Fig
ure
1

Table B6: Timesat output for all soil temperature probesSITE_ID Year Probe_
nameSoil_temp_depth_m
Start_TS_(DOY)
End_TS_(DOY)
Base_value_TS_(C)
Ampl_TS_(C)
Peak_TS_(DOY)
Peak_value_TS_(C)
1 AT-Neu 2010 TS_1 -0.05 61.32 339.44 0.15 17.54 200.9 17.72 AT-Neu 2011 TS_1 -0.05 51.04 328.84 0.40 16.37 201 16.773 AT-Neu 2012 TS_1 -0.05 61.12 341.88 0.73 17.57 202.9 18.34 BR-Npw 2016 TS_1 NaN 18.41 343.22 22.41 5.982 188 28.45 CA-SCB 2014 TS_1 0 105.94 292.18 -0.63 20.62 196.6 19.996 CA-SCB 2014 TS_2 -0.02 105.15 294.06 -0.74 20.42 197.5 19.687 CA-SCB 2014 TS_3 -0.04 112.00 294.38 0.05 19.07 199.6 19.118 CA-SCB 2014 TS_5 -0.16 123.21 317.72 -1.38 18.6 205.3 17.239 CA-SCB 2015 TS_1 0 106.92 287.14 -0.39 17.23 186.8 16.84
10 CA-SCB 2015 TS_2 -0.02 107.06 287.40 -0.42 17.08 187.4 16.6611 CA-SCB 2015 TS_3 -0.04 107.45 289.83 -0.51 16.81 188.9 16.312 CA-SCB 2015 TS_5 -0.16 114.95 305.55 -0.39 15.84 195.7 15.4513 CA-SCB 2016 TS_1 0 101.64 284.09 -0.31 19.07 193.2 18.7714 CA-SCB 2016 TS_2 -0.02 101.81 284.11 -0.30 18.96 193.5 18.6615 CA-SCB 2016 TS_3 -0.04 102.22 285.19 -0.30 18.6 194.3 18.316 CA-SCB 2016 TS_5 -0.16 101.16 298.99 -0.24 16.99 201.1 16.7417 CA-SCB 2017 TS_1 0 107.44 289.72 -0.25 17.67 198 17.4218 CA-SCB 2017 TS_2 -0.02 107.22 288.88 -0.25 17.59 198 17.3319 CA-SCB 2017 TS_3 -0.04 108.58 289.29 -0.26 17.28 199 17.0220 CA-SCB 2017 TS_5 -0.16 116.34 300.28 -0.24 14.95 214 14.7121 CA-SCC 2014 TS_1 -0.1 123.36 287.06 -0.55 15.64 203 15.0922 CA-SCC 2014 TS_2 -0.15 114.89 287.71 -0.83 14.49 200.8 13.6623 CA-SCC 2014 TS_3 -0.2 111.36 288.63 -0.69 11.52 194.9 10.8424 CA-SCC 2014 TS_4 -0.25 129.50 287.24 -0.22 8.612 207.4 8.39125 CA-SCC 2014 TS_5 -0.3 142.36 287.99 -0.10 6.329 212.1 6.22526 CA-SCC 2015 TS_1 -0.1 113.88 285.22 -0.28 16.26 189.2 15.9827 CA-SCC 2015 TS_2 -0.15 113.05 284.18 -0.24 14.56 192.8 14.3228 CA-SCC 2015 TS_3 -0.2 111.76 285.45 -0.22 12.71 199.1 12.4829 CA-SCC 2015 TS_4 -0.25 120.81 287.09 -0.16 10.08 204.8 9.92230 CA-SCC 2015 TS_5 -0.3 131.92 285.42 -0.09 7.705 209.2 7.61631 CA-SCC 2016 TS_1 -0.1 108.09 260.12 -0.33 18.37 190.9 18.0432 CA-SCC 2016 TS_2 -0.15 108.96 260.19 -0.30 17.31 192.1 17.0133 CA-SCC 2016 TS_3 -0.2 110.49 260.44 -0.26 15.4 194.1 15.1434 CA-SCC 2016 TS_4 -0.25 119.21 260.34 -0.20 13.38 200.2 13.1835 CA-SCC 2016 TS_5 -0.3 130.75 261.73 -0.12 10.03 202.2 9.90636 DE-Hte 2012 TS_3 -0.2 76.96 344.01 4.98 12.26 215.5 17.2337 DE-Hte 2013 TS_3 -0.2 60.92 377.99 3.96 11.99 207.9 15.9538 DE-Hte 2014 TS_1 0 NaN 327.83 8.52 8.342 205.6 16.8739 DE-Hte 2015 TS_1 0 62.92 360.55 5.17 11.67 187.4 16.8440 DE-Hte 2016 TS_1 0 71.87 NaN 4.94 12.36 175.6 17.341 DE-Hte 2017 TS_1 0 61.55 343.32 4.50 11.76 186 16.2642 DE-SfN 2012 TS_1 -0.02 NaN 372.59 0.00 23.55 206.5 15.2943 DE-SfN 2012 TS_3 -0.1 NaN 366.65 1.64 12.91 219.7 14.55

44 DE-SfN 2012 TS_4 -0.2 NaN 367.40 4.86 7.276 242.7 12.1445 DE-SfN 2012 TS_5 -0.5 NaN 367.40 4.86 7.276 242.7 12.1446 DE-SfN 2013 TS_1 -0.02 55.84 381.50 0.92 13.62 216.4 14.5447 DE-SfN 2013 TS_3 -0.1 60.45 384.77 1.56 12.5 221.1 14.0648 DE-SfN 2013 TS_4 -0.2 83.55 394.53 3.62 8.417 243.4 12.0449 DE-SfN 2013 TS_5 -0.5 83.55 394.53 3.62 8.417 243.4 12.0450 DE-Zrk 2014 TS_1 -0.05 54.79 361.65 4.36 13.93 202.3 18.2951 DE-Zrk 2014 TS_2 -0.1 59.27 366.51 4.87 12.65 207.3 17.5252 DE-Zrk 2014 TS_3 -0.2 62.95 371.30 5.53 11.5 211.7 17.0353 DE-Zrk 2014 TS_4 -0.3 67.45 375.14 6.05 10.4 216.5 16.4554 DE-Zrk 2014 TS_5 -0.5 72.50 378.95 6.57 9.359 221 15.9355 DE-Zrk 2015 TS_1 -0.05 58.29 359.29 4.28 13.24 215.5 17.5256 DE-Zrk 2015 TS_2 -0.1 62.61 364.99 4.79 12 219.8 16.857 DE-Zrk 2015 TS_3 -0.2 66.01 369.78 5.42 10.87 223.7 16.2958 DE-Zrk 2015 TS_4 -0.3 70.47 374.40 5.93 9.771 228 15.759 DE-Zrk 2015 TS_5 -0.5 74.71 378.76 6.43 8.751 232.2 15.1960 DE-Zrk 2016 TS_1 -0.05 72.81 332.00 4.28 14.93 200.4 19.261 DE-Zrk 2016 TS_2 -0.1 76.31 337.37 4.79 13.6 204.4 18.3962 DE-Zrk 2016 TS_3 -0.2 79.73 343.16 5.43 12.33 208.1 17.7763 DE-Zrk 2016 TS_4 -0.3 83.58 347.57 5.94 11.14 212 17.0964 DE-Zrk 2016 TS_5 -0.5 87.15 354.22 6.40 10.07 216 16.4765 DE-Zrk 2017 TS_1 -0.05 69.10 351.44 4.40 14.72 199 19.1266 DE-Zrk 2017 TS_2 -0.1 73.29 356.52 4.91 13.33 204 18.2367 DE-Zrk 2017 TS_3 -0.2 77.19 362.40 5.56 12.02 208 17.5868 DE-Zrk 2017 TS_4 -0.3 82.20 367.20 6.04 10.8 212 16.8469 DE-Zrk 2017 TS_5 -0.5 86.22 372.96 6.48 9.675 217 16.1570 DE-Zrk 2018 TS_1 -0.05 84.47 336.14 4.83 12.32 203 17.1471 DE-Zrk 2018 TS_2 -0.1 86.60 342.59 5.30 11.27 208 16.5772 DE-Zrk 2018 TS_3 -0.2 87.68 348.07 5.89 10.25 212 16.1473 DE-Zrk 2018 TS_4 -0.3 89.82 354.77 6.31 9.308 217 15.6174 DE-Zrk 2018 TS_5 -0.5 92.01 360.46 6.69 8.412 222 15.1175 FI-Lom 2006 TS_1 -0.07 114.15 290.83 -0.11 13.42 204.8 13.3176 FI-Lom 2006 TS_2 -0.3 117.21 307.88 0.27 12.01 214.1 12.2877 FI-Lom 2006 TS_3 -0.5 128.82 329.03 1.06 9.071 225.8 10.1378 FI-Lom 2007 TS_1 -0.07 126.84 302.05 0.11 13.05 200 13.1679 FI-Lom 2007 TS_2 -0.3 134.00 321.03 0.42 11.5 207.5 11.9280 FI-Lom 2007 TS_3 -0.5 138.37 348.03 1.06 8.873 221.1 9.93681 FI-Lom 2008 TS_1 -0.07 135.62 296.74 0.16 12.73 202.9 12.8882 FI-Lom 2008 TS_2 -0.3 141.46 318.74 0.58 10.62 209.6 11.283 FI-Lom 2008 TS_3 -0.5 146.70 349.21 1.17 8.214 221.2 9.38284 FI-Lom 2009 TS_1 -0.07 117.16 291.86 0.14 11.73 214 11.8785 FI-Lom 2009 TS_2 -0.3 123.51 314.51 0.67 9.692 221 10.3686 FI-Lom 2009 TS_3 -0.5 133.69 336.65 1.30 7.896 233 9.19387 FI-Lom 2010 TS_1 -0.07 129.91 318.54 0.05 12.13 208 12.1888 FI-Lom 2010 TS_2 -0.3 138.09 338.24 0.52 9.962 218 10.4889 FI-Lom 2010 TS_3 -0.5 147.34 359.95 1.19 7.344 231 8.53290 FI-Si2 2012 TS_1 -0.05 NaN 323.46 0.00 19.85 204.6 16.02

91 FI-Si2 2012 TS_2 -0.2 103.64 333.52 -0.04 15.75 217.5 15.7192 FI-Si2 2012 TS_3 -0.35 105.57 NaN 0.00 19.38 230.6 15.0993 FI-Si2 2012 TS_4 -0.5 110.87 NaN 0.00 17.26 237.5 14.6694 FI-Si2 2013 TS_1 -0.05 106.90 341.05 -0.05 16.04 199.4 15.9895 FI-Si2 2013 TS_2 -0.2 102.57 356.13 0.23 14.91 207.3 15.1496 FI-Si2 2013 TS_3 -0.35 NaN 376.47 0.00 18.26 209.6 14.2397 FI-Si2 2013 TS_4 -0.5 NaN 392.35 0.00 16.71 216.4 13.4898 FI-Si2 2014 TS_1 -0.05 104.63 331.10 -0.04 17.07 208.5 17.0399 FI-Si2 2014 TS_2 -0.2 107.82 359.78 0.59 15.33 215.3 15.92
100 FI-Si2 2014 TS_3 -0.35 112.02 385.94 0.99 13.61 222.2 14.61101 FI-Si2 2014 TS_4 -0.5 118.24 400.15 1.59 12.01 229.1 13.59102 FI-Si2 2015 TS_1 -0.05 76.49 352.34 -0.87 16.31 211 15.44103 FI-Si2 2015 TS_2 -0.2 80.08 364.72 -0.41 14.83 218 14.42104 FI-Si2 2015 TS_3 -0.35 82.01 374.79 0.12 13.27 225 13.39105 FI-Si2 2015 TS_4 -0.5 88.25 382.37 0.84 11.7 233 12.53106 FI-Si2 2016 TS_1 -0.05 102.64 329.42 -0.88 16.48 206 15.6107 FI-Si2 2016 TS_2 -0.2 102.16 361.04 -0.77 16.02 212 15.25108 FI-Si2 2016 TS_3 -0.35 103.15 383.82 -0.63 14.7 219 14.07109 FI-Si2 2016 TS_4 -0.5 104.76 399.01 -0.20 13.36 227 13.16110 HK-MPM 2016 TS_2 NaN NaN 566.87 0.00 7.789 219.8 28.92111 HK-MPM 2016 TS_3 NaN NaN 373.06 20.56 7.386 227.3 27.95112 HK-MPM 2017 TS_2 NaN NaN NaN 0.00 8.726 218.5 29.13113 HK-MPM 2017 TS_3 NaN 69.55 364.53 19.53 8.572 233.6 28.1114 HK-MPM 2018 TS_2 NaN NaN NaN 0.00 7.231 204.9 28.66115 HK-MPM 2018 TS_3 NaN 64.82 383.39 19.17 8.406 221.4 27.58116 JP-BBY 2015 TS_1 -0.183 87.83 340.83 0.94 21.59 218.1 22.53117 JP-BBY 2015 TS_2 -0.233 90.59 340.99 1.34 20.9 219.9 22.25118 JP-BBY 2015 TS_3 -0.283 90.34 341.60 1.58 20.42 221.4 22119 JP-BBY 2015 TS_4 -0.383 96.01 341.35 2.39 19.09 225.1 21.48120 JP-BBY 2015 TS_5 -0.483 95.83 341.49 2.91 18.09 228.9 21121 JP-BBY 2016 TS_1 -0.183 80.75 330.60 0.36 22.19 217.8 22.55122 JP-BBY 2016 TS_2 -0.233 82.30 335.40 0.67 21.64 220.8 22.3123 JP-BBY 2016 TS_3 -0.283 84.28 332.64 0.99 21.1 222 22.09124 JP-BBY 2016 TS_4 -0.383 89.00 332.43 1.76 19.92 225.6 21.68125 JP-BBY 2016 TS_5 -0.483 94.29 331.91 2.44 18.83 228.9 21.27126 JP-BBY 2017 TS_1 -0.183 80.38 347.77 0.20 21.75 213.8 21.95127 JP-BBY 2017 TS_2 -0.233 84.54 347.79 0.82 21.02 214.6 21.83128 JP-BBY 2017 TS_3 -0.283 86.19 347.10 1.06 20.56 216.3 21.62129 JP-BBY 2017 TS_4 -0.383 92.20 346.01 1.97 19.34 218.5 21.31130 JP-BBY 2017 TS_5 -0.483 98.15 345.18 2.70 18.34 221 21.03131 JP-BBY 2018 TS_1 -0.183 78.28 355.38 0.50 20.38 222 20.88132 JP-BBY 2018 TS_2 -0.233 83.55 357.60 1.48 19.23 224 20.7133 JP-BBY 2018 TS_3 -0.283 85.93 355.90 1.69 18.78 225 20.47134 JP-BBY 2018 TS_4 -0.383 95.89 351.34 2.81 17.25 229 20.07135 JP-BBY 2018 TS_5 -0.483 103.83 349.39 3.63 16.1 232 19.73136 JP-Mse 2012 TS_1 -0.01 60.38 348.86 2.15 23.76 211.8 25.91137 MY-MLM 2014 TS NaN NaN 358.37 25.06 3.968 194.5 29.03

138 MY-MLM 2015 TS NaN 27.32 NaN 25.57 1.973 172.7 27.55139 NZ-Kop 2012 TS_1 -0.5 62.54 360.29 8.30 8.394 219.8 16.7140 NZ-Kop 2012 TS_2 -0.1 65.53 362.35 8.45 8.093 222.1 16.54141 NZ-Kop 2012 TS_3 -0.2 68.77 365.64 8.73 7.243 228.2 15.98142 NZ-Kop 2013 TS_1 -0.5 45.63 367.00 8.41 7.635 210.5 16.04143 NZ-Kop 2013 TS_2 -0.1 47.60 370.98 8.54 7.486 212.3 16.03144 NZ-Kop 2013 TS_3 -0.2 52.74 377.20 8.82 6.87 217.8 15.69145 NZ-Kop 2014 TS_1 -0.5 56.88 365.68 8.16 8.79 219 16.95146 NZ-Kop 2014 TS_2 -0.1 59.45 367.47 8.29 8.512 221 16.8147 NZ-Kop 2014 TS_3 -0.2 62.93 372.48 8.55 7.792 226 16.34148 NZ-Kop 2015 TS_1 -0.5 56.49 371.82 7.73 9.355 214 17.09149 NZ-Kop 2015 TS_2 -0.1 58.32 374.74 7.87 9.063 217 16.93150 NZ-Kop 2015 TS_3 -0.2 62.67 378.44 8.19 8.217 222 16.4151 RU-Ch2 2014 TS_1 -0.04 138.76 263.76 -0.13 14.42 206.6 14.29152 RU-Ch2 2014 TS_2 -0.08 146.08 262.11 -0.14 13.03 206.5 12.9153 RU-Ch2 2014 TS_3 -0.16 155.95 264.51 -0.05 4.581 210.5 4.535154 RU-Ch2 2015 TS_1 -0.04 143.88 269.56 -0.14 13.97 193.3 13.83155 RU-Ch2 2015 TS_2 -0.08 147.34 265.69 -0.10 12.3 195.7 12.2156 RU-Ch2 2015 TS_3 -0.16 159.93 266.60 -0.04 3.995 205.2 3.96157 RU-Ch2 2016 TS_1 -0.04 126.98 273.54 -0.16 11.64 200.2 11.48158 RU-Ch2 2016 TS_2 -0.08 133.92 272.58 -0.10 10.06 203.2 9.964159 RU-Ch2 2016 TS_3 -0.16 147.99 275.45 -0.04 4.042 217.7 4.001160 RU-Che 2014 TS_1 -0.04 138.05 267.57 -0.12 15.04 208 14.92161 RU-Che 2014 TS_2 -0.08 149.72 263.67 -0.09 8.959 206.6 8.873162 RU-Che 2014 TS_3 -0.16 154.97 265.49 -0.07 7.006 210.3 6.938163 RU-Che 2015 TS_1 -0.04 143.85 274.68 -0.17 14.81 193.7 14.64164 RU-Che 2015 TS_2 -0.08 149.49 267.08 -0.06 8.336 197.9 8.273165 RU-Che 2015 TS_3 -0.16 154.48 271.03 -0.04 5.942 202.4 5.9166 RU-Che 2016 TS_1 -0.04 126.72 274.03 -0.19 12.95 200.4 12.76167 RU-Che 2016 TS_2 -0.08 137.01 273.70 -0.07 7.076 205.4 7.01168 RU-Che 2016 TS_3 -0.16 142.51 275.62 -0.05 5.498 211.8 5.451169 SE-Deg 2014 TS_1 -0.02 111.85 303.55 -0.53 17.22 201.6 16.69170 SE-Deg 2014 TS_2 -0.05 119.11 308.12 -0.31 13.23 207.4 12.93171 SE-Deg 2014 TS_3 -0.1 125.46 315.55 -0.10 12.54 212 12.44172 SE-Deg 2014 TS_4 -0.15 134.61 321.20 0.29 11.63 215.6 11.93173 SE-Deg 2014 TS_5 -0.3 126.75 330.85 0.52 11.61 220 12.13174 SE-Deg 2014 TS_6 -0.5 130.62 341.66 0.89 11.33 223.1 12.21175 SE-Deg 2015 TS_1 -0.02 104.25 310.59 -0.28 15.2 207.2 14.91176 SE-Deg 2015 TS_2 -0.05 110.64 312.57 0.09 13.86 209.5 13.95177 SE-Deg 2015 TS_3 -0.1 112.94 321.41 0.41 12.94 212.9 13.36178 SE-Deg 2015 TS_4 -0.15 115.72 329.21 0.60 11.94 216.6 12.54179 SE-Deg 2015 TS_5 -0.3 118.31 339.17 0.90 11.08 220.5 11.98180 SE-Deg 2015 TS_6 -0.5 121.80 347.97 1.30 10.19 224.6 11.48181 SE-Deg 2016 TS_1 -0.02 108.14 306.39 -0.19 14.88 200.3 14.68182 SE-Deg 2017 TS_1 -0.02 133.38 326.87 -0.20 12.35 215 12.15183 SE-Deg 2018 TS_1 -0.02 111.67 310.21 -0.17 14.7 198 14.52184 US-Atq 2014 TS_1 NaN 10.75 139.53 -0.20 8.068 61 7.864

185 US-Atq 2014 TS_2 NaN 18.00 137.32 -0.08 4.191 74.3 4.109186 US-Atq 2014 TS_3 NaN 28.49 138.48 -0.03 2.366 83.5 2.334187 US-Beo 2014 TS_1 NaN 155.09 270.13 -0.04 4.874 211.1 4.829188 US-Beo 2014 TS_2 NaN 168.62 270.60 -0.02 2.94 219.6 2.922189 US-Beo 2014 TS_3 NaN 170.53 269.49 -0.02 3.128 219.9 3.104190 US-Bes 2013 TS_1 NaN 143.22 261.99 -0.05 5.649 201.3 5.602191 US-Bes 2013 TS_2 NaN 150.57 267.49 -0.04 6.744 205.7 6.706192 US-Bes 2013 TS_3 NaN 146.03 267.28 -0.06 8.248 202.3 8.187193 US-Bes 2014 TS_1 NaN 151.79 282.29 -0.10 3.924 198.5 3.822194 US-Bes 2015 TS_1 NaN 140.45 270.98 -0.11 4.763 195.3 4.65195 US-Bes 2015 TS_2 NaN 148.76 269.64 -0.11 5.512 202.8 5.401196 US-Bes 2015 TS_3 NaN 146.77 271.72 -0.16 7.182 197.8 7.027197 US-BZB 2014 TS_1 -0.075 123.11 298.35 -0.44 15.35 215.8 14.91198 US-BZB 2014 TS_2 -0.05 115.15 292.07 -0.59 15.49 209.9 14.9199 US-BZB 2015 TS_1 -0.075 107.82 295.60 -0.38 14.04 210.2 13.67200 US-BZB 2015 TS_2 -0.05 98.63 293.17 -0.67 14.56 203.5 13.9201 US-BZB 2016 TS_1 -0.075 125.09 292.39 -0.33 16.39 214.3 16.06202 US-BZB 2016 TS_2 -0.05 109.89 290.95 -0.74 16.89 211.7 16.15203 US-BZF 2014 TS_1 -0.075 96.05 322.79 -1.56 16.12 205.4 14.56204 US-BZF 2014 TS_2 -0.05 112.68 322.83 -1.22 15.9 208.3 14.68205 US-BZF 2015 TS_1 -0.075 108.39 331.07 -1.20 14.88 197.5 13.68206 US-BZF 2015 TS_2 -0.05 111.46 336.09 -1.12 14.83 200.2 13.72207 US-BZF 2016 TS_1 -0.075 95.50 315.89 -1.03 17.18 205.1 16.15208 US-BZF 2016 TS_2 -0.05 100.12 317.57 -0.90 17.72 206 16.81209 US-BZS 2015 TS_1 NaN 116.48 275.22 -0.07 4.866 202.9 4.792210 US-BZS 2015 TS_2 NaN 97.29 283.75 -0.27 8.135 187.7 7.862211 US-BZS 2015 TS_3 NaN 105.93 272.47 -0.13 10.61 193.1 10.47212 US-BZS 2016 TS_1 NaN 119.07 278.90 -0.05 5.584 208.4 5.535213 US-BZS 2016 TS_2 NaN 87.59 278.96 -0.25 12.09 203.1 11.84214 US-BZS 2016 TS_3 NaN 98.29 277.92 -0.16 11.67 198.8 11.51215 US-ICs 2014 TS_1 -0.075 147.27 263.08 -0.08 5.467 205.6 5.39216 US-ICs 2014 TS_2 -0.05 147.13 262.66 -0.01 6.41 205.1 6.402217 US-ICs 2015 TS_1 -0.075 141.61 255.70 -0.02 6.12 195.2 6.098218 US-ICs 2015 TS_2 -0.05 140.38 256.88 -0.02 7.07 193.1 7.047219 US-ICs 2016 TS_1 -0.075 146.75 265.86 -0.05 5.67 206.2 5.623220 US-ICs 2016 TS_2 -0.05 146.79 265.67 -0.05 6.654 206.1 6.599221 US-Ivo 2014 TS_1 -0.05 136.92 264.34 -0.20 10.84 195.7 10.64222 US-Ivo 2014 TS_1 -0.4 136.92 264.34 -0.20 10.84 195.7 10.64223 US-Ivo 2014 TS_2 -0.1 142.52 266.53 -0.16 9.908 195.5 9.744224 US-Ivo 2014 TS_3 -0.15 144.98 262.74 -0.19 6.761 204.8 6.574225 US-Ivo 2014 TS_4 -0.3 166.58 262.05 -0.03 4.068 214.3 4.034226 US-Ivo 2015 TS_1 -0.05 139.42 257.06 -0.14 14.86 185.6 14.72227 US-Ivo 2015 TS_1 -0.4 139.42 257.06 -0.14 14.86 185.6 14.72228 US-Ivo 2015 TS_2 -0.1 141.20 256.70 -0.09 11.99 189.1 11.9229 US-Ivo 2015 TS_3 -0.15 145.76 260.99 -0.07 6.85 199.1 6.785230 US-Ivo 2015 TS_4 -0.3 158.88 259.63 -0.03 4.032 208.2 3.997231 US-Ivo 2016 TS_1 -0.05 133.60 262.43 -0.10 8.895 197.3 8.796

232 US-Ivo 2016 TS_1 -0.4 133.60 262.43 -0.10 8.895 197.3 8.796233 US-Ivo 2016 TS_2 -0.1 139.70 264.19 -0.04 6.76 202.2 6.719234 US-Ivo 2016 TS_3 -0.15 153.78 269.47 -0.05 4.305 211.5 4.253235 US-Ivo 2016 TS_4 -0.3 171.24 271.03 -0.01 2.644 221.2 2.631236 US-LA1 2012 TS_1 -0.1 29.15 331.44 15.59 13.5 197.2 29.08237 US-LA2 2012 TS_1 -0.1 36.65 336.05 15.04 14.35 193.2 29.39238 US-LA2 2013 TS_1 -0.1 65.79 377.93 14.70 16.06 201.5 30.76239 US-Los 2014 TS_1 0 136.18 417.40 1.95 8.263 244.3 10.22240 US-Los 2015 TS_1 0 148.23 422.27 2.43 7.761 258.7 10.19241 US-Los 2016 TS_1 0 135.20 415.75 2.47 8.083 255.1 10.56242 US-Los 2017 TS_1 0 141.15 414.62 1.89 7.451 256 9.343243 US-Los 2018 TS_1 0 169.83 421.79 1.46 7.419 260 8.883244 US-Myb 2011 TS_3 -0.08 NaN 329.50 12.12 8.859 231.7 20.98245 US-Myb 2011 TS_4 -0.16 NaN 333.87 12.36 8.288 235.8 20.65246 US-Myb 2011 TS_5 -0.32 NaN 338.98 12.72 7.56 241.4 20.28247 US-Myb 2011 TS_1 -0.02 NaN 326.62 11.96 9.156 229.3 21.12248 US-Myb 2012 TS_3 -0.08 35.60 372.21 9.39 10.96 216.1 20.36249 US-Myb 2012 TS_4 -0.16 40.39 375.48 9.90 10.23 220.7 20.13250 US-Myb 2012 TS_5 -0.32 47.39 379.29 10.56 9.212 227.2 19.78251 US-Myb 2012 TS_1 -0.02 29.91 372.10 8.98 11.77 214.4 20.74252 US-Myb 2013 TS_3 -0.08 34.38 354.74 9.25 11.28 210.9 20.52253 US-Myb 2013 TS_4 -0.16 40.07 359.02 9.87 10.41 215 20.28254 US-Myb 2013 TS_5 -0.32 45.10 363.81 10.53 9.441 221.9 19.97255 US-Myb 2013 TS_1 -0.02 NaN 355.11 8.47 12.24 208.2 20.7256 US-Myb 2014 TS_3 -0.08 26.04 365.88 9.64 12.28 210 21.93257 US-Myb 2014 TS_4 -0.16 38.09 364.15 10.74 11.23 211 21.97258 US-Myb 2014 TS_5 -0.32 44.34 366.12 11.25 10.25 218 21.5259 US-Myb 2015 TS_3 -0.08 17.34 340.72 9.77 11.85 212 21.62260 US-Myb 2015 TS_4 -0.16 12.76 339.04 10.79 10.84 221 21.63261 US-Myb 2015 TS_5 -0.32 18.83 343.94 11.35 9.93 226 21.28262 US-Myb 2016 TS_3 -0.08 5.05 357.82 9.61 11.19 201 20.8263 US-Myb 2016 TS_4 -0.16 3.39 356.20 9.84 10.87 208 20.72264 US-Myb 2016 TS_5 -0.32 12.02 360.46 10.73 9.627 214 20.36265 US-Myb 2017 TS_3 -0.08 27.31 352.90 9.86 13.1 214 22.96266 US-Myb 2017 TS_4 -0.16 28.29 357.41 9.92 12.74 215 22.66267 US-Myb 2017 TS_5 -0.32 36.79 360.41 10.85 11.23 223 22.08268 US-Myb 2017 TS_1 -0.02 62.79 325.72 12.70 10.71 216.8 23.41269 US-Myb 2018 TS_3 -0.08 36.27 326.10 10.20 10.72 207 20.92270 US-Myb 2018 TS_4 -0.16 41.30 332.83 10.47 10.35 209 20.82271 US-Myb 2018 TS_5 -0.32 48.43 336.09 11.18 9.293 215 20.47272 US-Myb 2018 TS_1 -0.02 38.38 344.86 10.05 11.93 200.3 21.98273 US-NC4 2012 TS_1 -0.05 42.43 336.03 7.87 15.75 215.4 23.62274 US-NC4 2013 TS_1 -0.05 59.96 368.85 6.92 16.83 210.5 23.74275 US-NC4 2014 TS_1 -0.05 54.42 362.34 6.73 16.81 208.5 23.54276 US-NC4 2015 TS_1 -0.05 68.13 387.31 8.27 16.06 205 24.33277 US-NC4 2016 TS_1 -0.05 52.97 351.38 9.41 15.04 220 24.45278 US-ORv 2012 TS NaN 57.42 352.55 4.36 20.61 203.9 24.97

279 US-ORv 2013 TS NaN 63.67 356.74 2.93 19.98 210.8 22.9280 US-ORv 2014 TS NaN 68.11 364.96 2.11 20.17 205.3 22.28281 US-ORv 2015 TS NaN 68.77 387.78 1.77 21.26 206 23.04282 US-OWC 2016 TS_1 -0.05 0.00 0.00 0.00 0 211.2 23.91283 US-Sne 2017 TS_1 -0.01 46.07 337.92 10.33 13.14 212.7 23.47284 US-Sne 2017 TS_2 -0.02 41.06 341.82 10.76 12.66 205.7 23.41285 US-Sne 2017 TS_3 -0.08 42.89 343.85 11.04 12.17 208.5 23.22286 US-Sne 2017 TS_4 -0.16 46.36 346.18 11.39 11.79 211 23.18287 US-Sne 2017 TS_5 -0.32 50.59 350.46 11.98 10.7 216 22.67288 US-Sne 2018 TS_1 -0.01 48.41 325.09 10.28 12.15 217.3 22.43289 US-Sne 2018 TS_2 -0.02 33.91 331.01 10.55 11.34 210.2 21.89290 US-Sne 2018 TS_3 -0.08 36.76 331.50 10.87 10.63 212.1 21.5291 US-Sne 2018 TS_4 -0.16 35.64 335.45 11.23 10.09 220.1 21.32292 US-Sne 2018 TS_5 -0.32 49.09 335.94 11.88 9.045 218 20.92293 US-Srr 2016 TS_1 NaN NaN 326.29 10.03 10.71 200.5 20.74294 US-Srr 2017 TS_1 NaN 11.34 346.85 7.22 13.71 199.5 20.93295 US-StJ 2016 TS_2 -0.05 68.37 347.38 4.05 16.22 213.7 20.27296 US-StJ 2016 TS_3 -0.1 68.38 347.38 5.84 14.1 213.7 19.94297 US-Tw1 2012 TS_1 -0.02 50.54 359.96 5.99 11.52 225.2 17.51298 US-Tw1 2012 TS_2 -0.04 48.02 358.76 6.14 11.32 227 17.46299 US-Tw1 2012 TS_3 -0.08 50.07 367.92 5.18 12.31 222.1 17.49300 US-Tw1 2012 TS_4 -0.16 49.05 367.52 5.31 12.19 224.5 17.5301 US-Tw1 2012 TS_5 -0.32 -79.10 347.23 7.89 9.513 225.3 17.4302 US-Tw1 2013 TS_1 -0.02 35.80 337.57 4.39 14.59 206.6 18.97303 US-Tw1 2013 TS_2 -0.04 36.08 337.66 4.39 14.57 206.8 18.96304 US-Tw1 2013 TS_3 -0.08 36.81 338.09 4.40 14.54 207.5 18.94305 US-Tw1 2013 TS_4 -0.16 37.57 338.82 4.41 14.59 208.4 19.01306 US-Tw1 2013 TS_5 -0.32 38.64 340.06 4.46 14.62 209.6 19.07307 US-Tw1 2014 TS_1 -0.02 41.23 395.41 6.67 10.89 208.3 17.56308 US-Tw1 2014 TS_2 -0.04 41.86 397.14 6.70 10.85 208.6 17.55309 US-Tw1 2014 TS_3 -0.08 43.55 400.01 6.78 10.72 209.8 17.49310 US-Tw1 2014 TS_4 -0.16 45.61 404.82 6.88 10.56 211.3 17.44311 US-Tw1 2014 TS_5 -0.32 49.62 416.29 7.09 10.24 213.9 17.33312 US-Tw1 2015 TS_1 -0.02 50.66 342.55 9.02 7.831 235 16.85313 US-Tw1 2015 TS_2 -0.04 52.00 342.38 9.09 7.706 235 16.8314 US-Tw1 2015 TS_3 -0.08 55.61 341.98 9.26 7.385 238 16.64315 US-Tw1 2015 TS_4 -0.16 59.57 342.95 9.51 6.972 240 16.48316 US-Tw1 2015 TS_5 -0.32 69.39 345.18 10.00 6.208 246 16.21317 US-Tw1 2016 TS_1 -0.02 34.57 361.06 8.78 7.943 218 16.72318 US-Tw1 2016 TS_2 -0.04 35.49 362.19 8.86 7.837 219 16.69319 US-Tw1 2016 TS_3 -0.08 38.58 363.10 9.04 7.546 221 16.59320 US-Tw1 2016 TS_4 -0.16 44.73 365.88 9.33 7.14 223 16.47321 US-Tw1 2016 TS_5 -0.32 56.22 370.54 9.86 6.35 229 16.21322 US-Tw1 2017 TS_1 -0.02 41.17 343.75 7.55 10.22 228 17.77323 US-Tw1 2017 TS_2 -0.04 41.75 344.56 7.61 10.11 229 17.72324 US-Tw1 2017 TS_3 -0.08 42.61 345.02 7.75 9.803 231 17.55325 US-Tw1 2017 TS_4 -0.16 45.05 347.17 7.97 9.368 234 17.34

326 US-Tw1 2017 TS_5 -0.32 48.82 349.23 8.38 8.5 240 16.88327 US-Tw1 2018 TS_1 -0.02 60.47 327.43 6.70 10.42 222 17.12328 US-Tw1 2018 TS_2 -0.04 61.54 327.44 6.75 10.36 223 17.1329 US-Tw1 2018 TS_3 -0.08 64.60 328.44 6.85 10.18 225 17.03330 US-Tw1 2018 TS_4 -0.16 67.67 329.40 7.01 9.925 227 16.93331 US-Tw1 2018 TS_5 -0.32 75.09 331.40 7.31 9.459 230 16.77332 US-Tw4 2015 TS_1 -0.02 15.93 327.22 10.04 11.56 199.4 21.6333 US-Tw4 2015 TS_3 -0.08 20.21 329.78 10.48 10.96 202.3 21.44334 US-Tw4 2015 TS_4 -0.16 23.88 332.52 10.86 10.42 205.7 21.28335 US-Tw4 2015 TS_5 -0.32 29.16 338.59 11.49 9.449 212.4 20.94336 US-Tw4 2016 TS_1 -0.02 9.56 358.75 8.16 11.29 201.7 19.45337 US-Tw4 2016 TS_3 -0.08 13.17 360.06 8.67 10.58 205.7 19.25338 US-Tw4 2016 TS_4 -0.16 15.94 362.56 9.11 9.991 209.2 19.11339 US-Tw4 2016 TS_5 -0.32 21.05 367.55 9.91 8.876 216.2 18.78340 US-Tw4 2017 TS_1 -0.02 38.35 347.31 8.07 11.52 211.9 19.59341 US-Tw4 2017 TS_3 -0.08 42.12 351.81 8.45 10.91 215.3 19.36342 US-Tw4 2017 TS_4 -0.16 46.03 354.70 8.83 10.35 218.6 19.18343 US-Tw4 2017 TS_5 -0.32 53.54 361.37 9.52 9.275 224.9 18.79344 US-Tw4 2018 TS_1 -0.02 58.11 344.87 8.00 10.93 218 18.93345 US-Tw4 2018 TS_3 -0.08 63.91 349.15 8.38 10.41 222 18.79346 US-Tw4 2018 TS_4 -0.16 67.95 352.10 8.71 9.862 225 18.57347 US-Tw4 2018 TS_5 -0.32 75.31 357.88 9.33 8.8 231 18.13348 US-Tw5 2018 TS_1 -0.02 NaN 414.83 0.00 8.894 222.2 18.37349 US-Tw5 2018 TS_2 -0.1 NaN 401.00 0.00 12.32 204.4 22.24350 US-Tw5 2018 TS_3 -0.02 NaN 414.83 0.00 8.894 222.2 18.37351 US-Tw5 2018 TS_4 -0.08 NaN 423.43 0.00 7.898 227.3 18.14352 US-Tw5 2018 TS_5 -0.16 NaN 430.15 0.00 7.531 230 17.94353 US-Uaf 2011 TS_1 -0.09 86.20 372.46 -12.29 21.95 199.6 9.667354 US-Uaf 2012 TS_1 -0.09 73.77 338.53 -11.83 20.86 202.4 9.028355 US-Uaf 2013 TS_1 -0.09 109.63 395.51 -10.08 20.52 200.4 10.44356 US-Uaf 2014 TS_1 -0.09 76.07 365.40 -10.94 19.94 206 8.999357 US-Uaf 2015 TS_1 -0.09 80.99 423.19 -9.77 19.76 190 9.998358 US-Uaf 2016 TS_1 -0.09 77.38 315.75 -7.74 19.13 198 11.39359 US-Uaf 2017 TS_1 -0.09 84.88 380.17 -7.39 19.08 196 11.69360 US-Uaf 2018 TS_1 -0.09 96.04 333.33 -5.60 17.72 199 12.11361 US-WPT 2011 TS_1 -0.1 80.95 342.17 5.27 19.27 202.6 24.54362 US-WPT 2011 TS_2 -0.3 NaN 347.04 6.38 16.62 209.7 23.01363 US-WPT 2012 TS_1 -0.1 40.29 345.57 3.70 21.6 197.4 25.3364 US-WPT 2012 TS_2 -0.3 44.91 354.96 4.52 19.21 203.8 23.72365 US-WPT 2013 TS_1 -0.1 74.61 340.47 3.73 18.23 207.2 21.96366 US-WPT 2013 TS_2 -0.3 77.62 352.35 4.32 16.69 211.7 21.01
Column DescriptionsSITE_IDYearProbe_name
Site identification code as assigned by regional flux data Data yearTemperature probe name as given in data files

Soil_temp_depth_mStart_TS_(DOY) Season start for elevated TS (DOY), point "f" in Figure 1End_TS_(DOY) Season end for elevated TS (DOY), point "h" in Figure 1Base_value_TS_(C)Ampl_TS_(C)
Peak_TS_(DOY) Day of maximum elevated TS (DOY), point "g" in Figure 1Peak_value_TS_(C) Maximum value of TS (C) point "e" in Figure 1
Amplitude of TS during elevated temperature season (C), difference between point "e" in Figure 1 and Base_value_TS
Baseline TS during non-elevated season (C), average of points
Depth of soil temperature probe (m), with negative values

Table B7 - Soil temperature probe depths (m)SITE_ID Year Probe
nameSoil_temp_depth_m
Additional_notes
1 AT-Neu TS_1 -0.052 AT-Neu TS_2 -0.13 AT-Neu TS_3 -0.24 BR-Npw TS_15 BR-Npw TS_26 BW-Gum no data7 BW-Nxr no data8 CA-SCB TS_1 09 CA-SCB TS_2 -0.02
10 CA-SCB TS_3 -0.0411 CA-SCB TS_4 -0.0812 CA-SCB TS_5 -0.1613 CA-SCB TS_6 -0.3214 CA-SCB TS_7 -0.6415 CA-SCB TS_8 -1.2816 CA-SCC TS_1 -0.117 CA-SCC TS_2 -0.1518 CA-SCC TS_3 -0.219 CA-SCC TS_4 -0.2520 CA-SCC TS_5 -0.321 CA-SCC TS_6 -0.522 CA-SCC TS_7 -0.623 CA-SCC TS_8 -0.724 CH-Cha TS_1 -0.0125 CH-Cha TS_2 -0.0226 CH-Cha TS_3 -0.0427 CH-Cha TS_4 -0.0728 CH-Cha TS_5 -0.129 CH-Cha TS_6 -0.1530 CH-Cha TS_7 -0.2531 CH-Cha TS_8 -0.432 CH-Cha TS_9 -0.9533 CH-Dav TS_1 -0.0534 CH-Dav TS_2 -0.1535 CH-Dav TS_3 -0.536 CH-Dav TS_4 -37 CH-Dav TS_5 -38 CH-Dav TS_6 -39 CH-Oe2 TS_1 -0.0540 CH-Oe2 TS_2 -0.141 CH-Oe2 TS_3 -0.1542 CH-Oe2 TS_4 -43 CH-Oe2 TS_5 -0.344 CH-Oe2 TS_6 -0.5

45 CH-Oe2 TS_7 -46 CN-Hgu TS47 DE-Dgw no data48 DE-Hte TS_1 049 DE-Hte TS_2 -0.150 DE-Hte TS_3 -0.251 DE-SfN TS_1 -0.0252 DE-SfN TS_3 -0.153 DE-SfN TS_4 -0.254 DE-SfN TS_5 -0.555 DE-Zrk TS_1 -0.0556 DE-Zrk TS_2 -0.157 DE-Zrk TS_3 -0.258 DE-Zrk TS_4 -0.359 DE-Zrk TS_5 -0.560 FI-Hyy TS_1 -0.0261 FI-Hyy TS_2 -0.0462 FI-Hyy TS_3 -0.1263 FI-Hyy TS_4 -0.2564 FI-Hyy TS_5 -0.565 FI-Lom TS_1 -0.0766 FI-Lom TS_2 -0.367 FI-Lom TS_3 -0.568 FI-Si2 TS_1 -0.0569 FI-Si2 TS_2 -0.270 FI-Si2 TS_3 -0.3571 FI-Si2 TS_4 -0.572 FI-Sii pre 2016 TS_1 -0.0573 FI-Sii pre 2016 TS_2 -0.274 FI-Sii pre 2016 TS_3 -0.3575 FI-Sii pre 2016 TS_4 -0.576 FI-Sii after 2017 TS_1 077 FI-Sii after 2017 TS_2 -0.578 FI-Sii after 2017 TS_3 -0.179 FI-Sii after 2017 TS_4 -0.1580 FI-Sii after 2017 TS_5 -0.2581 FI-Sii after 2017 TS_6 -0.4582 FI-Sii after 2017 TS_7 -0.9583 FR-LGt TS_1 -0.0284 FR-LGt TS_2 -0.0585 FR-LGt TS_3 -0.186 FR-LGt TS_4 -0.287 FR-LGt TS_5 -0.488 HK-MPM TS_189 HK-MPM TS_290 HK-MPM TS_391 ID-Pag TS_1 -0.05

92 IT-BCi TS_1 -0.0593 IT-BCi TS_2 -0.194 IT-BCi TS_3 -0.395 IT-BCi TS_4 -0.596 IT-BCi TS_5 -197 IT-Cas TS_1 -0.03598 IT-Cas TS_2 -0.07599 IT-Cas TS_3 -0.15
100 JP-BBY TS_1 -0.183101 JP-BBY TS_2 -0.233102 JP-BBY TS_3 -0.283103 JP-BBY TS_4 -0.383104 JP-BBY TS_5 -0.483105 JP-Mse TS_1 -0.01106 JP-Mse TS_2 -0.025107 JP-Mse TS_3 -0.05108 JP-Mse TS_4 -0.1109 JP-Mse TS_5 -0.2110 JP-Mse TS_6 -0.4111 JP-SwL no data112 KR-CRK TS_1 -0.05113 KR-CRK TS_2 -0.15114 MY-MLM TS_1 -0.05115 NL-Hor TS_1 -0.01116 NL-Hor TS_2 -0.02117 NL-Hor TS_3 -0.04118 NL-Hor TS_4 -0.05119 NL-Hor TS_5 -0.1120 NL-Hor TS_6 -0.15121 NL-Hor TS_7 -0.25122 NL-Hor TS_8 -0.4123 NL-Hor TS_9 -0.6124 NZ-Kop TS_1 -0.5125 NZ-Kop TS_2 -0.1126 NZ-Kop TS_3 -0.2127 PH-RiF TS_1128 RU-Ch2 TS_1 -0.04129 RU-Ch2 TS_2 -0.08130 RU-Ch2 TS_3 -0.16131 RU-Che TS_1 -0.04132 RU-Che TS_2 -0.08133 RU-Che TS_3 -0.16134 RU-Cok no data135 RU-Fy2 TS_1136 RU-Fy2 TS_2137 RU-Fy2 TS_3138 RU-Fy2 TS_4

139 RU-Fy2 TS_5140 SE-Deg TS_1 -0.02141 SE-Deg TS_2 -0.05142 SE-Deg TS_3 -0.1143 SE-Deg TS_4 -0.15144 SE-Deg TS_5 -0.3145 SE-Deg TS_6 -0.5146 UK-LBT no data147 US-A03 TS_1 -0.025148 US-A03 TS_2 -0.1149 US-A03 TS_3 -0.3150 US-A10 TS_1 -0.025151 US-A10 TS_2 -0.1152 US-A10 TS_3 -0.3153 US-Atq TS_1154 US-Atq TS_2155 US-Atq TS_3156 US-Beo TS_1157 US-Beo TS_2158 US-Beo TS_3159 US-Bes TS_1160 US-Bes TS_2161 US-Bes TS_3162 US-Bi1 TS_1 -0.02163 US-Bi1 TS_2 -0.04164 US-Bi1 TS_3 -0.08165 US-Bi1 TS_4 -0.16166 US-Bi1 TS_5 -0.32167 US-Bi2 TS_1 -0.02168 US-Bi2 TS_2 -0.04169 US-Bi2 TS_3 -0.08170 US-Bi2 TS_4 -0.16171 US-Bi2 TS_5 -0.32172 US-BZB TS_1 -0.075173 US-BZB TS_2 -0.05174 US-BZF TS_1 -0.075175 US-BZF TS_2 -0.05176 US-BZS TS_1177 US-BZS TS_2178 US-BZS TS_3179 US-CRT TS_1180 US-DPW no data181 US-EDN TS_1 -0.25182 US-EDN TS_2 -0.15183 US-EDN TS_3 -0.05184 US-EDN TS_4 0185 US-EDN TS_5 0.05

186 US-EDN TS_6 0.1187 US-EDN TS_7 0.2188 US-EDN TS_8 0.3189 US-EML TS_1 -0.05190 US-EML TS_2 -0.1191 US-EML TS_3 -0.2192 US-EML TS_4 -0.4193 US-Ho1 TS_1 -0.05194 US-Ho1 TS_2 -0.1195 US-HRA no data -0.02196 US-HRC no data -0.02197 US-ICs TS_1 -0.075198 US-ICs TS_2 -0.05199 US-Ivo TS_1 -0.05200 US-Ivo TS_2 -0.1201 US-Ivo TS_3 -0.15202 US-Ivo TS_4 -0.3203 US-Ivo TS_5 -0.4204 US-LA1 TS -0.1205 US-LA2 TS -0.1206 US-Los TS_1 0207 US-Los TS_2 -0.05208 US-Los TS_3 -0.1209 US-Los TS_4 -0.2210 US-Los TS_5 -0.5211 US-MRM TS_1212 US-MRM TS_2213 US-Myb TS_1 -0.02214 US-Myb TS_2 -0.04215 US-Myb TS_3 -0.08216 US-Myb TS_4 -0.16217 US-Myb TS_5 -0.32218 US-NC4 TS_1 -0.05219 US-NC4 TS_2 -0.2220 US-NGB no data221 US-NGC no data222 US-ORv TS_1 -0.08223 US-OWC TS_1 -0.05224 US-OWC TS_2 -0.3225 US-PFa226 US-Snd TS_1 -0.08227 US-Snd TS_2 -0.16228 US-Snd TS_3229 US-Snd TS_4230 US-Snd TS_5231 US-Snd TS_6232 US-Sne TS_1 -0.01

233 US-Sne TS_2 -0.02234 US-Sne TS_3 -0.08235 US-Sne TS_4 -0.16236 US-Sne TS_5 -0.32237 US-Srr TS_1238 US-Srr TS_2239 US-Srr TS_3240 US-Srr TS_4241 US-Srr TS_5242 US-StJ TS_2 -0.05243 US-StJ TS_3 -0.1244 US-Tw1 TS_1 -0.02245 US-Tw1 TS_2 -0.04246 US-Tw1 TS_3 -0.08247 US-Tw1 TS_4 -0.16248 US-Tw1 TS_5 -0.32249 US-Tw3 TS_1 -0.02250 US-Tw3 TS_2 -0.04251 US-Tw3 TS_3 -0.08252 US-Tw3 TS_4 -0.16253 US-Tw3 TS_5 -0.32254 US-Tw4 TS_1 -0.02255 US-Tw4 TS_2 -0.04256 US-Tw4 TS_3 -0.08257 US-Tw4 TS_4 -0.16258 US-Tw4 TS_5 -0.32259 US-Tw5 TS_1 -0.02260 US-Tw5 TS_2 -0.1261 US-Tw5 TS_3 -0.02262 US-Tw5 TS_4 -0.08263 US-Tw5 TS_5 -0.16264 US-Twt TS_1 -0.02265 US-Twt TS_2 -0.04266 US-Twt TS_3 -0.08267 US-Twt TS_4 -0.16268 US-Twt TS_5 -0.32269 US-Uaf TS_1 -0.09 average of 3 depths: -0.15, -0.02, -0.1270 US-Uaf TS_2 -0.183333 average of 3 depths: -0.3, -0.05, -0.2271 US-Uaf TS_3 -0.283333 average of 3 depths: -0.45, -0.1, -0.3272 US-Uaf TS_4 -0.366667 average of 3 depths: -0.5, -0.2, -0.4273 US-Uaf TS_5 -0.5 average of 2 depths: -0.7, -0.3274 US-Uaf TS_6 -0.6 average of 2 depths: -0.8, -0.4275 US-Uaf TS_7 -0.75 average of 2 depths: -1, -0.5276 US-Uaf TS_8 -0.925 average of 2 depths: -1.25, 0.6,277 US-Uaf TS_9 -1278 US-WPT TS_1 -0.1279 US-WPT TS_2 -0.3

Column Descriptions
SITE_IDYearProbe_name Temperature probe name as given in data filesSoil_temp_depth_mAdditional_notes When relevant, additional information about site
When relevant, information about time-span of probe location. If
Depth of soil temperature probe (m), with negative values being under
Site identification code as assigned by regional flux data network