A chemical kinetic modelling study of the combustion of CH4
44
1 2 3 4 5 6 7 8 9 10 11 12 13 14 15 16 17 18 19 20 21 22 23 24 25 26 27 28 29 30 31 32 33 34 35 36 37 38 39 40 41 42 43 44 45 46 47 48 49 50 51 52 53 54 55 56 57 58 59 60 61 62 63 64 65 A chemical kinetic modelling study of the combustion of CH 4 - CO - H 2 - CO 2 fuel mixtures M. Fischer 1 , X. Jiang Engineering Department, Lancaster University, Lancaster LA1 4YR, UK. Keywords: Biogas, Optimization, Modeling, Combustion, Chemical Kinetics. Abstract In the present study, five detailed reaction mechanisms have been employed for simu- lating 530 ignition delay times involving mixtures containing methane, hydrogen, carbon monoxide and carbon dioxide. A novel concept, Reaction Significance Analysis (RSA), has been used for identifying those kinetic parameters which have the greatest influence on the disparities between a given set of experimental data and the model predictions. Over- all, most mechanisms capture at best the combustion of biogas and display their poorest performance in relation to the combustion of bio-syngas. NUIG (a reaction mechanism developed at the National University of Ireland, Galway) proves to be the best choice for simulating the burning of bio-syngas, its imperfection notwithstanding. Generally, models tend to over-predict ignition delay times measured at the lowest temperatures. This effect is mostly related to the inhomogeneous behaviour of shock tubes under those conditions. Besides that, Reaction Significance Analyses revealed a correlation between poor modelling performance and reactions belonging to the subsystem HO 2 - H 2 O 2 . We identified situations where such chemical kinetic factors appear to play a role in inaccurate predictions. Overall, the present study strongly indicates that the kinetic modelling of the combustion of CH 4 - CO - H 2 - CO 2 should not be seen as a problem successfully solved in the past once and for all. There is a genuine need for more kinetic experiments targeting reaction parameters which remain widely uncertain owing to their weak influence on most available measurements. 1. Introduction While the combustion of heavy hydrocarbons (such as aromatic hydrocarbons, cy- cloalcanes and high alcanes) plays a major role in the use of transportation engines and burners [1–3], the combustion of methane remains extremely important for power and 1 Corresponding Author: Marc Fischer. E-mail address: m.fi[email protected] Telephone number: +44 1524 594645. Preprint submitted to Combustion and Flame January 26, 2016
-
Upload
khangminh22 -
Category
Documents
-
view
0 -
download
0
Transcript of A chemical kinetic modelling study of the combustion of CH4

1 2 3 4 5 6 7 8 9 10 11 12 13 14 15 16 17 18 19 20 21 22 23 24 25 26 27 28 29 30 31 32 33 34 35 36 37 38 39 40 41 42 43 44 45 46 47 48 49 50 51 52 53 54 55 56 57 58 59 60 61 62 63 64 65
A chemical kinetic modelling study of the combustion of
CH4 − CO− H2 − CO2 fuel mixtures
M. Fischer1 , X. Jiang
Engineering Department, Lancaster University, Lancaster LA1 4YR, UK.
Keywords:Biogas, Optimization, Modeling, Combustion, Chemical Kinetics.
Abstract
In the present study, five detailed reaction mechanisms have been employed for simu-lating 530 ignition delay times involving mixtures containing methane, hydrogen, carbonmonoxide and carbon dioxide. A novel concept, Reaction Significance Analysis (RSA),has been used for identifying those kinetic parameters which have the greatest influence onthe disparities between a given set of experimental data and the model predictions. Over-all, most mechanisms capture at best the combustion of biogas and display their poorestperformance in relation to the combustion of bio-syngas. NUIG (a reaction mechanismdeveloped at the National University of Ireland, Galway) proves to be the best choicefor simulating the burning of bio-syngas, its imperfection notwithstanding. Generally,models tend to over-predict ignition delay times measured at the lowest temperatures.This effect is mostly related to the inhomogeneous behaviour of shock tubes under thoseconditions. Besides that, Reaction Significance Analyses revealed a correlation betweenpoor modelling performance and reactions belonging to the subsystem HO2 − H2O2. Weidentified situations where such chemical kinetic factors appear to play a role in inaccuratepredictions. Overall, the present study strongly indicates that the kinetic modelling of thecombustion of CH4−CO−H2−CO2 should not be seen as a problem successfully solved inthe past once and for all. There is a genuine need for more kinetic experiments targetingreaction parameters which remain widely uncertain owing to their weak influence on mostavailable measurements.
1. Introduction
While the combustion of heavy hydrocarbons (such as aromatic hydrocarbons, cy-cloalcanes and high alcanes) plays a major role in the use of transportation engines andburners [1–3], the combustion of methane remains extremely important for power and
1Corresponding Author: Marc Fischer.E-mail address: [email protected] number: +44 1524 594645.
Preprint submitted to Combustion and Flame January 26, 2016

1 2 3 4 5 6 7 8 9 10 11 12 13 14 15 16 17 18 19 20 21 22 23 24 25 26 27 28 29 30 31 32 33 34 35 36 37 38 39 40 41 42 43 44 45 46 47 48 49 50 51 52 53 54 55 56 57 58 59 60 61 62 63 64 65
Table 1: Typical composition of biogas and bio-syngas from biomass gasification
Constituent (Volume %) Biogas Bio-syngas
CH4 50 - 75 8 - 11CO2 25 - 50 21 - 30CO - 28 - 36H2 0 - 1 22 - 32N2 0 - 10 -
heat generation. On the one hand, all detailed reaction mechanisms describing the oxida-tion and pyrolysis of aromatic compounds and high alcanes have to contain an accuratesub-model accounting for the combustion of CH4 [4, 5]. The reactions it involves candetermine to a large extent the concentrations of methyl and hydroxyl radicals and thusthe major features of any flame [6]. On the other hand, methane itself is one of the mainconstituents of fuels which are frequently used at the dawn of the third millennium. Nat-ural gas is a fossil resource mainly composed of methane which is still massively utilisedfor the production of heat and electricity [7]. It is currently also being increasingly usedas a fuel for engines [8].
Since methane is an important compound of promising renewable fuels such as biogasand bio-syngas, an accurate understanding of its burning is crucial for its environment-friendly and sustainable use [9, 10]. Mostly composed of 40-75% of methane, 25-55% ofcarbon dioxide (and possibly 0-10% of hydrogen), biogas stems from the fermentation ofbiomass by anaerobic bacteria. It can be produced from organic wastes and energeticplants. Its manifold applications include the combined generation of heat and electricityand its conversion into liquid or gaseous fuels and hydrogen [11]. Bio-syngas is a syntheticgas obtained from the thermal gasification of biomass. It contains CO, CO2, CH4, and H2
and is thought to be a cleaner fuel than biogas owing to its higher hydrogen content [12].Table 1 sums up the typical composition of biogas and bio-syngas [13]. Both biogas andbio-syngas are promising renewable fuels. Their combustion can be critically dependenton reactions undergone by methane and the methyl radical [14, 15].
All of the above indicates that a very good understanding of CH4 oxidation and itsinteraction with CO, CO2, and H2 is necessary if one is to meet the economical andenvironmental challenges of our century in an optimal way. CFD (Computational FluidDynamics) simulations are now being widely recognised as a necessary part of the efficientdesign of power generation systems [16]. Their reliable use requires a good underlyingdetailed reaction mechanism which must be reduced [17–19] in order to become suitable fortheir high computational requirements. Given the central importance of methane, mostreaction mechanisms have been specifically validated with respect to its combustion. Inour previous studies [14, 15], we considered five of them:
• GRI 3.0 (Gas Research Institute), which has been systematically optimised with
2

1 2 3 4 5 6 7 8 9 10 11 12 13 14 15 16 17 18 19 20 21 22 23 24 25 26 27 28 29 30 31 32 33 34 35 36 37 38 39 40 41 42 43 44 45 46 47 48 49 50 51 52 53 54 55 56 57 58 59 60 61 62 63 64 65
respect to a great number of measurements pertaining to the combustion of naturalgas.
• DRM (Detailed Reduced Model), a skeletal version of the GRI-mechanism.
• Frenklach’s mechanism, a detailed reaction mechanism extending the GRI-mechanismto pyrolytic conditions.
• Heghes’ mechanism, a reaction mechanism accounting for the oxidation of C1 − C4
hydrocarbons.
• A large-scale mechanism accounting for the combustion of C1 − C5 hydrocarbonsdesignated as NUIG (National University of Ireland, Galway).
A priori, GRI 3.0 is expected to lead to the best results given the fact that its kineticparameters have been specifically optimised with respect to a highly diverse set of exper-iments involving CH4.
Despite this intensive modelling endeavour, the situation is not always satisfactory.For example, the predictions of the mechanisms are in strong conflict with shock-tubeexperiments that specifically target the chemistry of CH3 recombination which can playan important role in the formation of NO during the combustion of biogas [20]. So far asbio-syngas is concerned, the ignition delay times for high pressures and high temperaturesas well as low temperatures and low pressures are poorly matched by GRI 3.0 [14]. Theseproblems indicate that it may be worthwhile to extend our comparative evaluation ofthe five models (which was limited to bio-syngas [14] and biogas [15]) to a much greaternumber of experimental data, many of which directly involve the combustion of methane.To that end, we considered 530 ignition delay times measured behind reflected shockwaves so as to allow a uniform quantification of the discrepancies between experimentsand model results.
This article is organised as follows. In Section 2, the methodology is presented. InSection 3, the simulations of sets of experiments using the five reaction mechanisms isdescribed and analysed. In Section 4, the influence of various factors (such as temperaturerange, dilution or composition) on the accuracy of the model predictions is examined.Finally, in Section 5, the conclusion of the present study is given along the outlook.
2. Methodology
The simulations of the shock tube measurements have been carried out with thesoftware Homrea [21–23] using homogeneous zero-dimensional assumptions involving aconstant volume V and a constant internal energy U. Whilst these hypotheses proveinsufficient for correctly accounting for a range of shock tube experiments (see [24–26]and our own discussion thereof in subsection 4.1), we adopted it uniformly here becausewe aimed at simulating a very wide variety of conditions relevant to the combustion ofCH4 − CO− H2 − CO2, comparing them to model predictions and computing statistical
3

1 2 3 4 5 6 7 8 9 10 11 12 13 14 15 16 17 18 19 20 21 22 23 24 25 26 27 28 29 30 31 32 33 34 35 36 37 38 39 40 41 42 43 44 45 46 47 48 49 50 51 52 53 54 55 56 57 58 59 60 61 62 63 64 65
quantities while keeping in mind that the discrepancies between model pre-
dictions and measurements often stem from a combination of faulty chemical
and physical modelling. While it might be desirable to systematically simulate ex-periments characterised by long ignition delays employing more realistic physical modelssuch as CHEMSHOCK [27], doing so would require a long-term endeavour going beyondthe resources available for the present work. We systematically defined the ignition delayas the time point at which the slope of the OH radical concentration (or that of H un-der pyrolytic conditions) takes on its greatest value. Our experience showed us that thedifference with values obtained through the use of other variables are very small, as hasbeen confirmed elsewhere [26].
Five detailed reaction mechanisms have been considered for the present study. TheGas Research Institute (GRI) mechanism 3.0 [28] has been developed for simulating thecombustion of natural gas. This involved the systematic optimisation of its kinetic andthermo-chemical parameters with the Surface Mapping Method [29, 30]. It consists of325 elementary reactions and encompasses 53 species which account for the combustionof H2 ,CO, CH4, N2 (NOx formation) as well as reactions between nitrogenous speciesand the hydrocarbons. While this reaction mechanism is now relatively old, it representsthe only systematic attempt to optimise its highly correlated kinetic parameters using awide range of experimental measurements.
Frenklach et al. [30–32] and Wang and Sheen [33] have forcefully argued againstthe view that “proliferating” reaction mechanisms based on collections of individuallyevaluated rate constants is a strategy likely to produce trustworthy models. Given thisunique feature of GRI 3.0., it seemed warranted to include it in our study despite its olderage.
The Developed Reduced Mechanism (DRM) 22 [34] is a reduced skeletal mechanismbased on an earlier version of GRI (1.2). It was developed through the use of a fluxanalysis and the constraints
R(i) < e(r)|R(ref)| and |R(i)δH(i)| < e(q)Q
whereby R(i) is the rate of reaction i, R(ref) is the rate of a reference reaction (such as, say,the maximum rate), δH(i) is the enthalpy change of reaction i, Q is the maximum valueamong all the terms |R(i)δH(i)|, and e(R) and e(q) are chosen parameters considerablysmaller than unity. The reference rates were produced using the detailed GRI-mechanismversion 1.2. Frenklach et al. [1, 5] constructed a reaction mechanism describing the forma-tion of Polycyclic Aromatic Hydrocarbons (PAH) under rich and pyrolytic conditions. Itrelies on the GRI-mechanism (version 1.2) alongside steps accounting for the formation ofgrowing aromatic compounds which are the precursors of soot. It led to good predictionsfor various profiles of aromatic species and their intermediates in laminar flames. Weconsidered it for all our investigations in order to see if it can better describe combustionunder rich conditions.
Heghes built up a reaction mechanism [4, 21, 35] for C1 − C4 hydrocarbons whichwas validated in relation to laminar flame speeds and ignition delay times measured in
4

1 2 3 4 5 6 7 8 9 10 11 12 13 14 15 16 17 18 19 20 21 22 23 24 25 26 27 28 29 30 31 32 33 34 35 36 37 38 39 40 41 42 43 44 45 46 47 48 49 50 51 52 53 54 55 56 57 58 59 60 61 62 63 64 65
shock tubes. The mechanism consists of 412 elementary reactions and 61 species and isbased on a rate-data compilation by Baulch et al. [36] grounded on kinetic experiments,quantum chemical computations and analogies with well-known reactions. It was testedwith respect to the stoichiometric/ fuel-lean combustion of H2 , H2 − CO, CH4, C2H2,C2H4, C2H6, C3H8, and C4H10. Overall, it yielded a good match to the measurementsexcept for acetylene, which is probably of little relevance to the simulation of natural gas,biogas, bio-syngas and methane alone. Since we used it in our previous studies aboutbiogas [15] and found it displayed interesting performances in relation to some CH4 −H2
blends, we considered it worthwhile to also employ it for the present work.The NUIG (National University of Ireland in Galway) mechanism is a C0−C5 reaction
mechanism which stems from a long-term endeavour aiming at the construction of amodel capable of describing the combustion of various hydrocarbons under a wide rangeof conditions. It has a hierarchical structure and includes H2−O2, CO−CH4, C2, C3, C4,and C5 sub-mechanisms [3, 37–39]. Whilst the NUIG mechanism has not been speciallyfine-tuned to capture the chemistry of H2−CO−CH4−O2 blends (such as in bio-syngas),it gave very satisfactory predictions of CH4/H2/CO experiments performed by Gersen etal. [40] in a rapid compression machine. In the bio-syngas experiments conducted byMathieu et al. [41] in shock tubes, the NUIG predictions are often much closer to themeasurements than those of the GRI-mechanism. As a consequence, we have deemedit worthy of consideration for our studies. In contrast to the other four mechanismsmentioned above, its H2 − O2 subpart has been separately developed [42] through arigorous comparison with measurements under fairly diverse conditions (from 298 to 2700K, 0.05 to 87 atm and an equivalence ratio varying between 0.2 and 6 for ignition delaytimes in shock tubes, flame speeds and concentration profiles in flames and laminar flowreactors). What is more, it employs the recommended rate expression for the elementarystep CO+HO2 = CO2+OH [43] aiming at reconciling the effect of CO in H2 mixtures onthe measured ignition delay times at high pressure. The kinetics of the CH3−O2−CH3O2
system has also been adapted to high pressures and intermediate temperature ranges [44].Taken all together, these factors might explain why NUIG performed better than GRI 3.0with respect to the simulation of the experiments involving bio-syngas mentioned above.
In a recent publication [20], Fischer and Jiang argued that the evaluation and opti-misation of chemical kinetics models call for some sort of probabilistic framework takinginto account the unavoidable uncertainties of any measurements. Wang and Sheen [33],Frenklach et al. [31, 32], Olm et al. [45, 46], and Burke et al. [47] have offered comple-mentary overviews of the evaluation and comparison of reaction mechanisms we refer theinterested reader to.
An experimental data point ei is usually assumed to follow a normal distribution withmean value µi and standard deviation σi so that its probability density is given by
P (ei, µi, σi) =1
σi
√2π
e−(ei−µi)2/2σ2
i
Therefore, the probability density of all measurements given the validity of a reaction
5

1 2 3 4 5 6 7 8 9 10 11 12 13 14 15 16 17 18 19 20 21 22 23 24 25 26 27 28 29 30 31 32 33 34 35 36 37 38 39 40 41 42 43 44 45 46 47 48 49 50 51 52 53 54 55 56 57 58 59 60 61 62 63 64 65
mechanism with parameter values p and the standard deviations σi is given by
L(e|p) =n∏
i=1
P (ei,mi, σi) =n∏
i=1
1
σi
√2π
e−(ei−mi(p))2/2σ2
i
Maximising this term is tantamount to minimising the Chi-square norm
χ2(p) =n∑
i=1
(ei −mi(p))2
σ2i
which yields maximum likelihood estimates for the kinetic coefficients. In the presentpublication (where we limit ourselves to ignition delay times), we decided to use thedistance between their logarithmic values defined as
d(p) =n∑
i=1
|log10(τm,i)− log10(τe,i)|
instead, whereby τm,i and τe,i are the model prediction and the experimental measurement,respectively. While this norm should be used with caution when estimating parameters, itallows a more intuitive visualisation of the strengths and weaknesses of the models undervarious conditions which all involve ignition delay times.
A new type of sensitivity analysis called Reaction Significance Analysis (RSA)has been developed by us [20]. Let us consider a parameter q included within the interval[ql; qu]. Its reaction significance is defined as
S = maxd(q), q ∈ [ql; qu] −mind(q), q ∈ [ql; qu]
It is a natural measure of the influence of q on the overall distance d between modelpredictions and measurements. Unlike sensitivity coefficients which are mostly related toa single species at a single time point, an RSA provides us with a quantity informing usabout the overall importance of a parameter with respect to an ensemble of experimentaldata. An RSA permits the identification of kinetic parameters whose optimisation can beexpected to minimise the global discrepancies between model predictions and measure-ments. Traditional sensitivity analyses focus on a limited part of the experiment and alimited number of variables such as the concentration of OH measured at the time of theignition. While dealing with a very large number of measurements , individual sensitivityanalyses do not necessarily inform us about the reactions playing a major role in theglobal disparities between model predictions and measurements. Consequently, we thinkthat RSA are worthy of consideration while attempting to evaluate the relative merits ofa model with respects to pressure, temperature or composition regions involving manyexperiments. We recently applied RSA to identify a reaction set of GRI 3.0 accounting forthe largest discrepancies with measured species profiles related to the combustion of CH3
and C2H6 and could show that the mechanism is potentially optimisable in that respect
6

1 2 3 4 5 6 7 8 9 10 11 12 13 14 15 16 17 18 19 20 21 22 23 24 25 26 27 28 29 30 31 32 33 34 35 36 37 38 39 40 41 42 43 44 45 46 47 48 49 50 51 52 53 54 55 56 57 58 59 60 61 62 63 64 65
[20].We believe that future studies systematically comparing RSA with advanced sensitiv-
ity analysis techniques (such as Global screening methods [48], Surface response methods[30], polynomial chaos methods [49] and techniques based on Bayesian analyses [33]) areworthwhile.
In order to allow comparisons between RSA performed for different experiments anddiverse reaction mechanisms, we defined relative Reaction Significances. Let us suppose,for instance, that the reaction significances of n reactions have been computed. Let uscall Rm the greatest value among them. The relative reaction significances are obtainedby dividing all corresponding reaction significances by Rm. For the sake of simplicity,relative reaction significances will be simply called reaction significances from now on.The advantage of this redefinition is threefold:
• all values are comprised between 0 and 1
• the relative importance of the steps can be more easily visualised
• comparisons with RSA calculated under other conditions become possible.
Reaction Significance Analyses have been carried out for the different experimental setsof Section 3 using DRM by virtue of its smaller number of reactions which reducedthe computational burden. While the numerical values of the RSA coefficients mightdepend on the reaction mechanism taken into consideration, our experience was that theimportant steps identified in this way can be also found using any other sufficiently reliablemodel instead [50].
RSA is a potential way to test the self-consistency of a set of experimental data. If thesame reactions are significant for various experiments very well described by the model,we might cautiously draw the conclusion that their values are more or less trustworthy.If the same reactions are significant for various experiments poorly predicted by themodel, we may either conclude that their parameters are erroneous or that the physicalassumptions used to simulate the experiments are invalid. A considerable body of evidence[24, 51, 52] shows that shock tube experiments at low temperatures exceeding a certainduration (which might be as short as 500 µs [26] ) can no longer be viewed as zero-dimensional systems whose variables only depend on the reaction time. Facility-dependentunstabilities may considerably quicken the ignition, thereby leading to much lower delaysthan those which would have been obtained if the system had been homogeneous. Inorder to make a distinction between this situation and cases where ignition delay times aremostly governed by homogeneous chemical kinetics, we separately computed the averageddiscrepancies (and their standard deviations) for temperatures below and above 1250
K as the shape of the data employed seems to strongly indicate that the combustion canbe considered homogeneous for values higher than this threshold.
Another potentially interesting aspect of RSA is its revealing the inconsistency of twoexperiments whose discrepancies with the model predictions are influenced by the samereactions. If one experiment presents a good match to the results of the mechanism
7

1 2 3 4 5 6 7 8 9 10 11 12 13 14 15 16 17 18 19 20 21 22 23 24 25 26 27 28 29 30 31 32 33 34 35 36 37 38 39 40 41 42 43 44 45 46 47 48 49 50 51 52 53 54 55 56 57 58 59 60 61 62 63 64 65
Table 2: Conditions of Kalitan [53]
Series XH2 XCO XCH4 XCO2 XAR XO2 XN2 p (bar)1 1.15E-01 6.60E-03 5.67E-03 1.50E-02 1.40E-03 1.79E-01 6.78E-01 9.7072 1.15E-01 6.60E-03 5.67E-03 1.50E-02 1.40E-03 1.79E-01 6.78E-01 30.1953 1.80E-01 1.03E-02 8.87E-03 2.36E-02 2.19E-03 1.61E-01 6.14E-01 11.9564 1.80E-01 1.03E-02 8.87E-03 2.36E-02 2.19E-03 1.61E-01 6.14E-01 36.5785 4.03E-02 5.53E-02 7.50E-03 3.52E-02 2.50E-03 1.57E-01 7.02E-01 9.1196 4.03E-02 5.53E-02 7.50E-03 3.52E-02 2.50E-03 1.57E-01 7.02E-01 25.8387 5.93E-02 8.15E-02 1.11E-02 5.19E-02 3.70E-03 1.32E-01 6.60E-01 36.781
Table 3: Average logarithmic discrepancies for Kalitan [53]
Series DRM Frenklach GRI Heghes NUIG1 0.234 0.234 0.517 0.277 0.1872 0.898 0.898 0.960 0.800 0.8213 0.703 0.703 0.880 0.692 0.7004 0.651 0.651 0.720 0.607 0.5875 0.358 0.358 0.088 0.123 0.0816 0.350 0.350 0.122 0.244 0.0407 0.240 0.240 0.132 0.146 0.114T < 1250 K 0.500 0.500 0.517 0.439 0.377T ≥ 1250 K 0.358 0.358 0.110 0.136 0.063
whereas the data of the other one are far off from them, we may safely conclude that atleast one of them has not been correctly modelled physically or that some systematic erroroccurred. Such a conclusion might be harder to rigurously draw when using traditionalsensitivity analyses which lack a direct connection to goodness of fit.
3. Simulation of sets of experiments
3.1. Experiments of Kalitan [53]
Kalitan [53] performed a series of shock tube experiments involving blends containingH2, CO, CH4, CO2, and AR burning with air. The ignition delay times were measuredbehind reflected shock waves under a large range of conditions. They were experimentallydetermined from the chemiluminescence profiles of the hydroxyl radical coupled with theprofile of the pressure behind the reflected shock wave. The experimental conditionsrelevant to methane are given in Table 2.
The simulated profiles themselves are represented in Figure 1 whereas the averagelogarithmic discrepancies for each series can be found in Table 3. It can be seen thatfor the experimental sets 2, 3, and 4 (as defined in Table 2), the ignition delay times areconsiderably overpredicted at smaller temperatures. No differences among the other inputconditions could account for this. The Reaction Significance Analysis (RSA) (see Figure
8

1 2 3 4 5 6 7 8 9 10 11 12 13 14 15 16 17 18 19 20 21 22 23 24 25 26 27 28 29 30 31 32 33 34 35 36 37 38 39 40 41 42 43 44 45 46 47 48 49 50 51 52 53 54 55 56 57 58 59 60 61 62 63 64 65
101
102
103
104
0.80 0.90 1.00
Ign
itio
n d
ela
y t
ime
(µs
)
103/T (K
-1)
ExpGRI
HeghesDRM
FrenklachNUIG
(a) 1-st experimental series
102
103
104
105
106
107
0.85 1.05 1.25
Ign
itio
n d
ela
y t
ime
(µs
)
103/T (K
-1)
ExpGRI
HeghesDRM
FrenklachNUIG
(b) 2-nd experimental series
102
103
104
105
0.85 1.00 1.15
Ign
itio
n d
ela
y t
ime (
µs)
103/T (K
-1)
ExpGRI
HeghesDRM
FrenklachNUIG
(c) 3-rd experimental series
101
102
103
104
0.80 0.90 1.00 1.10
Ign
itio
n d
ela
y t
ime (
µs)
103/T (K
-1)
ExpGRI
HeghesDRM
FrenklachNUIG
(d) 4-th experimental series
101
102
103
104
0.75 0.85 0.95
Ign
itio
n d
ela
y t
ime (
µs)
103/T (K
-1)
ExpGRI
HeghesDRM
FrenklachNUIG
(e) 5-th experimental series
100
101
102
103
104
0.75 0.85 0.95
Ign
itio
n d
ela
y t
ime (
µs)
103/T (K
-1)
ExpGRI
HeghesDRM
FrenklachNUIG
(f) 6-th experimental series
Figure 1: Simulation of the results of Kalitan [53]
9

1 2 3 4 5 6 7 8 9 10 11 12 13 14 15 16 17 18 19 20 21 22 23 24 25 26 27 28 29 30 31 32 33 34 35 36 37 38 39 40 41 42 43 44 45 46 47 48 49 50 51 52 53 54 55 56 57 58 59 60 61 62 63 64 65
0.00 0.50 1.00
OH + OH M = H2O2 M (LOW)
H + O2 = O + OH
H + H2O2 = HO2 + H2
OH OH M = H2O2 M (HIGH)
H + O2 + M = HO2 + M
H + O2 + N2 = HO2 + N2
HO2 + HO2 = O2 + H2O2
HO2 + HO2 = O2 + H2O2
H + HO2 = OH + OH
OH + CH3 = CH2 + H2O
OH + OH = O + H2O
H + O2 + H2O = HO2 + H2O
H CH3 M = CH4 M (LOW)
HCO + M =H +CO +M
OH + H2 = H + H2O
O + H2 = H + OH
OH + HO2 = O2 + H2O
H + HCO = H2 + CO
OH + CH4 = CH3 + H2O
H + CH2O = HCO + H2
+ + +
+ + +
+ +
Figure 2: Reaction Significance Analysis for Kalitan et al. [53]
2) reveals, however, the existence of reactions which are at least twice more significantfor the experiments leading to a poor fit.
• OH+OH+M = H2O2 +M ( LOW)
• H+ H2O2 = HO2 +H2
• OH+OH+M = H2O2 +M (HIGH)
• HO2 +HO2 = O2 +H2O2
• H+ HO2 = OH+OH
• OH+ CH3 = CH2 +H2O
• OH+OH = O+H2O
• H+ CH3 +M = CH4 +M ( LOW)
10

1 2 3 4 5 6 7 8 9 10 11 12 13 14 15 16 17 18 19 20 21 22 23 24 25 26 27 28 29 30 31 32 33 34 35 36 37 38 39 40 41 42 43 44 45 46 47 48 49 50 51 52 53 54 55 56 57 58 59 60 61 62 63 64 65
100
101
102
103
104
0.60 0.70 0.80 0.90 1.00
Ign
itio
n d
ela
y t
ime
(µs
)
103/T (K
-1)
Series 1Series 1Series 4Series 4Series 6Series 6Series 7Series 7
Figure 3: NUIG predictions for different series of Kalitan et al. [53]
LOW and HIGH correspond to the parameters of a Troe reaction for low and high pres-sures, respectively. The discrepancies for the second, third and fourth experimental series(which offer a poor match to the results of the models) seem to occur under conditionswhere the chemistry of H2O2 and the radicals OH and HO2 prevail. Since these are alsothe conditions where the physical system is inhomogeneous, no conclusion related to theinvalidity of their kinetic description can be reached. As shown in Figure 3,a comparisonbetween series 1, 4, 6, and 7 shows that those effects might not be entirely responsiblefor the whole mismatch, though. Series 6 and 7 present a reasonable agreement withthe predictions of NUIG at all temperatures. Series 1 is characterised by a good matchat the higher temperatures which becomes poorer as the temperature approaches 1050K. However, series 4 is marked by a poor fit to the results of the model, even at hightemperatures where the three other experimental series are in excellent agreement withthe reaction mechanism. These disparities are unrelated to the high pressure of series 4(36.578 bar) since series 6 (25.838 bar) and series 7 (36.781 bar) are also characterised byan elevated pressure. An examination of the initial concentrations of the reactants doesnot allow the identification of any obvious pattern which would cause different kineticbehaviours. Apart from a physical deviation from homogeneity, the discrepancies mightalso be due to the imprecision of some kinetic coefficients.
11

1 2 3 4 5 6 7 8 9 10 11 12 13 14 15 16 17 18 19 20 21 22 23 24 25 26 27 28 29 30 31 32 33 34 35 36 37 38 39 40 41 42 43 44 45 46 47 48 49 50 51 52 53 54 55 56 57 58 59 60 61 62 63 64 65
Table 4: Conditions of Petersen et al. [54]
Series XH2 XCH4 XO2 XN2 p (bar)1 0.0000 0.0502 0.2008 0.7490 20.32 0.0117 0.0466 0.1978 0.7439 20.33 0.0280 0.0420 0.1950 0.7350 23.5
101
102
103
104
0.50 0.60 0.70 0.80 0.90
Ign
itio
n d
ela
y t
ime
(µs
)
103/T (K
-1)
CorrelationGRI
HeghesDRM
FrenklachNUIG
(a) 1-st experimental series
101
102
103
0.60 0.70 0.80
Ign
itio
n d
ela
y t
ime
(µs
)
103/T (K
-1)
ExpGRI
HeghesDRM
FrenklachNUIG
(b) 2-nd experimental series
101
102
103
104
0.70 0.80 0.90
Ign
itio
n d
ela
y t
ime (
µs)
103/T (K
-1)
ExpGRI
HeghesDRM
FrenklachNUIG
(c) 3-rd experimental series
Figure 4: Comparison with the results of Petersen et al. [54] in Argon
3.2. Experiments of Petersen [54]
Petersen et al. [54] measured ignition delay times behind reflected shock waves. Theywere defined as the sudden increase in either CH* or OH*. The data we considered heredeal with the effects of hydrogen addition to methane during an undiluted combustionusing air as oxidant. Their conditions are reported in Table 4. The results are plotted inFigure 4.
Overall, NUIG provides a very good match to the measurements even though it leads
12

1 2 3 4 5 6 7 8 9 10 11 12 13 14 15 16 17 18 19 20 21 22 23 24 25 26 27 28 29 30 31 32 33 34 35 36 37 38 39 40 41 42 43 44 45 46 47 48 49 50 51 52 53 54 55 56 57 58 59 60 61 62 63 64 65
Table 5: Average logarithmic discrepancies for Petersen et al. [54]
Series DRM Frenklach GRI Heghes NUIG1 0.147 0.078 0.260 0.187 0.0662 0.263 0.178 0.364 0.134 0.0243 0.303 0.278 0.258 0.114 0.056T < 1250 K 0.191 0.021 0.095 0.410 0.137T ≥ 1250 K 0.177 0.076 0.180 0.446 0.158
to a poorer fit to ignition delay times characterising the combustion of pure methanewithout hydrogen at lower temperatures. The results of the three GRI-based mechanisms(namely GRI 3.0, DRM and Frenklach) are poor whereas those of Heghes lie between themand the results of NUIG in terms of agreement with the data. It is worth noting that forall mechanisms except DRM, the average discrepancies are higher for T ≥ 1250 K thanfor T < 1250 K. This indicates that physical inhomogeneities at the lowest temperaturesmay play a much less important role than the kinetics for these series of experiments.
Two Reaction Significance Analyses have been conducted for mixtures containing CH4
and the highest amount of H2 and one containing only methane, respectively. Their resultscan be visualised in Figure 5. Not surprisingly, it can be seen that reactions involvingthe system H2 −O2 play a considerably more important role in the presence of hydrogenwithin the fuel as can be seen for the following steps
H + O2 = O+OH
OH+H2 = H+H2O
H+HO2 = O2 +H2
The next following steps are almost insignificant to the burning of pure methane whereasthey become much more influential for the blend containing 40 % of hydrogen.
H + O2 +N2 = HO2 +N2
O+H2 = H+OH
O+HO2 = OH+O2
H+O2 +O2 = HO2 +O2
H+O2 +M = HO2 +M
H+O2 +H2O = HO2 +H2O
OH+OH+M = H2O2 +M
Conversely, reactions usually important for the oxidation of methane such as
CH3 +O2 = O+ CH3O
13

1 2 3 4 5 6 7 8 9 10 11 12 13 14 15 16 17 18 19 20 21 22 23 24 25 26 27 28 29 30 31 32 33 34 35 36 37 38 39 40 41 42 43 44 45 46 47 48 49 50 51 52 53 54 55 56 57 58 59 60 61 62 63 64 65
0 0.2 0.4 0.6 0.8 1
H + O2 = O + OH
OH + H2 = H + H2O
OH + HO2 = O2 + H2O
H + O2 + N2 = HO2 + N2
O + H2 = H + OH
HO2 + HO2 = O2 + H2O2
H + HO2 = OH + OH
O + HO2 = OH + O2
H + O2 + O2 = HO2 + O2
H + O2 + M = HO2 + M
OH OH M = H2O2 M (LOW )
H + HO2 = O2 + H2
H + O2 + H2O = HO2 + H2O
OH OH M = H2O2 M (HIGH)
HO2 + HO2 = O2 + H2O2
CH3 + O2 = O + CH3O
CH3 + O2 = OH + CH2O
O2 + CH2O = HO2 + HCO
H + CH4 = CH3 + H2
H CH3 M = CH4 M (HIGH)
CH3 + CH2O = HCO + CH4
OH + CH2O = HCO + H2O
CH3 + H2O2 = HO2 + CH4
HO2 + CH3 = OH + CH3O
OH + CH4 = CH3 + H2O
CH4
CH4 -H2
+
+ + +
++
+ + +
+ + +
Figure 5: Reaction Significance Analysis for Petersen et al. [54]
14

1 2 3 4 5 6 7 8 9 10 11 12 13 14 15 16 17 18 19 20 21 22 23 24 25 26 27 28 29 30 31 32 33 34 35 36 37 38 39 40 41 42 43 44 45 46 47 48 49 50 51 52 53 54 55 56 57 58 59 60 61 62 63 64 65
Table 6: Conditions of Huang et al. [55]
Series XCH4 XO2 XN2 p (bar)1 0.095 0.192 0.715 39.82 0.095 0.192 0.715 30.93 0.095 0.192 0.715 24.04 0.095 0.192 0.715 16.65 0.068 0.196 0.736 39.06 0.068 0.196 0.736 31.67 0.068 0.196 0.736 16.28 0.12 0.185 0.695 38.7
Table 7: Logarithmic discrepancies for Huang et al. [55]
Series DRM Frenklach GRI Heghes NUIG1 0.465 0.456 0.385 0.895 0.4032 0.488 0.481 0.413 0.919 0.4283 0.477 0.494 0.412 0.901 0.4964 0.500 0.534 0.442 0.928 0.5765 0.510 0.473 0.581 0.759 0.3976 0.416 0.393 0.369 0.863 0.4317 0.345 0.381 0.250 0.782 0.5278 0.263 0.277 0.210 0.650 0.200T < 1250 K 0.529 0.523 0.478 0.978 0.503T ≥ 1250 K 0.185 0.215 0.158 0.431 0.227
CH3 +O2 = OH+ CH2O
O2 + CH2O = HO2 +HCO
H+ CH4 = CH3 +H2
are of less importance to the hydrogen-rich blend considered here.
3.3. Experiments of Huang [55]
Huang et al. [55] carried out series of shock tube experiments involving undilutedmethane reacting with air. The ignition delay times were measured behind reflectedshock waves in relation to the maximum rate of pressure change. The experiments wereperformed under moderate temperatures (1000-1350 K), elevated pressures (16-40 atm)and a stoichiometric range of φ ∈ [0.7; 1.3]. The conditions of the measurement series arereported in Table 6. Selected results of the simulations are given in Figure 6. Logarithmicdiscrepancies are reported in Table 7. As a rule, model predictions are satisfactory at thehighest temperatures whereas they are too elevated at the lowest temperatures. Reac-tion Significance Analyses were carried out to identify the reactions having the highestinfluence on the discrepancies under these circumstances. The shape of the temperature-
15

1 2 3 4 5 6 7 8 9 10 11 12 13 14 15 16 17 18 19 20 21 22 23 24 25 26 27 28 29 30 31 32 33 34 35 36 37 38 39 40 41 42 43 44 45 46 47 48 49 50 51 52 53 54 55 56 57 58 59 60 61 62 63 64 65
102
103
104
105
0.70 0.80 0.90 1.00
Ign
itio
n d
ela
y t
ime
(µs
)
103/T (K
-1)
ExpGRI
HeghesDRM
FrenklachNUIG
(a) 1-st experimental series
102
103
104
105
0.70 0.80 0.90 1.00
Ign
itio
n d
ela
y t
ime
(µs
)
103/T (K
-1)
ExpGRI
HeghesDRM
FrenklachNUIG
(b) 2-nd experimental series
102
103
104
105
0.70 0.80 0.90 1.00
Ign
itio
n d
ela
y t
ime (
µs)
103/T (K
-1)
ExpGRI
HeghesDRM
FrenklachNUIG
(c) 3-rd experimental series
102
103
104
105
0.70 0.80 0.90 1.00
Ign
itio
n d
ela
y t
ime (
µs)
103/T (K
-1)
ExpGRI
HeghesDRM
FrenklachNUIG
(d) 4-th experimental series
102
103
104
105
0.70 0.80 0.90 1.00
Ign
itio
n d
ela
y t
ime (
µs)
103/T (K
-1)
ExpGRI
HeghesDRM
FrenklachNUIG
(e) 5-th experimental series
102
103
104
105
0.70 0.80 0.90 1.00
Ign
itio
n d
ela
y t
ime (
µs)
103/T (K
-1)
ExpGRI
HeghesDRM
FrenklachNUIG
(f) 6-th experimental series
Figure 6: Comparison with the results of Huang et al. [55] in Argon
16

1 2 3 4 5 6 7 8 9 10 11 12 13 14 15 16 17 18 19 20 21 22 23 24 25 26 27 28 29 30 31 32 33 34 35 36 37 38 39 40 41 42 43 44 45 46 47 48 49 50 51 52 53 54 55 56 57 58 59 60 61 62 63 64 65
dependent profiles makes it very likely that physical inhomogeneities accelerating theignition took place at temperatures inferior to a threshold as low as 1250 K. This is con-firmed by the fact that the average discrepancies at temperatures higher than 1250 K aresmaller than those at temperatures lower than 1250 K by at least a factor of 2. The firstexperimental series appears to be slightly anomalous in that the largest discrepancies arelocated around the middle of the temperature interval.
It can be seen that the chemistry of the HO2 −H2O2 plays an important role in bothlowest and highest temperatures. This feature is a well known effect of high pressures [6].The chain termination step OH+HO2 = O2+H2O proves to be the first and second mostimportant elementary step for high and low temperatures, respectively. The importanceof the HO2 radical can also be seen through the existence of reactions it undergoes withhydrocarbon radicals such as HO2 + CH3 = O2 + CH4 and HO2 + CH3 = CH3O + OH.Recombinations towards C2H6 and C2H5 also prove to play an important role. Thereaction
OH + H2O2 = HO2 +H2O
is considerably more sensitive for low than for high temperatures.The reactions
HO2 + CH2O = HCO+H2O2
HO2 + CH3 = O2 + CH4
OH+ CH4 = CH3 +H2O
OH+OH+M = H2O2 +M
also turn out to be more significant at low than at high temperatures, albeit to a lesserextent.
Since the effects of inadequate physical and chemical kinetic modelling are likely to beintertwined [52], it is not possible to draw any conclusions related to the validity of thereaction mechanisms apart from the fact that the ignition delays seem to be reasonablywell captured at the highest temperatures of each series, where homogeneous chemicalkinetics prevail. GRI 3.0 delivers the closest predictions in that regard.
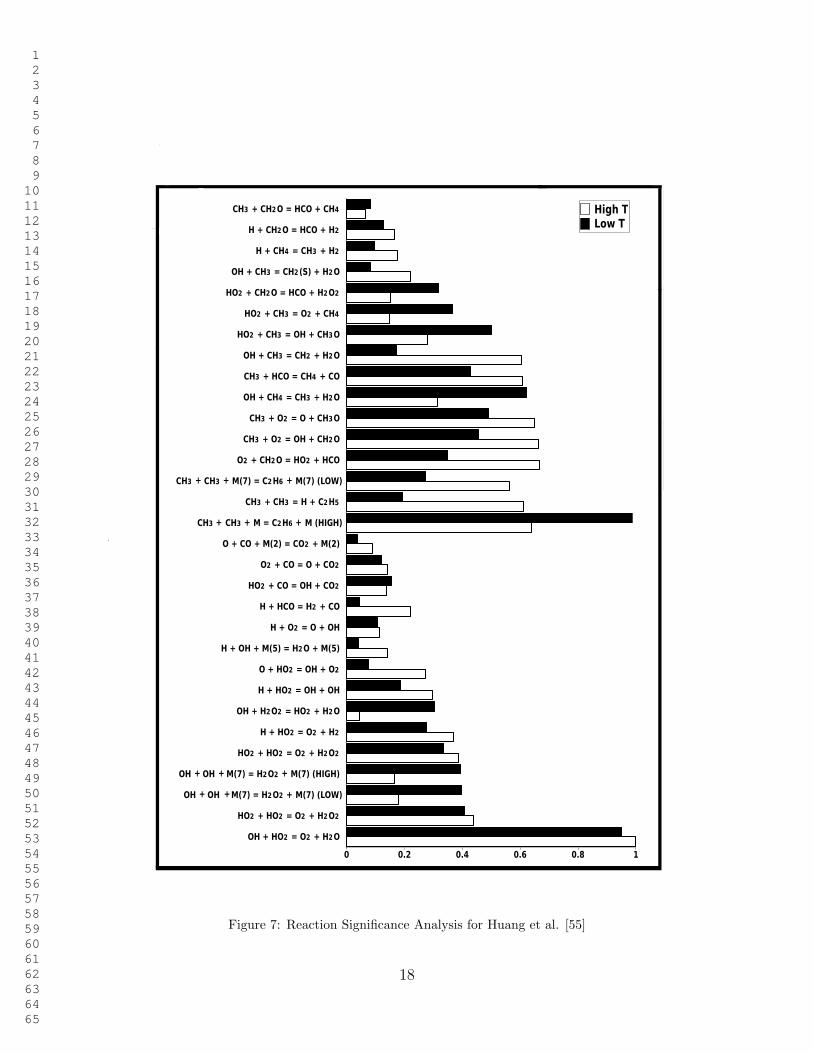
3.4. Experiments of Zhang et al. [56]
Zhang et al. [56] performed series of shock tube experiments at a pressure of p = 4bar and at temperatures varying between 1422 and 1877 K. The blends were made up ofmethane and hydrogen whereby the amount of H2 varied between 0 % and 20 %. Theequivalence ratio was φ = 2.0 everywhere. The mixtures were highly diluted in N2 whichcomprised 95 % of the overall volume. The ignition delay times were captured throughthe rapid increase of the pressure and OH radical profile. The experimental conditionsare reported in Table 8 and the simulated results are shown in Figure 8. The logarithmicdiscrepancies are given in Table 9. The three GRI-based mechanisms (namely GRI3.0, DRM, and Frenklach) provide the best match to the measurements. Overall, thepredictions from GRI 3.0 are the best fit to this set of data. It can be seen, however, thatfor mixtures containing H2, ignition delay times measured at the lowest temperatures are
17
1 2 3 4 5 6 7 8 9 10 11 12 13 14 15 16 17 18 19 20 21 22 23 24 25 26 27 28 29 30 31 32 33 34 35 36 37 38 39 40 41 42 43 44 45 46 47 48 49 50 51 52 53 54 55 56 57 58 59 60 61 62 63 64 65
0 0.2 0.4 0.6 0.8 1
OH + HO2 = O2 + H2O
HO2 + HO2 = O2 + H2O2
OH OH M(7) = H2O2 M(7) (LOW)
OH OH M(7) = H2O2 M(7) (HIGH)
HO2 + HO2 = O2 + H2O2
H + HO2 = O2 + H2
OH + H2O2 = HO2 + H2O
H + HO2 = OH + OH
O + HO2 = OH + O2
H + OH + M(5) = H2O + M(5)
H + O2 = O + OH
H + HCO = H2 + CO
HO2 + CO = OH + CO2
O2 + CO = O + CO2
O + CO + M(2) = CO2 + M(2)
CH3 CH3 M = C2H6 M (HIGH)
CH3 + CH3 = H + C2H5
CH3 CH3 M(7) = C2H6 M(7) (LOW)
O2 + CH2O = HO2 + HCO
CH3 + O2 = OH + CH2O
CH3 + O2 = O + CH3O
OH + CH4 = CH3 + H2O
CH3 + HCO = CH4 + CO
OH + CH3 = CH2 + H2O
HO2 + CH3 = OH + CH3O
HO2 + CH3 = O2 + CH4
HO2 + CH2O = HCO + H2O2
OH + CH3 = CH2 (S) + H2O
H + CH4 = CH3 + H2
H + CH2O = HCO + H2
CH3 + CH2O = HCO + CH4 High TLow T
+
+ + +
+ + +
+ + +
+ + +
Figure 7: Reaction Significance Analysis for Huang et al. [55]
18
1 2 3 4 5 6 7 8 9 10 11 12 13 14 15 16 17 18 19 20 21 22 23 24 25 26 27 28 29 30 31 32 33 34 35 36 37 38 39 40 41 42 43 44 45 46 47 48 49 50 51 52 53 54 55 56 57 58 59 60 61 62 63 64 65
Table 8: Conditions of Zhang et al. [56]
Series XH2 XCH4 XO2 XN2 p (bar)1 0.000 0.025 0.025 0.95 4.02 0.001 0.024 0.002 0.95 4.03 0.003 0.023 0.024 0.95 4.04 0.005 0.022 0.023 0.95 4.0
102
103
104
0.50 0.60 0.70
Ign
itio
n d
ela
y t
ime (
µs)
103/T (K
-1)
ExpGRI
HeghesDRM
FrenklachNUIG
(a) 1-st experimental series
102
103
104
0.50 0.60 0.70
Ign
itio
n d
ela
y t
ime (
µs)
103/T (K
-1)
ExpGRI
HeghesDRM
FrenklachNUIG
(b) 2-nd experimental series
102
103
104
0.50 0.60 0.70
Ign
itio
n d
ela
y t
ime (
µs)
103/T (K
-1)
ExpGRI
HeghesDRM
FrenklachNUIG
(c) 3-rd experimental series
102
103
104
105
0.50 0.60 0.70 0.80
Ign
itio
n d
ela
y t
ime (
µs)
103/T (K
-1)
ExpGRI
HeghesDRM
FrenklachNUIG
(d) 4-th experimental series
Figure 8: Comparison with the results of Zhang et al. [56]
19

1 2 3 4 5 6 7 8 9 10 11 12 13 14 15 16 17 18 19 20 21 22 23 24 25 26 27 28 29 30 31 32 33 34 35 36 37 38 39 40 41 42 43 44 45 46 47 48 49 50 51 52 53 54 55 56 57 58 59 60 61 62 63 64 65
Table 9: Average logarithmic discrepancies for Zhang et al. [56]
Series DRM Frenklach GRI Heghes NUIG1 0.022 0.025 0.074 0.154 0.0542 0.072 0.084 0.037 0.215 0.1233 0.159 0.187 0.088 0.291 0.2204 0.155 0.188 0.109 0.279 0.221T ≥ 1250 K 0.088 0.104 0.072 0.222 0.137
overpredicted. The relatively high ignition delay times measured experimentally (3.194ms) might be seen as an indication that the homogeneity assumptions used for modellingshock tube experiments may no longer have been valid [26]. The problem with thisexplanation is that ignition delay times of the same order of magnitude were well capturedby several models for mixtures 1 and 2 at the lowest temperatures. Coupled with the factthat the “gaps” are not as large as those typically originating from low-temperaturefacility-specific behaviour [24, 51], the effect seems rather related to higher amounts ofhydrogen in the blends where the disparities are stronger. To identify the causes of thisbehaviour, RSA were carried out at the lowest and highest temperatures in the absenceof H2 (series 1) and in a blend containing the greatest abundance of hydrogen (series4). The results are depicted in Figure 9. Several reactions play an important role in allfour situations. This includes the recombination of CH3 and H (whose reverse step is animportant chain initiation),
H + CH3 +M = CH4 +M
the recombination of CH3 and HO2 (whose reverse step can also be a chain initiation),
HO2 + CH3 = O2 + CH4
steps leading to the formation of formaldehyde CH2O and related radicals
CH3 +O2 = OH+ CH2O
CH3 +O2 = O+ CH3O
the formation of CO out of HCO,
CH3 +HCO = CH4 + CO
H+ HCO = H2 + CO
the recombination of CO and O towards CO2,
O + CO +M = CO2 +M
20

1 2 3 4 5 6 7 8 9 10 11 12 13 14 15 16 17 18 19 20 21 22 23 24 25 26 27 28 29 30 31 32 33 34 35 36 37 38 39 40 41 42 43 44 45 46 47 48 49 50 51 52 53 54 55 56 57 58 59 60 61 62 63 64 65
0 0.2 0.4 0.6 0.8 1
H + HO2 = O2 + H2
H + H + H2O = H2 + H2O
H + OH + M = H2O + M
H + H + M = H2 + M
H + O2 = O + OH
OH + HO2 = O2 + H2O
O + HO2 = OH + O2
O + CO + M = CO2 + M
H + HCO = H2 + CO
O + HCO = OH + CO
O2 + CO = O + CO2
O + HCO = H + CO2
HCO + O2 = HO2 + CO
HO2 + CH3 = O2 + CH4
CH3 + HCO = CH4 + CO
H CH3 M = CH4 M (LOW)
CH3 + O2 = O + CH3O
CH3 + O2 = OH + CH2O
OH + CH3 = CH2 + H2O
OH + CH3 = CH2 (S) + H2O
OH + CH4 = CH3 + H2O
CH3 + CH3 = H + C2H5
O2 + CH2O = HO2 + HCO
H + CH4 = CH3 + H2
CH3 CH3 M = C2H6 M (LOW)
O + CH3 = H + CH2O
CH2 (S) + O2 = CO + H2O
CH3 CH3 M = C2H6 M
H CH3 M = CH4 M
CH4 temperatures
CH4 -H2 : highest temperaturesCH4 -H2 : lowest temperatureCH4 : lowest temperatures
+
+ + +
+ +
+ + +
+
+ + +
Figure 9: Reaction Significance Analysis for Zhang [56]21

1 2 3 4 5 6 7 8 9 10 11 12 13 14 15 16 17 18 19 20 21 22 23 24 25 26 27 28 29 30 31 32 33 34 35 36 37 38 39 40 41 42 43 44 45 46 47 48 49 50 51 52 53 54 55 56 57 58 59 60 61 62 63 64 65
Table 10: Conditions of Zhukov et al. [57].
Series p (bar) T (K)1 2.54 - 4.56 1409.00 - 1715.002 11.90 - 17.60 1347.00 - 1722.003 23.50 - 32.00 1351.00 - 1580.004 38.00 - 50.00 1369.00 - 1659.005 131.00 - 174.00 1209.00 - 1507.006 395.00 - 477.00 1196.00 - 1379.00
and two chain termination steps.
H + H +M = H2 +M
H+OH+M = H2O+M
It is worth noting that the reaction O + CO + M = CO2 + M seems to be playing amore important role than OH + CO = CO2 + H here even if the former is much slowerkinetically [6].
As mentioned above, the poorest predictions concern series 4 (hydrogen-enhancedmethane) at the lowest temperatures of the study. In Figure 9, it can be seen that theonly reaction playing a significant role under these conditions is
H + HO2 = O2 +H2
The discrepancies may stem from its kinetic coefficients not being accurate enough.
3.5. Experiments of Zhukov et al. [57]
Zhukov et al. [57] studied the combustion of undiluted methane in shock tubes filledwith methane and air satisfying the equivalence ratio φ = 0.5. The ignition delay timeswere measured according to the emission of the OH radical. The experimental data theyreported have been divided here in six profiles whose conditions are given in Table 10.The results of our simulations can be seen in Figure 10. The logarithmic discrepanciescan be found in Table 11.
For all six series, Heghes’ predictions are very far from the measurements. Whilstit is superior to Heghes’ model, NUIG does not perform as well as the three GRI-basedmechanisms (namely GRI 3.0, DRM, and Frenklach).
Whilst a good agreement has been achieved for series 2, the predictions of all models(except GRI 3.0) are far off from the measurements of series 5. This fact does not seemto result from the temperature or pressure range (and potential physical inhomogeneitiesbrought about by them) since series 6 is characterised by even lower temperatures (1196.00- 1379.00 K instead of 1209.00 - 1507.00 K) and higher pressures (395.00 - 477.00 barinstead of 131.00 - 174.00 bar) whereas it is very well predicted by NUIG. While otherphysical anomalies can never be ruled out, we considered it worthwhile to investigate
22

1 2 3 4 5 6 7 8 9 10 11 12 13 14 15 16 17 18 19 20 21 22 23 24 25 26 27 28 29 30 31 32 33 34 35 36 37 38 39 40 41 42 43 44 45 46 47 48 49 50 51 52 53 54 55 56 57 58 59 60 61 62 63 64 65
101
102
103
104
5.50 6.00 6.50 7.00 7.50
Ign
itio
n d
ela
y t
ime
(µs
)
104/T (K
-1)
ExpGRI
HeghesDRM
FrenklachNUIG
(a) 1-st experimental series
101
102
103
104
5.50 6.00 6.50 7.00 7.50
Ign
itio
n d
ela
y t
ime
(µs
)
104/T (K
-1)
ExpGRI
HeghesDRM
FrenklachNUIG
(b) 2-nd experimental series
101
102
103
6.00 6.50 7.00 7.50
Ign
itio
n d
ela
y t
ime (
µs)
104/T (K
-1)
ExpGRI
HeghesDRM
FrenklachNUIG
(c) 3-rd experimental series
101
102
103
6.00 6.50 7.00 7.50
Ign
itio
n d
ela
y t
ime (
µs)
104/T (K
-1)
ExpGRI
HeghesDRM
FrenklachNUIG
(d) 4-th experimental series
101
102
103
6.50 7.00 7.50 8.00 8.50
Ign
itio
n d
ela
y t
ime (
µs)
104/T (K
-1)
ExpGRI
HeghesDRM
FrenklachNUIG
(e) 5-th experimental series
101
102
103
7.00 7.50 8.00 8.50
Ign
itio
n d
ela
y t
ime (
µs)
104/T (K
-1)
ExpGRI
HeghesDRM
FrenklachNUIG
(f) 6-th experimental series
Figure 10: Comparison with the results of Zhukov et al. [57].
23

1 2 3 4 5 6 7 8 9 10 11 12 13 14 15 16 17 18 19 20 21 22 23 24 25 26 27 28 29 30 31 32 33 34 35 36 37 38 39 40 41 42 43 44 45 46 47 48 49 50 51 52 53 54 55 56 57 58 59 60 61 62 63 64 65
Table 11: Average logarithmic discrepancies for Zhukov et al. [57]
Series DRM Frenklach GRI Heghes NUIG1 0.0765 0.1541 0.0671 0.3017 0.21132 0.0763 0.0692 0.1199 0.2370 0.10733 0.0912 0.0432 0.1821 0.2624 0.08404 0.0789 0.0835 0.1125 0.3217 0.11575 0.1439 0.1327 0.0721 0.4957 0.17106 0.1424 0.1061 0.1040 0.4140 0.0508T < 1250 K 0.2480 0.1846 0.0911 0.5368 0.1058T ≥ 1250 K 0.0830 0.0971 0.1059 0.3052 0.1395All 0.0918 0.1018 0.1051 0.3176 0.1377
chemical kinetic differences which could partially make sense of that state of affairs.Reaction Significance Analyses have been performed for series 2 (where a good agree-
ment has been achieved) and series 5 (where all predictions are very distant from themeasurements). The diagrams are given in Figure 11. The following reactions provedconsiderably more significant for series 5 than for series 2.
OH + H2O2 = HO2 +H2O
HO2 +HO2 = O2 +H2O2
HO2 + CO = OH+ CO2
OH+OH+M = H2O2 +M(LOW)
OH +OH+M = H2O2 +M(HIGH)
HO2 +HO2 = O2 +H2O2
They all involve HO2−H2O2. It is worth noting that Fischer and Jiang also identified thesame type of reactions as correlating with poor predictions of ignition delays of bio-syngasmixtures [14]. Hong et al. [27] pointed out that this class of reactions is not accuratelyknown and needs more precise coefficients. This might be one of the causes of the largeoverpredictions concerning series 5.
24

1 2 3 4 5 6 7 8 9 10 11 12 13 14 15 16 17 18 19 20 21 22 23 24 25 26 27 28 29 30 31 32 33 34 35 36 37 38 39 40 41 42 43 44 45 46 47 48 49 50 51 52 53 54 55 56 57 58 59 60 61 62 63 64 65
0.0 0.2 0.4 0.6 0.8 1.0
CH3 + O2 O + CH3O
OH + CH4 CH3 + H2O
CH3 + HCO CH4 + CO
CH3 + O2 OH + CH2O
CH3 CH3 M C2H6 M (HIGH)
O2 + CH2O HO2 + HCO
OH + CH3 CH2 + H2O
CH3 + CH3 H + C2H5
OH + CH3 CH2 (S) + H2O
H + CH4 CH3 + H2
O + CH2O OH + HCO
H CH3 M CH4 M (HIGH)
O + CH3 H + CH2O
HO2 + HO2 O2 + H2O2
OH OH M H2O2 M (HIGH)
OH OH M H2O2 M
H + HCO H2 + CO
O2 + CO O + CO2
O + HCO OH + CO
O + CO + M CO2 + M
HO2 + CO OH + CO2
O + HCO H + CO2
OH + HO2 O2 + H2O
HO2 + HO2 O2 + H2O2
O + HO2 OH + O2
H + HO2 O2 + H2
H + OH + M H2O + M
H + HO2 OH + OH
OH + H2O2 HO2 + H2O
O + H2 H + OH
OH + H2 H + H2O
H + H2O2 HO2 + H2
H + O2 O + OH
H + H + M H2 + M
Series 2Series 5
+
+ + +
+ + +
+ + +
+ + +
Figure 11: Reaction Significance Analysis for Zhukov’s experiments [57]25

1 2 3 4 5 6 7 8 9 10 11 12 13 14 15 16 17 18 19 20 21 22 23 24 25 26 27 28 29 30 31 32 33 34 35 36 37 38 39 40 41 42 43 44 45 46 47 48 49 50 51 52 53 54 55 56 57 58 59 60 61 62 63 64 65
Table 12: Conditions of Lifshitz et al. [58]
Series XH2 XCH4 XAR XO2
1 0.00E+00 0.035 0.8950 0.0702 7.30E-04 0.035 0.8943 0.0703 5.20E-03 0.035 0.8898 0.070
Table 13: Average logarithmic discrepancies for Lifshitz et al. [58]
Series DRM Frenklach GRI Heghes NUIG1 0.183 0.132 0.241 0.058 0.1222 0.162 0.115 0.218 0.055 0.1013 0.114 0.052 0.162 0.067 0.041T ≥ 1250 K 0.156 0.102 0.210 0.060 0.091
3.6. Results of previous studies on the modelling of biogas and bio-syngas combustion
To allow a more quantitative and informative study, we also considered results fromtwo of our previous investigations [14, 15] which are going to be only briefly reportedhere. Lifshitz et al. [58] studied the ignition delay times of CH4−O2 and CH4−H2−O2.They used Argon AR as bath-gas. The density was dens = 7.5E-05 mol/cm3 whereas theinitial mole fractions were XCH4 = 0.035 and XO2 = 0.07 The remaining conditions aresummarised in Table 12. The experiments were simulated by Fischer and Jiang in [14].The logarithmic discrepancies are reported in Table 13. The reader is referred to [14] forthe interpretation of these results.
Several series of experiments concerning bio-syngas combustion were conducted byMathieu et al. [41]. Ignition delay times were measured whereby AR played the role of abath gas. The conditions of the trials involving CH4 are given in table 14. The results ofour simulations [14] are reported in Table 15. It is noteworthy that for the experimentsperformed by Mathieu et al. [41], low temperatures and pressures (such as in series 2)as well as high temperatures and pressures (such as in series 6) are characterised by aconsiderable overprediction of the ignition delay times. Figure 12 illustrates this state ofaffairs in relation to the combustion of bio-syngas at low and high pressures as modelledby NUIG. Surprisingly, at high pressures the ignition delays at low temperatures are much
Table 14: Conditions of Mathieu et al. [41] (Bath gas: AR)
Series XH2 XCO XCH4 XCO2 XO2 p (bar)1 4.06E-03 4.06E-03 7.50E-04 0.00E+00 1.11E-02 1.72 2.97E-03 2.97E-03 8.92E-04 1.58E-03 9.50E-03 1.73 4.06E-03 4.06E-03 7.50E-04 0.00E+00 1.11E-02 12.74 2.97E-03 2.97E-03 8.92E-04 1.58E-03 9.50E-03 12.75 4.06E-03 4.06E-03 7.50E-04 0.00E+00 1.11E-02 32.46 2.97E-03 2.97E-03 8.92E-04 1.58E-03 9.50E-03 32.4
26

1 2 3 4 5 6 7 8 9 10 11 12 13 14 15 16 17 18 19 20 21 22 23 24 25 26 27 28 29 30 31 32 33 34 35 36 37 38 39 40 41 42 43 44 45 46 47 48 49 50 51 52 53 54 55 56 57 58 59 60 61 62 63 64 65
Table 15: Average logarithmic discrepancies for Mathieu et al. [41]
Series DRM Frenklach GRI Heghes NUIG1 0.1600 0.1610 0.2256 0.1857 0.15702 0.1743 0.1754 0.2068 0.1778 0.16583 0.1674 0.1744 0.2192 0.1746 0.19644 0.2500 0.2557 0.2587 0.2458 0.32715 0.0438 0.0449 0.0390 0.0261 0.07866 0.1512 0.1506 0.1490 0.1706 0.1002T < 1250 K 0.200 0.202 0.236 0.218 0.229T ≥ 1250 K 0.143 0.147 0.166 0.141 0.145
101
102
103
104
0.50 0.60 0.70 0.80 0.90 1.00
Ign
itio
n d
ela
y t
ime (
µs)
103/T (K
-1)
Series 2 (1.6 atm)Series 6 (32.0 atm)
NUIG (1.6 atm)NUIG (32.0 atm)
Figure 12: NUIG predictions for bio-syngas combustion [41]
better captured by the models than at high temperatures in spite of the general trendobserved elsewhere [24, 51], and attributed to an inhomogeneous behaviour of the shocktube. Interestingly enough, for the conditions where the mismatch between model andexperiments is the largest (low temperatures and pressures as well as high temperaturesand pressures), five reactions not significant under conditions where a good fit is foundplay a non-negligible role [14]. These are
H + CH3 +M → CH4 +M
H+HO2 → O2 + H2
H+ HO2 → 2OH
OH+ HO2 → O2 +H2O
HO2 + CH3 → OH+ CH3O
Four of the five reactions involve the radical HO2 whose chemistry was also identified tocoincide with poorer performances of the reaction mechanisms.
27

1 2 3 4 5 6 7 8 9 10 11 12 13 14 15 16 17 18 19 20 21 22 23 24 25 26 27 28 29 30 31 32 33 34 35 36 37 38 39 40 41 42 43 44 45 46 47 48 49 50 51 52 53 54 55 56 57 58 59 60 61 62 63 64 65
Table 16: Experimental conditions of Zeng et al. [59]
Run Series Richness p (bar) XCH4XO2
XN2XCO2
1 0.5 1 0.0499 0.1995 0.7506 02 0.5 1 0.0399 0.1596 0.6005 0.23 0.5 1 0.0249 0.0998 0.3753 0.54 0.5 10 0.0499 0.1995 0.7506 05 0.5 10 0.0399 0.1596 0.6005 0.26 0.5 10 0.0249 0.0998 0.3753 0.57 1 1 0.095 0.19 0.715 08 1 1 0.076 0.152 0.572 0.29 1 1 0.0475 0.095 0.3575 0.510 1 10 0.095 0.19 0.715 011 1 10 0.076 0.152 0.572 0.212 1 10 0.0475 0.095 0.3575 0.513 2 1 0.1736 0.1736 0.6528 014 2 1 0.1389 0.1389 0.5222 0.215 2 1 0.08680 0.08680 0.3264 0.5
Nevertheless, we somewhat doubt that the inaccuracy of their kinetic parameterswould be sufficient to explain the extent of the disagreement between the predictions ofNUIG and the measurements of Mathieu et al. We therefore suspect that a deviationfrom ideal homogeneous conditions is also likely to contribute to the failure to reproducethese data.
Zeng et al. [59] performed shock tube experiments with various mixtures of CH4,N2 and CO2 where they measured ignition delay times. The experimental conditionsare given in Table 16. We simulated these measurements in a previous work [15] andreported the main results in Table 17. It is worth noting that the experiments of Zeng etal. [59] were carried out at temperatures between 1335 K and 2069 K and that physicalinhomogeneities seem (at most) to be playing only a minor role in the ignition delays sothat they appear to be particularly suitable for a chemical kinetic investigation of biogascombustion.
4. Influence of various factors on the discrepancies
In this section, we analysed the role of the temperature, composition, dilution, andpressure on the mean logarithmic distance between the model predictions and the mea-surements whereby the averaging was done over the values of every respective set such asall experiments performed in the temperature interval [800; 1050] K.
28

1 2 3 4 5 6 7 8 9 10 11 12 13 14 15 16 17 18 19 20 21 22 23 24 25 26 27 28 29 30 31 32 33 34 35 36 37 38 39 40 41 42 43 44 45 46 47 48 49 50 51 52 53 54 55 56 57 58 59 60 61 62 63 64 65
Table 17: Average logarithmic discrepancies for Zeng et al. [59]
Series DRM Frenklach GRI Heghes NUIG1 0.028 0.065 0.023 0.246 0.1462 0.032 0.044 0.020 0.225 0.1103 0.040 0.023 0.043 0.150 0.0314 0.087 0.034 0.164 0.211 0.0795 0.050 0.071 0.109 0.255 0.1296 0.044 0.073 0.078 0.229 0.1207 0.060 0.119 0.041 0.291 0.1588 0.036 0.052 0.049 0.222 0.0949 0.036 0.043 0.034 0.197 0.06910 0.063 0.057 0.140 0.203 0.03811 0.051 0.122 0.075 0.254 0.10012 0.054 0.065 0.103 0.157 0.06113 0.187 0.254 0.132 0.429 0.25514 0.026 0.033 0.087 0.192 0.03115 0.077 0.105 0.024 0.266 0.116T ≥ 1250 K 0.058 0.081 0.070 0.241 0.109
Table 18: µ as a function of the temperature
T range N DRM Frenklach GRI Heghes NUIG800-1050 22 0.9088 0.8965 0.9745 1.0241 0.79571050-1200 80 0.3761 0.3730 0.3587 0.5772 0.32691200-1400 109 0.1814 0.1786 0.1853 0.3017 0.16571400-1600 140 0.1115 0.1195 0.1373 0.2293 0.12771600-2100 179 0.0764 0.0737 0.0862 0.1843 0.0978All 530 0.1874 0.1870 0.1984 0.3150 0.1835
4.1. Role of the temperature
The influence of the temperature on the average logarithmic discrepancies has beeninvestigated. The mean values µ of the logarithmic discrepancies are given in Table18. Table 19 contains the ratios between the standard deviations of the logarithmicdiscrepancies σ and their mean values µ. An important tendency can be observed in Table18. The average discrepancies between model predictions and measurements increase withdecreasing temperatures.
As we mentioned at the end of section 2, the modelling of shock tube experimentsat low temperatures as a homogeneous system has been shown to be invalid. In a studyabout syngas combustion also involving results from a flow reactor [51], Petersen et al.noticed tremendous discrepancies between measured ignition delays and model predic-
29

1 2 3 4 5 6 7 8 9 10 11 12 13 14 15 16 17 18 19 20 21 22 23 24 25 26 27 28 29 30 31 32 33 34 35 36 37 38 39 40 41 42 43 44 45 46 47 48 49 50 51 52 53 54 55 56 57 58 59 60 61 62 63 64 65
Table 19: σ/µ as a function of the temperature
T range N DRM Frenklach GRI Heghes NUIG800-1050 22 0.6052 0.6164 0.5389 0.5292 0.65971050-1200 80 0.5254 0.5173 0.5813 0.6949 0.67841200-1400 109 0.6667 0.6842 0.6328 0.6409 0.84591400-1600 140 0.7485 0.8296 0.6961 0.4796 0.84631600-2100 179 0.8462 0.8611 0.9177 0.5253 0.6742All 530 1.2720 1.2701 1.2243 0.9470 1.2057
tions for all temperatures inferior to about 840 K. No reasonable adjustments of kineticparameters could rectify the situation. Chaos and Dryer analysed the situation at length[24, 25, 60]. Long test times characteristic of low temperatures give rise to facility-boundphysical effects (such as the growth of the boundary layer, the attenuation of the incidentshock wave and residual gas velocities after the passage of the reflected shock wave) anddeflagrative processes related to mild ignition. These, in turn, are responsible for an inho-mogeneous ignition which might be considerably faster than what would have happenedunder idealised zero-dimensional conditions [26]. Different methods taking into accountor approximating the pressure history of the shock tube have been developed and suc-cessfully applied to cases where the disparities between model and experiment seemedinitially insurmountable [24, 27, 52, 61].
Since most experiments carried out under those conditions have, until now, been sim-ulated under the wrong assumptions, there could be considerable uncertainties affectingthe kinetic parameters of the HO2 − H2O2 system which have not always been correctlycalibrated [27, 52, 61]. While performing local adjustments might bring about small im-provements, they are also likely to lead to disagreements with previously well capturedexperiments owing to the highly correlated nature of the feasible set of parameters [31].Given the crucial importance of these reactions for the entire combustion community,we believe that a large-scale optimisation using all parameters and all available mea-surements should be carried out using a technique such as surface mapping [29, 30, 32].Special care should then be taken to simulate every experimental device (be it a premixedflame, a rapid compression machine, a flow reactor, a shock tube etc.) using a physicalmodel which does justice to the specific situation and might even differ from experimentto experiment.
NUIG is considerably superior to the four other reaction mechanisms for low and mid-dle temperature ranges, although that better performance tend to level off with increasingtemperatures where it is outperformed by DRM and Frenklach and then GRI 3.0. A sim-ilar effect has been noticed by Gersen et al. [40] and Mathieu et al. [41]. This seemsto indicate that some combinations of kinetic parameters of NUIG influential at highertemperatures might need to be more accurately estimated.
30

1 2 3 4 5 6 7 8 9 10 11 12 13 14 15 16 17 18 19 20 21 22 23 24 25 26 27 28 29 30 31 32 33 34 35 36 37 38 39 40 41 42 43 44 45 46 47 48 49 50 51 52 53 54 55 56 57 58 59 60 61 62 63 64 65
Table 20: µ as a function of the composition
All temperatures N DRM Frenklach GRI Heghes NUIGCH4 261 0.1887 0.1844 0.2071 0.3971 0.1973CH4 − H2 85 0.1481 0.1431 0.1296 0.1961 0.1347CH4 − CO2 74 0.0432 0.0594 0.0607 0.2113 0.0823CH4 − CO− H2 27 0.1369 0.1402 0.1818 0.1462 0.1542CH4 − CO− H2 − CO2 83 0.3669 0.3678 0.3675 0.3226 0.2885All mixtures 530 0.1874 0.1870 0.1984 0.3150 0.1835T < 1250 K N DRM Frenklach GRI Heghes NUIGCH4 58 0.4950 0.4873 0.4419 0.9352 0.4760CH4 − H2 4 0.2810 0.2785 0.2153 0.1177 0.0399CH4 − CO2 0 - - - - -CH4 − CO− H2 14 0.1873 0.1902 0.2476 0.2152 0.2171CH4 − CO− H2 − CO2 58 0.4311 0.4313 0.4468 0.3862 0.3442All mixtures 134 0.4288 0.4258 0.4170 0.5979 0.3789T ≥ 1250 K N DRM Frenklach GRI Heghes NUIGCH4 205 0.1020 0.0987 0.1407 0.2449 0.1184CH4 − H2 85 0.1481 0.1431 0.1296 0.1961 0.1347CH4 − CO2 73 0.0432 0.0594 0.0607 0.2113 0.0823CH4 − CO− H2 27 0.1369 0.1402 0.1818 0.1462 0.1542CH4 − CO− H2 − CO2 83 0.3669 0.3678 0.3675 0.3226 0.2885All mixtures 397 0.1059 0.1064 0.1246 0.2195 0.1175
4.2. Role of the composition
The average logarithmic discrepancies as a function of the mixture composition havebeen computed. The mean values µ of the logarithmic discrepancies are given in Table20. Table 21 contains the ratios between the standard deviations of the logarithmicdiscrepancies and their mean values σ/µ.
The ratios between the standard deviations and the mean values of the logarithmicdiscrepancies are very large and often even exceed 1. In this situation, this means that fora given composition (such as pure methane or biogas CH4 − CO2), the causes of the dis-crepancies may be very inhomogeneous and dependent on factors other than composition.Nevertheless, some general features can be identified.
Overall, most mechanisms capture at best the combustion of biogas (CH4−CO2) whereall considered experiments involved temperatures superior to 1250 K where a homogeneousbehaviour of the shock tube can be assumed. With the exception of Heghes, they displaytheir poorest performance in relation to the combustion of bio-syngas (CH4 −CO−H2 −CO2) even at temperatures higher than 1250 K. This supports the notion that the complexkinetic interactions ruling the combustion of such blends have not yet been optimallycaptured [14]. Overall, Heghes’ mechanism leads to considerably worse predictions than
31

1 2 3 4 5 6 7 8 9 10 11 12 13 14 15 16 17 18 19 20 21 22 23 24 25 26 27 28 29 30 31 32 33 34 35 36 37 38 39 40 41 42 43 44 45 46 47 48 49 50 51 52 53 54 55 56 57 58 59 60 61 62 63 64 65
Table 21: σ/µ as a function of the composition
All temperatures N DRM Frenklach GRI Heghes NUIGCH4 263 1.0921 1.1119 0.9570 0.8407 0.9693CH4 − H2 85 0.6474 0.6966 0.8814 0.5399 0.7328CH4 − CO2 73 0.7400 0.8768 0.7213 0.3206 0.7484CH4 − CO− H2 27 0.7957 0.7778 0.8591 0.9769 0.8653CH4 − CO− H2 − CO2 83 0.3669 0.3678 0.3675 0.3226 0.2885All mixtures 531 1.2720 1.2701 1.2243 0.9470 1.2057T < 1250 K N DRM Frenklach GRI Heghes NUIGCH4 58 0.4532 0.4383 0.5943 0.2690 0.3744CH4 − H2 4 0.3105 0.2423 0.4218 0.3538 0.6176CH4 − CO2 0 - - - - -CH4 − CO− H2 14 0.6573 0.6446 0.7380 0.7708 0.7237CH4 − CO− H2 − CO2 58 1.0799 1.0791 1.0889 1.1182 1.3344All mixtures 134 0.8239 0.8208 0.8953 0.7503 0.9039T ≥ 1250 K N DRM Frenklach GRI Heghes NUIGCH4 205 0.7748 0.8932 0.7482 0.5756 0.8332CH4 − H2 85 0.6474 0.6966 0.8814 0.5399 0.7328CH4 − CO2 73 0.7400 0.8768 0.7213 0.3206 0.7484CH4 − CO− H2 27 0.7957 0.7778 0.8591 0.9769 0.8653CH4 − CO− H2 − CO2 83 1.1038 1.1000 1.1603 1.1665 1.3734All mixtures 397 0.8318 0.8758 0.8231 0.5627 0.7994
the other models. However, in the case of CH4 − CO − H2 it performs better than GRI(0.1462 against 0.1818) and in the case of bio-syngas (CH4−CO−H2−CO2) it is closer tothe measurements than DRM, Frenklach and GRI. Despite the systematic optimisation itwas constructed through, GRI 3.0 is less performing than NUIG and DRM and Frenklach(both of which rely on a former version of GRI) with respect to methane combustion athigh temperature.
So far as the burning of biogas is concerned, the three GRI-based mechanisms (namelyDRM, Frenklach, and GRI 3.0) prove superior to the two other models. On average, NUIGis the best model and it clearly outperforms the four other candidates for what pertains tothe simulation of bio-syngas, as was demonstrated in two other studies [40, 41]. However,for temperatures higher than 1250 K, its overall performance is inferior to that of DRM(a reduced version of the first GRI mechanism) and Frenklach. Given the fact that theseexperiments are the most reliable ones in terms of kinetic information unaffected by non-ideal physics, it shows that the much older DRM is not necessarily outdated in terms ofaccuracy.
32

1 2 3 4 5 6 7 8 9 10 11 12 13 14 15 16 17 18 19 20 21 22 23 24 25 26 27 28 29 30 31 32 33 34 35 36 37 38 39 40 41 42 43 44 45 46 47 48 49 50 51 52 53 54 55 56 57 58 59 60 61 62 63 64 65
Table 22: µ as a function of the inert gas
Bath gas N DRM Frenklach GRI Heghes NUIGAR 92 0.1650 0.1488 0.2024 0.1370 0.1526N2 438 0.1921 0.1950 0.1975 0.3523 0.1900T < 1250 K N DRM Frenklach GRI Heghes NUIGAR 28 0.2005 0.2025 0.2363 0.2183 0.2293N2 105 0.4891 0.4848 0.4647 0.6982 0.4184T ≥ 1250 K N DRM Frenklach GRI Heghes NUIGAR 64 0.1494 0.1253 0.1875 0.1014 0.1191N2 333 0.0976 0.1028 0.1125 0.2422 0.1173
Table 23: σ/µ as a function of the inert gas
Bath gas N DRM Frenklach GRI Heghes NUIGAR 92 0.5767 0.6884 0.5512 0.8607 0.8176N2 438 1.3449 1.3145 1.3278 0.8828 1.2429T < 1250 K N DRM Frenklach GRI Heghes NUIGAR 28 0.5874 0.5821 0.6410 0.6437 0.7134N2 105 0.7566 0.7560 0.8597 0.6426 0.8754T ≥ 1250 K N DRM Frenklach GRI Heghes NUIGAR 64 0.5322 0.6849 0.4589 0.8479 0.7158N2 333 0.8950 0.9169 0.8990 0.4813 0.8159
4.3. Role of the dilution
The influence of the dilution through the inert gas AR and the presence of N2 has alsobeen investigated. For all experiments considered in this study, the presence of AR andthat of nitrogen as bath gas are mutually exclusive. The mean logarithmic discrepanciesand the corresponding standard deviations have been computed and are reported in Tables22 and 23, respectively.
On average, the presence of N2 leads to greater discrepancies for all mechanisms exceptGRI 3.0. The deterioration of the overall performance even exceeds a factor of 2 in the caseof Heghes. Given that the standard deviations are very high and that many unconsideredfactors might play a role in these differences, no firm conclusions can be drawn. The factthat GRI 3.0 follows the reverse tendency and delivers better prediction in the presence ofnitrogen might stem from it being the only mechanism including a set of elementary stepsaccounting for the formation of NO and other nitrogenous compounds [28]. Surprisingly,if only the higher temperatures are considered, all models (except Heghes) perform betterin the presence of N2 than in its absence, whereby the extent of the improvement is muchgreater in the case of GRI 3.0. For lower temperatures, all mechanisms (including GRI
33

1 2 3 4 5 6 7 8 9 10 11 12 13 14 15 16 17 18 19 20 21 22 23 24 25 26 27 28 29 30 31 32 33 34 35 36 37 38 39 40 41 42 43 44 45 46 47 48 49 50 51 52 53 54 55 56 57 58 59 60 61 62 63 64 65
Table 24: µ as a function of the pressure
p (bar) N DRM Frenklach GRI Heghes NUIG1 - 5 210 0.0841 0.1081 0.0793 0.2353 0.13795 - 10 16 0.2716 0.2596 0.3195 0.1883 0.136110 - 20 125 0.1861 0.1824 0.2241 0.2870 0.206720 - 30 81 0.2277 0.1810 0.2609 0.2697 0.108530 - 40 72 0.4188 0.4115 0.4150 0.5947 0.3662> 40 27 0.2099 0.1988 0.1685 0.5302 0.1971
T < 1250 K
p (bar) N DRM Frenklach GRI Heghes NUIG1 - 5 9 0.2383 0.2394 0.3472 0.2993 0.22605 - 10 13 0.2928 0.2928 0.3511 0.2252 0.148810 - 20 27 0.4709 0.4821 0.4824 0.6740 0.556020 - 30 20 0.3710 0.3737 0.2769 0.4936 0.220030 - 40 55 0.4968 0.4876 0.4855 0.6997 0.4391> 40 10 0.4050 0.3785 0.2922 0.7951 0.3239
T ≥ 1250 K
p (bar) N DRM Frenklach GRI Heghes NUIG1 - 5 201 0.0772 0.1022 0.0673 0.2324 0.13395 - 10 3 0.1793 0.1154 0.1826 0.0285 0.081010 - 20 98 0.1076 0.0999 0.1529 0.1804 0.110520 - 30 61 0.1807 0.1178 0.2556 0.1963 0.071930 - 40 17 0.1664 0.1651 0.1870 0.2549 0.1301> 40 17 0.0951 0.0931 0.0958 0.3744 0.1225
3.0) display a much poorer performance (by a factor of 2 or so) with nitrogen than withargon being used as the bath gas. This result seems related to the finding of Davidsonand Hanson [26] according to which the use of a mono-atomic inert gas such as AR avoidsthe physical inhomogeneities caused by N2.
4.4. Role of the pressure
Likewise, the effect of the pressure on the average logarithmic discrepancies has beendetermined. The mean values µ of the logarithmic discrepancies are reported in Table24. Table 25 contains the ratios between the standard deviations of the logarithmicdiscrepancies and their mean values σ/µ. There are few clear patterns emerging fromthese results. In general, GRI 3.0 delivers the best predictions in comparison to the fourother models at relatively low pressures inferior to five bars. NUIG leads to the bestresults for pressures comprised between 20 bar and 30 bar. This might be related tothe inclusion of high pressure experiments during its validation [2]. Separating the twoprincipal temperature ranges did not bring up any significant additional information in
34

1 2 3 4 5 6 7 8 9 10 11 12 13 14 15 16 17 18 19 20 21 22 23 24 25 26 27 28 29 30 31 32 33 34 35 36 37 38 39 40 41 42 43 44 45 46 47 48 49 50 51 52 53 54 55 56 57 58 59 60 61 62 63 64 65
Table 25: σ/µ as a function of the pressure
p (bar) N DRM Frenklach GRI Heghes NUIG1 - 5 210 0.9708 0.8979 1.1077 0.4203 0.69455 - 10 16 0.5284 0.6022 0.7063 0.7391 0.881510 - 20 125 1.1084 1.1709 0.9145 1.0195 1.100620 - 30 81 0.6937 0.9683 0.5515 0.9901 1.462230 - 40 72 1.0562 1.0622 1.0800 0.8459 1.0906> 40 27 0.8883 0.9156 1.0063 0.4963 0.8038
T < 1250 K
p (bar) N DRM Frenklach GRI Heghes NUIG1 - 5 9 0.3909 0.3945 0.4444 0.4422 0.45805 - 10 13 0.5174 0.5174 0.6795 0.5677 0.873310 - 20 27 0.5838 0.5648 0.6182 0.5714 0.413520 - 30 20 0.6041 0.5710 0.8984 0.8315 1.153330 - 40 55 0.9550 0.9633 1.0010 0.7528 0.9793> 40 10 0.4034 0.4620 0.7202 0.2829 0.5127
T ≥ 1250 K
p (bar) N DRM Frenklach GRI Heghes NUIG1 - 5 201 0.9607 0.9114 0.9083 0.4155 0.69995 - 10 3 0.1724 0.7311 0.4171 0.2808 0.394210 - 20 98 0.6763 0.8119 0.5128 0.7124 0.843320 - 30 61 0.5030 0.8528 0.3474 0.7125 1.215630 - 40 17 0.8487 0.8256 0.7948 0.6315 0.5928> 40 17 0.6359 0.7266 0.8511 0.3209 0.7882
35

1 2 3 4 5 6 7 8 9 10 11 12 13 14 15 16 17 18 19 20 21 22 23 24 25 26 27 28 29 30 31 32 33 34 35 36 37 38 39 40 41 42 43 44 45 46 47 48 49 50 51 52 53 54 55 56 57 58 59 60 61 62 63 64 65
that regard.
5. Conclusion and outlook
Reliable models leading to realistic simulations of the combustion of methane-basedfuels (such as natural gas, biogas and bio-syngas) are vital for both the industry andthe academic world at the dawn of the third millennium. While much progress has beenachieved since the 1960s, the current situation is far from being satisfactory as manyexperimental targets are still far off from the predictions of detailed reaction mechanisms[20, 40, 41]. In two of our previous articles, we endeavoured to accurately model the com-bustion of bio-syngas [14] and biogas [15]. It was found that while a reasonable agreementwith experimental data could be attained under many circumstances, considerable dispar-ities remained in other situations. This justifies the conclusion that the chemical kineticsof methane combustion (especially while combined with hydrogen, carbon monoxide orcarbon dioxide) is not yet optimally understood. This prompted us to perform the presentinvestigation where 530 experimental ignition delay times measured in shock tubes wereconsidered for evaluating five detailed reaction mechanisms. We made use of a novelanalysis tool we called RSA (Reaction Significance Analysis) described in section 2. Itbasically assesses the importance of a kinetic or thermochemical parameter for the overalldistance d between a set of experimental values and the corresponding model predictions.
Kalitan conducted a series of shock tube experiments involving blends containing H2,CO, CH4, and CO2. Ignition delay times are considerably overpredicted by the modelsat the lowest temperatures. RSA showed that under these conditions, reactions involvingOH, HO2 and H2O2 play a considerable role. While deviations from physical homogeneityat the lower temperatures may be the major cause of most disparities, the discrepanciescharacterising series 4 do not seem to be obviously related to the relatively low temper-atures and high pressures being employed. Petersen et al. carried out experiments withmixtures of methane and hydrogen. NUIG delivered the best results. RSA revealed thatthe reactions of the H2 − O2 system play a much more important role in the mixturecontaining 40 % of hydrogen than in pure methane. Huang et al. investigated the com-bustion of CH4 at relatively high pressures (16 - 40 bar). The predictions of the fivemechanisms are generally good at higher temperatures but poor at lower ones. The mainexplanation appears to be the inhomogeneous behaviour of the shock tube at low tem-peratures. Zhang et al. performed a series of experiments at p = 4 bar between 1422and 1877 K involving mixtures of CH4 and H2. Ignition delay times of hydrogen-richmixtures measured at the lowest temperatures tend to be overpredicted by the models.A consideration of all profiles makes it implausible that physical inhomogeneities are themain cause of the discrepancies which seem to be rather correlated to the increased ini-tial concentration of hydrogen. It is under the same conditions (and only them) thatthe reaction H + HO2 = O2 + H2 plays an important role in the discrepancies betweenmeasurements and predictions. Zhukov et al. studied the lean combustion of methaneover a large temperature range (1196.00 - 1722.00 K) and very large pressure range (2.54- 477.00 bar). Whilst parts of the data are in good agreement with the model predictions,
36

1 2 3 4 5 6 7 8 9 10 11 12 13 14 15 16 17 18 19 20 21 22 23 24 25 26 27 28 29 30 31 32 33 34 35 36 37 38 39 40 41 42 43 44 45 46 47 48 49 50 51 52 53 54 55 56 57 58 59 60 61 62 63 64 65
certain measurements are considerably overpredicted. Inhomogeneities caused by rela-tively high pressures and low temperatures are rather unlikely to be a significant factorhere because of the existence of other measurements under these conditions well capturedby the models.
While no overall cause could be discovered, RSA showed that reactions involvingHO2 − H2O2 (such as OH + H2O2 = HO2 + H2O) have a strong effect on the discrep-ancies. However, a relatively recent experimental study [62] and a theoretical work [47]investigated this reaction thoroughly and estimated values for the rate coefficient whichare consistent to within 25-30%. As a consequence, the potential inaccuracy of its kineticparameters could only account for a small part of the differences between measurementsand model predictions.
Generally, when ignition delay times considered in this study are overpredicted, thistends to happen at the lowest temperatures and to be correlated with the chemistry ofHO2 and H2O2. While inhomogeneous physical conditions are largely responsible for thesedisparities, some of our results in subsections 3.1, 3.4, 3.5, and 3.6 do not seem to stemfrom this problem and may be due to kinetic inaccuracies. This indicates that some pa-rameters of the HO2−H2O2 system probably need to be more precisely determined. Honget al. [27] also emphasised that steps belonging to this family should be estimated moreaccurately. Other works also identified these reactions as important at low temperatures[6, 61, 63, 64]. Finally, the influence of the mixture composition, dilution, temperatureand pressure on the discrepancies between measurements and model predictions has beenstatistically analysed. Overall, most mechanisms capture at best the combustion of bio-gas and display their poorest performance in relation to the combustion of bio-syngas.Despite its imperfection, NUIG proves to be the best choice for simulating the burning ofbio-syngas. At high temperatures, the presence of N2 in the reacting mixture increases theperformance of all models and particularly that of GRI 3.0 accounting for the formationof NO. At low temperatures, however, the presence of N2 reduces the predictive powerof all models which is probably due to its causing a further departure from homogeneity[26].
On average, the models tend to lead to poorer predictions at lower temperatures, whichis mostly due to physical inhomogeneities [60]. No clearly identifiable trend regarding thepressure could be identified.
To conclude, the present study revealed that the detailed kinetic modelling of methane(with or without H2, CO or CO2) cannot be yet considered satisfactorily completed. In[20], we argued that the feasible set approach championed by Frenklach et al. [30, 32, 65]is a promising and rigorous way of developing and systematically improving reactionmechanisms endowed with a solid predictive power. While this method has been followedfor creating the successive versions of the GRI mechanisms, the quality of its predictionshas been limited by the fact that many parameters of more isolated reactions such as H+HO2 = OH+OH are not sufficiently constrained by the available experimental data whichare mostly governed by ignition chemistry. Therefore, we consider it a worthwhile goalfor chemical kineticists to design new experiments yielding temporal and spatial speciesprofiles strongly constraining the parameter spaces of reactions of the CH4 − CO − H2
37

1 2 3 4 5 6 7 8 9 10 11 12 13 14 15 16 17 18 19 20 21 22 23 24 25 26 27 28 29 30 31 32 33 34 35 36 37 38 39 40 41 42 43 44 45 46 47 48 49 50 51 52 53 54 55 56 57 58 59 60 61 62 63 64 65
system which are only vaguely known.Special care needs to be taken to simulate them under the right physical assumptions.
In the case of low temperatures and high pressures, more realistic physical models shouldbe employed [25, 27].
Over the last years, there has been an increasing interest in so-called flameless (ormild) combustion relying on the use of pre-heated air because of its more optimal energyproduction and the more limited formation of CO2, CO and NOx [66–69]. It has beenestimated that the reduction of NOx production is more optimal at relatively low temper-atures such as 950C [70, 71]. The failure to reliably predict crucial combustion featuressuch as ignition delay times under these circumstances can certainly have an impact onthe optimal design of burners minimising these pollutants. Thus, the growing accuracyof kinetic parameters influential under these conditions (e.g. reactions involving HO2 andH2O2) coupled with the use of more realistic physical models goes hand in hand with theconstruction of more environment-friendly combustors.
6. Acknowledgements
We would like to thank the UK Engineering and Physical Science Research Councilfor the financial support through the project Clean Energy Utilisation from Biogas andBiomass Gasification (Grant Ref. No. EP/K036750/1). The simulation was performedusing the programme ”HOMREA” (simulation of time-dependent homogeneous reactionsystems) from Professor U. Riedel (the code-administrator), which was authored by thelate Professor Juergen Warnatz. We are also thankful to both professor Uwe Riedel andDr. Elke Goos from the German Aerospace Centre (DLR) for having assisted us in thedevelopment of the program Kinefit.
References
[1] M. Frenklach, Reaction mechanism of soot formation in flames, Phys. Chem. Chem.Phys. 4 (2002) 2028–2037.
[2] H. J. Curran, P. Gaffuri, W. J. Pitz, C. K. Westbrook, A comprehensive modelingstudy of iso-octane oxidation, Combustion and flame (2002) 253280.
[3] D. Healy, N. Donato, C. Aul, E. Petersen, C. Zinner, G. Bourque, H. Curran, Isobu-tane ignition delay time measurements at high pressure and detailed chemical kineticmodeling, Combustion and Flame 157 (2010) 1540–1551.
[4] C. Heghes, Soot Formation Modeling during Hydrocarbon Pyrolysis and Oxidationbehind Shock Waves, Ph.D. thesis, University of Heidelberg, 2006.
38

1 2 3 4 5 6 7 8 9 10 11 12 13 14 15 16 17 18 19 20 21 22 23 24 25 26 27 28 29 30 31 32 33 34 35 36 37 38 39 40 41 42 43 44 45 46 47 48 49 50 51 52 53 54 55 56 57 58 59 60 61 62 63 64 65
[5] H. Wang, M. Frenklach, PAH formation and growth in laminar premixed ethyleneand acetylene flames, Combustion and Flame 110 (1997) 173–221.
[6] N. Peters, B. Rogg, Reduced Kinetic Mechanisms for Applications in CombustionSystems, Springer edition, 2008.
[7] D. Sailor, J. R. Muoz, Sensitivity of electricity and natural gas consumption toclimate in the u.s.a.methodology and results for eight states, Energy 22 (1997) 987–998.
[8] H. M. Choa, B.-Q. Heb, Spark ignition natural gas enginesa review, Energy Conver-sion and Management 48 (2007) 608–618.
[9] S. Rasi, S. Veijanen, J. Rintala, Trace compounds of biogas from different biogasproduction plants, Energy 32 (2007) 1375 – 1380.
[10] E. Porpatham, A. Ramesh, B. Nagalingam, Investigation on the effect of concentra-tion of methane in biogas when used as a fuel for a spark ignition engine, Combustionand Flame 87 (2008) 1651 – 1659.
[11] P. Weiland, Biogas production: current state and perspectives, Appl MicrobiolBiotechnol 85 (2010) 849–860.
[12] M. Robbins, G. Evans, J. Valentine, I. Donnison, G. Allison, New opportunities forthe exploitation of energy crops by thermochemical conversion in the UK , Progressin Energy and Combustion Science 38 (2012) 138 – 155.
[13] A. Demirbas, Biofuels sources, biofuel policy, biofuel economy and global biofuelprojections, Energy Conversion and Management 49 (2008) 2106 – 2116.
[14] M. Fischer, X. Jiang, An assessment of chemical kinetics for bio-syngas combustion,Fuel 137 (2014) 293–305.
[15] M. Fischer, X. Jiang, An investigation of the chemical kinetics of biogas combustion,Fuel 150 (2015) 711–720.
[16] X. Jiang, C. H. Lai, Numerical Techniques for Direct and Large – Eddy Simulations,CRC Press, 2009.
[17] J. Kima, U. Uwe Schnell, G. Scheffknecht, Comparison of different global reactionmechanisms for MILD combustion of natural gas, Combustion Science and Technol-ogy 180 (1993) 565 – 592.
[18] J. Nafe, U. Maas, Modeling of NO formation based on ILDM reduced chemistry,Proceedings of the Combustion Institute 29 (2002) 1379 – 1385.
39

1 2 3 4 5 6 7 8 9 10 11 12 13 14 15 16 17 18 19 20 21 22 23 24 25 26 27 28 29 30 31 32 33 34 35 36 37 38 39 40 41 42 43 44 45 46 47 48 49 50 51 52 53 54 55 56 57 58 59 60 61 62 63 64 65
[19] A. A. Msaad, A. Belcadi, M. Mahdaoui, E. Aaffad, M. Mouqallid, Reduced detailedmechanism for methane combustion, Energy and Power Engineering 4 (2012) 28 –33.
[20] M. Fischer, X. Jiang, Numerical optimisation for model evaluation in combustionkinetics, Applied Energy (2015).
[21] J. Warnatz, U. Maas, R. Dibble, Combustion: Physical and Chemical Fundamentals,Modeling and Simulation, Experiments, Pollutant Formation, Springer, Springer Sci-ence & Business Media edition, 2006.
[22] K. Norinaga, O. Deutschmann, Detailed kinetic modeling of gas-phase reactions inthe chemical vapor deposition of carbon from light hydrocarbons, Ind. Eng. Chem.Res. 46 (2007) 3547–3557.
[23] R. Khan, D. Buchholz, F. Graf, R. Reimert, Pyrolysis of acetylene for vacuum car-burizing of steel: Modeling with detailed kinetics, International Journal of ChemicalReactor Engineering 7 (2009) 1542.
[24] M. Chaos, F. Dryer, Syngas combustion kinetics and applications, CombustionScience and Technology 180 (2008) 1053–1096.
[25] M. Chaos, F. Dryer, Chemical-kinetic modeling of ignition delay: Considerations ininterpreting shock tube data, Inc. Int J Chem Kinet 42 (2010) 143–150.
[26] D. F. Davidson, R. K. Hanson, Interpreting shock tube ignition data, InternationalJournal of Chemical Kinetics 36 (2004) 510–523.
[27] Z. Hong, D. Davidson, R. Hanson, An improved H2 - O2 mechanism based on recentshock tube/laser absorption measurements, Combustion and Flame 158 (2011) 633–644.
[28] G. Smith, D. Golden, M. Frenklach, N. Moriarty, B. Eiteneer, M. Goldenberg,C. Bowman, R. Hanson, S. Song, W. Gardiner, V. Lissianski, Z. Qin, GRI –mechanism 3.0, Website, last access on 11.11.2014. http://www.me.berkeley.edu/gri-mech/version30/text30.html,.
[29] N. Shenvi, J. M. Geremia, H. Rabitz, Nonlinear kinetic parameter identificationthrough map inversion, J. Phys. Chem. A 106 (2002) 12315.
[30] T. Russi, A. Packard, R. Feeley, M. Frenklach, Sensitivity analysis of uncertainty inmodel prediction, J. Phys. Chem. A. 112 (2008) 2579.
[31] M. Frenklach, Transforming data into knowledge – process informatics for combustionchemistry, Proceedings of the Combustion Institute 31 (2007) 125–140.
40

1 2 3 4 5 6 7 8 9 10 11 12 13 14 15 16 17 18 19 20 21 22 23 24 25 26 27 28 29 30 31 32 33 34 35 36 37 38 39 40 41 42 43 44 45 46 47 48 49 50 51 52 53 54 55 56 57 58 59 60 61 62 63 64 65
[32] X. You, T. Russi, A. Packard, M. Frenklach, Optimization of combustion kineticmodels on a feasible set, Proceedings of the Combustion Institute 33 (2011) 509–516.
[33] H. Wang, D. Sheen, Combustion kinetic model uncertainty quantification, propa-gation and minimization, Progress in Energy and Combustion Science 47 (2015)1–31.
[34] A. Kazakov, M. Frenklach, DRM mechanism, Website, last access on 11.11.2014.http://www.me.berkeley.edu/drm/,.
[35] C. Heghes, V. Karbach, J. Warnatz, Evaluation of new data for hydrocarbon kinetics,Proc. of Europ. Combust. Meeting. 176 (2005).
[36] D. Baulch, C. Bowma, C. Cobos, R. Cox, T. Just, J. Kerr, M. Pilling, D. Stocker,J. Troe, W. Tsang, R. Walker, J. Warnatz, Kinetic data for combustion modelling:Supplement II., J. Phys. Chem. Ref. Data 34 (2005) 757 – 1398.
[37] N. Donato, C. Aul, E. Petersen, C. Zinner, H. Curran, G. Bourque, Ignition andoxidation of 50/50 butane isomer blends, Journal of Engineering for Gas Turbinesand Power 132 (2010) 500–509.
[38] D. Healy, N. Donato, C. Aul, E. Petersen, C. Zinner, G. Bourque, H. Curran, n-butane ignition delay time measurements at high pressure and detailed chemicalkinetic modeling, Combustion and Flame 157 (2010) 1526–1539.
[39] D. Healy, M. Kopp, N. Polley, E. Petersen, G. Bourque, H. Curran, Methane/n-butane ignition delay measurements at high pressure and detailed chemical kineticsimulations, Energy and Fuels 24 (2010) 1617–1627.
[40] S. Gersen, H. Darmeveil, H. Levinsky, The effects of CO addition on the autoignitionof H2, CH4 and CH4/H2 fuels at high pressure in an RCM , Combustion and Flame159 (2012) 3472 – 3475.
[41] O. Mathieu, M. Kopp, E. Petersen, Shock-tube study of the ignition of multi-component syngas mixtures with and without ammonia impurities, Proceedingsof the Combustion Institute 34 (2013) 3211 – 3218.
[42] M. O. Conaire, H. Curran, J. Simmie, W. Pitz, C. Westbrook, A comprehensivemodeling study of hydrogen oxidation, Int. J. Chem. Kinet. 36 (2004) 603–622.
[43] X. You, C. Wang, H. Sung, S. Klippenstein, Reaction kinetics of CO + HO2 toProducts: ab initio transition state theory study with master equation modeling, J.Phys. Chem. A 111 (2007) 4031–4042.
[44] E. L. Eric L. Petersen, D. Kalitan, S. Simmons, G. Bourque, H. J. Curran, J. Simmie,Methane/propane oxidation at high pressures: Experimental and detailed chemicalkinetic modeling, Proceedings of the Combustion Institute 31 (2007) 447–454.
41

1 2 3 4 5 6 7 8 9 10 11 12 13 14 15 16 17 18 19 20 21 22 23 24 25 26 27 28 29 30 31 32 33 34 35 36 37 38 39 40 41 42 43 44 45 46 47 48 49 50 51 52 53 54 55 56 57 58 59 60 61 62 63 64 65
[45] C. Olm, I. Zsly, R. Plvlgyi, T. Varga, T. Nagy, H. J. Curran, T. Turnyi, Comparisonof the performance of several recent hydrogen combustion mechanisms, Combustionand Flame 161 (2014) 2219–2234.
[46] C. Olm, I. Zsly, T. Varga, H. J. Curran, T. Turnyi, Comparison of the performanceof several recent syngas combustion mechanisms, Combustion and Flame 162 (2015)1793–1812.
[47] M. P. Burke, S. Klippenstein, L. B. Harding, A quantitative explanation for theapparent anomalous temperature dependence of OH + HO2 = H2O + O2 throughmulti-scale modeling, Proceedings of the Combustion Institute 34 (2013) 547–555.
[48] A. S. Tomlin, The role of sensitivity and uncertainty analysis in combustion mod-elling, Proceedings of the Combustion Institute 34 (2013) 159–176.
[49] J. Prager, H. Najm, K. Sargsyan, C. Safta, W. Pitz, Uncertainty quantification ofreaction mechanisms accounting for correlations introduced by rate rules and fittedarrhenius parameters, Combustion and Flame 160 (2013) 1583–1593.
[50] M. Fischer, On the relevance of optimization methods for the systematic improvementof combustion reaction mechanisms, Ph.D. thesis, University of Heidelberg, 2011.
[51] E. Petersen, D. Kalitan, A. Barrett, S. Reehal, J. Mertens, D. Beerer, R. Hack,V. McDonell, New syngas/air ignition data at lower temperature and elevated pres-sure and comparison to current kinetics models, Combustion and Flame 149 (2007)244–247.
[52] G. A. Pang, D. F. Davidson, D. F. Davidson, R. K. Hanson, Experimental study andmodeling of shock tube ignition delay times for hydrogen-oxygen-argon mixtures atlow temperatures, Proceedings of the Combustion Institute 32 (2008) 181–188.
[53] D. Kalitan, A study of syngas oxidation at high pressures and low temperatures,Ph.D. thesis, University of Central Florida, 2007.
[54] E. L. Petersen, J. M. Hall, J. de Vries, A. R. Amadio, S. D. Smith, M. W. Crofton,M. University, Acceleration of shock-induced ignition in CH4/air and CO/air mix-tures using hydrogen addition, International colloquium on the dynamics of explo-sions and reactive systems, 2005.
[55] J. Huang, P. Hill, W. Bushe, S. Munshi, Shock-tube study of methane ignition underengine-relevant conditions: experiments and modeling, Combustion and Flame 136(2004) 25–42.
[56] Y. Zhang, Z. Huang, L. Wei, S. Niu, Experimental and kinetic study on ignitiondelay times of methane/hydrogen/oxygen/nitrogen mixtures by shock tube, ChineseScience Bulletin 56 (2011) 2853–2861.
42

1 2 3 4 5 6 7 8 9 10 11 12 13 14 15 16 17 18 19 20 21 22 23 24 25 26 27 28 29 30 31 32 33 34 35 36 37 38 39 40 41 42 43 44 45 46 47 48 49 50 51 52 53 54 55 56 57 58 59 60 61 62 63 64 65
[57] V. P. Zhukov, V. A. Sechenov, A. Y. Starikovskii, Spontaneous ignition of methaneairmixtures in a wide range of pressures, Combustion, Explosion, and Shock Waves 39(2003) 487–495.
[58] A. Lifshitz, K. Scheller, A. Burcat, G. Skinner, Shock-tube investigation of ignitionin methane-oxygen-argon mixtures, Combustion and Flame 16 (1971) 311 – 321.
[59] W. Zeng, M. Hongan, Y. Liang, E. Hu, Experimental and modeling study on effects ofN2 and CO2 on ignition characteristics of methane/air mixture, Journal of AdvancedResearch (Accepted Work) (2014).
[60] L. Dryer, M. Chaos, Ignition of syngas/air and hydrogen/air mixtures at low tem-peratures and high pressures: Experimental data interpretation and kinetic modelingimplications, Combustion and Flame 152 (2008) 293 – 299.
[61] G. Pang, D. Davidson, R. Hanson, Experimental study and modeling of shock tubeignition delay times for hydrogen-oxygen-argon mixtures at low temperatures, Pro-ceedings of the Combustion Institute 32 (2009) 181–188.
[62] Z. Hong, S. S. Vasu, D. F. Davidson, R. Hanson, Experimental study of the rate ofOH+H2O2− > H2O+O2 at high temperatures using the reverse reaction, J. Phys.Chem. A 2010 114 (2010) 5520–5525.
[63] V. I. Golovitchev, M. L. Pilia, C. Bruno, Autoignition of methane mixtures - theeffect of hydrogen peroxide, Journal of Propulsion and Power 12 (1996) 699–707.
[64] E. Petersen, R. Hanson, D. Davidson, Kinetics modeling of shock-induced ignitionin low-dilution CH4/O2 mixtures at high pressures and intermediate temperatures,Combustion and Flame 117 (1999) 272–290.
[65] M. Frenklach, Transforming data into knowledge process informatics for combustionchemistry, Proc. Combust. Inst. 31 (2007) 125.
[66] A. Mardani, S. Tabejamaat, Numerical study of flame structure in the mild combus-tion regime, Thermal Science 19 (2015) 21–34.
[67] C. Zhenjun, Z. Tong, Effects of co2 dilution on methane ignition in moderate orintense low-oxygen dilution (mild) combustion: A numerical study, Chinese Journalof Chemical Engineering 20 (2012) 701–709.
[68] S. Lille, W. Blasiak, M. Jewartowski, Experimental study of the fuel jet combustionin high temperature and low oxygen content exhaust gases, Energy 30 (2005) 373–384.
[69] J. Wuenning, J. Wuenning, Flameless oxidation to reduce thermal no-formation,Prog. Energy ComlnaL Sci. 23 (1997) 81–94.
43

1 2 3 4 5 6 7 8 9 10 11 12 13 14 15 16 17 18 19 20 21 22 23 24 25 26 27 28 29 30 31 32 33 34 35 36 37 38 39 40 41 42 43 44 45 46 47 48 49 50 51 52 53 54 55 56 57 58 59 60 61 62 63 64 65
[70] A. Effuggi, A. Cavigiolo, M. Galbiati, D. Gelosa, R. Rota, Mild combustion forfuel-nox reduction, Joint Meeting of The Scandinavian-Nordic and Italian Sectionsof The Combustion Institute, 2003.
[71] M. Mancini, Weber, R., U. Bollettini, Predicting nox emissions of a burner operatedin flameless oxidation mode, Proceedings of the Combustion Institute 29 (2002)1155–1163.
44