Kinetic spectrophotometric determination of escitalopram ...
10
J. Indian Chern. Soc., Vol. 90, March 2013, pp. 309-317 Kinetic spectrophotometric determination of escitalopram oxalate in bulk and pharmaceutical formations using alkaline potassium permanganate Salma A. AI- Tamimi*, Fatma A. Aly and Ohoud M. Al-Otaibi Department of Chemistry, College of Science, Women Student-Medical Studies and Science Sections, King Saud University, P.O. Box 22452, Riyadh 11495, Saudi Arabia E-mail : [email protected] Manuscript received online 29 April 2012, revised 14 May 2012, accepted 15 May 2012 Abstract : Simple and sensitive kinetic spectrophotometric methods were established for the determination of escitalopram oxalate in bulk and in its pharmaceutical preparations using alkaline potassium permanganate as an oxidizing agent. The methods involve determination of escitalopram oxalate by kinetic studies of its oxidation at room temperature for a fixed time of 15 min. The absorbance of the colored manganate ions was measured at 610 nm. Alternatively, the decr·case in the absorbance of permanganate upon addition of the studied drug was also measured at 525 nm. The absorbance- concentration plots in both procedures were rectilinear over the range of 4.0-25.0 IJ.g mL- 1 • The different experimental parameters affecting the development were carefully studied and optimized. The determination of escitalopram oxalate by the fixed concentration and initial rate methods is also feasible with the calibration equations obtained but the fixed time method has been found to be more applicable. Both procedures were applied to the determination of escitalopram oxalate in formulations. The results obtained were in good agreement with those obtained using reference methods. The proposed methods have a great value in their application to the analysis of escitalopram oxalate in quality control laboratories. Keywords : Escitalopram oxalate, kinetic spectrophotometry, fixed time method, validation, pharmaceutical preparations. Introduction Escitalopram (S-( + )-1-[3-( dimethylamino)propyl]-1-(p- fluorophenyl)-5-phthalancarbonitrile oxalate), the S-enan- tiomer of racemic citalopram, is a selective serotonin reuptake inhibitor (SSRI) and belongs to a group of medi- cines known as antidepressants. These medicines help to normalize the levels of serotonin in the brain. Distur- bances in the serotonin system of the brain are key fac- tors in the development of depression and related disor- ders'. Several analytical methods have been reported for the determination of escitalopram oxalate in pure form, in pharmaceuticals and in biological fluids. Most of the re- ported methods are chromatographic methods and no of- ficial methods have been reported for the determination of escitalopram oxalate. The reported methods include high performance thin layer chromatography (HPTLC) 2 - 4 , high performance liq- uid chromatography with tandem mass spectroscopy (HPLC/MS/MS) 5 - 7 , high performance liquid chromato- graphy with ultraviolet detection (LC-UV) 8 - 10 , high per- formance liquid chromatography with mass spectros- copy8· 11 • 12 , capillary electrophoresis method 13 , spectro- tluorometric method2, 14 and spectrophotometric meth- odslO,IS-19. The spectrophotometric methods include two direct UVzero order spectrophotometric methods 15 · 16 , and two colorimetric methods using iodine 17 and bromocresol green acidic dyel8 for determination of escitalopram in tablet Also, an absorbance correction 10 and si- equations methods have been developed for the simultaneous determination of escitalopram and clonazepam in combined tablet dosage form. Reviewing the literature survey revealed that no ki- netic spectrophotometric method has been reported for the determination of escitalopram. Kinetic spectrophotometric methods are becoming of a great interest in the pharmaceutical analysis20,21. The 309
-
Upload
khangminh22 -
Category
Documents
-
view
0 -
download
0
Transcript of Kinetic spectrophotometric determination of escitalopram ...

J. Indian Chern. Soc.,
Vol. 90, March 2013, pp. 309-317
Kinetic spectrophotometric determination of escitalopram oxalate in bulk and pharmaceutical formations using alkaline potassium permanganate
Salma A. AI-Tamimi*, Fatma A. Aly and Ohoud M. Al-Otaibi
Department of Chemistry, College of Science, Women Student-Medical Studies and Science Sections, King Saud University, P.O. Box 22452, Riyadh 11495, Saudi Arabia
E-mail : [email protected]
Manuscript received online 29 April 2012, revised 14 May 2012, accepted 15 May 2012
Abstract : Simple and sensitive kinetic spectrophotometric methods were established for the determination of escitalopram
oxalate in bulk and in its pharmaceutical preparations using alkaline potassium permanganate as an oxidizing agent.
The methods involve determination of escitalopram oxalate by kinetic studies of its oxidation at room temperature for a
fixed time of 15 min. The absorbance of the colored manganate ions was measured at 610 nm. Alternatively, the decr·case
in the absorbance of permanganate upon addition of the studied drug was also measured at 525 nm. The absorbance
concentration plots in both procedures were rectilinear over the range of 4.0-25.0 IJ.g mL-1• The different experimental
parameters affecting the development were carefully studied and optimized. The determination of escitalopram oxalate
by the fixed concentration and initial rate methods is also feasible with the calibration equations obtained but the fixed
time method has been found to be more applicable. Both procedures were applied to the determination of escitalopram
oxalate in formulations. The results obtained were in good agreement with those obtained using reference methods. The
proposed methods have a great value in their application to the analysis of escitalopram oxalate in quality control
laboratories.
Keywords : Escitalopram oxalate, kinetic spectrophotometry, fixed time method, validation, pharmaceutical preparations.
Introduction
Escitalopram (S-( + )-1-[3-( dimethylamino)propyl]-1-(pfluorophenyl)-5-phthalancarbonitrile oxalate), the S-enantiomer of racemic citalopram, is a selective serotonin reuptake inhibitor (SSRI) and belongs to a group of medicines known as antidepressants. These medicines help to normalize the levels of serotonin in the brain. Disturbances in the serotonin system of the brain are key factors in the development of depression and related disorders'.
Several analytical methods have been reported for the determination of escitalopram oxalate in pure form, in pharmaceuticals and in biological fluids. Most of the reported methods are chromatographic methods and no official methods have been reported for the determination of escitalopram oxalate.
The reported methods include high performance thin layer chromatography (HPTLC)2-4, high performance liquid chromatography with tandem mass spectroscopy
(HPLC/MS/MS)5-7, high performance liquid chromatography with ultraviolet detection (LC-UV)8- 10, high performance liquid chromatography with mass spectroscopy8· 11 • 12, capillary electrophoresis method 13, spectrotluorometric method2, 14 and spectrophotometric methodslO,IS-19.
The spectrophotometric methods include two direct UVzero order spectrophotometric methods 15·16, and two colorimetric methods using iodine 17 and bromocresol green acidic dyel8 for determination of escitalopram in tablet formul~tions. Also, an absorbance correction 10 and simulta~eous19 equations methods have been developed for the simultaneous determination of escitalopram and clonazepam in combined tablet dosage form.
Reviewing the literature survey revealed that no kinetic spectrophotometric method has been reported for the determination of escitalopram.
Kinetic spectrophotometric methods are becoming of a great interest in the pharmaceutical analysis20,21. The
309

J. Indian Chern. Soc., Vol. 90, March 2013
application of these methods offers some specitic advantages such as improved selectivity, avoiding the interference of the colored and/or turbidity background of the samples, possibility of avoiding the interference of the other active ingredients present in the commercial products, and reduction of the analysis time when the analytical reaction requires long for completion. No attempt has been made for the kinetic spectrophotometric determination of escitalopram. Therefore, the development of a kinetic spectrophotometric method for determination of escitalopram was necessary.
The present study describes, for the first time, simple and sensitive kinetic spectrophotometric methods for the determination of escitalopram in bulk and in its pharmaceutical preparations using alkaline potassium permanganate as an oxidizing agent. The methods involve determination of escitalopram by kinetic studies of its oxidation at room temperature for a tixed time of 15 min. The absorbance of the colored manganate ions was measured at 610 nm. Alternatively, the decrease in the absorbance of permanganate upon addition of the studied drug was also measured at 525 nm. The methods were successfully applied for the determination of this drug in its dosage forms.
Experimental
Apparatus:
An UV-Vis spectrophotometer model Ultrospec 2100-
Pro (Biochrom, England) with matched 1 em quartz cells was used for all measurements.
Chemicals and dosage forms :
All chemicals used were of analytical reagent grade, and the solvents were of spectroscopic grade. Potassium permanganate (BDH, UK) was 4.0 X 10⁻² M aqueous solution. Sodium hydroxide (Winlab, Middlesex, UK) was 0.5 M aqueous solution, escitalopram oxalate (Spimaco Al-Qassim Pharmaceutical, Saudi Arabia). The available pharmaceutical dosage forms used in the present investigation are Cipralex tablets.
Standard solution :
A stock solution containing 1.0 mg mL -I of escitalopram oxalate was prepared in distilled water. Working standard solutions were prepared from stock solution by further dilution with distilled water.
310
Procedures :
Construction of the kinetic calibration graphs :
Aliquot solutions containing 40.0-250.0 )..lg of escitalopram oxalate were transferred into a series of I 0 mL volumetric flasks; 1.5 mL of 0.5 M NaOH was added, followed by 2 mL of 4 x w-2 MKMn04 (for 610 nm) or 0.1 mL of 4 x w-2 M KMn04 (for 525 nm) were added. The mixtures were shaken well and completed to volume with distilled water. The increase in the absorbance at 610 nm or the decrease at 525 nm was measured after 15
min at ambient temperature (25 °C) against an appropriate hlank prepared simultaneously. The calibration graphs wen; Pbtained by plotting the absorbance (A) at 610 nm or the difference in the absorbance (AA) at 525 nm versus concentration of the drug in )..lg/mL. Alternatively, the corresponding regression equations were calculated.
Application of the proposed methods to the analysis of escitalopram oxalate in its dosage forms :
An accurately weighed amount of ten powdered tablets equivalent to 10.0 mg of escitalopram (12.77 mg escitalopram oxalate) was transferred into a 100 mL volumetric flask and completed to volume with distilled water. The flask with its contents was sonicated for 5 min and then filtered. The above procedure was followed. The nominal content was calculated either from the previously plotted calibration graph or using the corresponding
regression equation.
Results and discussion
The reaction between escitalopram and KMn04 in alkaline solution yields a green color as a result of manganate ions. As the intensity of color increases with time, it
was deemed useful to elaborate kinetically based methods for the determination of escitalopram.
Spectral studies :
The aqueous solution of escitalopram oxalate shows one absorption band peaking at 238 nm (Fig. lA) while that of alkaline potassium permanganate solution exhibits two absorption maxima at 525 and 545 nm (Fig. 1 B). The course of the reaction starts on the addition of aqueous alkaline potassium permanganate to the solution of
escitalopram resulting in the formation of new band peaking at 610 nm (Fig. lC). This band is attributed to the
formation of manganate ions in the presence of the drug.

Al-Tamimi et al. : Kinetic spectrophotometric determination of escitalopram oxalate in bulk etc.
1.2 -A
-·-···- B 1 --c
A I !\it
0.8 J v: I l ' '
cu ; I u ' ' c I l
"' i 1 .Q 0.6 .... : \ 0 VI i \ .Q
< ' ' ' ' ' ' 0.4
: : I ' I i I I I
0.2 I
I \ I ·•····•·· ..... I .. / 0
200 400 600 800
Wavelength, nm
Fig. I. Absorption spectra of : (A) escitalopram oxalate (20 )lg/ mL), (B) alkaline potassium permanganate (4 x 10·4 M) and (C) the reaction product of escitalopram oxalate (20 j.tg/mL) with alkaline potassium permanganate.
The intensity of the green colored solution increased with time owing to the formation of Mnoi-, whereas the absorbance of the solution at 525 nm decreased as the reaction proceeded due to the disappearance of Mn04-. These facts were used to developed kinetically based spectrophotometric methods for the determination of escitalopram
oxalate.
Optimization of the reaction conditions :
The factors affecting the reaction conditions were care
fully studied and optimized. Such factors were changed
individually while the others were kept constant. These factors included concentrations of KMn04, alkalinity, temperature. The effect of KMn04 concentration on the absorbance of the reaction product was studied at 610 nm using different volumes (0.2-2.6 mL) of 4 x 10⁻² M
KMn04. The maximum absorbance was attained using
1.6 mL, after which KMn04 has no effect on the absorbance. Thus 2 mL of 4 x 10⁻² M KMn04 was used for further studies at 610 nm. Also, 0.1 mL of 4 x 10⁻² M
was sufficient for measuring the decrease in the absorbance at 525 nm. The effect of NaOH concentration on the absorbance of the reaction product was investigated using different volumes (0.2-2.0 mL) of 0.5 M NaOH. It was found that increasing the volume of 0.5 M NaOH
would increase A or M of the reaction up to I mL at 610
or 525 nm, after that the absorbance was constant. Thus 1.5 mL of 0.5 M NaOH was used for further studies. The effect of temperature on the reaction rate was studied over the range of 25-80 °C. It was found that, permanganate is reduced to manganate ion at room temperature (25 °C) while at higher temperatures, the manganese dioxide is produced. Therefore, room temperature was selected as the optimum temperature.
Stoichiometry and reaction mechanism :
The stoichiometry of the reaction was studied adopting the limiting logarithmic method22 . A plot of log ab
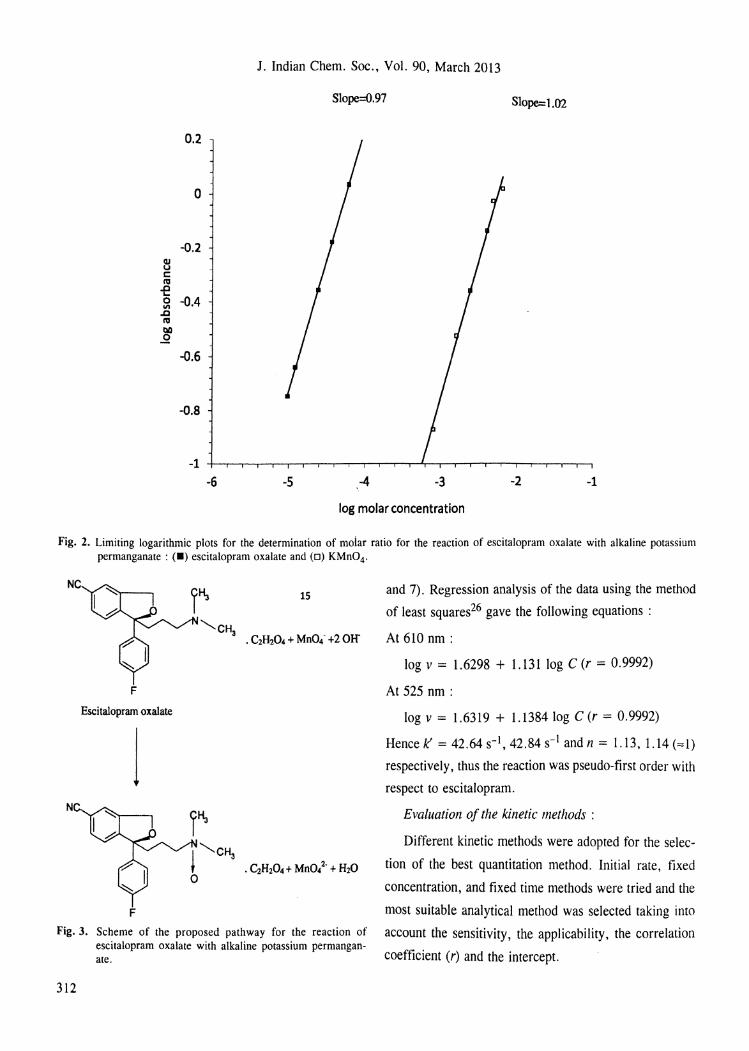
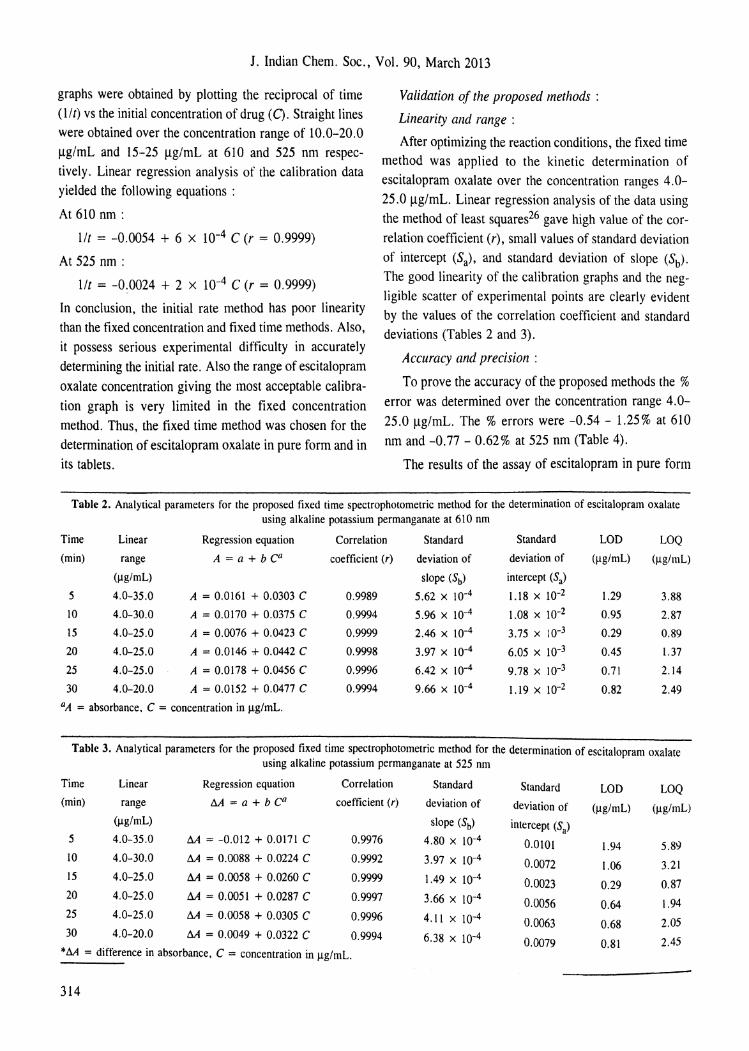
sorbance vs log [KMn04] and vs log [escitalopram] gave straight lines, with slope values of 1.02 and 0. 97 respectively (Fig. 2). Therefore, the reaction proceeds in ratio of 1 : l (KMn04 to drug). Based on the obtained molar ratio and by analogy to previous reports23-25 , the reaction pathway is proposed to proceed via formation of Noxide on the tertiary nitrogen of escitalopram as described in Fig. 3.
Study of the kinetic parameters :
Under the optimized experimental conditions, the determination of escitalopram was carried out in an excess of KMn04 and NaOH with respect to the initial concentration of escitalopram. As a result, pseudo-zero order reaction conditions were obtained with respect to their
concentrations. Therefore, on the basis of the kinetic in
vestigation, the kinetic equation for the oxidation of
escitalopram by KMn04 in alkaline medium is written
as:
v = k' en where v is the reaction rate, k' is pseudo rate constant, C
is the molar concentration of escitalopram. and n is the order of the reaction. The logarithmic form of equation
may be written as :
log v = log k' + n log C
The initial rates of reaction were evaluated at different concentrations of escitalopram (9.65 x w-6-6.03 x 10-s
M) by measuring the slopes of the initial tangent to the absorbance-time curves (at 610 and 525 nm). The values of the results are summarized in Table 1. The logarithms of reaction rates were plotted as a function of logarithms of escitalopram concentration at 610 and 525 nm (Figs. 6
311
J. Indian Chern. Soc., Vol. 90, March 2013
Slope=0.97 Slope:: 1.02
0.2
0
-0.2 QJ u 1: I'll
-e 0 -0.4 "' ..c I'll tiO
..2 -o.6
-o.s
-1
-6 -5 .-4 -3 -2 -1
log molar concentration
Fig. 2. Limiting logarithmic plots for the determination of molar ratio for the reaction of escitalopram oxalate with alkaline potassium permanganate : (•) escitalopram oxalate and (D) KMn04.
NC
F
Escitalopram oxalate
j NC
F
"'-...cH 3
15
Fig. 3. Scheme of the proposed pathway for the reaction of escitalopram oxalate with alkaline potassium permanganate.
312
and 7). Regression analysis of the data using the method
of least squares26 gave the following equations :
At 610 nm:
log v = 1.6298 + 1.131 log C (r = 0.9992)
At 525 nm:
log v = 1.6319 + 1.1384log C(r = 0.9992)
Hence k' = 42.64 s-1, 42.84 s-1 and n = 1.13, 1.14 (:::1)
respectively, thus the reaction was pseudo-first order with
respect to escitalopram.
Evaluation of the kinetic methods :
Different kinetic methods were adopted for the selec
tion of the best quantitation method. Initial rate, fixed
concentration, and fixed time methods were tried and the
most suitable analytical method was selected taking into
account the sensitivity, the applicability, the correlation
coefficient (r) and the intercept.

AI-Tamimi et al. : Kinetic spectrophotometric determination of escitalopram oxalate in bulk etc.
Table l. Initial rate for the reaction of different concentrations of escitalopram oxalate with alkaline potassium permanganate
At 610 nm At 525 nm
ex w-s (M) log C v(M s·1)
0.97 -5.02 8.67 x w-s 1.21 -4.92 1.2 x w-4
2.41 -4.62 2.67 x w-4
3.62 -4.44 4.0 x w-4
4.8 -4.32 5.67 x w-4
6.03 -4.22 7.oo x w-4
Initial rate method :
In this method, initial reaction rates were determined from the slopes of tangents of absorbance-time curves at 610 and 525 nm (Figs. 4 and 5). The calibration curves were constructed by plotting the initial rate (v) vs the concentration of escitalopram as shown in Figs. 8 and 9. Linear relationships were obtained over the concentration range of 0.97 X IQ-5-6.03 X w-5 M (4.0-25.0 Jlg/ mL). Regression analysis of the data using the method of least squares26 gave the following equations :
At 610 nm:
v = -3 X 10⁻⁵ + 12.131 C (r = 0.9996)
At 525 nm:
V = -3 X 10⁻⁵ + 11.56 C (r = 0.9990)
Fixed time method :
At a pre-selected fixed time, which was accurately
1.4
1.2
~ 0.8 .. -e ~ ~ 0.6
0.4
0.2
Escitalopram cone. (M•10"5)
--6.03
-4.83
--3.62
--2.41
--1.21
--0.97
0+----~----.-----,-----,
0 10 20 30 40
Time, min
Fig. 4. Absorbance-time curves for the reaction of different concentrations of escitalopram oxalate with alkaline potassium permanganate at 610 nm.
log v
-4.06
-3.92
-3.57
-3.40
-3.25
-3.15
,, 1 1
., u c .. -£!0.6 Sl ~
0.4
0.2
0 0 10
v (M s·1)
8.oo x w-5
1.13 x w-4
2.4 x w-4
3.67 x w-4
5.33 x w-4
6.67 x w-4
15 20 Time, min
25
log v
-4.10
-3.95
-3.62
-3.44
-3.27
-3.18
Escitalopram cone. (MxlO·')
--blank
--0.97
-1.21
-2.41
-<-3.62
--4.83
--6.03
30 35
Fig. 5. Absorbance-time curves for the reaction of different concentration of escitalopram oxalate with alkaline potassium permanganate at 525 nm.
determined, the absorbance was measured at 610 nm and
M was measured at 525 nm. Calibration graphs were
obtained by plotting the absorbance at 610 nm or M at
525 nm vs initial concentrations of escitalopram at fixed time of 5, 10, 15, 20, 25, 30 min were established. The
regression equations, correlation coefficients, and standard deviation of slope and intercept are given in Tables 2 and 3. It is clear that the most acceptable values of the correlation coefficient (r) and the intercept were obtained at a fixed time of 15 min which was chosen as the most suitable time interval for the measurement.
Fixed concentration method (fixed reaction extent) :
Reaction times were determined for different concen
trations of escitalopram to reach a specific absorbance at
610 nm or Mat 525 nm. A pre-selected value (0.48) was fixed and the time was measured in seconds. Calibration
313
J. Indian Chern. Soc., Vol. 90, March 2013
graphs were obtained by plotting the reciprocal of time (1/t) vs the initial concentration of drug (C). Straight lines were obtained over the concentration range of 10.0-20.0
!lgfmL and 15-25 11glmL at 610 and 525 nm respectively. Linear regression analysis of the calibration data yielded the following equations :
At 610 nm:
lit == -0.0054 + 6 X 10⁻⁴ C (r == 0.9999)
At 525 nm:
1/t == -0:0024 + 2 X 10⁻⁴ C (r = 0.9999)
In conclusion, the initial rate method has poor linearity than the fixed concentration and fixed time methods. Also, it possess serious experimental difficulty in accurately determining the initial rate. Also the range of escitalopram oxalate concentration giving the most acceptable calibration graph is very limited in the fixed concentration method. Thus, the fixed time method was chosen for the determination of escitalopram oxalate in pure form and in its tablets.
Validation of the proposed methods :
Linearity and range :
After optimizing the reaction conditions, the fixed time method was applied to the kinetic determination of escitalopram oxalate over the concentration ranges 4.0-
25.0 ~-tg/mL. Linear regression analysis of the data using the method of least squares26 gave high value of the correlation coefficient (r), small values of standard deviation of intercept (Sa), and standard deviation of slope (Sb).
The good linearity of the calibration graphs and the negligible scatter of experimental points are clearly evident by the values of the correlation coefficient and standard deviations (Tables 2 and 3).
Accuracy and precision :
To prove the accuracy of the proposed methods the % error was determined over the concentration range 4.0-
25.0 11g/mL. The % errors were -0.54 - 1.25% at 610
nm and -0.77-0.62% at 525 nm (Table 4).
The results of the assay of escitalopram in pure form
Table 2. Analytical parameters for the proposed fixed time spectrophotometric method for the determination of escitalopram oxalate using alkaline potassium permanganate at 610 nm
Time Linear Regression equation Correlation Standard Standard LOD LOQ
(min) range A=a+bC0 coefficient (r) deviation of deviation of (Jlg/mL) (Jlg/mL)
(Jlg/mL) slope (Sb) intercept (S.)
5 4.0-35.0 A = 0.0161 + 0.0303 C 0.9989 5.62 x w-4 1.18 x w-2 1.29 3.88
10 4.0-30.0 A = 0.0170 + 0.0375 C 0.9994 5.96 x w-4 t.08 x w-2 0.95 2.87
15 4.0-25.0 A = 0.0076 + 0.0423 C 0.9999 2.46 x w-4 3.75 X I o-3 0.29 0.89
20 4.0-25.0 A = 0.0146 + 0.0442 C 0.9998 3.97 x w-4 6.05 x w-3 0.45 1.37
25 4.0-25.0 A = 0.0178 + 0.0456 C 0.9996 6.42 x w-4 9.78 x w-3 0.71 2.14
30 4.0-20.0 A == 0.0152 + 0.0477 C 0.9994 9.66 x w-4 1.19 x w-2 0.82 2.49 0A = absorbance, C = concentration in JlglmL.
Table 3, Analytical parameters for the proposed fixed time spectrophotometric method for the determination of escitalopram oxalate using alkaline potassium permanganate at 525 nm
Time Linear Regression equation Correlation Standard Standard LOD LOQ (min) range M=a+bCa coefficient (r) deviation of deviation of (Jlg/mL) (!lg/mL)
(!lglmL) slope (Sb) intercept (S3)
5 4.0-35.0 M = -0.012 + 0.0171 C 0.9976 4.80 x w-4 0.0101 1.94 5.89 10 4.0-30.0 M = 0.0088 + 0.0224 C 0.9992 3.97 x w-4 0.0072 1.06 3.21 15 4.0-25.0 M == 0.0058 + 0.0260 C 0.9999 1.49 x w-4 0.0023 0.29 0.87 20 4.0-25.0 M = 0.0051 + 0.0287 C 0.9997 3.66 x w-4 0.0056 1.94 0.64 25 4.0-25.0 M = 0.0058 + 0.0305 C 0.9996 4.tt x w-4 0.0063 2.05 0.68 30 4.0-20.0 M = 0.0049 + 0.0322 C 0.9994 6.38 x w-4 0.0079 2.45 0.81
*M = difference in absorbance, C = concentration in Jlg/mL.
314

AI-Tamimi et at. : Kinetic spectrophotometric determination of escitalopram oxalate in bulk etc.
Table 4. Analysis of escitalopram oxalate in pure form by the published method and the proposed fixed time spectrophotometric method using alkaline potassium permanganate
Concentration
taken
(~-tg mL-1)
At 610 nm:
4.0
5.0
10.0
15.0
20.0
25.0
Mean± S.D.
Student's t-value
Variance ratio F-test
At 525 nm:
4.0
5.0
10.0
15.0
20.0
25.0
Mean± S.D.
Student's t-value
Variance ratio F-test
Concentration
found
(~-tg mL -1)
3.98
5.00
9.99
15.19
19.89
25.04
3.97
4.97
9.97
15.08
20.12
24.85
% Error'~
-0.50
0.00
-0.10
1.27
-0.55
0.16
-0.75
-0.60
-0.30
0.53
0.60
-0.60
acalcu1ated as [(measured value- true value)/(true value)] x 100.
bEach result is the average of three separate determinations.
Propose£~
method
99.53
99.95
99.86
101.25
99.46
100.18
100.04 ± 0.65
0.634 (2.365)('
3.789 (19.3)
99.23
99.38
99.69
100.57
100.62
99.42
99.82 ± 0.62
0.102 (2.365)C
3.408 (19.3)
% Foundb
Published
method 10
100.12
99.76
99.45
99.78 ± 0.33
100.12
99.76
99.45
99.78 ± 0.33
'-The figures between parentheses are the tabulated values oft and Fat P = 0.0526.
were compared with those of the published spectrophotometric method10 . Statistical analysis26 of the results obtained by the proposed and published methods using Student's t-test and variance ratio F-test, showed no significant difference between them regarding accuracy and precision, respectively (Table 4).
Intraday and interday precisions were assessed using three concentrations and three replicates of each concentration. The standard deviations were found to be very small indicating reasonable, repeatability and intermediate precision of the proposed methods (Table 5).
Selectivity :
The selectivity of the optimized procedures for the assay of escitalopram was examined in presence of the excipients present in cipralex tablets 1 e.g. talc, croscarmellose sodium, microcrystalline cellulose/colloi-
J/CS-7
dal silicon dioxide and magnesium stearate. The film coating contains hydroxypropyl methyl cellulose, titanium dioxide and polyethylene glycol. It was found that there is no significant interference from excipients. Accordingly, the proposed procedure can be considered as a selective method.
Application of the proposed methods :
In order to evaluate analytical usefulness of the proposed kinetic spectrophotometric methods, escitalopram oxalate was determined in its tablets.
The recoveries of different concentrations of escitalopram oxalate were based on the average of three replicate determinations. The results obtained were in good agreement with those obtained by the published spectrophotometric method 10 (Table 6). Statistical analysis26 of the results obtained by the proposed and the comparison
315

J. Indian Chern. Soc., Vol. 90, March 2013
Table 5. Precision data for the determination of escitalopram oxalate by the proposed tixed time spectrophotometric method
using alkaline potassium permanganate
Parameter Escitalopram concentration (!lg mL -I)
At 610 nm At 525 nm
10.0 15.0 20.0 10.0 15.0 20.0
lntraday :
%Found11 99.41 100.95 98.64 100.29 100.88 101.14
100.12 101.1 98.52 99.58 100.10 100.56
99.17 101.58 99.94 99.19 99.33 100.37
Mean 99.57 101.21 99.03 99.69 100.10 100.69
S.D. 0.49 0.33 0.79 0.56 0.78 0.40
S (meani' 0.29 0.19 0.45 0.32 0.45 0.23
lnterday :
%Found11 98.70 99.68 99.47 101.12 100.62 100.17
98.94 100.32 100.41 99.96 100.36 99.02
99.65 101.42 100.53 98.03 98.82 98.63
Mean 99.10 100.47 100.14 99.73 99.93 99.27
S.D. 0.49 0.88 0.58 1.56 0.97 0.80
S (mean)" 0.29 0.51 0.33 0.90 0.56 0.46
"Each result is the average of three separate experiments.
"Calculated as (S.D./ .jN).
Table 6. Analysis of escitalopram oxalate in commercial tablets by the published method and the proposed fixed time spectropho-
tometric method using alkaline potassium permanganate
Methods Concentration
taken
(!lg mL- 1)
At 610 nm :
Cipralex® tablets 4.00
(I 0 mgltablet)b 5.00
10.0
15.0
20.0
25.0
Mean± S.D.
Student's t-value
Variance ratio F-test
At 525 nm:
Cipralex® tablets 4.0
(10 mg/tablet) 5.0
10.0
15.0
20.0
25.0
316
% Found"
Proposed
method
98.22
99.53
101.66
99.22
99.41
98.68
99.45 ± 1.19
0.254 (2.365)C
1.059 (19.3)
100.97
99.23
100.39
98.22
99.43
100.77
Comparison
method 10
100.00
98.38
100.61
99.66 ± 1.15
100.00
98.38
100.61
Table-6 (con/d.)
Mean± S.D.
Student's t-value
Variance ratio F-test
99.83 ± 1.06 99.66 ± 1.15
0.222 (2.365)"
1.181 (5.79) 11Each result is the average of three separate determinations.
"Products of H. Lundbeck A/S, Denmark.
cThe figures between parentheses are the tabulated values oft and F at p = 0.0526 .
methods shows no significant difference between the two methods as regards to accuracy (t-test) and precision (F
test).
Conclusion :
The present study described, for the first time, a simple and sensitive kinetic spectrophotometric method for the determination of escitalopram oxalate in its dosage forms. The proposed fixed time method can be easily applied as it does not require elaborate treatment of the samples and/or tedious procedure for the analysis. As well, the method is sensitive enough for analysis of lower amounts of the drug. Further more, the proposed method does not require expensive instruments and/or critical analytical reagents. These advantages give the proposed method a great value and encourage its application to the analysis of escitalopram oxalate in quality control laboratories.
References
I. http://www .rxlist.com/Jexapro-drug.htm
2. E. A. Taha. N. N. Salama and S. Wang. Anal. Chem. In
sight, 2009, 4. 1.
3. M. V. Mahadik, S. R. Dhaneshwar and M. J. Kulkarni.
Anal. Chern .• 2007, 2, 101.
4. N. Dhavale, S. Gandhi, S. Sabnis and K. Bothara,
Chramatagr., 2008, 67, 487.
5. H. Zheng, L. Yang and W. Y. Tang, Nan Fang Yi Ke Da
Xue Xue Baa, 2008, 28, 2044.
6. Q. Yang, W. Liu, F. Zheng, J. Xu, J. Rao, D. Sun and S.
Gao, J. CEPS, 2006, 10, 1148.
7. G. Frison, D. Favretto, S. Vogliardi, C. Terranova and
S.D. Ferrara, Ther. Drug Manit., 2008, 30, 467.
8. S. R. Dhaneshwar, M. V. Mahadik and M. J. Kulkarni, J. AOAC Int., 2009,92, 138.
9. C. Greiner, C. Hiemke, W. Bader and E. Haen, Chromatogr. (B), 2007, 848, 39l.
10. S. V. Gandhi, N. D. Dhavale, V. Y. Jadhav and S. S.
Sabnis, 1. AOAC Int .. 2008, 91, 33.

AI-Tamimi et at. : Kinetic spectrophotometric determination of escitalopram oxalate in bulk etc.
11. S. S. Singh, H. Shah, S. Gupta, M. Jain, K. Sharma, P. Thakkar and R. Shah, Chromatogr. (8), 2004, 811,
209.
12. U. Gutteck and K. M. Rentsch, Clin. Chem. Lab. Medic., 2003, 41, 1571.
13. N. Johannesson and J. Bergquist, ?harm. Biomed. Anal .. 2007. 43. 1045.
14. S. Victor, M. Alex. D. Yadim, A. Dan, V. Z. Louis and D. Anatoly, Clin. Chem. Lab. Med., 2007, 45,
513.
15. K. Fatema, M. Zakiur Rahman, S. Kumar Biswas and S. Akter. S. J. Pharm. Sci., 2010. 3. 4.
16. S. Sharma, H. Rajpurohit, C. Sonwal, A. Bhandari, Y. Chaudhary and T. Jain, J. Young Pharm., 2010, 2, 420.
17. T. Karuna, K. Neelima, G. Venkateshwar1u and P. Y. Swamy, J. Sci. Ind. Res., 2006, 65, 808.
18. T. Vetrichelvan, K. Arul, M. Sumithra and B. Umadevi,
Indian J. Pharm. Sci .. 2010, 72, 269.
19. R. B. Kakde and D. D. Satone, Indian J. Pharm. Sci ..
2009, 71. 702.
20. I. A. Darwish, J. Anal. Clwn., 2005, 551. 222.
21. Y. El-Shabrawy, N. El-Enany and K. Salem, Il Fannaco,
2004, 59, 803.
22. J. Rose, "Advanced Physicochemical Experiments".
Pitman, London, 1964, p. 348.
23. J. March, "Advanced Organic Chemistry", 2nd ed.,
Tokyo, 1977, p. 1111.
24. F. A. Ibrahim, F. A. Ali, S. M. Ahmed and M. M.
Tolba, Int. J. Biomed. Sci., 2007. 3. 20.
25. H. E. Abdellatef. J. Pharm. Biomed. Anal .. 2002. 29.
835.
26. R. Caulcutt and R. Boddy, "Statistics for Analytical
Chemists", Chapman and Hall, London, 1983.
317

318