This is the preprint of the contribution published as - Helmholtz ...
39
This is the preprint of the contribution published as: Zhou, J., Saeidi, N., Wick, L.Y., Kopinke, F.-D., Georgi, A. (2021): Adsorption of polar and ionic organic compounds on activated carbon: surface chemistry matters Sci. Total Environ. , art. 148508 The publisher’s version is available at: http://dx.doi.org/10.1016/j.scitotenv.2021.148508
-
Upload
khangminh22 -
Category
Documents
-
view
0 -
download
0
Transcript of This is the preprint of the contribution published as - Helmholtz ...

This is the preprint of the contribution published as: Zhou, J., Saeidi, N., Wick, L.Y., Kopinke, F.-D., Georgi, A. (2021): Adsorption of polar and ionic organic compounds on activated carbon: surface chemistry matters Sci. Total Environ. , art. 148508 The publisher’s version is available at: http://dx.doi.org/10.1016/j.scitotenv.2021.148508

1
Adsorption of polar and ionic organic compounds on activated carbon:
Surface chemistry matters
Jieying Zhoua, Navid Saeidia, Lukas Y. Wickb, Frank-Dieter Kopinkea, Anett Georgia,*
aHelmholtz Centre for Environmental Research – UFZ, Department of Environmental
Engineering, D-04318 Leipzig, Germany.
bHelmholtz Centre for Environmental Research – UFZ, Department of Envionmental
Microbiology, D-04318 Leipzig, Germany
Corresponding author contact information: Tel.: +49 341 235 1760; Fax: +49 341 235 1471;
E-mail: [email protected]
Keywords: AC, adsorption processes, surface modification, persistent and mobile organic
compounds, water treatment

2
Abstract
Persistent and mobile organic compounds (PMOCs) are often detected micropollutants in the
water cycle, thereby challenging the conventional wastewater and drinking water treatment
techniques. Carbon-based adsorbents are often less effective or even unable to remove this class
of pollutants. Understanding of PMOC adsorption mechanisms is urgently needed for advanced
treatment of PMOC-contaminated water. Here, we investigated the effect of surface
modifications of activated carbon felts (ACFs) on the adsorption of six selected PMOCs
carrying polar or ionic groups. Among three ACFs, defunctionalized ACF bearing net positive
surface charge at neutral pH provides the most versatile sorption efficiency for all studied
PMOC types representing neutral, anionic and cationic compounds. Ion exchange capacity
giving quantitative information of sorbent surface charges at specified pH is recognized as a
frequently underestimated key property for evaluating adsorbents aiming at PMOC adsorption.
A most recently developed prediction tool for Freundlich parameters in PMOC adsorption was
applied and the prediction results are compared to the experimental data. The comparison
demonstrates the so far underestimated importance of the sorbent surface chemistry for PMOC
adsorption affinity and capacity. PMOC adsorption mechanisms were additionally investigated
by adsorption experiments at various temperatures, pH values and electrolyte concentrations.
Exothermic sorption was observed for all sorbate-sorbent pairs. Adsorption is improved for
ionic PMOCs on AC carrying sites of the same charge (positive or negative) at increased
electrolyte concentration, while not affected for neutral PMOCs unless strong electron donor-
acceptor yet weak non-Coulombic interactions exist. Our findings will allow for better design
and targeted application of activated carbon-based sorbents in water treatment facilities.

3
1. Introduction
Almost a half of the European chemicals regulation (REACH) registered organic substances
with unique CAS numbers (including predicted hydrolysis products) exhibit highly polar, ionic
or ionizable structures (Arp et al., 2017; Arp and Hale, 2019). Among them, the compounds
with freshwater half-lifes longer than 40 days and soil organic carbon–water distribution
coefficients log DOC < 4.5 (at pH = 4–10) are referred to persistent and mobile organic
compounds (PMOCs) (Arp et al., 2017). Many of these compounds readily pass the
conventional water treatment processes and become increasingly detectable in aquatic
environments (Farré et al., 2008; Loos et al., 2013; Reemtsma et al., 2006; Schulze et al., 2019).
Although detected in low concentrations (ng/L – µg/L), they may recirculate and accumulate
in short water cycles (Arp et al., 2017; Teychene et al., 2020), raising considerable toxicological
concerns under long-term exposure (Arp et al., 2017; Farré et al., 2008; Fent et al., 2006; Ferrari
et al., 2003; Loos et al., 2013; Sinclair and Boxall, 2003; Sophia A and Lima, 2018; Thomaidi
et al., 2015).
In wastewater and drinking water treatment plants, adsorption technology is widely used due to
its advantages including flexibility in operation mode (batch or continuous processes),
operational simplicity, low investment costs and low environmental impact (EPA, 2020; Sophia
A and Lima, 2018; Watson, 1999). Activated carbon (AC) materials with specific surface areas
~103 m2/g are frequently used as adsorbents. Besides ozonation, AC adsorption is presently the
most broadly applied and recommended technique for upgrading wastewater treatment plants
(Decrey et al., 2020; Reemtsma et al., 2016).
The appearance of PMOCs in the aquatic environment points to a significant treatment gap in
the current wastewater and drinking water purification processes where higher adsorption
efficiency of AC adsorbents is urgently called for (Reemtsma et al., 2016). Being structurally
different from the conventional nonpolar organic pollutants, PMOCs can interact with the
4
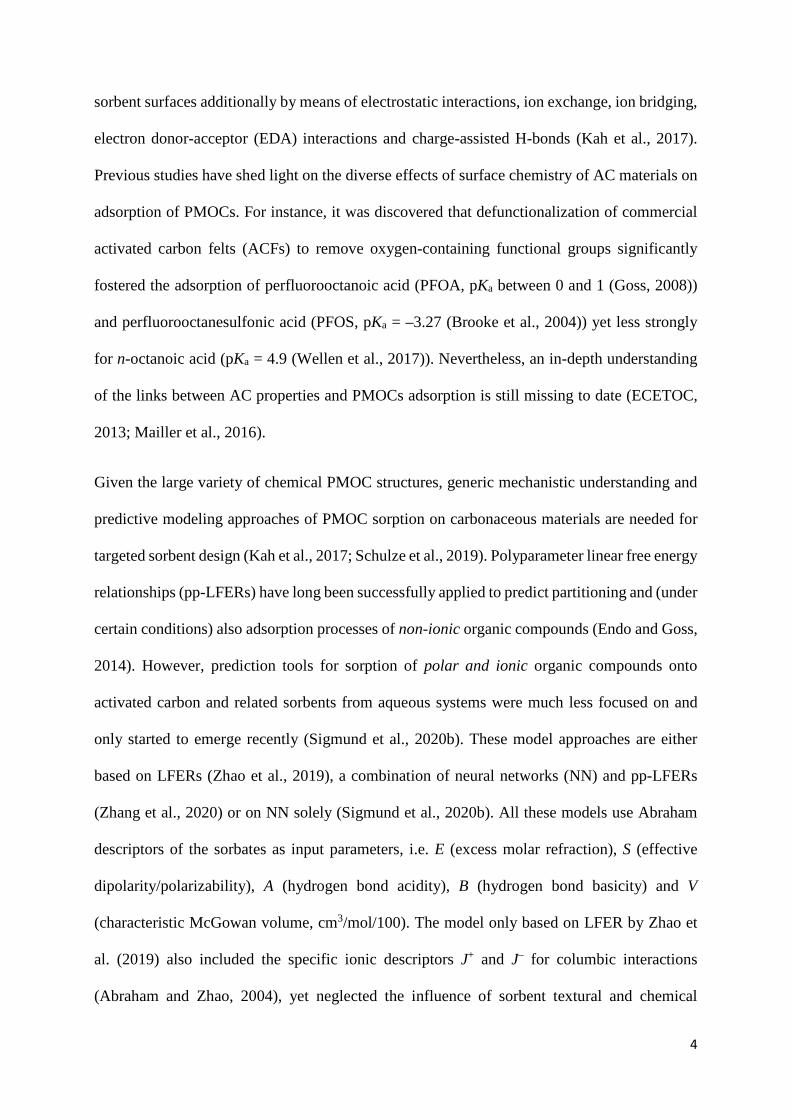
sorbent surfaces additionally by means of electrostatic interactions, ion exchange, ion bridging,
electron donor-acceptor (EDA) interactions and charge-assisted H-bonds (Kah et al., 2017).
Previous studies have shed light on the diverse effects of surface chemistry of AC materials on
adsorption of PMOCs. For instance, it was discovered that defunctionalization of commercial
activated carbon felts (ACFs) to remove oxygen-containing functional groups significantly
fostered the adsorption of perfluorooctanoic acid (PFOA, pKa between 0 and 1 (Goss, 2008))
and perfluorooctanesulfonic acid (PFOS, pKa = –3.27 (Brooke et al., 2004)) yet less strongly
for n-octanoic acid (pKa = 4.9 (Wellen et al., 2017)). Nevertheless, an in-depth understanding
of the links between AC properties and PMOCs adsorption is still missing to date (ECETOC,
2013; Mailler et al., 2016).
Given the large variety of chemical PMOC structures, generic mechanistic understanding and
predictive modeling approaches of PMOC sorption on carbonaceous materials are needed for
targeted sorbent design (Kah et al., 2017; Schulze et al., 2019). Polyparameter linear free energy
relationships (pp-LFERs) have long been successfully applied to predict partitioning and (under
certain conditions) also adsorption processes of non-ionic organic compounds (Endo and Goss,
2014). However, prediction tools for sorption of polar and ionic organic compounds onto
activated carbon and related sorbents from aqueous systems were much less focused on and
only started to emerge recently (Sigmund et al., 2020b). These model approaches are either
based on LFERs (Zhao et al., 2019), a combination of neural networks (NN) and pp-LFERs
(Zhang et al., 2020) or on NN solely (Sigmund et al., 2020b). All these models use Abraham
descriptors of the sorbates as input parameters, i.e. E (excess molar refraction), S (effective
dipolarity/polarizability), A (hydrogen bond acidity), B (hydrogen bond basicity) and V
(characteristic McGowan volume, cm3/mol/100). The model only based on LFER by Zhao et
al. (2019) also included the specific ionic descriptors J+ and J– for columbic interactions
(Abraham and Zhao, 2004), yet neglected the influence of sorbent textural and chemical

5
properties on PMOC adsorption. The model established by Zhang et al. (2020) by contrast
considers pore-filling and hydrophobic effects as adsorption drivers and, hence, includes total
pore volume (Vt) and BET-derived specific surface area (SBET) as sorbent-related input
parameters. These two sorbent-parameters are, however, highly correlated (Sigmund et al.,
2020a). This model is predominantly trained with sorption data on carbonaceous sorbents with
SBET ≥ 400 m2/g. Another most recently developed model by Sigmund et al. (2020b) is based
on the sorbent’s SBET and elemental composition (C wt%, H/C and O/C molar ratios) combined
with the sorbates’ log D, A- % or B+ % (pH-dependent percentage of anionic or cationic species,
respectively). Although many data on the elemental composition of C-based adsorbents of
moderate carbonization degree exist (e.g. for biochars), they are heavily missing for ACs
applied in sorption studies. As a result, only 55 out of 330 items in the training-set for anionic
and polar organic compounds used in (Sigmund et al., 2020b) exhibit SBET ≥ 400 m2/g. While
all three prediction tools deepen our understanding of PMOC sorption on carbon-based
materials, they are all affected by limitations in appropriate experimental literature data for
model training. Data shortages include (i) detailed characterization of AC sorbents and their ion
exchange capacities (Sigmund et al., 2020b), (ii) high-quality adsorption isotherm data, and (iii)
lack of adsorption studies on cationic organic compounds (“small and noisy data set’’ (Sigmund
et al., 2020b)).
In order to advance the presently limited knowledge on correlations between PMOC adsorption
and AC properties, we here studied for the first time the adsorption of six environmentally
relevant PMOCs on three types of ACFs of high specific surface area (SBET = 1100–1500 m2/g)
and similar porous structures yet distinct surface functionalities. The PMOC adsorbates consist
of three positively charged compounds (benzyltrimethylammonium (BTMA+),
benzyltriethylammonium (BTEA+), tetrapropyl-ammonium (TPA+)), an organic anion (p-
toluenesulfonate, p-TsO–, acid form with pKa < –1 (Guthrie, 1978; Sergeant and Dempsey,

6
1979)), and two neutral molecules (at pH 7; methyl-tert-butyl ether (MTBE), p-
toluenesulfonamide (p-TSA, pKa = 10.5 (Atwood and Steed, 2004))). According to Schulze et
al. (2018), MTBE, p-TsO-, and BTMA+ have a high environmental emission potential, i.e. were
ranked 3rd, 50th, and 313th out of 936 REACH registered PMOCs (Schulze et al., 2018).
Additionally, MTBE, p-TsO-, and BTMA+ are among the most persistent and mobile aquatic
PMOCs with freshwater half-lifes of >60 d, log Doc of <1 at pH = 4–10 and a water
solubility >10 g/L (Arp et al., 2017). Despite the high environmental relevance, very limited
adsorption studies on such PMOCs were performed and yet, except for MTBE adsorption on
15 different AC materials reported by Li et al. (2002), most previous studies did not focus on
the impact of the sorbent surface chemistry (Davarpanah et al., 2015; Duman and Ayranci, 2010;
Qi et al., 2013; Tamai et al., 2004; Wu et al., 2011). Herein, to analyze effects of AC surface
properties on the PMOCs’ sorption affinity and capacity, isotherms of individual sorbate-
sorbent pairs were measured at different temperature, electrolyte concentration and pH
conditions. To understand the role of AC surface chemistry for PMOC adsorption we further
fitted our data with Freundlich and Langmuir equations and compared them to results predicted
by the model suggested by Sigmund et al. (2020b).

7
2. Experimental section
2.1 Chemicals
p-TsO– (commercially available in form of C7H8O3S∙H2O, > 98.5%) and BTMA hydroxide
(C10H17NO, 20 w/w% aq.) were obtained from Alfa Aesar. p-TSA (C7H9NO2S, ≥99%) and TPA
hydroxide (C12H29NO, 1.0 M aq.) were purchased from Sigma-Adrich. MTBE (C5H12O, >99%)
and BTEA hydroxide (C13H23NO, 10 w/w% aq.) were acquired from Fluka Analytical and abcr
GmbH, respectively. Selected sorbate properties are listed in Table S1. Ethanol (EtOH,
≥99.9%), HNO3 (65%), HCl (37%), NaOH (99%), KCl (>99%), NaNO3 (>99%), Na2SO4 (99%),
CuSO4∙5H2O (>99%), citric acid monohydrate (C6H8O7∙H2O, >99%) and the ammonia solution
(25 w/w% aq.) were purchased from Merck. Methanol (>99.95%) and i-propanol (≥99.9%)
were obtained from Th.Geyer. Oxalic acid bis(cyclohexylidene hydrazide) (Cuprizone,
C14H22N4O2, > 98%) and ammonium acetate (C2H7NO2, ≥98.0%) were purchased from Bernd
Kraft GmbH. Deionized water was used to prepare all solutions.
2.2 Materials
Actitex®-FC1001 (Jacobi CARBONS, ACF10 in short, 30 cm2) was washed with i-propanol
(60 mL) and five times with H2O (60 mL, shaking at 120 rpm, 30 min) followed by air-drying
(80°C, overnight) before use or further treatment. The oxidized sample (OxACF10) was
prepared by stirring ACF10 (1.1 g) in HNO3 (5 M, 130 mL) at 95°C for 6 h. The as-treated
sample was then washed five times with H2O (shaking at 120 rpm, 30 min) until pH reached
approx. 6 and then air-dried (50°C, overnight). The defunctionalized sample (DeACF10) was
prepared by treating ACF10 in a quartz tubular oven at 900°C under H2 atmosphere for 2 h
(heating rate: 150 K/min, starting from 20°C, gas flow rate: 40 mL/min). Before heating, the

8
oven containing the sample was purged with N2 for 30 min and then with H2 for another 30 min.
After heating, the oven was cooled automatically to 100°C in H2, then to 20°C in N2.
2.3 Material characterization
The specific surface area (SBET) of the sorbents was measured with the BET method (N2 at 77
K) using BELSORP MINI (BEL Japen, Ltd.) with a sample pretreatment at 100°C. The
mesopore size distribution (Ø > 2 nm) was characterized by the BJH method. The size
distribution of the micropores (Ø < 2 nm) was determined using a magnetic suspension balance
(Rubotherm GmbH) by means of CO2 adsorption at 0°C and analysed by NLDFT fitting from
the software Pore analyser (Porotec GmbH). The point of zero net proton charge (pHPZC) of the
ACF samples was determined as reported (Babić et al., 1999). Cation and anion exchange
capacities (CEC and AEC) were determined as described earlier (Saeidi et al., 2020a; Zelazny
et al., 1996). The detailed procedures for pHPZC and CEC/AEC determination are given in SI.
Elemental analysis was performed using a CHN analyser (LECO TruSpec CHN). The oxygen
contents of the samples were calculated from the mass balance O wt% = 100% – C wt% – H
wt% – N wt% – ash wt%. The ash content was determined gravimetrically as residue after
burning the sample at 750°C in oxygen. Temperature-programmed desorption (TPD) results
were recorded on a BELCAT-B chemisorption analyser (BEL Japan Ltd.) coupled with an
Infralyt detector (SAXON Junkalor) for CO and CO2 detection. The ACFs were first pre-treated
at 150°C for 30 min in an argon atmosphere (50 mL/min), then heated up from 150°C to 1100°C
with a heating rate of 10 K/min. X-ray photoelectron spectroscopy (XPS) measurements were
performed by an Axis Ultra photoelectron spectrometer (Kratos Analytical Ltd.) using
monochromatized Al Kα radiation (hν = 1486.6 eV). For binding energy (BE) determination,
the main component of the C1s signal at 284.8 eV was employed as reference. Peak

9
deconvolution was performed with CasaXPS (http://www.casaxps.com/) by applying a Shirley
background and sums of Gaussian and Lorentzian functions for the fitting. The Attenuated total
reflection (ATR)-FTIR was performed on a Nicolet iS50R FR-IR device (ThermoFischer). The
morphology of ACFs was characterized using scanning electron microscopy (SEM) (Zeiss
Merlin VP Compact).
2.4 Adsorption experiments
0.1–4.0 g/L ACFs were shaken (120 rpm) for 24–48 h in aqueous Na2SO4 solution (1–100 mM,
8–10 mL) followed by pH adjustment with 0.1 M NaOH and/or H2SO4 solutions to desired
values. Such pre-wetting step allows background solution to penetrate the inner pores, making
them readily accessible for dissolved sorbates (Duman and Ayranci, 2010). Then, stock
solutions containing individual sorbate compounds (1–3 g/L) pre-neutralized to pH 7 were
added to the ACF-containing batches to reach desired initial concentrations (2.5 – 80 mg/L).
After shaking overnight at the selected temperatures (20°C, 40°C, 55°C, and 70°C, 400 rpm
with LLG-uniTHERMIX 2 pro), the pH values of the suspensions were adjusted back to desired
values. Temperature dependence was measured for exploring the impact of entropy and
enthalpy effects in the adsorption processes. For samples containing nonionic MTBE, the pH-
adjustment during the adsorption process was abandoned. Also, gas-liquid volume ratios <1:5
were set so that MTBE loss into the gas phase was negligible. After 48 h-adsorption at the
selected temperature, samples were taken and filtered with Whatman® syringe filters (0.45 µm,
PTFE), concentrated by evaporation of water under N2 or diluted when necessary, and used for
concentration measurement. The final pH values were detected in the range (± 0.5) close to the
desired values.

10
The single-point adsorption coefficient Kd (L/m2) indicating the adsorption affinity of the
sorbent towards the sorbate at a given condition was calculated as
𝐾𝐾d = 𝑞𝑞e𝑐𝑐e
(1)
where qe (µmol/m2) related to sorbent’s SBET is the sorbent loading and ce (µmol/L) the
concentration of dissolved solute in the aqueous phase at the adsorption equilibrium.
The adsorption isotherms of sorbate-sorbent pairs were fitted with linearized forms of
Freundlich (Eq. 2) and Langmuir equations (Eq. 3) expressed as follows,
log 𝑞𝑞e = 𝑛𝑛 ∙ log 𝑐𝑐e + log 𝐾𝐾F (2)
where n is the dimensionless Freundlich exponent and KF ((µmol/m2)/(µmol/L)n) is the
Freundlich constant (Aljerf, 2018). In addition, KF in unit of (µg/kg)/(µg/L)n is derived from
fittings using qe (µg/kg) related to adsorbent mass and ce (µg/L) to compare with the model
predictions in Section 3.2.4. Logarithms of parameters which carry units are to be understood
as numbers after dividing by these units.
𝑐𝑐e𝑞𝑞e
= 𝑐𝑐e𝑞𝑞max
+ 1𝑞𝑞max𝐾𝐾L
(3)
where qmax (µmol/m2) is the maximal (monolayer) sorbent loading and KL (L/µmol) the
Langmuir constant. Both KF and KL are related to the adsorption affinity of the sorbent towards
the selected sorbate while qmax represents the adsorption capacity. n 1 indicates a more
homogenous distribution of sorption sites on sorbent surface (Delpeux-Ouldriane et al., 2015;
Li et al., 2002).

11
2.5 Analytical methods
Aliquots of aqueous samples were taken using a syringes equipped with Whatman® (0.45 µm,
PTFE) filters before being measured. The analysis of p-TsO– and TPA+ was accomplished by
a liquid chromatography equipment coupled with a photo diode array UV/VIS detector and
single-stage mass spectrometer (MS) with electrospray ionization (LC-MS2020, SHIMADZU
Corporation). UV/VIS detection was applied for p-TsO– (λ = 220 nm) and the MS detector
operated in selected ion monitoring (SIM) mode with m/z = 186 amu was used for TPA+. The
concentrations of p-TSA were analysed by gas chromatography–mass spectrometry
(SHIMADZU GC–MS 2010) in SIM mode (m/z = 171 amu) after solvent extraction (for details
see SI part). MTBE concentrations were determined by Headspace-GC–MS analysis using a
SHIMADZU AOC-5000 Plus autosampler coupled to the above mentioned GC–MS operated
in SIM mode (m/z = 73 amu). The concentrations of dissolved BTMA+ and BTEA+ were both
measured by UV/VIS spectrometry (SHIMADZU UVmini-1240) at λ = 207 nm. Corresponding
blank samples without analytes were prepared for correcting the baseline. To measure the Cu2+
concentrations, 1–6 mL aliquots were added to a combination of 1 mL cuprizone solution (0.5
wt% in EtOH:H2O = 1:1 v/v) and 1 mL triammonium citrate-ammonia buffer ((NH4)3C6H5O7
–NH3, pH = 9) solution to form the copper-cuprizone complex absorbing intensively at 595 nm
(Messori et al., 2007). The mixture was shaken for 30 min (120 rpm) in darkness before diluted
to the concentration range 0.1–2 mg/L and analysed by UV/VIS spectrometry. More detailed
information of the measurements is given in the SI part.
12
3. Results and discussion
3.1 Characterization of ACFs
Derived from a commercially available ACF10, two surface-modified ACFs were prepared to
provide distinct sorbent properties for adsorption of selected polar organic compounds. All
three ACFs were carefully characterized for their bulk chemical composition, surface
functionalities and pore structures.
Elemental analyses were performed for all studied ACF types with results listed in Table 1.
HNO3 oxidation of ACF resulted a 1.8-fold increased O content (18.1 wt%) of OxACF10
relative to untreated ACF10 (9.9 wt%) while annealing of the original ACF10 in H2 flow at 900°C
for 2 h resulted in a significant reduction in the O content (4.3 wt%) of DeACF10. TPD was
performed to further characterize the O-containing functional groups (Fig. S1). Observed peaks
at T ≈ 800 K, 1000 K and 1100–1200 K in the CO release profiles can be assigned to the
destruction of aliphatic hydroxyl, phenolic hydroxyl and carbonyl groups, respectively (Vogel
et al., 2019). In CO2 release profiles, the peak around 500 K may refer to the decomposition of
carboxylic or anhydride groups (Vogel et al., 2019; Zhou et al., 2007) while CO2 release at
higher temperatures (700–1000 K) is likely to be derived from lactone groups (Zhou et al.,
2007). The ATR-FTIR spectra (Fig. S2) also confirm the origins of O-containing functional
groups on OxACF10. XPS high resolution C1s spectra (Fig. S3) show an increased peak
intensity relating to ππ* shake-up which implies higher contents of sp2 C and, accordingly,
more hydrophobic surfaces in the order of OxACF10 < ACF10 < DeACF10.
To quantify charged sites on ACF surfaces, the ion exchange capacities towards inorganic
cations and anions were characterized at circumneutral pH. Cation and anion exchange
capacities (CEC and AEC, respectively) give quantitative information on surface charge
densities of AC at a specified relevant pH. These are favoured compared to other parameters

13
used for describing AC surface chemistry, such as O-content which does not contain
information on the speciation of the O-containing groups or point-of-zero charge (pHPZC) which
only gives qualitative information on the predominant charge at pH ≠ pHPZC for heterogeneous
adsorbent surfaces. Distinct charge densities of the three ACF surfaces were found (Table 1).
Differences in ion exchange capacities were mainly attributed to O contents of the samples due
to the quasi absence of N in the ACFs (Yang, 2019). Generally, higher CEC were found in
ACFs carrying more O-containing functional groups and, hence, more negatively charged sites
at circumneutral pH. In contrast, higher AEC was found for oxygen-poor DeACF10. As
supported by the XPS spectra (Fig. S11), DeACF10 surface is rather rich in aromatic regions
free of O-containing functional groups, and possess highly delocalized π-electrons. Such
structures are prone to adsorb protons and form positively charged sites (Saeidi et al., 2020a).
The increase of the pHPZC of the ACFs was in the order of OxACF10 < ACF10 < DeACF10 and
relates to the order of the ACF ion exchange capacities. The CEC of the sorbents also reflects
well their capacity to retain Cu2+ (Table S2, Fig. S4).
Analysis of the textural properties (Table 2) revealed for all three ACF high specific surface
areas (> 1000 m2/g) as obtained from N2 BET analyses (SBET) suggesting high PMOC sorption
capacities. 93% of SBET is maintained for DeACF10 after thermal treatment in H2 at 900°C,
whereas a 27% loss in SBET was found for OxACF10 after oxidizing with hot HNO3 solution.
The N2 adsorption-desorption isotherms of all ACFs (Fig. S5a) resemble the IUPAC Type I
isotherm (Sing et al., 1985) typically observed for microporous AC materials. The narrow
hysteresis loops further indicate a predominance of micropores in all ACFs (Alothman, 2012;
Lee et al., 2013; Zhao et al., 2016). Analysis of the pore volume distributions of the ACFs (Fig.
S5b) reveals that oxidation of the ACF10 led to a decrease in the fraction of micropores (Ø < 2
nm) likely due to pore blocking by O-containing surface functional groups (Bayram and

14
Ayranci, 2011; Hotová et al., 2020), and accordingly a reduced SBET. The morphology of the
three ACFs is shown in SEM images (Fig. S6).
3.2 PMOCs adsorption
3.2.1 Adsorption affinities and capacities of ACFs towards PMOCs
Adsorption isotherms in 10 mM Na2SO4 solution at pH 7 (Fig. S7) were determined to quantify
PMOC adsorption affinities (Kd) and capacities (qmax) to the ACFs. All isotherms were fitted
by both the Freundlich equation (Eq. 2) in the low ce range (i.e. below saturation loading, Fig.
S8) and by Langmuir equation (Eq. 3) in the whole data range (Fig. S9) as summarized in Table
3. Log Kd for all sorbate-sorbent pairs at ce = 20 µmol/L (Fig. 1) were calculated from the
Freundlich parameters by Kd = cen-1∙KF (cf. Eqs. 1 & 2).
As described in Section 3.1, all three ACF sorbents studied carry porous structures dominated
by micropores. Based on the characterization results given in Table 2, the total pore volumes
on unit specific surface ((0.45 ± 0.07) mm3/m2) are comparable for all three ACFs. Although
the pore size distribution differs for the three ACF types, these differences should not result in
large varieties in adsorption capacities towards target PMOCs (Table 3) due to the only minor
to moderate pore filling extents as elucidated below. For instance, TPA+ exhibits the largest van
der Waals molecular volume (≈ 139.8 cm3/mol) and molecule size (0.63–0.97 nm (Tamai et al.,
2004)) of all tested PMOCs. However, TPA+ exhibited higher sorption to OxACF10 (qmax = 0.18
µmol/m2) than to DeACF10 (qmax = 0.13 µmol/m2) although the VØ ≥ 1 nm of OxACF10 was found
to be about 50% lower than in DeACF10 (Table 2). With a simplified assumption that TPA+
molecules solely enter pores of Ø ≥ 1 nm, only about 7.9% of pores with Ø ≥ 1 nm of OxACF10
would be occupied (for calculation cf. SI). Similarly, we estimated the maximal pore filling
extents of all sorbates in pores with Ø ≥ 1 nm of OxACF10, ACF10 and DeACF10 (Table S3).

15
As-obtained data show that the pores were occupied between 0.7 and 32%, suggesting that the
sorbent pore volumes may not be the limiting factor for PMOC sorption to the ACFs.
Kd and qmax values propose distinct PMOC sorption to the ACFs; in particular for anionic p-
TsO– and neutral p-TSA and MTBE. For instance, p-TSA and MTBE adsorption affinities (log
Kd; Fig. 1) and the maximum adsorption capacities (qmax; Table 3) follow the order of DeACF10 >
ACF10 > OxACF10. Two factors may explain these findings: (i) increasing polarity of the
sorbent surfaces due to oxidation penalizes the organic sorbates in the competition with water
molecules for adsorption. (ii) Additional EDA interactions between the lone electron pairs of
the p-TSA and MTBE heteroatoms and the protonated DeACF10 surface as had been previously
reported for MTBE (Li et al., 2002). p-TSA, however, was adsorbed with higher sorption
affinities on all ACFs than MTBE despite its lower log D which shall indicate a weaker
hydrophobic effect (Table S1, Kah et al., 2017). This is likely due to additional π-π interactions
(Wu et al., 2011) of p-TSA. Furthermore, charge-assisted hydrogen bonds ((±) CAHB, being
relevant at ∆pKa < 5 (Li et al., 2013; Teixidó et al., 2011)) between p-TSA (pKa = 10.5) and
ACF surfaces (carboxyl groups with pKa = 3–6 (Strelko et al., 2002) and phenolic groups with
pKa = 8–10 (Xiao and Pignatello, 2016)) might contribute as well. However, the strong increase
in Kd and qmax of p-TSA upon defunctionalization of the carbon surface rather speaks for a
minor contribution of (±) CAHB to its overall sorption.
Adsorption of charged PMOCs requires charge compensation either by oppositely charged sites
on adsorbent surface (ion exchange) or co-adsorption of charge-balancing counter ions from
the electrolyte solution (Kah et al., 2017; Schwarzenbach et al., 1993). As a measure of the
surface charging state of AC surfaces, CEC and AEC values are highly relevant and
recommended to be measured, yet largely missing in the literature pool (Kah et al., 2017;
Sigmund et al., 2020b). Different to the pHPZC which only gives qualitative information on the
net surface charge, CEC and AEC provide quantitative information on the content of negatively

16
and positively charged surface sites, respectively, at a certain pH value. Since the CEC of the
ACFs was OxACF10 > ACF10 >> DeACF10 (Table 1), better sorption of the cationic PMOCs to
OxACF10 than to DeACF10 could be expected. However, rather similar qmax and log Kd of TPA+,
BTMA+ and BTEA+ were found for all ACFs (Table 3, Fig. 1) despite the low CEC of the
defunctionalized and net positively charged DeACF10 surface. Only for BTMA+, i.e., the
smallest cationic PMOC under study, slightly higher log Kd and qmax were observed on
OxACF10. This points at the relevance of hydrophobicity as a driving force for sorption and
may also explain why adsorption capacities of TPA+, BTMA+ and BTEA+ (≥0.1 µmol/m2) were
higher than the CECs of oxygen-poorer ACF10 and DeACF10. Also, cation-π EDA interactions
might cause additional promoting effects in the adsorption of cationic PMOCs on AC surfaces
containing a higher density of π systems (Kah et al., 2017). On the contrary, the qmax of the
cationic PMOCs was 50–80% lower than the CEC of OxACF10 following the order of TPA+ <
BTEA+ < BTMA+ (<Cu2+ that accounted for 87% of CEC, cf. Fig. S4, Table S2). The high qmax
of cationic PMOCs beyond sorbents’ CECs suggest a strong contribution of hydrophobic effects,
i.e. the combination of van der Waals forces and solvophobic effects, to the overall sorption
due to the relatively bulky non-polar parts in their molecule structure. Such interactions could
even overcompensate the net negative charge effects of ACF10 surface, as has been described
for sorption of alkyl ammonium cations of varying chain lengths to inorganic sorbents
(Schwarzenbach et al., 1993). So far, however, systematic studies on similar effects on PMOC
adsorption to AC materials are missing. Our results suggest that the reversal of sorbent surface
net charge by adsorption of PMOCs depends on the AC surface chemistry: cationic PMOCs
can be more easily accommodated beyond sorbents’ CECs as found for hydrophobic ACF10
and DeACF10, but not for hydrophilic OxACF10. One possible reason for the unexpectedly weak
charge effects with cationic sorbates might be the shielding of the positive charge by four more
or less bulky substituents, which may prevent a close approach of the N atom to negatively
charged surface sites. Anionic sorbates such as p-TsO– are not affected in a similar way.

17
Contrary to the cationic PMOCs, the qmax of negatively charged p-TsO– to all ACFs was larger
than the sorbents’ AECs (Tables 1 & 3) again indicating a superposition of non-Coulombic
(hydrophobic) and anion exchange interactions between p-TsO– and ACF surfaces. The qmax
decreases in the order of DeACF10 > ACF10 >> OxACF10 (Table 3) and reflects the simultaneous
decrease in hydrophobicity and increased number of repulsive negatively charged sites (higher
CEC) of OxACF10 surface. Kd and qmax of p-TsO–, however, were significantly lower than of
its uncharged derivative p-TSA (Fig. 1, Table 3) and exhibited more pronounced differences
for the differently treated ACFs. This suggests a minor contribution of negative (-) CAHB
between p-TsO- (pKa = –1.3) and the carboxyl groups of OxACF10 (pKa = 3–6) which should
otherwise promote the adsorption, and emphasizes the combination of electrostatic and
hydrophobic effects as drivers for the sorption of anionic PMOCs. Our findings support recent
studies on the sorption trends of anionic per- and polyfluoroalkyl substances (PFAS) (Saeidi et
al., 2020a; Zhi and Liu, 2016).
3.2.2 Effect of temperature on adsorption of selected PMOCs
To separate enthalpic and entropic contributions of adsorption, adsorption experiments at
different temperatures were performed for TPA+, BTMA+, p-TsO– and p-TSA and interpreted
using a modified van’t Hoff equation. The van’t Hoff equation (Liu, 2009) links Kads as
adsorption equilibrium constant with ∆Hads and ∆Sads as adsorption enthalpy and entropy.
𝑙𝑙𝑛𝑛 𝐾𝐾𝑎𝑎𝑎𝑎𝑎𝑎 = −∆𝐻𝐻abs𝑅𝑅𝑅𝑅
+ ∆𝑆𝑆abs𝑅𝑅
(4)
Note that there is an ongoing debate on the correct equilibrium constants to be applied in Eq. 4
for adsorption to solid surfaces (which in principle should be unit-free) (Liu, 2009; Tran et al.,
2017). However, it becomes insignificant when aiming at values for adsorption enthalpy only.

18
Thus, we apply a simplified approach, replacing Kads by Kd, i.e., the single-point adsorption
coefficient in the low sorbent loading range (q << qmax) to give a modified van’t Hoff equation.
We consider the derived adsorption enthalpies (∆Hads = –R‧d(ln Kd)/d(1/T)) as ‘apparent’ ones,
being aware of the limited thermodynamic significance of these values. The calculated values
are in the range from ∆Hads = 0 for adsorption of TPA+ on OxACF10 to –38 kJ/mol for
adsorption of p-TsO– on DeACF10.
Exothermic sorption was observed for all sorbate-sorbent pairs, with less steep slopes (i.e. less
exothermic adsorption) for adsorption to OxACF10 than to DeACF10 (Fig. 2). Especially,
adsorption of cationic TPA+ and BTMA+ on OxACF10 was found to be quasi thermoneutral.
Although these sorbates should experience improved electrostatic attraction with the oxidized
carbon surface, sacrificed non-Coulombic interactions on the more hydrophilic sorbent took
over. Our findings are in accordance with previous results (Duman and Ayranci, 2010) which
showed that adsorption of BTMA+ and BTEA+ onto microporous activated carbon cloth was
dominated by hydrophobic effects. Entropy seems to be an important driving force for
adsorption of the organic cations to the oxidized ACF surface, as most obvious for BTMA+
where OxACF10 shows the lowest slope (lowest ∆Hads) but still highest Kd .
Defunctionalization of the ACF generally had minor impacts on the slopes of van’t Hoff plots
for neutral and cationic PMOCs, yet clearly enhanced the ∆Hads of p-TsO–. Here, the
superposition of improved van der Waals forces, π-π and n-π EDA interactions and attractive
Coulombic interactions (with protonated π-electron systems) leads to a more exothermic
process.

19
3.2.3 Effect of the ionic strength and pH on adsorption
Ionic strength (IS): applying background electrolyte (Na2SO4) with increasing concentrations
from 1 mM to 100 mM may influence adsorption of polar and ionic organic compounds by: (i)
increased competition for sorption sites by inorganic ions (Kah et al., 2017; Saeidi et al., 2020a),
(ii) higher shielding of the sorbent’s ion exchange sites due to a compressed electric double
layer (EDL) (Brown et al., 2016), and (iii) increased chemical activity of dissolved sorbates by
possible salting-out effect (Xiao et al., 2005). As salting-out effects were estimated to cause
effects on log Kd of < ±0.02 (Schwarzenbach et al., 1993), they are considered negligible for
our interpretation and thus are not further considered.
As shown in Fig. 3, poor influence of the salt concentration on log Kd of p-TSA adsorption for
any of the ACF was found. This indicates that the strong p-TSA adsorption to ACF is mainly
driven by non-Coulumbic interactions. In contrast, Kd of MTBE on DeACF10 decreased slightly
at increasing ionic strengths. Contrary to likewise neutral p-TSA, MTBE has no π-electron
system to interact with the ACF surface, and the EDA interactions may be hindered either by
competitive sorption of SO42– or increased shielding of sorption sites. On OxACF10, increasing
IS suppressed adsorption of cationic TPA+ and BTMA+, whereas the anionic p-TsO– adsorbed
more strongly. These opposite effects can be explained by the same mechanism: joint effect of
EDL compression and competing Na+ adsorption at the negatively charged OxACF10 surface
aroused a weakening of attractive or repulsive electrostatic interactions for cationic and anionic
PMOCs, respectively. Similar reasons account for the changes in log Kd on DeACF10 for
charged PMOCs upon IS change (Saeidi et al., 2020a).
The effect of solution pH (at 4, 7 and 9) on the adsorption of selected PMOCs on OxACF10 and
DeACF10 is shown in Fig. S10. Decreasing pH from 9 to 4 moderately reduced the adsorption
of TPA+ and BTMA+ on OxACF10 (Fig. S10a). Since pHPZC of OxACF10 is 2.4, the sorbent

20
surface keeps a negative net charge at pH 4 while the density of negatively charged surface sites
increases at higher pH, which clearly benefits the uptake of the cationic PMOCs. Accordingly,
the adsorption affinity of p-TsO– on DeACF10 (pHPZC = 10.2) increases when decreasing pH
from 9 to 4 due to enhanced electrostatic interactions (Fig. S10b). In comparison, no change in
log Kd in the adsorption of neutral p-TSA on DeACF10 was observed at different pH values as
expected. The effect of a broader pH range on adsorption of especially weak organic acids and
bases was reported to be studied using the bell-shape relationship (Xiao and Pignatello, 2014).
In summary, increases in IS improved adsorption if solutes and net charges of the sorbent
surface were of the same sign (positive or negative), while increased IS hindered adsorption if
charges were of opposite signs. IS effects on neutral compounds were found only in case of
strong EDA yet weak non-Coulombic interactions.
3.2.4 Comparison of experimental data with model predictions
Our experimental PMOC sorption data were compared to model predictions (Sigmund et al.,
2020b) adapted for the adsorption of polar organic compounds to carbonaceous materials. As
Abraham parameters of ionic compounds are poorly accessible, the comparison was done for
MTBE, p-TsO– and p-TSA with Abraham parameters (of their neutral forms) available from
the UFZ LSER database (Ulrich et al., 2017) as also proposed by Sigmund et al. (2020b). We
further included previously published data on octanoic acid (OCA, pKa = 4.9 (Wellen et al.,
2017)) (Saeidi et al., 2020b) and MTBE adsorption (Li et al., 2002). Fig. 4 shows the
comparison of Log KF and n as these two Freundlich parameters are separately predicted for
each sorbate-sorbent pair by Sigmund et al. (2020b).
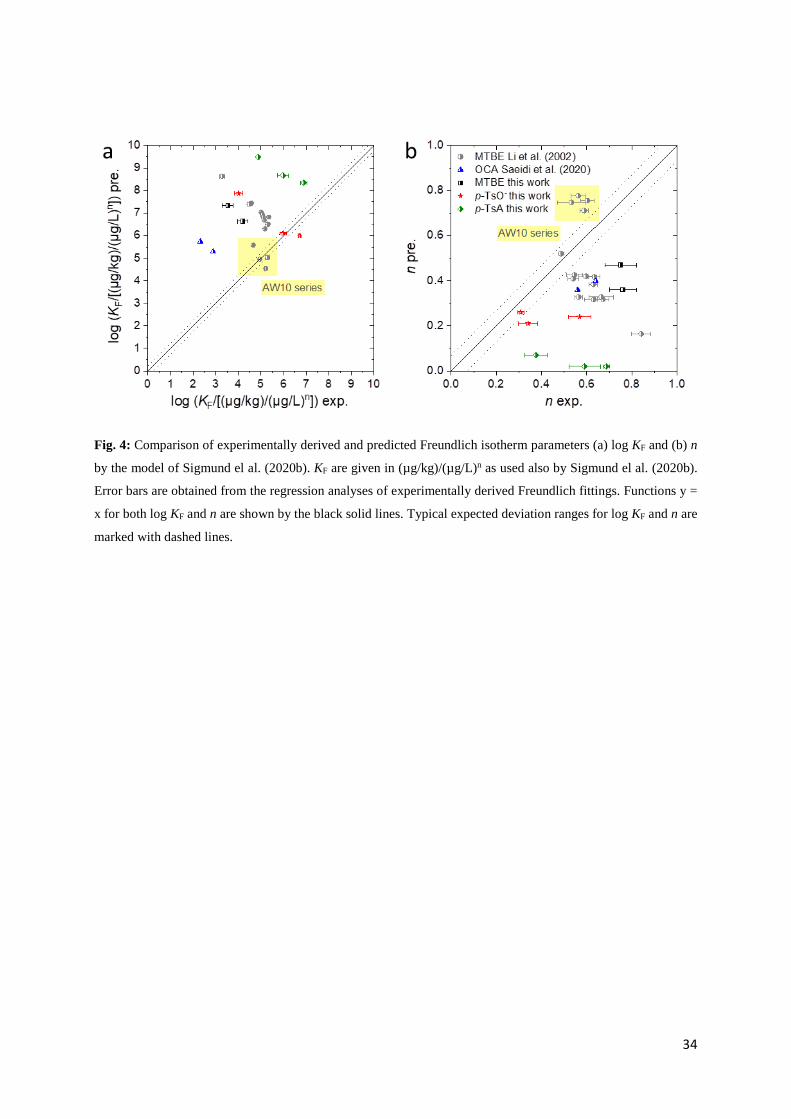
Generally, Fig. 4 reveals higher predicted log KF coupled with lower predicted n than
experimental-derived ones. In a few cases, for instance among the 17 sets of MTBE adsorption

21
data compared, the most successful matches were found on AW10 carbon series (incl. oxidized
OAW10, H2-treated HAW10, NH3-treated AAW10 and pristine AW10 reported in (Li et al.,
2002)) carrying SBET < 850 m²/g (Fig. 4, SI S4 and SI Excel-file). In contrast, unreasonably high
log KF, pre > log KF, exp + 1 were observed on other AC-based sorbents carrying SBET > 1100 m²/g
(cf. SI S4). The observed mismatch may be explained by the fact that the model was trained
heavily with biochar sorbents of relatively low SBET (83% datasets with SBET < 400 m2/g) as
datasets with well characterized AC carrying high SBET are often hard to find in the literature.
As SBET was found to be the key property among all 12 input parameters to predict KF and n for
anionic and neutral PMOCs according to Sigmund et al. (2020b), results in Fig. 4 suggest that
further model training involving well-characterized AC materials of high SBET is needed for
successful prediction of PMOC in large-scale water treatment facilities.
Next, we tested if the model allows predicting the effect of changes of ACF’s surface chemistry
on PMOC adsorption. Although predicted and experimental log Kd values for adsorption of p-
TsO– to ACF10 and p-TSA to ACF10 and DeACF10 were comparable (Fig. 5), the model
generally failed to predict the poorer adsorption of PMOCs to ACFs with higher O-contents
(i.e. ACFs of more elevated CEC and higher negative surface charge densities at neutral pH).
This suggests that sorbent surface chemistry impacts may need to be better considered by the
model. As proposed by Sigmund et al. (2020b), model improvements may implement EDA and
electrostatic interactions between sorbents and sorbates and, hence, also consider parameters
describing sorbent surface charge. Although ion exchange capacities more precisely quantify
charges at a sorbent’s surface at specified pH than commonly used O/C ratios, total acidity or
pHpzc, they are yet rare to find in literature. In addition, an inclusion of appropriate descriptors
for ionic PMOCs may be required as the current model applies Abraham parameters for
uncharged compounds only (Abraham and Zhao, 2004; Zhang et al., 2020; Zhao et al., 2019).
Involvement of ionization degrees A– % and B+ % solely might not fully solve the problem as
implied by the distorted predicted trends. Finally, comprehensive characterization of the

22
sorbents beyond ion exchange properties may be useful for updating prediction models.
Nevertheless, a compromise between practical applicability (easily approachable AC
characteristics which can be potentially offered by AC suppliers) and precision of prediction is
certainly required.
23
4. Conclusion
In the present study, surface chemistry of AC is identified as an important factor for adsorption
performance especially towards ionic and ionizable PMOCs. Surface-defunctionalized ACF
was found to promise the widest application potential to adsorb neutral, anionic and cationic
PMOCs among three tested ACFs. The defunctionalization creates a rather hydrophobic carbon
surface carrying positively charged sites which specifically improves the adsorption of anionic
PMOCs, while benefiting the adsorption of all probed PMOCs including the studied quaternary
amines. Therefore, surface defunctionalization can work as a universal strategy to facilitate the
removal of a wide range of diverse PMOCs simultaneously meanwhile to extend fixed-bed
adsorber operation times or reduce required dosage of powdered AC in WWTPs.
In contrast, surface oxidation of AC as a means to increase density of negative charges results
in higher surface polarity which is clearly detrimental for adsorption of p-TSA, p-TsO– and
TPA+ due to enhanced competitive adsorption of water molecules to AC surface. However, it
selectively enhanced the adsorption of BTMA+, i.e., the probed cationic PMOC with the
smallest number of carbon atoms and the lowest log D. It is thus tentatively suggested that a
threshold limit in the size of the hydrophobic part of cationic PMOCs exists, below which
oxidized AC surfaces can benefit their adsorption due to intensified electrostatic attraction.
Our work further demonstrates that the challenges in prognosis of the complicated PMOC
sorption behaviors on AC sorbents are not fully conquered by the state-of-the-art prediction
tools, which evidently underestimates the impact of sorbent surface chemistry. Our findings
alert that standardized quantitative parameters describing AC surface chemistry are needed
which should be commonly reported in scientific studies and finally also in product sheets by
AC producers. Such parameters can be applied as input for the improvement of sorption
prediction models for newly emerging PMOCs. In this respect, ion exchange capacity which
quantifies sorbent surface charges at specified pH is recommended as a meaningful parameter.

24
Acknowledgement:
We acknowledge the funding by Deutsche Forschungsgemeinschaft GE 3029/1‑1 and the
funding within the PhD-college STROMER of Thematic Area Environmental Engineering and
Biotechnology of UFZ. We acknowledge Dr. Marcus Lange, Dr. Jens Möllmer, Dr. Hans Uhlig
at Institut für Nichtklassische Chemie e.V. (INC), Leipzig, for CO2 adsorption measurement;
M.Sc. Andrea Prager at Leibniz Institute of Surface Engineering (IOM), Leipzig, for XPS
determination; Dr. Ulf Roland and Dr. Frank Holzer for the ATR-FTIR measurement; Dr.
Gabriel Sigmund at University of Vienna for fruitful discussions; and B.Sc. Ruonan Qin for
assisting the work as an internship student on the adsorption of MTBE. We are thankful for the
use of SEM at the Centre for Chemical Microscopy (ProVIS) at UFZ, which is supported by
European Regional Development Funds (EFRE-Europe funds Saxony) and the Helmholtz
Association.

25
References
Abraham M.H., Zhao Y.H., 2004. Determination of solvation descriptors for ionic species: hydrogen bond acidity and basicity. J. Org. Chem. 69, 4677-4685.
Aljerf L., 2018. High-efficiency extraction of bromocresol purple dye and heavy metals as chromium from industrial effluent by adsorption onto a modified surface of zeolite: kinetics and equilibrium study. J. Environ. Manage. 225, 120-132.
Alothman Z., 2012. A review: fundamental aspects of silicate mesoporous materials. Materials 5, 2874-2902.
Arp H.P.H., Brown T.N., Berger U., Hale S.E., 2017. Ranking REACH registered neutral, ionizable and ionic organic chemicals based on their aquatic persistency and mobility. Environ. Sci.: Process. Impacts. 19, 939-955.
Arp H.P.H., Hale S.E., 2019. REACH: Improvement of guidance and methods for the identification and assessment of PMT/vPvM substances, Umweltbundesamt, https://www.umweltbundesamt.de/publikationen/reach-improvement-of-guidance-methods-for-the (accessed 1 June 2021).
Atwood J.L., Steed J.W., 2004. Encyclopedia of Supramolecular Chemistry Vol 1, CRC Press, New York.
Babić B.M., Milonjić S.K., Polovina M.J., Kaludierović B.V., 1999. Point of zero charge and intrinsic equilibrium constants of activated carbon cloth. Carbon 37, 477-481.
Bayram E., Ayranci E., 2011. A systematic study on the changes in properties of an activated carbon cloth upon polarization. Electrochim. Acta 56, 2184-2189.
Brooke D., Footitt A., Nwaogu T.A., 2004. Environmental risk evaluation report: Perfluorooctanesulphonate (PFOS) https://www.gov.uk/government/uploads/system/uploads/attachment_data/file/290857/scho1009brbl-e-e.pdf (accessed 1 June 2021).
Brown M.A., Goel A., Abbas Z., 2016. Effect of electrolyte concentration on the Stern layer thickness at a charged interface. Angew. Chem. Int. Ed. 55, 3790-3794.
Davarpanah M., Ahmadpour A., Rohani-Bastami T., Dabir H., 2015. Synthesis and application of diethanolamine-functionalized polystyrene as a new sorbent for the removal of p-toluenesulfonic acid from aqueous solution. J. Ind. Eng. Chem. 30, 281-288.
Decrey L., Bonvin F., Bonvin C., Bonvin E., Kohn T., 2020. Removal of trace organic contaminants from wastewater by superfine powdered activated carbon (SPAC) is neither affected by SPAC dispersal nor coagulation. Water Res. 185, 116302.

26
Delpeux-Ouldriane S., Gineys M., Cohaut N., Béguin F., 2015. The role played by local pH and pore size distribution in the electrochemical regeneration of carbon fabrics loaded with bentazon. Carbon 94, 816-825.
Duman O., Ayranci E., 2010. Adsorptive removal of cationic surfactants from aqueous solutions onto high-area activated carbon cloth monitored by in situ UV spectroscopy. J. Hazard. Mater. 174, 359-367.
ECETOC, 2013. Environmental exposure assessment of ionizable organic compounds -technical report No. 123. European Centre for Ecotoxicology and Toxicology of Chemicals, Brussels. https://www.ecetoc.org/publication/tr-123-environmental-risk-assessment-of-ionisable-compounds/ (accessed 1 June 2021).
Endo S., Goss K.-U., 2014. Applications of polyparameter linear free energy relationships in environmental chemistry. Environ. Sci. Technol. 48, 12477-12491.
EPA, 2020. United Staates Environmental Protection Agency: Drinking water treatment technology unit cost models and overview of technologies https://www.epa.gov/sdwa/drinking-water-treatment-technology-unit-cost-models-and-overview-technologies (accessed 16 April 2021).
Farré M.l., Pérez S., Kantiani L., Barceló D., 2008. Fate and toxicity of emerging pollutants, their metabolites and transformation products in the aquatic environment. TrAC Trends Anal. Chem. 27, 991-1007.
Fent K., Weston A.A., Caminada D., 2006. Ecotoxicology of human pharmaceuticals. Aquat. Toxicol. 76, 122-159.
Ferrari B.t., Paxéus N., Giudice R.L., Pollio A., Garric J., 2003. Ecotoxicological impact of pharmaceuticals found in treated wastewaters: study of carbamazepine, clofibric acid, and diclofenac. Ecotoxicol. Environ. Saf. 55, 359-370.
Goss K.-U., 2008. The pKa values of PFOA and other highly fluorinated carboxylic acids. Environ. Sci. Technol. 42, 456-458.
Guthrie J.P., 1978. Hydrolysis of esters of oxy acids: pKa values for strong acids; Brønsted relationship for attack of water at methyl; free energies of hydrolysis of esters of oxy acids; and a linear relationship between free energy of hydrolysis and pKa holding over a range of 20 pK units. Can. J. Chem. 56, 2342-2354.
Hotová G., Slovák V., Zelenka T., Maršálek R., Parchaňská A., 2020. The role of the oxygen functional groups in adsorption of copper (II) on carbon surface. Sci. Total Environ. 711, 135436.
Kah M., Sigmund G., Xiao F., Hofmann T., 2017. Sorption of ionizable and ionic organic compounds to biochar, activated carbon and other carbonaceous materials. Water Res. 124, 673-692.

27
Lee K.J., Miyawaki J., Shiratori N., Yoon S.-H., Jang J., 2013. Toward an effective adsorbent for polar pollutants: formaldehyde adsorption by activated carbon. J. Hazard. Mater. 260, 82-88.
Li L., Quinlivan P.A., Knappe D.R.U., 2002. Effects of activated carbon surface chemistry and pore structure on the adsorption of organic contaminants from aqueous solution. Carbon 40, 2085-2100.
Li X., Pignatello J.J., Wang Y., Xing B., 2013. New insight into adsorption mechanism of ionizable compounds on carbon nanotubes. Environ. Sci. Technol. 47, 8334-8341.
Liu Y., 2009. Is the free energy change of adsorption correctly calculated? J. Chem. Eng. Data 54, 1981-1985.
Loos R., Carvalho R., António D.C., Comero S., Locoro G., Tavazzi S., et al., 2013. EU-wide monitoring survey on emerging polar organic contaminants in wastewater treatment plant effluents. Water Res. 47, 6475-6487.
Mailler R., Gasperi J., Coquet Y., Derome C., Buleté A., Vulliet E., et al., 2016. Removal of emerging micropollutants from wastewater by activated carbon adsorption: experimental study of different activated carbons and factors influencing the adsorption of micropollutants in wastewater. J. Environ. Chem. Eng. 4, 1102-1109.
Messori L., Casini A., Gabbiani C., Sorace L., Muniz-Miranda M., Zatta P., 2007. Unravelling the chemical nature of copper cuprizone. Dalton Trans., 2112-2114.
Qi Y., Jin X., Yu C., Wang Y., Yang L., Li Y., 2013. A novel chelating resin containing high levels of sulfamine group: preparation and its adsorption characteristics towards p-toluenesulfonic acid and Hg(II). Chem. Eng. J. 233, 315-322.
Reemtsma T., Berger U., Arp H.P.H., Gallard H., Knepper T.P., Neumann M., et al., 2016. Mind the gap: persistent and mobile organic compounds—water contaminants that slip through. Environ. Sci. Technol. 50, 10308-10315.
Reemtsma T., Weiss S., Mueller J., Petrovic M., González S., Barcelo D., et al., 2006. Polar pollutants entry into the water cycle by municipal wastewater: a european perspective. Environ. Sci. Technol. 40, 5451-5458.
Saeidi N., Kopinke F.-D., Georgi A., 2020a. Understanding the effect of carbon surface chemistry on adsorption of perfluorinated alkyl substances. Chem. Eng. J. 381, 122689.
Saeidi N., Kopinke F.-D., Georgi A., 2020b. What is specific in adsorption of perfluoroalkyl acids on carbon materials? Chemosphere, 128520.
Schulze S., Sättler D., Neumann M., Arp H.P.H., Reemtsma T., Berger U., 2018. Using REACH registration data to rank the environmental emission potential of persistent and mobile organic chemicals. Sci. Total Environ. 625, 1122-1128.

28
Schulze S., Zahn D., Montes R., Rodil R., Quintana J.B., Knepper T.P., et al., 2019. Occurrence of emerging persistent and mobile organic contaminants in European water samples. Water Res. 153, 80-90.
Schwarzenbach R.P., Gschwend P.M., Imboden D.M., 1993. Environmental Organic Chemistry, John Wiley & Sons, Inc., New York.
Sergeant E.P., Dempsey B., 1979. Ionisation constants of organic acids in aqueous solution. IUPAC chemical data series No. 23, Pergamon Press, New York.
Sigmund G., Gharasoo M., Hüffer T., Hofmann T., 2020a. Comment on predicting aqueous adsorption of organic compounds onto biochars, carbon nanotubes, granular activated carbons and resins with machine learning. Environ. Sci. Technol. 54, 11636-11637.
Sigmund G., Gharasoo M., Hüffer T., Hofmann T., 2020b. Deep learning neural network approach for predicting the sorption of ionizable and polar organic pollutants to a wide range of carbonaceous materials. Environ. Sci. Technol. 54, 4583–4591.
Sinclair C.J., Boxall A.B.A., 2003. Assessing the ecotoxicity of pesticide transformation products. Environ. Sci. Technol. 37, 4617-4625.
Sing K.S.W., Everett D.H., Haul R.A.W., Moscou L., Pierotti R.A., Rouquerol J., et al., 1985. Reporting physisorption data for gas/solid systems with special reference to the determination of surface area and porosity (recommendations 1984). Pure Appl. Chem. 57, 603-619.
Sophia A.C., Lima E.C., 2018. Removal of emerging contaminants from the environment by adsorption. Ecotoxicol. Environ. Saf. 150, 1-17.
Strelko V., Malik D.J., Streat M., 2002. Characterisation of the surface of oxidised carbon adsorbents. Carbon 40, 95-104.
Tamai H., Kunihiro M., Yasuda H., 2004. Adsorption of tetraalkylammonium ions on microporous and mesoporous activated carbons prepared from vinylidene chloride copolymer. J. Colloid Interface Sci. 275, 44-47.
Teixidó M., Pignatello J.J., Beltrán J.L., Granados M., Peccia J., 2011. Speciation of the ionizable antibiotic sulfamethazine on black carbon (biochar). Environ. Sci. Technol. 45, 10020-10027.
Teychene B., Chi F., Chokki J., Darracq G., Baron J., Joyeux M., et al., 2020. Investigation of polar mobile organic compounds (PMOC) removal by reverse osmosis and nanofiltration: rejection mechanism modelling using decision tree. Water Supply 20, 975-983.
Thomaidi V.S., Stasinakis A.S., Borova V.L., Thomaidis N.S., 2015. Is there a risk for the aquatic environment due to the existence of emerging organic contaminants in treated domestic wastewater? Greece as a case-study. J. Hazard. Mater. 283, 740-747.

29
Tran H.N., You S.-J., Hosseini-Bandegharaei A., Chao H.-P., 2017. Mistakes and inconsistencies regarding adsorption of contaminants from aqueous solutions: a critical review. Water Res. 120, 88-116.
Ulrich N., Endo S., Brown T.N., Watanabe N., Bronner G., Abraham M.H., et al., 2017. UFZ-LSER Database v 3.2 http://www.ufz.de/lserd (accessed 16 April 2021).
Vogel M., Kopinke F.-D., Mackenzie K., 2019. Acceleration of microiron-based dechlorination in water by contact with fibrous activated carbon. Sci. Total Environ. 660, 1274-1282.
Watson J., 1999. Separation Methods for Waste and Environmental Applications, Marcel Dekker, New York.
Wellen B.A., Lach E.A., Allen H.C., 2017. Surface pKa of octanoic, nonanoic, and decanoic fatty acids at the air–water interface: applications to atmospheric aerosol chemistry. Phys. Chem. Chem. Phys. 19, 26551-26558.
Wu T., Cai X., Tan S., Li H., Liu J., Yang W., 2011. Adsorption characteristics of acrylonitrile, p-toluenesulfonic acid, 1-naphthalenesulfonic acid and methyl blue on graphene in aqueous solutions. Chem. Eng. J. 173, 144-149.
Xiao F., Pignatello J.J., 2014. Effect of adsorption nonlinearity on the pH–adsorption profile of ionizable organic compounds. Langmuir 30, 1994-2001.
Xiao F., Pignatello J.J., 2016. Effects of post-pyrolysis air oxidation of biomass chars on adsorption of neutral and ionizable compounds. Environ. Sci. Technol. 50, 6276-6283.
Xiao J.-X., Zhang Y., Wang C., Zhang J., Wang C.-M., Bao Y.-X., et al., 2005. Adsorption of cationic–anionic surfactant mixtures on activated carbon. Carbon 43, 1032-1038.
Yang W., 2019, Electrochemical Advanced Oxidation Processes for Emerging Organic Contaminants Removal with Graphene-based Modified Carbon Felt Electrode. PhD thesis.
Zelazny L.W., He L., Vanwormhoudt A., 1996. Charge Analysis of Soils and Anion Exchange. Methods of Soil Analysis: Part 3 Chemical Methods, 5.3. Soil Science Society of America, Inc., American Society of Agronomy, Inc., Madison, pp. 1231-1253.
Zhang K., Zhong S., Zhang H., 2020. Predicting aqueous adsorption of organic compounds onto biochars, carbon nanotubes, granular activated carbons and resins with machine learning. Environ. Sci. Technol. 54, 7008-7018.
Zhao H., Qian L., Guan X., Wu D., Zhao G., 2016. Continuous bulk FeCuC aerogel with ultradispersed metal nanoparticles: an efficient 3D heterogeneous electro-Fenton cathode over a wide range of pH 3–9. Environ. Sci. Technol. 50, 5225-5233.
Zhao Y., Lin S., Choi J.-W., Bediako J.K., Song M.-H., Kim J.-A., et al., 2019. Prediction of adsorption properties for ionic and neutral pharmaceuticals and pharmaceutical intermediates on activated charcoal from aqueous solution via LFER model. Chem. Eng. J. 362, 199-206.

30
Zhi Y., Liu J., 2016. Surface modification of activated carbon for enhanced adsorption of perfluoroalkyl acids from aqueous solutions. Chemosphere 144, 1224-1232.
Zhou J.-H., Sui Z.-J., Zhu J., Li P., Chen D., Dai Y.-C., et al., 2007. Characterization of surface oxygen complexes on carbon nanofibers by TPD, XPS and FT-IR. Carbon 45, 785-796.

31
Figures:
Fig. 1: Log Kd on ACFs for selected PMOCs at ce = 20 µM in 10 mM Na2SO4 solution at pH 7 at 20 °C. These
values were calculated from the corresponding Freundlich isotherm parameters. The error bars of log Kd are
calculated from the errors in KF and n obtained from the regression analyses of the Freundlich linear fittings.

32
Fig. 2: Linear fittings of ln Kd vs. (1/T) for (a) p-TSA, (b) TPA+, (c) BTMA+ and (d) p-TsO- in 10 mM Na2SO4 at
pH 7. The initial concentration of dissolved sorbate was set at 20 mg/L. The experimental conditions (details given
in SI) were selected giving q ≤ ½ qmax.

33
Fig. 3: The effect of electrolyte solution concentration on the adsorption of selected compounds on (a) OxACF10,
(b) ACF10 and (c) DeACF10 in Na2SO4 solution at pH 7. The experimental conditions (details given in SI) were
selected to ensure q ≤ 2/3 qmax. The error bars are standard deviations of the single values from duplicate
experiments with triplicate measurements each.
34
Fig. 4: Comparison of experimentally derived and predicted Freundlich isotherm parameters (a) log KF and (b) n
by the model of Sigmund el al. (2020b). KF are given in (µg/kg)/(µg/L)n as used also by Sigmund el al. (2020b).
Error bars are obtained from the regression analyses of experimentally derived Freundlich fittings. Functions y =
x for both log KF and n are shown by the black solid lines. Typical expected deviation ranges for log KF and n are
marked with dashed lines.

35
Fig. 5: Experimentally derived and predicted log Kd of MTBE, p-TSA, p-TsO– and OCA (–) at ce = 20 µM on
various ACFs in 10 mM Na2SO4 solution at pH 7. Log Kd and error bars were obtained as for Fig. 1. DeCACF
contains a lower O-content and a more hydrophobic surface with a higher delocalized π-electron density than
CACF (Saeidi et al., 2020b).

36
Tables:
Table 1: Chemical properties of untreated ACF10 and surface-modified OxACF10 and DeACF10.
Sample pHPZC CEC (µmol/m2) AEC (µmol/m2) C wt% H wt% O wt%a N wt%
OxACF10 2.4 ± 0.1 1.0 0.0087 78.5 0.3 18.1 2.7
ACF10 5.7 ± 0.2 0.040 0.025 87.7 0.3 9.9 1.8
DeACF10 10.2 ± 0.2 ≤ 0.010 0.23 93.4 0.4 4.3 0.9 a Calculated from mass balance according to O wt% = 100% – C wt% – H wt% – N wt% – ash wt%.

37
Table 2: Textural properties of ACF10, OxACF10, and DeACF10. Vt = total pore volume; Vmeso = mesopore volume;
Vmicro, Ø<1 nm and Vmicro, Ø=1–2 nm = pore volume of micropores with Ø < 1 nm and Ø = 1–2 nm.
Sample SBET (m2/g)a Vt (cm3/g)b Vmicro, Ø < 1 nm (cm3/g)b Vmicro, Ø = 1-2 nm (cm3/g)b Vmeso (cm3/g)b
OxACF10 1100 0.51 0.16 0.31 0.04
ACF10 1500 0.57 0.14 0.39 0.04
DeACF10 1400 0.73 0.08 0.58 0.07 a Determined by N2 adsorption/desorption up to p/p0 = 0.99. b Determined by CO2 adsorption.

38
Table 3: Freundlich and Langmuir isotherm parameters for adsorption of six PMOCs on three ACFs in 10 mM
Na2SO4 solution at pH 7, 20°C.
Sorbate ACF sorbent Freundlich Langmuir
KF (10-3 (µmol/m2)/(µmol/L)n) n R2 qmax (µmol/m2) KL (L/µmol) R2
TPA+
OxACF10 18 0.42 0.995 0.18 0.031 0.986
ACF10 35 0.44 0.970 0.16 0.11 0.974
DeACF10 28 0.37 0.958 0.13 0.11 0.996
BTMA+
OxACF10 19 0.67 0.998 0.53 0.018 0.969
ACF10 34 0.33 0.974 0.23 0.035 0.941
DeACF10 12 0.54 0.995 0.22 0.016 0.992
BTEA+
OxACF10 85 0.27 0.963 0.36 0.087 0.979
ACF10 68 0.28 0.977 0.28 0.081 0.982
DeACF10 68 0.26 0.934 0.30 0.060 0.976
OxACF10 0.95 0.57 0.970 0.025 0.013 0.916
p-TsO- ACF10 21 0.34 0.939 0.11 0.084 0.993
DeACF10 100 0.31 0.994 0.38 0.14 1.000
OxACF10 13 0.69 0.999 0.36 0.024 0.944
p-TSA ACF10 75 0.59 0.947 1.0 0.037 0.997
DeACF10 220 0.38 0.935 1.3 0.079 0.984
MTBE
OxACF10 n.d.a n.d.a n.d.a n.d a n.d. a n.d. a
ACF10 0.77 0.76 0.980 0.098 0.0037 0.854
DeACF10 3.6 0.75 0.977 0.16 0.014 0.974 a OxACF10 has a very low adsorption to MTBE (no significant depletion up to ACF dosage of 5 g/L).


![Puschkin und Tiflis: Kaukasische Spuren (preprint) [Pushkin and Tbilisi: Caucasian Traces (preprint)]](https://static.fdokumen.com/doc/165x107/6315cc26511772fe45108470/puschkin-und-tiflis-kaukasische-spuren-preprint-pushkin-and-tbilisi-caucasian.jpg)