LIVSCI2385-published copy
10
This article appeared in a journal published by Elsevier. The attached copy is furnished to the author for internal non-commercial research and education use, including for instruction at the authors institution and sharing with colleagues. Other uses, including reproduction and distribution, or selling or licensing copies, or posting to personal, institutional or third party websites are prohibited. In most cases authors are permitted to post their version of the article (e.g. in Word or Tex form) to their personal website or institutional repository. Authors requiring further information regarding Elsevier’s archiving and manuscript policies are encouraged to visit: http://www.elsevier.com/authorsrights
Transcript of LIVSCI2385-published copy
This article appeared in a journal published by Elsevier. The attachedcopy is furnished to the author for internal non-commercial researchand education use, including for instruction at the authors institution
and sharing with colleagues.
Other uses, including reproduction and distribution, or selling orlicensing copies, or posting to personal, institutional or third party
websites are prohibited.
In most cases authors are permitted to post their version of thearticle (e.g. in Word or Tex form) to their personal website orinstitutional repository. Authors requiring further information
regarding Elsevier’s archiving and manuscript policies areencouraged to visit:
http://www.elsevier.com/authorsrights
Author's personal copy
Productive performance, biochemical and hematologicaltraits of broiler chickens supplemented with propolis,bee pollen, and mannan oligosaccharides continuouslyor intermittently
Y.A. Attia a,b,n, A.E. Abd Al-Hamid b, M.S. Ibrahim c, M.A. Al-Harthi a,F. Bovera d, A.Sh. Elnaggar b
a Arid Land Agriculture Department, Faculty of Meteorology, Environment and Arid Land Agriculture, King Abdulaziz University,Jeddah 21589, Saudi Arabiab Department of Animal and Poultry Production, Faculty of Agriculture, Damanhour University, Damanhour 22516, Egyptc Department of Microbiology, Faculty of Veterinary Medicine, Damanhour University, Damanhour 22516, Egyptd Department of Veterinary Medicine and Animal Science, University of Napoli Federico II, Napoli, Italy
a r t i c l e i n f o
Article history:Received 11 May 2013Received in revised form3 March 2014Accepted 6 March 2014
Keywords:BroilersNatural growth promotersGrowth performanceBlood profiles
a b s t r a c t
The aim of this study was to compare the effect of different dietary supplements (beepollen, BP; propolis, Pro; and mannan oligosaccharides, MOS) administered continuous orintermittent on productive performance and physiological traits of broiler chickens. Atotal of 324 unsexed 1-d-old Arbor Acres broiler chickens were divided among 9 dietarytreatments with 6 replicate cages per treatment and 6 broiler chickens per cage, assigningexperimental units to treatments randomly. Broiler chickens were assigned to thefollowing starter and grower dietary treatments: basal control with no supplementationor basal control diets supplemented with 300 mg BP (BP), 300 mg Pro (Pro), 300 mg BPand 300 mg Pro (BPþPro), and 0.5 g MOS/kg. Each treatment group was divided into 2, inwhich the additives were administrated continuous or intermittent. The broiler chickenswere vaccinated at d 7, 10, 14, and 21 of age. In the continuous treatment groups,supplementations were given from d 0 to 35, whereas in the intermittent treatmentgroups, the administration protocol was the following: 3 consecutive days before the dayof vaccination (4, 5 and 6; 7, 8 and 9; 11, 12 and 13; and 18, 19 and 20 d of age); on the dayof vaccinations and 1 d after each vaccination (d 8, 11, 15 and 22 d of age). Thus,supplements were administered for 17 days as 7, 8 and 11 d of age were overlappedbecause of the vaccination on 7 and 10 d of age. All the supplements administeredcontinuously or intermittently increased (Po0.05) body weight gain (average 1856 vs.1641 g) and improved (Po0.01) feed conversion ratio (average 1.88 vs. 2.24) during theentire period of the study in comparison to the un-supplemented control treatment. Also,dressing percentage was increased (Po0.05) in all the supplemented treatmentscompared with the control treatment (an average 70.9% vs. 68.9%). There was nosynergistic effect of BP and Pro on growth performance, indicating that either of themis adequate. In general, the natural growth promoters increased red blood cells andhemoglobin (Po0.012) and decreased triglycerides, cholesterol, urea-N, and creatinine
Contents lists available at ScienceDirect
journal homepage: www.elsevier.com/locate/livsci
Livestock Science
http://dx.doi.org/10.1016/j.livsci.2014.03.0051871-1413/& 2014 Elsevier B.V. All rights reserved.
n Corresponding author at: Arid Land Agriculture Department, Faculty of Meteorology, Environment and Arid Land Agriculture, King AbdulazizUniversity, Jeddah 21589, Saudi Arabia. Tel.: þ966 56 8575961; fax: þ966 2 6952364.
E-mail address: [email protected] (Y.A. Attia).
Livestock Science 164 (2014) 87–95
Author's personal copy
(Po0.008) as well as aspartate aminotransferase (P¼0.047) in broiler chickens. Supple-menting BP, Pro, or MOS continuously or intermittently was equally effective in increasinggrowth performance and dressing percent of broiler chickens.
& 2014 Elsevier B.V. All rights reserved.
1. Introduction
In the past, sub-therapeutic doses of antibiotics havebeen shown to improve the growth performance, animalhealth, and control pathogens. However, the potentialnegative effects of antibiotics such as antibiotic resistanceand residues problems caused the European Communityto place a general ban of the use of antibiotics as a growthpromoter (AGP) in animal production since January 2006(Attia et al., 2011a). As a consequence, the use of AGP inother countries around the World is under evaluation,especially in poultry production (Diarra et al., 2007; Attiaet al., 2013). This prompted many researchers to conduct astudy to find a natural alternative to antibiotics. Amongthe possible alternatives, prebiotics, especially mannanoligosaccharides (MOS) derived from the outer cell wallof the yeast Saccharomyces cerevisiae, are considered apromising alternative to antibiotics (Kocher, 2006; Cheled-Shoval et al., 2011). MOS can act in two ways: providingnutrients to intestinal microflora (as prebiotics) and pre-venting the attachment of some pathogen bacteria (asEscherichia coli and Salmonella enteritidis) to the intestinalmucosa (Spring et al., 2000) by binding the mannosereceptors on the type 1 fimbriae.
Also, plant-derived substances received considerableinterest by the poultry industry because of their antioxidantand antimicrobial effects. Bee pollen (BP) is a naturalproduct, which is collected from plants by honey bees.Bee pollen is a rich source of indispensable amino acids,water and fat soluble vitamins, and flavonoids (Attia et al.,2011b,c). Propolis (Pro) is a resinous substance from variousplants and consists of resin, essential oils, and waxes, whichare gathered by bees. Propolis contains amino acids, miner-als, ethanol, vitamin A and E, B complex vitamins, andflavonoids and has strong antimicrobial properties (Sforcin,2007; Yang et al., 2008; Viuda-Martos et al., 2008; Aygunet al., 2012).
Several researchers (Sforcin, 2007; Galal et al., 2008;Attia et al., 2011b,c; Popiela-Pleban et al., 2012) demon-strated that BP and Pro could be used as growth promotersand immune enhancers as an alternative to antibiotics. Inaddition, BP was able to improve poultry health andgastro-intestinal functions in poultry (Selmanoğlu et al.,2009; Attia et al., 2011b,c), protect kidney, and decreasetriglycerides, cholesterol, creatinine, and blood urea N (Huet al., 2003). Propolis has been suggested as a suitablehealth supplement for consumers in developed countries(Bankova, 2005). Growth, iron utilization, and regenera-tion efficiency of hemoglobin were improved in ratssupplemented with Pro (Haro et al., 2000). Propolis wasbeneficial for productive and reproductive functions,hematological measurements, and economic values ofrabbits, and this could be attributed to vitamins, minerals,
phenolic constituents, and enzymes (Banskota et al.,2001). The aim of this study was to investigate the effectsof continuous or intermittent supplementation of MOS, BP,and Pro on productive performance and physiologicaltraits of broiler chickens.
1.1. Experimental chickens, diets, and design
A total of 324 unsexed 1-d-old Arbor Acres broilerchickens obtained from a commercial company were wingbanded and divided among 9 dietary treatments with 6replicate cages per treatment and 6 broiler chickens percage, assigning experimental units to treatments ran-domly. Broiler chickens were assigned to the followingstarter and grower dietary treatments: basal control withno supplementation or basal control diets supplementedwith 300 mg BP (Mahmoud Gomaa Abd EL Galil CO,Pyramids Cairo, Giza, Egypt; BP), 300 mg Pro (HangzhouKangli Health Products Co., Fuyang Hangzhou Zhejiang,China; Pro), 300 mg BP and 300 mg Pro (BPþPro), or 0.5 gMOS (Alltech Inc., Nicholasville, KY, USA; MOS)/kg.
Each supplemented treatment was divided into 2 sub-treatments, in which the additives were administratedcontinuous or intermittent. Each treatment of 12 cages of6 broiler chickens and each subtreatment of 6 replicatecages/treatment. The chickens were vaccinated at 7, 10, 14,and 21 d of age. In the continuous treatment groups thesupplements were administered each day during d 0–35.In the intermittent treatment groups, the supplementswere administered as follow: 3 d before the day of vacci-nation (d 4–6; d 7–9; d 11–13 and d 18–20) on the day ofvaccinations (7, 10, 14 and 21 d), and one day after eachvaccination (8, 11, 15 and 22 d). Thus, supplements wereadministered for 17 d, and 7, 8 and 11 d of age wereoverlapped because of the vaccination on 7 and 10 d ofage. The administration regimen was for 24 h each day.The basal diet was formulated according to NRC (1994)and the composition (Table 1) and the chemical analysis ofthe diets and BP and Pro were determined using AOAC(2004) procedures: dry matter (934.01), CP (954.01), etherextract (920.39), crude fiber (954.18), and ash (942.05;Tables 1 and 2).
1.2. Housing and husbandry
Broiler chickens were housed in battery brooders in asemi-opened house and had ad libitum access to feed andfree access to water via automatic nipple drinkers. A lightschedule of 23 h light and 1 h dark was maintained until7th day, and 20 h of light and 4 h of dark were maintainedfrom 8 to 36 d of age. The average outdoor minimum andmaximum temperatures and relative humidity during theexperimental period were 21.2 and 24.2 1C and 56.7% and
Y.A. Attia et al. / Livestock Science 164 (2014) 87–9588
Author's personal copy
58.7%, respectively. The brooding temperatures (indoor)were 32, 30, 27, and 24–21 1C during d 0–7, d 7–14, d 14–20and d 20–35, respectively. Broiler chickens were vaccinated(Nobilis ND Clone 30, Influenza H5N2, Gomboro, and Clonewith Gomboro; Merck & Co., Inc., Intervet, Cairo, Egypt) at 7,10, 14, and 21 d of age, as mentioned before.
1.3. Response criteria
Chickens were weighed (g) at d 0, 21, and 35 and bodyweight gain (g/chicken) was calculated. Feed intake wasrecorded (g/chicken) for each cage (6 per treatment, 3 persubtreatment) at d 21 and 35, and individual feed intake wascalculated (g/chicken). Feed conversion ratio (FCR; g feed/ggain) and survival rate (SR; 100 – mortality rate) werecalculated from d 0 to 21, d 21 to 35 and d 0 to 35. At d 35,8 chickens per treatment (at least 1 chicken per cage, equalnumber of each sex) were randomly selected and slaughteredaccording to Islamic procedure. After bleeding, each carcasswas plucked, eviscerated, and weighed to determine dressingpercentage. Liver, gizzard, heart and spleen were separated,individually weighed, and expressed as percentage of livebody weight.
Blood samples were collected from 8 broiler chickensper treatment (the same used for slaughtering) at d 35 and
put in both not-heparinized and heparinized tubes. Plasmawas separated by centrifugation at 1500g for 10 min at 4 1Cand stored at �18 1C until analysis. Plasma profile wasdetermined using commercial diagnostic kits (DiamondDiagnostics Company, Cairo, Egypt). Plasma total proteinand albumin concentration (g/100 mL) were determinedaccording to Henry et al. (1974) and Doumas et al. (1971),respectively. Globulin concentration (g/100 mL) was calcu-lated as the difference between the total protein andalbumin. Triglycerides were analyzed using a kit (Sigma-Aldrich, St. Louis, MO), and total cholesterol was deter-mined as described by Watson (1960). The activities (m/L)of alanine amino transferase (ALT) and aspartate aminotransferase (AST) enzymes were determined according to themethod described by Retiman and Frankel (1957). Plasma
Table 1Ingredients and chemical composition of the experimental basal diets(as-fed basis).
Item Starter diet Grower diet
Ingredient, g/kgMaize 511 518.5Rye 0.0 50.0Soybean meal 328.5 244.5Vegetable oil 22.5 20.0Full fat soybean meal 100.0 130.0Dicalcium phosphate 18.0 16.0Limestone 10.0 10.0L-Lys 1.0 1.5DL-Met 1.5 2.0Vitamin and mineral premixa 4.5 3.0NaCl 3.0 4.5Total 1000 1000
Calculated and determined compositionDry matter, g/kgb 866.8 875.5ME, MJ/kgc 12.72 12.98CP, g/kgb 229.2 210.8Lysine, g/kgc 13.3 12.3Met, g/kgc 5.0 5.2MetþCys, g/kgc 8.7 8.7Calcium, g/kgc 9.1 8.5Available phoshorus, g/kgc 4.6 4.1Crude fat, %b 60.9 64.5Crude fiber, %b 35.5 35.1Ash, %b 52.2 54.8NFE, %b 623.4 634.4
a Provided per kilogram of the diet: vitamin A (beta-carotene),7200 μg; vitamin E (DL-α-tocopheryl acetate), 20 mg; menadione,2.3 mg; vitamin D3, 55 μg; riboflavin, 5.5 mg; calcium pantothenate,12 mg; nicotinic acid, 50 mg; choline, 250 mg; vitamin B12, 10 μg; vitaminB6, 3 mg; thiamine, 3 mg; folic acid, 1 mg; and D-biotin, 0.05 mg. Tracemineral (mg/kg) of diet: Mn, 80; Zn, 60; Fe, 35; Cu, 8; and Se, 0.1 mg.
b Analyzed values (AOAC, 2004).c Calculated values.
Table 2Composition of bee pollen and propolis.
Item Bee pollen Propolis
Proximate analysis, %Moisture 3.5 –
Crude protein 25 1.0Ash 2.9 4.1Fat 5.2 1.2Carbohydrates 67.6 1.8Sugar 35 –
Starch 18 –
Gross energy, cal/100 g 405 –
Essential oils – 3.5
Amino acids, % of proteinVal 6.0 –
Leu 5.6 –
Isol 4.7 –
Met 1.7 –
Thr 4.6 –
Lys 5.7 –
Arg 4.7 –
Phe 3.5 –
Try 1.6 –
Cis 0.6 –
His 1.5 –
Glu 2.1 –
Indispensable amino acids 39.6 –
Indispensable amino acids index 105 –
Chemical score 74 –
Minerals, % of ashCa 8 –
P 11 –
Fe 6.5 –
Cu 0.07 –
K 32 –
Mg 6.5 –
Mn 1.4 –
Zn 0.04 –
Na 1.1 –
Z 1 –
Cl 0.8 –
Si 5 –
Major fatty acids, % of fatty acidsPalmitic acid 13.73 13.3Stearic acid – 6.4Oleic acid 11.88 12.3Linoleic acid 18.96 1.5Linolenic acid 41.52 0.59Arachidonic acid – 8.0
Flavonoids – 25.9
Y.A. Attia et al. / Livestock Science 164 (2014) 87–95 89
Author's personal copy
creatinine and urea concentrations were determined accord-ing to the methods described by Fabiny and Ertingshausen(1971) and Sampson et al. (1980), respectively.
Total red blood cells (RBC) were counted by an Aobright line hemocytometer using a light microscope at1900� magnification. Blood samples were diluted 200times with physiological saline before counting. Totalwhite blood cells (WBC) were counted by an Ao brightline hemocytometer using a light microscope at 100�magnification as described by Hepler (1966).
Hemoglobin concentration was determined by thecyanomethemoglobein method (Eilers, 1967). Wintrobehematocrite tubes were used for determination of thehematocrite value. Blood samples were centrifuged at1900g for 20 min at 4 1C, and then hematocrite valueswere measured by reading the packed cell volume (PCV)on the graduated scale. The average volume (size) of RBC(MCV, mm3)¼[hematocrit (%)/RBC]�10. The averageweight of hemoglobin in RBC (MCH, pg)¼[hemoglobinconcentration (g/dL)/RBC]�10. The average concentrationof hemoglobin in the RBC (MCHC, %)¼[hemoglobin (g/dL)/hematocrit (%)]�100.
1.4. Statistical analyses
Statistical analysis was done using the GLM procedureof SAS (2003) using one-way analyses of variance accord-ing to the following model: Yijk¼μþDiþei, where Y is thedependent variables; μ is the general mean; D is thesupplement effect, and e is the random error. Meansdifferences at Po0.05 were tested using Student–New-man–Keuls-test. Survival rate was analyzed as percentageusing chi-square analyses.
2. Results
Table 2 shows that BP is a rich source of energy andnutrients, e.g., protein, fat, carbohydrates (sugar andstarch), indispensable amino acids, gross energy, fattyacids, and minerals. On the other hand, Pro is a rich sourceof antioxidants, e.g., flavonoids, but contained lower amounts
of protein, fat, carbohydrates, and essential oils comparedwith BP.
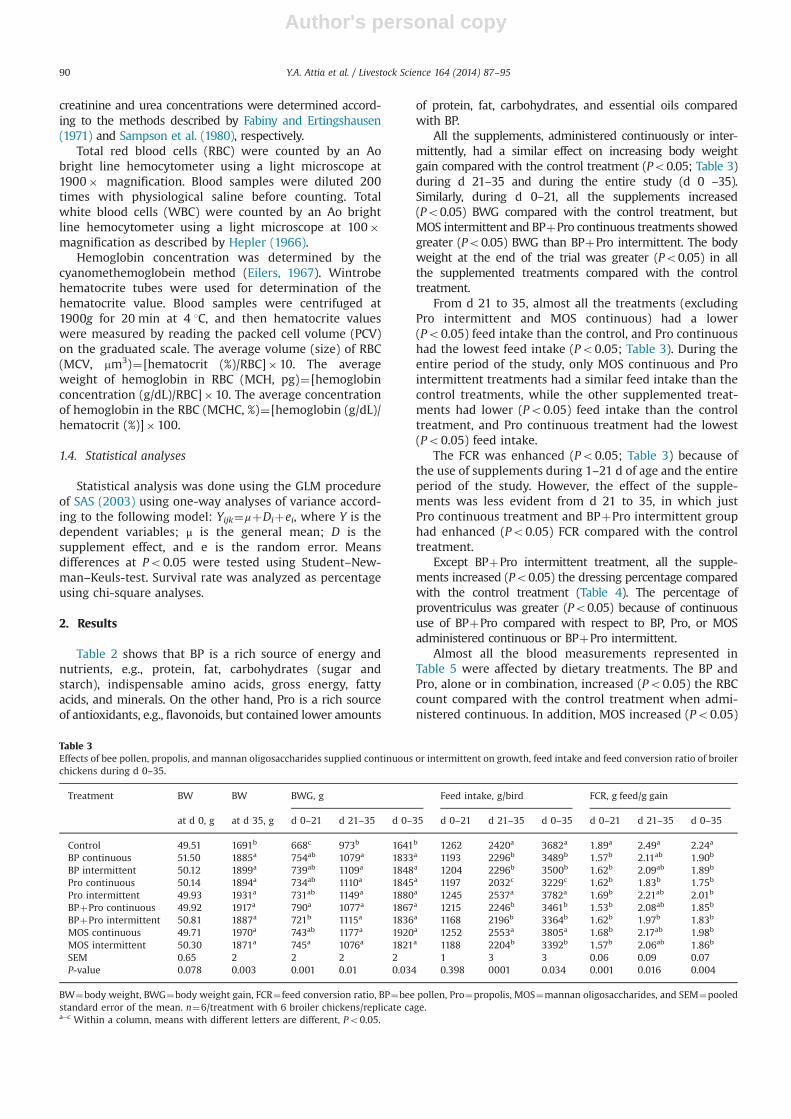
All the supplements, administered continuously or inter-mittently, had a similar effect on increasing body weightgain compared with the control treatment (Po0.05; Table 3)during d 21–35 and during the entire study (d 0 –35).Similarly, during d 0–21, all the supplements increased(Po0.05) BWG compared with the control treatment, butMOS intermittent and BPþPro continuous treatments showedgreater (Po0.05) BWG than BPþPro intermittent. The bodyweight at the end of the trial was greater (Po0.05) in allthe supplemented treatments compared with the controltreatment.
From d 21 to 35, almost all the treatments (excludingPro intermittent and MOS continuous) had a lower(Po0.05) feed intake than the control, and Pro continuoushad the lowest feed intake (Po0.05; Table 3). During theentire period of the study, only MOS continuous and Prointermittent treatments had a similar feed intake than thecontrol treatments, while the other supplemented treat-ments had lower (Po0.05) feed intake than the controltreatment, and Pro continuous treatment had the lowest(Po0.05) feed intake.
The FCR was enhanced (Po0.05; Table 3) because ofthe use of supplements during 1–21 d of age and the entireperiod of the study. However, the effect of the supple-ments was less evident from d 21 to 35, in which justPro continuous treatment and BPþPro intermittent grouphad enhanced (Po0.05) FCR compared with the controltreatment.
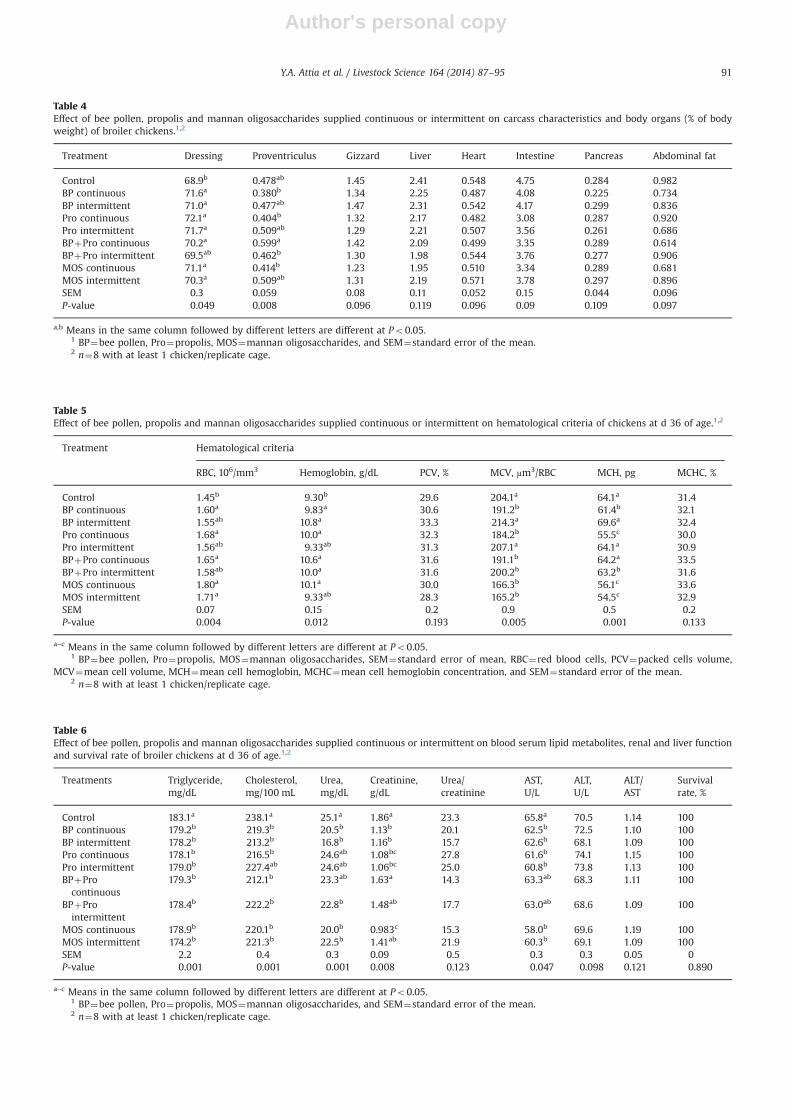
Except BPþPro intermittent treatment, all the supple-ments increased (Po0.05) the dressing percentage comparedwith the control treatment (Table 4). The percentage ofproventriculus was greater (Po0.05) because of continuoususe of BPþPro compared with respect to BP, Pro, or MOSadministered continuous or BPþPro intermittent.
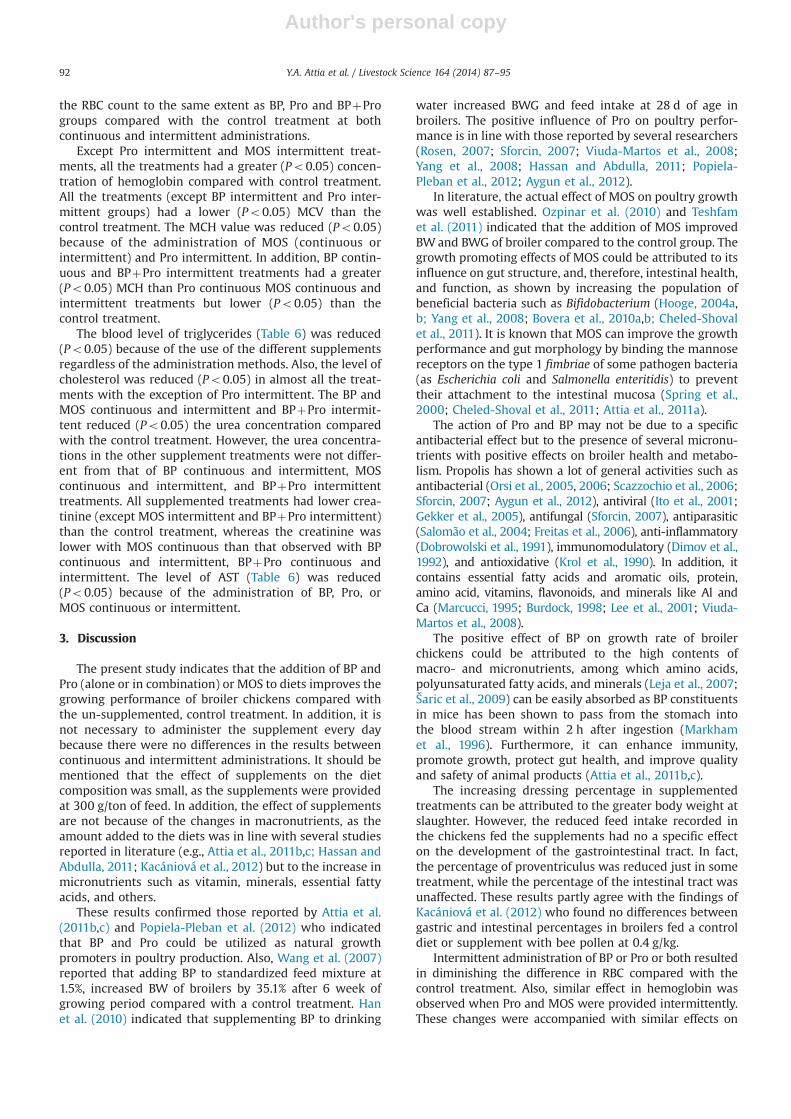
Almost all the blood measurements represented inTable 5 were affected by dietary treatments. The BP andPro, alone or in combination, increased (Po0.05) the RBCcount compared with the control treatment when admi-nistered continuous. In addition, MOS increased (Po0.05)
Table 3Effects of bee pollen, propolis, and mannan oligosaccharides supplied continuous or intermittent on growth, feed intake and feed conversion ratio of broilerchickens during d 0–35.
Treatment BW BW BWG, g Feed intake, g/bird FCR, g feed/g gain
at d 0, g at d 35, g d 0–21 d 21–35 d 0–35 d 0–21 d 21–35 d 0–35 d 0–21 d 21–35 d 0–35
Control 49.51 1691b 668c 973b 1641b 1262 2420a 3682a 1.89a 2.49a 2.24a
BP continuous 51.50 1885a 754ab 1079a 1833a 1193 2296b 3489b 1.57b 2.11ab 1.90b
BP intermittent 50.12 1899a 739ab 1109a 1848a 1204 2296b 3500b 1.62b 2.09ab 1.89b
Pro continuous 50.14 1894a 734ab 1110a 1845a 1197 2032c 3229c 1.62b 1.83b 1.75b
Pro intermittent 49.93 1931a 731ab 1149a 1880a 1245 2537a 3782a 1.69b 2.21ab 2.01b
BPþPro continuous 49.92 1917a 790a 1077a 1867a 1215 2246b 3461b 1.53b 2.08ab 1.85b
BPþPro intermittent 50.81 1887a 721b 1115a 1836a 1168 2196b 3364b 1.62b 1.97b 1.83b
MOS continuous 49.71 1970a 743ab 1177a 1920a 1252 2553a 3805a 1.68b 2.17ab 1.98b
MOS intermittent 50.30 1871a 745a 1076a 1821a 1188 2204b 3392b 1.57b 2.06ab 1.86b
SEM 0.65 2 2 2 2 1 3 3 0.06 0.09 0.07P-value 0.078 0.003 0.001 0.01 0.034 0.398 0001 0.034 0.001 0.016 0.004
BW¼body weight, BWG¼body weight gain, FCR¼feed conversion ratio, BP¼bee pollen, Pro¼propolis, MOS¼mannan oligosaccharides, and SEM¼pooledstandard error of the mean. n¼6/treatment with 6 broiler chickens/replicate cage.a–c Within a column, means with different letters are different, Po0.05.
Y.A. Attia et al. / Livestock Science 164 (2014) 87–9590
Author's personal copy
Table 4Effect of bee pollen, propolis and mannan oligosaccharides supplied continuous or intermittent on carcass characteristics and body organs (% of bodyweight) of broiler chickens.1,2
Treatment Dressing Proventriculus Gizzard Liver Heart Intestine Pancreas Abdominal fat
Control 68.9b 0.478ab 1.45 2.41 0.548 4.75 0.284 0.982BP continuous 71.6a 0.380b 1.34 2.25 0.487 4.08 0.225 0.734BP intermittent 71.0a 0.477ab 1.47 2.31 0.542 4.17 0.299 0.836Pro continuous 72.1a 0.404b 1.32 2.17 0.482 3.08 0.287 0.920Pro intermittent 71.7a 0.509ab 1.29 2.21 0.507 3.56 0.261 0.686BPþPro continuous 70.2a 0.599a 1.42 2.09 0.499 3.35 0.289 0.614BPþPro intermittent 69.5ab 0.462b 1.30 1.98 0.544 3.76 0.277 0.906MOS continuous 71.1a 0.414b 1.23 1.95 0.510 3.34 0.289 0.681MOS intermittent 70.3a 0.509ab 1.31 2.19 0.571 3.78 0.297 0.896SEM 0.3 0.059 0.08 0.11 0.052 0.15 0.044 0.096P-value 0.049 0.008 0.096 0.119 0.096 0.09 0.109 0.097
a,b Means in the same column followed by different letters are different at Po0.05.1 BP¼bee pollen, Pro¼propolis, MOS¼mannan oligosaccharides, and SEM¼standard error of the mean.2 n¼8 with at least 1 chicken/replicate cage.
Table 5Effect of bee pollen, propolis and mannan oligosaccharides supplied continuous or intermittent on hematological criteria of chickens at d 36 of age.1,2
Treatment Hematological criteria
RBC, 106/mm3 Hemoglobin, g/dL PCV, % MCV, mm3/RBC MCH, pg MCHC, %
Control 1.45b 9.30b 29.6 204.1a 64.1a 31.4BP continuous 1.60a 9.83a 30.6 191.2b 61.4b 32.1BP intermittent 1.55ab 10.8a 33.3 214.3a 69.6a 32.4Pro continuous 1.68a 10.0a 32.3 184.2b 55.5c 30.0Pro intermittent 1.56ab 9.33ab 31.3 207.1a 64.1a 30.9BPþPro continuous 1.65a 10.6a 31.6 191.1b 64.2a 33.5BPþPro intermittent 1.58ab 10.0a 31.6 200.2b 63.2b 31.6MOS continuous 1.80a 10.1a 30.0 166.3b 56.1c 33.6MOS intermittent 1.71a 9.33ab 28.3 165.2b 54.5c 32.9SEM 0.07 0.15 0.2 0.9 0.5 0.2P-value 0.004 0.012 0.193 0.005 0.001 0.133
a–c Means in the same column followed by different letters are different at Po0.05.1 BP¼bee pollen, Pro¼propolis, MOS¼mannan oligosaccharides, SEM¼standard error of mean, RBC¼red blood cells, PCV¼packed cells volume,
MCV¼mean cell volume, MCH¼mean cell hemoglobin, MCHC¼mean cell hemoglobin concentration, and SEM¼standard error of the mean.2 n¼8 with at least 1 chicken/replicate cage.
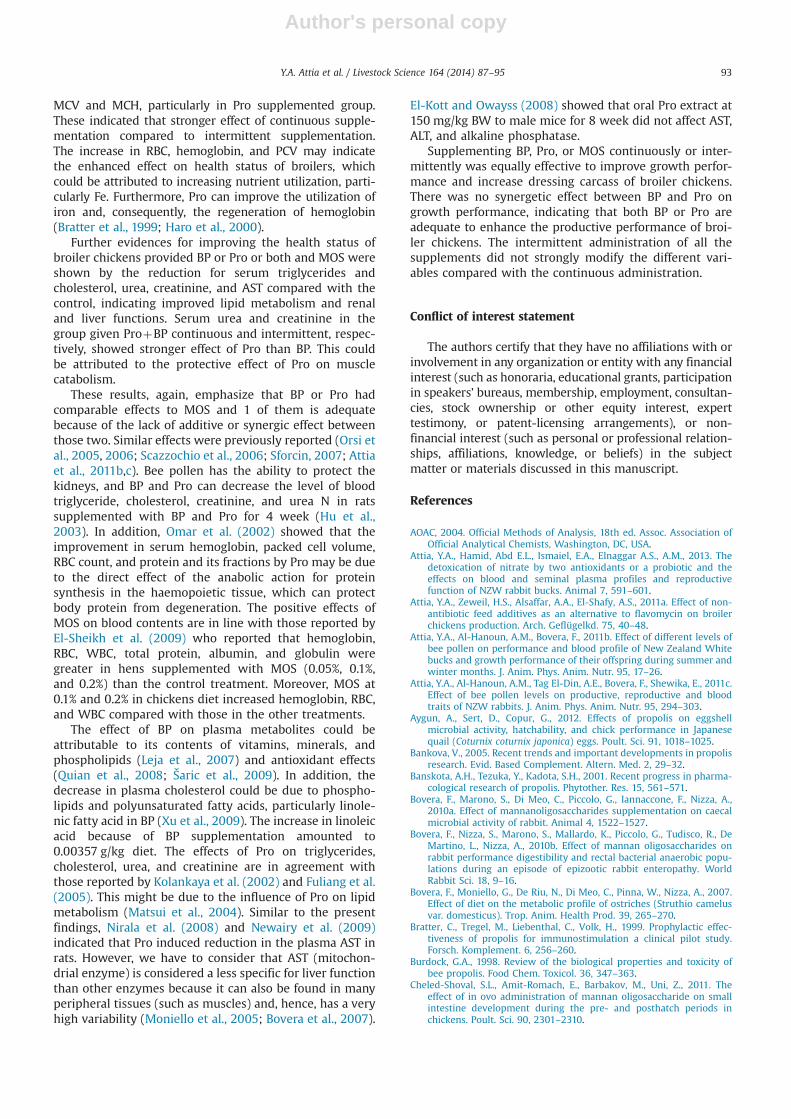
Table 6Effect of bee pollen, propolis and mannan oligosaccharides supplied continuous or intermittent on blood serum lipid metabolites, renal and liver functionand survival rate of broiler chickens at d 36 of age.1,2
Treatments Triglyceride,mg/dL
Cholesterol,mg/100 mL
Urea,mg/dL
Creatinine,g/dL
Urea/creatinine
AST,U/L
ALT,U/L
ALT/AST
Survivalrate, %
Control 183.1a 238.1a 25.1a 1.86a 23.3 65.8a 70.5 1.14 100BP continuous 179.2b 219.3b 20.5b 1.13b 20.1 62.5b 72.5 1.10 100BP intermittent 178.2b 213.2b 16.8b 1.16b 15.7 62.6b 68.1 1.09 100Pro continuous 178.1b 216.5b 24.6ab 1.08bc 27.8 61.6b 74.1 1.15 100Pro intermittent 179.0b 227.4ab 24.6ab 1.06bc 25.0 60.8b 73.8 1.13 100BPþProcontinuous
179.3b 212.1b 23.3ab 1.63a 14.3 63.3ab 68.3 1.11 100
BPþProintermittent
178.4b 222.2b 22.8b 1.48ab 17.7 63.0ab 68.6 1.09 100
MOS continuous 178.9b 220.1b 20.0b 0.983c 15.3 58.0b 69.6 1.19 100MOS intermittent 174.2b 221.3b 22.5b 1.41ab 21.9 60.3b 69.1 1.09 100SEM 2.2 0.4 0.3 0.09 0.5 0.3 0.3 0.05 0P-value 0.001 0.001 0.001 0.008 0.123 0.047 0.098 0.121 0.890
a–c Means in the same column followed by different letters are different at Po0.05.1 BP¼bee pollen, Pro¼propolis, MOS¼mannan oligosaccharides, and SEM¼standard error of the mean.2 n¼8 with at least 1 chicken/replicate cage.
Y.A. Attia et al. / Livestock Science 164 (2014) 87–95 91
Author's personal copy
the RBC count to the same extent as BP, Pro and BPþProgroups compared with the control treatment at bothcontinuous and intermittent administrations.
Except Pro intermittent and MOS intermittent treat-ments, all the treatments had a greater (Po0.05) concen-tration of hemoglobin compared with control treatment.All the treatments (except BP intermittent and Pro inter-mittent groups) had a lower (Po0.05) MCV than thecontrol treatment. The MCH value was reduced (Po0.05)because of the administration of MOS (continuous orintermittent) and Pro intermittent. In addition, BP contin-uous and BPþPro intermittent treatments had a greater(Po0.05) MCH than Pro continuous MOS continuous andintermittent treatments but lower (Po0.05) than thecontrol treatment.
The blood level of triglycerides (Table 6) was reduced(Po0.05) because of the use of the different supplementsregardless of the administration methods. Also, the level ofcholesterol was reduced (Po0.05) in almost all the treat-ments with the exception of Pro intermittent. The BP andMOS continuous and intermittent and BPþPro intermit-tent reduced (Po0.05) the urea concentration comparedwith the control treatment. However, the urea concentra-tions in the other supplement treatments were not differ-ent from that of BP continuous and intermittent, MOScontinuous and intermittent, and BPþPro intermittenttreatments. All supplemented treatments had lower crea-tinine (except MOS intermittent and BPþPro intermittent)than the control treatment, whereas the creatinine waslower with MOS continuous than that observed with BPcontinuous and intermittent, BPþPro continuous andintermittent. The level of AST (Table 6) was reduced(Po0.05) because of the administration of BP, Pro, orMOS continuous or intermittent.
3. Discussion
The present study indicates that the addition of BP andPro (alone or in combination) or MOS to diets improves thegrowing performance of broiler chickens compared withthe un-supplemented, control treatment. In addition, it isnot necessary to administer the supplement every daybecause there were no differences in the results betweencontinuous and intermittent administrations. It should bementioned that the effect of supplements on the dietcomposition was small, as the supplements were providedat 300 g/ton of feed. In addition, the effect of supplementsare not because of the changes in macronutrients, as theamount added to the diets was in line with several studiesreported in literature (e.g., Attia et al., 2011b,c; Hassan andAbdulla, 2011; Kacániová et al., 2012) but to the increase inmicronutrients such as vitamin, minerals, essential fattyacids, and others.
These results confirmed those reported by Attia et al.(2011b,c) and Popiela-Pleban et al. (2012) who indicatedthat BP and Pro could be utilized as natural growthpromoters in poultry production. Also, Wang et al. (2007)reported that adding BP to standardized feed mixture at1.5%, increased BW of broilers by 35.1% after 6 week ofgrowing period compared with a control treatment. Hanet al. (2010) indicated that supplementing BP to drinking
water increased BWG and feed intake at 28 d of age inbroilers. The positive influence of Pro on poultry perfor-mance is in line with those reported by several researchers(Rosen, 2007; Sforcin, 2007; Viuda-Martos et al., 2008;Yang et al., 2008; Hassan and Abdulla, 2011; Popiela-Pleban et al., 2012; Aygun et al., 2012).
In literature, the actual effect of MOS on poultry growthwas well established. Ozpinar et al. (2010) and Teshfamet al. (2011) indicated that the addition of MOS improvedBWand BWG of broiler compared to the control group. Thegrowth promoting effects of MOS could be attributed to itsinfluence on gut structure, and, therefore, intestinal health,and function, as shown by increasing the population ofbeneficial bacteria such as Bifidobacterium (Hooge, 2004a,b; Yang et al., 2008; Bovera et al., 2010a,b; Cheled-Shovalet al., 2011). It is known that MOS can improve the growthperformance and gut morphology by binding the mannosereceptors on the type 1 fimbriae of some pathogen bacteria(as Escherichia coli and Salmonella enteritidis) to preventtheir attachment to the intestinal mucosa (Spring et al.,2000; Cheled-Shoval et al., 2011; Attia et al., 2011a).
The action of Pro and BP may not be due to a specificantibacterial effect but to the presence of several micronu-trients with positive effects on broiler health and metabo-lism. Propolis has shown a lot of general activities such asantibacterial (Orsi et al., 2005, 2006; Scazzochio et al., 2006;Sforcin, 2007; Aygun et al., 2012), antiviral (Ito et al., 2001;Gekker et al., 2005), antifungal (Sforcin, 2007), antiparasitic(Salomão et al., 2004; Freitas et al., 2006), anti-inflammatory(Dobrowolski et al., 1991), immunomodulatory (Dimov et al.,1992), and antioxidative (Krol et al., 1990). In addition, itcontains essential fatty acids and aromatic oils, protein,amino acid, vitamins, flavonoids, and minerals like Al andCa (Marcucci, 1995; Burdock, 1998; Lee et al., 2001; Viuda-Martos et al., 2008).
The positive effect of BP on growth rate of broilerchickens could be attributed to the high contents ofmacro- and micronutrients, among which amino acids,polyunsaturated fatty acids, and minerals (Leja et al., 2007;Šaric et al., 2009) can be easily absorbed as BP constituentsin mice has been shown to pass from the stomach intothe blood stream within 2 h after ingestion (Markhamet al., 1996). Furthermore, it can enhance immunity,promote growth, protect gut health, and improve qualityand safety of animal products (Attia et al., 2011b,c).
The increasing dressing percentage in supplementedtreatments can be attributed to the greater body weight atslaughter. However, the reduced feed intake recorded inthe chickens fed the supplements had no a specific effecton the development of the gastrointestinal tract. In fact,the percentage of proventriculus was reduced just in sometreatment, while the percentage of the intestinal tract wasunaffected. These results partly agree with the findings ofKacániová et al. (2012) who found no differences betweengastric and intestinal percentages in broilers fed a controldiet or supplement with bee pollen at 0.4 g/kg.
Intermittent administration of BP or Pro or both resultedin diminishing the difference in RBC compared with thecontrol treatment. Also, similar effect in hemoglobin wasobserved when Pro and MOS were provided intermittently.These changes were accompanied with similar effects on
Y.A. Attia et al. / Livestock Science 164 (2014) 87–9592
Author's personal copy
MCV and MCH, particularly in Pro supplemented group.These indicated that stronger effect of continuous supple-mentation compared to intermittent supplementation.The increase in RBC, hemoglobin, and PCV may indicatethe enhanced effect on health status of broilers, whichcould be attributed to increasing nutrient utilization, parti-cularly Fe. Furthermore, Pro can improve the utilization ofiron and, consequently, the regeneration of hemoglobin(Bratter et al., 1999; Haro et al., 2000).
Further evidences for improving the health status ofbroiler chickens provided BP or Pro or both and MOS wereshown by the reduction for serum triglycerides andcholesterol, urea, creatinine, and AST compared with thecontrol, indicating improved lipid metabolism and renaland liver functions. Serum urea and creatinine in thegroup given ProþBP continuous and intermittent, respec-tively, showed stronger effect of Pro than BP. This couldbe attributed to the protective effect of Pro on musclecatabolism.
These results, again, emphasize that BP or Pro hadcomparable effects to MOS and 1 of them is adequatebecause of the lack of additive or synergic effect betweenthose two. Similar effects were previously reported (Orsi etal., 2005, 2006; Scazzochio et al., 2006; Sforcin, 2007; Attiaet al., 2011b,c). Bee pollen has the ability to protect thekidneys, and BP and Pro can decrease the level of bloodtriglyceride, cholesterol, creatinine, and urea N in ratssupplemented with BP and Pro for 4 week (Hu et al.,2003). In addition, Omar et al. (2002) showed that theimprovement in serum hemoglobin, packed cell volume,RBC count, and protein and its fractions by Pro may be dueto the direct effect of the anabolic action for proteinsynthesis in the haemopoietic tissue, which can protectbody protein from degeneration. The positive effects ofMOS on blood contents are in line with those reported byEl-Sheikh et al. (2009) who reported that hemoglobin,RBC, WBC, total protein, albumin, and globulin weregreater in hens supplemented with MOS (0.05%, 0.1%,and 0.2%) than the control treatment. Moreover, MOS at0.1% and 0.2% in chickens diet increased hemoglobin, RBC,and WBC compared with those in the other treatments.
The effect of BP on plasma metabolites could beattributable to its contents of vitamins, minerals, andphospholipids (Leja et al., 2007) and antioxidant effects(Quian et al., 2008; Šaric et al., 2009). In addition, thedecrease in plasma cholesterol could be due to phospho-lipids and polyunsaturated fatty acids, particularly linole-nic fatty acid in BP (Xu et al., 2009). The increase in linoleicacid because of BP supplementation amounted to0.00357 g/kg diet. The effects of Pro on triglycerides,cholesterol, urea, and creatinine are in agreement withthose reported by Kolankaya et al. (2002) and Fuliang et al.(2005). This might be due to the influence of Pro on lipidmetabolism (Matsui et al., 2004). Similar to the presentfindings, Nirala et al. (2008) and Newairy et al. (2009)indicated that Pro induced reduction in the plasma AST inrats. However, we have to consider that AST (mitochon-drial enzyme) is considered a less specific for liver functionthan other enzymes because it can also be found in manyperipheral tissues (such as muscles) and, hence, has a veryhigh variability (Moniello et al., 2005; Bovera et al., 2007).
El-Kott and Owayss (2008) showed that oral Pro extract at150 mg/kg BW to male mice for 8 week did not affect AST,ALT, and alkaline phosphatase.
Supplementing BP, Pro, or MOS continuously or inter-mittently was equally effective to improve growth perfor-mance and increase dressing carcass of broiler chickens.There was no synergetic effect between BP and Pro ongrowth performance, indicating that both BP or Pro areadequate to enhance the productive performance of broi-ler chickens. The intermittent administration of all thesupplements did not strongly modify the different vari-ables compared with the continuous administration.
Conflict of interest statement
The authors certify that they have no affiliations with orinvolvement in any organization or entity with any financialinterest (such as honoraria, educational grants, participationin speakers’ bureaus, membership, employment, consultan-cies, stock ownership or other equity interest, experttestimony, or patent-licensing arrangements), or non-financial interest (such as personal or professional relation-ships, affiliations, knowledge, or beliefs) in the subjectmatter or materials discussed in this manuscript.
References
AOAC, 2004. Official Methods of Analysis, 18th ed. Assoc. Association ofOfficial Analytical Chemists, Washington, DC, USA.
Attia, Y.A., Hamid, Abd E.L., Ismaiel, E.A., Elnaggar A.S., A.M., 2013. Thedetoxication of nitrate by two antioxidants or a probiotic and theeffects on blood and seminal plasma profiles and reproductivefunction of NZW rabbit bucks. Animal 7, 591–601.
Attia, Y.A., Zeweil, H.S., Alsaffar, A.A., El-Shafy, A.S., 2011a. Effect of non-antibiotic feed additives as an alternative to flavomycin on broilerchickens production. Arch. Geflügelkd. 75, 40–48.
Attia, Y.A., Al-Hanoun, A.M., Bovera, F., 2011b. Effect of different levels ofbee pollen on performance and blood profile of New Zealand Whitebucks and growth performance of their offspring during summer andwinter months. J. Anim. Phys. Anim. Nutr. 95, 17–26.
Attia, Y.A., Al-Hanoun, A.M., Tag El-Din, A.E., Bovera, F., Shewika, E., 2011c.Effect of bee pollen levels on productive, reproductive and bloodtraits of NZW rabbits. J. Anim. Phys. Anim. Nutr. 95, 294–303.
Aygun, A., Sert, D., Copur, G., 2012. Effects of propolis on eggshellmicrobial activity, hatchability, and chick performance in Japanesequail (Coturnix coturnix japonica) eggs. Poult. Sci. 91, 1018–1025.
Bankova, V., 2005. Recent trends and important developments in propolisresearch. Evid. Based Complement. Altern. Med. 2, 29–32.
Banskota, A.H., Tezuka, Y., Kadota, S.H., 2001. Recent progress in pharma-cological research of propolis. Phytother. Res. 15, 561–571.
Bovera, F., Marono, S., Di Meo, C., Piccolo, G., Iannaccone, F., Nizza, A.,2010a. Effect of mannanoligosaccharides supplementation on caecalmicrobial activity of rabbit. Animal 4, 1522–1527.
Bovera, F., Nizza, S., Marono, S., Mallardo, K., Piccolo, G., Tudisco, R., DeMartino, L., Nizza, A., 2010b. Effect of mannan oligosaccharides onrabbit performance digestibility and rectal bacterial anaerobic popu-lations during an episode of epizootic rabbit enteropathy. WorldRabbit Sci. 18, 9–16.
Bovera, F., Moniello, G., De Riu, N., Di Meo, C., Pinna, W., Nizza, A., 2007.Effect of diet on the metabolic profile of ostriches (Struthio camelusvar. domesticus). Trop. Anim. Health Prod. 39, 265–270.
Bratter, C., Tregel, M., Liebenthal, C., Volk, H., 1999. Prophylactic effec-tiveness of propolis for immunostimulation a clinical pilot study.Forsch. Komplement. 6, 256–260.
Burdock, G.A., 1998. Review of the biological properties and toxicity ofbee propolis. Food Chem. Toxicol. 36, 347–363.
Cheled-Shoval, S.L., Amit-Romach, E., Barbakov, M., Uni, Z., 2011. Theeffect of in ovo administration of mannan oligosaccharide on smallintestine development during the pre- and posthatch periods inchickens. Poult. Sci. 90, 2301–2310.
Y.A. Attia et al. / Livestock Science 164 (2014) 87–95 93

Author's personal copy
Diarra, M.S., Fred, G.S., Fatoumata, D., Jane, P., Luke, M., Roland, B., Claudie,B., Pascal, D., Susan, B., Brent, J.S., Edward, T., 2007. Impact of feedsupplementation with antimicrobial agents on growth performanceof broiler chickens, clostridium perfringens and enterococcus counts,and antibiotic resistance phenotypes and distribution of antimicro-bial resistance determinants in Escherichia coli isolates. Am. Soc.Microbiol. 73, 6566–6576.
Dimov, V., Ivanovska, N., Bankova, V., Popov, S., 1992. Immunomodulatoryaction of propolis IV. Prophylactic activity against gram-negativeinfections and adjuvant effect of the water-soluble derivative. Vaccine10, 817–823.
Dobrowolski, J.W., Vohora, S.B., Sharma, K., Shah, S.A., Naqvi, S.A.,Dandiya, P.C., 1991. Antibacterial, antifungal, antiamoebic, anti-inflammatory and antipyretic studies on propolis bee products.J. Ethanopharm. 35, 77–82.
Doumas, B.T., Watson, W.A., Biggs, H.G., 1971. Albumin standards and themeasurement of serum albumin with bromocresol green. Clin. Chem.Acta 31, 87–96.
Eilers, R.J., 1967. Notification of final adoption of an international methodand standard solution for hemoglobinometry specifications for pre-paration of a standard solution. Am. J. Clin. Pathol. 47, 212–214.
El-Kott, A.F., Owayss, A.A., 2008. Protective effects of propolis against theamitraz hepatotoxicity in mice. J. Pharmacol. Toxicol. 35, 402–408.
El-Sheikh, A.M.H., Abdalla, E.A., Hanafy Maysa, M., 2009. Study onproductive performance, hematological and immunological para-meters in local strain of chicken as affected by mannan oligosacchar-ide under hot climate. Egypt. Poult. Sci. J. 29, 287–305.
Fabiny, D.L., Ertingshausen, G., 1971. Automated reaction rate method forthe determination of serum creatinine with the Centerfi. Clin. Chem.17, 696–700.
Freitas, S.F., Shinohara, L., Sforcin, J.M., Guimarães, S., 2006. in vitro effectsof propolis on Giardia duodenalis trophozoites. Phytomedicine 13,170–175.
Fuliang, H.U., Hepburn, H.R., Xuan, H., Chen, M., Daya, S., Radloff, S.E.,2005. Effects of propolis on blood glucose, blood lipid and freeradicals in rats with diabetes mellitus. Pharmacol. Res. 51, 147–152.
Galal, A., Abd El-Motaal, A.M., Ahmed, A.M.H., Zaki, T.G., 2008. Productiveperformance and immune response of laying hens as affected bydietary propolis supplementation. Int. J. Poult. Sci. 7, 272–278.
Gekker, G., Hu, S., Spivak, M., Lokensgard, J.R., Peterson, P.K., 2005. Anti-HIV-1 activity of propolis in CD4þ lymphocyte and microglial cellcultures. J. Ethnopharmacol. 102, 158–163.
Han, Y.J., Nunes, J.C., Xavier, D., 2010. Signaling status with luxury goodsthe role of brand prominence. J. Market. 74, 15–30.
Haro, A., Lopez-Aliaga, F., Lisbona, M., Barrionuevo, M.J., Alferez, M.,Campos, M.S., 2000. Beneficial effect of pollen and propolis on themetabolism of iron, calcium, phosphorous, and magnesium in ratswith nutritional ferropenic anemia. J. Agric. Food Chem. 48,5715–5722.
Hassan, M.G., Abdulla, T.A., 2011. The effect of propolis feed supplemen-tation on hygiene and performance. Iraqi J. Vet. Sci. 25, 77–82.
Henry, R.J., Cannon, D.C., Winkelman, J.W., 1974. Clinical ChemistryPrinciples and Techniques. Harpers and Row Publication, London, UK415.
Hepler, O.E., 1966. Manual of Clinical Laboratory Method. Thomas,Springfield, IL, USA.
Hooge, D.M., 2004a. Meat-analysis of broiler chicken pen trials evaluatingdietary mannan oligosaccharide 1993–2003. Int. J. Poult. Sci. 3, 163–174.
Hooge, D.M., 2004b. Turkey pen trials with dietary mannan oligosacchar-ides Meta analysis, 1993–2003. Int. J. Poult. Sci. 3, 179–188.
Hu, F., Xuan, H., Zhu, W., Chen, M., Ying, H., 2003. Effects of pollen andpropolis on diabetes mellitus SD rats. Apicult. China 54, 9–11.
Ito, J., Chang, F.R., Wang, H.K., 2001. Anti-AIDS agents. 48. Anti-HIV activityof moronic acid derivatives and the new melliferone-related triterpe-noid isolated from Brazilian propolis. J. Nat. Prod. 64, 1278–1281.
Kacániová, M., Rovná, K., Arpásová, H., Cubon, J., Hleba, L., Pochop, J.,Kunová, S., Hascík, P., 2012. in vitro and in vivo antimicrobial activityof propolis on the microbiota from gastrointestinal tract of chickens.J. Environ. Sci. Health 47, 1665–1671.
Kocher, A., 2006. Interfacing gut health and nutrition: the use of dietarypre- and probiotics to maximise growth performance in pigs andpoultry. In: Barug, D., de Jong, J., Kies, A.K., Verstegen, M.W.A. (Eds.),Antimicrobial Growth Promoters, Wageningen Academic Publishers,The Netherlands, pp. 289–310.
Kolankaya, D., Selmanoghlu, G., Sorkun, K., Salih, B., 2002. Protectiveeffects of Turkish propolis on alcohol induced serum lipid changesand liver injury in male rats. Food Chem. 78, 213–217.
Krol, W., Czuba, Z., Scheller, S., Gabrys, J., Grabiec, S., Shani, J., 1990.Antioxidant property of ethanolic extract of propolis EEP as evaluated
by inhibiting the chemiluminescence oxidation of huminal. Biochem.Int. 21, 593–597.
Lee, S.W., Kim, H.J., Hwangbo, S., 2001. Studies on the chemical char-acteristic of Korean propolis. J. Korean Soc. Food Sci. Anim. Res. 21,383–388.
Leja, M., Mareczek, A., Wyzgolik, G., Klepacz, J., Czekońska, K., 2007.Antioxidative properties of bee pollen in selected plant species. FoodChem. 100, 237–240.
Marcucci, M.C., 1995. Propolis chemical composition, biological proper-ties and therapeutic activity. Apidologie 26, 83–99.
Markham, K.E., Mitchel, K.A., Wilkins, A.L., Daldy, J.A., Lu, Y., 1996. HPLCand GC–MS identification of the major organic constituents in NewZealand propolis. Phytochemistry 42, 205–211.
Matsui, T., Ebuchi, S., Fujise, T., Abesundara, K.J., Doi, S., Yamada, H.,Matsumoto, K., 2004. Strong antihyperglycemic effects of water-soluble fraction of Brazilian propolis and its bioactive constituent,3,4,5-tri-ocaffeoylquinic acid. Biol. Pharm. Bull. 27, 1797–1803.
Moniello, G., Bovera, F., Solinas, I.L., Piccolo, G., Pinna, W., Nizza, A., 2005.Effect of age and blood collection site on the metabolic profile ofostriches. S. Afr. J. Anim. Sci. 35, 268–272.
NRC, 1994. Nutrient Requirements of Poultry, 9th rev. ed. NationalAcademies Press, Washington, DC, USA.
Newairy, A.A., Salama, A.F., Hussien, H.M., Yousef, M.I., 2009. Propolisalleviates aluminium-induced lipid peroxidation and biochemicalparameters in male rats. Food Chem. Toxicol. 47, 1093–1098.
Nirala, S.K., Bhadauria, M., Shukla, S., Agrawal, O.P., Mathur, A., Li, P.Q.,Mathur, R., 2008. Pharmacological intervention of tiferron andpropolis to alleviate beryllium-induced hepatorenal toxicity. Fundam.Clin. Pharmacol. 22, 403–415.
Omar, R.E.M., Mahmoud, E.A., Karousa, M.M., Randa, S.A., 2002. Effect ofadditives propolis and nigella sativa seed oil on some behaviourialpatterns, performance products and blood parameters in Sassochickens. Egypt. Poult. Sci. J. 21, 140–151.
Orsi, R.O., Sforcin, J.M., Funari, S.R.C., Bankova, V., 2005. Effects ofBrazilian and Bulgarin propolis on bactericidal activity of macro-phages against Salmonella typhimurium. Int. J. Immunopharmacol. 5,359–368.
Orsi, R.O., Sforcin, J.M., Funari, S.R.C., Fernandes, J.R.A., Bankova, V., 2006.Synergistic effect of propolis and antibiotics on Salmonella typhi.Braz. J. Microbiol. 37, 108–112.
Ozpinar, H., Erhard, M., Ahrens, F., Kutay, C., Eseceli, H., 2010. Effects ofvitamin E, vitamin C and mannanoligosaccharide Bio-Mos supple-ments on performance and immune system in broiler chicks. J. Am.Vet. Adv. 9, 2647–2654.
Popiela-Pleban, E., Roman, A., Dobrzanski, Z., Pogoda-Sewerniak, K.,Opalinski, S., Korczynski, M., 2012. Effect of propolis and bee pollensupplementation on selected blood parameters of laying hens. In:Book of Abstracts, World's Poult. Sci. J. (Suppl. 1) 659. The 24th WorldPoultry Congress August 5–9, Salvador, BA, Brazil.
Quian, W.L., Khan, Z., Atson, D.G., Fearnley, J., 2008. Analysis of sugars inbee pollen and propolis by ligand exchange chromatography incombination with pulsed amperometric detection and mass spectro-metry. J. Food Compos. Anal. 21, 78–83.
Reitman, S., Frankel, S., 1957. A colorimetric method for the determina-tion of serum glutamic oxaloacetate and glutamic pyruvic transami-nases. Am. J. Clin. Pathol. 28, 56–62.
Rosen, G.D., 2007. Holo-analysis of the efficacy of Bio-Mos in broilernutrition. Br. Poult. Sci. 48, 21–26.
Salomão, K., Dantas, A.P., Borba, C.M., Campos, L.C., Machado, D.G., Neto, F.R.A., De Castro, S.L., 2004. Chemical composition and microbialactivity of extracts from Brazilian and Bulgarian propolis. Lett. Appl.Microbiol. 38, 87–92.
Sampson, E.J., Baird, M.A., Burtis, C.A., Smith, E.M., Witte, D.L., Bayse, D.D.,1980. A coupled-enzyme equilibrium method for urea measuring inserum. optimization and evaluation of the AACC study group on ureacandidate reference method. Clin. Chem. 26, 816–826.
Šaric, A., Balog, T., Sobocance, S., Kusis, B., Šverko, V., Rusak, G., Likic, S.,Bubalo, D., Pinto, B., Real, D., Marotti, T., 2009. Antioxidant effects offlavonoid from Crotain Cystus incanus L. rich bee pollen. Food Chem.Toxicol. 47, 547–554.
SAS, 2003. Statistical Analyses Software. The SAS System for Windows,Release 9.1.3 Service pack 2, TS-level 01M3. SAS Institute Inc., Cary,NC, USA.
Scazzochio, F., D'Auria, F.D., Alessandrini, D., Pantanella, F., 2006. Multi-factorial aspects of antimicrobial activity of propolis. Microbiol. Res.161, 327–333.
Selmanoğlu, G., Hayretdağ, S., Kolankaya, D., Tüylü, A.Ö., Sorkun, K., 2009.The effect of pollen on some reproductive parameters of male rats.Pestic. Phytomed. 24, 59–63.
Y.A. Attia et al. / Livestock Science 164 (2014) 87–9594

Author's personal copy
Sforcin, J.M., 2007. Propolis and the immune system: a review. JEthnopharmacol. 113 (1), 1–14.
Spring, P., Wenk, C., Dawson, A.K., Newman, E.K., 2000. The effects ofdietary mannanoligosaccharides on cecal parameters and the con-centrations of enteric bacteria in the ceca of Salmonella-challengedbroilers chicks. Poult. Sci. 79, 205–211.
Teshfam, M., Vahdatpour, T., Nazerad, K., Ahmadias, N., 2011. Effects offeed additives on growth-related hormones and performance ofJapanese quail Coturnix japonica. J. Anim. Vet. Adv. 10, 721–827.
Viuda-Martos, M., Ruiz-Navajas, Y., Fernández-López, J., Pérez-Alvarez, J.A.,2008. Functional properties of honey, propolis, and royal jelly. J. FoodSci. 73, R117–124.
Wang, J., Li, S., Wang, Q., Xin, B., Wang, H., 2007. Trophic effect of beepollen on small intestine in broiler chickens. J. Med. Food 102,276–280.
Watson, D., 1960. A simple method for determination of serum choles-terol. Clin. Chem. Acta 5, 637–643.
Xu, X., Sun, L., Dong, J., Zhang, H., 2009. Breaking the cell of rape beepollen and consecutive extraction of functional oil with supercriticalcarbon oxide. Innov. Food Sci. Emer. Technol. 10, 42–46.
Yang, Y., Iji, P.A., Kocher, A., Thomson, E., Mikkelsen, L.L., Choct, M., 2008.Effects of mannanoligosaccharide in broiler chicken diets on growthperformance, energy utilisation, nutrient digestibility and intestinalmicroflora. Br. Poult. Sci. 49, 186–194.
Y.A. Attia et al. / Livestock Science 164 (2014) 87–95 95