FI Published
28
Fundamenta Informaticae 124 (2013) 63–90 63 DOI 10.3233/FI-2012-825 IOS Press Unsupervised Tracking, Roughness and Quantitative Indices Sankar K. Pal ∗ , Debarati Chakraborty Center for Soft Computing Research, Indian Statistical Institute, 203 B. T. Road, Kolkata 700108, India [email protected]; [email protected] Abstract. This paper presents a novel methodology for tracking a single moving object in a video sequence applying the concept of rough set theory. The novelty of this technique is that it does not consider any prior information about the video sequence unlike many existing techniques. The first target model is constructed using the median filtering based foreground detection technique and af- ter that the target is reconstructed in every frame according to the rough set based feature reduction concept incorporating a measure of indiscernibility instead of indiscernibility matrix. The area of in- terest is initially defined roughly in every frame based on the object shift in the previous frames, and after reduction of redundant features the object is tracked. The measure of indiscernibility of a fea- ture is defined based on its degree of belonging (DoB) to the target. Three quantitative indices based on rough sets, feature similarity and Bhattacharya distance are proposed to evaluate the performance of tracking and detect the mis-tracked frames in the process of tracking to make those corrected. Un- like many existing measures, the proposed ones do not require to know the ground truth or trajectory of the video sequence. Extensive experimental results are given to demonstrate the effectiveness of the method. Comparative performance is demonstrated both visually and quantitatively. Keywords: Rough Set, Unsupervised Tracking, Feature Reduction, Bhattacharya distance, moving ob- ject segmentation. 1. Introduction In computer vision detection and tracking of moving objects is a very important problem. Application of object tracking in video sequences has been studied over the years. It is used to perform the tasks like * Address for correspondence: Center for Soft Computing Research, Indian Statistical Institute, 203 B. T. Road, Kolkata 700108, India
Transcript of FI Published
Fundamenta Informaticae 124 (2013) 63–90 63
DOI 10.3233/FI-2012-825
IOS Press
Unsupervised Tracking, Roughness and Quantitative Indices
Sankar K. Pal∗, Debarati ChakrabortyCenter for Soft Computing Research,
Indian Statistical Institute,
203 B. T. Road, Kolkata 700108, India
[email protected]; [email protected]
Abstract. This paper presents a novel methodology for tracking a single moving object in a videosequence applying the concept of rough set theory. The novelty of this technique is that it does notconsider any prior information about the video sequence unlike many existing techniques. The firsttarget model is constructed using the median filtering based foreground detection technique and af-ter that the target is reconstructed in every frame according to the rough set based feature reductionconcept incorporating a measure of indiscernibility instead of indiscernibility matrix. The area of in-terest is initially defined roughly in every frame based on the object shift in the previous frames, andafter reduction of redundant features the object is tracked. The measure of indiscernibility of a fea-ture is defined based on its degree of belonging (DoB) to the target. Three quantitative indices basedon rough sets, feature similarity and Bhattacharya distance are proposed to evaluate the performanceof tracking and detect the mis-tracked frames in the process of tracking to make those corrected. Un-like many existing measures, the proposed ones do not require to know the ground truth or trajectoryof the video sequence. Extensive experimental results are given to demonstrate the effectiveness ofthe method. Comparative performance is demonstrated both visually and quantitatively.
Keywords: Rough Set, Unsupervised Tracking, Feature Reduction, Bhattacharya distance, moving ob-ject segmentation.
1. Introduction
In computer vision detection and tracking of moving objects is a very important problem. Applicationof object tracking in video sequences has been studied over the years. It is used to perform the tasks like∗Address for correspondence: Center for Soft Computing Research, Indian Statistical Institute, 203 B. T. Road, Kolkata 700108,India
64 S.K. Pal and D. Chakraborty / Unsupervised Tracking, Roughness and Quantitative Indices
motion based recognition, traffic monitoring and automated surveillance [29, 27, 13, 15]. In the task ofobject tracking there are different types of uncertainties and ambiguities. These arise due to the reasonslike loss of information caused by projection of the 3D world on a 2D image, noise, complex objectmotion and presence of regions with similar features.
The ambiguities and uncertainties are handled in various ways, e.g., using statistical and probabilisticmethods, fuzzy sets and fuzzy logic [8], kernel based method [5, 23]. Over the years researchers havebeen trying to improve the accuracy and speed both in detection and tracking. These methods can broadlybe of two types. In one kind of approach prior knowledge about the number and the size of objects, or theobject appearance and shape were required [29]. The other approach is based on background estimation[3, 25, 6, 12] which, in turn, needs several input frames available to approximate the background model.But, in practical scenario the prior knowledge is not always available. There may also not be enoughinput frames to estimate the background. We have taken into account the aforesaid issues and proposeda method for tracking which does not need prior knowledge about the sequence. We have shown roughset theory as an effective tool for handling the uncertainties.
Theory of rough sets [17] has recently become a popular mathematical framework for image pro-cessing problems [22, 16]. The focus of the theory is on the ambiguity caused by limited discernibilityof objects in the domain of discourse. Its key concepts are those of object ‘indiscernibility’ and ‘set ap-proximation’. The primary use of rough set theory has so far mainly been in generating logical rules forclassification and prediction [24]; thereby making it a prospective tool for various tasks including patternrecognition, image processing, feature selection, data mining and knowledge discovery from large datasets. Use of rough set rules based on reducts has significant role for dimensionality reduction/featureselection by discarding redundant features [26]; thereby having potential application for mining largedata sets [11]. Rough set theory is an intelligent technique for managing uncertainty that is used for thediscovery of data dependencies, to evaluate the importance of attributes, to discover patterns in data, toreduce redundancy, and to recognize and classify objects [9, 26, 28, 18]. Though the concept of rough sethas been applied in several areas of pattern recognition, its use in the problem of object tracking has notbeen addressed adequately. For example, Dai et al. [7] used rough set rule reduction concept to controlmoving camera, Jalal et al. [10] performed the task of tracking using rough entropy in wavelet domain.Reduction of knowledge is very necessary to solve the problem of object tracking and rough set theoryis proven to be effective for this task.
The objective of the present paper is to develop an unsupervised method using the concept of featurereduction in rough set theory for object tracking from a video sequence shot by a still camera withouthaving any prior knowledge about the sequence and the object. It is assumed that, the object is movingneither very fast nor very slow from frame to frame initially; there is not much feature variation amongobject model in the initial frames neither due to external effect (such as, lightning change) nor dueto object movement (such as change in color or shape); the object does not have huge color variationwithin itself and it does not have similar features as the background. The initial target is modeled usingthe median filtering based background estimation technique [6]. The problem of tracking has beendepicted as a task of reducing a set of pixels from the current frame as closed to that in the targetmodel using rough set theory. Here the degree of belonging (DoB) of a pixel to the object region isdetermined in terms of its color and spatial information. So, the issue of reduction of knowledge playsthe key role here. This method of reduction of features also eliminates the other objects that mightappear in the region of interest. Three measures based on rough set theory and pixel distribution toevaluate the performance of tracking have been defined. Unlike other measures [13, 2, 14, 15], the
S.K. Pal and D. Chakraborty / Unsupervised Tracking, Roughness and Quantitative Indices 65
proposed ones do not require the information of ground truth or the trajectory of the sequence. Theseindices reflect nearly similar results to those obtained by the measure based on ground truth (centroiddistance). The measure based on Bhattacharya distance considers bins of unequal size to represent thetarget. Its appropriateness and effectiveness in detecting the mis-tracked frames vs. bins of equal sizeis also experimentally demonstrated. This measures are also used to detect the mis-tracked frames inthe process of tracking and those results are corrected then by using the magnitudinous and directionalobject shift information from the previous frames.
The article is organized as follows. In Section 2 we have described the basic concepts and featuresof rough set theory required for the development of the proposed methodology. In Section 3 we haveexplained the method of tracking along with a block diagram. Section 4 describes the correspondingalgorithm. Three new measures to evaluate the performance of tracking are defined in Section 5. Detailsof experimental results on different types of data sets with comparison are shown in Section 6. Compar-ison is made with mixture of Gaussian (MoG) and mean shift tracking methods. Section 7 concludes thearticle.
2. Rough Sets: Reduct and Core
Let A = ⟨U,R⟩ be an information system. For a given set S, a subset of attributes, let R determinesthe approximation space RS = (U, IND(R) in S. Let X be a set in universe U (X ⊆ U ) to beapproximated based on the set of equivalent relations ([x]R) defined over R. Then, X is approximatedas R-lower approximation RX and R-upper approximation RX in RS. They are defined as follows:
RX = {x ∈ U : [x]R ⊆ X} (1)
RX = {x ∈ U : [x]R ∩X = ∅} (2)
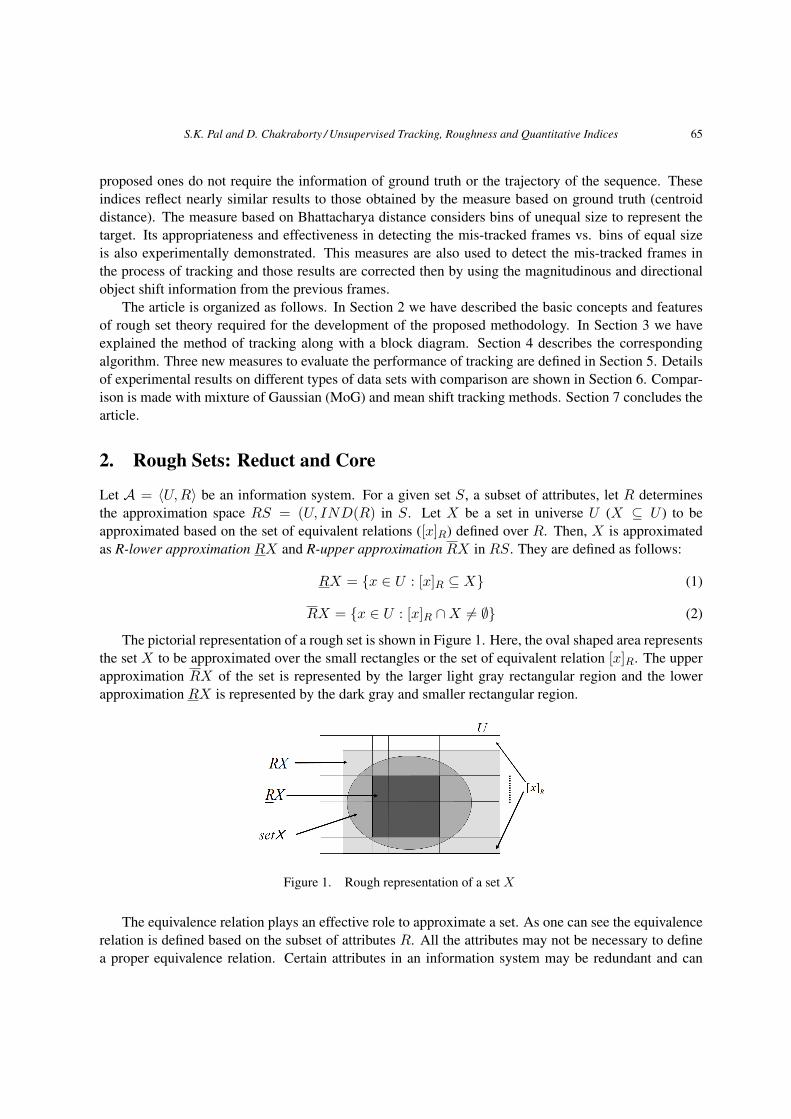
The pictorial representation of a rough set is shown in Figure 1. Here, the oval shaped area representsthe set X to be approximated over the small rectangles or the set of equivalent relation [x]R. The upperapproximation RX of the set is represented by the larger light gray rectangular region and the lowerapproximation RX is represented by the dark gray and smaller rectangular region.
Figure 1. Rough representation of a set X
The equivalence relation plays an effective role to approximate a set. As one can see the equivalencerelation is defined based on the subset of attributes R. All the attributes may not be necessary to definea proper equivalence relation. Certain attributes in an information system may be redundant and can
66 S.K. Pal and D. Chakraborty / Unsupervised Tracking, Roughness and Quantitative Indices
be eliminated without losing the essential classificatory/ discriminatory information. The procedure ofeliminating those redundant equivalence relation from the point of view of rough sets is as follows.
Let R be a family of equivalent relations and let R ∈ R. R will be said dispensable in R ifIND(R) = IND(R − {R}), otherwise R is indispensable in R. The family of R is independent ifeach R ∈ R is indispensable in R, otherwise it is dependent. Suppose, P ⊆ R, P is independent andIND(P) = IND(R); then, P is called a reduct of R. R may have more than one reduct. The set ofall indispensable relations in R is called the core of R. It can be shown that CORE(R) =
∩RED(R).
This is how the knowledge can be reducted from a knowledge base [17].
2.1. Partial Dependency in Knowledge Base
Theorizing based on drawing inference about the world is another (other than classification) importanttask. In other words, the problem is - how knowledge can be induced from a given knowledge base.
If there is not enough information available for classifying all the data points in a given set, thensome part of that set can be classified by employing the knowledge of some other classifications. Thatpart of the set is known as positive region of the classification with respect to the other classification. Itcan be expressed as:
POSP (Q) =∪
X∈U/Q
PX (3)
where, P and Q are equivalence relations over U and Equation (3) denotes P positive regions of Q. Thedependency between P and Q is measured according to:
k = γP (Q) =cardPOSP (Q)
cardU(4)
If k = 1 then all elements in the universe can be classified to the elementary categories of U/Q byemplyoing the knowledge of P . If k = 1 then only the elements within POSP (Q) can be classified.
All these concepts deal with incompleteness of knowledge. In case of object tracking in video se-quences the knowledge is also incomplete. For example, the object location, its shape and size, andappearance of any other object in the area of interest may not be known to the tracker. To deal with thesekinds of incompleteness we model the aforesaid concepts of rough set theory in order to track an ob-ject. It is expected that, the moving object will have almost similar features throughout the sequence andhence the reduct and core features of frames may give an idea about the object model. In case of practicalapplication, the features with exactly same feature values may not be present in all the frames, rather itwill deviate a bit from frame to frame. Hence, the concept ’Measure of Indiscernibility’is introducedhere, based on which the reduct and core are found out in video . The details of all the implementationsare discussed in the following section.
3. Object Extraction and Tracking
To track an object, proper design of the tracker or the tracking window is very necessary. The pixelswithin the tracker are considered as object pixels to locate and reconstruct the object in the next frame.So, the proper selection of the pixels within the tracker also plays a very important role in tracking. Someunwanted object may appear within the tracker and that may lead to mis-tracking.

S.K. Pal and D. Chakraborty / Unsupervised Tracking, Roughness and Quantitative Indices 67
Our aim is to extract out an object from a video sequence shot with still camera without having anyprior knowledge about the sequence. In the process we want to avoid the unwanted regions within thetracker at the time of reconstructing the object. These are discussed in the following sections.
(a)
(b)
Figure 2. Block diagram of the proposed methodology (a) Initial estimations (b) Tracking
68 S.K. Pal and D. Chakraborty / Unsupervised Tracking, Roughness and Quantitative Indices
3.1. Methodology
The proposed method of video tracking is shown in a block diagram in Figure 2. The first step involvesmodeling of the moving object. We have considered the simple and popular background estimationmethod: median filtering [6] to estimate the the background and extract the initial target model. This isshown in Figure 2(a). This way we can reduce the possibility of distortion caused by noise. We haveconsidered previous five frames in this approach. The difference regions between two consecutive framesfor those frames have been extracted. So, there will be n − 1 nos. of difference images if n previousframes are considered. The rectangular region (assuming that the tracker is rectangular) containing thelargest two segments from each difference image is considered as the object of interest of that frame. Theshifts (i.e., magnitude and direction) of the centers of those rectangles are then calculated and the medianof the shifts is obtained. This information is used to form the search window for pixels if some framewith noise is present in the sequence. Otherwise, the consecutive frame difference will be considered.
To perform the task of tracking the object in the current frame the changed area between the currentframe and the previous frame is extracted out. But, the difference area or region of interest (ROIt) maybe mislead due to presence of noise in the frame. The quantitative indices described in Section 5 areused to determine the presence of noise in a certain frame. That is, if noise is present in a frame thedifference region of that frame is equivalent to mis-tracked one, and k, f and b values or at least one ofthem between the changed region and T Mod will reflect that. If the difference of a frame is found tobe mis-tracked, that region will not be considered as ROIt, rather the probable location for each pixelwill be predicted based on its shift information as shown in Figure 2(b) and that predicted region will betreated as ROIt for that particular frame.
Then, the degree of belonging (DoB) of each pixel in the ROIt with respect to the target model(T Mod) is compared, and if the DoB value of a pixel is within a pre-specified threshold, then, it will beselected as a non-redundant feature, otherwise deducted.
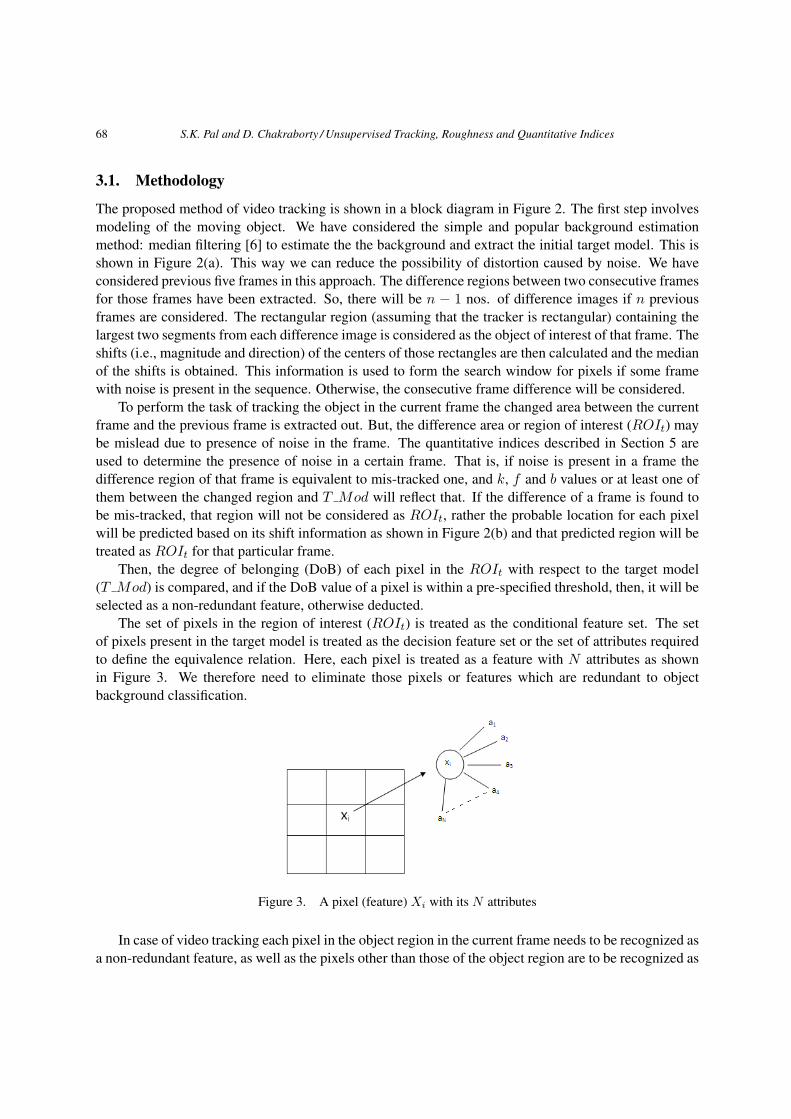
The set of pixels in the region of interest (ROIt) is treated as the conditional feature set. The setof pixels present in the target model is treated as the decision feature set or the set of attributes requiredto define the equivalence relation. Here, each pixel is treated as a feature with N attributes as shownin Figure 3. We therefore need to eliminate those pixels or features which are redundant to objectbackground classification.
Figure 3. A pixel (feature) Xi with its N attributes
In case of video tracking each pixel in the object region in the current frame needs to be recognized asa non-redundant feature, as well as the pixels other than those of the object region are to be recognized as
S.K. Pal and D. Chakraborty / Unsupervised Tracking, Roughness and Quantitative Indices 69
redundant features. We have considered the object model and the region of interest in the current frameas two families of equivalence relations. In other words, we have a set of feature values of T Mod, andwe need to select those features from ROIt which resemble the T Mod closely in terms of N attributes,the remaining features need to be deducted. The said method of pixel reduction is performed based onthe measure of degree of belonging (DoB). The DoB of a pixel in ROI t to the target model is computedusing the N attributes of the pixels at the same and surrounding locations in T Mod. The details of themeasure have been discussed in Section 3.3. If the value of DoB is greater than a certain threshold thenthe feature will be selected, otherwise deducted.
3.2. Object of Interest as a Rough Set
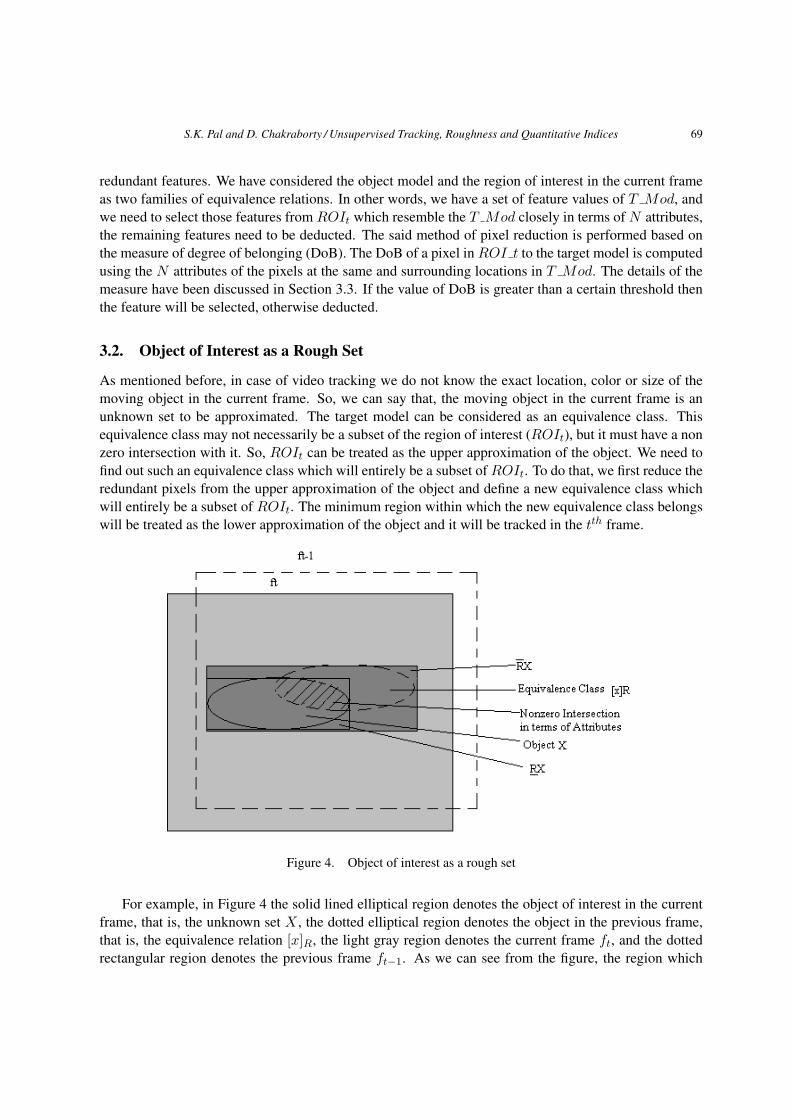
As mentioned before, in case of video tracking we do not know the exact location, color or size of themoving object in the current frame. So, we can say that, the moving object in the current frame is anunknown set to be approximated. The target model can be considered as an equivalence class. Thisequivalence class may not necessarily be a subset of the region of interest (ROIt), but it must have a nonzero intersection with it. So, ROIt can be treated as the upper approximation of the object. We need tofind out such an equivalence class which will entirely be a subset of ROIt. To do that, we first reduce theredundant pixels from the upper approximation of the object and define a new equivalence class whichwill entirely be a subset of ROIt. The minimum region within which the new equivalence class belongswill be treated as the lower approximation of the object and it will be tracked in the tth frame.
Figure 4. Object of interest as a rough set
For example, in Figure 4 the solid lined elliptical region denotes the object of interest in the currentframe, that is, the unknown set X , the dotted elliptical region denotes the object in the previous frame,that is, the equivalence relation [x]R, the light gray region denotes the current frame ft, and the dottedrectangular region denotes the previous frame ft−1. As we can see from the figure, the region which
70 S.K. Pal and D. Chakraborty / Unsupervised Tracking, Roughness and Quantitative Indices
has a nonzero intersection with [x]R is the dark gray region or ROIt. So, the dark gray region in ft istreated as upper approximation of X or RX . The minimum region that contains the set of features afterdeduction, that is, the smaller rectangle in the darker gray region is treated as the lower approximationof the object or RX .
3.2.1. Reduct and Core in Video
We can see from the earlier section that initially for a certain frame we are given with the upper approx-imation RX and the set of equivalence relation defined over the set of features Rt−1. As we are dealingwith the video sequence, all the features in the previous frame (Rt−1) may not be present in the ROItor in the upper approximation. So, we need to find out the features similar to Rt−1 in ROIt, in orderto compute the lower approximation of X . From Section 2 we know that a reduct of knowledge is itsessential part, which suffices to define all the basic concepts occurring in the considered knowledge. Let,the set of features in RX be defined as Pt. We need to find out a Rt−1-reduct of Pt where each featureis represented in terms of N attributes. This is done according to the forthcoming criterion. A featurePt ⊆ Pt will be reducted if and only if
POS(Pt−Pt)(Rt−1) = POSPt(Rt−1). (5)
The intersection of all the reducts is treated as the core (Section 2). Accordingly, the Rt−1-core ofPt will be treated as the reduced set of features for the new target model and will be treated as Rt at thetime of computing RX .
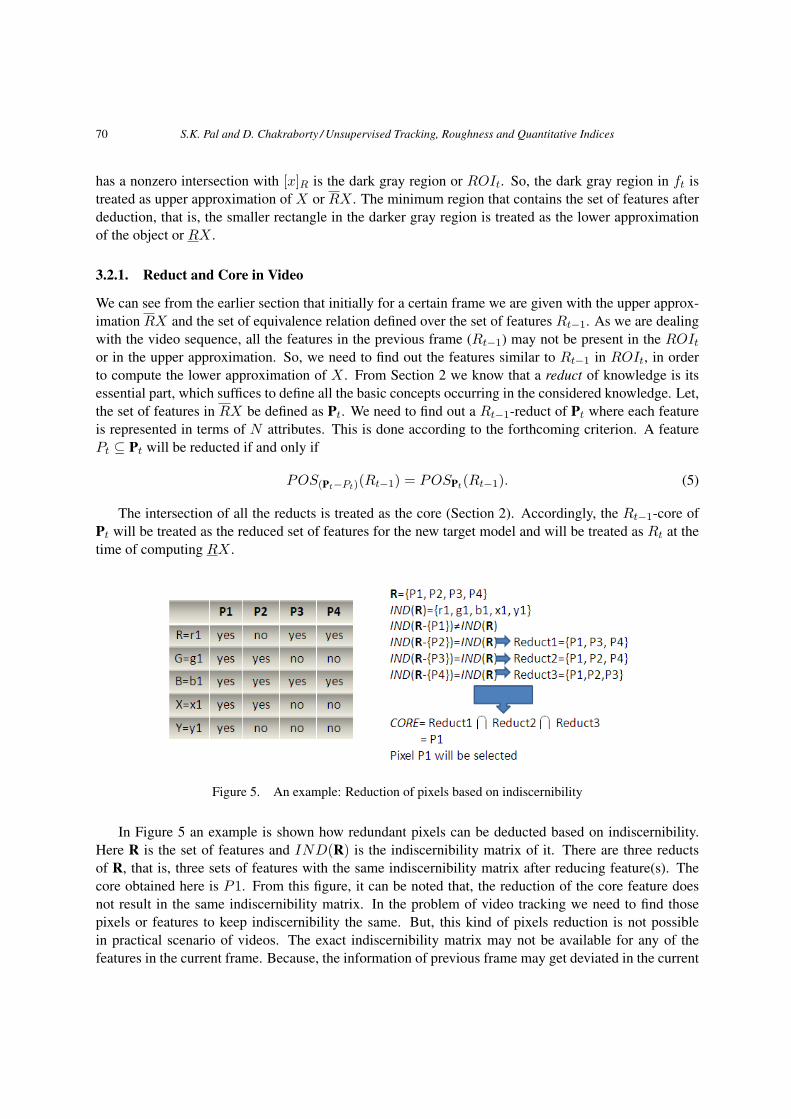
Figure 5. An example: Reduction of pixels based on indiscernibility
In Figure 5 an example is shown how redundant pixels can be deducted based on indiscernibility.Here R is the set of features and IND(R) is the indiscernibility matrix of it. There are three reductsof R, that is, three sets of features with the same indiscernibility matrix after reducing feature(s). Thecore obtained here is P1. From this figure, it can be noted that, the reduction of the core feature doesnot result in the same indiscernibility matrix. In the problem of video tracking we need to find thosepixels or features to keep indiscernibility the same. But, this kind of pixels reduction is not possiblein practical scenario of videos. The exact indiscernibility matrix may not be available for any of thefeatures in the current frame. Because, the information of previous frame may get deviated in the current
S.K. Pal and D. Chakraborty / Unsupervised Tracking, Roughness and Quantitative Indices 71
frame due to the change in object color/ shape/ size. Therefore the concept of exact matching (or exactsimilarity) between frames is not appropriate or meaningful, rather a degree of matching or similaritymay be used. To make this process suitable to videos, we have defined a measure of indiscernibilityrather than considering the exact indiscernibility matrix. The said measure of indiscernibility is referredas degree of belonging (DoB) for feature reduction. In the next section we discuss the measure.
3.3. Measure of Indiscernibility (Degree of Belonging) for a Feature
Let, a feature in the current frame (ft) be represented as M and the set of features similar or nearer to itin the target model (T Mod) be denoted by N . Let the distance between them be expressed as:
d = Dist(M,N) (6)
Where, Dist(.) is the distance function used to compute the distance between M and N . If theinformation on M is exactly the same as that of a features in N , then d will be zero. As the similaritybetween M and N decreases, d increases, the maximum value being unity. Therefore, lower the value ofd, better is the DoB of M to the T Mod.
In case of human vision system (HVS), in a certain range of features, HVS is very sensitive, afteror before that the change in response is less. This characteristics may be incorporated in defining thefunction d to compute the DoB. In case of our experiment, we have used Zadeh’s S-function [30] as thedistance function.
We are given with an equivalence relation (Targ Mod) and a set of features, that is, the probabletarget area. We need to eliminate those features which are redundant with respect to new equivalencerelation to be formed in the current frame. After considering a feature, that is, a pixel in T Mod,we measure the degree of belonging (DoB) with respect to ROIt. This can be done based on pixels’attributes. Several attributes could be used depending upon the problem. We have considered sevenattributes: x, y,R,G,B, ev, eh of a feature to define the distance function. Here, x and y denote thespatial location of a feature (pixel) at ROIt, R, G, B are color values and ev, eh are the vertical andhorizontal edges obtained by using Sobel operator. Further, pixels may not be in the same position atROIt as it is predicted to be. Rather it may get shifted due to its change in velocity or shape or size. So,consideration of a window around the spatial location in ROIt will be more effective than consideringa single pixel. Accordingly, we considered a window of size w1 × w2 centered at its correspondinglocation of ROIt and the feature in the equivalence relation (target model).
Again, it can be said that, some spatial change from the estimated location is more probable, while,the change in other attributes (e,g., color) is less likely. Therefor, to measure the DoB (Equation 10)more weight on the color-edge distance than the spatial distance of pixels has been given in order tohave their proper impact. In our experiment, we have measured the distance in terms of color and edgeattributes (denoted by dcl) and in terms of spatial location (denoted by dsp) between the input featureand the features within the window on ROIt as:
dcl = mini∈(w1×w2)(
∑c=(R,G,B,ev,eh)
|T Modc(xi, yi)−ROItc(x, y)|
3) (7)
dsp = max(|x′ − xs|, |y′ − ys|)/(w/2) (8)
72 S.K. Pal and D. Chakraborty / Unsupervised Tracking, Roughness and Quantitative Indices
where (xs, ys) is the location of the pixel within the window from which the color-edge distance of theinput feature is minimum and x′, y′ is its location at ROIt and w is either w1 or w2 depending on whichaxis is giving maximum distance.
Let the distance of the input feature and the features in the window of the target model be defined(using the aforesaid S-function, and Equations (7) and (8)) as:
d =
0 if dcl ≤ αdsp+2( dcl−α
γ−α)2
2 if α < dcl ≤ βdsp+(1−2( dcl−γ
γ−α)2)
2 if β < dcl ≤ γ
1 if dcl > γ
(9)
The degree of belonging (DoB) of the input feature is measured as:
DoB = 1− d (10)
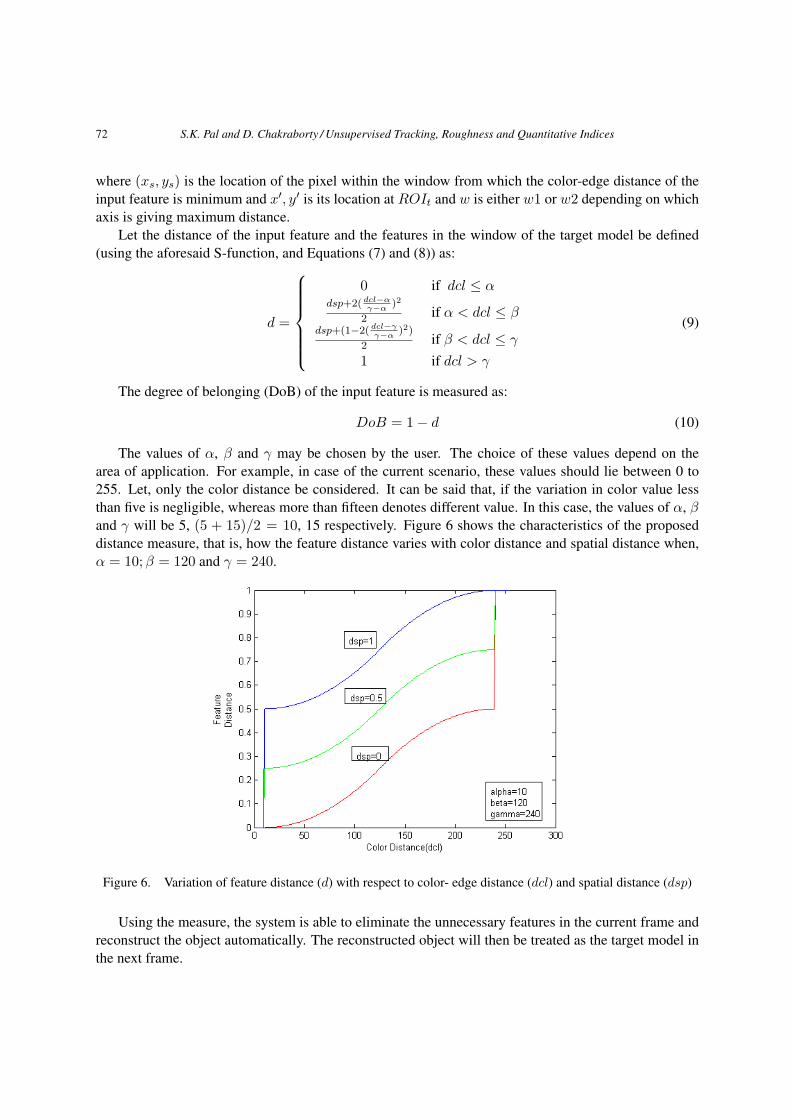
The values of α, β and γ may be chosen by the user. The choice of these values depend on thearea of application. For example, in case of the current scenario, these values should lie between 0 to255. Let, only the color distance be considered. It can be said that, if the variation in color value lessthan five is negligible, whereas more than fifteen denotes different value. In this case, the values of α, βand γ will be 5, (5 + 15)/2 = 10, 15 respectively. Figure 6 shows the characteristics of the proposeddistance measure, that is, how the feature distance varies with color distance and spatial distance when,α = 10;β = 120 and γ = 240.
Figure 6. Variation of feature distance (d) with respect to color- edge distance (dcl) and spatial distance (dsp)
Using the measure, the system is able to eliminate the unnecessary features in the current frame andreconstruct the object automatically. The reconstructed object will then be treated as the target model inthe next frame.
S.K. Pal and D. Chakraborty / Unsupervised Tracking, Roughness and Quantitative Indices 73
4. Algorithm for Tracking
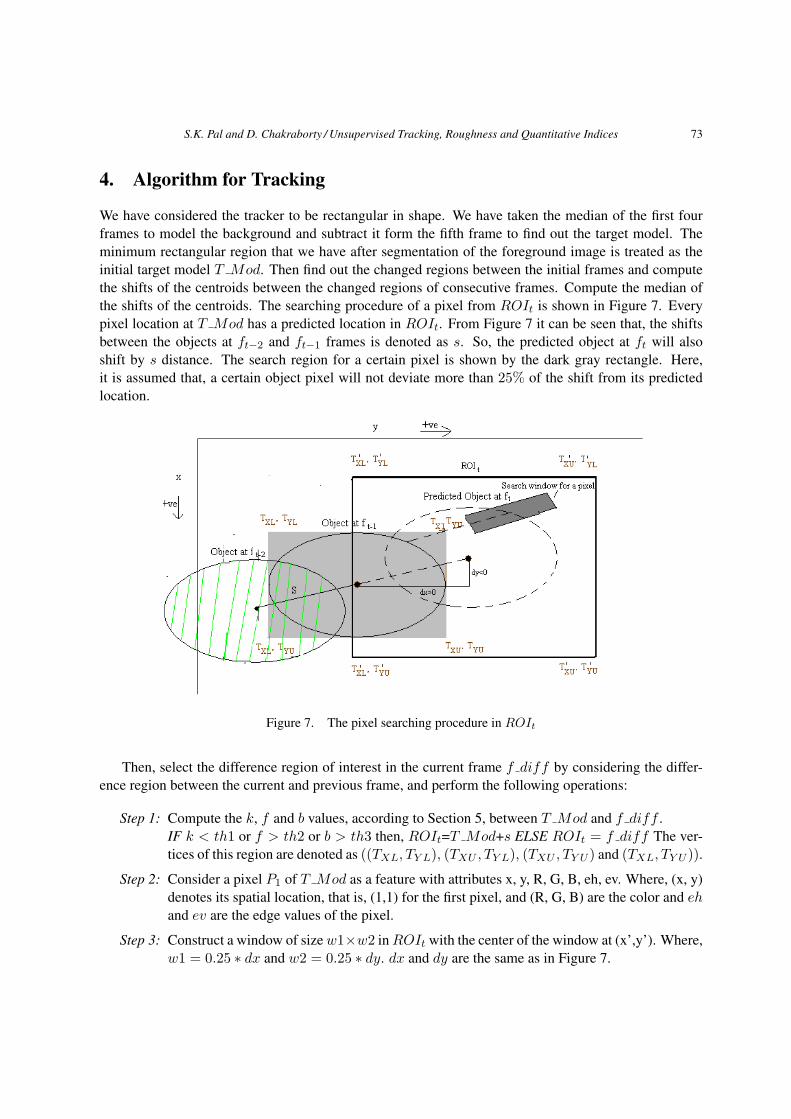
We have considered the tracker to be rectangular in shape. We have taken the median of the first fourframes to model the background and subtract it form the fifth frame to find out the target model. Theminimum rectangular region that we have after segmentation of the foreground image is treated as theinitial target model T Mod. Then find out the changed regions between the initial frames and computethe shifts of the centroids between the changed regions of consecutive frames. Compute the median ofthe shifts of the centroids. The searching procedure of a pixel from ROIt is shown in Figure 7. Everypixel location at T Mod has a predicted location in ROIt. From Figure 7 it can be seen that, the shiftsbetween the objects at ft−2 and ft−1 frames is denoted as s. So, the predicted object at ft will alsoshift by s distance. The search region for a certain pixel is shown by the dark gray rectangle. Here,it is assumed that, a certain object pixel will not deviate more than 25% of the shift from its predictedlocation.
Figure 7. The pixel searching procedure in ROIt
Then, select the difference region of interest in the current frame f diff by considering the differ-ence region between the current and previous frame, and perform the following operations:
Step 1: Compute the k, f and b values, according to Section 5, between T Mod and f diff .IF k < th1 or f > th2 or b > th3 then, ROIt=T Mod+s ELSE ROIt = f diff The ver-tices of this region are denoted as ((TXL, TY L), (TXU , TY L), (TXU , TY U ) and (TXL, TY U )).
Step 2: Consider a pixel P1 of T Mod as a feature with attributes x, y, R, G, B, eh, ev. Where, (x, y)denotes its spatial location, that is, (1,1) for the first pixel, and (R, G, B) are the color and ehand ev are the edge values of the pixel.
Step 3: Construct a window of size w1×w2 in ROIt with the center of the window at (x’,y’). Where,w1 = 0.25 ∗ dx and w2 = 0.25 ∗ dy. dx and dy are the same as in Figure 7.
74 S.K. Pal and D. Chakraborty / Unsupervised Tracking, Roughness and Quantitative Indices
Step 4: Calculate the color-edge distance (dcl) between P1 and all the pixels in the window of theROIt according to Equation (7).
Step 5: Calculate the spatial distance (dsp) according to Equation (8).
Step 6: Compute DoB with Equation (10).
Step 7: Repeat Step 2 to Step 6 for every pixel in T Mod.
Step 8: Select a threshold (Th) for those features with DoB value neither 0 nor 1. (Select it as thethe lower quartile value of those DoB values assuming that more than 75% pixels will be theobject pixels.)
Step 9: Reduct the pixels with DoB less than the threshold (Th), and select the remaining to recon-struct the object model which will be treated as T Mod (size Tx × Ty) in the next frame.Track this region.
Step 10: Design the tracker according to the following in the next frameIF dx > 0 then, Txu = Txu + 1.25s and Txl = Txl − 0.75s ELSE Txu = Txu + 0.75s andTxl = Txl − 1.25sIF dy > 0 then, Tyu = Tyu + 1.25S and Tyl = Tyl − 0.75s ELSE Tyu = Tyu + 0.75s andTyl = Tyl − 1.25s.Here, Tx = Txu + Txl and Ty = Tyu + Tyl.
Step 11: Calculate the frame difference within this rectangular region only and treat it as f diff .
Step 12: Repeat Step 1 to Step 11 for each frame in the video sequence.
5. Measures of Tracking
As we mentioned before, our aim is to find out a way of tracking a moving object without having anyprior knowledge about the video sequence. There exist many techniques to evaluate the performance oftracking. These are mainly of two types. One is based on ground truth and the other one is based on thetrajectory of the sequence [13, 2, 14]. Here we propose three measures (k-index, f -index and b-index) toevaluate the tracking performance without having the knowledge about either ground truth or trajectory.
5.1. Using Partial Dependency of Knowledge
As mentioned in Section 2, POSRt−1(Pt) is the set of all objects which can be classified to elementarycategories of knowledge Pt, employing knowledge Rt−1. We have evaluated the set of attributes T Modbased on the knowledge of previous frame. Here, we can consider, T Mod as Rt − 1 and ROIt as Pt.Similarly, the set which is treated as the reconstructed target model is considered to be POSRt−1(Pt).It is assumed that the moving object model in the frames have several common features, throughout thesequence, and there will be very less change in target models between two consecutive frames as only afew features are likely to be affected. So, the measure of how much part of knowledge of Pt has beenevaluated from knowledge Rt−1 can be a good measure to evaluate the tracking performance. In roughset theory, the aforesaid concept is defined as:
k = γRt−1(Pt) =cardPOSRt−1(P)
cardU(11)
S.K. Pal and D. Chakraborty / Unsupervised Tracking, Roughness and Quantitative Indices 75
where card denotes the cardinality of the set. The higher the value of k is, the more is the dependency.If k = 1, the entire knowledge of Pt has been evaluated by employing the knowledge Rt−1.
Here, we consider the union of T Mod and ROIt as the universe of classes. The k-value reflects howproperly the T Mod can reconstruct the target model in the current frame, thus evaluates the performanceof T Mod. That is, if there is any fault in selection of T Mod, then card(POSRt−1(Pt))) will be smalland card(U) will be large; thereby giving smaller value of k in the tth frame. So, if a frame has smallerk- value, then we can conclude that, the frame is mis-tracked or over-tracked or under-tracked. In otherwords, the k-measure can automatically determine if the target model has been reconstructed properly inthe current frame using the information of the previous frame.
5.2. Using Ratio of Feature Distance to Total Feature
This measure is computed as the ratio of the summation of the feature distance and the total no. offeatures in ROIt. It can be written as:
f =
F∑i=1
Disti
F(12)
Where, F is the total no. of features and Dist is the same as in Equation 6. It is expected that, all thepixels of object model in the previous frame will be present in the current frame with a certain shift in thecurrent frame. Then, the feature distance will be zero for each feature. Henceforth, it can be concludedthat, if the summation of feature distance is small, then, the value of f will also be small. That meansthere exist more pixels with value of DoB high. So, the lower value of f for a frame indicates the bettertracking in the frame. Any frame having a value of f greater than a certain threshold will be said to bemis-tracked or over-tracked (the tracker contains more redundant features) or under-tracked (the trackerdoes not contain sufficient features to define the equivalence classes).
5.3. Using Target Representation and Bhattacharya Distance
The color distributions of the target model and reconstructed object are considered in this measure. Here,a target is represented based on the distributions of the levels in the target model and the tracked region.We have divided the total range of levels into m number of bins/ segments. The size of a bin is dependenton the no. of occurrence of the pixels of the levels within that bin; thereby making it wider for levelswith higher number of occurrence.
In case of video tracking, the object model region and tracked region are supposed to contain pixelswith similar levels. It can be said that the levels where the occurrences of pixels are maximum in boththe target model and tracked region are similar. Further, the probability of deviation in the levels withsuch maximum occurrence of pixels would be higher than those for the levels with less occurrence ofpixels.
Let, pu be the occurrence of pixels in the uth bin and be represented as: pu =n∑
i=1δ[bin(xi)−u] with
δ: Kronecker delta function, bin(xi): the bin where the ith pixel is and n: total number of pixels in theregion. Then, the sizes of the bins are defined in terms of the following ratio: ui : u2 : .. : uj : .. : um =
76 S.K. Pal and D. Chakraborty / Unsupervised Tracking, Roughness and Quantitative Indices
p1 : p2 : .. : pj : .. : pm. The target model is represented as:
puj =n∑
i=1
δ[bin(xi)− uj ] (13)
Let quj characterize the tracked regions corresponding to the uthj bin. Then Bhattacharya distance be-tween puj and quj is:
b = 1−m∑j=1
√(pujquj ) (14)
As b represents the distance between two distributions, lower value of b reflects better tracking.
(a)
(b) (c)
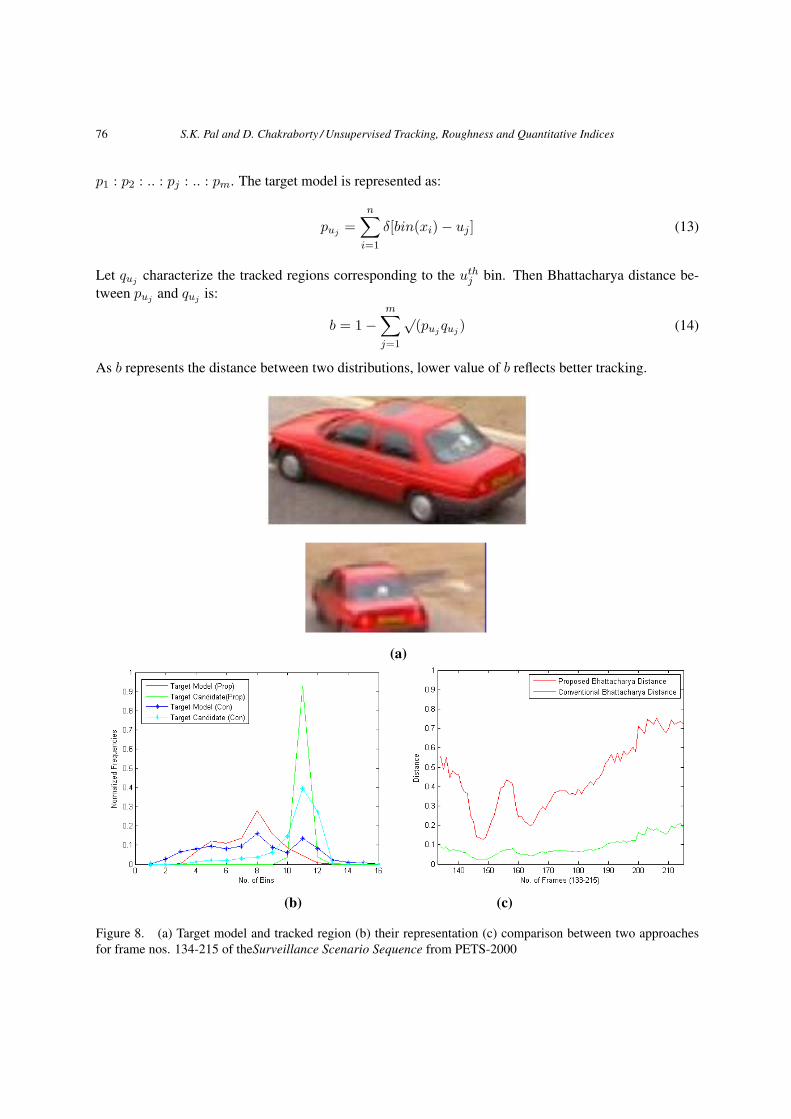
Figure 8. (a) Target model and tracked region (b) their representation (c) comparison between two approachesfor frame nos. 134-215 of theSurveillance Scenario Sequence from PETS-2000
S.K. Pal and D. Chakraborty / Unsupervised Tracking, Roughness and Quantitative Indices 77
Note that, a method for object tracking based on Bhattacharya distance was explained by Comman-icu et al. [5]. However, unlike our approach, the object was represented with bins of equal size. Wecan see from Figure 8 that the consideration of unequal histogram bins results in more clear seperabilil-ity between the target model and the target candidate (tracked region). Here, frame nos. 134-215 oftheSurveillance Scenario Sequence from PETS-2000 are shown, as an example. From Figure 8(b) theseperability corresponding to the target model and tracked region (as in Figure 8(a)) is seen to be muchlarger, while in Figure 8(c) the Bhattacharya distance throughout the sequence is seen to be much higherwith clear peaks and valleys; thereby making it easier to find out the mis-tracked frames.
Note: From the above three indices of tracking, it can be noted that, k-index measures the knowledgedependency between the target model and tracked region. The resulting decision on tracking using k-index may be wrong if the size of the object changes rapidly. For example if the object appears suddenlymuch bigger than it was in the previous frame, then without having the whole object as the tracked region,or having the same sized tracked region as it was there in the previous frame, the k-value may get higherwhich should not be the case. f -index determines the pixel-wise similarity between these two regionsconsidering the neighborhood effect. This measure may also fail similarly if the background containssimilar attributes. b-index is based on the similarity between color histograms of the two regions. Ifthere is a huge change in color between two frames’ object model, then, tracking the right object maybe detected as mis-tracked by this measure. Though the three indices of tracking have some limitationindividually, they may be used together to supplement the other. For example, the sudden change inobject size can be detected by b-index, while the huge change in color can be detected by k-index. Noneof the measures could be claimed as the best among the three in all scenarios as these are stronglyapplication dependent.
6. Results and Discussions
Experiments were conducted to demonstrate the effectiveness of the proposed method in: removingthe unwanted regions within a tracker automatically and reconstructing the object, tracking the movingobject, and identifying the mis-tracked frames. The new quantitative indices (k-index, f -index and b-index) based on rough sets are used to measure the performance. Comparative results with two otherpopular techniques are also shown.
We have performed our experiments with different types of data sets from PETS-2000 [19], PETS-2001 [20], PETS-2004 [21], AVSS-2007 [1]. However, to limit the size of the paper, we have shownsome of the results only.
6.1. Reconstruction
The procedure of reconstruction has been discussed previously. This section will show how our proposedalgorithm can eliminate the unwanted regions as redundant features.
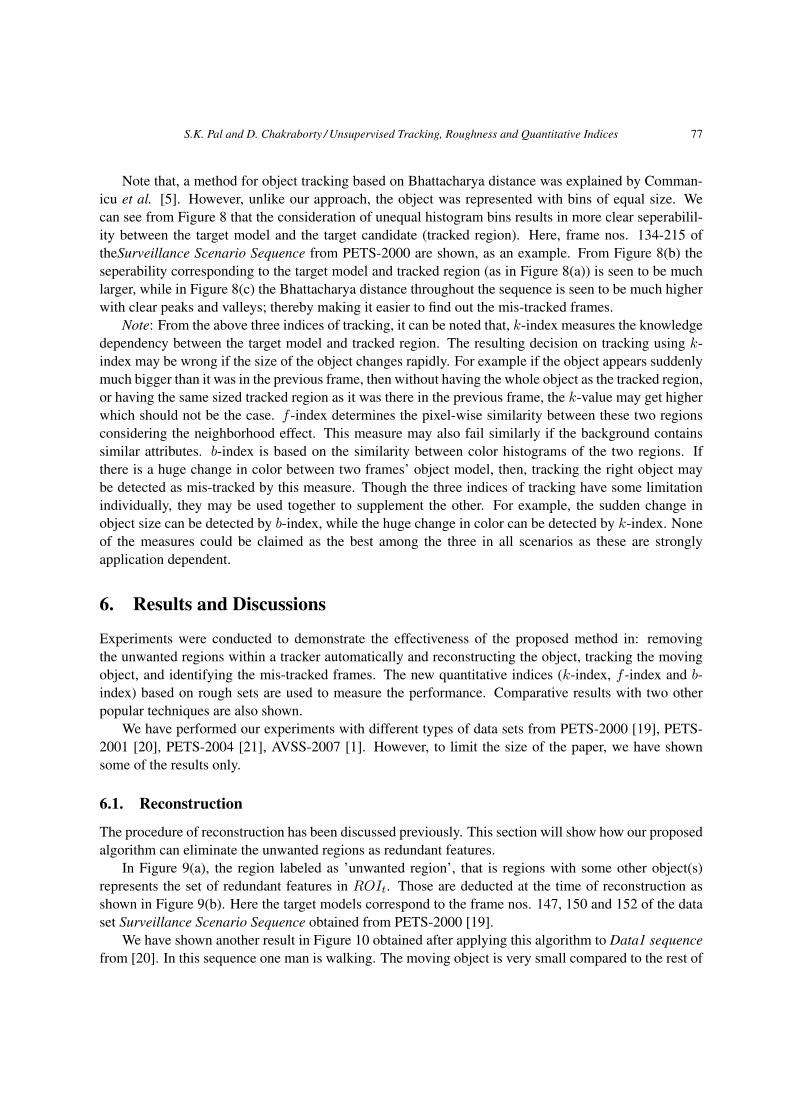
In Figure 9(a), the region labeled as ’unwanted region’, that is regions with some other object(s)represents the set of redundant features in ROIt. Those are deducted at the time of reconstruction asshown in Figure 9(b). Here the target models correspond to the frame nos. 147, 150 and 152 of the dataset Surveillance Scenario Sequence obtained from PETS-2000 [19].
We have shown another result in Figure 10 obtained after applying this algorithm to Data1 sequencefrom [20]. In this sequence one man is walking. The moving object is very small compared to the rest of
78 S.K. Pal and D. Chakraborty / Unsupervised Tracking, Roughness and Quantitative Indices
(a)
(b)
Figure 9. The reconstruction results on frame nos. 147, 150, 152 from the Surveillance Scenario Sequence fromPETS-2000: (a) ROIt, (b) after feature reduction
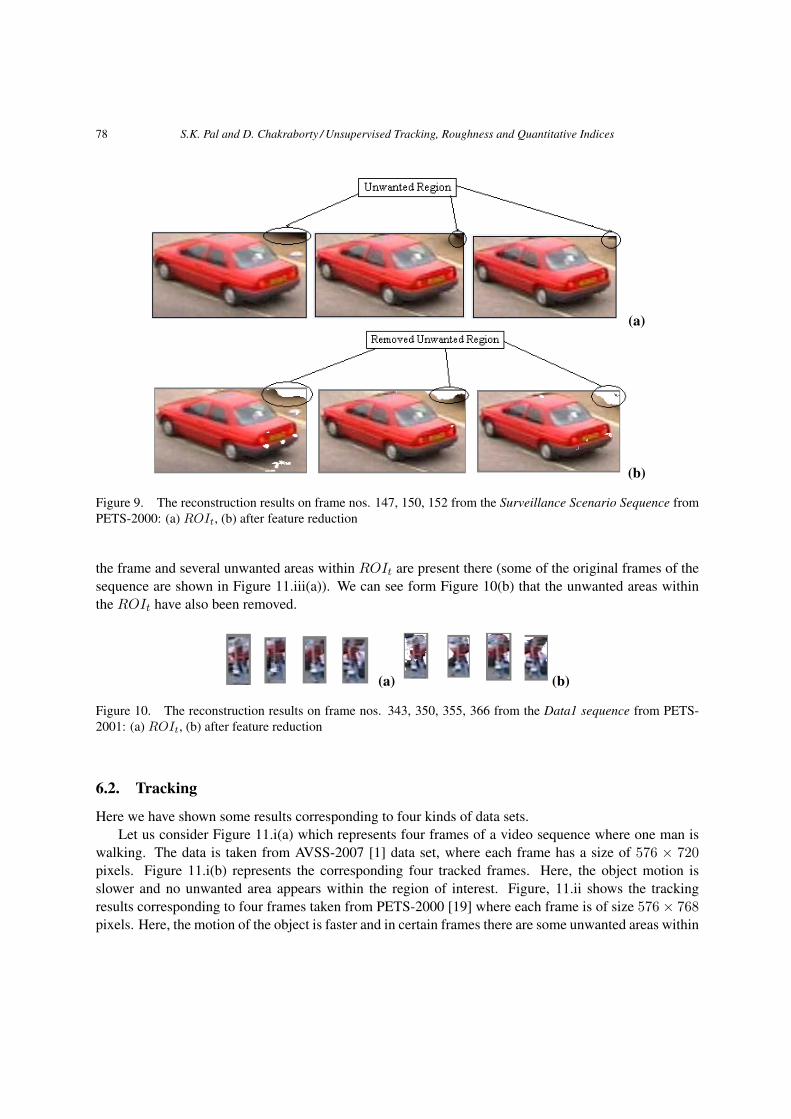
the frame and several unwanted areas within ROIt are present there (some of the original frames of thesequence are shown in Figure 11.iii(a)). We can see form Figure 10(b) that the unwanted areas withinthe ROIt have also been removed.
(a) (b)
Figure 10. The reconstruction results on frame nos. 343, 350, 355, 366 from the Data1 sequence from PETS-2001: (a) ROIt, (b) after feature reduction
6.2. Tracking
Here we have shown some results corresponding to four kinds of data sets.Let us consider Figure 11.i(a) which represents four frames of a video sequence where one man is
walking. The data is taken from AVSS-2007 [1] data set, where each frame has a size of 576 × 720pixels. Figure 11.i(b) represents the corresponding four tracked frames. Here, the object motion isslower and no unwanted area appears within the region of interest. Figure, 11.ii shows the trackingresults corresponding to four frames taken from PETS-2000 [19] where each frame is of size 576× 768pixels. Here, the motion of the object is faster and in certain frames there are some unwanted areas within

S.K. Pal and D. Chakraborty / Unsupervised Tracking, Roughness and Quantitative Indices 79
i(a)
i(b)
ii(a)
ii(b)
iii(a)
iii(b)
iv(a)
iv(b)
Figure 11. Tracking Results for different video sequences: (i) Frame nos. 1305, 1317, 1331, 1347 from theBaggage Detection Sequence from AVSS-2007 (ii)Frame nos. 134, 154, 174, 194 from theSurveillance Sce-nario Sequence from PETS-2000 (iii) Frame nos. 221, 281, 331, 371 from theData1 sequence from PETS-2001(iv)Frame nos. 66, 104, 114, 145 from theWalk3 sequence from PETS-2004 (a) Original and (b) Tracked
80 S.K. Pal and D. Chakraborty / Unsupervised Tracking, Roughness and Quantitative Indices
the region of interest. In case of both the data sets (Figs 11.i and 11.ii) the area of object region islarger, whereas in case of Figure 11.iii the object is much smaller. The data set is taken from PETS-2001[20] (each frame of size 576 × 768 pixels). Here, there is a person walking in front of several standingcars. So, several unwanted objects within the Region of Interest are present there. The object area isvery small as well as the object is not crisply separable from the background even by human eyes. Themoving object is also smaller in case of Figure (11.iv). This data set is taken from PETS-ECCV-2004[21] (each frame of size 384 × 288 pixels). There is a person walking through B-line. The person iswalking, standing, waving his hands throughout the sequence. In all the aforesaid data sets, the results oftracking are satisfactory and are shown in corresponding figures (Figs 11.i(b),11.ii(b), 11.iii(b), 11.iv(b)).
6.3. Evaluation of Mis-tracked Frames
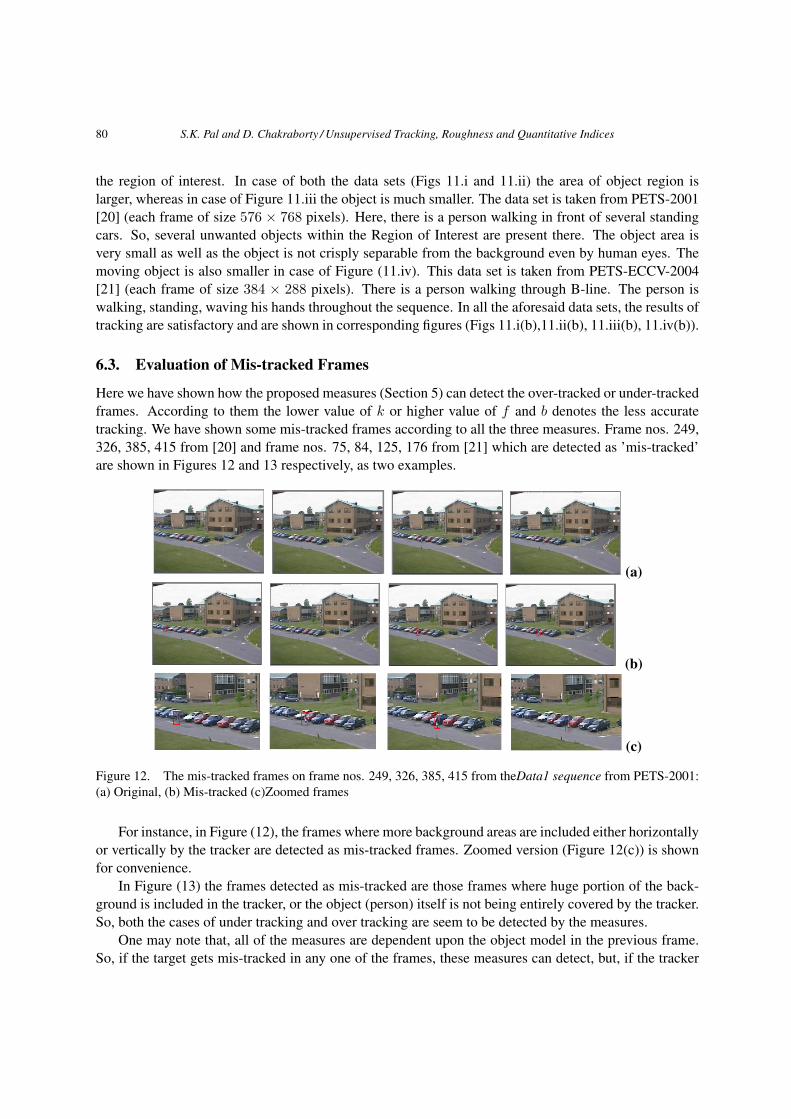
Here we have shown how the proposed measures (Section 5) can detect the over-tracked or under-trackedframes. According to them the lower value of k or higher value of f and b denotes the less accuratetracking. We have shown some mis-tracked frames according to all the three measures. Frame nos. 249,326, 385, 415 from [20] and frame nos. 75, 84, 125, 176 from [21] which are detected as ’mis-tracked’are shown in Figures 12 and 13 respectively, as two examples.
(a)
(b)
(c)
Figure 12. The mis-tracked frames on frame nos. 249, 326, 385, 415 from theData1 sequence from PETS-2001:(a) Original, (b) Mis-tracked (c)Zoomed frames
For instance, in Figure (12), the frames where more background areas are included either horizontallyor vertically by the tracker are detected as mis-tracked frames. Zoomed version (Figure 12(c)) is shownfor convenience.
In Figure (13) the frames detected as mis-tracked are those frames where huge portion of the back-ground is included in the tracker, or the object (person) itself is not being entirely covered by the tracker.So, both the cases of under tracking and over tracking are seem to be detected by the measures.
One may note that, all of the measures are dependent upon the object model in the previous frame.So, if the target gets mis-tracked in any one of the frames, these measures can detect, but, if the tracker
S.K. Pal and D. Chakraborty / Unsupervised Tracking, Roughness and Quantitative Indices 81
(a)
(b)
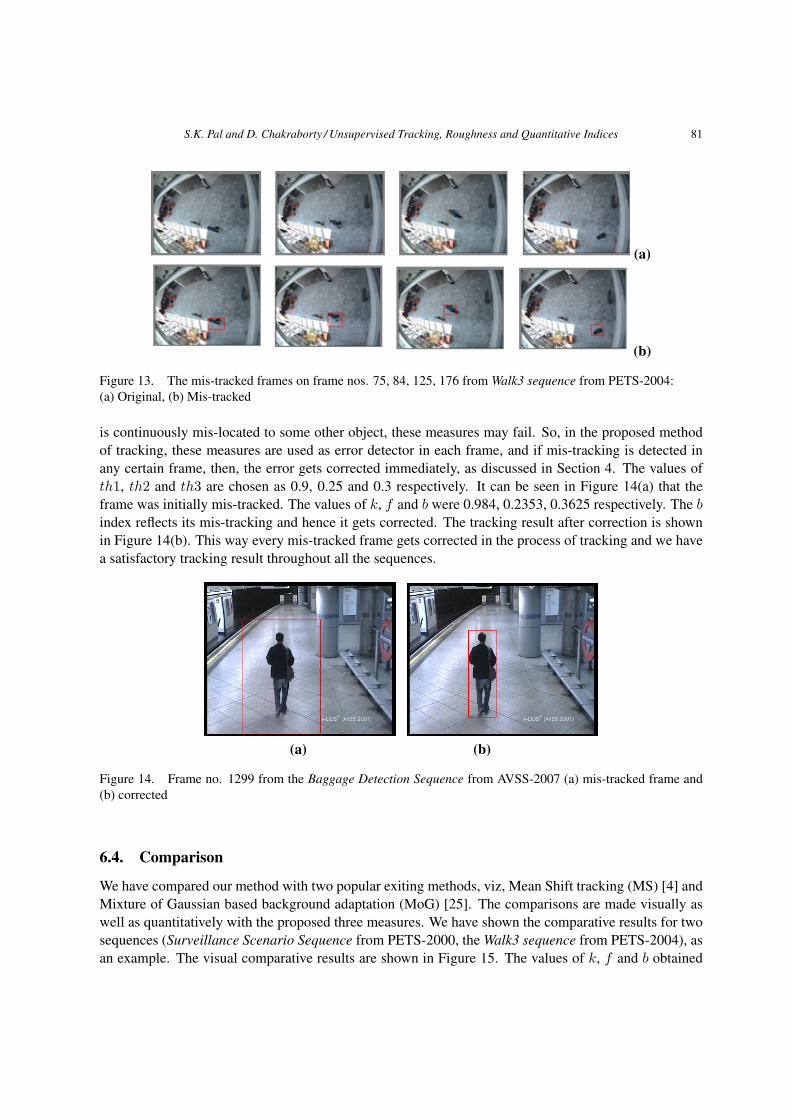
Figure 13. The mis-tracked frames on frame nos. 75, 84, 125, 176 from Walk3 sequence from PETS-2004:(a) Original, (b) Mis-tracked
is continuously mis-located to some other object, these measures may fail. So, in the proposed methodof tracking, these measures are used as error detector in each frame, and if mis-tracking is detected inany certain frame, then, the error gets corrected immediately, as discussed in Section 4. The values ofth1, th2 and th3 are chosen as 0.9, 0.25 and 0.3 respectively. It can be seen in Figure 14(a) that theframe was initially mis-tracked. The values of k, f and b were 0.984, 0.2353, 0.3625 respectively. The bindex reflects its mis-tracking and hence it gets corrected. The tracking result after correction is shownin Figure 14(b). This way every mis-tracked frame gets corrected in the process of tracking and we havea satisfactory tracking result throughout all the sequences.
(a) (b)
Figure 14. Frame no. 1299 from the Baggage Detection Sequence from AVSS-2007 (a) mis-tracked frame and(b) corrected
6.4. Comparison
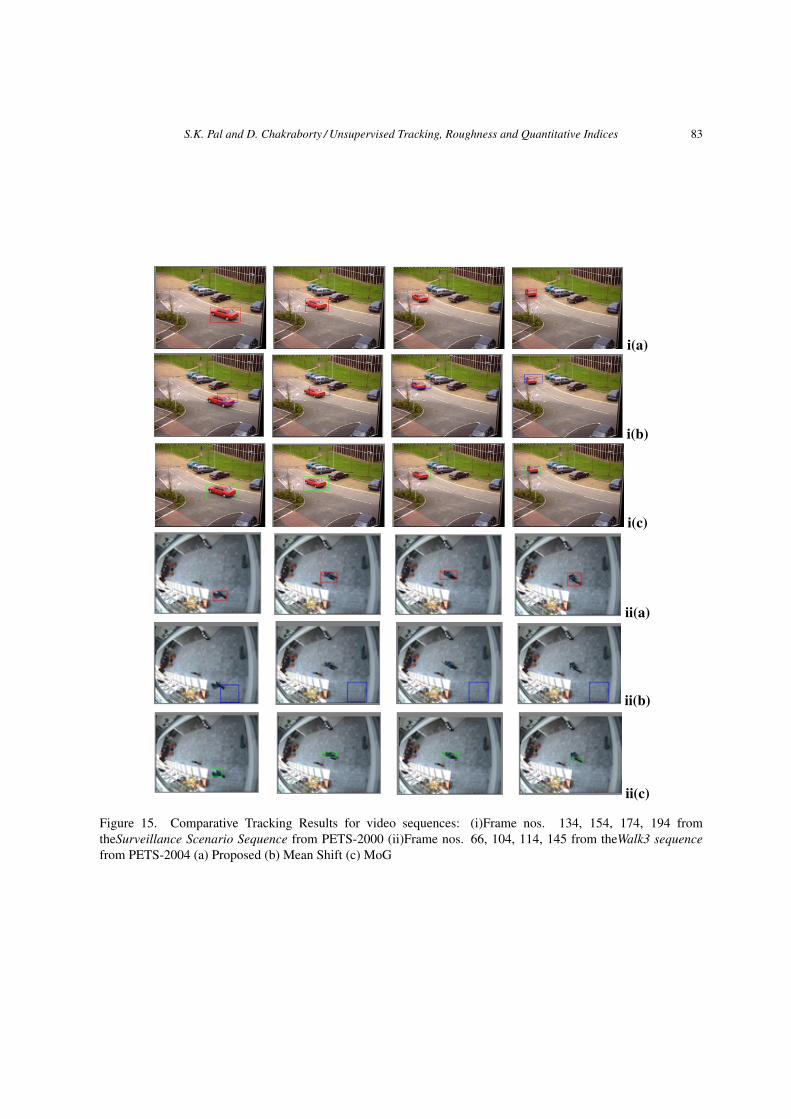
We have compared our method with two popular exiting methods, viz, Mean Shift tracking (MS) [4] andMixture of Gaussian based background adaptation (MoG) [25]. The comparisons are made visually aswell as quantitatively with the proposed three measures. We have shown the comparative results for twosequences (Surveillance Scenario Sequence from PETS-2000, the Walk3 sequence from PETS-2004), asan example. The visual comparative results are shown in Figure 15. The values of k, f and b obtained

82 S.K. Pal and D. Chakraborty / Unsupervised Tracking, Roughness and Quantitative Indices
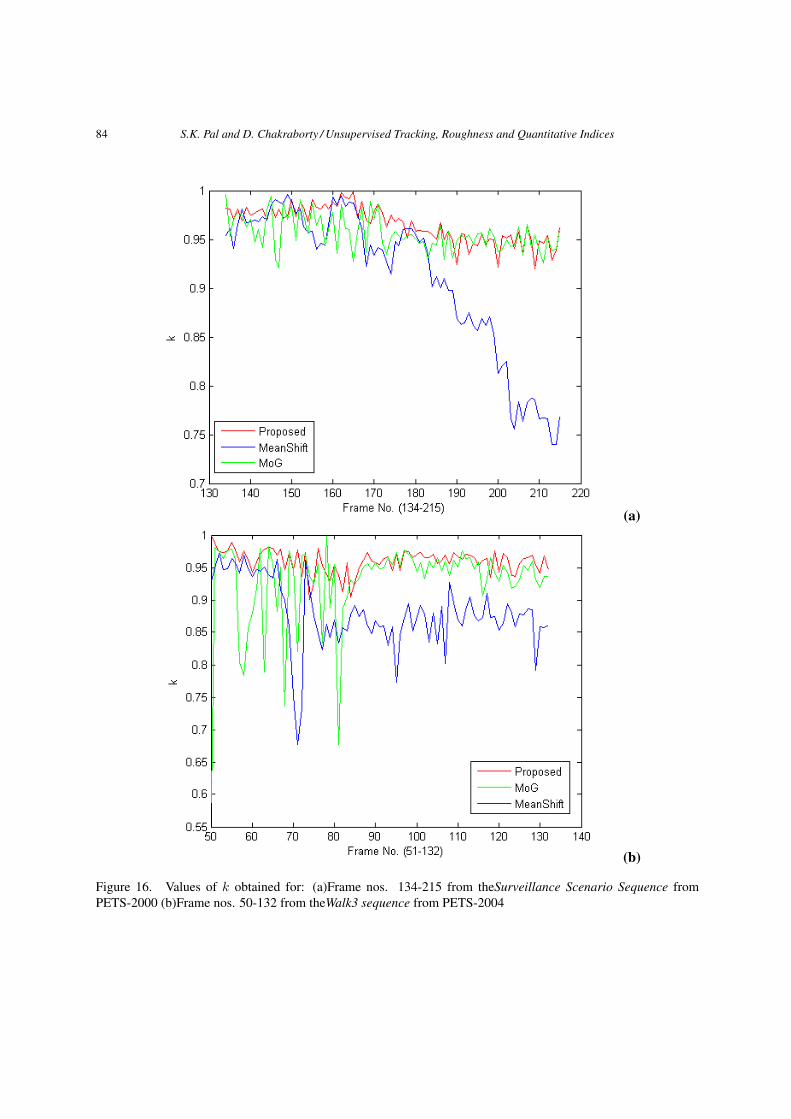
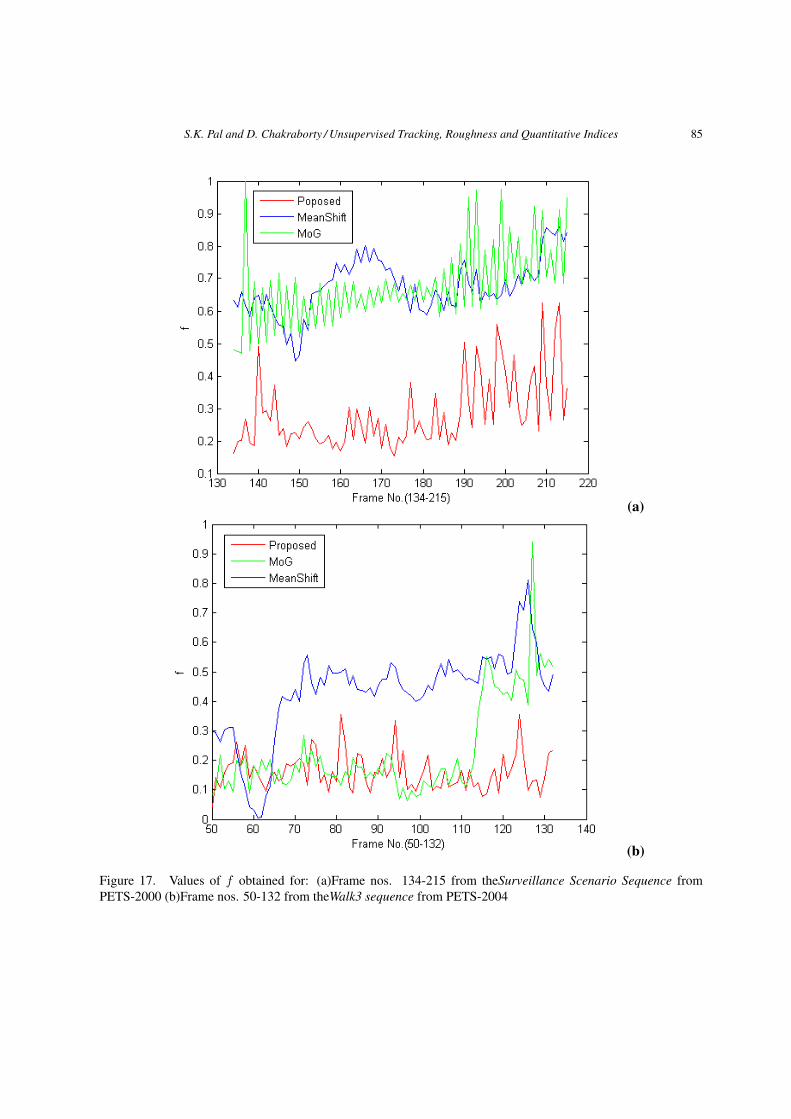
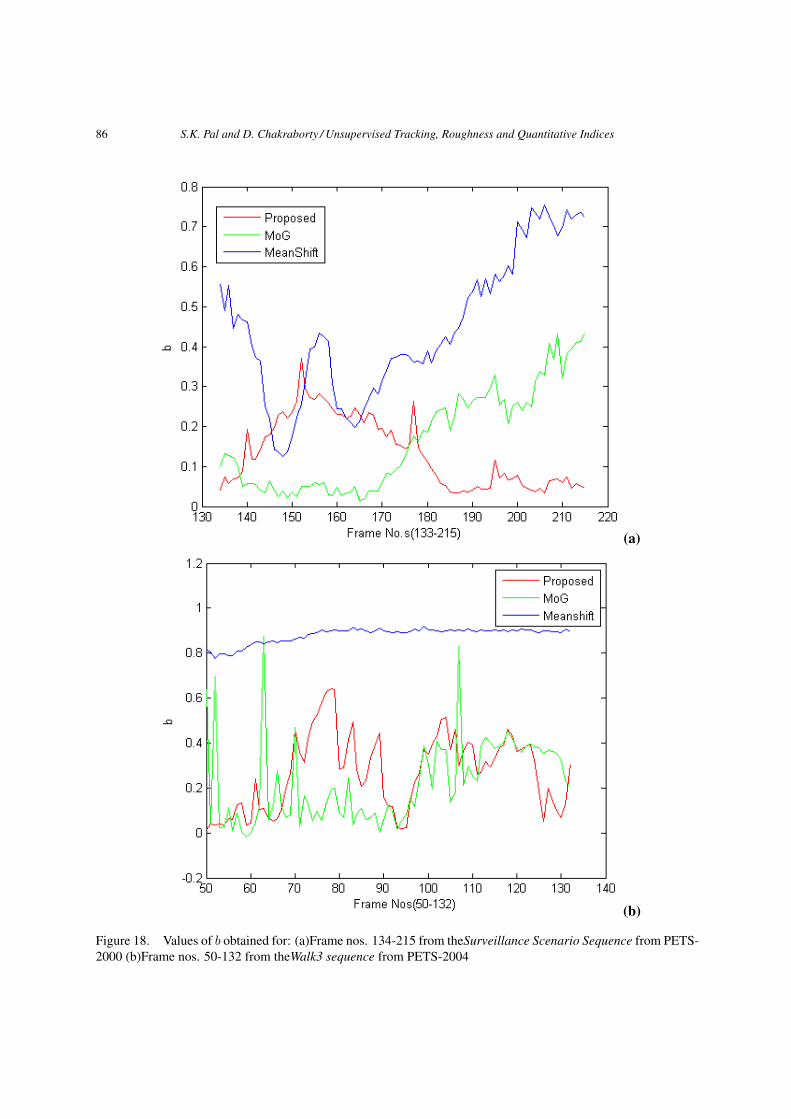
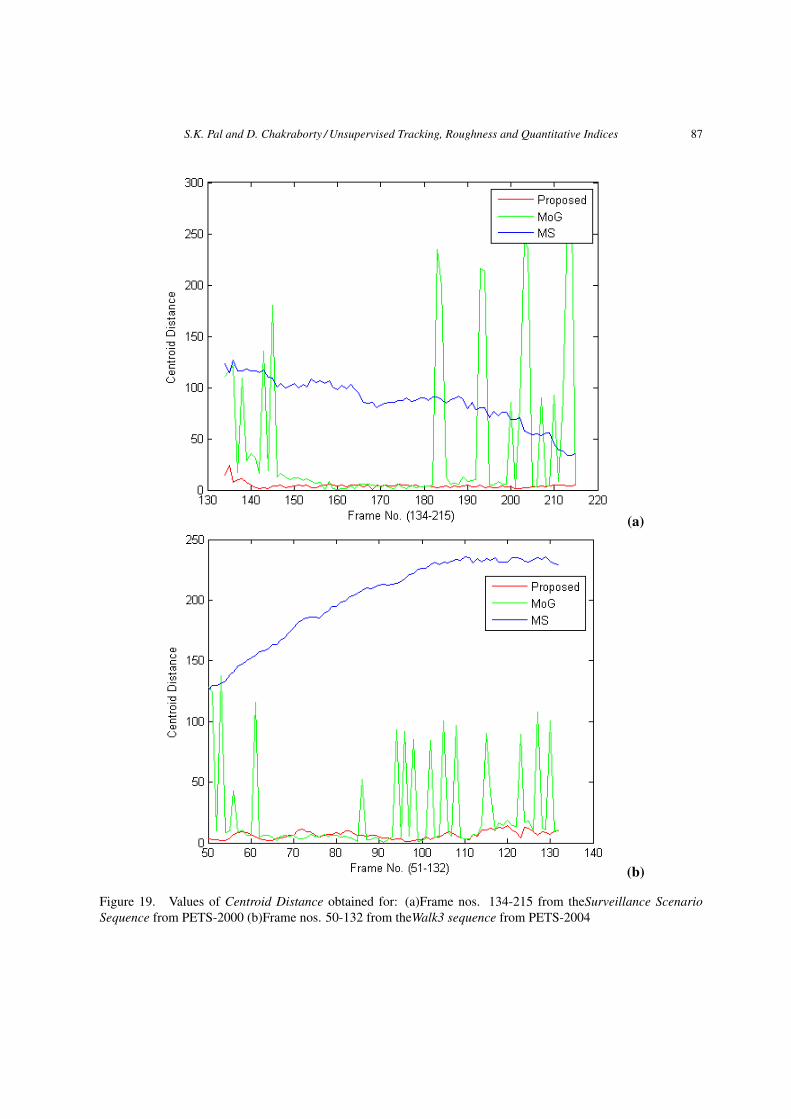
according to Equations (11, 12, 14) for the two sequences applying the three defined methods (viz.proposed, mean-shift and MoG) are shown in Figures 16, 17 and 18 respectively. One more numericalcomparison is done based on the centroid distance, i.e., how far the tracker centroid is from the groundtruth object centroid. Euclidian distance metric is used here. This is a popular measure to evaluate thetracking performance. In Figure 19 the centroid distance measures for the said two sequences and threemethods are shown. As seen from these figures, the proposed method results in higher value of k, andlower values of centroid distance, f and b; thereby signifying more accurate tracking than the othertwo methods. For example, it can be seen from Figure 15(i) that in case of Surveillance Sequence thetracking results show that meanshift (MS) method provides the worst result whereas MoG gives betterresult than MS and the proposed method provides the most accurate result among the three methods.The visual results are reflected in quantitative measures also. The ground truth based measure depictedin Figure 19(a) shows the same. In Figure 16(a) it can be noticed that the average value of k is the lowestfor meanshift (MS) method, higher than MS but lower than the proposed one for MoG and the highestfor the defined one. From Figure 17(a) the f -values, as expected, are lower for proposed method andhigher for meanshift and MoG. The average b-values are the lowest for the proposed method, higherthan the proposed but lower than MS for MoG and the highest for MS and shown in Figure 18(a). Onetabular expression expression is shown in Table 1 where the columns denote the best (Rank1) to worst(Rank3) methods among the three decided according to the average values of k (kproposed, kMS , kMoG),f (fproposed, fMS , fMoG) and b(bproposed, bMS , bMoG) indices in the respective rows.
Table 1. Accuracy of The Three Methods According to k-index, f -index and b-index for Surveillance Scenario,and Walk3 sequences
Surveillance Scenario Rank1 Rank2 Rank3
k-index kproposed kMoG kMS
f -index fproposed fMS fMoG
b-index bproposed bMoG bMS
Decision Proposed MoG MS
Walk3 Sequence
k-index kproposed kMoG kMS
f -index fproposed fMoG fMS
b-index bMoG bproposed bMS
Decision Proposed MoG MS
So, it can be said that, the measures defined here are effective to evaluate the performance of trackingquantitatively.
S.K. Pal and D. Chakraborty / Unsupervised Tracking, Roughness and Quantitative Indices 83
i(a)
i(b)
i(c)
ii(a)
ii(b)
ii(c)
Figure 15. Comparative Tracking Results for video sequences: (i)Frame nos. 134, 154, 174, 194 fromtheSurveillance Scenario Sequence from PETS-2000 (ii)Frame nos. 66, 104, 114, 145 from theWalk3 sequencefrom PETS-2004 (a) Proposed (b) Mean Shift (c) MoG
84 S.K. Pal and D. Chakraborty / Unsupervised Tracking, Roughness and Quantitative Indices
(a)
(b)
Figure 16. Values of k obtained for: (a)Frame nos. 134-215 from theSurveillance Scenario Sequence fromPETS-2000 (b)Frame nos. 50-132 from theWalk3 sequence from PETS-2004
S.K. Pal and D. Chakraborty / Unsupervised Tracking, Roughness and Quantitative Indices 85
(a)
(b)
Figure 17. Values of f obtained for: (a)Frame nos. 134-215 from theSurveillance Scenario Sequence fromPETS-2000 (b)Frame nos. 50-132 from theWalk3 sequence from PETS-2004
86 S.K. Pal and D. Chakraborty / Unsupervised Tracking, Roughness and Quantitative Indices
(a)
(b)
Figure 18. Values of b obtained for: (a)Frame nos. 134-215 from theSurveillance Scenario Sequence from PETS-2000 (b)Frame nos. 50-132 from theWalk3 sequence from PETS-2004
S.K. Pal and D. Chakraborty / Unsupervised Tracking, Roughness and Quantitative Indices 87
(a)
(b)
Figure 19. Values of Centroid Distance obtained for: (a)Frame nos. 134-215 from theSurveillance ScenarioSequence from PETS-2000 (b)Frame nos. 50-132 from theWalk3 sequence from PETS-2004
88 S.K. Pal and D. Chakraborty / Unsupervised Tracking, Roughness and Quantitative Indices
7. Conclusions
In this paper we have described a method using the concept of rough set based feature reduction alongwith a measure of indiscerniblity for tracking a moving object in a video sequence. We have used medianfiltering method for initial object modeling to reduce the effect of noise. We have also proposed threenew measures to evaluate the performance of tracking. We have used these measures in the processof tracking to determine the mis-tracked frames and making them corrected. This way, the over allperformance of tracking gets improved. We have implemented our algorithm on several data sets andhave satisfactory results. The proposed method is seen to be more efficient for tracking as comparedto mean-shift and MoG. The method does not require any prior knowledge about the video sequenceor the object and it can reconstruct the desired object in the current frame. The reconstructed objectis more reliable as the method includes the neighborhood information of a pixel predicted from theobject shift information in the previous frames, in addition. The proposed measures are able to find outthe mis-tracked frames successfully, which shows their effectiveness to make the process corrected andto evaluate the quality of tracking. Appropriateness of a particular index in evaluating the tracking isapplication oriented. These measures are also unsupervised and do not require any knowledge about theground truth. k-index reflects the knowledge dependency between the target model and tracked region.f -index determines the pixel-wise similarity in terms of these two regions considering the neighborhoodeffect. b-index measures the similarity between color histograms of the two regions. The superiority ofconsidering unequal bins over equal bins in computing Bhattacharya distance for determining the mis-tracked frames is also established. The values of the indexes reflect nearly similar results to a ground truthbased measure. This shows its effectiveness towards performance evaluation of tracking. The methodcan be extended for tracking multiple moving objects.
8. Acknowledgement
S. K. Pal acknowledges the J. C. Bose National Fellowship, Government of India.
References
[1] AVSS-2007: Fourth IEEE Int. Conf. Adv. Video & Signal Based Surveillance, 2007.
[2] Black, J., Ellis, T., Rosin, P.: A novel method for video tracking performance evaluation, Proc. Joint IEEEInt. Workshop on VS-PETS, 2003, 125–132.
[3] Cheung, S. S., Kamath, C.: A Robust techniques for background subtraction in urban traffic video, Proc.Video Communications and Image Processing, ISPIE Electronic Imaging, 5308, 2004, 881–892.
[4] Comaniciu, D., Ramesh, V., Meer, P.: Mean shift: A robust approach towards feature space analysis., IEEETrans. Patt. Anal. and Machine Intell., 24, 2002, 603619.
[5] Comaniciu, D., Ramesh, V., Meer, P.: Kernel-based object tracking, IEEE Trans. Pattern Analysis andMachine Intell., 25, 2003, 564–577.
[6] Cucchiara, R., Grana, C., Piccardi, M., Prati, A.: Detecting moving objects, ghosts and shadows in videostreams, IEEE Trans. Patt. Anal. and Machine Intell., 25, 2003, 1337–1342.
S.K. Pal and D. Chakraborty / Unsupervised Tracking, Roughness and Quantitative Indices 89
[7] Dai, S., Ren, W., Gu, F., Huang, H., Chang, S.: Implementation of Robot Visual Tracking System Based onRough Set Theory, FSKD (2), 2008, 155–160.
[8] Fang, H., Jiang, J., Feng, Y.: A fuzzy logic approach for detection of video shot boundaries, Pattern Recog-nition, 39, 2006, 2092 – 2100.
[9] Hassanien, A. E., Abraham, A., Peters, J. F., Schaefer, G.: Overview of rough-hybrid approaches in imageprocessing, Proc. IEEE Conf. on Fuzzy Systems, IEEE Press, N. J., 2008, 2135–2142.
[10] Jalal, A. S., Tiwary, U. S.: A Robust Object Tracking Method for Noisy Video using Rough Entropy inWavelet Domain, IHCI, 2009, 113–122.
[11] Komorouski, J., Pawlak, Z., Polkowski, L., Skowron, A.: Rough sets: a tutorial, Rough Fuzzy Hybridization:A New Trend In Decision-Making (S. K. Pal, A. Skowron, Eds.), Springer, Singapore, 1999, 3–98.
[12] Maddalena, L., Petrosino, A.: A self-organizing approach to background subtraction for visual surveillanceapplications, IEEE Trans. Image Process., 17, 2008, 1168–1177.
[13] Maggio, E., Cavallaro, A.: Video Tracking - Theory And Practice, Wiley, N. Y., 2010.
[14] Needham, C. J., Boyle, R. D.: Performance evaluation metrics and statistics for positional tracker evaluation,Proc. of the Computer Vision Systems: Third International Conference, ICVS, 2003, 278–289.
[15] Pal, S. K., Petrosino, A., Maddalena, L., Eds.: Handbook on Soft Computing for Video surveillance, CRCPress, Boca Raton, 2012.
[16] Pal, S. K., Shankar, B. U., Mitra, P.: Granular computing, rough entropy and object extraction, PatternRecogn. Lett., 26, 2005, 2509–2517.
[17] Pawlak, Z.: Rough Sets: Theoretical Aspects of Reasoning about Data, Kluwer Academic Publishers, Nor-well, MA, 1992.
[18] Peters, J. F., Borkowski, M.: K-means indiscernibility relation over pixels, S. tsumoto, R. Slowinski, J.Komorowski, J.W. Grzymala-Buess, Lecture Notes in artificial Intelligence, Springer-Verlag, Berlin, 2004,580–535.
[19] PETS-2000: IEEE Int. WS Perfor. Evaluation of Tracking and Surveillance, 2000.
[20] PETS-2001: IEEE Int. WS Perfor. Evaluation of Tracking and Surveillance, 2001.
[21] PETS-2004: IEEE Int. WS Perfor. Evaluation of Tracking and Surveillance and EC Funded CAVIARproject/IST 2001, 2004.
[22] Sen, D., Pal, S. K.: Generalized rough sets, entropy, and image ambiguity measures, IEEE Trans. on Systems,Man, and Cyberns., Part B, 39, 2009, 117–128.
[23] Shen, C., Kim, J., Wang, H.: Generalized kernel-based visual tracking, IEEE Trans. Circuits and Systems forVideo Technology, 20, 2010, 119–130.
[24] Skowron, A., Rauszer, C.: The discernibility matrices and functions in information systems, IntelligentDecision Support, Handbook of Applications and Advances of the Rough Sets Theory (R. Slowinski, Ed.),Kluwer Academic, Dordrecht, 1992.
[25] Stauffer, C., Grimson, W. E. L.: Adaptive background mixture models for real-time tracking, Proc ComputerVision and Pattern Recognition, IEEE Computer Society, 1999, 246–252.
[26] Swirniaski, R. W.: Rough sets methods in feature reduction and classification, Int. J. of Applied Mathematicsand Computer Sc., 11, 2001, 565–582.
[27] Tekalp, A. M.: Digital Video Processing, Prentice Hall, N. J., 1995.
90 S.K. Pal and D. Chakraborty / Unsupervised Tracking, Roughness and Quantitative Indices
[28] Yao, Y.: Two semantic issues in a probabilistic rough set model, Fundam. Inform., 108, 2011, 249–265.
[29] Yilmaz, A., Javed, O., Shah, M.: Object tracking : a survey, ACM Computing Surveys, 38, 2006, 1264–1291.
[30] Zadeh, L.: Fuzzy sets as a basis for theory of possibility, Fuzzy Sets and Systems, 1, 1978, 3–28.