NICRA equipments (published).pdf
68
-
Upload
khangminh22 -
Category
Documents
-
view
3 -
download
0
Transcript of NICRA equipments (published).pdf


Advanced Research Facilitiesdeveloped under
National Initiative on ClimateResilient Agriculture (NICRA)
Compiled and Edited by
D.J. Rajkhowa, Krishnappa R.,S. Hazarika, Anup Das, U.S. Saikia and
S.V. Ngachan
ICAR Research Complex for NEH Region,Umiam 793103, Meghalaya

Contributors:Dr (Late). A Venkatesh, Principal Scientist, AgroforestryDr. A Pattanayak, Principal Scientist & Head, Division of BiotechnologyDr. A Sen, Principal Scientist & Head, Animal Health DivisionDr. Anjani Jha, Senior Scientist, HorticultureDr. Anup Das, Senior Scientist, AgronomyDr. AS. Panwar, Principal Scientist & Head, Crop ProductionDr. B C Verma, Senior Scientist, Soil ScienceDr. D.J. Rajkhowa, Principal Scientist, AgronomyDr. Jayanta Layek, Scientist, AgronomyDr. K P Mohapatra, Senior Scientist, ForestryDr. Kadirvel G, Senior Scientist, Animal ProductionDr. Krishnappa R, Scientist, Plant PhysiologyDr. Manoj Kumar, Scientist, Soil ScienceDr. Pankaj Baiswar, Senior Scientist, Plant PathologyDr. R K Singh, Principal Scientist & Head, Division of Agril. Engg.Dr. Rajesh Kumar, Senior Scientist, AgronomyDr. Ramkrushna G I, Scientist, AgronomyDr. S K Das, Principal Scientist & Head, Division of Fishery SciencesDr. S.V. Ngachan, DirectorDr. Samar Hazarika, Principal Scientist, Soil ScienjceDr. Suresh Kumar D S, Principal Scientist & Head, Division of Animal ProductionDr. U.S. Saikia, Senior Scientist, AgrometeorologyDr.B U Choudhury, Senior Scientist, Soil ScienceDr.G C.Munda, Ex. Principal Scientist & Head, Division of NRMDr. N S Azad Thakur, Principal Scientist & Head, Division of NRMDr.Premila Devi, Principal Scientist, BiochemistryDr.Satish Chandra, Principal Scientist & Head, Division of Plant HealthDr.T Ramesh, Senior Scientist, Soil ScienceEr. Sandip Mandal, Senior Scientist, Farm Machinery
Editorial AssistanceAnjan K Sarma,Arvind Kumar,Manshi Sharma,Meghna Haloi,Devangana B andJuri Buragohain

Acknowledgement
We are very much thankful to the Indian Council of Agriculture Research (ICAR),New Delhi and Central Research Institute for Dryland Agriculture (CRIDA), Hyderabad forallotment of NICRA project to ICAR Research Complex for North Eastern Hills Region,Umiam and providing financial grant for the project. We also like to sincerely acknowledgethe all round help, active support, valuable advice from Dr.S.Ayappan, DG, ICAR & Secy,DARE, Dr. A.K. Sikka, DDG (NRM), Dr. A.K Singh, Ex DDG (NRM), Dr. B. Venkateswarlu,Ex Director, CRIDA, Hyderabad, Dr.Ch. Srinivasa Rao, Director, CRIDA, Dr. M.Maheshwari, P.I, NICRA project, CRIDA in creating the advance research facilities andproviding guidance in shaping the NICRA project. Heartfelt thanks are due to Dr. S.V.Ngachan, Director, ICAR Research Complex for North Eastern Hill Region, Umiam,Meghalaya, for keen interest untiring efforts, timely advice, constant encouragement, promptaction without which the creation of such research facilities and implementing research onclimate resilient agriculture would have not been possible.
The active involvement, help and support received from the Joint Directors of regionalCentres, Head of Divisions, Scientists from Headquarters and Regional Centres, Finance,Administration and Establishment sections of the Institute in developing and strengtheningNICRA facilities are duly acknowledged. Last but not the least, the untiring effort andactive involvements of all the Research Associates, Research Fellows, and Technical Staffsin meeting research facilities under NICRA are thankfully acknowledged. It is believed thatthe publication will be of immense utility for the Scientists, Researchers, Teachers, Students,Technicals, etc. in planning and undertaking research and training activities pertaining toclimate change agriculture
D.J. RajkhowaPI, NICRA


Contents
Sl Instrument Name Division In-charge PageNo. No.
1 Carbon dioxide Enrichment Technologies Natural Resource1.CTGC Management2.FATE
2 Rain Out Shelter (ROS) Natural ResourceManagement
3 Plant Growth Chamber Crop Production4 Biochar Production Unit Agril. Engg5 Lysimeter Natural Resource
Management6 Root Imager Crop Production7 Portable Photosynthetic System (PPS) Crop Production8 Controlled Environmental Laboratory Shaker Crop Production9 Ultrasound with Color Dapple Natural Resource
Management10 Radio Telemetry Natural Resource
Management11 TOC Analyzer Crop Production12 Gas Chromatography Natural Resource
Management13 Phase Contrast Microscope Crop Protection14 Atomic Absorption Spectrophotometer (AAS) Natural Resource
Management15 Automatic Weather Station (AWS) Natural Resource
Management16 Ultra Low Deep Freezers Animal Health17 Cold Room Facility Horticulture18 Dew Point Potentiometer Natural Resource
Management19 Gel Documentation Unit Biotechnology20 Time Domain Reflectometer (TDR) Natural Resource
Management21 Line and Point Quantum Sensors Natural Resource
(LQS and PQS) Management22 Environmental Gas Analyzer (EGA) for CO2 Natural Resource
Emissions Management


1
Introduction
Climate change has become an important area of concern for India to ensure food andnutritional security for growing population. The impacts of climate change are global, butcountries like India are more vulnerable in view of the high population depending onagriculture. In India, significant negative impacts have been implied with medium-term(2010-2039) climate change, predicted to reduce yields by 4.5 to 9 percent, depending onthe magnitude and distribution of warming. The Government of India has accorded highpriority on research and development to cope with climate change in agriculture sector. ThePrime Minister’s National Action Plan on climate change has identified Agriculture as oneof the eight national missions. With this background, the ICAR has launched a major Projectentitled, National Initiative on Climate Resilient Agriculture (NICRA) during 2010-11with the following objectives:
■ To enhance the resilience of Indian agriculture covering crops, livestock andfisheries to climatic variability and climate change through development andapplication of improved production and risk management technologies
■ To demonstrate site specific technology packages on farmers’ fields for adaptingto current climate risks
■ To enhance the capacity building of scientists and other stakeholders in climateresilient agricultural research and its application.
India is expected to face severe impacts of climate change and the country’s northeastern region is highly vulnerable. Agriculture in north east is heavily dependent on climateand therefore, a slight shift in climate could severely affect the agriculture and hence foodand livelihood security of the people. The signs of climate change in NEH are becomingincreasingly evident in terms of rising temperature and changing rainfall pattern. The annualmaximum and minimum temperature during 1901-2003 have increased by 1.02 °C and 0.60C/100 years. Temperature is projected to rise by another 3-5 °C during the latter half ofthis century. Frequent occurrence of droughts, floods and even flash floods further substantiatethe impact of climate change in the region. These changes are expected to intensify furtherin the near future which are likely to reduce the agricultural productivity. The perceptiblechanges in climate and current scientific evidences warrants an urgent need for developmentand application of improved production and risk management technologies in the field ofagriculture for north eastern region of the country. With this background in view, NICRAproject was launched in ICAR Research Complex for NEH Region, Umiam, Meghalayaand its six (6) regional centres viz. Basar (Arunachal Pradesh), Lamphelpat (Manipur),Jharnapani (Nagaland), Tadong (Sikkim), Lembucherra (Tripura) and Kolasib (Mizoram)during 2011 with the following major objectives:

2
· Identification of temperature tolerant rice and maize varieties for north easternhill ecosystem.
· Assessment of mitigation potential through SWM practices for enhancing climaticresilience.
· Understanding the unique traits in indigenous pig and poultry which make themresilient to climate change and development of data base.
Social Division along with other Divisions and some Krishi Vignan Kendras (KVKs)under the Institute are involved in Technology Demonstration Component (TDC) in identifiedvillages and disseminating technology to the climate sensitive hill farmers.
State of the art facilities have been developed in ICAR Research Complex for NEHRegion, Umiam and its regional centres under NICRA to carry out advance scientific researchfor strengthening the climate resilient agriculture in the region. Glimpses of the advanceresearch facilities developed under NICRA along with their features and applications aredescribed in this publication.
3
Carbon dioxide Enrichment Technologies
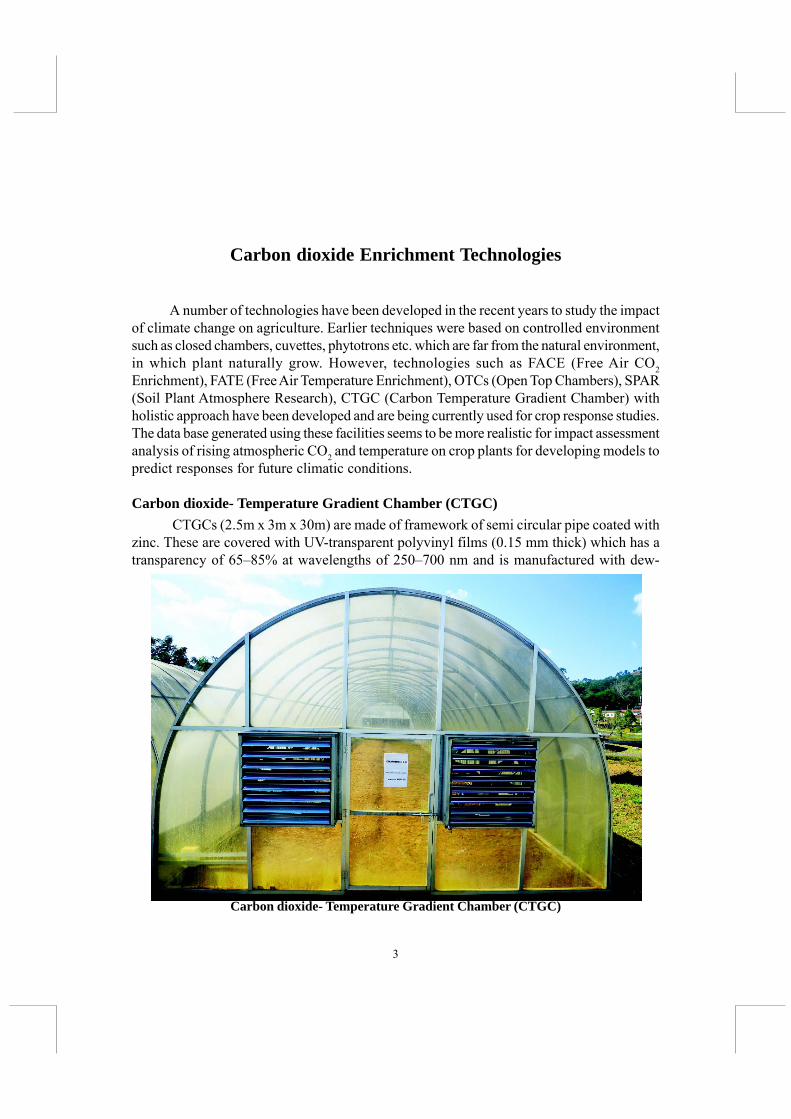
A number of technologies have been developed in the recent years to study the impactof climate change on agriculture. Earlier techniques were based on controlled environmentsuch as closed chambers, cuvettes, phytotrons etc. which are far from the natural environment,in which plant naturally grow. However, technologies such as FACE (Free Air CO2Enrichment), FATE (Free Air Temperature Enrichment), OTCs (Open Top Chambers), SPAR(Soil Plant Atmosphere Research), CTGC (Carbon Temperature Gradient Chamber) withholistic approach have been developed and are being currently used for crop response studies.The data base generated using these facilities seems to be more realistic for impact assessmentanalysis of rising atmospheric CO2 and temperature on crop plants for developing models topredict responses for future climatic conditions.
Carbon dioxide- Temperature Gradient Chamber (CTGC) CTGCs (2.5m x 3m x 30m) are made of framework of semi circular pipe coated with
zinc. These are covered with UV-transparent polyvinyl films (0.15 mm thick) which has atransparency of 65–85% at wavelengths of 250–700 nm and is manufactured with dew-
Carbon dioxide- Temperature Gradient Chamber (CTGC)

4
preventing treatment on its inner surface. The cooling wall in the chamber is covered withporous polypropylene screen (8x8 clear strands per cm). Air in the chamber is heated bysolar radiation. However, at low radiations, oil heaters are used. Set of oil heater andventilators are used to maintain temperature gradient inside the chamber.
The gradient of temperature can be increased to the extent of 5°C warmed conditionsat the air outlet, rising at a rate of 1°C at 5m intervals across the chamber despite great dailyand seasonal changes in ambient air temperature. Also, CO2 concentrations were linearlyincreased from the air inlet to the outlet from 370 ppm and 750 ppm (doubled theconcentration) respectively.
In order to achieve the target temperature and CO2 concentration gradient in thechamber, the CTGC has a control on ventilation rate according to the fluctuation of ambientair temperature and regulation on electronic mass flow controller, flow direction changerand pressure regulator. The injection system includes a blower, injection pipes, CO2 andtemperature measuring system. CO2 (conc. 370, 530 and 750 μmol mol-1, respectively at 0,10 and 25 m away from the air inlet) is supplied through longitudinal pipe installed at 10 cmheight along inside wall of CTGC. Environmental variables such as soil temperature, relativehumidity, incident solar radiation etc. can be recorded.
SpecificationsThe Carbon dioxide and Temperature Gradient Chamber (CTGC) facility consists
eight 30x6x4m chambers with1. Two chambers with temperature gradient of 5°C above ambient2. Two chambers with temperature gradient of 5°C above ambient + uniform
concentration of elevated CO2 (550 ppm)3. Two chambers with uniform concentration of elevated CO2 (550 ppm)4. Two chambers with ambient temperature and CO2 with all structural fittings of
S.No.25. All the chambers are covered with high quality, light weight, rigid, corrugated
polycarbonate sheet of Lexan and BIS grade, with excellent impact and weatherresistance, superior clarity, versatility with >90% light diffusion and with >85%PAR transmission. The thickness of the sheet is 4mm.
6. Each chamber is provided with 12 no’s of sensors for temperature and relativehumidity appropriately located and controlled by RTD/Thyristers to maintain thetemperature gradient of 7.0±0.5°C with reference to ambient temperature.Temperature sensors have provision for measuring range 0-100°C, with an accuracyof ±0.2°C and a resolution of 0.02%. The RH sensors range of 0-100% withaccuracy of 0.5% and a resolution of 0.02%.
8. The chambers with elevated CO2 are provided with provision for proper monitoringand control system to maintain uniform CO2 concentration vertically andhorizontally even in combination with gradient temperature condition.

5
9. Control panel consists of temperature, humidity and CO2 controller attached withsoftware PLC (Programmable Logic Controller) and SCADA (Supervisory Controland Data Acquisition) control system
10.Air circulating unit has the provision for maintaining set humidity and temperaturewith at least 90% efficiency and aerosol disinfector humidifier to attain a maximumof 80% RH.
11.IRGA along with pump pack considering as a set CO2 monitoring by microprocessorbased CO2 analyzer with non-dispersive infrared absorption (NDIR) measuringmethod. The repeatability of the CO2 analyzer within ±0.5% of full scale andresponse time of 1-3 seconds; within ±1% of linearity; ±0.5% of noise of fullscale with in-built temperature and relative humidity measurement facility. Beforeair sample enters the analyzer, it should pass from the moisture removal device tosafe guard the analyzer from excess humidity. The provision for measuring CO2concentration should be made through 6 sampling points in each chamber by adedicated CO2 analyzer with pump pack and should be interfaced with SCADAand PLC.
12.Heating system for four chambers (2 only temperature; 2 with both temperatureand CO2): The gradient of 5±0.5°C above ambient increase in temperature within
CTGC facility at Agro-forestry field of ICAR Research Complex, Umiam

6
each chamber with 1±0.5°C increase at regular interval are set with proper controland regulation. The temperature settings have a cut off for above 50±0.5°C underany circumstances. The provision to program variable temperatures for differentdurations and an in-built alarm system for different trouble shooting events needare provided.
Applications1. To evaluate the physiological, bio-chemical and phenological responses of crop
genotypes to the interactive effects of elevated temperature and CO22. To assess the interactive effect of elevated temperature and CO2 on Carbon
metabolism (photosynthetic rate, chlorophyll fluorescence etc.).
Free Air Temperature Enrichment (FATE)FATE facility comprises of ring like structure of 8m diameter with steel pole erections
around the ring to support infra red (IR) lamps (1500 – watt) positioned at an angle of 40°and about 1.2 m above ground which can homogeneously irradiate 40-50 cm path ofvegetation. These lamps are regulated by proportional action controller, which modulatesIR flux density (frequency, 10 Hz) to obtain a preset target temperature differential (T)between heated and a corresponding unheated plot. IR lamps, used in simulating temperature,are made of tungsten filament and can irradiate at 2000 °C. Filter is used selectively to cutoff visible light so that light can be continued in night. It also removes wavelength to whichphytochrome is sensitive so that photo morphogenesis can be avoided.
Specifications1. Nine FATE rings with 8m diameter at elevated surface air temperature (ambient
30o C) and CO2 (550 ppm) level with detachable arrangement and height adjustment(up to 2m) with respect to crop height.
2. Three rings each for maintaining the conditions ofi) Ambient crop canopy temperature +3oC±0.5oCii) Ambient crop canopy temperature +3oC±0.5oC and 550 ppm ±50 ppm CO2iii)Ambient control with all structural fittings for temperature and CO2 elevation
3. Heating system for maintaining elevated crop canopy temperature of +3oC±0.5oCis achieved through infra red heaters of 230V at one meter above canopy. Thenumber of heaters to maintain set elevated temperature is fixed appropriately.Warming by heating system does not have any effect on photo-morphogenesisand no significant radiation emission shorter than 850 nm from IR heaters.
4. CO2 supply system consists of pressurized and refrigerated CO2 tank of min 20kilo liters with all necessary accessories to maintain required pressure andtemperature and with safety certificates. Gaseous CO2 is supplied to each FATEring through CO2 supply lines.

7
FATE facility developed at ICAR Research Complex, Umiam under NICRA

8
5. Temperature, CO2 controlling and monitoring system along with data storage andback up facility are installed. CO2 monitoring by NDIR micro processor controlledCO2 analyser with 0-2000 ppm range compensate the signal offsets caused bywater vapour, temperature and barometric pressure. The heating system sensecanopy temperature (with corrections for reflected infrared radiation from heaters)and use a proportional-internal-derivative (PID) feedback system to maintain theheating treatment.
6. Automatic Weather Station (AWS) including solar radiation, air temperature,relative humidity, rain gauge, wind speed and wind direction.
7. Soil moisture and soil temperature monitoring at depths of 15cm, 30cm, 45cmand 60cm preferably at four points in each FATE rings.
8. UPS system support all control and monitoring units with 2hrs back up.
Applications1. To investigate the dynamics of carbon and nutrients in soil and plants under elevated
CO2 and temperature.2. Generating data base on micro meteorological observations in the crop canopy
under elevated temperature and CO2 conditions.3. Pest and disease incidence/dynamics under elevated temperature and CO2
conditions.

9
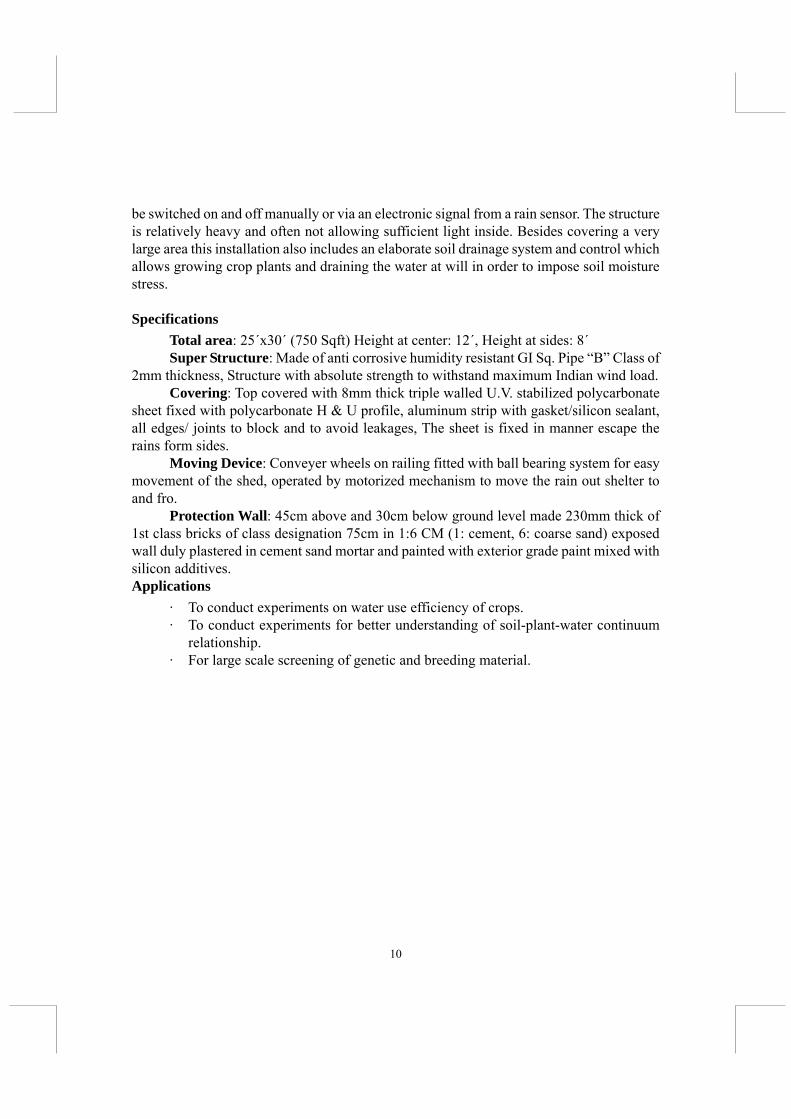
Rain Out Shelter (ROS)
Rainout shelters (ROS) are the facilities designed to protect a certain area of landagainst receiving precipitations so that an experimentally controlled drought stress can beimposed on that area. There are two different types of rainout shelters viz. (1) static and (2)movable. Within the moveable design there are automatic/motorized and manual versions.The automatic version is signaled to move over the protected plot by a rain sensor and anelectric drive system. Rain sensors activate electric motors to move the shelters along thetracks to cover the crop during a rainfall event. Once the rain stops, the shelter moves off thecrop automatically. The manual version is moved either by manually switching the driveon (“manually driven”) or by manually pushing it (“manually pushed”) over the protectedplot.
Many versions of motorized moveable shelters are available. The “classical” designused in many of these shelters consists of the same principle. A roof /walls structure ismounted on wheels on a track. The structure can be driven by electric motors. The drive can
Automatic rain out shelter facility at ICAR RC NEH Region
10
be switched on and off manually or via an electronic signal from a rain sensor. The structureis relatively heavy and often not allowing sufficient light inside. Besides covering a verylarge area this installation also includes an elaborate soil drainage system and control whichallows growing crop plants and draining the water at will in order to impose soil moisturestress.
SpecificationsTotal area: 25´x30´ (750 Sqft) Height at center: 12´, Height at sides: 8´Super Structure: Made of anti corrosive humidity resistant GI Sq. Pipe “B” Class of
2mm thickness, Structure with absolute strength to withstand maximum Indian wind load.Covering: Top covered with 8mm thick triple walled U.V. stabilized polycarbonate
sheet fixed with polycarbonate H & U profile, aluminum strip with gasket/silicon sealant,all edges/ joints to block and to avoid leakages, The sheet is fixed in manner escape therains form sides.
Moving Device: Conveyer wheels on railing fitted with ball bearing system for easymovement of the shed, operated by motorized mechanism to move the rain out shelter toand fro.
Protection Wall: 45cm above and 30cm below ground level made 230mm thick of1st class bricks of class designation 75cm in 1:6 CM (1: cement, 6: coarse sand) exposedwall duly plastered in cement sand mortar and painted with exterior grade paint mixed withsilicon additives.Applications
· To conduct experiments on water use efficiency of crops.· To conduct experiments for better understanding of soil-plant-water continuum
relationship.· For large scale screening of genetic and breeding material.

11
Plant Growth Chamber
A plant growth chamber is a kind of arrangement, which is developed to create artificialenvironmental conditions whilst eliminating the variability found in nature. In this chamberor cabinet, temperature, light and humidity are controlled in such a way that one can createdesired environment essential for research and testing for a particular seed or plant.
Product features for plant growth chambers may include touch-screen controls,observation windows, additional lighting, humidity control, spray nozzle packages, air-cooledcondensing, remote-controlled condensing, dry alarms, cabinets and shelving, dimmablelighting, extended temperature ranges, and heated or glass doors. Most plant growth chambersare made of metal and covered in a white enamel finish. There are two basic models: reach-in and walk-in type. Reach-in plant growth chambers or incubators are often used in researchapplications. These provide lighting for vascular plants, and are used in plant pathologyresearch, seed development, and many other applications. Reach-in plant growth chamberscan have swinging, flip-open, or sliding doors. Some models have more than one chamberwith the option of individual controls. These plant growth chambers are available in a varietyof sizes to accommodate many different types of plants.
Plant growth chamber installed at ICAR Research Complex under NICRA

12
Lighting: The chambers use a combination of fluorescent and incandescent lamps toprovide balanced daylight spectrum with 100% to 10% light intensity which is desirableplant growth. ‘Dawn/dusk’ conditions are simulated by the addition of a high proportion ofred light. Light fixture is counter-balanced and heat from the lamps is removed by therefrigeration system. As an additional option, the height of the lamps can be adjusted usingan external motor. This ensures that the growing conditions remain constant and the plantsare not disturbed.
Refrigeration system: Cooling is provided using self-contained water cooledcondensing unit with hot gas bypass for continuous compressor operation.
Airflow: horizontal or vertical airflow.The plenum wall and floor design ensures a low air velocity guaranteeing a high
degree of temperature/humidity.SpecificationsLighting modules : Three (Low, Medium and High)Lighting intensity : 200 to 1000 mmol m-²s-¹Lighting type : Fluorescent and incandescentTemperature range : +5°C to +40°C - lights off
+10°C to +45°C- lights onHumidity range : 40%RH to 95%rh lights off
40%RH to 85%rh lights onAirflow : Horizontal or verticalDimension :
ApplicationsPlant growth chambers are extensively employed for agricultural and life science
research applications including plant production, bio-engineering, pharmaceuticals andplant pathology research.

13
Biochar Production Unit
Biochar is a name for charcoal when it is used for particular purposes, especially as asoil amendment to sequester carbon and improve soil properties. It is a porous carbon richsolid produced by thermo-chemical conversion of biomass in an oxygen depleted atmospherecalled pyrolysis. The only difference between biochar and charcoal is in its utilitarianintention. Biochar is produced for soil application whereas charcoal is produced for otheruses such as heating, barbeque, etc.
Pyrolysis of biomass produces biochar, liquids, and gases. The relative yield ofproducts from pyrolysis varies depending on process conditions and feedstock used.Temperatures of 400–500 °C (752–932 °F) produce more char, while temperatures above700 °C (1,292 °F) favour the yield of liquid and gas fuel components. Pyrolysis occursmore quickly at the higher temperatures, typically requiring seconds instead of hours. Hightemperature pyrolysis is also known as gasification, and produces primarily syngas. Typicalyields are 60% bio-oil, 20% biochar, and 20% syngas. By comparison, slow pyrolysis canproduce substantially more char (~50%).
Process of Biochar production from organic residues
SpecificationsFeedstock type: moist biomassFeedstock volume: 1.5 cubic metersBatch time: from 3 to 10 hoursMoisture content: up to 60%Feedstock size: Wood chips (Upto 30 cm length), Crop residues, Weed biomassChar yield: up to 100 kg per batchInfrastructure used: 3 electric fans and a generator (provided with the kiln)

14
Applications
1. Biochar production unit is used to produce biochar from biowaste like Cropresidues, Weed biomass, wood chips which are available in plenty in NEH Region.By converting this agricultural waste into a powerful soil enhancer like biocharthat holds carbon and makes soils more fertile, discourage deforestation andpreserve cropland diversity.
2. Biochar application improves soil organic carbon, physical as well as chemicalproperties of soil.
3. Biochar can improve almost any soil. Areas with low rainfall or nutrient-poorsoils of NEH Region will benefit most likely from addition of biochar.
4. Research areas that confirming benefits of biochar application include:· Reduced leaching of nitrogen into ground water· Possible reduced emissions of nitrous oxide· Increased cation-exchange capacity resulting in improved soil fertility· Moderating of soil acidity· Increased water retention· Increased number of beneficial soil microbes
Biochar production unit commissioned under NICRA project at ICAR Barapani
15
Lysimeter
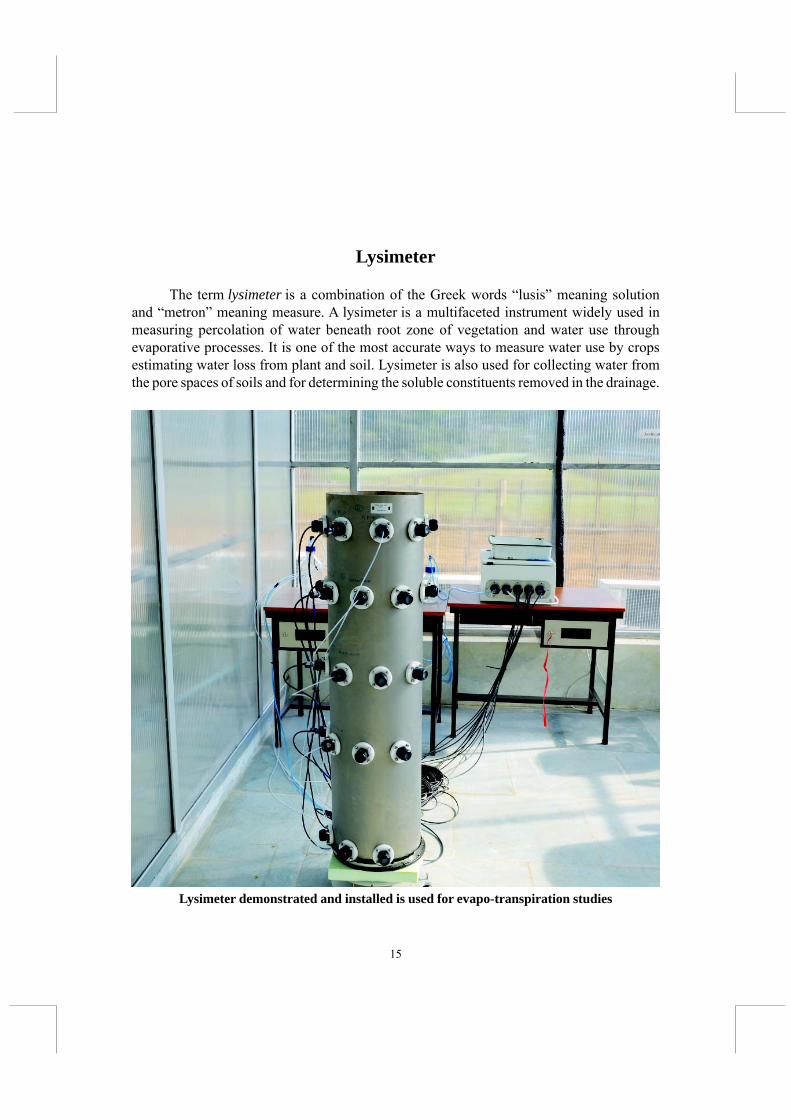
The term lysimeter is a combination of the Greek words “lusis” meaning solutionand “metron” meaning measure. A lysimeter is a multifaceted instrument widely used inmeasuring percolation of water beneath root zone of vegetation and water use throughevaporative processes. It is one of the most accurate ways to measure water use by cropsestimating water loss from plant and soil. Lysimeter is also used for collecting water fromthe pore spaces of soils and for determining the soluble constituents removed in the drainage.
Lysimeter demonstrated and installed is used for evapo-transpiration studies

16
Lysimeters are of two types: Weighing and non-weighing. Weighting type of lysimeterrepresents field conditions well since it is done outside the laboratory. Weighing lysimetershave been used to quantify precipitation (P) not only in the form of rain or snow, but alsodew, fog and rime and also to determine actual evapo-transpiration (ET).
With the advent of modern computers and data loggers, continuous monitoring ofweighing lysimeter is readily possible. The most representative units typically havemonolithic cores where soil structure and associated parameters remain unchanged, asdisturbed soil cores may affect plant growth conditions significantly. S i m i l a r l y ,laboratory lysimeter is used to measure the amount of water crops use under controlledcondition, It can also be used for leaching loss of nutrients study, lime movement along thesoil depth etc.
Specifications· The Lysimeter is equipped with:
o Six TS1 tensiometers in the depths of 0.2, 0.4, 0.6, 0.8 and 1.4 m and with afield tensiometer at the depth of 1.4 m.
o Eight 30 cm long 3-rod TDR probes in the depth of 0.1, 0.2, 0.3, 0.4, 0.6, 0.8,1.0 and 1.4 m.
· A climate station consisting of a air temperature, a humidity, a wind speed, a net-radiation and a global radiation sensor
· The weighable lysimeter has a surface of 1 m² and a monolith depth of 1.5 m· To receive the congruent field drainage the lysimeter’s suction cup rake at 1.40 m
is evacuated according to the field water tension which is measured in 1.40 mdepth with an external tensiometer.
Applications1. Evapotranspiration Studies- it is used in direct measurement of the water balance
of crop plants. By weighing both the lysimeter and the drainage barrel, increase instored water due to rain or irrigation and losses of water due to evapotransirationand deep drainage are directly measured and easly computed mathematically
2. It helps in determination of stage-wise crop co-efficient for irrigation scheduleing3. It helps in studying leakage/percolation of contaminants

17
Root Imager
Root development and function are vitally important for plant adaptation to anenvironment. Root imaging in-situ helps to examine root health and activity which are criticalindicators of plant performance and economic yield.
Root Imager (CI-600R) is used for imaging of plant roots in situ and to study its distribtutionand density in the rhizosphere
Specifications· Scanner Resolution: Maximum 600dpi - up to 23.5 million pixels· Image Size: 21.6W × 19.6L cm (8.5W × 7.7L in)· Scan Speed: 5 to 15 seconds - depending on scanning resolutions

18
· Interface: USB port· Power Supply: Computer USB port· Scan Head Dimensions: 34.3cm long × 6.4cm diameter· Standard Clear Tube Dimensions: 6.4cm inner diameter × 105cm length (2.5 inches
× 41 inches); custom lengths available upon request· Scanner Unit Weight: 750g
Applications➢ It provides an underground, high resolution, color image of the living roots in the
soil.➢ This enables the observation of root growth and behavior over time-one or multiple
growing seasons➢ It can be easily operated using a laptop or tablet and user friendly software provided
with the system.➢ Portable and field ready for fast accurate root and soil images

19
Portable Photosynthetic System (PPS)
Photosynthesis systems or Infra Red Gas Analyser (IRGA) are electronic instrumentsdesigned for non-destructive measurement of photosynthetic rates in the field. Photosynthesissystems are commonly used in agronomy and environmental research, as well as studies ofthe global carbon cycle. IRGA is one such system commonly measures fluxes of CO2 in anairstream moving through a transparent chamber enclosing a leaf. In addition to permittingthe researchers to quickly assay small CO2 fluxes, this technique avoids the logistic problemsassociated with radioactive substances and can be employed in the field. The basiccomponents of a photosynthetic system are the leaf chamber, infrared gas analyzer (IRGA),batteries and a console with keyboard, display and memory.
Parameters measured➢ a) Leaf temperature, b) Chamber air temperature, c) PAR (photo-synthetically
active radiation), d) Atmospheric pressure. These systems may used to calculatea) water use efficiency of agro ecosystem (A/E), b) Stomatal conductance (gs), c)Intrinsic water use efficiency (A/gs), d) Sub-stomatal CO2 concentration (Ci).

20
Specifications
Main Console
Analysis Method (Gas Analyzers)Non-dispersive infrared, configured as an absolute absorptiometer with microprocessor
control of linearization.The analyzers simultaneously measure absolute CO2 and H2O of thereference and analysis gas streams.
Measurement RangeCO2: 0-2,000 μmol mol-1 (Optimal Range), 0-9,999 μmol mol-1 (Maximum Range)
H2O: 0-75 mb Corrections are made for temperature, pressure and foreign gasbroadening.
Precision (Absolute)CO2: 0.2 μmol mol-1 at 300 ppm,
0.5 μmol mol-1 at 1,750 ppm3.0 μmol mol-1 at 9,999 ppm
H2O: 0.015 mb at 0 mb0.020 mb at 10 mb0.030 mb at 50 mb
LinearityBetter than 1.0% throughout the range, with calibration at 2,000 ppm CO2 or 40 mb
H2O.
Stability (CO2 Analysis)Automatic zero at regular intervals corrects for sample cell contamination, source
and detector ageing and pre-amplifier gain changes.
Response TimeElectrical: 0.5 secondsDisplay/Analog Output: 1.6 secondsPneumatic: < 5 seconds
Air SamplingAdjustable up to 100 cm3 min-1 using integral DC pumps. Both analysis and reference
pumps fitted with mass flow controllers. The analyzer may be used in open and closedsystems.
Environmental Sensor Inputs3 input channels are available for use with PP Systems’ environmental sensors.

21
Accuracy: Better than 1 min/month at 25°C.Operating Temperature: 0-70°C.
Recording OptionsBy PC or by the instrument. Automatic logging at user selectable intervals between
10 seconds and 1 hour, controlled by internal real-time clock.
Instrument Status DetectionIndication of instrument malfunction, including low battery voltage (< 10.5V) through
the blinking light signals.
Power SupplyInternal, rechargeable 12V NiMH batteries providing up to 8 hours continuous use.
Batteries can easily be changed without shutting down the system.
Integral Cuvette Air Supply Unit0-470 cm3 min-1 measured and controlled by a mass flow meter.
PPS procured under NICRA is used to measure photosynthetic parameters of various fieldcrops under climate change
22
Automatic Control RangeCO2: 0-2,000 μmol mol-1, H2O: 0- Dewpoint
Operating Environment0-50°C, Non-condensing.. In dirty environments, external air filtration is required.
Applications1. To understand the effect of CO2 enrichment on the photosynthetic behavior of
plants in terms of photosynthetic rate (A), Transpiration rate (E) and stomataconductance (gs)
2. To study the effect of biotic (pest and disease) and abiotic stress (drought resistance,salt tolerance and heavy metal tolerance) on staple crop plants transgenic plants.
3. To measure isoprene emission rates from plantation trees (oil palm tree) and tounderstand volatile substance emission from trees which are under circadian controlof plants.
4. To evaluate the eco-physiological diversity, behavior and the breeding potentialof wild germplasm
5. To investigate the relative effects of tree age and tree size on the physiologicalattributes of two broadleaf species.

23
Controlled Environmental Laboratory Shaker
Environmental chamber is an enclosure used to test the effects of specifiedenvironmental conditions on biological items, industrial materials and electronic devices.These chambers can simulate any type of environmental condition such as temperature,humidity, vibration, light intensity etc. with versatile programming. Temperature control bymicroprocessor plus shaking ensures a constant and even temperature within the chamber.Equipped with direct drive shaking system for reliable, long-term operation needed for cellgrowth. It is simple to programme time, temperature and shaking speed using electronicdisplay.
Controlled Environmental laboratory shaker at ICAR Research Complex, Umiam

24
Features: Digital control of time, temperature and shaking speed for accuracy andrepeatability, Variable speed: 50 to 250 rpm.
SpecificationsTemperature setting range : 10 to 70°C ,Maximum load : 8kgOverall dimesions : 590 × 525 × 510 mmDimensions(inner chamber) : 460 × 350 × 400 mmDigital time setting : 0-96 hrs (nonstop)Load up to 2.5 kg, Interchangeable platforms for shaking/incubating different vessels,Option of four easily interchangeable platforms for a wide range of different, robust,
compact construction with clear small window panel for easy visibility of chamber contents.
ApplicationsThe bench-top shaker-incubators can be used for mixing/shaking and incubating
biological fluids samples, cell cultures and tissues for required period of time.
Controlled Environmental laboratory shaker used for incubation and shaking of biologicalsamples under desired temperature and light conditions

25
Ultrasound with Color Dapple
This system uses echoes as the basis of sonar (sound navigation and ranging). Thesounds used for sonar are well within the ultrasonic range, with frequencies of 1 - 20 megaHertz (MHz). The vibration is largest when the electric field stimulates a natural frequencyof a crystal (an example of resonance). The vibrations are then passed through any adjacentmaterials, or into the air as a longitudinal wave i.e. a sound wave is produced. Normally thetransmitting and receiving crystals are built into the same hand-held unit, which is a called,an ultrasonic transducer (generally, a transducer is any device to convert energy from oneform to another). Because of the impedance difference between air and skin, a couplingmedium helps to match the impedance of the crystal in the probe more closely to theimpedance of the skin of the patient. The most common coupling medium is a film of oilsmeared on the patient’s skin. The operator requires needs to ensure that the probe is kept incontinuous contact with the oil, preventing air bubbles coming between the probe and skin.On the other hand, different body layers such as fat, muscle and many body organs havevery similar impedances, so that most of the beam will pass from one layer into the next,and only a small fraction is reflected. In practice, this is not a problem, in fact the imaging
Ultra sound facility used in detection of various reproductive disorders in animals and pets

26
technique relies on it. To obtain a reasonable image with good resolution of an interfacebetween two layers, around 1% of a beam must be reflected, leaving a substantial portion tocontinue on to further reflections.
SpecificationsThe Color Doppler Ultrasound System is provided with the advanced ultrasonic
Doppler technologies, including the Full Digital Super-wide Band Beam Former, DigitalDynamic Focusing, Variable Aperture and Dynamic Tracing, Wide Band Dynamic Range,Multi-Beam Parallel Processing, etc.
The ultrasound diagnostic software system, ultrasound system imaging, multi-languages operation interfaces and touch screen with human-computer interaction technologyare customized easily in accordance with the design of human engineering.
This system has been designed to comply with applicable international standards andregulations, ensuring the safety and availability. This system is based on the computertechnology and Linux operation system, which make the system more flexible and stable.
Applications- Imaging inner body parts especially soft tissues noninvasively- Follicular dynamic, follicular wave in different season, pregnancy diagnosis and
abnormal condition in the reproductive tract.

27
Radio Telemetry
Biotelemetry is the measurement of biological parameters over a distance. The meansof transmitting the data from the point of generation to the point of reception can take manyforms.. It is defined as a means of transmitting body physiological data from a remotelocation to a location that has the capability to interpret the data and affect decision making.Biotelemetry is a vital constituent in the field of medical/veterinary sciences. It entails remotemeasurement of biological parameters. Use of wires to transmit data may be eliminated bywireless technology. Biotelemetry, using wireless diagnosis, can monitor electronically thesymptoms and movements of animals.
SpecificationsInstrument Type: Industrial RF Transceiver
Telemetry instrument procured under NICRA project at ICAR NEH HQ, Umiam

28
Transceiver Performance:Output Power: 1000mWTransmission Range: Up to 15 miles (32 km) line-of-sightReceiver Sensitivity: -100dBm typical @ 76.8kbps RF Data Rate
Networking:Frequency Band, RF Technology: 902 - 928, FHSS (USA)Supported Network Topologies: Point-to-Point, Point-to-Multipoint Channels: 32
Electrical:Power Consumption: 40mA receive, 400mA transmit (@ 12 Vdc)Power Requirement: 7-18 VDC
Environmental:Operating Conditions: Temp -40° to +176°F (-40° to +80°C);10% to 90% humidity (non-condensing)
Physical:Dimensions: 4-3/4x2-3/4x1-1/8 inch (12x7x2.9 cm)Weight: 7 oz (170 g)
Applications➢ Modern telemetry is widely used to send signals from a living organism over
some distance to a receiver without use of wires. Usually, biotelemetry is used forgathering data about the physiology, behavior, or location of the organism.
➢ Biotelemetry is extensively used in medical/veterinary fields to monitor animalsand research subjects. Sensors and transmitters placed on or implanted in animalsare used to study physiology and behavior in the laboratory and to study themovements, behavior, and physiology of wildlife species in their naturalenvironments.
➢ Different physiological parameters like Blood pressure, electrocardiogram, bodytemperature and heart rate and some stress parameters and behavior of pigs can beassessed under different climatic condition.
➢ It is advantageous due to its non-invasiveness, real picture based and can be assessedwithout handling animals.

29
TOC Analyzer
Total organic carbon (TOC) analyzers are devices used to analyze the organic carboncontent in liquid as well as solid samples. They provide highly sensitive, non-specific readoutsof all TOC through two-stage processes involving oxidation and detection. Apart frommeasuring organic carbon, it can also detect Total Carbon (TC) and Total Inorganic Carbon(TIC) in solid and liquid samples. In the instrument, the sample is delivered to the combustionfurnace, which is supplied with purified air. There, it undergoes combustion through heating
to a high temperature (usually 680°C) with a platinum catalyst. It decomposes and is convertedto carbon dioxide. The carbon dioxide generated is cooled and dehumidified, and thendetected by NDIR (Non Dispersive Infrared) detector.
General view of TOC Analyzer connected with TIC Module

30
Operational diagram of TOC Analyzer connected with TIC Module
Specifications
Item Description
Measurement items TC, NPOCOptional: IC, POC, TOC (= TC-IC, = NPOC + POC), TN
Measurement principle 680° combustion catalytic oxidation - NDIR detectionmethod
Measurement range From 0 – 5 to 0 – 1,000 mgC/L f.s. (0 to 20,000 mgC/L f.s. with dilution function)
Repeatability Within ±2 % f.s. *1Span stability Within ±2 % f.s. /day (temperature variation within 5 °C)*1Measurement cycle 4 minutes min. (NPOC, residual IC 2 % max.) *2Sample injection method Syringe pump/sliding injection portSample dilution function Dilution within syringe; dilution factor 2 to 50
Dilution accuracy: Within ±2 % (×2 to ×20); within ±5 %(×21 to ×50)

31
Automatic calibration function Automatic calibration using standard solution (Dilutionwater is used as the zero standard solution for zero-calibration.) Options can be attached to use up to eightstandard solutions and to permit automatic calibration withup to a 5-point multi-point calibration curve.
Display, operation Color LCD with touch screenEPA TOC removal rate TOC removal rate calculation according to the United Statescalculation function EPA regulations (Part IV 40 CFR Part 9, 141 and 142, 1998)
(when a 2- or more-stream switching option is provided)Data storage function Store 20,000 past on-line measured values (equivalent to
one year’s data at 30-minute measuring cycle).Offers trend graph displays.
Data storage device Store measured values or measurement conditions to USBmemory *3. (USB 1.1 or 2.0 USB memory; FAT16 orFAT32; no encryption)
Analog output Selectable between 4 – 20 mA DC or 0 – 16 mA DC (isolatedoutputs) With attached option: Up to 12 outputs (loadresistance: 500Ù max.)
Contact output signal Alarm signalsMajor failure, instrument alarm, power cut, CPU alarm,concentration alarm (upper limit/lower limit/upper upperlimit/lower lower limit), measurement halted event signals.Maintenance, measurement ready, on-line operation,measuring sample, calibrating, regenerating catalyst,measuring control sample, interrupt samplemeasurement,analog output trigger, analog output flow linerecognition signal, measured flow line recognition signal,sampling pump control output
Contact input Start calibration, stop measurement, start on-linemeasurement, reset alarm, measurement start flow line 1 to6, halt measurement (output contact capacity: 1.4 V DCmin., 10 mA min.)
Carrier gas Pressurized air, high-purity air, oxygen *4; supply pressure:250 to 300 kPa. Optional: High-purity nitrogen *4
Power supply AC 100 ~ 240 V ±10%, 10 A, 50/60 HzAmbient temperature Within 1 to 40° (34 to 104°)Dimensions W550 × D383 × H1240 mm (excluding protrusions)
(W22 x D15 x H49 inches)Weight Approx. 70 kg (154 lbs.)

32
Applications➢ Total organic carbon (TOC) analyzers are used to evaluate the total amount of
organic matter in water from the amount of carbon it contains.➢ TOC analyzers are used in diverse fields, including the management of tap water,
effluent, and ultrapure water, management of pharmaceutical water used in drugmanufacturing processes, evaluation of cleaning efficiency (cleaning validation),and environmental investigations of river water and soils, for example.
➢ Total organic carbon sensors and analyzers provide fast, continuous measurementof ppb-level organic contamination so that it will help to monitor organiccontamination.

33
Gas Chromatography
Gas chromatography (GC) is a common type of chromatography used in analyticalchemistry for separating and analyzing compounds that can be vaporized withoutdecomposition. Typical uses of GC include testing the purity of a particular substance, orseparating the different components of a mixture (the relative amounts of such componentscan also be determined). In some situations, GC may help in identifying a compound. Inpreparative chromatography, GC can be used to prepare pure compounds from a mixture.
In GC, the mobile phase (or “moving phase”) is a carrier gas, usually an inert gassuch as helium or an un-reactive gas such as nitrogen. The stationary phase is a microscopiclayer of liquid or polymer on an inert solid support, inside a piece of glass or metal tubingcalled a column (a homage to the fractionating column used in distillation). The instrumentused to perform gas chromatography is called a gas chromatograph (or “aerograph”, “gasseparator”).
In general, substances that vaporize below 300 °C (and therefore are stable up to thattemperature) can be measured quantitatively. The samples are also required to be -free; they
Gas chromatography installed in central lab of ICAR RC NEH, Umiam, Meghalaya

34
should not contain ions. Very minute amounts of a substance can be measured but it is oftenrequired that the sample must be measured in comparison to a sample containing the pure,suspected substance known as a reference standard.
Specifications
Operation Parameters
Ambient temp. : -10°C to 55°C (Optional enclosure: -40°C to 60°C)Humidity : 0-95% non-condensingPower Consumption : 24 watts @ 24 VDC (Nominal Operation),
36 watts @ 24 VDC (startup),110 VAC operation (optional)
Carrier Gas : Helium @ 10 cc/min @ 60 PSI. Approximately 4-5months using of 300 ft3 bottle.Hydrogen carrier option available,
Sample Flow Rate: 10 – 100 PSI clean, dry gas @ 50 cc/min
Scientists working with Gas chromatography system, installed in central lab of ICAR RCNEH, Umiam, Meghalaya

35
Performance parametersRange : 0-1000 ppm to 100% for individual componentsResponse : 4 minutes for C1 to C6+, N2, CO2
5 minutes for C1 to C7+, N2, CO23 minutes for H2S and CO2, depending on backgroundcomposition For other measurements / times pleaseconsult factory
Linearity: 1% for individual componentsRepeatability: ±0.5 BTU per 1000 BTU
Instrument SpecificationsSize : 14”H x 12”W x 8”DWeight : 35 lbsColumns : 1-4 – 1/16” stainless steel packed column (application
dependent)Valves : 1-4 valves – Uses Valco Model DV22 10-port / Model
DV22 6-portDetector : Low Temperature TCDOven : Stainless steel oven using airless heat sink.
Designed to maintain consistent temperatureElectronics : Galvanic DIMAC dual processor platform utilizing 32
bit ARM7 CPU, advanced I/O processor and 6MB flashmemory. Real time clock with battery backup.
Software : Galvanic DIMAC software. DIMAC is a Windows-based,graphical user interface (GUI) software used for analyserconfiguration and monitoring.
Data Logging & : Stores up to 10,000 items. User can setparameters suchArchiving as time (hourly, daily, weekly, monthly, each analysis)

36
and averages (hourly, daily, weekly, monthly and yearly,each analysis).
Reports : Can generate report of calculated values including BTUvalue, relative density, GPM, vapour pressure, specificgravity and liquid volume % for each component, plusother totalized readings.
Applications➢ Gas chromatography used to determine the identity of Natural products containing
mixtures of similar compounds. Ex: Crude oil analysis (Hydrocarbons (C2-C40+)/Contents of Lavender oil/Measuring the ethylene that is secreted by plants
➢ Determination of Pesticide residues in Agriculture/Aquaculture products➢ Qualitative and Quantative analysis of Phytosterol content in Food products➢ GC is used to quantify GHG emissions under climate change➢ Gas Chromatography is used extensively in forensic science to identify and
quantify various biological specimens and crime-scene evidence.

37
Phase Contrast Microscope
Phase contrast microscopy is an optical microscope technique that converts phaseshifts in light passing through a transparent specimen to brightness changes in the image.Phase shifts themselves are invisible butbecome visible when shown as brightnessvariations. When light waves travels througha medium other than vacuum, interactionwith the medium causes the wave amplitudeand phase to change in a manner dependenton properties of the medium. Changes inamplitude (brightness) arise from thescattering and absorption of light, which isoften wavelength dependent and may giverise to colours. Photographic equipment andthe human eye are only sensitive to amplitudevariations. Without special arrangements,phase changes are therefore invisible. Yet,phase changes often carry importantinformation.
Phase contrast microscopy isparticularly important in biology. It revealsmany cellular structures that are not visiblewith a simpler bright field microscope. Thesestructures were made visible to earliermicroscopists by staining, but this requiredadditional preparation killed the cells. The phase contrast microscope made it possible forbiologists to study living cells and how they proliferate through cell division. After itsinvention in the early 1930s, phase contrast microscopy proved to be such advancement inmicroscopy, that its inventor Frits Zernike was awarded the Nobel Prize (physics) in 1953.
SpecificationsHigh-contrast observation of internal structure of live cells/fungus • UPLFLN-PH
series objectives have high transmission factors, producing well balanced images with highcontrast even at low magnifications. They are suitable for simultaneous fluorescence, brightfield and dark field observations.
Phase Contrast Microscope

38
ApplicationsPhase contrast microscopy is especially useful for studying microbial motility,
determining the shape of living cells and detecting bacterial structures such as endosporesand inclusion bodies. It also widely used to study the eukaryotic cells.
Turnip
Radish
Stomatal structure and distribution of turnip and radish crop plants in abaxial and adaxialsurface of the leaves viewed through compound microscope (Olympus-BX-5)
Compound microscope installed is used for various pathological and cellular studies in plantsand animal tissues

39
Atomic Absorption Spectrophotometer (AAS)
AAS is a laboratory instrument that measures the concentration of elements in soil,fertilizer and plant sample solutions. AAS can be used to determine over 70 different elementsin solution or directly in solid samples used in pharmacology, biophysics and research.Atomic absorption is so sensitive that it can measure down the concentration of elements toparts per billion (μg dm–3) in any sample.
Every element has a specific number of electrons associated with its nucleus. Thenormal and most stable orbital configuration of an atom is known as the “ground state.” Ifenergy is applied to an atom, the energy will be absorbed and an outer electron will bepromoted to a less stable configuration known as the “excited state.” Since this state isunstable, the atom will immediately return to the “ground state,” releasing light energy. The“ground state” atom of elements absorbs light energy of a specific wavelength as it entersthe “excited state.” As the number of atoms in the light path increases, the amount of light
AAS installed at ICAR Barapani under NICRA

40
absorbed also increases. By measuring the amount of light absorbed, a quantitativedetermination of the amount of analyte can be made. The use of special light sources andcareful selection of wavelengths allow the specific determination of individual elements.
Schematic diagram of an atomic absorption spectrometer
There are five basic components of an atomic absorption instrument:1. The light source that emits the spectrum of the element of interest.2. An “absorption cell” in which atoms of the sample are produced (flame, graphite
furnace, MHS cell, FIAS cell, FIMS cell)3. A monochromator for light dispersion4. A detector, which measures the light intensity and amplifies the signal5. A display that shows the reading after it has been processed by the instrument
electronics
SpecificationsFully automated PC controlled true double beam multi element Atomic Absorption
Spectrophotometer1) Optics: Double beam. Optics mounted on a reinforced flat plate with a fitted
cover for protection from dust and vapor. Mirror surfaces are quartz over coatedfor enhanced protection.) 2) Monochromator: Czerny turner mount, diffractiongrating of atleast 1200 lines/mm, blazed at 200nm.
3) Wavelength range: 185-900nm.4) Focal Length: 400mm5) Reciprocal Linear dispersion: 1.3 nm/mm6) Slits Automated slit selection. Settings: 0.2, 0.5, 1.0 nm or more.

41
7) Detector: Photomultiplier (2 nos)8) Background correction: High intensity deuterium background corrector covering
wavelength range 185–425 nm and Corrects up to 2.5 background absorbance.9) Lamp support: At least 4 lamps mounted in fixed positions with fast lamp
selection using mirror and automated lamp selection. Lamps automaticallyswitched off at the end of analysis.
10) Burner: air acetylene burner and nitrous–oxide acetylene burner with Tefloncoating must be quoted.
11) Safety monitoring functions: are available for both flame as well as furnace12) Gas control: Instrument should have fully automatic programmable gas control,
and automatic change over between Air Acetylene and Nitrous oxide flame.13) Sensitivity: >0.9 Absorbance with precision of < 0.5% RSD from ten 5 s
integrations for 5 mg/L Cu standard14) Coded hollow cathode lamps: coded hollow cathode lamps should be quoted
with the system for following elements Na- K-Cl-S-Cr-Cu-Fe-Mn-Ni- Ag - Cd -Pb – Zn- Ca - Mg – Al- Co- Mo-phosphorous.
15) Software & computer/printer: compatible and latest configuration computer,and HP Laser jet color printer
16) GRAPHITE FURNACE:A. Fully automated constant temperature zone graphite furnace, dynamic
feedback temp. Control, cooling water temp compensation, Temperatureprogrammable from 40 to 3000 C with maximum heating rate up to 2000 C/se, Choice of two inert gases with programmable flow rate, Solid titaniumwork-head for maximum corrosion resistance, Quartz and windows for highlight energy. Comprehensive safety interlocks for gases, water flow and temp,tube and transformer temperatures.
B. Tube Camera: Graphite furnace viewing camera for real time viewing insidegraphite tube.
C. Recirculating water chiller: with flow rates of 1.5-2L/min at 175- 200 kPa forcooling of graphite furnace must be quoted from manufacturer and will be ofimported origin.
D. Auto sampler for graphite furnace: Automatic programmable samplesdispenser for GTA atleast 50 samples in 1.5-2 ml vials, five 25 ml vessels forbulk solutions, Automatic preparation up to 10 points calibration, Automaticadditions of modifiers, Pre or co-injections, Automatic over range volumereduction, Hot injection Automatic flow through rinsing.
17) Accessories: Air compressor, Chiller Nitrous Oxide gas regulator with pre heater,Acetylene, Argon Gas cylinders with Double stage regulator, fume hood, 8 KVAonline UPS with 30 minutes back up must be quoted to run the system

42
Applications· water analysis· food analysis· analysis of animal feedstuffs· analysis of additives in lubricating oils and greases· analysis of soils for nutrient content· clinical analysis (blood samples: whole blood, plasma, serum)

43
Automatic Weather Station (AWS)
An Automatic weather station (AWS) is an automated version of traditional weatherstation, either to enable measurements from remote areas or to save human labour. An AWSwill typically consist of a weather-proof enclosure containingthe data logger, rechargeablebattery, telemetry (optional) andthe meteorological sensors with anattached solar panel or windturbine and mounted upon a mast.The basic suite of sensors typicallymeasures wind, pressure,temperature, relative humidity, andprecipitation. In addition,measurements can be taken of e.g.multi-level soil temperature, soilmoisture, global and net solarradiation, water level, andtemperature. The specificconfiguration may vary due to thepurpose of the system. The systemmay report in several differentways. It may be in real -time via alocal link to a computer system orvia telecommunications or satellitesystems. GSM mobile phonetechnology has also been knownto be used. An alternative is thestorage of the information in localdata storage such as flash memoryfor retrieval at a later stage. Mostautomatic weather stations haveThermometer for measuringtemperature, Anemometer for measuring wind speed, Hygrometer for measuring humidity,Barometer for measuring atmospheric pressure. Some of them even have rain gauge formeasuring rainfall, ceilometers for measuring cloud height, present weather sensor orvisibility sensor.
Automatic Weather Station

44
SpecificationsThe sensors along with the accessories and facilities shall be fully compatible with
the data logger and transmission system specified below. All sensors should be NIST (NationalInstitute for Standards and Technology, USA) traceable.
Air Temperature: a) Range: -40°C to +60°C b) Accuracy: 0.2 °C or better (withradiation shield) c) Resolution: 0.1°C d) Sensor Type: Resistance type e) Response Time:10 sec or better
Wind Speed: a) Range (Operation) : 0 to 60m/s or better b) Sustainability : Up to 75m/secc) Accuracy: 0.5 m/s or better d) Resolution: 0.1 m/s e) Sensor Type: Ultrasonic f)Threshold: 0.5 m/s or less g) Response time: 10 sec. or better
Wind Direction: a) Range: 0 to 359 Degrees b) Accuracy: 5 degrees or better c)Resolution: 1 deg. d) Sensor Type: Ultrasonic e) Threshold: 0.5 m/s or better f) Responsetime : 10 sec. or better
Pressure Sensor: a) Range (with single sensor) : 600 to 1100hPa, b) Accuracy : 0.2h Pa or better c) Resolution : 0.1 hPa d) Sensor Type : Solid state e) Response Time : 10 sec.or better
Relative Humidity Sensor: a) Range: 0 to 100% RH b) Accuracy: 3% or better c)Resolution: 1% d) Sensor Type : Capacitive / Solid-state e) Response Time : 10 sec. or better
Rainfall Sensor: a) Range : 0 to 1023 mm/hr b) Accuracy : 5% or better c) Resolution: 0.5 mm d) Sensor Type : Tipping bucket rain gauge or any other suitable sensor. e) Optionfor Snow bound AWS : Rainfall/snowfall measurement may be added
Global Radiation Sensor: a) Range : 0 to 1500 W/m2 b) Accuracy : 5% or better c)Resolution : 5 W/m2 Soil Temperature a) Range : -40°C to +55°C b) Accuracy : 0.1°C orbetter c) Resolution : 0.01°C d) Sensor Type : Resistance type or equivalent e) ResponseTime : 10 seconds or better f) Depths : Two (5 cm and 20 cm)
Soil moisture: a) Range: 10 to 200 centibars suction b) Sensor type : TDR c) Units :Percent Units: Percentage of moisture / mm d) Accuracy : 2 per cent e) Resolution : 10centibar suction f) Depths : Ground level + Five **
Datalogger specifications: The system provided to collect the observationsautomatically from attached sensors, process the same and store them into its memory asper the pre programmed procedure at every full hour UTC and data shall be transmitted tothe INSAT-DRT in TDMA (TIME DIVISION MULTIPLE ACCESS) mode.
Applications1) Meteorological research, 2) Environmental impact studies, 3) Emergency response
4) Fire weather, 5) Waste management
NOTE: Wind Speed and Wind Direction measurements can be made at a height of 10 metres above ground level.Necessary arrangement is made to locate sensors on the tower for the maintenance and sensor upkeep bythe observational staff.

45
Ultra Low Deep Freezers
Ultra-low temperature freezers are specially designed for safe, reliable storage ofplant and animal samples at ultra low temperatures (-40°C to -80°C) with cost-effectiveoperation and innovative features. The inner walls of these instruments are manufacturedfrom high quality acrylic materials to avoid temperature loss. It is equipped with thermostatand digital controller for effective monitoring of temperatures. These ultra-low temperaturefreezers safeguard precious samples at low temperatures with advanced technology platforms,maximum temperature recovery, microprocessor controls and high-quality refrigeration.
Ultra deep freezer is used for storing plant and animal tissues for long time under very lowtemperatures

46
Specifications:➢ Temperature ranges: -40°C to ambient -80°C➢ LED Temperature display➢ Audio visual alarm for door open, power failure & temp. variation➢ Internal stainless steel door with PUF insulation➢ Quick and easy alarm set point programming➢ Display accuracy: +0.5%, full scale➢ Power supply: Single phase 230 Volts, 50 Hz➢ Capacity 101 litres
Applications❖ Deep freezers are used for scientific research, low temperature experiments❖ They used in freeze and storage of special materials like hematid white blood
cell, skin, bone, bacteria semen, biological products, deep-sea products, electricproducts etc.

47
Cold Room Facility
Cold rooms are the facilities for storing large quantities of thermo-labile materialsand perishable products at low temperature. They are standard preservation chambers builtat site to desired dimensions and cooling specifications
Cold rooms facility created at ICAR NEH for storing fruits and vegetables
SpecificationsCold room size: 10ft x 10ft x 8ft (L x W x H)Insulation : Thickness of the insulation PPGI on outside /Inside Pre Fab Modular
PUF panels 60 mm, density >40 kg/m3Type of insulation for floor: 60 mm PUF panel with aluminium checkered sheet
finish, 3mm thickness Door size and Type PUF –Flush in type with 34” x 78” clear openingwith accessories: Pad Lock System, Posi seal Closure, Human Safety Release knob. Provisionof PVC/PP curtains

48
Pull down time: 10HrsMax. Product Incoming temperature: 35°C tempTemperature required in cold room: +2°C to +8° CDoor openings: About 10 times in a day for 2-3 min each timeRefrigeration and Compressor Refrigeration Capacity: 15,000 BTU/hr @ + 2° C
Room temp. & 35° C ambient. Split type Air-cooled with R134A/404 gasDigital Temperature indicator: Provided controller Microprocessor based LED
displayInternal – Lighting (with cover): Electrical sockets 5/15amps Racks SS with 4
shelves with equidistance on two side from top to bottom in conformity with dimensionsMax. Ambient Conditions: +35 ° CPower Requirement: 440 volts, 3-phase, 50hzDrain: Duly insulated Copper pipe with “U” trap.
Applications1. Cold room with highest quality & refrigeration system helpful to maintain desired
cold temperature, humidity level and air flow, which ensures freshness of fruits,vegetables, flower & other perishable products.
2. Cold room facility helpful for storage of vaccines, blood samples, drugs, bioproducts and lots of thermo-labile chemicals with lot of safety factors like humidityand high & low- temperatures alarms
3. Cold room insulated with high-efficiency PUF panels to control the temperaturecan be used for ripening of fruits with the ethylene generators, adequate airflowand refrigeration regulation

49
Dew Point Potentiometer
A Dew point potentiometer measures soil water potential. Water potential ismeasurement of the energy status of the water in a system. It indicates how tightly water isbound, structurally or chemically, within a substance. Water potential can be computedfrom the vapour pressure of air in equilibrium with a sample in a sealed measurement chamber.The dew point potentiometer uses the chilled-mirror dew point technique to measure thepotential of a sample. Here the sample is equilibrated with the headspace of a sealed chamberthat contains a mirror and a means of detecting condensation in the mirror. At equilibriumthe water potential of the air in the chamber is the same as the water potential of the sample.Here the mirror temperature is precisely controlled by a thermoelectric (peltier) cooler.Detection of the exact point at which condensation first appears on the mirror is observedwith a photoelectric cell. A beam of light is directed onto the mirror and reflected into aphotodetector. The photodectector senses the change in reflectance when condensation occursin the mirror. A thermocouple attached to the mirror than records the temperature at whichcondensation occurs. The final water potential and temperature is displayed on a LED screen.
Dew point Potentiometer procured at ICAR NEH for soil water measurements

50
SpecificationsAccuracy : ±0.1 MPa from 0 to -10 MPa, 1% from -10 to -300 MPaRange : 0 to -300 MPaMeasurement time : ~5 minutes for most soil samples, ~20 minutes for plant
tissue samplesTemperature control : 15 to 50°C (± 0.2°C)Sensor type : 1) Chilled-mirror dew point sensor
2) Infrared temperature sensorOperating environment : 5 to 43°C (41 to 110°F)Universal power : 5 to 43°C: (41 to 110°F)Sample dish capacity : 7 ml recommended (15 ml full)Weight : 3.2 kg (5.2 kg shipping weight)Dimensions : 24.1 x 22.9 x 8.9 cm (9.5 x 9.0 x 3.5 in)Case material : Powder-painted aluminumDisplay : 20 x 2 alphanumeric dot-matrixes LCD with backlightingInterface cable : Standard RS232 serial cable (included)
Applications1. Soil water potential can be determined quickly with this device.2. The instrument is very much suited for measuring water potentials less than about
-0.25 bars, but will not provide accurate measurements for soils at moisture contentabove field capacity.
3. Accurate measurements require 10- to 15-minute reading times. To operate theinstrument a disturbed sample of the soil is placed in a dish that is then placedinside the instrument.

51
Gel Documentation Unit
A Gel doc, also known as a gel documentation system, gel image system or gel imager,is equipment widely used in molecular biology laboratories for the imaging anddocumentation of nucleic acid and protein suspended within polyacrylamide or agarosegels. These gels are typically stained with ethidium bromide or other fluorophores such asSYBR Green. Generally, a Gel doc consists of an ultraviolet (UV) light transilluminator, ahood to shield external light sources and protect the user from UV exposure, and a camerafor image capturing.
Gel documentation systemSpecifications
Chemi-luminescence NoFluorescence Yes
Note: Options to convert UV to blue screen available to visualizeDNA samples while protecting against UV damage.
Colorimetry/densitometry YesIllumination control 3 modes (trans-UV, trans white, epi-white)Detector CCDImage resolution 4 megapixelsPixel size (H x V) 4.65 x 4.65 μmFilter holder 3 positions (2 for filters, 1 without filter)Emission filters 1 included (standard), 3 optional

52
Dynamic range >3.0 orders of magnitudeInstrument size 36 x 60 x 96 cm
(L x W x H)Instrument weight 32 kgOperating voltage 110/115/230 V AC nominalOperating temperature 10–28°C (21°C recommended)Operating humidity <70% non-condensingWorkflow reproducibility 100% repeatability via recallable protocols; from image
capture to quantitative analysis and reportsAuto-exposure 2 user-defined modes (intense or faint bands)
Applications1. Gel and blot imaging and analysis: This system accommodates a wide array of
samples from large handcast polyacrylamide gels to small precast gels and blots2. The system is an ideal accomapaniment to PCR, Purification and electrophoresis
systems enabling image analysis and documentation of restriction digests amplifiednucleic acids, genetic finger printing, RFLPs, and protein purification andcharacterisation
3. Can view protein gels stained with Coomassie Blue, Silver Stain and colorimetricgel stains
4. Comprehensive, automated quantitative analysis of protein and DNA samples5. Repeatable, reproducible accurate and easy to use imaging facility through high
resolution high sensitivity CCD detection technology and modular options toaccommodate wide range of samples.
Gel documentation system is used for detection of nucleic acids and proteins in plant andanimal tissues
53
Time Domain Reflectometer(TDR)
A time-domain reflectometer (TDR) is an electronic instrument that uses time-domainreflectometry to measure instantaneously the volumetric water content and electricalconductivity of soil and other porous media. Water content is inferred from the dielectricpermittivity of the medium, whereas electrical conductivity is inferred from TDR signalattenuation. Empirical and dielectric mixing models are used to relate water content tomeasured dielectric permittivity. Clay and organic matter bind substantial amounts of water,such that measured bulk dielectric constant is reduced and the relationship with total watercontent requires individual calibration.
A variety of TDR probe configurations, connectors and waveguides for depthmeasurement ranging from 08 cm to 100 cm are available. Time domain reflectometry systemsbased around the TDR100 consist of a reflectometer, datalogger, coaxial multiplexer(s),cables, and probes. Advances in TDR technology and in other dielectric methods offer thepromise not only for less expensive and more accurate tools for electrical determination ofwater and solute contents, but also a host of other properties such as specific surface area,and retention properties of porous media.
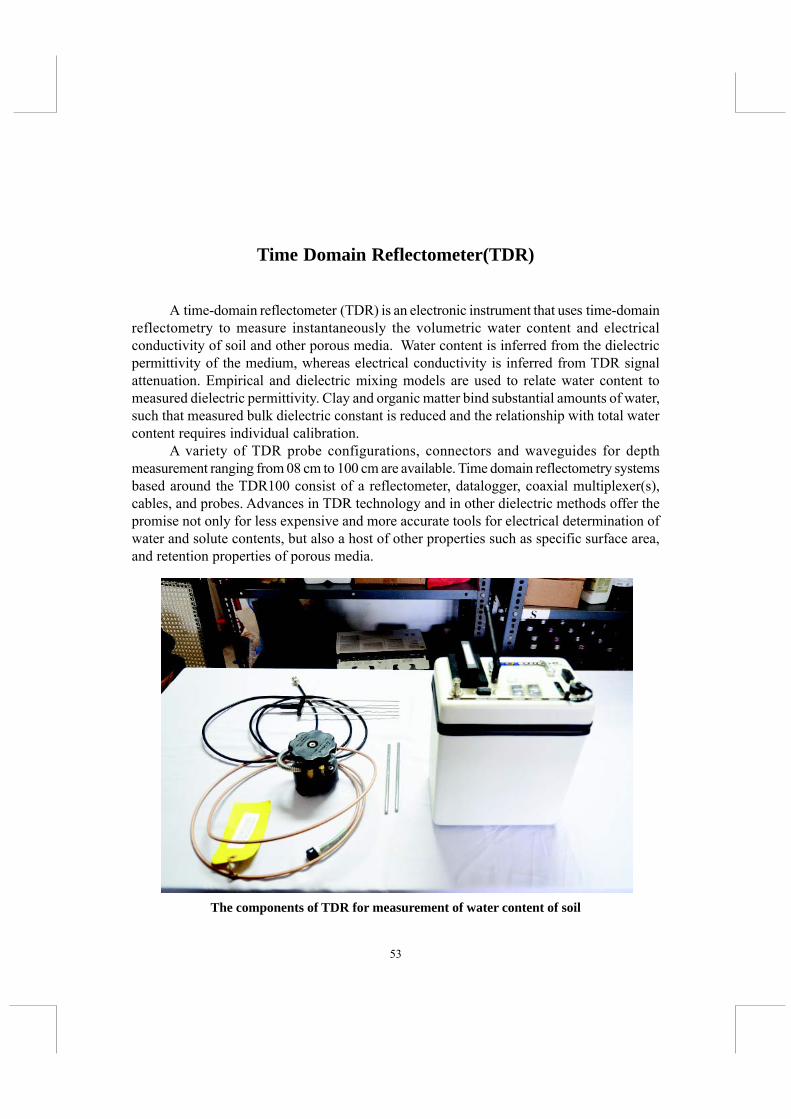
The components of TDR for measurement of water content of soil

54
SpecificationsMeasurement range : 0 – 100% vol. moistureAccuracy : +2%Operating temperature : 0-45°CPower supply : Ni cad batterySampling resolution : 10 picosecondsMeasuring pulse amplitude : 1’6 volt peak
Applications1. Time Domain Reflectometry (TDR) is widely used to measure soil water content,
bulk electrical conductivity, and rock mass deformation.2. For most soils, excluding those with very high in organic matter (OM>10%), the
TDR method provides water content in the range from zero to 0.5 m3 m-3 withaccuracy better than 0.01 to 0.02 m3 m-3
3. TDR probes/measurements are ideal to assess a wide range of soil volumesincluding thin layers near the soil surface
4. TDR measurements are nondestructive offer excellent accuracy and precision.5. It is also very useful in root water uptake studies where information from discrete
parts of the root zone is desired. Since TDR accurately integrates soil water contentchanges occurring along the length of the probe rods, TDR probes may be insertedvertically into soils to accurately assess mean water content over the length of therods, even in soils exhibiting sharp water content changes with depth.

55
Line and Point Quantum Sensors (LQS and PQS)
Line/point quantum sensors measure photosynthetically active radiation (PAR, 400-700 mm) in terms of photosynthetic photon flux density (PPFD). It is also used to determinethe plant intercepted radiation, which is almost linearly proportional to net radiation.
The line quantum sensor is usually 1 m in length and 12.7 mm in width. It is madefrom an array of high stability silicone photo voltaic detectors placed at 2.38 cm apart.These detectors are placed in a water proof anodized aluminum case with acrylic diffuserand stainless hardware.
Line quantum sensor components and light intensity measurements near plant canopy
SpecificationsLQS – Unit: Micromoles per m2 per sec.
Spectral response: 400-950 mm 400-700 mm
Range: 0-5 milli moles/sec

56
PQS – Range: 0-5000 micro moles per m2 per sec
Conversion equation for PQSMicromoles per m2 per sec = RAW data (1500/4096) x 50Sensitivity : Typically 7 μA per 1000 μmol s-1 m-2.Linearity : Maximum deviation of 1% up to 10,000 μmol
s-1 m-2.Stability : < ± 2% change over a 1 year period.Response Time : 10 μs.Temperature Dependence : ± 0.15% per °C maximum.Sensitivity : Variation over Length: ± 7% maximum using a 1”
wide beam from an incandescent light source.Sensing Area : 1 meter L x 12.7 mm W (39.4” x 0.50”).Detector : High stability silicon photovoltaic detector
(blue enhanced).Sensor Housing : Weatherproof anodized aluminum case with acrylic
diffuser and stainless steel hardware.Size : 121.3 L x 2.54 W x 2.54 cm D (47.7” x 1.0” x 1.0”).Weight : 1.4 kg (3.0 lbs.).Cable Length : 3.1 m (10.0 ft.).
Applications❖ Plant scientists, Horticulturists, Ecologists and other Environmental scientists use
quantum and point sensors to measure PAR accurately❖ Quantum sensor output is given in micro moles per second per m2 which can be
converted to WM-2.I WM-2 = 0.2174 micro moles per sec. per m2
Plant absorbed PAR is determined as follows:Absorbed PAR = Incident PAR – (Reflected PAR + Transmitted PAR)

57
Environmental Gas Analyzer (EGA) for CO2 Emissions
Carbon dioxide is a gas of interest in many analytical applications. Carbon dioxidecan be measured in percent (%) and parts per million (ppm) depending on the requirementsof the application. Infrared detectors can be used to measure CO2 because it is an excellentabsorber of infrared energy. Carbon dioxide gas analyzer procured under NICRA is a portableunit with rechargeable battery backup. It is a non-dispersive, infrared gas analyzer thatfeatures an “Auto-Zero” facility. Using this equipment, CO2 concentration at ppm level canbe readily measured. It is a high precision instrument for the use of CO2 monitoringapplications such as greenhouses, environment control rooms, nurseries and laboratories. Itmay be equipped with additional sensors for measurement of humidity, temperature, PAR,O2, soil respiration, soil temperature and canopy assimilation.
EGA measurements in dry seeded paddy field

58
System Features:• High precision, compact CO2 analyzer• Accuracy: < 1% of span concentration over calibrated range• Lightweight, field portable• Built-in sampling pump• Automatic pressure and temperature compensation• High resolution LCD display• Voltage, current and digital (RS232) output• Visual and audible alarm• Integral data logging capability
SpecificationsAnalysis Method: Non-dispersive infrared, configured as an absolute
absorptiometer with microprocessor control oflinearization.
Measurement Range of CO2: 0-2,000 ppm (μmol mol-1)Accuracy: < 1% of span concentration over the calibrated range,
but limited by the accuracy of the calibration gas mixture.Stability: Automatic Zero at regular intervals, corrects for sample
cell contamination, source and detector ageing and pre-amplifier gain changes.
Sampling Pump: Integral DC pump operating at a flow rate of 350 ml/min.Pump can be disabled for static measurements on demand.
Gas Flow Rate: 200 ml/min - 500 ml/minEnvironmental Sensor Two inputs available for use with external sensorsInterface: (humidity, temperature, PAR, oxygen, soil respiration,
etc.). Air Filter Filtered sample line (hydrophobic).CO2 Control: High and low set points.Alarm: Audio alarmReal Time Clock: Accuracy > 1 minute per month at 25° C, operating
temperature 0-70° C. Automatic correction for month endand leap years. Recording Manual (by keypress) orautomatic at user selected intervals between 1 and 250minutes.
Keypad: Custom, tactile keypad.Data Storage: 512KBattery backed: RAM (1,000 records).Response Time Display: Analog Output: 1.6 secondsDisplay: High contrast 2 x 16 character LCD.Power Consumption: 12V @ 0.7A (warm-up) 12V @ 0.4A (normal operation).

59
Power Supply 12V rechargeable lead acid batteryproviding up to 4 hours continuous operation
Operating Environment: -5° C - 50° C, non-condensing. In dirty environments,external air filtration is required.
Dimensions: 18 cm (W) x 21.5 cm (H) x 6.3 cm (D)Weight: 1.9 kg
Applications1. Soil CO2 efflux rate or exchange rate or soil respiration2. Soil temperature, Soil moisture and Relative humidity measurements3. Carbon sequestration4. Animal or insect respiration5. Whole canopy assimilation6. Environmental toxicology9. Bioremediation

60