Das ICM an der Hochschule Karlsruhe – ein nicht quantisierter Flip
Upload
khangminh22Category
view
1download
0
Forschungszentrum Karlsruhe in der Helmholtz-Gemeinschaft Wissenschaftliche Berichte FZKA 7340 Contributions to the 30th International Cosmic Ray Conference, Merida, Mexico, 2007 by Forschungszentrum Karlsruhe Institut für Kernphysik, Institut für Prozessdatenverarbeitung und Elektronik and Universität Karlsruhe Institut für Experimentelle Kernphysik J. Blümer, R. Engel, A. Haungs (Editors) Institut für Kernphysik August 2007


Forschungszentrum Karlsruhe
in der Helmholtz-Gemeinschaft
Wissenschaftliche Berichte
Forschungszentrum Karlsruhe GmbH, Karlsruhe
2007
FZKA 7340
Contributions to the
30th International Cosmic Ray Conference,
Merida, Mexico, 2007
by
Forschungszentrum KarlsruheInstitut für Kernphysik,
Institut für Prozessdatenverarbeitung und Elektronik
and
Universität KarlsruheInstitut für Experimentelle Kernphysik
Johannes Blümer, Ralph Engel, Andreas Haungs (Editors)
Institut für Kernphysik

Für diesen Bericht behalten wir uns alle Rechte vor
Forschungszentrum Karlsruhe GmbH Postfach 3640, 76021 Karlsruhe
Mitglied der Hermann von Helmholtz-Gemeinschaft Deutscher Forschungszentren (HGF)
ISSN 0947-8620
urn:nbn:de:0005-073408
ABSTRACT
The bi-annual International Cosmic Ray Conferences have become the most central meet-ings for discussing new results and recent progress in the field of cosmic ray research. Thecontributions to these conferences cover a wide range of subjects extending from the physics of the sun and heliosphere, over gamma-ray observations to direct and indirect cosmic ray measurements and their interpretation. Many new results are announced for the first time at these meetings.
The present volume is a compilation of the contributions of Institutes of For-schungszentrum Karlsruhe and University Karlsruhe to the 30th International Cosmic Ray Conference (ICRC), held in Merida, Mexico from July 3 to 11, 2007. The collection of contri-butions provides an up-to-date review of the current activities and research projects relatedto cosmic rays that are pursued in Karlsruhe. The articles also demonstrate the enormousprogress that has been made during the last years, in particular in the field of ultra-high en-ergy cosmic rays. Most of these contributions are the result of close and fruitful collaborationof many different groups worldwide, first of all within international collaborations such as the Pierre Auger, LOPES and KASCADE-Grande Collaborations, but also within smaller groups.
The articles compiled in this report are sorted according to the main research foci ofthe Karlsruhe groups. These include the physics of the knee in the cosmic ray spectrum, the transition between galactic and extra-galactic cosmic rays, and extragalactic cosmic rays of the highest energies.
Cosmic rays in the energy range from just below the knee in the cosmic ray spectrum(1014.5 eV) to the energy of the conjectured transition between galactic and extra-galactic cosmic rays are studied with the KASCADE-Grande detector at the site of Forschungszen-trum Karlsruhe. KASCADE-Grande is a multi-detector air shower array, which combines the electron and muon detectors of the KASCADE (KArlsruhe Shower Core and Array Detector) array with a 0.5 km2 array of scintillators. Based on a data set from about 3 years of opera-tion, first shower size spectra have been derived and limits on the anisotropy of the cosmic ray flux were presented at the conference.
An alternative method of air shower detection is the measurement of radio signalsproduced by the particles showers in the atmosphere. The physics potential of this detectiontechnique is investigated with the LOPES (LOFAR PrototypE Station) array of dipole anten-nas at the site of the KASCADE-Grande installation. Measuring the electric field strength inthe frequency range from 40 to 80 MHz, a very good correlation between the shower energy reconstructed with KASCADE-Grande and the radio signal was found. Important contribu-tions presented at the conference include the investigation of the influence of thunderstormson the measured field strength and the measurement of showers with large zenith angles aswell as significant progress in the modelling of the emission processes of the radio signals during the shower development.
The study of cosmic rays at the highest energies and the transition between galactic and extra-galactic cosmic rays is the aim of the Pierre Auger Project. The Pierre Auger Ob-servatory is the largest cosmic ray detector with one installation in the northern and southern
i
hemisphere to ensure full sky coverage. The southern detector is currently under construc-tion in the Province of Mendoza, Argentina. After completion it will consist of 24 fluorescencetelescopes and a surface detector array of 1600 water Cherenkov tanks, covering an area of3000 km2. A site near Lamar in Colorado, USA has been selected for the northern observa-tory and preparatory R&D work has begun. The data taken with the southern observatory during construction correspond to about 75% of one year of operation with the completedobservatory. Even with this limited data set, the Auger results represented the highlights ofthe conference. The Auger data provide unambiguous proof of a suppression of the ultra-high energy cosmic ray flux. They also show that the fraction of photons in the highest en-ergy cosmic rays is very small, ruling out many exotic physics scenarios. Furthermore, a sig-nificant discrepancy between the characteristics of simulated and measured air showers at ultra-high energy has been found.
Due to the indirect character of cosmic ray measurements with air showers, all analy-ses discussed above depend on the detailed simulation of cosmic ray interactions and ex-tensive air showers. Recent progress in this field is summarized in the contributions relatedto the CORSIKA (Cosmic Ray Simulations for KASCADE and Auger) simulation package,the measurement of the characteristics of hadronic interactions, and air shower simulationstudies.
Other contributions to the conference in Merida include the measurement of the fluo-rescence light yield with the AIRLIGHT experiment in Karlsruhe, the direct measurement ofcosmic rays at lower energy with the balloon borne instrument TRACER (Transition Radia-tion Array for Cosmic Energetic Radiation) and possible theoretical interpretations, and the search for signals from dark matter annihilation.
ii
Beiträge zur 30th International Cosmic Ray Conference (ICRC), Merida, Mexico, 2007des Forschungszentrums Karlsruhe, Institut für Kernphysik und Institut für Prozess-datenverarbeitung und Elektronik, sowie der Universität Karlsruhe, Institut für experi-mentelle Kernphysik
Zusammenfassung
Die zweijährlich stattfindende internationale Konferenz zur kosmischen Strahlung (ICRC) ist die in diesem Forschungsbereich weltweit wichtigste Tagung um Resultate und neueste Entwicklungen vorzustellen und zu diskutieren. Beiträge zu diesen Konferenzen umfasseneinen weiten wissenschaftlichen Bereich mit experimentellen Ergebnissen aus der Sonnen-und Heliosphären-Physik, über die Quellenbeobachtung mit hochenergetischen Gammas bis zu direkter und indirekter Messung kosmischer Teilchen, sowie die Interpretation all dieserBeobachtungen. Viele neue Resultate werden bei dieser Konferenzreihe erstmalig der Öf-fentlichkeit vorgestellt.
Die in diesem Band zusammengestellten Beiträge sind von den herausgebendenInstituten des Forschungszentrums und der Universität Karlsruhe in enger und fruchtbarer Zusammenarbeit mit weiteren nationalen und internationalen Universitäten und Instituten entstanden und auf der diesjährigen ICRC vorgestellt worden. Die Zusammenarbeit betrifft insbesondere Studien und Datenanalysen innerhalb der großen internationalen Kollaboratio-nen wie der Pierre-Auger-, der KASCADE-Grande-, und der LOPES-Kollaborationen, aberauch Arbeiten innerhalb kleinerer Gruppen. Die Sammlung stellt damit einen Überblick über alle die kosmische Strahlung betreffenden, aktuellen Karlsruher Aktivitäten und Projekte dar.Die Beiträge belegen auch den enormen Fortschritt im in diesem Forschungsgebiet der letz-ten Jahre, insbesondere bei der Messung und Analyse der hochenergetischen kosmischenStrahlung.
Die Beiträge in diesem Band sind geordnet gemäß den Forschungsschwerpunktender Karlsruher Gruppen. Dies betrifft die kosmische Strahlung im Energiebereich des so ge-nannten Knies, dem Bereich des Übergangs von galaktischer zu extragalaktischer kosmi-scher Strahlung und der Messung extragalaktischer Teilchen höchster Energien.
Luftschauermessungen von kosmischen Teilchen mit einer Energie gerade unterhalbdes Knies im Spektrum (1014.5 eV) bis in etwa zu einem Energiebereich, bei dem der Über-gang von galaktischem zu extragalaktischem Teilchenursprung vermutet wird, werden mit dem KASCADE-Grande Experiment gemessen, das sich auf dem Gelände des For-schungszentrums Karlsruhe befindet. Kascade-Grande ist ein Multi-Detektor Aufbau, das die Detektoren des ursprünglichen KASCADE Experimentes mit einem neuen Detektorfeld ver-bindet, das aus 37 Stationen besteht, verteilt auf einer Fläche von 0.5 km2. Basierend aufeinen Datensatz von nunmehr drei Betriebsjahren, konnten auf der Konferenz erste Ergeb-nisse bezüglich Spektren der gemessenen Schauergrößen, sowie Grenzen für Anisotropienin der Verteilung der Ankunftsrichtungen der kosmischen Teilchen vorgestellt werden.
iii
Als eine alternative Messmethode hochenergetischer Teilchen wird die Messung derRadioemission während der Luftschauerentwicklung in der Atmosphäre betrachtet. Das phy-sikalische Potential dieser neuen Messtechnik wird mit Hilfe der LOPES (LOFAR PrototypEStation) Dipolantennen untersucht. LOPES ist aufgebaut innerhalb des KASCADE-GrandeExperimentes und misst in Koinzidenz mit den Teilchendetektoren. Mit LOPES wird die elekt-rische Feldstärke im Frequenzbereich von 40-80 MHz gemessen, und es konnte eine sehr starke Korrelation mit der primären Energie der Schauer auslösenden Teilchen gefundenwerden. Weitere wichtige Ergebnisse dieser Untersuchungen, wie der Einfluss von Gewit-terstürmen auf die Feldstärke oder das Verhalten der Radioemission für sehr waagrechte Schauer konnten ebenfalls präsentiert werden. Zudem konnte über einen signifikanten Fort-schritt in der Simulation der Emissionsprozesse des Radiosignals berichtet werden.
Das Studium der höchstenergetischsten kosmischen Teilchen und des Übergangs von galaktischer zu extragalaktischer kosmischer Strahlung ist das Ziel des Pierre Auger Projektes. Das Pierre Auger Observatorium ist das weltweit größte seiner Art mit je einer Installation auf der Nord- und der Südhalbkugel der Erde. Der südliche Experimentteil in der Provinz Mendoza in Argentinien steht kurz vor der Fertigstellung. Nach dem vollständigen Aufbau wird es aus 24 Fluoreszenz-Teleskopen und einem Feld von 1600 Wasser-Tscherenkow Detektoren bestehen, das eine Fläche von 3000 km2 abdeckt. Die KleinstadtLamar in Colorado, USA wurde als Areal für das Nord-Observatorium ausgesucht, und erstevorbereitende Entwicklungsarbeiten vor Ort wurden begonnen und auf der Konferenz prä-sentiert. Die im südlichen Observatorium bereits genommen Daten entsprechen ungefähr75% der Messzeit eines Jahres des vollständig aufgebauten Experimentes. Bereits mit die-sem begrenzten Datensatz waren die ersten Auger Ergebnisse das wissenschaftliche High-light auf der diesjährigen Konferenz. Die Analysen der Daten beweisen eindeutig eine Unter-drückung im Fluss der höchstenergetischsten kosmischen Strahlung. Auch konnte gezeigt werden, dass der Anteil primärer Gammastrahlung in diesem Energiebereich sehr klein ist,und dass damit bereits viele exotische Theorien zur Entstehung der kosmischen Strahlungausgeschlossen sind. Des Weiteren wurde eine signifikante Diskrepanz in der Charakteristikvon simulierten zu gemessenen Luftschauern bei den allerhöchsten Energien gefunden undauf der Konferenz diskutiert.
Da alle Messungen dieser kosmischen Teilchen nur indirekt über den Nachweis von Luftschauer durchgeführt werden können, basieren alle Analyse Ergebnisse auf detailliertenSimulationen der Luftschauerentwicklung und hier insbesondere der hadronischen Wech-selwirkungen. Fortschritte auf diesem Gebiet wurden präsentiert in Beiträgen im Zusam-menhang mit der Weiterentwicklung und Verbesserung des CORSIKA (Cosmic Ray Simula-tions for KASCADE and Auger) Simulation-Programmes, der besseren Beschreibung hadro-nischer Wechselwirkungen auch durch Beteiligung an Beschleunigerexperimenten, und all-gemeinen Studien zur Luftschauerentwicklung.
Weitere Beiträge aus Karlsruhe zur Konferenz in Merida hatten zum Thema die Mes-sung der Fluoreszenz-Lichtausbeute mit dem AIRLIGHT-Experiment in Karlsruhe, die direkteMessung kosmischer Teilchen niedrigerer Energien und deren Interpretation mit dem Bal-lon-Experiment TRACER (Transition Radiation Array for Cosmic Energetic Radiation) unddie Suche nach Signalen der Annilihation von Teilchen der dunklen Materie.
iv
CONTENTS
KASCADE-Grande
The KASCADE-Grande Experiment 1A. Haungs et al., KASCADE-Grande Collaboration
Shower size spectrum reconstructed with KASCADE-Grande 5F. Di Pierro et al., KASCADE-Grande Collaboration
Electron shower size spectra reconstructed with KASCADE-Grande data 9F. Cossavella et al., KASCADE-Grande Collaboration
Muon spectra reconstructed from inclined air showers measured by KASCADEGrande 13J.C. Arteaga et al., KASCADE-Grande Collaboration
Features of the S(500) distribution for large air showers detected with the KASCADE-Grande 17arrayG. Toma et al., KASCADE-Grande Collaboration
Search for anisotropy and point sources of cosmic rays with the KASCADE-Grande 21experimentS. Over, M. Stümpert et al., KASCADE-Grande Collaboration
The muon component of air showers measured by the KASCADE-Grande Experiment 25V. De Souza, J. van Buren et al., KASCADE-Grande Collaboration
Separation of the electromagnetic and the muon component in EAS by their arrival 29timesM. Brüggemann et al., KASCADE-Grande Collaboration
Muon Production Height in the Air-Shower Experiment KASCADE-Grande 33P. Doll et al., KASCADE-Grande Collaboration
Tests of hadronic interaction models with muon pseudorapidities measured with 37KASCADE-GrandeJ. Zabierowski et al., KASCADE-Grande Collaboration
Reconstruction of primary mass group energy spectra with KASCADE 41H. Ulrich et al., KASCADE-Grande Collaboration
Measurement of attenuation lengths of hadrons in air showers with KASCADE 45D. Hildebrand et al., KASCADE-Grande Collaboration
v
LOPES and radio signal simaulation studies
Investigations of the lateral extension of radio emission in air showers by LOPES30 49measurementsS. Nehls et al., LOPES Collaboration
Operation of LOPES-30 for Polarization Measurements of the Radio Emission of 53Cosmic Ray Air Showers P.G. Isar et al., LOPES Collaboration
Update on radio detection of inclined air showers with LOPES-10 57A. Saftoiu et al., LOPES Collaboration
Radio emission of air showers in electric fields 61S. Buitink et al., LOPES Collaboration
Trigger Strategy for Radio Detection of Atmospheric Air Showers with LOPESSTAR 65 T. Asch, O. Krömer et al., LOPES Collaboration
REAS2: CORSIKA-based Monte Carlo simulations of geosynchrotron radio emission 69T. Huege, R. Ulrich, R. Engel
Energy and composition sensitivity of geosynchrotron radio emission from EAS 73T. Huege, R. Ulrich, R. Engel
Calculation of radio emission from high-energy air showers 77N.N. Kalmykov, A.A. Konstantinov, R. Engel
Radio Detection of Neutrinos from Behind a Mountain 81O. Brusova, L. Anchordoqui, T. Huege, K. Martens
The LOFAR air shower front evolution library 85S. Lafebre, T. Huege, H. Falcke, J. Kuijpers
Pierre-Auger-Project
Measurement of the UHECR energy spectrum using data from the Surface Detector 89of the Pierre Auger Observatory M. Roth for the Pierre Auger Collaboration
Study of the Cosmic Ray Composition above 0.4 EeV using the Longitudinal Profiles of 93Showers observed at the Pierre Auger ObservatoryM. Unger for the Pierre Auger Collaboration
Test of hadronic interaction models with data from the Pierre Auger Observatory 97R. Engel for the Pierre Auger Collaboration
HEAT – Enhancement Telescopes for the Pierre Auger Southern Observatory 101H.O. Klages for the Pierre Auger Collaboration
Longitudinal Shower Profile Reconstruction from Fluorescence and Cherenkov Light 105M. Unger, R. Engel, F. Schüssler and R. Ulrich
vi
Comparison of preshower characteristics at Auger South and North 109P. Homola, M. Risse, R. Engel, D. Gora, J. Pekala, B. Wilczynska, H. Wilczynski
Variation of the shower lateral spread with air temperature at the ground 113B. Wilczynska, R. Engel, P. Homola, B. Keilhauer, H. Klages, J. Pekala, H. WilczynskiI
Simulation study of shower profiles from ultra-high energy cosmic rays 117V. Scherini, F. Schüssler, R. Engel, K.-H. Kampert, M. Risse, M. Unger
Contribution of atmospheric scattering of light to shower signal in a fluorescence 121detectorJ. Pekala, D. Gora, P. Homola, M. Risse, B. Wilczynska, H. Wilczynski
New statistical parameters for mass composition studies with energy above 1017 eV 125F. Catalani, J.A. Chinellato, V. De Souza, J. Takahashi
A MC simulation of neutrino showers and their detection with the Pierre Auger Observatory 129D. Gora, M. Roth, A. Tamborro
Investigation of backgrounds for horizontal neutrino showers at ultra-high energy 133O. Tascau, R. Engel, K.-H. Kampert, M. Risse
Pierre-Auger-Project: Abstracts of further contributions 137
Air shower simulation and hadronic interactions
Latest Results from the Air Shower Simulation Programs CORSIKA and CONEX 149T. Pierog, R. Engel, D. Heck, S. Ostapchenko, K. Werner
The Hadronic Interaction Model EPOS and Air Shower Simulations: New Results on 153Muon ProductionT. Pierog, K. Werner
Pion production in proton- and pion-carbon collisions at 12 GeV/c measured with HARP 157C. Meurer, J. Blümer, R. Engel, A. Haungs, A. Roth and the HARP Collaboration
On the relation between the proton-air cross section and fluctuations of the shower 161longitudinal profile R. Ulrich, J. Blümer, R. Engel, F. Schüssler, M. Unger
Simulation studies of the charge ratio of the muon density distribution in EAS as 165measured by the WILLI detector triggered by a mini-array B. Mitrica, O. Sima, I.M. Brancus, H. Rebel, A. Haungs, A. Saftoiu
The muon charge ratio in cosmic ray air showers 169H. Rebel, O. Sima, A. Haungs, J. Oehlschläger
vii
Further articles
Measurement of the Air Fluorescence Yield with the AirLight Experiment 173T. Waldenmaier, J. Blümer, D. Gonzalez, H.O. Klages
Laser Calibration of the Air Fluorescence Yield Experiment AirLight 177D. Gonzalez, J. Blümer, H.O. Klages, T. Waldenmaier
The TRACER Project: Instrument Concept, Balloon Flights, and Analysis Procedures 181D. Müller, M. Ave, P.J. Boyle, F. Gahbauer, C. Höppner, J. Hörandel, M. Ichimura,A. Romero-Wolf
Cosmic Ray Energy Spectra of Primary Nuclei from Oxygen to Iron: Results from 185the TRACER 2003 LDB Flight P.J. Boyle, M. Ave, C. Höppner, J. Hörandel, M. Ichimura, D. Müller, A. Romero-Wolf
Propagation of High-Energy Cosmic Rays through the Galaxy: Discussion and 189Interpretation of TRACER Results M. Ave, P. Boyle, C. Höppner, J. Hörandel, M. Ichimura, D. Müller,
On the origin of the knees in the cosmic-ray energy spectrum 193J. Hörandel, N.N. Kalmykov, A.a. Silaev, A.V. Timokhin
Confinement of Cosmic Rays in Dark Matter clumps 197 W. De Boer, V. Zhukov
Collaboration lists 201
viii
30TH INTERNATIONAL COSMIC RAY CONFERENCE
The KASCADE-Grande Experiment
A. HAUNGSa , W.D. APELa, J.C. ARTEAGAa, F. BADEAa , K. BEKKa, M. BERTAINAb ,
J. BLUMERa,c , H. BOZDOGa, I.M. BRANCUSd , M. BRUGGEMANNe , P. BUCHHOLZe , A. CHIAVASSAb ,
F. COSSAVELLAc , K. DAUMILLERa , V. DE SOUZAc , F. DI PIERROb , P. DOLLa, R. ENGELa,
J. ENGLERa, M. FINGERc , D. FUHRMANNf , P.L. GHIAg , H.J. GILSa, R. GLASSTETTERf ,
C. GRUPENe , D. HECKa , J.R. HORANDELc , T. HUEGEa, P.G. ISARa , K.-H. KAMPERTf ,
D. KICKELBICKe , H.O. KLAGESa, Y. KOLOTAEVe, P. LUCZAKh, H.J. MATHESa, H.J. MAYERa ,
C. MEURERa , J. MILKEa, B. MITRICAd , A. MORALESa, C. MORELLOg , G. NAVARRAb , S. NEHLSa,
J. OEHLSCHLAGERa, S. OSTAPCHENKOa, S. OVERe , M. PETCUd , T. PIEROGa , S. PLEWNIAa,
H. REBELa, M. ROTHa , H. SCHIELERa, O. SIMAi , M. STUMPERTc, G. TOMAd , G.C. TRINCHEROg ,
H. ULRICHa , J. VAN BURENa , W. WALKOWIAKe , A. WEINDLa, J. WOCHELEa, J. ZABIEROWSKIh .a Institut fur Kernphysik, Forschungszentrum Karlsruhe, Germanyb Dipartimento di Fisica Generale dell’Universita Torino, Italyc Institut fur Experimentelle Kernphysik, Universitat Karlsruhe, Germanyd National Institute of Physics and Nuclear Engineering, Bucharest, Romaniae Fachbereich Physik, Universitat Siegen, Germanyf Fachbereich Physik, Universitat Wuppertal, Germanyg Istituto di Fisica dello Spazio Interplanetario, INAF Torino, Italyh Soltan Institute for Nuclear Studies, Lodz, Polandi Department of Physics, University of Bucharest, [email protected]
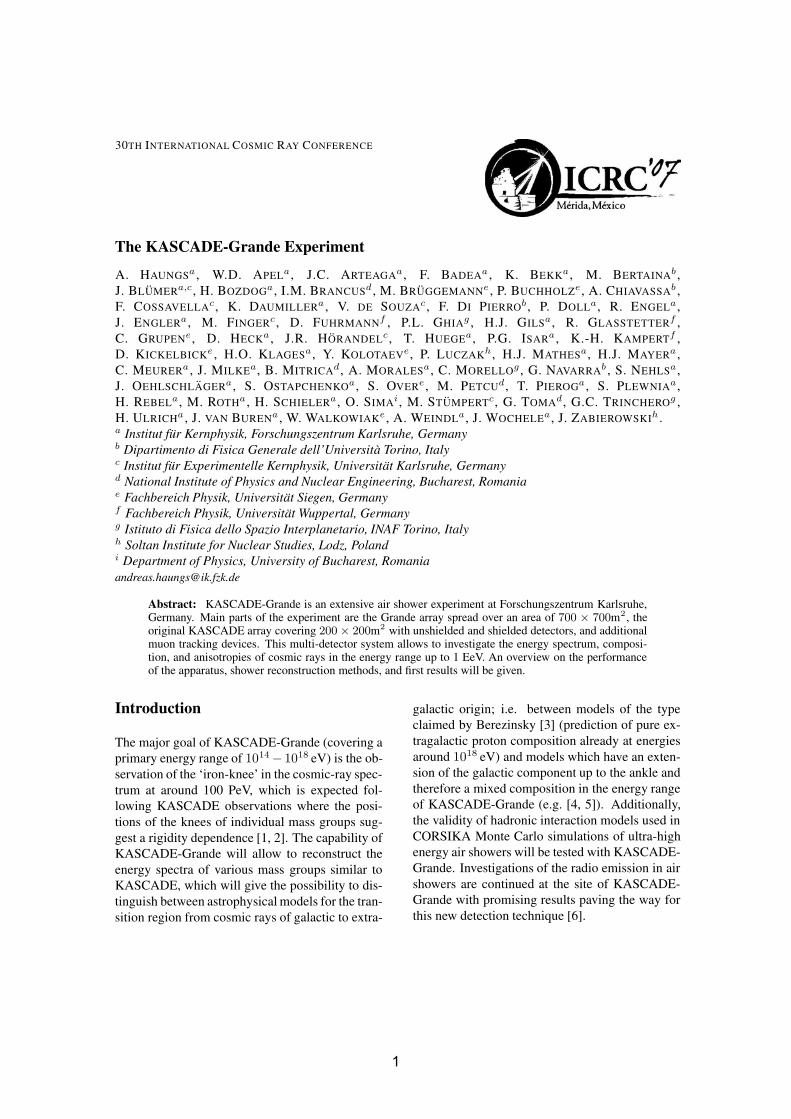
Abstract: KASCADE-Grande is an extensive air shower experiment at Forschungszentrum Karlsruhe,Germany. Main parts of the experiment are the Grande array spread over an area of 700 × 700m2, theoriginal KASCADE array covering 200 × 200m2 with unshielded and shielded detectors, and additionalmuon tracking devices. This multi-detector system allows to investigate the energy spectrum, composi-tion, and anisotropies of cosmic rays in the energy range up to 1 EeV. An overview on the performanceof the apparatus, shower reconstruction methods, and first results will be given.
Introduction
The major goal of KASCADE-Grande (covering a
primary energy range of 1014 − 1018 eV) is the ob-
servation of the ‘iron-knee’ in the cosmic-ray spec-
trum at around 100 PeV, which is expected fol-
lowing KASCADE observations where the posi-
tions of the knees of individual mass groups sug-
gest a rigidity dependence [1, 2]. The capability of
KASCADE-Grande will allow to reconstruct the
energy spectra of various mass groups similar to
KASCADE, which will give the possibility to dis-
tinguish between astrophysical models for the tran-
sition region from cosmic rays of galactic to extra-
galactic origin; i.e. between models of the type
claimed by Berezinsky [3] (prediction of pure ex-
tragalactic proton composition already at energies
around 1018 eV) and models which have an exten-
sion of the galactic component up to the ankle and
therefore a mixed composition in the energy range
of KASCADE-Grande (e.g. [4, 5]). Additionally,
the validity of hadronic interaction models used in
CORSIKA Monte Carlo simulations of ultra-high
energy air showers will be tested with KASCADE-
Grande. Investigations of the radio emission in air
showers are continued at the site of KASCADE-
Grande with promising results paving the way for
this new detection technique [6].
11
THE KASCADE-GRANDE EXPERIMENT
y c
oo
r din
ate
[m
]
x coordinate [m]
Grande stations
Piccolo Cluster
LOPES 10LOPES 30
KASCADE-Array
trigger-cluster #17 (of 18)
20
0 m
13 m
Central Detector
Array Cluster
Detector Station
Electronic Station
Muon Tracking Detector
Grande Station
Radio Antenna (LOPES-10)
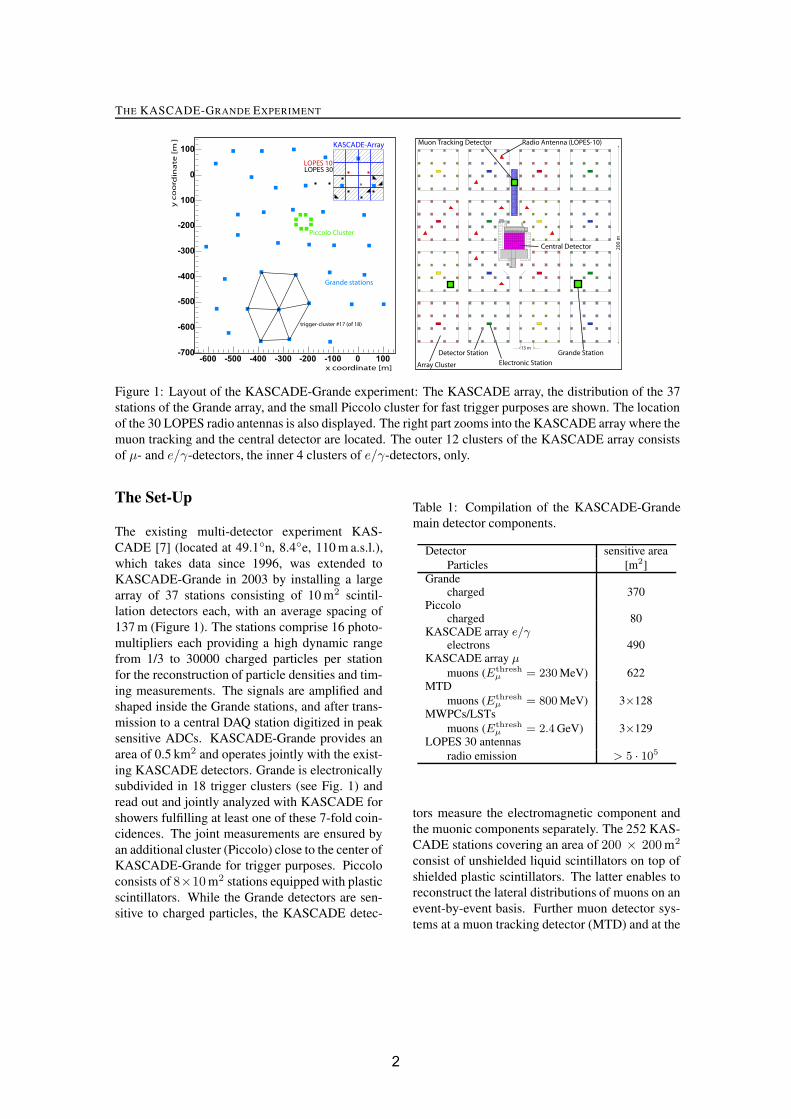
Figure 1: Layout of the KASCADE-Grande experiment: The KASCADE array, the distribution of the 37
stations of the Grande array, and the small Piccolo cluster for fast trigger purposes are shown. The location
of the 30 LOPES radio antennas is also displayed. The right part zooms into the KASCADE array where the
muon tracking and the central detector are located. The outer 12 clusters of the KASCADE array consists
of μ- and e/γ-detectors, the inner 4 clusters of e/γ-detectors, only.
The Set-Up
The existing multi-detector experiment KAS-
CADE [7] (located at 49.1◦n, 8.4◦e, 110 m a.s.l.),
which takes data since 1996, was extended to
KASCADE-Grande in 2003 by installing a large
array of 37 stations consisting of 10 m2 scintil-
lation detectors each, with an average spacing of
137 m (Figure 1). The stations comprise 16 photo-
multipliers each providing a high dynamic range
from 1/3 to 30000 charged particles per station
for the reconstruction of particle densities and tim-
ing measurements. The signals are amplified and
shaped inside the Grande stations, and after trans-
mission to a central DAQ station digitized in peak
sensitive ADCs. KASCADE-Grande provides an
area of 0.5 km2 and operates jointly with the exist-
ing KASCADE detectors. Grande is electronically
subdivided in 18 trigger clusters (see Fig. 1) and
read out and jointly analyzed with KASCADE for
showers fulfilling at least one of these 7-fold coin-
cidences. The joint measurements are ensured by
an additional cluster (Piccolo) close to the center of
KASCADE-Grande for trigger purposes. Piccolo
consists of 8×10 m2 stations equipped with plastic
scintillators. While the Grande detectors are sen-
sitive to charged particles, the KASCADE detec-
Table 1: Compilation of the KASCADE-Grande
main detector components.
Detector sensitive areaParticles [m2]
Grandecharged 370
Piccolocharged 80
KASCADE array e/γelectrons 490
KASCADE array μmuons (Ethresh
μ = 230 MeV) 622MTD
muons (Ethreshμ = 800 MeV) 3×128
MWPCs/LSTsmuons (Ethresh
μ = 2.4 GeV) 3×129LOPES 30 antennas
radio emission > 5 · 105
tors measure the electromagnetic component and
the muonic components separately. The 252 KAS-
CADE stations covering an area of 200 × 200 m2
consist of unshielded liquid scintillators on top of
shielded plastic scintillators. The latter enables to
reconstruct the lateral distributions of muons on an
event-by-event basis. Further muon detector sys-
tems at a muon tracking detector (MTD) and at the
22
30TH INTERNATIONAL COSMIC RAY CONFERENCE
electron number [log10
(Ne)]
6 6.5 7 7.5 8
]-1
sr
-1 s
-2 [
me
dI/
dN
-2110
-2010
-1910
-1810
-1710
-1610
-1510
-1410
-1310 °0-18
°18-25
°25-30
°30-34
°34-37
°37-40
Preliminary
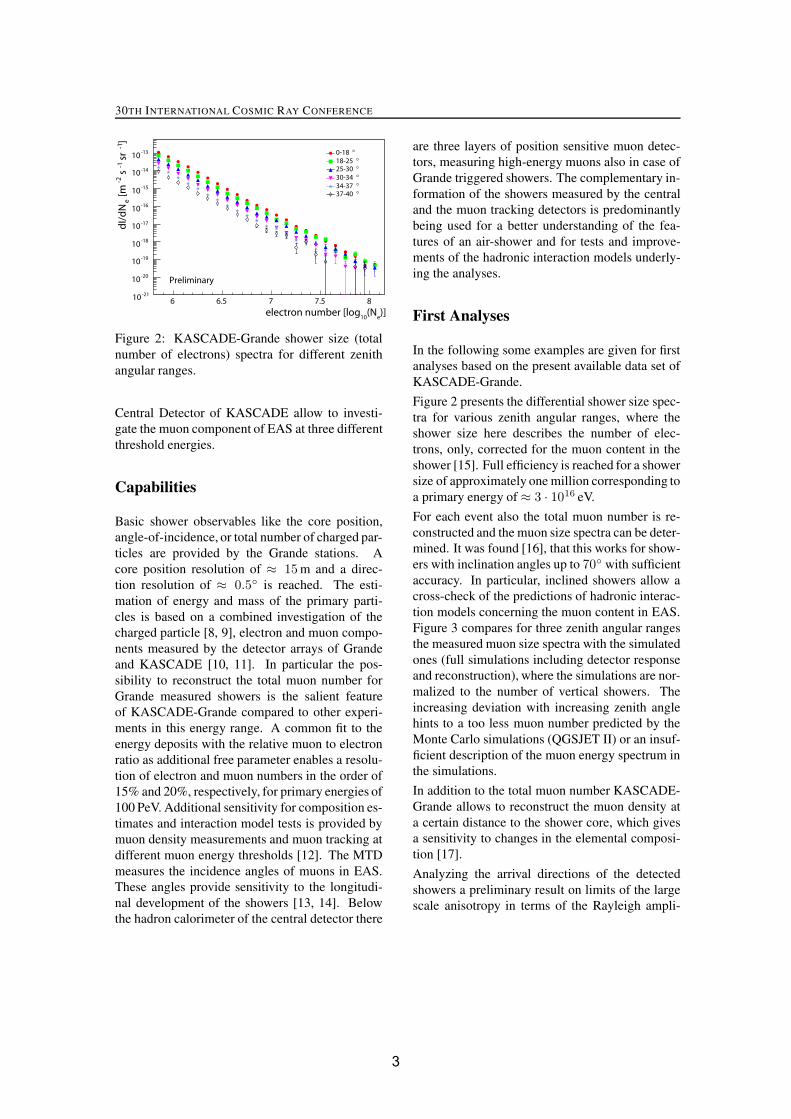
Figure 2: KASCADE-Grande shower size (total
number of electrons) spectra for different zenith
angular ranges.
Central Detector of KASCADE allow to investi-
gate the muon component of EAS at three different
threshold energies.
Capabilities
Basic shower observables like the core position,
angle-of-incidence, or total number of charged par-
ticles are provided by the Grande stations. A
core position resolution of ≈ 15 m and a direc-
tion resolution of ≈ 0.5◦ is reached. The esti-
mation of energy and mass of the primary parti-
cles is based on a combined investigation of the
charged particle [8, 9], electron and muon compo-
nents measured by the detector arrays of Grande
and KASCADE [10, 11]. In particular the pos-
sibility to reconstruct the total muon number for
Grande measured showers is the salient feature
of KASCADE-Grande compared to other experi-
ments in this energy range. A common fit to the
energy deposits with the relative muon to electron
ratio as additional free parameter enables a resolu-
tion of electron and muon numbers in the order of
15% and 20%, respectively, for primary energies of
100 PeV. Additional sensitivity for composition es-
timates and interaction model tests is provided by
muon density measurements and muon tracking at
different muon energy thresholds [12]. The MTD
measures the incidence angles of muons in EAS.
These angles provide sensitivity to the longitudi-
nal development of the showers [13, 14]. Below
the hadron calorimeter of the central detector there
are three layers of position sensitive muon detec-
tors, measuring high-energy muons also in case of
Grande triggered showers. The complementary in-
formation of the showers measured by the central
and the muon tracking detectors is predominantly
being used for a better understanding of the fea-
tures of an air-shower and for tests and improve-
ments of the hadronic interaction models underly-
ing the analyses.
First Analyses
In the following some examples are given for first
analyses based on the present available data set of
KASCADE-Grande.
Figure 2 presents the differential shower size spec-
tra for various zenith angular ranges, where the
shower size here describes the number of elec-
trons, only, corrected for the muon content in the
shower [15]. Full efficiency is reached for a shower
size of approximately one million corresponding to
a primary energy of ≈ 3 · 1016 eV.
For each event also the total muon number is re-
constructed and the muon size spectra can be deter-
mined. It was found [16], that this works for show-
ers with inclination angles up to 70◦ with sufficient
accuracy. In particular, inclined showers allow a
cross-check of the predictions of hadronic interac-
tion models concerning the muon content in EAS.
Figure 3 compares for three zenith angular ranges
the measured muon size spectra with the simulated
ones (full simulations including detector response
and reconstruction), where the simulations are nor-
malized to the number of vertical showers. The
increasing deviation with increasing zenith angle
hints to a too less muon number predicted by the
Monte Carlo simulations (QGSJET II) or an insuf-
ficient description of the muon energy spectrum in
the simulations.
In addition to the total muon number KASCADE-
Grande allows to reconstruct the muon density at
a certain distance to the shower core, which gives
a sensitivity to changes in the elemental composi-
tion [17].
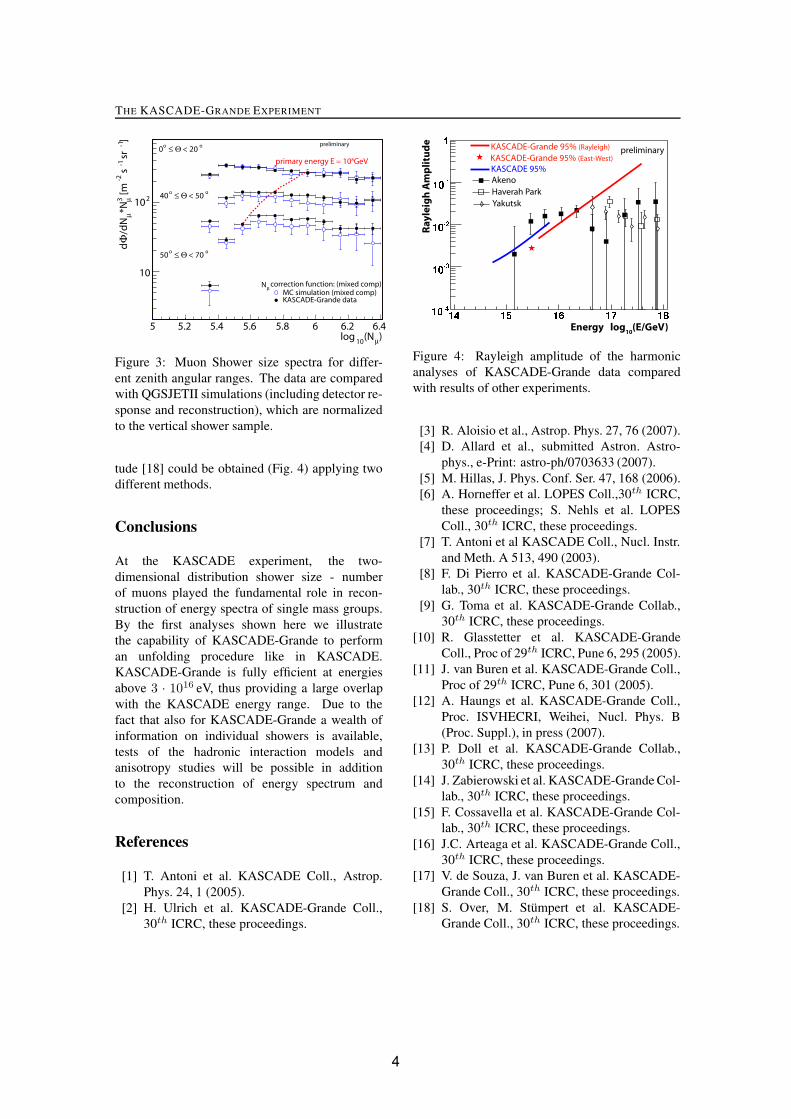
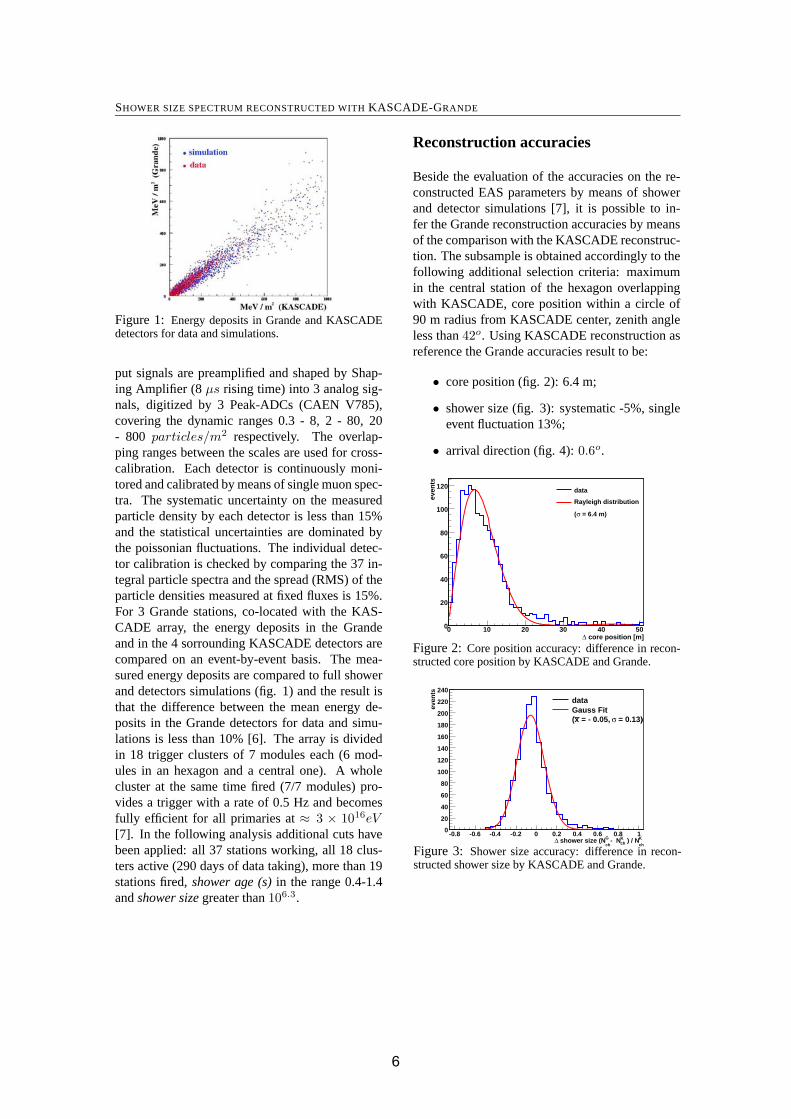
Analyzing the arrival directions of the detected
showers a preliminary result on limits of the large
scale anisotropy in terms of the Rayleigh ampli-
33
THE KASCADE-GRANDE EXPERIMENT
)μ
(N10
log5 5.2 5.4 5.6 5.8 6 6.2 6.4
]-1
sr
-1 s
-2 [
m3 μ
*Nμ
/dN
Φd
10
210
correction function: (mixed comp)μ
NMC simulation (mixed comp)
KASCADE-Grande data
o < 20Θ ≤
o0
o < 50Θ ≤
o40
o < 70Θ ≤
o50
primary energy E ≈ 108GeV
preliminary
Figure 3: Muon Shower size spectra for differ-
ent zenith angular ranges. The data are compared
with QGSJETII simulations (including detector re-
sponse and reconstruction), which are normalized
to the vertical shower sample.
tude [18] could be obtained (Fig. 4) applying two
different methods.
Conclusions
At the KASCADE experiment, the two-
dimensional distribution shower size - number
of muons played the fundamental role in recon-
struction of energy spectra of single mass groups.
By the first analyses shown here we illustrate
the capability of KASCADE-Grande to perform
an unfolding procedure like in KASCADE.
KASCADE-Grande is fully efficient at energies
above 3 · 1016 eV, thus providing a large overlap
with the KASCADE energy range. Due to the
fact that also for KASCADE-Grande a wealth of
information on individual showers is available,
tests of the hadronic interaction models and
anisotropy studies will be possible in addition
to the reconstruction of energy spectrum and
composition.
References
[1] T. Antoni et al. KASCADE Coll., Astrop.
Phys. 24, 1 (2005).
[2] H. Ulrich et al. KASCADE-Grande Coll.,
30th ICRC, these proceedings.
Ra
yle
igh
Am
pli
tud
e
Energy log10
(E/GeV)
Akeno
Haverah Park
Yakutsk
KASCADE-Grande 95% (Rayleigh)
KASCADE 95%
KASCADE-Grande 95% (East-West)preliminary
Figure 4: Rayleigh amplitude of the harmonic
analyses of KASCADE-Grande data compared
with results of other experiments.
[3] R. Aloisio et al., Astrop. Phys. 27, 76 (2007).
[4] D. Allard et al., submitted Astron. Astro-
phys., e-Print: astro-ph/0703633 (2007).
[5] M. Hillas, J. Phys. Conf. Ser. 47, 168 (2006).
[6] A. Horneffer et al. LOPES Coll.,30th ICRC,
these proceedings; S. Nehls et al. LOPES
Coll., 30th ICRC, these proceedings.
[7] T. Antoni et al KASCADE Coll., Nucl. Instr.
and Meth. A 513, 490 (2003).
[8] F. Di Pierro et al. KASCADE-Grande Col-
lab., 30th ICRC, these proceedings.
[9] G. Toma et al. KASCADE-Grande Collab.,
30th ICRC, these proceedings.
[10] R. Glasstetter et al. KASCADE-Grande
Coll., Proc of 29th ICRC, Pune 6, 295 (2005).
[11] J. van Buren et al. KASCADE-Grande Coll.,
Proc of 29th ICRC, Pune 6, 301 (2005).
[12] A. Haungs et al. KASCADE-Grande Coll.,
Proc. ISVHECRI, Weihei, Nucl. Phys. B
(Proc. Suppl.), in press (2007).
[13] P. Doll et al. KASCADE-Grande Collab.,
30th ICRC, these proceedings.
[14] J. Zabierowski et al. KASCADE-Grande Col-
lab., 30th ICRC, these proceedings.
[15] F. Cossavella et al. KASCADE-Grande Col-
lab., 30th ICRC, these proceedings.
[16] J.C. Arteaga et al. KASCADE-Grande Coll.,
30th ICRC, these proceedings.
[17] V. de Souza, J. van Buren et al. KASCADE-
Grande Coll., 30th ICRC, these proceedings.
[18] S. Over, M. Stumpert et al. KASCADE-
Grande Coll., 30th ICRC, these proceedings.
44

30TH INTERNATIONAL COSMIC RAY CONFERENCE
Shower size spectrum reconstructed with KASCADE-Grande
F. DI PIERROb, W.D. APELa, J.C. ARTEAGAa, F. BADEAa, K. BEKKa, M. BERTAINAb,J. BLUMERa,c, H. BOZDOGa, I.M. BRANCUSd, M. BRUGGEMANNe, P. BUCHHOLZe, A. CHIAVASSAb,F. COSSAVELLAc, K. DAUMILLERa, V. DE SOUZAc, P. DOLLa, R. ENGELa, J. ENGLERa, M. FINGERc,D. FUHRMANNf , P.L. GHIAg , H.J. GILSa, R. GLASSTETTERf , C. GRUPENe, A. HAUNGSa, D. HECKa,J.R. HORANDELc, T. HUEGEa, P.G. ISARa, K.-H. KAMPERTf , D. KICKELBICKe, H.O. KLAGESa,Y. KOLOTAEVe, P. LUCZAKh, H.J. MATHESa, H.J. MAYERa, C. MEURERa, J. MILKEa, B. MITRICAd,A. MORALESa, C. MORELLOg , G. NAVARRAb, S. NEHLSa, J. OEHLSCHLAGERa, S. OSTAPCHENKOa,S. OVERe, M. PETCUd, T. PIEROGa, S. PLEWNIAa, H. REBELa, M. ROTHa, H. SCHIELERa, O. SIMAi,M. STUMPERTc, G. TOMAd, G.C. TRINCHEROg , H. ULRICHa, J. VAN BURENa, W. WALKOWIAKe,A. WEINDLa, J. WOCHELEa, J. ZABIEROWSKIh.a Institut fur Kernphysik, Forschungszentrum Karlsruhe, Germanyb Dipartimento di Fisica Generale dell’Universita Torino, Italyc Institut fur Experimentelle Kernphysik, Universitat Karlsruhe, Germanyd National Institute of Physics and Nuclear Engineering, Bucharest, Romaniae Fachbereich Physik, Universitat Siegen, Germanyf Fachbereich Physik, Universitat Wuppertal, Germanyg Istituto di Fisica dello Spazio Interplanetario, INAF Torino, Italyh Soltan Institute for Nuclear Studies, Lodz, Polandi Department of Physics, University of Bucharest, [email protected]
Abstract: The Grande array as main part of the KASCADE-Grande experiment consists of 37×10 m2
scintillation detectors spread over an area of 700×700 m2. Grande enables triggers and reconstructionof primary cosmic rays in the energy range of ∼ 3 · 1015eV to 1018eV. The detectors and the showersize (i.e.: total number of charged particles) reconstruction accuracies are discussed. The KASCADE-Grande set-up allows, for a subsample of the registered showers, detailed comparisons of the data withmeasurements of the original KASCADE array on an event-by-event basis. The lateral distributions ofcharged particles and the resulting preliminary shower size spectrum for vertical showers are presented.
Introduction
The KASCADE-Grande experiment [1, 2] locatedat Forschungszentrum Karlsruhe, extends the en-ergy range covered by KASCADE [3] up to 1018
eV by means of the Grande array which increasesthe acceptance area up to 0.5 km2. Grande, ob-tained reassembling the EAS-TOP detectors [4],measures the lateral distribution of charged parti-cles up to 700 m from the core and the KASCADEmuon detectors allow to reconstruct the muon lat-eral distribution up to the same distances [5].
The Grande Array
The Grande array consists of 37 stations with anaverage spacing of 137 m over a 700 x 700 m2
area. Every detector station consists of 10 m2 ofplastic scintillator (NE102A) organized in 16 units(80 x 80 x 4 cm3). Each unit is equipped with ahigh gain (HG) photomultiplier (Philips XP3462B,≈ 1.6pC/m.i.p.) and the 4 central units are addi-tionally equipped with a low gain (LG) photomul-tiplier (≈ 0.08pC/m.i.p.). The signals from thePMTs are added up through passive mixers, onefor the HG and one for the LG PMTs. The out-
5
5
SHOWER SIZE SPECTRUM RECONSTRUCTED WITH KASCADE-GRANDE
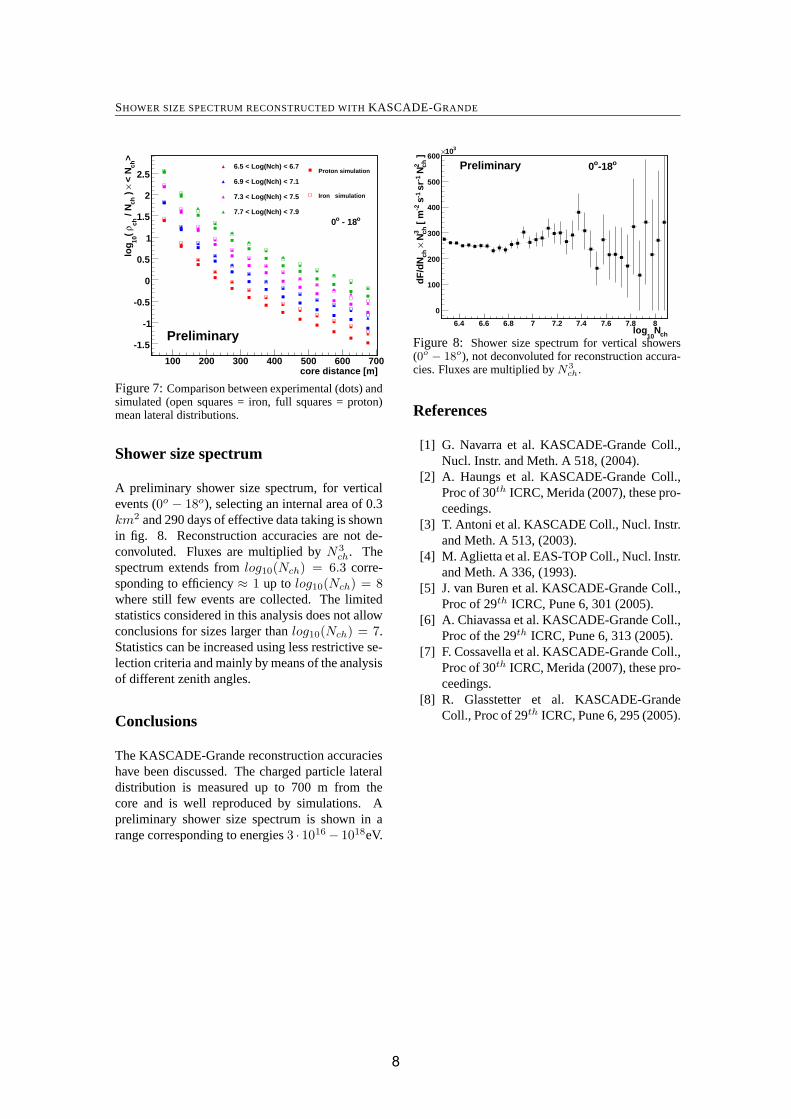
Figure 1: Energy deposits in Grande and KASCADEdetectors for data and simulations.
put signals are preamplified and shaped by Shap-ing Amplifier (8 μs rising time) into 3 analog sig-nals, digitized by 3 Peak-ADCs (CAEN V785),covering the dynamic ranges 0.3 - 8, 2 - 80, 20- 800 particles/m2 respectively. The overlap-ping ranges between the scales are used for cross-calibration. Each detector is continuously moni-tored and calibrated by means of single muon spec-tra. The systematic uncertainty on the measuredparticle density by each detector is less than 15%and the statistical uncertainties are dominated bythe poissonian fluctuations. The individual detec-tor calibration is checked by comparing the 37 in-tegral particle spectra and the spread (RMS) of theparticle densities measured at fixed fluxes is 15%.For 3 Grande stations, co-located with the KAS-CADE array, the energy deposits in the Grandeand in the 4 sorrounding KASCADE detectors arecompared on an event-by-event basis. The mea-sured energy deposits are compared to full showerand detectors simulations (fig. 1) and the result isthat the difference between the mean energy de-posits in the Grande detectors for data and simu-lations is less than 10% [6]. The array is dividedin 18 trigger clusters of 7 modules each (6 mod-ules in an hexagon and a central one). A wholecluster at the same time fired (7/7 modules) pro-vides a trigger with a rate of 0.5 Hz and becomesfully efficient for all primaries at ≈ 3 × 10¹⁶eV[7]. In the following analysis additional cuts havebeen applied: all 37 stations working, all 18 clus-ters active (290 days of data taking), more than 19stations fired, shower age (s) in the range 0.4-1.4and shower size greater than 106.3.
Reconstruction accuracies
Beside the evaluation of the accuracies on the re-constructed EAS parameters by means of showerand detector simulations [7], it is possible to in-fer the Grande reconstruction accuracies by meansof the comparison with the KASCADE reconstruc-tion. The subsample is obtained accordingly to thefollowing additional selection criteria: maximumin the central station of the hexagon overlappingwith KASCADE, core position within a circle of90 m radius from KASCADE center, zenith angleless than 42o. Using KASCADE reconstruction asreference the Grande accuracies result to be:
• core position (fig. 2): 6.4 m;
• shower size (fig. 3): systematic -5%, singleevent fluctuation 13%;
• arrival direction (fig. 4): 0.6o.
core position [m]Δ0 10 20 30 40 50
even
ts
0
20
40
60
80
100
120 data
Rayleigh distribution
= 6.4 m)σ(
Figure 2: Core position accuracy: difference in recon-structed core position by KASCADE and Grande.
K
ch ) / NK
ch- NG
ch shower size (NΔ
-0.8 -0.6 -0.4 -0.2 0 0.2 0.4 0.6 0.8 1
even
ts
0
20
40
60
80
100
120
140
160
180
200
220
240
dataGauss Fit
= 0.13)σ = - 0.05, x(
dataGauss Fit
= 0.13)σ = - 0.05, x(
dataGauss Fit
= 0.13)σ = - 0.05, x(
dataGauss Fit
= 0.13)σ = - 0.05, x(
dataGauss Fit
= 0.13)σ = - 0.05, x(
dataGauss Fit
= 0.13)σ = - 0.05, x(
dataGauss Fit
= 0.13)σ = - 0.05, x(
dataGauss Fit
= 0.13)σ = - 0.05, x(
Figure 3: Shower size accuracy: difference in recon-structed shower size by KASCADE and Grande.
6

30TH INTERNATIONAL COSMIC RAY CONFERENCE
arrival direction [deg]Δ0 0.5 1 1.5 2 2.5 3 3.5 4
even
ts
0
20
40
60
80
100
120
140data
Rayleigh distribution
)o = 0.58σ(
Figure 4: Arrival direction accuracy: difference be-tween the arrival direction reconstructed by KASCADEand by Grande.
Comparing these results to the KASCADE accura-cies [3] we can conclude that despite the 2 arraysare rather different (the KASCADE array is com-posed of 252 detectors over an area of 200 × 200m2 with a spacing of 13 m) the Grande shower re-construction has a good accuracy with respect toKASCADE and adequate for its aims.
Mean lateral distributions
In fig. 5 the experimental mean lateral distributionsfor vertical showers (0o − 18o) and for differentshower sizes in the range 6.3 < Log10Nch < 8.1are shown. The line represents a fit with a slightlymodified NKG function, optimized by means ofshower simulations [8]:
ρch = Nch ·C(s) ·(
r
r0
)s−α (1 +
r
r0
)s−β
(1)
with the normalization factor:C(s)=Γ(β−s)/(2πr2
0Γ(s−α+2)Γ(α+β−2s−2)),the shower size Nch, age parameter s and α=1.5, β=3.6 and r0=40 m. The lateral distributionsmeasured by the Grande array extend up to morethan 700 m and the used lateral distribution func-tion well represents data over the whole range. Aneffect due to the saturation of the detectors startsto be evident only very close to the core (r < 75m) and for the highest energies. The ”shower age(s)” has been studied as a function of the showersize (Nch) for different angular bins of equal ac-ceptance. Fig. 6 shows that the s (age) value, as ex-
core distance [m]100 200 300 400 500 600 700
)2 /
mρ(
10lo
g
-1
0
1
2
36.3 < Log(Nch) < 6.5
6.5 < Log(Nch) < 6.7
6.7 < Log(Nch) < 6.9
6.9 < Log(Nch) < 7.1
7.1 < Log(Nch) < 7.3
7.3 < Log(Nch) < 7.5
7.5 < Log(Nch) < 7.7
7.7 < Log(Nch) < 7.9
7.9 < Log(Nch) < 8.1
Fitted LDF
s = 0.97
s = 0.97
s = 0.97
s = 0.95
s = 0.95
s = 0.94
s = 0.93
s = 0.90
s = 0.83
o-18o0
Figure 5: Experimental mean lateral distributions fi ttedwith the LDF (eq. 1).
chN10
log6.4 6.6 6.8 7 7.2 7.4
s p
aram
eter
0.9
0.95
1
1.05
1.1
1.15
1.2o - 32.4o25.9
o - 25.9o18o - 18o0
o - 32.4o25.9o - 25.9o18
o - 18o0
o - 32.4o25.9o - 25.9o18
o - 18o0
o - 32.4o25.9o - 25.9o18
o - 18o0
o - 32.4o25.9o - 25.9o18
o - 18o0
o - 32.4o25.9o - 25.9o18
o - 18o0
Preliminary
Figure 6: Age parameter values (s) as a function ofshower size (Nch), for different zenith angles.
pected, increases with increasing zenith angle anddecreases with increasing shower size.
The experimental lateral distributions are com-pared to simulated ones, obtained for proton andiron primaries in the energy range 1016 − 1018 eVwith QGSjet-II interaction model (fig. 7). Themeasured particle densities by each detector arenormalized to the total number of particles. Theobtained lateral distributions are multiplied by themean Nch of the bin in order to distinguish the dif-ferent graphs (for the same reason only 4 Nch binsare plotted). Data, as expected, lie between ironand proton simulations and show the same shape.This result shows that the lateral distribution canbe indeed an efficient composition estimator.
7
SHOWER SIZE SPECTRUM RECONSTRUCTED WITH KASCADE-GRANDE
core distance [m]100 200 300 400 500 600 700
>ch
< N
× )
ch
/ N
chρ(10
log
-1.5
-1
-0.5
0
0.5
1
1.5
2
2.56.5 < Log(Nch) < 6.7
6.9 < Log(Nch) < 7.1
7.3 < Log(Nch) < 7.5
7.7 < Log(Nch) < 7.9
Proton simulation
Iron simulation
Preliminary
o - 18o0
Figure 7: Comparison between experimental (dots) andsimulated (open squares = iron, full squares = proton)mean lateral distributions.
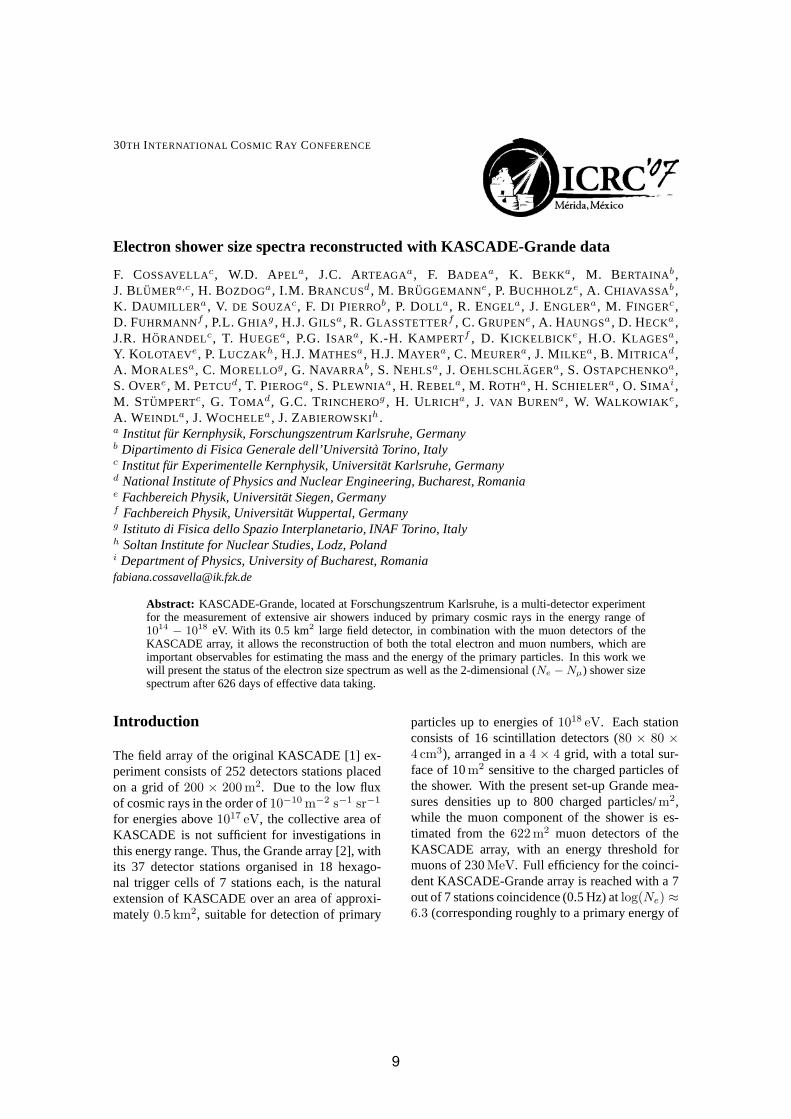
Shower size spectrum
A preliminary shower size spectrum, for verticalevents (0o − 18o), selecting an internal area of 0.3km2 and 290 days of effective data taking is shownin fig. 8. Reconstruction accuracies are not de-convoluted. Fluxes are multiplied by N 3
ch. Thespectrum extends from log10(Nch) = 6.3 corre-sponding to efficiency ≈ 1 up to log10(Nch) = 8where still few events are collected. The limitedstatistics considered in this analysis does not allowconclusions for sizes larger than log10(Nch) = 7.Statistics can be increased using less restrictive se-lection criteria and mainly by means of the analysisof different zenith angles.
Conclusions
The KASCADE-Grande reconstruction accuracieshave been discussed. The charged particle lateraldistribution is measured up to 700 m from thecore and is well reproduced by simulations. Apreliminary shower size spectrum is shown in arange corresponding to energies 3 · 1016 − 1018eV.
chN10
log6.4 6.6 6.8 7 7.2 7.4 7.6 7.8 8
]2 ch
N-1
sr
-1 s
-2 [
m3 ch
N×ch
dF
/dN
0
100
200
300
400
500
600310×
o-18o0Preliminary
Figure 8: Shower size spectrum for vertical showers(0o − 18o), not deconvoluted for reconstruction accura-cies. Fluxes are multiplied by N3
ch.
References
[1] G. Navarra et al. KASCADE-Grande Coll.,Nucl. Instr. and Meth. A 518, (2004).
[2] A. Haungs et al. KASCADE-Grande Coll.,Proc of 30th ICRC, Merida (2007), these pro-ceedings.
[3] T. Antoni et al. KASCADE Coll., Nucl. Instr.and Meth. A 513, (2003).
[4] M. Aglietta et al. EAS-TOP Coll., Nucl. Instr.and Meth. A 336, (1993).
[5] J. van Buren et al. KASCADE-Grande Coll.,Proc of 29th ICRC, Pune 6, 301 (2005).
[6] A. Chiavassa et al. KASCADE-Grande Coll.,Proc of the 29th ICRC, Pune 6, 313 (2005).
[7] F. Cossavella et al. KASCADE-Grande Coll.,Proc of 30th ICRC, Merida (2007), these pro-ceedings.
[8] R. Glasstetter et al. KASCADE-GrandeColl., Proc of 29th ICRC, Pune 6, 295 (2005).
8
30TH INTERNATIONAL COSMIC RAY CONFERENCE
Electron shower size spectra reconstructed with KASCADE-Grande data
F. COSSAVELLAc , W.D. APELa, J.C. ARTEAGAa, F. BADEAa , K. BEKKa , M. BERTAINAb ,J. BLUMERa,c , H. BOZDOGa, I.M. BRANCUSd , M. BRUGGEMANNe , P. BUCHHOLZe , A. CHIAVASSAb ,K. DAUMILLERa , V. DE SOUZAc , F. DI PIERROb , P. DOLLa, R. ENGELa, J. ENGLERa, M. FINGERc ,D. FUHRMANNf , P.L. GHIAg , H.J. GILSa, R. GLASSTETTERf , C. GRUPENe , A. HAUNGSa , D. HECKa ,J.R. HORANDELc , T. HUEGEa, P.G. ISARa, K.-H. KAMPERTf , D. KICKELBICKe , H.O. KLAGESa,Y. KOLOTAEVe, P. LUCZAKh, H.J. MATHESa, H.J. MAYERa, C. MEURERa, J. MILKEa, B. MITRICAd ,A. MORALESa, C. MORELLOg , G. NAVARRAb , S. NEHLSa, J. OEHLSCHLAGERa, S. OSTAPCHENKOa,S. OVERe , M. PETCUd , T. PIEROGa , S. PLEWNIAa, H. REBELa, M. ROTHa , H. SCHIELERa , O. SIMAi ,M. STUMPERTc , G. TOMAd , G.C. TRINCHEROg , H. ULRICHa , J. VAN BURENa , W. WALKOWIAKe ,A. WEINDLa, J. WOCHELEa , J. ZABIEROWSKIh .a Institut fur Kernphysik, Forschungszentrum Karlsruhe, Germanyb Dipartimento di Fisica Generale dell’Universita Torino, Italyc Institut fur Experimentelle Kernphysik, Universitat Karlsruhe, Germanyd National Institute of Physics and Nuclear Engineering, Bucharest, Romaniae Fachbereich Physik, Universitat Siegen, Germanyf Fachbereich Physik, Universitat Wuppertal, Germanyg Istituto di Fisica dello Spazio Interplanetario, INAF Torino, Italyh Soltan Institute for Nuclear Studies, Lodz, Polandi Department of Physics, University of Bucharest, [email protected]
Abstract: KASCADE-Grande, located at Forschungszentrum Karlsruhe, is a multi-detector experimentfor the measurement of extensive air showers induced by primary cosmic rays in the energy range of1014 − 1018 eV. With its 0.5 km2 large field detector, in combination with the muon detectors of theKASCADE array, it allows the reconstruction of both the total electron and muon numbers, which areimportant observables for estimating the mass and the energy of the primary particles. In this work wewill present the status of the electron size spectrum as well as the 2-dimensional (Ne − Nμ) shower sizespectrum after 626 days of effective data taking.
Introduction
The field array of the original KASCADE [1] ex-periment consists of 252 detectors stations placedon a grid of 200 × 200 m2. Due to the low fluxof cosmic rays in the order of 10−10 m−2 s−1 sr−1
for energies above 1017 eV, the collective area ofKASCADE is not sufficient for investigations inthis energy range. Thus, the Grande array [2], withits 37 detector stations organised in 18 hexago-nal trigger cells of 7 stations each, is the naturalextension of KASCADE over an area of approxi-mately 0.5 km2, suitable for detection of primary
particles up to energies of 1018 eV. Each stationconsists of 16 scintillation detectors (80 × 80 ×4 cm3), arranged in a 4 × 4 grid, with a total sur-face of 10 m2 sensitive to the charged particles ofthe shower. With the present set-up Grande mea-sures densities up to 800 charged particles/ m2,while the muon component of the shower is es-timated from the 622 m2 muon detectors of theKASCADE array, with an energy threshold formuons of 230 MeV. Full efficiency for the coinci-dent KASCADE-Grande array is reached with a 7out of 7 stations coincidence (0.5 Hz) at log(Ne) ≈6.3 (corresponding roughly to a primary energy of
99
KASCADE-GRANDE
)eLog(N4 4.5 5 5.5 6 6.5 7 7.5
eff
icie
nc
y
0
0.2
0.4
0.6
0.8
1
proton - 20 stat cutiron - 20 stat cut7/7 trigger4/7 trigger
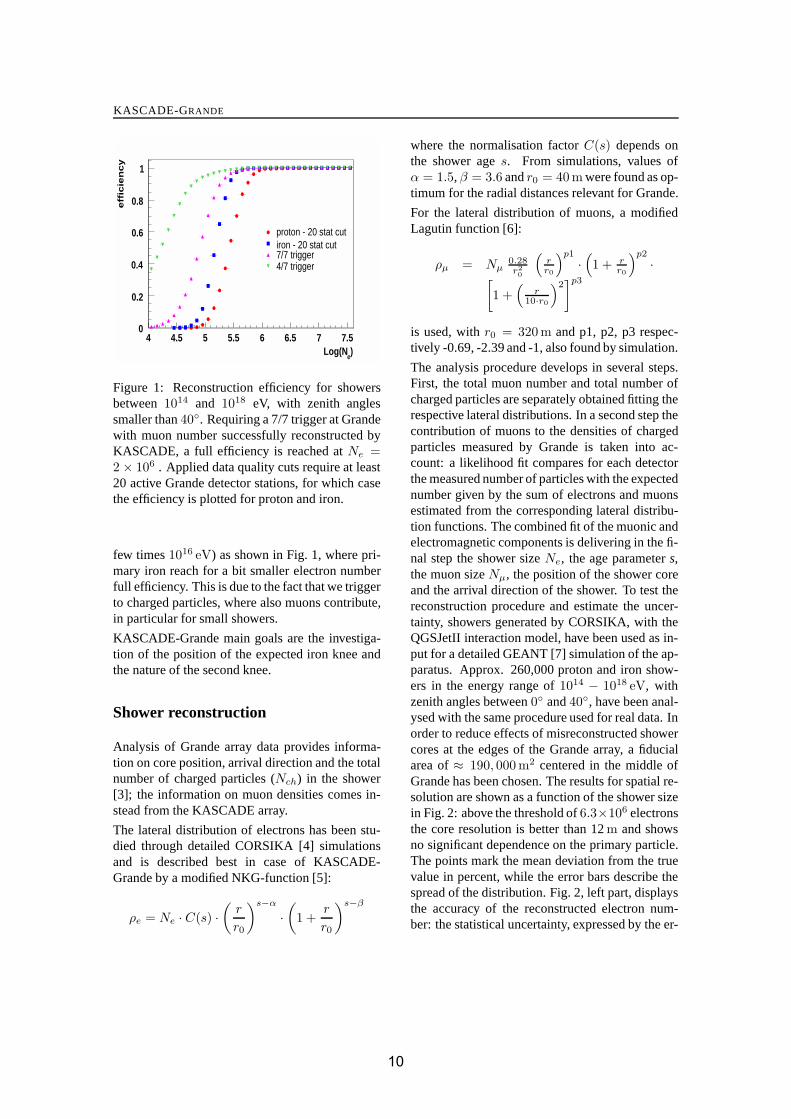
Figure 1: Reconstruction efficiency for showersbetween 1014 and 1018 eV, with zenith anglessmaller than 40◦. Requiring a 7/7 trigger at Grandewith muon number successfully reconstructed byKASCADE, a full efficiency is reached at Ne =2 × 10⁶ . Applied data quality cuts require at least20 active Grande detector stations, for which casethe efficiency is plotted for proton and iron.
few times 1016 eV) as shown in Fig. 1, where pri-mary iron reach for a bit smaller electron numberfull efficiency. This is due to the fact that we triggerto charged particles, where also muons contribute,in particular for small showers.
KASCADE-Grande main goals are the investiga-tion of the position of the expected iron knee andthe nature of the second knee.
Shower reconstruction
Analysis of Grande array data provides informa-tion on core position, arrival direction and the totalnumber of charged particles (Nch) in the shower[3]; the information on muon densities comes in-stead from the KASCADE array.
The lateral distribution of electrons has been stu-died through detailed CORSIKA [4] simulationsand is described best in case of KASCADE-Grande by a modified NKG-function [5]:
ρe = Ne · C(s) ·(
r
r0
)s−α
·(
1 +r
r0
)s−β
where the normalisation factor C(s) depends onthe shower age s. From simulations, values ofα = 1.5, β = 3.6 and r0 = 40 m were found as op-timum for the radial distances relevant for Grande.
For the lateral distribution of muons, a modifiedLagutin function [6]:
ρμ = Nμ0.28r2
0
(rr0
)p1
·(1 + r
r0
)p2
·[1 +
(r
10·r0
)2]p3
is used, with r0 = 320 m and p1, p2, p3 respec-tively -0.69, -2.39 and -1, also found by simulation.
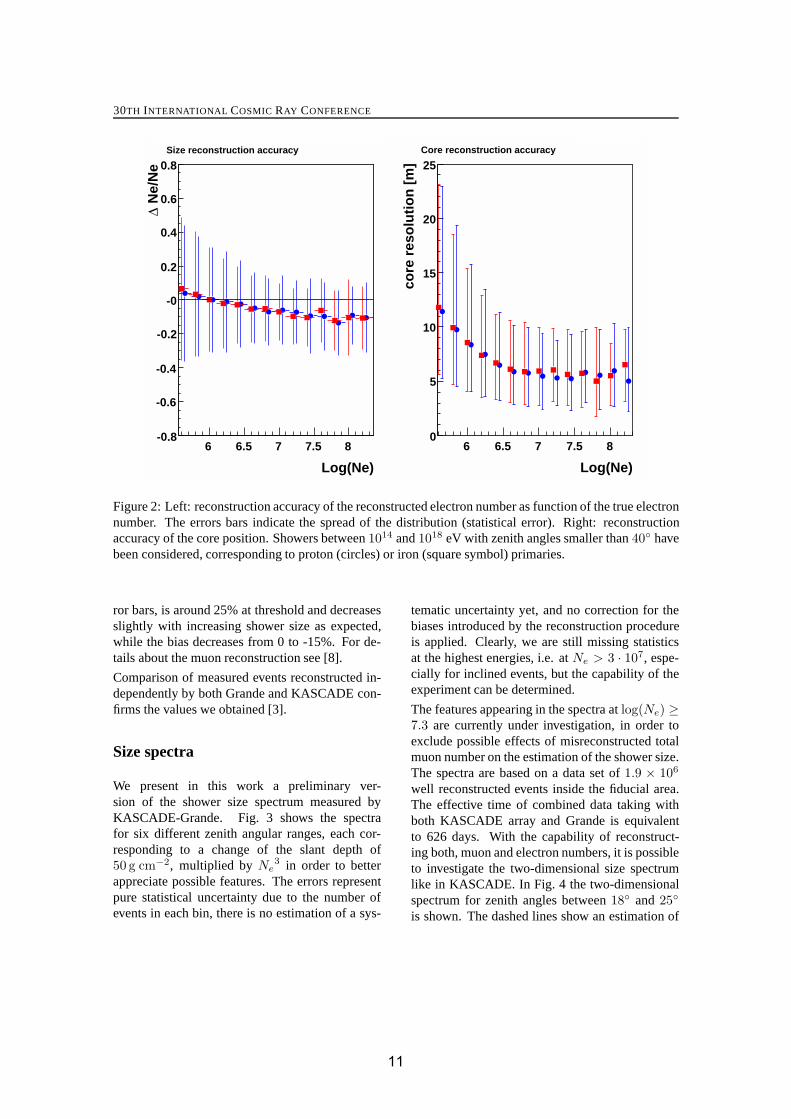
The analysis procedure develops in several steps.First, the total muon number and total number ofcharged particles are separately obtained fitting therespective lateral distributions. In a second step thecontribution of muons to the densities of chargedparticles measured by Grande is taken into ac-count: a likelihood fit compares for each detectorthe measured number of particles with the expectednumber given by the sum of electrons and muonsestimated from the corresponding lateral distribu-tion functions. The combined fit of the muonic andelectromagnetic components is delivering in the fi-nal step the shower size Ne, the age parameter s,the muon size Nμ, the position of the shower coreand the arrival direction of the shower. To test thereconstruction procedure and estimate the uncer-tainty, showers generated by CORSIKA, with theQGSJetII interaction model, have been used as in-put for a detailed GEANT [7] simulation of the ap-paratus. Approx. 260,000 proton and iron show-ers in the energy range of 1014 − 1018 eV, withzenith angles between 0◦ and 40◦, have been anal-ysed with the same procedure used for real data. Inorder to reduce effects of misreconstructed showercores at the edges of the Grande array, a fiducialarea of ≈ 190, 000 m2 centered in the middle ofGrande has been chosen. The results for spatial re-solution are shown as a function of the shower sizein Fig. 2: above the threshold of 6.3×10⁶ electronsthe core resolution is better than 12 m and showsno significant dependence on the primary particle.The points mark the mean deviation from the truevalue in percent, while the error bars describe thespread of the distribution. Fig. 2, left part, displaysthe accuracy of the reconstructed electron num-ber: the statistical uncertainty, expressed by the er-
1010
30TH INTERNATIONAL COSMIC RAY CONFERENCE
Log(Ne)
6 6.5 7 7.5 8
Ne/
Ne
Δ
-0.8
-0.6
-0.4
-0.2
-0
0.2
0.4
0.6
0.8Size reconstruction accuracy
Log(Ne)
6 6.5 7 7.5 8
core
res
olu
tio
n [
m]
0
5
10
15
20
25Core reconstruction accuracy
Figure 2: Left: reconstruction accuracy of the reconstructed electron number as function of the true electronnumber. The errors bars indicate the spread of the distribution (statistical error). Right: reconstructionaccuracy of the core position. Showers between 1014 and 1018 eV with zenith angles smaller than 40◦ havebeen considered, corresponding to proton (circles) or iron (square symbol) primaries.
ror bars, is around 25% at threshold and decreasesslightly with increasing shower size as expected,while the bias decreases from 0 to -15%. For de-tails about the muon reconstruction see [8].
Comparison of measured events reconstructed in-dependently by both Grande and KASCADE con-firms the values we obtained [3].
Size spectra
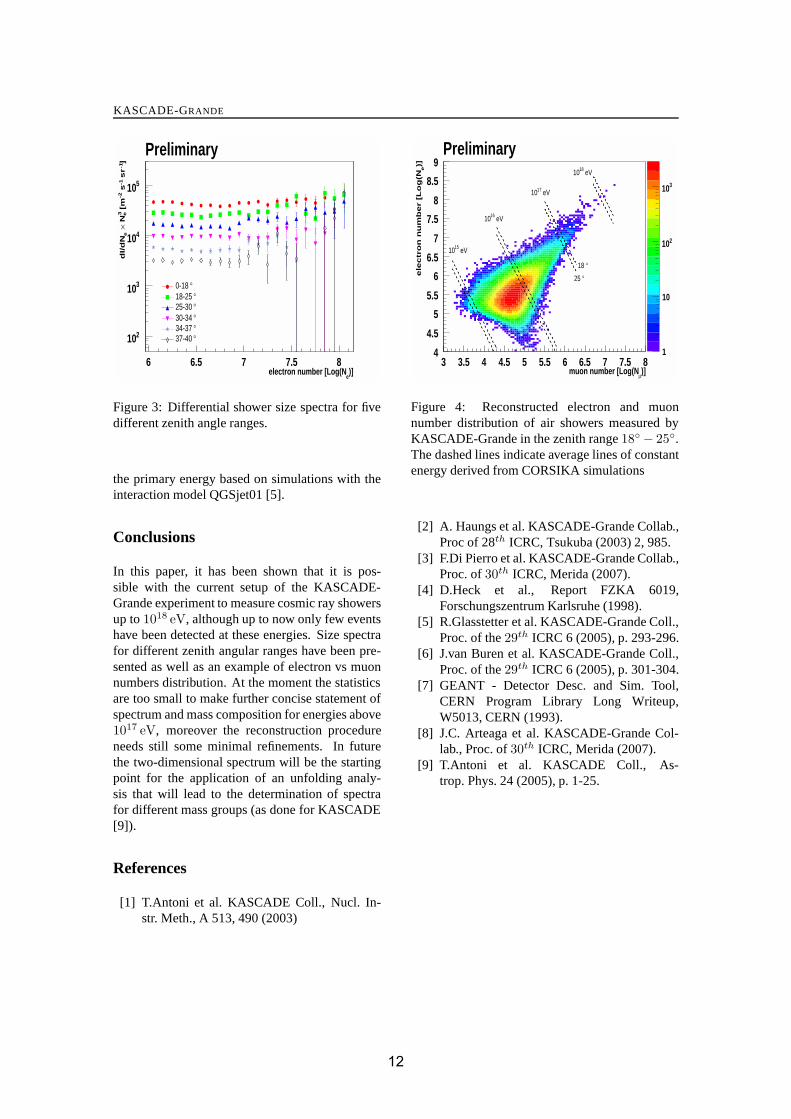
We present in this work a preliminary ver-sion of the shower size spectrum measured byKASCADE-Grande. Fig. 3 shows the spectrafor six different zenith angular ranges, each cor-responding to a change of the slant depth of50 g cm−2, multiplied by Ne
3 in order to betterappreciate possible features. The errors representpure statistical uncertainty due to the number ofevents in each bin, there is no estimation of a sys-
tematic uncertainty yet, and no correction for thebiases introduced by the reconstruction procedureis applied. Clearly, we are still missing statisticsat the highest energies, i.e. at Ne > 3 · 107, espe-cially for inclined events, but the capability of theexperiment can be determined.
The features appearing in the spectra at log(Ne) ≥7.3 are currently under investigation, in order toexclude possible effects of misreconstructed totalmuon number on the estimation of the shower size.The spectra are based on a data set of 1.9 × 10⁶
well reconstructed events inside the fiducial area.The effective time of combined data taking withboth KASCADE array and Grande is equivalentto 626 days. With the capability of reconstruct-ing both, muon and electron numbers, it is possibleto investigate the two-dimensional size spectrumlike in KASCADE. In Fig. 4 the two-dimensionalspectrum for zenith angles between 18◦ and 25◦
is shown. The dashed lines show an estimation of
1111
KASCADE-GRANDE
)]e
electron number [Log(N6 6.5 7 7.5 8
]-1
sr
-1 s
-2 [
m3 e
N×
ed
I/d
N
210
310
410
510
°0-18°18-25°25-30°30-34°34-37°37-40
Preliminary
Figure 3: Differential shower size spectra for fivedifferent zenith angle ranges.
the primary energy based on simulations with theinteraction model QGSjet01 [5].
Conclusions
In this paper, it has been shown that it is pos-sible with the current setup of the KASCADE-Grande experiment to measure cosmic ray showersup to 1018 eV, although up to now only few eventshave been detected at these energies. Size spectrafor different zenith angular ranges have been pre-sented as well as an example of electron vs muonnumbers distribution. At the moment the statisticsare too small to make further concise statement ofspectrum and mass composition for energies above1017 eV, moreover the reconstruction procedureneeds still some minimal refinements. In futurethe two-dimensional spectrum will be the startingpoint for the application of an unfolding analy-sis that will lead to the determination of spectrafor different mass groups (as done for KASCADE[9]).
References
[1] T.Antoni et al. KASCADE Coll., Nucl. In-str. Meth., A 513, 490 (2003)
)]μmuon number [Log(N3 3.5 4 4.5 5 5.5 6 6.5 7 7.5 8
)]e
ele
ctr
on
nu
mb
er
[Lo
g(N
4
4.5
5
5.5
6
6.5
7
7.5
8
8.5
9
1
10
210
310
eV1810
°18
eV1610
eV1510
°25
eV1710
Preliminary
Figure 4: Reconstructed electron and muonnumber distribution of air showers measured byKASCADE-Grande in the zenith range 18◦ − 25◦.The dashed lines indicate average lines of constantenergy derived from CORSIKA simulations
[2] A. Haungs et al. KASCADE-Grande Collab.,Proc of 28th ICRC, Tsukuba (2003) 2, 985.
[3] F.Di Pierro et al. KASCADE-Grande Collab.,Proc. of 30th ICRC, Merida (2007).
[4] D.Heck et al., Report FZKA 6019,Forschungszentrum Karlsruhe (1998).
[5] R.Glasstetter et al. KASCADE-Grande Coll.,Proc. of the 29th ICRC 6 (2005), p. 293-296.
[6] J.van Buren et al. KASCADE-Grande Coll.,Proc. of the 29th ICRC 6 (2005), p. 301-304.
[7] GEANT - Detector Desc. and Sim. Tool,CERN Program Library Long Writeup,W5013, CERN (1993).
[8] J.C. Arteaga et al. KASCADE-Grande Col-lab., Proc. of 30th ICRC, Merida (2007).
[9] T.Antoni et al. KASCADE Coll., As-trop. Phys. 24 (2005), p. 1-25.
1212
30TH INTERNATIONAL COSMIC RAY CONFERENCE
Muon spectra reconstructed from inclined air showers measured by KASCADE-Grande
J.C. ARTEAGAa, W.D. APELa, F. BADEAa , K. BEKKa , M. BERTAINAb , J. BLUMERa,c , H. BOZDOGa ,I.M. BRANCUSd , M. BRUGGEMANNe , P. BUCHHOLZe , A. CHIAVASSAb , F. COSSAVELLAc ,K. DAUMILLERa , V. DE SOUZAc , F. DI PIERROb , P. DOLLa, R. ENGELa, J. ENGLERa, M. FINGERc ,D. FUHRMANNf , P.L. GHIAg , H.J. GILSa, R. GLASSTETTERf , C. GRUPENe , A. HAUNGSa , D. HECKa ,J.R. HORANDELc , T. HUEGEa, P.G. ISARa, K.-H. KAMPERTf , D. KICKELBICKe , H.O. KLAGESa,Y. KOLOTAEVe, P. LUCZAKh, H.J. MATHESa, H.J. MAYERa, C. MEURERa, J. MILKEa, B. MITRICAd ,A. MORALESa, C. MORELLOg , G. NAVARRAb , S. NEHLSa, J. OEHLSCHLAGERa, S. OSTAPCHENKOa,S. OVERe , M. PETCUd , T. PIEROGa , S. PLEWNIAa, H. REBELa, M. ROTHa , H. SCHIELERa , O. SIMAi ,M. STUMPERTc , G. TOMAd , G.C. TRINCHEROg , H. ULRICHa , J. VAN BURENa , W. WALKOWIAKe ,A. WEINDLa, J. WOCHELEa , J. ZABIEROWSKIh .a Institut fur Kernphysik, Forschungszentrum Karlsruhe, Germanyb Dipartimento di Fisica Generale dell’Universita Torino, Italyc Institut fur Experimentelle Kernphysik, Universitat Karlsruhe, Germanyd National Institute of Physics and Nuclear Engineering, Bucharest, Romaniae Fachbereich Physik, Universitat Siegen, Germanyf Fachbereich Physik, Universitat Wuppertal, Germanyg Istituto di Fisica dello Spazio Interplanetario, INAF Torino, Italyh Soltan Institute for Nuclear Studies, Lodz, Polandi Department of Physics, University of Bucharest, [email protected]
Abstract: Inclined air showers (i.e. showers with zenith angle above 40 degrees) are registered by theKASCADE-Grande experiment, which is designed to address fundamental questions about the origin,composition and acceleration mechanisms of primary cosmic rays between 1014 and 1018 eV. Despite theaggravate reconstruction due to the thin scintillation detectors used in KASCADE-Grande these inclinedevents are valuable since they offer a good opportunity to both, study the penetrating component of theair showers and cross-checks of hadronic interaction models. Working in this direction, a first analysisof the KASCADE-Grande data from inclined events has been performed. In particular, the muon spectrahave been reconstructed for different zenith angle intervals and features of the resulting spectra have beenstudied and confronted with expectations from Monte Carlo simulations.
Introduction
The main objective of the KASCADE-Grande ex-periment is the search for a knee in the heavy com-ponent of the cosmic ray spectrum. The presenceor not of this feature will shed light on the origin ofthe cosmic rays in the energy region of 1014−1018
eV. The experiment studies this region of the cos-mic ray spectrum indirectly, by observing the ex-tensive air showers produced by cosmic rays in theatmosphere. For this purpose, KASCADE-Grande
makes use of an 0.5 km2 array of 37× 10 m2 plas-tic scintillator detectors, which measures the ar-rival time and the density of charged particles inthe shower front [1]. The advantage of the experi-ment is that it can directly measure the penetratingcomponent of the air shower by using the array of192 × 3.2 m2 shielded scintillator detectors of theoriginal KASCADE observatory [2].
KASCADE-Grande is sensitive to air showers upto 70o degrees of zenith angle, but only showers
1313

KASCADE-GRANDE
(E/GeV)10log6 6.5 7 7.5 8 8.5 9
Eff
icie
ncy
0
0.2
0.4
0.6
0.8
1
Trigger and reconstruction eff (Mixed).
(E/GeV)10log6 6.5 7 7.5 8 8.5 9
Eff
icie
ncy
0
0.2
0.4
0.6
0.8
1
o < 20θ≤o 0o < 40θ≤o20o < 50θ≤o40o < 70θ≤o50
Figure 1: KASCADE-Grande triggering and re-construction efficiency as a function of primary en-ergy for different zenith angle intervals.
below 40o have been used up to now in the generalanalyses. Before using the data on inclined show-ers (i.e., on events above θ = 40o) a very goodunderstanding of the precision of the employed re-construction techniques in this zenith angle rangeis required. This task has recently begun, led bythe different opportunities that the study of in-clined showers offers, e.g.: 1) to increase the statis-tics of the experiment, 2) to understand in moredetail the penetrating component of the shower,which is dominant in these kind of events, and3) to cross-check hadronic interaction models, ta-king advantage of the close relation existing bet-ween the hadronic processes and the production ofmuons in the shower. In the following, the resultsof a first analysis of the penetrating component ofinclined showers measured with the KASCADE-Grande experiment will be discussed.
Efficiency and systematics
To study the systematics and performance of theKASCADE-Grande detector at different zenith an-gles, both the air shower and the secondary particleinteraction with the detector were carefully simu-lated. The air showers were generated with COR-SIKA [3], employing the high-energy hadronic in-teraction model QGSJET II [4] for the range θ =0o − 70o, the energy interval E = 1015 − 1018 eVand different primaries with equal abundances: H,
MC-Data 2fit (Kreta V1.17/01) Entries 33055
[deg]θ0 10 20 30 40 50 60 70
) μ(N
10 lo
gΔ
-0.2
-0.1
0
0.1
0.2
0.3
Entries 33055
Figure 2: Zenith angle dependence of the system-atic error for the reconstructed muon number.
He, C, Si and Fe. A power law cosmic ray flux withspectral index γ =−2 was used to generate the airshowers. The cosmic ray events were isotropicallydistributed and their core homogeneously scatteredover the entire Grande array. The same reconstruc-tion procedure used for the experimental data wasapplied to the simulations.
The total muon number, Nμ, in the air shower isestimated from a log-likelihood fit to the measuredmuon densities at the KASCADE muon detectors[5]. On the other hand, the arrival direction of theshower is obtained from a χ2 fit to the arrival timesof the shower front to the KASCADE-Grande sta-tions [6]. In this fit, sampling effects, fluctuationsand the curvature of the shower front are properlymodeled based on Monte Carlo simulations fol-lowing [6], but with the difference that for inclinedshowers also muons are taken into account whenparametrizing the shower front dependence on thezenith angle.
Several quality cuts were applied to the simulateddata. A fiducial area of 0.4 km2 with octagonalshape, centered at KASCADE-Grande, was cho-sen for the analysis to avoid showers with misre-constructed cores. Additionally, only events thattriggered more than 19 Grande stations and passedsuccessfully the charged particle reconstructionwere considered. Cuts on the electron number Ne
and the electron age parameter, s, were also intro-duced. For events with θ < 50o, the cut Ne > 105
was imposed. The same cut can not be applied toshowers with higher zenith angles, in other case
1414
30TH INTERNATIONAL COSMIC RAY CONFERENCE
MC-Data 2fit (Kreta V1.17/01) Entries 33055
)μ(N10log5.4 5.6 5.8 6 6.2 6.4 6.6 6.8 7
) μ(N
10 lo
gΔ
-0.15
-0.1
-0.05
0
0.05
0.1Entries 33055
o - 70o = 0θ
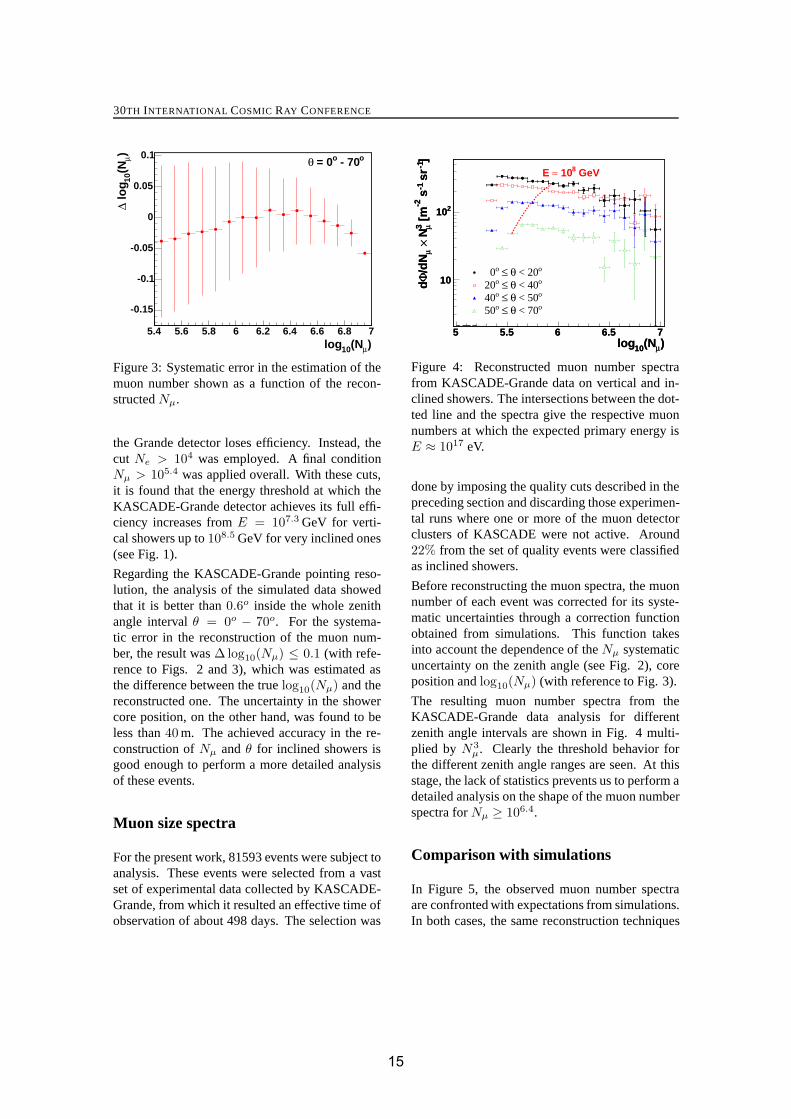
Figure 3: Systematic error in the estimation of themuon number shown as a function of the recon-structed Nμ.
the Grande detector loses efficiency. Instead, thecut Ne > 104 was employed. A final conditionNμ > 105.4 was applied overall. With these cuts,it is found that the energy threshold at which theKASCADE-Grande detector achieves its full effi-ciency increases from E = 107.3 GeV for verti-cal showers up to 108.5 GeV for very inclined ones(see Fig. 1).
Regarding the KASCADE-Grande pointing reso-lution, the analysis of the simulated data showedthat it is better than 0.6o inside the whole zenithangle interval θ = 0o − 70o. For the systema-tic error in the reconstruction of the muon num-ber, the result was Δlog10(Nμ) ≤ 0.1 (with refe-rence to Figs. 2 and 3), which was estimated asthe difference between the true log10(Nμ) and thereconstructed one. The uncertainty in the showercore position, on the other hand, was found to beless than 40 m. The achieved accuracy in the re-construction of Nμ and θ for inclined showers isgood enough to perform a more detailed analysisof these events.
Muon size spectra
For the present work, 81593 events were subject toanalysis. These events were selected from a vastset of experimental data collected by KASCADE-Grande, from which it resulted an effective time ofobservation of about 498 days. The selection was
)μ(N10log5 5.5 6 6.5 7
]-1
sr
-1 s
-2 [
m3 μ
N×μ
/dN
Φd 10
210
)μ(N10log5 5.5 6 6.5 7
]-1
sr
-1 s
-2 [
m3 μ
N×μ
/dN
Φd 10
210
correction function: All)μ
Muon Size x Nmu^3 Spectrum (N
KRETA V 1.17.01 Ntupleso < 20θ≤o 0o < 40θ≤o20o < 50θ≤o40o < 70θ≤o50
GeV8 10≈E
Figure 4: Reconstructed muon number spectrafrom KASCADE-Grande data on vertical and in-clined showers. The intersections between the dot-ted line and the spectra give the respective muonnumbers at which the expected primary energy isE ≈ 1017 eV.
done by imposing the quality cuts described in thepreceding section and discarding those experimen-tal runs where one or more of the muon detectorclusters of KASCADE were not active. Around22% from the set of quality events were classifiedas inclined showers.
Before reconstructing the muon spectra, the muonnumber of each event was corrected for its syste-matic uncertainties through a correction functionobtained from simulations. This function takesinto account the dependence of the Nμ systematicuncertainty on the zenith angle (see Fig. 2), coreposition and log10(Nμ) (with reference to Fig. 3).
The resulting muon number spectra from theKASCADE-Grande data analysis for differentzenith angle intervals are shown in Fig. 4 multi-plied by N3
μ. Clearly the threshold behavior forthe different zenith angle ranges are seen. At thisstage, the lack of statistics prevents us to perform adetailed analysis on the shape of the muon numberspectra for Nμ ≥ 106.4.
Comparison with simulations
In Figure 5, the observed muon number spectraare confronted with expectations from simulations.In both cases, the same reconstruction techniques
1515

KASCADE-GRANDE
)μ(N10log5 5.2 5.4 5.6 5.8 6 6.2 6.4
]-1
sr
-1 s
-2 [
m3 μ
N×μ
/dN
Φd
1
10
210
310
correction function (mixed comp.)μNMC simulation (mixed comp.)KG data
o < 20θ≤o0
o < 50θ≤o40
o < 70θ≤o50
o < 20Θ≤o 0
GeV8 10≈E
Figure 5: Comparison between the reconstructedmuon spectrum from experimental data and simu-lations at different zenith angle ranges.
were applied. The simulated data set here em-ployed was similar to the one described in section2, but multiplied with an appropriate weight func-tion, according to the energy of the event, in orderto reproduce an energy power law spectrum withγ = −3. To compare the measured and simulatedNμ spectra, the latter ones had to be multiplied bya common normalization factor, which was chosenin such a way that for the range θ < 20o, the muonspectra obtained from the experimental and simu-lated data have the same magnitude. The analysisis restricted to the interval log10(Nμ) = 5.4 − 6.4in order to avoid statistical fluctuations, in particu-lar, due to a low number of inclined events at highenergies.
Small differences in magnitude between the mea-sured and expected Nμ spectra for inclined sho-wers are revealed in Fig. 5. The difference isalso present for the range θ = 20o − 40o (notshown in Fig. 5 for clarity reasons), and growsfrom 12% at this zenith angle interval up to 20%for θ = 50o − 70o. When iron nuclei or protonsare used as primaries in the simulations, the abovesystematic trend is also observed, only the magni-tude of the differences changes slightly. A lowermuon number in the predictions from Monte Carlosimulations (CORSIKA/QGSJET II) for inclinedshowers than in the measurements or a reconstruc-tion bias could be responsible for the observed dif-ferences. To find the reasons behind these discre-pancies more analyses are needed.
Conclusions
It was shown that the KASCADE-Grande detectoris sensitive to very high energy inclined air showers(40o ≤ θ < 70o), which can be well reconstructed.Besides that the angular resolution of the detectorand the achieved accuracy reconstruction of Nμ aresufficient to allow detailed analyses with inclinedair showers in KASCADE-Grande. From a firstanalysis of measured inclined showers the muonnumber spectra, corrected by the correspondingNμ systematic uncertainties, were reconstructed.These fluxes were compared with expectationsfrom simulations based on CORSIKA/QGSJET II.After normalizing the simulated Nμ spectra witha common factor, which allowed us to match themeasured and simulated fluxes for θ < 20o, a sys-tematic difference between the experimental andthe simulated spectra was found, which increaseswith the zenith angle. The origin of this discre-pancy has to be investigated.
Acknowledgments
One of us, J.C. Arteaga, would like to thank tothe DAAD (grant A/05/12380) and the Institut furKernphysik at FZK for all its support.
References
[1] A. Haungs et al., KASCADE-Grande Coll.,Proc. of 28th ICRC Tsukuba 2, 985 (2003).
[2] T. Antoni et al., Nucl. Instrum. Meth. A513,490 (2003).
[3] D. Heck et al., Forschungszentrum Karls-ruhe, Report FZKA 6019 (1998).
[4] S.S. Ostapchenko, Phys. Rev. D74, 014026(2006).
[5] J. van Buren et al., KASCADE-Grande Coll.,Proc. of 29th ICRC Pune 6, 301 (2005).
[6] R. Glasstetter et al., KASCADE-GrandeColl., Proc. of 29th ICRC Pune 6, 293 (2005).
[7] W.D. Apel et al., KASCADE-Grande Coll.,Astropart. Phys. 24, 467 (2006).
1616

30TH INTERNATIONAL COSMIC RAY CONFERENCE
Features of the S(500) distribution for large air showers detected with theKASCADE-Grande array
G. TOMAd , W.D. APELa, J.C. ARTEAGAa, F. BADEAa , K. BEKKa , M. BERTAINAb ,J. BLUMERa,c , H. BOZDOGa, I.M. BRANCUSd , M. BRUGGEMANNe , P. BUCHHOLZe , A. CHIAVASSAb ,F. COSSAVELLAc , K. DAUMILLERa , V. DE SOUZAc , F. DI PIERROb , P. DOLLa, R. ENGELa,J. ENGLERa, M. FINGERc , D. FUHRMANNf , P.L. GHIAg , H.J. GILSa, R. GLASSTETTERf ,C. GRUPENe , A. HAUNGSa , D. HECKa , J.R. HORANDELc, T. HUEGEa, P.G. ISARa , K.-H. KAMPERTf ,D. KICKELBICKe , H.O. KLAGESa, Y. KOLOTAEVe, P. LUCZAKh, H.J. MATHESa, H.J. MAYERa ,C. MEURERa , J. MILKEa, B. MITRICAd , A. MORALESa, C. MORELLOg , G. NAVARRAb , S. NEHLSa,J. OEHLSCHLAGERa, S. OSTAPCHENKOa, S. OVERe , M. PETCUd , T. PIEROGa , S. PLEWNIAa,H. REBELa, M. ROTHa, H. SCHIELERa , O. SIMAi , M. STUMPERTc , G.C. TRINCHEROg , H. ULRICHa ,J. VAN BURENa , W. WALKOWIAKe , A. WEINDLa, J. WOCHELEa , J. ZABIEROWSKIh .a Institut fur Kernphysik, Forschungszentrum Karlsruhe, Germanyb Dipartimento di Fisica Generale dell’Universita Torino, Italyc Institut fur Experimentelle Kernphysik, Universitat Karlsruhe, Germanyd National Institute of Physics and Nuclear Engineering, Bucharest, Romaniae Fachbereich Physik, Universitat Siegen, Germanyf Fachbereich Physik, Universitat Wuppertal, Germanyg Istituto di Fisica dello Spazio Interplanetario, INAF Torino, Italyh Soltan Institute for Nuclear Studies, Lodz, Polandi Department of Physics, University of Bucharest, [email protected]
Abstract: For the experimental conditions of the KASCADE-Grande experiment, the density of chargedparticles of large air showers (EAS) at the distance of about 500 m from the shower core S(500) has beenshown by detailed simulation studies to be an approximate energy estimator, being nearly independent ofthe mass of the primary particle. This report presents some first experimentally observed features of theS(500) observable of EAS registered with the KASCADE-Grande array installed at the Forschungszen-trum Karlsruhe, Germany. The measured energy deposits of particles in the 37 scintillation detectorstations have been used to reconstruct the lateral charged particle distributions which are described bya Linsley LDF. With adjusting the charged particle density distribution and applying various cuts, theS(500) distribution of the data has been evaluated. Among other features, the S(500) dependence fromthe EAS angle of incidence has been studied .
Introduction
It has been first shown by Hillas et al. [1] that thelateral charged particle density at a particular dis-tance from the EAS core, dependent on the specificlayout of the considered array, proves to be nearlyindependent of primary mass and maps only theprimary energy. An estimate of the primary en-ergy on this basis has been applied for various ar-rays [2]. KASCADE-Grande [3] consists as main
component of an array of 37 detector stations of 10m2 scintillation counters, that covers a total area of∼0.5 km2. Dedicated simulation studies [4] haveshown for the particular case of the layout of theKASCADE-Grande array that the charged parti-cle density at the distance of around 500 m fromshower centre appears most appropriate for the en-ergy estimate.
1717
KASCADE-GRANDE
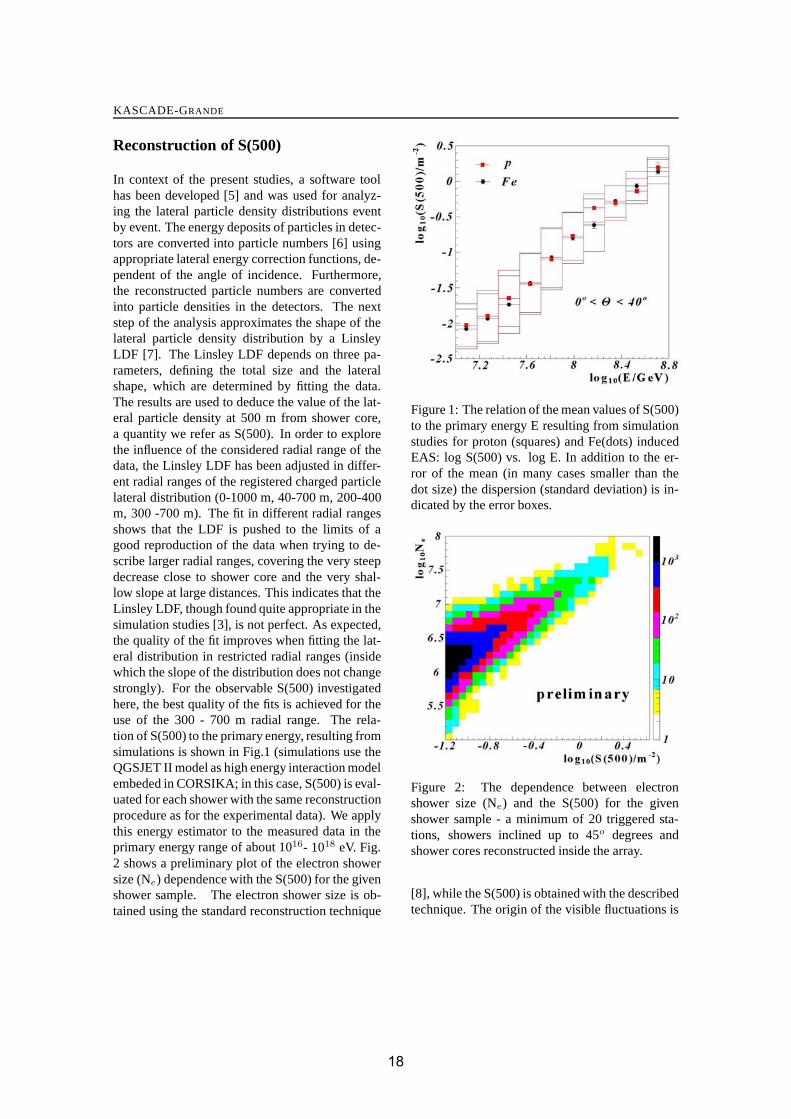
Reconstruction of S(500)
In context of the present studies, a software toolhas been developed [5] and was used for analyz-ing the lateral particle density distributions eventby event. The energy deposits of particles in detec-tors are converted into particle numbers [6] usingappropriate lateral energy correction functions, de-pendent of the angle of incidence. Furthermore,the reconstructed particle numbers are convertedinto particle densities in the detectors. The nextstep of the analysis approximates the shape of thelateral particle density distribution by a LinsleyLDF [7]. The Linsley LDF depends on three pa-rameters, defining the total size and the lateralshape, which are determined by fitting the data.The results are used to deduce the value of the lat-eral particle density at 500 m from shower core,a quantity we refer as S(500). In order to explorethe influence of the considered radial range of thedata, the Linsley LDF has been adjusted in differ-ent radial ranges of the registered charged particlelateral distribution (0-1000 m, 40-700 m, 200-400m, 300 -700 m). The fit in different radial rangesshows that the LDF is pushed to the limits of agood reproduction of the data when trying to de-scribe larger radial ranges, covering the very steepdecrease close to shower core and the very shal-low slope at large distances. This indicates that theLinsley LDF, though found quite appropriate in thesimulation studies [3], is not perfect. As expected,the quality of the fit improves when fitting the lat-eral distribution in restricted radial ranges (insidewhich the slope of the distribution does not changestrongly). For the observable S(500) investigatedhere, the best quality of the fits is achieved for theuse of the 300 - 700 m radial range. The rela-tion of S(500) to the primary energy, resulting fromsimulations is shown in Fig.1 (simulations use theQGSJET II model as high energy interaction modelembeded in CORSIKA; in this case, S(500) is eval-uated for each shower with the same reconstructionprocedure as for the experimental data). We applythis energy estimator to the measured data in theprimary energy range of about 1016- 1018 eV. Fig.2 shows a preliminary plot of the electron showersize (Ne) dependence with the S(500) for the givenshower sample. The electron shower size is ob-tained using the standard reconstruction technique
Figure 1: The relation of the mean values of S(500)to the primary energy E resulting from simulationstudies for proton (squares) and Fe(dots) inducedEAS: log S(500) vs. log E. In addition to the er-ror of the mean (in many cases smaller than thedot size) the dispersion (standard deviation) is in-dicated by the error boxes.
Figure 2: The dependence between electronshower size (Ne) and the S(500) for the givenshower sample - a minimum of 20 triggered sta-tions, showers inclined up to 45o degrees andshower cores reconstructed inside the array.
[8], while the S(500) is obtained with the describedtechnique. The origin of the visible fluctuations is
1818
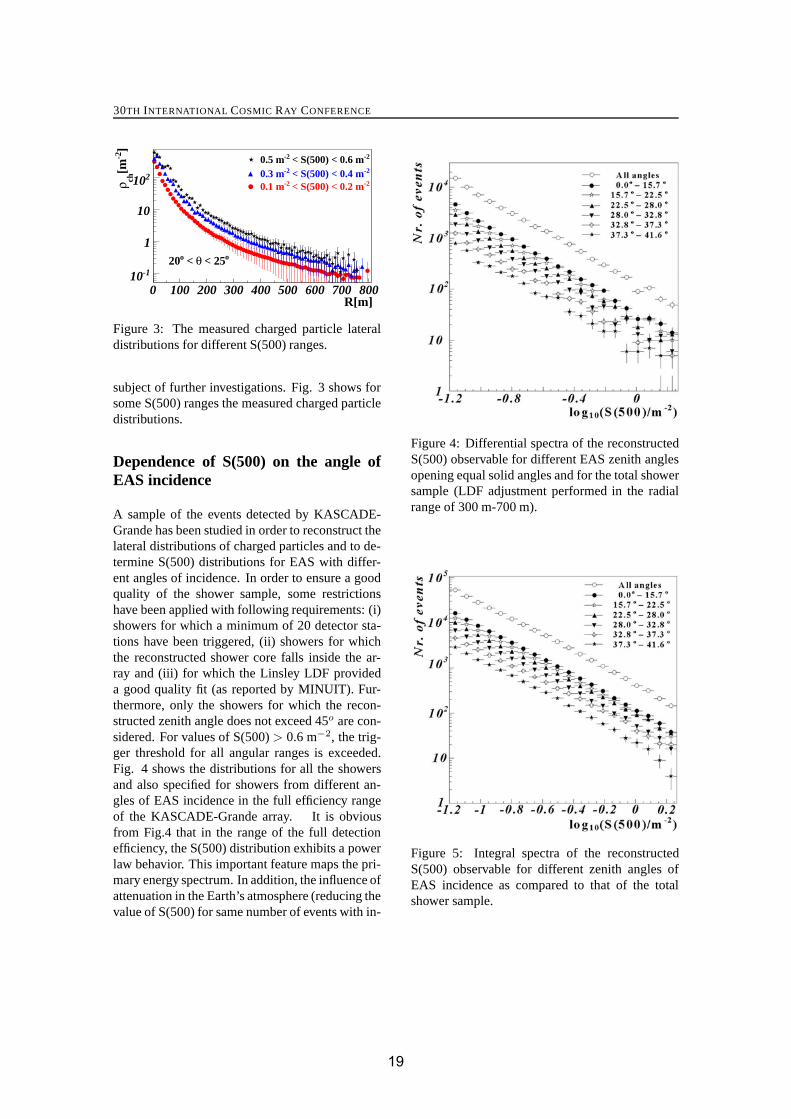
30TH INTERNATIONAL COSMIC RAY CONFERENCE
R[m]0 100 200 300 400 500 600 700 800
]-2
[mchρ
-110
1
10
210 -2 < S(500) < 0.2 m-20.1 m
-2 < S(500) < 0.4 m-20.3 m
-2 < S(500) < 0.6 m-20.5 m
o < 25θ < o20
Figure 3: The measured charged particle lateraldistributions for different S(500) ranges.
subject of further investigations. Fig. 3 shows forsome S(500) ranges the measured charged particledistributions.
Dependence of S(500) on the angle ofEAS incidence
A sample of the events detected by KASCADE-Grande has been studied in order to reconstruct thelateral distributions of charged particles and to de-termine S(500) distributions for EAS with differ-ent angles of incidence. In order to ensure a goodquality of the shower sample, some restrictionshave been applied with following requirements: (i)showers for which a minimum of 20 detector sta-tions have been triggered, (ii) showers for whichthe reconstructed shower core falls inside the ar-ray and (iii) for which the Linsley LDF provideda good quality fit (as reported by MINUIT). Fur-thermore, only the showers for which the recon-structed zenith angle does not exceed 45o are con-sidered. For values of S(500) > 0.6 m−2, the trig-ger threshold for all angular ranges is exceeded.Fig. 4 shows the distributions for all the showersand also specified for showers from different an-gles of EAS incidence in the full efficiency rangeof the KASCADE-Grande array. It is obviousfrom Fig.4 that in the range of the full detectionefficiency, the S(500) distribution exhibits a powerlaw behavior. This important feature maps the pri-mary energy spectrum. In addition, the influence ofattenuation in the Earth’s atmosphere (reducing thevalue of S(500) for same number of events with in-
Figure 4: Differential spectra of the reconstructedS(500) observable for different EAS zenith anglesopening equal solid angles and for the total showersample (LDF adjustment performed in the radialrange of 300 m-700 m).
Figure 5: Integral spectra of the reconstructedS(500) observable for different zenith angles ofEAS incidence as compared to that of the totalshower sample.
1919
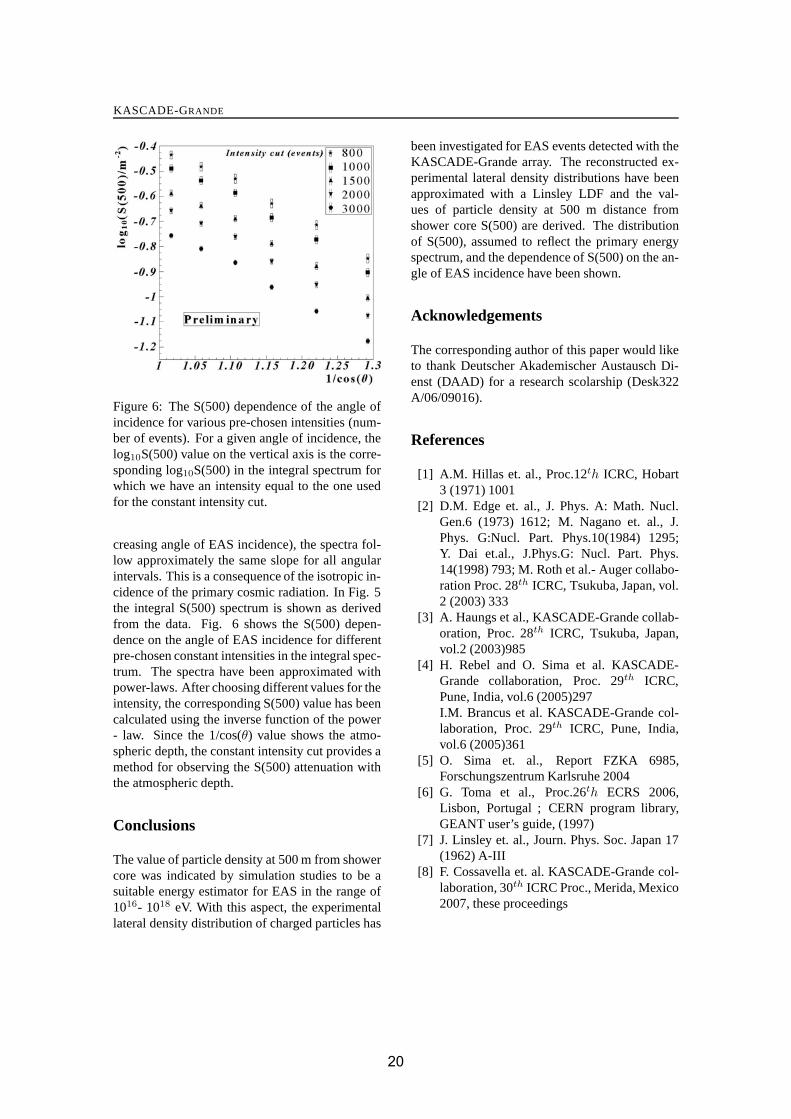
KASCADE-GRANDE
Figure 6: The S(500) dependence of the angle ofincidence for various pre-chosen intensities (num-ber of events). For a given angle of incidence, thelog10S(500) value on the vertical axis is the corre-sponding log10S(500) in the integral spectrum forwhich we have an intensity equal to the one usedfor the constant intensity cut.
creasing angle of EAS incidence), the spectra fol-low approximately the same slope for all angularintervals. This is a consequence of the isotropic in-cidence of the primary cosmic radiation. In Fig. 5the integral S(500) spectrum is shown as derivedfrom the data. Fig. 6 shows the S(500) depen-dence on the angle of EAS incidence for differentpre-chosen constant intensities in the integral spec-trum. The spectra have been approximated withpower-laws. After choosing different values for theintensity, the corresponding S(500) value has beencalculated using the inverse function of the power- law. Since the 1/cos(θ) value shows the atmo-spheric depth, the constant intensity cut provides amethod for observing the S(500) attenuation withthe atmospheric depth.
Conclusions
The value of particle density at 500 m from showercore was indicated by simulation studies to be asuitable energy estimator for EAS in the range of1016- 1018 eV. With this aspect, the experimentallateral density distribution of charged particles has
been investigated for EAS events detected with theKASCADE-Grande array. The reconstructed ex-perimental lateral density distributions have beenapproximated with a Linsley LDF and the val-ues of particle density at 500 m distance fromshower core S(500) are derived. The distributionof S(500), assumed to reflect the primary energyspectrum, and the dependence of S(500) on the an-gle of EAS incidence have been shown.
Acknowledgements
The corresponding author of this paper would liketo thank Deutscher Akademischer Austausch Di-enst (DAAD) for a research scolarship (Desk322A/06/09016).
References
[1] A.M. Hillas et. al., Proc.12th ICRC, Hobart3 (1971) 1001
[2] D.M. Edge et. al., J. Phys. A: Math. Nucl.Gen.6 (1973) 1612; M. Nagano et. al., J.Phys. G:Nucl. Part. Phys.10(1984) 1295;Y. Dai et.al., J.Phys.G: Nucl. Part. Phys.14(1998) 793; M. Roth et al.- Auger collabo-ration Proc. 28th ICRC, Tsukuba, Japan, vol.2 (2003) 333
[3] A. Haungs et al., KASCADE-Grande collab-oration, Proc. 28th ICRC, Tsukuba, Japan,vol.2 (2003)985
[4] H. Rebel and O. Sima et al. KASCADE-Grande collaboration, Proc. 29th ICRC,Pune, India, vol.6 (2005)297I.M. Brancus et al. KASCADE-Grande col-laboration, Proc. 29th ICRC, Pune, India,vol.6 (2005)361
[5] O. Sima et. al., Report FZKA 6985,Forschungszentrum Karlsruhe 2004
[6] G. Toma et al., Proc.26th ECRS 2006,Lisbon, Portugal ; CERN program library,GEANT user’s guide, (1997)
[7] J. Linsley et. al., Journ. Phys. Soc. Japan 17(1962) A-III
[8] F. Cossavella et. al. KASCADE-Grande col-laboration, 30th ICRC Proc., Merida, Mexico2007, these proceedings
2020
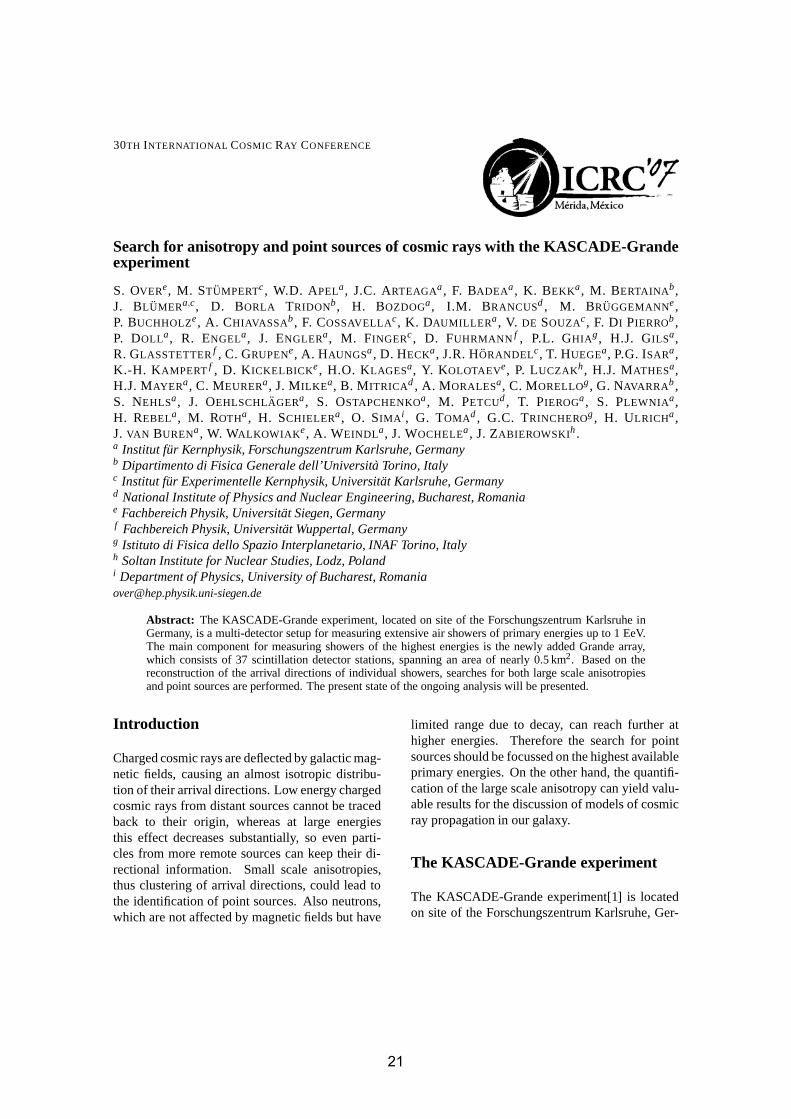
30TH INTERNATIONAL COSMIC RAY CONFERENCE
Search for anisotropy and point sources of cosmic rays with the KASCADE-Grandeexperiment
S. OVERe, M. STUMPERTc , W.D. APELa , J.C. ARTEAGAa , F. BADEAa , K. BEKKa , M. BERTAINAb ,J. BLUMERa,c, D. BORLA TRIDONb , H. BOZDOGa , I.M. BRANCUSd , M. BRUGGEMANNe ,P. BUCHHOLZe , A. CHIAVASSAb , F. COSSAVELLAc, K. DAUMILLERa , V. DE SOUZAc , F. DI PIERROb ,P. DOLLa , R. ENGELa, J. ENGLERa , M. FINGERc , D. FUHRMANN f , P.L. GHIAg , H.J. GILSa ,R. GLASSTETTER f , C. GRUPENe , A. HAUNGSa , D. HECKa , J.R. HORANDELc, T. HUEGEa, P.G. ISARa ,K.-H. KAMPERT f , D. KICKELBICKe , H.O. KLAGESa, Y. KOLOTAEVe, P. LUCZAKh , H.J. MATHESa,H.J. MAYERa , C. MEURERa , J. MILKEa, B. MITRICAd , A. MORALESa, C. MORELLOg , G. NAVARRAb ,S. NEHLSa , J. OEHLSCHLAGERa , S. OSTAPCHENKOa , M. PETCUd , T. PIEROGa , S. PLEWNIAa ,H. REBELa , M. ROTHa , H. SCHIELERa , O. SIMAi , G. TOMAd , G.C. TRINCHEROg , H. ULRICHa ,J. VAN BURENa , W. WALKOWIAKe , A. WEINDLa , J. WOCHELEa , J. ZABIEROWSKIh .a Institut fur Kernphysik, Forschungszentrum Karlsruhe, Germanyb Dipartimento di Fisica Generale dell’Universita Torino, Italyc Institut fur Experimentelle Kernphysik, Universitat Karlsruhe, Germanyd National Institute of Physics and Nuclear Engineering, Bucharest, Romaniae Fachbereich Physik, Universitat Siegen, Germanyf Fachbereich Physik, Universitat Wuppertal, Germanyg Istituto di Fisica dello Spazio Interplanetario, INAF Torino, Italyh Soltan Institute for Nuclear Studies, Lodz, Polandi Department of Physics, University of Bucharest, [email protected]
Abstract: The KASCADE-Grande experiment, located on site of the Forschungszentrum Karlsruhe inGermany, is a multi-detector setup for measuring extensive air showers of primary energies up to 1 EeV.The main component for measuring showers of the highest energies is the newly added Grande array,which consists of 37 scintillation detector stations, spanning an area of nearly 0.5 km2. Based on thereconstruction of the arrival directions of individual showers, searches for both large scale anisotropiesand point sources are performed. The present state of the ongoing analysis will be presented.
Introduction
Charged cosmic rays are deflected by galactic mag-netic fields, causing an almost isotropic distribu-tion of their arrival directions. Low energy chargedcosmic rays from distant sources cannot be tracedback to their origin, whereas at large energiesthis effect decreases substantially, so even parti-cles from more remote sources can keep their di-rectional information. Small scale anisotropies,thus clustering of arrival directions, could lead tothe identification of point sources. Also neutrons,which are not affected by magnetic fields but have
limited range due to decay, can reach further athigher energies. Therefore the search for pointsources should be focussed on the highest availableprimary energies. On the other hand, the quantifi-cation of the large scale anisotropy can yield valu-able results for the discussion of models of cosmicray propagation in our galaxy.
The KASCADE-Grande experiment
The KASCADE-Grande experiment[1] is locatedon site of the Forschungszentrum Karlsruhe, Ger-
2121
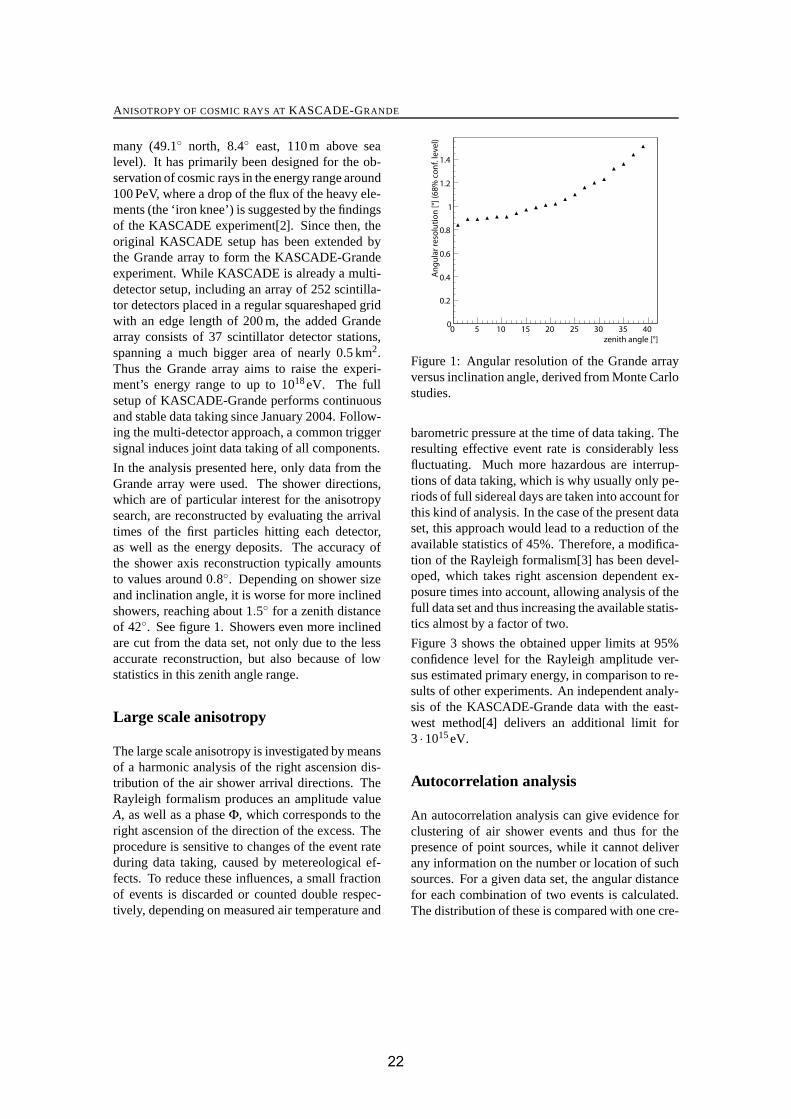
ANISOTROPY OF COSMIC RAYS AT KASCADE-GRANDE
many (49.1◦ north, 8.4◦ east, 110 m above sealevel). It has primarily been designed for the ob-servation of cosmic rays in the energy range around100 PeV, where a drop of the flux of the heavy ele-ments (the ‘iron knee’) is suggested by the findingsof the KASCADE experiment[2]. Since then, theoriginal KASCADE setup has been extended bythe Grande array to form the KASCADE-Grandeexperiment. While KASCADE is already a multi-detector setup, including an array of 252 scintilla-tor detectors placed in a regular squareshaped gridwith an edge length of 200 m, the added Grandearray consists of 37 scintillator detector stations,spanning a much bigger area of nearly 0.5 km2.Thus the Grande array aims to raise the experi-ment’s energy range to up to 1018 eV. The fullsetup of KASCADE-Grande performs continuousand stable data taking since January 2004. Follow-ing the multi-detector approach, a common triggersignal induces joint data taking of all components.
In the analysis presented here, only data from theGrande array were used. The shower directions,which are of particular interest for the anisotropysearch, are reconstructed by evaluating the arrivaltimes of the first particles hitting each detector,as well as the energy deposits. The accuracy ofthe shower axis reconstruction typically amountsto values around 0.8◦. Depending on shower sizeand inclination angle, it is worse for more inclinedshowers, reaching about 1.5◦ for a zenith distanceof 42◦. See figure 1. Showers even more inclinedare cut from the data set, not only due to the lessaccurate reconstruction, but also because of lowstatistics in this zenith angle range.
Large scale anisotropy
The large scale anisotropy is investigated by meansof a harmonic analysis of the right ascension dis-tribution of the air shower arrival directions. TheRayleigh formalism produces an amplitude valueA, as well as a phase Φ, which corresponds to theright ascension of the direction of the excess. Theprocedure is sensitive to changes of the event rateduring data taking, caused by metereological ef-fects. To reduce these influences, a small fractionof events is discarded or counted double respec-tively, depending on measured air temperature and
zenith angle [°]0 5 10 15 20 25 30 35 40
Ang
ular
reso
lutio
n [°
] (68
% c
onf.
leve
l)
0
0.2
0.4
0.6
0.8
1
1.2
1.4
Figure 1: Angular resolution of the Grande arrayversus inclination angle, derived from Monte Carlostudies.
barometric pressure at the time of data taking. Theresulting effective event rate is considerably lessfluctuating. Much more hazardous are interrup-tions of data taking, which is why usually only pe-riods of full sidereal days are taken into account forthis kind of analysis. In the case of the present dataset, this approach would lead to a reduction of theavailable statistics of 45%. Therefore, a modifica-tion of the Rayleigh formalism[3] has been devel-oped, which takes right ascension dependent ex-posure times into account, allowing analysis of thefull data set and thus increasing the available statis-tics almost by a factor of two.
Figure 3 shows the obtained upper limits at 95%confidence level for the Rayleigh amplitude ver-sus estimated primary energy, in comparison to re-sults of other experiments. An independent analy-sis of the KASCADE-Grande data with the east-west method[4] delivers an additional limit for3 ·1015 eV.
Autocorrelation analysis
An autocorrelation analysis can give evidence forclustering of air shower events and thus for thepresence of point sources, while it cannot deliverany information on the number or location of suchsources. For a given data set, the angular distancefor each combination of two events is calculated.The distribution of these is compared with one cre-
2222
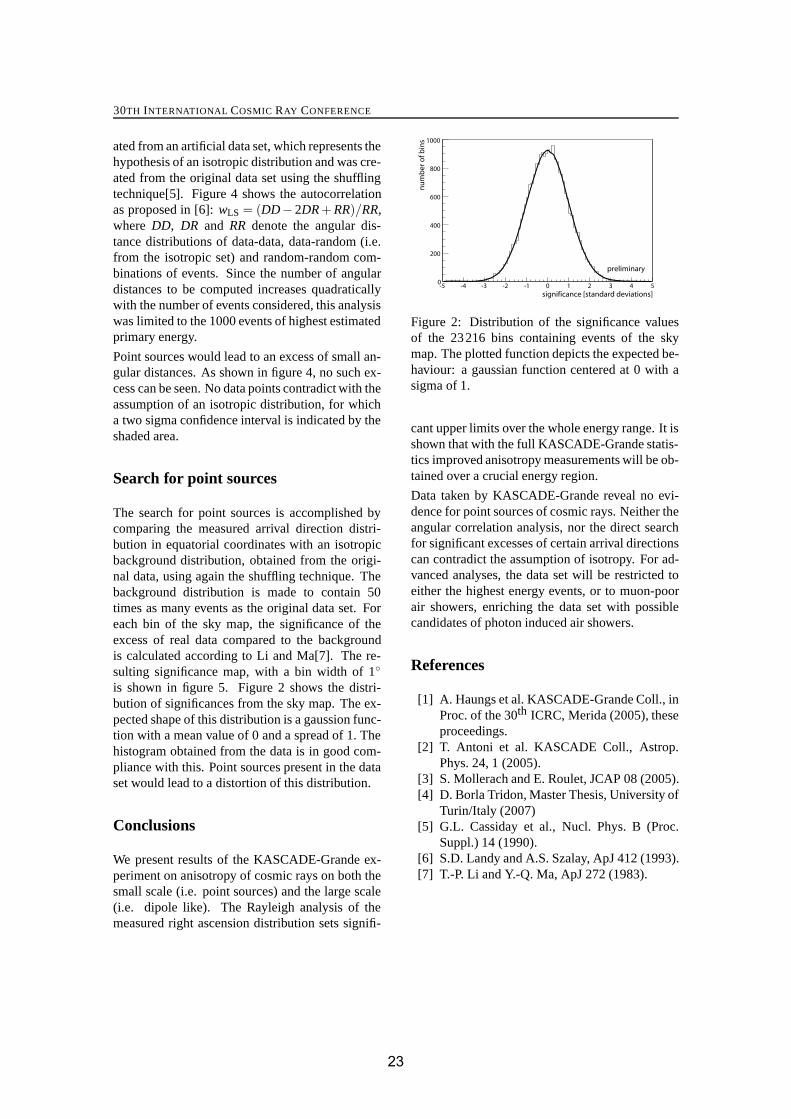
30TH INTERNATIONAL COSMIC RAY CONFERENCE
ated from an artificial data set, which represents thehypothesis of an isotropic distribution and was cre-ated from the original data set using the shufflingtechnique[5]. Figure 4 shows the autocorrelationas proposed in [6]: wLS = (DD− 2DR + RR)/RR,where DD, DR and RR denote the angular dis-tance distributions of data-data, data-random (i.e.from the isotropic set) and random-random com-binations of events. Since the number of angulardistances to be computed increases quadraticallywith the number of events considered, this analysiswas limited to the 1000 events of highest estimatedprimary energy.
Point sources would lead to an excess of small an-gular distances. As shown in figure 4, no such ex-cess can be seen. No data points contradict with theassumption of an isotropic distribution, for whicha two sigma confidence interval is indicated by theshaded area.
Search for point sources
The search for point sources is accomplished bycomparing the measured arrival direction distri-bution in equatorial coordinates with an isotropicbackground distribution, obtained from the origi-nal data, using again the shuffling technique. Thebackground distribution is made to contain 50times as many events as the original data set. Foreach bin of the sky map, the significance of theexcess of real data compared to the backgroundis calculated according to Li and Ma[7]. The re-sulting significance map, with a bin width of 1◦is shown in figure 5. Figure 2 shows the distri-bution of significances from the sky map. The ex-pected shape of this distribution is a gaussion func-tion with a mean value of 0 and a spread of 1. Thehistogram obtained from the data is in good com-pliance with this. Point sources present in the dataset would lead to a distortion of this distribution.
Conclusions
We present results of the KASCADE-Grande ex-periment on anisotropy of cosmic rays on both thesmall scale (i.e. point sources) and the large scale(i.e. dipole like). The Rayleigh analysis of themeasured right ascension distribution sets signifi-
-5 -4 -3 -2 -1 0 1 2 3 4 50
200
400
600
800
1000
significance [standard deviations]
num
bero
f bin
s
preliminary
Figure 2: Distribution of the significance valuesof the 23216 bins containing events of the skymap. The plotted function depicts the expected be-haviour: a gaussian function centered at 0 with asigma of 1.
cant upper limits over the whole energy range. It isshown that with the full KASCADE-Grande statis-tics improved anisotropy measurements will be ob-tained over a crucial energy region.
Data taken by KASCADE-Grande reveal no evi-dence for point sources of cosmic rays. Neither theangular correlation analysis, nor the direct searchfor significant excesses of certain arrival directionscan contradict the assumption of isotropy. For ad-vanced analyses, the data set will be restricted toeither the highest energy events, or to muon-poorair showers, enriching the data set with possiblecandidates of photon induced air showers.
References
[1] A. Haungs et al. KASCADE-Grande Coll., inProc. of the 30th ICRC, Merida (2005), theseproceedings.
[2] T. Antoni et al. KASCADE Coll., Astrop.Phys. 24, 1 (2005).
[3] S. Mollerach and E. Roulet, JCAP 08 (2005).[4] D. Borla Tridon, Master Thesis, University of
Turin/Italy (2007)[5] G.L. Cassiday et al., Nucl. Phys. B (Proc.
Suppl.) 14 (1990).[6] S.D. Landy and A.S. Szalay, ApJ 412 (1993).[7] T.-P. Li and Y.-Q. Ma, ApJ 272 (1983).
2323
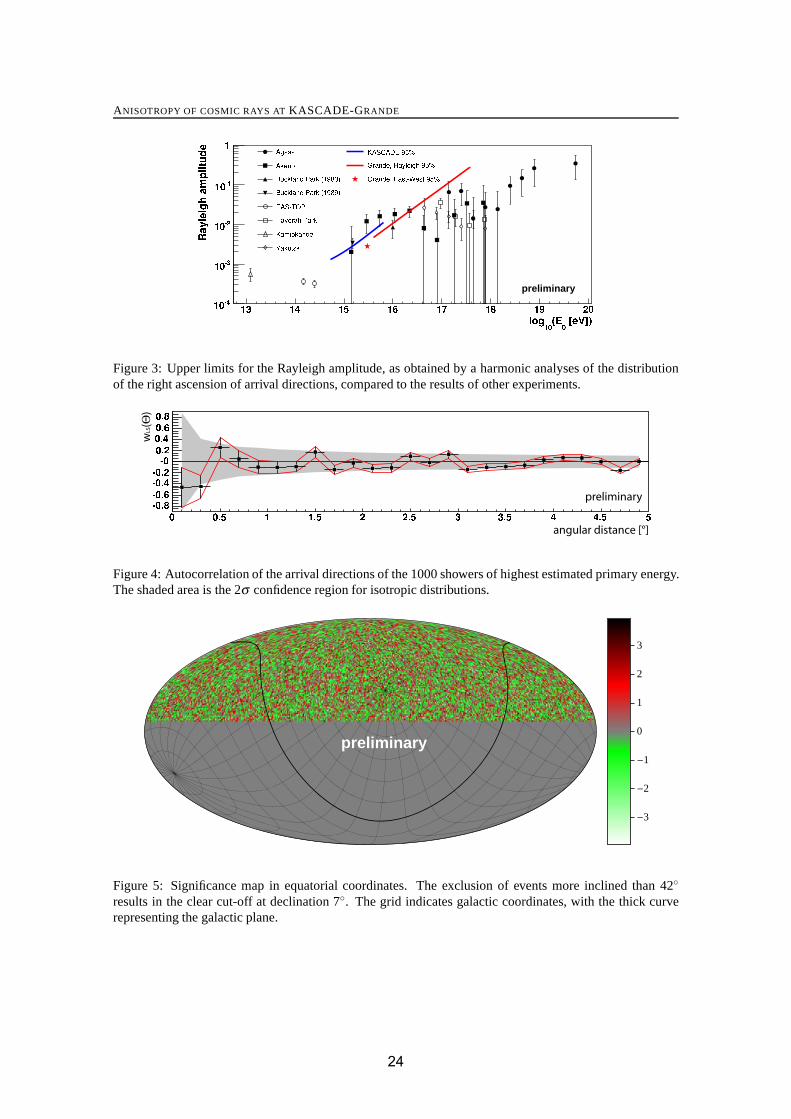
ANISOTROPY OF COSMIC RAYS AT KASCADE-GRANDE
preliminary
Figure 3: Upper limits for the Rayleigh amplitude, as obtained by a harmonic analyses of the distributionof the right ascension of arrival directions, compared to the results of other experiments.
angular distance [°]
preliminary
wL
S(Θ
)
Figure 4: Autocorrelation of the arrival directions of the 1000 showers of highest estimated primary energy.The shaded area is the 2σ confidence region for isotropic distributions.
−3
−2
−1
0
1
2
3
preliminary
Figure 5: Significance map in equatorial coordinates. The exclusion of events more inclined than 42◦results in the clear cut-off at declination 7◦. The grid indicates galactic coordinates, with the thick curverepresenting the galactic plane.
2424

30TH INTERNATIONAL COSMIC RAY CONFERENCE
The muon component of air showers measured by the KASCADE-Grande Experi-ment
V. DE SOUZAc , J. VAN BURENa , W.D. APELa, J.C. ARTEAGAa , F. BADEAa , K. BEKKa ,M. BERTAINAb, J. BLUMERa,c , H. BOZDOGa , I.M. BRANCUSd , M. BRUGGEMANNe , P. BUCHHOLZe ,A. CHIAVASSAb , F. COSSAVELLAc , K. DAUMILLERa, F. DI PIERROb , P. DOLLa, R. ENGELa,J. ENGLERa, M. FINGERc , D. FUHRMANNf , P.L. GHIAg , H.J. GILSa, R. GLASSTETTERf ,C. GRUPENe , A. HAUNGSa , D. HECKa , J.R. HORANDELc, T. HUEGEa, P.G. ISARa , K.-H. KAMPERTf ,D. KICKELBICKe , H.O. KLAGESa, Y. KOLOTAEVe, P. LUCZAKh, H.J. MATHESa, H.J. MAYERa ,C. MEURERa , J. MILKEa, B. MITRICAd , A. MORALESa, C. MORELLOg , G. NAVARRAb , S. NEHLSa,J. OEHLSCHLAGERa, S. OSTAPCHENKOa, S. OVERe , M. PETCUd , T. PIEROGa , S. PLEWNIAa,H. REBELa, M. ROTHa , H. SCHIELERa, O. SIMAi , M. STUMPERTc, G. TOMAd , G.C. TRINCHEROg ,H. ULRICHa , W. WALKOWIAKe , A. WEINDLa, J. WOCHELEa, J. ZABIEROWSKIh .a Institut fur Kernphysik, Forschungszentrum Karlsruhe, Germanyb Dipartimento di Fisica Generale dell’Universita Torino, Italyc Institut fur Experimentelle Kernphysik, Universitat Karlsruhe, Germanyd National Institute of Physics and Nuclear Engineering, Bucharest, Romaniae Fachbereich Physik, Universitat Siegen, Germanyf Fachbereich Physik, Universitat Wuppertal, Germanyg Istituto di Fisica dello Spazio Interplanetario, INAF Torino, Italyh Soltan Institute for Nuclear Studies, Lodz, Polandi Department of Physics, University of Bucharest, [email protected]
Abstract: KASCADE-Grande is a multi detector setup for the investigation of extensive air showersin the 1016 − 1018 eV energy range. With the Grande array it is possible to reconstruct the showercore position, the arrival direction and the total number of charged particles in the shower. The Grandearray measures in coincidence with the original KASCADE muon array consisting of 622 m2 shieldedscintillators. The data of the combined measurements are used to extract information from the muonicand eletromagnetic parts of the shower independently. In this paper, the muon density in a ring from 380to 400 m distance from the shower axis is studied and compared to predictions of hadronic interactionmodels. We report first results of these muon measurements at KASCADE-Grande which indicates theprimary composition evolution.
Introduction
The KASCADE-Grande experiment [1] has beenset up to measure primary cosmic rays in the en-ergy range from 1016 to 1018 eV. Its main goal isto study the expected knee of the iron component.These observations would confirm the hypothesisthat explains the proton knee of the primary cosmicrays spectrum at a few PeV and determine the as-
trophysical mechanism which operates in this en-ergy range.
The experiment is located at the Forschungszen-trum Karlsruhe, Germany, where, beside the ex-isting KASCADE [2] array, two new detector setups (Grande and Piccolo) have been installed. Theexperiment is able to sample different componentsof extensive air showers (electromagnetic, muonicand hadronic) with high accuracy and covering asurface of 0.5 km2. For an overview of the ac-
2525

KASCADE-GRANDE
Distance to shower axis (m)0 100 200 300 400 500 600 700
)-2
Mu
on
Den
sity
(m
-110
1
10 Sim. Proton (Median)
Sim. Iron (Median)
)σSim. Proton (
)σSim. Iron (
Data
) < 7.3e
7.0 < Log10(N
Figure 1: Density of muons as a function of thedistance from the shower axis. Only showers withzenith angle below 40◦ were used. Error bars rep-resent one sigma of the data distribution. See textfor details.
tual setup of the KASCADE-Grande Experimentsee ref. [8].
In this article we present studies of the muon com-ponent of the shower. The energy deposited bymuons can be measured by the KASCADE sta-tions separately from the electromagnetic compo-nent with a threshold of Eμ > 230 MeV for ver-tical muons. Muons are the messengers of thehadronic interactions of the particles in the showerand therefore are a powerful tool to determine theprimary particle mass and to study the hadronic in-teraction models.
Figure 1 shows the density of muons as a func-tion of the distance from the shower axis for eventswith total number of electron (Ne) in the range7.0 < Log10(Ne) < 7.3. The density of muons iscalculated for each shower as the sum of the signalmeasured by all stations in rings of 20 m divided bythe effective detection area of the stations. Similarplots were obtained for other Ne ranges.
In the same plot, two limits for iron and protonsimulations are also shown. The shaded area wasdetermined by taking the median of the iron (fullred line) and proton (full blue line) simulation.The dashed lines represents the simulation limitswhen the 16th quantile of the proton (dashed blueline) distribution and the 84th quantile of the iron(dashed red line) distribution were taken. It repre-sents the one sigma (σ ) limit of the simulation.
For all the studies in this paper we have usedthe CORSIKA [3] simulation program with
)-2Muon Density (m0 0.05 0.1 0.15 0.2 0.25 0.3 0.35 0.40
0.02
0.04
0.06
0.08
0.1
0.12
0.14
0.16
0.18
0.2
) < 6.3e
6.0 < Log10(N
380 < r < 400 m
Sim. Iron
Sim. Proton
Data
Figure 2: Density of muons in a ring from 380 to400 m distance from the shower axis. See text fordetails.
FLUKA [4] and QGSJetII [5] hadronic interactionmodels. CORSIKA showers are simulated throughthe detectors and reconstructed in the same way asthe measured data, such that a direct comparisonbetween data and simulation is possible.
In the following, the density of muons in the ringfrom 380 to 400 m distance from the shower axisis going to be studied in more details. This dis-tance range has been chosen in order to minimizethe fluctuation of the signal and the reconstructioninaccuracy and to maximize the number of show-ers for which we have data.
The evaluation of the density of muons in the ringfrom 380 to 400 m is going to be determined asa function of the total number of electrons in theshower and a comparison to simulations is goingto be shown.
Reconstruction Accuracy
The main parameters used in this study are the den-sity of muons and the total number of electrons inthe shower for which the reconstruction accuracyis going to be discussed below. For the reconstruc-tion accuracy of the shower geometry see ref. [7].
The density of muons is directly measured bythe KASCADE scintillators. These detectors areshielded by 10 cm of lead and 4 cm of iron, corre-sponding to 20 radiation lengths and a threshold of230 MeV for vertical muons. The error in the mea-surement of the energy deposit was experimentallydetermined to be smaller than 10% [2].
2626

30TH INTERNATIONAL COSMIC RAY CONFERENCE
)-2Muon Density (m0 0.2 0.4 0.6 0.8 1 1.2 1.40
0.02
0.04
0.06
0.08
0.1
0.12
Sim. Iron
Sim. Proton
Data
) < 7.3e
7.0 < Log10(N
380 < r < 400 m
Figure 3: Density of muons in a ring from 380 to400 m distance from the shower axis. See text fordetails.
The total number of electrons in the shower is re-constructed in a combined way using KASCADEand KASCADE-Grande stations. A lateral dis-tribution function (LDF) of the Lagutin type canbe fitted to the density of muons measured by theKASCADE detector [6]. After that, using the fit-ted function, the number of muons at any dis-tance from the shower axis can be estimated. TheKASCADE-Grande stations measure the numberof charged particles. The number of electrons ateach KASCADE-Grande stations is determined bysubtracting from the measured number of chargedparticles the number of muons estimated with theLDF fitted to the KASCADE stations.
At this stage, the number of electrons at eachKASCADE-Grande station is known. Latest, amodified NKG function is fitted to this data andthe total number of electrons is determined in thefit. The accuracy of the reconstruction of Ne canbe seen in ref. [9].
Quality cuts have been applied to the events in thisanalysis procedure. We have required the zenithangle to be smaller than 40 degrees and the eventshould have more than 19 KASCADE-Grande sta-tions with signal. The same quality cuts were ap-plied to the simulated events used for reconstruc-tion studies and to the data presented in the follow-ing section. After the quality cuts, the total num-ber of electrons can be estimated with a systematicshift smaller than 10% and a statistical uncertaintysmaller than 20% along the entire range consideredin this paper [9].
)-2Muon Density (m0 0.5 1 1.5 2 2.5 3 3.5 4 4.5 50
0.02
0.04
0.06
0.08
0.1
0.12
0.14
Sim. Iron
Sim. Proton
Data
) < 8.0e
7.7 < Log10(N
380 < r < 400 m
Figure 4: Density of muons in a ring from 380 to400 m distance from the shower axis. See text fordetails.
Data Analysis
All showers measured by KASCADE-Grandewhich survived the quality cuts explained abovehave their muon density measured as a function ofthe distance from the shower axis. The distribu-tions of the measured densities in a ring from 380to 400 meters distance from the axis are shown infigure 3,4 and 5 in comparison with simulation.
We show the distributions for three cuts in totalelectron number: 6.0 < Log10(Ne) < 6.3, 7.0 <Log10(Ne) < 7.3 and 7.7 < Log10(Ne) < 8.0 infigures 2, 3 and 4, respectively.
Figure 2 shows that the data could be better de-scribed by a proton dominant abundance at this Ne
selection. However, figures 3 and 4, with higherNe selections, show that the data could only bedescribed if a mixed composition is considered.From the three figures it is clear that an enhance-ment of the heavy component occurs with increas-ing Ne.
Figure 5 shows the evolution of the median muondensity as a function of Ne. Two limits for the sim-ulation are shown. The shaded area shows the lim-its determined by the median values of the proton(full blue line) and iron simulations (full red line).These limits can be used to visualize the evolutionof the primary composition.
The dashed lines delimit the one sigma range ofthe proton and iron simulations. For that, it wastaken the lower one sigma limit (16th quantile) ofthe proton (dashed blue line) distribution and the
2727

KASCADE-GRANDE
)e
Log10(N5 5.5 6 6.5 7 7.5 8
)-2
Mu
on
Den
sity
(m
-210
-110
1
380 < r < 400 m
Sim. Proton (Median)
Sim. Iron (Median)
)σSim. Proton (
)σSim. Iron (
Data
Figure 5: Muons density from 380 to 400 m distance from the shower axis as a function of total electronnumber. Error bars represent one sigma of the data distribution. See text for details.
upper one sigma limit (84th quantile) for the iron(dashed red line) distribution. These limits canbe used to understand the fluctuations of the datawhen compared to the simulation. Note that a com-bined proton and iron composition shows about thesame fluctuation of the data.
The change in slope seen in figure 6 forLog10(Ne) < 6.0 corresponds to the thresholdof the experiment and the fact that both data andsimulation shows the same behavior illustrates thegood level of understanding of our detectors. Forthe highest Ne values the simulations run out ofsufficient statistics.
Conclusions
The Grande array is in continuous and stable datataking since January 2004. In this article, we havebriefly described the procedure used to measurethe density of muons with the KASCADE arrayand studied its correlation with the total numberof electrons in the shower.
The density of muons in the shower is measured di-rectly by the KASCADE detectors. We have usedthis data to study the hadronic interaction model(QGSJetII) and the primary composition. The me-dian and the fluctuation of the density of muons ina ring from 380 to 400 m distance from the shower
axis lies within the limits of proton and iron sim-ulations calculated by CORSIKA-QGSJetII in therange 6.0 < Log10(Ne) < 8.0. We have alsoshown that this parameter can be used for compo-sition studies. A preliminary evolution from morelight to a more heavy composition with increasingNe was observed.
References
[1] A. Haungs et al. KASCADE-Grande Collab.,Proc. of 28th ICRC, Tsukuba (2003) 2, 985.
[2] T. Antoni et al. KASCADE Coll., Nucl. Instr.and Meth. A 513, 490 (2003).
[3] D. Heck et al., Report FZKA 6019 (1998)[4] G. Battistonia et al., ISVHECRI (2006) hep-
ph/0612075v1[5] S.S. Ostapchenko, Phys. Rev. D 74 (2006)
014026[6] J. van Buren et al. KASCADE-Grande Coll.,
Proc. 29th ICRC, Pune (2005)[7] J.C.Arteaga et al. KASCADE-Grande Coll.,
Proc. 30th ICRC, Merida (2007).[8] A. Haungs et al. KASCADE-Grande Coll.,
Proc. 30th ICRC, Merida (2007).[9] F. Cossavela et al. KASCADE-Grande Coll.,
Proc. 30th ICRC, Merida (2007).
2828
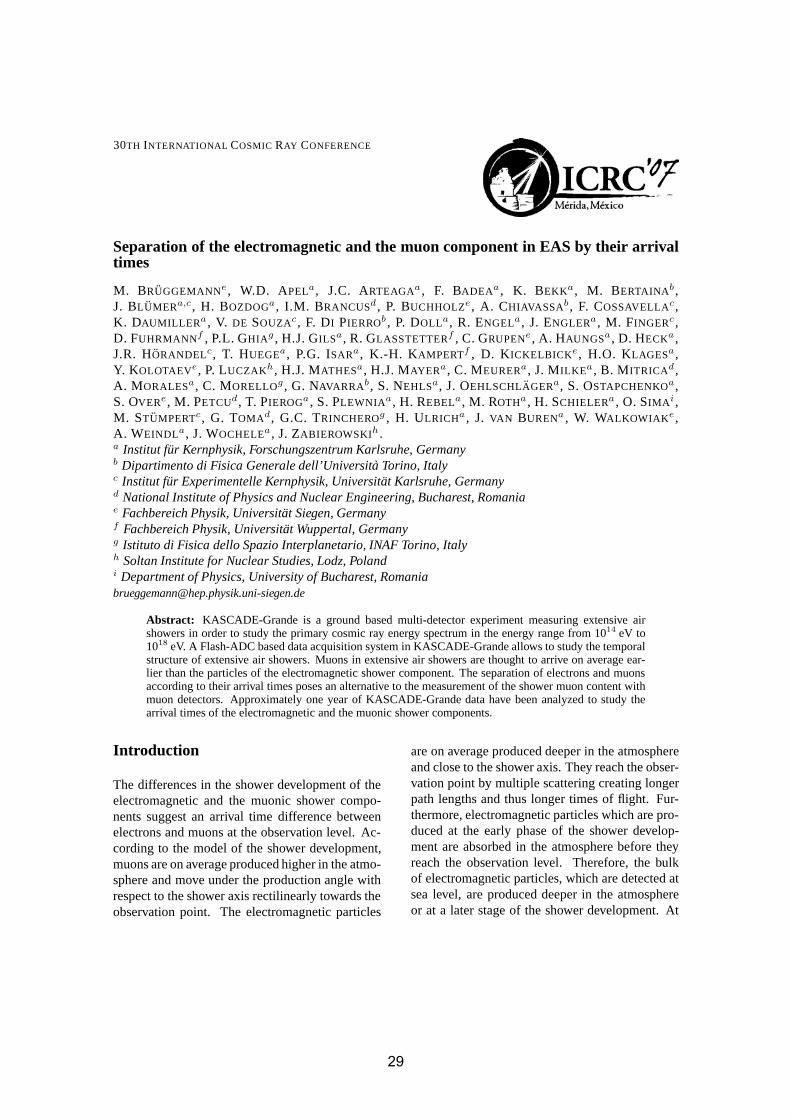
30TH INTERNATIONAL COSMIC RAY CONFERENCE
Separation of the electromagnetic and the muon component in EAS by their arrivaltimes
M. BRUGGEMANNe , W.D. APELa, J.C. ARTEAGAa , F. BADEAa , K. BEKKa, M. BERTAINAb ,J. BLUMERa,c , H. BOZDOGa, I.M. BRANCUSd , P. BUCHHOLZe , A. CHIAVASSAb , F. COSSAVELLAc ,K. DAUMILLERa , V. DE SOUZAc , F. DI PIERROb , P. DOLLa, R. ENGELa, J. ENGLERa, M. FINGERc ,D. FUHRMANNf , P.L. GHIAg , H.J. GILSa, R. GLASSTETTERf , C. GRUPENe , A. HAUNGSa , D. HECKa ,J.R. HORANDELc , T. HUEGEa, P.G. ISARa, K.-H. KAMPERTf , D. KICKELBICKe , H.O. KLAGESa,Y. KOLOTAEVe, P. LUCZAKh, H.J. MATHESa, H.J. MAYERa, C. MEURERa, J. MILKEa, B. MITRICAd ,A. MORALESa, C. MORELLOg , G. NAVARRAb , S. NEHLSa, J. OEHLSCHLAGERa, S. OSTAPCHENKOa,S. OVERe , M. PETCUd , T. PIEROGa , S. PLEWNIAa, H. REBELa, M. ROTHa , H. SCHIELERa , O. SIMAi ,M. STUMPERTc , G. TOMAd , G.C. TRINCHEROg , H. ULRICHa , J. VAN BURENa , W. WALKOWIAKe ,A. WEINDLa, J. WOCHELEa , J. ZABIEROWSKIh .a Institut fur Kernphysik, Forschungszentrum Karlsruhe, Germanyb Dipartimento di Fisica Generale dell’Universita Torino, Italyc Institut fur Experimentelle Kernphysik, Universitat Karlsruhe, Germanyd National Institute of Physics and Nuclear Engineering, Bucharest, Romaniae Fachbereich Physik, Universitat Siegen, Germanyf Fachbereich Physik, Universitat Wuppertal, Germanyg Istituto di Fisica dello Spazio Interplanetario, INAF Torino, Italyh Soltan Institute for Nuclear Studies, Lodz, Polandi Department of Physics, University of Bucharest, [email protected]
Abstract: KASCADE-Grande is a ground based multi-detector experiment measuring extensive airshowers in order to study the primary cosmic ray energy spectrum in the energy range from 1014 eV to1018 eV. A Flash-ADC based data acquisition system in KASCADE-Grande allows to study the temporalstructure of extensive air showers. Muons in extensive air showers are thought to arrive on average ear-lier than the particles of the electromagnetic shower component. The separation of electrons and muonsaccording to their arrival times poses an alternative to the measurement of the shower muon content withmuon detectors. Approximately one year of KASCADE-Grande data have been analyzed to study thearrival times of the electromagnetic and the muonic shower components.
Introduction
The differences in the shower development of theelectromagnetic and the muonic shower compo-nents suggest an arrival time difference betweenelectrons and muons at the observation level. Ac-cording to the model of the shower development,muons are on average produced higher in the atmo-sphere and move under the production angle withrespect to the shower axis rectilinearly towards theobservation point. The electromagnetic particles
are on average produced deeper in the atmosphereand close to the shower axis. They reach the obser-vation point by multiple scattering creating longerpath lengths and thus longer times of flight. Fur-thermore, electromagnetic particles which are pro-duced at the early phase of the shower develop-ment are absorbed in the atmosphere before theyreach the observation level. Therefore, the bulkof electromagnetic particles, which are detected atsea level, are produced deeper in the atmosphereor at a later stage of the shower development. At
2929

KASCADE-GRANDE
this point, the energy available for the produc-tion of secondaries has already decreased. Hence,the average kinetic energy of the electromagneticparticles is smaller than the kinetic energy of themuons. The resulting effect of the different de-velopment of the electromagnetic and the muonicshower components is that muons arrive earlier atthe observation level than particles of the electro-magnetic shower component. The difference in thearrival time increases with the radial distance fromthe shower core.
Analysis
In order to study particle arrival times withKASCADE-Grande, data from a Flash-ADC baseddata acquisition system have been analyzed. TheFADC system comprises 16 FADC modules of 8bit resolution and a sampling frequency of 1 GHz.The 16 FADC modules are installed in eight de-tector stations of the KASCADE detector array.The two modules per station are connected to theelectromagnetic and the muonic detectors in or-der to measure the electromagnetic and the muonicshower components separately. The FADC mod-ules digitize the full shape of the photomultipliersignal. In this way the arrival times of shower par-ticles at the detectors are being stored since the de-tector signal corresponds to a convolution of theparticle arrival time distribution with the singleparticle detector response. This means that an ex-traction of the particle arrival time distribution ispossible by applying an unfolding algorithm if thesingle particle detector response is known.
The single particle detector response has been de-termined by averaging single particle events fromusual air shower data. A single particle detectorresponse has been determined for the e/γ- and theμ-detector separately. The single particle detectorresponse is used to construct the response matrixfor the Gold unfolding algorithm. Figure 1 showsan example of an FADC pulse shape and the resultof the unfolding.
The data used to study the arrival times of showerparticles were recorded during approximately oneyear between January 2005 and February 2006.The minimum requirement for a data taking runto be analyzed was that at least the KASCADE
array, the Grande array and the Flash-ADC sys-tem participated in the data taking. From theseruns only showers were selected which had theirshower core reconstructed within a fiducial areaof 600 m×600 m around the center of the Grandearray, and which triggered at least 20 Grandedetector stations. To assure a high quality ofthe reconstructed shower observables only show-ers which had a zenith angle smaller than 30◦
were used for the analysis. In total, approxi-mately 290,000 extensive air showers measuredby KASCADE-Grande entered the analysis. Theused events belongs to primary energies of approx-imately 1016 eV –1018 eV. The signals in these se-lected air showers were only used for the analysisif no saturation occured and the KASCADE arraytime measurement of the corresponding detectorstations was available.
The signals which passed these quality require-ments were unfolded as described above. The re-sulting arrival time distributions were filled intooverall particle arrival time distributions. In or-der to study the temporal structure of the showercomponent in dependence on the distance from theshower center, the overall arrival time distributionswere created for 13 intervals of the distance fromthe shower core. As an example, the arrival timedistributions of electrons and muons are shown infigure 1. As the detectors for the electromagneticshower component are located above the detec-tors for the muonic shower component, the arrivaltime distributions of electrons contain also the ar-rival times generated by muons passing the elec-tromagnetic detector. This contribution had to besubtracted on a statistical basis by subtracting themuon arrival time distribution from the electron ar-rival time distribution after scaling down the muonarrival time distribution by the ratio of the elec-tron detector area and muon detector area. As anexample, the resulting particle arrival time distri-butions of electrons and muons are shown on theright hand side of figure 1 for the distance intervalR = (250 − 300) m.
Results
The arrival time distributions are used to gener-ate the time profile of the electromagnetic and the
3030
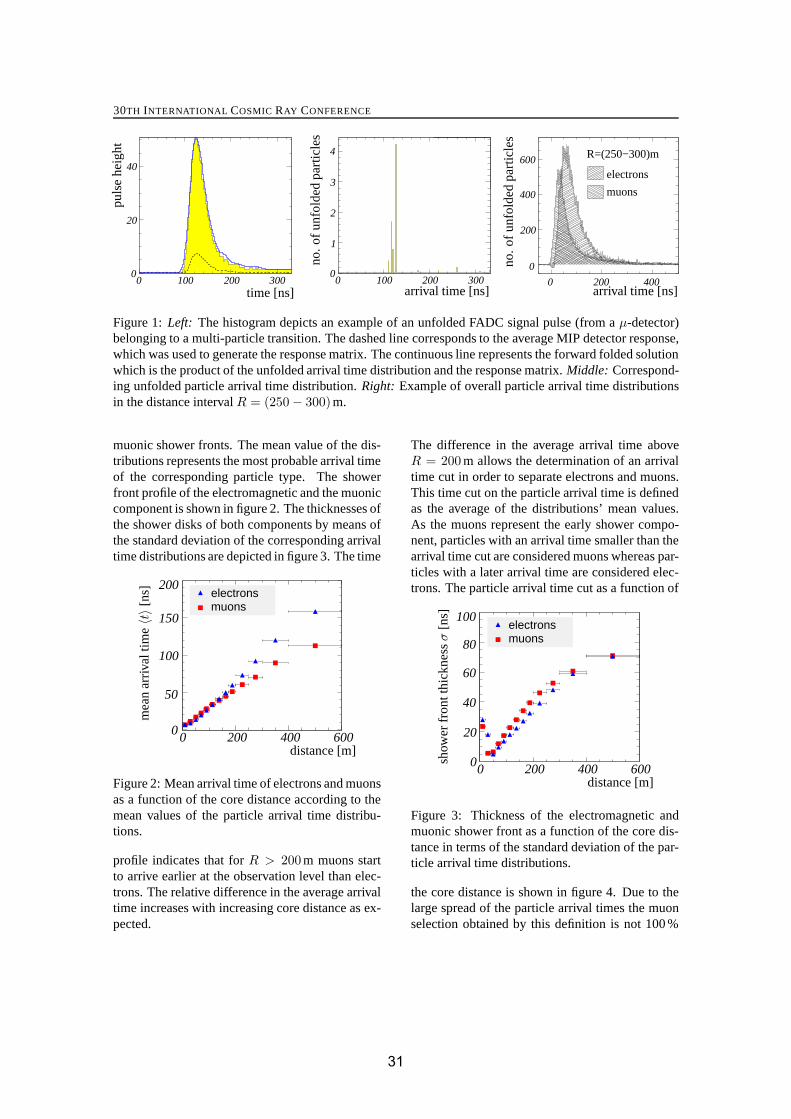
30TH INTERNATIONAL COSMIC RAY CONFERENCE
0 100 200 3000
20
40
0 100 200 3000
1
2
3
4
electrons
muons
0
400
600
200
0 200 400
R=(250−300)m
time [ns] arrival time [ns]arrival time [ns]
no.o
fun
fold
edpa
rtic
les
no.o
fun
fold
edpa
rtic
les
puls
ehe
ight
Figure 1: Left: The histogram depicts an example of an unfolded FADC signal pulse (from a μ-detector)belonging to a multi-particle transition. The dashed line corresponds to the average MIP detector response,which was used to generate the response matrix. The continuous line represents the forward folded solutionwhich is the product of the unfolded arrival time distribution and the response matrix. Middle: Correspond-ing unfolded particle arrival time distribution. Right: Example of overall particle arrival time distributionsin the distance interval R = (250 − 300)m.
muonic shower fronts. The mean value of the dis-tributions represents the most probable arrival timeof the corresponding particle type. The showerfront profile of the electromagnetic and the muoniccomponent is shown in figure 2. The thicknesses ofthe shower disks of both components by means ofthe standard deviation of the corresponding arrivaltime distributions are depicted in figure 3. The time
0 200 400 6000
50
100
150
200electronsmuons
distance [m]
mea
nar
riva
ltim
e〈t〉
[ns]
Figure 2: Mean arrival time of electrons and muonsas a function of the core distance according to themean values of the particle arrival time distribu-tions.
profile indicates that for R > 200 m muons startto arrive earlier at the observation level than elec-trons. The relative difference in the average arrivaltime increases with increasing core distance as ex-pected.
The difference in the average arrival time aboveR = 200 m allows the determination of an arrivaltime cut in order to separate electrons and muons.This time cut on the particle arrival time is definedas the average of the distributions’ mean values.As the muons represent the early shower compo-nent, particles with an arrival time smaller than thearrival time cut are considered muons whereas par-ticles with a later arrival time are considered elec-trons. The particle arrival time cut as a function of
0 200 400 6000
20
40
60
80
100electronsmuons
distance [m]
show
erfr
ontt
hick
ness
σ[n
s]
Figure 3: Thickness of the electromagnetic andmuonic shower front as a function of the core dis-tance in terms of the standard deviation of the par-ticle arrival time distributions.
the core distance is shown in figure 4. Due to thelarge spread of the particle arrival times the muonselection obtained by this definition is not 100 %
3131
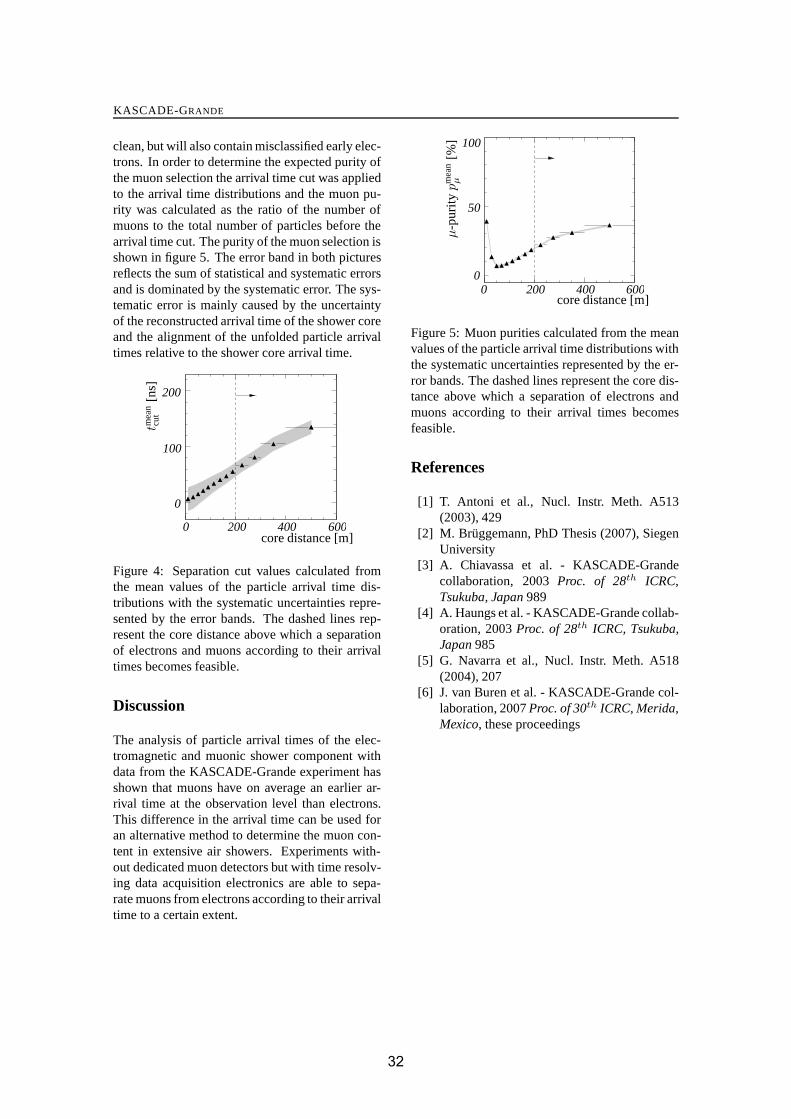
KASCADE-GRANDE
clean, but will also contain misclassified early elec-trons. In order to determine the expected purity ofthe muon selection the arrival time cut was appliedto the arrival time distributions and the muon pu-rity was calculated as the ratio of the number ofmuons to the total number of particles before thearrival time cut. The purity of the muon selection isshown in figure 5. The error band in both picturesreflects the sum of statistical and systematic errorsand is dominated by the systematic error. The sys-tematic error is mainly caused by the uncertaintyof the reconstructed arrival time of the shower coreand the alignment of the unfolded particle arrivaltimes relative to the shower core arrival time.
0 200 400 600
0
100
200
tmea
ncu
t[n
s]
core distance [m]
Figure 4: Separation cut values calculated fromthe mean values of the particle arrival time dis-tributions with the systematic uncertainties repre-sented by the error bands. The dashed lines rep-resent the core distance above which a separationof electrons and muons according to their arrivaltimes becomes feasible.
Discussion
The analysis of particle arrival times of the elec-tromagnetic and muonic shower component withdata from the KASCADE-Grande experiment hasshown that muons have on average an earlier ar-rival time at the observation level than electrons.This difference in the arrival time can be used foran alternative method to determine the muon con-tent in extensive air showers. Experiments with-out dedicated muon detectors but with time resolv-ing data acquisition electronics are able to sepa-rate muons from electrons according to their arrivaltime to a certain extent.
0 200 400 6000
50
100
core distance [m]
μ-p
urity
pm
ean
μ[%
]
Figure 5: Muon purities calculated from the meanvalues of the particle arrival time distributions withthe systematic uncertainties represented by the er-ror bands. The dashed lines represent the core dis-tance above which a separation of electrons andmuons according to their arrival times becomesfeasible.
References
[1] T. Antoni et al., Nucl. Instr. Meth. A513(2003), 429
[2] M. Bruggemann, PhD Thesis (2007), SiegenUniversity
[3] A. Chiavassa et al. - KASCADE-Grandecollaboration, 2003 Proc. of 28th ICRC,Tsukuba, Japan 989
[4] A. Haungs et al. - KASCADE-Grande collab-oration, 2003 Proc. of 28th ICRC, Tsukuba,Japan 985
[5] G. Navarra et al., Nucl. Instr. Meth. A518(2004), 207
[6] J. van Buren et al. - KASCADE-Grande col-laboration, 2007 Proc. of 30th ICRC, Merida,Mexico, these proceedings
3232

30TH INTERNATIONAL COSMIC RAY CONFERENCE
Muon Production Height in the Air-Shower Experiment KASCADE-Grande
P. DOLLa, W.D. APELa, J.C. ARTEAGAa, F. BADEAa , K. BEKKa , M. BERTAINAb , J. BLUMERa,c ,H. BOZDOGa , I.M. BRANCUSd , M. BRUGGEMANNe , P. BUCHHOLZe , A. CHIAVASSAb ,F. COSSAVELLAc , K. DAUMILLERa, V. DE SOUZAc , F. DI PIERROb , R. ENGELa, J. ENGLERa,M. FINGERc , D. FUHRMANNf , P.L. GHIAg , H.J. GILSa, R. GLASSTETTERf , C. GRUPENe ,A. HAUNGSa , D. HECKa , J.R. HORANDELc , T. HUEGEa, P.G. ISARa, K.-H. KAMPERTf ,D. KICKELBICKe , H.O. KLAGESa, Y. KOLOTAEVe, P. LUCZAKh, H.J. MATHESa, H.J. MAYERa ,C. MEURERa , J. MILKEa, B. MITRICAd , A. MORALESa, C. MORELLOg , G. NAVARRAb , S. NEHLSa,J. OEHLSCHLAGERa, S. OSTAPCHENKOa, S. OVERe , M. PETCUd , T. PIEROGa , S. PLEWNIAa,H. REBELa, M. ROTHa , H. SCHIELERa, O. SIMAi , M. STUMPERTc, G. TOMAd , G.C. TRINCHEROg ,H. ULRICHa , J. VAN BURENa , W. WALKOWIAKe , A. WEINDLa, J. WOCHELEa, J. ZABIEROWSKIh .a Institut fur Kernphysik, Forschungszentrum Karlsruhe, Germanyb Dipartimento di Fisica Generale dell’Universita Torino, Italyc Institut fur Experimentelle Kernphysik, Universitat Karlsruhe, Germanyd National Institute of Physics and Nuclear Engineering, Bucharest, Romaniae Fachbereich Physik, Universitat Siegen, Germanyf Fachbereich Physik, Universitat Wuppertal, Germanyg Istituto di Fisica dello Spazio Interplanetario, INAF Torino, Italyh Soltan Institute for Nuclear Studies, Lodz, Polandi Department of Physics, University of Bucharest, [email protected]
Abstract: A large area (128m2) Muon Tracking Detector (MTD), located within the KASCADE ex-periment, has been built with the aim to identify muons (Eμ >0.8GeV) and their directions in extensiveair showers by track measurements under more than 18 r.l. shielding. The orientation of the muon trackwith respect to the shower axis is expressed in terms of the radial- and tangential angles. By means oftriangulation the muon production height Hμ is determined. By means of Hμ, transition from light toheavy cosmic ray primary particle with increasing shower energy Eo from 1-10 PeV is observed.
Introduction
Muons have never been used up to now to recon-struct the hadron longitudinal development of EASwith sufficient accuracy, due to the difficulty ofbuilding large area ground-based telescopes [1].Muons are produced mainly by charged pions andkaons in a wide energy range. They must not al-ways be produced directly on the shower axis. Themultiple Coulomb scattering in the atmosphere andin the detector shielding also change the muon di-rection. It is evident that the reconstruction of thelongitudinal development of the muon componentby means of triangulation [2, 3] provides a power-
ful tool for primary mass measurement and for thestudy of high-energy hadron interactions with theatmospheric nuclei, giving the information simi-lar to that obtained with the Fly’s Eye experiment,but in the energy range not accessible by the de-tection of fluorescent light. Muon tracking allowsalso the study of hadron interactions by means ofthe muon pseudorapitity [4]. Already in the past,analytical tools have been developed which de-scribe the transformation between shower observ-ables recorded on the observation level and observ-ables which represent the longitudinal shower de-velopment [5]. Fig. 1 shows the experimental en-vironment.
3333

MUON PRODUCTION HEIGHT IN THE AIR-SHOWER EXPERIMENT KASCADE-GRANDE
x/m
-700 -600 -500 -400 -300 -200 -100 0 100
y/m
-700
-600
-500
-400
-300
-200
-100
0
100
KASCADEMuon Tracking Detector
CentralDetectorPiccolo
KASCADE-Grande
13 m
CENTRALDETECTOR
MUON TRACKING DETECTOR
200 m
200
m
2,4
m
ABSORBER
5,4 m
ARRAYCLUSTER
ARRAY DETECTOR
Figure 1: Schematic view of the KASCADE-Grande experiment with some details on the Muon TrackingDetector (MTD).
Muon Production Height over Electronand Muon Size
Usually, Xmax is the atmospheric depth at whichthe electrons and photons of the air shower reachtheir maximum numbers and is considered to bemass A sensitive [6]. Concerning muons whichstem dominantly from π± decays, the correspond-ing height where most muons are created may alsoprovide a mass A sensitive observable. For Xmax,Matthews [7] in a phenomenological ansatz givesfor the e.m. part the elongation rate of 85gcm−2
per decade (lg=log10) which is in a good agree-ment with simulations. For the Xmax value for nu-clei ref. [7] reports: XA
max = Xpmax − Xoln(A)
(Xo radiation length in air), therefore, Xmax fromiron showers is ∼ 150gcm−2 higher than Xmax
from proton showers at all energies. With the in-tegral number of muons for a proton or nucleus Ainduced shower:
Nμ ∼ Eβ0 or NA
μ ∼ A(EA/A)β (1)
andXmax ∼ lg(E0) (2)
we assume that 〈Hμ〉 exhibits a similar lg(Ne)and lg(N tr
μ ) dependence as Xmax. Note however,〈Hμ〉, because of the long tails in the Hμ distribu-tion towards small (gcm−2) can be systematically
higher than the muon production height, wheremost of the muons are created in a shower. Someenergetic muons may stem from the first interac-tion and survive down to the MTD detector plane.The elongation rate Dμ becomes
Dμ = δ〈Hμ〉/δlgNAμ (3)
The almost mass A independent energy assignmentin equation [4] was employed.
lgE0[GeV ] = 0.19lg(Ne) + 0.79lg(N trμ ) + 2.33
(4)The shower development leads also to differentfluctuations in those shower parameters.
For the following analysis the elongation rateDμ was given the value 70gcm−2 per decade inlg(N tr
μ ). After subtracting from each track the ’en-ergy’ dependent penetration depth
HAμ = Hμ−70gcm−2lg(N tr
μ )+20gcm−2lg(Ne)(5)
the remaining depth HAμ should be giving the mass
A dependence.
The correction with the electron size lg(Ne) inequation [5] should be of opposite sign because offluctuations to larger size for this variable (Xmax
also fluctuates to larger values).
Investigating in a closer look the distribution of theparameters involved in the correction for HA
μ for
3434
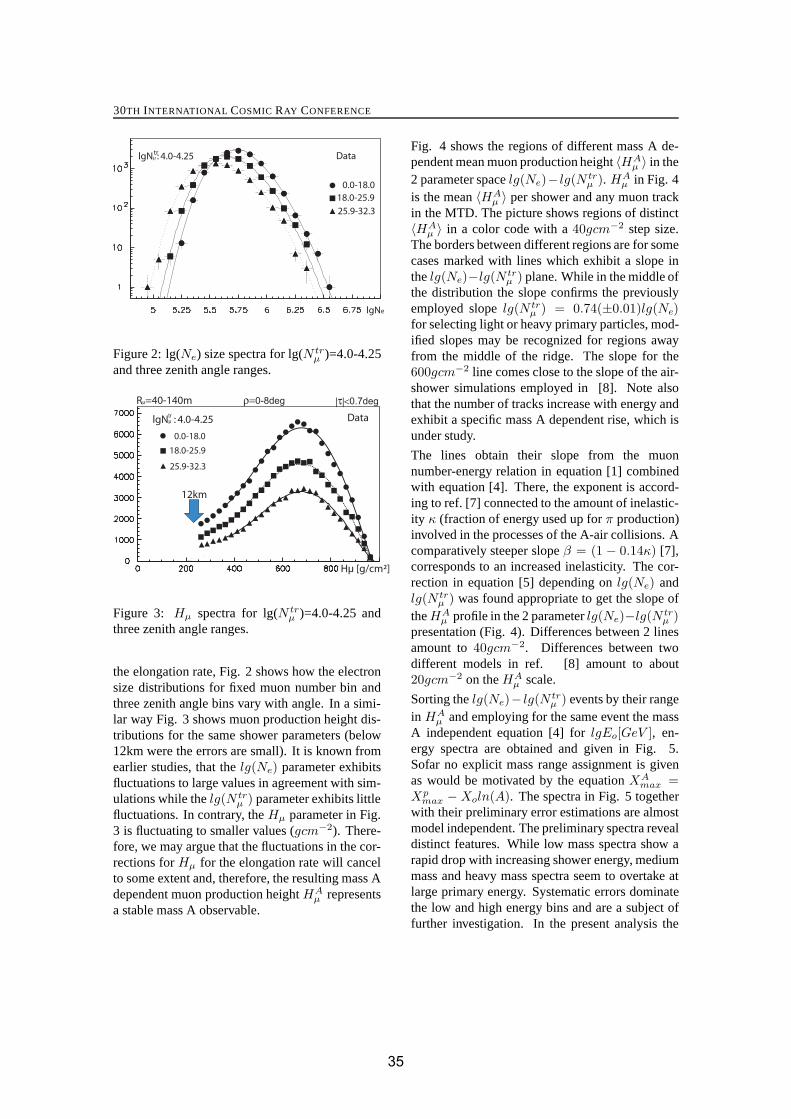
30TH INTERNATIONAL COSMIC RAY CONFERENCE
18.0-25.9
25.9-32.3
0.0-18.0
Data
lgNe
trlgNμ : 4.0-4.25
Figure 2: lg(Ne) size spectra for lg(N trμ )=4.0-4.25
and three zenith angle ranges.
25.9-32.3
18.0-25.9
0.0-18.0
Hμ [g/cm²]
Data
12km
Rμ=40-140m ρ=0-8deg |τ|<0.7degtrlgNμ : 4.0-4.25
Figure 3: Hμ spectra for lg(N trμ )=4.0-4.25 and
three zenith angle ranges.
the elongation rate, Fig. 2 shows how the electronsize distributions for fixed muon number bin andthree zenith angle bins vary with angle. In a simi-lar way Fig. 3 shows muon production height dis-tributions for the same shower parameters (below12km were the errors are small). It is known fromearlier studies, that the lg(Ne) parameter exhibitsfluctuations to large values in agreement with sim-ulations while the lg(N tr
μ ) parameter exhibits littlefluctuations. In contrary, the Hμ parameter in Fig.3 is fluctuating to smaller values (gcm−2). There-fore, we may argue that the fluctuations in the cor-rections for Hμ for the elongation rate will cancelto some extent and, therefore, the resulting mass Adependent muon production height HA
μ representsa stable mass A observable.
Fig. 4 shows the regions of different mass A de-pendent mean muon production height 〈HA
μ 〉 in the2 parameter space lg(Ne)− lg(N tr
μ ). HAμ in Fig. 4
is the mean 〈HAμ 〉 per shower and any muon track
in the MTD. The picture shows regions of distinct〈HA
μ 〉 in a color code with a 40gcm−2 step size.The borders between different regions are for somecases marked with lines which exhibit a slope inthe lg(Ne)−lg(N tr
μ ) plane. While in the middle ofthe distribution the slope confirms the previouslyemployed slope lg(N tr
μ ) = 0.74(±0.01)lg(Ne)for selecting light or heavy primary particles, mod-ified slopes may be recognized for regions awayfrom the middle of the ridge. The slope for the600gcm−2 line comes close to the slope of the air-shower simulations employed in [8]. Note alsothat the number of tracks increase with energy andexhibit a specific mass A dependent rise, which isunder study.
The lines obtain their slope from the muonnumber-energy relation in equation [1] combinedwith equation [4]. There, the exponent is accord-ing to ref. [7] connected to the amount of inelastic-ity κ (fraction of energy used up for π production)involved in the processes of the A-air collisions. Acomparatively steeper slope β = (1 − 0.14κ) [7],corresponds to an increased inelasticity. The cor-rection in equation [5] depending on lg(Ne) andlg(N tr
μ ) was found appropriate to get the slope ofthe HA
μ profile in the 2 parameter lg(Ne)−lg(N trμ )
presentation (Fig. 4). Differences between 2 linesamount to 40gcm−2. Differences between twodifferent models in ref. [8] amount to about20gcm−2 on the HA
μ scale.
Sorting the lg(Ne)− lg(N trμ ) events by their range
in HAμ and employing for the same event the mass
A independent equation [4] for lgEo[GeV ], en-ergy spectra are obtained and given in Fig. 5.Sofar no explicit mass range assignment is givenas would be motivated by the equation XA
max =Xp
max − Xoln(A). The spectra in Fig. 5 togetherwith their preliminary error estimations are almostmodel independent. The preliminary spectra revealdistinct features. While low mass spectra show arapid drop with increasing shower energy, mediummass and heavy mass spectra seem to overtake atlarge primary energy. Systematic errors dominatethe low and high energy bins and are a subject offurther investigation. In the present analysis the
3535

MUON PRODUCTION HEIGHT IN THE AIR-SHOWER EXPERIMENT KASCADE-GRANDE
7.0
6.0
5.0
4.0 4.5 5.0 5.5
lgN
e
lgNμ
0-18deg Rμ=40-140m
560
600
640
offset
640
600
ntracks
AHμ[g/cm²]
tr
Figure 4: lg(Ne) − lg(N trμ ) matrix with effective
muon production height HAμ along the z-axis.
0-18deg preliminary
logEo[GeV]
Hμ [g/cm²]
<540540-580580-620
>620
E d
N/d
E[cm
² sr
s G
eV ]
2.5
-1.5
-1 A
Figure 5: Energy spectra for different mass Agroups which produce muons at different effectivemuon production height HA
μ .
detection threshold of the MTD may be effectiveand a fraction of tracks may be missing leading toa light particle mass interpretation.
Conclusions
Triangulation allows to investigate Hμ. Futureanalysis of other shower angle bins and of largerand improved quality data sample will provide amore detailed information on the nature of high en-ergy shower muons. Also muon multiplicities pro-vide valuable parameters to derive the relative con-tributions of different primary cosmic ray particles.A natural extension towards even larger shower en-
ergies will be provided by KASCADE-Grande [9].There is a common understanding that the high en-ergy shower muons serve as sensitive probes to in-vestigate [4] the high energy hadronic interactionsin the EAS development. Very inclined muonswhich can be studied with tracks recorded by thewall modules of the MTD are currently of vital in-terest.
Acknowledgements
The support by the PPP-DAAD/MNiSW grant for2007-2008 is kindly acknowledged.
References
[1] P.Doll et al., Nucl.Instr.and Meth.A488 (2002) 517; J.Zabierowski and P.Doll.,Nucl.Instr.and Meth. A484 (2002) 528.
[2] M.Ambrosio et al., Nucl. Phys.(Proc.Suppl.)75A (1999) 312.
[3] R.Obenland et al., (KASCADE Coll.),Proc. 29th ICRC 2005, Pune, India Vol.6,225.
[4] J.Zabierowski et al., (KASCADE Coll.), Proc.29th ICRC 2005, Pune, India Vol.6,357;J.Zabierowski et al., (KASCADE Coll.), Proc.30th ICRC 2007, Merida, Mexico, these pro-ceedings.
[5] L.Pentchev and P.Doll, J.Phys.G:Nucl.Part.Phys. 27 (2001) 1459.
[6] J.Linsley,Proc.15th ICRC, 12 (1977) 89;T.K.Gaisser et al., Proc. 16th ICRC, 9(1979)258.
[7] J.Matthews, Astropart.Phys.22 (2005) 387[8] T. Antoni et al., (KASCADE Coll.), Astropart.
Phys. 24 (2005) 1.[9] A.Haungs et al., (KASCADE-Grande Coll.),
Proc. ISVHECRI, Weihei, Nucl.Phys.B, inpress.
3636
30TH INTERNATIONAL COSMIC RAY CONFERENCE
Tests of hadronic interaction models with muon pseudorapidities measured withKASCADE-Grande
J. ZABIEROWSKIa , W.D. APELb, J.C. ARTEAGAa, F. BADEAb , K. BEKKb, M. BERTAINAc ,J. BLUMERb,d , H. BOZDOGb , I.M. BRANCUSe , M. BRUGGEMANNf , P. BUCHHOLZf , A. CHIAVASSAc ,F. COSSAVELLAd , K. DAUMILLERb, V. DE SOUZAd, F. DI PIERROc , P. DOLLb, R. ENGELb,J. ENGLERb, M. FINGERd , D. FUHRMANNg , P.L. GHIAh, H.J. GILSb, R. GLASSTETTERg ,C. GRUPENf , A. HAUNGSb , D. HECKb , J.R. HORANDELd , T. HUEGEb, P.G. ISARb , K.-H. KAMPERTg ,D. KICKELBICKf , H.O. KLAGESb, Y. KOLOTAEVf , P. LUCZAKa , H.J. MATHESb, H.J. MAYERb ,C. MEURERb, J. MILKEb, B. MITRICAe , A. MORALESb, C. MORELLOh, G. NAVARRAc , S. NEHLSb,J. OEHLSCHLAGERb, S. OSTAPCHENKOb, S. OVERf , M. PETCUe , T. PIEROGb , S. PLEWNIAb,H. REBELb , M. ROTHb , H. SCHIELERb , O. SIMAi , M. STUMPERTd , G. TOMAe , G.C. TRINCHEROh ,H. ULRICHb , J. VAN BURENb , W. WALKOWIAKf , A. WEINDLb , J. WOCHELEb.a Soltan Institute for Nuclear Studies, Lodz, Polandb Institut fur Kernphysik, Forschungszentrum Karlsruhe, Germanyc Dipartimento di Fisica Generale dell’Universita Torino, Italyd Institut fur Experimentelle Kernphysik, Universitat Karlsruhe, Germanye National Institute of Physics and Nuclear Engineering, Bucharest, Romaniaf Fachbereich Physik, Universitat Siegen, Germanyg Fachbereich Physik, Universitat Wuppertal, Germanyh Istituto di Fisica dello Spazio Interplanetario, INAF Torino, Italyi Department of Physics, University of Bucharest, [email protected]
Abstract: The Muon Tracking Detector in the KASCADE-Grande experiment allows the measurement ofmuon directions up to 700 m from the shower center. It means, that nearly all muons produced in a showerand surviving to the ground level are subject of investigation. It is important not only for studying meanmuon production heights but also for investigations of EAS muon pseudorapidity distributions. Thesedistributions are nearly identical to the pseudorapidity distributions of their parent mesons produced inhadronic interactions. Lateral distribution of muon pseudorapidity in extensive air showers (EAS) isa sensitive probe of hadronic interaction parameters embedded in the models. In this quantity lateraldistribution of muon energy and lateral distribution of muon transverse momenta are hidden. Results ofthe analysis compared with the predictions of QGSJetII and FLUKA2002 models are discussed.
Introduction
The Muon Tracking Detector (MTD) [1] is oneof the detector components in the KASCADE-Grande experiment [2] operated on site of the Re-search Center Karlsruhe in Germany by an interna-tional collaboration. The MTD with its detectionacceptance of about 500 m2· sr measures in EAStracks of muons, which energy exceeds 0.8 GeV,with the excellent angular resolution of (≈ 0.35◦.
The layout of the experiment is shown in Fig. 1.
Muons are very sensitive probe of the processesresponsible for the development of an air showerin the atmosphere. They hardly interact and suf-fer only small deflection due to scattering in theair. Thus, in the directional information they con-serve some of the kinematic parameters of theirparent mesons - the most abundant products ofhadronic interactions. Despite significant progressover the last decade, these interactions, at the en-
3737

MUON PSEUDORAPIDITIES IN KASCADE-GRANDE
x/m
-700 -600 -500 -400 -300 -200 -100 0 100
y/m
-700
-600
-500
-400
-300
-200
-100
0
100
KASCADEMuon Tracking Detector
CentralDetectorPiccolo
KASCADE-Grande
13 m
CENTRALDETECTOR
MUON TRACKING DETECTOR
200 m
200
m
2,4
m
ABSORBER
5,4 m
ARRAYCLUSTER
ARRAY DETECTOR
Figure 1: Layout of the KASCADE-Grande experiment distributed over the Research Center Karlsruhe.KASCADE is situated in the North-East corner of the Center; note the position of the Muon TrackingDetector.
ergies and kinematical regions relevant for the de-velopment of EAS, are still not well understood,mainly due to the lack of direct accelerator mea-surements. Therefore, tests of the models with theEAS data are the only accessible means to improvethem.
Muon tracking
The muon tracking in KASCADE-Grande utilizesthe concept of radial (ρ) and tangential (τ ) angles(Fig. 2). The radial angle is a basic quantity in thedetermination of muon production heights [3]. Acombination of both angles, as shown in [4], al-low to determine the pseudorapidities of muons inEAS. Namely, a certain combination of τ and ρ isequal to the ratio of transversal to longitudinal mo-mentum components of the muon with respect tothe shower direction:
ζ ≡√
τ2 + ρ2 =pt
p‖(1)
Hence, the pseudorapidity η of muons with energy> 0.8 GeV (MTD threshold) can be expressed asfollows:
η = ln2 × p‖
pt≈ − ln
ζ
2(2)
tangentialplane
shower axis
detector
muon track
radial
plane
τ
ρ
OA
BPp
t
p||
D
Figure 2: Definition of radial and tangential angles.
This muon pseudorapidity is highly correlated withpseudorapidity of their parent hadrons [5], thus be-ing a powerful probe of high-energy hadronic in-teractions and can be used to test and improve ex-isting hadronic interaction models.
Results and discussion
In KASCADE-Grande we have measured muondirections up to 600 m distance from the showercore. As simulations show, we track in this waynearly all muons surviving to the observation level[6]. A very good probe of the hadronic interac-tion is the lateral distribution of mean radial angleand, finally, of mean muon pseudorapidity. This
3838
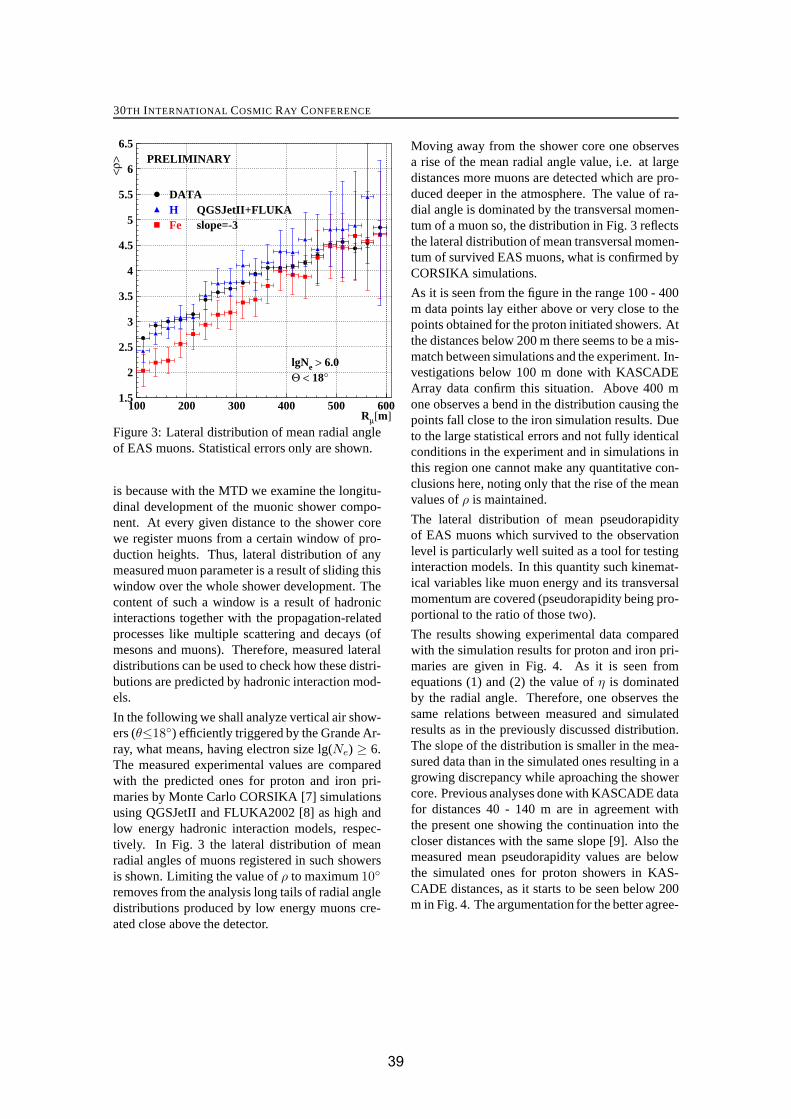
30TH INTERNATIONAL COSMIC RAY CONFERENCE
QGSJetII+FLUKAslope=-3
lgNe > 6.0Θ < 18°
<ρ>
Rμ[m]
PRELIMINARY
DATAHFe
1.5
2
2.5
3
3.5
4
4.5
5
5.5
6
6.5
100 200 300 400 500 600
Figure 3: Lateral distribution of mean radial angleof EAS muons. Statistical errors only are shown.
is because with the MTD we examine the longitu-dinal development of the muonic shower compo-nent. At every given distance to the shower corewe register muons from a certain window of pro-duction heights. Thus, lateral distribution of anymeasured muon parameter is a result of sliding thiswindow over the whole shower development. Thecontent of such a window is a result of hadronicinteractions together with the propagation-relatedprocesses like multiple scattering and decays (ofmesons and muons). Therefore, measured lateraldistributions can be used to check how these distri-butions are predicted by hadronic interaction mod-els.
In the following we shall analyze vertical air show-ers (θ≤18◦) efficiently triggered by the Grande Ar-ray, what means, having electron size lg(Ne) ≥ 6.The measured experimental values are comparedwith the predicted ones for proton and iron pri-maries by Monte Carlo CORSIKA [7] simulationsusing QGSJetII and FLUKA2002 [8] as high andlow energy hadronic interaction models, respec-tively. In Fig. 3 the lateral distribution of meanradial angles of muons registered in such showersis shown. Limiting the value of ρ to maximum 10◦
removes from the analysis long tails of radial angledistributions produced by low energy muons cre-ated close above the detector.
Moving away from the shower core one observesa rise of the mean radial angle value, i.e. at largedistances more muons are detected which are pro-duced deeper in the atmosphere. The value of ra-dial angle is dominated by the transversal momen-tum of a muon so, the distribution in Fig. 3 reflectsthe lateral distribution of mean transversal momen-tum of survived EAS muons, what is confirmed byCORSIKA simulations.
As it is seen from the figure in the range 100 - 400m data points lay either above or very close to thepoints obtained for the proton initiated showers. Atthe distances below 200 m there seems to be a mis-match between simulations and the experiment. In-vestigations below 100 m done with KASCADEArray data confirm this situation. Above 400 mone observes a bend in the distribution causing thepoints fall close to the iron simulation results. Dueto the large statistical errors and not fully identicalconditions in the experiment and in simulations inthis region one cannot make any quantitative con-clusions here, noting only that the rise of the meanvalues of ρ is maintained.
The lateral distribution of mean pseudorapidityof EAS muons which survived to the observationlevel is particularly well suited as a tool for testinginteraction models. In this quantity such kinemat-ical variables like muon energy and its transversalmomentum are covered (pseudorapidity being pro-portional to the ratio of those two).
The results showing experimental data comparedwith the simulation results for proton and iron pri-maries are given in Fig. 4. As it is seen fromequations (1) and (2) the value of η is dominatedby the radial angle. Therefore, one observes thesame relations between measured and simulatedresults as in the previously discussed distribution.The slope of the distribution is smaller in the mea-sured data than in the simulated ones resulting in agrowing discrepancy while aproaching the showercore. Previous analyses done with KASCADE datafor distances 40 - 140 m are in agreement withthe present one showing the continuation into thecloser distances with the same slope [9]. Also themeasured mean pseudorapidity values are belowthe simulated ones for proton showers in KAS-CADE distances, as it starts to be seen below 200m in Fig. 4. The argumentation for the better agree-
3939
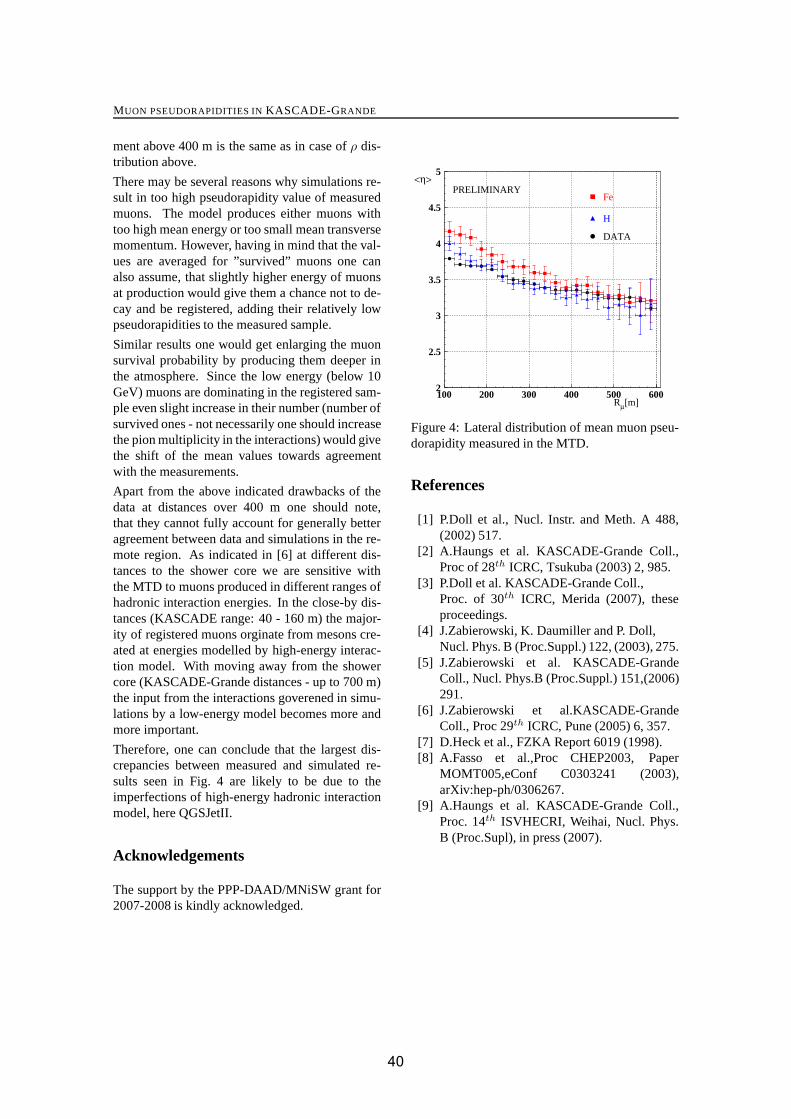
MUON PSEUDORAPIDITIES IN KASCADE-GRANDE
ment above 400 m is the same as in case of ρ dis-tribution above.
There may be several reasons why simulations re-sult in too high pseudorapidity value of measuredmuons. The model produces either muons withtoo high mean energy or too small mean transversemomentum. However, having in mind that the val-ues are averaged for ”survived” muons one canalso assume, that slightly higher energy of muonsat production would give them a chance not to de-cay and be registered, adding their relatively lowpseudorapidities to the measured sample.
Similar results one would get enlarging the muonsurvival probability by producing them deeper inthe atmosphere. Since the low energy (below 10GeV) muons are dominating in the registered sam-ple even slight increase in their number (number ofsurvived ones - not necessarily one should increasethe pion multiplicity in the interactions) would givethe shift of the mean values towards agreementwith the measurements.
Apart from the above indicated drawbacks of thedata at distances over 400 m one should note,that they cannot fully account for generally betteragreement between data and simulations in the re-mote region. As indicated in [6] at different dis-tances to the shower core we are sensitive withthe MTD to muons produced in different ranges ofhadronic interaction energies. In the close-by dis-tances (KASCADE range: 40 - 160 m) the major-ity of registered muons orginate from mesons cre-ated at energies modelled by high-energy interac-tion model. With moving away from the showercore (KASCADE-Grande distances - up to 700 m)the input from the interactions goverened in simu-lations by a low-energy model becomes more andmore important.
Therefore, one can conclude that the largest dis-crepancies between measured and simulated re-sults seen in Fig. 4 are likely to be due to theimperfections of high-energy hadronic interactionmodel, here QGSJetII.
Acknowledgements
The support by the PPP-DAAD/MNiSW grant for2007-2008 is kindly acknowledged.
<η>
Rμ[m]
PRELIMINARY
DATA
H
Fe
2
2.5
3
3.5
4
4.5
5
100 200 300 400 500 600
Figure 4: Lateral distribution of mean muon pseu-dorapidity measured in the MTD.
References
[1] P.Doll et al., Nucl. Instr. and Meth. A 488,(2002) 517.
[2] A.Haungs et al. KASCADE-Grande Coll.,Proc of 28th ICRC, Tsukuba (2003) 2, 985.
[3] P.Doll et al. KASCADE-Grande Coll.,Proc. of 30th ICRC, Merida (2007), theseproceedings.
[4] J.Zabierowski, K. Daumiller and P. Doll,Nucl. Phys. B (Proc.Suppl.) 122, (2003), 275.
[5] J.Zabierowski et al. KASCADE-GrandeColl., Nucl. Phys.B (Proc.Suppl.) 151,(2006)291.
[6] J.Zabierowski et al.KASCADE-GrandeColl., Proc 29th ICRC, Pune (2005) 6, 357.
[7] D.Heck et al., FZKA Report 6019 (1998).[8] A.Fasso et al.,Proc CHEP2003, Paper
MOMT005,eConf C0303241 (2003),arXiv:hep-ph/0306267.
[9] A.Haungs et al. KASCADE-Grande Coll.,Proc. 14th ISVHECRI, Weihai, Nucl. Phys.B (Proc.Supl), in press (2007).
4040
30TH INTERNATIONAL COSMIC RAY CONFERENCE
Reconstruction of primary mass group energy spectra with KASCADE
H. ULRICHa , W.D. APELa , J.C. ARTEAGAa , F. BADEAa , K. BEKKa , M. BERTAINAb ,
J. BLUMERa,c, H. BOZDOGa , I.M. BRANCUSd, M. BRUGGEMANNe , P. BUCHHOLZe , A. CHIAVASSAb ,
F. COSSAVELLAc , K. DAUMILLERa, V. DE SOUZAc, F. DI PIERROb , P. DOLLa, R. ENGELa ,
J. ENGLERa , M. FINGERc, D. FUHRMANNf , P.L. GHIAg , H.J. GILSa , R. GLASSTETTERf ,
C. GRUPENe, A. HAUNGSa , D. HECKa , J.R. HORANDELc , T. HUEGEa , P.G. ISARa, K.-H. KAMPERTf ,
D. KICKELBICKe , H.O. KLAGESa , Y. KOLOTAEVe, P. LUCZAKh, H.J. MATHESa , H.J. MAYERa ,
C. MEURERa , J. MILKEa , B. MITRICAd , A. MORALESa , C. MORELLOg , G. NAVARRAb , S. NEHLSa ,
J. OEHLSCHLAGERa , S. OSTAPCHENKOa , S. OVERe, M. PETCUd, T. PIEROGa , S. PLEWNIAa ,
H. REBELa , M. ROTHa , H. SCHIELERa , O. SIMAi, M. STUMPERTc , G. TOMAd, G.C. TRINCHEROg ,
J. VAN BURENa , W. WALKOWIAKe , A. WEINDLa , J. WOCHELEa, J. ZABIEROWSKIh .a Institut fur Kernphysik, Forschungszentrum Karlsruhe, Germanyb Dipartimento di Fisica Generale dell’Universita Torino, Italyc Institut fur Experimentelle Kernphysik, Universitat Karlsruhe, Germanyd National Institute of Physics and Nuclear Engineering, Bucharest, Romaniae Fachbereich Physik, Universitat Siegen, Germanyf Fachbereich Physik, Universitat Wuppertal, Germanyg Istituto di Fisica dello Spazio Interplanetario, INAF Torino, Italyh Soltan Institute for Nuclear Studies, Lodz, Polandi Department of Physics, University of Bucharest, [email protected]
Abstract: The KASCADE-Grande experiment was designed for the measurement of extensive air show-ers induced by cosmic rays of the knee region, i.e. with energies between 0.5 PeV and 1 EeV. Main focusof the experiment is the precise determination of energy and composition of the primary cosmic rays,thus clarifying the nature of the knee. Data of the preceding KASCADE experiment have been used ina composition analysis[1], proposing the knee to be caused by a steepening in the light-element spectra.Furthermore, the analysis identified insufficiencies of the simulations and the interaction models usedtherein in describing the considered data. In the following, an update on the analysis will be presented.
Introduction
Even though the majority of recent air shower ex-
periments aims at the highest energy (well above
1019 eV), the much lower PeV-range is still of con-
siderably interest. Here, at an energy of approx.
4 PeV, a sudden steepening of the energy spectrum
occurs, which is refered to as the so-called knee of
cosmic rays. Hypotheses for its origin range from
astrophysical scenarios, like changing acceleration
mechanisms or escape from the Galaxy, to parti-
cle physics models. For restricting or even reject-
ing different models, detailed knowledge about the
energy dependent chemical composition of cosmic
rays is necessary.
At present, measurements in the knee region are
only possible by the detection of extensive air
showers (EAS) induced by primary cosmic-ray
particles. While gaining statistical significance by
this approach, any reconstructed properties of the
primary particles have to rely on simulations and
the description of high energy hadronic interac-
tions used therein. By nature, these interaction
models have to be phenomenological and differ in
their predictions. In this sense any thorough anal-
4141

COMPOSITION ANALYSIS WITH KASCADE
ysis of EAS data offers the opportunity of testing
and improving high energy interaction models.
The KASCADE experiment[2], precursor and now
part of the KASCADE-Grande experiment[3],
aims at these questions. By analyzing the KAS-
CADE key observables (electron and muon shower
size) a strong dependence of the result for the ele-
mental abundances on the used interaction model
was demonstrated[1]. In addition, an insufficient
description of the data by the considered simula-
tions could be revealed.
In the following, an update on this composition
analysis is given with special emphasis on the in-
fluence of the low energy interaction model. Fur-
thermore, the analysis was repeated for data of dif-
ferent zenith angle intervals, thus testing for con-
sistency of the procedure. A brief discussion of the
properties of simulations using the new EPOS[4]
model finally concludes this article.
Outline of the analysis
Starting point for the analysis is the number of
measured EAS depending on electron number
lg Ne and muon number lg N trμ (muons with core
distances between 40 m and 200 m), the so-called
two-dimensional shower size spectrum. For show-
ers inside the KASCADE array and with inclina-
tion less than 18◦ this spectrum is also shown in
Fig. 3. The content Nj of each histogram cell j is
Nj = C
NA∑
A=1
∫ +∞
−∞
dJA
d lg EpA d lg E. (1)
C is a normalizing constant (time, aperture).
The sum is carried out over all primary parti-
cle types of mass A. The functions pA =pA(lg Ne,j , lg N tr
μ,j | lg E) give the probability for
an EAS of primary energy E and mass A to
be measured and reconstructed with shower sizes
Ne,j and N trμ,j . The probabilities pA include
shower fluctuations, efficiencies, and reconstruc-
tion systematics and resolution. For reasons of
clarity integration over solid angle and cell area is
omitted in Eqn. 1, but taken into account.
With this notation the two-dimensional size spec-
trum is interpreted as a set of coupled integral
equations. This set can be solved for the pri-
mary energy spectra dJA
d lg E by the application of
unfolding algorithms. In the analysis the parti-
cles H, He, C, Si, and Fe were chosen as repre-
sentatives for five mass groups of primary cosmic
ray particles. The corresponding probabilities pA
were determined by Monte Carlo simulations us-
ing COSRIKA[5] and a GEANT[6] based simula-
tion of the experiment. Details of the procedure
can be found in Ref.[1].
Using FLUKA instead of GHEISHA
In Ref.[1], the probabilities pA were deter-
mined using the high energy interaction mod-
els QGSJet[7] (2001 version) and SIBYLL[8]
2.1 in the simulations. In both cases low en-
ergy interactions (< 80 GeV) were modeled with
the GHEISHA[9] code. For the present analy-
sis, GHEISHA was replaced by the FLUKA[10]
package, and only the QGSJet 01 model was
used. Differences between these simulations are
rather small, with nearly energy and primary in-
dependent differences of Δ lg Ne ≈ 0.015 and
Δlg N trμ ≈ 0.02 (more electrons and less muons
with FLUKA).
Because of these small differences of the sim-
ulation predictions, it is not surprising, that the
results of the complete unfolding analysis differ
for the FLUKA case only little from those of
the GHEISHA case. As an example, the results
for the energy spectra of H, He, and C obtained
with GHEISHA and FLUKA are compared with
each other in Fig. 1. The differences between the
two solution sets are small, especially in compar-
ison with methodical uncertainties (shaded bands
in the figure). In case of the heavy elements (Si,
Fe) the influence is somewhat larger, but still of
same or smaller order than methodical uncertain-
ties. To summarize, the overall picture of the so-
lution seems to be affected insignificantly by using
FLUKA instead of GHEISHA.
Analysing data of different zenith angleranges
In the presented analysis only EAS with zenith an-
gles smaller than 18◦ were considered so far. Apart
from increasing statistics, the analysis of more in-
clined shower data could serve as a consistency
4242

30TH INTERNATIONAL COSMIC RAY CONFERENCE
Figure 1: Results for the energy spectra of
H, He, and C using QGSJet/FLUKA and
QGSJet/GHEISHA based simulations. Shaded
bands correspond to estimates of methodical un-
certainties for the QGSJet/GHEISHA spectra.
check. Since the data could not be described sat-
isfactorily by the simulations (see Ref.[1]), identi-
cal results compared to the vertical data set cannot
be expected. Nevertheless, strong and large differ-
ences between the solution sets would indicate a
severe problem in either the simulation code or the
applied analysis technique. For this kind of cross-
check the QGSJet/FLUKA analysis was repeated
for two more data sets of EAS with higher incli-
nation. In the first one considered zenith angles
range from 18◦ to 25.9◦, in the second from 25.9◦
to 32.3◦.
The results for the all-particle spectrum coincide
very well inside their statistical uncertainties, only
for the underlying mass group spectra small differ-
ences can be detected. For lack of space, only the
results for H and He are discussed in the following.
The spectra for Helium derived from the three data
sets coincide inside their statistical uncertainties,
as can be seen in Fig. 2. In the same figure, obvi-
ous systematic differences can be observed for the
proton spectra at energies above the proton knee.
Here, the change of index decreases with increas-
ing zenith angle, i.e. gets less pronounced.
The observed systematic deviations of the solution
sets to each other are small and can be understood
by the increasing shower fluctuations with increas-
Figure 2: Energy spectra of H and He based on
the analysis of EAS data originating from different
zenith angle intervals. For reasons of clarity esti-
mates of methodical uncertainties are omitted.
ing zenith angle and shifted energy threshold due
to the fixed data range in lg Ne and lg N trμ . There-
fore, no strong or unexplainable differences are
found, which would hint to severe problems in the
simulation or the analysis. Thus, conclusions[1]
drawn from the analysis of nearly vertical showers
are not affected.
New interaction model: EPOS
The most recent release of CORSIKA made the
new EPOS[4] model available for the simulation
of high energy hadronic interactions in EAS. Us-
ing the combination EPOS/FLUKA in CORSIKA
a set of EAS similar to the ones used in the pre-
sented analyses was generated. Of special inter-
est is the energy dependence of the shower fluctua-
tions sA(lg Ne, lg N trμ | lg E), describing the prob-
ability for an EAS of primary mass A and energy
lg E to exhibit electron size lg Ne and muon size
lg N trμ at observation level. Figure 3 compares the
positions of the maxima of these distributions for
proton and iron induced EAS using EPOS, QGSJet
01, and SIBYLL 2.1. For orientation, the two-
dimensional electron and muon size spectrum is
also shown.
It can be seen from the figure, that for each model
the lines, which correspond to the most probable
4343
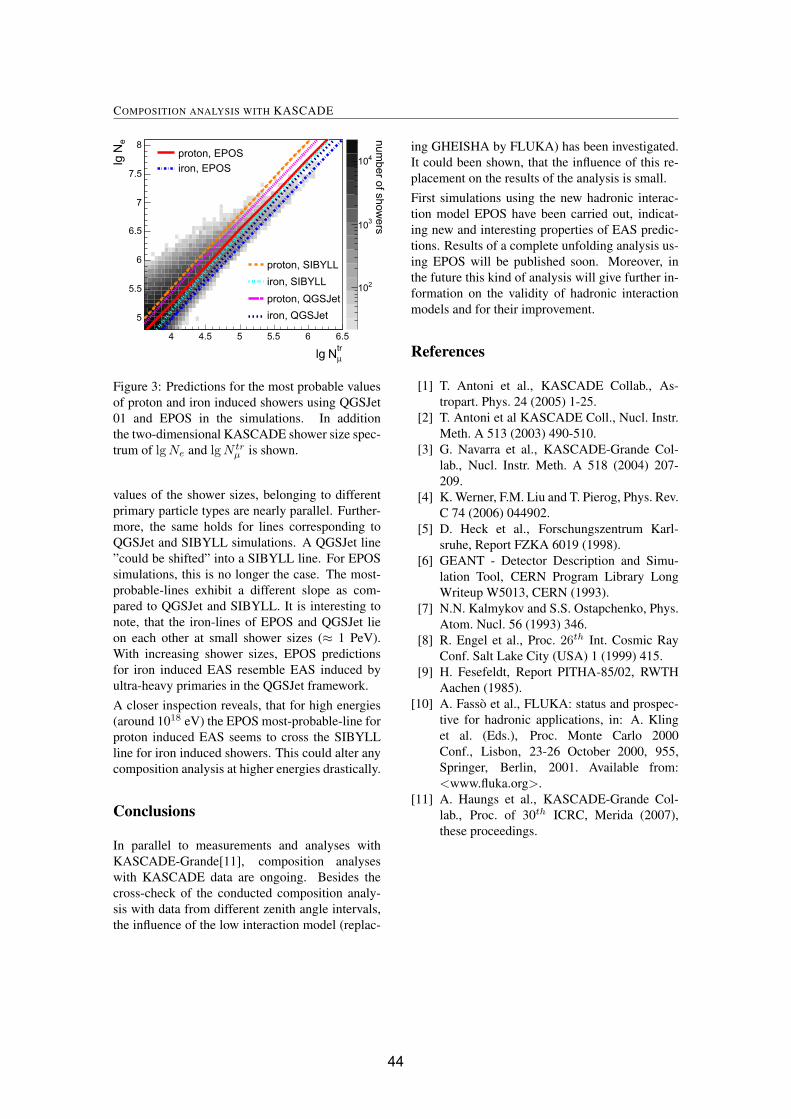
COMPOSITION ANALYSIS WITH KASCADE
Figure 3: Predictions for the most probable values
of proton and iron induced showers using QGSJet
01 and EPOS in the simulations. In addition
the two-dimensional KASCADE shower size spec-
trum of lg Ne and lg N trμ is shown.
values of the shower sizes, belonging to different
primary particle types are nearly parallel. Further-
more, the same holds for lines corresponding to
QGSJet and SIBYLL simulations. A QGSJet line
”could be shifted” into a SIBYLL line. For EPOS
simulations, this is no longer the case. The most-
probable-lines exhibit a different slope as com-
pared to QGSJet and SIBYLL. It is interesting to
note, that the iron-lines of EPOS and QGSJet lie
on each other at small shower sizes (≈ 1 PeV).
With increasing shower sizes, EPOS predictions
for iron induced EAS resemble EAS induced by
ultra-heavy primaries in the QGSJet framework.
A closer inspection reveals, that for high energies
(around 1018 eV) the EPOS most-probable-line for
proton induced EAS seems to cross the SIBYLL
line for iron induced showers. This could alter any
composition analysis at higher energies drastically.
Conclusions
In parallel to measurements and analyses with
KASCADE-Grande[11], composition analyses
with KASCADE data are ongoing. Besides the
cross-check of the conducted composition analy-
sis with data from different zenith angle intervals,
the influence of the low interaction model (replac-
ing GHEISHA by FLUKA) has been investigated.
It could been shown, that the influence of this re-
placement on the results of the analysis is small.
First simulations using the new hadronic interac-
tion model EPOS have been carried out, indicat-
ing new and interesting properties of EAS predic-
tions. Results of a complete unfolding analysis us-
ing EPOS will be published soon. Moreover, in
the future this kind of analysis will give further in-
formation on the validity of hadronic interaction
models and for their improvement.
References
[1] T. Antoni et al., KASCADE Collab., As-
tropart. Phys. 24 (2005) 1-25.
[2] T. Antoni et al KASCADE Coll., Nucl. Instr.
Meth. A 513 (2003) 490-510.
[3] G. Navarra et al., KASCADE-Grande Col-
lab., Nucl. Instr. Meth. A 518 (2004) 207-
209.
[4] K. Werner, F.M. Liu and T. Pierog, Phys. Rev.
C 74 (2006) 044902.
[5] D. Heck et al., Forschungszentrum Karl-
sruhe, Report FZKA 6019 (1998).
[6] GEANT - Detector Description and Simu-
lation Tool, CERN Program Library Long
Writeup W5013, CERN (1993).
[7] N.N. Kalmykov and S.S. Ostapchenko, Phys.
Atom. Nucl. 56 (1993) 346.
[8] R. Engel et al., Proc. 26th Int. Cosmic Ray
Conf. Salt Lake City (USA) 1 (1999) 415.
[9] H. Fesefeldt, Report PITHA-85/02, RWTH
Aachen (1985).
[10] A. Fasso et al., FLUKA: status and prospec-
tive for hadronic applications, in: A. Kling
et al. (Eds.), Proc. Monte Carlo 2000
Conf., Lisbon, 23-26 October 2000, 955,
Springer, Berlin, 2001. Available from:
<www.fluka.org>.
[11] A. Haungs et al., KASCADE-Grande Col-
lab., Proc. of 30th ICRC, Merida (2007),
these proceedings.
4444

30TH INTERNATIONAL COSMIC RAY CONFERENCE
Measurement of attenuation lengths of hadrons in air showers with KASCADE
D. HILDEBRANDc , W.D. APELa, J.C. ARTEAGAa, F. BADEAa , K. BEKKa, M. BERTAINAb ,J. BLUMERa,c , H. BOZDOGa, I.M. BRANCUSd , M. BRUGGEMANNe , P. BUCHHOLZe , A. CHIAVASSAb ,F. COSSAVELLAc , K. DAUMILLERa , V. DE SOUZAc , F. DI PIERROb , P. DOLLa, R. ENGELa,J. ENGLERa, M. FINGERc , D. FUHRMANNf , P.L. GHIAg , H.J. GILSa, R. GLASSTETTERf ,C. GRUPENe , A. HAUNGSa , D. HECKa, J.R. HORANDELc,j , T. HUEGEa, P.G. ISARa , K.-H. KAMPERTf , D. KICKELBICKe , H.O. KLAGESa, Y. KOLOTAEVe, P. LUCZAKh, H.J. MATHESa,H.J. MAYERa, C. MEURERa , J. MILKEa, B. MITRICAd , A. MORALESa, C. MORELLOg , G. NAVARRAb ,S. NEHLSa, J. OEHLSCHLAGERa, S. OSTAPCHENKOa, S. OVERe , M. PETCUd , T. PIEROGa ,S. PLEWNIAa, H. REBELa, M. ROTHa , H. SCHIELERa, O. SIMAi , M. STUMPERTc , G. TOMAd ,G.C. TRINCHEROg , H. ULRICHa , J. VAN BURENa , W. WALKOWIAKe , A. WEINDLa , J. WOCHELEa ,J. ZABIEROWSKIh .a Institut fur Kernphysik, Forschungszentrum Karlsruhe, Germany b Dipartimento di Fisica Generaledell’Universita Torino, Italy c Institut fur Experimentelle Kernphysik, Universitat Karlsruhe, Germany d
National Institute of Physics and Nuclear Engineering, Bucharest, Romania e Fachbereich Physik, Univer-sitat Siegen, Germany f Fachbereich Physik, Universitat Wuppertal, Germany g Istituto di Fisica delloSpazio Interplanetario, INAF Torino, Italy h Soltan Institute for Nuclear Studies, Lodz, Poland i Depart-ment of Physics, University of Bucharest, Romania j now at Radboud University Nijmegen, The [email protected]
Abstract: Different methods are applied to derive the attenuation lengths of hadrons in air showerswith the KASCADE experiment. A data set of unaccompanied hadrons is used (where only a hadron isregistered with a calorimeter) as well as full air showers, where also the number of electrons and muonsis registered with a field array. The different attenuation lengths obtained are discussed.
Introduction
The measurement of the attenuation lengths ofhadrons in air showers provides a suitable exper-imental access to the properties of high-energyhadronic interactions.
Main detector for the present analysis is the 16 ×20 m2 hadron calorimeter of the KASCADE ex-periment [3]. An iron sampling calorimeter com-prising of nine layers of liquid ionization cham-bers interspaced with absorbers of lead, iron, andconcrete. It measures the energy, as well as pointand angle of incidence for hadrons with energiesEh > 50 GeV. It has been calibrated at an acceler-ator beam [9]. In addition, for a part of the analy-ses discussed here the electromagnetic and muonic
(Eμ > 0.23 GeV) shower components are regis-tered with a 200 × 200 m2 scintillator array [1].
Different methods are discussed to derive attenua-tion lengths. The values obtained are not a prioricomparable to each other since they are based ondifferent definitions. The first part deals with unac-companied hadrons, i.e. only one hadron is regis-tered with the calorimeter, followed by an analysisof hadrons in air showers.
Unaccompanied Hadrons
For the following analyses the actual verti-cal thickness X0 of the atmosphere above theKASCADE experiment is needed. The aver-age ground pressure during the observation time
4545
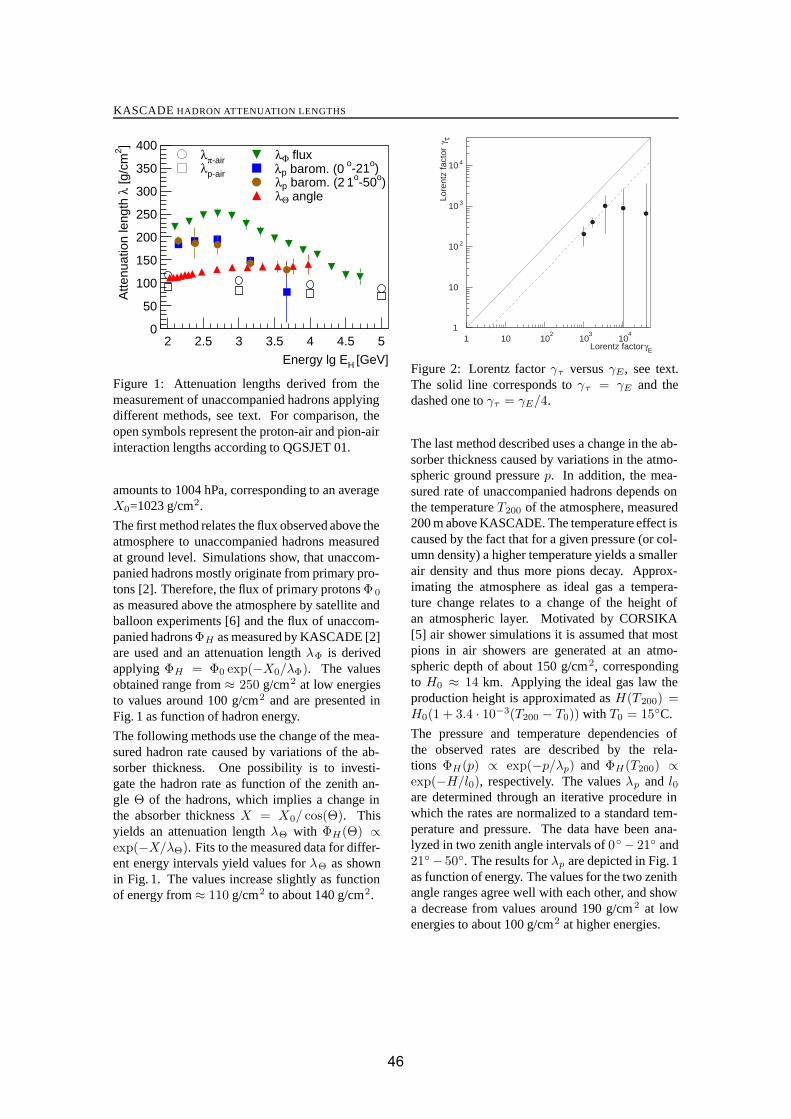
KASCADE HADRON ATTENUATION LENGTHS
Energy lg EH [GeV]
Atte
nuat
ion
leng
th λ
[g/c
m2 ]
λp barom. (0 o-21o)λp barom. (2 1o-50o)λΘ angle
λΦ fluxλπ-airλp-air
0
50
100
150
200
250
300
350
400
2 2.5 3 3.5 4 4.5 5
Figure 1: Attenuation lengths derived from themeasurement of unaccompanied hadrons applyingdifferent methods, see text. For comparison, theopen symbols represent the proton-air and pion-airinteraction lengths according to QGSJET 01.
amounts to 1004 hPa, corresponding to an averageX0=1023 g/cm2.
The first method relates the flux observed above theatmosphere to unaccompanied hadrons measuredat ground level. Simulations show, that unaccom-panied hadrons mostly originate from primary pro-tons [2]. Therefore, the flux of primary protons Φ 0
as measured above the atmosphere by satellite andballoon experiments [6] and the flux of unaccom-panied hadrons ΦH as measured by KASCADE [2]are used and an attenuation length λΦ is derivedapplying ΦH = Φ0 exp(−X0/λΦ). The valuesobtained range from ≈ 250 g/cm2 at low energiesto values around 100 g/cm2 and are presented inFig. 1 as function of hadron energy.
The following methods use the change of the mea-sured hadron rate caused by variations of the ab-sorber thickness. One possibility is to investi-gate the hadron rate as function of the zenith an-gle Θ of the hadrons, which implies a change inthe absorber thickness X = X0/ cos(Θ). Thisyields an attenuation length λΘ with ΦH(Θ) ∝exp(−X/λΘ). Fits to the measured data for differ-ent energy intervals yield values for λΘ as shownin Fig. 1. The values increase slightly as functionof energy from ≈ 110 g/cm2 to about 140 g/cm2.
Lorentz factor γE
Lore
ntz
fact
or γ
τ
1
10
10 2
10 3
10 4
1 10 102
103
104
Figure 2: Lorentz factor γτ versus γE , see text.The solid line corresponds to γτ = γE and thedashed one to γτ = γE/4.
The last method described uses a change in the ab-sorber thickness caused by variations in the atmo-spheric ground pressure p. In addition, the mea-sured rate of unaccompanied hadrons depends onthe temperature T200 of the atmosphere, measured200 m above KASCADE. The temperature effect iscaused by the fact that for a given pressure (or col-umn density) a higher temperature yields a smallerair density and thus more pions decay. Approx-imating the atmosphere as ideal gas a tempera-ture change relates to a change of the height ofan atmospheric layer. Motivated by CORSIKA[5] air shower simulations it is assumed that mostpions in air showers are generated at an atmo-spheric depth of about 150 g/cm2, correspondingto H0 ≈ 14 km. Applying the ideal gas law theproduction height is approximated as H(T200) =H0(1 + 3.4 · 10−3(T200 − T0)) with T0 = 15◦C.
The pressure and temperature dependencies ofthe observed rates are described by the rela-tions ΦH(p) ∝ exp(−p/λp) and ΦH(T200) ∝exp(−H/l0), respectively. The values λp and l0are determined through an iterative procedure inwhich the rates are normalized to a standard tem-perature and pressure. The data have been ana-lyzed in two zenith angle intervals of 0◦ − 21◦ and21◦− 50◦. The results for λp are depicted in Fig. 1as function of energy. The values for the two zenithangle ranges agree well with each other, and showa decrease from values around 190 g/cm2 at lowenergies to about 100 g/cm2 at higher energies.
4646
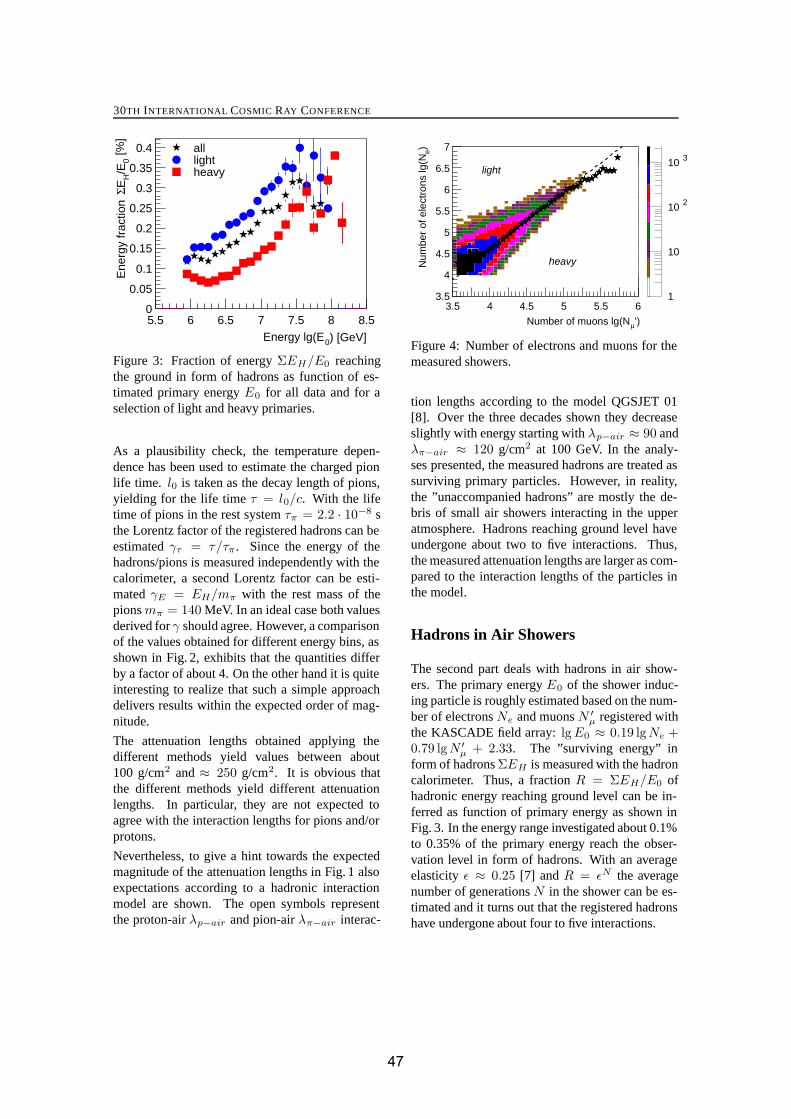
30TH INTERNATIONAL COSMIC RAY CONFERENCE
Energy lg(E0) [GeV]
Ene
rgy
frac
tion
ΣEH/E
0
alllightheavy
0
0.05
0.1
0.15
0.2
0.25
0.3
0.35
0.4
5.5 6 6.5 7 7.5 8 8.5
[%]
Figure 3: Fraction of energy ΣEH/E0 reachingthe ground in form of hadrons as function of es-timated primary energy E0 for all data and for aselection of light and heavy primaries.
As a plausibility check, the temperature depen-dence has been used to estimate the charged pionlife time. l0 is taken as the decay length of pions,yielding for the life time τ = l0/c. With the lifetime of pions in the rest system τπ = 2.2 · 10−8 sthe Lorentz factor of the registered hadrons can beestimated γτ = τ/τπ . Since the energy of thehadrons/pions is measured independently with thecalorimeter, a second Lorentz factor can be esti-mated γE = EH/mπ with the rest mass of thepions mπ = 140 MeV. In an ideal case both valuesderived for γ should agree. However, a comparisonof the values obtained for different energy bins, asshown in Fig. 2, exhibits that the quantities differby a factor of about 4. On the other hand it is quiteinteresting to realize that such a simple approachdelivers results within the expected order of mag-nitude.
The attenuation lengths obtained applying thedifferent methods yield values between about100 g/cm2 and ≈ 250 g/cm2. It is obvious thatthe different methods yield different attenuationlengths. In particular, they are not expected toagree with the interaction lengths for pions and/orprotons.
Nevertheless, to give a hint towards the expectedmagnitude of the attenuation lengths in Fig. 1 alsoexpectations according to a hadronic interactionmodel are shown. The open symbols representthe proton-air λp−air and pion-air λπ−air interac-
1
10
10 2
10 3
Number of muons lg(Nμ')
Num
ber
of e
lect
rons
lg(N
e)
3.5
4
4.5
5
5.5
6
6.5
7
3.53.75 4 4.254.5 4.75 5 5.25 5.55.75 6
light
heavy
Figure 4: Number of electrons and muons for themeasured showers.
tion lengths according to the model QGSJET 01[8]. Over the three decades shown they decreaseslightly with energy starting with λp−air ≈ 90 andλπ−air ≈ 120 g/cm2 at 100 GeV. In the analy-ses presented, the measured hadrons are treated assurviving primary particles. However, in reality,the ”unaccompanied hadrons” are mostly the de-bris of small air showers interacting in the upperatmosphere. Hadrons reaching ground level haveundergone about two to five interactions. Thus,the measured attenuation lengths are larger as com-pared to the interaction lengths of the particles inthe model.
Hadrons in Air Showers
The second part deals with hadrons in air show-ers. The primary energy E0 of the shower induc-ing particle is roughly estimated based on the num-ber of electrons Ne and muons N ′
μ registered withthe KASCADE field array: lg E0 ≈ 0.19 lgNe +0.79 lgN ′
μ + 2.33. The ”surviving energy” inform of hadrons ΣEH is measured with the hadroncalorimeter. Thus, a fraction R = ΣEH/E0 ofhadronic energy reaching ground level can be in-ferred as function of primary energy as shown inFig. 3. In the energy range investigated about 0.1%to 0.35% of the primary energy reach the obser-vation level in form of hadrons. With an averageelasticity ε ≈ 0.25 [7] and R = εN the averagenumber of generations N in the shower can be es-timated and it turns out that the registered hadronshave undergone about four to five interactions.
4747
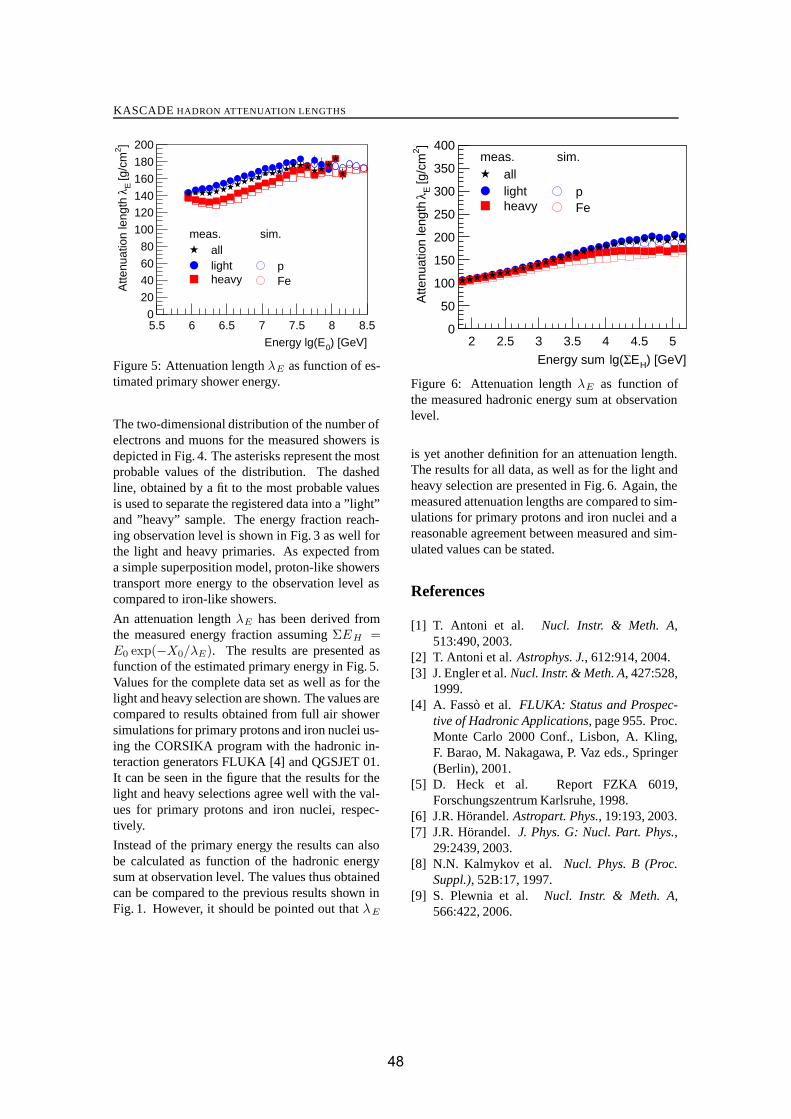
KASCADE HADRON ATTENUATION LENGTHS
Energy lg(E0) [GeV]
Atte
nuat
ion
leng
th λ
E [g
/cm
2 ]
0
20
4060
80
100
120140
160
180
200
5.5 6 6.5 7 7.5 8 8.5
plightFeheavy
allmeas. sim.
Figure 5: Attenuation length λE as function of es-timated primary shower energy.
The two-dimensional distribution of the number ofelectrons and muons for the measured showers isdepicted in Fig. 4. The asterisks represent the mostprobable values of the distribution. The dashedline, obtained by a fit to the most probable valuesis used to separate the registered data into a ”light”and ”heavy” sample. The energy fraction reach-ing observation level is shown in Fig. 3 as well forthe light and heavy primaries. As expected froma simple superposition model, proton-like showerstransport more energy to the observation level ascompared to iron-like showers.
An attenuation length λE has been derived fromthe measured energy fraction assuming ΣEH =E0 exp(−X0/λE). The results are presented asfunction of the estimated primary energy in Fig. 5.Values for the complete data set as well as for thelight and heavy selection are shown. The values arecompared to results obtained from full air showersimulations for primary protons and iron nuclei us-ing the CORSIKA program with the hadronic in-teraction generators FLUKA [4] and QGSJET 01.It can be seen in the figure that the results for thelight and heavy selections agree well with the val-ues for primary protons and iron nuclei, respec-tively.
Instead of the primary energy the results can alsobe calculated as function of the hadronic energysum at observation level. The values thus obtainedcan be compared to the previous results shown inFig. 1. However, it should be pointed out that λE
Energy sum lg(ΣEH) [GeV]
Atte
nuat
ion
leng
th λ
E [g
/cm
2 ]
0
50
100
150
200
250
300
350
400
2 2.5 3 3.5 4 4.5 5
plightFeheavy
allmeas. sim.
Figure 6: Attenuation length λE as function ofthe measured hadronic energy sum at observationlevel.
is yet another definition for an attenuation length.The results for all data, as well as for the light andheavy selection are presented in Fig. 6. Again, themeasured attenuation lengths are compared to sim-ulations for primary protons and iron nuclei and areasonable agreement between measured and sim-ulated values can be stated.
References
[1] T. Antoni et al. Nucl. Instr. & Meth. A,513:490, 2003.
[2] T. Antoni et al. Astrophys. J., 612:914, 2004.[3] J. Engler et al. Nucl. Instr. & Meth. A, 427:528,
1999.[4] A. Fasso et al. FLUKA: Status and Prospec-
tive of Hadronic Applications, page 955. Proc.Monte Carlo 2000 Conf., Lisbon, A. Kling,F. Barao, M. Nakagawa, P. Vaz eds., Springer(Berlin), 2001.
[5] D. Heck et al. Report FZKA 6019,Forschungszentrum Karlsruhe, 1998.
[6] J.R. Horandel. Astropart. Phys., 19:193, 2003.[7] J.R. Horandel. J. Phys. G: Nucl. Part. Phys.,
29:2439, 2003.[8] N.N. Kalmykov et al. Nucl. Phys. B (Proc.
Suppl.), 52B:17, 1997.[9] S. Plewnia et al. Nucl. Instr. & Meth. A,
566:422, 2006.
4848
30TH INTERNATIONAL COSMIC RAY CONFERENCE
Investigations of the lateral extension of radio emission in air showers by LOPES30measurements
S. NEHLSa, W.D. APELa, J.C. ARTEAGAa, T. ASCHb , J. AUFFENBERGc , F. BADEAa , L. BAHRENd ,
K. BEKKa , M. BERTAINAe , P.L. BIERMANNf , J. BLUMERa,g , H. BOZDOGa , I.M. BRANCUSh ,
M. BRUGGEMANNi , P. BUCHHOLZi , S. BUITINKj , H. BUTCHERd , A. CHIAVASSAe , F. COSSAVELLAg ,
K. DAUMILLERa , V. DE SOUZAg , F. DI PIERROe , P. DOLLa, R. ENGELa, H. FALCKEd,j ,
H. GEMMEKEb, P.L. GHIAk , R. GLASSTETTERc, C. GRUPENi , A. HAUNGSa , D. HECKa ,
J.R. HORANDELj , A. HORNEFFERj , T. HUEGEa, P.G. ISARa, K.-H. KAMPERTc , D. KICKELBICKi ,
Y. KOLOTAEVi, O. KROMERb , J. KUIJPERSj , S. LAFEBREj , P. LUCZAKl , H.J. MATHESa,
H.J. MAYERa , C. MEURERa, J. MILKEa, B. MITRICAh , C. MORELLOk , G. NAVARRAe , A. NIGLj ,
J. OEHLSCHLAGERa, S. OSTAPCHENKOa, S. OVERi , M. PETCUh, J. PETROVICj , T. PIEROGa ,
S. PLEWNIAa, J. RAUTENBERGc , H. REBELa , M. ROTHa , H. SCHIELERa, O. SIMAm , K. SINGHj ,
M. STUMPERTg , G. TOMAh, G.C. TRINCHEROk , H. ULRICHa , J. VAN BURENa , W. WALKOWIAKi ,
A. WEINDLa, J. WOCHELEa , J. ZABIEROWSKIl , J.A. ZENSUSf .a Institut fur Kernphysik, Forschungszentrum Karlsruhe, Germanyb Inst. Prozessdatenverarbeitung und Elektronik, Forschungszentrum Karlsruhe, Germanyc Fachbereich Physik, Universitat Wuppertal, Germanyd ASTRON, Dwingeloo, The Netherlandse Dipartimento di Fisica Generale dell’Universita Torino, Italyf Max-Planck-Institut fur Radioastronomie Bonn, Germanyg Institut fur Experimentelle Kernphysik, Universitat Karlsruhe, Germanyh National Institute of Physics and Nuclear Engineering Bucharest, Romaniai Fachbereich Physik, Universitat Siegen, Germanyj Dept. of Astrophysics, Radboud University Nijmegen, The Netherlandsk Istituto di Fisica dello Spazio Interplanetario, INAF Torino, Italyl Soltan Institute for Nuclear Studies Lodz, Polandm Department of Physics, University of Bucharest, [email protected]
Abstract: The antenna field of LOPES uses inverted V-shaped dipole antennas to measure radio signalsoriginating from extensive air showers (EAS). The LOPES antennas are measuring in coincidence withthe air shower experiment KASCADE-Grande. For roughly one year data in the frequency range from40–80 MHz were taken, having 30 linearly polarized antennas oriented to East-West. In this data set theEast-West polarization only was measured in order to investigate in detail the lateral extension of the radioemission. By using an external source all antennas have an absolute amplitude calibration, i.e. a frequencydependent correction factor allows to reconstruct the electric field strength of the radio emission. For firstanalyses, in particlular air showers with a high signal-to-noise ratio, data are used to investigate the lateraldistribution, which shows an exponential decrease.
Introduction
The LOPES experiment was set up at the site of
KASCADE-Grande [1] to confirm the principle of
radio detection of air showers [2] and the theory of
geosynchrotron radiation [3] as dominant emission
process in the frequency range below a few hun-
dred Megahertz. The KASCADE-Grande experi-
ment is measuring EAS in the energy range 1014–
4949

LATERAL DISTRIBUTION INVESTIGATIONS
1018 eV. LOPES and KASCADE-Grande experi-
ment are measuring in coincidence the radio emis-
sion of EAS, implemented by an external trigger-
ing for LOPES. The LOPES experiment uses in-
verted vee-shaped dipole antennas. For the detec-
tion of radio signals from 40 to 80 MHz was cho-
sen in order to avoid most of the radio frequency
interference (RFI) being present at the location.
In a first construction phase (LOPES10), 10 anten-
nas were taking a sufficiently large data set for de-
tailed investigations [2] of the relation between de-
tected radio pulses and air shower reconstruction
parameters, provided by KASCADE-Grande.
In a next construction phase (LOPES30), the num-
ber of antennas and the baseline were increased.
In addition an absolute amplitude calibration was
performed to reconstruct the electric field strength
at each individual antenna. For both phases only
the East-West polarization direction was measured.
Meanwhile in a third phase dual polarization mea-
surements are performed.
Calibration
The amplitude calibration uses a reference source
(VSQ) of known electric field strength at a certain
distance. Each LOPES30 radio antenna is cali-
brated at its location inside the KASCADE-Array
and therefore this calibration includes all environ-
mental effects, like ground characteristics, temper-
ature effects, or setup systematics. The power to
be received from the radio antenna in calibration
mode is compared with the power recorded in the
LOPES electronics PM. With the relation:
V (ν) =(
4πrν
c
)2
· PM (ν)Gr(GP )V SQ cos2(β)
(1)
The amplification factor V (ν) describes the fre-
quency dependent behavior of each electronic
channel for the signal transmission. The directivity
pattern Gr of the LOPES antenna is obtained by a
simulation assuming realistic conditions. To quan-
tify polarization losses during a misalignment of
the linearly polarized VSQ and linearly polarized
LOPES antenna the angle β is introduced. For the
VSQ only the product of gain and emitted power
(GP )VSQ is known. In Figure 1 the determined
amplification factors V (ν) for a vertical calibration
for all 30 antennas are shown.
frequency [MHz]45 50 55 60 65 70 75
am
pli
fica
tio
n f
act
or
V
310
410
510
all LOPES30 antennas
antennas # 1-10 (cluster 1)
antennas #11-10 (cluster 2)
antennas #21-30 (cluster 3)
Figure 1: The frequency dependent amplification
factors for all 30 antennas obtained by the ampli-
tude calibration.
The earlier LOPES10 hardware can be distin-
guished (antennas 1–10) by their band pass range
(43–76 MHz) from the other 20 antennas (42–
74 MHz). The calibration results in a spread for
the amplification factors of nearly one order of
magnitude. This large spread illustrates the need
for an absolute calibration and is corrected for in
the analysis software. The uncertainty of the cal-
ibration method can be estimated from repeated
measurement campaigns for a single antenna under
all kinds of conditions, including the precision of
achieving the same geometry in all measurements.
It results in an uncertainty of approximately 25%
for the power related amplification factor V , aver-
aged over the effective frequency range.
Radio pulse investigations
LOPES30 in the described setup took data in the
period from mid of November 2005 until begin-
ning of December 2006, receiving 966.000 exter-
nal triggers from KASCADE. The LOPES data ac-
quisition system was able to process 860.000 of
them, where the loss is mostly due to the dead-time
of roughly 1.5 seconds.
The EAS observables, e.g. shower size, number
of muons, arrival direction, and shower core po-
sition are reconstructed only with the KASCADE
data and have to fulfill quality cuts, before further
processing of the radio information. As the full
data set consists mostly of low energetic showers
the expected radio signal strength is relatively low.
5050

30TH INTERNATIONAL COSMIC RAY CONFERENCE
Therefore, for a first radio pulse analysis a prese-
lection of high energetic showers based on restric-
tions in the electron and muon number was done.
Showers with shower size Ne > 5 · 106 and trun-
cated muon number[1] N trμ > 5 ·104 where further
investigated, giving 1200 candidate events.
The analysis of the candidate events performs a se-
ries of processing steps to determine the correla-
tion quantity cc-beam pulse height. First the raw
data is corrected for instrumental delays and af-
terwards a fast Fourier-transformation is applied.
To suppresses radio frequency interference a mit-
igation of narrow band emitters is applied. Then
the reconstructed geometry of the EAS from KAS-
CADE is taken to apply a phase shift to each an-
tenna data, what can be translated as a shift in time.
Further the amplitude calibration is considered and
a correction due to small instrumental phase shifts.
The data are transformed back into the time do-
main, according to the observables from the EAS
reconstruction. All time series si(t) can now be
superimposed interferometrically and with:
CC(t) = ±
√√√√√
∣∣∣∣∣∣
1Npairs − 1
∑
i�=j
si(t) · sj(t)
∣∣∣∣∣∣
(2)
the so called cross correlation beam CC(t) is cal-
culated. With this kind of data processing the radio
pulses recorded in the LOPES30 data can be iden-
tified. For a detailed description of the processing
steps see [4].
Such cc-beam radio pulses are fitted with a Gaus-
sian function to quantify the height, which is an
averaged field strength for a mean distance to the
shower axis of the selected radio antennas. As an
estimation of the pulse height uncertainty the un-
certainty of the Gaussian fit is used. For 849 can-
didates a radio pulse could be fitted (see Figure 2).
From Monte Carlo simulations an approximately
linear dependence of primary energy E0 with the
electric field strength E is predicted. As the num-
ber of muons detected at ground scales roughly
with the primary energy, in Figure 2 the radio pulse
height is plotted against the truncated number of
muons N trμ . The used error bars are derived from
the fit uncertainty.
truncated muon number
510
610
pu
lse
he
igh
t [μ
V/m
/MH
z]
-110
1
10
Figure 2: Relation of truncated muon number N trμ
and cc-beam pulse height.
Shower 1 Shower 2
log Ne 7.26 7.27
log N trμ 5.95 5.91
log Eest. [eV] 17.4 17.4
θ [deg.] 24.0 23.8
φ [deg.] 2.3 4.9
CCall [μV/m/MHz] 6.8 ± 0.6 6.5 ± 0.8
Table 1: EAS observables for two similar shower.
There can be seen no significant correlation be-
tween those two quantities. Due to the strong de-
pendence of the radio signal on the shower direc-
tion [5] (geomagnetic angle, zenith angle, and az-
imuth angle) and on the distance to the shower
core, the correlation with the muon number is
spread out and an unfolding of the dependences is
needed. In a first step for this unfolding the lateral
dependence will be investigated in more detail and
discussed here for two events explicitly.
Lateral extension of radio signals
In the used data set there are two resembling show-
ers, which can be used to directly compare the ra-
dio pulse height for certain distance ranges from
the shower axis. The layout in Fig. 3 gives the
shower core position in the KASCADE-Array and
the originating direction indicated by an arrow.
The reconstructed EAS observables are given in
Table 1 in addition to the cc-beam of all anten-
nas (CCall) (see Fig. 4), we considered antennas
5151
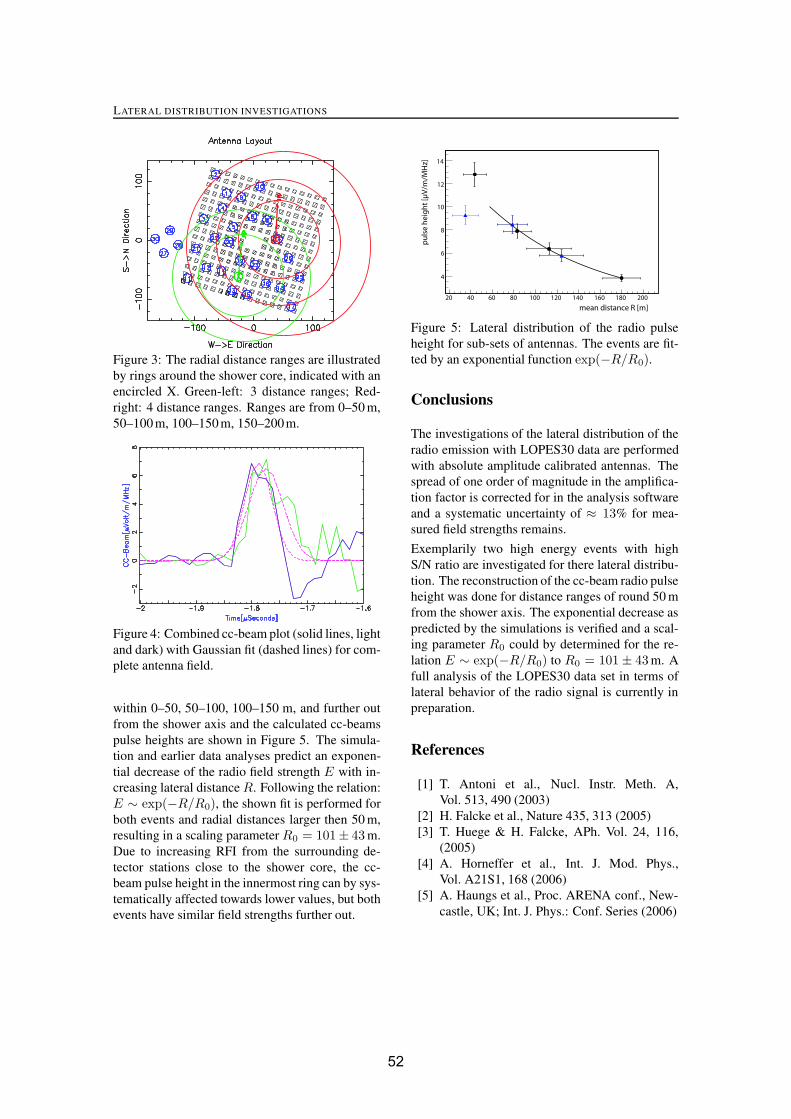
LATERAL DISTRIBUTION INVESTIGATIONS
Figure 3: The radial distance ranges are illustrated
by rings around the shower core, indicated with an
encircled X. Green-left: 3 distance ranges; Red-
right: 4 distance ranges. Ranges are from 0–50 m,
50–100 m, 100–150 m, 150–200m.
Figure 4: Combined cc-beam plot (solid lines, light
and dark) with Gaussian fit (dashed lines) for com-
plete antenna field.
within 0–50, 50–100, 100–150 m, and further out
from the shower axis and the calculated cc-beams
pulse heights are shown in Figure 5. The simula-
tion and earlier data analyses predict an exponen-
tial decrease of the radio field strength E with in-
creasing lateral distance R. Following the relation:
E ∼ exp(−R/R0), the shown fit is performed for
both events and radial distances larger then 50 m,
resulting in a scaling parameter R0 = 101± 43 m.
Due to increasing RFI from the surrounding de-
tector stations close to the shower core, the cc-
beam pulse height in the innermost ring can by sys-
tematically affected towards lower values, but both
events have similar field strengths further out.
mean distance R [m]
20 40 60 80 100 120 140 160 180 200
pu
lse
he
igh
t [μ
V/m
/MH
z]
4
6
8
10
12
14
Figure 5: Lateral distribution of the radio pulse
height for sub-sets of antennas. The events are fit-
ted by an exponential function exp(−R/R0).
Conclusions
The investigations of the lateral distribution of the
radio emission with LOPES30 data are performed
with absolute amplitude calibrated antennas. The
spread of one order of magnitude in the amplifica-
tion factor is corrected for in the analysis software
and a systematic uncertainty of ≈ 13% for mea-
sured field strengths remains.
Exemplarily two high energy events with high
S/N ratio are investigated for there lateral distribu-
tion. The reconstruction of the cc-beam radio pulse
height was done for distance ranges of round 50 m
from the shower axis. The exponential decrease as
predicted by the simulations is verified and a scal-
ing parameter R0 could by determined for the re-
lation E ∼ exp(−R/R0) to R0 = 101 ± 43 m. A
full analysis of the LOPES30 data set in terms of
lateral behavior of the radio signal is currently in
preparation.
References
[1] T. Antoni et al., Nucl. Instr. Meth. A,
Vol. 513, 490 (2003)
[2] H. Falcke et al., Nature 435, 313 (2005)
[3] T. Huege & H. Falcke, APh. Vol. 24, 116,
(2005)
[4] A. Horneffer et al., Int. J. Mod. Phys.,
Vol. A21S1, 168 (2006)
[5] A. Haungs et al., Proc. ARENA conf., New-
castle, UK; Int. J. Phys.: Conf. Series (2006)
5252
30TH INTERNATIONAL COSMIC RAY CONFERENCE
Operation of LOPES-30 for Polarization Measurements of the Radio Emission ofCosmic Ray Air Showers
P.G. ISARa , W.D. APELa, J.C. ARTEAGAa , T. ASCHb , J. AUFFENBERGc , F. BADEAa , L. BAHRENd ,K. BEKKa , M. BERTAINAe , P.L. BIERMANNf , J. BLUMERa,g , H. BOZDOGa , I.M. BRANCUSh ,M. BRUGGEMANNi , P. BUCHHOLZi , S. BUITINKj , H. BUTCHERd , A. CHIAVASSAe , F. COSSAVELLAg ,K. DAUMILLERa , V. DE SOUZAg , F. DI PIERROe , P. DOLLa, R. ENGELa, H. FALCKEd,j ,H. GEMMEKEb, P.L. GHIAk , R. GLASSTETTERc, C. GRUPENi , A. HAUNGSa , D. HECKa ,J.R. HORANDELj , A. HORNEFFERj , T. HUEGEa, K.-H. KAMPERTc , D. KICKELBICKi , Y. KOLOTAEVi,O. KROMERb , J. KUIJPERSj , S. LAFEBREj , P. LUCZAKl , H.J. MATHESa, H.J. MAYERa ,C. MEURERa, J. MILKEa, B. MITRICAh , C. MORELLOk , G. NAVARRAe , S. NEHLSa, A. NIGLj ,J. OEHLSCHLAGERa, S. OSTAPCHENKOa, S. OVERi , M. PETCUh, J. PETROVICj , T. PIEROGa ,S. PLEWNIAa, J. RAUTENBERGc , H. REBELa , M. ROTHa , H. SCHIELERa, O. SIMAm , K. SINGHj ,M. STUMPERTg , G. TOMAh, G.C. TRINCHEROk , H. ULRICHa , J. VAN BURENa , W. WALKOWIAKi ,A. WEINDLa, J. WOCHELEa , J. ZABIEROWSKIl , J.A. ZENSUSf .a Institut fur Kernphysik, Forschungszentrum Karlsruhe, Germanyb Inst. Prozessdatenverarbeitung und Elektronik, Forschungszentrum Karlsruhe, Germanyc Fachbereich Physik, Universitat Wuppertal, Germanyd ASTRON, Dwingeloo, The Netherlandse Dipartimento di Fisica Generale dell’Universita Torino, Italyf Max-Planck-Institut fur Radioastronomie Bonn, Germanyg Institut fur Experimentelle Kernphysik, Universitat Karlsruhe, Germanyh National Institute of Physics and Nuclear Engineering Bucharest, Romaniai Fachbereich Physik, Universitat Siegen, Germanyj Dept. of Astrophysics, Radboud University Nijmegen, The Netherlandsk Istituto di Fisica dello Spazio Interplanetario, INAF Torino, Italyl Soltan Institute for Nuclear Studies Lodz, Polandm Department of Physics, University of Bucharest, [email protected]
Abstract: The LOPES-30 experiment, located at the site of the air shower experiment KASCADE-Grande at Forschungszentrum Karlsruhe, Germany, is an array of 30 dipole antennas set-up to investigatethe pulsed radio emission from cosmic ray air showers in the Earth’s atmosphere. After one year ofmeasurements of the East-West polarization by all 30 antennas, recently, the LOPES-30 set-up was re-configured to perform dual-polarization measurements. Half of the antennas have been configured formeasurements of the North-South polarization direction. By measuring at the same time both, the E-Wand N-S polarization components of the radio emission, the geosynchrotron effect as the dominant emis-sion mechanism in air showers can be verified. The status of the measurements, including the absolutecalibration procedure of the antennas as well as a preliminary analysis of dual-polarized event examplesare reported.
Introduction
The LOFAR (LOw Frequency ARray) P rototypEStation - LOPES experiment [1] is operating in
the 40-80 MHz frequency range. The KASCADE-Grande [2] experiment (an extension of the KArl-sruhe Shower Core and Array DEtector KAS-CADE) provides the trigger information and well-
5353

LOPES
reconstructed parameters of the air shower proper-ties in the energy range from a few PeV to 1 EeV.The LOPES-30 configuration is an extension ofthe initially installed 10 LOPES antennas (LOPES-10) by the addition of 20 dipole antennas, whichhave an absolute amplitude calibration providing alarger sensitive area and a large baseline to the ra-dio signal at a single event basis. This provides thepossibility for a detailed investigation of the lateralextension of the pulsed radio signal. Moreover, theantenna number is high enough for a new configu-ration sensitive to both, the East-West and North-South polarization directions.
The LOPES-POL Configuration
Since end of 2006, LOPES is performing polariza-tion measurements. Half of the 30 antennas areconfigured for the East-West and North-South po-larization measurements respectively, while five ofthem are configured as dual-polarization antennasat the same place, measuring at the same time both,the N-S and E-W polarization directions. The ac-tual configuration is depicted in Fig.4.
Since December 2006, the LOPES antennas aretriggered by the original KASCADE and in addi-tion by the KASCADE-Grande array. Within thisnew additional trigger source, the LOPES experi-ment can therefore benefit from the extended de-tection area making possible the analysis of largeevents at large distances with a much better accu-racy.
Motivation for Performing PolarizationMeasurements
For the initial measurements, all 30 antennas of theLOPES experiment were equipped with dipoles inE-W direction, measuring the single polarizationof the radio emission only. Recently, for recordingthe full radio signal, LOPES-30 has been reconfig-ured to perform dual-polarization measurements.
The radio emission generated by the geosyn-chrotron mechanism is expected to be highly lin-early polarized [3]. As predicted by the sophisti-cated Monte Carlo simulation for the radio emis-sion, the signal is usually present in both polar-
-200
-150
-100
-50
0
50
100
150
200
250
300
0 20 40 60 80 100 120
t [ns]
∣ ∣ ∣Ei(
� R,t
)∣ ∣ ∣[μ
Vm
−1]
Figure 1: Raw simulated pulses in the individuallinear polarization components of a 1017 eV ver-tical air shower. The solid line represent the E-Wpolarization component, dashed line N-S and dot-ted line the vertical component respectively.
ization components which strengths strongly de-pends on the position of the observer relative tothe incoming air shower. In addition, the polar-ization is directly related with the shower azimuthfor a given zenith angle. Knowledge of these po-larization characteristics of the radio emission aremandatory for the interpretation of experimentalmeasurements, which can directly verify the geo-magnetic origin of the radio emission from atmo-spheric air showers.
Fig.1 shows a simulated raw (unlimited-bandwidth) pulse arriving at a distance of200 m to the N-W from the center of a 1017 eVvertical shower. The N-S and E-W polarizationcomponents are of similar strength and arrivemostly synchronously, as expected for a linearlypolarized pulse. For inclined air showers, avertical polarized component can occur as well.
Polarization Sensitivity
The array of 30 digital radio antennas have an ab-solute amplitude calibration in order to estimatethe electric field strength of the short radio pulsegenerated in air showers [5]. To perform the cal-ibration, a commercial calibrated radio source isused as emitter and LOPES antennas are measur-ing within an artificially triggered event. For a cal-
5454

30TH INTERNATIONAL COSMIC RAY CONFERENCE
[degree]βPolarisation angle
100 200 300
Tota
l fie
ld s
tren
gth
(frac
tion)
0
0.5
1
SE WN0
Figure 2: Fraction of the total field strength seenby the linearly polarized LOPES antenna (sensi-tive to E-W) as a function of the polarization an-gle β. Points: experimental data, solid line: datafit by a sinβ-function, dotted line: theoretical sinβ-distribution (normalized to the value at β=270◦).
ibration campaign, the reference source is placedat 11m above each LOPES antenna. It is a mov-able biconical reference antenna which is linearlypolarized and has a nearly constant directivity nearits principal axis.
Fig.2, respectively Fig.3 shows the fraction of thetotal field strength seen by a linearly dual-polarizedLOPES antenna as a function of the angle β be-tween the polarization axes of the reference sourceand the LOPES antenna. Each polarization direc-tion is measured individually during the same cam-paign varying the polarization angle of the refer-ence antenna in steps of 10 degrees by rotating thereference source in vertical position. The resultsobtained prove the expected polarization sensitiv-ity (and insensitivity) of both, the E-W and N-Soriented LOPES antennas.
First Events
As an example, (see Fig.5) we display an eventdetected by LOPES in the new polarization con-figuration in December 2006. The KASCADEshower reconstruction results in a primary energyof E0 ≈ 1018 eV, a geomagnetic angle (the anglebetween the shower axis and the Earth magnetic
[degree]βPolarization an gle
0 100 200 300
Tota
lfie
ldst
reng
th(fr
actio
n)
0
0.5
1
N S WE
Figure 3: The same as Fig.2, but now for the an-tenna sensitive to the N-S polarization direction ofthe radio signal. The dotted curve is normalized tothe value at β=180◦.
field) of 83◦, an azimuth angle of 51◦ (i.e. comingfrom North-East), and a zenith angle of 66◦. Theshower shows clearly signals recorded in both po-larization directions. The figure shows the valueof the reconstructed CC-beam [6] which describesthe average electric field strength for the mean dis-tance from the shower axis.
As another example, (see Fig.6) we display anevent detected in December 2006 with a primaryenergy of E0 ≈ 3 · 1017 eV, a geomagnetic an-gle of 77◦, an azimuth angle of 333◦ (i.e. com-ing from North, North-West), and a zenith angleof 54◦. The shower shows clearly signal recordedonly in the E-W polarization direction without asignificant signal contribution in the other N-S po-larization direction.
These two selected events clearly show the capa-bilities of the LOPES experiment in recording theradio emission in both, the E-W and N-S polar-ization components. The new antenna configura-tion allows a full detection of the pulsed radio sig-nal generated by the cosmic ray air showers in theEarth’s atmosphere.
Conclusions
In its current configuration, the LOPES experimentis performing polarization measurements; measur-
5555

LOPES
1
8
7
4
5
2
3
14
10
9
11
13
12
1518
19
21
16
17
22
23
24
25
262728
29
EW+NS
NSEW
30
20
6
Figure 4: The antenna layout at the KASCADEarray. The all antenna setup is divided in 15 E-Wand 15 N-S polarized channels. Five antennas aresensitive to both polarization directions at the sametime.
ing at the same time both, the E-W and N-S polar-ization components allows a much more detailedanalysis of the radio events than with the East-Westpolarized measurements alone.
Providing calibrated data, the LOPES experimentallows a direct comparison with theoretical predic-tions for the first time. A direct verification ofthe geosynchrotron effect as the dominant emis-sion mechanism in air showers is possible now.
References
[1] H. Falcke et al., Nature 435, 313-316 (2005)[2] A. Haungs et al., 30th ICRC these Proc.
(2007)[3] T. Huege & H. Falcke, Astropart.Phys. 24
116-136 (2005)[4] T. Huege, R. Ulrich and R. Engel, As-
tropart.Phys. 27 392-405 (2007)[5] S. Nehls et al., ARENA Proc. 2005,
Int.J.Mod.Phys. A21S1, 187 (2006)[6] A. Horneffer et al., ARENA Proc. 2005,
Int.J.Mod.Phys. A21S1, 168 (2006)[7] P.G. Isar et al., ARENA Proc. (2006)
Figure 5: The Cross Correlation(CC)-beams for adual-polarized event (E-W component: upper sig-nal, N-S component: lower signal) of a primary en-ergy of 1018 eV coming from North-East. The fulllines indicate the CC-beams and the dotted linesthe Gaussian fits respectively. One can clearly seevery high radio signal recorded in both polarizationdirections.
Figure 6: The same Cross Correlation(CC)-beams(see Fig.5) for a dual-polarized event of a pri-mary energy of 3 · 1017 eV coming from North,North-West. One can cleraly see very high signalrecorded in the E-W polarization direction only.
5656

30TH INTERNATIONAL COSMIC RAY CONFERENCE
Update on radio detection of inclined air showers with LOPES-10
A. SAFTOIUh, W.D. APELa, J.C. ARTEAGAa, T. ASCHb, J. AUFFENBERGc, F. BADEAa, L. BAHRENd,K. BEKKa, M. BERTAINAe, P.L. BIERMANNf , J. BLUMERa,g , H. BOZDOGa, I.M. BRANCUSh,M. BRUGGEMANNi, P. BUCHHOLZi, S. BUITINKj , H. BUTCHERd, A. CHIAVASSAe, F. COSSAVELLAg ,K. DAUMILLERa, V. DE SOUZAg , F. DI PIERROe, P. DOLLa, R. ENGELa, H. FALCKEd,j ,H. GEMMEKEb, P.L. GHIAk , R. GLASSTETTERc, C. GRUPENi, A. HAUNGSa, D. HECKa,J.R. HORANDELj , A. HORNEFFERj , T. HUEGEa, P.G. ISARa, K.-H. KAMPERTc, D. KICKELBICKi,Y. KOLOTAEVi, O. KROMERb, J. KUIJPERSj , S. LAFEBREj , P. LUCZAKl , H.J. MATHESa,H.J. MAYERa, C. MEURERa, J. MILKEa, B. MITRICAh, C. MORELLOk , G. NAVARRAe, S. NEHLSa,A. NIGLj , J. OEHLSCHLAGERa, S. OSTAPCHENKOa, S. OVERi, M. PETCUh, J. PETROVICj ,T. PIEROGa, S. PLEWNIAa, J. RAUTENBERGc, H. REBELa, M. ROTHa, H. SCHIELERa, O. SIMAm,K. SINGHj , M. STUMPERTg , G. TOMAh, G.C. TRINCHEROk , H. ULRICHa, J. VAN BURENa,W. WALKOWIAKi, A. WEINDLa, J. WOCHELEa, J. ZABIEROWSKIl, J.A. ZENSUSf .a Institut fur Kernphysik, Forschungszentrum Karlsruhe, Germanyb Inst. Prozessdatenverarbeitung und Elektronik, Forschungszentrum Karlsruhe, Germanyc Fachbereich Physik, Universitat Wuppertal, Germanyd ASTRON, Dwingeloo, The Netherlandse Dipartimento di Fisica Generale dell’Universita Torino, Italyf Max-Planck-Institut fur Radioastronomie Bonn, Germanyg Institut fur Experimentelle Kernphysik, Universitat Karlsruhe, Germanyh National Institute of Physics and Nuclear Engineering Bucharest, Romaniai Fachbereich Physik, Universitat Siegen, Germanyj Dept. of Astrophysics, Radboud University Nijmegen, The Netherlandsk Istituto di Fisica dello Spazio Interplanetario, INAF Torino, Italyl Soltan Institute for Nuclear Studies Lodz, Polandm Department of Physics, University of Bucharest, [email protected]
Abstract: Inclined air showers are a particularly interesting target for observation with the radio tech-nique. They are expected to be well detectable and allow analyses of angular correlations over a muchbroader range in geomagnetic angle than near-vertical events. We present an updated analysis of highlyinclined (> 50◦ zenith angle), high energy (Nμ > 105) air showers measured with LOPES-10 in coin-cidence with KASCADE-Grande. Data from the Grande rather than the KASCADE array are used forthe reconstruction of the air shower events, giving us access to a broader range of core distances for anindependent cross-check with the earlier analysis.
Introduction
It is a known fact that air showers generate radiowaves while propagating through the atmosphere.Since the 1960s various mechanisms have beenproposed. The last of them, dating back only to2003, explains the radio emission from air show-
ers as a coherent geosynchrotron emission due tothe deflection of charged particles, electrons andpositrons, in the Earth’s magnetic field [1, 2]. Inorder to shed more light on the features of the ra-dio emission and confirm dominant mechanismsresponsible for the emission, we must investigatein detail correlations of the measured field strength
5757
UPDATE ON INCLINED EVENTS
with shower parameters. For this purpose we usethe LOPES set-up, placed within the KASCADE-Grande array (KArlsruhe Shower Core and Ar-ray Detector and Grande array), which is a goodtool to investigate shower radio emission in coin-cidence with shower parameters obtained from in-dependent particle detectors in the energy range of1016 − 1018 eV [3].
An air showers develops in the atmosphere andevolves due to multiple interactions. The elec-tromagnetic component reaches a maximum highabove the ground and afterwards decreases rapidly.Consequently, only a small number of electrons(comparing with the electron number at the showermaximum) reach the ground. But the number ofelectrons and positrons in the shower maximum isexpected to be approximately proportional to thestrength of the radio pulse detected by the anten-nas. Therefore, better knowledge of radio emissionparameters may give extra information on showerdevelopment.
Also the radio detection technique is proposed asa tool for neutrino detection. High energy verticalneutrinos most likely pass through the Earth’s at-mosphere without any interaction, but as the zenithangle increases the probability that a neutrino maygenerate an electromagnetic shower increases. Ra-dio emission can be observed for vertical, slightlyinclined as well as highly inclined air showers withno principle limitations from the radio detectionpoint of view. The antenna sensitivity poses muchsmaller problems when zenith angle increases incomparison with flat particle detectors for whichthe reconstruction becomes unreliable for zenithangles larger than 60◦.
Data analysis
For the present study we have analyzed datarecorded in 2004 by LOPES-10 which consists of10 East-West polarization antennas placed insidethe KASCADE array. The LOPES-10 data setshave been submitted to several selections in or-der to investigate different aspects. For this workwe have selected only inclined events, zenith angle> 50◦, and high energy events, Nμ > 105. By an-alyzing inclined events we are able to investigateangular correlations over a much broader geomag-
geomagnetic angle (deg)30 40 50 60 70 80 90
azim
uth
an
gle
(d
eg)
0
50
100
150
200
250
300
350
Figure 1: Azimuth angle as a function of geomag-netic angle for the 139 selected events with avail-able radio data. Red rhombs - clear radio signal de-tected; blue crosses - reliable reconstruction withGrande, processed with optimized beam formingprocedure; black dots - Grande reconstruction un-reliable.
netic angle than vertical or near-vertical events.The geomagnetic angle is the angle between theshower axis and Earth’s magnetic field.
A previous work on inclined showers [5]has reported correlations between measured fieldstrength and shower parameters considering datain coincidence with the KASCADE array whichcovers an area of 200x200 m2. The LOPES-10antennas are also situated inside the KASCADEarray, therefore only close events were processed.Now we extend the study and investigate events incoincidence with Grande data, keeping the zenithangle and energy cuts. This gives us the oppor-tunity to investigate distant events of up to 800 mfrom the LOPES antennas that have been detectedby the Grande stations on an area of ∼0.5 km2.For large showers triggering KASCADE with atleast 10/16 clusters fired, data readout of both theLOPES antennas and the Grande array is triggered.In total, for 139 out of 149 selected high energy in-clined events (Nμ > 105 and zenith angle > 50◦)with Grande data, radio data was recorded with theLOPES array. The following analysis is performedwith these 139 events.
Because we use KASCADE-Grande data as a start-ing point in the digital beam-forming of radio data
5858
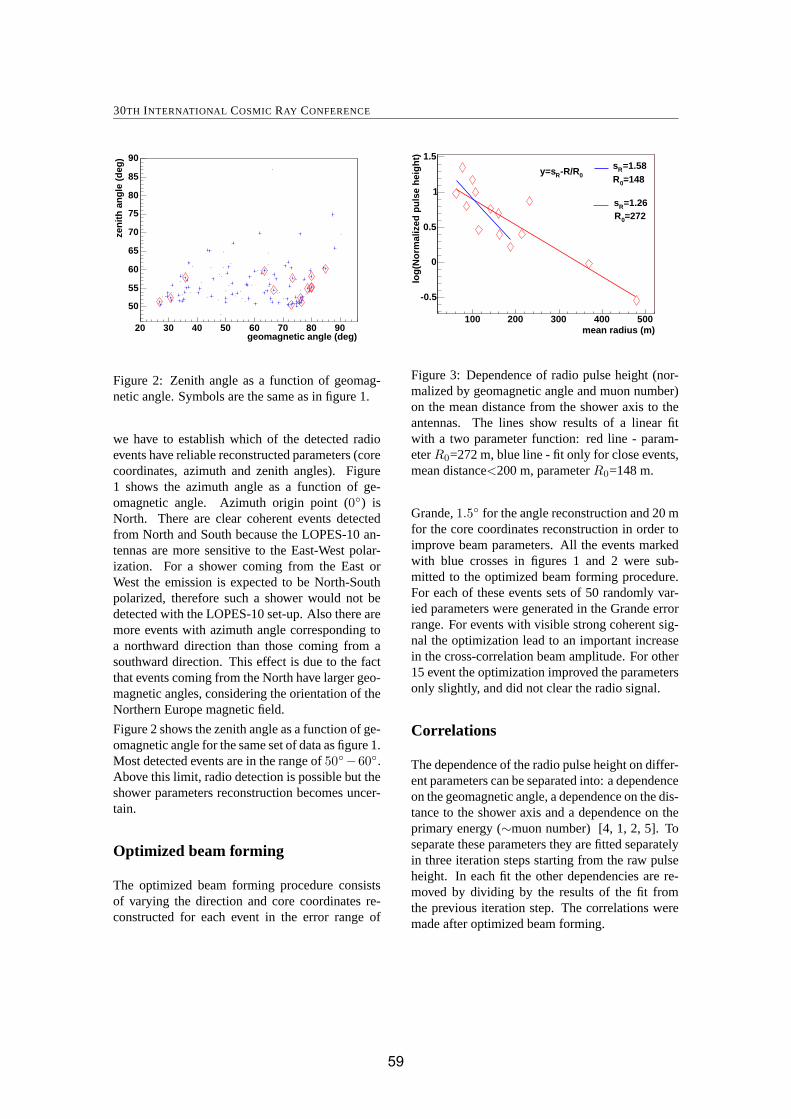
30TH INTERNATIONAL COSMIC RAY CONFERENCE
geomagnetic angle (deg)20 30 40 50 60 70 80 90
zen
ith
an
gle
(d
eg)
50
55
60
65
70
75
80
85
90
Figure 2: Zenith angle as a function of geomag-netic angle. Symbols are the same as in figure 1.
we have to establish which of the detected radioevents have reliable reconstructed parameters (corecoordinates, azimuth and zenith angles). Figure1 shows the azimuth angle as a function of ge-omagnetic angle. Azimuth origin point (0◦) isNorth. There are clear coherent events detectedfrom North and South because the LOPES-10 an-tennas are more sensitive to the East-West polar-ization. For a shower coming from the East orWest the emission is expected to be North-Southpolarized, therefore such a shower would not bedetected with the LOPES-10 set-up. Also there aremore events with azimuth angle corresponding toa northward direction than those coming from asouthward direction. This effect is due to the factthat events coming from the North have larger geo-magnetic angles, considering the orientation of theNorthern Europe magnetic field.
Figure 2 shows the zenith angle as a function of ge-omagnetic angle for the same set of data as figure 1.Most detected events are in the range of 50◦−60◦.Above this limit, radio detection is possible but theshower parameters reconstruction becomes uncer-tain.
Optimized beam forming
The optimized beam forming procedure consistsof varying the direction and core coordinates re-constructed for each event in the error range of
mean radius (m)100 200 300 400 500
log
(No
rmal
ized
pu
lse
hei
gh
t)
-0.5
0
0.5
1
1.5
0-R/RRy=s
=1.26Rs=2720R
=1.58Rs=1480R
Figure 3: Dependence of radio pulse height (nor-malized by geomagnetic angle and muon number)on the mean distance from the shower axis to theantennas. The lines show results of a linear fitwith a two parameter function: red line - param-eter R0=272 m, blue line - fit only for close events,mean distance<200 m, parameter R0=148 m.
Grande, 1.5◦ for the angle reconstruction and 20 mfor the core coordinates reconstruction in order toimprove beam parameters. All the events markedwith blue crosses in figures 1 and 2 were sub-mitted to the optimized beam forming procedure.For each of these events sets of 50 randomly var-ied parameters were generated in the Grande errorrange. For events with visible strong coherent sig-nal the optimization lead to an important increasein the cross-correlation beam amplitude. For other15 event the optimization improved the parametersonly slightly, and did not clear the radio signal.
Correlations
The dependence of the radio pulse height on differ-ent parameters can be separated into: a dependenceon the geomagnetic angle, a dependence on the dis-tance to the shower axis and a dependence on theprimary energy (∼muon number) [4, 1, 2, 5]. Toseparate these parameters they are fitted separatelyin three iteration steps starting from the raw pulseheight. In each fit the other dependencies are re-moved by dividing by the results of the fit fromthe previous iteration step. The correlations weremade after optimized beam forming.
5959

UPDATE ON INCLINED EVENTS
1-cos(geomagnetic angle)0.1 0.2 0.3 0.4 0.5 0.6 0.7 0.8 0.9
No
rmal
ized
pu
lse
hei
gh
t
1
1.5
2
2.5
3
-cos(geo))G(1+qGy=s
=1.04Gs=0.7Gq
=2.28Gs=0.18Gq
Figure 4: Dependence of the pulse height (normal-ized by muon number and distance) on the geo-magnetic angle. Two linear fits were performed:red line - fit for all the clear radio events, bluedashed line without the event marked with thegreen dot. Parameters are shown in the plot.
Figure 3 shows the dependence of the pulse height,obtained after two iterations, corrected for muonnumber and geomagnetic angle, on the mean dis-tance from the shower axis to the antenna set-up.There is a clear decrease with distance.
As shown in figure 4, there is a clear correlation ofthe pulse height, corrected for muon number anddistance, with the geomagnetic angle which sug-gests that the emission is caused by the interactionof the shower with the Earth’s magnetic field. Theincrease of the pulse height with geomagnetic an-gle supports the geosynchrotron theory. There isone event, marked with the green dot, which is stillunder investigation and therefore two fits were per-formed, one with the outlier and one without it.
Figure 5 shows a clear dependence of the pulseheight, corrected for the geomagnetic angle anddistance, on the muon number which is an approx-imate estimator of the primary particle energy. Thedependence is fitted with a power law.
Conclusions
In this work we have extended previous studies ofradio emission from inclined air showers to larger
0 500 1000 1500 2000 2500310×
No
rmal
ized
pu
lse
hei
gh
t
0
1
2
3
4
5
6p
y=s(x) s=7.7e-5
p=0.91
μN
Figure 5: Dependence of the pulse height (normal-ized by geomagnetic angle and distance) on muonnumber, fitted with a power law.
distances by analyzing LOPES-10 data in coin-cidence with data recorded by the Grande arrayof the KASCADE-Grande experiment. The pre-dicted features, increase of the pulse height withthe primary energy, decrease of the pulse heightwith distance and the geomagnetic influence areconfirmed. In addition, the data proves that veryinclined events can be detected in the radio do-main at large distances showing the capabilities ofthe radio technique for measuring very inclined airshowers.
Acknowledgements
We express our thanks to the Romanian Ministry ofEducation of Research for the financial support ofthis study as part of the CEEX 05-D11-79 project.
References
[1] T. Huege and H. Falcke, Astron. Astrophys.,41, 19 (2003)
[2] H. Falcke, P. Gorham, Astropart. Phys., 19,477 (2003)
[3] H. Falcke et al., Nature 435, 313 (2005)[4] H.R. Allan, Prog. in Elem. part. and Cos. Ray
Phys., Vol. 10, 171 (1971)[5] J. Petrovic et al., Astron. Astrophys., 462,
389 (2007)
6060
30TH INTERNATIONAL COSMIC RAY CONFERENCE
Radio emission of air showers in electric fields
S. BUITINKa , W.D. APELb, J.C. ARTEAGAb, T. ASCHc , J. AUFFENBERGd , F. BADEAb , L. BAHRENe ,K. BEKKb , M. BERTAINAf , P.L. BIERMANNg , J. BLUMERb,h, H. BOZDOGb , I.M. BRANCUSi ,M. BRUGGEMANNj , P. BUCHHOLZj , H. BUTCHERe , A. CHIAVASSAf , F. COSSAVELLAh,K. DAUMILLERb, V. DE SOUZAh, F. DI PIERROf , P. DOLLb, R. ENGELb, H. FALCKEa,e,H. GEMMEKEc, P.L. GHIAk , R. GLASSTETTERd, C. GRUPENj , A. HAUNGSb , D. HECKb ,J.R. HORANDELa, A. HORNEFFERa, T. HUEGEb, P.G. ISARb, K.-H. KAMPERTd , D. KICKELBICKj ,Y. KOLOTAEVj , O. KROMERc , J. KUIJPERSa, S. LAFEBREa, P. LUCZAKl, H.J. MATHESb,H.J. MAYERb , C. MEURERb, J. MILKEb, B. MITRICAi , C. MORELLOk , G. NAVARRAf , S. NEHLSb,A. NIGLa, J. OEHLSCHLAGERb, S. OSTAPCHENKOb , S. OVERj , M. PETCUi , J. PETROVICa ,T. PIEROGb , S. PLEWNIAb, J. RAUTENBERGd , H. REBELb, M. ROTHb , H. SCHIELERb , O. SIMAm ,K. SINGHa , M. STUMPERTh, G. TOMAi, G.C. TRINCHEROk , H. ULRICHb , J. VAN BURENb ,W. WALKOWIAKj , A. WEINDLb, J. WOCHELEb , J. ZABIEROWSKIl , J.A. ZENSUSg .a Dept. of Astrophysics, Radboud University Nijmegen, The Netherlandsb Institut fur Kernphysik, Forschungszentrum Karlsruhe, Germanyc Inst. Prozessdatenverarbeitung und Elektronik, Forschungszentrum Karlsruhe, Germanyd Fachbereich Physik, Universitat Wuppertal, Germanye ASTRON, Dwingeloo, The Netherlandsf Dipartimento di Fisica Generale dell’Universita Torino, Italyg Max-Planck-Institut fur Radioastronomie Bonn, Germanyh Institut fur Experimentelle Kernphysik, Universitat Karlsruhe, Germanyi National Institute of Physics and Nuclear Engineering Bucharest, Romaniaj Fachbereich Physik, Universitat Siegen, Germanyk Istituto di Fisica dello Spazio Interplanetario, INAF Torino, Italyl Soltan Institute for Nuclear Studies Lodz, Polandm Department of Physics, University of Bucharest, [email protected]
Abstract: The radio emission from cosmic ray air showers consists in large part of geosynchrotronradiation. Since the radiation mechanism is based on particle acceleration, atmospheric electric fieldsmay play an important role. LOPES results show that electric fields under fair weather conditions do notalter the radio emission considerably, but during thunderstorms strongly amplified pulses are measured.We simulate the electric field influence on the shower development and radiated emission with CORSIKAand REAS2. We present results from LOPES data analysis and some first results from simulations.
Introduction
The secondary electrons and positrons of an ex-tensive air shower (EAS) produce coherent radioemission in the atmosphere. Results from LOPES[1] show that the intensity of the radio emissionis strongly correlated with the angle of the showeraxis with the geomagnetic field, proving that the
dominant part of the emission is driven by the ge-omagnetic field. This mechanism can be under-stood in terms of transverse current emission [2] orgeosynchrotron emission [3]. The latter descrip-tion allows for detailed Monte Carlo simulationsin which shower electrons and positrons are treatedindividually, which is done in [4].
6161

AIR SHOWERS IN ELECTRIC FIELDS
Atmospheric electric fields may influence theemission mechanism, especially when the electricfield force is of the same order of magnitude (orhigher) as the Lorentz force from the geomagneticfield. The uncertainty introduced by this effect isone of the reasons why efforts to detect radio emis-sion from cosmic ray air showers in the 1970’swere abandoned [5]. In this work we discuss themechanisms by which the electric field influencesthe emission. Results are shown from LOPES dataanalysis and Monte Carlo simulations with COR-SIKA and REAS2.
Atmospheric electric fields
In fair weather, i.e. atmospheric conditions inwhich electrified clouds are absent, there isa downward electric field present with a fieldstrength of ∼ 100 Vm−1 at ground level. The fieldstrength decreases rapidly with altitude. Cloudscan typically gain field strengths of a few hundredVm−1. Nimbostratus clouds, which have a typicalthickness of more than 2000 m can have fields ofthe order of 10 kVm−1. The largest electric fieldsare found inside thunderstorms and are typically100 kVm−1. In most clouds this field is directedvertically (either upwards or downwards, depend-ing on the type of cloud), but thunderclouds con-tain complex charge distributions and can have lo-cal fields in any direction. Thunderclouds can havea vertical extent of ∼ 10 km (values taken from[6]).
The atmospheric electric field acts on the radioemission from EAS in various ways. We dis-tinguish two generations of electrons: the rela-tivistic electrons from pair creation in the EAS(called shower electrons from here) and the non-relativistic electrons resulting from the ionizationof air molecules by the EAS particles (called ion-ization electrons from here).
The electric force accelerates the shower electronsand positrons, producing radiation in more or lessthe same way as the magnetic field does. The to-tal emitted power of a single electron or positronis proportional to the square of the Lorentz factorand the square of the applied perpendicular force:P ∝ γ2F 2
⊥. The part of the electric force that isdirected perpendicular on the particle orbit adds to
the Lorentz force, increasing (or decreasing, de-pending on geometry) F⊥. The part of the electricforce that is directed parallel to the particle orbitincreases or decreases γ. Generally, the single par-ticle pulses become stronger but narrower in time.Taking into account coherency effects, this doesnot automatically lead to amplification of the com-plete shower pulse. This effect (and the electricfield emission mechanism in general) is discussedin detail in [7].
The ionization electrons are also accelerated in theelectric field. A radio pulse will be emitted fromthe current that is produced in this way. When ion-ized electrons gain an energy of ε > εc ≈ 0.1 − 1MeV they can ionize new molecules. If the elec-tric field is strong enough to accelerate ionizationelectrons to such energies a process called runawaybreakdown [8] can occur. The critical field strengthof Ec ≈ 100 − 150 kV/m, needed for this effect,is present only inside thunderclouds. The radiationpattern of the runaway breakdown is calculated in[9] for a vertical shower and resembles that of acurrent pulse. The pulse amplitude is calculatedto be several orders of magnitude higher than thegeosynchrotron emission from the EAS. Depend-ing on the viewing geometry the pulses can havetime widths of 100-300 ns.
Both mechanisms can be responsible for an am-plification of the radio pulse from EAS. There areseveral ways to distinguish between them, includ-ing direction of emission, pulse time width and po-larization.
LOPES data analysis
In 2004, the LOPES array consisted of 10 east-west aligned dipole antennas, co-located with theKASCADE experiment which provides triggers forLOPES and reconstructs the content, energy and di-rection of the air shower. When the data used inthis paper was taken, LOPES measured only the po-larization in the east-west plane. Details about theexperimental setup and the reduction of the datacan be found in [11].
Three sets of data were selected from the 2004database of LOPES:
6262
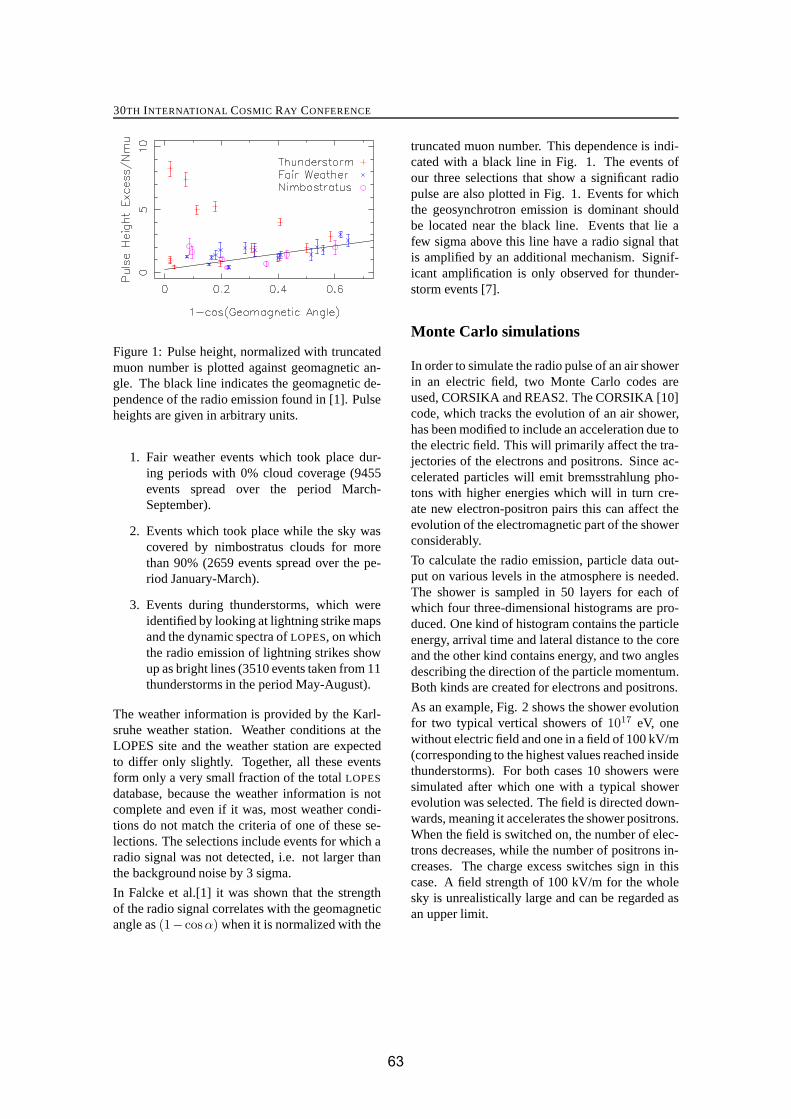
30TH INTERNATIONAL COSMIC RAY CONFERENCE
Figure 1: Pulse height, normalized with truncatedmuon number is plotted against geomagnetic an-gle. The black line indicates the geomagnetic de-pendence of the radio emission found in [1]. Pulseheights are given in arbitrary units.
1. Fair weather events which took place dur-ing periods with 0% cloud coverage (9455events spread over the period March-September).
2. Events which took place while the sky wascovered by nimbostratus clouds for morethan 90% (2659 events spread over the pe-riod January-March).
3. Events during thunderstorms, which wereidentified by looking at lightning strike mapsand the dynamic spectra of LOPES, on whichthe radio emission of lightning strikes showup as bright lines (3510 events taken from 11thunderstorms in the period May-August).
The weather information is provided by the Karl-sruhe weather station. Weather conditions at theLOPES site and the weather station are expectedto differ only slightly. Together, all these eventsform only a very small fraction of the total LOPES
database, because the weather information is notcomplete and even if it was, most weather condi-tions do not match the criteria of one of these se-lections. The selections include events for which aradio signal was not detected, i.e. not larger thanthe background noise by 3 sigma.
In Falcke et al.[1] it was shown that the strengthof the radio signal correlates with the geomagneticangle as (1− cosα) when it is normalized with the
truncated muon number. This dependence is indi-cated with a black line in Fig. 1. The events ofour three selections that show a significant radiopulse are also plotted in Fig. 1. Events for whichthe geosynchrotron emission is dominant shouldbe located near the black line. Events that lie afew sigma above this line have a radio signal thatis amplified by an additional mechanism. Signif-icant amplification is only observed for thunder-storm events [7].
Monte Carlo simulations
In order to simulate the radio pulse of an air showerin an electric field, two Monte Carlo codes areused, CORSIKA and REAS2. The CORSIKA [10]code, which tracks the evolution of an air shower,has been modified to include an acceleration due tothe electric field. This will primarily affect the tra-jectories of the electrons and positrons. Since ac-celerated particles will emit bremsstrahlung pho-tons with higher energies which will in turn cre-ate new electron-positron pairs this can affect theevolution of the electromagnetic part of the showerconsiderably.
To calculate the radio emission, particle data out-put on various levels in the atmosphere is needed.The shower is sampled in 50 layers for each ofwhich four three-dimensional histograms are pro-duced. One kind of histogram contains the particleenergy, arrival time and lateral distance to the coreand the other kind contains energy, and two anglesdescribing the direction of the particle momentum.Both kinds are created for electrons and positrons.
As an example, Fig. 2 shows the shower evolutionfor two typical vertical showers of 1017 eV, onewithout electric field and one in a field of 100 kV/m(corresponding to the highest values reached insidethunderstorms). For both cases 10 showers weresimulated after which one with a typical showerevolution was selected. The field is directed down-wards, meaning it accelerates the shower positrons.When the field is switched on, the number of elec-trons decreases, while the number of positrons in-creases. The charge excess switches sign in thiscase. A field strength of 100 kV/m for the wholesky is unrealistically large and can be regarded asan upper limit.
6363
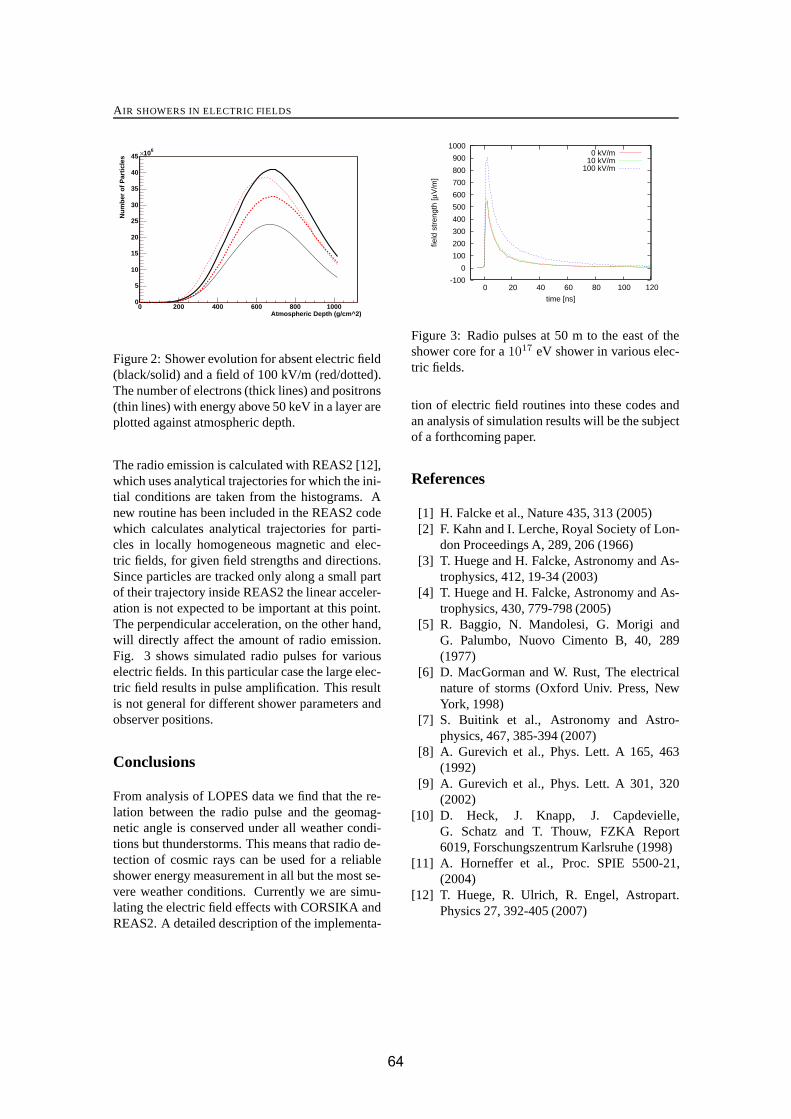
AIR SHOWERS IN ELECTRIC FIELDS
Atmospheric Depth (g/cm^2)0 200 400 600 800 1000
Nu
mb
er o
f P
arti
cles
0
5
10
15
20
25
30
35
40
45610×
Figure 2: Shower evolution for absent electric field(black/solid) and a field of 100 kV/m (red/dotted).The number of electrons (thick lines) and positrons(thin lines) with energy above 50 keV in a layer areplotted against atmospheric depth.
The radio emission is calculated with REAS2 [12],which uses analytical trajectories for which the ini-tial conditions are taken from the histograms. Anew routine has been included in the REAS2 codewhich calculates analytical trajectories for parti-cles in locally homogeneous magnetic and elec-tric fields, for given field strengths and directions.Since particles are tracked only along a small partof their trajectory inside REAS2 the linear acceler-ation is not expected to be important at this point.The perpendicular acceleration, on the other hand,will directly affect the amount of radio emission.Fig. 3 shows simulated radio pulses for variouselectric fields. In this particular case the large elec-tric field results in pulse amplification. This resultis not general for different shower parameters andobserver positions.
Conclusions
From analysis of LOPES data we find that the re-lation between the radio pulse and the geomag-netic angle is conserved under all weather condi-tions but thunderstorms. This means that radio de-tection of cosmic rays can be used for a reliableshower energy measurement in all but the most se-vere weather conditions. Currently we are simu-lating the electric field effects with CORSIKA andREAS2. A detailed description of the implementa-
-100
0
100
200
300
400
500
600
700
800
900
1000
0 20 40 60 80 100 120
field
str
engt
h [μ
V/m
]
time [ns]
0 kV/m10 kV/m
100 kV/m
Figure 3: Radio pulses at 50 m to the east of theshower core for a 1017 eV shower in various elec-tric fields.
tion of electric field routines into these codes andan analysis of simulation results will be the subjectof a forthcoming paper.
References
[1] H. Falcke et al., Nature 435, 313 (2005)[2] F. Kahn and I. Lerche, Royal Society of Lon-
don Proceedings A, 289, 206 (1966)[3] T. Huege and H. Falcke, Astronomy and As-
trophysics, 412, 19-34 (2003)[4] T. Huege and H. Falcke, Astronomy and As-
trophysics, 430, 779-798 (2005)[5] R. Baggio, N. Mandolesi, G. Morigi and
G. Palumbo, Nuovo Cimento B, 40, 289(1977)
[6] D. MacGorman and W. Rust, The electricalnature of storms (Oxford Univ. Press, NewYork, 1998)
[7] S. Buitink et al., Astronomy and Astro-physics, 467, 385-394 (2007)
[8] A. Gurevich et al., Phys. Lett. A 165, 463(1992)
[9] A. Gurevich et al., Phys. Lett. A 301, 320(2002)
[10] D. Heck, J. Knapp, J. Capdevielle,G. Schatz and T. Thouw, FZKA Report6019, Forschungszentrum Karlsruhe (1998)
[11] A. Horneffer et al., Proc. SPIE 5500-21,(2004)
[12] T. Huege, R. Ulrich, R. Engel, Astropart.Physics 27, 392-405 (2007)
6464
30TH INTERNATIONAL COSMIC RAY CONFERENCE
Trigger Strategy for Radio Detection of Atmospheric Air Showers with LOPESSTAR
T. ASCHa , O. KROMERa , W.D. APELb, J.C. ARTEAGAb , J. AUFFENBERGc , F. BADEAb , L. BAHRENd ,K. BEKKb, M. BERTAINAe , P.L. BIERMANNf , J. BLUMERb,g , H. BOZDOGb , I.M. BRANCUSh ,M. BRUGGEMANNi , P. BUCHHOLZi , S. BUITINKj , H. BUTCHERd , A. CHIAVASSAe , F. COSSAVELLAg ,K. DAUMILLERb, V. DE SOUZAg , F. DI PIERROe , P. DOLLb, R. ENGELb, H. FALCKEd,j ,H. GEMMEKEa, P.L. GHIAk , R. GLASSTETTERc, C. GRUPENi , A. HAUNGSb , D. HECKb ,J.R. HORANDELj , A. HORNEFFERj , T. HUEGEb, P.G. ISARb, K.-H. KAMPERTc , D. KICKELBICKi ,Y. KOLOTAEVi, J. KUIJPERSj , S. LAFEBREj , P. LUCZAKl , H.J. MATHESb, H.J. MAYERb ,C. MEURERb , J. MILKEb, B. MITRICAh , C. MORELLOk , G. NAVARRAe , S. NEHLSb, A. NIGLj ,J. OEHLSCHLAGERb, S. OSTAPCHENKOb, S. OVERi , M. PETCUh , J. PETROVICj , T. PIEROGb ,S. PLEWNIAb, J. RAUTENBERGc , H. REBELb, M. ROTHb , H. SCHIELERb , O. SIMAm , K. SINGHj ,M. STUMPERTg , G. TOMAh, G.C. TRINCHEROk , H. ULRICHb , J. VAN BURENb , W. WALKOWIAKi ,A. WEINDLb , J. WOCHELEb , J. ZABIEROWSKIl , J.A. ZENSUSf .a Inst. Prozessdatenverarbeitung und Elektronik, Forschungszentrum Karlsruhe, Germanyb Institut fur Kernphysik, Forschungszentrum Karlsruhe, Germanyc Fachbereich Physik, Universitat Wuppertal, Germanyd ASTRON, Dwingeloo, The Netherlandse Dipartimento di Fisica Generale dell’Universita Torino, Italyf Max-Planck-Institut fur Radioastronomie Bonn, Germanyg Institut fur Experimentelle Kernphysik, Universitat Karlsruhe, Germanyh National Institute of Physics and Nuclear Engineering Bucharest, Romaniai Fachbereich Physik, Universitat Siegen, Germanyj Dept. of Astrophysics, Radboud University Nijmegen, The Netherlandsk Istituto di Fisica dello Spazio Interplanetario, INAF Torino, Italyl Soltan Institute for Nuclear Studies Lodz, Polandm Department of Physics, University of Bucharest, [email protected]
Abstract: In the framework of LOPES (LOFAR PrototypE Station), a Self-Triggered Array of Radiodetectors (STAR) is developed. The challenge of LOPESSTAR is to provide an independent self-triggeron radio emission of extensive air showers with primary energies above 5 · 1017 eV.Measurements are done with an external trigger and self-trigger in radio loud and quiet areas. Based onthese data the self-trigger is optimised and higher level triggers are developed, as well as algorithms forreconstruction of shower observables. The methods and first results from LOPESSTAR are described.
Introduction
On site of the Forschungszentrum Karlsruhe (FZK)in a first step 10 and later additional 20 short dipoleantennas with an inverted V-shape (LOPES30)with east/west polarisation were installed and trig-gered by KASCADE [1, 2].
To optimise these techniques and to provide anindependent trigger system for radio emission ofUltra High Energy Cosmic Rays (UHECRs) theLOPESSTAR detector was developed. Two an-tenna clusters, each with 4 logarithmically peri-odic dipole antennas (LPDAs) and two polarisationchannels – east/west & north/south (8 channels),
6565
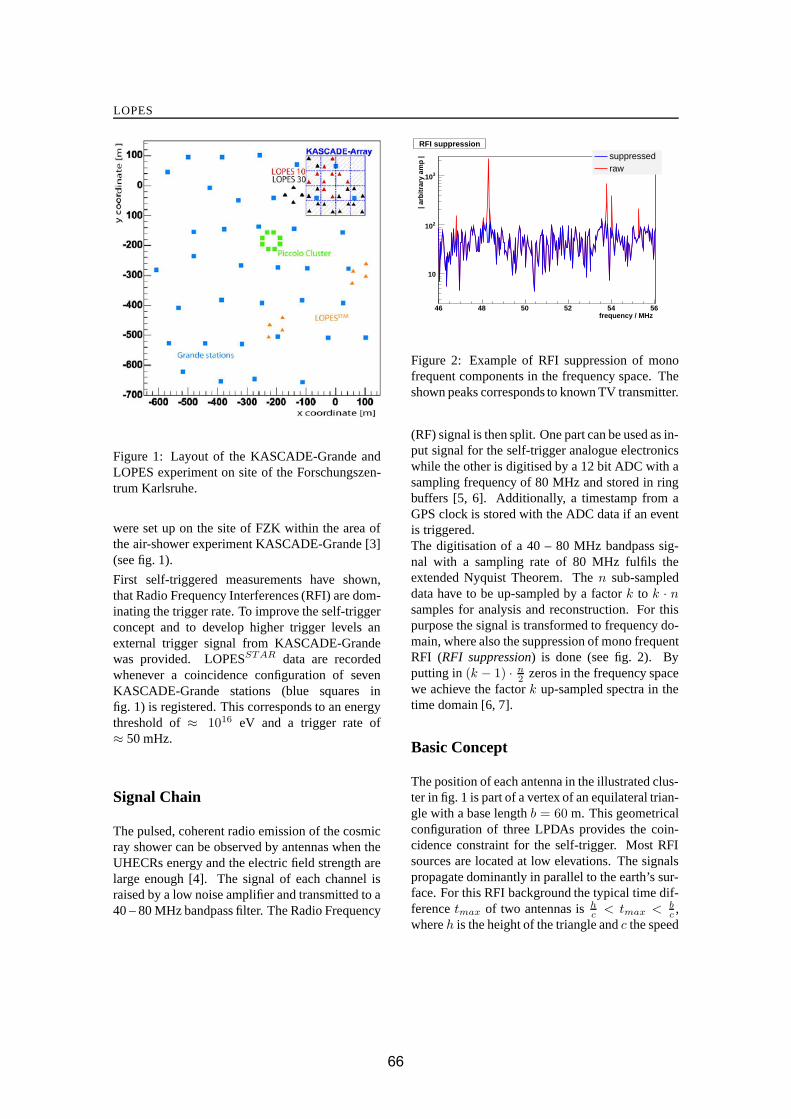
LOPES
Figure 1: Layout of the KASCADE-Grande andLOPES experiment on site of the Forschungszen-trum Karlsruhe.
were set up on the site of FZK within the area ofthe air-shower experiment KASCADE-Grande [3](see fig. 1).
First self-triggered measurements have shown,that Radio Frequency Interferences (RFI) are dom-inating the trigger rate. To improve the self-triggerconcept and to develop higher trigger levels anexternal trigger signal from KASCADE-Grandewas provided. LOPESSTAR data are recordedwhenever a coincidence configuration of sevenKASCADE-Grande stations (blue squares infig. 1) is registered. This corresponds to an energythreshold of ≈ 1016 eV and a trigger rate of≈ 50 mHz.
Signal Chain
The pulsed, coherent radio emission of the cosmicray shower can be observed by antennas when theUHECRs energy and the electric field strength arelarge enough [4]. The signal of each channel israised by a low noise amplifier and transmitted to a40 – 80 MHz bandpass filter. The Radio Frequency
frequency / MHz 46 48 50 52 54 56
| arb
itra
ry a
mp
|
10
210
310
suppressedraw
RFI suppression
Figure 2: Example of RFI suppression of monofrequent components in the frequency space. Theshown peaks corresponds to known TV transmitter.
(RF) signal is then split. One part can be used as in-put signal for the self-trigger analogue electronicswhile the other is digitised by a 12 bit ADC with asampling frequency of 80 MHz and stored in ringbuffers [5, 6]. Additionally, a timestamp from aGPS clock is stored with the ADC data if an eventis triggered.The digitisation of a 40 – 80 MHz bandpass sig-nal with a sampling rate of 80 MHz fulfils theextended Nyquist Theorem. The n sub-sampleddata have to be up-sampled by a factor k to k · nsamples for analysis and reconstruction. For thispurpose the signal is transformed to frequency do-main, where also the suppression of mono frequentRFI (RFI suppression) is done (see fig. 2). Byputting in (k − 1) · n
2 zeros in the frequency spacewe achieve the factor k up-sampled spectra in thetime domain [6, 7].
Basic Concept
The position of each antenna in the illustrated clus-ter in fig. 1 is part of a vertex of an equilateral trian-gle with a base length b = 60 m. This geometricalconfiguration of three LPDAs provides the coin-cidence constraint for the self-trigger. Most RFIsources are located at low elevations. The signalspropagate dominantly in parallel to the earth’s sur-face. For this RFI background the typical time dif-ference tmax of two antennas is h
c < tmax < bc ,
where h is the height of the triangle and c the speed
6666

30TH INTERNATIONAL COSMIC RAY CONFERENCE
1
10
210
310
410
number of pulses0 5 10 15 20 25
sig
nal
to
no
ise
rati
o
0
100
200
300
400
500
600
700
800
900
Quality per RF ChannelQuality per RF Channel
Figure 3: Signal to noise ratio versus the detectednumber of pulses with eight entries per event. Thedashed lines indicate the Quality Cut.
of light. For zenith angles θ ≤ 60◦ most of thecosmic ray events are detected. The adjusted co-incidence time 0 ≤ tc < tmax is used to suppresshorizontal background.
New Approach
In a first step, a simple approach for the self-triggeranalogue electronics was chosen. The sum of en-velope signals of two polarisations of one antennais compared with a fixed, but adjustable, thresholdfor all antennas. If this constraint per antenna isfulfilled within a given coincidence time tc a trig-ger is generated and the data are stored.The used fixed threshold, but also the addition ofthe envelope signals of one antenna were not ef-fective to get a threshold equivalent to 1018 eV toobtain sufficient background suppression in triplecoincidences. Therefore we developed a classifica-tion system to reject background and a new strat-egy to accept shower events.
Classification
The analysis is based on a 27d dataset triggeredexternally by KASCADE-Grande (2006-12-12 to2007-01-07) in a four antenna array in the lowermiddle of KASCADE-Grande. More than 102,000events are recorded with a primary energy E >1016 eV.Events including one RF channel with a signal
1
10
210
position of pulse / 12.5 ns0 200 400 600 800 1000 1200 1400 1600 1800 2000 2200
len
gth
of
pu
lse
/ 12.
5 n
s
0
20
40
60
80
100
120
applied Quality Cutapplied Quality Cut
Figure 4: Shown is length of pulses versus posi-tion of pulse of all channels accepted by the Qual-ity Cut.
larger than the range of the ADC are rejected forthis analysis. RFI suppression is applied to all re-maining RF channels. Four classification parame-ters are calculated: signal to noise ratio – The ra-tio of the peak value and noise in the squared 2048point sub-sampled data. number of pulses – No.of pulses above a dynamically defined thresholdcounted on base of the sub-sampled data. lengthof pulse – The width of the peak of an envelopein the up-sampled data is calculated. position ofpulse – The position of the peak in the time do-main is calculated in the up-sampled data.
New Strategy
The distribution of the signal to noise ratio versusnumber of pulses is illustrated in fig. 3 and showsper event eight entries. As expected, the num-ber of pulses is high if the signal to noise ratio issmall. In this case the algorithm to count the pulsesdoes not work efficiently, because the threshold isjust above the noisy background. If the signal tonoise ratio is > 100 the counted pulses are clearlyvisible pulses. On the other hand, the expectednumber of pulses are low, if more than five pulsesare detected the broad band RFI is for this chan-nel too high. The quality per RF channel is de-fined to be good by the cut signal to noise ratio >75 AND number of pulses < 5.
The length of pulses versus position of pulse of theaccepted RF channels are plotted in fig. 4. RFI
6767

LOPES
0
2
4
6
8
10
12
14
position of pulse / 12.5 ns0 200 400 600 800 1000 1200 1400 1600 1800 2000 2200
len
gth
of
pu
lse
/ 12.
5 n
s
0
20
40
60
80
100
120
140
applied Quality Cut and L0 Triggerapplied Quality Cut and L0 Trigger
Figure 5: Applied are the Quality Cut and L0 trig-ger. The black lines indicate a part of further cuts.
signals are distributed randomly over the recordedtime window. The maximum length of pulsecorresponds to the mean length of RFI pulsestmean,RFI = 475 ns at the antenna array. The de-creasing mean length of pulses for low and highvalues of the recorded time are due to the usedwindow function for Fourier transformation. Only21,000 events (20%) of the given data sample areaccepted for further analysis.The Quality Cut acts like a monitor for each RFchannel. The impact is directly visible in fig. 4.Each event which has at least one RF channel ac-cepted by the Quality Cut is analysed by the fol-lowing Level Zero (L0) trigger which verifies thecoincidence of all RF channels. The envelope anda dynamic threshold of each polarisation per an-tenna (eight RF channels) are calculated. In thecase of broad band RFI in several RF channels it isimportant to suppress these channels for the triggerdecision.The basic idea is to verify all possible coincidencesof all RF channels of one triangle and to ensure thatat least one RF channel per antenna is included.This also implies a comparison of different polari-sations. The contribution of the signal strength ineach polarisation is given by the geomagnetic an-gle (angle between shower axis and geomagneticfield) but is identical in both polarisations. 269events (0.026%) of the given data sample are ac-cepted by the L0 trigger. Due to the dynamicthreshold per channel this mechanism is able to de-tect UHECR events in radio loud environments.
Applying the Quality Cut and L0 trigger on thedata sample results to fig. 5. A suppression ofRFI and random signals is visible. Due to theknowledge of the trigger delay and the expectedtime length of the observed radio signal the peakillustrated in fig. 5 corresponds to shower candi-dates. The black lines show a part of the finalcuts to determine radio events. The cut is given bynumber of pulses = 1 AND detected channels >2. Any event which includes one RF channel thatfulfils this constraints is accepted and results to 12out of 102,000 events. 5 of these events are in goodagreement with the reconstructed shower directionby a plane fit compared with the reconstructed di-rection of KASCADE-Grande.
Conclusion
The detection of coherent radio emission ofUHECR with an independent and self-triggereddetector is the challenge of LOPESSTAR . Onsite of the Forschungszentrum Karlsruhe data aretaken in coincidence with the air-shower experi-ment KASCADE-Grande. Based on this data sam-ple a trigger strategy was developed. The dataquality of each channel is monitored while a co-incidence check is independent of the polarisationand noisy channels are suppressed. The intro-duced algorithm detected 12 shower candidates outof 102,000 triggered events. With the benefit ofthe KASCADE-Grande reconstruction 5 UHECRevents with a reconstructed energy E > 7 ·1017 eVare detected.
References
[1] T. Antoni et al., Nucl. Instr. Methods A,513:490, 2003
[2] A. Horneffer, PhD Thesis, University Bonn,2006
[3] G. Navarra et al., Nucl. Instr. Methods A,518:207, 2004
[4] T. Huege, H. Falcke, Astropart. Physics 24,116-136, 2005
[5] H. Gemmeke et al., Intern. Journal of Mod.Physics A, 21:242, 2006
[6] T. Asch et al., Proc. VCI, 2007 in print[7] H. Nyquist, Proc. IEEE, Vol. 90, No. 2, 2002
6868

30TH INTERNATIONAL COSMIC RAY CONFERENCE
REAS2:CORSIKA-based Monte Carlo simulations of geosynchrotron radio emission
T. HUEGE1, R. ULRICH1, R. ENGEL1.1Institut fur Kernphysik, Forschungszentrum Karlsruhe, Postfach 3640, 76021 Karlsruhe, [email protected]
Abstract: Simulations of geosynchrotron radio emission from extensive air showers performed with theMonte Carlo code REAS1 used analytical parameterisations to describe the spatial, temporal, energyand angular particle distributions in air showers. The successor REAS2 replaces these parameterisationswith precise, multi-dimensional histograms derived from per-shower CORSIKA simulations. REAS2allows an independent selection between parameterisation and histogram for each of the relevant particledistributions, enabling us to study the changes arising from using a more realistic air shower model indetail. We describe the new simulation strategy and illustrate the effects introduced by the improved airshower model.
Introduction
From results of the LOPES experiment [1], radioemission from cosmic ray air showers is known tobe dominated by a geomagnetic emission mech-anism that can be described with the “geosyn-chrotron model” [2]. In the geosynchrotron pro-cess, relativistic secondary shower electrons andpositrons are deflected in the earth’s magneticfield, thereby giving rise to strongly pulsed, co-herent radio emission in the frequency range from∼ 10 to 100 MHz. In the recent years, thegeosynchrotron model had evolved from analyticfrequency-domain calculations [4] to time-domainMonte Carlo simulations based on an analytical de-scription of the underlying extensive air shower,as implemented in the REAS1 simulation code[5]. Many general properties of the radio emis-sion have been predicted since using REAS1 [6].The successor to this code, REAS2, now featuresan implementation of the geosynchrotron modelno longer based on analytically parameterised airshower properties, but using realistic, per-showerCORSIKA [3] simulations to model the spatial,temporal, energy and angular distributions of theshower particles. In this article, we describe thechanges arising from the much more realistic airshower model and illustrate the potential of the
new simulation code for advanced studies of theradio pulse shape.
REAS2 air shower model
While the electromagnetic emission model has notchanged between REAS1 and REAS2, REAS2simulations are now based on very detailed parti-cle information derived with CORSIKA on a per-shower basis. For each individual air shower,CORSIKA writes out separate information forelectrons and positrons sampled in (usually) 50layers between the point of first interaction and theobserver position. Each layer encompasses
• one three-dimensional histogram of
1. particle arrival time relative to that ofan imaginary primary particle propa-gating with the speed of light from thepoint of first interaction
2. lateral distance of the particle from theshower core
3. particle energy
• and one three-dimensional histogram of
1. angle of the particle momentum to theshower axis
6969

REAS2 GEOSYNCHROTRON SIMULATIONS
2. angle of the particle momentum to the(radial) outward direction
3. particle energy.
These histograms give REAS2 access to a truefour-dimensional distribution of particles in atmo-spheric depth, arrival time, lateral distance and en-ergy, and in addition describe the angular distri-bution of particle momenta as a function of par-ticle energy and atmospheric depth. The chosenseparation of the distributions into two histogramsensures that the necessary amounts of data can behandled on standard PCs while making approxima-tions of only minor significance for the simulationof the radio signal. (The most important drawbackof this scheme is the loss of information on az-imuthal asymmetries in the air shower.) Naturally,effects associated with air showers induced by dif-ferent types of primary particles can be analysed indetail with this simulation strategy. The longitudi-nal evolution of the air shower is sampled on an ad-ditional, finer grid (usually) spaced with 5 g cm−2
distance.
REAS2 vs. REAS1 results
Incorporating the new CORSIKA-based air showermodel and some additional enhancements, theREAS2 code provides a much more realistic deter-mination of geosynchrotron radio emission than itspredecessor REAS1. A particular merit of the cho-sen approach is that the transition from the REAS1to the REAS2 air shower model can be performedin a gradual fashion, switching the different parti-cle distributions (spatial, temporal, energy, and an-gular) from parameterised to histogrammed one ata time and analysing the changes arising in the ra-dio signal. The corresponding effects and techni-cal details have been discussed elsewhere [8]; herewe only compare the end result of REAS2 simu-lations with those of REAS1 simulations for thetypical reference case of a vertical 1017 eV proton-induced air shower. As presented in Fig. 1, the ra-dio pulses calculated with REAS2 for an observerto the north of the shower core show only moderatechanges in comparison with the REAS1-generatedpulses. In particular, the pulses close to the core(75 m corresponds to the typical lateral distancein the LOPES experiment) get considerably nar-
rower, caused by the narrower arrival time dis-tributions provided by CORSIKA in comparisonwith the parameterisation used in REAS1. Con-sequently, the frequency spectrum of the emissionclose to the core gets much flatter for the REAS2-calculated pulses (Fig. 2). Further away from thecore (525 m corresponds to the distance range ofinterest for larger scale radio antenna arrays), theamplitude drops by a factor of ∼ 2, mainly asa consequence of the much broader angular dis-tribution of particle momenta derived from COR-SIKA. Interestingly, the overall field strength inthe frequency band used by the LOPES experiment(40 to 80 MHz) does not change significantly be-tween REAS1 and REAS2 (Fig. 2). A more sig-
-400
-200
0
200
400
600
800
1000
1200
0 50 100 150 200
field
str
engt
h [μ
V/m
]
time [ns]
REAS1 75 mREAS2 75 m
REAS1 525 m (x 20)REAS2 525 m (x 20)
Figure 3: Comparison of REAS1 and REAS2-simulated radio pulses at 75 m and 525 m west ofthe shower core. The bipolar pulses present in theREAS1 simulations are no longer present.
nificant change becomes visible when studying thechanges to the radio pulses for an observer west ofthe shower core, as depicted in Fig. 3. First, a sig-nificant drop in pulse amplitude close to the showercore can be identified. This leads to a pronouncedeast-west versus north-south asymmetry in the ra-dio “footprint”, even for vertical air showers (cf.Fig. 4). At larger distances, a qualitative changein the pulse shape takes place: while REAS1-generated pulses in this region showed bipolarstructures, the REAS2-calculated signals becomeuniversally unipolar. The bipolar pulse shapes inthe REAS1 calculations can be considered arti-facts of over-simplified particle distributions (e.g.,in the momentum angles), and the REAS2 resultsdescribe the geosynchrotron emission much morerealistically. Another important characteristic of
7070
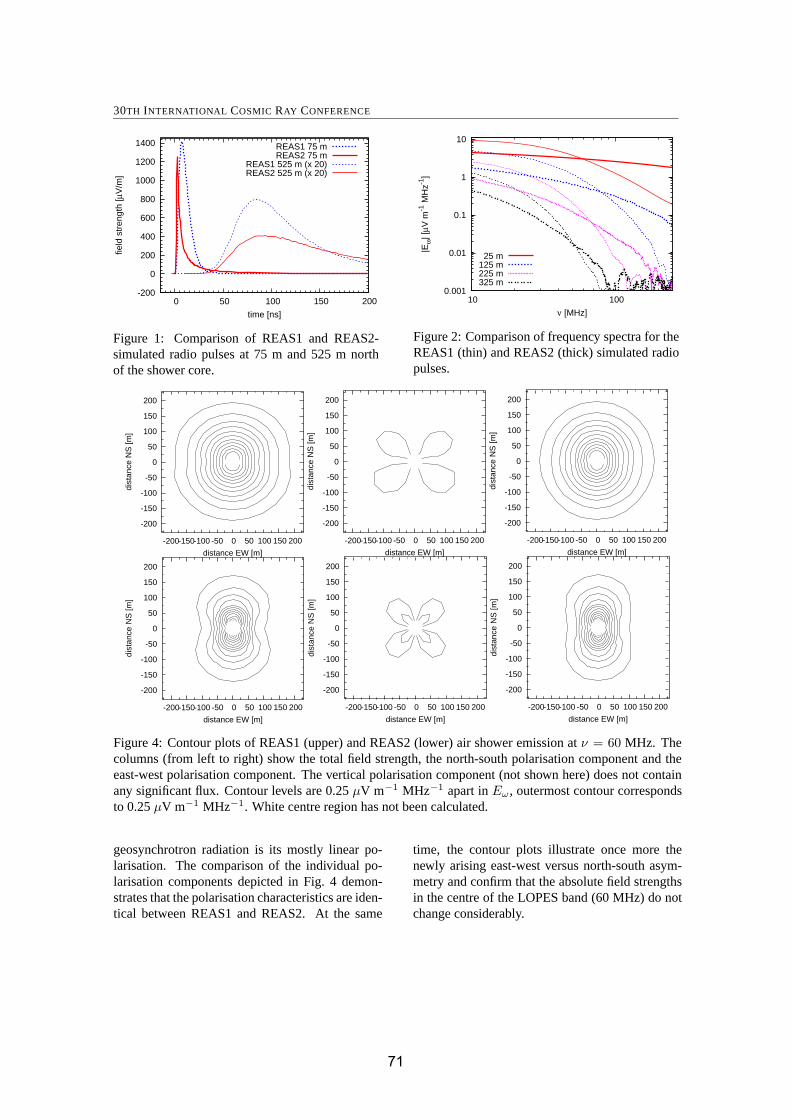
30TH INTERNATIONAL COSMIC RAY CONFERENCE
-200
0
200
400
600
800
1000
1200
1400
0 50 100 150 200
field
str
engt
h [μ
V/m
]
time [ns]
REAS1 75 mREAS2 75 m
REAS1 525 m (x 20)REAS2 525 m (x 20)
Figure 1: Comparison of REAS1 and REAS2-simulated radio pulses at 75 m and 525 m northof the shower core.
0.001
0.01
0.1
1
10
10 100
|Eω| [
μV m
-1 M
Hz-1
]
ν [MHz]
25 m125 m225 m325 m
Figure 2: Comparison of frequency spectra for theREAS1 (thin) and REAS2 (thick) simulated radiopulses.
-200
-150
-100
-50
0
50
100
150
200
-200-150-100 -50 0 50 100 150 200
dist
ance
NS
[m]
distance EW [m]
-200
-150
-100
-50
0
50
100
150
200
-200-150-100 -50 0 50 100 150 200
dist
ance
NS
[m]
distance EW [m]
-200
-150
-100
-50
0
50
100
150
200
-200-150-100 -50 0 50 100 150 200
dist
ance
NS
[m]
distance EW [m]
-200
-150
-100
-50
0
50
100
150
200
-200-150-100 -50 0 50 100 150 200
dist
ance
NS
[m]
distance EW [m]
-200
-150
-100
-50
0
50
100
150
200
-200-150-100 -50 0 50 100 150 200
dist
ance
NS
[m]
distance EW [m]
-200
-150
-100
-50
0
50
100
150
200
-200-150-100 -50 0 50 100 150 200
dist
ance
NS
[m]
distance EW [m]
Figure 4: Contour plots of REAS1 (upper) and REAS2 (lower) air shower emission at ν = 60 MHz. Thecolumns (from left to right) show the total field strength, the north-south polarisation component and theeast-west polarisation component. The vertical polarisation component (not shown here) does not containany significant flux. Contour levels are 0.25 μV m−1 MHz−1 apart in Eω , outermost contour correspondsto 0.25 μV m−1 MHz−1. White centre region has not been calculated.
geosynchrotron radiation is its mostly linear po-larisation. The comparison of the individual po-larisation components depicted in Fig. 4 demon-strates that the polarisation characteristics are iden-tical between REAS1 and REAS2. At the same
time, the contour plots illustrate once more thenewly arising east-west versus north-south asym-metry and confirm that the absolute field strengthsin the centre of the LOPES band (60 MHz) do notchange considerably.
7171
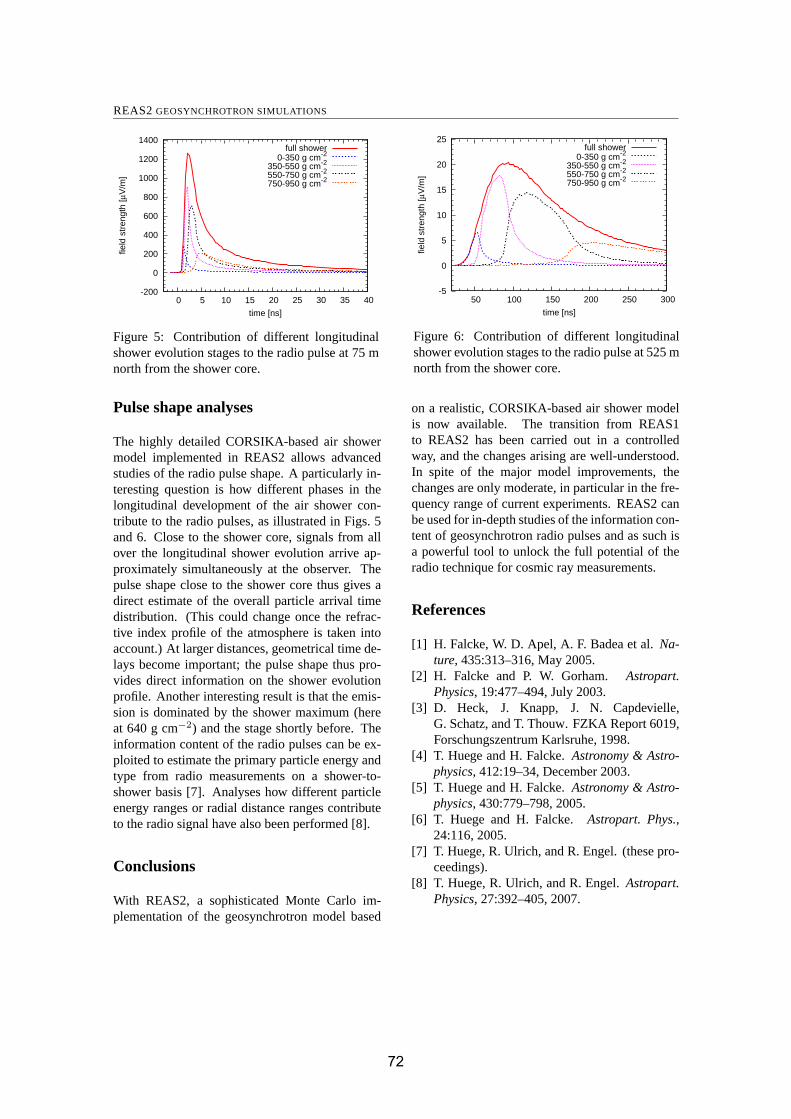
REAS2 GEOSYNCHROTRON SIMULATIONS
-200
0
200
400
600
800
1000
1200
1400
0 5 10 15 20 25 30 35 40
field
str
engt
h [μ
V/m
]
time [ns]
full shower0-350 g cm-2
350-550 g cm-2
550-750 g cm-2
750-950 g cm-2
Figure 5: Contribution of different longitudinalshower evolution stages to the radio pulse at 75 mnorth from the shower core.
-5
0
5
10
15
20
25
50 100 150 200 250 300
field
str
engt
h [μ
V/m
]
time [ns]
full shower0-350 g cm-2
350-550 g cm-2
550-750 g cm-2
750-950 g cm-2
Figure 6: Contribution of different longitudinalshower evolution stages to the radio pulse at 525 mnorth from the shower core.
Pulse shape analyses
The highly detailed CORSIKA-based air showermodel implemented in REAS2 allows advancedstudies of the radio pulse shape. A particularly in-teresting question is how different phases in thelongitudinal development of the air shower con-tribute to the radio pulses, as illustrated in Figs. 5and 6. Close to the shower core, signals from allover the longitudinal shower evolution arrive ap-proximately simultaneously at the observer. Thepulse shape close to the shower core thus gives adirect estimate of the overall particle arrival timedistribution. (This could change once the refrac-tive index profile of the atmosphere is taken intoaccount.) At larger distances, geometrical time de-lays become important; the pulse shape thus pro-vides direct information on the shower evolutionprofile. Another interesting result is that the emis-sion is dominated by the shower maximum (hereat 640 g cm−2) and the stage shortly before. Theinformation content of the radio pulses can be ex-ploited to estimate the primary particle energy andtype from radio measurements on a shower-to-shower basis [7]. Analyses how different particleenergy ranges or radial distance ranges contributeto the radio signal have also been performed [8].
Conclusions
With REAS2, a sophisticated Monte Carlo im-plementation of the geosynchrotron model based
on a realistic, CORSIKA-based air shower modelis now available. The transition from REAS1to REAS2 has been carried out in a controlledway, and the changes arising are well-understood.In spite of the major model improvements, thechanges are only moderate, in particular in the fre-quency range of current experiments. REAS2 canbe used for in-depth studies of the information con-tent of geosynchrotron radio pulses and as such isa powerful tool to unlock the full potential of theradio technique for cosmic ray measurements.
References
[1] H. Falcke, W. D. Apel, A. F. Badea et al. Na-ture, 435:313–316, May 2005.
[2] H. Falcke and P. W. Gorham. Astropart.Physics, 19:477–494, July 2003.
[3] D. Heck, J. Knapp, J. N. Capdevielle,G. Schatz, and T. Thouw. FZKA Report 6019,Forschungszentrum Karlsruhe, 1998.
[4] T. Huege and H. Falcke. Astronomy & Astro-physics, 412:19–34, December 2003.
[5] T. Huege and H. Falcke. Astronomy & Astro-physics, 430:779–798, 2005.
[6] T. Huege and H. Falcke. Astropart. Phys.,24:116, 2005.
[7] T. Huege, R. Ulrich, and R. Engel. (these pro-ceedings).
[8] T. Huege, R. Ulrich, and R. Engel. Astropart.Physics, 27:392–405, 2007.
7272
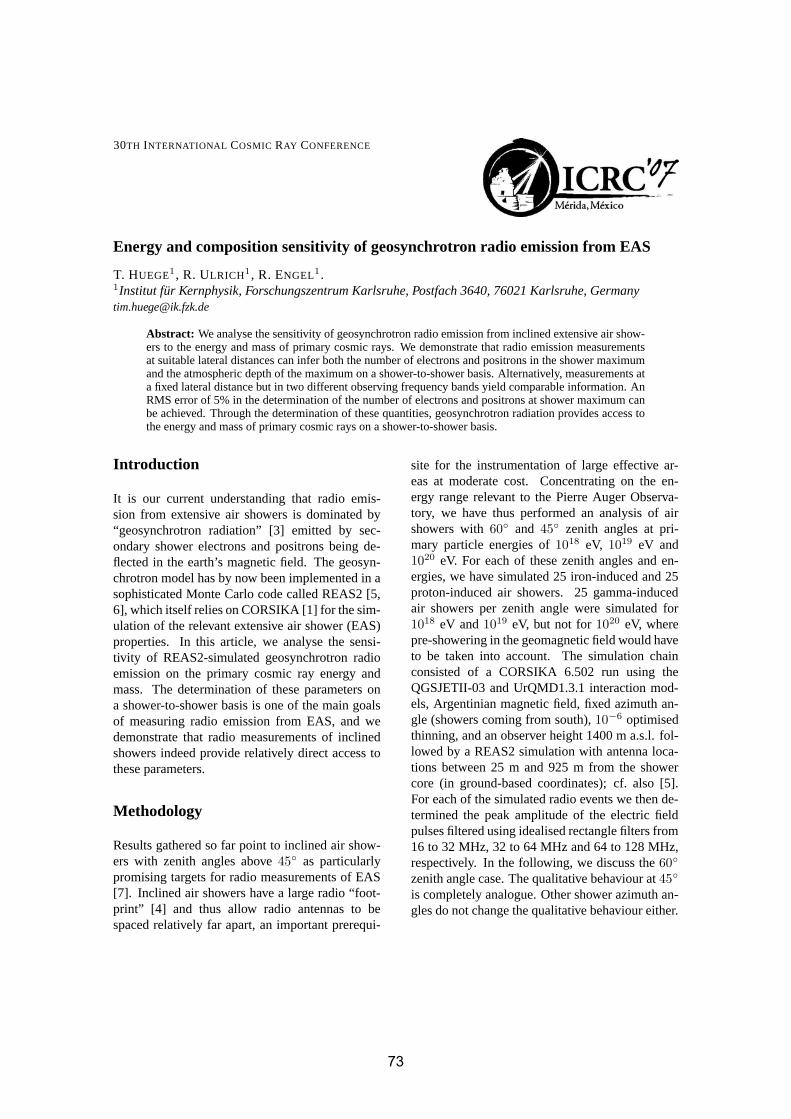
30TH INTERNATIONAL COSMIC RAY CONFERENCE
Energy and composition sensitivity of geosynchrotron radio emission from EAS
T. HUEGE1, R. ULRICH1, R. ENGEL1.1Institut fur Kernphysik, Forschungszentrum Karlsruhe, Postfach 3640, 76021 Karlsruhe, [email protected]
Abstract: We analyse the sensitivity of geosynchrotron radio emission from inclined extensive air show-ers to the energy and mass of primary cosmic rays. We demonstrate that radio emission measurementsat suitable lateral distances can infer both the number of electrons and positrons in the shower maximumand the atmospheric depth of the maximum on a shower-to-shower basis. Alternatively, measurements ata fixed lateral distance but in two different observing frequency bands yield comparable information. AnRMS error of 5% in the determination of the number of electrons and positrons at shower maximum canbe achieved. Through the determination of these quantities, geosynchrotron radiation provides access tothe energy and mass of primary cosmic rays on a shower-to-shower basis.
Introduction
It is our current understanding that radio emis-sion from extensive air showers is dominated by“geosynchrotron radiation” [3] emitted by sec-ondary shower electrons and positrons being de-flected in the earth’s magnetic field. The geosyn-chrotron model has by now been implemented in asophisticated Monte Carlo code called REAS2 [5,6], which itself relies on CORSIKA [1] for the sim-ulation of the relevant extensive air shower (EAS)properties. In this article, we analyse the sensi-tivity of REAS2-simulated geosynchrotron radioemission on the primary cosmic ray energy andmass. The determination of these parameters ona shower-to-shower basis is one of the main goalsof measuring radio emission from EAS, and wedemonstrate that radio measurements of inclinedshowers indeed provide relatively direct access tothese parameters.
Methodology
Results gathered so far point to inclined air show-ers with zenith angles above 45◦ as particularlypromising targets for radio measurements of EAS[7]. Inclined air showers have a large radio “foot-print” [4] and thus allow radio antennas to bespaced relatively far apart, an important prerequi-
site for the instrumentation of large effective ar-eas at moderate cost. Concentrating on the en-ergy range relevant to the Pierre Auger Observa-tory, we have thus performed an analysis of airshowers with 60◦ and 45◦ zenith angles at pri-mary particle energies of 1018 eV, 1019 eV and1020 eV. For each of these zenith angles and en-ergies, we have simulated 25 iron-induced and 25proton-induced air showers. 25 gamma-inducedair showers per zenith angle were simulated for1018 eV and 1019 eV, but not for 1020 eV, wherepre-showering in the geomagnetic field would haveto be taken into account. The simulation chainconsisted of a CORSIKA 6.502 run using theQGSJETII-03 and UrQMD1.3.1 interaction mod-els, Argentinian magnetic field, fixed azimuth an-gle (showers coming from south), 10−6 optimisedthinning, and an observer height 1400 m a.s.l. fol-lowed by a REAS2 simulation with antenna loca-tions between 25 m and 925 m from the showercore (in ground-based coordinates); cf. also [5].For each of the simulated radio events we then de-termined the peak amplitude of the electric fieldpulses filtered using idealised rectangle filters from16 to 32 MHz, 32 to 64 MHz and 64 to 128 MHz,respectively. In the following, we discuss the 60◦
zenith angle case. The qualitative behaviour at 45◦
is completely analogue. Other shower azimuth an-gles do not change the qualitative behaviour either.
7373
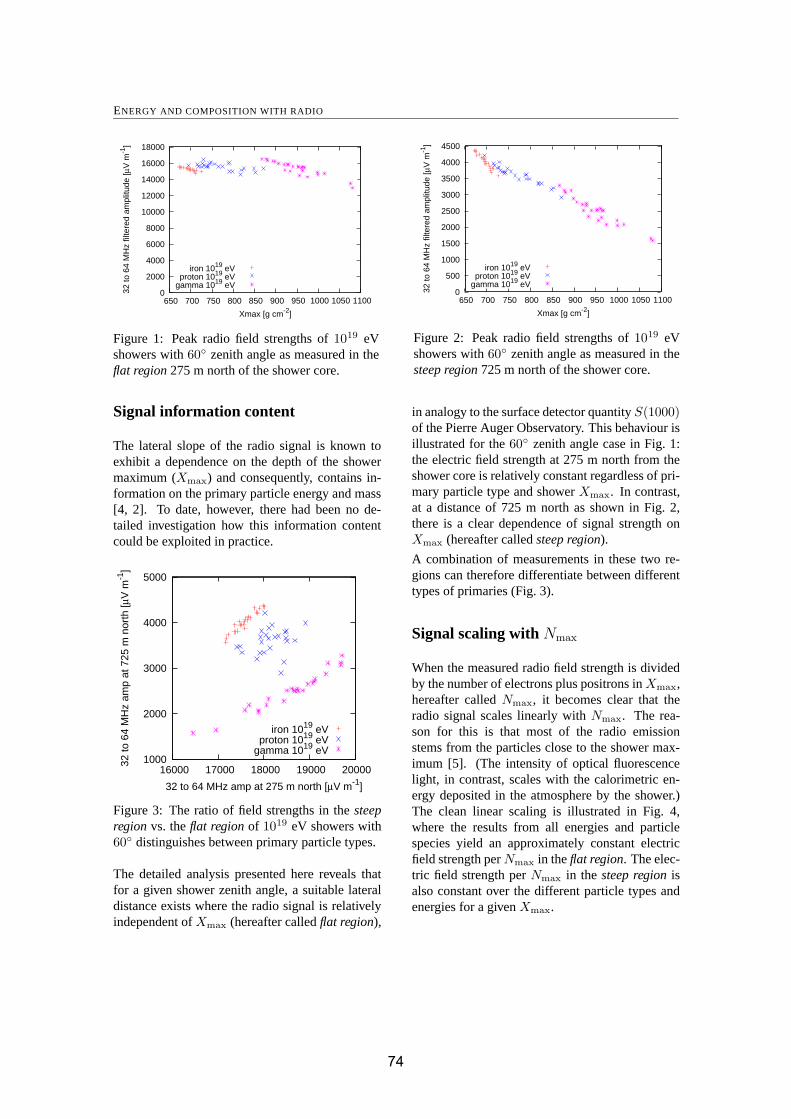
ENERGY AND COMPOSITION WITH RADIO
0
2000
4000
6000
8000
10000
12000
14000
16000
18000
650 700 750 800 850 900 950 1000 1050 1100
32 to
64
MH
z fil
tere
d am
plitu
de [μ
V m
-1]
Xmax [g cm-2]
iron 1019 eVproton 1019 eV
gamma 1019 eV
Figure 1: Peak radio field strengths of 1019 eVshowers with 60◦ zenith angle as measured in theflat region 275 m north of the shower core.
0
500
1000
1500
2000
2500
3000
3500
4000
4500
650 700 750 800 850 900 950 1000 1050 1100
32 to
64
MH
z fil
tere
d am
plitu
de [μ
V m
-1]
Xmax [g cm-2]
iron 1019 eVproton 1019 eV
gamma 1019 eV
Figure 2: Peak radio field strengths of 1019 eVshowers with 60◦ zenith angle as measured in thesteep region 725 m north of the shower core.
Signal information content
The lateral slope of the radio signal is known toexhibit a dependence on the depth of the showermaximum (Xmax) and consequently, contains in-formation on the primary particle energy and mass[4, 2]. To date, however, there had been no de-tailed investigation how this information contentcould be exploited in practice.
1000
2000
3000
4000
5000
16000 17000 18000 19000 20000
32 to
64
MH
z am
p at
725
m n
orth
[μV
m-1
]
32 to 64 MHz amp at 275 m north [μV m-1]
iron 1019 eVproton 1019 eV
gamma 1019 eV
Figure 3: The ratio of field strengths in the steepregion vs. the flat region of 1019 eV showers with60◦ distinguishes between primary particle types.
The detailed analysis presented here reveals thatfor a given shower zenith angle, a suitable lateraldistance exists where the radio signal is relativelyindependent of Xmax (hereafter called flat region),
in analogy to the surface detector quantity S(1000)of the Pierre Auger Observatory. This behaviour isillustrated for the 60◦ zenith angle case in Fig. 1:the electric field strength at 275 m north from theshower core is relatively constant regardless of pri-mary particle type and shower Xmax. In contrast,at a distance of 725 m north as shown in Fig. 2,there is a clear dependence of signal strength onXmax (hereafter called steep region).
A combination of measurements in these two re-gions can therefore differentiate between differenttypes of primaries (Fig. 3).
Signal scaling with Nmax
When the measured radio field strength is dividedby the number of electrons plus positrons in Xmax,hereafter called Nmax, it becomes clear that theradio signal scales linearly with Nmax. The rea-son for this is that most of the radio emissionstems from the particles close to the shower max-imum [5]. (The intensity of optical fluorescencelight, in contrast, scales with the calorimetric en-ergy deposited in the atmosphere by the shower.)The clean linear scaling is illustrated in Fig. 4,where the results from all energies and particlespecies yield an approximately constant electricfield strength per Nmax in the flat region. The elec-tric field strength per Nmax in the steep region isalso constant over the different particle types andenergies for a given Xmax.
7474
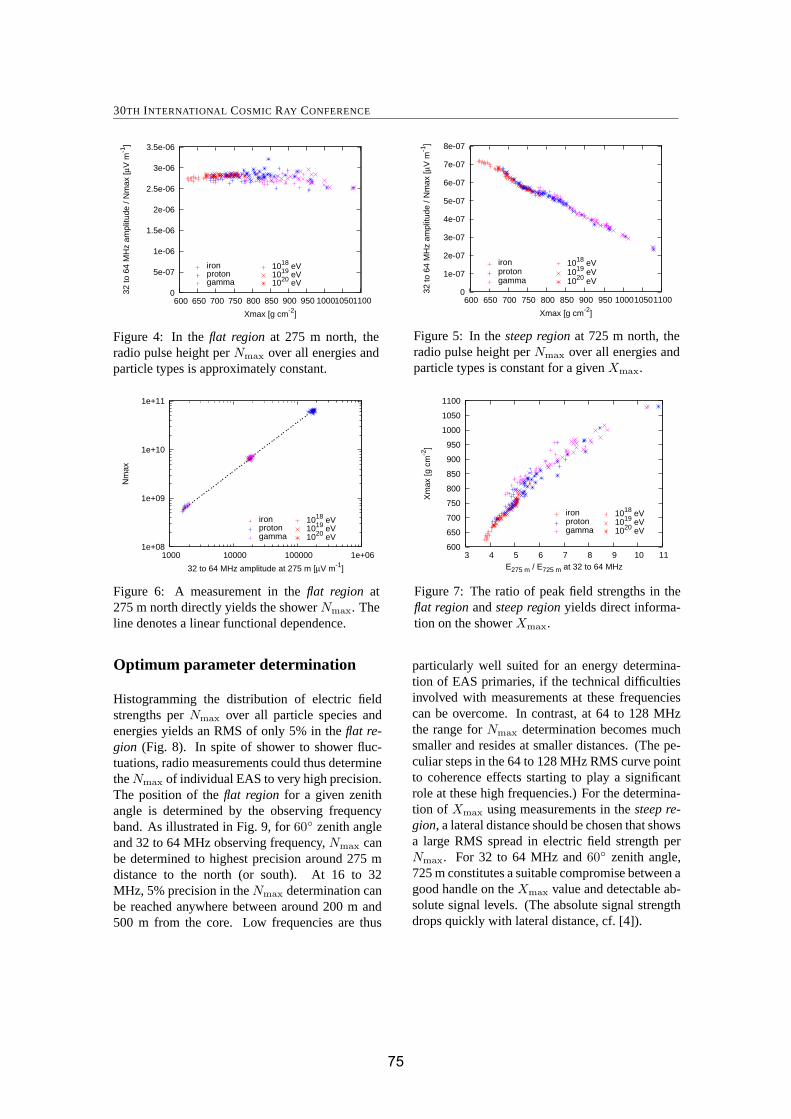
30TH INTERNATIONAL COSMIC RAY CONFERENCE
0
5e-07
1e-06
1.5e-06
2e-06
2.5e-06
3e-06
3.5e-06
600 650 700 750 800 850 900 950 1000 1050 1100
32 to
64
MH
z am
plitu
de /
Nm
ax [μ
V m
-1]
Xmax [g cm-2]
iron proton gamma
1018 eV 1019 eV 1020 eV
Figure 4: In the flat region at 275 m north, theradio pulse height per Nmax over all energies andparticle types is approximately constant.
0
1e-07
2e-07
3e-07
4e-07
5e-07
6e-07
7e-07
8e-07
600 650 700 750 800 850 900 950 1000 1050 1100
32 to
64
MH
z am
plitu
de /
Nm
ax [μ
V m
-1]
Xmax [g cm-2]
iron proton gamma
1018 eV 1019 eV 1020 eV
Figure 5: In the steep region at 725 m north, theradio pulse height per Nmax over all energies andparticle types is constant for a given Xmax.
1e+08
1e+09
1e+10
1e+11
1000 10000 100000 1e+06
Nm
ax
32 to 64 MHz amplitude at 275 m [μV m-1]
iron proton gamma
1018 eV 1019 eV 1020 eV
Figure 6: A measurement in the flat region at275 m north directly yields the shower Nmax. Theline denotes a linear functional dependence.
600
650
700
750
800
850
900
950
1000
1050
1100
3 4 5 6 7 8 9 10 11
Xm
ax [g
cm
-2]
E275 m / E725 m at 32 to 64 MHz
iron proton gamma
1018 eV 1019 eV 1020 eV
Figure 7: The ratio of peak field strengths in theflat region and steep region yields direct informa-tion on the shower Xmax.
Optimum parameter determination
Histogramming the distribution of electric fieldstrengths per Nmax over all particle species andenergies yields an RMS of only 5% in the flat re-gion (Fig. 8). In spite of shower to shower fluc-tuations, radio measurements could thus determinethe Nmax of individual EAS to very high precision.The position of the flat region for a given zenithangle is determined by the observing frequencyband. As illustrated in Fig. 9, for 60◦ zenith angleand 32 to 64 MHz observing frequency, Nmax canbe determined to highest precision around 275 mdistance to the north (or south). At 16 to 32MHz, 5% precision in the Nmax determination canbe reached anywhere between around 200 m and500 m from the core. Low frequencies are thus
particularly well suited for an energy determina-tion of EAS primaries, if the technical difficultiesinvolved with measurements at these frequenciescan be overcome. In contrast, at 64 to 128 MHzthe range for Nmax determination becomes muchsmaller and resides at smaller distances. (The pe-culiar steps in the 64 to 128 MHz RMS curve pointto coherence effects starting to play a significantrole at these high frequencies.) For the determina-tion of Xmax using measurements in the steep re-gion, a lateral distance should be chosen that showsa large RMS spread in electric field strength perNmax. For 32 to 64 MHz and 60◦ zenith angle,725 m constitutes a suitable compromise between agood handle on the Xmax value and detectable ab-solute signal levels. (The absolute signal strengthdrops quickly with lateral distance, cf. [4]).
7575

ENERGY AND COMPOSITION WITH RADIO
0
10
20
30
40
50
60
70
80
90
100
-20 -15 -10 -5 0 5 10 15 20
num
ber
of e
ntrie
s
deviation from mean 32 to 64 MHz amplitude/Nmax [%]
Figure 8: For 60◦ zenith angle showers, the RMSspread in peak field strength per Nmax in the flatregion over all energies and particle types amountsto ∼ 5%. In principle, Nmax can thus be inferredwith 5% uncertainty.
0
5
10
15
20
25
30
35
40
0 100 200 300 400 500 600 700 800 900 1000
RM
S d
evia
tion
from
mea
n am
p./p
art.
[%]
distance from shower core [m]
16 to 32 MHz32 to 64 MHz
64 to 128 MHz
Figure 9: Determination of the RMS uncertainty inpeak field strength per Nmax as a function of lat-eral (ground-coordinate) distance from the showercore. The flat region shifts to larger lateral dis-tances at lower frequencies.
Conclusions
Simulations of geosynchrotron radio emission withthe REAS2 Monte Carlo code reveal that informa-tion contained in the lateral profile of the radiosignal can be exploited for a direct determinationof Nmax and Xmax on a shower-to-shower basis.These quantities can in turn be related to the en-ergy and mass of the primary cosmic ray particle.
For a given zenith angle and observing frequencyband, distinct distance regimes denoted here as theflat region and the steep region can be identified.Measurements in the flat region directly yield theNmax of the shower, with an RMS deviation ofonly 5%. A comparison of peak field strengthsin the steep region and flat region for a given ob-serving bandwidth provides a direct estimate of theshower Xmax. Alternatively, measurements at afixed distance but in two different observing fre-quency bands provide comparable information.
The position of the flat region in case of 60◦ zenithangles for the observing frequency band from 32to 64 MHz lies at approximately 275 m and wouldthus require an antenna spacing of that order. (Thegiven number is valid for antenna positions alongthe shower axis; in the perpendicular direction thescales are smaller due to azimuthal asymmetries ofthe radio footprint.) If technical problems arisingin measurements at lower frequencies such as 16to 32 MHz can be overcome, antenna spacings of
up to 500 m will allow measurements in the flat re-gion. The qualitative behaviour at 45◦ zenith angleis analogue, yet at lower lateral distances. At largerzenith angles, the scales will be larger, but con-sistent simulations require the implementation ofcurved atmospheres for zenith angles much largerthan 60◦, which is currently being prepared.
References
[1] D. Heck, J. Knapp, J. N. Capdevielle,G. Schatz, and T. Thouw. FZKA Report 6019,Forschungszentrum Karlsruhe, 1998.
[2] T. Huege, W. D. Apel, A. F. Badea et al. InProc. of the 29th ICRC, Pune, India, volume 7,page 107, 2005. astro-ph/0507026.
[3] T. Huege and H. Falcke. Astronomy & Astro-physics, 412:19–34, December 2003.
[4] T. Huege and H. Falcke. Astropart. Phys.,24:116, 2005.
[5] T. Huege, R. Ulrich, and R. Engel. Astropart.Physics, 27:392–405, 2007.
[6] T. Huege, R. Ulrich, and R. Engel. In Proceed-ings of the 30th ICRC, Merida, Mexico, 2007.(these proceedings).
[7] J. Petrovic, W. D. Apel, T. Asch, F. Badea etal. Astronomy & Astrophysics, 462:389–395,2007.
7676
30TH INTERNATIONAL COSMIC RAY CONFERENCE
Calculation of radio emission from high-energy air showers
N. N. KALMYKOV1 , A. A. KONSTANTINOV1 , R. ENGEL2 .1 Scobeltsyn Institute of Nuclear Physics, Moscow State University, Leninskie Gory 1, 119991 Moscow,Russia2 Institut fur Kernphysik, Forschungszentrum Karlsruhe, 76021 Karlsruhe, [email protected]
Abstract: Results of the simulation of radio signals from 1017 eV extensive air showers are reported. Thesimulations are based on a track-by-track electric field calculation using the EGSnrc Monte Carlo showercode. The lateral distribution of the predicted radio emission is compatible with the recent LOPES-10experimental data at distances < 300 m. Perspectives of extending EAS radio emission calculations tothe ultra-high energy range (up to 1020 eV) are also discussed.
Introduction
Radio emission accompanying extensive air show-
ers (EAS) is considered as a promising alterna-
tive to traditional methods of high energy cosmic
ray detection. Recently, first measurements from
a new generation of radio antenna arrays, LOPES
[1], which is co-located with the KASCADE air
shower array [2], and CODALEMA [3], were pub-
lished. The experimentally found, good correla-
tion of the signal with the shower energy has also
renewed the interest in theoretical predictions [1].
In general, there are two approaches of calculating
the radio signal of an air shower.
The starting point of Askaryan’s predictions in
1961 was the model of the motion of effective
charges in EAS [4]. In [4] both electron excess
and charge separation in the Earth’s magnetic field
were proposed as responsible for the EAS radio
emission. In this picture a shower is considered as
a continuous system of charges and currents. Evi-
dently, the approach of calculating the radio emis-
sion for a system of charges and currents rather
than individual particles has the potential of being
numerically very efficient.
On the other hand, parametrizations of the overall
charges and currents in EAS have not yet been de-
veloped. Therefore it is very useful to start with
an approach that is based on following individual
particle trajectories using the Monte Carlo (MC)
technique. In such an approach, shower properties
can be included in the most accurate and simple
way, which, however, requires very large comput-
ing time at primary energies above 1015 eV.
Using the MC approach, EAS radio emission
has been theoretically investigated most inten-
sively within the framework of the “geosyn-
chrotron emission” model [5] proposed by Falcke
and Gorham in 2003 [6]. In this model, it is as-
sumed that the overall radio signal of air showers is
dominated by the radio emission due to the deflec-
tion of particle trajectories in the magnetic field of
the Earth. In the geosynchroton model, simulations
are performed in the time domain, i.e. the elec-
tric field contributions produced by shower parti-
cles are summed as function of the detection time
[5, 7]. The refractive index of air is taken as unity.
In this paper, we follow a more general approach
that does not explicitly distinguish between the
geosynchroton or Cherenkov radio signal. We
calculate the radio signal of each shower parti-
cle in Fourier space (frequency domain). Signal
contributions due to start and end points of parti-
cle trajectories and localized momentum changes
in Coulomb scattering and bremsstrahlung are in-
cluded as well as the continuous deflection in the
Earth’s magnetic field. The refractive index of air
is naturally accounted for in the simulation.
77
77
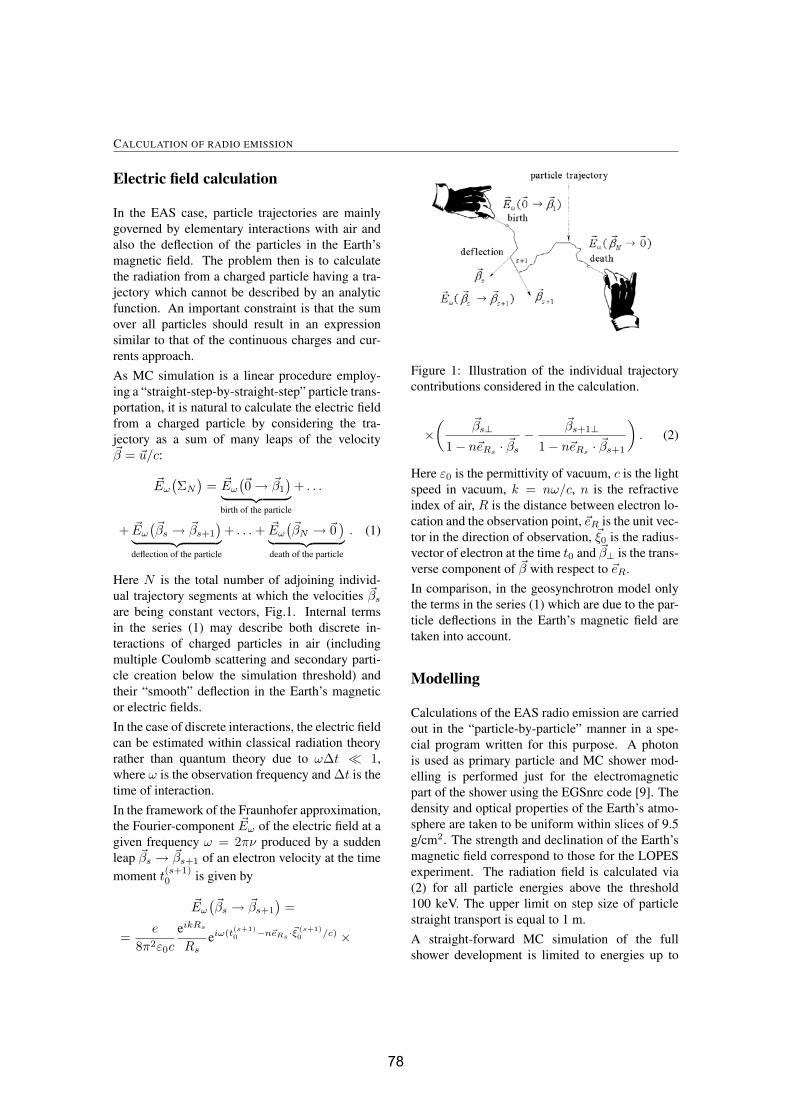
CALCULATION OF RADIO EMISSION
Electric field calculation
In the EAS case, particle trajectories are mainly
governed by elementary interactions with air and
also the deflection of the particles in the Earth’s
magnetic field. The problem then is to calculate
the radiation from a charged particle having a tra-
jectory which cannot be described by an analytic
function. An important constraint is that the sum
over all particles should result in an expression
similar to that of the continuous charges and cur-
rents approach.
As MC simulation is a linear procedure employ-
ing a “straight-step-by-straight-step” particle trans-
portation, it is natural to calculate the electric field
from a charged particle by considering the tra-
jectory as a sum of many leaps of the velocity�β = �u/c:
�Eω
(ΣN
)= �Eω
(�0 → �β1
)
︸ ︷︷ ︸birth of the particle
+ . . .
+ �Eω
(�βs → �βs+1
)
︸ ︷︷ ︸deflection of the particle
+ . . . + �Eω
(�βN → �0
)
︸ ︷︷ ︸death of the particle
. (1)
Here N is the total number of adjoining individ-
ual trajectory segments at which the velocities �βs
are being constant vectors, Fig.1. Internal terms
in the series (1) may describe both discrete in-
teractions of charged particles in air (including
multiple Coulomb scattering and secondary parti-
cle creation below the simulation threshold) and
their “smooth” deflection in the Earth’s magnetic
or electric fields.
In the case of discrete interactions, the electric field
can be estimated within classical radiation theory
rather than quantum theory due to ωΔt � 1,
where ω is the observation frequency and Δt is the
time of interaction.
In the framework of the Fraunhofer approximation,
the Fourier-component �Eω of the electric field at a
given frequency ω = 2πν produced by a sudden
leap �βs → �βs+1 of an electron velocity at the time
moment t(s+1)0 is given by
�Eω
(�βs → �βs+1
)=
=e
8π2ε0c
eikRs
Rseiω(t
(s+1)
0−n�eRs ·�ξ (s+1)
0/c) ×
Figure 1: Illustration of the individual trajectory
contributions considered in the calculation.
×( �βs⊥
1 − n�eRs· �βs
−�βs+1⊥
1 − n�eRs· �βs+1
). (2)
Here ε0 is the permittivity of vacuum, c is the light
speed in vacuum, k = nω/c, n is the refractive
index of air, R is the distance between electron lo-
cation and the observation point, �eR is the unit vec-
tor in the direction of observation, �ξ0 is the radius-
vector of electron at the time t0 and �β⊥ is the trans-
verse component of �β with respect to �eR.
In comparison, in the geosynchrotron model only
the terms in the series (1) which are due to the par-
ticle deflections in the Earth’s magnetic field are
taken into account.
Modelling
Calculations of the EAS radio emission are carried
out in the “particle-by-particle” manner in a spe-
cial program written for this purpose. A photon
is used as primary particle and MC shower mod-
elling is performed just for the electromagnetic
part of the shower using the EGSnrc code [9]. The
density and optical properties of the Earth’s atmo-
sphere are taken to be uniform within slices of 9.5
g/cm2. The strength and declination of the Earth’s
magnetic field correspond to those for the LOPES
experiment. The radiation field is calculated via
(2) for all particle energies above the threshold
100 keV. The upper limit on step size of particle
straight transport is equal to 1 m.
A straight-forward MC simulation of the full
shower development is limited to energies up to
78
78

30TH INTERNATIONAL COSMIC RAY CONFERENCE
� 1015 eV. The situation may be improved by ap-
plying the “thinning” method [10], which is char-
acterized by the parameter εth = Eth/E0, where
Eth is the energy at which the thinning process is
started, E0 is the energy of primary particle. The
influence of thinning on the radio emission calcu-
lation quality has been studied in the 1012 − 1014
eV range. Unfortunately, the general conclusion
is that thinning does not allow to increase the pri-
mary energy as much as would be needed to sim-
ulate showers at ultra-high energy. Namely, at the
LOPES frequency range (40-80 MHz), the accept-
able level εth reduces computing time by a factor
of only 10-20 for a range of observation distances
up to 200-300 m from a shower axis. The reason
is that for radio emission the low energy particles
(having energies much less than the critical energy
of 81 MeV) are extremely important.
Results
In Fig.2 the longitudinal profile of one 1017 eV
photon-initiated vertical shower is presented. The
initial photon was injected at 30 km above the sea
level. The simulated profile is similar to the aver-
age cascade curve at 1017 eV. Therefore it is rea-
sonable to assume that the given shower is rep-
resentative for a comparison of the predicted ra-
dio emission with experimental data at energies of
about 1017 eV that is averaged over many showers.
The comparison with LOPES-10 experimental
data is plotted on Fig.3, where the simulated ra-
dio emission has been averaged over north, south,
west and east directions. A correlation of radio sig-
nals with distance is found for the group of events
selected out of 5 months of LOPES-10 measure-
ments [8]. All selected showers have energies in
the range E0 � 5 · 1016 − 6 · 1017 eV and zenith
angles < 50◦.
In the comparison, it has been taken into ac-
count that experimentally measured and theoreti-
cally calculated field strengths are not absolutely
identical. In the simulation, the Fourier-component
at a given frequency (2) is calculated, whereas in
the experiment a field strength over the frequency
range from 40 up to 80 MHz is measured. Such un-
certainty introduces some fudge factor A, that does
not influence essentially on the functional form
Figure 2: Number of charged particles of a 1017
eV photon-initiated vertical shower as a function of
atmospheric depth. Thinning level εth = 2 · 10−7
or Eth = 20 GeV. The model results are compared
to Greisen’s parameterization for a radiation length
of 36.8 g/cm2 and an critical energy of 81 MeV.
Figure 3: Lateral distribution of EAS radio emis-
sion. Results of the present work (EGSnrc),
LOPES-10 experimental data [8] and Haverah Park
experimental data approximation, taken from the
same report [8], are compared.
79
79
CALCULATION OF RADIO EMISSION
of the lateral dependence of radio emission. In
fact, we obtain that in the observed bandwidth of
the LOPES experiment the field strength does not
change substantially at the distances less than 300
m. On Fig.3 A = 1 has been adopted, but this
value may have to be changed once the absolute
calibration of the LOPES antennas is known.
It is seen that the calculated radio emission re-
produces the experimentally found dependence on
the lateral distance rather well. The deviation at
larger lateral distances beyond 300 m is not unex-
pected. It is related to the detection threshold of
the LOPES-10 array, since only showers with a de-
tected radio signal were included in the LOPES
data analysis. At large lateral distance, the de-
tection probability falls below unity and showers
without detected radio signal have to be included
to allow a comparison with our calculation.
The parameterization of the data obtained with the
old Haverah Park radio experiment [11] is also
shown in the same figure. The presented approxi-
mation was fitted for the range E0 � 1017−1018 of
EAS with zenith angles < 35◦ [11] (the curve has
been taken from [8]). The Haverah Park approxi-
mation (fitted for 55 MHz) corresponds to the field
calculated at the range 100-300 m. Results differ
significantly only for R < 100 m, where the ex-
ponential fit ∼ exp(−R/(110 m)) seems not to be
valid. Note that there is considerable uncertainty
regarding the absolute calibration of the pioneer-
ing radio measurements of the 60ies and 70ies.
Conclusions
Calculation of radio emission from an air shower
with E0 = 1017 eV has been performed. The
lateral distribution of simulated radio signals is
compatible with the recent LOPES-10 experimen-
tal data [8] and the old Haverah Park data [11].
The presented calculation should be considered
just as a demonstration since 1 month and 50 pro-
cessors have been required for its realization. At
present time the real limit of the straight-forward
MC simulation of EAS radio emission is 1015 −1016 eV.
Our present hopes of calculating EAS radio emis-
sion at ultra-high energy are based on some spe-
cific features of the radio emission. It has been
mentioned that only two pure collective effects in
the EAS development initiate their radio emission:
an electron excess and a geomagnetic polarization.
Thus, a full “particle-by-particle” shower model-
ing is something that is too detailed for efficient
radio emission calculations.
The energy of the simulations could be consider-
ably increased within the framework of the EAS
macroscopic consideration, in which the shower is
treated as a system of the electric moments and cur-
rents (due to an excess of electrons and systematic
charge separating in the Earth’s magnetic field).
Still MC simulations will be needed for calculating
the overall shower properties and generating real-
istic shower-to-shower fluctuations.
Acknowledgments
A.A.K. would like to thank Dr. W.D. Apel for the
support and advice he got while working on the
KASCADE cluster. This work was supported by
INTAS (grant 05-109-5459).
References
[1] H. Falcke et al., LOPES Collab., Nature 435,
313, 2005.
[2] T. Antoni et al., KASCADE Collab., NIM
A513, 490, 2003.
[3] D. Ardouin et al., CODALEMA Collab., As-
tropart. Phys. 26, 341, 2006.
[4] G. A. Askaryan, Sov. Phys. JETP. 41, 616
(1961).
[5] T. Huege, H. Falcke, Astropart. Phys. 430, p.
779, 2005.
[6] H. Falcke, P. W. Gorham, Astropart. Phys. 19,
p. 477, 2003.
[7] T. Huege, R. Ulrich, R. Engel, Astropart.
Phys. 27, 392, 2007.
[8] W. D. Apel et al., LOPES Collab., Astropart.
Phys. 26, 332, 2006.
[9] http//www.irs.inms.nrc.ca/EGSnrc/pirs701 .
[10] A. M. Hillas, Proc. 17th Int. Cosmic Ray
Conf. Paris. 8, p. 193, 1981.
[11] H. R. Allan, Progress in elementary particle
and cosmic ray physics. 10, p. 171, 1971.
80
80

30TH INTERNATIONAL COSMIC RAY CONFERENCE
Radio Detection of Neutrinos from Behind a Mountain
O. BRUSOVA1, L. ANCHORDOQUI2, T. HUEGE3, K. MARTENS1.1University of Utah, Department of Physics, 115S 1400E, Salt Lake City, UT 84112, USA2Department of Physics, University of Wisconsin-Milwaukee, P.O. Box 413, Milwaukee, WI 53201, USA3Institut fur Kernphysik, Forschungszentrum Karlsruhe, Postfach 3640, 76021 Karlsruhe, [email protected]
Abstract: We explore the sensitivity of a neutrino detector employing strongly directional high gainradio antennae to detect the conversion of neutrinos above 1016 eV in a mountain or the earth crust. Thedirectionality of the antennae will allow both, the low threshold and the suppression of background. Thistechnology would have the advantage that it does not require a suitable atmosphere as optical detectorsdo and could therefore be deployed at any promising place on the planet. In particular one could choosesuitable topographies at latitudes that are matched to promising source candidates.
Introduction
Identifying the sources of the highest energy Cos-mic Rays (CR) is a fundamental and unsolvedproblem in astroparticle physics. If they are accel-erated in astrophysical objects, high energy neu-trino emission should be associated with this ac-celeration [1]. Since these neutrinos would neitherinteract with intergalactic or interstellar media norbe deflected by magnetic fields, neutrino astron-omy carries the hope of identifying these elusivesources of highest energy CRs.
Various detectors have been proposed for neutrinoenergies above 1016 eV, most of them relying onmountains to provide suitable target mass for ντ
with the ensuing τ lepton decay providing a de-tectable air shower (AS) after the τ leaves the tar-get [2]. As high energy neutrinos get absorbed inthe earth, geometries for such events are restrictedto within a few degrees of horizontal [3]. At ener-gies above 1019 eV the τ decay length in vacuumexceeds 500 km, increasingly putting these decaysout of the reach of detectors.
Optical detectors exploiting the fluorescence emis-sion of horizontal showers as well scintillator tele-scopes have been proposed to measure the promis-ing ντ signature [4]. Here we explore what couldbe a simpler and cheaper technology in the field:
Strongly directional (high gain, low threshold) ra-dio antennas. All they require is a rigid mechani-cal support structure and like all the other detectorssome electronics. But no optical components haveto be calibrated and maintained, and the detectorcould be made largely insensitive to the local cli-mate at a promising detector site. The challengefor our detector will lie in isolating the signal.
Geosynchrotron radio signals
AS produce geosynchrotron radio emission due tothe deflection of secondary shower electrons andpositrons in the earth’s magnetic field [5]. In thisstudy for the first time such radio signals are stud-ied from horizontal showers. Using the REAS2Monte Carlo code [6] we calculate the radio emis-sion from 1015 eV and 1016 eV horizontal, π+ in-duced AS propagating through a constant densityatmosphere of 1.058 × 10⁻³ g cm−3, correspond-ing to approximately 1500 m above sea level. Themagnetic field was set to a strength of 0.4 Gausswith an inclination of 60◦, a conservative estimatefor Central Europe and Northern America. The ASwere simulated as propagating from north to south;the corresponding geomagnetic angle is thus 60◦.This is the most conservative choice, as it effec-tively minimizes the field component perpendicu-
8181

RADIO DETECTION OF NEUTRINOS
lar to the propagation direction of the AS. Atmo-spheric curvature can be neglected here, as the ASneed only a few kilometers to develop in the loweratmosphere. The AS simulations were carried outusing CORSIKA 6.502 [7], with shower-to-showerfluctuations taken out by simulating 25 air showersper parameter set and then selecting a shower witha typical longitudinal evolution profile for the radiosimulations.
1
10
100
0 100 200 300 400 500 600
20 to
80
MH
z fil
tere
d am
plitu
de [μ
V/m
]
vertical observer offset from shower axis [m]
10 km distance15 km distance20 km distance30 km distance40 km distance
Figure 1: Lateral dependence of geosynchrotronradio emission field strenghts of 1016 eV hori-zontal air showers for different observer distancesfrom the τ decay point. 1015 eV values are lowerby approximately a factor of 10.
One important question is which observer distanceis suited best for radio observations of these hori-zontal AS. Figure 1 illustrates how the lateral pro-file of the radio signal spreads out as the distancefrom the starting point of the AS increases. Despitestrong relativistic beaming of geosynchrotron radi-ation, the lateral slope changes significantly withthe distance of the observer from the τ decay point.An observing distance of 20 km seems to consti-tute a good compromise: the signal in the centerregion is still strong while its lateral spread doesnot require too dense an array of antennae.
Also important is the selection of a suitable obser-vation frequency band. This clearly depends onthe actual noise situation at the selected observ-ing site. In the absence of man-made radio in-terference, atmospheric and galactic noise set thelimits. In Fig. 2 we show what signal-to-noise ra-tios (SNR, defined as peak power of the signal di-vided by power of the noise in the band of inter-est) can be expected for 1016 eV AS at 20 km ob-serving distance and 225 m vertical observer off-
Upper Band Frequency [MHz]10 20 30 40 50 60 70 80 90 100
Lo
wer
Ban
d F
req
uen
cy [
MH
z]
10
20
30
40
50
60
70
80
90
100
0
0.2
0.4
0.6
0.8
1
Figure 2: Expected SNR as a function of observ-ing frequency band for 1016 eV showers initiated at20 km distance and 225 m vertical observer offsetfrom the shower axis, calculated for an isotropic ra-diator. 1015 eV values are lower by approximatelya factor of 100.
set from the shower axis. The values are calcu-lated for an isotropic radiator and a combinationof day-time atmospheric noise and galactic noisebased on measurements by the CCIR/ITU-R (Inter-national Telecommunication Union). As geosyn-chrotron emission has a steeply falling frequencyspectrum, it is important to include low frequen-cies. As can be seen in Fig. 2 an observing band-width from 20 to 80 MHz would be desirable. Be-low 20 MHz, atmospheric noise gets very strong,and above 80 MHz FM radio transmitters couldpose problems.
SNR of order unity are too low for self-triggeredmeasurements of geosynchroton radiation. Usingdirectional antennae pointing at the target masswill significantly improve the SNR. For the en-visioned broad-band measurements, logarithmic-periodic dipole antennae (LPDAs) can achieve an-tenna gains of 10 dBi. If three such antennae arephase coupled, effective gains of up to 16 dBi canbe reached. This boosts the SNR into a regionwhere measurements seem feasible up to axis off-sets of ∼ 300 m, as illustrated in Fig. 3.
For the specific relative geometry of AS and mag-netic field explored here the lateral distribution ofthe radio signal is very different along the hori-zonatal and the vertical axis. As multiple mea-surements along the vertical also allow to placeadditional constraints on the zenith angle of the
8282
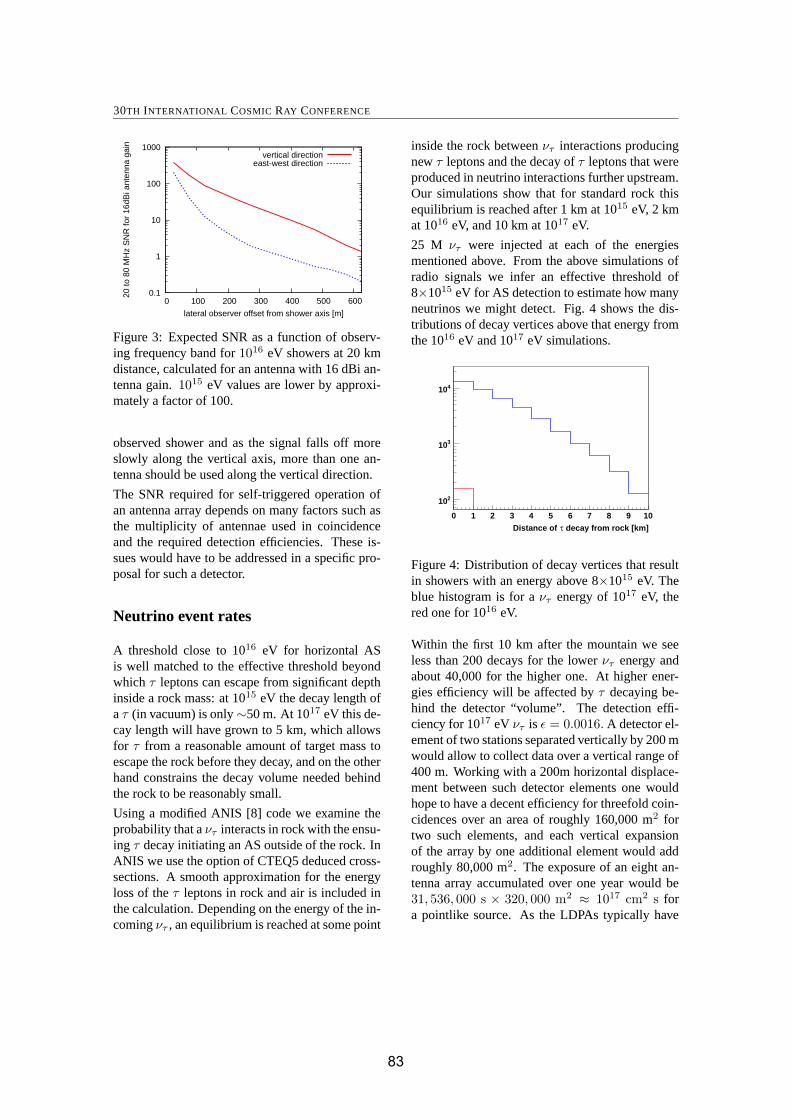
30TH INTERNATIONAL COSMIC RAY CONFERENCE
0.1
1
10
100
1000
0 100 200 300 400 500 600
20 to
80
MH
z S
NR
for
16dB
i ant
enna
gai
n
lateral observer offset from shower axis [m]
vertical directioneast-west direction
Figure 3: Expected SNR as a function of observ-ing frequency band for 1016 eV showers at 20 kmdistance, calculated for an antenna with 16 dBi an-tenna gain. 1015 eV values are lower by approxi-mately a factor of 100.
observed shower and as the signal falls off moreslowly along the vertical axis, more than one an-tenna should be used along the vertical direction.
The SNR required for self-triggered operation ofan antenna array depends on many factors such asthe multiplicity of antennae used in coincidenceand the required detection efficiencies. These is-sues would have to be addressed in a specific pro-posal for such a detector.
Neutrino event rates
A threshold close to 1016 eV for horizontal ASis well matched to the effective threshold beyondwhich τ leptons can escape from significant depthinside a rock mass: at 1015 eV the decay length ofa τ (in vacuum) is only ∼50 m. At 1017 eV this de-cay length will have grown to 5 km, which allowsfor τ from a reasonable amount of target mass toescape the rock before they decay, and on the otherhand constrains the decay volume needed behindthe rock to be reasonably small.
Using a modified ANIS [8] code we examine theprobability that a ντ interacts in rock with the ensu-ing τ decay initiating an AS outside of the rock. InANIS we use the option of CTEQ5 deduced cross-sections. A smooth approximation for the energyloss of the τ leptons in rock and air is included inthe calculation. Depending on the energy of the in-coming ντ , an equilibrium is reached at some point
inside the rock between ντ interactions producingnew τ leptons and the decay of τ leptons that wereproduced in neutrino interactions further upstream.Our simulations show that for standard rock thisequilibrium is reached after 1 km at 1015 eV, 2 kmat 1016 eV, and 10 km at 1017 eV.
25 M ντ were injected at each of the energiesmentioned above. From the above simulations ofradio signals we infer an effective threshold of8×1015 eV for AS detection to estimate how manyneutrinos we might detect. Fig. 4 shows the dis-tributions of decay vertices above that energy fromthe 1016 eV and 1017 eV simulations.
decay from rock [km]τDistance of
0 1 2 3 4 5 6 7 8 9 10
210
310
410
Figure 4: Distribution of decay vertices that resultin showers with an energy above 8×10¹⁵ eV. Theblue histogram is for a ντ energy of 1017 eV, thered one for 1016 eV.
Within the first 10 km after the mountain we seeless than 200 decays for the lower ντ energy andabout 40,000 for the higher one. At higher ener-gies efficiency will be affected by τ decaying be-hind the detector “volume”. The detection effi-ciency for 1017 eV ντ is ε = 0.0016. A detector el-ement of two stations separated vertically by 200 mwould allow to collect data over a vertical range of400 m. Working with a 200m horizontal displace-ment between such detector elements one wouldhope to have a decent efficiency for threefold coin-cidences over an area of roughly 160,000 m2 fortwo such elements, and each vertical expansionof the array by one additional element would addroughly 80,000 m2. The exposure of an eight an-tenna array accumulated over one year would be31, 536, 000 s × 320, 000 m2 ≈ 1017 cm2 s fora pointlike source. As the LDPAs typically have
8383

RADIO DETECTION OF NEUTRINOS
an opening angle of 65◦, detectors situated 30 kmfrom a 1.5 km high mountain range would cover asolid angle of 5.7 × 10⁻² sr.
A source would only be seen if it is behind a tar-get mass at the local horizon of the detector. Thetime any given source spends near the horizon de-pends on its declination. Figure 5 summarizes thetotal observation times that can be expected if thesource can be followed within ±1.5◦ of the hori-zon and gives the azimuthal coverage required tofollow the source along that segment of its path. Ifa source were to just rise or set vertically through a±1.5◦ detector aperture, it would be visible for lessthan 1% of the total time. If the location was cho-sen to accommodate the requisite azimuthal cover-age shown in Fig. 5, then one would expect to “see”the source about 15% of total time for a latitude of45◦. The proposed antennae will cover the requi-site 30◦ in azimuth. Putting all this together, if wecan measure ντ between 1016 eV and 1017 eV, withthe efficiencies estimated above and linearly inter-polated between the two energies, it would take anarray of a little more than 130k antennae to observeone event per year from Galactic sources [9].
Latitude [deg]
0 10 20 30 40 50 60 70 80 90
Per
cen
t o
f T
ota
l Tim
e
0
10
20
30
40
50
60
70
Latitude [deg]
0 10 20 30 40 50 60 70 80 90
Req
uir
ed A
zim
uth
al C
ove
rag
e [d
eg]
0
50
100
150
200
250
Figure 5: Upper panel: Percent of total time spentin a ±1.5◦ band around the horizon if the upperor lower culmination point is arranged to be 1.5◦
above or below the horizon. Lower panel: totalnumber of degrees that have to be covered in az-imuth in order to attain that maximal time.
To give an example of the sensitivity reach tothe diffuse neutrino flux we consider, φντ
�10−3 (Eν/GeV)−2.54 GeV−1 cm−2 s−1 sr−1,
which is expected if extragalactic cosmic rays(from transparent sources) begin dominatingthe observed spectrum at energies as low as∼ 1017.6 eV [10], as suggested by recent HiResdata [11]. For such a ντ -flux, the expected numberof events (with Eν > 1017 eV) per year per eightantennae is about 0.003.
Conclusions
The energy range at which the detector worksis well matched to the problem of ντ detectionthrough τ decay in the atmosphere. 300 antennaeis quite an undertaking for 1 event per year. Ef-forts are underway to better estimate the detectorresponse around 1016 eV.
Acknowledgements
We thank O. Kroemer for very useful discussions.
References
[1] F. Halzen and D. Hooper, Rept. Prog. Phys. 65,1025 (2002).
[2] D. Fargion, Astrophys. J. 570, 909 (2002).[3] K. Martens for the HiRes Collaboration, in
these Proceedings (2007).[4] Z. Cao et al., J. Phys. G 31, 571 (2005); M. Iori
et al.,, arXiv:astro-ph/0602108.[5] T. Huege and H. Falcke, Astron. Astrophys.
412, 19 (2003).[6] T. Huege, R. Ulrich and R. Engel, Astropart.
Phys. 27, 392 (2007).[7] D. Heck, J. Knapp, J. N. Capdevielle,
G. Schatz, and T. Thouw. FZKA Report 6019,Forschungszentrum Karlsruhe, 1998.
[8] A. Gazizov and M. P. Kowalski, Comput.Phys. Commun. 172, 203 (2005).
[9] M. D. Kistler and J. F. Beacom, Phys. Rev. D74, 063007 (2006).
[10] M. Ahlers et al., and T. J. Weiler, Phys. Rev.D 72, 023001 (2005).
[11] R. U. Abbasi et al. [HiRes Collaboration],Phys. Rev. Lett. 92, 151101 (2004).
8484
30TH INTERNATIONAL COSMIC RAY CONFERENCE
The LOFAR air shower front evolution library
S. LAFEBRE1 , T. HUEGE2 , H. FALCKE1,3 , J. KUIJPERS1
1Institute for Mathematics, Astrophysics and Particle Physics, Radboud University, P.O. box 9010, 6500GL Nijmegen, the Netherlands2Institut fur Kernphysik, Forschungszentrum Karlsruhe, P.O. box 3640, 76021 Karlsruhe, Germany3ASTRON, P.O. box 2, 7990 AA Dwingeloo, the [email protected]
Abstract: The LOFAR radio telescope, under construction in the Netherlands, is an excellent test case forthe detection of extensive air showers through their radio signal. In order to fully understand the propertiesof these signals, we are building a library of CORSIKA simulations over a wide range of energies onthe LOFAR BlueGene supercomputer. This library contains particle data throughout the atmosphere, asopposed to the lowest detection level only. The REAS2 code is used to calculate geosynchrotron radioemission from these simulations. We present parametrisations of various characteristics of the particlesfrom showers in this library.
Introduction
Recently, the development of digital radio tele-
scopes such as LOFAR [2] has initiated a wave
of renewed interest in the coherent radio emission
from cosmic ray air showers [1]. In order to better
understand the radiation mechanism and its impli-
cations, a series of air shower simulations is be-
ing carried out, which produce histogrammed par-
ticle data suitable for simulations using the REAS2
code. The CORSIKA [5] based radio emission sim-
ulations employ a realistic description of the air
shower properties on a shower to shower basis [7]
and we intend to pursue this approach further by
using a shower simulation library in support of the
high energy cosmic ray programme with the LO-
FAR telescope.
Unfortunately, using existing air shower libraries
is not an option: these commonly only consist of
distributions of particles on the lowest observation
level – usually the Earth’s surface. Such libraries
are not suited for radio emission simulations, how-
ever, since according to our current understanding
this radiation is caused by geomagnetic deflection
of secondary shower electrons and positrons [6].
Here, we summarise our efforts building our air
shower front evolution library, and present first re-
sults obtained from this library.
Setup
The calculation of synchrotron emission from air
showers is not built into CORSIKA: an additional
code, REAS2 [7] needs to be run on the parti-
cle distributions, which determines the radio foot-
print on the ground. To this end we use the
same interface code as in [7], which outputs two
three-dimensional histograms for electrons and
positrons for 50 observation levels at equidistant
atmospheric slant depths. For each level, these
histograms contain 1) particle energy vs. particle
arrival time vs. lateral particle distance from the
shower core; and 2) particle energy vs. angle of
momentum to the shower axis vs. angle of momen-
tum to the (radial) outward direction.
An overview of the simulations we are carrying
out is given in table 1. We use photons, protons
and iron as primaries, with energies ranging from
1016 to 1020.5 eV (set by an optimistic estimate
of the LOFAR detection limits) for six zenith an-
gles cos θ = 1, 0.9, . . . , 0.5. The azimuthal an-
gle is constant, as the effect on the particle dis-
85
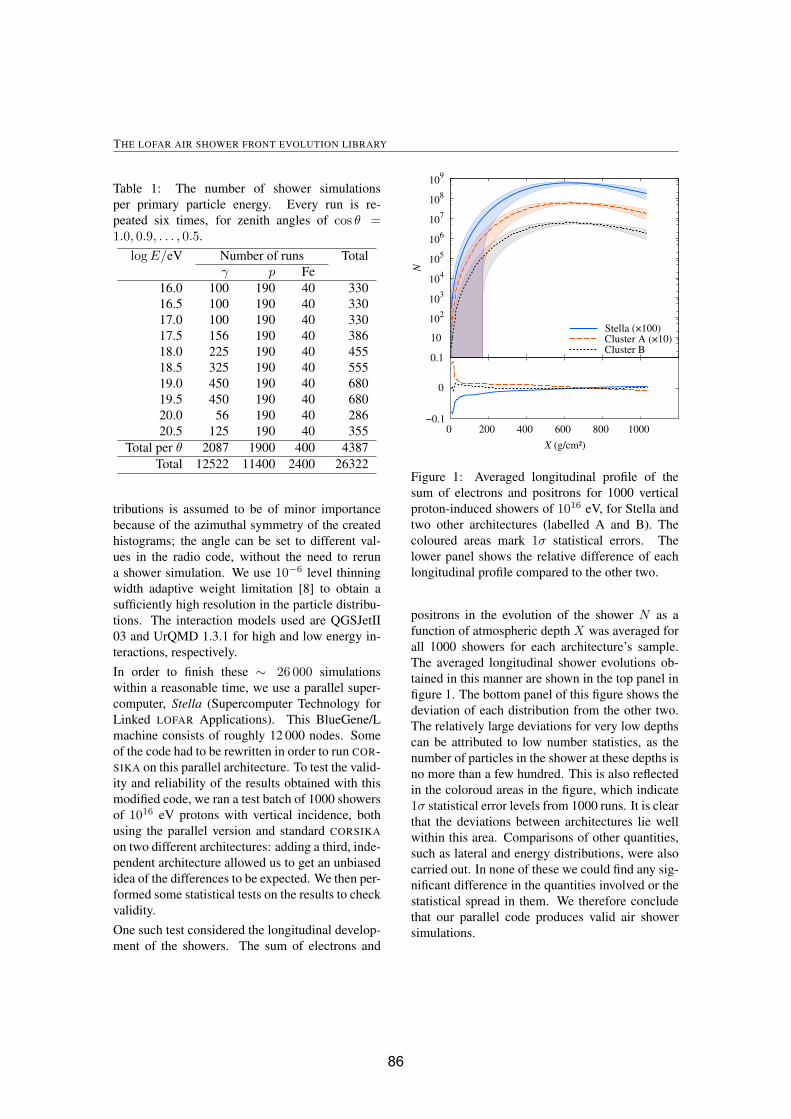
THE LOFAR AIR SHOWER FRONT EVOLUTION LIBRARY
Table 1: The number of shower simulations
per primary particle energy. Every run is re-
peated six times, for zenith angles of cos θ =1.0, 0.9, . . . , 0.5.
log E/eV Number of runs Total
γ p Fe
16.0 100 190 40 330
16.5 100 190 40 330
17.0 100 190 40 330
17.5 156 190 40 386
18.0 225 190 40 455
18.5 325 190 40 555
19.0 450 190 40 680
19.5 450 190 40 680
20.0 56 190 40 286
20.5 125 190 40 355
Total per θ 2087 1900 400 4387
Total 12522 11400 2400 26322
tributions is assumed to be of minor importance
because of the azimuthal symmetry of the created
histograms; the angle can be set to different val-
ues in the radio code, without the need to rerun
a shower simulation. We use 10−6 level thinning
width adaptive weight limitation [8] to obtain a
sufficiently high resolution in the particle distribu-
tions. The interaction models used are QGSJetII
03 and UrQMD 1.3.1 for high and low energy in-
teractions, respectively.
In order to finish these ∼ 26 000 simulations
within a reasonable time, we use a parallel super-
computer, Stella (Supercomputer Technology for
Linked LOFAR Applications). This BlueGene/L
machine consists of roughly 12 000 nodes. Some
of the code had to be rewritten in order to run COR-
SIKA on this parallel architecture. To test the valid-
ity and reliability of the results obtained with this
modified code, we ran a test batch of 1000 showers
of 1016 eV protons with vertical incidence, both
using the parallel version and standard CORSIKA
on two different architectures: adding a third, inde-
pendent architecture allowed us to get an unbiased
idea of the differences to be expected. We then per-
formed some statistical tests on the results to check
validity.
One such test considered the longitudinal develop-
ment of the showers. The sum of electrons and
10
102
103
104
105
106
107
108
109
0 200 400 600 800 1000
N
Stella (×100)Cluster A (×10)Cluster B
X (g/cm²)
0
−0.1
0.1
Figure 1: Averaged longitudinal profile of the
sum of electrons and positrons for 1000 vertical
proton-induced showers of 1016 eV, for Stella and
two other architectures (labelled A and B). The
coloured areas mark 1σ statistical errors. The
lower panel shows the relative difference of each
longitudinal profile compared to the other two.
positrons in the evolution of the shower N as a
function of atmospheric depth X was averaged for
all 1000 showers for each architecture’s sample.
The averaged longitudinal shower evolutions ob-
tained in this manner are shown in the top panel in
figure 1. The bottom panel of this figure shows the
deviation of each distribution from the other two.
The relatively large deviations for very low depths
can be attributed to low number statistics, as the
number of particles in the shower at these depths is
no more than a few hundred. This is also reflected
in the coloroud areas in the figure, which indicate
1σ statistical error levels from 1000 runs. It is clear
that the deviations between architectures lie well
within this area. Comparisons of other quantities,
such as lateral and energy distributions, were also
carried out. In none of these we could find any sig-
nificant difference in the quantities involved or the
statistical spread in them. We therefore conclude
that our parallel code produces valid air shower
simulations.
86

30TH INTERNATIONAL COSMIC RAY CONFERENCE
Results
The test sample of 3 × 1000 showers we obtained
for validating our output can be used for an analy-
sis of vertical air showers from protons at 1016 eV,
given the large number of simulations we carried
out for one single configuration. One of the air
shower properties we investigated is the longitu-
dinal profile N(X).A popular parametrisations to describe the longi-
tudinal evolution of air showers was suggested by
Greisen [4] and Gaisser & Hillas [3]. We can gen-
eralise both, however, to read
NL(X) = Nmax exp
[λ
Xmax
(
lnX
Xmax
−n∑
i=1
εi
(1 − X
Xmax
)i)]
, (1)
where, in the case of 1016 eV proton showers,
λ � 45± 7 g/cm2 is a characteristic length param-
eter, Xmax � 6.4 ± 0.8 · 102 g/cm2 is the atmo-
spheric depth at which the number of electrons and
positrons N(X) peaks, and Nmax � 6.5±0.5 ·106
is the number of particles at this depth. We deter-
mined optimal values for εi from the average of
N(X) in our sample of simulations, setting i ≤ 6:
using terms of even higher order does not decrease
the variance reduction significantly anymore. The
values we obtained are
εi = [1.000,−0.013, 0.005, 0.053, 0.181, 0.207],(2)
which is very close to the Gaisser–Hillas
parametrisation, εi = [1, 0, 0, . . .]. Using this
parametrisation, N(X) fits slightly better, even
for individual showers, than either the Greisen or
Gaisser–Hillas parametrisations. Note that this
analysis was based on averaging in X: averaging
of the shower age s might change these results.
Since the showers in our library contain histograms
of particle distributions over the entire evolution of
the shower, we can produce multidimensional rep-
resentations of particle densities. As an example
of such a representation, figure 2 shows the parti-
cle density n = dN/dr2 as a function of X and
the distance from the shower axis r. As expected,
most of the particles in a 1016 eV shower exist in a
10
102
0.1
1
0 800600400200 1000X (g/cm²)
r (
m)
103
105
102
1
10−2
10−4
104
Figure 2: Two-dimensional structure of the aver-
age particle density n as a function of atmospheric
depth X and distance form the shower axis r. The
color scale and white contour lines represent parti-
cle densities in particles per m2. Contour lines are
spaced logarithmically at factors of ten.
narrow cylinder around the shower axis with a ra-
dius of a few meters. It is interesting to note that
the maximum particle density is reached at differ-
ent depths for different distances; also note that the
reduction rate of the density with X varies with r.
A quantity that may influence the radio footprint of
an air shower is the net charge of the shower. Air
showers tend to develop a net negative charge as
they evolve, through positrons interacting with at-
mospheric electrons. As this charge excess moves
through the atmosphere at superluminal velocity,
it gives rise to Cerenkov radiation in the radio do-
main. Currently, the relative role of this effect is
uncertain. Looking into the charge excess may al-
low us to determine the relative importance of the
effects compared to that of coherent synchrotron
emission, which is thought to be dominant.
The charge excess q of electrons over photons as a
function of shower depth X is defined as the ratio:
q(X) =ne−(X) − ne+(X)ne−(X) + ne+(X)
. (3)
Figure 3 shows the relative average charge excess qas a function of X and r. Note the feature in the
top right of this figure; its origin is unclear, but it is
probably strongly correlated with the cutoff energy
used (400 keV in these simulations): further study
is required here. Contrary to the relative excess, the
87
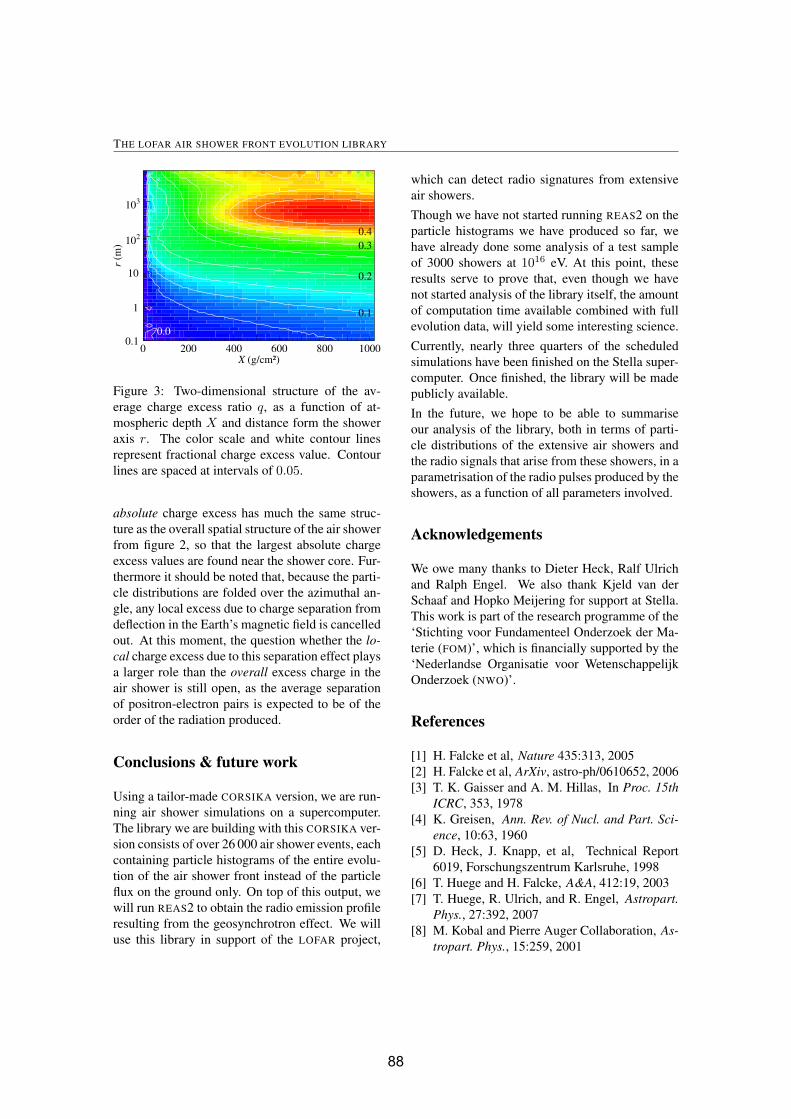
THE LOFAR AIR SHOWER FRONT EVOLUTION LIBRARY
10
102
0.1
1
0 800600400200 1000X (g/cm²)
r (
m)
103
0.1
0.2
0.3
0.4
0.0
Figure 3: Two-dimensional structure of the av-
erage charge excess ratio q, as a function of at-
mospheric depth X and distance form the shower
axis r. The color scale and white contour lines
represent fractional charge excess value. Contour
lines are spaced at intervals of 0.05.
absolute charge excess has much the same struc-
ture as the overall spatial structure of the air shower
from figure 2, so that the largest absolute charge
excess values are found near the shower core. Fur-
thermore it should be noted that, because the parti-
cle distributions are folded over the azimuthal an-
gle, any local excess due to charge separation from
deflection in the Earth’s magnetic field is cancelled
out. At this moment, the question whether the lo-cal charge excess due to this separation effect plays
a larger role than the overall excess charge in the
air shower is still open, as the average separation
of positron-electron pairs is expected to be of the
order of the radiation produced.
Conclusions & future work
Using a tailor-made CORSIKA version, we are run-
ning air shower simulations on a supercomputer.
The library we are building with this CORSIKA ver-
sion consists of over 26 000 air shower events, each
containing particle histograms of the entire evolu-
tion of the air shower front instead of the particle
flux on the ground only. On top of this output, we
will run REAS2 to obtain the radio emission profile
resulting from the geosynchrotron effect. We will
use this library in support of the LOFAR project,
which can detect radio signatures from extensive
air showers.
Though we have not started running REAS2 on the
particle histograms we have produced so far, we
have already done some analysis of a test sample
of 3000 showers at 1016 eV. At this point, these
results serve to prove that, even though we have
not started analysis of the library itself, the amount
of computation time available combined with full
evolution data, will yield some interesting science.
Currently, nearly three quarters of the scheduled
simulations have been finished on the Stella super-
computer. Once finished, the library will be made
publicly available.
In the future, we hope to be able to summarise
our analysis of the library, both in terms of parti-
cle distributions of the extensive air showers and
the radio signals that arise from these showers, in a
parametrisation of the radio pulses produced by the
showers, as a function of all parameters involved.
Acknowledgements
We owe many thanks to Dieter Heck, Ralf Ulrich
and Ralph Engel. We also thank Kjeld van der
Schaaf and Hopko Meijering for support at Stella.
This work is part of the research programme of the
‘Stichting voor Fundamenteel Onderzoek der Ma-
terie (FOM)’, which is financially supported by the
‘Nederlandse Organisatie voor Wetenschappelijk
Onderzoek (NWO)’.
References
[1] H. Falcke et al, Nature 435:313, 2005
[2] H. Falcke et al, ArXiv, astro-ph/0610652, 2006
[3] T. K. Gaisser and A. M. Hillas, In Proc. 15thICRC, 353, 1978
[4] K. Greisen, Ann. Rev. of Nucl. and Part. Sci-ence, 10:63, 1960
[5] D. Heck, J. Knapp, et al, Technical Report
6019, Forschungszentrum Karlsruhe, 1998
[6] T. Huege and H. Falcke, A&A, 412:19, 2003
[7] T. Huege, R. Ulrich, and R. Engel, Astropart.Phys., 27:392, 2007
[8] M. Kobal and Pierre Auger Collaboration, As-tropart. Phys., 15:259, 2001
88
30TH INTERNATIONAL COSMIC RAY CONFERENCE
Measurement of the UHECR energy spectrum using data from the Surface Detectorof the Pierre Auger Observatory
MARKUS ROTH1 , FOR THE AUGER COLLABORATION2
1Institut fur Kernphysik, Forschungszentrum Karlsruhe, POB 3640, D-76021 Karlsruhe, Germany2Observatorio Pierre Auger, Av. San Martın Norte 304, (5613) Malargue, Mendoza, [email protected]
Abstract: At the southern site of the Pierre Auger Observatory, which is close to completion, an exposurethat significantly exceeds the largest forerunner experiments has already been accumulated. We reporta measurement of the cosmic ray energy spectrum based on the high statistics collected by the surfacedetector. The methods developed to determine the spectrum from reconstructed observables are described.The energy calibration of the observables, which exploits the correlation of surface detector data withfluorescence measurements in hybrid events, is presented in detail. The methods are simple and robust,exploiting the combination of fluorescence detector (FD) and surface detector (SD) and do not rely ondetailed numerical simulation or any assumption about the chemical composition. Besides presentingstatistical uncertainties, we address the impact of systematic uncertainties.
Introduction
The Pierre Auger Observatory [1] is designed tomeasure the extensive air showers produced by thehighest energy cosmic rays (E > 1018.5 eV) withthe goal of discovering their origins and composi-tion. Two different techniques are used to detect airshowers. Firstly, a collection of telescopes is usedto sense the fluorescence light produced by exci-tation of nitrogen induced by the cascade of parti-cles in the atmosphere. The FD provides a nearlycalorimetric, model-independent energy measure-ment, because the fluorescence light is producedin proportion to energy dissipation by a shower inthe atmosphere [2, 3]. This method can be usedonly when the sky is moonless and dark, and thushas roughly a 10% duty cycle [4]. The secondmethod uses an array of detectors on the ground tosample particle densities as the air shower arrivesat the Earth’s surface. The surface detector has a100% duty cycle [5]. A subsample of air show-ers detected by both instruments, dubbed hybridevents, are very precisely measured [6] and pro-vide an invaluable energy calibration tool. Hybridevents make it possible to relate the shower energy(FD) to the ground parameter S(1000).
Analysis procedure
The parameter S(1000) characterises the energy ofa cosmic ray shower detected by the SD array andis the signal in units of VEM that would be pro-duced in a tank at a distance of 1000 m from theshower axis. One VEM is the signal produced by asingle relativistic muon passing vertically throughthe centre of a water tank. A likelihood method isapplied to obtain the lateral distribution function,where the shower axis, S(1000) and the curvatureof the shower front are determined [7]. The se-lection criteria are such to ensure the rejection ofaccidental triggers (physics trigger) and the eventsare well contained in the SD array (quality trig-ger), i.e. we require that all six nearest neighboursof the station with the highest signal be active. Inthis way we guarantee that the core of the showeris contained inside the array and enough of theshower is sampled to make an S(1000) measure-ment. The present data set is taken from 1 January,2004 through 28 February, 2007 while the arrayhas been growing in size. To ensure an excellentdata quality we remove periods with problems dueto failures in data acquisition, due to lightning andhardware difficulties. We select events only if the
89

MEASUREMENT OF THE ENERGY SPECTRUM USING DATA FROM THE PIERRE AUGER OBSERVATORY
θcos2
0.3 0.4 0.5 0.6 0.7 0.8 0.9 1
θdN
/dco
s2
100
102
103
lg(S(1000)/VEM)> 1.
lg(S(1000)/VEM)> 1.2
lg(S(1000)/VEM)> 1.4
lg(S(1000)/VEM)> 1.6
lg(S(1000)/VEM)> 1.8
Figure 1: Integral number of events vs cos2 θ forthe indicated minimum value of S(1000).
zenith angle is less than 60° and the reconstructedenergy is above 3 EeV. For this analysis, the arrayis fully efficient for detecting such showers, so theacceptance at any time is solely determined by thegeometric aperture of the array [8]. The integratedexposure mounts up to about 5165 km2 sr yr,which is a factor of more than 3 larger than theexposure obtained by the largest forerunner ex-periment AGASA [9]. Moreover the present ac-ceptance exceeds the one given in [10] by a fac-tor of about 3. For a given energy the value ofS(1000) decreases with zenith angle, θ, due to at-tenuation of the shower particles and geometricaleffects. Assuming an isotropic flux for the wholeenergy range considered, i.e. the intensity distribu-tion is uniform when binned in cos2 θ, we extractthe shape of the attenuation curve from the data. InFigure 1 several intensities, Ii = I(> Si(1000)),above a given value of lg Si(1000) are shown asa function of cos2 θ. The choice of the thresholdlg S(1000) is not critical since the shape is nearlythe same within the statistical limit. The fitted at-tenuation curve, CIC(θ) = 1 + a x + b x2, is aquadratic function of x = cos2 θ− cos2 38◦ as dis-played in Figure 2 for a particular constant inten-sity cut, I0 = 128 events, with a = 0.94 ± 0.06and b = −1.21 ± 0.27. The cut correspondsto a shower size of about S38◦ = 47 VEM andequivalently to an energy of about 9 EeV. Sincethe average angle is 〈θ〉 � 38◦ we take this an-gle as reference and convert S(1000) into S38◦ byS38◦ ≡ S(1000)/CIC(θ). It may be regardedas the signal S(1000) the shower would have pro-
θcos2
0.3 0.4 0.5 0.6 0.7 0.8 0.9 1
S(1
000)
[V
EM
]
25
30
35
40
45
50
55
60
Figure 2: Derived attenuation curve, CIC(θ), fit-ted with a quadratic function.
duced had it arrived at θ = 38◦. The reconstruc-tion accuracy of the parameter S(1000), σS(1000),comprises 3 contributions and these are taken intoaccount in inferring S38◦ and its uncertainty σS38◦
:a statistical uncertainty due to the finite size of thedetector and the limited dynamic range of the sig-nal detection, a systematic uncertainty due to theassumptions of the shape of the lateral distribu-tion and finally due to the shower-to-shower fluc-tuations [11]. To infer the energy we have to es-tablish the relation between S38◦ and the calori-metric energy measurement, EFD. A set of hybridevents of high quality is selected based on the crite-ria reported in [6] without applying the cut on thefield of view, which appears to have a negligibleeffect for the topic addressed here. A small correc-tion to account for the energy carried away by highenergy muons and neutrinos, the so-called invisi-ble energy, depends slightly on mass and hadronicmodel. The applied correction is based on the av-erage for proton and iron showers simulated withthe QGSJet model and sums up to about 10% andits systematic uncertainty contributes 4% to the to-tal uncertainty in FD energy [3]. Moreover the SDquality cuts described above are applied. The cri-teria include a measurement of the vertical aerosoloptical depth profile (VAOD(h)) [12] using lasershots generated by the central laser facility (CLF)[13] and observed by the FD in the same hour ofeach selected hybrid event. The selected hybridevents were used to calibrate the SD energy. Thefollowing procedure was adopted. For each hy-brid event, with measured FD energy EFD, theSD energy estimator S38◦ was determined from the
90
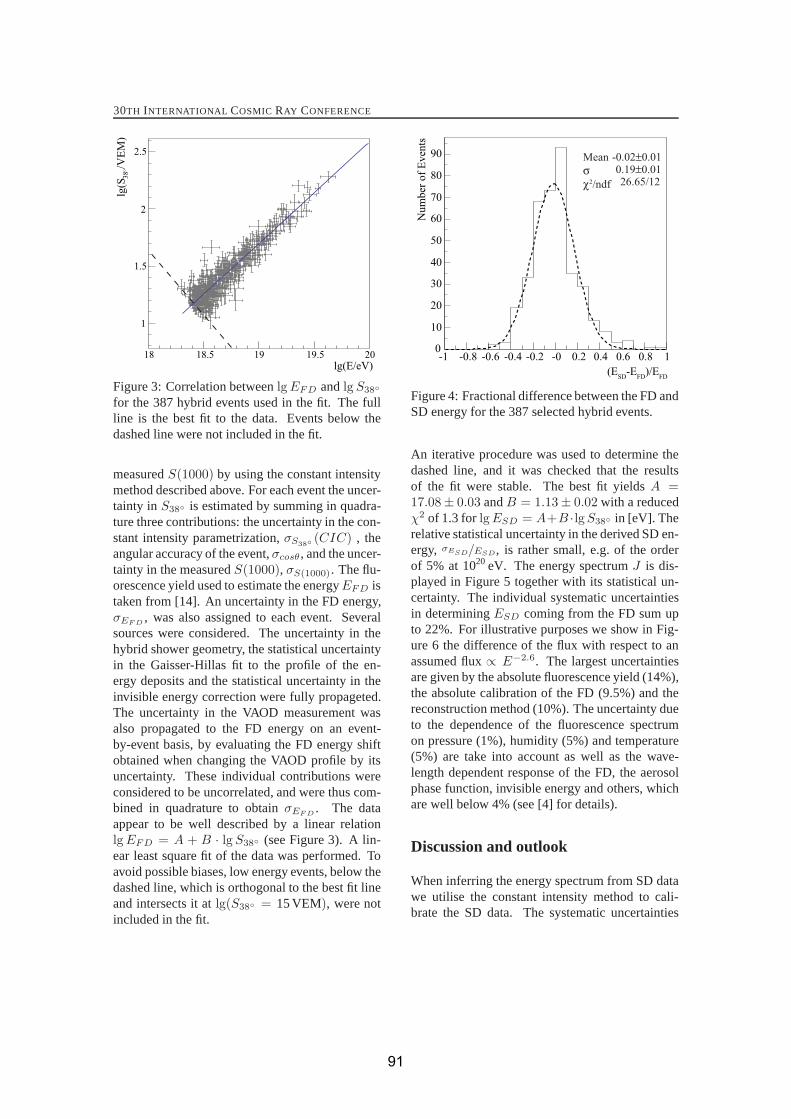
30TH INTERNATIONAL COSMIC RAY CONFERENCE
lg(E/eV)18 18.5 19 19.5 20
/VE
M)
38
o l
g(S
1
1.5
2
2.5
Figure 3: Correlation between lg EFD and lg S38◦
for the 387 hybrid events used in the fit. The fullline is the best fit to the data. Events below thedashed line were not included in the fit.
measured S(1000) by using the constant intensitymethod described above. For each event the uncer-tainty in S38◦ is estimated by summing in quadra-ture three contributions: the uncertainty in the con-stant intensity parametrization, σS38◦
(CIC) , theangular accuracy of the event, σcosθ , and the uncer-tainty in the measured S(1000), σS(1000). The flu-orescence yield used to estimate the energy EFD istaken from [14]. An uncertainty in the FD energy,σEF D
, was also assigned to each event. Severalsources were considered. The uncertainty in thehybrid shower geometry, the statistical uncertaintyin the Gaisser-Hillas fit to the profile of the en-ergy deposits and the statistical uncertainty in theinvisible energy correction were fully propageted.The uncertainty in the VAOD measurement wasalso propagated to the FD energy on an event-by-event basis, by evaluating the FD energy shiftobtained when changing the VAOD profile by itsuncertainty. These individual contributions wereconsidered to be uncorrelated, and were thus com-bined in quadrature to obtain σEF D
. The dataappear to be well described by a linear relationlg EFD = A + B · lg S38◦ (see Figure 3). A lin-ear least square fit of the data was performed. Toavoid possible biases, low energy events, below thedashed line, which is orthogonal to the best fit lineand intersects it at lg(S38◦ = 15 VEM), were notincluded in the fit.
-1 -0.8 -0.6 -0.4 -0.2 -0 0.2 0.4 0.6 0.8 1
Nu
mb
er o
f E
ven
ts
0
10
20
30
40
50
60
70
80
90
(ESD
-EFD
)/EFD
Mean
σ χ2/ndf
-0.02±0.010.19±0.0126.65/12
Figure 4: Fractional difference between the FD andSD energy for the 387 selected hybrid events.
An iterative procedure was used to determine thedashed line, and it was checked that the resultsof the fit were stable. The best fit yields A =17.08± 0.03 and B = 1.13± 0.02 with a reducedχ2 of 1.3 for lg ESD = A+B ·lgS38◦ in [eV]. Therelative statistical uncertainty in the derived SD en-ergy, σE
SD/ESD, is rather small, e.g. of the orderof 5% at 1020 eV. The energy spectrum J is dis-played in Figure 5 together with its statistical un-certainty. The individual systematic uncertaintiesin determining ESD coming from the FD sum upto 22%. For illustrative purposes we show in Fig-ure 6 the difference of the flux with respect to anassumed flux ∝ E−2.6. The largest uncertaintiesare given by the absolute fluorescence yield (14%),the absolute calibration of the FD (9.5%) and thereconstruction method (10%). The uncertainty dueto the dependence of the fluorescence spectrumon pressure (1%), humidity (5%) and temperature(5%) are take into account as well as the wave-length dependent response of the FD, the aerosolphase function, invisible energy and others, whichare well below 4% (see [4] for details).
Discussion and outlook
When inferring the energy spectrum from SD datawe utilise the constant intensity method to cali-brate the SD data. The systematic uncertainties
91
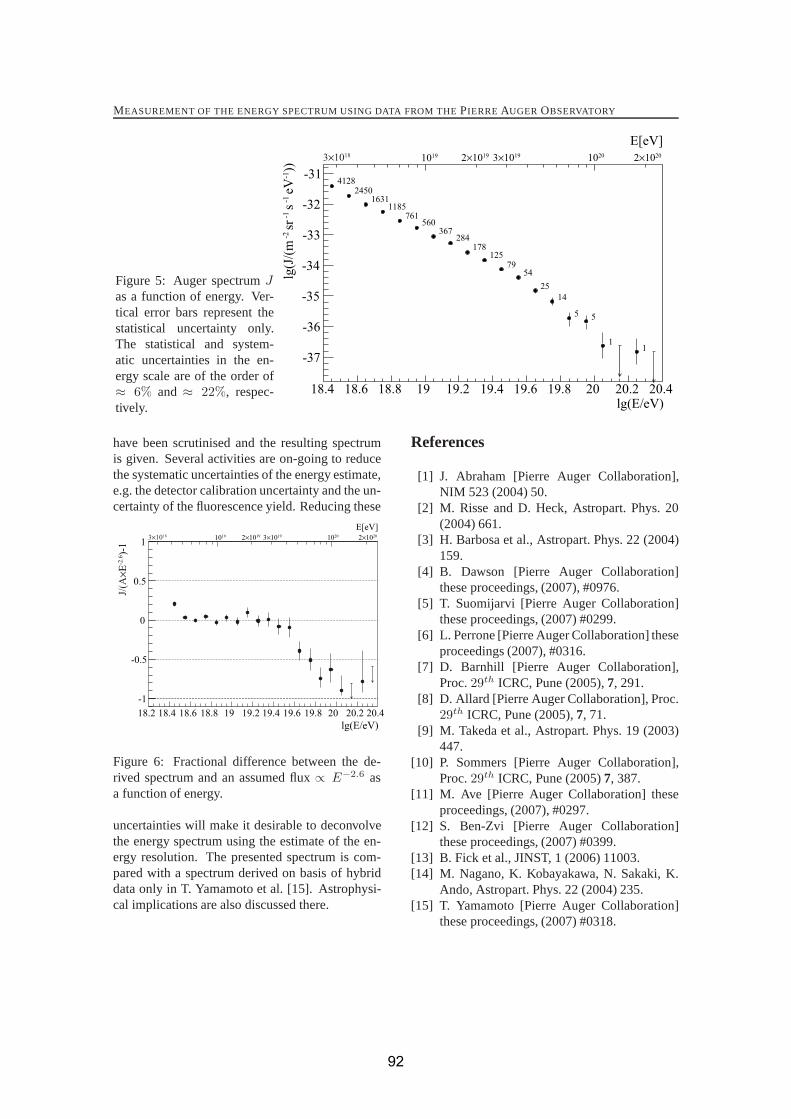
MEASUREMENT OF THE ENERGY SPECTRUM USING DATA FROM THE PIERRE AUGER OBSERVATORY
Figure 5: Auger spectrum Jas a function of energy. Ver-tical error bars represent thestatistical uncertainty only.The statistical and system-atic uncertainties in the en-ergy scale are of the order of≈ 6% and ≈ 22%, respec-tively. lg(E/eV)
18.4 18.6 18.8 19 19.2 19.4 19.6 19.8 20 20.2 20.4
-37
-36
-35
-34
-33
-32
-31
E[eV]
1019 2×10¹⁹ 3×10¹⁹ 1020 2×10²⁰
41282450
16311185
761560
367284
178125
7954
25
14
5 5
11
3×10¹⁸
lg(J
/(m
-2 s
r -1 s
-1 e
V-1))
have been scrutinised and the resulting spectrumis given. Several activities are on-going to reducethe systematic uncertainties of the energy estimate,e.g. the detector calibration uncertainty and the un-certainty of the fluorescence yield. Reducing these
lg(E/eV)
18.2 18.4 18.6 18.8 19 19.2 19.4 19.6 19.8 20 20.2 20.4
-1
-0.5
0
0.5
1
J/(A
×E-2
.6)-
1
E[eV]1019 2×10¹⁹ 3×10¹⁹ 1020 2×10203×1018
Figure 6: Fractional difference between the de-rived spectrum and an assumed flux ∝ E−2.6 asa function of energy.
uncertainties will make it desirable to deconvolvethe energy spectrum using the estimate of the en-ergy resolution. The presented spectrum is com-pared with a spectrum derived on basis of hybriddata only in T. Yamamoto et al. [15]. Astrophysi-cal implications are also discussed there.
References
[1] J. Abraham [Pierre Auger Collaboration],NIM 523 (2004) 50.
[2] M. Risse and D. Heck, Astropart. Phys. 20(2004) 661.
[3] H. Barbosa et al., Astropart. Phys. 22 (2004)159.
[4] B. Dawson [Pierre Auger Collaboration]these proceedings, (2007), #0976.
[5] T. Suomijarvi [Pierre Auger Collaboration]these proceedings, (2007) #0299.
[6] L. Perrone [Pierre Auger Collaboration] theseproceedings (2007), #0316.
[7] D. Barnhill [Pierre Auger Collaboration],Proc. 29th ICRC, Pune (2005), 7, 291.
[8] D. Allard [Pierre Auger Collaboration], Proc.29th ICRC, Pune (2005), 7, 71.
[9] M. Takeda et al., Astropart. Phys. 19 (2003)447.
[10] P. Sommers [Pierre Auger Collaboration],Proc. 29th ICRC, Pune (2005) 7, 387.
[11] M. Ave [Pierre Auger Collaboration] theseproceedings, (2007), #0297.
[12] S. Ben-Zvi [Pierre Auger Collaboration]these proceedings, (2007) #0399.
[13] B. Fick et al., JINST, 1 (2006) 11003.[14] M. Nagano, K. Kobayakawa, N. Sakaki, K.
Ando, Astropart. Phys. 22 (2004) 235.[15] T. Yamamoto [Pierre Auger Collaboration]
these proceedings, (2007) #0318.
92
30th International Cosmic Ray Conference
Study of the Cosmic Ray Composition above 0.4 EeV using the Longitu-dinal Profiles of Showers observed at the Pierre Auger Observatory
Michael Unger1
for the Pierre Auger Collaboration2
1Forschungszentrum Karlsruhe, Postfach 3640, 76021 Karlsruhe, Germany2Observatorio Pierre Auger, Av. San Martin Norte 304, 5613 Malargue, Argentinia
Abstract: The Pierre Auger Observatory has been collecting data in a stable manner sinceJanuary 2004. We present here a study of the cosmic ray composition using events recordedin hybrid mode during the first years of data taking. These are air showers observed bythe fluorescence detector as well as the surface detector, so the depth of shower maximum,Xmax, is measured directly. The cosmic ray composition is studied in different energy ranges bycomparing the observed average Xmax with predictions from air shower simulations for differentnuclei. The change of 〈Xmax〉 with energy (elongation rate) is used to derive estimates of thechange in primary composition.
Introduction
Ultra-high-energy cosmic rays are presumedto be of extragalactic origin. With increas-ing energies, and thus Larmor radii, the galac-tic charged particles can not be confined inour Galaxy and the galactic cosmic ray accel-erator candidates are expected to reach theirmaximum energy well below 1018 eV. More-over, there are no experimental signs of ananisotropy of the cosmic ray arrival directionat these energies.The transition between galactic and extra-galactic cosmic rays is therefore believed tohappen between 1018 and 1019 eV where a spec-tral break in the cosmic ray flux known as the’ankle’ or ’dip’ is observed. The exact positionand nature of the transition is still disputedand it seems clear that a combined precise mea-surement of the particle flux and compositionin this energy range is needed to be able todistinguish between different models of the ex-tragalactic cosmic ray component (see [1] forrecent discussions on this subject).For fluorescence detectors (FDs), the observ-able most sensitive to the composition is theslant depth position Xmax at which the maxi-
mum of the longitudinal shower profile occurs.Its average value 〈Xmax〉 at a certain energy Eis related to the mean logarithmic mass 〈ln A〉via
〈Xmax〉 = Dp [ln (E/E0) − 〈ln A〉] + cp, (1)
where Dp denotes the ’elongation rate’ [2] of aproton, and cp is the average depth of a protonwith reference energy E0. Both, Dp and cp,depend on the nature of hadronic interactions.The width of the Xmax distribution is anothercomposition sensitive parameter, since heavynuclei are expected to produce smaller shower-to-shower fluctuations than protons.
Data Analysis
In this analysis we use hybrid events collectedby the Pierre Auger Observatory between the1st of December 2004 and the 30th of April2007. These are showers observed by at leastone FD and with at least one triggered tankrecorded by the surface detector.In order to ensure a good Xmax resolution atthe 20 g cm−2 level [3], the following qualitycuts were applied to the data: The recon-structed Xmax should lie within the observed
93

Study of the Cosmic Ray Composition with the Pierre Auger Observatory
Xup
Xlow
field of view
Figure 1: Illustration of the effect of the fieldof view of the fluorescence detector on the se-lected Xmax distribution. Filled areas indicateslant depths, which are de-selected by the qual-ity cuts.
shower profile and the reduced χ2 of a fit witha Gaisser-Hillas function [4] should not exceed2.5. Moreover, insignificant shower maximaare rejected by requiring that the χ2 of a lin-ear fit to the longitudinal profile exceeds theGaisser-Hillas fit χ2 by at least four. Finally,the estimated uncertainties of the shower max-imum and total energy must be smaller than40 g cm−2 and 20%, respectively.In addition, a set of fiducial volume cuts is ap-plied to allow for an unbiased measurement ofthe Xmax-distribution: Energy dependent cutson the zenith angle and the maximum tank-core distance ensure a single-tank trigger prob-ability near one for protons and iron at all en-ergies.In order to minimise systematic uncertain-ties from the relative timing between the flu-orescence and surface detectors, the minimumviewing angle under which a shower was ob-served is required to be larger than 20◦. Thiscut also removes events with a large fraction ofdirect Cherenkov light.Moreover, a minimisation of the effect of thefield of view boundaries of the FDs is of utmostimportance: The current fluorescence detec-tors cover an elevation range from Ω1 = 1.5◦ toΩ2 = 30◦ and therefore the observable heightsfor vertical tracks are between R tan Ω1 < hv <R tan Ω2, where R denotes the distance of the
]2 [g/cmlowX200 300 400 500 600 700 800
]2>
[g/c
mm
ax<X
500
550
600
650
700
750
800
850
900
Figure 2: Dependence of the average mea-sured Xmax on the upper viewable slant depthboundary for showers with energies between1018 and 1018.25 eV. The arrow indicates thecut corresponding to an estimated containedevent fraction of > 95%.
shower core to the fluorescence detector. Thatis, the farther away from a fluorescence detec-tor a track is detected, the smaller becomes theobservable upper slant depth boundary Xup.Similarly the lower slant depth boundary Xlow
becomes larger for near showers.Since in the quality selection it is requiredthat the Xmax is detected within the field ofview, these slant depth boundaries can severelybias the selected Xmax-distributions, as it issketched in Fig. 1. This bias can be avoidedby selecting only tracks with geometries corre-sponding to an Xup-Xlow range, which is largeenough to contain most of the parent Xmax-distribution. Therefore, we investigate the de-pendence of 〈Xmax〉 on the field of view bound-aries and place fiducial volume cuts at the Xup
and Xlow values, where the 〈Xmax〉 starts tobe constant. An example of this procedure isshown in Fig. 2.
Systematic Uncertainties
The effect of atmospheric uncertainties onthe measurement of the shower maximumis discussed in detail in [5]. The dominat-ing contribution is the long-term validityof the monthly average molecular profiles
94
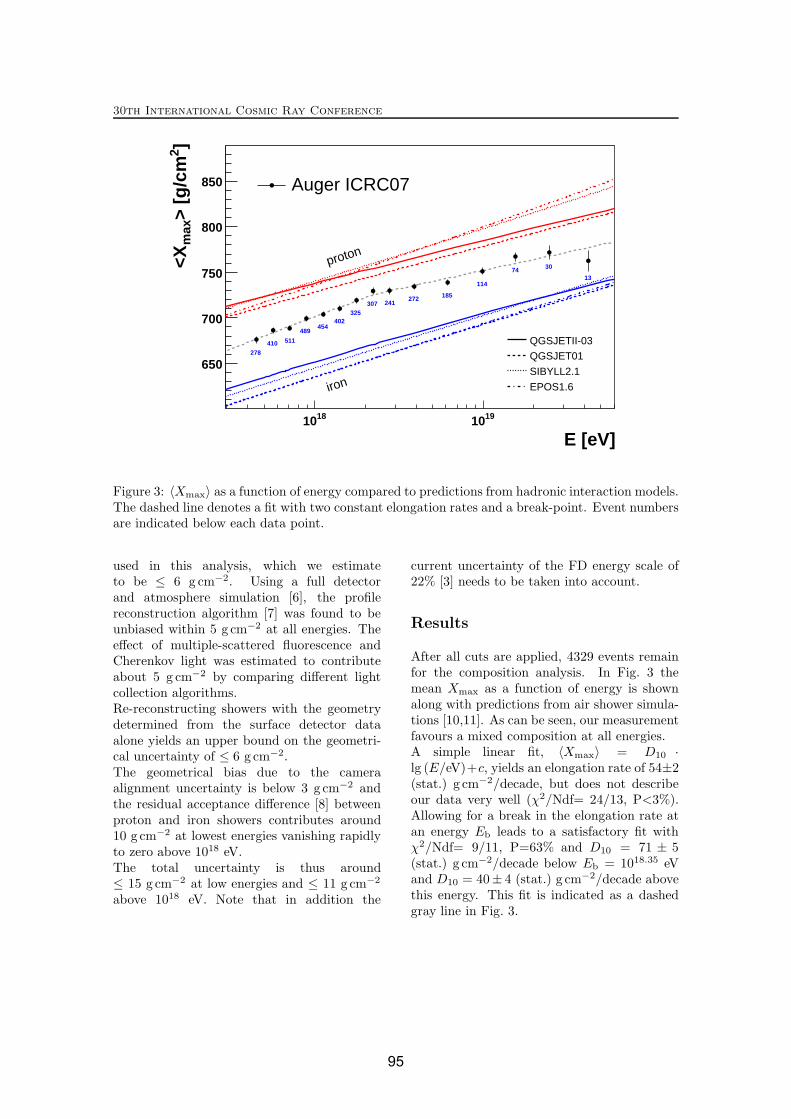
30th International Cosmic Ray Conference
E [eV]1810 1910
]2>
[g/c
mm
ax<X
650
700
750
800
850 Auger ICRC07
278410 511
489454
402325
307 241272 185
114
74 30
13
QGSJETII-03
QGSJET01
SIBYLL2.1
EPOS1.6
proton
iron
Figure 3: 〈Xmax〉 as a function of energy compared to predictions from hadronic interaction models.The dashed line denotes a fit with two constant elongation rates and a break-point. Event numbersare indicated below each data point.
used in this analysis, which we estimateto be ≤ 6 g cm−2. Using a full detectorand atmosphere simulation [6], the profilereconstruction algorithm [7] was found to beunbiased within 5 g cm−2 at all energies. Theeffect of multiple-scattered fluorescence andCherenkov light was estimated to contributeabout 5 g cm−2 by comparing different lightcollection algorithms.Re-reconstructing showers with the geometrydetermined from the surface detector dataalone yields an upper bound on the geometri-cal uncertainty of ≤ 6 g cm−2.The geometrical bias due to the cameraalignment uncertainty is below 3 g cm−2 andthe residual acceptance difference [8] betweenproton and iron showers contributes around10 g cm−2 at lowest energies vanishing rapidlyto zero above 1018 eV.The total uncertainty is thus around≤ 15 g cm−2 at low energies and ≤ 11 g cm−2
above 1018 eV. Note that in addition the
current uncertainty of the FD energy scale of22% [3] needs to be taken into account.
Results
After all cuts are applied, 4329 events remainfor the composition analysis. In Fig. 3 themean Xmax as a function of energy is shownalong with predictions from air shower simula-tions [10,11]. As can be seen, our measurementfavours a mixed composition at all energies.A simple linear fit, 〈Xmax〉 = D10 ·lg (E/eV)+c, yields an elongation rate of 54±2(stat.) g cm−2/decade, but does not describeour data very well (χ2/Ndf= 24/13, P<3%).Allowing for a break in the elongation rate atan energy Eb leads to a satisfactory fit withχ2/Ndf= 9/11, P=63% and D10 = 71 ± 5(stat.) g cm−2/decade below Eb = 1018.35 eVand D10 = 40± 4 (stat.) g cm−2/decade abovethis energy. This fit is indicated as a dashedgray line in Fig. 3.
95

Study of the Cosmic Ray Composition with the Pierre Auger Observatory
E [eV]1810 1910
/dec
ade]
2 [
g/c
m10
D
10
20
30
40
50
60
70
80
90
QGSJETII-03
QGSJET01
SIBYLL2.1
EPOS1.6
lg(E/eV)<18.35lg(E/eV)>18.35
Figure 4: Comparison of the measured elonga-tion rate, D10, below (solid circle) and above(open circle) 1018.35 eV to predictions of airshower simulations (red: protons, blue: iron).
Due to the uncertainties of hadronic interac-tion at highest energies, the interpretation ofthese elongation rates is, however, ambiguous(cf. Fig. 4). Using the QGSJETII elongationrates the data suggests a moderate lighteningof the primary cosmic at low energies and analmost constant composition at high energies,whereas the EPOS elongation rate is clearlylarger than the measured one at high energies,which would indicate a transition from lightto heavy elements. Theses ambiguities will bepartially resolved by the analysis of the Xmax
fluctuations as an additional mass sensitive pa-rameter.A comparison with previous measurements [9]is presented in Fig. 5. The results of all threeexperiments are compatible within their sys-tematic uncertainties. It is worthwhile notingthat although the data presented here havebeen collected during the construction of thePierre Auger Observatory, their statistical pre-cision already exceed that of preceeding exper-iments.
References
[1] V. Berezinsky et al., Phys. Rev. D 74
(2006) 043005; T. Stanev, astro-ph/0611633;A. M. Hillas, astro-ph/0607109, D. Allard etal., Astropart.Phys. 27, (2007), 61.
E [eV]1810 1910
]2>
[g/c
mm
ax<X
650
700
750
800
850Auger ICRC07Fly’s Eye
HiRes/MiaHiRes
Figure 5: 〈Xmax〉 as a function of energy com-pared to previous experiments.
[2] J. Linsley, Proc. 15th ICRC, 12 (1977) 89;T.K. Gaisser et al., Proc. 16th ICRC, 9 (1979)258; J. Linsley and A.A. Watson, Phys. Rev.Lett., 46 (1981) 459.[3] B. Dawson [Pierre Auger Collaboration],these proceedings, #0976[4] T.K. Gaisser and A.M. Hillas, Proc. 15thICRC (1977), 8, 353.[5] M. Prouza [Pierre Auger Collaboration],these proceedings, #0398[6] L. Prado et al., Nucl. Instrum. Meth., A545(2005), 632.[7] M. Unger, R. Engel, F. Schussler, R. Ulrich,these proceedings, #0972[8] H.O. Klages [Pierre Auger Collaboration],these proceedings, #0065[9] D.J. Bird et al. [Fly’s Eye Collaboration],Phys. Rev. Lett., 71 (1993) 3401; T. Abu-Zayyad et al. [HiRes-MIA Collaboration], As-trophys. J., 557 (2001) 686; R.U. Abbasi etal. [HiRes Collaboration], Astrophys. J., 622(2005) 910.[10] N.N. Kalmykov et al., Nucl. Phys. B (Proc.Suppl.) (1997), 7; R. Engel et al., Proc.26th ICRC (1999), 415; S. Ostapchenko, Nucl.Phys. Proc. Suppl., 151 (2006), 143; T. Pieroget al., these proceedings, #0905 and astro-ph/0611311.[11] T. Bergmann et al., Astropart. Phys., 26,(2007), 420.
96
30TH INTERNATIONAL COSMIC RAY CONFERENCE
Test of hadronic interaction models with data from the Pierre Auger Observatory
RALPH ENGEL1, FOR THE PIERRE AUGER COLLABORATION2
1 Forschungszentrum Karlsruhe, P.O. Box 3640, 76021 Karlrsuhe, Germany2 Observatorio Pierre Auger, Av. San Martın Norte 304, (5613) Malargue, Mendoza, [email protected]
Abstract: The Pierre Auger Observatory allows the measurement of both longitudinal profiles andlateral particle distributions of high-energy showers. The former trace the overall shower development,mainly of the electromagnetic component close to the core where the latter reflect the particle densitiesin the tail of the shower far away from the core and are sensitive to both the muonic and electromagneticcomponents. Combining the two complementary measurements, predictions of air shower simulations aretested. In particular the muon component of the tank signals, which is sensitive to hadronic interactionsat high energy, is studied with several independent methods. Implications for the simulation of hadronicinteractions at ultra-high energy are discussed.
Introduction
During the last decade, air shower simulationcodes have reached such a high quality that thereis good overall agreement between the predictedand experimentally observed shower characteris-tics. The largest remaining source of uncer-tainty of shower predictions stems from our limitedknowledge of hadronic interactions at high energy.Hadronic multiparticle production has to be simu-lated at energies exceeding by far those accessibleat man-made accelerators and in phase space re-gions not covered in collider experiments. There-fore it is not surprising that predictions for thenumber of muons or other observables, which aredirectly related to hadron production in showers,depend strongly on the adopted hadronic interac-tion models [1].
In this work we will employ universality featuresof the longitudinal profile of the electromagneticshower component to combine fluorescence detec-tor and surface array measurements of the PierreAuger Observatory. Using the measured showerdepth of maximum, Xmax, the muon density atground is inferred without assumptions on the pri-mary cosmic ray composition. This allows a directtest of the predictions of hadronic interaction mod-els.
Parameterisation of surface detectorsignal using universality
Universality features of the longitudinal profile ofshowers have been studied by several authors [2].Here we exploit shower universality features topredict the surface detector signal expected forAuger Cherenkov tanks due to the electromagneticand muonic shower components at 1000 m fromthe shower core. In the following only a briefintroduction to the method of parameterising themuonic and electromagnetic tank signals is given.A detailed description is given in [3].
A library of proton and iron showers covering theenergy range from 1017 to 1020 eV and zenith an-gles between 0◦ and 70◦ was generated with COR-SIKA 6.5 [4] and the hadronic interaction modelsQGSJET II.03 [5] and FLUKA [6]. For compari-son, a smaller set of showers was simulated withthe combinations QGSJET II.03/GHEISHA [7]and SIBYLL 2.1/FLUKA [8, 9]. Seasonal modelsof the Malargue molecular atmosphere were used[10]. The detector response is calculated usinglook-up tables derived from a detailed GEANT4simulation [11].
Within the library of showers, the predicted sur-face detector signal for the electromagnetic com-ponent of a shower at the lateral distance of 1000 m
97
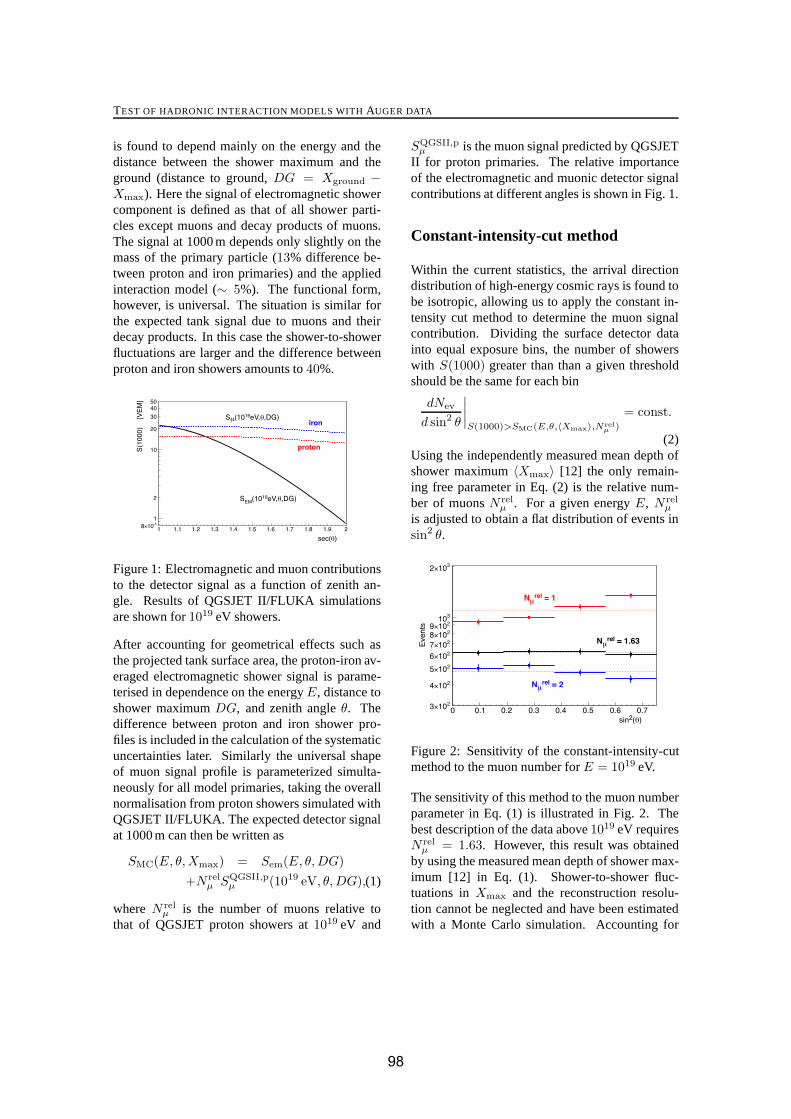
TEST OF HADRONIC INTERACTION MODELS WITH AUGER DATA
is found to depend mainly on the energy and thedistance between the shower maximum and theground (distance to ground, DG = Xground −Xmax). Here the signal of electromagnetic showercomponent is defined as that of all shower parti-cles except muons and decay products of muons.The signal at 1000 m depends only slightly on themass of the primary particle (13% difference be-tween proton and iron primaries) and the appliedinteraction model (∼ 5%). The functional form,however, is universal. The situation is similar forthe expected tank signal due to muons and theirdecay products. In this case the shower-to-showerfluctuations are larger and the difference betweenproton and iron showers amounts to 40%.
sec(θ)1 1.1 1.2 1.3 1.4 1.5 1.6 1.7 1.8 1.9 2
[VE
M]
S(1
000)
-110×81
2
10
20
30
4050
SEM(1019eV,θ,DG)
Sμ(1019eV,θ,DG)
proton
iron
Figure 1: Electromagnetic and muon contributionsto the detector signal as a function of zenith an-gle. Results of QGSJET II/FLUKA simulationsare shown for 1019 eV showers.
After accounting for geometrical effects such asthe projected tank surface area, the proton-iron av-eraged electromagnetic shower signal is parame-terised in dependence on the energy E, distance toshower maximum DG, and zenith angle θ. Thedifference between proton and iron shower pro-files is included in the calculation of the systematicuncertainties later. Similarly the universal shapeof muon signal profile is parameterized simulta-neously for all model primaries, taking the overallnormalisation from proton showers simulated withQGSJET II/FLUKA. The expected detector signalat 1000 m can then be written as
SMC(E, θ, Xmax) = Sem(E, θ, DG)+N rel
μ SQGSII,pμ (1019 eV, θ, DG),(1)
where N relμ is the number of muons relative to
that of QGSJET proton showers at 1019 eV and
SQGSII,pμ is the muon signal predicted by QGSJET
II for proton primaries. The relative importanceof the electromagnetic and muonic detector signalcontributions at different angles is shown in Fig. 1.
Constant-intensity-cut method
Within the current statistics, the arrival directiondistribution of high-energy cosmic rays is found tobe isotropic, allowing us to apply the constant in-tensity cut method to determine the muon signalcontribution. Dividing the surface detector datainto equal exposure bins, the number of showerswith S(1000) greater than than a given thresholdshould be the same for each bin
dNev
d sin2 θ
∣∣∣∣S(1000)>SMC(E,θ,〈Xmax〉,Nrel
μ)
= const.
(2)Using the independently measured mean depth ofshower maximum 〈Xmax〉 [12] the only remain-ing free parameter in Eq. (2) is the relative num-ber of muons N rel
μ . For a given energy E, N relμ
is adjusted to obtain a flat distribution of events insin2 θ.
sin2(θ)0 0.1 0.2 0.3 0.4 0.5 0.6 0.7
Eve
nts
210×3
210×4
210×5
210×6
210×7
210×8
210×9310
310×2
Nμrel = 2
Nμrel = 1.63
Nμrel = 1
Figure 2: Sensitivity of the constant-intensity-cutmethod to the muon number for E = 1019 eV.
The sensitivity of this method to the muon numberparameter in Eq. (1) is illustrated in Fig. 2. Thebest description of the data above 1019 eV requiresN rel
μ = 1.63. However, this result was obtainedby using the measured mean depth of shower max-imum [12] in Eq. (1). Shower-to-shower fluc-tuations in Xmax and the reconstruction resolu-tion cannot be neglected and have been estimatedwith a Monte Carlo simulation. Accounting for
98
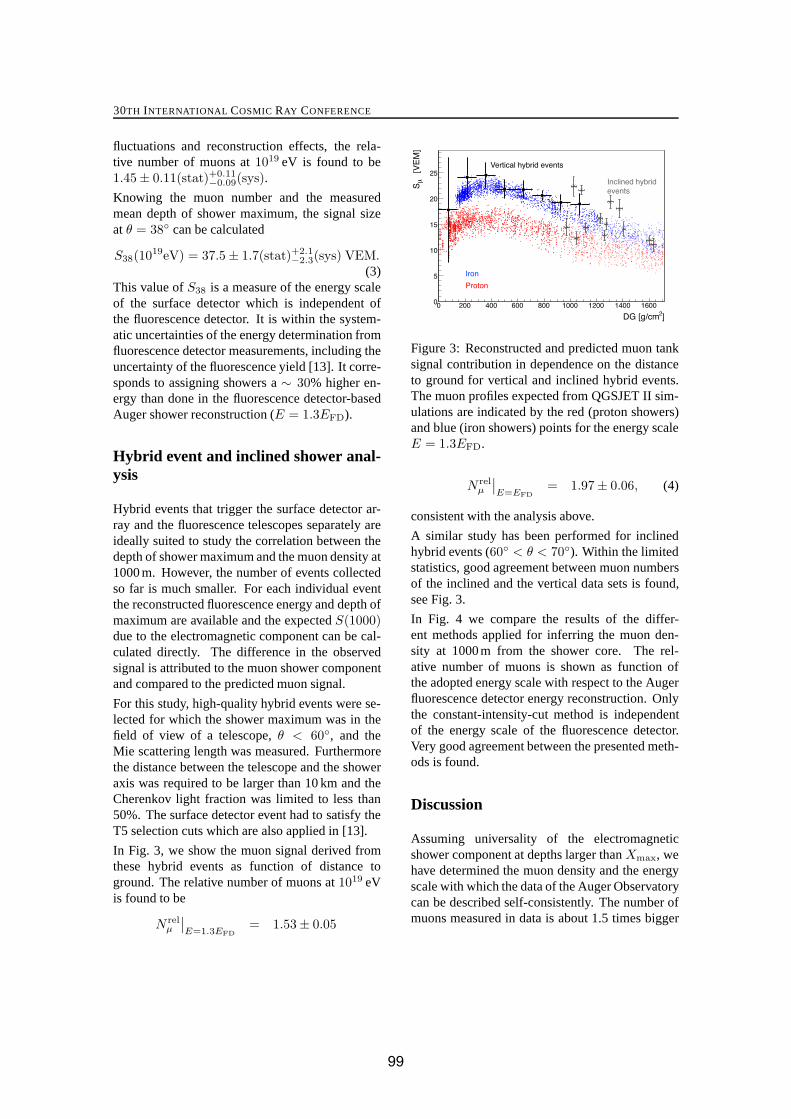
30TH INTERNATIONAL COSMIC RAY CONFERENCE
fluctuations and reconstruction effects, the rela-tive number of muons at 1019 eV is found to be1.45 ± 0.11(stat)+0.11
−0.09(sys).Knowing the muon number and the measuredmean depth of shower maximum, the signal sizeat θ = 38◦ can be calculated
S38(1019eV) = 37.5 ± 1.7(stat)+2.1−2.3(sys) VEM.
(3)This value of S38 is a measure of the energy scaleof the surface detector which is independent ofthe fluorescence detector. It is within the system-atic uncertainties of the energy determination fromfluorescence detector measurements, including theuncertainty of the fluorescence yield [13]. It corre-sponds to assigning showers a ∼ 30% higher en-ergy than done in the fluorescence detector-basedAuger shower reconstruction (E = 1.3EFD).
Hybrid event and inclined shower anal-ysis
Hybrid events that trigger the surface detector ar-ray and the fluorescence telescopes separately areideally suited to study the correlation between thedepth of shower maximum and the muon density at1000 m. However, the number of events collectedso far is much smaller. For each individual eventthe reconstructed fluorescence energy and depth ofmaximum are available and the expected S(1000)due to the electromagnetic component can be cal-culated directly. The difference in the observedsignal is attributed to the muon shower componentand compared to the predicted muon signal.
For this study, high-quality hybrid events were se-lected for which the shower maximum was in thefield of view of a telescope, θ < 60◦, and theMie scattering length was measured. Furthermorethe distance between the telescope and the showeraxis was required to be larger than 10 km and theCherenkov light fraction was limited to less than50%. The surface detector event had to satisfy theT5 selection cuts which are also applied in [13].
In Fig. 3, we show the muon signal derived fromthese hybrid events as function of distance toground. The relative number of muons at 1019 eVis found to be
N relμ
∣∣E=1.3EFD
= 1.53 ± 0.05
]2DG [g/cm0 200 400 600 800 1000 1200 1400 1600
[VE
M]
μS
0
5
10
15
20
25Inclined hybridevents
Vertical hybrid events
Proton
Iron
Figure 3: Reconstructed and predicted muon tanksignal contribution in dependence on the distanceto ground for vertical and inclined hybrid events.The muon profiles expected from QGSJET II sim-ulations are indicated by the red (proton showers)and blue (iron showers) points for the energy scaleE = 1.3EFD.
N relμ
∣∣E=EFD
= 1.97 ± 0.06, (4)
consistent with the analysis above.
A similar study has been performed for inclinedhybrid events (60◦ < θ < 70◦). Within the limitedstatistics, good agreement between muon numbersof the inclined and the vertical data sets is found,see Fig. 3.
In Fig. 4 we compare the results of the differ-ent methods applied for inferring the muon den-sity at 1000 m from the shower core. The rel-ative number of muons is shown as function ofthe adopted energy scale with respect to the Augerfluorescence detector energy reconstruction. Onlythe constant-intensity-cut method is independentof the energy scale of the fluorescence detector.Very good agreement between the presented meth-ods is found.
Discussion
Assuming universality of the electromagneticshower component at depths larger than Xmax, wehave determined the muon density and the energyscale with which the data of the Auger Observatorycan be described self-consistently. The number ofmuons measured in data is about 1.5 times bigger
99

TEST OF HADRONIC INTERACTION MODELS WITH AUGER DATA
Energy scale rel. to fluorescence detector0.7 0.8 0.9 1 1.1 1.2 1.3 1.4
at 1
0 E
eVμ
N
1
1.2
1.4
1.6
1.8
2
2.2
2.4
2.6
2.8
3
rel
μ
CICInclined hybridevents
Vertical hybridevents
Figure 4: Comparison of the results on the relativemuon multiplicity at 1019 eV from different meth-ods.
than that predicted by QGSJET II for proton show-ers. Consistent results were obtained with severalanalysis methods.
The QGSJET II and SIBYLL 2.1 predictions foriron showers correspond to relative muon numbersof 1.39 and 1.27, respectively. Therefore, inter-preted in terms of QGSJET II or SIBYLL 2.1, thederived muon density would correspond to a pri-mary cosmic ray composition heavier than iron,which is clearly at variance with the measuredXmax values. The discrepancy between air showerdata and simulations reported here is qualitativelysimilar to the inconsistencies found in compositionanalyses of previous detectors, see, for example,[14, 15, 16].
Finally it should be mentioned that the results ofthis study depend not only on the predictions ofthe hadronic interaction models but also on the re-liability of the model used for calculating the elec-tromagnetic interactions (EGS4 in this study [17]).
References
[1] J. Knapp, D. Heck, S. J. Sciutto, M. T. Dova,and M. Risse, Astropart. Phys. 19 (2003) 77–99 and astro-ph/0206414.
[2] P. Billoir, lecture given at CORSIKA School,http://www-ik.fzk.de/corsika/corsika-school,2005; M. Giller, A. Kacperczyk, J. Mali-nowski, W. Tkaczyk, and G. Wieczorek,J. Phys. G31 (2005) 947–958; F. Nerling,
J. Blumer, R. Engel, and M. Risse, Astropart.Phys. 24 (2006) 421–437 and astro-ph/0506729; D. Gora et al., Astropart. Phys.24 (2006) 484–494 and astro-ph/0505371;A. S. Chou [Pierre Auger Collab.], Proc. of29th ICRC (Pune), India, 3-11 Aug 2005, p.319.
[3] F. Schmidt, M. Ave, L. Cazon, A. Chou, theseproceedings #0752, 2007.
[4] D. Heck, J. Knapp, J. Capdevielle, G. Schatz,and T. Thouw, Wissenschaftliche BerichteFZKA 6019, Forschungszentrum Karlsruhe,1998.
[5] S. Ostapchenko, Phys. Rev. D74 (2006)014026 and hep-ph/0505259.
[6] A. Fasso, A. Ferrari, J. Ranft, and R. P. Sala,in Proc. of Int. Conf. on Advanced MonteCarlo for Radiation Physics, Particle Trans-port Simulation and Applications (MC 2000),Lisbon, Portugal, 23-26 Oct 2000, A. Kling,F. Barao, M. Nakagawa, L. Tavora, P. Vazeds., Springer-Verlag Berlin, p. 955, 2001.
[7] H. Fesefeldt, preprint PITHA-85/02, RWTHAachen, 1985.
[8] R. S. Fletcher, T. K. Gaisser, P. Lipari, andT. Stanev, Phys. Rev. D50 (1994) 5710.
[9] R. Engel, T. K. Gaisser, P. Lipari, andT. Stanev, in Proceedings of the 26th ICRC(Salt Lake City) vol. 1, p. 415, 1999.
[10] B. Keilhauer, J. Blumer, R. Engel, H. O.Klages, and M. Risse, Astropart. Phys. 22(2004) 249 and astro-ph/0405048.
[11] P.L. Ghia and I.LHenry-Yvon [Pierre AugerCollab.], these proceedings #0300, 2007.
[12] M. Unger [Pierre Auger Collab.], these pro-ceedings #0594, 2007.
[13] M. Roth [Pierre Auger Collab.], these pro-ceedings #0313, 2007.
[14] T. Abu-Zayyad et al. (HiRes-MIA Collab.),Phys. Rev. Lett. 84 (2000) 4276 and astro-ph/9911144.
[15] M.T. Dova, M.E. Mancenido, A.G. Mariazzi,T.P. McCauley and A.A. Watson, Astropart.Phys. 21 (2004) 597 and astro-ph/0312463.
[16] A.A. Watson, Nucl. Phys. Proc. Suppl. 136(2004) 290 and astro-ph/0408110.
[17] W.R. Nelson, Report SLAC-265, StanfordLinear Accelerator Center, 1985.
100

30TH INTERNATIONAL COSMIC RAY CONFERENCE
HEAT – Enhancement Telescopes for the Pierre Auger Southern Observatory
H. O. KLAGES1, FOR THE PIERRE AUGER COLLABORATION
1Forschungszentrum Karlsruhe, Institut für Kernphysik, P.O.Box 3640, D76021 Karlsruhe, Germany [email protected]
Abstract: The southern part of the Pierre Auger Observatory (PAO) is nearing completion in the
province of Mendoza, Argentina. Since 2004 the instrument is used to take air shower data at the
highest energies [1]. The energy threshold of the 3000 km² surface array of 1600 particle detectors for
high quality air shower reconstruction is about 3 . 1018 eV. The 24 Auger fluorescence telescopes (FD),
located in four “eye” stations at the edge of the detector array, enable precise air shower measure-
ments even at primary energies below 1018 eV. The Auger Collaboration has decided to further expand
its energy range down to 1017 eV after completion of the southern observatory around the end of 2007
by three additional fluorescence telescopes with an elevated field of view from 30o to 60o above the
horizon. It is foreseen to use these High Elevation Auger Telescopes (HEAT) in combination with the
existing telescopes at one of the four existing FD sites (Coihueco) as well as in hybrid mode using the
shower particle data from a new infill detector area of about 25 km² with fourfold sampling density –
close to HEAT and in the field of view of the new telescopes. This SD infill array (AMIGA) will also
be equipped with large area muon detectors [2]. In addition, it will be a perfectly suited test area for
the development of novel detection techniques for air showers at ultrahigh energies [3].
Introduction
Cosmic rays with energies in the range between
1017 eV and 5.1018 eV are of special interest for
the determination of the details of the transition
from galactic to extragalactic cosmic rays. The
precise shape of the energy spectrum and the
possible changes in primary composition must be
well known to enable stringent tests of models for
the acceleration and transport of both, galactic
and extragalactic, cosmic rays. More elaborated
arguments can be found in a separate contribution
to this conference [4].
The fluorescence technique for the detection of
air showers encounters difficulties at energies
below 1018 eV. The signal strength in fluorescence
photons per unit path length is (at air shower
maximum) roughly proportional to the primary
energy. Therefore, the effective distance range of
air shower detection gets smaller at lower ener-
gies. Only relatively close-by showers will trigger
the DAQ. At these small distances the height of
observation by the FD telescopes is limited. In
addition, lower energy air showers reach their
maximum of development at higher altitudes.
This height cutoff effect naturally gets even worse
for air showers incident at larger zenith angles.
The maximum of shower development will thus
quite often fall outside the field of view of the
existing FD telescopes of the Auger Observatory,
which is limited to about 30o above the horizon.
For an unambiguous reconstruction of the shower
profiles this leads to severe cuts in the triggered
data, which may be dependent on primary mass.
The telescope detection efficiency for showers,
which hit the ground at a certain distance from
the “eye”, also depends on the shower-detector
geometry. Showers approaching the telescopes
will have a higher trigger probability due to the
angular dependence of the scattered Cherenkov
light. Also, the efficiency for successful recon-
struction of the shower profile and Xmax will be
increased as is illustrated in figure 1. Therefore, it
is clear that for lower energies the fluorescence
telescopes benefit from a larger elevation range.
The Auger Collaboration will combine several of
their existing telescopes with three additional
telescopes tilted by about 30o, therefore covering
elevation angles up to 60o above horizon, but else
these will be very similar to the existing systems.
101

HEAT – HIGH ELEVATION AUGER TELESCOPES
Figure 1: Severe effects of a limited field of view
of fluorescence telescopes. Showers approaching
the “eye” have higher reconstruction efficiency.
Auger FD and the HEAT Telescopes The Auger Collaboration has installed 24 fluores-
cence telescopes at the southern observatory site
in Argentina. The telescopes are taking data in
four FD buildings (45 km apart from each other at
the edges of the array) overlooking the 3000 km²
array of 1600 particle detector tanks.
Each telescope has a field of view of 30o x 30o.
The Schmidt optics of the telescopes has an effec-
tive aperture of about 3 m². The signal/noise ratio
is improved by the use of UV transmitting filter
glass (M-UG6) for the entrance windows. The
high sensitivity of the Auger telescopes enables
the detection of showers with E > 1019 eV up to
distances of more than 40 km. Therefore, most of
the highest energy events are detected in stereo
mode by at least two telescopes simultaneously.
The strength of the Auger experiment is the op-
eration in Hybrid mode. More than 10% of all
events are detected by the surface detector system
(SD) and at least one (FD) telescope. These
events are especially valuable in two different
ways. The FD information allows the independent
energy calibration of well measured SD events at
higher energies. On the other hand, the FD traces
for low energy events can be reconstructed much
better, if at least one of the SD detector tanks has
triggered and its timing information can be used
for the event reconstruction. In this “brass hybrid
mode” the energy threshold of reconstruction is
much lower than for the surface detector alone,
where at least five tanks must trigger for good
reconstruction quality of all shower parameters.
Therefore, the energy range below 1018.5 eV is the
domain of the Auger FD telescopes. The three
new HEAT telescopes will show their full
strength also in the hybrid mode.
An SD infill area of 25 km² with fourfold surface
detector density close to the HEAT telescopes will
raise the hybrid trigger rate considerably and
lower the combined threshold for high quality
data. The additional large area muon detectors in
this area (AMIGA) will further enhance the high
capabilities of the PAO South experiment for the
determination of the mass distribution of the
primary cosmic ray particles.
The installation and commissioning of these two
enhancement systems will fit perfectly in the time
span between the end of detector commissioning
in Argentina and the start of installations for the
PAO North experiment in Colorado.
Properties of the HEAT Telescopes
In the context of design studies for the Auger
North experiment planned for a Colorado site it
became obvious to the FD study group that the
quality of the fluorescence telescopes operating in
Argentina is very satisfying. Apparently there is
no need for major design changes. Therefore, it
was decided to keep the main design parameters
like the structure of the PMT cameras and the
layout for the telescope optics unchanged.
These decisions lead to new requirements for the
mechanics of the HEAT telescopes. The existing
24 telescopes are operated in four solid concrete
FD buildings. The new systems will be installed
in moveable individual enclosures. As several
obsolete electronic circuits will have to be re-
placed anyhow, new designed readout electronics
will be used for HEAT, also as baseline design
and prototypes for the PAO North FD telescopes.
The three telescope shelters are made from steel
structures with lightweight insulating walls. They
are design to withstand large wind and snow
loads according to the local conditions and legal
regulations. Each shelter is built on a heavy plat-
form, a strong steel frame filled with concrete.
These platforms can be tilted by 30o using com-
mercial hydraulic drives and heavy duty bearings.
The large weight of the ground plates is necessary
to reduce wind induced vibrations of the shelters.
All critical installations are connected to these
solid ground plates only, not to the shelter walls.
102
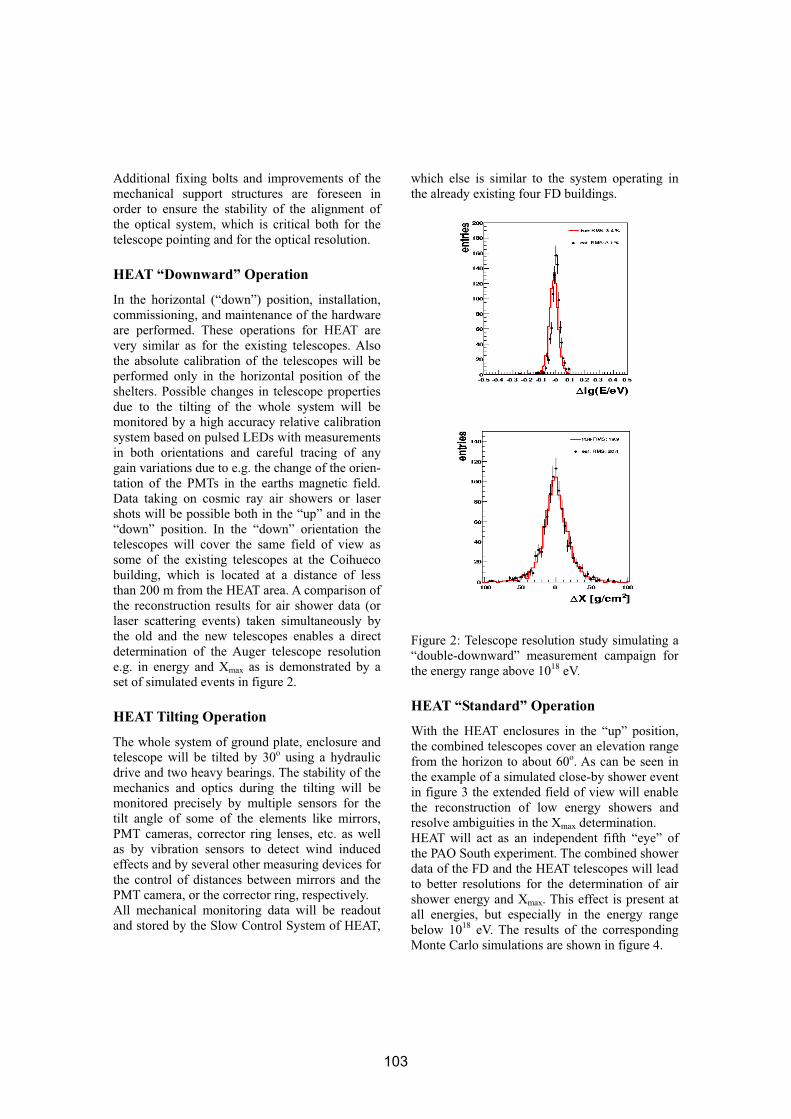
Additional fixing bolts and improvements of the
mechanical support structures are foreseen in
order to ensure the stability of the alignment of
the optical system, which is critical both for the
telescope pointing and for the optical resolution.
HEAT “Downward” Operation
In the horizontal (“down”) position, installation,
commissioning, and maintenance of the hardware
are performed. These operations for HEAT are
very similar as for the existing telescopes. Also
the absolute calibration of the telescopes will be
performed only in the horizontal position of the
shelters. Possible changes in telescope properties
due to the tilting of the whole system will be
monitored by a high accuracy relative calibration
system based on pulsed LEDs with measurements
in both orientations and careful tracing of any
gain variations due to e.g. the change of the orien-
tation of the PMTs in the earths magnetic field.
Data taking on cosmic ray air showers or laser
shots will be possible both in the “up” and in the
“down” position. In the “down” orientation the
telescopes will cover the same field of view as
some of the existing telescopes at the Coihueco
building, which is located at a distance of less
than 200 m from the HEAT area. A comparison of
the reconstruction results for air shower data (or
laser scattering events) taken simultaneously by
the old and the new telescopes enables a direct
determination of the Auger telescope resolution
e.g. in energy and Xmax as is demonstrated by a
set of simulated events in figure 2.
HEAT Tilting Operation
The whole system of ground plate, enclosure and
telescope will be tilted by 30o using a hydraulic
drive and two heavy bearings. The stability of the
mechanics and optics during the tilting will be
monitored precisely by multiple sensors for the
tilt angle of some of the elements like mirrors,
PMT cameras, corrector ring lenses, etc. as well
as by vibration sensors to detect wind induced
effects and by several other measuring devices for
the control of distances between mirrors and the
PMT camera, or the corrector ring, respectively.
All mechanical monitoring data will be readout
and stored by the Slow Control System of HEAT,
which else is similar to the system operating in
the already existing four FD buildings.
Figure 2: Telescope resolution study simulating a
“double-downward” measurement campaign for
the energy range above 1018 eV.
HEAT “Standard” Operation
With the HEAT enclosures in the “up” position,
the combined telescopes cover an elevation range
from the horizon to about 60o. As can be seen in
the example of a simulated close-by shower event
in figure 3 the extended field of view will enable
the reconstruction of low energy showers and
resolve ambiguities in the Xmax determination.
HEAT will act as an independent fifth “eye” of
the PAO South experiment. The combined shower
data of the FD and the HEAT telescopes will lead
to better resolutions for the determination of air
shower energy and Xmax. This effect is present at
all energies, but especially in the energy range
below 1018 eV. The results of the corresponding
Monte Carlo simulations are shown in figure 4.
103
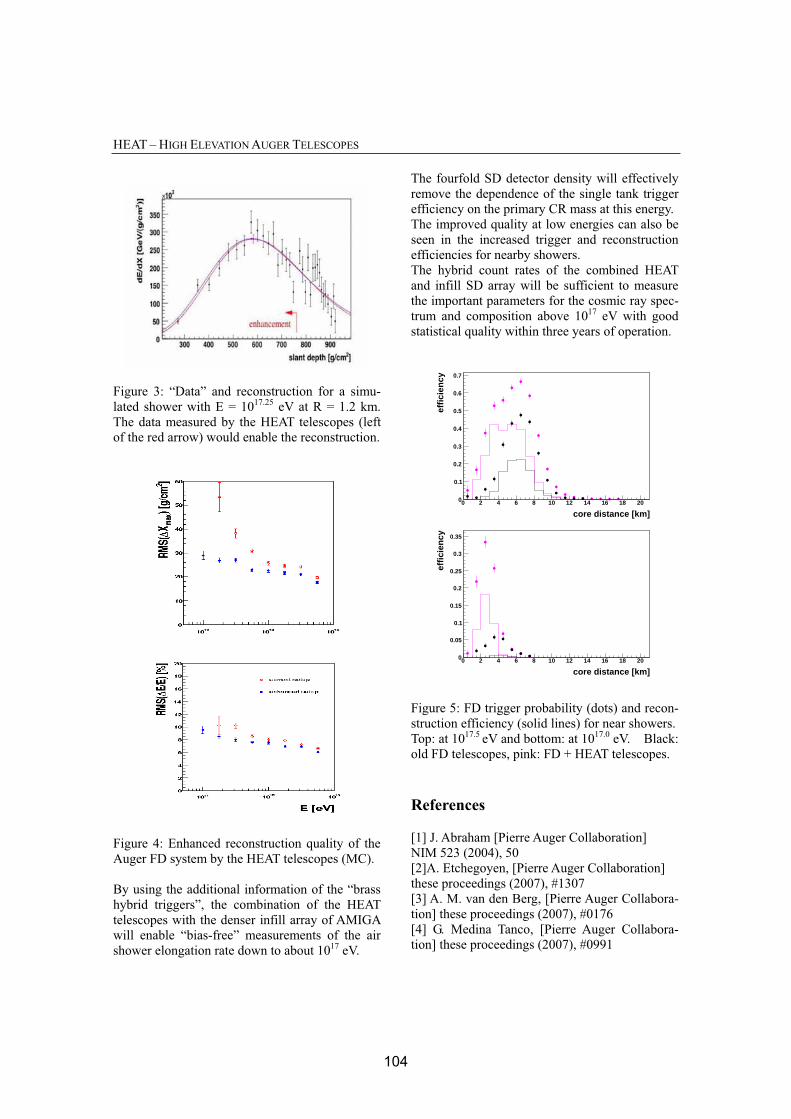
HEAT – HIGH ELEVATION AUGER TELESCOPES
Figure 3: “Data” and reconstruction for a simu-
lated shower with E = 1017.25 eV at R = 1.2 km.
The data measured by the HEAT telescopes (left
of the red arrow) would enable the reconstruction.
Figure 4: Enhanced reconstruction quality of the
Auger FD system by the HEAT telescopes (MC).
By using the additional information of the “brass
hybrid triggers”, the combination of the HEAT
telescopes with the denser infill array of AMIGA
will enable “bias-free” measurements of the air
shower elongation rate down to about 1017 eV.
The fourfold SD detector density will effectively
remove the dependence of the single tank trigger
efficiency on the primary CR mass at this energy.
The improved quality at low energies can also be
seen in the increased trigger and reconstruction
efficiencies for nearby showers.
The hybrid count rates of the combined HEAT
and infill SD array will be sufficient to measure
the important parameters for the cosmic ray spec-
trum and composition above 1017 eV with good
statistical quality within three years of operation.
core distance [km]0 2 4 6 8 10 12 14 16 18 20
effi
cien
cy
0
0.1
0.2
0.3
0.4
0.5
0.6
0.7
core distance [km]0 2 4 6 8 10 12 14 16 18 20
effi
cien
cy
0
0.05
0.1
0.15
0.2
0.25
0.3
0.35
Figure 5: FD trigger probability (dots) and recon-
struction efficiency (solid lines) for near showers.
Top: at 1017.5 eV and bottom: at 1017.0 eV. Black:
old FD telescopes, pink: FD + HEAT telescopes.
References
[1] J. Abraham [Pierre Auger Collaboration]
NIM 523 (2004), 50
[2]A. Etchegoyen, [Pierre Auger Collaboration]
these proceedings (2007), #1307
[3] A. M. van den Berg, [Pierre Auger Collabora-
tion] these proceedings (2007), #0176
[4] G. Medina Tanco, [Pierre Auger Collabora-
tion] these proceedings (2007), #0991
104

30th International Cosmic Ray Conference
Longitudinal Shower Profile Reconstruction from Fluorescence andCherenkov Light
M. Unger, R. Engel, F. Schussler and R. Ulrich
Forschungszentrum Karlsruhe, Postfach 3640, 76021 Karlsruhe, Germany
Abstract: Traditionally, longitudinal shower profiles are reconstructed in fluorescence lightexperiments by treating the Cherenkov light contribution as background. Here we will arguethat, due to universality of the energy spectra of electrons and positrons, both fluorescenceand Cherenkov light can be used simultaneously as signal to infer the longitudinal showerdevelopment. We present a new profile reconstruction method that is based on the analyticleast-square solution for the estimation of the shower profile from the observed light signaland discuss the extrapolation of the profile with a Gaisser-Hillas function.
Introduction
During its passage through the atmosphereof the earth an extensive air shower excitesnitrogen molecules of the air, which subse-quently radiate isotropically ultraviolet fluo-rescence light. Since the amount of emittedlight is proportional to the energy deposited,the longitudinal shower development can beobserved by appropriate optical detectors suchas HiRes [1], Auger [2] or TA [3].As part of the charged shower particles travelfaster than the speed of light in air, Cherenkovlight is emitted in addition. Therefore, in gen-eral a mixture of the two light sources reachesthe aperture of the detector.In the traditional method [4] for the recon-struction of the longitudinal shower develop-ment the Cherenkov light is iteratively sub-tracted from the measured total light. Thedrawbacks of this ansatz are the lack of con-vergence for events with a large amount ofCherenkov light and the difficulty of propagat-ing the uncertainty of the subtracted signal tothe reconstructed shower profile.It has already been noted in [5] that, due tothe universality of the energy spectra of thesecondary electrons and positrons within anair shower, there exists a non-iterative solution
for the reconstruction of a longitudinal showerprofile from light detected by fluorescence tele-scopes.Here we will present the analytic least-squaresolution for the estimation of the shower profilefrom the observed light signal in which both,fluorescence and Cherenkov light, are treatedas signal.
Scattered and Direct Light
The non-scattered, i.e. direct fluorescence lightemitted at a certain slant depth Xi is measuredat the detector at a time ti. Given the fluores-cence yield Y f
i [6, 7] at this point of the atmo-sphere, the number of photons produced at theshower in a slant depth interval ΔXi is
N fγ(Xi) = Y f
i wi ΔXi,
where wi denotes the energy deposited at slantdepth Xi (cf. Fig. 1). These photons aredistributed over a sphere with surface 4 π r2
i ,where ri denotes the distance of the detector.Due to atmospheric attenuation only a frac-tion Ti of them can be detected. Given a lightdetection efficiency of ε, the measured fluores-cence light flux yf
i can be written as
yfi = di Y f
i wi ΔXi, (1)
105

Longitudinal Shower Profile Reconstruction from Fluorescence and Cherenkov Light
Ti
Yi
t i
ri
β i
ε
iX
tiTi
Xiri
Tji ε
βi
Figure 1: Illustration of the isotropic fluorescence light emission (circles), Cherenkov beam alongthe shower axis and the direct (left) and scattered (right) Cherenkov light contributions.
where the abbreviation di = ε Ti
4 π r2
i
was used.For the sake of clarity the wave length depen-dence of Y , T and ε will be disregarded in thefollowing but be discussed later.The number of Cherenkov photons emitted atthe shower is proportional to the number ofcharged particles above the Cherenkov thresh-old energy. Since the electromagnetic compo-nent dominates the shower development, theemitted Cherenkov light, NC
γ , can e calculatedfrom
NCγ (Xi) = Y C
i N ei ΔXi,
where N ei denotes the number of electrons and
positrons above a certain energy cutoff, whichis constant over the full shower track and not tobe confused with the Cherenkov emission en-ergy threshold. Details of the Cherenkov lightproduction like these thresholds are includedin the Cherenkov yield factor Y C
i [5, 8, 9, 10].Although the Cherenkov photons are emittedin a narrow cone along the particle direction,they cover a considerable angular range withrespect to the shower axis, because the chargedparticles are deflected from the primary parti-cle direction due to multiple scattering. Giventhe fraction fC(βi) of Cherenkov photons emit-ted at an angle βi with respect to the showeraxis [8, 10], the light flux at the detector aper-ture originating from direct Cherenkov light is
yCdi = di fC(βi)Y C
i ΔXi N ei . (2)
Due to the forward peaked nature ofCherenkov light production, an intense
Cherenkov light beam can build up alongthe shower as it traverses the atmosphere(cf. Fig. 1). If a fraction fs(βi) of the beamis scattered towards the detector it can con-tribute significantly to the total light received.In a simple one-dimensional model the numberof photons in the beam at depth Xi is justthe sum of Cherenkov light produced at allprevious depths Xj attenuated on the wayfrom Xj to Xi by Tji:
Nbeamγ (Xi) =
i∑
j=0
Tji Y Cj ΔXj N e
j .
Similar to the direct contributions, the scat-tered Cherenkov light received at the detectoris then
yCsi = di fs(βi)
i∑
j=0
Tji Y Cj ΔXj N e
j . (3)
Finally, the total light received at the detec-tor at the time ti is obtained by adding thescattered and direct light contributions.
Shower Profile Reconstruction
The aim of the profile reconstruction is to es-timate the energy deposit and/or electron pro-file from the light flux observed at the detector.At first glance this seems to be hopeless, sinceat each depth there are the two unknown vari-ables wi and N e
i , and only one measured quan-tity, namely yi. Since the total energy deposit
106
30th International Cosmic Ray Conference
is just the sum of the energy loss of electrons,wi and N e
i are related via
wi = N ei
∫ ∞
0
fe(E, Xi) we(E) dE, (4)
where fe(E, Xi) denotes the normalized elec-tron energy distribution and we(E, Xi) is theenergy loss of a single electron with energy E.As it is shown in [9, 5, 10], the electron energyspectrum fe(E, Xi) is universal in shower agesi = 3/(1+2Xmax/Xi), i.e. it does not dependon the primary mass or energy, but only onthe relative distance to the shower maximum,Xmax. Eq. (4) can thus be simplified to
wi = N ei αi.
where αi is the average energy deposit per elec-tron at shower age si. With this one-to-onerelation between the energy deposit and thenumber of electrons, the shower profile is read-ily calculable from the equations given in thelast section. For the solution of the problem,it is convenient to rewrite the relation betweenenergy deposit and light at the detector in ma-trix notation: Let y = (y1, y2, . . . , yn)T be then-component vector (histogram) of the mea-sured photon flux at the aperture and w =(w1, w2, . . . , wn)T the energy deposit vector atthe shower track. Using the ansatz
y = C ·w (5)
the elements of the Cherenkov-fluorescence
matrix C can be found by a comparison withthe coefficients in equations (1), (2) and (3):
Cij =
⎧⎪⎨
⎪⎩
0, i < j
cdi + cs
ii, i = j
csij , i > j,
(6)
where
cdi = di
(Y f
i + fC(βi)Y Ci /αi
)ΔXi
and
csij = di fs(βi) Tji Y C
j /αj ΔXj .
The solution of Eq. (5) can be obtained by in-version, leading to the energy deposit estima-tor w:
w = C−1 · y .
Due to the triangular structure of theCherenkov-fluorescence matrix the inverse canbe calculated fast even for matrices with largedimension. As the matrix elements in (6) arealways ≥ 0, C is never singular.The statistical uncertainties of w are obtainedby error propagation:
Vw = C−1
Vy
(C
T)−1
.
It is interesting to note that even if themeasurements yi are uncorrelated, i.e. theircovariance matrix Vy is diagonal, the calcu-lated energy loss values wi are not. This is,because the light observed during time intervali does not solely originate from wi, but alsoreceives a contribution from earlier showerparts wj , j < i, via the ’Cherenkov beam’.
Wavelength Dependence
Until now it has been assumed that the showerinduces light emission at a single wavelength λ.In reality, the fluorescence yield shows distinctemission peaks and the number of Cherenkovphotons is proportional to 1
λ2 . In that case,also the wavelength dependence of the detec-tor efficiency and the light transmission needto be taken into account. Assuming that abinned wavelength distribution of the yields isavailable (Yik =
∫ λk+Δλ
λk−ΔλYi(λ) dλ), the above
considerations still hold when replacing cdi and
csij in Eq. (6) by
c di = ΔXi
∑
k
dik
(Y f
ik + fC(βi)Y Cik/αi
)
and
c sij = ΔXj
∑
k
dik fs(βi) Tjik Y Cjk/αj ,
wheredik =
εk Tik
4 π r2i
.
The detector efficiency εk and transmission co-efficients Tik and Tjik are evaluated at thewavelength λk.
107
Longitudinal Shower Profile Reconstruction from Fluorescence and Cherenkov Light
Shower Age Dependence
Due to the age dependence of the electronspectra fe(E, si), the Cherenkov yield factorsY C
i and the average electron energy depositsαi depend on the shower maximum, which isnot known before the profile has been recon-structed. Fortunately, these dependencies aresmall: In the age range of importance for theshower profile reconstruction (s ∈ [0.8, 1.2]) αvaries only within a few percent [10] and Y C byless than 15% [5]. Therefore, a good estimateof α and Y C can be obtained by setting s = 1.After the shower profile has been calculatedwith these estimates, Xmax can be determinedand the profiles can be re-calculated with anupdated Cherenkov-fluorescence matrix.
Gaisser-Hillas Fit
The knowledge of the complete profile is re-quired for the calculation of the Cherenkovbeam and the shower energy. If due to thelimited field of view of the detector only a partof the profile is observed, an appropriate func-tion for the extrapolation to unobserved depthsis needed. A possible choice is the Gaisser-Hillas function [11] which was found to givea good description of measured longitudinalprofiles [12]. It has only four free parameters:Xmax, the depth where the shower reaches itsmaximum energy deposit wmax and two shapeparameters X0 and λ.The best set of Gaisser-Hillas parameters p canbe obtained by minimizing the error weightedsquared difference between the vector of func-tion values fGH and x, which is
χ2GH = [ w − f(p)]T Vw
−1 [ w − f(p)]
This minimization works well if a large frac-tion of the shower has been observed below andabove the shower maximum. If this is not thecase, or even worse, if the shower maximum isoutside the field of view, the problem is under-determined, i.e. the experimental informationis not sufficient to reconstruct all four Gaisser-Hillas parameters. This complication can beovercome by weakly constraining X0 and λ to
their average values 〈X0〉 and 〈λ〉. The newminimization function is then the modified χ2
χ2 = χ2GH +
(X0 − 〈X0〉)2VX0
+(λ − 〈λ〉)2
Vλ,
where the variance of X0 and λ around theirmean values are in the denominators.In this way, even if χ2
GH is not sensitive to X0
and λ, the minimization will still converge.On the other hand, if the measurements havesmall statistical uncertainties and/or covera wide range in depth, the minimizationfunction is flexible enough to allow for shapeparameters differing from their mean values.These mean values can be determined fromair shower simulations or, preferably, fromhigh quality data profiles which can be recon-structed without constraints.
References
[1] T. Abu-Zayyad et al. [HiRes Collabora-tion]. Nucl. Instrum. Meth., A450:253,2000.
[2] J. Abraham et al. [Pierre Auger Collab-oration]. Nucl. Instrum. Meth., A523:50,2004.
[3] H. Kawai et al. [Telescope Array Collabo-ration]. Proc. 29th ICRC, 8:141, 2005.
[4] R. M. Baltrusaitis et al. [Fly’s Eye Collab-oration]. Nucl. Instrum. Meth., A240:410,1985.
[5] M. Giller et al. J. Phys. G, 30:97, 2004.[6] M. Nagano et al. Astropart. Phys., 22:235,
2004.[7] F. Kakimoto et al. Nucl. Instrum. Meth.,
A372:527, 1996.[8] A. M. Hillas. J. Phys. G, 8:1461, 1982.[9] A. M. Hillas. J. Phys. G, 8:1475, 1982.
[10] F. Nerling et al. Astropart. Phys., 24:421,2006.
[11] T. K. Gaisser and A. M. Hillas. Proc. 15th
ICRC, 8:353, 1977.[12] Z. Cao et al. [HiRes Collaboration]. Proc.
28th ICRC, page 378, 2003.
108
30TH INTERNATIONAL COSMIC RAY CONFERENCE
Comparison of preshower characteristics at Auger South and North
P. HOMOLA1, M. RISSE2, R. ENGEL3, D. GORA1,4, J. PEKALA1, B. WILCZYNSKA1, H. WILCZYNSKI11H. Institute of Nuclear Physics PAN, Radzikowskiego 152, 31-342 Krakow, Poland2University of Wuppertal, Department of Physics, Gausstr. 20, 42097 Wuppertal, Germany3Forschungszentrum Karlsruhe, Institut fur Kernphysik, 76021 Karlsruhe, Germany4Universitat Karlsruhe, Institut fr Experimentelle Kernphysik, 76128 Karlsruhe, [email protected]
Abstract: Due to geomagnetic cascading, the properties of air showers initiated by photons above1019 eV depend strongly on the arrival direction and on the geographical location of the experimentalsite. This offers the possibility of a complementary search for such ultra-high energy photons with ob-servatories located at sites with significantly different local geomagnetic field. In this paper we comparethe characteristics of photon showers at the southern and northern sites of the Pierre Auger Observatory.The complementarity of the shower features seen by the two sites is demonstrated. We study how thiscomplementarity can be used to search for ultra-high energy photons.
Introduction
Substantial fluxes of cosmic-ray photons at ultra-
high energy (UHE), above 1019 eV, are predicted
by non-acceleration (top-down) models of cosmic-
ray origin (for example, see [2]). At a smaller level,
UHE photons are also expected to be produced in
acceleration (bottom-up) models [4]. So far, up-
per limits on the photon flux were set (see [15] and
references therein). The large exposure expected
to be collected during the next years, in particular
by the Pierre Auger Observatory [12], will enor-
mously increase the sensitivity for detecting UHE
photons [13].
Contrary to the case of hadron primaries, UHE
photons around 1020 eV can interact with the geo-
magnetic field before entering the atmosphere [10]
producing a bunch of lower energy particles. This
process is commonly called geomagnetic cascad-
ing or preshower and leads to a dramatic change
of the air shower development for primary photons
(see [7] and references therein). The probability of
magnetic e+e− pair production (“photon conver-
sion”) and, in case of conversion, the synchrotron
emission by the produced electrons depend on the
particle energy and on the transverse component
of the local magnetic field [3, 6]. This implies
the dependence of the expected properties of the
photon-induced shower on the primary arrival di-
rection within the local coordinate system and on
the geographic location of the experiment [10].
In this work we study how the preshower charac-
teristics affects the properties of air showers for
the conditions of the southern part of the Auger
Observatory (“Auger South”) situated in Malargue
(Argentina) at 69.2◦ W, 35.2◦ S and its northern
part (“Auger North”) planned in Colorado (USA)
at 102.7◦ W, 37.7◦ N. The geomagnetic field vec-
tor differs significantly between these two sites:
at Auger South, the magnetic field of ∼24.6 μTpoints upward to θ ∼ 55◦, φ ∼ 87◦ while at Auger
North, the magnetic field of ∼52.5 μT points
downward from θ ∼ 25◦, φ ∼ 262◦.1 It is also
considered how the different properties of photon-
showers at the two sites can be used to perform a
complementary search for UHE photons.
While the study is performed for the specific case
of the two Auger sites, the general findings hold
for any two sites with sufficiently different local
magnetic field conditions.
1. Azimuth is defined in this work counterclockwisefrom geographic East. For instance, φ = 0◦ means East,φ = 90◦ North etc.
109
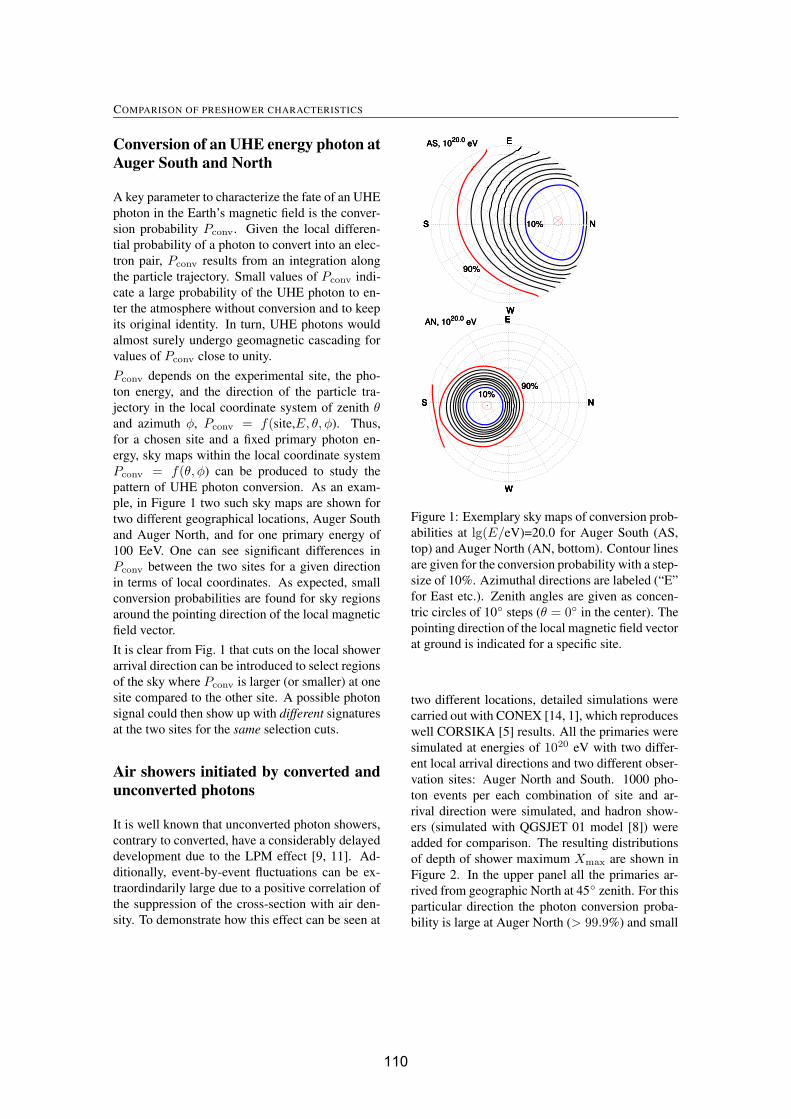
COMPARISON OF PRESHOWER CHARACTERISTICS
Conversion of an UHE energy photon atAuger South and North
A key parameter to characterize the fate of an UHE
photon in the Earth’s magnetic field is the conver-
sion probability Pconv. Given the local differen-
tial probability of a photon to convert into an elec-
tron pair, Pconv results from an integration along
the particle trajectory. Small values of Pconv indi-
cate a large probability of the UHE photon to en-
ter the atmosphere without conversion and to keep
its original identity. In turn, UHE photons would
almost surely undergo geomagnetic cascading for
values of Pconv close to unity.
Pconv depends on the experimental site, the pho-
ton energy, and the direction of the particle tra-
jectory in the local coordinate system of zenith θand azimuth φ, Pconv = f(site,E, θ, φ). Thus,
for a chosen site and a fixed primary photon en-
ergy, sky maps within the local coordinate system
Pconv = f(θ, φ) can be produced to study the
pattern of UHE photon conversion. As an exam-
ple, in Figure 1 two such sky maps are shown for
two different geographical locations, Auger South
and Auger North, and for one primary energy of
100 EeV. One can see significant differences in
Pconv between the two sites for a given direction
in terms of local coordinates. As expected, small
conversion probabilities are found for sky regions
around the pointing direction of the local magnetic
field vector.
It is clear from Fig. 1 that cuts on the local shower
arrival direction can be introduced to select regions
of the sky where Pconv is larger (or smaller) at one
site compared to the other site. A possible photon
signal could then show up with different signatures
at the two sites for the same selection cuts.
Air showers initiated by converted andunconverted photons
It is well known that unconverted photon showers,
contrary to converted, have a considerably delayed
development due to the LPM effect [9, 11]. Ad-
ditionally, event-by-event fluctuations can be ex-
traordindarily large due to a positive correlation of
the suppression of the cross-section with air den-
sity. To demonstrate how this effect can be seen at
E
N
W
S
AS, 1020.0 eV
90%
10%
E
N
W
S
AS, 1020.0 eV
90%
10%
E
N
W
S
AS, 1020.0 eV
90%
10%
E
N
W
S
E
N
W
S
E
N
W
S
AN, 1020.0 eV
90%10%
E
N
W
S
AN, 1020.0 eV
90%10%
E
N
W
S
AN, 1020.0 eV
90%10%
E
N
W
S
E
N
W
S
Figure 1: Exemplary sky maps of conversion prob-
abilities at lg(E/eV)=20.0 for Auger South (AS,
top) and Auger North (AN, bottom). Contour lines
are given for the conversion probability with a step-
size of 10%. Azimuthal directions are labeled (“E”
for East etc.). Zenith angles are given as concen-
tric circles of 10◦ steps (θ = 0◦ in the center). The
pointing direction of the local magnetic field vector
at ground is indicated for a specific site.
two different locations, detailed simulations were
carried out with CONEX [14, 1], which reproduces
well CORSIKA [5] results. All the primaries were
simulated at energies of 1020 eV with two differ-
ent local arrival directions and two different obser-
vation sites: Auger North and South. 1000 pho-
ton events per each combination of site and ar-
rival direction were simulated, and hadron show-
ers (simulated with QGSJET 01 model [8]) were
added for comparison. The resulting distributions
of depth of shower maximum Xmax are shown in
Figure 2. In the upper panel all the primaries ar-
rived from geographic North at 45◦ zenith. For this
particular direction the photon conversion proba-
bility is large at Auger North (> 99.9%) and small
110
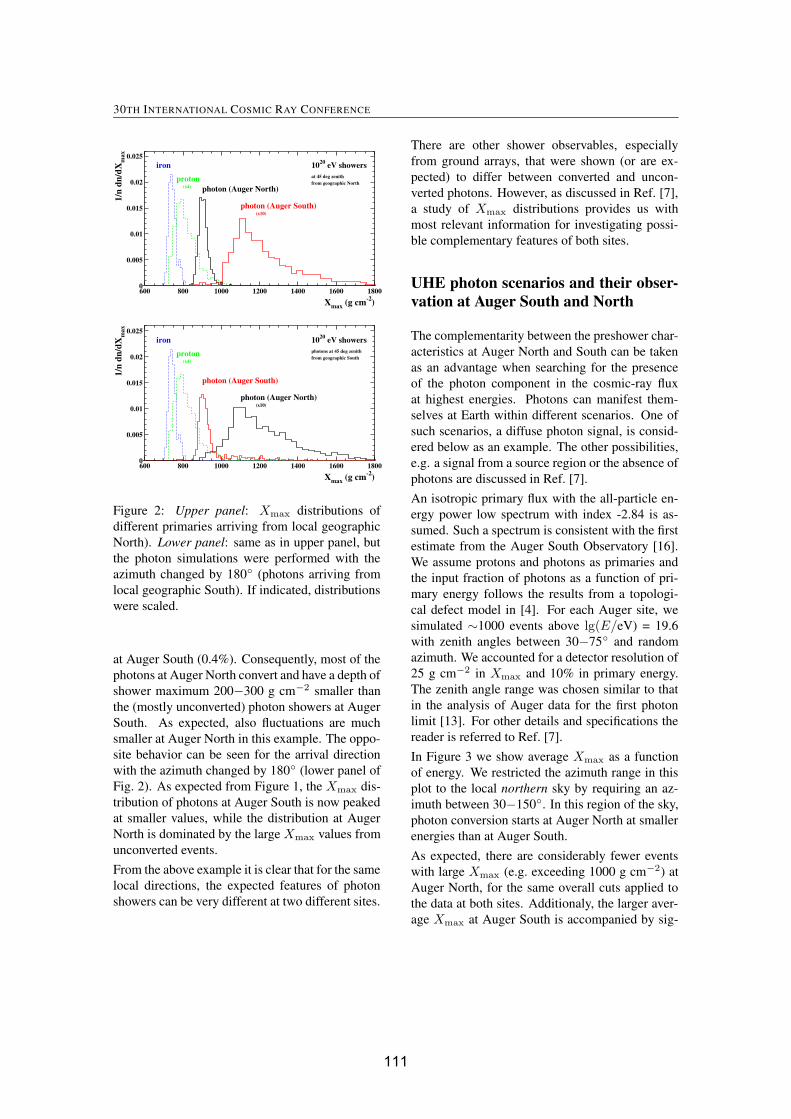
30TH INTERNATIONAL COSMIC RAY CONFERENCE
0
0.005
0.01
0.015
0.02
0.025
600 800 1000 1200 1400 1600 1800
Xmax (g cm-2)
1/n
dn/d
Xm
ax
1020 eV showersat 45 deg zenithfrom geographic North
iron
proton(x4) photon (Auger North)
photon (Auger South)(x10)
0
0.005
0.01
0.015
0.02
0.025
600 800 1000 1200 1400 1600 1800
Xmax (g cm-2)
1/n
dn/d
Xm
ax
1020 eV showersphotons at 45 deg zenithfrom geographic South
iron
proton(x4)
photon (Auger North)(x10)
photon (Auger South)
Figure 2: Upper panel: Xmax distributions of
different primaries arriving from local geographic
North). Lower panel: same as in upper panel, but
the photon simulations were performed with the
azimuth changed by 180◦ (photons arriving from
local geographic South). If indicated, distributions
were scaled.
at Auger South (0.4%). Consequently, most of the
photons at Auger North convert and have a depth of
shower maximum 200−300 g cm−2 smaller than
the (mostly unconverted) photon showers at Auger
South. As expected, also fluctuations are much
smaller at Auger North in this example. The oppo-
site behavior can be seen for the arrival direction
with the azimuth changed by 180◦ (lower panel of
Fig. 2). As expected from Figure 1, the Xmax dis-
tribution of photons at Auger South is now peaked
at smaller values, while the distribution at Auger
North is dominated by the large Xmax values from
unconverted events.
From the above example it is clear that for the same
local directions, the expected features of photon
showers can be very different at two different sites.
There are other shower observables, especially
from ground arrays, that were shown (or are ex-
pected) to differ between converted and uncon-
verted photons. However, as discussed in Ref. [7],
a study of Xmax distributions provides us with
most relevant information for investigating possi-
ble complementary features of both sites.
UHE photon scenarios and their obser-vation at Auger South and North
The complementarity between the preshower char-
acteristics at Auger North and South can be taken
as an advantage when searching for the presence
of the photon component in the cosmic-ray flux
at highest energies. Photons can manifest them-
selves at Earth within different scenarios. One of
such scenarios, a diffuse photon signal, is consid-
ered below as an example. The other possibilities,
e.g. a signal from a source region or the absence of
photons are discussed in Ref. [7].
An isotropic primary flux with the all-particle en-
ergy power low spectrum with index -2.84 is as-
sumed. Such a spectrum is consistent with the first
estimate from the Auger South Observatory [16].
We assume protons and photons as primaries and
the input fraction of photons as a function of pri-
mary energy follows the results from a topologi-
cal defect model in [4]. For each Auger site, we
simulated ∼1000 events above lg(E/eV) = 19.6
with zenith angles between 30−75◦ and random
azimuth. We accounted for a detector resolution of
25 g cm−2 in Xmax and 10% in primary energy.
The zenith angle range was chosen similar to that
in the analysis of Auger data for the first photon
limit [13]. For other details and specifications the
reader is referred to Ref. [7].
In Figure 3 we show average Xmax as a function
of energy. We restricted the azimuth range in this
plot to the local northern sky by requiring an az-
imuth between 30−150◦. In this region of the sky,
photon conversion starts at Auger North at smaller
energies than at Auger South.
As expected, there are considerably fewer events
with large Xmax (e.g. exceeding 1000 g cm−2) at
Auger North, for the same overall cuts applied to
the data at both sites. Additionaly, the larger aver-
age Xmax at Auger South is accompanied by sig-
111
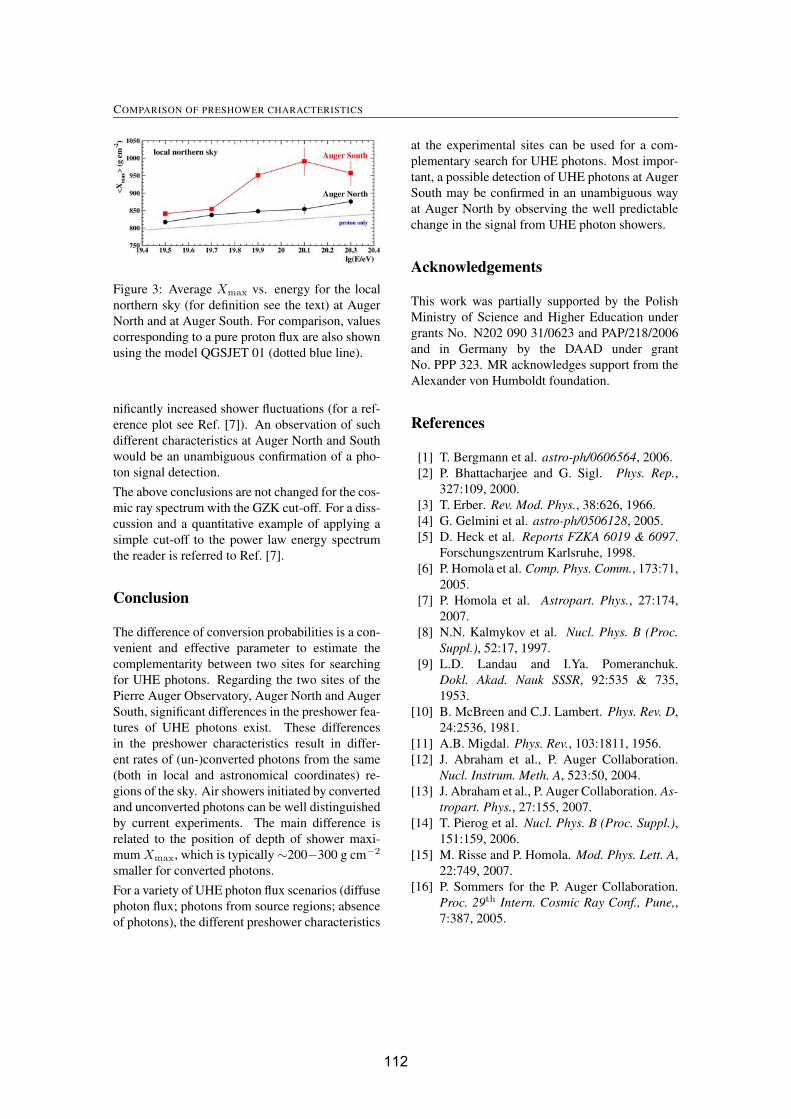
COMPARISON OF PRESHOWER CHARACTERISTICS
Figure 3: Average Xmax vs. energy for the local
northern sky (for definition see the text) at Auger
North and at Auger South. For comparison, values
corresponding to a pure proton flux are also shown
using the model QGSJET 01 (dotted blue line).
nificantly increased shower fluctuations (for a ref-
erence plot see Ref. [7]). An observation of such
different characteristics at Auger North and South
would be an unambiguous confirmation of a pho-
ton signal detection.
The above conclusions are not changed for the cos-
mic ray spectrum with the GZK cut-off. For a diss-
cussion and a quantitative example of applying a
simple cut-off to the power law energy spectrum
the reader is referred to Ref. [7].
Conclusion
The difference of conversion probabilities is a con-
venient and effective parameter to estimate the
complementarity between two sites for searching
for UHE photons. Regarding the two sites of the
Pierre Auger Observatory, Auger North and Auger
South, significant differences in the preshower fea-
tures of UHE photons exist. These differences
in the preshower characteristics result in differ-
ent rates of (un-)converted photons from the same
(both in local and astronomical coordinates) re-
gions of the sky. Air showers initiated by converted
and unconverted photons can be well distinguished
by current experiments. The main difference is
related to the position of depth of shower maxi-
mum Xmax, which is typically ∼200−300 g cm−2
smaller for converted photons.
For a variety of UHE photon flux scenarios (diffuse
photon flux; photons from source regions; absence
of photons), the different preshower characteristics
at the experimental sites can be used for a com-
plementary search for UHE photons. Most impor-
tant, a possible detection of UHE photons at Auger
South may be confirmed in an unambiguous way
at Auger North by observing the well predictable
change in the signal from UHE photon showers.
Acknowledgements
This work was partially supported by the Polish
Ministry of Science and Higher Education under
grants No. N202 090 31/0623 and PAP/218/2006
and in Germany by the DAAD under grant
No. PPP 323. MR acknowledges support from the
Alexander von Humboldt foundation.
References
[1] T. Bergmann et al. astro-ph/0606564, 2006.
[2] P. Bhattacharjee and G. Sigl. Phys. Rep.,327:109, 2000.
[3] T. Erber. Rev. Mod. Phys., 38:626, 1966.
[4] G. Gelmini et al. astro-ph/0506128, 2005.
[5] D. Heck et al. Reports FZKA 6019 & 6097.
Forschungszentrum Karlsruhe, 1998.
[6] P. Homola et al. Comp. Phys. Comm., 173:71,
2005.
[7] P. Homola et al. Astropart. Phys., 27:174,
2007.
[8] N.N. Kalmykov et al. Nucl. Phys. B (Proc.Suppl.), 52:17, 1997.
[9] L.D. Landau and I.Ya. Pomeranchuk.
Dokl. Akad. Nauk SSSR, 92:535 & 735,
1953.
[10] B. McBreen and C.J. Lambert. Phys. Rev. D,
24:2536, 1981.
[11] A.B. Migdal. Phys. Rev., 103:1811, 1956.
[12] J. Abraham et al., P. Auger Collaboration.
Nucl. Instrum. Meth. A, 523:50, 2004.
[13] J. Abraham et al., P. Auger Collaboration. As-tropart. Phys., 27:155, 2007.
[14] T. Pierog et al. Nucl. Phys. B (Proc. Suppl.),151:159, 2006.
[15] M. Risse and P. Homola. Mod. Phys. Lett. A,
22:749, 2007.
[16] P. Sommers for the P. Auger Collaboration.
Proc. 29th Intern. Cosmic Ray Conf., Pune,,7:387, 2005.
112
30TH INTERNATIONAL COSMIC RAY CONFERENCE
Variation of the shower lateral spread with air temperature at the ground
B. WILCZYNSKA1, R. ENGEL2, P. HOMOLA1, B. KEILHAUER3, H. KLAGES2, J. PEKALA1,H. WILCZYNSKI1.1Institute of Nuclear Physics PAN, Radzikowskiego 152, 31-342 Krakow, Poland2 Forschungszentrum Karlsruhe, Institut fur Kernphysik, 76021 Karlsruhe, Germany3Universitat Karlsruhe, Institut fur Experimentelle Kernphysik, 76128 Karlsruhe, [email protected]
Abstract: The vertical profile of air density at a given site varies considerably with time. Well understoodseasonal differences are present, but sizeable effects on shorter time scales, like day-to-day or day-to-nightvariations, are also present. In consequence, the Moliere radius changes, influencing the lateral distribu-tion of particles in air showers and therefore may influence shower detection in surface detector arrays.In air shower reconstruction, usually seasonal average profiles of the atmosphere are used, because localdaily measurements of the profile are rarely available. Therefore, the daily fluctuations of the atmosphereare not accounted for. This simplification increases the inaccuracies of shower reconstruction. We showthat a universal correlation exists between the ground temperature and the shape of the atmospheric den-sity profile, up to altitudes of several kilometers, hence providing a method to reduce inaccuracies inshower reconstruction due to weather variation.
Introduction
In experimental studies of highest energy cos-mic rays, the atmosphere serves both as the tar-get in which primary cosmic rays interact and themedium in which extensive air showers develop.Therefore, as precise as possible knowledge ofproperties of the atmosphere is very important. Inparticular, the vertical profi le of air density is ofprimary importance.
It was shown in [3, 4, 5] that the time variability ofthe vertical profi le of air density (and consequently,atmospheric depth) is very important. Systematic,site-specifi c seasonal variation of the atmosphericprofi le is observed. In addition, irregular variationis observed on shorter time scales like day-to-dayor day-to-night. Variation of the atmospheric den-sity implies a variation of the Moliere radius and inconsequence, the lateral spread of air shower parti-cles varies accordingly. Therefore, uncertainties ofthe profi le of air density influence air shower de-tection in surface detector arrays. A trigger biasmay result from inaccurate accounting for lateralspread of shower particles. Thus it is important to
account for atmospheric variation as accurately aspossible to avoid errors in shower reconstruction.
In this paper we use UK Met Offi ce data [1] tostudy the vertical profi le of air density. These datacontain temperature and pressure profi les mea-sured by radiosondes at a worldwide network ofballoon launching stations. In the following wepresent an analysis of data collected in years 2002–2004 at the station in Salt Lake City (USA) and atthe station in Mendoza (Argentina), located nearthe site of the southern Pierre Auger Observatory.
Lateral particle distribution
The lateral particle distribution in a shower is de-termined by the Moliere radius, which is inverselyproportional to air density. This distribution ob-served at the ground level is shaped mainly in alowest layer of the atmosphere, about two cascadeunits thick, above the ground.
The vertical distribution of air density, and conse-quently the Moliere radius, varies a lot from themodel distribution usually assumed in air showerstudies. It was shown in [5] that this variation is
113

SHOWER LATERAL SPREAD
Figure 1: Relative difference in lateral distribu-tion of particle density in a vertical 1019 eV pro-ton shower simulated using atmospheric profi les intwo extreme January days at Salt Lake City.
especially large in winter. As an axample, Januaryatmospheric profi les at Salt Lake City were used tosimulate shower development. Showers simulatedusing different atmospheric profi les differ consid-erably in lateral particle distribution. Lateral dis-tributions of a 1019 eV proton shower were sim-ulated with CORSIKA [2] using atmosphere pro-fi les of extremely warm and cold days in January.The relative difference of the lateral particle den-sity is shown in Figure 1. This difference can beas large as 15% at large distances from the showeraxis. Although it may be treated as an upper limitrather than a typical value, one should note that the15% variation in particle density due to weather ef-fects alone is a very large difference. This exampledemonstrates the need for a profi le of atmosphericdensity as accurate as possible.
Local daily soundings of the atmosphere are rarelyavailable at air shower detector sites, so that onehas to use some average profi les of air density ineveryday shower reconstruction. Neglecting thedaily variation of the atmosphere introduces inac-curacies in shower reconstruction. Therefore, animportant question is whether one can approximatethe true atmospheric profi le based on some eas-ily available data, like temperature and pressure atground level, when the radiosounding is not avail-able. This is the subject of the current study.
Figure 2: Example of correlation of air density attwo different altitudes above ground, with temper-ature at the ground level. The circles mark the ex-tremely warm and cold days used to prepare Fig.1.
Figure 3: Slope of the correlation shown in Fig.2as a function of altitude, at different times of dayin summer and winter at Salt Lake City.
114
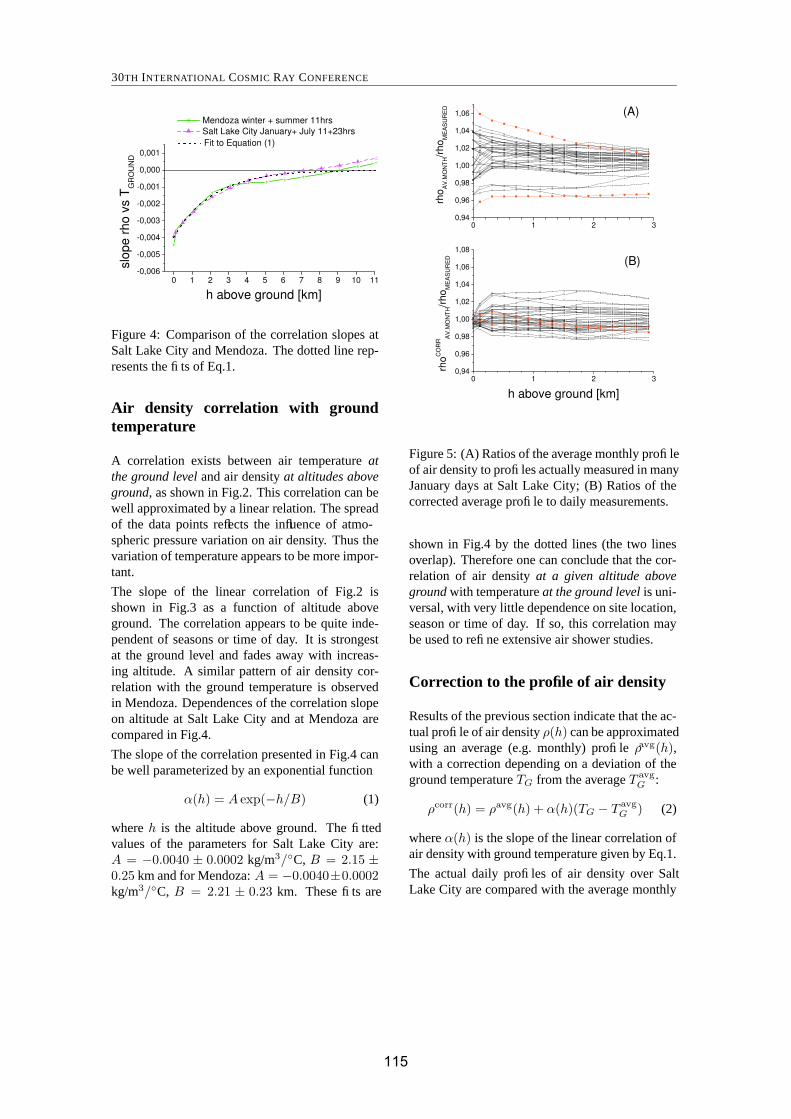
30TH INTERNATIONAL COSMIC RAY CONFERENCE
Figure 4: Comparison of the correlation slopes atSalt Lake City and Mendoza. The dotted line rep-resents the fi ts of Eq.1.
Air density correlation with groundtemperature
A correlation exists between air temperature atthe ground level and air density at altitudes aboveground, as shown in Fig.2. This correlation can bewell approximated by a linear relation. The spreadof the data points reflects the influence of atmo-spheric pressure variation on air density. Thus thevariation of temperature appears to be more impor-tant.
The slope of the linear correlation of Fig.2 isshown in Fig.3 as a function of altitude aboveground. The correlation appears to be quite inde-pendent of seasons or time of day. It is strongestat the ground level and fades away with increas-ing altitude. A similar pattern of air density cor-relation with the ground temperature is observedin Mendoza. Dependences of the correlation slopeon altitude at Salt Lake City and at Mendoza arecompared in Fig.4.
The slope of the correlation presented in Fig.4 canbe well parameterized by an exponential function
α(h) = A exp(−h/B) (1)
where h is the altitude above ground. The fi ttedvalues of the parameters for Salt Lake City are:A = −0.0040 ± 0.0002 kg/m3/◦C, B = 2.15 ±0.25 km and for Mendoza: A = −0.0040±0.0002kg/m3/◦C, B = 2.21 ± 0.23 km. These fi ts are
Figure 5: (A) Ratios of the average monthly profi leof air density to profi les actually measured in manyJanuary days at Salt Lake City; (B) Ratios of thecorrected average profi le to daily measurements.
shown in Fig.4 by the dotted lines (the two linesoverlap). Therefore one can conclude that the cor-relation of air density at a given altitude aboveground with temperature at the ground level is uni-versal, with very little dependence on site location,season or time of day. If so, this correlation maybe used to refi ne extensive air shower studies.
Correction to the profile of air density
Results of the previous section indicate that the ac-tual profi le of air density ρ(h) can be approximatedusing an average (e.g. monthly) profi le ρavg(h),with a correction depending on a deviation of theground temperature TG from the average T avg
G :
ρcorr(h) = ρavg(h) + α(h)(TG − T avgG ) (2)
where α(h) is the slope of the linear correlation ofair density with ground temperature given by Eq.1.
The actual daily profi les of air density over SaltLake City are compared with the average monthly
115

SHOWER LATERAL SPREAD
Figure 6: (A) Standard deviation and (B) mean ofratios shown in Fig.5 as a function of altitude. Thefi lled symbols pertain to uncorrected density pro-fi les of Fig.5A, while the open symbols concernthe corrected profi les of Fig.5B.
profi le. In Fig.5A ratios of the average to thedaily measured ones are plotted. A relatively largespread (several percent), especially near the groundlevel, is seen. In Fig.5B the ratios of ρcorr(h) tothe actually measured ones are plotted. It is evi-dent that the correction of Eq. 2 considerably re-duces the dispersion of the density ratios at low al-titudes. This means that at low altitudes ρcorr(h)approximates the actual profi le considerably bet-ter than the monthly average does. This is illus-trated in Fig.6, in which the mean and standard de-viation of the sets of curves plotted in Fig.5 areshown as a function of altitude. The correction ef-fectively works only at low altitudes, as the corre-lation shown in Fig.4 vanishes with increasing al-titude. Nevertheless, we note that the lateral distri-bution of shower particles at the ground level is de-termined mainly by the Moliere radius over lowesttwo cascade units, i.e. over lowest ∼750 m aboveground, in case of the Pierre Auger Observatory.
Conclusion
The observed correlation of ground temperaturewith air density at altitudes up to several kilome-ters above ground provides a method to approxi-mate the true profi le of atmospheric density. Forshower reconstruction it is always best to use thelocal daily measurement of the atmospheric pro-fi le. However, when the actual measurement of theprofi le is not available for a given day, an approx-imation of the daily profi le can be derived froman average (e.g. monthly) profi le, adjusted witha correction depending only on temperature at theground. Since the temperature reading at ground isalways available, this correction helps to reduce in-accuracies in shower reconstruction, especially insurface arrays of detectors.
Acknowledgements
This work was partially supported by the PolishMinistry of Science and Higher Education undergrants No. N202 090 31/0623 and PAP/218/2006and in Germany by the DAAD uder grant No.PPP323. One of the authors (BK) is supported bythe DFG under grant No. KE 1151/1.
References
[1] British Atmospheric Data Centre.http://badc.nerc.ac.uk/data/radiosglobe/radhelp.html.
[2] D. Heck et al. Reports FZKA 6019 and 6097,Forschungszentrum Karlsruhe, 1998.
[3] B. Keilhauer et al. Astropart. Phys, 22:249,2004.
[4] B. Wilczynska et al. Proc. 29th ICRC, Pune,7:203, 2005.
[5] B. Wilczynska et al. Astropart. Phys, 25:106,2006.
116
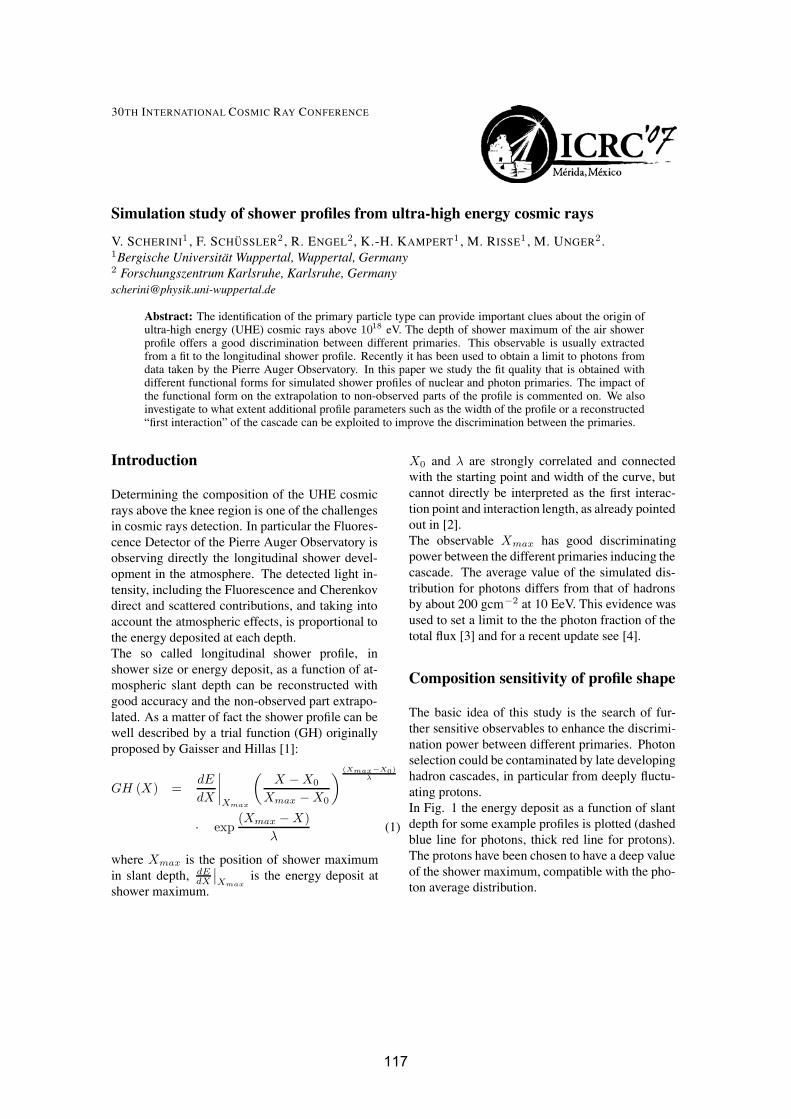
30TH INTERNATIONAL COSMIC RAY CONFERENCE
Simulation study of shower profiles from ultra-high energy cosmic rays
V. SCHERINI1 , F. SCHUSSLER2 , R. ENGEL2, K.-H. KAMPERT1 , M. RISSE1 , M. UNGER2 .1Bergische Universitat Wuppertal, Wuppertal, Germany2 Forschungszentrum Karlsruhe, Karlsruhe, [email protected]
Abstract: The identification of the primary particle type can provide important clues about the origin ofultra-high energy (UHE) cosmic rays above 1018 eV. The depth of shower maximum of the air showerprofile offers a good discrimination between different primaries. This observable is usually extractedfrom a fit to the longitudinal shower profile. Recently it has been used to obtain a limit to photons fromdata taken by the Pierre Auger Observatory. In this paper we study the fit quality that is obtained withdifferent functional forms for simulated shower profiles of nuclear and photon primaries. The impact ofthe functional form on the extrapolation to non-observed parts of the profile is commented on. We alsoinvestigate to what extent additional profile parameters such as the width of the profile or a reconstructed“first interaction” of the cascade can be exploited to improve the discrimination between the primaries.
Introduction
Determining the composition of the UHE cosmicrays above the knee region is one of the challengesin cosmic rays detection. In particular the Fluores-cence Detector of the Pierre Auger Observatory isobserving directly the longitudinal shower devel-opment in the atmosphere. The detected light in-tensity, including the Fluorescence and Cherenkovdirect and scattered contributions, and taking intoaccount the atmospheric effects, is proportional tothe energy deposited at each depth.The so called longitudinal shower profile, inshower size or energy deposit, as a function of at-mospheric slant depth can be reconstructed withgood accuracy and the non-observed part extrapo-lated. As a matter of fact the shower profile can bewell described by a trial function (GH) originallyproposed by Gaisser and Hillas [1]:
GH (X) =dE
dX
∣∣∣∣Xmax
(X − X0
Xmax − X0
) (Xmax−X0)λ
· exp(Xmax − X)
λ(1)
where Xmax is the position of shower maximumin slant depth, dE
dX
∣∣Xmax
is the energy deposit atshower maximum.
X0 and λ are strongly correlated and connectedwith the starting point and width of the curve, butcannot directly be interpreted as the first interac-tion point and interaction length, as already pointedout in [2].The observable Xmax has good discriminatingpower between the different primaries inducing thecascade. The average value of the simulated dis-tribution for photons differs from that of hadronsby about 200 gcm−2 at 10 EeV. This evidence wasused to set a limit to the the photon fraction of thetotal flux [3] and for a recent update see [4].
Composition sensitivity of profile shape
The basic idea of this study is the search of fur-ther sensitive observables to enhance the discrimi-nation power between different primaries. Photonselection could be contaminated by late developinghadron cascades, in particular from deeply fluctu-ating protons.In Fig. 1 the energy deposit as a function of slantdepth for some example profiles is plotted (dashedblue line for photons, thick red line for protons).The protons have been chosen to have a deep valueof the shower maximum, compatible with the pho-ton average distribution.
117
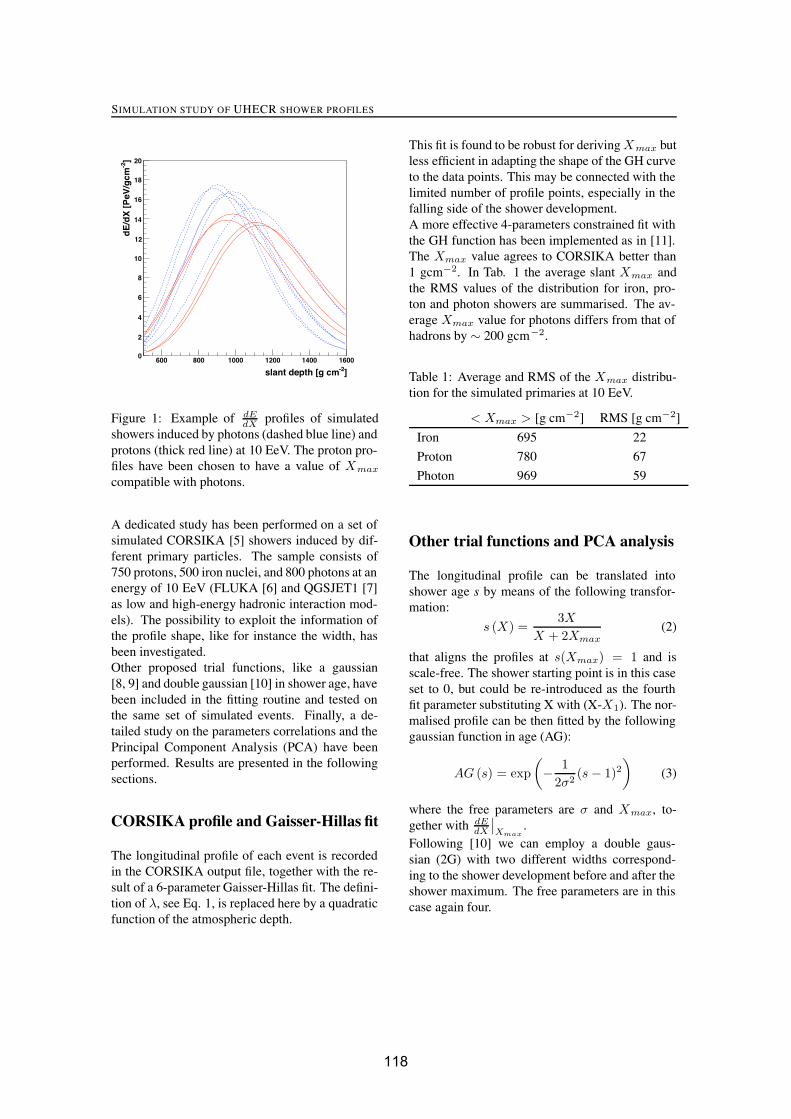
SIMULATION STUDY OF UHECR SHOWER PROFILES
]-2slant depth [g cm600 800 1000 1200 1400 1600
]-2
dE
/dX
[P
eV/g
cm
0
2
4
6
8
10
12
14
16
18
20
Figure 1: Example of dEdX profiles of simulated
showers induced by photons (dashed blue line) andprotons (thick red line) at 10 EeV. The proton pro-files have been chosen to have a value of Xmax
compatible with photons.
A dedicated study has been performed on a set ofsimulated CORSIKA [5] showers induced by dif-ferent primary particles. The sample consists of750 protons, 500 iron nuclei, and 800 photons at anenergy of 10 EeV (FLUKA [6] and QGSJET1 [7]as low and high-energy hadronic interaction mod-els). The possibility to exploit the information ofthe profile shape, like for instance the width, hasbeen investigated.Other proposed trial functions, like a gaussian[8, 9] and double gaussian [10] in shower age, havebeen included in the fitting routine and tested onthe same set of simulated events. Finally, a de-tailed study on the parameters correlations and thePrincipal Component Analysis (PCA) have beenperformed. Results are presented in the followingsections.
CORSIKA profile and Gaisser-Hillas fit
The longitudinal profile of each event is recordedin the CORSIKA output file, together with the re-sult of a 6-parameter Gaisser-Hillas fit. The defini-tion of λ, see Eq. 1, is replaced here by a quadraticfunction of the atmospheric depth.
This fit is found to be robust for derivingXmax butless efficient in adapting the shape of the GH curveto the data points. This may be connected with thelimited number of profile points, especially in thefalling side of the shower development.A more effective 4-parameters constrained fit withthe GH function has been implemented as in [11].The Xmax value agrees to CORSIKA better than1 gcm−2. In Tab. 1 the average slant Xmax andthe RMS values of the distribution for iron, pro-ton and photon showers are summarised. The av-erage Xmax value for photons differs from that ofhadrons by ∼ 200 gcm−2.
Table 1: Average and RMS of the Xmax distribu-tion for the simulated primaries at 10 EeV.
< Xmax > [g cm−2] RMS [g cm−2]
Iron 695 22
Proton 780 67
Photon 969 59
Other trial functions and PCA analysis
The longitudinal profile can be translated intoshower age s by means of the following transfor-mation:
s (X) =3X
X + 2Xmax(2)
that aligns the profiles at s(Xmax) = 1 and isscale-free. The shower starting point is in this caseset to 0, but could be re-introduced as the fourthfit parameter substituting X with (X-X1). The nor-malised profile can be then fitted by the followinggaussian function in age (AG):
AG (s) = exp(− 1
2σ2(s − 1)2
)(3)
where the free parameters are σ and Xmax, to-gether with dE
dX
∣∣Xmax
.Following [10] we can employ a double gaus-sian (2G) with two different widths correspond-ing to the shower development before and after theshower maximum. The free parameters are in thiscase again four.
118

30TH INTERNATIONAL COSMIC RAY CONFERENCE
In Fig. 2 the average relative residuals, as a func-tion of shower age, obtained with the tested analyt-ical fit functions are plotted for the proton sample.In Tab. 2 the mean and RMS values of the σ of thegaussian for the simulated iron, proton and pho-ton showers are summarised. The correlation be-tween the width of the gaussian AG and the depthof shower maximum is shown in Fig. 3. A later de-velopment of the cascade is associated with a nar-rower profile width. Similar average values and thesame correlation are found between the rising edgeσ and the Xmax for the 2G fit, in agreement withthe previously cited works.
shower age0.6 0.7 0.8 0.9 1 1.1 1.2 1.3 1.4
(FIT
-MC
)/F
IT
-0.05
0
0.05
0.1
0.15
0.2
GaisserHillas 4-pars
DoubleGauss
SingleGauss
CORSIKA 6-pars
Figure 2: Average relative residuals to the testedanalytical functions for protons at 10 EeV: 4-parameters GH fit (black squares), single gaussian(blue triangles), double gaussian (pink bullets), and6-parameters CORSIKA (red crosses).
Using X1 as a free parameter in the fitting pro-cess we observe a correlation with σ that can berepresented, both for hadrons and photons, by astraight line. This correlation is shown in Fig. 4for the simulated sets of iron, proton and photon
Table 2: Average and RMS values of the σ distri-butions for the simulated primaries at 10 EeV.
< σ > [g cm−2] RMS [g cm−2]
Iron 0.22 0.006
Proton 0.20 0.015
Photon 0.16 0.011
(slant)maxX600 700 800 900 1000 1100 1200 1300
sig
ma
0.1
0.15
0.2
0.25
0.3
ironprotonphoton
Figure 3: Correlation between the width of thegaussian (AG) and depth of shower maximumfor showers initiated by iron, proton and photonprimaries, respectively marked as grey stars, redcrosses and blue×.
primaries, respectively marked by grey stars, redcrosses and blue×.
X_1-400 -300 -200 -100 0 100 200
sig
ma
0.1
0.15
0.2
0.25
0.3
ironprotonphoton
hadron: P0=0.203 P1=0.00021photon: P0=0.166 P1=0.00018
Figure 4: Correlation between σ and X1 for thegaussian fit, same color code as Fig. 3.
The possibility to exploit the information carriedby the σ has been quantified applying the PrincipalComponent Analysis (PCA).
119
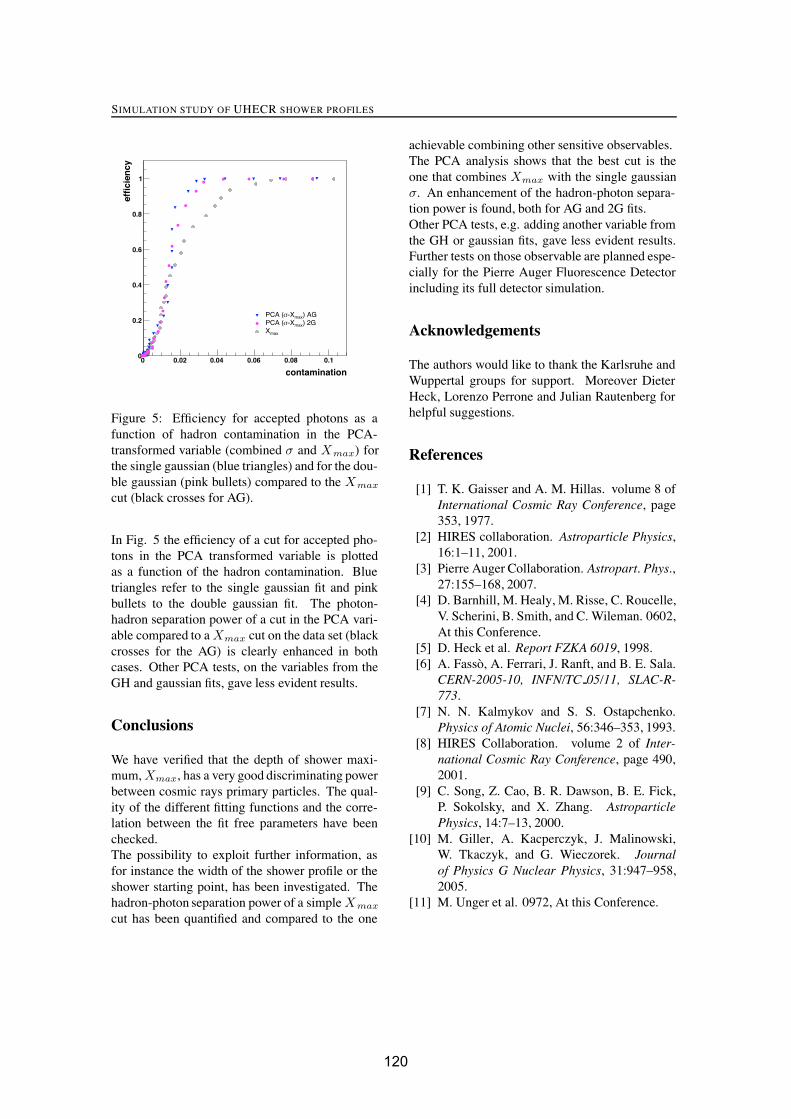
SIMULATION STUDY OF UHECR SHOWER PROFILES
contamination0 0.02 0.04 0.06 0.08 0.1
effi
cien
cy
0
0.2
0.4
0.6
0.8
1
) AGmax-X�PCA () 2Gmax-X�PCA (
maxX
Figure 5: Efficiency for accepted photons as afunction of hadron contamination in the PCA-transformed variable (combined σ and Xmax) forthe single gaussian (blue triangles) and for the dou-ble gaussian (pink bullets) compared to the Xmax
cut (black crosses for AG).
In Fig. 5 the efficiency of a cut for accepted pho-tons in the PCA transformed variable is plottedas a function of the hadron contamination. Bluetriangles refer to the single gaussian fit and pinkbullets to the double gaussian fit. The photon-hadron separation power of a cut in the PCA vari-able compared to aXmax cut on the data set (blackcrosses for the AG) is clearly enhanced in bothcases. Other PCA tests, on the variables from theGH and gaussian fits, gave less evident results.
Conclusions
We have verified that the depth of shower maxi-mum,Xmax, has a very good discriminating powerbetween cosmic rays primary particles. The qual-ity of the different fitting functions and the corre-lation between the fit free parameters have beenchecked.The possibility to exploit further information, asfor instance the width of the shower profile or theshower starting point, has been investigated. Thehadron-photon separation power of a simpleXmax
cut has been quantified and compared to the one
achievable combining other sensitive observables.The PCA analysis shows that the best cut is theone that combines Xmax with the single gaussianσ. An enhancement of the hadron-photon separa-tion power is found, both for AG and 2G fits.Other PCA tests, e.g. adding another variable fromthe GH or gaussian fits, gave less evident results.Further tests on those observable are planned espe-cially for the Pierre Auger Fluorescence Detectorincluding its full detector simulation.
Acknowledgements
The authors would like to thank the Karlsruhe andWuppertal groups for support. Moreover DieterHeck, Lorenzo Perrone and Julian Rautenberg forhelpful suggestions.
References
[1] T. K. Gaisser and A. M. Hillas. volume 8 ofInternational Cosmic Ray Conference, page353, 1977.
[2] HIRES collaboration. Astroparticle Physics,16:1–11, 2001.
[3] Pierre Auger Collaboration. Astropart. Phys.,27:155–168, 2007.
[4] D. Barnhill, M. Healy, M. Risse, C. Roucelle,V. Scherini, B. Smith, and C. Wileman. 0602,At this Conference.
[5] D. Heck et al. Report FZKA 6019, 1998.[6] A. Fasso, A. Ferrari, J. Ranft, and B. E. Sala.
CERN-2005-10, INFN/TC 05/11, SLAC-R-773.
[7] N. N. Kalmykov and S. S. Ostapchenko.Physics of Atomic Nuclei, 56:346–353, 1993.
[8] HIRES Collaboration. volume 2 of Inter-national Cosmic Ray Conference, page 490,2001.
[9] C. Song, Z. Cao, B. R. Dawson, B. E. Fick,P. Sokolsky, and X. Zhang. AstroparticlePhysics, 14:7–13, 2000.
[10] M. Giller, A. Kacperczyk, J. Malinowski,W. Tkaczyk, and G. Wieczorek. Journalof Physics G Nuclear Physics, 31:947–958,2005.
[11] M. Unger et al. 0972, At this Conference.
120
30TH INTERNATIONAL COSMIC RAY CONFERENCE
Contribution of atmospheric scattering of light to shower signal in a fluorescencedetector
J. PEKALA1, D. GORA1,2, P. HOMOLA1, M. RISSE3, B. WILCZYNSKA1, H. WILCZYNSKI1.1Institute of Nuclear Physics PAN, Radzikowskiego 152, 31-342 Krakow, Poland2Universitat Karlsruhe,Institut fur Experimentelle Kernphysik, 76128 Karlsruhe, Germany3University of Wuppertal, Department of Physics, 42097 Wuppertal, [email protected]
Abstract: The light emitted by an extensive air shower undergoes scattering on molecules and aerosolsin the atmosphere. The scattering effect not only attenuates the light, but also contributes to the signalrecorded by a detector. Hence, this effect directly influences the determination of shower energy. Inroutine analyses so far only contributions from direct and singly-scattered Cherenkov photons have beenaccounted for. Monte Carlo simulations were used in this work to study single and multiple scattering offluorescence photons as well as multiple scattering of Cherenkov photons, for various shower geometriesand varying distributions of aerosols in the air. The resulting contribution of scattered photons to the signalrecorded in a fluorescence detector was obtained. A parameterization of this additional contribution isprovided that can be used in shower reconstruction in the fluorescence technique of cosmic ray detection.
Introduction
The effect of scattering of light in the air results inattenuation of light emitted by an air shower be-fore it arrives to a detector. However, it may alsocontribute to the signal received by the detectorwhen light scatters several times before finally get-ting to the detector. Since the intensity of the scat-tered light does not relate directly to current num-ber of particles in a shower, the scattered light is abackground for a ”useful” unscattered fluorescencelight.
In routine air shower analyses so far, only thebackground due to direct and singly scatteredCherenkov light is subtracted from the signalrecorded by a fluorescence detector. A contribu-tion to the signal coming neither from multiplyscattered Cherenkov photons, nor from scattered(singly and multiply) fluorescence light, is sub-tracted. Failure to account for this additional back-ground signal results in overestimation of showerenergy in the fluorescence method of shower de-tection.
The aim of this work is to quantify the contributionfrom scattered fluorescence and multiply scattered
Cherenkov photons to the shower signal recordedby a fluorescence detector and to provide meansto amend the existing shower reconstruction proce-dure so that a correction for the multiple scatteringcontribution can be applied.
Simulation set
Simulations of scattering, and tracing of scatteredphotons were done using the Hybrid fadc pro-gram [2]. The original program was modified [6],so that multiple scattering of both fluorescenceand Cherenkov photons can be simulated sepa-rately. Wavelength-dependent Rayleigh scatteringon molecules and Mie scattering on aerosols aresimulated.
An extensive set of simulations was made. Simu-lation runs were performed for various shower en-ergies, different shower-detector distances and dif-ferent shower inclinations. Also, a variable distri-bution of aerosols in the atmosphere, with differentaerosol concentration at the ground and differentscale height of the distribution were tested. In ad-dition, a possible dependence of the scattering ef-fect on the molecular atmosphere distribution (i.e.
121

CONTRIBUTION OF MULTIPLE SCATTERING
0
5
10
15
20
25
0 1 2 3 4 5 6 7 8 9 10
new
sig
nal /
old
sig
nal [
%]
altitude [km]
zeta = 1.5 deg
3 km < d < 5 km6 km < d < 8 km
14 km < d < 16 km24 km < d < 26 km
elev
atio
n =
2°field of view limits
Figure 1: Contribution of scattered light to showersignal versus altitude above ground for selectedshower-detector distances. The solid lines are fitsof Eq.1. The dashed lines show limits of a detectorfield of view (elevation 2◦–30◦).
variable vertical distribution of air mass) and on lo-cation of a detector at different altitudes above sealevel were checked.
Two distributions of Cherenkov photon emissionfrom a shower were also used: a simple expo-nential distribution [1] and a more realistic two-exponent one [5].
Contributions to the signal in a detector wererecorded, coming from direct fluorescence and di-rect and singly scattered Cherenkov light, whichare accounted for in routine shower reconstruc-tion algorithms. These are collectively calledin this paper the ”old signal”. In addition, thenewly analysed contributions from multiply scat-tered Cherenkov and scattered (singly and mul-tiply) fluorescence photons, called here the ”newsignal”, were recorded.
Contribution of scattering
The results of simulations are quantified in terms ofvariable M = ”new signal”/”old signal”, i.e. in per-centage of the total shower signal used in showerreconstruction so far. It was shown in [6] thatthe contribution of scattered fluorescence light andmultiply scattered Cherenkov light to the shower”image spot” falls with altitude of shower frontabove the ground. The ”image spot” is the solidangle within which 90% of the signal is received.
0
0.5
1
1.5
2
2.5
3
3.5
4
4.5
5
6 7 8 9 10 11 12 13 14 15 16
ΛT[km]
parameter Aparameter B
Figure 2: Dependence of the A and B parameterson the total horizontal attenuation length (see thetext for details).
It is important to note that pixellization of the fieldof view of a fluorescence detector must be takeninto account. The angular size of the image spotdepends on the shower-detector distance and fordistant showers has a radius of about half of a de-gree. On the other hand, the radius of a detectorpixel size is usually larger than 0.5◦. Since theangular distribution of the scattered light is muchwider than that of the direct fluorescence [6], therelative contribution of the scattered componentdepends on the solid angle, from which signal iscollected in the detector. For example, in fluores-cence telescopes of the Pierre Auger Observatorythe signal is collected from a solid angle with a ra-dius larger than 1◦ [3]. Therefore, for distant show-ers this solid angle is larger than the image spotof the shower, and in consequence the contributionfrom multiple scattering is increased.
The scattering contribution to shower signal can bewell parameterized by
M = Aζd exp(−h/B) (1)
where ζ is the radius of the signal collection anglein the detector, d – the shower-detector distance, his the altitude of the shower front above the ground;A and B are parameters of the fit. As shown inFig.1, Eq.1 very well describes the contributionfrom scattering. For low altitudes this contributioncan exceed 20% for distant showers. If the detec-tor field of view is limited at low elevations, thedistant showers are not observed at very low alti-tudes. For example, only the region to the right
122

30TH INTERNATIONAL COSMIC RAY CONFERENCE
0
2
4
6
8
10
12
14
16
0 2 4 6 8 10 12
new
sig
nal /
old
sig
nal [
%]
altitude [km]
τ < 0.50.5 < τ < 11 < τ < 1.51.5 < τ < 2
2 < τ < 3τ > 3
Figure 3: Contribution of multiple scattering forall values of the total horizontal attenuation length,in groups of the optical depth τ along the shower-detector line of sight. The lines are fits of Eq.2 withmean values of the respective τ intervals.
from ”elevation=2◦” dashed curve in Fig.1 can beobserved in the Auger fluorescence detectors.
The A and B parameters of Eq.1 depend on distri-bution of aerosols. We show this dependence as afunction of the total horizontal attenuation lengthΛT (for the wavelength of 361 nm) which can beeasily measured experimentally. Fig.2 shows thedependence of A and B on ΛT :A = a1 exp(−ΛT /a2) + a3, with a1 = 1.77 ±0.03%, a2 = 4.37 ± 0.06km, a3 = 0.14 ± 0.01%;B = b1ΛT + b2, with b1 = 0.198 ± 0.004,b2 = 1.40 ± 0.03km.
Alternatively, the scattering contribution can be ex-pressed as a function of the optical depth τ of theshower-detector line of sight:
M = Fζτ exp(−h/G) (2)
with F = 3.32 ± 0.01%, G = 5.43 ± 0.03km.
The contribution of the multiple scattering to theshower signal was found to be rather insensitiveto details of vertical air mass distribution. Simu-lations were performed using the US Standard At-mosphere Model, as well as seasonal atmosphericprofiles for the southern site of the Auger Observa-tory. The differences between them are importantfor determination of depth of shower maximum.However, local differences of air density amongthese models appear to be rather insignificant forthe scattering effect. Similarly, variation of the de-
0
5
10
15
20
0 0.01 0.02 0.03 0.04 0.05 0.06 0.07 0.08 0.09 0.1
fluor
esc.
sca
tt. /
fluor
esc.
dire
ct [%
]
τ*α*d0.5
ζ = 1°
1018 eV, 15 km1018 eV, 25 km1019 eV, 15 km1019 eV, 25 km1020 eV, 15 km1020 eV, 25 km1021 eV, 15 km1021 eV, 25 km
77.4*(τ*α*d0.5*ζ1.1)0.68
0
5
10
15
20
25
30
35
40
0 0.01 0.02 0.03 0.04 0.05 0.06 0.07 0.08 0.09 0.1
fluor
esc.
sca
tt. /
fluor
esc.
dire
ct [%
]
τ*α*d0.5
ζ = 2°
1018 eV, 15 km1018 eV, 25 km1019 eV, 15 km1019 eV, 25 km1020 eV, 15 km1020 eV, 25 km1021 eV, 15 km1021 eV, 25 km
77.4*(τ*α*d0.5*ζ1.1)0.68
Figure 4: Comparison of fluorescence light scat-tering with results of [7] for ζ = 1◦ and ζ = 2◦.The data points are results of this work, the linesrepresent the fit given in [7].
tector altitude above sea level by a few hundredmeters does not affect the scattering contribution.We note that the air density depends on altitudeabove sea level, while the distribution of aerosols– on altitude above ground, so that the Rayleighand Mie scattering effects might contribute differ-ently. Nevertheless, the total scattering contribu-tion to shower signal does not appear to be notice-ably sensitive to the detector altitude.
Similarly, different distributions of Cherenkovemission from the shower, proposed in [1, 5] resultin similar scattering contributions to the showersignal.
Comparison with other results
Some studies of the scattering contribution can befound in the literature. In Ref.[7] scattering of flu-
123

CONTRIBUTION OF MULTIPLE SCATTERING
0
0.5
1
1.5
2
2.5
3
3.5
4
0 0.5 1 1.5 2 2.5 3fluor
esc.
sca
ttere
d / f
luor
esc.
dire
ct [%
]
zeta [deg]
Xc = 7 km, 361 nm
multiple scatt.single scatt.3.1*k*zeta
Figure 5: Comparison of Rayleigh scattering offluorescence light with results of [4]. The datapoints are results of this work, the line representsthe fit given in [4]
orescence light was studied assuming a uniformfluorescence light intensity along the shower track.To make the comparison, scattering of fluorescencelight only was extracted from our simulations. Thecomparison shown in Fig.4 demonstrates a reason-able agreement in the range of small scatteringcontributions.
Another study was made in Ref.[4] of Rayleighscattering only of fluorescence photons in aconstant-density atmosphere. Since the air densityin a real atmosphere falls approximately exponen-tially with altitude, positions of shower front lowabove the horizon were selected from our simula-tions, to study light propagation in a near-constantair density. A comparison of the Rayleigh scatter-ing only of fluorescence light with the results of [4]is shown in Fig.5. One can conclude therefore thata comparison of results of [7] and [4] with corre-sponding subsets of our results shows a satisfactoryagreement.
Conclusion
A comprehensive study of multiple scattering con-tribution to shower signal as recorded by a fluo-rescence detector was made. This contribution isparameterized as a function of the signal collec-tion angle ζ in the detector, the shower-detectordistance, the shower front altitude above groundand the total horizontal attenuation length (Eq.1),
or as a function of ζ, optical depth and altitude(Eq.2). The scattering contribution varies alongthe shower track, and may exceed 10% for distantshowers low above the horizon. Failure to accountfor the multiple scattering effect may result in asystematic overestimation of the shower energy bya few percent.
Since the contribution to the signal received bya detector varies along the shower track, it maychange the shape of the shower longitudinal pro-file, and in consequence, the reconstructed depthof shower maximum is affected. This change, how-ever, is generally small, a few g/cm2.
The parameterization of the scattering contributionpresented in this paper can be readily implementedinto existing algorithms of shower reconstructionin the fluorescence detection technique.
Acknowledgements
This work was partially supported by the PolishMinistry of Science and Higher Education undergrants No. N202 011 31/0401, N202 090 31/0623and PAP/218/2006.
References
[1] R. M. Baltrusaitis et al. Nucl. Instr. Meth. A,240:410, 1985.
[2] B. Dawson. private communication, 1998.[3] V. de Souza et al. Proc. 29th ICRC, Pune, 7:21,
2005.[4] M. Giller and A. Smialkowski. Proc. 29th
ICRC, Pune, 7:195, 2005.[5] F. Nerling et al. Astropart. Phys, 24:421, 2006.[6] B. Pekala et al. Proc. 29th ICRC, Pune, 7:207,
2005.[7] M. Roberts. J. Phys. G: Nucl. Part. Phys.,
31:1291, 2005.
124

30TH INTERNATIONAL COSMIC RAY CONFERENCE
New statistical parameters for mass composition studies with energy above 1017 eV
F. CATALANI1,J.A. CHINELLATO1, V. DE SOUZA2, J. TAKAHASHI1.1 Instituto de Fısica Gleb Wataghin, Universidade Estadual de Campinas, Brasil2 Institut fur Experimentelle Kernphysik, Universitat Karlsruhe, 76021 Karlsruhe, [email protected]
Abstract: The determination of the mass composition of the ultra high energy cosmic rays is essential tomany open questions in astroparticle physics. However the identification of the cosmic ray primary par-ticle is a complex task due to several difficulties such as the large fluctuations in the shower developmentand the low number of experimental measurables. We present a proposal for composition studies applyingmultivariate analysis to make use of all the possible parameters to improve primary particle identification.Several measurable features of the CR shower longitudinal profile such as the Nmax, Xmax, asymmetry,kurtosis, and skewness were combined using linear discriminant analysis (LDA). Studies were done usingcosmic ray showers simulated by the CONEX code considering gamma, proton, helium, carbon and ironas primary particles.
Introduction
The mass composition of ultra high energy cosmicrays (UHECR) plays a fundamental role in the un-derstanding of their origin, acceleration and prop-agation mechanisms. In the energy region of cos-mic ray spectra around 1015, known as the spec-tra knee, the most probable source for these par-ticles are the galactic supernovae. However, forhigher energies there are no known sources insideour galaxy that could be capable of acceleratingparticles to such energies. Thus, the natural con-clusion is that they must be of extragalactic origin.Within this scenario, the exact energy point wheretransition from the galactic to extragalactic compo-nent occurs varies with different models that pre-dict different chemical composition for the CR inthis high energy region. For example, in a modelthat considers that the transition occurs at the ankleenergies around 1018 eV [4], the chemical compo-sition of the spectra will be mostly populated byheavy nuclei such as iron. On the other hand, mod-els that considers a dip scenario the transition oc-curs around 1017 eV and the extragalactic compo-nent is composed basically by protons (it admits asmall fraction of helium nuclei) [3]. Thus, the de-termination of the chemical composition of cosmic
rays above 1017 eV is essential to solve this prob-lem.
At lower energies, the composition of the cosmicray spectra is achieved by studying, on a statisticalbasis, the variation of some experimental observ-able and considering that different primary parti-cles will develop different shower parameters. Forexample, in the case of fluorescence detector, theposition in the atmosphere where the shower ismaximum (Xmax) is different for proton initiatedor iron initiated showers, thus it is used as a com-position estimator. With ground array detectors,composition studies are done comparing the ratiobetween the hadronic and electromagnetic compo-nent of the shower. However, in the energy rangeabove 1017 eV, the shower development and theprocess of detection are constrained by large fluc-tuations that makes the the primary particle iden-tification more difficult. In this region of the CRspectra, composition measurements are still incon-clusive [8]. While the HiRes Collaboration [1]measured an unchanging light composition above1018 eV and a change from heavy to light com-position in the range 1017 − 1018 eV, the AGASAexperiment [9] measured an upper limit of the ironfraction of 35% in the range 1019 − 1019.5 eV and76% in the range 1019.5 − 1020 eV.
125
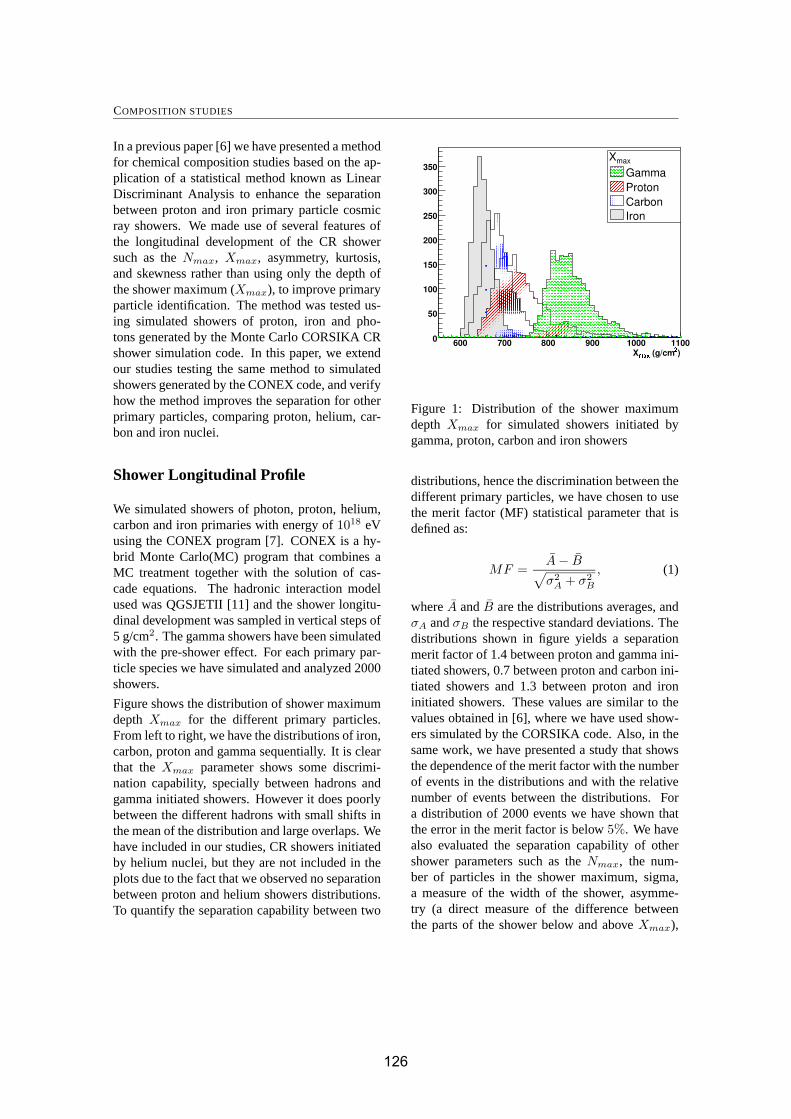
COMPOSITION STUDIES
In a previous paper [6] we have presented a methodfor chemical composition studies based on the ap-plication of a statistical method known as LinearDiscriminant Analysis to enhance the separationbetween proton and iron primary particle cosmicray showers. We made use of several features ofthe longitudinal development of the CR showersuch as the Nmax, Xmax, asymmetry, kurtosis,and skewness rather than using only the depth ofthe shower maximum (Xmax), to improve primaryparticle identification. The method was tested us-ing simulated showers of proton, iron and pho-tons generated by the Monte Carlo CORSIKA CRshower simulation code. In this paper, we extendour studies testing the same method to simulatedshowers generated by the CONEX code, and verifyhow the method improves the separation for otherprimary particles, comparing proton, helium, car-bon and iron nuclei.
Shower Longitudinal Profile
We simulated showers of photon, proton, helium,carbon and iron primaries with energy of 1018 eVusing the CONEX program [7]. CONEX is a hy-brid Monte Carlo(MC) program that combines aMC treatment together with the solution of cas-cade equations. The hadronic interaction modelused was QGSJETII [11] and the shower longitu-dinal development was sampled in vertical steps of5 g/cm2. The gamma showers have been simulatedwith the pre-shower effect. For each primary par-ticle species we have simulated and analyzed 2000showers.
Figure shows the distribution of shower maximumdepth Xmax for the different primary particles.From left to right, we have the distributions of iron,carbon, proton and gamma sequentially. It is clearthat the Xmax parameter shows some discrimi-nation capability, specially between hadrons andgamma initiated showers. However it does poorlybetween the different hadrons with small shifts inthe mean of the distribution and large overlaps. Wehave included in our studies, CR showers initiatedby helium nuclei, but they are not included in theplots due to the fact that we observed no separationbetween proton and helium showers distributions.To quantify the separation capability between two
Figure 1: Distribution of the shower maximumdepth Xmax for simulated showers initiated bygamma, proton, carbon and iron showers
distributions, hence the discrimination between thedifferent primary particles, we have chosen to usethe merit factor (MF) statistical parameter that isdefined as:
MF =A − B
√σ2
A + σ2B
, (1)
where A and B are the distributions averages, andσA and σB the respective standard deviations. Thedistributions shown in figure yields a separationmerit factor of 1.4 between proton and gamma ini-tiated showers, 0.7 between proton and carbon ini-tiated showers and 1.3 between proton and ironinitiated showers. These values are similar to thevalues obtained in [6], where we have used show-ers simulated by the CORSIKA code. Also, in thesame work, we have presented a study that showsthe dependence of the merit factor with the numberof events in the distributions and with the relativenumber of events between the distributions. Fora distribution of 2000 events we have shown thatthe error in the merit factor is below 5%. We havealso evaluated the separation capability of othershower parameters such as the Nmax, the num-ber of particles in the shower maximum, sigma,a measure of the width of the shower, asymme-try (a direct measure of the difference betweenthe parts of the shower below and above Xmax),
126
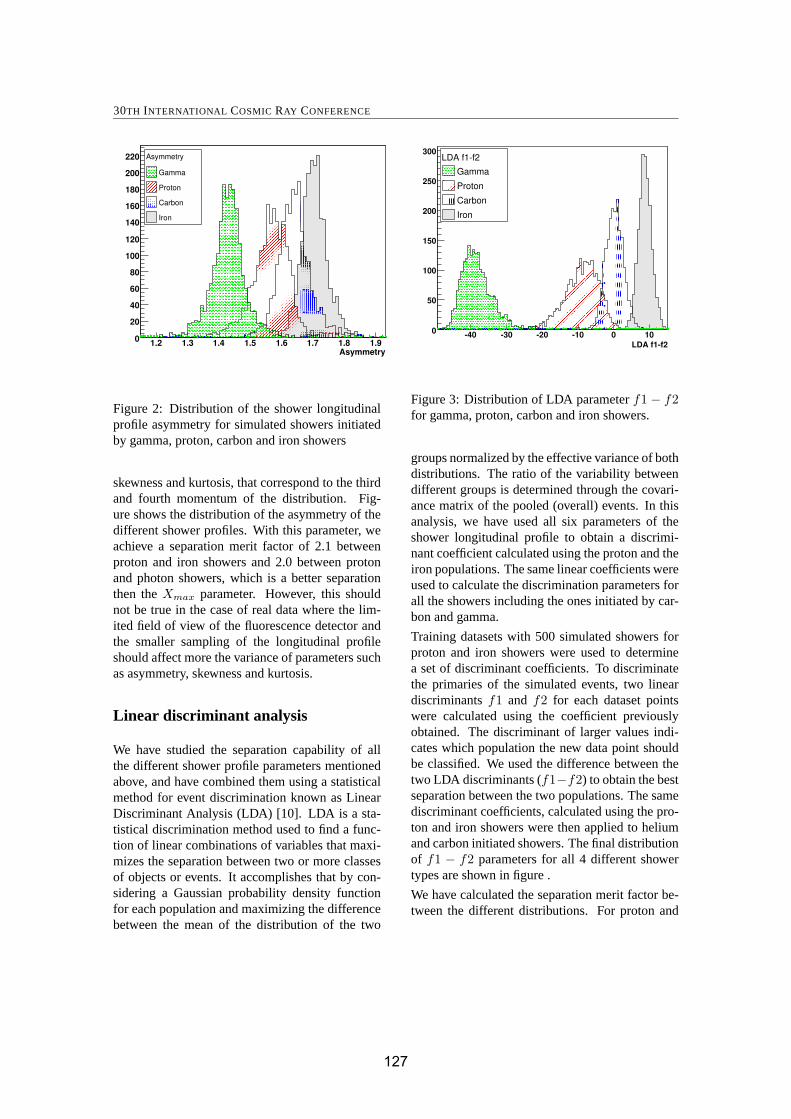
30TH INTERNATIONAL COSMIC RAY CONFERENCE
Figure 2: Distribution of the shower longitudinalprofile asymmetry for simulated showers initiatedby gamma, proton, carbon and iron showers
skewness and kurtosis, that correspond to the thirdand fourth momentum of the distribution. Fig-ure shows the distribution of the asymmetry of thedifferent shower profiles. With this parameter, weachieve a separation merit factor of 2.1 betweenproton and iron showers and 2.0 between protonand photon showers, which is a better separationthen the Xmax parameter. However, this shouldnot be true in the case of real data where the lim-ited field of view of the fluorescence detector andthe smaller sampling of the longitudinal profileshould affect more the variance of parameters suchas asymmetry, skewness and kurtosis.
Linear discriminant analysis
We have studied the separation capability of allthe different shower profile parameters mentionedabove, and have combined them using a statisticalmethod for event discrimination known as LinearDiscriminant Analysis (LDA) [10]. LDA is a sta-tistical discrimination method used to find a func-tion of linear combinations of variables that maxi-mizes the separation between two or more classesof objects or events. It accomplishes that by con-sidering a Gaussian probability density functionfor each population and maximizing the differencebetween the mean of the distribution of the two
Figure 3: Distribution of LDA parameter f1 − f2for gamma, proton, carbon and iron showers.
groups normalized by the effective variance of bothdistributions. The ratio of the variability betweendifferent groups is determined through the covari-ance matrix of the pooled (overall) events. In thisanalysis, we have used all six parameters of theshower longitudinal profile to obtain a discrimi-nant coefficient calculated using the proton and theiron populations. The same linear coefficients wereused to calculate the discrimination parameters forall the showers including the ones initiated by car-bon and gamma.
Training datasets with 500 simulated showers forproton and iron showers were used to determinea set of discriminant coefficients. To discriminatethe primaries of the simulated events, two lineardiscriminants f1 and f2 for each dataset pointswere calculated using the coefficient previouslyobtained. The discriminant of larger values indi-cates which population the new data point shouldbe classified. We used the difference between thetwo LDA discriminants (f1−f2) to obtain the bestseparation between the two populations. The samediscriminant coefficients, calculated using the pro-ton and iron showers were then applied to heliumand carbon initiated showers. The final distributionof f1 − f2 parameters for all 4 different showertypes are shown in figure .
We have calculated the separation merit factor be-tween the different distributions. For proton and
127
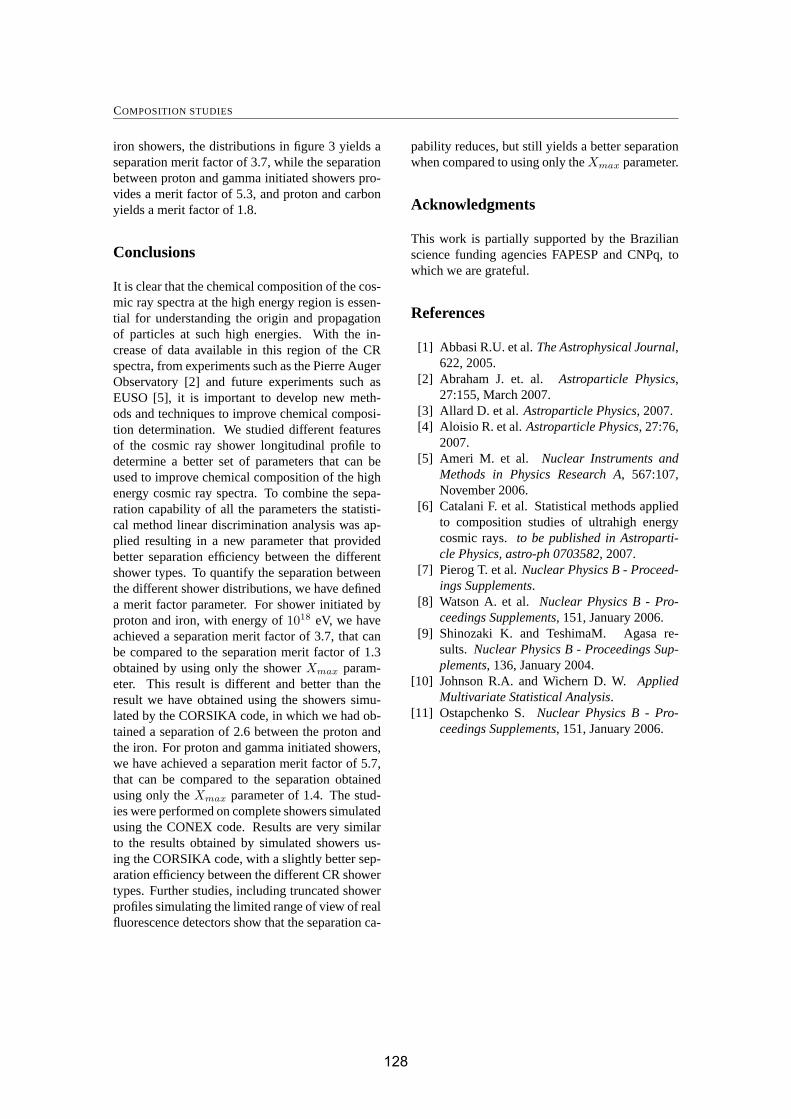
COMPOSITION STUDIES
iron showers, the distributions in figure 3 yields aseparation merit factor of 3.7, while the separationbetween proton and gamma initiated showers pro-vides a merit factor of 5.3, and proton and carbonyields a merit factor of 1.8.
Conclusions
It is clear that the chemical composition of the cos-mic ray spectra at the high energy region is essen-tial for understanding the origin and propagationof particles at such high energies. With the in-crease of data available in this region of the CRspectra, from experiments such as the Pierre AugerObservatory [2] and future experiments such asEUSO [5], it is important to develop new meth-ods and techniques to improve chemical composi-tion determination. We studied different featuresof the cosmic ray shower longitudinal profile todetermine a better set of parameters that can beused to improve chemical composition of the highenergy cosmic ray spectra. To combine the sepa-ration capability of all the parameters the statisti-cal method linear discrimination analysis was ap-plied resulting in a new parameter that providedbetter separation efficiency between the differentshower types. To quantify the separation betweenthe different shower distributions, we have defineda merit factor parameter. For shower initiated byproton and iron, with energy of 1018 eV, we haveachieved a separation merit factor of 3.7, that canbe compared to the separation merit factor of 1.3obtained by using only the shower Xmax param-eter. This result is different and better than theresult we have obtained using the showers simu-lated by the CORSIKA code, in which we had ob-tained a separation of 2.6 between the proton andthe iron. For proton and gamma initiated showers,we have achieved a separation merit factor of 5.7,that can be compared to the separation obtainedusing only the Xmax parameter of 1.4. The stud-ies were performed on complete showers simulatedusing the CONEX code. Results are very similarto the results obtained by simulated showers us-ing the CORSIKA code, with a slightly better sep-aration efficiency between the different CR showertypes. Further studies, including truncated showerprofiles simulating the limited range of view of realfluorescence detectors show that the separation ca-
pability reduces, but still yields a better separationwhen compared to using only the Xmax parameter.
Acknowledgments
This work is partially supported by the Brazilianscience funding agencies FAPESP and CNPq, towhich we are grateful.
References
[1] Abbasi R.U. et al. The Astrophysical Journal,622, 2005.
[2] Abraham J. et. al. Astroparticle Physics,27:155, March 2007.
[3] Allard D. et al. Astroparticle Physics, 2007.[4] Aloisio R. et al. Astroparticle Physics, 27:76,
2007.[5] Ameri M. et al. Nuclear Instruments and
Methods in Physics Research A, 567:107,November 2006.
[6] Catalani F. et al. Statistical methods appliedto composition studies of ultrahigh energycosmic rays. to be published in Astroparti-cle Physics, astro-ph 0703582, 2007.
[7] Pierog T. et al. Nuclear Physics B - Proceed-ings Supplements.
[8] Watson A. et al. Nuclear Physics B - Pro-ceedings Supplements, 151, January 2006.
[9] Shinozaki K. and TeshimaM. Agasa re-sults. Nuclear Physics B - Proceedings Sup-plements, 136, January 2004.
[10] Johnson R.A. and Wichern D. W. AppliedMultivariate Statistical Analysis.
[11] Ostapchenko S. Nuclear Physics B - Pro-ceedings Supplements, 151, January 2006.
128

30th International Cosmic Ray Conference
A MC simulation of neutrino showers and their detection with the PierreAuger Observatory
D. Gora1,2
, M. Roth3, A. Tamburro
1
1Institut fur Experimentelle Kernphysik Universitat Karlsruhe,D-76021 Karlsruhe, Germany2 Institute of Nuclear Physics PAN, ul. Radzikowskiego 152, 31-342 Krakow, Poland3 Forschungszentrum Karlsruhe, D-76021 Karlsruhe, Germany
Abstract: In this paper we present a study about the possibility to detect neutrino induced
extensive air showers at the Pierre Auger Observatory. The Monte Carlo simulations performed
take into account the details of the neutrino propagation inside the Earth, the air as well as
the surrounding mountains, which are modelled by a digital elevation map. Details on the
sensitivity with respect to the incoming direction as well as the aperture, the acceptance and
the total observable event rates, on the basis of various assumptions of the incoming neutrino
flux, and an upper limit for ultra high energy neutrinos, above 0.1 EeV, are given.
Introduction and method
The Pierre Auger Observatory has the capa-bility to detect neutrino induced showers. Es-pecially, if a ντ interacts close to the Earth’ssurface, the so–called Earth skimming neutri-nos, it can produce a tau lepton which canemerge from the Earth, decay and produce ex-tended air showers. If the decay vertex of atau lepton is close enough to the surface ar-ray, it can be detected and distinguished fromvery inclined showers induced by a proton ornuclei due to the presence of the electromag-netic component. As shown in Fig. 1A, theSouthern site (SO) is surrounded by a largeamount of rock (the Andes mountains). This isthe natural target for Earth skimming neutri-nos which leads to a significant enhancementof the tau lepton flux with respect to calcu-lations done with the simple spherical modelof the Earth. In case of the Northern site(NO) the mountains which might enhance thetau lepton flux are far away, Fig. 1B, so thatthe influence of the mountains is not very pro-nounced. However due to a larger area of thedetector (the planned area is about 3.5 timeslarger than SO) the rate is supposed to be
about three times larger than the one for theSouthern site. In order to simulate the neu-trino propagation through the Earth and the τlepton decay, an extended version of the ANIScode was used [1]. First, for a fixed energy ofthe tau neutrinos, 200.000 events were gener-ated with a zenith angle in the range between90◦−95◦ and azimuth between 0◦−360◦ at thetop of the atmosphere. Then tau neutrinos arepropagated to the detector in small steps. Ateach step of propagation the probability of a ντ
nucleon interaction is calculated according tothe parameterization of the cross section basedon the CTEQ5 [2] parton distribution func-tion. The propagation of tau leptons throughthe Earth was simulated with the energy lossmodel (continuous energy loss approach) givenby Dutta et al. in Ref. [4]: β(Eτ ) ≡ 1.2 ×10⁻⁶ + 0.16 × 10⁻⁶ln(Eτ/1010) cm2g−1. Thefactor β parameterizes the τ lepton energyloss through bremsstrahlung, pair production,and photonuclear interactions. The computa-tions were done by using digital elevation maps(DEM) [5] and then they were repeated by us-ing the spherical model of the Earth (SP), withits radius set to 6371 km (sea level). As a re-sult, the flux of the emerging τ leptons, i.e. the
129
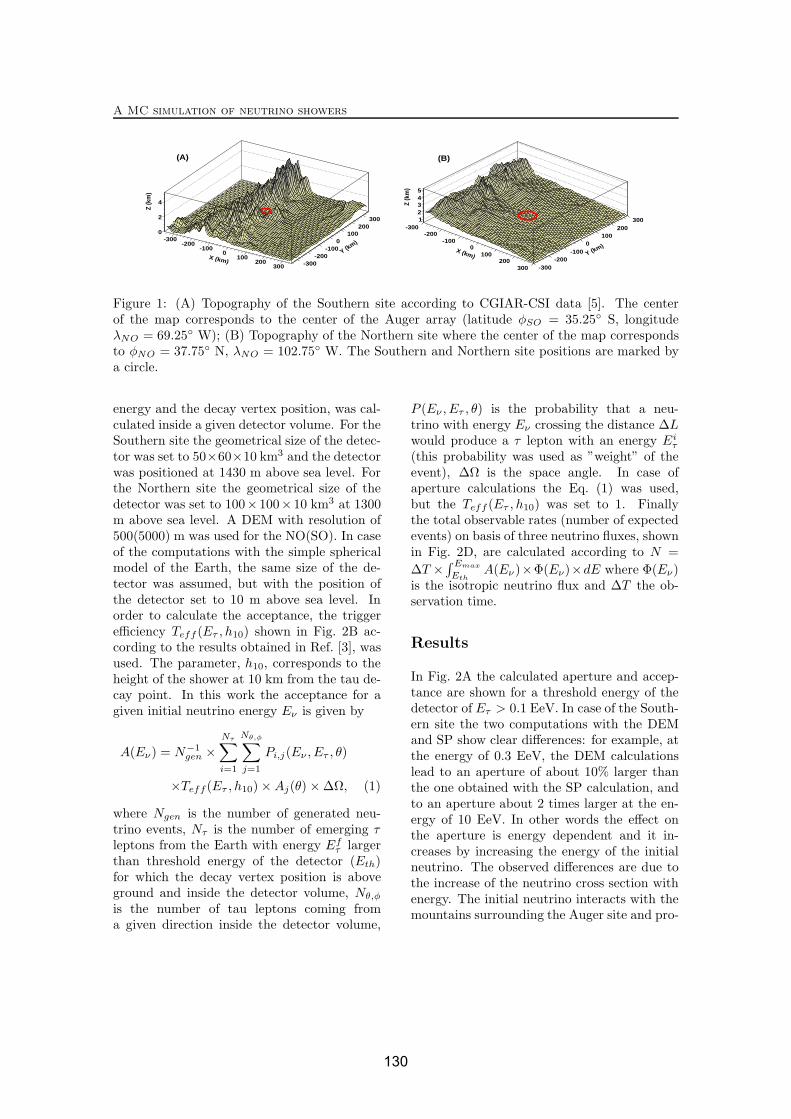
A MC simulation of neutrino showers
X (km)
-300-200
-1000
100200
300
Y (km)
-300-200
-1000
100200
300
Z (k
m)
0
2
4
(A)
X (km)
-300-200
-1000
100200
300
Y (km)
-300-200
-1000
100200
300
Z (k
m)
12345
(B)
Figure 1: (A) Topography of the Southern site according to CGIAR-CSI data [5]. The centerof the map corresponds to the center of the Auger array (latitude φSO = 35.25◦ S, longitudeλNO = 69.25◦ W); (B) Topography of the Northern site where the center of the map correspondsto φNO = 37.75◦ N, λNO = 102.75◦ W. The Southern and Northern site positions are marked bya circle.
energy and the decay vertex position, was cal-culated inside a given detector volume. For theSouthern site the geometrical size of the detec-tor was set to 50×60×10 km3 and the detectorwas positioned at 1430 m above sea level. Forthe Northern site the geometrical size of thedetector was set to 100×100×10 km3 at 1300m above sea level. A DEM with resolution of500(5000) m was used for the NO(SO). In caseof the computations with the simple sphericalmodel of the Earth, the same size of the de-tector was assumed, but with the position ofthe detector set to 10 m above sea level. Inorder to calculate the acceptance, the triggerefficiency Teff (Eτ , h10) shown in Fig. 2B ac-cording to the results obtained in Ref. [3], wasused. The parameter, h10, corresponds to theheight of the shower at 10 km from the tau de-cay point. In this work the acceptance for agiven initial neutrino energy Eν is given by
A(Eν) = N−1gen ×
Nτ∑
i=1
Nθ,φ∑
j=1
Pi,j(Eν , Eτ , θ)
×Teff(Eτ , h10) × Aj(θ) × ΔΩ, (1)
where Ngen is the number of generated neu-trino events, Nτ is the number of emerging τleptons from the Earth with energy Ef
τ largerthan threshold energy of the detector (Eth)for which the decay vertex position is aboveground and inside the detector volume, Nθ,φ
is the number of tau leptons coming froma given direction inside the detector volume,
P (Eν , Eτ , θ) is the probability that a neu-trino with energy Eν crossing the distance ΔLwould produce a τ lepton with an energy Ei
τ
(this probability was used as ”weight” of theevent), ΔΩ is the space angle. In case ofaperture calculations the Eq. (1) was used,but the Teff (Eτ , h10) was set to 1. Finallythe total observable rates (number of expectedevents) on basis of three neutrino fluxes, shownin Fig. 2D, are calculated according to N =
ΔT ×∫ Emax
Eth
A(Eν )×Φ(Eν)×dE where Φ(Eν)is the isotropic neutrino flux and ΔT the ob-servation time.
Results
In Fig. 2A the calculated aperture and accep-tance are shown for a threshold energy of thedetector of Eτ > 0.1 EeV. In case of the South-ern site the two computations with the DEMand SP show clear differences: for example, atthe energy of 0.3 EeV, the DEM calculationslead to an aperture of about 10% larger thanthe one obtained with the SP calculation, andto an aperture about 2 times larger at the en-ergy of 10 EeV. In other words the effect onthe aperture is energy dependent and it in-creases by increasing the energy of the initialneutrino. The observed differences are due tothe increase of the neutrino cross section withenergy. The initial neutrino interacts with themountains surrounding the Auger site and pro-
130
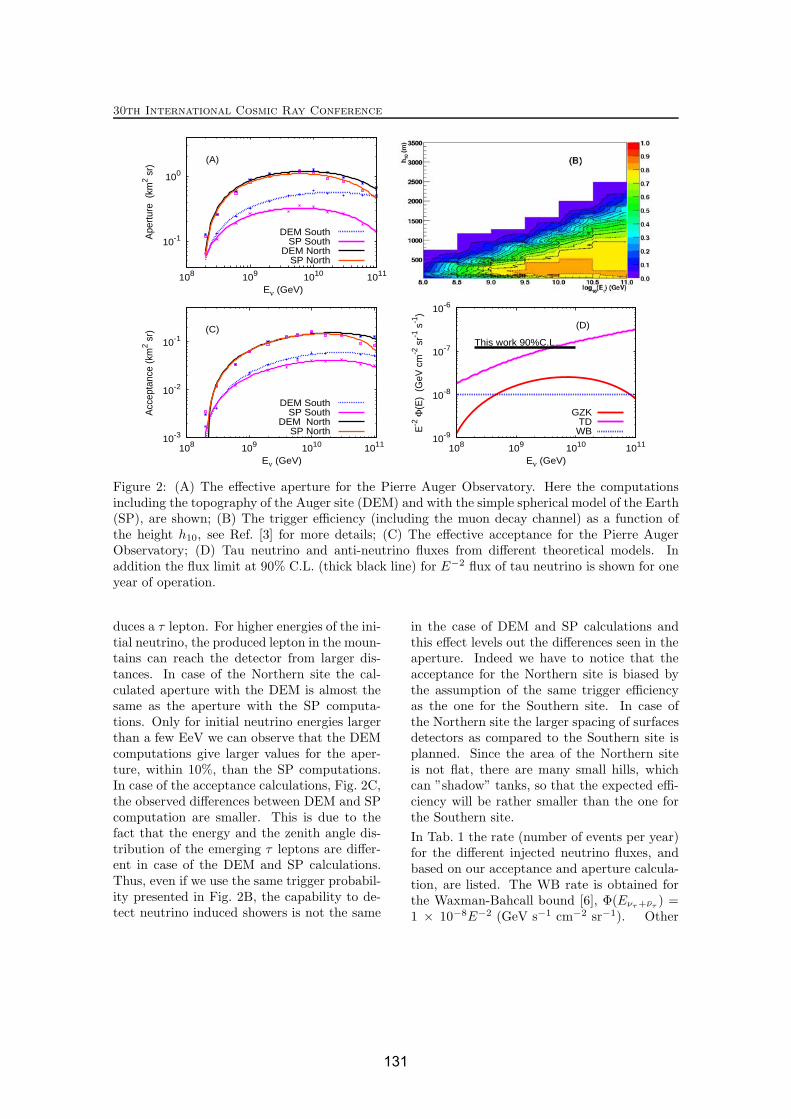
30th International Cosmic Ray Conference
10-1
100
108 109 1010 1011
Ape
rtur
e (
km2 s
r)
Eν (GeV)
(A)
DEM South SP South
DEM North SP North
10-3
10-2
10-1
108 109 1010 1011
Acc
epta
nce
(km
2 sr)
Eν (GeV)
(C)
DEM South SP South
DEM North SP North
10-9
10-8
10-7
10-6
108 109 1010 1011
E-2
Φ(E
) (
GeV
cm
-2 s
r-1 s
-1)
Eν (GeV)
(D)
This work 90%C.L.
GZKTDWB
Figure 2: (A) The effective aperture for the Pierre Auger Observatory. Here the computationsincluding the topography of the Auger site (DEM) and with the simple spherical model of the Earth(SP), are shown; (B) The trigger efficiency (including the muon decay channel) as a function ofthe height h10, see Ref. [3] for more details; (C) The effective acceptance for the Pierre AugerObservatory; (D) Tau neutrino and anti-neutrino fluxes from different theoretical models. Inaddition the flux limit at 90% C.L. (thick black line) for E−2 flux of tau neutrino is shown for oneyear of operation.
duces a τ lepton. For higher energies of the ini-tial neutrino, the produced lepton in the moun-tains can reach the detector from larger dis-tances. In case of the Northern site the cal-culated aperture with the DEM is almost thesame as the aperture with the SP computa-tions. Only for initial neutrino energies largerthan a few EeV we can observe that the DEMcomputations give larger values for the aper-ture, within 10%, than the SP computations.In case of the acceptance calculations, Fig. 2C,the observed differences between DEM and SPcomputation are smaller. This is due to thefact that the energy and the zenith angle dis-tribution of the emerging τ leptons are differ-ent in case of the DEM and SP calculations.Thus, even if we use the same trigger probabil-ity presented in Fig. 2B, the capability to de-tect neutrino induced showers is not the same
in the case of DEM and SP calculations andthis effect levels out the differences seen in theaperture. Indeed we have to notice that theacceptance for the Northern site is biased bythe assumption of the same trigger efficiencyas the one for the Southern site. In case ofthe Northern site the larger spacing of surfacesdetectors as compared to the Southern site isplanned. Since the area of the Northern siteis not flat, there are many small hills, whichcan ”shadow” tanks, so that the expected effi-ciency will be rather smaller than the one forthe Southern site.
In Tab. 1 the rate (number of events per year)for the different injected neutrino fluxes, andbased on our acceptance and aperture calcula-tion, are listed. The WB rate is obtained forthe Waxman-Bahcall bound [6], Φ(Eντ +ντ
) =1 × 10⁻⁸E−2 (GeV s−1 cm−2 sr−1). Other
131
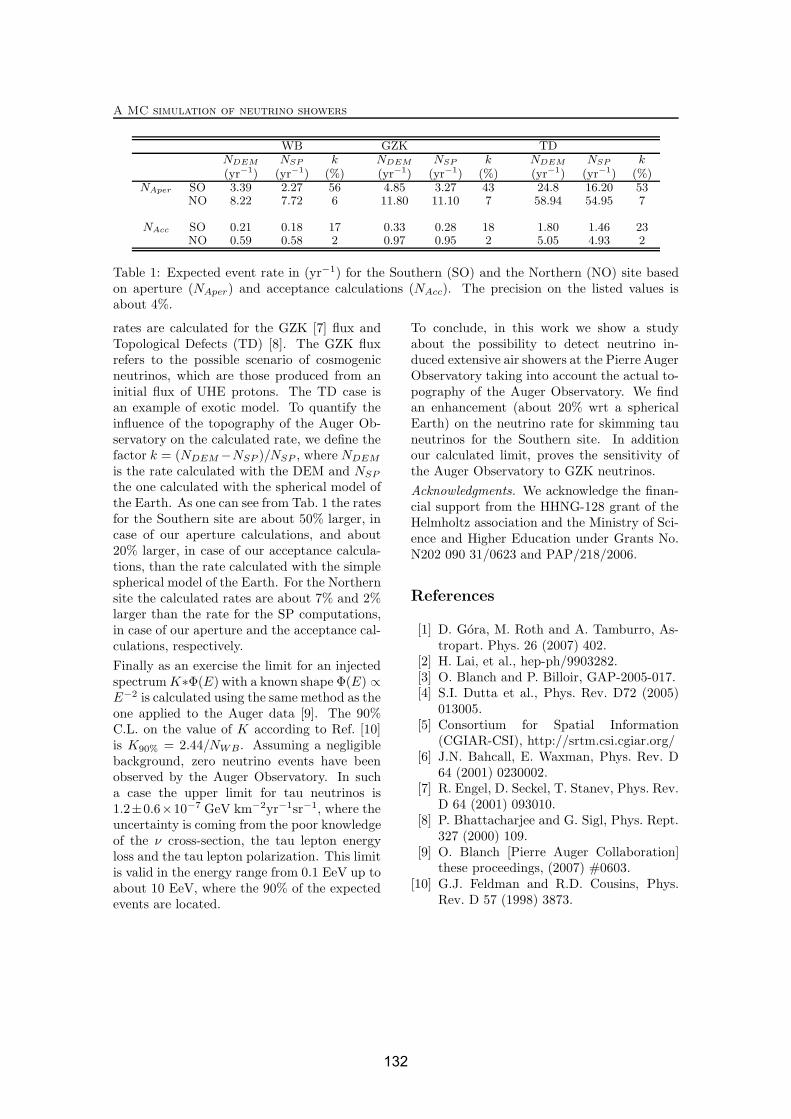
A MC simulation of neutrino showers
WB GZK TD
NDEM NSP k NDEM NSP k NDEM NSP k(yr
−1) (yr
−1) (%) (yr
−1) (yr
−1) (%) (yr
−1) (yr
−1) (%)
NAper SO 3.39 2.27 56 4.85 3.27 43 24.8 16.20 53
NO 8.22 7.72 6 11.80 11.10 7 58.94 54.95 7
NAcc SO 0.21 0.18 17 0.33 0.28 18 1.80 1.46 23
NO 0.59 0.58 2 0.97 0.95 2 5.05 4.93 2
Table 1: Expected event rate in (yr−1) for the Southern (SO) and the Northern (NO) site basedon aperture (NAper) and acceptance calculations (NAcc). The precision on the listed values isabout 4%.
rates are calculated for the GZK [7] flux andTopological Defects (TD) [8]. The GZK fluxrefers to the possible scenario of cosmogenicneutrinos, which are those produced from aninitial flux of UHE protons. The TD case isan example of exotic model. To quantify theinfluence of the topography of the Auger Ob-servatory on the calculated rate, we define thefactor k = (NDEM −NSP )/NSP , where NDEM
is the rate calculated with the DEM and NSP
the one calculated with the spherical model ofthe Earth. As one can see from Tab. 1 the ratesfor the Southern site are about 50% larger, incase of our aperture calculations, and about20% larger, in case of our acceptance calcula-tions, than the rate calculated with the simplespherical model of the Earth. For the Northernsite the calculated rates are about 7% and 2%larger than the rate for the SP computations,in case of our aperture and the acceptance cal-culations, respectively.
Finally as an exercise the limit for an injectedspectrum K∗Φ(E) with a known shape Φ(E) ∝E−2 is calculated using the same method as theone applied to the Auger data [9]. The 90%C.L. on the value of K according to Ref. [10]is K90% = 2.44/NWB. Assuming a negligiblebackground, zero neutrino events have beenobserved by the Auger Observatory. In sucha case the upper limit for tau neutrinos is1.2±0.6×10⁻⁷ GeV km−2yr−1sr−1, where theuncertainty is coming from the poor knowledgeof the ν cross-section, the tau lepton energyloss and the tau lepton polarization. This limitis valid in the energy range from 0.1 EeV up toabout 10 EeV, where the 90% of the expectedevents are located.
To conclude, in this work we show a studyabout the possibility to detect neutrino in-duced extensive air showers at the Pierre AugerObservatory taking into account the actual to-pography of the Auger Observatory. We findan enhancement (about 20% wrt a sphericalEarth) on the neutrino rate for skimming tauneutrinos for the Southern site. In additionour calculated limit, proves the sensitivity ofthe Auger Observatory to GZK neutrinos.
Acknowledgments. We acknowledge the finan-cial support from the HHNG-128 grant of theHelmholtz association and the Ministry of Sci-ence and Higher Education under Grants No.N202 090 31/0623 and PAP/218/2006.
References
[1] D. Gora, M. Roth and A. Tamburro, As-tropart. Phys. 26 (2007) 402.
[2] H. Lai, et al., hep-ph/9903282.[3] O. Blanch and P. Billoir, GAP-2005-017.[4] S.I. Dutta et al., Phys. Rev. D72 (2005)
013005.[5] Consortium for Spatial Information
(CGIAR-CSI), http://srtm.csi.cgiar.org/[6] J.N. Bahcall, E. Waxman, Phys. Rev. D
64 (2001) 0230002.[7] R. Engel, D. Seckel, T. Stanev, Phys. Rev.
D 64 (2001) 093010.[8] P. Bhattacharjee and G. Sigl, Phys. Rept.
327 (2000) 109.[9] O. Blanch [Pierre Auger Collaboration]
these proceedings, (2007) #0603.[10] G.J. Feldman and R.D. Cousins, Phys.
Rev. D 57 (1998) 3873.
132

30TH INTERNATIONAL COSMIC RAY CONFERENCE
Investigation of backgrounds for horizontal neutrino showers at ultra-high energy
O. TASCAU 1 , R. ENGEL2, K.-H. KAMPERT 1, M. RISSE 1.1 Bergische Universitat Wuppertal, Germany , 2 Forschungszentrum Karlsruhe, [email protected]
Abstract: A possible signature of a neutrino-induced air shower is a near-horizontal event developingvery deeply in the atmosphere at depths exceeding a few thousand g/cm2. Making use of high-statisticsshower libraries we study the background to such events from high-energy muons produced in primaryproton events, which may propagate deeply into the atmosphere before initiating a subcascade. The ratesof background events are compared with various flux models of ultra-high energy neutrino production.
Introduction
The Pierre Auger Observatory is one of the detec-tors able to detect neutrino showers and, in the rel-evant energy range, Auger is equivalent to tens ofkm3 of water. The detection of neutrinos is not themain aim of the Auger Observatory, but it can beconsidered as a very rich by-product for many rea-sons. We are investigating if we can extract a ν sig-nal above the hadronic background. If no signal isobserved, this will put severe constraints on mod-els which predict high-energy neutrino production.
Why are we interested in neutrinos? Mainly be-cause: 1) Neither the GZK cutoff nor magneticfields operate on ν. Therefore the reconstructeddirections should point directly to the source, withthe intrinsic angular precision of the detector. 2)The existence of detectable fluxes of neutrinoswithenergies in excess of 1018 eV is in principle one ofthe signatures of Topological Defect theories. 3)At around 1017 eV we are close to the highest en-ergies accessible to the large future neutrino tele-scope projects and give some indications, severalyears before such detectors become operational, onthe validity of the models used in the design ofsuch projects (detectingmainly predicted neutrinosproduced in AGNs).
Above 1015 eV the Earth becomes opaque to ν andonly down-going or Earth-skimming EeV neutri-nos can be detected. The challenge lies in the iden-tification of these showers in the background of
Figure 1: ”Old“ and ”young“ cosmic rays showers.
down-going cosmic rays and atmospheric muons.Inclined showers in the atmosphere are expectedto play a crucial role for the detection of EeV neu-trinos. The background for the detection of in-clined showers produced by neutrinos is mainlydue to showers induced by protons and nuclei. Thefirst ones are expected to develop high in the at-mosphere so that when the shower front reachesground level it has very different properties from‘ordinary’ showers that are observed in the ver-tical direction. They are called “old showers“.Deep-inclined showers induced by neutrinos candevelop close to ground level so that their showerfront looks like a typical vertical proton cosmic rayshower. Another type of background to inclinedshowers induced by ν is given by deep showers in-duced otherwise.
The electromagnetic part of cosmic ray showersgets practically absorbed in the first 2000 g/cm2
133
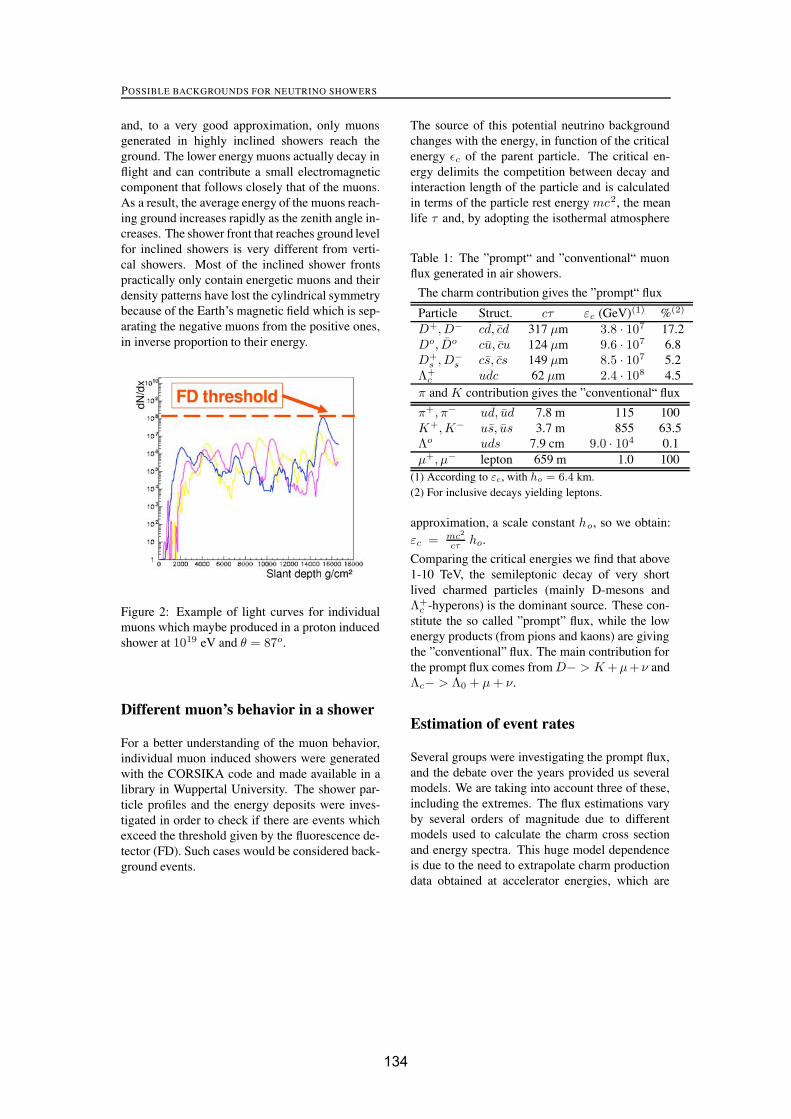
POSSIBLE BACKGROUNDS FOR NEUTRINO SHOWERS
and, to a very good approximation, only muonsgenerated in highly inclined showers reach theground. The lower energy muons actually decay inflight and can contribute a small electromagneticcomponent that follows closely that of the muons.As a result, the average energy of the muons reach-ing ground increases rapidly as the zenith angle in-creases. The shower front that reaches ground levelfor inclined showers is very different from verti-cal showers. Most of the inclined shower frontspractically only contain energetic muons and theirdensity patterns have lost the cylindrical symmetrybecause of the Earth’s magnetic field which is sep-arating the negative muons from the positive ones,in inverse proportion to their energy.
Figure 2: Example of light curves for individualmuons which maybe produced in a proton inducedshower at 1019 eV and θ = 87o.
Different muon’s behavior in a shower
For a better understanding of the muon behavior,individual muon induced showers were generatedwith the CORSIKA code and made available in alibrary in Wuppertal University. The shower par-ticle profiles and the energy deposits were inves-tigated in order to check if there are events whichexceed the threshold given by the fluorescence de-tector (FD). Such cases would be considered back-ground events.
The source of this potential neutrino backgroundchanges with the energy, in function of the criticalenergy εc of the parent particle. The critical en-ergy delimits the competition between decay andinteraction length of the particle and is calculatedin terms of the particle rest energymc2, the meanlife τ and, by adopting the isothermal atmosphere
Table 1: The ”prompt“ and ”conventional“ muonflux generated in air showers.
The charm contribution gives the ”prompt“ flux
Particle Struct. cτ εc (GeV)(1) %(2)
D+, D− cd, cd 317 μm 3.8 · 107 17.2Do, Do cu, cu 124 μm 9.6 · 107 6.8D+
s , D−s cs, cs 149 μm 8.5 · 107 5.2
Λ+c udc 62 μm 2.4 · 108 4.5
π andK contribution gives the ”conventional“ flux
π+, π− ud, ud 7.8 m 115 100K+, K− us, us 3.7 m 855 63.5Λo uds 7.9 cm 9.0 · 104 0.1μ+, μ− lepton 659 m 1.0 100(1) According to εc, with ho = 6.4 km.(2) For inclusive decays yielding leptons.
approximation, a scale constant ho, so we obtain:εc = mc2
cτ ho.
Comparing the critical energies we find that above1-10 TeV, the semileptonic decay of very shortlived charmed particles (mainly D-mesons andΛ+
c -hyperons) is the dominant source. These con-stitute the so called ”prompt” flux, while the lowenergy products (from pions and kaons) are givingthe ”conventional” flux. The main contribution forthe prompt flux comes fromD− > K +μ+ ν andΛc− > Λ0 + μ + ν.
Estimation of event rates
Several groups were investigating the prompt flux,and the debate over the years provided us severalmodels. We are taking into account three of these,including the extremes. The flux estimations varyby several orders of magnitude due to differentmodels used to calculate the charm cross sectionand energy spectra. This huge model dependenceis due to the need to extrapolate charm productiondata obtained at accelerator energies, which are
134

30TH INTERNATIONAL COSMIC RAY CONFERENCE
several orders of magnitude below the relevant cos-mic rays collisions. The most conservative modelwas studied in several papers based on Thunman etal. [7](TIG), using state-of-the-art models to sim-ulate charm particle production through perturba-tive QCD processes in high energy hadron-hadroninteractions, and investigations of a possible non-perturbative mechanism for the case of an intrinsiccharm quark component in the nucleon. The nextmodel considered is Gondolo et al. [2](GGV) andit is considered an improvement of the TIG values,being compatible with the results from Pasquali etal. [6] which used a complementary analysis. Theyused higher K factors for the parton distributionfunctions (PDF’s) as function of energy, making afull simulation of the cascades, while PRS used ap-proximative analytic solution to the cascade equa-tions in the air. The most exotic model we tookinto account is the one presented by Zas et al.[8] (ZHV), which pushes the charm production to10%, thus obtaining a very high charm flux. Eachpaper cited here used several parameters and meth-ods, obtaining results which may differ by 2 ordersof magnitude. However, in our interval of inter-est, we chose, for a simple estimate, the followingvalues of the E3-weighted-flux of the muons Fμ:for TIG, 10−5, for GGV, 10−3 and for ZHV, 10−1
GeV 3/cm2 sr s.
All the prompt fluxes presented here are verticalfluxes. At the energies < 1016 eV, the horizontalflux has a slower cutoff than the vertical one, and,in our interval, we assume that the horizontal fluxis 10 times higher than the vertical one, using theestimations given by Martin et al in [4].
The estimate of the rate of the potential back-grounds for the neutrino showers detected byAuger is given by dNμ/dt in the following form:
D
∫dΩ
∫dεμ
dNμ
dtdΩdεμ
∫dV ∗ Pnon−int ∗ Pint
(1)The background light introduces a duty cyclewhich limits its acceptance both for cosmic ray andneutrino detection. In this equationwe take into ac-count the duty cycle D for the fluorescence detectorin Auger which is considered 10%. The solid an-gle in which the considered showers may arrive is∫ 90◦
80◦∫ 360◦
0 sin(θ)dθdφ
Figure 3: The interaction should take place in thesensitive area of Auger.
We consider events only with the interaction is inthe sensitive volume. The probability for this is
given by Pint = 1 − e−x2−x1
λint while the one toenter the volumewithout interaction isPnon−int =
e− x1−x0
λint , with x1, x0 and x2 as in the figure, wherea symbolic Auger volume is shown, for a 10 kmheight.
The integral prompt muon flux in our energy range
(in GeV)∫
dεμ is∫ 1011
108Fμ
Eμ3 dEμ. We denote
D
∫dΩ
∫dεμ
dNμ
dtdΩdεμ= C (2)
and dNμ/dt becomes:
C
∫dA⊥Pnon−int
∫ l2
l1
dPint(xint)dxint
ρ(xint)dl
(3)where ρ(xint)dl = dxint andA⊥ is the transversalarea for the line elements of the trajectories insidethe considered volume.
For the case xint − x1 << λint we can ap-
proximate e− xint−x1
λint ≈ 1 and, for the moment,we do not include the energy loss. We consider
ρ = − dXvdh ; Xv = X0e
− hh0 ;
∫ρdl = x and we get
dNμ
dt= C
∫dA
1λint
∫ X1
X2
dXv (4)
with h0=8.4 km and X0=1030 g/cm2 and A, thefiducial surface of Auger South.
MAuger =∫
dA∫ X1
X2 dXv = 1.64 · 1010tons isthe mass of the air above the Auger South sur-
135

POSSIBLE BACKGROUNDS FOR NEUTRINO SHOWERS
face, in a layer of 10 km thickness. The inter-action length λint = mair
Na·σμ−airis calculated us-
ing mair=14.54 g/mol, Na = 6.023 · 1023 mol−1
and the cross section σμ−air , taken from the COR-SIKA simulations.
Results
Table 2 summarises the results of the calculatedevent rates according to previous section. The
Table 2: Possible FD background from HE muon-induced showers (events/year).
θ TIG [7] GGV [2] ZHV [8]
80◦ − 90◦ 1.4 · 10−5 1.4 · 10−3 0 .14
60◦ − 90◦ 4 · 10−5 4 · 10−3 0.4
Table 3: FD hadronic background to ν FD signal
ν/year/model(1) TIG [7] GGV [2] ZHV [8]
0.043 / GZK-WB 0.1% 10% 100%
0.67 / NH 0.006% 0.6% 60%(1) According to [5] for 60◦ − 90◦
background values are computed also for θ =60o − 90o in order to compare them with the neu-trino signal predicted by Miele et al. [5], includ-ing here the conservative value obtained assum-ing the GZK flux for Waxman-Bahcall scenariofor cosmogenic neutrinos (GZK-WB) and the ex-treme one given by the exotic model for generat-ing UHECR with large associated neutrino fluxes,named New Hadrons (NH).
Conclusions
High energy muons from heavy flavor decay caninduce young horizontal showers similar to theν signatures. The theoretical uncertainties arehuge, so the predicted possible background valuesspread over several orders of magnitude. muonenergy loss is neglected is rather important. Thiscalculation neglected the energy loss, thefore, the
estimated muon-induced event rates are upperlimits. For the most exotic perspective, ZHV[8], the background rates almost rule out the νdetection, but, in turn, one could think about aninteresting capability to detect charm, once theappropriate tools to recognize the charm signatureare there. However, this is possible due to theassumption of a 10% charm production, which isnot supported by the Akeno data [8]. For the othertwo considered models, the predicted backgroundrates are sufficiently low, opening an interestingwindow to study high energy neutrinoswith Auger.
While the present estimate was performed for theFD, further sensitivity to ν‘s is provided by the sur-face array of Auger Observatory.Another possible background source would bephoton induced showers which due to the LPM ef-fect develop very deep in the atmosphere. Relatedinvestigations are ongoing.
Acknowledgements
Financial support given by the German Ministryfor Research and Education (BMBF), under thegrant 05 CU5PX1/6, is gratefully acknowledged.
References
[1] C. G. C. Costa. High Energy Ph. 0010306,2001.
[2] G. Gelmini, P. Gondolo, and G. Varieschi.Phys. Rev. D 61 056011, 2000.
[3] D. Heck, J. Knapp, J. N. Capdevielle,G. Schatz, and T. Thouw. FZKA 6019, 1998.
[4] A. D. Martin, M. G. Ryskin, and A. M. Stasto.Hep. Ph. 0302140, 2003.
[5] G. Miele, O. Pastor, and O. Pisanti. Phys. Lett.B 634, pages 137–142, 2006.
[6] L. Pasquali and M. H. Reno. Phys. Rev. D, 59,page 034020, 1999.
[7] M. Thunman, B. Ingelman, and P. Gondolo.Astropart.Phys.5, pages 309–332, 1995.
[8] E. Zas, F. Halzen, and R. A. Vasquez. As-tropart. Phys. 1, page 297, 1993.
136

137
138
139
140
141
142
143
144
145

146

147

148
30TH INTERNATIONAL COSMIC RAY CONFERENCE
Latest Results from the Air Shower Simulation Programs CORSIKA and CONEX
T. PIEROG1 , R. ENGEL1, D. HECK1, S. OSTAPCHENKO1,2 AND K. WERNER3 .1 Forschungszentrum Karlsruhe, Institut fur Kernphysik, Karlsruhe, Germany2 D.V. Skobeltsyn Institute of Nuclear Physics, Moscow State University, Moscow, Russia3 SUBATECH, University of Nantes – IN2P3/CNRS– EMN, Nantes, [email protected]
Abstract: Interpretation of EAS measurements strongly depends on detailed air shower simulations.The uncertainty in the prediction of shower observables for different primary particles and energies iscurrently dominated by differences between hadronic interaction models. The new models QGSJET II-3and EPOS 1.6, which reproduce all major results of existing accelerator data (including detailed data ofRHIC experiments for EPOS), have been implemented in the air shower simulation programs CORSIKAand CONEX. We show predictions of these new models and compare them with those from older modelssuch as QGSJET01 or SIBYLL. Results for important air shower observables are discussed in detail.
Introduction
The experimental method of studying ultra-highenergy cosmic rays is an indirect one. Typically,one investigates various characteristics of exten-sive air showers (EAS), a huge nuclear-electro-magnetic cascade induced by a primary particle inthe atmosphere, and uses the obtained informationto infer the properties of the original particle, itsenergy, type, direction etc. Hence, the reliabilityof ultra-high energy cosmic ray analyses dependson the use of proper theoretical and phenomeno-logical descriptions of the cascade processes.
The most natural way to predict atmospheric parti-cle cascading in detail seems to be a direct MonteCarlo (MC) simulation of EAS development, likeit is done, for example, in the CORSIKA program[1]. As a very large computation time is requiredat high energy, an alternative procedure was devel-oped to describe EAS development numerically,based on the solution of the corresponding cas-cade equations. Combining this with an explicitMC simulation of the most energetic part of an airshower allows us to obtain accurate results both foraverage EAS characteristics and for their fluctua-tions in CONEX program [2].
After briefly describing recent changes introducedin CORSIKA and CONEX, we will present the lat-
est results for important air shower observables ob-tained with these models.
Improvements of CORSIKA andCONEX
Last year QGSJET II-3 [3] and this year EPOS 1.6[4] have been introduced in both CORSIKA andCONEX as new hadronic interaction models. Thesemodels have quite different philosophies. The firstone is dedicated to cosmic ray physics and basedon the re-summation of enhanced pomeron graphsto all orders [5]. The latter one is designed for highenergy physics and partially relies on a more phe-nomenological approach, aiming at a nearly per-fect description of accelerator data, in particularnew RHIC measurements. Some results are pre-sented in the following (see also [6]).
Concerning the particle tracking algorithms, themost important improvement in the last release ofCORSIKA (6.611) is the possibility to combine theSLANT/UPWARD/CURVED options [7] in order tosimulate air showers with any kind of zenith an-gle, including upward going showers (from 0◦ to180◦). The calculation of slant depth distances hasbeen improved using the work of [8] as also em-ployed in CONEX. In Fig. 1 the mean longitudinal
149
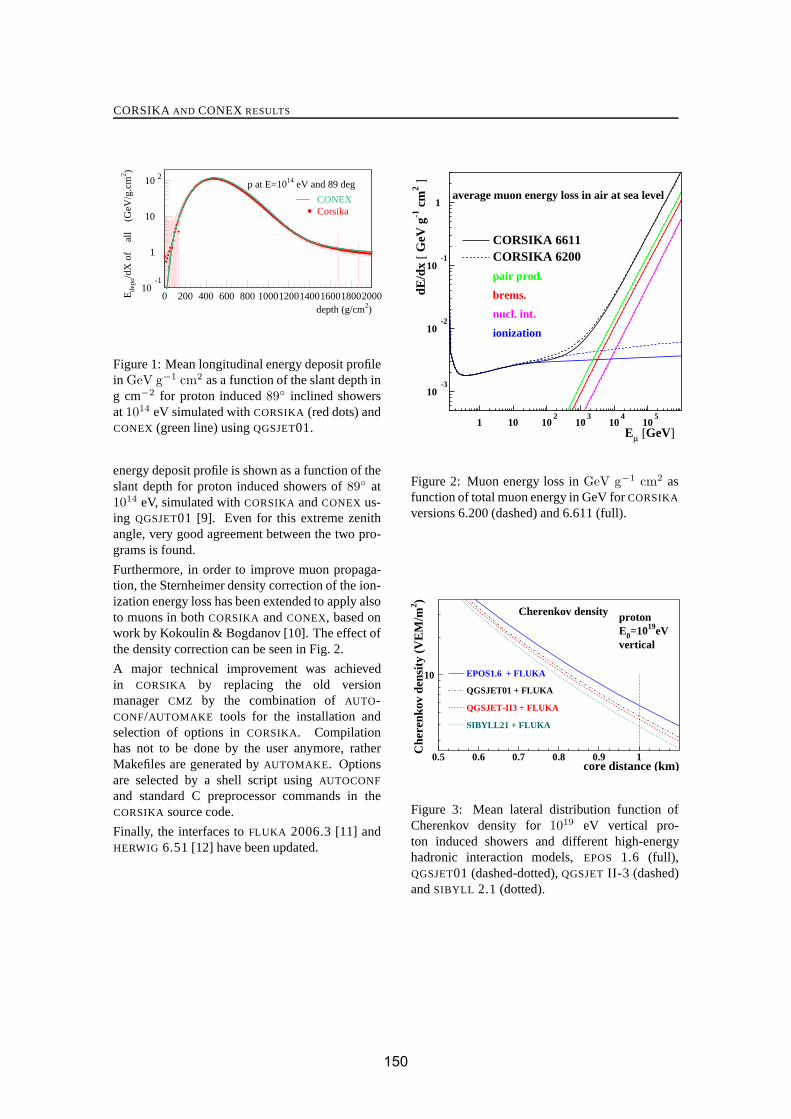
CORSIKA AND CONEX RESULTS
10-1
1
10
10 2
0 200 400 600 800 100012001400160018002000 depth (g/cm2)
Ede
po/d
X o
f
all
(G
eV/g
.cm
2 )
p at E=1014 eV and 89 deg
CONEXCorsika
Figure 1: Mean longitudinal energy deposit profilein GeV g−1 cm2 as a function of the slant depth ing cm−2 for proton induced 89◦ inclined showersat 1014 eV simulated with CORSIKA (red dots) andCONEX (green line) using QGSJET01.
energy deposit profile is shown as a function of theslant depth for proton induced showers of 89◦ at1014 eV, simulated with CORSIKA and CONEX us-ing QGSJET01 [9]. Even for this extreme zenithangle, very good agreement between the two pro-grams is found.
Furthermore, in order to improve muon propaga-tion, the Sternheimer density correction of the ion-ization energy loss has been extended to apply alsoto muons in both CORSIKA and CONEX, based onwork by Kokoulin & Bogdanov [10]. The effect ofthe density correction can be seen in Fig. 2.
A major technical improvement was achievedin CORSIKA by replacing the old versionmanager CMZ by the combination of AUTO-CONF/AUTOMAKE tools for the installation andselection of options in CORSIKA. Compilationhas not to be done by the user anymore, ratherMakefiles are generated by AUTOMAKE. Optionsare selected by a shell script using AUTOCONF
and standard C preprocessor commands in theCORSIKA source code.
Finally, the interfaces to FLUKA 2006.3 [11] andHERWIG 6.51 [12] have been updated.
10-3
10-2
10-1
1
1 10 102
103
104
105
Eμ [GeV] dE
/dx
[ GeV
g-1
cm
2]
pair prod.
brems.
nucl. int.
ionization
average muon energy loss in air at sea level
CORSIKA 6200CORSIKA 6611
Figure 2: Muon energy loss in GeV g−1 cm2 asfunction of total muon energy in GeV for CORSIKA
versions 6.200 (dashed) and 6.611 (full).
10
0.5 0.6 0.7 0.8 0.9 1core distance (km)
Che
renk
ov d
ensi
ty (
VE
M/m
2 )
EPOS1.6 + FLUKA
QGSJET01 + FLUKA
QGSJET-II3 + FLUKA
SIBYLL21 + FLUKA
protonE0=1019eVvertical
Cherenkov density
Figure 3: Mean lateral distribution function ofCherenkov density for 1019 eV vertical pro-ton induced showers and different high-energyhadronic interaction models, EPOS 1.6 (full),QGSJET01 (dashed-dotted), QGSJET II-3 (dashed)and SIBYLL 2.1 (dotted).
150
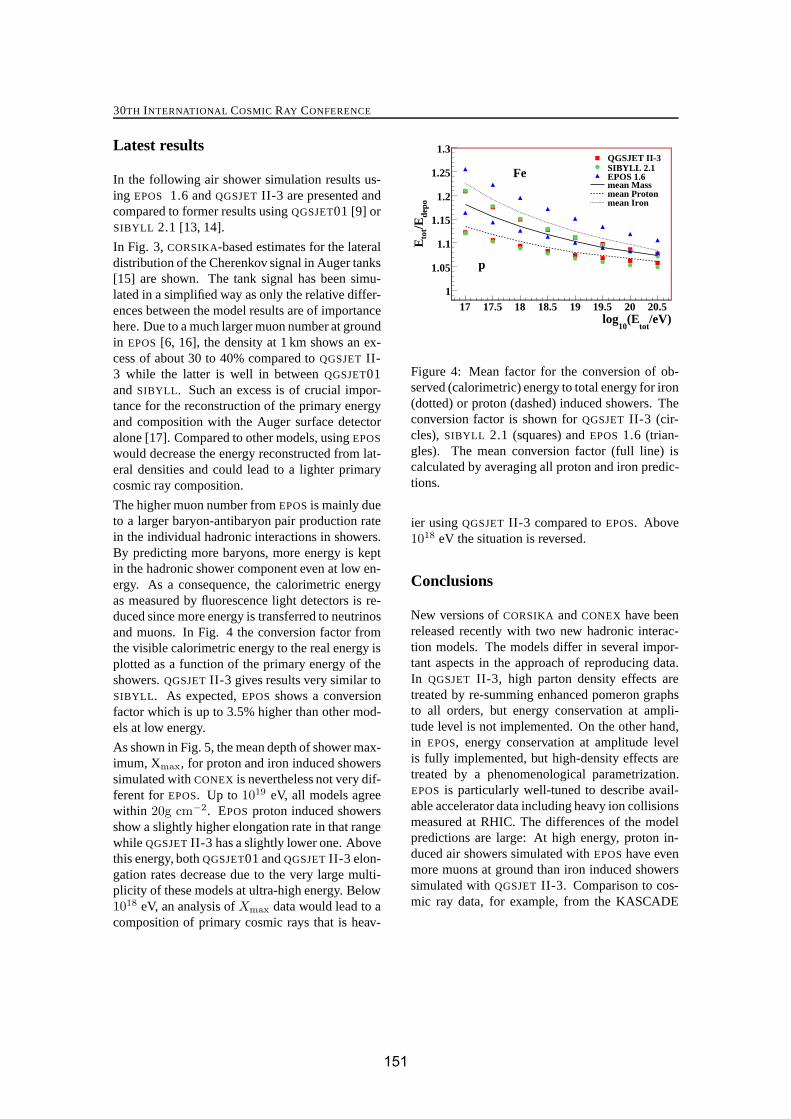
30TH INTERNATIONAL COSMIC RAY CONFERENCE
Latest results
In the following air shower simulation results us-ing EPOS 1.6 and QGSJET II-3 are presented andcompared to former results using QGSJET01 [9] orSIBYLL 2.1 [13, 14].
In Fig. 3, CORSIKA-based estimates for the lateraldistribution of the Cherenkov signal in Auger tanks[15] are shown. The tank signal has been simu-lated in a simplified way as only the relative differ-ences between the model results are of importancehere. Due to a much larger muon number at groundin EPOS [6, 16], the density at 1 km shows an ex-cess of about 30 to 40% compared to QGSJET II-3 while the latter is well in between QGSJET01and SIBYLL. Such an excess is of crucial impor-tance for the reconstruction of the primary energyand composition with the Auger surface detectoralone [17]. Compared to other models, using EPOS
would decrease the energy reconstructed from lat-eral densities and could lead to a lighter primarycosmic ray composition.
The higher muon number from EPOS is mainly dueto a larger baryon-antibaryon pair production ratein the individual hadronic interactions in showers.By predicting more baryons, more energy is keptin the hadronic shower component even at low en-ergy. As a consequence, the calorimetric energyas measured by fluorescence light detectors is re-duced since more energy is transferred to neutrinosand muons. In Fig. 4 the conversion factor fromthe visible calorimetric energy to the real energy isplotted as a function of the primary energy of theshowers. QGSJET II-3 gives results very similar toSIBYLL. As expected, EPOS shows a conversionfactor which is up to 3.5% higher than other mod-els at low energy.
As shown in Fig. 5, the mean depth of shower max-imum, Xmax, for proton and iron induced showerssimulated with CONEX is nevertheless not very dif-ferent for EPOS. Up to 1019 eV, all models agreewithin 20g cm−2. EPOS proton induced showersshow a slightly higher elongation rate in that rangewhile QGSJET II-3 has a slightly lower one. Abovethis energy, both QGSJET01 and QGSJET II-3 elon-gation rates decrease due to the very large multi-plicity of these models at ultra-high energy. Below1018 eV, an analysis of Xmax data would lead to acomposition of primary cosmic rays that is heav-
/eV)tot
(E10
log17 17.5 18 18.5 19 19.5 20 20.5
depo
/Eto
tE
1
1.05
1.1
1.15
1.2
1.25
1.3
p
FeQGSJET II-3SIBYLL 2.1EPOS 1.6mean Massmean Protonmean Iron
Figure 4: Mean factor for the conversion of ob-served (calorimetric) energy to total energy for iron(dotted) or proton (dashed) induced showers. Theconversion factor is shown for QGSJET II-3 (cir-cles), SIBYLL 2.1 (squares) and EPOS 1.6 (trian-gles). The mean conversion factor (full line) iscalculated by averaging all proton and iron predic-tions.
ier using QGSJET II-3 compared to EPOS. Above1018 eV the situation is reversed.
Conclusions
New versions of CORSIKA and CONEX have beenreleased recently with two new hadronic interac-tion models. The models differ in several impor-tant aspects in the approach of reproducing data.In QGSJET II-3, high parton density effects aretreated by re-summing enhanced pomeron graphsto all orders, but energy conservation at ampli-tude level is not implemented. On the other hand,in EPOS, energy conservation at amplitude levelis fully implemented, but high-density effects aretreated by a phenomenological parametrization.EPOS is particularly well-tuned to describe avail-able accelerator data including heavy ion collisionsmeasured at RHIC. The differences of the modelpredictions are large: At high energy, proton in-duced air showers simulated with EPOS have evenmore muons at ground than iron induced showerssimulated with QGSJET II-3. Comparison to cos-mic ray data, for example, from the KASCADE
151
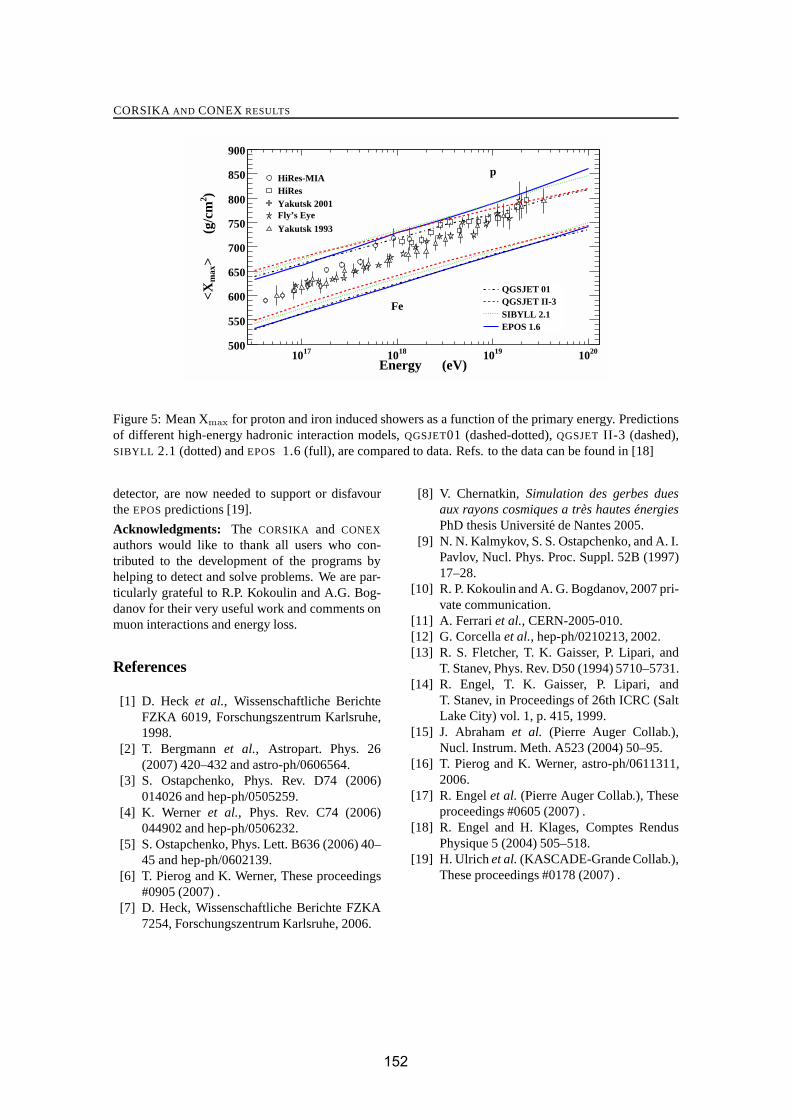
CORSIKA AND CONEX RESULTS
Energy (eV)1710 1810 1910 2010
)2>
(g/c
mm
ax<X
500
550
600
650
700
750
800
850
900
HiRes-MIAHiResYakutsk 2001Fly’s Eye
Yakutsk 1993
p
Fe
QGSJET 01QGSJET II-3SIBYLL 2.1EPOS 1.6
Figure 5: Mean Xmax for proton and iron induced showers as a function of the primary energy. Predictionsof different high-energy hadronic interaction models, QGSJET01 (dashed-dotted), QGSJET II-3 (dashed),SIBYLL 2.1 (dotted) and EPOS 1.6 (full), are compared to data. Refs. to the data can be found in [18]
detector, are now needed to support or disfavourthe EPOS predictions [19].
Acknowledgments: The CORSIKA and CONEX
authors would like to thank all users who con-tributed to the development of the programs byhelping to detect and solve problems. We are par-ticularly grateful to R.P. Kokoulin and A.G. Bog-danov for their very useful work and comments onmuon interactions and energy loss.
References
[1] D. Heck et al., Wissenschaftliche BerichteFZKA 6019, Forschungszentrum Karlsruhe,1998.
[2] T. Bergmann et al., Astropart. Phys. 26(2007) 420–432 and astro-ph/0606564.
[3] S. Ostapchenko, Phys. Rev. D74 (2006)014026 and hep-ph/0505259.
[4] K. Werner et al., Phys. Rev. C74 (2006)044902 and hep-ph/0506232.
[5] S. Ostapchenko, Phys. Lett. B636 (2006) 40–45 and hep-ph/0602139.
[6] T. Pierog and K. Werner, These proceedings#0905 (2007) .
[7] D. Heck, Wissenschaftliche Berichte FZKA7254, Forschungszentrum Karlsruhe, 2006.
[8] V. Chernatkin, Simulation des gerbes duesaux rayons cosmiques a tres hautes energiesPhD thesis Universite de Nantes 2005.
[9] N. N. Kalmykov, S. S. Ostapchenko, and A. I.Pavlov, Nucl. Phys. Proc. Suppl. 52B (1997)17–28.
[10] R. P. Kokoulin and A. G. Bogdanov, 2007 pri-vate communication.
[11] A. Ferrari et al., CERN-2005-010.[12] G. Corcella et al., hep-ph/0210213, 2002.[13] R. S. Fletcher, T. K. Gaisser, P. Lipari, and
T. Stanev, Phys. Rev. D50 (1994) 5710–5731.[14] R. Engel, T. K. Gaisser, P. Lipari, and
T. Stanev, in Proceedings of 26th ICRC (SaltLake City) vol. 1, p. 415, 1999.
[15] J. Abraham et al. (Pierre Auger Collab.),Nucl. Instrum. Meth. A523 (2004) 50–95.
[16] T. Pierog and K. Werner, astro-ph/0611311,2006.
[17] R. Engel et al. (Pierre Auger Collab.), Theseproceedings #0605 (2007) .
[18] R. Engel and H. Klages, Comptes RendusPhysique 5 (2004) 505–518.
[19] H. Ulrich et al. (KASCADE-Grande Collab.),These proceedings #0178 (2007) .
152
30TH INTERNATIONAL COSMIC RAY CONFERENCE
The Hadronic Interaction Model EPOS and Air Shower Simulations: New Resultson Muon Production
T. PIEROG1 AND K. WERNER2 .1 Forschungszentrum Karlsruhe, Institut fur Kernphysik, Karlsruhe, Germany2 SUBATECH, University of Nantes – IN2P3/CNRS– EMN, Nantes, [email protected]
Abstract: Since about one decade, air shower simulations based on the hadronic interaction modelsQGSJET and SIBYLL predict very similar results for the main observables. For instance, the mean depthof the shower maximum Xmax agrees within 5% between the different models and are in relative goodagreement with the measurements. However the number of muons at ground differs substantially betweenthese 2 models and the data. Recently a new hadronic interaction model EPOS has been introducedin air shower simulation programs. This model has originally been used to analyse hadron-hadron aswell as heavy ion physics at RHIC and SPS energies, and it gives very interesting results in air showersimulations: we find for example a large increase in the number of muons at ground as compared to theformer models. Results will be discussed in detail, in particular the role of the baryons and anti-baryonsin the air shower development.
Introduction
Air shower simulations are a very powerful toolto interpret ground based cosmic ray experiments.However, most simulations are still based onhadronic interaction models being more than 10years old. Much has been learned since, in par-ticular due to new data available from the SPS andRHIC accelerators.
In this paper, we discuss air shower simulationsbased on EPOS, the latter one being a hadronic in-teraction model, which does very well compared toRHIC data [3, 1], and also all other available datafrom high energy particle physic experiments (ISR,CDF and especially SPS experiments at CERN).
EPOS is a consistent quantum mechanical mul-tiple scattering approach based on partons andstrings [6], where cross sections and the particleproduction are calculated consistently, taking intoaccount energy conservation in both cases (un-like other models where energy conservation is notconsidered for cross section calculations [9]). Aspecial feature is the explicit treatment of projec-tile and target remnants, leading to a very good de-scription of baryon and antibaryon production as
measured in proton-proton collisions at 158 GeVat CERN [10]. Nuclear effects related to Cronintransverse momentum broadening, parton satu-ration, and screening have been introduced intoEPOS [16]. Furthermore, high density effects lead-ing to collective behavior in heavy ion collisionsare also taken into account [15].
EPOS Basics
One may consider the simple parton model to bethe basis of high energy hadron-hadron interac-tion models, which can be seen as an exchangeof a “parton ladder” between the two hadrons. InEPOS, the term “parton ladder” is actually meantto contain two parts [6]: the hard one, as dis-cussed above, and a soft one, which is a purelyphenomenological object, parameterized in Reggepole fashion.
In additions to the parton ladder, there is anothersource of particle production: the two off-shellremnants, see fig. 1. We showed in ref. [10]that this “three object picture” can solve the “multi-strange baryon problem” of conventional high en-ergy models, see ref. [5].
153
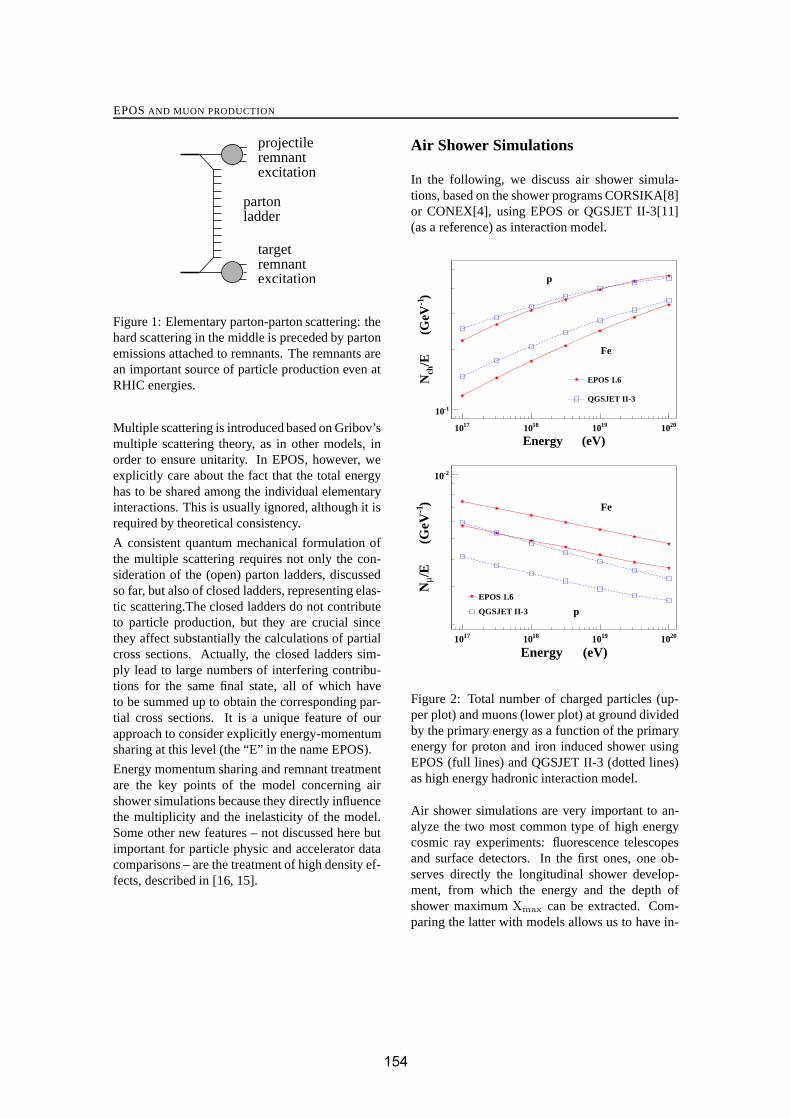
EPOS AND MUON PRODUCTION
remnantprojectile
excitation
targetremnantexcitation
partonladder
Figure 1: Elementary parton-parton scattering: thehard scattering in the middle is preceded by partonemissions attached to remnants. The remnants arean important source of particle production even atRHIC energies.
Multiple scattering is introduced based on Gribov’smultiple scattering theory, as in other models, inorder to ensure unitarity. In EPOS, however, weexplicitly care about the fact that the total energyhas to be shared among the individual elementaryinteractions. This is usually ignored, although it isrequired by theoretical consistency.
A consistent quantum mechanical formulation ofthe multiple scattering requires not only the con-sideration of the (open) parton ladders, discussedso far, but also of closed ladders, representing elas-tic scattering.The closed ladders do not contributeto particle production, but they are crucial sincethey affect substantially the calculations of partialcross sections. Actually, the closed ladders sim-ply lead to large numbers of interfering contribu-tions for the same final state, all of which haveto be summed up to obtain the corresponding par-tial cross sections. It is a unique feature of ourapproach to consider explicitly energy-momentumsharing at this level (the “E” in the name EPOS).
Energy momentum sharing and remnant treatmentare the key points of the model concerning airshower simulations because they directly influencethe multiplicity and the inelasticity of the model.Some other new features – not discussed here butimportant for particle physic and accelerator datacomparisons – are the treatment of high density ef-fects, described in [16, 15].
Air Shower Simulations
In the following, we discuss air shower simula-tions, based on the shower programs CORSIKA[8]or CONEX[4], using EPOS or QGSJET II-3[11](as a reference) as interaction model.
Energy (eV)1710 1810 1910 2010
)-1
/E
(G
eVch
N-110
p
Fe
EPOS 1.6
QGSJET II-3
Energy (eV)1710 1810 1910 2010
)-1
/E
(G
eVμ
N
-210
p
Fe
EPOS 1.6
QGSJET II-3
Figure 2: Total number of charged particles (up-per plot) and muons (lower plot) at ground dividedby the primary energy as a function of the primaryenergy for proton and iron induced shower usingEPOS (full lines) and QGSJET II-3 (dotted lines)as high energy hadronic interaction model.
Air shower simulations are very important to an-alyze the two most common type of high energycosmic ray experiments: fluorescence telescopesand surface detectors. In the first ones, one ob-serves directly the longitudinal shower develop-ment, from which the energy and the depth ofshower maximum Xmax can be extracted. Com-paring the latter with models allows us to have in-
154
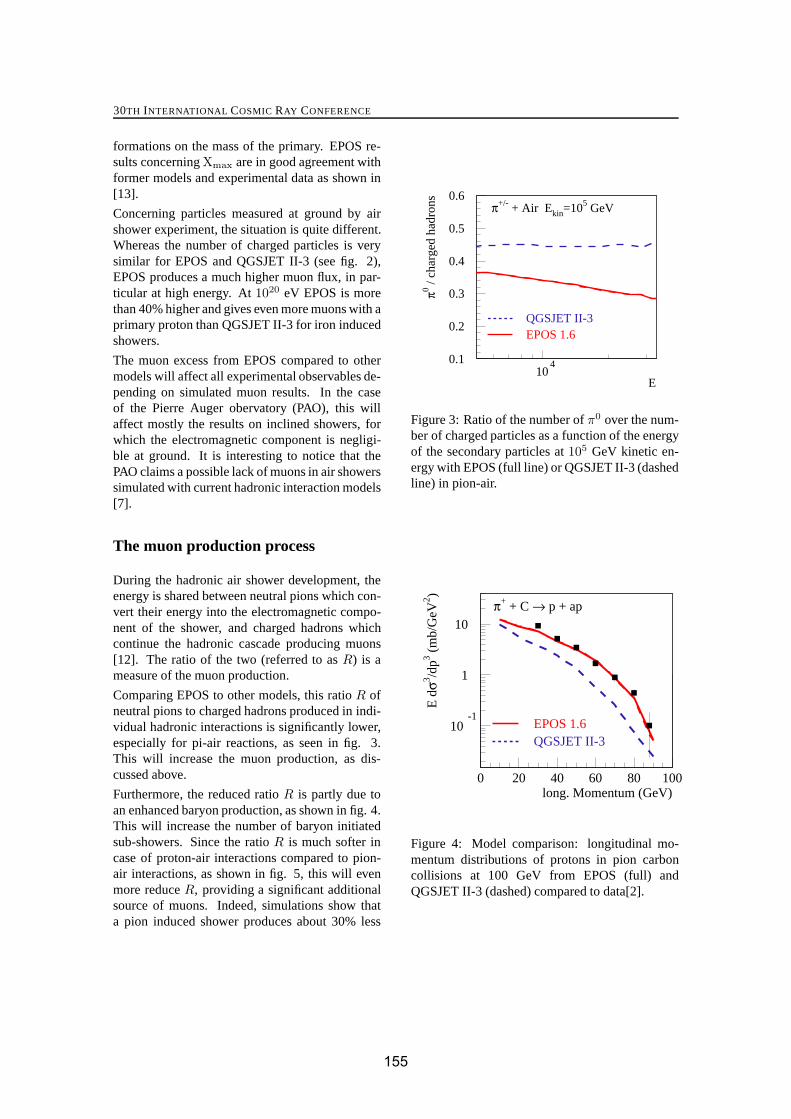
30TH INTERNATIONAL COSMIC RAY CONFERENCE
formations on the mass of the primary. EPOS re-sults concerning Xmax are in good agreement withformer models and experimental data as shown in[13].
Concerning particles measured at ground by airshower experiment, the situation is quite different.Whereas the number of charged particles is verysimilar for EPOS and QGSJET II-3 (see fig. 2),EPOS produces a much higher muon flux, in par-ticular at high energy. At 1020 eV EPOS is morethan 40% higher and gives even more muons with aprimary proton than QGSJET II-3 for iron inducedshowers.
The muon excess from EPOS compared to othermodels will affect all experimental observables de-pending on simulated muon results. In the caseof the Pierre Auger obervatory (PAO), this willaffect mostly the results on inclined showers, forwhich the electromagnetic component is negligi-ble at ground. It is interesting to notice that thePAO claims a possible lack of muons in air showerssimulated with current hadronic interaction models[7].
The muon production process
During the hadronic air shower development, theenergy is shared between neutral pions which con-vert their energy into the electromagnetic compo-nent of the shower, and charged hadrons whichcontinue the hadronic cascade producing muons[12]. The ratio of the two (referred to as R) is ameasure of the muon production.
Comparing EPOS to other models, this ratio R ofneutral pions to charged hadrons produced in indi-vidual hadronic interactions is significantly lower,especially for pi-air reactions, as seen in fig. 3.This will increase the muon production, as dis-cussed above.
Furthermore, the reduced ratio R is partly due toan enhanced baryon production, as shown in fig. 4.This will increase the number of baryon initiatedsub-showers. Since the ratio R is much softer incase of proton-air interactions compared to pion-air interactions, as shown in fig. 5, this will evenmore reduce R, providing a significant additionalsource of muons. Indeed, simulations show thata pion induced shower produces about 30% less
0.1
0.2
0.3
0.4
0.5
0.6
104
E
π0 / ch
arge
d ha
dron
s
π+/- + Air Ekin=105 GeV
QGSJET II-3EPOS 1.6
Figure 3: Ratio of the number of π0 over the num-ber of charged particles as a function of the energyof the secondary particles at 105 GeV kinetic en-ergy with EPOS (full line) or QGSJET II-3 (dashedline) in pion-air.
10-1
1
10
0 20 40 60 80 100 long. Momentum (GeV)
E d
σ3 /dp3 (
mb/
GeV
2 )
π+ + C → p + ap
EPOS 1.6QGSJET II-3
Figure 4: Model comparison: longitudinal mo-mentum distributions of protons in pion carboncollisions at 100 GeV from EPOS (full) andQGSJET II-3 (dashed) compared to data[2].
155

EPOS AND MUON PRODUCTION
0.1
0.2
0.3
0.4
0.5
104
E
π0 / ch
arge
d ha
dron
s
EPOS Ekin=105 GeV
π+/- + Airp + Air
Figure 5: Ratio of the number of π0 over the num-ber of charged particles as a function of the energyof the secondary particles at 105 GeV kinetic en-ergy in proton-air (full line) or pion-air (dashedline) for EPOS.
muons than a proton induced shower. This featureof the air shower development is in fact model in-dependent and can easily be understood because ofthe leading particle effect [14].
Summary
EPOS is a new interaction model constructed on asolid theoretical basis. It has been tested very care-fully against all existing hadron-hadron and hadronnucleus data, also those usually not considered im-portant for cosmic rays. In air shower simula-tions, EPOS provides more muons than other mod-els, which was found to be linked to an increasedbaryon production.
Acknowledgments
The authors would like to thanks Ralph Engel, Di-eter Heck and Sergej Ostapchenko for fruitful dis-cussions.
References
[1] B. I. Abelev et al. Strange particle produc-tion in p + p collisions at s**(1/2) = 200-gev.nucl-ex/0607033, 2006.
[2] D. S. Barton et al. Experimental study of thea-dependence of inclusive hadron fragmenta-tion. Phys. Rev., D27:2580, 1983.
[3] R. Bellwied. Strange particle productionmechanisms in proton proton collisions atrhic. Acta Phys. Hung., A27:201–204, 2006.
[4] T. Bergmann et al. One-dimensional hybridapproach to extensive air shower simulation.Astropart. Phys., 26:420–432, 2007.
[5] M. Bleicher et al. Overpopulation of anti-omega in p p collisions: A way to distinguishstatistical hadronization from string dynam-ics. Phys. Rev. Lett., 88:202501, 2002.
[6] H. J. Drescher et al. Parton-based gribov-regge theory. Phys. Rept., 350:93–289, 2001.
[7] R. Engel et al. Test of hadronic interactionmodels with data from the pierre auger ob-servatory. These proceedings, #0605, 2007.
[8] D. Heck et al. Corsika: A monte carlo code tosimulate extensive air showers. FZKA-6019,1998.
[9] M. Hladik et al. Self-consistency requirementin high-energy nuclear scattering. Phys. Rev.Lett., 86:3506–3509, 2001.
[10] F. M. Liu et al. Constraints on models forproton-proton scattering from multistrangebaryon data. Phys. Rev., D67:034011, 2003.
[11] S. Ostapchenko. Non-linear screening effectsin high energy hadronic interactions. Phys.Rev., D74:014026, 2006.
[12] T. Pierog et al. Impact of uncertainties inhadron production on air-shower predictions.Czech. J. Phys., 56:A161–A172, 2006.
[13] T. Pierog et al. Latest results of airshower simulation programs corsika andconex. These proceedings, #0899, 2007.
[14] T. Pierog and K. Werner. astro-ph/0611311.[15] K. Werner. Core-corona separation in ultra-
relativistic heavy ion collisions. Phys. Rev.Lett., 98:152301, 2007.
[16] K. Werner et al. Parton ladder splitting andthe rapidity dependence of transverse mo-mentum spectra in deuteron gold collisions atrhic. Phys. Rev., C74:044902, 2006.
156
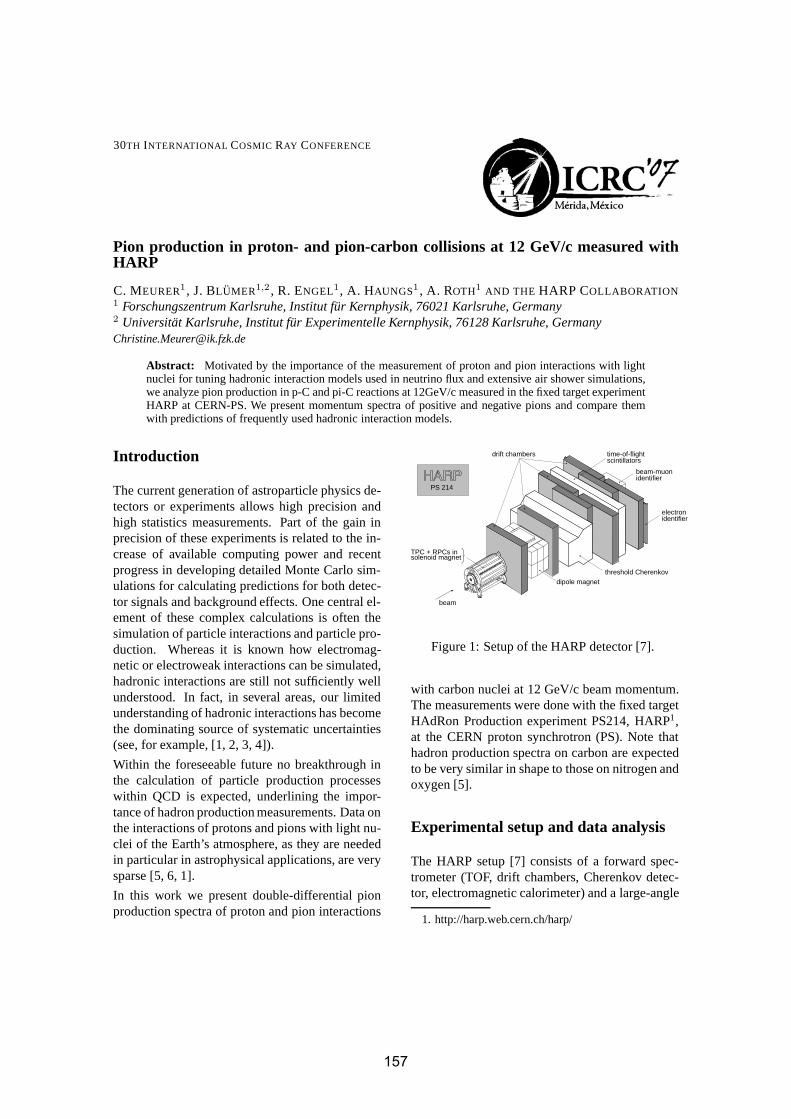
30TH INTERNATIONAL COSMIC RAY CONFERENCE
Pion production in proton- and pion-carbon collisions at 12 GeV/c measured withHARP
C. MEURER1, J. BLUMER1,2 , R. ENGEL1, A. HAUNGS1 , A. ROTH1 AND THE HARP COLLABORATION1 Forschungszentrum Karlsruhe, Institut fur Kernphysik, 76021 Karlsruhe, Germany2 Universitat Karlsruhe, Institut fur Experimentelle Kernphysik, 76128 Karlsruhe, [email protected]
Abstract: Motivated by the importance of the measurement of proton and pion interactions with lightnuclei for tuning hadronic interaction models used in neutrino flux and extensive air shower simulations,we analyze pion production in p-C and pi-C reactions at 12GeV/c measured in the fixed target experimentHARP at CERN-PS. We present momentum spectra of positive and negative pions and compare themwith predictions of frequently used hadronic interaction models.
Introduction
The current generation of astroparticle physics de-tectors or experiments allows high precision andhigh statistics measurements. Part of the gain inprecision of these experiments is related to the in-crease of available computing power and recentprogress in developing detailed Monte Carlo sim-ulations for calculating predictions for both detec-tor signals and background effects. One central el-ement of these complex calculations is often thesimulation of particle interactions and particle pro-duction. Whereas it is known how electromag-netic or electroweak interactions can be simulated,hadronic interactions are still not sufficiently wellunderstood. In fact, in several areas, our limitedunderstanding of hadronic interactions has becomethe dominating source of systematic uncertainties(see, for example, [1, 2, 3, 4]).
Within the foreseeable future no breakthrough inthe calculation of particle production processeswithin QCD is expected, underlining the impor-tance of hadron production measurements. Data onthe interactions of protons and pions with light nu-clei of the Earth’s atmosphere, as they are neededin particular in astrophysical applications, are verysparse [5, 6, 1].
In this work we present double-differential pionproduction spectra of proton and pion interactions
drift chambers
PS 214
time-of-flightscintillators
beam-muonidentifier
electronidentifier
threshold Cherenkovdipole magnet
beam
TPC + RPCs insolenoid magnet
Figure 1: Setup of the HARP detector [7].
with carbon nuclei at 12 GeV/c beam momentum.The measurements were done with the fixed targetHAdRon Production experiment PS214, HARP1,at the CERN proton synchrotron (PS). Note thathadron production spectra on carbon are expectedto be very similar in shape to those on nitrogen andoxygen [5].
Experimental setup and data analysis
The HARP setup [7] consists of a forward spec-trometer (TOF, drift chambers, Cherenkov detec-tor, electromagnetic calorimeter) and a large-angle
1. http://harp.web.cern.ch/harp/
157

PION PRODUCTION MEASURED WITH HARP
p (MeV/c)0 2000 4000 6000 8000
) (m
b/(
GeV
/c s
r))
Ω/(
dp
dπ
σ2d
0
100
200
300
400 = 0.03-0.06 radθ
p (MeV/c)0 2000 4000 6000 8000
) (m
b/(
GeV
/c s
r))
Ω/(
dp
dπ
σ2d
0
100
200
300
400 = 0.06-0.09 radθ
p (MeV/c)0 2000 4000 6000 8000
) (m
b/(
GeV
/c s
r))
Ω/(
dp
dπ
σ2d
0
100
200
300
400 = 0.09-0.12 radθ
p (MeV/c)0 2000 4000 6000 8000
) (m
b/(
GeV
/c s
r))
Ω/(
dp
dπ
σ2d
0
100
200
300
400 = 0.12-0.15 radθ
p (MeV/c)0 2000 4000 6000 8000
) (m
b/(
GeV
/c s
r))
Ω/(
dp
dπ
σ2d
0
100
200
300
400 = 0.15-0.18 radθ
p (MeV/c)0 2000 4000 6000 8000
) (m
b/(
GeV
/c s
r))
Ω/(
dp
dπ
σ2d
0
100
200
300
400 = 0.18-0.21 radθ
p (MeV/c)0 2000 4000 6000 8000
) (m
b/(
GeV
/c s
r))
Ω/(
dp
dπ
σ2d
0
100
200
300
400 = 0.21-0.24 radθ
+X+π→p+C(@12GeV/c)
HARP
DPMJET-III
GHEISHA
UrQMD
Figure 2: Inclusive production cross section of π+
in p-C interactions at 12 GeV/c. The predictions ofthe models DPMJET III [10, 11], GHEISHA [12],and UrQMD [13] are also shown.
detection system (TPC), see Fig. 1. The forwardspectrometer is built around a dipole magnet withan integral field of 0.66 Tm for momentum recon-struction. The forward detector system covers an-gles up to 250 mrad and is ideally suited for mini-mum bias particle production measurements. It isemployed in the analysis presented here.
A detailed description of the event selection andtrack reconstruction of the carbon data set can befound in [8]. In the following only a brief overviewis given. Particle identification is discussed in [9].
The pion and proton data sets were taken in twoshort runs in June and September 2002. More thanone million triggers with positive beam and half amillion triggers with negative beam were collected.In addition about 900k empty target events wererecorded to correct for background interactions. A
p (MeV/c)0 2000 4000 6000 8000
) (m
b/(
GeV
/c s
r))
Ω/(
dp
dπ
σ2d
0
100
200
300
400 = 0.03-0.06 radθ
p (MeV/c)0 2000 4000 6000 8000
) (m
b/(
GeV
/c s
r))
Ω/(
dp
dπ
σ2d
0
100
200
300
400 = 0.06-0.09 radθ
p (MeV/c)0 2000 4000 6000 8000
) (m
b/(
GeV
/c s
r))
Ω/(
dp
dπ
σ2d
0
100
200
300
400 = 0.09-0.12 radθ
p (MeV/c)0 2000 4000 6000 8000
) (m
b/(
GeV
/c s
r))
Ω/(
dp
dπ
σ2d
0
100
200
300
400 = 0.12-0.15 radθ
p (MeV/c)0 2000 4000 6000 8000
) (m
b/(
GeV
/c s
r))
Ω/(
dp
dπ
σ2d
0
100
200
300
400 = 0.15-0.18 radθ
p (MeV/c)0 2000 4000 6000 8000
) (m
b/(
GeV
/c s
r))
Ω/(
dp
dπ
σ2d
0
100
200
300
400 = 0.18-0.21 radθ
p (MeV/c)0 2000 4000 6000 8000
) (m
b/(
GeV
/c s
r))
Ω/(
dp
dπ
σ2d
0
100
200
300
400 = 0.21-0.24 radθ
+X-π→p+C(@12GeV/c)
HARP
DPMJET-III
GHEISHA
UrQMD
Figure 3: Inclusive production cross section of π−
in p-C interactions at 12 GeV/c. The predictions ofthe models DPMJET III [10, 11], GHEISHA [12],and UrQMD [13] are also shown.
thin carbon target of thickness of 5% of an interac-tion length was used. Events were selected accord-ing to the detected beam particle and beam posi-tion. After quality cuts about 460k p-C and 350kπ−-C events were left for analysis.
To ensure high quality track reconstruction, sec-ondary particle tracks were selected only in the de-tector hemisphere in which the magnetic field ofthe dipole would bent the particle trajectory to-wards the beam axis. A matched hit in the TOFwall and several hits in the drift chamber sys-tem were required. About 100k secondary parti-cle tracks in p-C and a similar number of tracks inπ−-C interactions passed the selection cuts.
The measured particle spectra were corrected fordetector acceptance and reconstruction resolutioneffects using the Bayesian unfolding technique of
158

30TH INTERNATIONAL COSMIC RAY CONFERENCE
D’Agostini [14]. The detector acceptance and res-olution is calculated by reconstructing a set ofsingle track Monte Carlo simulations based onGEANT4 [15]. All relevant processes such as en-ergy loss, absorption and re-interaction are consid-ered. Empty target subtraction and a correction forkaons being misidentified as pions is applied.
Results
The double-differential pion production cross sec-tions in proton-carbon interactions are shown inFigs. 2 and 3. The leading particle effect is clearlyseen for positively charged pions.
The error bars indicate statistical and systematic er-rors added in quadrature. The size of both errorsis of the same order and varies from 4% to 14%depending on the secondary particle momentum.Only for the highest momenta the statistical errorclearly dominates and reaches more than 20%. Thedominant sources of systematic uncertainty are thesubtraction of tertiary interactions and the overallmomentum scale.
The data are compared with predictions of themodels DPMJET III [10, 11], GHEISHA [12], andUrQMD [13]. There is no obvious trend of onemodel giving a much better description of the datasets than the others. For example, the DPMJETpredictions give a good description of the π+ spec-tra but clear discrepancies are seen for π− crosssections. The situation is similar for the other mod-els.
In Fig. 4 we show the pion production cross sec-tions for π−-carbon interactions. These cross sec-tions are particularly valuable for estimating ter-tiary interactions and give also a low-energy an-chor point for tuning models used in air showersimulations. Again the error bars indicate both thesystematic and statistical errors. A comparison ofthis data set with model predictions is in prepara-tion.
Finally it should be mentioned that the analysisof pion production in proton-nitrogen and proton-oxygen interactions at 12 GeV/c is in progress.First results will be shown at the conference.
References
[1] T. K. Gaisser and M. Honda, Ann. Rev.Nucl. Part. Sci. 52 (2002) 153–199 and hep-ph/0203272.
[2] T. Antoni et al. (KASCADE Collab.), As-tropart. Phys. 24 (2005) 1–25 and astro-ph/0505413.
[3] T. Abu-Zayyad et al. (HiRes-MIA Collab.),Phys. Rev. Lett. 84 (2000) 4276 and astro-ph/9911144.
[4] A. A. Watson, Nucl. Phys. Proc. Suppl. 151(2006) 83–91 and astro-ph/0410514.
[5] C. Meurer, J. Blumer, R. Engel, A. Haungs,and M. Roth, Czech. J. Phys. 56 (2006) A211and astro-ph/0512536.
[6] R. Engel, T. K. Gaisser, and T. Stanev,Phys. Lett. B472 (2000) 113–118 and hep-ph/9911394.
[7] M. G. Catanesi et al. (HARP Collab.), Nucl.Instrum. Meth. A571 (2007) 527–561.
[8] C. Meurer, PhD thesis, Universitat Karlsruhe,2007.
[9] M. G. Catanesi et al., Nucl. Instrum. Meth.A572 (2007) 899–921.
[10] S. Roesler, R. Engel, and J. Ranft, in Proc.of Int. Conf. on Advanced Monte Carlo forRadiation Physics, Particle Transport Sim-ulation and Applications (MC 2000), Lis-bon, Portugal, 23-26 Oct 2000, A. Kling, F.Barao, M. Nakagawa, L. Tavora, P. Vaz eds.,Springer-Verlag Berlin, p. 1033-1038 (2001),2000.
[11] S. Roesler, R. Engel, and J. Ranft, Preparedfor 27th International Cosmic Ray Confer-ence (ICRC 2001), Hamburg, Germany, 7-15Aug 2001, p. 439.
[12] H. Fesefeldt, preprint PITHA-85/02, RWTHAachen, 1985.
[13] M. Bleicher et al., J. Phys. G: Nucl. Part.Phys. 25 (1999) 1859.
[14] G. D’Agostini, Nucl. Instrum. Meth. A362(1995) 487–498.
[15] S. Agostinelli et al. (GEANT4 Collab.), Nucl.Instrum. Meth. A506 (2003) 250–303.
159
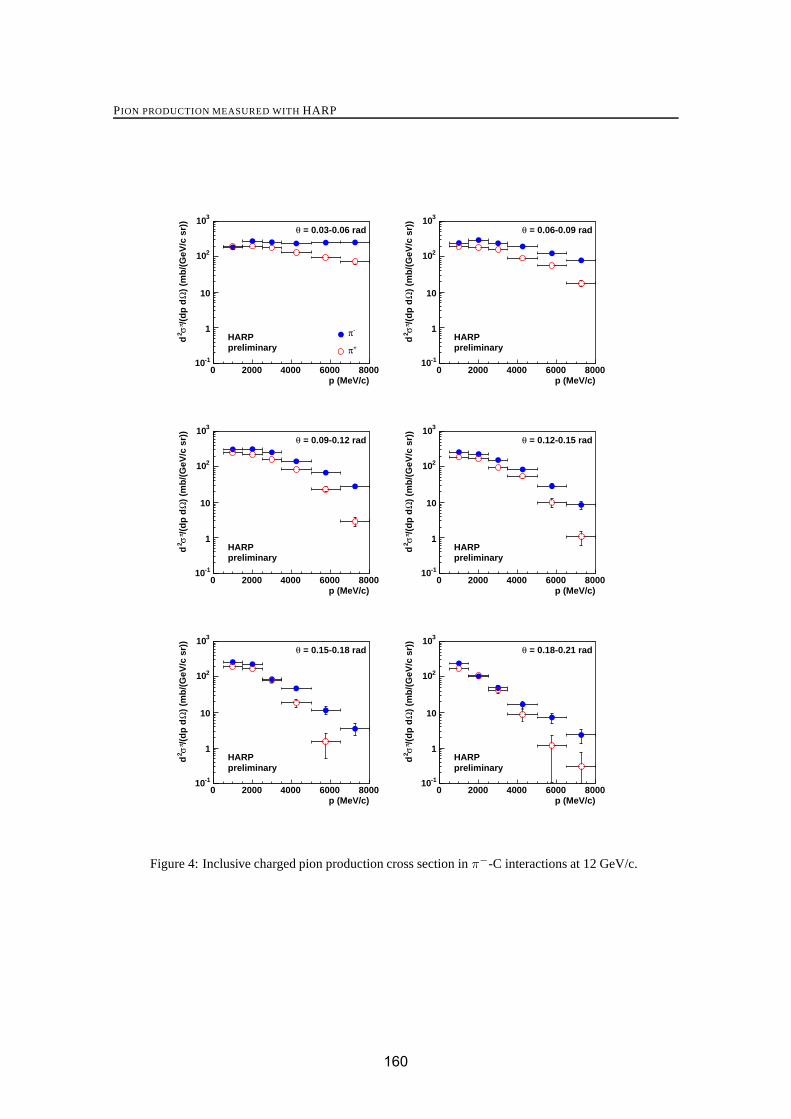
PION PRODUCTION MEASURED WITH HARP
p (MeV/c)0 2000 4000 6000 8000
) (m
b/(
GeV
/c s
r))
Ω/(
dp
dπ
σ2d
-110
1
10
210
310
-π+π
= 0.03-0.06 radθ
HARPpreliminary
p (MeV/c)0 2000 4000 6000 8000
) (m
b/(
GeV
/c s
r))
Ω/(
dp
dπ
σ2d
-110
1
10
210
310 = 0.06-0.09 radθ
HARPpreliminary
p (MeV/c)0 2000 4000 6000 8000
) (m
b/(
GeV
/c s
r))
Ω/(
dp
dπ
σ2d
-110
1
10
210
310 = 0.09-0.12 radθ
HARPpreliminary
p (MeV/c)0 2000 4000 6000 8000
) (m
b/(
GeV
/c s
r))
Ω/(
dp
dπ
σ2d
-110
1
10
210
310 = 0.12-0.15 radθ
HARPpreliminary
p (MeV/c)0 2000 4000 6000 8000
) (m
b/(
GeV
/c s
r))
Ω/(
dp
dπ
σ2d
-110
1
10
210
310 = 0.15-0.18 radθ
HARPpreliminary
p (MeV/c)0 2000 4000 6000 8000
) (m
b/(
GeV
/c s
r))
Ω/(
dp
dπ
σ2d
-110
1
10
210
310 = 0.18-0.21 radθ
HARPpreliminary
Figure 4: Inclusive charged pion production cross section in π−-C interactions at 12 GeV/c.
160
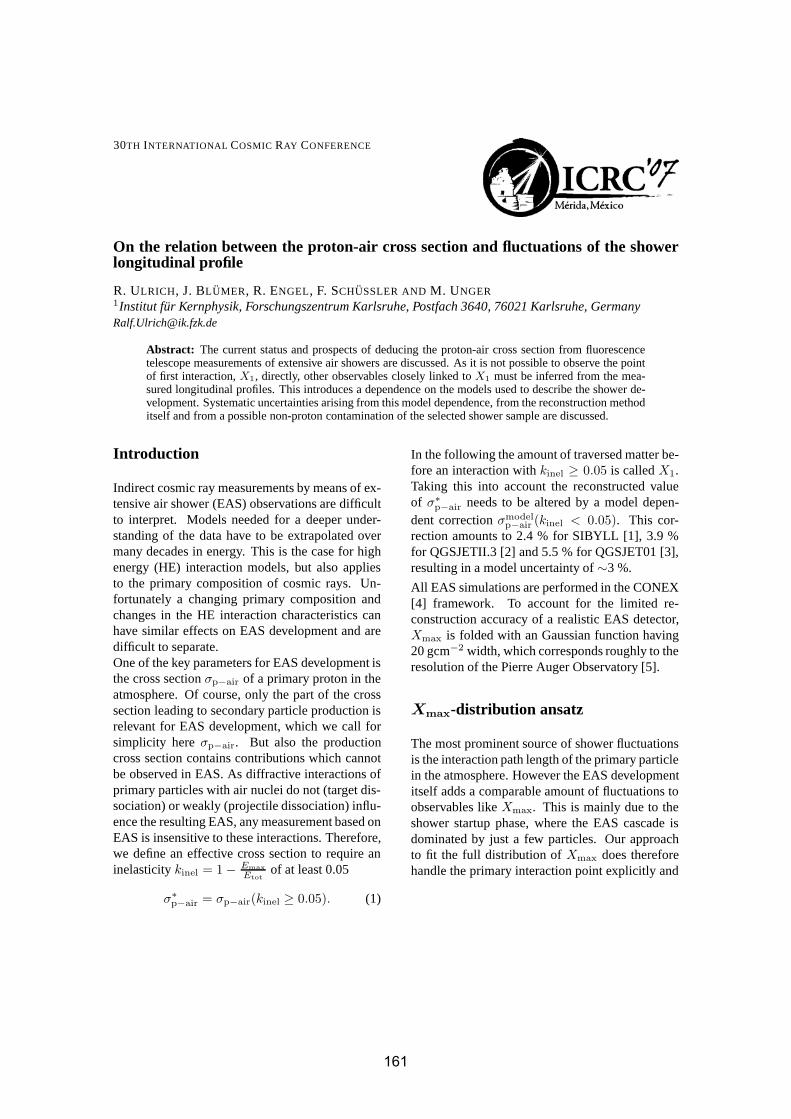
30TH INTERNATIONAL COSMIC RAY CONFERENCE
On the relation between the proton-air cross section and fluctuations of the showerlongitudinal profile
R. ULRICH, J. BLUMER, R. ENGEL, F. SCHUSSLER AND M. UNGER1Institut fur Kernphysik, Forschungszentrum Karlsruhe, Postfach 3640, 76021 Karlsruhe, [email protected]
Abstract: The current status and prospects of deducing the proton-air cross section from fluorescencetelescope measurements of extensive air showers are discussed. As it is not possible to observe the pointof first interaction, X1, directly, other observables closely linked to X1 must be inferred from the mea-sured longitudinal profiles. This introduces a dependence on the models used to describe the shower de-velopment. Systematic uncertainties arising from this model dependence, from the reconstruction methoditself and from a possible non-proton contamination of the selected shower sample are discussed.
Introduction
Indirect cosmic ray measurements by means of ex-tensive air shower (EAS) observations are difficultto interpret. Models needed for a deeper under-standing of the data have to be extrapolated overmany decades in energy. This is the case for highenergy (HE) interaction models, but also appliesto the primary composition of cosmic rays. Un-fortunately a changing primary composition andchanges in the HE interaction characteristics canhave similar effects on EAS development and aredifficult to separate.One of the key parameters for EAS development isthe cross section σp−air of a primary proton in theatmosphere. Of course, only the part of the crosssection leading to secondary particle production isrelevant for EAS development, which we call forsimplicity here σp−air. But also the productioncross section contains contributions which cannotbe observed in EAS. As diffractive interactions ofprimary particles with air nuclei do not (target dis-sociation) or weakly (projectile dissociation) influ-ence the resulting EAS, any measurement based onEAS is insensitive to these interactions. Therefore,we define an effective cross section to require aninelasticity kinel = 1 − Emax
Etot
of at least 0.05
σ∗p−air = σp−air(kinel ≥ 0.05). (1)
In the following the amount of traversed matter be-fore an interaction with kinel ≥ 0.05 is called X1.Taking this into account the reconstructed valueof σ∗
p−air needs to be altered by a model depen-dent correction σmodel
p−air (kinel < 0.05). This cor-rection amounts to 2.4 % for SIBYLL [1], 3.9 %for QGSJETII.3 [2] and 5.5 % for QGSJET01 [3],resulting in a model uncertainty of ∼3 %.
All EAS simulations are performed in the CONEX[4] framework. To account for the limited re-construction accuracy of a realistic EAS detector,Xmax is folded with an Gaussian function having20 gcm−2 width, which corresponds roughly to theresolution of the Pierre Auger Observatory [5].
Xmax-distribution ansatz
The most prominent source of shower fluctuationsis the interaction path length of the primary particlein the atmosphere. However the EAS developmentitself adds a comparable amount of fluctuations toobservables like Xmax. This is mainly due to theshower startup phase, where the EAS cascade isdominated by just a few particles. Our approachto fit the full distribution of Xmax does thereforehandle the primary interaction point explicitly and
161
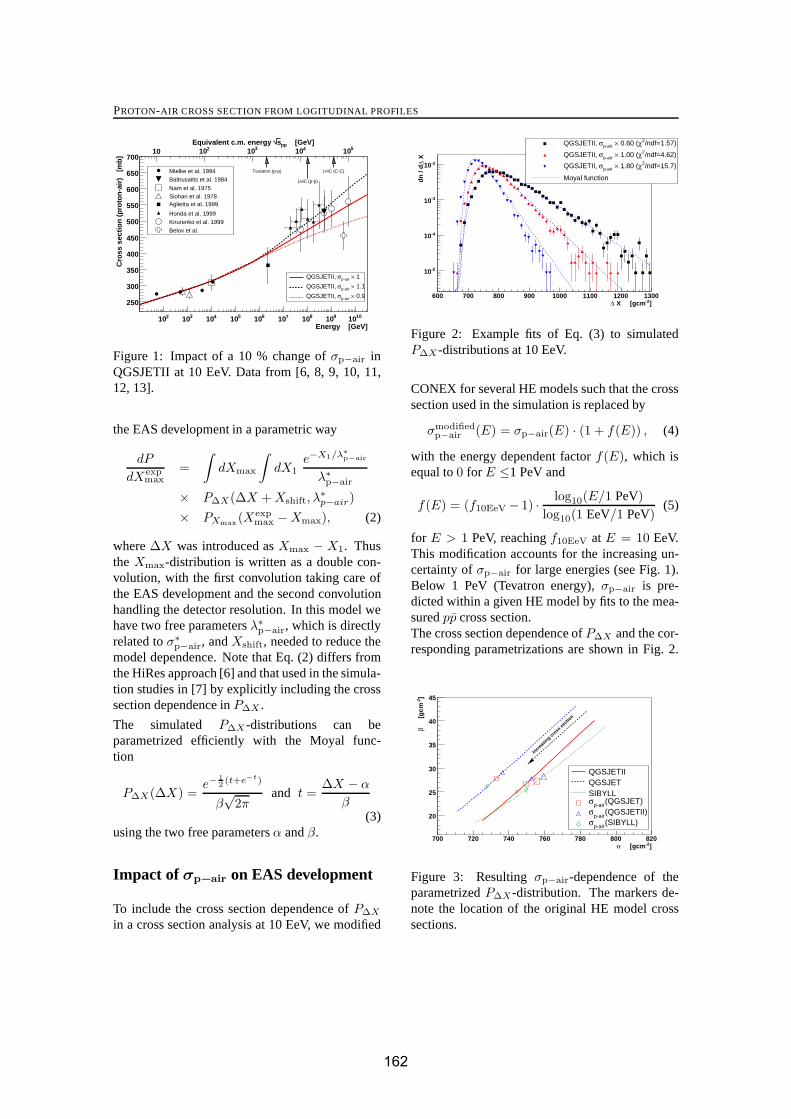
PROTON-AIR CROSS SECTION FROM LOGITUDINAL PROFILES
(Energy/eV)10
log10 11 12 13 14 15 16 17 18 19
Cro
ss s
ecti
on
(p
roto
n-a
ir)
[m
b]
250
300
350
400
450
500
550
600
650
700
1×p-airσQGSJETII,
1.1×p-airσQGSJETII,
0.9×p-airσQGSJETII,
Energy [GeV]210 310 410 510 610 710 810 910 1010
[GeV]ppsEquivalent c.m. energy 10 210 310 410 510
Mielke et al. 1994Baltrusaitis et al. 1984
Nam et al. 1975Siohan et al. 1978Aglietta et al. 1999
Honda et al. 1999Knurenko et al. 1999Belov et al.
Tevatron (p-p)
LHC (p-p)
LHC (C-C)
Figure 1: Impact of a 10 % change of σp−air inQGSJETII at 10 EeV. Data from [6, 8, 9, 10, 11,12, 13].
the EAS development in a parametric way
dP
dXexpmax
=
∫dXmax
∫dX1
e−X1/λ∗
p−air
λ∗p−air
× PΔX(ΔX + Xshift, λ∗p−air)
× PXmax(Xexp
max − Xmax), (2)
where ΔX was introduced as Xmax − X1. Thusthe Xmax-distribution is written as a double con-volution, with the first convolution taking care ofthe EAS development and the second convolutionhandling the detector resolution. In this model wehave two free parameters λ∗
p−air, which is directlyrelated to σ∗
p−air, and Xshift, needed to reduce themodel dependence. Note that Eq. (2) differs fromthe HiRes approach [6] and that used in the simula-tion studies in [7] by explicitly including the crosssection dependence in PΔX .
The simulated PΔX -distributions can beparametrized efficiently with the Moyal func-tion
PΔX(ΔX) =e−
1
2(t+e−t)
β√
2πand t =
ΔX − α
β(3)
using the two free parameters α and β.
Impact of σp−air on EAS development
To include the cross section dependence of PΔX
in a cross section analysis at 10 EeV, we modified
]-2 X [gcmΔ600 700 800 900 1000 1100 1200 1300
XΔd
n /
d
-510
-410
-310
-210
/ndf=1.57)2χ 0.60 (×p-airσQGSJETII,
/ndf=4.62)2χ 1.00 (×p-airσQGSJETII,
/ndf=15.7)2χ 1.80 (×p-airσQGSJETII,
Moyal function
Figure 2: Example fits of Eq. (3) to simulatedPΔX -distributions at 10 EeV.
CONEX for several HE models such that the crosssection used in the simulation is replaced by
σmodifiedp−air (E) = σp−air(E) · (1 + f(E)) , (4)
with the energy dependent factor f(E), which isequal to 0 for E ≤1 PeV and
f(E) = (f10EeV − 1) · log10(E/1 PeV)
log10(1 EeV/1 PeV)(5)
for E > 1 PeV, reaching f10EeV at E = 10 EeV.This modification accounts for the increasing un-certainty of σp−air for large energies (see Fig. 1).Below 1 PeV (Tevatron energy), σp−air is pre-dicted within a given HE model by fits to the mea-sured pp cross section.The cross section dependence of PΔX and the cor-responding parametrizations are shown in Fig. 2.
]-2 [gcmα700 720 740 760 780 800 820
]-2
[
gcm
β
20
25
30
35
40
45
incr
easin
g cross
sect
ion
QGSJETIIQGSJETSIBYLL
(QGSJET)p-airσ(QGSJETII)
p-airσ
(SIBYLL)p-airσ
Figure 3: Resulting σp−air-dependence of theparametrized PΔX-distribution. The markers de-note the location of the original HE model crosssections.
162
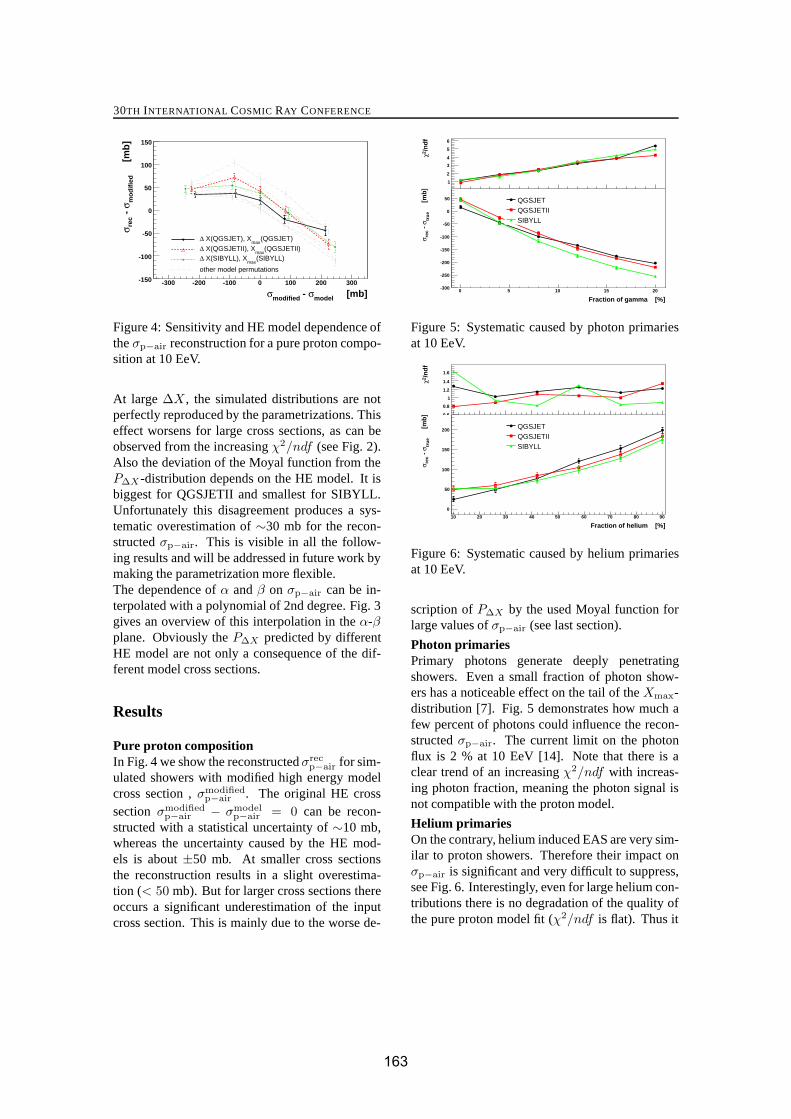
30TH INTERNATIONAL COSMIC RAY CONFERENCE
[mb]modelσ - modifiedσ-300 -200 -100 0 100 200 300
[
mb
]m
od
ifie
dσ
-
rec
σ
-150
-100
-50
0
50
100
150
(QGSJET)max
X(QGSJET), XΔ(QGSJETII)
max X(QGSJETII), XΔ
(SIBYLL)max
X(SIBYLL), XΔother model permutations
Figure 4: Sensitivity and HE model dependence ofthe σp−air reconstruction for a pure proton compo-sition at 10 EeV.
At large ΔX , the simulated distributions are notperfectly reproduced by the parametrizations. Thiseffect worsens for large cross sections, as can beobserved from the increasing χ2/ndf (see Fig. 2).Also the deviation of the Moyal function from thePΔX -distribution depends on the HE model. It isbiggest for QGSJETII and smallest for SIBYLL.Unfortunately this disagreement produces a sys-tematic overestimation of ∼30 mb for the recon-structed σp−air. This is visible in all the follow-ing results and will be addressed in future work bymaking the parametrization more flexible.The dependence of α and β on σp−air can be in-terpolated with a polynomial of 2nd degree. Fig. 3gives an overview of this interpolation in the α-βplane. Obviously the PΔX predicted by differentHE model are not only a consequence of the dif-ferent model cross sections.
Results
Pure proton compositionIn Fig. 4 we show the reconstructed σrec
p−air for sim-ulated showers with modified high energy modelcross section , σmodified
p−air . The original HE crosssection σmodified
p−air − σmodelp−air = 0 can be recon-
structed with a statistical uncertainty of ∼10 mb,whereas the uncertainty caused by the HE mod-els is about ±50 mb. At smaller cross sectionsthe reconstruction results in a slight overestima-tion (< 50 mb). But for larger cross sections thereoccurs a significant underestimation of the inputcross section. This is mainly due to the worse de-
Fraction of gamma [%]0 5 10 15 20
[
mb
]tr
ue
σ -
re
cσ
-300
-250
-200
-150
-100
-50
0
50 QGSJETQGSJETIISIBYLL
/nd
f2 χ
1
2
3
4
5
6
Figure 5: Systematic caused by photon primariesat 10 EeV.
Fraction of helium [%]10 20 30 40 50 60 70 80 90
[
mb
]tr
ue
σ -
re
cσ
0
50
100
150
200 QGSJETQGSJETIISIBYLL
/nd
f2 χ
0.6
0.8
1
1.2
1.4
1.6
Figure 6: Systematic caused by helium primariesat 10 EeV.
scription of PΔX by the used Moyal function forlarge values of σp−air (see last section).
Photon primariesPrimary photons generate deeply penetratingshowers. Even a small fraction of photon show-ers has a noticeable effect on the tail of the Xmax-distribution [7]. Fig. 5 demonstrates how much afew percent of photons could influence the recon-structed σp−air. The current limit on the photonflux is 2 % at 10 EeV [14]. Note that there is aclear trend of an increasing χ2/ndf with increas-ing photon fraction, meaning the photon signal isnot compatible with the proton model.
Helium primariesOn the contrary, helium induced EAS are very sim-ilar to proton showers. Therefore their impact onσp−air is significant and very difficult to suppress,see Fig. 6. Interestingly, even for large helium con-tributions there is no degradation of the quality ofthe pure proton model fit (χ2/ndf is flat). Thus it
163
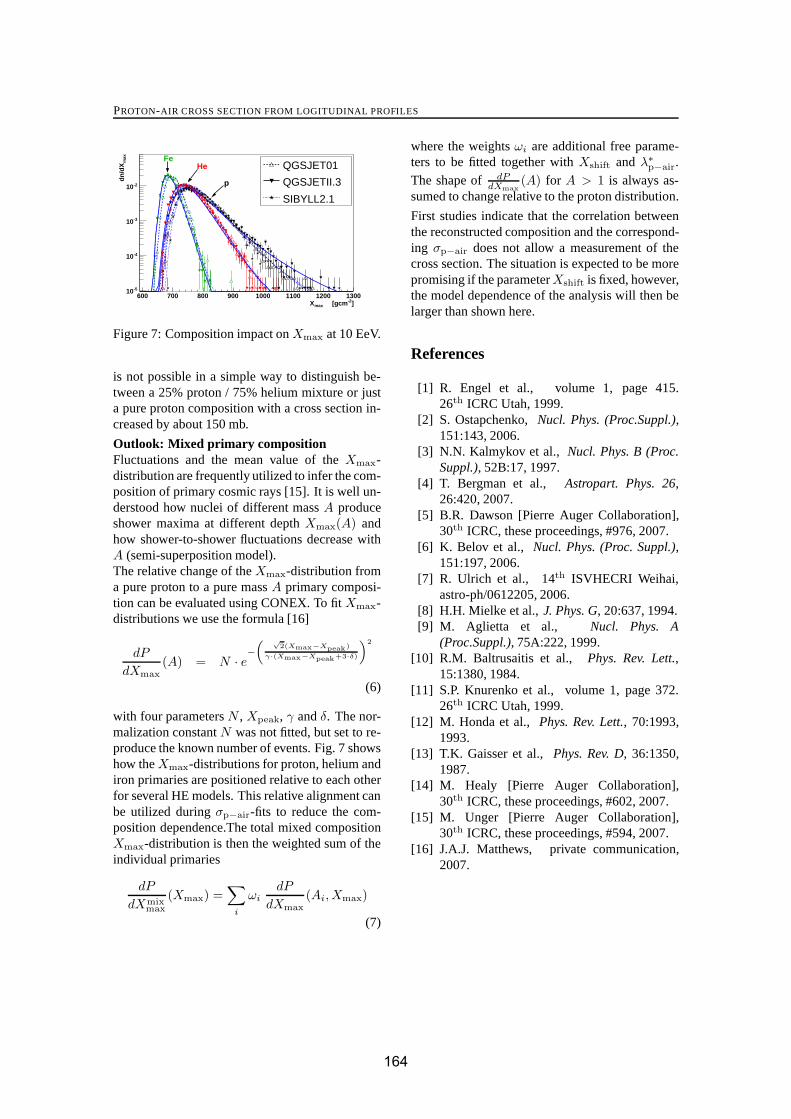
PROTON-AIR CROSS SECTION FROM LOGITUDINAL PROFILES
]-2 [gcmmaxX600 700 800 900 1000 1100 1200 1300
max
dn
/dX
-510
-410
-310
-210 p
HeFe
QGSJET01
QGSJETII.3
SIBYLL2.1
Figure 7: Composition impact on Xmax at 10 EeV.
is not possible in a simple way to distinguish be-tween a 25% proton / 75% helium mixture or justa pure proton composition with a cross section in-creased by about 150 mb.
Outlook: Mixed primary compositionFluctuations and the mean value of the Xmax-distribution are frequently utilized to infer the com-position of primary cosmic rays [15]. It is well un-derstood how nuclei of different mass A produceshower maxima at different depth Xmax(A) andhow shower-to-shower fluctuations decrease withA (semi-superposition model).The relative change of the Xmax-distribution froma pure proton to a pure mass A primary composi-tion can be evaluated using CONEX. To fit Xmax-distributions we use the formula [16]
dP
dXmax(A) = N · e−
( √
2(Xmax−Xpeak
)
γ·(Xmax−Xpeak
+3·δ)
)2
(6)
with four parameters N , Xpeak, γ and δ. The nor-malization constant N was not fitted, but set to re-produce the known number of events. Fig. 7 showshow the Xmax-distributions for proton, helium andiron primaries are positioned relative to each otherfor several HE models. This relative alignment canbe utilized during σp−air-fits to reduce the com-position dependence.The total mixed compositionXmax-distribution is then the weighted sum of theindividual primaries
dP
dXmixmax
(Xmax) =∑
i
ωidP
dXmax(Ai, Xmax)
(7)
where the weights ωi are additional free parame-ters to be fitted together with Xshift and λ∗
p−air.The shape of dP
dXmax
(A) for A > 1 is always as-sumed to change relative to the proton distribution.
First studies indicate that the correlation betweenthe reconstructed composition and the correspond-ing σp−air does not allow a measurement of thecross section. The situation is expected to be morepromising if the parameter Xshift is fixed, however,the model dependence of the analysis will then belarger than shown here.
References
[1] R. Engel et al., volume 1, page 415.26th ICRC Utah, 1999.
[2] S. Ostapchenko, Nucl. Phys. (Proc.Suppl.),151:143, 2006.
[3] N.N. Kalmykov et al., Nucl. Phys. B (Proc.Suppl.), 52B:17, 1997.
[4] T. Bergman et al., Astropart. Phys. 26,26:420, 2007.
[5] B.R. Dawson [Pierre Auger Collaboration],30th ICRC, these proceedings, #976, 2007.
[6] K. Belov et al., Nucl. Phys. (Proc. Suppl.),151:197, 2006.
[7] R. Ulrich et al., 14th ISVHECRI Weihai,astro-ph/0612205, 2006.
[8] H.H. Mielke et al., J. Phys. G, 20:637, 1994.[9] M. Aglietta et al., Nucl. Phys. A
(Proc.Suppl.), 75A:222, 1999.[10] R.M. Baltrusaitis et al., Phys. Rev. Lett.,
15:1380, 1984.[11] S.P. Knurenko et al., volume 1, page 372.
26th ICRC Utah, 1999.[12] M. Honda et al., Phys. Rev. Lett., 70:1993,
1993.[13] T.K. Gaisser et al., Phys. Rev. D, 36:1350,
1987.[14] M. Healy [Pierre Auger Collaboration],
30th ICRC, these proceedings, #602, 2007.[15] M. Unger [Pierre Auger Collaboration],
30th ICRC, these proceedings, #594, 2007.[16] J.A.J. Matthews, private communication,
2007.
164
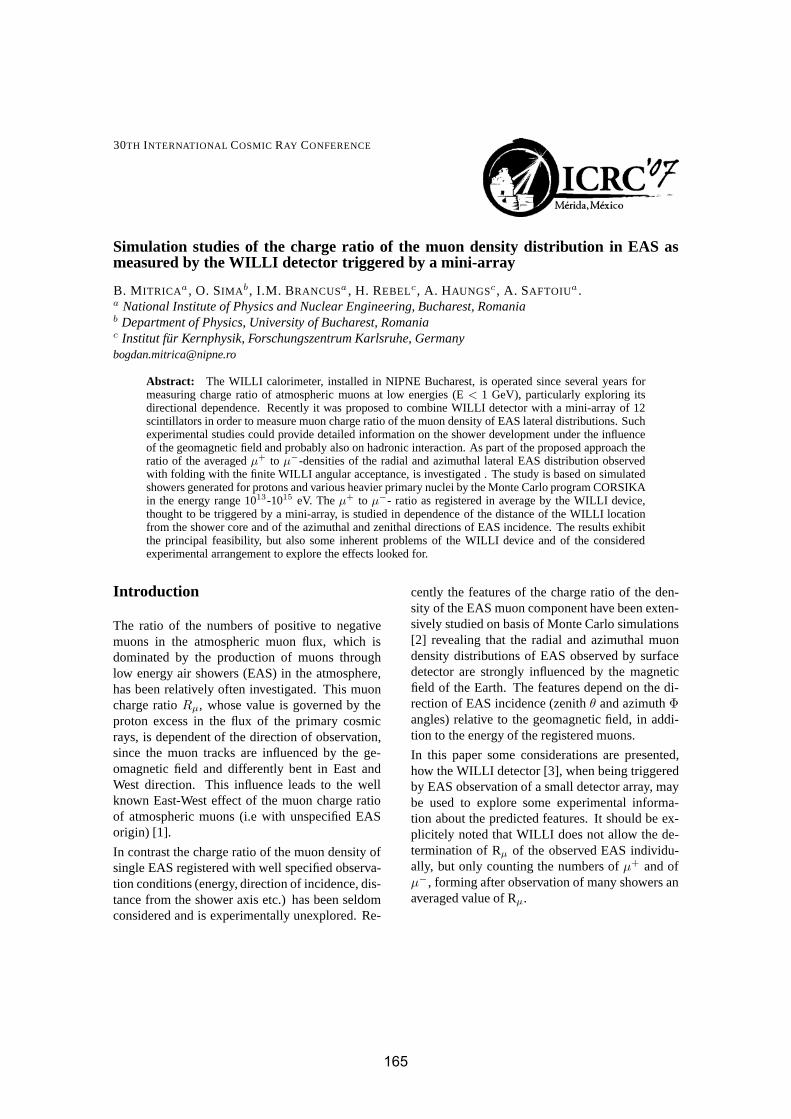
30TH INTERNATIONAL COSMIC RAY CONFERENCE
Simulation studies of the charge ratio of the muon density distribution in EAS asmeasured by the WILLI detector triggered by a mini-array
B. MITRICAa , O. SIMAb , I.M. BRANCUSa , H. REBELc , A. HAUNGSc , A. SAFTOIUa .a National Institute of Physics and Nuclear Engineering, Bucharest, Romaniab Department of Physics, University of Bucharest, Romaniac Institut fur Kernphysik, Forschungszentrum Karlsruhe, [email protected]
Abstract: The WILLI calorimeter, installed in NIPNE Bucharest, is operated since several years formeasuring charge ratio of atmospheric muons at low energies (E < 1 GeV), particularly exploring itsdirectional dependence. Recently it was proposed to combine WILLI detector with a mini-array of 12scintillators in order to measure muon charge ratio of the muon density of EAS lateral distributions. Suchexperimental studies could provide detailed information on the shower development under the influenceof the geomagnetic field and probably also on hadronic interaction. As part of the proposed approach theratio of the averaged μ+ to μ−-densities of the radial and azimuthal lateral EAS distribution observedwith folding with the finite WILLI angular acceptance, is investigated . The study is based on simulatedshowers generated for protons and various heavier primary nuclei by the Monte Carlo program CORSIKAin the energy range 1013-1015 eV. The μ+ to μ−- ratio as registered in average by the WILLI device,thought to be triggered by a mini-array, is studied in dependence of the distance of the WILLI locationfrom the shower core and of the azimuthal and zenithal directions of EAS incidence. The results exhibitthe principal feasibility, but also some inherent problems of the WILLI device and of the consideredexperimental arrangement to explore the effects looked for.
Introduction
The ratio of the numbers of positive to negativemuons in the atmospheric muon flux, which isdominated by the production of muons throughlow energy air showers (EAS) in the atmosphere,has been relatively often investigated. This muoncharge ratio Rμ, whose value is governed by theproton excess in the flux of the primary cosmicrays, is dependent of the direction of observation,since the muon tracks are influenced by the ge-omagnetic field and differently bent in East andWest direction. This influence leads to the wellknown East-West effect of the muon charge ratioof atmospheric muons (i.e with unspecified EASorigin) [1].
In contrast the charge ratio of the muon density ofsingle EAS registered with well specified observa-tion conditions (energy, direction of incidence, dis-tance from the shower axis etc.) has been seldomconsidered and is experimentally unexplored. Re-
cently the features of the charge ratio of the den-sity of the EAS muon component have been exten-sively studied on basis of Monte Carlo simulations[2] revealing that the radial and azimuthal muondensity distributions of EAS observed by surfacedetector are strongly influenced by the magneticfield of the Earth. The features depend on the di-rection of EAS incidence (zenith θ and azimuth Φangles) relative to the geomagnetic field, in addi-tion to the energy of the registered muons.
In this paper some considerations are presented,how the WILLI detector [3], when being triggeredby EAS observation of a small detector array, maybe used to explore some experimental informa-tion about the predicted features. It should be ex-plicitely noted that WILLI does not allow the de-termination of Rμ of the observed EAS individu-ally, but only counting the numbers of μ+ and ofμ−, forming after observation of many showers anaveraged value of Rμ.
165

WILLI DETECTOR
Figure 1: Sketch of the geometrical layout of amini-array for triggering the nearby located WILLIdevice for muon detection by registering EAS [2].
Concept of an experimental arrange-ment
The WILLI detector [3, 4] installed for studyingthe muon charge ratio of atmospheric muons dis-criminates positive and negative muons by mea-suring the life time of muons stopped in the de-tector layers: Stopped positive muons decay witha lifetime of 2.2 μs, while negative muons are cap-tured in atomic orbits, thus leading to an effectivelysmaller lifetime depending on the stopping mate-rial. From the adjustment of the measured decaycurve to the actual mean value of the life time thevalue of Rμ can be deduced. Details of the methodare described elsewhere [3]. It largely avoids theuncertainties due to different detection efficienciesand geometrical acceptances of muons of differentcharges which affect the results of magnetic spec-trometers. In the present configuration the WILLIsetup is able to get directed to a pre-chosen direc-tion of muon incidence (zenith and azimuth an-gle) [4] for studies of the East-West effect of at-mospheric muons [5] e.g..
The application of the WILLI device for experi-mental studies of the features of the radial and az-imuthal variation of the charge ratio of the muondensity distribution in EAS needs a link to the EASregistration by a nearby located detector array,specifying the characteristics (core location, direc-tion of incidence etc.) of the triggering EAS. Fig.1
displays a highly schematic sketch of an eventualgeometrical layout of a mini-array of 12 detectorunits, whose spatial distribution defines also thewindow of primary energies of the observed EAS.
The necessary simulation studies of the perfor-mance of such a mini-array and of the expectedtrigger rate (roughly estimated to be in the orderof 1 event/min) are in progress. In particular, thelayout studies must also include an adequate elec-tronic system for triggering and data acquisitionsince only one stopped muon per shower can behandled in the present system. In the present stud-ies we study, how the finite angular acceptance ofthe WILLI spectrometer, positioned at a particularaccurately defined distance from the shower coreand observing muons from a particular directionwill affect the pronounced predicted variation ofthe charge ratio of the observed muon density.
0
0.5
1
1.5
0 100 200 300
Azimuth (o)
Cha
rge
rati
o
WestEast
Figure 2: Dependence of the charge ratio on theazimuthal position of WILLI around shower core(radial distance: 150-200 m). Proton showers(E=1015 eV, θ=45o) coming from East (squares)and from West (triangles). WILLI is oriented par-allel to the shower axis.
166

30TH INTERNATIONAL COSMIC RAY CONFERENCE
0
1
2
3
0 100 200 300
Azimuth (o)
Cha
rge
rati
o
100-150 m
550-600 m350-400 m
Figure 3: Dependence of the charge ratio on theazimuthal position of WILLI around shower corefor various radial ranges. Proton showers (E=1015
eV, θ=45o) coming from North. WILLI is orientedparallel to the shower axis.
Simulations of the charge ratio of theEAS muon density distribution as seenby WILLI
The following results, displayed in Figs. 2-6, arebased on simulations by the EAS Monte Carlo sim-ulation code CORSIKA (vers.6.0) [6] using finallythe same set of simulations (about 60000 show-ers in total) as in [2], but including the criteria ofmuon registration by WILLI. For the present ex-ploratory study the hardware triggering and veto-ing conditions and the software cuts implementedin the WILLI data acquisition and analysis systemwere replaced by the condition that a single muonfrom a shower event hits WILLI. Furthermore thismuon should have the energy E < 1 GeV (with thethreshold slightly dependent on the angle of inci-dence) and the incidence angle filtered with a gaus-sian angular acceptance with a dispersion similarto that determined in [3].
As expected from the theoretical studies [2] thefigures indicate that the azimuthal variation of theRμ gets more pronounced with increasing core
0
0.5
1
1.5
2
0 100 200 300
Azimuth (o)C
harg
e ra
tio
30o
45o
55o
Figure 4: Dependence of the charge ratio on the az-imuthal position of WILLI around shower core forproton showers (E=1015 eV) with several zenithangles coming from North. Radial distance: 200-250 m. WILLI is oriented parallel to the showeraxis in each case.
distance. Actually the salient features are shownfor core distances ≥ 100 m. The features atsmaller distances follow the general trend, but needfor demonstration a larger statistical accuracy, i.e.within the present procedure a larger number ofanalysed EAS, actually approaching the experi-mental reality. Differences of Rμ between iron andproton induced showers are small, at least at theenergies studied in this work.
Concluding remarks
The application of the WILLI calorimeter as devicefor measuring the charge ratio of the EAS muondensity needs some modifications of the appara-tus, especially for triggering by the mini-array andthe acquisition of the low energy muons [3]. EASmuons have an energy spectrum which is harderthan that of atmospheric muons and less rich ofmuons which are able to get stopped in the ac-tual WILLI device. This feature implies a seriouslimitation of the statistical accuracy of results of
167

WILLI DETECTOR
0
0.5
1
1.5
2
0 100 200 300
Azimuth (o)
Cha
rge
rati
o
Fep
Figure 5: Dependence of the charge ratio on theazimuthal position of WILLI around shower corefor proton (squares) and Fe (triangles) showers(E=1015 eV, θ=45o) coming from North; radial dis-tance: 450-500 m. WILLI is oriented parallel tothe shower axis.
WILLI. Hence the WILLI should to be additionallyequipped with some absorber material for degrada-tion of the muon energy in the direction of obser-vation. For devising the mini-array (intended tobe set up with 12 scintillator units from the formerCentral Detector of KASCADE in Forschungszen-trum Karlsruhe) special attention should be put tothe accuracy of the core location since inaccuraciesof the core location are propagated in the azimuthal(and radial) position of the WILLI device with re-spect to the incoming shower and may smear outvariations of the Rμ (azimuth). Therefore carefulperformance studies, optimising the layout of theplanned mini-array are requested.
Acknowledgements
This work is supported by the Romanian Ministryof Education and Research (grant CEEX 05-D11-79/2005).
0
0.5
1
1.5
0 100 200 300
Azimuth (o)C
harg
e ra
tio
+15o N0o N
-15o N
Figure 6: Dependence of the charge ratio on the az-imuthal position of WILLI around shower core forproton showers (E=1015 eV, θ=45o) coming fromNorth. Radial distance: 200-250 m. WILLI is ori-ented parallel to the shower axis (squares), +15o N(towards East, triangles) and -15o N (towards West,stars).
References
[1] O.C. Allkofer et al., Journ. Geophys. Re-search 90 (1985) 3537.
[2] H. Rebel and O. Sima, Romanian Rep. Phys.59 (2007) 427; H.Rebel et al., Report FZKA7294, Forschungszentrum Karlsruhe 2007;H.Rebel et al., Proc. of 30th ICRC, Merida,Mexico 2007.
[3] B. Vulpescu et al., Nucl. Instr. Methods A414 (1998) 1699; B. Vulpescu et al., J. Phys.G: Nucl. Part. Phys. 27 (2001) 977.
[4] I. M. Brancus et al., Nucl. Phys. A 271 (2003)1044c.
[5] I. M. Brancus et al., Proc. ISVHECRI, Wei-hei, China 2006, Nucl. Phys. B (in press).
[6] D. Heck et al., Report FZKA 6019Forschungszentrum Karlsruhe 1998.
168

30TH INTERNATIONAL COSMIC RAY CONFERENCE
The muon charge ratio in cosmic ray air showers
H. REBELa, O. SIMAb , A. HAUNGSa , J. OEHLSCHLAGERa.a Institut fur Kernphysik, Forschungszentrum Karlsruhe, Germanyb Department of Physics, University of Bucharest, [email protected]
Abstract: The muon charge ratio of the lateral muon density distributions in single Extended Air Show-ers (EAS) is studied on basis of Monte Carlo simulations, in view of proposals to measure this observablein coincidence with EAS observations. Differences of the azimuthal variation of the muon densitiesof opposite charges and the azimuthal variation of the muon charge ratio appear to be very much pro-nounced, dependent on the direction of the EAS incidence and the position of the observer in respect tothe Earth’s magnetic vector. The influence of the geomagnetic field, which induces comparable effects inradio emission from EAS, is obviously of great interest for understanding the shower development.
Introduction
The flux, the energy spectrum and the charge ratioof atmospheric muons, resulting from the decay ofpions and kaons which are produced in collisionsof primary cosmic rays with the air molecules,have been studied extensively over wide range ofenergies at sea level as well as on high mountainaltitudes and during balloon ascents. The studiescomprise several aspects, in particular they provideinformation on the composition of cosmic rays andon characteristic features of the hadronic interac-tion and of the influence of the geomagnetic fieldon the primary and secondary components of cos-mic radiation. The investigations show that theratio of the number of positive to negative atmo-spheric muons Ratm
μ = Nμ+ /Nμ− is experimentallyvarying between the values of about 1.2 -1.3 [1].As detailed analyses [2] show, the excess of thepositive charge reflects mainly the excess of pro-tons of primary cosmic rays and less eventual smalldifferences of the production of positive and neg-ative parent particles of the muons. The Earth’smagnetic field influences the flux of primary cos-mic rays entering the Earth atmosphere leadingto the well-known East-West asymmetry and thelatitude effect. In addition the geomagnetic fieldbends the trajectories of the charged particles of thesecondary cosmic rays which get curved. The ef-
fect is particularly dominant for the muon compo-nent which is less affected by Coulomb scatteringsprocesses. This leads to the East-West effect of themuon charge ratio: the observation that the ratio ofpositive and negative atmospheric muons proves tobe different for muons arriving the spectroscopicdevice from West from those arriving from Eastdirection (see [3]). The finding originates fromthe fact that in the East-West plane due to differentbendings, muons of positive and negative chargeshave different path lengths from the locus of pro-duction to the observer. Hence the decay probabil-ity of low energy muons is differently modified.
The features are slightly different for the muoncharge ratio in Extensive Air Showers (EAS)whose axes have well defined angles (θ,Φ) of in-cidence, not only relative to the zenith direction,but also relative to the vector of the magnetic fieldof the Earth. The total charge ratio integrated overall muons of the EAS is only determined by thehadronic interaction and the decay of the parentparticles, and no more by the composition of cos-mic rays. However, due to various effects the lat-eral distribution ρ(r, φ) of the density of positiveand negative muons and its charge ratio Rμ(r, φ)vary radially (with the distance r from the EAScentre) as well as azimuthally (with the EAS intrin-sic azimuth φ, counted clockwise in the horizontal
169
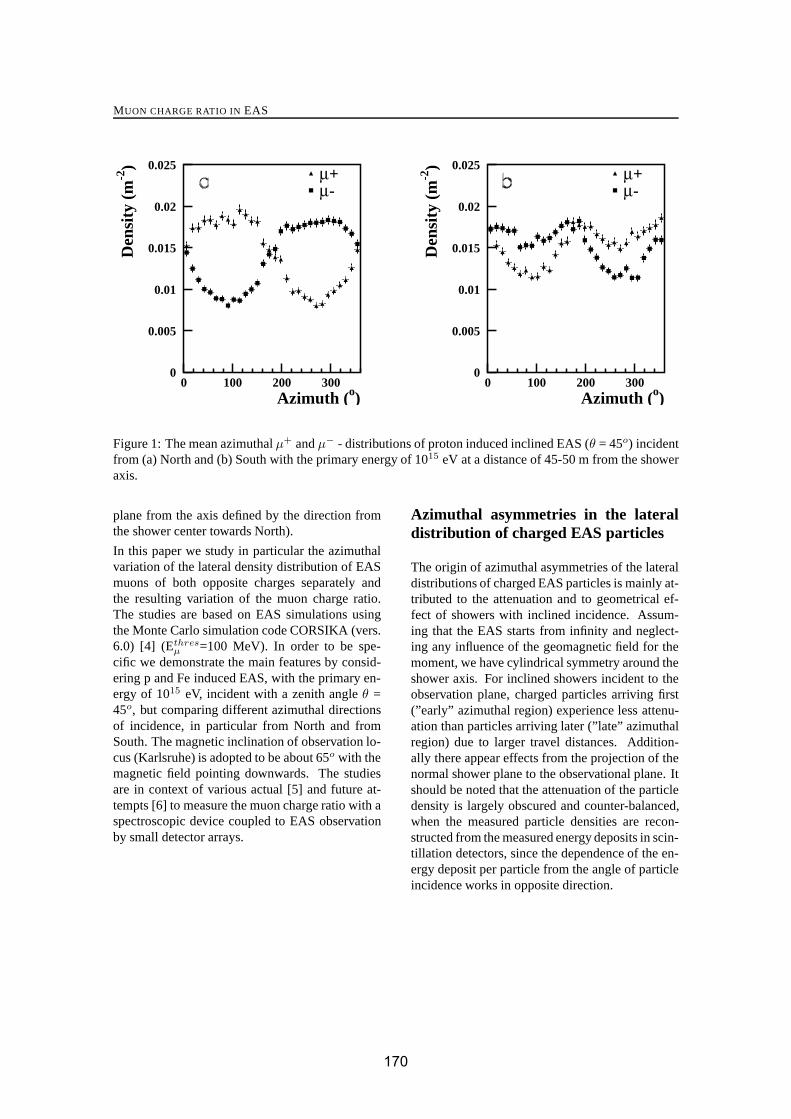
MUON CHARGE RATIO IN EAS
0
0.005
0.01
0.015
0.02
0.025
0 100 200 300Azimuth (o)
Den
sity
(m
-2) μ+
μ-
0
0.005
0.01
0.015
0.02
0.025
0 100 200 300Azimuth (o)
Den
sity
(m
-2) μ+
μ-
Figure 1: The mean azimuthal μ+ and μ− - distributions of proton induced inclined EAS (θ = 45o) incidentfrom (a) North and (b) South with the primary energy of 1015 eV at a distance of 45-50 m from the showeraxis.
plane from the axis defined by the direction fromthe shower center towards North).
In this paper we study in particular the azimuthalvariation of the lateral density distribution of EASmuons of both opposite charges separately andthe resulting variation of the muon charge ratio.The studies are based on EAS simulations usingthe Monte Carlo simulation code CORSIKA (vers.6.0) [4] (Ethres
μ =100 MeV). In order to be spe-cific we demonstrate the main features by consid-ering p and Fe induced EAS, with the primary en-ergy of 1015 eV, incident with a zenith angle θ =45o, but comparing different azimuthal directionsof incidence, in particular from North and fromSouth. The magnetic inclination of observation lo-cus (Karlsruhe) is adopted to be about 65o with themagnetic field pointing downwards. The studiesare in context of various actual [5] and future at-tempts [6] to measure the muon charge ratio with aspectroscopic device coupled to EAS observationby small detector arrays.
Azimuthal asymmetries in the lateraldistribution of charged EAS particles
The origin of azimuthal asymmetries of the lateraldistributions of charged EAS particles is mainly at-tributed to the attenuation and to geometrical ef-fect of showers with inclined incidence. Assum-ing that the EAS starts from infinity and neglect-ing any influence of the geomagnetic field for themoment, we have cylindrical symmetry around theshower axis. For inclined showers incident to theobservation plane, charged particles arriving first(”early” azimuthal region) experience less attenu-ation than particles arriving later (”late” azimuthalregion) due to larger travel distances. Addition-ally there appear effects from the projection of thenormal shower plane to the observational plane. Itshould be noted that the attenuation of the particledensity is largely obscured and counter-balanced,when the measured particle densities are recon-structed from the measured energy deposits in scin-tillation detectors, since the dependence of the en-ergy deposit per particle from the angle of particleincidence works in opposite direction.
170

30TH INTERNATIONAL COSMIC RAY CONFERENCE
0
1
2
3
0 100 200 300Azimuth (o)
Cha
rge
rati
o R
μ 15-2045-50145-150
0
1
2
3
0 100 200 300Azimuth (o)
Cha
rge
rati
o R
μ 15-2045-50145-150
Figure 2: Azimuthal variation of the charge ratio Rμ(r, φ) of the mean muon density distribution of protoninduced inclined EAS (θ = 45o) incident from (a) North and (b) South with the primary energy of 1015 eVat various distances r(m) from the shower axis.
Influence of the geomagnetic field on theazimuthal lateral μ
+ and μ− - distribu-
tions
Figures 1 and 2 display some selective examples ofthe results for proton induced EAS observed in theobservational plane as function of the azimuth an-gle φ. Fe induced showers show similar features.The asymmetry for EAS incident from various di-rections can be explained by different relative an-gles to the Earth magnetic vector. When the geo-magnetic field is switched off, the azimuthal μ+
and μ− - distributions show practically only thevariation due to geometric and attenuation effects,for μ+ and μ− similar, so that the charge ratiovalue stays with Rμ(r, φ) =1. Obviously differ-ences in the π+ and π− productions remain rathersmall at the considered energies (and within the in-voked hadronic interaction model: QGSJET). Thisfinding is underlined by the value of the muoncharge ratio integrated over all distances and az-imuth angles Rμ = 1.028 ± 0.002 for the casesshown in Figure 2.
The influence of the geomagnetic field and theseparation of μ+ and μ− increase with the path
length (slant depth) of the muon trajectories inthe atmosphere. Hence the Rμ(r, φ) variation getsmore pronounced with increasing distances fromthe shower core, with the threshold (Fig.3) of ob-served muon energies (since muons of higher ener-gies stem dominantly from earlier generations) andwith the zenith angle EAS incidence (see Fig.4).Recently this feature has been regarded in view ofa separation of positive and negative muons by theEarth’s magnetic field [7] , for the case of very in-clined showers of primary energies high enough sothat the muon component observed at ground re-mains sufficiently intensive for observation.
Concluding remarks
EAS simulations show that the lateral density dis-tributions of the positive and negative muons arevarying not only with the (radial) distance from theshower axis, but also with the azimuth relative tothe plane of the incident shower. The reasons aredifferent. In addition to the attenuation effects ofcharged particles of inclined showers in the atmo-sphere by the variation of the travelling distances,the geomagnetic field affects dominantly the travel
171
MUON CHARGE RATIO IN EAS
0
2
4
6
0 100 200 300
Azimuth (o)
Cha
rge
rati
o R
μ
10 GeV0.1 GeV
100 GeV
Figure 3: Azimuthal variation of the charge ratioRμ of the muon density distribution of proton in-duced EAS of inclined incidence (θ = 45o), inci-dent from North with the primary energy of 1015
eV, observed at a radial distance of 45-50m. Com-parison of different detection thresholds.
2
4
6
0 100 200 300
Azimuth (o)
Cha
rge
rati
o R
μ
Θ=30o
Θ=45o
Θ=55o
Θ=65o
Figure 4: Azimuthal variation of the charge ratioRμ of the muon density distribution of proton in-duced EAS with different zenith angles incidentfrom North with the primary energy of 1015 eV ,observed at a radial distance of 45-50m. Compari-son of different zenith angles of incidence.
of positive and negative muons with deflections inopposite directions. The geomagnetic effects de-pend on the direction of the EAS axis relative to theEarth’s magnetic vector. This leads to an azimuthalvariation of the muon charge ratio of the muon den-sity distribution. In the extreme case of very in-clined showers (with long slant depths) the Earthfield might be used as magnetic separator. Obvi-ously these features which are not yet experimen-tally explored [5], [6], [8] in a systematic way, areof great interest for the understanding of the EASdevelopment. It should be mentioned that somefindings for the muon component induced by thegeomagnetic field resemble features observed forthe radio emission from EAS [3]. Furthermore thequantitative results would also provide some de-tailed information about the hadronic interaction,in particular when observing higher energy muons.
Acknowledgements
These studies have been triggered by the discus-sion of a concept to investigate experimentally themuon charge ratio in the lateral muon density dis-tribution of EAS by extending the WILLI appara-tus [6]. One of us (O.S) acknowledges travel sup-port by the Romanian Ministry of Education andResearch (grant CEEX 05-D11-79/2005).
References
[1] T. Hebbeker and C. Timmermans, Astropart.Phys. 18, 107 (2002).
[2] J. Wentz et al. J. Phys. G: Nucl. Part. Phys.27, 1699 (2001); J. Wentz et al. Phys. Rev. D67, 073020 (2003).
[3] H. Rebel et al. Report FZKA 7294Forschungzentrum Karlsruhe 2007.
[4] D. Heck et al. Report FZKA 6019Forschungzentrum Karlsruhe 1998.
[5] S. Tsuji et al. Proc. of 29th ICRC, Pune(2005) 6, 213; ibid 8, 233.
[6] I. M. Brancus et al. Proc. ISVHECRI, Weihei(2006), Nucl. Phys. B (in press).
[7] B. K. Xue and Bo-Qiang Ma, Astropart.Phys. 27, 286 (2007); M. Ave, R. A. Vasquezand E. Zas, Astropart. Phys. 14, 91 (2000).
[8] A. M. Ivanov et al. JETP Lett. 69, 288 (1999).
172
30TH INTERNATIONAL COSMIC RAY CONFERENCE
Measurement of the Air Fluorescence Yield with the AirLight Experiment
TILO WALDENMAIER1 , JOHANNES BLUMER2,3, DANAYS GONZALEZ2, HANS KLAGES2 .1Bartol Research Institute, DPA, University of Delaware, Newark, DE 19716, U.S.A.2Forschungszentrum Karlsruhe, Institut fur Kernphysik, P.O.Box 3640, 76021 Karlsruhe, Germany3Universitat Karlsruhe, Institut fur Experimentelle Kernphysik, P.O.Box 6980, 76128 Karlsruhe, [email protected]
Abstract: The present uncertainties of the air fluorescence yield are the limiting factor for the energyreconstruction of ultra-high energy cosmic rays measured by fluorescence telescopes. The AirLight ex-periment has measured the pressure and energy dependence of the air fluorescence yield for the eightstrongest nitrogen transitions with a precision of about 15 % for low energy electrons between 250 keVand 2000 keV. Furthermore the influence of water vapor has been investigated. This paper introduces theexperimental method and summarizes the results.
Introduction
The measurement of air fluorescence is used bymany modern experiments (i.e. HiRes [9], PierreAuger Observatory [1]) to detect extensive airshowers (EAS), induced by ultra-high energy cos-mic rays. The secondary EAS particles (mostlyelectrons and positrons) deposit their energy inthe atmosphere by exciting or ionizing the airmolecules which afterwards partially relax byemitting fluorescence photons. As pointed out byBunner [3] most of these photons in the wave-length range between 300 nm and 400 nm origi-nate from transitions of the second positive (2P)system of molecular nitrogen and the first nega-tive (1N) system of molecular nitrogen ions. Thesefaint emissions can be measured by fluorescencetelescopes, allowing the observation of the lon-gitudinal development of EAS through the atmo-sphere and a calorimetric determination of the pri-mary cosmic-ray energy. The conversion factorbetween the deposited energy and the number ofemitted fluorescence photons is the so-called fluo-rescence yield Yλ(p, T ) which depends on the airpressure p and temperature T as well as on thewavelength λ of the emitted photons. This methodis considered to provide the most direct measureof the primary cosmic-ray energy, it is howeverlimited by the present uncertainties of the fluores-cence yield of about 15 % to 30 % and the lack
of knowledge about its energy dependence. In re-cent years this gave rise to a number of new labora-tory experiments (i.e. Kakimoto et al. [6], Naganoet al. [8], AIRFLY [2], FLASH [5] or AirLight)aiming a precise measurement of the fluorescenceyield over a wide energy, pressure and tempera-ture range. This paper reports about the resultsof the AirLight experiment at ForschungszentrumKarlsruhe in Germany and is extracted from thePh.D. thesis [10] of the corresponding author.
The AirLight Experiment
The setup of the AirLight experiment is similar tothe experiments done by Kakimoto and Nagano etal. [6, 8]. As is shown in Fig. 1 it consists of acylindrical aluminum chamber in which electronsare injected along the chamber axis. The elec-trons are emitted from a 90Sr-source situated at thetop of the chamber and are collimated by severallead rings. The electron source has an activity of37 MBq with an end point energy of 2.3 MeV. Af-ter having traversed 10 cm of gas (dry air, purenitrogen, or a nitrogen-oxygen mixture) the elec-trons are stopped in a plastic scintillator to de-termine their energy with an energy resolution ofabout 10 % at 1 MeV. The electron rate at the scin-tillator alters between 10 kHz and 20 kHz, depend-ing on the pressure in the chamber which can be
173
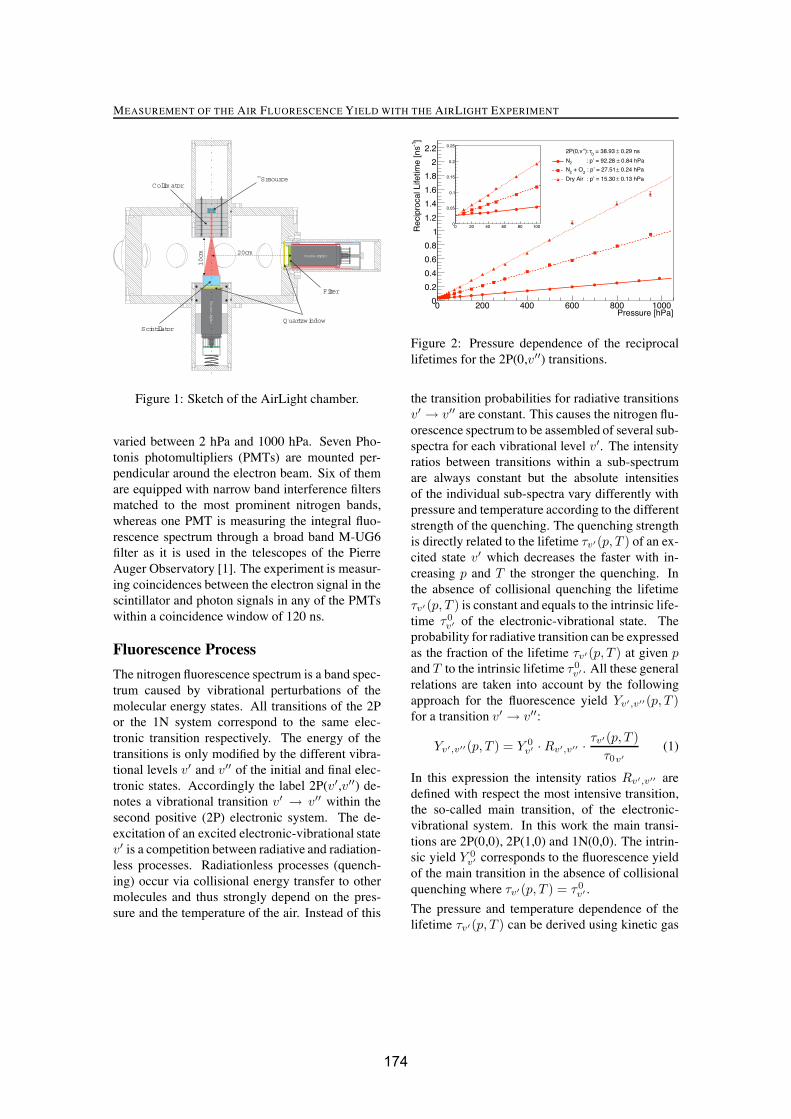
MEASUREMENT OF THE AIR FLUORESCENCE YIELD WITH THE AIRLIGHT EXPERIMENT
Photomultip
lier
Photom ultiplier20cm
Scintillator
Collim ator
Quartzwindow
Filter
90Srsource
10cm
Figure 1: Sketch of the AirLight chamber.
varied between 2 hPa and 1000 hPa. Seven Pho-tonis photomultipliers (PMTs) are mounted per-pendicular around the electron beam. Six of themare equipped with narrow band interference filtersmatched to the most prominent nitrogen bands,whereas one PMT is measuring the integral fluo-rescence spectrum through a broad band M-UG6filter as it is used in the telescopes of the PierreAuger Observatory [1]. The experiment is measur-ing coincidences between the electron signal in thescintillator and photon signals in any of the PMTswithin a coincidence window of 120 ns.
Fluorescence Process
The nitrogen fluorescence spectrum is a band spec-trum caused by vibrational perturbations of themolecular energy states. All transitions of the 2Por the 1N system correspond to the same elec-tronic transition respectively. The energy of thetransitions is only modified by the different vibra-tional levels v′ and v′′ of the initial and final elec-tronic states. Accordingly the label 2P(v′,v′′) de-notes a vibrational transition v′ → v′′ within thesecond positive (2P) electronic system. The de-excitation of an excited electronic-vibrational statev′ is a competition between radiative and radiation-less processes. Radiationless processes (quench-ing) occur via collisional energy transfer to othermolecules and thus strongly depend on the pres-sure and the temperature of the air. Instead of this
Pressure [hPa]0 200 400 600 800 1000
]-1
Rec
ipro
cal L
ifetim
e [n
s
0
0.2
0.4
0.6
0.8
1
1.2
1.4
1.6
1.8
2
2.2
0 20 40 60 80 1000
0.05
0.1
0.15
0.2
0.25 0.29 ns± = 38.93
0�2P(0,v’’):
0.84 hPa± : p’ = 92.28 2N
0.24 hPa± : p’ = 27.51 2
+ O2N
0.13 hPa±Dry Air : p’ = 15.30
Figure 2: Pressure dependence of the reciprocallifetimes for the 2P(0,v′′) transitions.
the transition probabilities for radiative transitionsv′ → v′′ are constant. This causes the nitrogen flu-orescence spectrum to be assembled of several sub-spectra for each vibrational level v′. The intensityratios between transitions within a sub-spectrumare always constant but the absolute intensitiesof the individual sub-spectra vary differently withpressure and temperature according to the differentstrength of the quenching. The quenching strengthis directly related to the lifetime τv′(p, T ) of an ex-cited state v′ which decreases the faster with in-creasing p and T the stronger the quenching. Inthe absence of collisional quenching the lifetimeτv′ (p, T ) is constant and equals to the intrinsic life-time τ0
v′ of the electronic-vibrational state. Theprobability for radiative transition can be expressedas the fraction of the lifetime τv′(p, T ) at given pand T to the intrinsic lifetime τ0
v′ . All these generalrelations are taken into account by the followingapproach for the fluorescence yield Yv′,v′′(p, T )for a transition v′ → v′′:
Yv′,v′′(p, T ) = Y 0v′ · Rv′,v′′ · τv′(p, T )
τ0v′(1)
In this expression the intensity ratios Rv′,v′′ aredefined with respect the most intensive transition,the so-called main transition, of the electronic-vibrational system. In this work the main transi-tions are 2P(0,0), 2P(1,0) and 1N(0,0). The intrin-sic yield Y 0
v′ corresponds to the fluorescence yieldof the main transition in the absence of collisionalquenching where τv′(p, T ) = τ0
v′ .
The pressure and temperature dependence of thelifetime τv′(p, T ) can be derived using kinetic gas
174
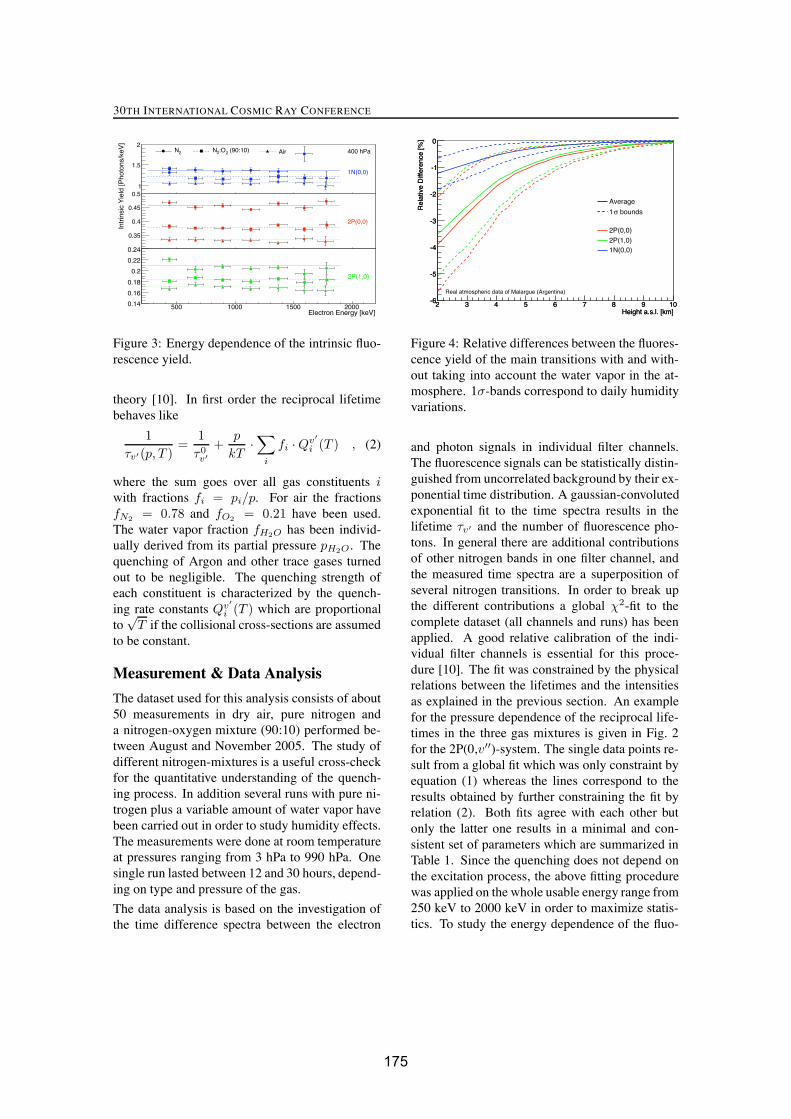
30TH INTERNATIONAL COSMIC RAY CONFERENCE
Electron Energy [keV]
Intr
insi
c Y
ield
[Pho
tons
/keV
]
1
1.5
2
1N(0,0)
2N (90:10)2:O2N Air 400 hPa
0.35
0.4
0.45
0.5
2P(0,0)
500 1000 1500 20000.14
0.16
0.18
0.2
0.22
0.24
2P(1,0)
Figure 3: Energy dependence of the intrinsic fluo-rescence yield.
theory [10]. In first order the reciprocal lifetimebehaves like
1τv′(p, T )
=1
τ0v′
+p
kT·∑
i
fi · Qv′i (T ) , (2)
where the sum goes over all gas constituents iwith fractions fi = pi/p. For air the fractionsfN2 = 0.78 and fO2 = 0.21 have been used.The water vapor fraction fH2O has been individ-ually derived from its partial pressure pH2O . Thequenching of Argon and other trace gases turnedout to be negligible. The quenching strength ofeach constituent is characterized by the quench-ing rate constants Qv′
i (T ) which are proportionalto
√T if the collisional cross-sections are assumed
to be constant.
Measurement & Data Analysis
The dataset used for this analysis consists of about50 measurements in dry air, pure nitrogen anda nitrogen-oxygen mixture (90:10) performed be-tween August and November 2005. The study ofdifferent nitrogen-mixtures is a useful cross-checkfor the quantitative understanding of the quench-ing process. In addition several runs with pure ni-trogen plus a variable amount of water vapor havebeen carried out in order to study humidity effects.The measurements were done at room temperatureat pressures ranging from 3 hPa to 990 hPa. Onesingle run lasted between 12 and 30 hours, depend-ing on type and pressure of the gas.
The data analysis is based on the investigation ofthe time difference spectra between the electron
Height a.s.l. [km]2 3 4 5 6 7 8 9 10
Rel
ativ
e D
iffer
ence
[%]
-6
-5
-4
-3
-2
-1
0
Average
bounds�1
2P(0,0)
2P(1,0)1N(0,0)
Real atmospheric data of Malargue (Argentina)
Height a.s.l. [km]2 3 4 5 6 7 8 9 10
Rel
ativ
e D
iffer
ence
[%]
-6
-5
-4
-3
-2
-1
0
Figure 4: Relative differences between the fluores-cence yield of the main transitions with and with-out taking into account the water vapor in the at-mosphere. 1σ-bands correspond to daily humidityvariations.
and photon signals in individual filter channels.The fluorescence signals can be statistically distin-guished from uncorrelated background by their ex-ponential time distribution. A gaussian-convolutedexponential fit to the time spectra results in thelifetime τv′ and the number of fluorescence pho-tons. In general there are additional contributionsof other nitrogen bands in one filter channel, andthe measured time spectra are a superposition ofseveral nitrogen transitions. In order to break upthe different contributions a global χ2-fit to thecomplete dataset (all channels and runs) has beenapplied. A good relative calibration of the indi-vidual filter channels is essential for this proce-dure [10]. The fit was constrained by the physicalrelations between the lifetimes and the intensitiesas explained in the previous section. An examplefor the pressure dependence of the reciprocal life-times in the three gas mixtures is given in Fig. 2for the 2P(0,v′′)-system. The single data points re-sult from a global fit which was only constraint byequation (1) whereas the lines correspond to theresults obtained by further constraining the fit byrelation (2). Both fits agree with each other butonly the latter one results in a minimal and con-sistent set of parameters which are summarized inTable 1. Since the quenching does not depend onthe excitation process, the above fitting procedurewas applied on the whole usable energy range from250 keV to 2000 keV in order to maximize statis-tics. To study the energy dependence of the fluo-
175
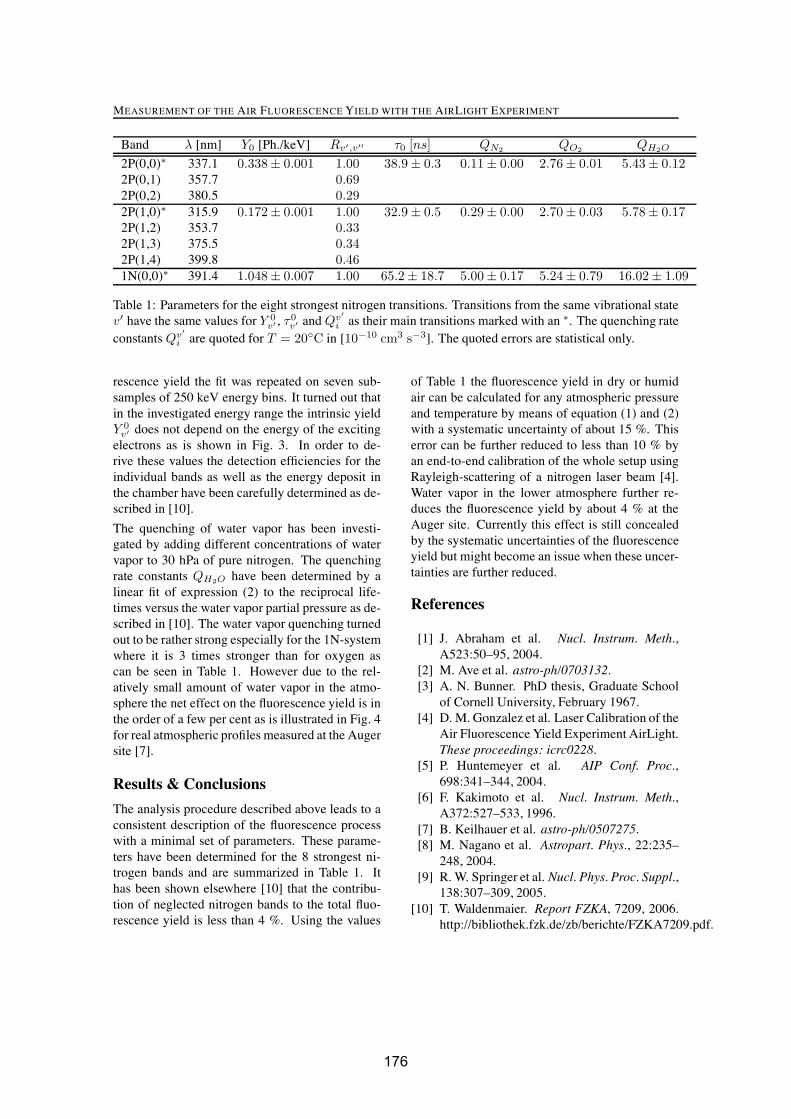
MEASUREMENT OF THE AIR FLUORESCENCE YIELD WITH THE AIRLIGHT EXPERIMENT
Band λ [nm] Y0 [Ph./keV] Rv′,v′′ τ0 [ns] QN2 QO2 QH2O
2P(0,0)∗ 337.1 0.338± 0.001 1.00 38.9 ± 0.3 0.11 ± 0.00 2.76 ± 0.01 5.43 ± 0.122P(0,1) 357.7 0.692P(0,2) 380.5 0.292P(1,0)∗ 315.9 0.172± 0.001 1.00 32.9 ± 0.5 0.29 ± 0.00 2.70 ± 0.03 5.78 ± 0.172P(1,2) 353.7 0.332P(1,3) 375.5 0.342P(1,4) 399.8 0.461N(0,0)∗ 391.4 1.048± 0.007 1.00 65.2 ± 18.7 5.00 ± 0.17 5.24 ± 0.79 16.02 ± 1.09
Table 1: Parameters for the eight strongest nitrogen transitions. Transitions from the same vibrational statev′ have the same values for Y 0
v′ , τ0v′ andQv′
i as their main transitions marked with an ∗. The quenching rateconstantsQv′
i are quoted for T = 20◦C in [10−10 cm3 s−3]. The quoted errors are statistical only.
rescence yield the fit was repeated on seven sub-samples of 250 keV energy bins. It turned out thatin the investigated energy range the intrinsic yieldY 0
v′ does not depend on the energy of the excitingelectrons as is shown in Fig. 3. In order to de-rive these values the detection efficiencies for theindividual bands as well as the energy deposit inthe chamber have been carefully determined as de-scribed in [10].
The quenching of water vapor has been investi-gated by adding different concentrations of watervapor to 30 hPa of pure nitrogen. The quenchingrate constants QH2O have been determined by alinear fit of expression (2) to the reciprocal life-times versus the water vapor partial pressure as de-scribed in [10]. The water vapor quenching turnedout to be rather strong especially for the 1N-systemwhere it is 3 times stronger than for oxygen ascan be seen in Table 1. However due to the rel-atively small amount of water vapor in the atmo-sphere the net effect on the fluorescence yield is inthe order of a few per cent as is illustrated in Fig. 4for real atmospheric profiles measured at the Augersite [7].
Results & Conclusions
The analysis procedure described above leads to aconsistent description of the fluorescence processwith a minimal set of parameters. These parame-ters have been determined for the 8 strongest ni-trogen bands and are summarized in Table 1. Ithas been shown elsewhere [10] that the contribu-tion of neglected nitrogen bands to the total fluo-rescence yield is less than 4 %. Using the values
of Table 1 the fluorescence yield in dry or humidair can be calculated for any atmospheric pressureand temperature by means of equation (1) and (2)with a systematic uncertainty of about 15 %. Thiserror can be further reduced to less than 10 % byan end-to-end calibration of the whole setup usingRayleigh-scattering of a nitrogen laser beam [4].Water vapor in the lower atmosphere further re-duces the fluorescence yield by about 4 % at theAuger site. Currently this effect is still concealedby the systematic uncertainties of the fluorescenceyield but might become an issue when these uncer-tainties are further reduced.
References
[1] J. Abraham et al. Nucl. Instrum. Meth.,A523:50–95, 2004.
[2] M. Ave et al. astro-ph/0703132.[3] A. N. Bunner. PhD thesis, Graduate School
of Cornell University, February 1967.[4] D. M. Gonzalez et al. Laser Calibration of the
Air Fluorescence Yield Experiment AirLight.These proceedings: icrc0228.
[5] P. Huntemeyer et al. AIP Conf. Proc.,698:341–344, 2004.
[6] F. Kakimoto et al. Nucl. Instrum. Meth.,A372:527–533, 1996.
[7] B. Keilhauer et al. astro-ph/0507275.[8] M. Nagano et al. Astropart. Phys., 22:235–
248, 2004.[9] R. W. Springer et al. Nucl. Phys. Proc. Suppl.,
138:307–309, 2005.[10] T. Waldenmaier. Report FZKA, 7209, 2006.
http://bibliothek.fzk.de/zb/berichte/FZKA7209.pdf.
176
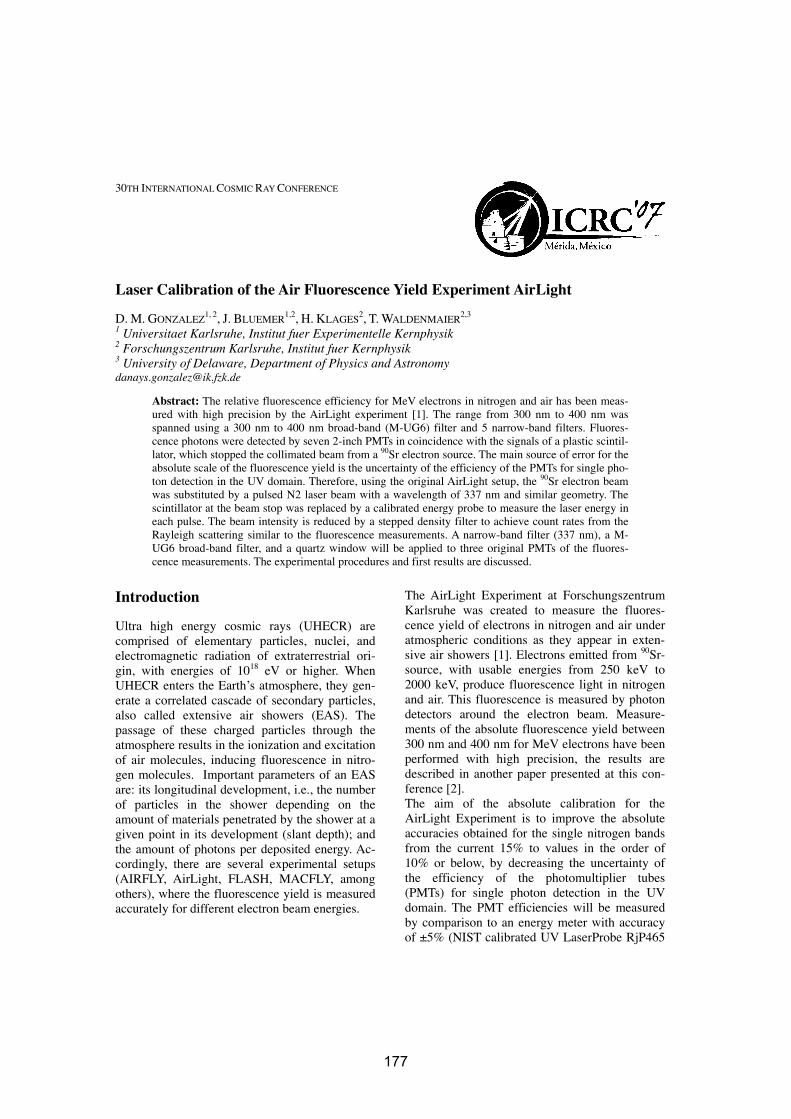
30TH INTERNATIONALCOSMIC RAYCONFERENCE
Laser Calibration of the Air Fluorescence Yield Experiment AirLight
D.M. GONZALEZ1, 2, J. BLUEMER1,2, H. KLAGES2, T.WALDENMAIER2,31 Universitaet Karlsruhe, Institut fuer Experimentelle Kernphysik2 Forschungszentrum Karlsruhe, Institut fuer Kernphysik3 University of Delaware, Department of Physics and [email protected]
Abstract: The relative fluorescence efficiency for MeV electrons in nitrogen and air has been meas-ured with high precision by the AirLight experiment [1]. The range from 300 nm to 400 nm wasspanned using a 300 nm to 400 nm broad-band (M-UG6) filter and 5 narrow-band filters. Fluores-cence photons were detected by seven 2-inch PMTs in coincidence with the signals of a plastic scintil-lator, which stopped the collimated beam from a 90Sr electron source. The main source of error for theabsolute scale of the fluorescence yield is the uncertainty of the efficiency of the PMTs for single pho-ton detection in the UV domain. Therefore, using the original AirLight setup, the 90Sr electron beamwas substituted by a pulsed N2 laser beam with a wavelength of 337 nm and similar geometry. Thescintillator at the beam stop was replaced by a calibrated energy probe to measure the laser energy ineach pulse. The beam intensity is reduced by a stepped density filter to achieve count rates from theRayleigh scattering similar to the fluorescence measurements. A narrow-band filter (337 nm), a M-UG6 broad-band filter, and a quartz window will be applied to three original PMTs of the fluores-cence measurements. The experimental procedures and first results are discussed.
Introduction
Ultra high energy cosmic rays (UHECR) arecomprised of elementary particles, nuclei, andelectromagnetic radiation of extraterrestrial ori-gin, with energies of 1018 eV or higher. WhenUHECR enters the Earth’s atmosphere, they gen-erate a correlated cascade of secondary particles,also called extensive air showers (EAS). Thepassage of these charged particles through theatmosphere results in the ionization and excitationof air molecules, inducing fluorescence in nitro-gen molecules. Important parameters of an EASare: its longitudinal development, i.e., the numberof particles in the shower depending on theamount of materials penetrated by the shower at agiven point in its development (slant depth); andthe amount of photons per deposited energy. Ac-cordingly, there are several experimental setups(AIRFLY, AirLight, FLASH, MACFLY, amongothers), where the fluorescence yield is measuredaccurately for different electron beam energies.
The AirLight Experiment at ForschungszentrumKarlsruhe was created to measure the fluores-cence yield of electrons in nitrogen and air underatmospheric conditions as they appear in exten-sive air showers [1]. Electrons emitted from 90Sr-source, with usable energies from 250 keV to2000 keV, produce fluorescence light in nitrogenand air. This fluorescence is measured by photondetectors around the electron beam. Measure-ments of the absolute fluorescence yield between300 nm and 400 nm for MeV electrons have beenperformed with high precision, the results aredescribed in another paper presented at this con-ference [2].The aim of the absolute calibration for theAirLight Experiment is to improve the absoluteaccuracies obtained for the single nitrogen bandsfrom the current 15% to values in the order of10% or below, by decreasing the uncertainty ofthe efficiency of the photomultiplier tubes(PMTs) for single photon detection in the UVdomain. The PMT efficiencies will be measuredby comparison to an energy meter with accuracyof ±5% (NIST calibrated UV LaserProbe RjP465
177
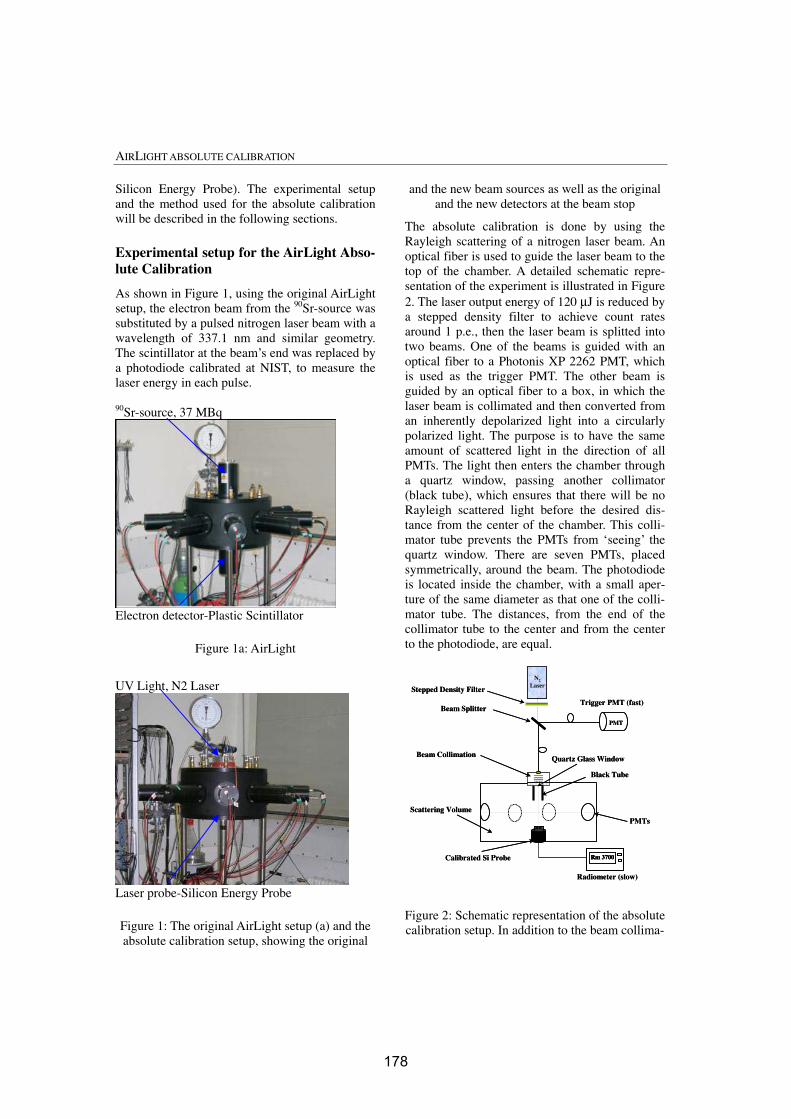
AIRLIGHTABSOLUTE CALIBRATION
Silicon Energy Probe). The experimental setupand the method used for the absolute calibrationwill be described in the following sections.
Experimental setup for the AirLight Abso-lute Calibration
As shown in Figure 1, using the original AirLightsetup, the electron beam from the 90Sr-source wassubstituted by a pulsed nitrogen laser beam with awavelength of 337.1 nm and similar geometry.The scintillator at the beam’s end was replaced bya photodiode calibrated at NIST, to measure thelaser energy in each pulse.
90Sr-source, 37 MBq
Electron detector-Plastic Scintillator
Figure 1a: AirLight
UV Light, N2 Laser
Laser probe-Silicon Energy Probe
Figure 1: The original AirLight setup (a) and theabsolute calibration setup, showing the original
and the new beam sources as well as the originaland the new detectors at the beam stop
The absolute calibration is done by using theRayleigh scattering of a nitrogen laser beam. Anoptical fiber is used to guide the laser beam to thetop of the chamber. A detailed schematic repre-sentation of the experiment is illustrated in Figure2. The laser output energy of 120 μJ is reduced bya stepped density filter to achieve count ratesaround 1 p.e., then the laser beam is splitted intotwo beams. One of the beams is guided with anoptical fiber to a Photonis XP 2262 PMT, whichis used as the trigger PMT. The other beam isguided by an optical fiber to a box, in which thelaser beam is collimated and then converted froman inherently depolarized light into a circularlypolarized light. The purpose is to have the sameamount of scattered light in the direction of allPMTs. The light then enters the chamber througha quartz window, passing another collimator(black tube), which ensures that there will be noRayleigh scattered light before the desired dis-tance from the center of the chamber. This colli-mator tube prevents the PMTs from ‘seeing’ thequartz window. There are seven PMTs, placedsymmetrically, around the beam. The photodiodeis located inside the chamber, with a small aper-ture of the same diameter as that one of the colli-mator tube. The distances, from the end of thecollimator tube to the center and from the centerto the photodiode, are equal.
N2
Laser
PMT
Rm 3700
Scattering Volume
Calibrated Si Probe
Beam Splitter
Stepped Density Filter
Trigger PMT (fast)
Radiometer (slow)
Beam Collimation
PMTs
Black Tube
Quartz Glass Window
N2
Laser
PMT
Rm 3700Rm 3700
Scattering Volume
Calibrated Si Probe
Beam Splitter
Stepped Density Filter
Trigger PMT (fast)
Radiometer (slow)
Beam Collimation
PMTs
Black Tube
Quartz Glass Window
Figure 2: Schematic representation of the absolutecalibration setup. In addition to the beam collima-
178
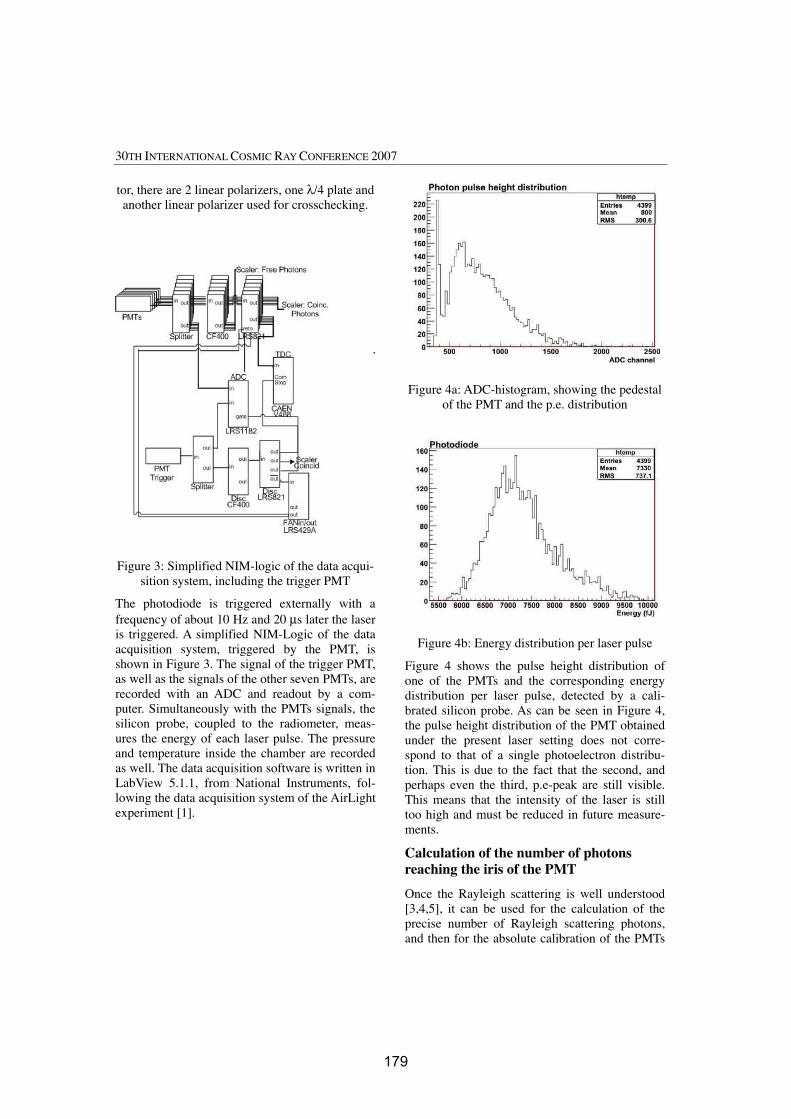
30TH INTERNATIONALCOSMIC RAYCONFERENCE 2007
tor, there are 2 linear polarizers, one λ/4 plate andanother linear polarizer used for crosschecking.
Figure 3: Simplified NIM-logic of the data acqui-sition system, including the trigger PMT
The photodiode is triggered externally with afrequency of about 10 Hz and 20 μs later the laseris triggered. A simplified NIM-Logic of the dataacquisition system, triggered by the PMT, isshown in Figure 3. The signal of the trigger PMT,as well as the signals of the other seven PMTs, arerecorded with an ADC and readout by a com-puter. Simultaneously with the PMTs signals, thesilicon probe, coupled to the radiometer, meas-ures the energy of each laser pulse. The pressureand temperature inside the chamber are recordedas well. The data acquisition software is written inLabView 5.1.1, from National Instruments, fol-lowing the data acquisition system of the AirLightexperiment [1].
Figure 4a: ADC-histogram, showing the pedestalof the PMT and the p.e. distribution
Figure 4b: Energy distribution per laser pulse
Figure 4 shows the pulse height distribution ofone of the PMTs and the corresponding energydistribution per laser pulse, detected by a cali-brated silicon probe. As can be seen in Figure 4,the pulse height distribution of the PMT obtainedunder the present laser setting does not corre-spond to that of a single photoelectron distribu-tion. This is due to the fact that the second, andperhaps even the third, p.e-peak are still visible.This means that the intensity of the laser is stilltoo high and must be reduced in future measure-ments.
Calculation of the number of photonsreaching the iris of the PMT
Once the Rayleigh scattering is well understood[3,4,5], it can be used for the calculation of theprecise number of Rayleigh scattering photons,and then for the absolute calibration of the PMTs
179
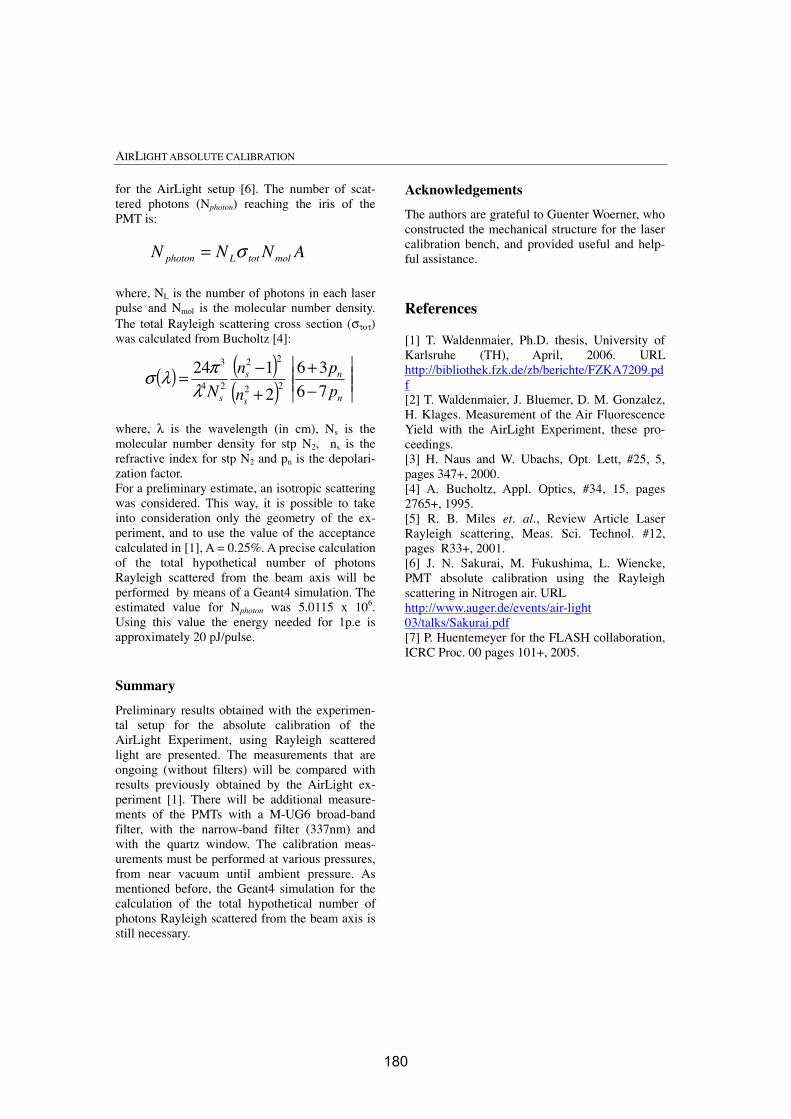
AIRLIGHTABSOLUTE CALIBRATION
for the AirLight setup [6]. The number of scat-tered photons (Nphoton) reaching the iris of thePMT is:
ANNN moltotLphoton σ=
where, NL is the number of photons in each laserpulse and Nmol is the molecular number density.The total Rayleigh scattering cross section (στοτ)was calculated from Bucholtz [4]:
( ) ( )( ) ��
�
����
�
−+
+−=
n
n
s
s
s p
p
n
n
N 76
36
2
12422
22
24
3
λπλσ
where, λ is the wavelength (in cm), Ns is themolecular number density for stp N2, ns is therefractive index for stp N2 and pn is the depolari-zation factor.For a preliminary estimate, an isotropic scatteringwas considered. This way, it is possible to takeinto consideration only the geometry of the ex-periment, and to use the value of the acceptancecalculated in [1], A = 0.25%. A precise calculationof the total hypothetical number of photonsRayleigh scattered from the beam axis will beperformed by means of a Geant4 simulation. Theestimated value for Nphoton was 5.0115 x 10
6.Using this value the energy needed for 1p.e isapproximately 20 pJ/pulse.
Summary
Preliminary results obtained with the experimen-tal setup for the absolute calibration of theAirLight Experiment, using Rayleigh scatteredlight are presented. The measurements that areongoing (without filters) will be compared withresults previously obtained by the AirLight ex-periment [1]. There will be additional measure-ments of the PMTs with a M-UG6 broad-bandfilter, with the narrow-band filter (337nm) andwith the quartz window. The calibration meas-urements must be performed at various pressures,from near vacuum until ambient pressure. Asmentioned before, the Geant4 simulation for thecalculation of the total hypothetical number ofphotons Rayleigh scattered from the beam axis isstill necessary.
Acknowledgements
The authors are grateful to Guenter Woerner, whoconstructed the mechanical structure for the lasercalibration bench, and provided useful and help-ful assistance.
References
[1] T. Waldenmaier, Ph.D. thesis, University ofKarlsruhe (TH), April, 2006. URLhttp://bibliothek.fzk.de/zb/berichte/FZKA7209.pdf[2] T. Waldenmaier, J. Bluemer, D. M. Gonzalez,H. Klages. Measurement of the Air FluorescenceYield with the AirLight Experiment, these pro-ceedings.[3] H. Naus and W. Ubachs, Opt. Lett, #25, 5,pages 347+, 2000.[4] A. Bucholtz, Appl. Optics, #34, 15, pages2765+, 1995.[5] R. B. Miles et. al., Review Article LaserRayleigh scattering, Meas. Sci. Technol. #12,pages R33+, 2001.[6] J. N. Sakurai, M. Fukushima, L. Wiencke,PMT absolute calibration using the Rayleighscattering in Nitrogen air. URLhttp://www.auger.de/events/air-light03/talks/Sakurai.pdf[7] P. Huentemeyer for the FLASH collaboration,ICRC Proc. 00 pages 101+, 2005.
180
30TH INTERNATIONAL COSMIC RAY CONFERENCE
The TRACER Project: Instrument Concept, Balloon Flights, and Analysis Proce-dures
D. MULLER, M. AVE, P.J. BOYLE, F. GAHBAUER, C. HOPPNER, J. HORANDELa, M. ICHIMURAb, D.MULLER AND A. ROMERO-WOLF
The University of Chicago, 5640 South Ellis Avenue, Chicago, IL 60637, USA(a) University of Karlsruhe, Germany (b) Hirosaki University, [email protected]
Abstract: Accurate measurements of the composition and energy spectra of cosmic rays beyond the TeVenergy region have been an experimental challenge for years. TRACER (“Transition Radiation Array forCosmic Energetic Radiation”), is currently the largest cosmic-ray detector for direct measurements, andhas been developed for long-duration balloon flights. The instrument is unconventional in that it usesonly electromagnetic processes, such as measurements of ionization energy loss, Cherenkov light, andtransition radiation, to make precision measurements that span more than four decades in energy, from 1GeV/nucleon to energies beyond 10 TeV/nucleon. In its first long-duration balloon flight from Antarcticain December 2003, TRACER measured the energy spectra of the primary galactic cosmic-ray nuclei fromoxygen (Z = 8) to iron (Z = 26). For a second LDB flight from Sweden in July 2006, the instrument wasmodified and upgraded in order to include the important light nuclei from boron (Z = 5) to nitrogen (Z =7). We discuss the performance of TRACER in these two flights, review the response of the individualdetector components, and the techniques employed in the data analysis.
Introduction
The TRACER instrument (“Transition RadiationArray for Cosmic Energetic Radiation”) has beendeveloped to provide direct measurements ofthe elemental composition and energy spectra ofcosmic-ray nuclei. The measurements shouldreach energies approaching the cosmic-ray “knee”,hence the instrument exhibits the largest geomet-ric factor (∼ 5m2ster) thus far realized in balloon-borne observations. TRACER has had three bal-loon flights: a test flight in New Mexico [1], andtwo long-duration balloon flights, in Antarctica [2]and in the Northern Hemisphere, respectively. Inthis paper, we shall summarize the overall pro-gram, including the key design and performancecharacteristics of the detector system.
Instrument Description
In order to minimize the mass-to-area ratio of theinstrument, TRACER uses purely electromagnetic
techniques to determine charge Z and energy E (orthe Lorentz-factor γ = E/mc2) of cosmic-ray nu-clei; a nuclear interaction in the detector is notneeded, and in fact, not desired. Thus, TRACERemploys a combination of Cherenkov counters,plastic scintillators, gaseous detectors for specifi cionization, and transition radiation detectors. Theparticles encountered in high-latitude flights mayhave a wide range of energies, from sub-relativisticenergies (< 1GeV/nucleon) up to the rare high-energy particles of interest here, with energieshigher by four orders of magnitude.
The discrimination of the rare high-energy par-ticles from the much more abundant (by aboutfour orders of magnitude) low-energy flux repre-sents a particular challenge for TRACER. This dis-crimination is achieved with an acrylic Cherenkovcounter, combined with ionization measurementswith plastic scintillators and gas proportional tubes(“dE/dx counter”). For sub-relativistic particlesabove the Cherenkov threshold, the Cherenkov sig-nal increases with energy and reaches saturationaround γ ∼ 10, while the ionization signal de-
181
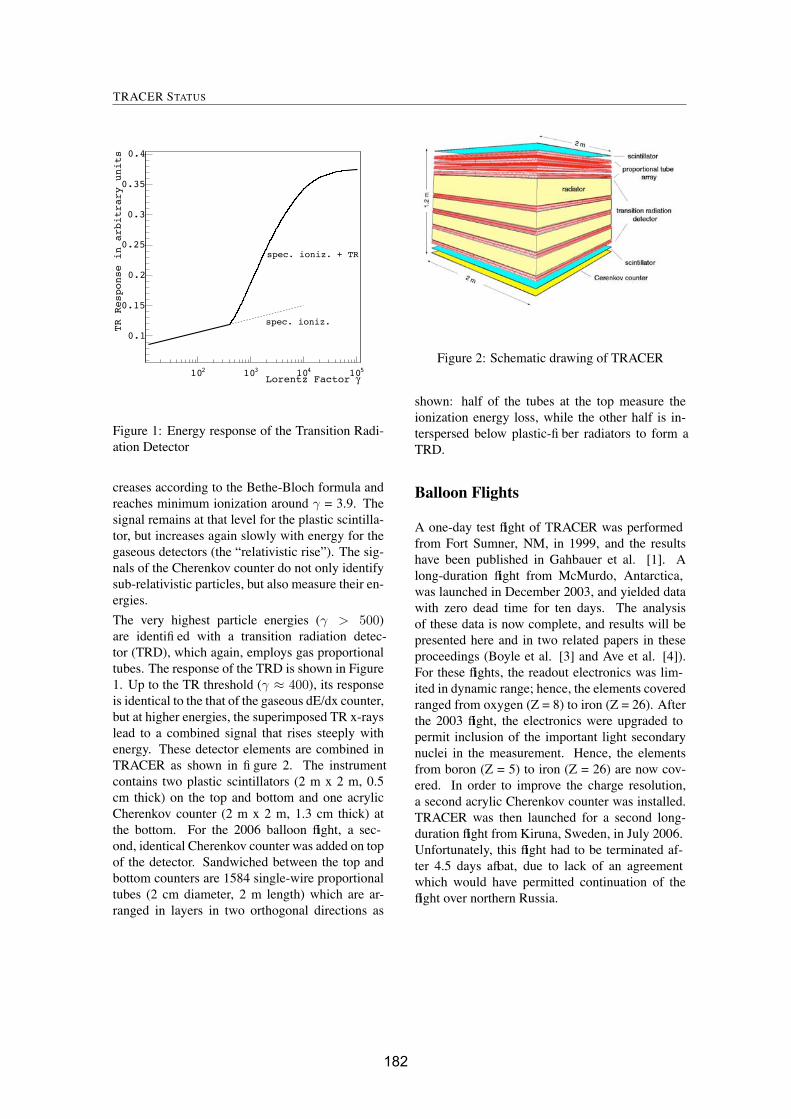
TRACER STATUS
�Lorentz Factor 210 310 410 510
TR Response in arbitrary units
0.1
0.15
0.2
0.25
0.3
0.35
0.4
spec. ioniz.
spec. ioniz. + TR
Figure 1: Energy response of the Transition Radi-ation Detector
creases according to the Bethe-Bloch formula andreaches minimum ionization around γ = 3.9. Thesignal remains at that level for the plastic scintilla-tor, but increases again slowly with energy for thegaseous detectors (the “relativistic rise”). The sig-nals of the Cherenkov counter do not only identifysub-relativistic particles, but also measure their en-ergies.
The very highest particle energies (γ > 500)are identifi ed with a transition radiation detec-tor (TRD), which again, employs gas proportionaltubes. The response of the TRD is shown in Figure1. Up to the TR threshold (γ ≈ 400), its responseis identical to the that of the gaseous dE/dx counter,but at higher energies, the superimposed TR x-rayslead to a combined signal that rises steeply withenergy. These detector elements are combined inTRACER as shown in fi gure 2. The instrumentcontains two plastic scintillators (2 m x 2 m, 0.5cm thick) on the top and bottom and one acrylicCherenkov counter (2 m x 2 m, 1.3 cm thick) atthe bottom. For the 2006 balloon flight, a sec-ond, identical Cherenkov counter was added on topof the detector. Sandwiched between the top andbottom counters are 1584 single-wire proportionaltubes (2 cm diameter, 2 m length) which are ar-ranged in layers in two orthogonal directions as
Figure 2: Schematic drawing of TRACER
shown: half of the tubes at the top measure theionization energy loss, while the other half is in-terspersed below plastic-fi ber radiators to form aTRD.
Balloon Flights
A one-day test flight of TRACER was performedfrom Fort Sumner, NM, in 1999, and the resultshave been published in Gahbauer et al. [1]. Along-duration flight from McMurdo, Antarctica,was launched in December 2003, and yielded datawith zero dead time for ten days. The analysisof these data is now complete, and results will bepresented here and in two related papers in theseproceedings (Boyle et al. [3] and Ave et al. [4]).For these flights, the readout electronics was lim-ited in dynamic range; hence, the elements coveredranged from oxygen (Z = 8) to iron (Z = 26). Afterthe 2003 flight, the electronics were upgraded topermit inclusion of the important light secondarynuclei in the measurement. Hence, the elementsfrom boron (Z = 5) to iron (Z = 26) are now cov-ered. In order to improve the charge resolution,a second acrylic Cherenkov counter was installed.TRACER was then launched for a second long-duration flight from Kiruna, Sweden, in July 2006.Unfortunately, this flight had to be terminated af-ter 4.5 days afloat, due to lack of an agreementwhich would have permitted continuation of theflight over northern Russia.
182
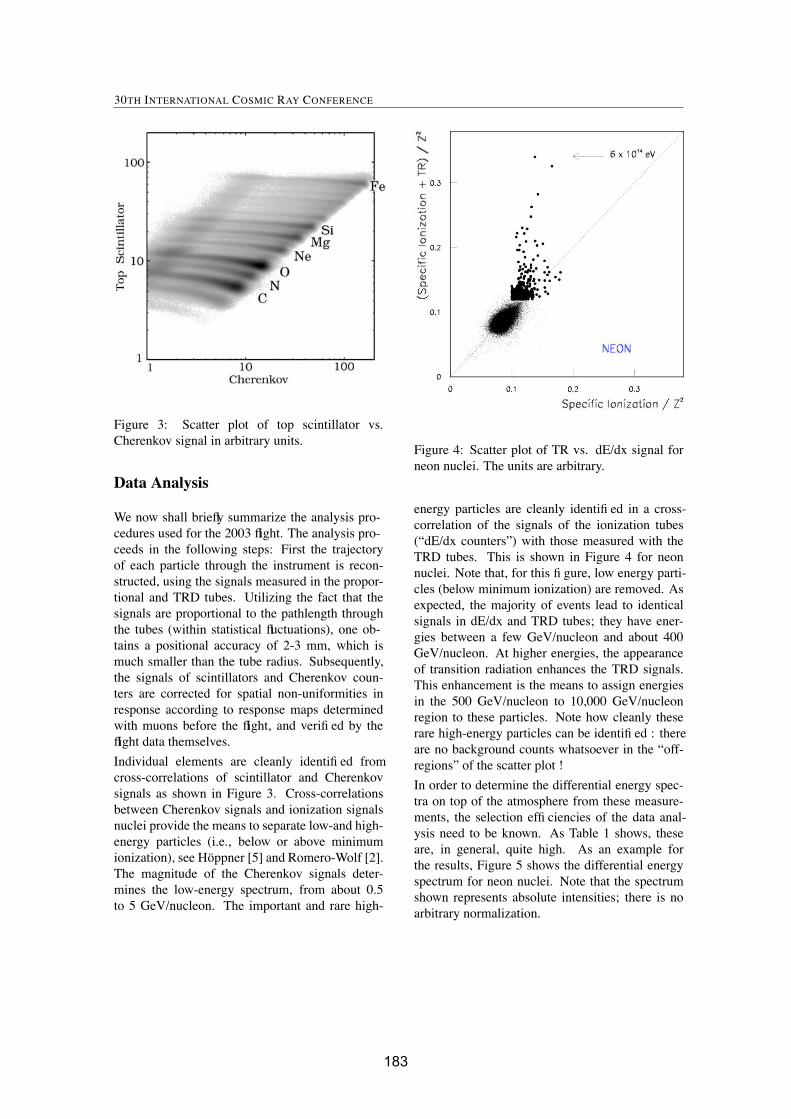
30TH INTERNATIONAL COSMIC RAY CONFERENCE
Figure 3: Scatter plot of top scintillator vs.Cherenkov signal in arbitrary units.
Data Analysis
We now shall briefly summarize the analysis pro-cedures used for the 2003 flight. The analysis pro-ceeds in the following steps: First the trajectoryof each particle through the instrument is recon-structed, using the signals measured in the propor-tional and TRD tubes. Utilizing the fact that thesignals are proportional to the pathlength throughthe tubes (within statistical fluctuations), one ob-tains a positional accuracy of 2-3 mm, which ismuch smaller than the tube radius. Subsequently,the signals of scintillators and Cherenkov coun-ters are corrected for spatial non-uniformities inresponse according to response maps determinedwith muons before the flight, and verifi ed by theflight data themselves.
Individual elements are cleanly identifi ed fromcross-correlations of scintillator and Cherenkovsignals as shown in Figure 3. Cross-correlationsbetween Cherenkov signals and ionization signalsnuclei provide the means to separate low-and high-energy particles (i.e., below or above minimumionization), see Hoppner [5] and Romero-Wolf [2].The magnitude of the Cherenkov signals deter-mines the low-energy spectrum, from about 0.5to 5 GeV/nucleon. The important and rare high-
Figure 4: Scatter plot of TR vs. dE/dx signal forneon nuclei. The units are arbitrary.
energy particles are cleanly identifi ed in a cross-correlation of the signals of the ionization tubes(“dE/dx counters”) with those measured with theTRD tubes. This is shown in Figure 4 for neonnuclei. Note that, for this fi gure, low energy parti-cles (below minimum ionization) are removed. Asexpected, the majority of events lead to identicalsignals in dE/dx and TRD tubes; they have ener-gies between a few GeV/nucleon and about 400GeV/nucleon. At higher energies, the appearanceof transition radiation enhances the TRD signals.This enhancement is the means to assign energiesin the 500 GeV/nucleon to 10,000 GeV/nucleonregion to these particles. Note how cleanly theserare high-energy particles can be identifi ed : thereare no background counts whatsoever in the “off-regions” of the scatter plot !
In order to determine the differential energy spec-tra on top of the atmosphere from these measure-ments, the selection effi ciencies of the data anal-ysis need to be known. As Table 1 shows, theseare, in general, quite high. As an example forthe results, Figure 5 shows the differential energyspectrum for neon nuclei. Note that the spectrumshown represents absolute intensities; there is noarbitrary normalization.
183
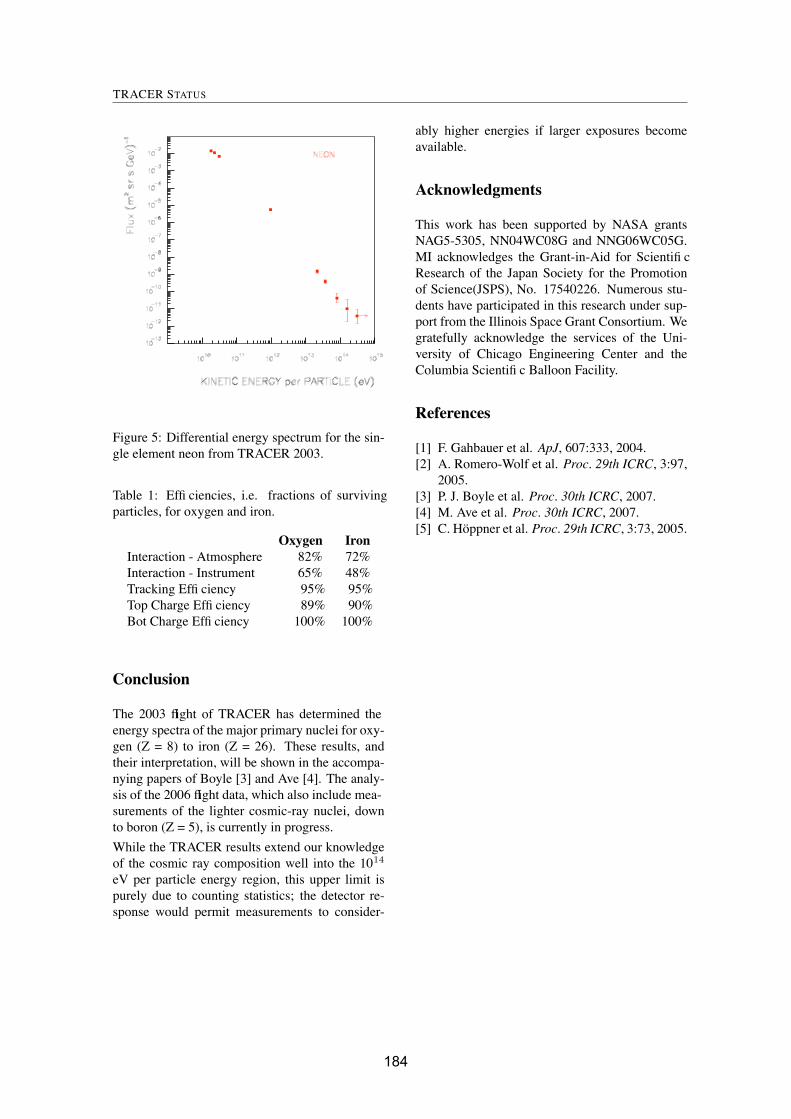
TRACER STATUS
Figure 5: Differential energy spectrum for the sin-gle element neon from TRACER 2003.
Table 1: Effi ciencies, i.e. fractions of survivingparticles, for oxygen and iron.
Oxygen IronInteraction - Atmosphere 82% 72%Interaction - Instrument 65% 48%Tracking Effi ciency 95% 95%Top Charge Effi ciency 89% 90%Bot Charge Effi ciency 100% 100%
Conclusion
The 2003 flight of TRACER has determined theenergy spectra of the major primary nuclei for oxy-gen (Z = 8) to iron (Z = 26). These results, andtheir interpretation, will be shown in the accompa-nying papers of Boyle [3] and Ave [4]. The analy-sis of the 2006 flight data, which also include mea-surements of the lighter cosmic-ray nuclei, downto boron (Z = 5), is currently in progress.
While the TRACER results extend our knowledgeof the cosmic ray composition well into the 1014
eV per particle energy region, this upper limit ispurely due to counting statistics; the detector re-sponse would permit measurements to consider-
ably higher energies if larger exposures becomeavailable.
Acknowledgments
This work has been supported by NASA grantsNAG5-5305, NN04WC08G and NNG06WC05G.MI acknowledges the Grant-in-Aid for Scientifi cResearch of the Japan Society for the Promotionof Science(JSPS), No. 17540226. Numerous stu-dents have participated in this research under sup-port from the Illinois Space Grant Consortium. Wegratefully acknowledge the services of the Uni-versity of Chicago Engineering Center and theColumbia Scientifi c Balloon Facility.
References
[1] F. Gahbauer et al. ApJ, 607:333, 2004.[2] A. Romero-Wolf et al. Proc. 29th ICRC, 3:97,
2005.[3] P. J. Boyle et al. Proc. 30th ICRC, 2007.[4] M. Ave et al. Proc. 30th ICRC, 2007.[5] C. Hoppner et al. Proc. 29th ICRC, 3:73, 2005.
184
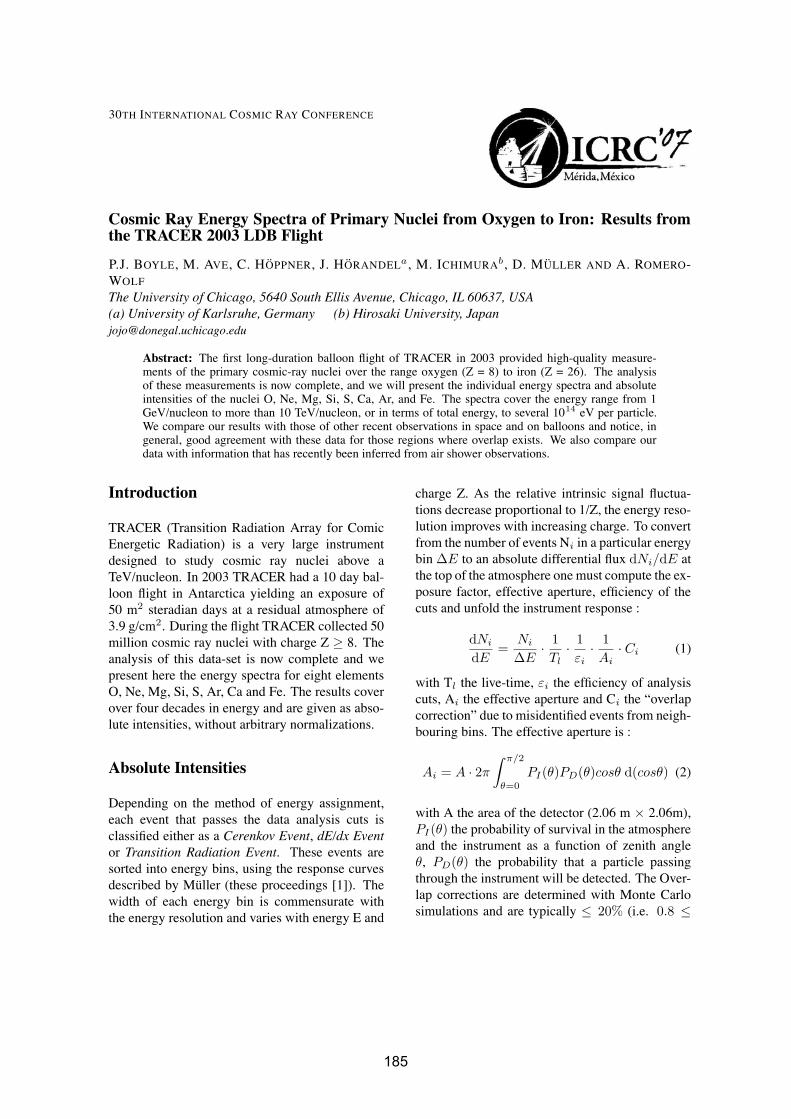
30TH INTERNATIONAL COSMIC RAY CONFERENCE
Cosmic Ray Energy Spectra of Primary Nuclei from Oxygen to Iron: Results fromthe TRACER 2003 LDB Flight
P.J. BOYLE, M. AVE, C. HOPPNER, J. HORANDELa, M. ICHIMURAb, D. MULLER AND A. ROMERO-WOLF
The University of Chicago, 5640 South Ellis Avenue, Chicago, IL 60637, USA(a) University of Karlsruhe, Germany (b) Hirosaki University, [email protected]
Abstract: The first long-duration balloon flight of TRACER in 2003 provided high-quality measure-ments of the primary cosmic-ray nuclei over the range oxygen (Z = 8) to iron (Z = 26). The analysisof these measurements is now complete, and we will present the individual energy spectra and absoluteintensities of the nuclei O, Ne, Mg, Si, S, Ca, Ar, and Fe. The spectra cover the energy range from 1GeV/nucleon to more than 10 TeV/nucleon, or in terms of total energy, to several 1014 eV per particle.We compare our results with those of other recent observations in space and on balloons and notice, ingeneral, good agreement with these data for those regions where overlap exists. We also compare ourdata with information that has recently been inferred from air shower observations.
Introduction
TRACER (Transition Radiation Array for ComicEnergetic Radiation) is a very large instrumentdesigned to study cosmic ray nuclei above aTeV/nucleon. In 2003 TRACER had a 10 day bal-loon flight in Antarctica yielding an exposure of50 m2 steradian days at a residual atmosphere of3.9 g/cm2. During the flight TRACER collected 50million cosmic ray nuclei with charge Z ≥ 8. Theanalysis of this data-set is now complete and wepresent here the energy spectra for eight elementsO, Ne, Mg, Si, S, Ar, Ca and Fe. The results coverover four decades in energy and are given as abso-lute intensities, without arbitrary normalizations.
Absolute Intensities
Depending on the method of energy assignment,each event that passes the data analysis cuts isclassified either as a Cerenkov Event, dE/dx Eventor Transition Radiation Event. These events aresorted into energy bins, using the response curvesdescribed by Muller (these proceedings [1]). Thewidth of each energy bin is commensurate withthe energy resolution and varies with energy E and
charge Z. As the relative intrinsic signal fluctua-tions decrease proportional to 1/Z, the energy reso-lution improves with increasing charge. To convertfrom the number of events Ni in a particular energybin ΔE to an absolute differential flux dNi/dE atthe top of the atmosphere one must compute the ex-posure factor, effective aperture, efficiency of thecuts and unfold the instrument response :
dNi
dE=
Ni
ΔE· 1Tl
· 1εi
· 1Ai
· Ci (1)
with Tl the live-time, εi the efficiency of analysiscuts, Ai the effective aperture and Ci the “overlapcorrection” due to misidentified events from neigh-bouring bins. The effective aperture is :
Ai = A · 2π
∫ π/2
θ=0
PI(θ)PD(θ)cosθ d(cosθ) (2)
with A the area of the detector (2.06 m × 2.06m),PI(θ) the probability of survival in the atmosphereand the instrument as a function of zenith angleθ, PD(θ) the probability that a particle passingthrough the instrument will be detected. The Over-lap corrections are determined with Monte Carlosimulations and are typically ≤ 20% (i.e. 0.8 ≤
185
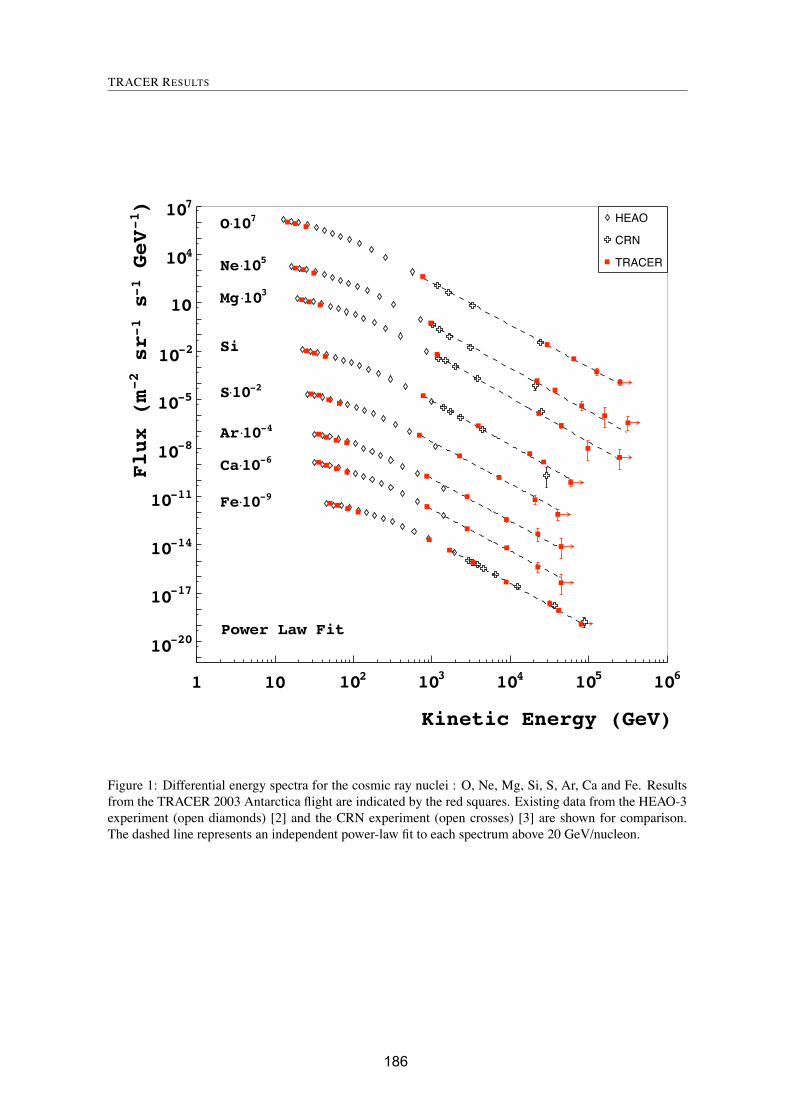
TRACER RESULTS
Kinetic Energy (GeV)
1 10 210 310 410 510 610
)-1
GeV
-1
s
-1
sr
-2
Flux (m
-2010
-1710
-1410
-1110
-810
-510
-210
10
410
710 HEAO
CRN
TRACER
710�O
510�Ne
310�Mg
Si
-210�S
-410�Ar
-610�Ca
-910�Fe
Power Law Fit
Figure 1: Differential energy spectra for the cosmic ray nuclei : O, Ne, Mg, Si, S, Ar, Ca and Fe. Resultsfrom the TRACER 2003 Antarctica flight are indicated by the red squares. Existing data from the HEAO-3experiment (open diamonds) [2] and the CRN experiment (open crosses) [3] are shown for comparison.The dashed line represents an independent power-law fit to each spectrum above 20 GeV/nucleon.
186
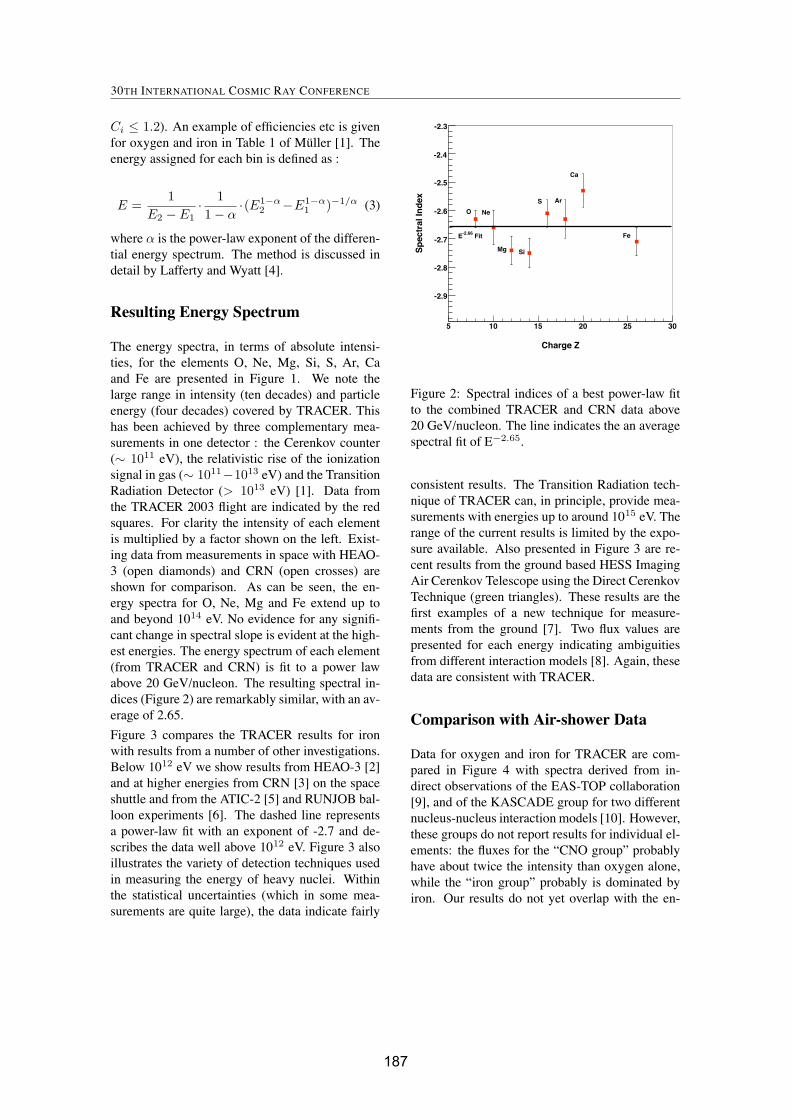
30TH INTERNATIONAL COSMIC RAY CONFERENCE
Ci ≤ 1.2). An example of efficiencies etc is givenfor oxygen and iron in Table 1 of Muller [1]. Theenergy assigned for each bin is defined as :
E =1
E2 − E1· 11 − α
·(E1−α2 −E1−α
1 )−1/α (3)
where α is the power-law exponent of the differen-tial energy spectrum. The method is discussed indetail by Lafferty and Wyatt [4].
Resulting Energy Spectrum
The energy spectra, in terms of absolute intensi-ties, for the elements O, Ne, Mg, Si, S, Ar, Caand Fe are presented in Figure 1. We note thelarge range in intensity (ten decades) and particleenergy (four decades) covered by TRACER. Thishas been achieved by three complementary mea-surements in one detector : the Cerenkov counter(∼ 1011 eV), the relativistic rise of the ionizationsignal in gas (∼ 1011−1013 eV) and the TransitionRadiation Detector (> 1013 eV) [1]. Data fromthe TRACER 2003 flight are indicated by the redsquares. For clarity the intensity of each elementis multiplied by a factor shown on the left. Exist-ing data from measurements in space with HEAO-3 (open diamonds) and CRN (open crosses) areshown for comparison. As can be seen, the en-ergy spectra for O, Ne, Mg and Fe extend up toand beyond 1014 eV. No evidence for any signifi-cant change in spectral slope is evident at the high-est energies. The energy spectrum of each element(from TRACER and CRN) is fit to a power lawabove 20 GeV/nucleon. The resulting spectral in-dices (Figure 2) are remarkably similar, with an av-erage of 2.65.
Figure 3 compares the TRACER results for ironwith results from a number of other investigations.Below 1012 eV we show results from HEAO-3 [2]and at higher energies from CRN [3] on the spaceshuttle and from the ATIC-2 [5] and RUNJOB bal-loon experiments [6]. The dashed line representsa power-law fit with an exponent of -2.7 and de-scribes the data well above 1012 eV. Figure 3 alsoillustrates the variety of detection techniques usedin measuring the energy of heavy nuclei. Withinthe statistical uncertainties (which in some mea-surements are quite large), the data indicate fairly
Charge Z
5 10 15 20 25 30
Sp
ectr
al In
dex
-2.9
-2.8
-2.7
-2.6
-2.5
-2.4
-2.3
O Ne
Mg Si
S Ar
Ca
Fe Fit-2.66E
Figure 2: Spectral indices of a best power-law fitto the combined TRACER and CRN data above20 GeV/nucleon. The line indicates the an averagespectral fit of E−2.65.
consistent results. The Transition Radiation tech-nique of TRACER can, in principle, provide mea-surements with energies up to around 1015 eV. Therange of the current results is limited by the expo-sure available. Also presented in Figure 3 are re-cent results from the ground based HESS ImagingAir Cerenkov Telescope using the Direct CerenkovTechnique (green triangles). These results are thefirst examples of a new technique for measure-ments from the ground [7]. Two flux values arepresented for each energy indicating ambiguitiesfrom different interaction models [8]. Again, thesedata are consistent with TRACER.
Comparison with Air-shower Data
Data for oxygen and iron for TRACER are com-pared in Figure 4 with spectra derived from in-direct observations of the EAS-TOP collaboration[9], and of the KASCADE group for two differentnucleus-nucleus interaction models [10]. However,these groups do not report results for individual el-ements: the fluxes for the “CNO group” probablyhave about twice the intensity than oxygen alone,while the “iron group” probably is dominated byiron. Our results do not yet overlap with the en-
187

TRACER RESULTS
Figure 3: Iron energy spectrum above 1010eVper particle in units of m2 ster−1 s−1, highlight-ing the complementarity between detection tech-niques. TRACER (red squares), HEAO-3 [2](black diamonds), CRN [3] (black crosses), ATIC-2 [5] (black open circles), RUNJOB [6] (blue opencircles) and HESS [8] (green stars).
ergy region of the air shower data, but the gap isbecoming smaller, in particular for oxygen. Addi-tional measurements will indeed lead to significantconstraints on the air shower interpretations.
Conclusion
The TRACER 2003 data represent the most de-tailed measurements to date for heavy nucleiabove a TeV/nucleon with single charge resolution.While the results do not reveal any surprising fea-tures in the cosmic ray energy spectra at high ener-gies, they begin to provide stringent constraints onthe conventional models on galactic propagation.The analysis of the TRACER results in the contextof these models is discussed in these proceedings(Ave et al. [11]).
Figure 4: Energy Spectra from TRACER and fromthe interpretation of air shower data of KASCADE(for two different interaction models) and of EAS-TOP (two data points for each energy are given,representing upper and lower limits). The spectraare for oxygen and for iron for TRACER, but forthe “CNO-group” and the “Fe-group” for the otherobservations.
We acknowledge support as summarized in Mulleret al [1].
References
[1] D. Muller et al. Proc. 30th ICRC, 2007.[2] J. J. Engelmann et al. A&A, 233:96, 1990.[3] D. Muller et al. ApJ, 374:356–365, 1991.[4] J. D. Lafferty and T. R. Wyatt. NIM A,
355:541, 1995.[5] A. D. Panov et al. ArXiv e-print, 2006.[6] V. A. Derbina et al. ApJ, L, 628:L41, 2005.[7] D. B. Kieda et al. Proc. 27th ICRC, 4:1533,
2001.[8] F. Aharonian et al. Phys. Rev. D,
75(4):042004–, 2007.[9] G. Navarra et al. Proc. 28th ICRC, 1:147,
2003.[10] T. Antoni et al. APh, 24:1–2, 2005.[11] M. Ave et al. Proc. 30th ICRC, 2007.
188
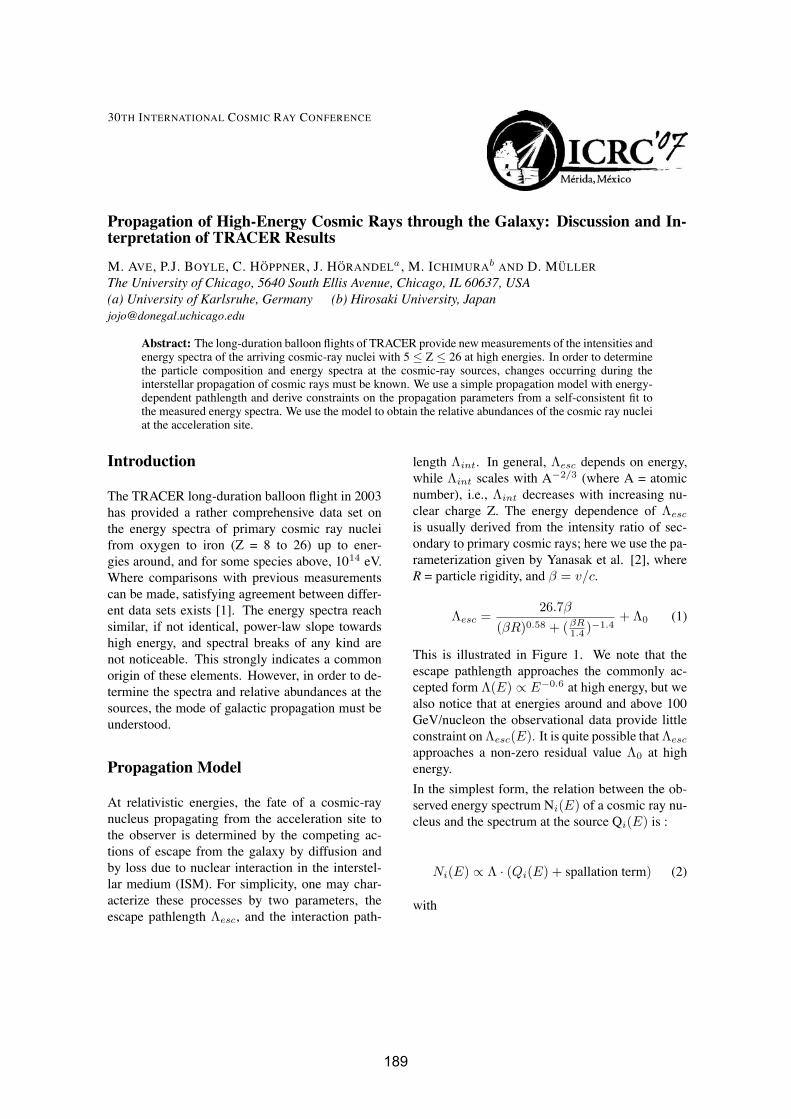
30TH INTERNATIONAL COSMIC RAY CONFERENCE
Propagation of High-Energy Cosmic Rays through the Galaxy: Discussion and In-terpretation of TRACER Results
M. AVE, P.J. BOYLE, C. HOPPNER, J. HORANDELa, M. ICHIMURAb AND D. MULLER
The University of Chicago, 5640 South Ellis Avenue, Chicago, IL 60637, USA(a) University of Karlsruhe, Germany (b) Hirosaki University, [email protected]
Abstract: The long-duration balloon flights of TRACER provide newmeasurements of the intensities andenergy spectra of the arriving cosmic-ray nuclei with 5 ≤ Z ≤ 26 at high energies. In order to determinethe particle composition and energy spectra at the cosmic-ray sources, changes occurring during theinterstellar propagation of cosmic rays must be known. We use a simple propagation model with energy-dependent pathlength and derive constraints on the propagation parameters from a self-consistent fit tothe measured energy spectra. We use the model to obtain the relative abundances of the cosmic ray nucleiat the acceleration site.
Introduction
The TRACER long-duration balloon flight in 2003has provided a rather comprehensive data set onthe energy spectra of primary cosmic ray nucleifrom oxygen to iron (Z = 8 to 26) up to ener-gies around, and for some species above, 1014 eV.Where comparisons with previous measurementscan be made, satisfying agreement between differ-ent data sets exists [1]. The energy spectra reachsimilar, if not identical, power-law slope towardshigh energy, and spectral breaks of any kind arenot noticeable. This strongly indicates a commonorigin of these elements. However, in order to de-termine the spectra and relative abundances at thesources, the mode of galactic propagation must beunderstood.
Propagation Model
At relativistic energies, the fate of a cosmic-raynucleus propagating from the acceleration site tothe observer is determined by the competing ac-tions of escape from the galaxy by diffusion andby loss due to nuclear interaction in the interstel-lar medium (ISM). For simplicity, one may char-acterize these processes by two parameters, theescape pathlength Λesc, and the interaction path-
length Λint. In general, Λesc depends on energy,while Λint scales with A−2/3 (where A = atomicnumber), i.e., Λint decreases with increasing nu-clear charge Z. The energy dependence of Λesc
is usually derived from the intensity ratio of sec-ondary to primary cosmic rays; here we use the pa-rameterization given by Yanasak et al. [2], whereR = particle rigidity, and β = v/c.
Λesc =26.7β
(βR)0.58 + (βR
1.4 )−1.4+ Λ0 (1)
This is illustrated in Figure 1. We note that theescape pathlength approaches the commonly ac-cepted form Λ(E) ∝ E−0.6 at high energy, but wealso notice that at energies around and above 100GeV/nucleon the observational data provide littleconstraint onΛesc(E). It is quite possible thatΛesc
approaches a non-zero residual value Λ0 at highenergy.
In the simplest form, the relation between the ob-served energy spectrum Ni(E) of a cosmic ray nu-cleus and the spectrum at the source Qi(E) is :
Ni(E) ∝ Λ · (Qi(E) + spallation term) (2)
with
189
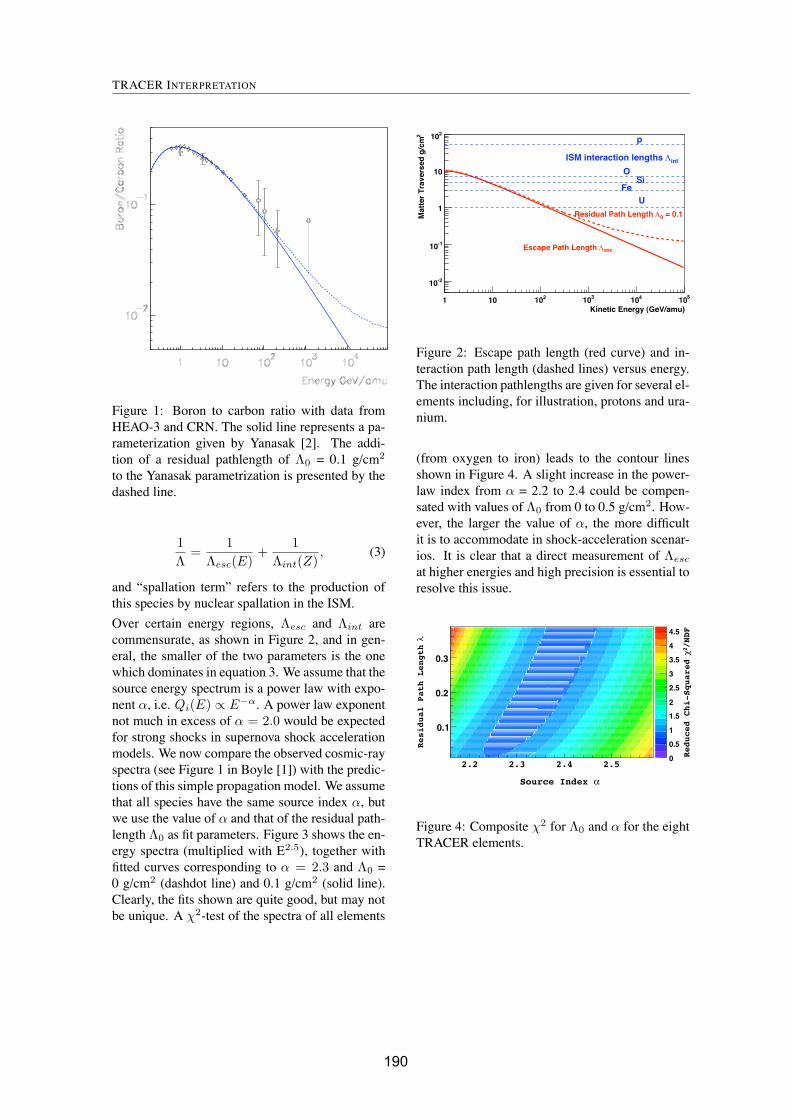
TRACER INTERPRETATION
Figure 1: Boron to carbon ratio with data fromHEAO-3 and CRN. The solid line represents a pa-rameterization given by Yanasak [2]. The addi-tion of a residual pathlength of Λ0 = 0.1 g/cm2
to the Yanasak parametrization is presented by thedashed line.
1Λ
=1
Λesc(E)+
1Λint(Z)
, (3)
and “spallation term” refers to the production ofthis species by nuclear spallation in the ISM.
Over certain energy regions, Λesc and Λint arecommensurate, as shown in Figure 2, and in gen-eral, the smaller of the two parameters is the onewhich dominates in equation 3. We assume that thesource energy spectrum is a power law with expo-nent α, i.e. Qi(E) ∝ E−α. A power law exponentnot much in excess of α = 2.0 would be expectedfor strong shocks in supernova shock accelerationmodels. We now compare the observed cosmic-rayspectra (see Figure 1 in Boyle [1]) with the predic-tions of this simple propagation model. We assumethat all species have the same source index α, butwe use the value of α and that of the residual path-length Λ0 as fit parameters. Figure 3 shows the en-ergy spectra (multiplied with E2.5), together withfitted curves corresponding to α = 2.3 and Λ0 =0 g/cm2 (dashdot line) and 0.1 g/cm2 (solid line).Clearly, the fits shown are quite good, but may notbe unique. A χ2-test of the spectra of all elements
Kinetic Energy (GeV/amu)1 10 210 310 410 510
2M
atte
r T
rave
rsed
g/c
m
-210
-110
1
10
210
int�ISM interaction lengths
esc�Escape Path Length
= 0.10�Residual Path Length
OSi
U
p
Fe
Figure 2: Escape path length (red curve) and in-teraction path length (dashed lines) versus energy.The interaction pathlengths are given for several el-ements including, for illustration, protons and ura-nium.
(from oxygen to iron) leads to the contour linesshown in Figure 4. A slight increase in the power-law index from α = 2.2 to 2.4 could be compen-sated with values of Λ0 from 0 to 0.5 g/cm2. How-ever, the larger the value of α, the more difficultit is to accommodate in shock-acceleration scenar-ios. It is clear that a direct measurement of Λesc
at higher energies and high precision is essential toresolve this issue.
�Source Index
�Residual Path Length /NDF
2�
Reduced Chi-Squared
2.2 2.3 2.4 2.5
0.1
0.2
0.3
0
0.5
1
1.5
2
2.5
3
3.5
4
4.5
Figure 4: Composite χ2 for Λ0 and α for the eightTRACER elements.
190
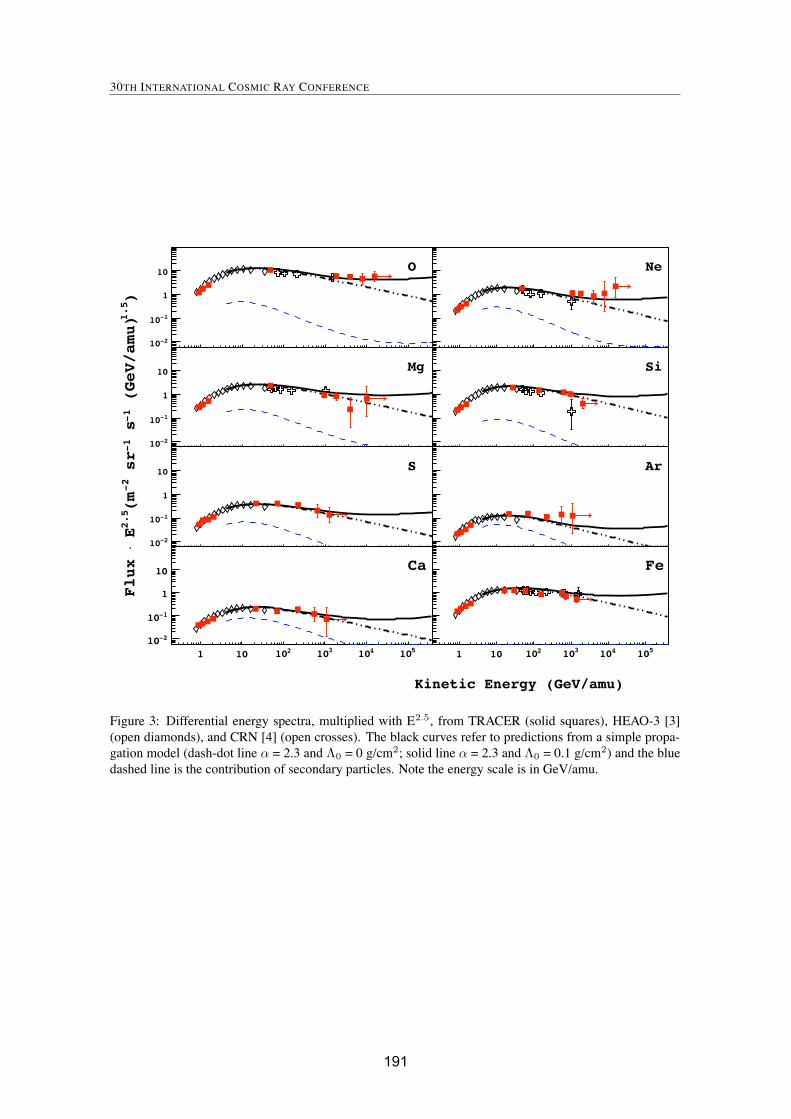
30TH INTERNATIONAL COSMIC RAY CONFERENCE
Kinetic Energy (GeV/amu)
)1.5
(GeV/amu)
-1
s
-1
sr
-2
(m
2.5
E
�Flux
-210
-110
1
10 O
-210
-110
1
10 Mg
-210
-110
1
10 S
1 10 210 310 410 510
-210
-110
1
10 Ca
Ne
Si
Ar
1 10 210 310 410 510
Fe
Figure 3: Differential energy spectra, multiplied with E2.5, from TRACER (solid squares), HEAO-3 [3](open diamonds), and CRN [4] (open crosses). The black curves refer to predictions from a simple propa-gation model (dash-dot line α = 2.3 and Λ0 = 0 g/cm2; solid line α = 2.3 and Λ0 = 0.1 g/cm2) and the bluedashed line is the contribution of secondary particles. Note the energy scale is in GeV/amu.
191
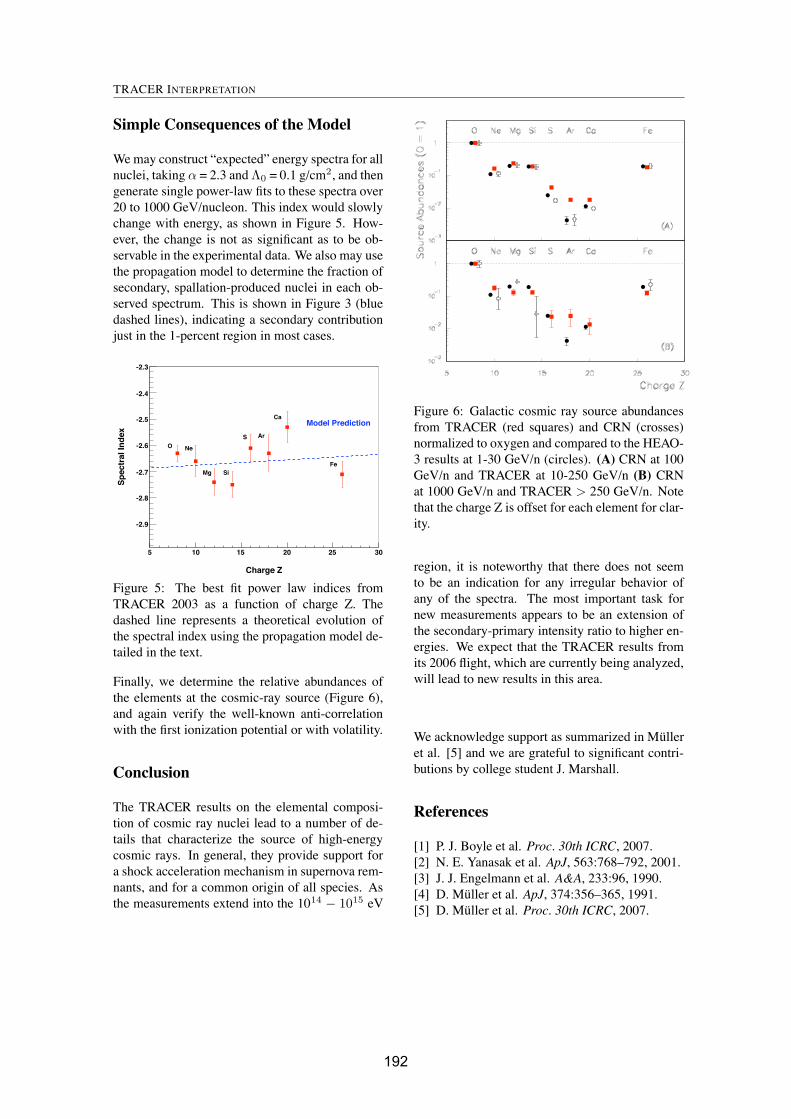
TRACER INTERPRETATION
Simple Consequences of the Model
Wemay construct “expected” energy spectra for allnuclei, taking α = 2.3 andΛ0 = 0.1 g/cm2, and thengenerate single power-law fits to these spectra over20 to 1000 GeV/nucleon. This index would slowlychange with energy, as shown in Figure 5. How-ever, the change is not as significant as to be ob-servable in the experimental data. We also may usethe propagation model to determine the fraction ofsecondary, spallation-produced nuclei in each ob-served spectrum. This is shown in Figure 3 (bluedashed lines), indicating a secondary contributionjust in the 1-percent region in most cases.
Charge Z
5 10 15 20 25 30
Sp
ectr
al In
dex
-2.9
-2.8
-2.7
-2.6
-2.5
-2.4
-2.3
O Ne
Mg Si
S Ar
Ca
Fe
Model Prediction
Figure 5: The best fit power law indices fromTRACER 2003 as a function of charge Z. Thedashed line represents a theoretical evolution ofthe spectral index using the propagation model de-tailed in the text.
Finally, we determine the relative abundances ofthe elements at the cosmic-ray source (Figure 6),and again verify the well-known anti-correlationwith the first ionization potential or with volatility.
Conclusion
The TRACER results on the elemental composi-tion of cosmic ray nuclei lead to a number of de-tails that characterize the source of high-energycosmic rays. In general, they provide support fora shock acceleration mechanism in supernova rem-nants, and for a common origin of all species. Asthe measurements extend into the 1014 − 1015 eV
Figure 6: Galactic cosmic ray source abundancesfrom TRACER (red squares) and CRN (crosses)normalized to oxygen and compared to the HEAO-3 results at 1-30 GeV/n (circles). (A) CRN at 100GeV/n and TRACER at 10-250 GeV/n (B) CRNat 1000 GeV/n and TRACER > 250 GeV/n. Notethat the charge Z is offset for each element for clar-ity.
region, it is noteworthy that there does not seemto be an indication for any irregular behavior ofany of the spectra. The most important task fornew measurements appears to be an extension ofthe secondary-primary intensity ratio to higher en-ergies. We expect that the TRACER results fromits 2006 flight, which are currently being analyzed,will lead to new results in this area.
We acknowledge support as summarized in Mulleret al. [5] and we are grateful to significant contri-butions by college student J. Marshall.
References
[1] P. J. Boyle et al. Proc. 30th ICRC, 2007.[2] N. E. Yanasak et al. ApJ, 563:768–792, 2001.[3] J. J. Engelmann et al. A&A, 233:96, 1990.[4] D. Muller et al. ApJ, 374:356–365, 1991.[5] D. Muller et al. Proc. 30th ICRC, 2007.
192

30TH INTERNATIONAL COSMIC RAY CONFERENCE
On the origin of the knees in the cosmic-ray energy spectrum
J.R. HORANDELa, N.N. KALMYKOVb , A.A. SILAEVc , AND A.V. TIMOKHINc .a Institute for Experimental Nuclear Physics, University of Karlsruhe, Germany, now at Department ofAstrophysics, Radboud University Nijmegen, The Netherlandsb Skobeltsyn Institute of Nuclear Physics, Lomonosov Moscow State University, Moscow, Russiac Faculty of Physics, Lomonosov Moscow State University, Moscow, [email protected]
Abstract: Combining diffusion equation solutions with direct Monte-Carlo simulations of charged parti-cle trajectories, the propagation of cosmic rays in the Galaxy is investigated. Different assumptions on theshape of the regular Galactic magnetic fields and source distributions are considered and their influenceon cosmic-ray life times and the energy spectrum obtained at Earth is examined. The origin of the kneein the energy spectrum at 4 · 1015 eV and the second knee at 4 · 1017 eV is discussed. It is investigatedwhether the knee can be explained by propagation effects only and if the second knee is due to the end ofthe galactic component with a strong contribution of elements heavier than iron.
Introduction
The knee in the energy spectrum of cosmic rays(CRs) at ∼ (4 − 5) · 1015 eV was first observedalmost 50 years ago [9], but its origin is still un-der discussion and it is generally believed to be acorner stone in understanding the origin of CRs.
The verification of various hypotheses of the CRorigin and the nature of the knee in their energyspectrum is complicated by the fact that the CRspectra at the sources and at the Earth are different.The change of the energy spectrum during propa-gation is related to the energy dependence of theCR life time in the Galaxy.
Using a combined approach, which includes thesolution of a diffusion equation for the CR densityin the Galaxy and a method of numerical calcula-tions of trajectories, we have performed a calcula-tion of the energy spectrum at Earth in the energyrange 1012 − 1020 eV.
The method of numerical integration of trajecto-ries is traditionally used for the calculation of thespectrum at high energies [14, 6, 5] but it is nottoo efficient at low energies as the calculation timeneeded is inversely proportional to particle energy.
The diffusion model is more suitable at lower ener-gies and the CR energy spectrum may be obtainedby the solution of the diffusion equation for the CRdensity in the Galaxy [5, 11]. There are no com-puting difficulties inherent to the numerical simu-lation of trajectories, but the diffusion approach islimited by a certain energy boundary — the energyof a proton should not exceed 1017 eV [5].
In our calculations we tested different assumptionsabout the structure of the regular magnetic fieldsof the Galaxy, and also different spatial distribu-tions of CR galactic sources, to determine to whatdegree this uncertainty will influence results of thecalculations.
The results obtained were used to verify the hy-potheses of the origin of the knee in the energyspectrum using experimental data as obtained atEarth.
Assumptions about magnetic fields
The magnetic field used in the calculations in-cluded a regular and a chaotic component
�B = �Breg + �Bchaot. (1)
193
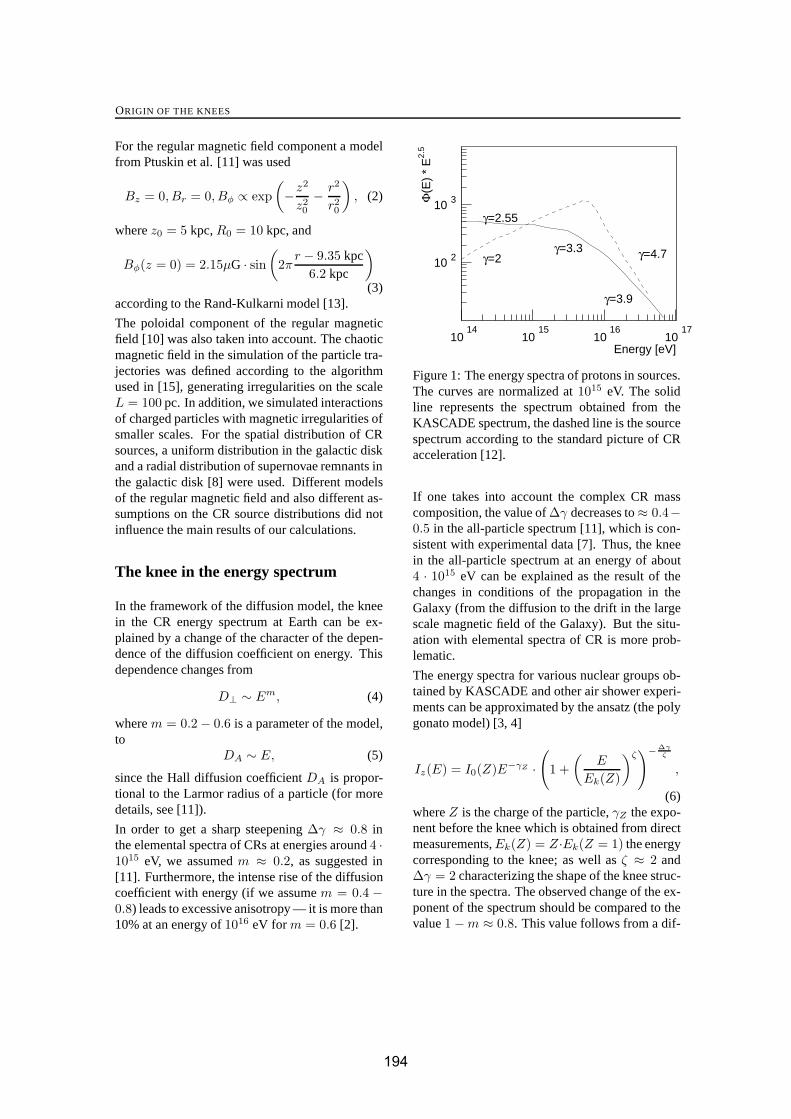
ORIGIN OF THE KNEES
For the regular magnetic field component a modelfrom Ptuskin et al. [11] was used
Bz = 0, Br = 0, Bφ ∝ exp
(−z2
z20
− r2
r20
), (2)
where z0 = 5 kpc, R0 = 10 kpc, and
Bφ(z = 0) = 2.15μG · sin(
2πr − 9.35 kpc
6.2 kpc
)
(3)according to the Rand-Kulkarni model [13].
The poloidal component of the regular magneticfield [10] was also taken into account. The chaoticmagnetic field in the simulation of the particle tra-jectories was defined according to the algorithmused in [15], generating irregularities on the scaleL = 100 pc. In addition, we simulated interactionsof charged particles with magnetic irregularities ofsmaller scales. For the spatial distribution of CRsources, a uniform distribution in the galactic diskand a radial distribution of supernovae remnants inthe galactic disk [8] were used. Different modelsof the regular magnetic field and also different as-sumptions on the CR source distributions did notinfluence the main results of our calculations.
The knee in the energy spectrum
In the framework of the diffusion model, the kneein the CR energy spectrum at Earth can be ex-plained by a change of the character of the depen-dence of the diffusion coefficient on energy. Thisdependence changes from
D⊥ ∼ Em, (4)
where m = 0.2 − 0.6 is a parameter of the model,to
DA ∼ E, (5)
since the Hall diffusion coefficient DA is propor-tional to the Larmor radius of a particle (for moredetails, see [11]).
In order to get a sharp steepening Δγ ≈ 0.8 inthe elemental spectra of CRs at energies around 4 ·1015 eV, we assumed m ≈ 0.2, as suggested in[11]. Furthermore, the intense rise of the diffusioncoefficient with energy (if we assume m = 0.4 −0.8) leads to excessive anisotropy — it is more than10% at an energy of 1016 eV for m = 0.6 [2].
Energy [eV]
Φ(E
) *
E2.
5
γ=2.55
γ=3.3
γ=3.9
γ=2 γ=4.710 2
10 3
1014
1015
1016
1017
Figure 1: The energy spectra of protons in sources.The curves are normalized at 1015 eV. The solidline represents the spectrum obtained from theKASCADE spectrum, the dashed line is the sourcespectrum according to the standard picture of CRacceleration [12].
If one takes into account the complex CR masscomposition, the value of Δγ decreases to ≈ 0.4−0.5 in the all-particle spectrum [11], which is con-sistent with experimental data [7]. Thus, the kneein the all-particle spectrum at an energy of about4 · 1015 eV can be explained as the result of thechanges in conditions of the propagation in theGalaxy (from the diffusion to the drift in the largescale magnetic field of the Galaxy). But the situ-ation with elemental spectra of CR is more prob-lematic.
The energy spectra for various nuclear groups ob-tained by KASCADE and other air shower experi-ments can be approximated by the ansatz (the polygonato model) [3, 4]
Iz(E) = I0(Z)E−γZ ·(
1 +
(E
Ek(Z)
)ζ)−Δγ
ζ
,
(6)where Z is the charge of the particle, γZ the expo-nent before the knee which is obtained from directmeasurements, Ek(Z) = Z·Ek(Z = 1) the energycorresponding to the knee; as well as ζ ≈ 2 andΔγ = 2 characterizing the shape of the knee struc-ture in the spectra. The observed change of the ex-ponent of the spectrum should be compared to thevalue 1 − m ≈ 0.8. This value follows from a dif-
194

30TH INTERNATIONAL COSMIC RAY CONFERENCE
fusion model to explain the origin of the knee [11].It is obvious that the experimental value of Δγ isessentially greater; hence, at least a part of the ob-served Δγ should stem from the peculiarities of theenergy spectrum at the sources. It is instructive topoint out that at higher energies (above 1017 eV)the diffusion coefficient becomes proportional toE2 and, formally, one could get a sharp knee. Butthe diffusion approach produces wrong results atsuch energies and an essentially more complicatedtransport equation is needed.
Taking the spectra measured at Earth as parame-terized with equation 6 and taking into account thedependence of the CR life time on energy, obtainedby numerical calculation of trajectories the spectraat the sources can be estimated. The result is pre-sented in Fig. 1 as solid line. It represents the pro-ton spectrum at the sources. The result indicatesthat the relatively sharp knee in the elemental spec-tra at the Earth (see e.g. [4]) can not be explainedin the context of the diffusion model only, and it isnecessary to assume a change of spectra in sourcesat corresponding energies.
For a final conclusion it is necessary to ultimatelyestablish the exact shape of the spectra for elemen-tal groups.
The second knee in the spectrum
Using spectra at the sources similar to the oneshown in Fig. 1 the spectra at Earth have been esti-mated [5]. As source composition, the abundancesof elements from hydrogen to uranium as mea-sured in the solar system [1] have been weightedwith Z3.2. This choice is arbitrary to a certain ex-tent, but may be motivated by a higher efficiencyin the injection or acceleration processes for nu-clei with high charge numbers. The abundancesare scaled with a factor which is identical for allelements to obtain approximately the absolute val-ues as expected at the Earth according to the polygonato model. At the source, a power law ∝ E−2.5
has been assumed for all elements with a knee,caused e.g. by the maximum energy attained dur-ing the acceleration, at Z · 4.5 PeV, with a powerlaw index −3.5 above the respective knee. Usingthe derived propagation path length and interactionlength, the amount of interacting particles has been
determined. Secondary products generated in spal-lation processes are taken into account, assumingthat the energy per nucleon is conserved in thesereactions. They are added to the correspondingspectra with smaller Z . The spectra thus obtainedare compared to spectra according to the poly go-nato model in Fig. 2.
Two features should be noted: The absolute fluxesat Earth are predicted quite well, especially whenconsidering that only a simple scaling law has beenintroduced for the abundances at the sources, start-ing with the composition in the solar system. Moreimportant for the present discussion is the shape ofthe spectra. As expected, the shape of the protonspectrum is not influenced by the (few) interactionsduring propagation and the difference of the spec-tral index at the source and at Earth γ = −2.71 [3]can be explained by the energy dependence of theescape path length ∝ E−0.2. On the other hand,it can be recognized that due to nuclear interac-tions the spectra for heavier elements are flatter.The slopes obtained with the simple approach forthe CNO, silicon, and iron groups agree well withthe steepness as expected from the poly gonatomodel. For heavy elements at low energies sec-ondary products generated in spallation processesplay an important role for the shape of the spec-trum. At low energies many nuclei interact due tothe large escape path length and the small interac-tion length, thus, the spectra of nuclei without anyinteraction deviate from power laws. However, thespallation products of heavier elements at higherenergies compensate the effect and the resultingspectra are again approximately power laws, as canbe seen in Fig. 2.
Summary and Conclusion
The propagation pathlength and escape time ofcosmic rays in the galaxy has been calculated ina combined approach solving a diffusion equationand numerically calculate the trajectories of parti-cles in the Galaxy. To explain the relatively steepfall-off of the observed energy spectra for elemen-tal groups at their respective knees, the modulationof the spectrum due to propagation solely is notsufficient. An additional steepening of the spectraat the source is necessary, e.g. caused by the max-
195

ORIGIN OF THE KNEES
10 2
10 3
10 2
10 3
4 6 8 4 6 8
Z=1-2F
lux
* E
2.5 [(
m2 s
r s
GeV
1.5 )- ]
Z=3-9
Z=10-22 Z=23-92
Energy lg E0 [GeV]
Figure 2: Energy spectra at Earth for elements with nuclear charge Z as indicated. The dashed linesrepresent spectra according to the poly gonato model, the solid lines are expected from the diffusion modeldiscussed, see text. Two solid lines are shown in each panel, representing an estimate for the uncertainties[5].
imum energy attained during acceleration. It canbe concluded that the knee in the energy spectrumof cosmic rays has its origin most likely in both,acceleration and propagation processes.
It seems to be reasonable that the second kneearound 400 PeV ≈ 92 · Ek(p) is due to thecut-off of the heaviest elements in galactic cos-mic rays. Considering the calculated escape pathlength and nuclear interaction length within thediffusion model, it seems to be reasonable that thespectra for heavy elements are flatter as comparedto light elements. The calculations show also thateven for the heaviest elements at the respectiveknee energies more than about 50% of the nucleisurvive the propagation process without interac-tions. This may explain why ultra-heavy elementscould contribute significantly (∼ 40%) to the all-particle flux at energies around 400 PeV and thusexplain the second knee in the energy spectrum.
References
[1] A.G.W. Cameron. Space Sci. Rev., 15:121,1973.
[2] M. Hillas. Proc. 26th Int. Cosmic Ray Conf.,Salt Lake City, 4:225, 1999.
[3] J.R. Horandel. Astropart. Phys., 19:193,2003.
[4] J.R. Horandel. astro-ph/0702370, 2007.[5] J.R. Horandel et al. Astropart. Phys., 27:119,
2007.[6] S. Karakula et al. Proc. Phys. Soc. A., 5:904,
1972.[7] G.B. Khristiansen. Proc. 24th Int. Cosmic
Ray Conf., Rome, 2:772, 1995.[8] K. Kodaira. Publ. Astron. Soc. Japan, 26:255,
1974.[9] G.V. Kulikov and G.B. Khristiansen. JETP,
35:635, 1958.[10] M. Prouza and R. Smida. Astron. & Astroph.,
410:1, 2003.[11] V.S. Ptuskin et al. Astron. & Astroph.,
268:726, 1993.[12] V.S. Ptuskin and V.N. Zirakashvili. Astron. &
Astroph., 429:755, 2005.[13] R.J. Rand and S.R. Kulkarni. Astrophys. J.,
343:760, 1989.[14] K.O. Thielheim and W. Langhoff. Proc.
Phys. Soc. A., 1:694, 1968.[15] V.N. Zirakashvili et al. Izv. RAN ser. phys.,
59:153, 1995.
196
30TH INTERNATIONAL COSMIC RAY CONFERENCE
Confinement of Cosmic Rays in Dark Matter clumps
W. DE BOER , V.ZHUKOV
Institut fur Experimentelle Kernphysik, Universitat Karlsruhe (TH),76128 Karlsruhe, GermanySkobeltsyn Institute of Nuclear Physics, Moscow State University, 119992 Moscow, Russia
Abstract: Some part of the relic Dark Matter is distributed in small-scale clumps which survived struc-ture formation in inflation cosmological scenario. The annihilation of DM inside these clumps is a strongsource of stable charged particles which can have a substantial density near the clump core. The stream-ing of the annihilation products from the clump can enhance irregularities in the galactic magnetic field.This can produce small scale variations in diffusion coefficient affecting propagation of Cosmic Rays.
Introduction
The Cosmic Ray (CR) propagation in the Galac-tic disk is described as a resonant scattering on themagneto hydrodynamic turbulences (MHD) withthe scale equal to the particle Larmor radius
in the galactic magnetic field .The MHD turbulences can propagate in space asAlfven waves with the velocity ,which depends on the interstellar gas densityand is in the order of 10-100 km/s. The spectraldensity of the waves is usually associated with fluc-tuations in interstellar medium (ISM) and followsa power law , where forthe Kolmogorov spectrum. The MHD waves in-teract with the CR and ISM and can be enhancedor damped, depending on the energy flow. The ki-netic equation for the spectral density inspherical coordinates can be written as [11]:
(1)
The G term describes the enhancement of turbu-lences due to streaming of CR particles and S rep-resents the damping. The growth of turbulencesoccurs when the CR streaming velocity is largerthan the Alfven speed [17]. The streaming ve-locity depends on the gradient of the CR densitywhich satisfies the diffusion equation:
(2)
where is the source function, is the con-vection velocity and energy losses are neglected.
The diffusion coefficient at resonance is relatedto as [1]:and a high level of turbulences corresponds to alocal confinement of particles. Since the enhance-ment and damping strongly depend on the local en-vironment, this opens a possibility for large andsmall scale variations in propagation parametersand therefore CR density. On the large scale theMHD waves can be damped in the galactic diskof pc, leading to a large diffusion co-efficient. Outside the disk the can belarger and propagation is dominated by convectionif [15]. On small scales the diffusivepropagation can be affected near the CR sourcesor in the dense gas clouds [13, 18]. In the modelwith isotropic propagation the locally observed CRfluxes are used to evaluate the CR distribution inthe whole Galaxy and then to calculate the diffu-sive gamma rays [12]. The obtained size of dif-fusion zone of 1-4 kpc is compatible with obser-vations of secondary CR (B,Be,subFe) but contra-dicts smaller angular gradients observed in diffu-sive gamma rays which requires larger halo [4].The isotropic model also does not explain the ex-cess of gamma rays in GeV range [10, 12]. Thegalactic rotation curve points to a large mass inthe galactic halo which can be associated with theDark Matter (DM). The DM can self annihilate andproduce stable particles which will contribute tothe gamma rays and CR fluxes. Here we considerhow the DM can affect the galactic model.
197

CR CONFINEMENT IN DM CLUMPS
Dark Matter annihilation in clumps
The N-body cosmological simulations and analyt-ical calculations show that in the inflation sce-nario the smallest DM structures originate frominitial primordial fluctuations. These primordialDM clumps are partially destroyed during evolu-tion contributing to the bulk DM but 0.001-0.1 ofrelic DM can still reside in the clumps, depend-ing on initial conditions [9, 8]. The density pro-file inside the clumps is cuspybut is probably saturated at some critical density
forming a dense core. The clump mass distri-bution follows with the mini-mum mass defined by free streaming of DM parti-cles just after kinetic decoupling
[2]. The local number density distri-bution of such clumps can vary in the rangeof pc depending on density pro-file and tidal destruction [2, 8]. Inside the clump,the DM of mass will annihilate producing sta-ble particles: protons, antiprotons, positrons, elec-trons and gamma rays, which can be observed ontop of the ordinary CR fluxes. The luminosityof the clump for a -component is:
, where is the yield per an-
nihilation. For most of DM candidates the anni-hilation goes into fermions, predominantly quark-antiquarks, which after fragmentation will producefor GeV: 3 positrons or electrons, 0.3protons or antiprotons and 8 gamma at 1 GeV. Theprecise energy spectrum is well measured in ac-celerator experiments, for protons and antiprotonsbelow 1 GeV the and for electronsand positrons . The is the ther-mally averaged annihilation cross section whichcan be estimated from the observed relic DM den-sity in time of decoupling ( )
, where[16]. Nowadays ( ) the crosssection can be the same or only smaller [6]. How-ever the total annihilation signal can be boostedby clumpiness of DM, so called boost factor. Theclumps are much denser than the bulk profile andmost of the signal will come from the core ofmost abundant smallest clumps. The DM anni-hilation (DMA) signal is decreasing fast with theDM mass, at least as , and the boost factor islimited by [2] thus limiting the observabil-
ity of heavy DM GeV. Taking a clumpwith and 100 AU size with theaverage density of 100 GeV/cm , the total yieldfor GeV charged particles will be for
GeV. Assuming the isothermal distri-bution of clumps in the galactic halo of 20 kpc di-ameter and normalizing at ,the total luminosity from the DM annihilation inGeV range in years will be particles,to be compared with the SNR explosion deliver-ing particles per explosion in the galacticdisk. Despite small luminosity the DM clump is acompact and constant source and the local densityof produced particles can significantly exceed thegalactic average producing agradient in CR density distribution.
MHD turbulences initiated by DM an-nihilation
The streaming of charged DMA products from thecuspy clump will increase the level of local MHDturbulences. The amplification of MHD wavesparallel to magnetic field lines can be presentedas [17, 1]:
,where is the
cosine of scattering angle andis the anisotropic term of the CR density distri-bution which can be obtained from integration ofdiffusion equation (2). The transverse waves areaveraged out along propagation path and scatter-ing is not efficient, that is, only turbulences alonglocal field lines will be amplified by streaming,this asymmetry is neglected in this study. Thegrowth is reduced by different damping mecha-nisms. Different possibilities can be considered: adense molecular cloud with ,a hot plasma region and the galactic halo. Thestrongest damping takes place in the dense neu-tral gas due to ions-neutral friction which dis-sipates energy as , where
is the collisional crosssection [?]. In the hot underdense gas the growthis suppressed by larger and ionized gas density
[17]. The collision of opposite waves leadsto a nonlinear damping proportional to the level ofmagnetic turbulences , is
the gas thermal velocity [1]. The fast magne-
198
30TH INTERNATIONAL COSMIC RAY CONFERENCE
tosonic waves with the Kraichnan spectrum can bealso dumped at small scales by the CR themselves[14], this is not considered here. The simplified so-lution of the kinetic equation for (1),neglecting momentum dependency for GeV par-ticles, convection term in (2) and assuming pointlike source function , has a form:
where is related to the to-
tal clump liminosity, ,are the dampings, and is a
normalization factor. In the steady state it will re-sult in an exponential increase of near theclump core followed by a decrease , see Fig-ure 1. Since the spectrum of annihilated particlesis limited by , the distribution will becutoff at . Thus the anisotropic stream-ing will create a region around a clump with smalldiffusion , aligned with the local field andwith the size defined by the clump DM density,annihilation and dumping rates. The velocity ofthe clump proper motion and the convection speedshould be below the local in order to have stableenvironments for the growth. The turbulences willbe strongly suppressed in the dense gas region al-though the DMA particles produced in the cusp ofthe clump still can be confined. In the underdensearea in the galactic disk, like the Local Bubble, orin the galactic halo, the DM clump can be a sub-stantial source of small scale MHD waves. Theeffect on CR propagation will be especially largeif the diffusion coefficient inside clumps is muchsmaller than outside . The confine-ment zones with the size of can trap the annihi-lation products and CR for a time thusincreasing local CR density. In a self-consistentmodel the zone with a large diffusion is limited bythe thin galactic disk and the convection is dom-inant in the halo[15]. If the convection and dis-tance between clumps are large enough, the backscattering of DMA produced particles into galac-tic disk can be small and will contribute a littleto the observed CR fluxes, but the gamma raysand radio waves from these areas can be observed.First, the gamma rays produced directly from an-nihilation will produce a bump in the spectrum at
[7]. This can reproduce the gamma
rays energy spectrum and angular gradients ob-served by EGRET [10, 7]. Second, the electronsand positrons trapped near the clump will con-tribute to the lower energy gamma rays via In-verse Compton and to radio waves by the syn-chrotron radiation. The DMA contributions to thecharged CR will depend on the location of near-est clumps and the local environment. The localconfinement combined with a large external con-vection and anisotropic diffusion will reduce thefluxes of antiprotons and positrons from DMA incomparison with the DMA gamma flux [3]. Thesecondary CR from nuclear interactions will be re-duced too but can be recovered if CR are trappedin local molecular cloud structure [5].
Conclusion
The annihilation of DM in clumps can be a sourceof MHD waves which affect the propagation of CRwith . The growth of the MHD wavescan be large for the light DM candidate, like theSUSY neutralino with GeV which haslargest annihilation cross section, and cuspy DMclump profile. The created turbulences are dampedby ion-neutral interactions in the dense gas regionsbut in the galactic halo or underdense areas theDM clumps can produce trapping zones with in-creased particle density. The gamma rays from theDM annihilation in clumps can be related to the ob-served by EGRET excess in GeV range. The DMAgamma rays angular profiles depend upon clumpsdistribution in the galaxy. The abundantly pro-duced in DM annihilation electrons and positronswill lose energy via inverse Compton and syn-chrotron radiation contributing to the low energygamma rays and radio waves. The contribution ofcharged DMA products to the observed CR fluxeswill strongly depend on the local propagation pa-rameters and can be reduced in case of anisotropicpropagation and small scale confinement.
Acknowledgments
The authors thanks H.J. V lk, V.S. Ptuskin, V. I.Dokuchaev and B. Moore for useful discussions.
199

CR CONFINEMENT IN DM CLUMPS
References
[1] V. S. Berezinskii, S. V. Bulanov, V. A. Do-giel, and V. S. Ptuskin. Astrophysics of cos-mic rays. Amsterdam: North-Holland, 1990.,1990.
[2] V. Berezinsky, V. Dokuchaev, andY. Eroshenko. Phys. Rev. D, 68(10):103003,November 2003.
[3] L. Bergstrom, J. Edsjo, M. Gustafsson, andP. Salati. JCAP, 5:6, 2006.
[4] D. Breitschwerdt, V. A. Dogiel, and H. J.Volk. Astron. Astrophys., 385:216, 2002.
[5] B. D. G. Chandran. Astroph. J., 529:513,2000.
[6] W. de Boer, C. Sander, V. Zhukov, A. V.Gladyshev, and D. I. Kazakov. Phys. Rev.Lett., 95(20):209001, 2005.
[7] W. de Boer, C. Sander, V. Zhukov, A. V.Gladyshev, and D. I. Kazakov. Astron. As-trophys., 444:51, 2005.
[8] T. Goerdt, O. Y. Gnedin, B. Moore, J. Die-mand, and J. Stadel. MNRAS, 375:191, 2007.
[9] A. V. Gurevich, K. P. Zybin, and V. A. Sirota.Sov. Phys. Usp., 167:913, 1997.
[10] S. D. Hunter and et al. Astroph. J., 481:205,1997.
[11] R. Kulsrud and W. P. Pearce. Astroph. J,156:445, 1969.
[12] Igor V. Moskalenko, A. W. Strong, J. F.Ormes, and S. G. Mashnik. Adv. Space Res.,35:156, 2005.
[13] P. Padoan and J. Scalo. Astroph J. Lett.,624:L97, 2005.
[14] V. S. Ptuskin and et al. Astroph. J., 642:902,2006.
[15] V. S. Ptuskin, H. J. Voelk, V. N. Zirakashvili,and D. Breitschwerdt. Astron. Astrophys.,321:434, 1997.
[16] D. N. Spergel and et al. Astroph. J. Supp.,148:175, 2003.
[17] D. G. Wentzel. ARA A, 12:71, 1974.[18] E. G. Zweibel and J. M. Shull. Astroph. J.,
259:859, 1982.
r, AU10 20 30 40 50 60 70 80 90 100
rel.u
nits
-310
-210
-110
1 -3=0.1 cmHW(r) n
(r)CRf
-3=10 cmHW(r) n
-1 k, cm
-1510 -1410 -1310 -1210 -110
W(k
) re
l.uni
ts
-310
-210
-110
Figure 1: The spatial distribution and parti-cles distributions in the DM clump for GeVparticles, cm/s and . The en-ergy spectrum of for =100 GeV.
200
KASCADE-Grande Collaboration(as of July 2007)
W.D. Apela, J.C. Arteagaa,1, F. Badeaa,2, K. Bekka, M. Bertainab, J. Blumera,c, H. Bozdoga,
I.M. Brancusd, M. Bruggemanne, P. Buchholze, A. Chiavassab, F. Cossavellac, K. Daumillera,
V. de Souzac, F. Di Pierrob, P. Dolla, R. Engela, J. Englera, M. Fingerc, D. Fuhrmannf , P.L. Ghiag,
H.J. Gilsa, R. Glasstetterf , C. Grupene, A. Haungsa, D. Hecka, J.R. Horandelc,3, T. Huegea,
P.G. Isara, K.-H. Kampertf , D. Kickelbicke, H.O. Klagesa, Y. Kolotaeve, P. Luczakh, H.J. Mathesa,
H.J. Mayera, C. Meurera, J. Milkea, B. Mitricad, A. Moralesa, C. Morellog, G. Navarrab,
S. Nehlsa, J. Oehlschlagera, S. Ostapchenkoa,4, S. Overe, M. Petcud, T. Pieroga, S. Plewniaa,
H. Rebela, M. Rotha, H. Schielera, O. Simai, M. Stumpertc, G. Tomad, G.C. Trincherog, H. Ulricha,
J. van Burena, W. Walkowiake, A. Weindla, J. Wochelea, J. Zabierowskih
a Institut fur Kernphysik, Forschungszentrum Karlsruhe, 76021 Karlsruhe, Germanyb Dipartimento di Fisica Generale dell’Universita, 10125 Torino, Italyc Institut fur Experimentelle Kernphysik, Universitat Karlsruhe, 76021 Karlsruhe, Germany,d National Institute of Physics and Nuclear Engineering, 7690 Bucharest, Romaniae Fachbereich Physik, Universitat Siegen, 57068 Siegen, Germanyf Fachbereich Physik, Universitat Wuppertal, 42097 Wuppertal, Germanyg Istituto di Fisica dello Spazio Interplanetario, INAF, 10133 Torino, Italyh Soltan Institute for Nuclear Studies, 90950 Lodz, Polandi Department of Physics, University of Bucharest, 76900 Bucharest, Romania
1 permanent address: CINVESTAV, Mexico D.F., Mexico2 on leave of absence from Nat. Inst. of Phys. and Nucl. Engineering, Bucharest, Romania3 now at: Dept. of Astrophysics, Radboud University Nijmegen, The Netherlands4 on leave of absence from Moscow State University, 119899 Moscow, Russia
201

LOPES Collaboration(as of May 2007)
W.D. Apela, J.C. Arteagaa,1, T. Aschb, J. Auffenbergc, F. Badeaa,2, L. Bahrend, K. Bekka, M. Bertainae,P.L. Biermannf , J. Blumera,g, H. Bozdoga, I.M. Brancush, M. Bruggemanni, P. Buchholzi,S. Buitinkj, H. Butcherd, A. Chiavassae, F. Cossavellag, K. Daumillera, V. de Souzag, F. Di Pierroe,P. Dolla, R. Engela, H. Falcked,j, H. Gemmekeb, P.L. Ghiak, R. Glasstetterc, C. Grupeni, A. Haungsa,D. Hecka, J.R. Horandelj, A. Hornefferj, T. Huegea, P.G. Isara,3, K.-H. Kampertc, D. Kickelbicki,Y. Kolotaevi, O. Kromerb, J. Kuijpersj, S. Lafebrej , P. Luczakl, H.J. Mathesa, H.J. Mayera,C. Meurera, J. Milkea, B. Mitricah, C. Morellok, G. Navarrae, S. Nehlsa, A. Niglj, J. Oehlschlagera,S. Ostapchenkoa,4, S. Overi, M. Petcuh, J. Petrovicj,5, T. Pieroga, S. Plewniaa, J. Rautenbergc,H. Rebela, M. Rotha, H. Schielera, O. Simam, K. Singhj, M. Stumpertg, G. Tomah, G.C. Trincherok,H. Ulricha, J. van Burena, W. Walkowiaki, A. Weindla, J. Wochelea, J. Zabierowskil, J.A. Zensusf
a Institut fur Kernphysik, Forschungszentrum Karlsruhe, 76021 Karlsruhe, Germanyb Inst. Prozessdatenverarbeitung und Elektronik, Forschungszentrum Karlsruhe, Germanyc Fachbereich Physik, Universitat Wuppertal, 42097 Wuppertal, Germanyd ASTRON, 7990 AA Dwingeloo, The Netherlandse Dipartimento di Fisica Generale dell’Universita, 10125 Torino, Italyf Max-Planck-Institut fur Radioastronomie, 53010 Bonn, Germanyg Institut fur Experimentelle Kernphysik, Universitat Karlsruhe, 76021 Karlsruhe, Germanyh National Institute of Physics and Nuclear Engineering, 7690 Bucharest, Romaniai Fachbereich Physik, Universitat Siegen, 57068 Siegen, Germanyj Dept. of Astrophysics, Radboud University Nijmegen, 6525 ED Nijmegen, The Netherlandsk Istituto di Fisica dello Spazio Interplanetario, INAF, 10133 Torino, Italyl Soltan Institute for Nuclear Studies, 90950 Lodz, Polandm Department of Physics, University of Bucharest, 76900 Bucharest, Romania
1 permanent address: CINVESTAV, Mexico D.F., Mexico2 on leave of absence from Nat. Inst. of Phys. and Nucl. Engineering, Bucharest, Romania3 on leave of absence from Inst. for Space Science, Bucharest, Romania4 on leave of absence from Moscow State University, 119899 Moscow, Russia5 now at: NIKHEF, Amsterdam, The Netherlands
202

30TH INTERNATIONAL COSMIC RAY CONFERENCE
The Pierre Auger Collaboration
J. ABRAHAM , P. ABREU , M. AGLIETTA , C. AGUIRRE , D. ALLARD , I. ALLEKOTTE , J. ALLEN ,P. ALLISON , C. ALVAREZ , J. ALVAREZ-MUNIZ , M. AMBROSIO , L. ANCHORDOQUI ,S. ANDRINGA , J.C. ANJOS , A. ANZALONE , C. ARAMO , S. ARGIRO , K. ARISAKA ,E. ARMENGAUD , F. ARNEODO , F. ARQUEROS , T. ASCH , H. ASOREY , P. ASSIS , B.S. ATULUGAMA ,J. AUBLIN , M. AVE , G. AVILA , T. BACKER , D. BADAGNANI , A.F. BARBOSA , H.M.J. BARBOSA ,D. BARNHILL , S.L.C. BARROSO , P. BAULEO , J. BEATTY , T. BEAU , B.R. BECKER ,K.H. BECKER , J.A. BELLIDO , S. BENZVI , C. BERAT , T. BERGMANN , P. BERNARDINI ,X. BERTOU , P.L. BIERMANN , P. BILLOIR , O. BLANCH-BIGAS , F. BLANCO , P. BLASI ,C. BLEVE , H. BLUMER , M. BOHACOVA , C. BONIFAZI , R. BONINO , M. BORATAV ,J. BRACK , P. BROGUEIRA , W.C. BROWN , J.M. BRUNET , P. BUCHHOLZ , N.G. BUSCA ,K.S. CABALLERO-MORA , B. CAI , D.V. CAMIN , J.N. CAPDEVIELLE , R. CARUSO , A. CASTELLINA ,O. CATALANO , G. CATALDI , L. CAZON-BOADO , R. CESTER , J. CHAUVIN , A. CHIAVASSA ,J.A. CHINELLATO , A. CHOU , J. CHYE , P.D.J. CLARK , R.W. CLAY , S.B. CLAY , E. COLOMBO ,R. CONCEICAO , B. CONNOLLY , F. CONTRERAS , J. COPPENS , A. CORDIER , U. COTTI ,S. COUTU , C.E. COVAULT , A. CREUSOT , J. CRONIN , S. DAGORET-CAMPAGNE , K. DAUMILLER ,B.R. DAWSON , R.M. DE ALMEIDA , L.A. DE CARVALHO , C. DE DONATO , S.J. DE JONG , G. DE
LA VEGA , W.J.M. DE MELLO JUNIOR , J.R.T. DE MELLO NETO , I. DE MITRI , V. DE SOUZA ,L. DEL PERAL , O. DELIGNY , A. DELLA SELVA , C. DELLE FRATTE , H. DEMBINSKI , C. DI
GIULIO , J.C. DIAZ , C. DOBRIGKEIT , J.C. D’OLIVO , D. DORNIC , A. DOROFEEV , M.T. DOVA ,D. D’URSO , M.A. DUVERNOIS , R. ENGEL , L. EPELE , M. ERDMANN , C.O. ESCOBAR ,A. ETCHEGOYEN , P. FACAL SAN LUIS , H. FALCKE , G. FARRAR , A.C. FAUTH , D. FAZIO ,N. FAZZINI , A. FERNANDEZ , F. FERRER , S. FERRY , B. FICK , A. FILEVICH , A. FILIPCIC ,I. FLECK , R. FONTE , D. FUHRMANN , W. FULGIONE , B. GARCIA , D. GARCIA-PINTO ,X. GARRIDO , H. GEENEN , G. GELMINI , H. GEMMEKE , P.L. GHIA , M. GILLER , H. GLASS ,M.S. GOLD , G. GOLUP , F. GOMEZ ALBARRACIN , M. GOMEZ BERISSO , R. GOMEZ HERRERO ,P. GONCALVES , M. GONCALVES DO AMARAL , D. GONZALEZ , J.G. GONZALEZ , M. GONZALEZ ,D. GORA , A. GORGI , P. GOUFFON , V. GRASSI , A. GRILLO , C. GRUNFELD , C. GRUPEN ,Y. GUARDINCERRI , F. GUARINO , G.P. GUEDES , J. GUTIERREZ , J.D. HAGUE , J.C. HAMILTON ,D. HARARI , S. HARMSMA , J.L. HARTON , A. HAUNGS , M.D. HEALY , T. HEBBEKER , D. HECK ,C. HOJVAT , P. HOMOLA , J. HRANDEL , A. HORNEFFER , M. HORVAT , M. HRABOVSKY ,T. HUEGE , M. IARLORI , A. INSOLIA , F. IONITA , A. ITALIANO , M. KADUCAK , K.H. KAMPERT ,B. KEILHAUER , E. KEMP , R.M. KIECKHAFER , H.O. KLAGES , M. KLEIFGES , J. KLEINFELLER ,R. KNAPIK , J. KNAPP , D.-H. KOANG , Y. KOLOTAEV , A. KOPMANN , O. KRMER , D. KUMPEL ,N. KUNKA , A. KUSENKO , G. LA ROSA , C. LACHAUD , B.L. LAGO , D. LEBRUN , P. LEBRUN ,J. LEE , M.A. LEIGUI DE OLIVEIRA , A. LETESSIER-SELVON , M. LEUTHOLD , I. LHENRY-YVON ,R. LOPEZ , A. LOPEZ AGUERA , M.C. MACCARONE , C. MACOLINO , S. MALDERA , M. MALEK ,G. MANCARELLA , M.E. MANCENIDO , D. MANDAT , P. MANTSCH , A.G. MARIAZZI , I.C. MARIS ,D. MARTELLO , J. MARTINEZ , O. MARTINEZ , H.J. MATHES , J. MATTHEWS , J.A.J. MATTHEWS ,G. MATTHIAE , G. MAURIN , D. MAURIZIO , P.O. MAZUR , T. MCCAULEY , M. MCEWEN ,R.R. MCNEIL , M.C. MEDINA , G. MEDINA-TANCO , A. MELI , D. MELO , E. MENICHETTI ,
203

PIERRE AUGER COLLABORATION
A. MENSHIKOV , CHR. MEURER , R. MEYHANDAN , M.I. MICHELETTI , G. MIELE , W. MILLER ,S. MOLLERACH , M. MONASOR , D. MONNIER RAGAIGNE , F. MONTANET , B. MORALES ,C. MORELLO , E. MORENO , J.C. MORENO , C. MORRIS , M. MOSTAFA , M.A. MULLER ,R. MUSSA , G. NAVARRA , L. NELLEN , C. NEWMAN-HOLMES , D. NEWTON , T. NGUYEN
THI , N. NIERSTENHFER , D. NITZ , H. NOGIMA , D. NOSEK , L. NOZKA , J. OEHLSCHLAGER ,T. OHNUKI , A. OLINTO , L.F.A. OLIVEIRA , V.M. OLMOS-GILBAJA , M. ORTIZ , S. OSTAPCHENKO ,L. OTERO , M. PALATKA , J. PALLOTTA , G. PARENTE , E. PARIZOT , S. PARLATI , M. PATEL ,T. PAUL , V. PAVLIDOU , M. PECH , J. PEKALA , R. PELAYO , I.M. PEPE , L. PERRONE ,S. PETRERA , P. PETRINCA , Y. PETROV , DIEP PHAM NGOC , DONG PHAM NGOC , T.N. PHAM
THI , A. PICHEL , R. PIEGAIA , T. PIEROG , M. PIMENTA , V. PIRRONELLO , O. PISANTI ,M. PLATINO , J. POCHON , T.A. PORTER , L. PRADO JUNIOR , P. PRIVITERA , M. PROUZA , E.J. QUEL ,J. RAUTENBERG , H.C. REIS , S. REUCROFT , B. REVENU , J. RIDKY , S. RIGGI , M. RISSE , V. RIZI ,S. ROBBINS , M. ROBERTS , C. ROBLEDO , G. RODRIGUEZ , D. RODRIGUEZ FRIAS , J. RODRIGUEZ
MARTINO , J. RODRIGUEZ ROJO , G. ROS , J. ROSADO , M. ROTH , C. ROUCELLE , B. ROUILLE-D’ORFEUIL , E. ROULET , A.C. ROVERO , F. SALAMIDA , H. SALAZAR , G. SALINA , F. SANCHEZ ,M. SANTANDER , C.E. SANTO , E.M. SANTOS , F. SARAZIN , S. SARKAR , R. SATO , V. SCHERINI ,H. SCHIELER , F. SCHMIDT , T. SCHMIDT , O. SCHOLTEN , P. SCHOVANEK , F. SCHUSSLER ,S.J. SCIUTTO , M. SCUDERI , A. SEGRETO , D. SEMIKOZ , M. SETTIMO , R.C. SHELLARD ,I. SIDELNIK , B.B. SIFFERT , G. SIGL , N. SMETNIANSKY DE GRANDE , A. SMIAŁKOWSKI , R. SMIDA ,B.E. SMITH , G.R. SNOW , P. SOKOLSKY , P. SOMMERS , J. SOROKIN , H. SPINKA , R. SQUARTINI ,E. STRAZZERI , A. STUTZ , F. SUAREZ , T. SUOMIJARVI , A.D. SUPANITSKY , M. SUTHERLAND ,J. SWAIN , Z. SZADKOWSKI , J. TAKAHASHI , A. TAMASHIRO , A. TAMBURRO , O. TASCAU ,R. TICONA , J. TIFFENBERG , C. TIMMERMANS , W. TKACZYK , C.J. TODERO PEIXOTO , B. TOME ,A. TONACHINI , D. TORRESI , P. TRAVNICEK , A. TRIPATHI , G. TRISTRAM , D. TSCHERNIAKHOVSKI ,M. TUEROS , V. TUNNICLIFFE , R. ULRICH , M. UNGER , M. URBAN , J.F. VALDES GALICIA ,I. VALINO , L. VALORE , A.M. VAN DEN BERG , V. VAN ELEWYCK , R.A. VAZQUEZ , D. VEBERIC ,A. VEIGA , A. VELARDE , T. VENTERS , V. VERZI , M. VIDELA , L. VILLASENOR , S. VOROBIOV ,L. VOYVODIC , H. WAHLBERG , O. WAINBERG , T. WALDENMAIER , P. WALKER , D. WARNER ,A.A. WATSON , S. WESTERHOFF , C. WIEBUSCH , G. WIECZOREK , L. WIENCKE , B. WILCZYNSKA ,H. WILCZYNSKI , C. WILEMAN , M.G. WINNICK , J. XU , T. YAMAMOTO , P. YOUNK , E. ZAS ,D. ZAVRTANIK , M. ZAVRTANIK , A. ZECH , A. ZEPEDA , M. ZIOLKOWSKI
Centro Atomico Bariloche (CNEA); Instituto Balseiro (CNEA and UNCuyo); CONICET, 8400 San Carlos deBariloche, Rıo Negro, Argentina
Instituto de Astronomıa y Fısica del Espacio (CONICET), CC 67, Suc. 28 (1428) Buenos Aires, ArgentinaDepartamento de Fısica, Centro Atomico Constituyentes, CNEA, Av. Gral. Paz 1499, (1650) San Martın, Buenos
Aires, ArgentinaPierre Auger Southern Observatory, Av. San Martin Norte 304, (5613) Malargue, Prov. De Mendoza, ArgentinaUniversidad Nacional de la Plata, Facultad de Ciencias Exactas, Departamento de Fısica and IFLP/CONICET;
Univ. Nac. de Buenos Aires, FCEyN, Departamento de Fısica, C.C. 67, (1900) La Plata, ArgentinaUniversidad Tecnologica Nacional, Regionales Mendoza y San Rafael; CONICET; CEILAP-CITEFA, Observatorio
Meteorologico de Mendoza, Av. Arq. Carlos Thays s/n, 5500 Mendoza, ArgentinaUniversity of Adelaide, Dept. of Physics, Adelaide, S.A. 5005, AustraliaUniversidad Catolica de Bolivia, Av. 16 Julio 1732, POB 5829, La Paz, BoliviaUniversidad Mayor de San Andres, Av. Villazon N 1995, Monoblock Central, BoliviaCentro Brasileiro de Pesquisas Fisicas, Rua Dr. Xavier Sigaud, 150, CEP 22290-180 Rio de Janeiro, RJ, BrazilUniversidade de Sao Paulo, Inst. de Fisica, Cidade Universitaria Caixa Postal 66318, Caixa Postal 66318,
05315-970 Sao Paulo, SP, BrazilUniversidade de Sao Paulo, Instituto Astronomico e Geofisico, Cidade Universitaria, Rua do Matao 1226,
05508-900 Sao Paulo, SP, Brazil
204
30TH INTERNATIONAL COSMIC RAY CONFERENCE
Universidade Estadual de Campinas, Gleb Wataghin Physics Institute (IFGW), Departamento de Raios Cosmicos eCronologia, CP 6165, 13083-970, Campinas, SP, Brazil
Univ. Estadual de Feira de Santana, Departamento de Fisica, Campus Universitario, BR 116, KM 03, 44031-460Feira de Santana, Brazil
Universidade Federal da Bahia, Campus da Ondina, 40210- 340 Salvador, BA, BrazilUniversidade Federal do ABC, Centro de Ciencias Naturais e Humanas, Rua Santa Adelia, 166, Bairro Bangu,
09.210-170 Santo Andre, SP, BrazilUniv. Federal do Rio de Janeiro (UFRJ), Instituto de Fısica, Cidade Universitaria, Caixa Postal 68528, 21945-970
Rio de Janeiro, RJ, BrazilUniv. Federal Fluminense, Inst. de Fisica, Campus da Praia Vermelha, 24210-340 Niteroi, RJ, BrazilCharles University, Institute of Particle & Nuclear Physics, Faculty of Mathematics and Physics, V Holesovickach
2, CZ-18000 Prague 8, Czech RepublicInstitute of Physics of the Academy of Sciences of the Czech Republic, Na Slovance 2, CZ-182 21 Praha 8, Czech
RepublicInstitut de Physique Nucleaire, Universite Paris-Sud 11 and IN2P3/CNRS, 15, rue Georges Clemenceau, 91400
Orsay, FranceLaboratoire AstroParticule et Cosmologie, Universite Paris VII, 11, Place Marcelin Berthelot, F-75231 Paris
CEDEX 05, FranceLaboratoire de l’Accelerateur Lineaire, Universite Paris-Sud 11 and IN2P3/CNRS, BP 34, Batiment 200, F-91898
Orsay cedex, FranceLaboratoire de Physique Nucleaire et de Hautes Energies, Universite Paris 6 & 7 and IN2P3/CNRS, 4 place Jussieu,
75252 Paris Cedex 05, FranceLaboratoire de Physique Subatomique et de Cosmologie (LPSC), IN2P3/CNRS, Universite Joseph-Fourier
(Grenoble 1), 53, ave. des Martyrs, F-38026 Grenoble CEDEX, FranceBergische Universitat Wuppertal, Fachbereich C - Physik, GaußStr. 20, D - 42097 Wuppertal, GermanyForschungszentrum Karlsruhe, Institut fur Kernphysik, Postfach 3640, D - 76021 Karlsruhe, GermanyForschungszentrum Karlsruhe, Institut fur Prozessdatenverarbeitung und Elektronik, Postfach 3640, D - 76021
Karlsruhe, GermanyMax-Planck-Institut fur Radioastronomie, Auf dem Hugel 69, D - 53121 Bonn, GermanyRWTH Aachen, III. Physikalisches Institut A, Physikzentrum, Huyskensweg, D - 52056 Aachen, GermanyUniversitat Karlsruhe (TH), Institut fur Experimentelle Kernphysik (IEKP), Postfach 6980, D - 76128 Karlsruhe,
GermanyUniversitat Siegen, Fachbereich 7 Physik - Experimentelle Teilchenphysik, Emmy Noether-Campus, Walter- Flex-Str.
3, D - 57068 Siegen, GermanyDipartimento di Fisica dell’Universita de l’Aquila and INFN, Via Vetoio, I-67010 Coppito, Aquila, ItalyDipartimento di Fisica dell’Universita di Milano and Sezione INFN, via Celoria 16, I-20133 Milan, ItalyDipartimento di Fisica dell’Universita di Napoli ”Federico II” and Sezione INFN, Via Cintia 2, 80123 Napoli, ItalyDipartimento di Fisica dell’Universita di Roma II ”Tor Vergata” and Sezione INFN, Via della Ricerca Scientifica,
I- 00133 Roma, ItalyDipartimento di Fisica dell’Universita di Catania and Sezione INFN, Corso Italia, 57, I-95129 Catania, ItalyDipartimento di Fisica Sperimentale dell’Universita di Torino and Sezione INFN, Via Pietro Giuria, 1, I-10125
Torino, ItalyDipartimento di Fisica, Universita del Salento and Sezione INFN, via Arnesano, I-73100 Lecce, ItalyIstituto di Astrofisica Spaziale e Fisica Cosmica di Palermo (INAF), Via Ugo La Malfa 153, I-90146 Palermo, ItalyIstituto di Fisica dello Spazio Interplanetario (INAF), sezione di Torino and Dipartimento di Fisica Generale
dell’Universita and INFN Torino, Via P. Giuria 1, 10125 Torino, ItalyINFN, Laboratori Nazionali del Gran Sasso, Strada Statale 17/bis Km 18+910, I-67010 Assergi (L’Aquila), ItalyOsservatorio Astrofisico di Arcetri, Largo E. Fermi 5, I-50125 Florence, ItalySezione INFN di Napoli, Complesso Universitario di Monte Sant’ Angelo, Via Cinthia, I-80126 Napoli, Italy
205
PIERRE AUGER COLLABORATION
Benemerita Universidad Autonoma de Puebla (BUAP), Ap. Postal J – 48, 72500 Puebla, Puebla, MexicoCentro de Investigacion y de Estudios Avanzados del IPN (CINVESTAV), Apartado Postal 14-740, 07000 Mexico,
D.F., MexicoUniversidad Michoacana de San Nicolas de Hidalgo (UMSNH), Edificio C-3 Cd Universitaria, C.P. 58040 Morelia,
Michoacan, MexicoUniversidad Nacional Autonoma de Mexico (UNAM), Apdo. Postal 20-364, 01000 Mexico, D.F., MexicoInstitute of Mathematics, Astrophysics and Particle Physics (IMAPP), Radboud University, 6500 GL Nijmegen,
NetherlandsKernfysisch Versneller Instituut (KVI), University of Groningen, Zernikelaan 25, NL-9747 AA Groningen, Nether-
landsNIKHEF, POB 41882, NL-1009 DB Amsterdam, NetherlandsASTRON, PO Box 2, 7990 AA Dwingeloo, NetherlandsInstitute of Nuclear Physics PAN, Radzikowskiego 52, 31-342 Cracow, PolandUniversity of Łodz, Pomorska 149/153, 90 236 Łodz, PolandLaboratorio de Instrumentacao e Fısica Experimental de Partıculas, Avenida Elias Garcia, 14-1, P-1000-149
Lisboa, PortugalUniversity of Nova Gorica, Laboratory for Astroparticle Physics, Vipavska 13, POB 301, SI-5000 Nova Gorica,
SloveniaDepartamento de Fisica Atomica, Molecular y Nuclear, Facultad de Ciencias Fisicas, Universidad Complutense de
Madrid, E-28040 Madrid, SpainSpace Plasmas and Astroparticle Group, Universidad de Alcala, Pza. San Diego, s/n, 28801 Alcala de Henares
(Madrid), SpainDepartamento de Fısica de Partıculas, Campus Sur, Universidad, E-15782 Santiago de Compostela, SpainRudolf Peierls Centre for Theoretical Physics, University of Oxford, Oxford OX1 3NP, United KingdomInstitute of Integrated Information Systems, School of Electronic Engineering, University of Leeds, Leeds LS2 9JT,
United KingdomUniversity of Leeds, School of Physics and Astronomy, Leeds, LS2 9JT, United KingdomArgonne National Laboratory, HEP Division, Argonne, IL 60439, United StatesCase Western Reserve University, Dept. of Physics, Cleveland, OH 44106, United StatesDepartment of Physics, Colorado School of Mines, Golden, CO 80401, United StatesColorado State University, Department of Physics, Fort Collins, CO 80523, United StatesDepartment of Physics, Colorado State University, Pueblo, CO 81001, United StatesColumbia University, Dept. of Physics, New York, NY 10027, United StatesFermilab, MS367, POB 500, Batavia, IL 60510-0500, United StatesLouisiana State University, Dept. of Physics and Astronomy, Baton Rouge, LA 70803-4001, United StatesMichigan Technological University, Physics Dept., 1400 Townsend Drive, Houghton, MI 49931-1295, United StatesNew York University, Physics Department, 4 Washington Place, New York, NY 10003, United StatesNortheastern University, Department of Physics, 110 Forsyth Street, Boston, MA 02115-5096, United StatesOhio State University, 2400 Olentangy River Road, Columbus, OH 43210-1061, United StatesPennsylvania State University, Department of Physics, 104 Davey Lab, University Park, PA 16802-6300, United
StatesSouthern University, Dept. of Physics, Baton Rouge, LA 70813-0400, United StatesUniversity of California, Los Angeles (UCLA), Department of Physics and Astronomy, Los Angeles, CA 90095,
United StatesUniversity of Chicago, Enrico Fermi Institute, 5640 S. Ellis Ave., Chicago, IL 60637, United StatesUniversity of Colorado, Physics Department, Boulder, CO 80309-0446, United StatesHigh Energy Physics Group, University of Hawaii, 2505 Correa Rd., Honolulu, HI 96822, United StatesUniversity of Minnesota, School of Physics and Astronomy, 116 Church St. SE, Minneapolis, MN 55455, United
States
206

30TH INTERNATIONAL COSMIC RAY CONFERENCE
University of Nebraska, Dept. of Physics and Astronomy, 116 Brace Lab, Lincoln, NE 68588-0111, United StatesUniversity of New Mexico, Dept. of Physics and Astronomy, 800 Yale, Albuquerque, NM 87131, United StatesUniversity of Utah, 115 S. 1400 East # 201, Salt Lake City, UT 84112-0830, United StatesUniversity of Wisconsin-Milwaukee, Dept. of Physics, Milwaukee, WI 53201, United StatesInstitute for Nuclear Science and Technology (INST), 5T-160 Hoang Quoc Viet Street, Nghia Do, Cau Giay, Hanoi,
Vietnam
207
Copyright © 2022 FDOKUMEN