
Forschungszentrum Jülich
326
Forschungszentrum Jülich in Ger Helrrrholt~-Ger>reirr cFtirft
-
Upload
khangminh22 -
Category
Documents
-
view
1 -
download
0
Transcript of Forschungszentrum Jülich
Forschungszentrum Jülichin Ger Helrrrholt~-Ger>reirr cFtirft

Schriften des Forschungszentrums JülichBilateral Seminars of the International Bureau
Vol . 33

Forschungszentrum Jülich GmbHBilateral Seminars of the International Bureau
Egyptian - German Workshop an
Materials and Processesfor Advanced Technology:Materials for Energy Systems
Cairo 7 - 9 ,April 2002
edited byDetlev Stöver, Martin Bram
Schriften des Forschungszentrums JülichBilateral Seminars of the International Bureau
Vol . 33
ISSN 1433-5581
ISBN 3-89336-320-3

Bibliographic information published by Die Deutsche BibliothekDie Deutsche Bibliothek lists this publication in the DeutscheNationalbibliografie; detailed bibliographic data is available in theInternet at <http ://dnb .ddb .d e> .
Publisher
Forschungszentrum Jülich GmbHand Distributor :
Central Library52425 JülichGermanyPhone +49 (0) 24 61 61 - 53 68 - Fax +49 (0) 24 61 61 - 6103e-mail : zb-publikation@fz-juelich .d eInternet : http ://wvvw.fz-juelich .de/zb
Coverdesign :
Grafische Betriebe, Forschungszentrum Jülich GmbH
Printer :
Grafische Betriebe, Forschungszentrum Jülich GmbH
© Forschungszentrum Jülich 2003
Schriften des Forschungszentrums JülichBilateral Seminars of the International Bureau Vol . 33
ISSN 1433-5581MN 3-99336-320-3
Neither this book nor any part may be reproduced or transmitted in any form or by any means,electronic or mechanical, including photocopying, microfilming, and recording, or by anyinformation storage and retrieval system, without permission in writing from the publisher.
List of contents
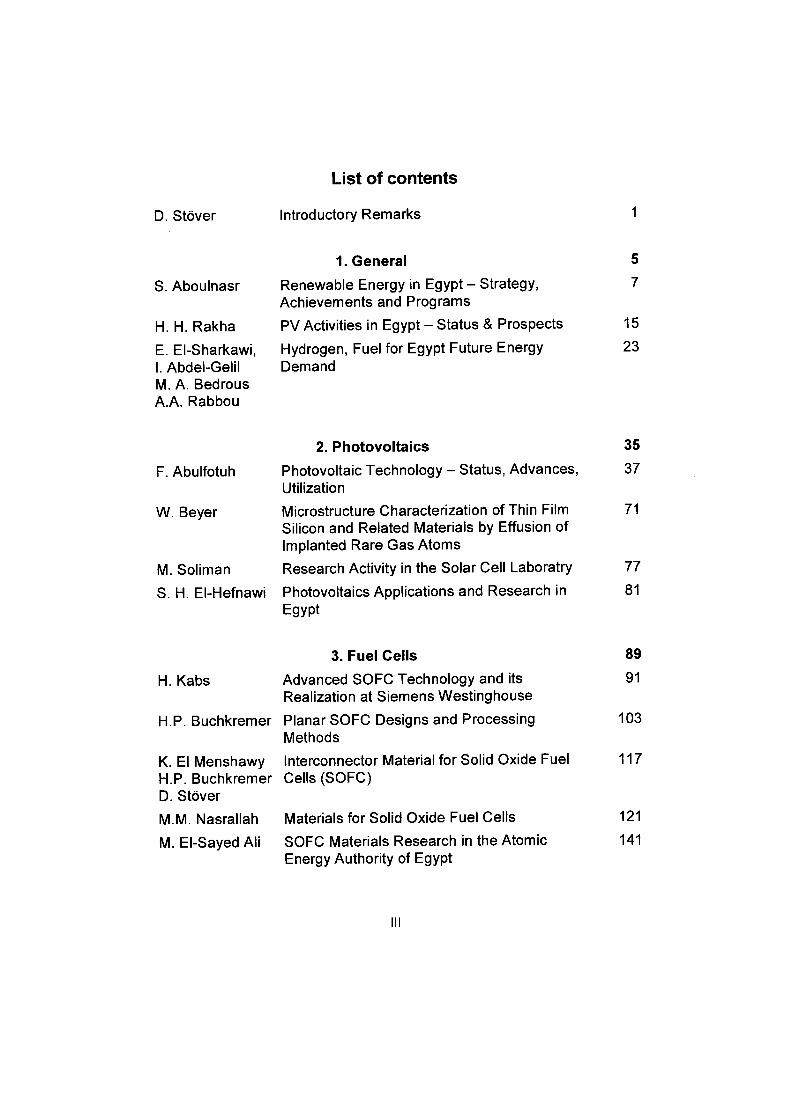
D. Stöver Introductory Remarks 1
1 . General 5
S . Aboulnasr Renewable Energy in Egypt - Strategy, 7Achievements and Programs
H . H . Rakha PV Activities in Egypt - Status & Prospects 15
E. EI-Sharkawi, Hydrogen, Fuel for Egypt Future Energy 23I . Abdel-Gelil DemandM. A. BedrousA.A . Rabbou
2. Photovoltaics 35
F. Abulfotuh Photovoltaic Technology - Status, Advances, 37Utilization
W. Beyer Microstructure Characterization of Thin Film 71Silicon and Related Materials by Effusion ofImplanted Rare Gas Atoms
M. Soliman Research Activity in the Solar Cell Laboratry 77
S . H . EI-Hefnawi Photovoltaics Applications and Research in 81Egypt
3. Fuel Cells 89
H . Kabs Advanced SOFC Technology and its 91Realization at Siemens Westinghouse
H.P . Buchkremer Planar SOFC Designs and Processing 103Methods
K. EI Menshawy Interconnector Material for Solid Oxide Fuel 117H.P . Buchkremer Cells (SOFC)D . StöverM.M . Nasrallah Materials for Solid Oxide Fuel Cells 121
M . EI-Sayed Ali SOFC Materials Research in the Atomic 141Energy Authority of Egypt
IV
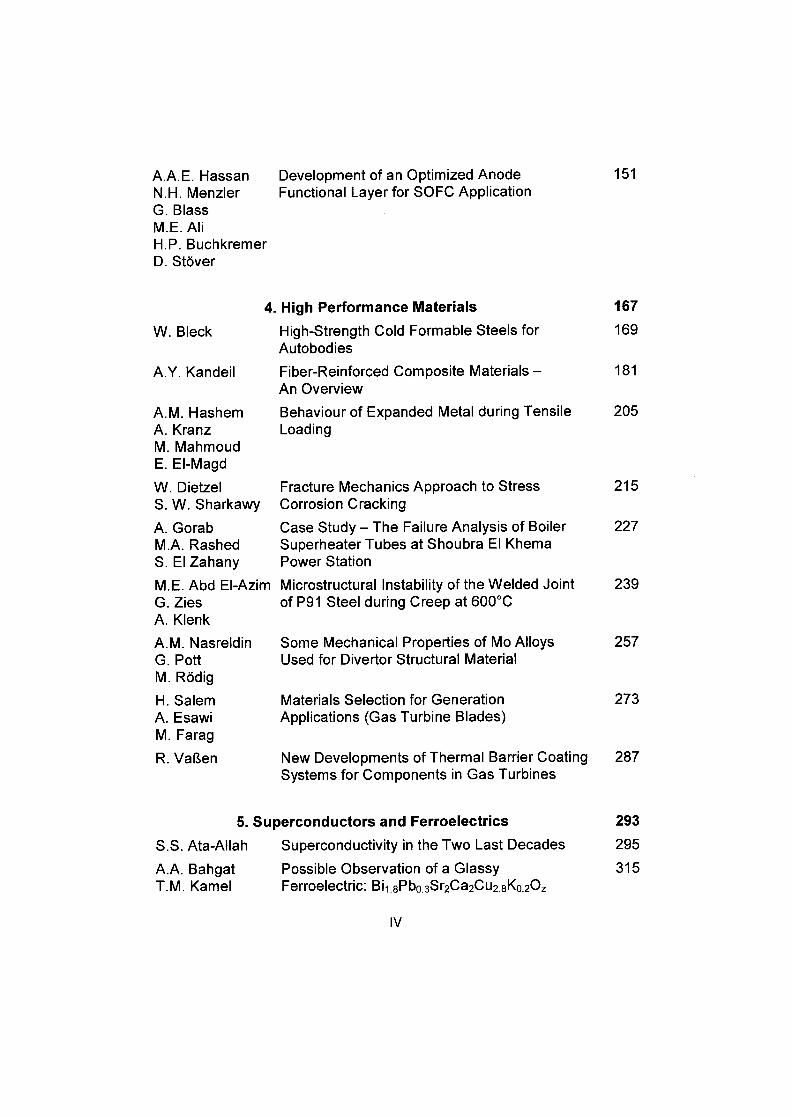
4. High Performance Materials 167
W. Bleck High-Strength Cold Formable Steels for 169Autobodies
A.Y . Kandeil Fiber-Reinforced Composite Materials - 181An Overview
A.M . Hashem Behaviour of Expanded Metal during Tensile 205A . Kranz LoadingM. MahmoudE . EI-MagdW. Dietzel Fracture Mechanics Approach to Stress 215S . W. Sharkawy Corrosion CrackingA. Gorab Case Study - The Failure Analysis of Boiler 227M.A. Rashed Superheater Tubes at Shoubra EI KhemaS . EI Zahany Power StationM.E . Abd EI-Azim Microstructural Instability of the Welded Joint 239G. Zies of P91 Steel during Creep at 600°CA. KlenkA.M . Nasreldin Some Mechanical Properties of Mo Alloys 257G. Pott Used for Divertor Structural MaterialM . RödigH . Salem Materials Selection for Generation 273A . Esawi Applications (Gas Turbine Blades)M. FaragR. Vaßen New Developments of Thermal Barrier Coating 287
Systems for Components in Gas Turbines
5. Superconductors and Ferroelectrics 293
S.S . Ata-Allah Superconductivity in the Two Last Decades 295
A.A . Bahgat Possible Observation of a Glassy 315T.M . Kamel Ferroelectric: Bi l.8Pbo.3Sr2Ca2Cu2.8Ko.20Z
A.A.E . Hassan Development of an Optimized Anode 151N.H . Menzler Functional Layer for SOFC ApplicationG . BlassM.E . AliH.P . BuchkremerD . Stöver

Dear Colleagues, ladies and gentlemen
Introductory remarks
Prof. Dr. Detlev Stöver
Joint Egyptian-German Workshop an Materials and Processes for Advanced
Technologies : Materials in Energy Systems
Excellency
Mrs. Chairman of AEA Prof. Feyza
It's a great pleasure for me to give you a heartily welcome an behalf of the German
delegation . We came here to meet you and celebrate this workshop an materials in energy
systems. In parallel I welcome all the participants from Egypt, excellencies, chairmen,
professors, scientists, good friends from recent and Former times. 1 welcome as well all the
participants of the German delegation, coming from Research Center Jülich but also from
R.C . Geesthacht, from Aachen University as well as Siemens industry.
The Egyptian-German cooperation in the field of material research has a long tradition of
more than 30 years. (Though it is risky to talk about 30 years tradition in a country wherehictnji ic rniiinter_i in milleniiimc Tather than in rierades .% Klims-rthAlecg thic chnrt n rinri r%
30 years is about one generation which means that people change maintaining the
cooperation . This indeed is happening and coincidently the content of the cooperation has
changed from the nuclear business to nowadays nonnuclear items in energy technology . 1
think materials R+D is really a key point to all substantial advances in existing energy
converting systems as well as for the development of really new systems.
New materials and related technologies always create the basis for new processes or
often even are the key problems to be solved before technological processes envisaged
can be made running . Let's take the fuel cell as an example. The principle of the fuel cell
has been discovered in 1839 by Sir William Grove and the famous solid electrolyte which
until today is doped zirconia has been discovered in 1899 . Nevertheless it took another
century to make a solid oxide fuel cell ready for the beginning of a market penetration
phase where we are faced with nowadays . And this has been made possible by intensive
work an materials and material technology R+D. So in my view we are completely right to
1

rely an and deal with materials in energy technology and to care especially about
cooperation in this field of science and technology.
There is an ongoing cooperation between Egypt and Germany concerning materials and
materials technology . The workshop here in Cairo is a lively demonstration of this .
For Egypt new energy technologies may play an important role in the Future looking, e. g.
at solar energy, direct conversation systems like fuel cells or even combined systems of
those. So it appears very logical and conclusive that material technologies for energy
systems should play a major role in the scientific and technological development prospects
of your country. The exchange of staff, the materials related R+D work should be
continued and may be even intensified in the future .
Ladies and Gentlemen, I hope we will have an interesting and challenging meeting here in
the next days. Last but not least let me mention the hospitality of our Egyptain partners
which is well known to many of us . I thank you already in advance for everything that will
be arranged .
Thank you and good luck.
Acknowledgements
The Joint Egyptian - German Workshop on �Materials and Processes for AdvancedTechnology : Materials for Energy Systems" was held at the Atomic Energy Authority inCairo, Egypt, 6.-9 . April 2002 .
The workshop was organized under the auspices of his Excellency Dr . Eng . HassanYounis, the Minister of Electricity and Energy. He gave an opening statement delivered byEng . H . EI-kholy, first under secretary . Prof. Fayza Abdel Mageed, EAEA Chairperson alsopresented a statement. Strengthening cooperation between Egypt and Germany wasemphasized by all speakers .
The workshop consisted of presentions from both sides . Nine German experts belongingto research centers, universities and industry have participated in the workshop . From theEgyptian side there were 18 lectures and about 50 senior management participantsbelonging to different electricity authorities and companies, Ministry of Petroleum, Ministryof Industry, Ministry of Defense, universities and research centres .
The presentations covered several R&D activities in the field of materials for energytechnologies . Most of the presentations were focused an problems related to materials andmanufacturing processes of different energy systems including solar cells, solid oxide fuelcells, steam power plants and gas turbines and superconducting materials . Someoverviews were also presented an the strategy and programmes of renewable energy inEgypt as well as fuel cell programmes for transport applications in Egypt .
The workshop was considered as having been really successfui in evaluating results anongoing projects and giving hints for some future research and development work .
We thank all contributors and participants for their presentations and stimulatingdiscussion . The funding given by the Federal Ministry for Education and Research (BMBF)through the International Bureau of Forschungszentrum Jülich GmbH is gratefullyacknowledged .
The saure holds for the Egyptian Ministry of Electricity and Energy and the EgyptianAtomic Energy Authority .
Moreover thanks belong to the International Bureau of Forschungszentrum Jülich GmbHfor publishing these proceedings in their Series, International Cooperation, BilateralSeminars.


1 . General
S. Aboulnasr Renewable Energy in Egypt-Strategy, Achievements 7and Programs
H. H . Rakha PV Activities in Egypt-Status & Prospects 15
E. EI-Sharkawi, Hydrogen, Fuel for Egypt Future Energy Demand 23I . Abdel-GelilM. A. BedrousA.A. Rabbou

1- IntroductionSecuring energy demand an continuous bases is a vital element for sustaineddevelopment plans. In view of the limited fossil fuel reserves, the depleted nature of thefossil fuel, the growing concerns about the pollution from the conventional power plantsand their negative impacts an the environment, Egypt has given due consideration to thepromotion of its indigenous renewable energy resources mainly Solar, Wind and Biomass.
2- Institutional Framework:
Egypt has an early start addressing renewable energy . Since 70's different institutions andorganizations have developed programs in the field . Such programs were coordinatedthrough the RE supreme council .
To support and enhance the institutional capabilities for renewable energy developmentand as a result of the growing interest and activities in the Field, The New and RenewableEnergy Authority "NREA" was established in 1986 to provide a focal point for expandingefforts to develop and introduce renewable energy technologies to Egypt an a commercialscale together with implementation of related energy conservation programs.
NREA is entrusted to plan and implement renewable energy programs in coordination withother concerned national and international institutions within the framework of its mandatewhich are:-
-
Renewable energy resources assessment and planing for utilization .-
Research, development, demonstration, Testing and evaluation of the differenttechnologies .
-
Application of mature technologies .-
Education, training and information dissemination.-
Transfer of technology, development of focal industry .-
Establishment of testing and certification facilities and development of focalstandards and codes.
3- The Strategy
RENEWABLE ENERGY IN EGYPTSTRATEGY, ACHIEVEMENTS AND PROGRAMS
ENG. SHERIF ABOULNASR*EXECUTIVE CHAIRMAN
NEW & RENEWABLE ENERGY AUTHORITY (NREA), EGYPT
In early 80's, while formulating the strategy of the Egyptian power sector, the planing forrenewable energy was considered as an integral part of the National Energy PlanningProcess.
The renewable energy component of the national energy strategy targets to provide acontribution from R. E. sources to cover 3% of the electric energy demand by 2010, withadditional contributions in other energy applications .
. Presented by Eng. Bothayna AmeenRashed, General Manager of Planning, NREA
Such expansion plan gives plenty of room for a considerable share of electricity generationfrom renewable energy sources
It is obvious that the implementation of such strategy will be an essential element of thenational plans for achieving sustainable development and protection of the environmentvia upgrading energy efficiency and replacing conventional polluting resources byrenewable resources.
4- Renewable Energy Achievements :
During the last decade, Egypt has been one ofprograms for the development of renewable energysolar, wind and biomass. The following describesdifferent fields of activities, almost focusing anassessment and applications with long term plans.
4-1 Pilot & Demonstration Projects
4.1 .1
In the Field of Solar Photovoltaic.
the developing countries followingresources, with special emphasis anthe milestone achievements in thesolar and wind energy resource
Most of the Photovoltaic applications were demonstrated and Field tested as Waterpumping, desalination, clinical refrigerators, village electrification . . .etc, whiletelecommunication systems, navigation and airport aid lights and highway advertisingboards are already commercialized . The capacity of the PV projects presently in operationamounts to about 2 MWp.
4.1 .2
In the Field of SolarThermal Applications And Energy ConservationSystems
Domestic Solar Water Heaters (DSWH)Since early 1980s, low temperature Domestic Solar Water Heaters (DSWH) have beenproduced locally through joint ventures . Currently, eight companies are active in the field ofproduction, design and installation as well as competing to adopt products to the localconditions . The annual production capacity exceeds 25,000 m2 of collectors . Over 300,000 m2have been installed and operated particularly in new Cities and touristic villages . As well, thegovernment has adopted measures to support market promotion through mandatory use of°DSWH" in new communities . Egyptian standard specifications and Codes of practice for"DSWH" were issued in 1986 . NREA is providing technical expertise and services for the design,testing, development, applications and supervision of solar water heating systems.
Solar Industrial Processes Heat (SIPH)To satisfy the strategc objectives, NREA implemented two "SIPH" pilot projects of lowtemperature in the food and textile industries . They are integrated with waste heatrecovery systems and co-financed with United State Agency for InternationalDevelopment (USAID). Their objectives were to demonstrate and field testing SolarIndustrial Process Heat and Waste Heat Recovery Systems in different sectors. Each

one included local manufactured flat plate collectors with total surface area 356 mZproducing 26 m3/day of hot water at 50 - 65°C . The two projects have been operatingsuccessfully Since 1990, 1993 respectively, saving about1800 TOE/Year .
In the frame of comprehensive planning of Solar Industrial Processes heat and wasteheat recovery systems for medium temperature in Egypt (1997 -2012), NREAperformed a study to forecast, through field Energy Audits, the potential of SIPH andwaste heat recovery systems for six industrial sub sectors. The study was financed bythe African Development Fund (ADF). As a result of this study, A Pharmaceuticalcompany has been selected to host a pilot project for medium/ high temperature (up to175°C) .
The project is currently under implementation, using parabolic concentrators with singleaxis tracking system.The project mainly consists of
- Solar plant (parabolic trough collectors) for process steam generation at175°C/8bar .
-
Energy conservation for condensate steam returns system, insulation of steamnetwork and burners of boilers .
The project is planned to start operation by 2003 with expected fuel saving rate of about1200 TOE/Year.
4.1 .3 In the Field Wind Energy
Egypt is endowed by huge wind energy potentials where the coastal areas particularlythe Red Sea Coast and the South Western parts of the country have high windvelocities reaching 10 m/s and 7 m/s respectively . Wind resources in coastal areas ofEgypt have proven to be feasible both for mechanical pumping and electricitygeneration . Several organizations have directed efforts towards utilization of suchresource .
Encouraged by the high wind regime at the Red Sea, the first steps of exploiting windenergy have been started by limited pilot projects .
In 1988, the First Wind Farm with a capacity of (400Kw) was installed in RasGhareb an the Red Sea Coast serving one of the oil companies. The WindFarm Consists of 4 units, 100 kW each .Fully imported wind turbines were used .
In 1992, the second wind farm is 4X100 KW each at Hurghada an the Red SeaCoast. 45% of the wind turbine components were locally manufactured, mainlyblades, towers and other mechanical parts. The farm has been connected to thelocal network of Hurghada city . In 1998, the network has been connected to theNational grid .
The a/m wind generated electricity is powering desalination units to produce 130 m3/day ofpotable water to satisfy NREA' site facilities needs of water at Hurghada
4-2 Large Scale Electricity Production Program
Egypt has crossed the phase of limited demonstration projects to the phase of largescale grid connected projects .
In 1994, NREA has formulated its Bulk Renewable Energy Electricity ProductionProgram (BREEPP) for large-scale power generation .
The BREEPP has two main components for both grid-connected large-scale solar andwind electricity generation plants and forecasted to push ahead both technologies tothe market place.
4.2.1 Solar Thermal Electricity Generation (STEG)
As far as the solar electricity is concerned, NREA has completed in 1995, anassessment and identification study for the Solar Thermal Electricity Generation"STEG" potentials which concluded that :
1 .
The total accessible potential for national grid connected "STEG" systemsin Egypt is tremendous and far exceeds all practical expectations forimplementation . Priority is given to the areas having higher direct solar radiationintensity(2200-2600 Kwh/m2/year) and access to both electrical grids & natural gasnetworks .
2.
The Integrated Solar Combined Cycle System "ISCCS" using parabolictrough solar technology with a conventional gas turbine combined cycle (Annex4&5) is considered the most appropriate system for Egypt's first plant . The choiceof solar technology for the next plants will depend upon the state of art at the timeof commencing the implementation procedure.
In 1996, the Egyptian Cabinet of Ministers has approved an the establishment of the first"ISCCS" pilot power plant of about 100-150 MW capacity .The natural gas will be used as a fossil fuel for the gas turbine and the peak periodsupplementary firing in the Waste Heat Recovery Boiler (WHRB) .The first plant is anticipated to be implemented through Build-Own-Operate-Transfer(BOOT) Or Build-Own-Operate (BOO) contract .
In 1997, two pre feasibility studies were performed for the first °ISCCS" plant at Kuraymatwith a capacity of about (150) MW. The studies were based an parabolic troughconcentrator and central tower receiver technologies as alternates . Egypt has officiallyrequested The Global Environment Facility (GEF) to support the project .GEF has shown a positive response being available to provide a grant fund to cover asubstantial part of the incremental cost in comparison to the least cost conventionalalternative producing the same annual electric energy, and assigning the World Bank asan implementing Agency
10

The consulting services were divided into two phases as fallow:
Phase I :To conduct a feasibility study covering the technical, economic, financial, aspects
including identifying the appropriate configuration, plant size, solar fraction, suitable solartechnology and conceptual design of the plant, with estimation of the incremental cost incomparison with a reference conventional (C.C) plant producing the same annual electricenergy .
Phase II :
The capacity of the power plant is 127MW.The solar contribution is 31 MWeThe annual produced electric energy by the integrated plant is about 900 GWh.The solar contribution represented 9.1 % of the total electric energy productionCo2 saving is 7.1
The consulting services include :Preparation of the Request for Proposals (RFP) for private developers or anyother documents as required .Assisting EEA/NREA in the evaluation of the offers, including support innegotiations with the successful bidder.
The second phase of consulting services is expected to be completed by end of 2001 .The plant is planned to be operative in 2006 .
Commercial wind Farms.
- A Grid connected5MW Wind Farm at Hurghada .The farm consists of 38 wind turbines of different technologies (pitch regulated/stallregulated blades/ tubular/lattice towers) and ratings (of 100-300 Kw). 50% of thecomponents are locally manufactured . The farm has been connected to the local gridand operated successfully since 1993, producing about 10 million Kwh/year.
- Wind Energy Technology Center (WETC)A wind energy technology center in Hurghada was established in cooperation withDenmark. l t includes a mechanical & electrical workshop and a training center .The main activities of the center are:- Research and development.- Testing and certification for wind turbines' components- Technical evaluation- Training programs.
The Center can serve local objectives and regional cooperation programs

An area of 80 Km' an the Gulf of Suez at Zafarana site has been allocated for NREAto start implementing the large-scale wind electricity programs .
Projects under operation :-
The 15t phase (30 MW) of 60 Mw wind farm in cooperation with the DanishInternational Development Agency (DANIDA) has been connected to the nationalgrid and operated since Nov. 2000 . The annual electric energy production is about120 GWh/year
The 1S t stage (33 Mw) of 73 Mw wind farm in cooperation with German governmenthas been connected to the national grid and operated since Feb. 2001 . The annualelectric energy production is about 130 Gwh/year .
The above mentioned phases are saving about 50,000 T.O.E . /year
Projects under implementation
The 2nd phase (30 MW) of 60 Mw wind farm in cooperation with (DANIDA) to beoperative in 2003
The second and third phases (each 20 MW) of the wind farm in cooperation withGerman government (to be operative by 2002 & 2003 respectively) .
Projects under Negotiations
120 Mw wind farm at Zafarana (in 2 stages) in cooperation with Japan. Theproject is in the Phase of negotiation, while a feasibility study was performed forthe project .
" 60 Mw wind farm at Zafarana in cooperation with Spain. A memorandum ofunderstanding was signed with the selected Spanish consulting firm was assignedto perform consulting services for the project.
5-
Renewable Energy Program Up To 2010
5.1 In The Field of Solar Thermal Electricity Generation (STEG)
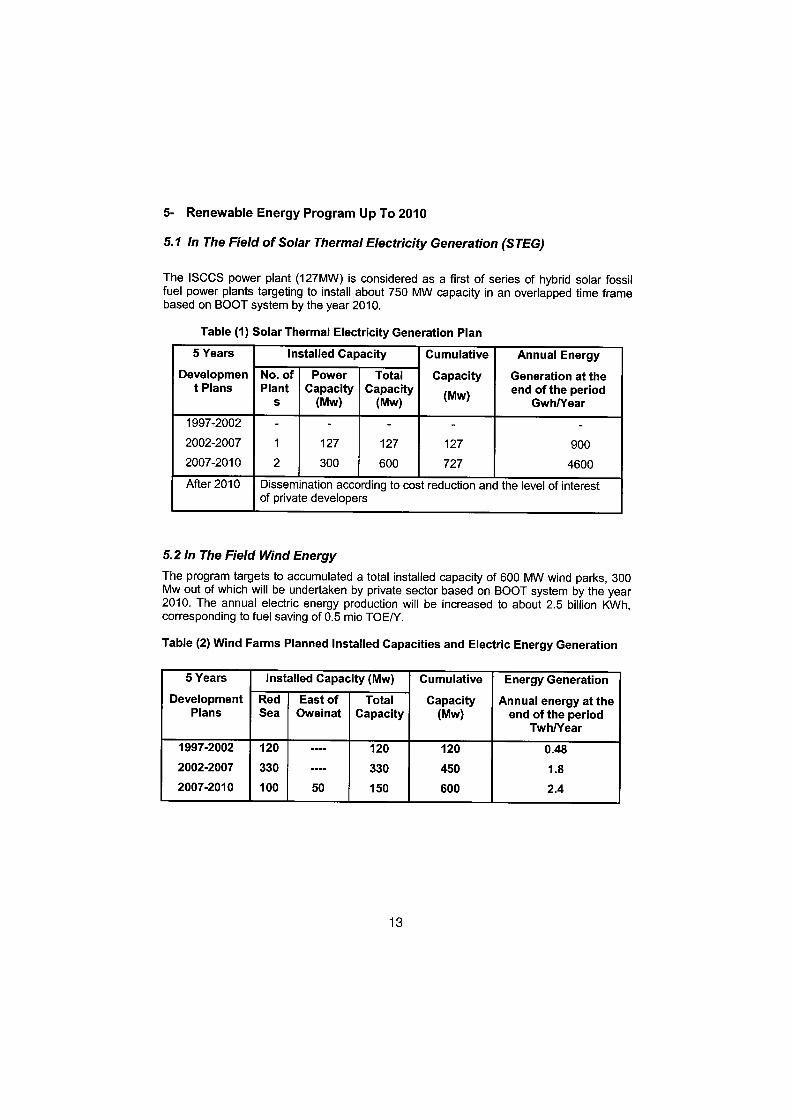
The ISCCS power plant (127MW) is considered as a first of series of hybrid solar fossilfuel power plants targeting to install about 750 MW capacity in an overlapped time framebased an BOOT system by the year 2010 .
Table (1) Solar Thermal Electricity Generation Plan
5.2 In The Field Wind EnergyThe program targets to accumulated a total installed capacity of 600 MW wind parks, 300Mw out of which will be undertaken by private sector based an BOOT system by the year2010 . The annual electric energy production will be increased to about 2.5 billion KWh,corresponding to fuel saving of 0.5 mio TOE/Y.
Table (2) Wind Farms Planned Installed Capacities and Electric Energy Generation
1 3
5 Years Installed Capacity Cumulative Annual Energy
Developmen No . of Power Total Capacity Generation at thet Plans Plant Capacity Capacity
(MW) end of the periods (MW) (MW) Gwh/Year
1997-2002 - - - - -
2002-2007 1 127 127 127 9002007-2010 2 300 600 727 4600After 2010 Dissemination according to cost reduction and the level of interest
of private developers
5Years Installed Capacity (Mw) Cumulative Energy GenerationDevelopment Red East of Total Capacity Annual energy at the
Plans Sea Oweinat Capacity (MW) end of the periodTwh/Year
1997-2002 120 ---- 120 120 0.482002-2007 330 ---- 330 450 1 .82007-2010 100 50 150 600 2.4

References
1 .
Country Profile for Renewable Energy in Egypt, Sep., 2001 " New & RenewableEnergy Authority (NREA)"
2.
Annual Report of Egyptian Electricity Holding Company (200/2001)
3.
Egypt's Renewable Energy Strategy, Achievements And Programs,Eng. M. Sami Zannoun, April 2001
1- Abstract
2- Introduction
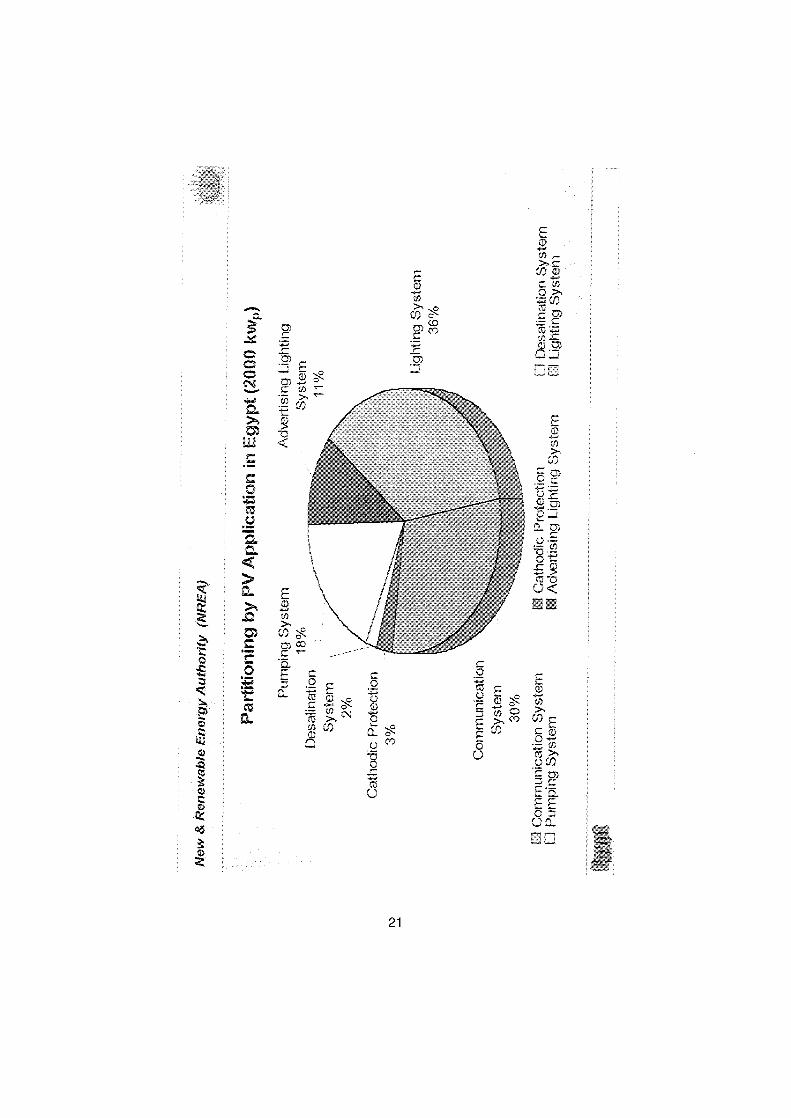
PV Activities in EgyptStatus & Prospects
Eng. Hassan Hassaballa RakhaGeneral Manager PV Dept. NREA
This paper presents the extensive experience of PV applications in Egypt, which arecarried out, in parts by the New & Renewable Energy Authority (NREA) and thebenefits of renewable energy. It also covers the future prospects of PV applications forsustainable development of rural and isolated areas, and the constrains limiting thespread use of such technology in Egypt.
Egypt is located in the world's solar belt and has an excellent solar availability . Theannual average global solar radiation over Egypt ranges from about 1950 kWh/m2/yearan the Mediterranean coast to a more than 2600 kWh/m2/year in upper Egypt. Whileabout 90 % of the Egyptian territory has an average global radiation greater than 2200kWh/m2/year.
In 1986, the New and Renewable Energy Authority NREA was established in order tocarry out the rote of the introduction, dissemination, utilization and development ofRenewable Energy RE application in Egypt. Energy was considered as an integral pariof the national energy planning that targets to cover3 % of the electric energy demandfrom renewable resources by the year 2010 .
Egypt has got an ambitious plan for village electrification . More than 98 % of the villagewere electrified from the utility grid . From the rest of the unelectrified villages there arefew hundreds of small remote rural communities that was found to best fit forphotovoltaic PV solar electrification. Those villages are characterized by low Powerdemand, constant load, dispersed nature of houses, beyond the economical extensionof the utility and are not included in the future plan for electrification from the nationalgrid .
Also PV pumping systems and PV solar home are needed for the private sector in thenew reclaimed lands and remote areas, but the main difficulty now is the high initialcosts of there systems.
1 5

3- Benefits of Renewable Energy
WaterPumaing
Enhance diversity in energy supply markets, thereby strengtheningenergy security .
Represent secure, long-term, environmentally sustainable energysupplies .
Make a major contribution to the global and reduction of atmosphericemissions.
Provide commercially attractive options to meet specific user .
Create significant regional employment opportunities in energyinfrastructure manufacturing, installation and maintenance.
Offer low operating costs and opportunity to manufacture much of theequipment locally.
Renewable energy can not be exhausted .
4- PREVIOUS EXPERIENCE I N THE FIELD OF PV SOLAR ENERGY FORRURAL ELECTRIFICATION
Photovoltaic power utilization has been addressed within the Egyptian Ministry ofElectricity and Energy MEE as early as 1979 . Most of the known PV applications suchas water pumping, desalination, clinical refrigerator, ice making plant, villageelectrification, bill boards etc have been demonstrated and field tested in Egypt. Somecommercial PV applications such as telecommunication, navigation aids and billboardsare now self-sustainable in Egypt.
Currently, the various PV powered projects are accounted to beyond 2 MWp spreadover different parts of Egypt. Contributors in these projects are the national,international institutions and private sector .
5- NREA ACCOMPLISHMENT IN THE FILD OF PHOTOVOLTAICPROJECTS
NREA has accomplished considerable achievements in introducing PV to the EgyptianContext for various applications starting from pilot projects to field - testing anddemonstration through commercialization . The most significant projects are follows
14 kWP PV pumping system at Wadi EI-Natroun with water production inthe range of 80 - 100 m31day .
2.2 kWP PV portable unit with water production in the range of 20 - 30m31day .
1 6

Desalination
-
1.7 kWP PV pumping unit at Mansoreia Village.
Villa_ge Electrification
Refrigeration
Communication
7 kW, PV pumping and RO water desalination plant for producing 5 - 7m31day offresh water at High Voltage Research Center I EEA.18.5 kWP PV desalination RO plant at EI-Hamrawein an the Red Seawith a productivity of 60 m31day.8 kWP PV I Diesel - powered RO water desalination unit for producing 5m31day of potable water at Abou-Ghosoon an the Red Sea Cost .
- 28 kWP PV pilot project for electrification of remote village has beenimplemented for
1 7
Household Lighting .
Street Lights .Pumping Units.
Installation of a 38 kW PV/Diesel/Battery hybrid power system poweredIce-Making Plant to produce 6 tons per day of flake ice for fishpreservation at remote desert lake in Wadi EI-Raiyan, EI-Fayoum.10 PV-Power Refrigerators for vaccine storage were installed in ruralhealth care facilities .1 .2 kWP refrigerator for keeping medicine in health unit equipment at MitAbou EI-Kom Village .
-
8 PV powered emergency communication systems.
Signaling & Warninci
-
Anaval warning system placed an Lake Nasser .

Others
Concultancy Services
6- PV Prospects
A number of PV - Powered colour television sets .
A loudspeaker system at Mit Abou EI-Kom Mosque .Lighting some offices for the organization for Energy Conservation andPlanning OECP .
Prepare tender document for PV powered obstruction lighting units withbattery storage for High Voltage Transmission Lines (Towers) forEgyptian Electricity Authority EEA.
Introducing the technical consultancy for acceptance and operation testsand preliminary hand over for Ein EI-Skhona Tall Station and SuezBalance with 30 WP PV power system for lighting .
PV Solar Electricity to serve rural / isolated areas
Energy has a vital role to play in meeting the basic needs of rural population andimproving the Standard of living . Increased and improved energy supplies can increasefood production, water supply, Health care, Education and communication. l t can alsosupport industrial activity in rural areas, providing local employment, reduce migrationto urban areas.Egypt in its national strategy plan is aiming for the development of new communities,remote villages and desert areas.
6.1 Off-grid Remote Communities and Village PV Electrification
Inspite of the ambitious an going Egyptian rural electrification plans through gridextension which covers more than 98 % of the rural villages, there will be still someremote isolated small communities and settlements that are far from the electric gridand consequently will not be attached to it .
More than a hundred of Small remote isolated communities which are characterized bypoor inhabitants were found to best fit the PV electrification and are not included in thefuture plan for electrification from the national grid . The structure of hoose communitiesin many cases includes 20 house each, 8 persons per family, low power demand (700-800 Wh/day), constant load, and dispersed nature of houses and far from the utilitygrid . Consequently individual PV household's kit capable of supplying around 700Wh/day Gould be an appropriate solution .
The Egyptian government has decided lately to electrify a number of 33 remote villagesas a first stage in Sinai using PV power systems. Five remote communities have
1 8

been choosen in south Sinai to be electrified by PV power as a 15t phase. Those fivecommunities will be assessed in terms of the technical reliability and social impact andwill feedback the next phases .
First Phase Project Profile
No of houses to be electrified
143No of public buildings
4Estimated load energy per house
800 Wh/day
6.2 PV Electricity Supply for Pumping System for Land ReclamationProjects
Currently the government of Egypt is placing high priority an developing New Desertareas in order to decrease the overpopulation around the Nile Valley and Delta creatingnew societies, newjob opportunities, new investment as well as raising the Standard ofliving .
The Egyptian plan of new land reclamation projects considered the use of ground wateras a potential supply of irrigation . High level of solar radiation and availability of underground water characterize the Egyptian desert areas. All those feature encourage theuse of renewable energy, which is inexhaustible, clean energy and suitable for userural areas which are far from the utility grid and difficult sites for the diesel operation.
In regard to the diesel gensets, the disadvantages of the diesel generator set aremultiplied ; costs of fuel and repairs time required for management of the supply of fuel,breakdowns and of Start & stop, operation, a relatively short life time, fume, thedisturbances resulting from fumes, noise and vibration .
The Egyptian national plans for new land reclamation include; development of 3.4million feddans in Toshki, 12.000 feddans at Darb EL Arbean and planting 200.000feddans in East Oweinat in 10 years time by digging 1500 - 1600 water wells. Theestimated power requires for East Oweinat 200 MW for water pumping and waterdistribution network, small industries for agriculture product and lighting . The existingwater wells are 217and they use diesel generators .
The characteristics of the existing wells at East Oweinate are
7- PV Cost Reduction
New material .
Higher module efficiency.Improved manufacturing technology.Mass productions .Design quality .
1 9
Static Head : 25 - 30 mWell Depth : 250 - 300 mWell Discharge : 200 - 250 m3 / hr.Diesel Operation : 16 hr/day

8- PV Barriers
9- Recommendation /PV market development
To make PV a significant energy option for rural / isolated areas progress is needed toreduce costs, increase awareness faster market deployment by removing technical andnon-technical barriers .
10- Action needed
The rote of the governments:
Incentives and subsidies (micro - finance schemes) should applied to stimulatedemand .
Given high priorities in the national plan for using PV solar home systems in therural areas with small loans instead of extending the national grid .Holding seminar / workshops an rural energy to encourage the market.Encourage the private sector to participate in rural energy .Eliminate the taxes an the imported equipment.
10-1 Technical issues
10-2 Financing agencies
Relatively higher unit cost of systems.Low income levels of rural dwellers .
Lack of people awareness.
Lack of coordination of the key players.Lack of incentive for market stimulation .Lack of local manufacturing capabilities to minimize system cost .Lack of setting of rural energy within national plans.
Improving productivity and manufacturers of PV to make it moreaffordable.
Train local people in technology application and operation.Link agriculture and cottage industries to rural energy development.
-
Adequate funding of GEF and ODA (official development assistance) .- Adequate funding of CDM (clean development mechanism) of Kyoto
protocol to the UN framework convention an climate change .-
Leverage new World Bank Village Power Program.
20
21

22
1. INTRODUCTION
HYDROGEN, FUEL FOR EGYPT FUTUREENERGY DEMAND
By
Dr . Emad El-Sharkawi
Dr. Ibrahim Abdel-GelilChairman, ENC-WEC'/Egypt
Executive Chairman, EEAAZ/ Egypt
Eng. MaherAziz Bedrous
Eng.AhmedAbdRabbouDirector of Environmental Studies,
Coordinator, Climate Change Unit,EEHC3/Egypt
EEAA/Egypt
New energy resources and technology will have a crucial role to play throughout tomorrow'sworld, but its potential contribution is even greater in the developing countries. It is in thedeveloping countries that, over the next 30 years and beyond, the greatest increase in energyconsumption is needed and will occur. Because of lack of resources, a significant proportion ofthis energy demand may have to be obtained from new forms of energy. Hydrogen is anacceptable candidate. It is practical to produce hydrogen in a large scale through electrolysis ofwater, which is an available substance in nature. Hydrogen combustion is very clean and almostcomplete under controlled conditions . lt produes only water vapor and NOxwhen combustiontakes place with oxygen from air . NOx removal technology exists today.
Hydrogen, also, has the outstanding physio-chemical properties such as : low ignition energy,high ignition temperature, high flame propagation rate and wide flammability range.
Already today hydrogen is a very important element used in huge quantities by the chemicalindustry . However, the major part (over 75%) ofthis hydrogen is produced by steam reformingof natural gas. The rest is produced by water electrolysis based an current (conventional)technology that does not necessarily rely an fossil energy .
Solar energy, (photovoltaics and photo-assisted electrolysis), may open a new gateway forlarge-scale solar hydrogen systems.In short, hydrogen could provide an inexhaustible source for the energy needed to powertomorrow's world. Hydrogen also could help solve some of today's pollution-relatedenvironmental problems.
This paper outlines the present generation and use of hydrogen in Egypt's transport sector aswell as future prospective to using large-scale hydrogen energy systems.
1 . ENC-WEC
=Egyptian National Committee of the World Energy Council2. EEAA
=Egyptian Environmental Affairs Agency3. EEHC
= Egyptian Electricity Holding Company
23
2. ENERGY SITUATION OF EGYPT
2.1 . Energy supply
Egypt's main energy resources are oil, natural gas, coal and hydropower, in addition to a goodpotential of renewable energy resources. Oil reserves are estimated to equal to approximately3.804 billion barrels (end of 2000/99), most of which are located in the Gulf of Suez . Oilproduction during the Same year is accounted for about 36.585 Mtoe . Natural gas is the secondmajor energy resource with a reserve level of nearly 8.89 billion barrels of oil equivalent. Mostof the gas resources are located in the North Coast, Nile Delta and Western Desert. With thecurrent annual production level of about 14 .6 Mtoe, it is planned that natural gas would play animportant role in the country's future fuel mix.
Hydropower is the third major energy resource in Egypt. Nearly 95% ofthe Nile's hydropowerpotential has already been exploited to generate about 14.659 TWh of electricity for the year2000/99. Oil and gas accounts for about 94.4% of total commercial energy production whilehydropower represents the remaining 5 .6%. In addition to oil, natural gas and hydropower,Egypt has limited coal reserves estimated at about 27 Mt. The only commercial mining is nowbeing developed in "Maghara", Sinai to produce about 60,000 tons per year . About 1.4 Mt tonsper year of coal are being imported as feedstock for steel industry.
In addition to its limited commercial energy resources, Egypt has also a good potential ofrenewable energy resources . These include solar, wind and biomass such as fuel wood,agriculture wastes and dried animal dang, which have been used in rural areas to meet someenergy demand . lt is estimated that about 3.6 Mt of oil equivalent of Biomass energy isconsumed annually .
Due to its geographic locations, Egypt enjoys the sunshine all year around with direct dailysolar intensity ranging between 2600 to 7100 kcal/m2. Meanwhile, wind speed mappingsshowed that Egypt has some locations ofaverage annual wind speed ofabout 30 km/hr capableofproducing power from wind turbines .
According to 2000/99 figures, primary commercial energy consumption totalled about 44.05Mtoe of which oil represents about 61%, gas about 31% and hydropower about 8°/" . The percapita energy consumption is approximately 0.67 toe which is higher than the average of mostdeveloping countries.
2.2 . Energy Demand
Egypt has had a long history of rapidly growing energy demand which grew by an averagegrowth rate of about 8.6% per annum during the 1970's and 6.5°/" during the 1980's. During thesame periods, the electricity sector was characterized by increasing reliance an oil as a basicsource offuels due to limited availability of hydropower resources . Thermal power generationusing petroleum products and natural gas currently represents nearly 80% ofthe total electricitygeneration, while the Balance is met by hydropower .
In addition to energy transformation sectors, energy is consumed in four major end use sectors .These are industry, transport, residential and commercial and agriculture . Energy consumptionby sectors in 2000/99 reveals that industry and transport are the major energy consuming sectorswhich accounted for about 45%and 31 .3°/" respectively oftotal final consumption .
24
2.3 . Energy future outlook
Based an the Govemment's development plans, population growth, fuel prices, and using theincome and price elasticitys previously developed at OEP, the total and sectoral future energydemand during the period (1998/99-2016/17) have been determined using the Energy andPower Evaluation Program (ENPEP). Accordingly, total energy consumption is expected toincrease from nearly 1213 PJ in 1998/99 to about 4177 PJ in the year 2016/17. The industrysector is expected to be the major consumer of petroleum energy (oil and gas) in the year2016/17. Its share in the total demand is expected to increase to about 45 % in the year2016/17. The demand of the power sector is found to increase from 403 PJ in 1998/99 to about1335 PJ in 2016/17. The future expansion plan of the Egyptian Electricity Holding Company(EEHC) through the year 2017 is expected to be 77% dependent an natural gas, 8%hydropower, and 5% an renewable resources . The transport sector total demand is expected toincrease from nearly 310 PJ in 1998/99 with a share of about 37% of total energy consumptionto reach about 501 PJ in 2016/17 with a share of 12% oftotal energy consumption.
Considering this big demand of energy an the light of oil and gas reserves in Egypt, it is quiteobvious that new sources ofenergy are greatly needed for securing energy supply streams to thenational sustainable energy development . In this context, hydrogen fuel represents the mostviable solution for meeting future needs ofenergy demand .
3. VIABILITY OF HYDROGEN FUEL
The unique advantage ofhydrogen as a fuel is that it is one of the most abundant elements in theuniverse, can be produced from water, and does not introduce oxides of carbon into theatmosphere . A hydrogen-based economy would evolve an a completely sustainable,nonpolluting fuel cycle, one that replicates the great natural cycle of the biosphere with watervapor as its only major waste product .
The conversion technology of water or natural gas to hydrogen in large central plants istechnically viable today; economics and safety are the major concems that must be overcome tomake widespread commercial use ofhydrogen as fuel .
Existing natural-gas pipelines could be adapted in many cases for hydrogen transportation, sothat transporting hydrogen would cost much less than transporting electricity over longdistances. Hydrogen can also be stored more readily than electricity. With proper modifications,some types of intemal-combustion engines can be modified to bum hydrogen . Hydrogen alsocan have advantage as an aviation fuel forjet engines, in the future .
Gaseous hydrogen, taking its efficiency advantage into account, would cost about $1 .40 for theequivalent of one gallon of gasoline. If fossil fuels are hold responsible for the environmentaldamage they do, then at least $1 per gallon to the true cost of gasoline has to be added.Therefore, even today, hydrogen is cheaper than fossil fuels when the overall societal costs areintemalised.
4. SOURCES OF HYDROGEN
The vast majority of the hydrogen needed to power tomorrow's world would be manufacturedas a by-product of renewable or environmentally acceptable technologies . Hydrogen will be
25
manufactured from non-polluting sources and would provide a means to wean us fromtraditional fuels.
Until renewable technologies are proven reliable and economical, most of the hydrogenmanufactured will continue to be a by-product of fossil fuels such as natural gas. In the ferst partofthe twenty-First century, coal could become the cheapest source for producing hydrogen, withits carbon dioxide by-product captured and utilized for industrial purposes or sequestrated . And,as the next generations ofinherently safe nuclear reactors are developed, and a safe acceptableanswer is found for the question of permanent storing radioactive wastes, then nuclear powercould also prove to be an important source of electricity for hydrogen production .
Today, many of the R&D centres are researching hydrogen production from coal, natural gas,and the use of electro-catalysts to "split" water with sunlight. Scientists and technologistsbelieve that, initially, the way to a hydrogen-powered world is by extracting hydrogen from coalbut containing the attendant carbon dioxide . They believe that the overall project will includeselling or sequestrating carbon dioxide so that it will not contribute to the global-warmengproblem.
They, also, consider that photovoltaic (PV) based electrolytic hydrogen - hydrogen capturedfrom the earth's atmosphere - could be both environmentally benign and an economicallycompetitive alternative to electricity by the turn of the century . These scientists also claim thatPV hydrogen production would require a relatively small land mass . A circular area with adiameter of 240 miles, located in New Mexico or Arizona, would theoretically be sufficient tohold enough PV cells to manufacture hydrogen equivalent in energy to the entere fossil-fuel-derived energy of oil, natural gas, and coal consumed in the United States during 1986 .
Some leading manufacturers of silicon solar cells, predicted that photovoltaics will be used inthe electrolysis ofwater to produce hydrogen for fuel cells and combustion engines, opening upto photovoltaics, notjust the market for electric power, but also the transport market.
Further research, testing, and development will determine which energy source will producehydrogen most economically while accounting and paying for polluting by-products . But thisdoesn't mean that only one source will wen and exclusively dominate future energy supplies . Ifall energy sources make improvements, this planet will have a more sustainable energy mix.
5. EGYPTAND HYDROGEN FUEL
Egypt is endowed with two principal resources from which hydrogen fuel can be produced.Egypt has natural gas, and is blessed with cloudless skies and intense solar radiation in southemEgypt.
5.1 Hydrogen ProduetionEgyptian experience with hydrogen production is wide . Reformers are currently in use infertilizer and petrochemical facilities to produce hydrogen . Electrolysis systems are also beingused in Egypt. Anumber of indicative examples are presented below.
Abu Qir Fertilizer Factory. The Abu Qir fertilizer in Alexandria uses 1000 tons ofmethane from natural gas to produce 1750 tons of urea per day. Pipeline of natural gas isupgraded to 95% methane using molecular sieves . Methane with no sulfur is used as Feed stock.Steam reforming of methane at 900°C in the presenee of a nickel oxide catalyst, convertsmethane into hydrogen, CO, C02. A low temperature converter with copper and zinc oxide ascatalysts converts methane into hydrogen, CO, C02, . A low temperature with copper and zinc
26

oxide as catalysts converts CO to C02. Potassium hydorxide solution separates the C02 fromhydrogen . Hydrogen is used to produce ammonia, and the ammonia and carbon dioxidecombine to form urea .
Oil Refineries. The refineries are in Suez, Ameriya, Alexandria, Assuit and Cairo. Allfossil fuel based refineries produce hydrogen as a byproduct. The naphtha refinery uses acatalyst to raise the octane number of gasoline from 40 to 90 ; and in the process, hydrogen isproduced as a byproduct. The refineries that produce the higher distillates (premier gasoline,regular gasoline and diesel oil) from fuel oil use the hydrogen byproduct to remove sulfur fromfuel oil .
Kima Ferflizer Factory (hydroelectric electrolysis). This facility has been in successfuloperation for over 25 years producing hydrogen through hydropower electrolysis ofwater. Nownatural gas mains are being laid from the gas fields, in the north of the Nile Delta, up to Assiut,and Kima is planning to use natural gas as the feed stock for hydrogen production . Kima factoryproduces, presently, 3000 tons of hydrogen per day using uni-polar skid mounted electrolyzersmanufactured by Brown Boveri Company. These are old electrolyzers but very reliable . Thenewer versions available from several other sources are more efficient . A 25% PotassiumHydroxide solution at 80°C is the electrolyte used for the electrolysis process. The electrolyte issupplied with de-mineralized artesian well water to replenish the system . No compressors areused because the hydrogen produced is directly consumed in the production of ammoniafertilizer. There is no storage of hydrogen either . Approximately 100,000 Tons of oxygen isvented into the atmosphere each day. The Kima factory has a capacity to produce 80 million m3ofhydrogen per day.
Kima is also, however, studying the feasibility of producing hydrogen by solarelectrolysis, with Japanese technical assistance, the study also includes the possibility ofexporting heavy water to Japan.
5.2
Fuel Cell Technology in the Egyptian Context
A large number of Egyptian institutions have undertaken research an fuel cell technology. CairoUniversity and National Research Center are the most active ofthese institutions having workedan testing catalysts for increasing the production of hydrogen ions, developing more efficientProton Exchange Membranes and a Direct Methanol Fuel Cell (DMFC) operating at lowtemperature and using liquid fuel to produce hydrogen . Other research institutions have alsoundertaken work in this field.
The following is representative ofthe applied work undertaken at the National Research Center :
"
Preparation of practical electrodes for the fuel cell which reduces the current noble metalcontent for cost reduction;
"
Optimization of electrode morphology to improve mass transport in the diffusion layer toenhance catalytic reactions ;
"
Investigation of electrode porosity and permeability to methanol ."
Transition metal Pthalocyanides and Prophetic for use as oxygen reduction catalysts in theDMFC ;
" Development of new inorganic membranes for DMFC based an zeolites and TinMordenites . The investigation of the solid electrolyte conductivity and methanolpermeability in a single cell configuration.
27

Egypt is, therefore, very well positioned to be able to absorb fuel cell technology, andconsequently to use hydrogen fuel an a large seale as the most favorable fuel for fuel celloperation.
6. EGYPT FUEL CELL BUS DEMONSTRATION PROJECT
Egypt fuel cell demonstration project is co-funded by the Global Environment facility, GEF,Government ofEgypt, GOE and bus manufacturer . The GEF objective of fundeng this project isto support the commercialisation of fuel cell technology and reducing the cost of technologiesthat reduces the emissions of Greenhouse gases, GHG. The main goal of this project from theEgyptian prospective is technology transfer of an advanced efficient technology that usesavailable energy resources in Egypt and demonstration of utilizing hydrogen as clean alternativefuel in transport sector .
6.1 Project objectives :
The specific objectives of the project are ;
"
Verify the efficiency, operability, reliability, and maintenance requirements of fuel cellbuses.
" Build up the local experience and capability in both personnel and parts supply foroperating and maintaining fuel cell buses and hydrogen facilities .
"
Demonstrate to the public and gain acceptance from them the operability, safety, highperformance, and low emission of fuel cell buses and hydrogen production and fuelingfacilities .
"
Provide opportunities for the local bus manufactures to integrate and assemble fuel cellbuses with imported engines and chassis.
"
Induce the universities and research institutes in Egypt to get more involved in fuel celltechnology.
"
Establish policy changes and codes/standards to promote the use of fuel cell technology."
Increase the volume demand of fuel cell buses, jointly with other GEF fuel cell busdemonstration projects, to accelerate the commercialisation.
"
Accumulate experience as input to fuel cell bus developers to further improve their productsand accelerate commercialisation .
Most ofthe objectives above are geared for the fuel cell bus technology to take root in Egypt sothat a füll commercial implementation of the technology can be materialized later to contributeto the global efforts for GHGreduction . These objectives are also set to lead Egypt to become aregional or worldwide fuel cell bus supplier. This will be accomplished by building upon themanufacturing expertise gained during the demonstration project and the low labor cost inEgypt. The new business created can contribute significantly to the nation's economy.
6.2 Project feasibility study
A detailed feasibility study was conducted with a major objective to select the best fuel cell bussystem for public transportation in Cairo. This feasibility study was conducted an two differentparts. The ferst part concentrate an a füll-scale commercial deployment of fuel cell buses in
28

Cairo, i.e . the total bus fleet of Cairo Transport Authority, CTA, about 3600 buses willuse hydrogen and fuel cell technology within the coming 15-20 years.Where, the second part of the feasibility study concentrated an the demonstration scaleof 8 buses to start real operation mid2002 .
The feasibility study designed to address the following issues for both thecommercialisation and demonstration parts;
"
Should the hydrogen required be produced in a large centralised plant or by asmall plants located at each garage?
"
What is the best way to produce hydrogen, by electrolysis, natural gasreforming, natural gas partial oxidation, or purchase from the a petrochemicalor fertilizer plant?
"
What is the best way to transport hydrogen from the central plant to busgarages, by liquid tank or bypipeline?
"
Does it make sense to use more costly electricity from renewable energyresources for the electrolyzer as to maximize C02 reduction?
"
Canthe additional cost to sequester C02generated from hydrogen plant bejustified by the increased amount of CO2reduction?
"
Should the hydrogen required for the fuel cell buses be produced on-board oroffboard?
In addition to addressing the previous technical issues, a cost estimates were conduced based anthe expected projected costs ofthe system component when they are fully conumercialised.
The final selection ofthe optimum system was judged notjust by the incremental cost ofC02reduction but many other factors, such as the total capital required, amount of C02 reductionand cost per kilometre of bus driving were also considered .
Nine scenarios were assessed and compared to the baseline scenario, current diesel bus, withinthe feasibility study . These scenarios were ;
The V scenario is the baseline current diesel bus
The 2"d to 4`h scenarios the hydrogen is produced in centralized plant located at Dahshour basedan natural gas refonning, In second scenario hydrogen is converted cryogenically into liquidwhich is delivered in tank trucks to the bus garages of CTA. In third scenario hydrogen issupplied the CTAgarages by pipeline . Fourth scenario the Same as the third scenario with C02sequestration into spent gas well in Beni Suef area .
The 5d' to the 8`h scenarios are designed to test the on-site hydrogen production to eliminate thecost ofhydrogen transport. 5`h and 6d' scenarios using uses natural gas as feedstock ofcompactrefonner and partial oxidation technology. The 7~h and 8'h scenarios are designed to test the on-site hydrogen production using the compact alkali electrolyzer and proton exchange membrane,PEM. The 7`h and 8`h seenarios using wind power as source of electricity for the electrolyzersto test a zero GHGemission scenarios
The 9`h is to assess the option ofpurchasing the hydrogen from the K1MA plant in Aswan. Thehydrogen will be liquefied and shipped by barges through the Nile to Cairo and then distributedto the CTA garages by trucks .
29

The final results ofthe feasibility stady for a full-scale commercial deployment of fuel cellbuses in Cairo a centralized natural gas reforming plant with the product hydrogendehvered to the bus garages by a gas pipeline andCO2recovered and sequestered in aspent gas well was selected base an the abovementioned criteria .
Whereas, for the demonstration project, it is not practical to construct a centralizednatural gas reforming plant due to the small needed hydrogen quantity for operatingonly 8 buses. Thus,apackaged electrolyzer unit, including high pressure hydrogen gasstorage cylinders, hydrogen compressors, and dispensers, will be purchased andinstalled at the host garage to meet the hydrogen requirement.
6.3 . Demonstration Projeet Aetivities
The demonstration project will not be limited to the demonstration of the fuel cell technologyand hydrogen production handling in public transport sector with all the detailed aetivitiesmentioned hereafter but also will implement few of sustainability measures, task 5, that willsupport the future commercialisation of hydrogen and fuel cell technology in Egypt. Thedemonstration project will be carried out with five major tasks. These activities include thefollowing:
Task 1 : Fuel Cell Bus Purchase
Tasks 1 .1 : Finalize Bus SpecificationTasks 1 .2 : Issue Tender and Award Contract for the Fuel-Cell BusesTasks 1.3 : Fabrication and Delivery of the First 3 BusesTasks 1.4 : Fabrication and Delivery of the Next 5 Buses
Task 2: Hydrogen Facility Purchase and Installation
Tasks 2.1 : Engineering and Site DesignTasks 2.2 : PermittingTasks 2.3 : Major Equipment/Facility PurchaseTasks 2.4 : Utility Hookup and Site ConstructionTasks 2.5 : Mechanical Shakedown and Facility Startup
Task 3: Bus/H2 Facility Operation and Maintenance
Tasks 3 .1 : Operation and Maintenance ofthe First 3 BusesTasks 3 .2 : Operation and Maintenance ofthe Next 5 BusesTasks 3 .3 : Operation and Maintenance ofHydrogen Facility
Task 4 : Test Data Analysis and ProiectManagement
Tasks 4.1 : Prepare Test PlanTasks 4.2 : Data Acquisition and AnalysisTasks 4.3 : Project Management and Reporting
Task 5: Sustainability Program
30
Tasks 5.1 : Develop Master Plan/Intervention MeasuresTasks 5.2 : Build Up Codes/Standards and Local CapabilityTasks 5.3 : Disseminate Information
6. 5. Project Sustainability
To sustain the fuel cell technology in Egypt after the GEF support, the ferst activity is for GCBCto expand the demonstration project . As an example, 20 more fuel cell buses could be purchasedat the end of the demonstration project to increase the fleet size from 8 to 28 buses. As thehydrogen facility is already oversized, purchasing another electrolyzer module to double thehydrogen production capacity should be sufficient to meet the need ofthe expanded fleet .
The cost of the 8 fuel cell buses to be purchased for the GEF project is 10 times ofthat of dieselbuses. By the time the additional 20 buses are purchased (2006), the fuel cell bus cost isexpected to drop to be 2-3 times ofthe diesel bus cost. As the cost difference is still too large forthe project to proceed an commercial basis, the Egyptian Govemment will seek finance fromvarious sources to fund the incremental cost. The incremental cost is estimated to be US$ 15million, including the additional hydrogen production facility, utility consumption, and laborand management cost.
This expanded project will operate for 2-3 years. By 2008 or 2009 when it is completed, the fuelcell bus cost is expected to be only 10-30% more than the diesel bus cost. At that time, the taxcredit or soft loan provided by the govemment should give enough incentive for the local busmanufactures to launch conunercial production and allows GCBC and CTA to convert dieselbuses or CNGbuses an a garage-by-garage basis (on the average 150 buses per garage) withoutgovemment's financial aid. The incentive for the bus manufactures could also be provided bythe increase of diesel fuel cost, tighter air emission standard, or tax an air emission or carbonemission .
Meanwhile, the Ministry of Petroleum or private entrepreneurs would be willing to commit tobuilding the centralized hydrogen production plant and distribution system when the fuel celltechnology becomes fully proven in the expanded demonstration project and thecommercialization prospect becomes certain . To minimize the capital requirement, thecentralized hydrogen plant will be built by modular construction in stages to be in progressionwith the bus garage conversion. This is also true to some degree for the hydrogen distribution bypipelines. Only the trunk line will be built frst . The brauch lines to the individual garages willbe added as more and more garages are converted.
The construction of the hydrogen distribution system and also the pipeline for C02sequestration falls into the category of infrastructure buildup. The govemment needs to eitherdirectly finance the project or provide guarantee an the return for investors to take an theproject .
6. 6. Project Research Program
Within the project appraisal committee, PAC, meeting organized an Feb. 2002, where theproject were presented and approved by the committee due to its outstanding contributions toboth energy and transport sectors in Egypt. The research program of the project attracts theattention of most of the committee members and a lot of recommendation and modificationwere provided to the program.
31
The original research program concentrated an the Proton Exchange Membrane, PEM, fuel celltype that will be used for Cairo fuel cell bus demonstration project . The current researchprogram covers the following issues for PEM fuel cell and the fuel cell buses: (a) improvementsof fuel cell stack components ; (b) new or improved power train system design to make thesystem simpler, more effcient, lower cost, dynaniically more responsive, or operable over awider range; (c) improvements ofpower train components and, (d) new or improved hydrogenproduction processes which are more efficient, require lower cost, or have power COZ emissions.
The PAC meeting recommended that the research program should covers all the types of fuelcells using other fuels rather than the hydrogen used for different technical applications . Basedan that recommendation the research program will be open for both stationary as well as mobileapplication for the most common fuel cell types like, Alkaline Fuel Cell, AFC, Phosphoric AcidFuel Cell, PAFC, Molten Carbonate Fuel Cell, MCFC, and Solid Oxide Fuel Cell, SOFC, aswell as the PEM. Aiming at improving the overall performance, reducing costs and prolongs thelifetime of the fuel cells, the following topics could be areas for the new research program, inaddition to the original program, for all the mentioned fuel cell types ; the electrolyte, thecatalyst and the bipolar plate.
REFERENCES
Abdel Gelil, Ibrahim, Bedrous, Maher Aziz and Others : "Environmentally SoundEnergy Policies and Technologies for Egypt Sustainable Development", 17`h Congressofthe World Energy Council (WEC), Houston, Texas, USA, September 13-18, 1998 .
Organization for Energy Planning (OEP): "Energy in Egypt ", Annual Statistical Report,2000/1999.
Egyptian Electricity Holding Company (EEHC) : Annual Report ofElectrical Statistics,2000/1999.
Egyptian Environmental Affairs Agency : "GEF Proect Brief Fuel Cell BusDemonstration Project in Cairo ", March 2000 .
Dr . Emad El-Sharkawi, Dr . Ibrahim Abdel-Gelil, Eng. Maher Aziz . Bedrous, Eng.Ahmed Abd Rabbou ; "Hydrogen: A Pathway to Clean, Limitless Energyfor the 21-stCentury, Egypt's Country Paper", Federation of Arab Scientific Research Councils,Expert Group Meeting, Amman, Jordan, 22-24 Aug. 1999 .
Bajura, R. ; Beecy , D. ; Carabetta, R. and others : "Vision 21-Pathway to Clean,Affordable Energy for the 21-st Century"; Paper No. 4.1 .05, 17 fi' WEC Congress,Houston, USA, 12-18 Sept. 1998 .
Philip C. Cruver: "Hydrogen: Tomorrow's Limitless Power Source"; The Future, Nov.-Dec. 1989.
32
Hisa, Shoichi; Fukuda, Masafumi and others : "A Vision for Thermal Power-PlantTechnology Development" ; Paper No . 4.1 .03, 17t' WEC Congress, Houston, USA, 12-18 Sept. 1998 .
Project of the Arab Republic of Egypt, United Nations Development Programme andGlobal Environment Facility; Project Document EGY/98/G42/A/1G/31 : "Egypt-Integrated System for Zero or Reduced Emission Fuel Cell Bus Operation in Cairo",GIA: EEAA, Sept . 1998 .
M. A. Mosalam Shaltout : "Solar Hydrogen from Lake Nasser for 21 5` Century inEgypt" ; Hydrogen Energy, Vol. 32 No . 4 pp. 233-238, 1998, International Associationfor Hydrogen Energy, Elsevier Science Ltd.
"International Clean Energy Network Using Hydrogen Conversion-1996 AnnualSummary Report an Results"; NEDO-WE-NET-96, March, 1997 .
Shaygan, N. ; Modirzareh, M. R. : "The Development of Mixer and Automatic IgnitionSystem for Hydrogen Fueled Engine"; Paper No . 3 .3 .03, 17 a, WEC Congress, Houston,USA, 12-18 Sept . 1998 .
Sallemia, N; Amiri, A; Shiva, M. : "Optimum Design of Gaseous Hydrogen PressureVessel Considering the Technical and Economical Aspects"; Paper No . 3.2 .11, 17"'WECCongress, Houston, USA, 12-18 Sept. 1998 .
Edeskuty, F. J. ; Haugh, J. J. and Thampson, R. T. : "Safety Aspects of Large ScaleCombustion of Hydrogen"; Hydrogen Energy Progress VI, Pergamon Press, Elmsford,NY., 1989 .

34
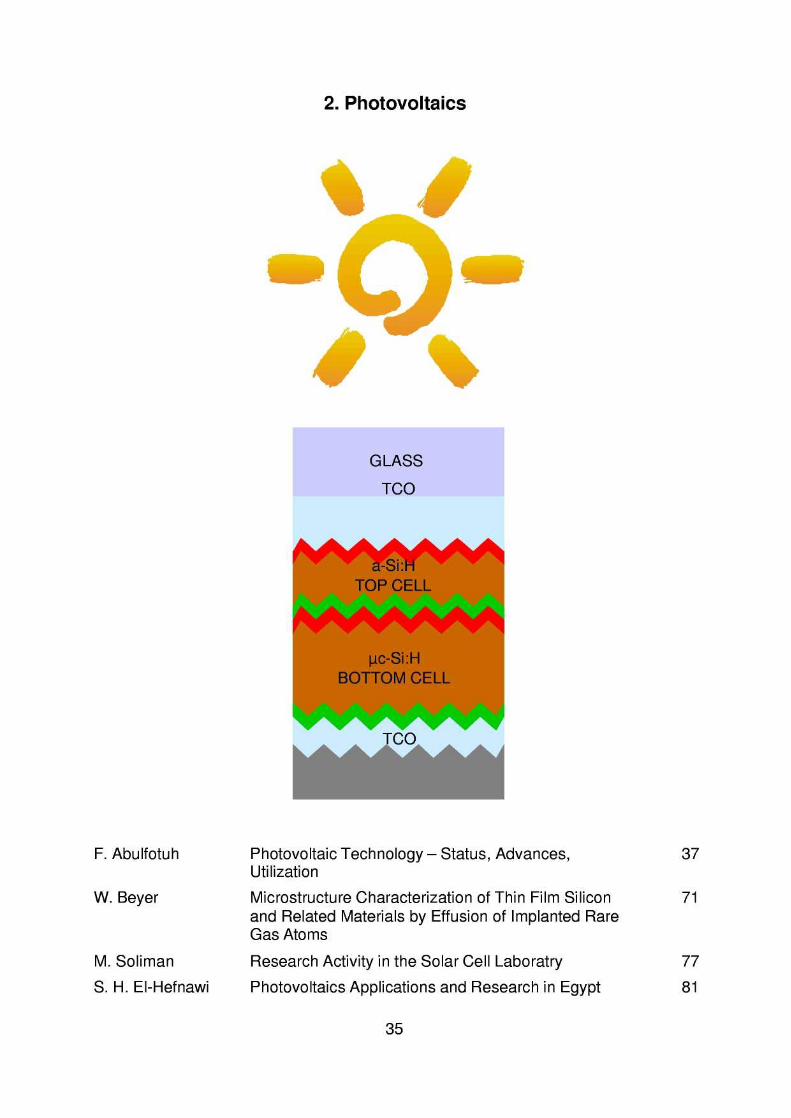
2. Photovoltaics
GLASS
TCO
OWV a-Si : H
NATOP CELL
PC-Si :HBOTTOM CELL
mwa
35
F. Abulfotuh Photovoltaic Technology - Status, Advances, 37Utilization
W. Beyer Microstructure Characterization of Thin Film Silicon 71and Related Materials by Effusion of Implanted RareGas Atoms
M . Soliman Research Activity in the Solar Cell Laboratry 77
S. H . EI-Hefnawi Photovoltaics Applications and Research in Egypt 81

37

38
W
aa.
Z0
(D r-ooZW a Z oc
Z a vWJ vH- V z
ö ww Z0 H _v F- O
WZ W o tu W i-
U ta W ÜW o Z(, a JF- Z ~o ..~ o a a ä

0Y
L
W
_ L.
d~
cn o a~ .~ ~°üv zs > ca ~ o ö
~3 W
J ä
0 -0
39
ö ä
övo -a 1.E r c
m s
0 31- ~
13 V YQ .
3:
.Q
NQN
OLLO
4H
40
L
U
.~
s äUH~ .cuo 12._.w 0 430
L ++
L3: -bod
41
42
43
tCCJ
Q.
ccXW
44
4~ N L. ÜLRS
~ (Z~ Ü tß OC CO y O L-7 m(1) y N .... O
C U) 0) Nd y O O 0 O-40
.- aD 0a)UN Cß
rm t0
O m LQ Oyh- 1
L O rca O ~- NL ÜOV (0 (Dy cßQ
ctf O
ü?ßL-
LCB yU
O ~ (D y OV Ü
Ö ty? c:V ~ n- O
tü CO 0;~ Q Q
OL r :3 Q Q c O N>% u) -CL 1- Z QN tn ~ m Q! O (ß `
O OVd O

+~O
tA
.LW 4~
~ Q)
4. ~i". Y~ ~ L
J N ß. J J J J
0 01-3-
mL Orn- o O.%U s- tit
L-LO N O m + ia vu) 0.
E 'v) N Om~ 0 L v szQ v m M 0 ~N ü 0 'ä Ö .t~
U)
. ._ m y= .Q r- Z mt ö ,° 3vr o. ß . L m
O ~ ~ Z o o = v) 3e% 0 4-0
L O O Op > L L O L ß N
14w r- Z 0. s .C
N
O
N
O tß U) U) -E N N N C3 Q)`~' 'i N ty d
U)O +0 L L
C C?fJ Q. L RS C LO LA'
CL 0U) N äß cum 0 r-
(V `eL o O E O O O O 0 LL' Y L x 0 i .,
W0 um0 m 0 "L m :ß cu m
J Z
46
M CDd
vW
5L
I 1~ Ü v otu
OY .,r-
ä -0W
aQ
O cQa
U o iD,..
p n .'
OLL
L
' v) Nc ._
Ri
a)N
m o c va) -
`Q d n..a) U
a)
O 1 1-' ö:._. LLO
N 1 f 1 :t-eIN1v
~ö
v)>
`
Ür,to .-J
Ip a
E
O
U
47
sON M
O O O
(ßa0
0 ö(D - ~n cnn. cß >
cq N (ß
ö
LONöN
O
U)cl*)QO
CO
OmCD
O
N
saQ -.rCcß
a >
O
0
.LOtü>
5L Cö 11)
OCD
Oö
Oö
t-
ö
ö `~U _O
(0 0Uör
0ö a)U cA
> O Ö
m570 cuzö
a)z ä, ~°-
j13
O
O
ONO
ö ö r )C? U O
cß a) cn cntß
U
ä ~z
tu L-a :3m 4-0
3'» 3
L 3..ti=
z3i
0Q
0v
c
LCI
48
r
T
ca
r
0T
w0Nr
s
49
Q ~ Q
taL
NOCN
00
r
«a 4-0
750 2
V
a
L
e:
50
CAc»r Cti
Co NN
LoCoM
toCoCo
to
°~r
k r
Nc
d' LoeM
t0N
CO r,rN
tCfr
t~0t!'StV
dem'C~0
M
rd;
RntA
~
tiC.Ct
r
et'd'
N0O
~
rCO d'
rODr
rr
CAIn
C)
~Ln~M ~~ Ir. Itnr r r tt~
C3~r
N
~
N~
00
~
00
rtn
dem̀
L
:3u: -i0
NOON cc~
Ntne-
CNN
Nee-
ONcG
CDCN
CDM
CoCA
c4I`e- "
et'CA
Cq* 1
CCCN
N
MN
co(0CCO
toCoNr
1-CY)ett`
CotzCoN
CCACA'r
CN
Cqe
CCO
CDCCG
Me-CN
c-»C» i_1~1 1vae-
wr
c-~M
vr~t
c,tn
~c~r
ti
e-.d.CA
OM
eM
e-
Co
N
O 0.~
_ß
1-
0ß
Nc0cs
c
ü--*
Oü
=1
L
c0
öRdL
N
3c
0
cO
ß
d
COU
c.RmcR
F-Z
eG _= 4UO-
OV
tn
CR
00Leuo3O
a>'
in V v
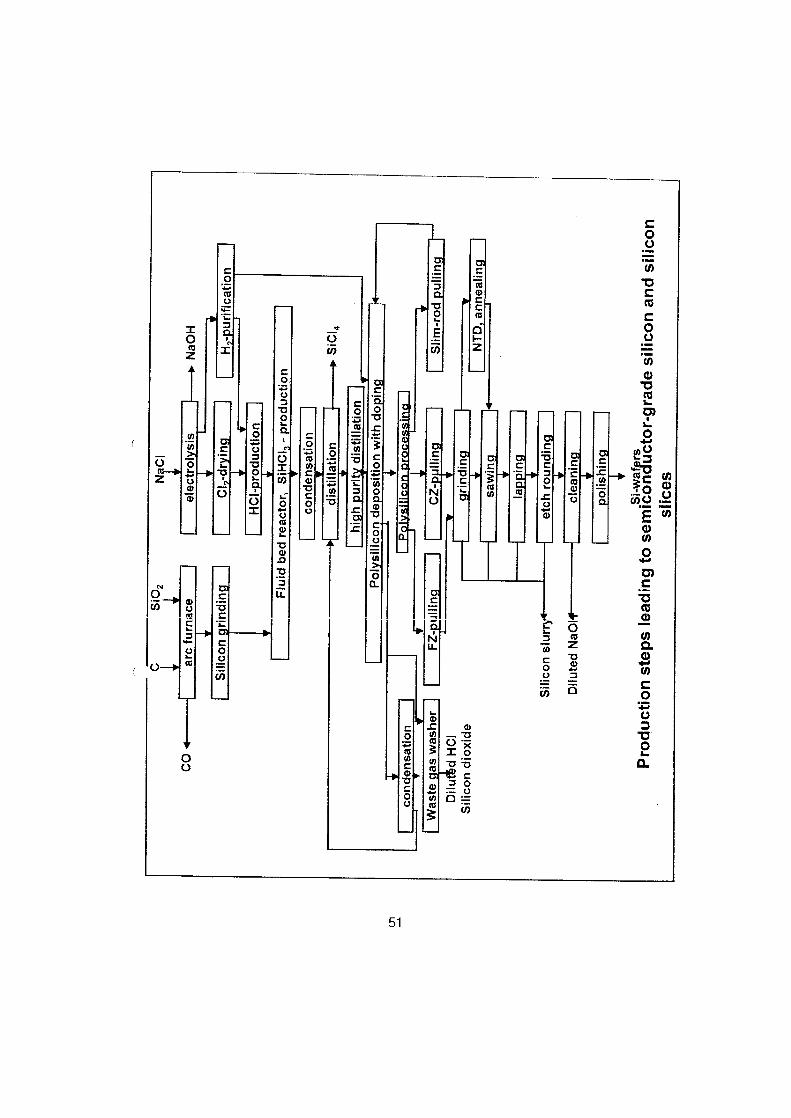
51
N
ü}
ßoL NZ Q
oU 3
OLd
R ü .x O3 = oR

CD.~ M
~ - ~'
--
~~~~
-
~~~-~~~~~~ ~~-~~~-~~-~~.~~~~~~
.c #~~ CL
52
O
CL
MM~~
M ~.
~
m~ 0.
~ -~
~ 0.~ +1 (0
.~ ~~~~ 22 i75 ~~U-
-T'------------~~| oqjaK~ ~J~K X, ~ 2 |~~ ~~
| || ||
NOO ZU
O OL :,r
L
06
tß
L
U
OcaL
m
.t~LU
O
m mUOU
53
V
a0
0aiwVo
L
W
c:Om
U1 Z
54
O N
Ocn Z
p M
Ocn Z
O
U)Z
ö äö L
0
a) rrÜs. . N= 4>"tu L
Ln NmL
4- zzM O
Ü ~(D Q2 U)
cOß~
r_00 r_O~
Ö Ö(n Z (1? Z (n Z
(5 äZ Z0 0
55
NNc;Z Zc c0 0cß
cyN
56
JeaÄ1(Ilead) fennuBGW
7510O
N
caOH
s
0c0
.LCL
0U
dMWangeinwno
57
OL
O
L
OU
58
00 cO d' N O OO tC d' N O CO tfl ~ N 0 90 t0 '~ N OMMMMMNNNNNrrrrrsluawdiMS anileinwno POuad
41m0.JE) °,ffl
N00N
OoON
OOr
OGiTOr
t3?C}r
NOr
OOr
r
0000
.920
59
OO
Ooo
OO
OO
OO
OO O
OOO
Oe
OW) O00tQ V
Q.^ O
d'M Cfl
cfl
MNO00ON
00O 00 tn N rr
N N d'O U .ra>a
O cnZ. r
O_CDCON to h
MmN
CDOd'
C:)OCo
CDCO N to dO' r
OQ .~
OO Or v)
M ON
Ul)d'OÖ
ON
~AN
O00OO O
Q ._O E
M r tt) r r ti r N r r
a
O.
o os ~, ~ a w
O OLC
LC
sÜ Ü
O O c~ M '0Co Z O
O
LdLä ä
"Rim
'C
_0 "x2
"ä n 1 to
.L
O
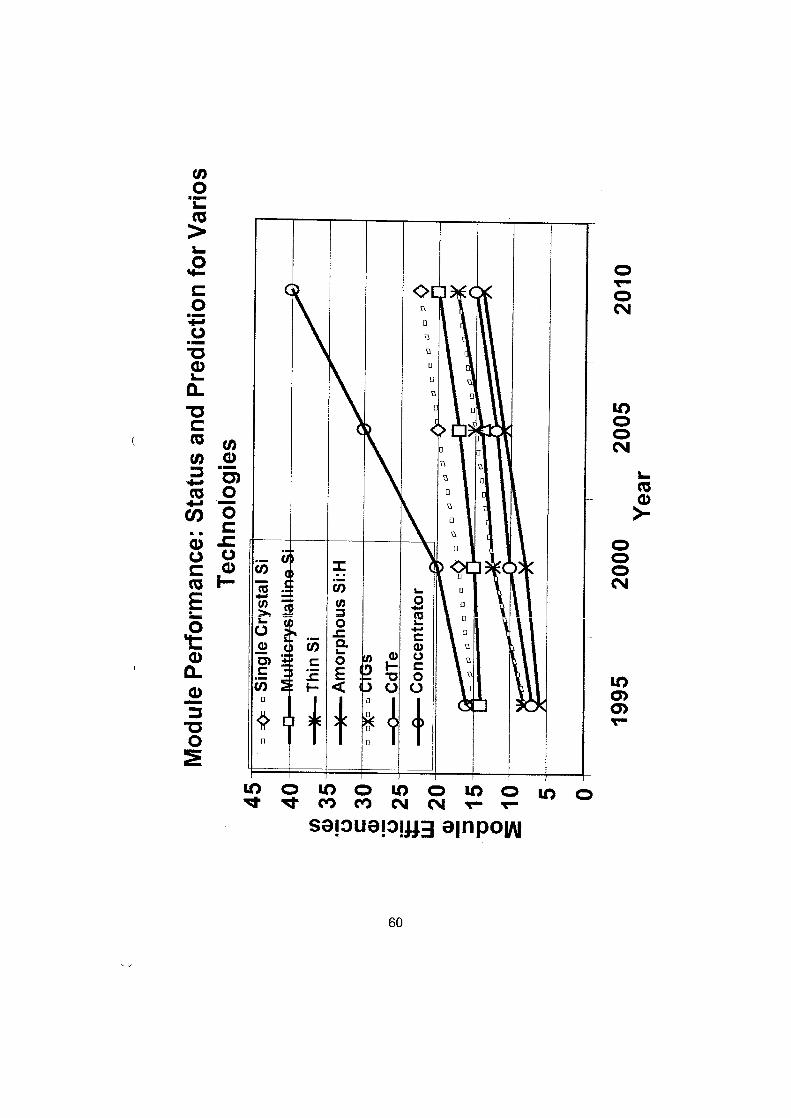
sai:Duaiai113 alnpow
60
0N
0
N
0
N
°°°°°° n1
1°
0 0no°
cn ~I = pa ~~ ~ ~ y
L 0°
L 0 u
U~ t++c °
4 Ü Ü
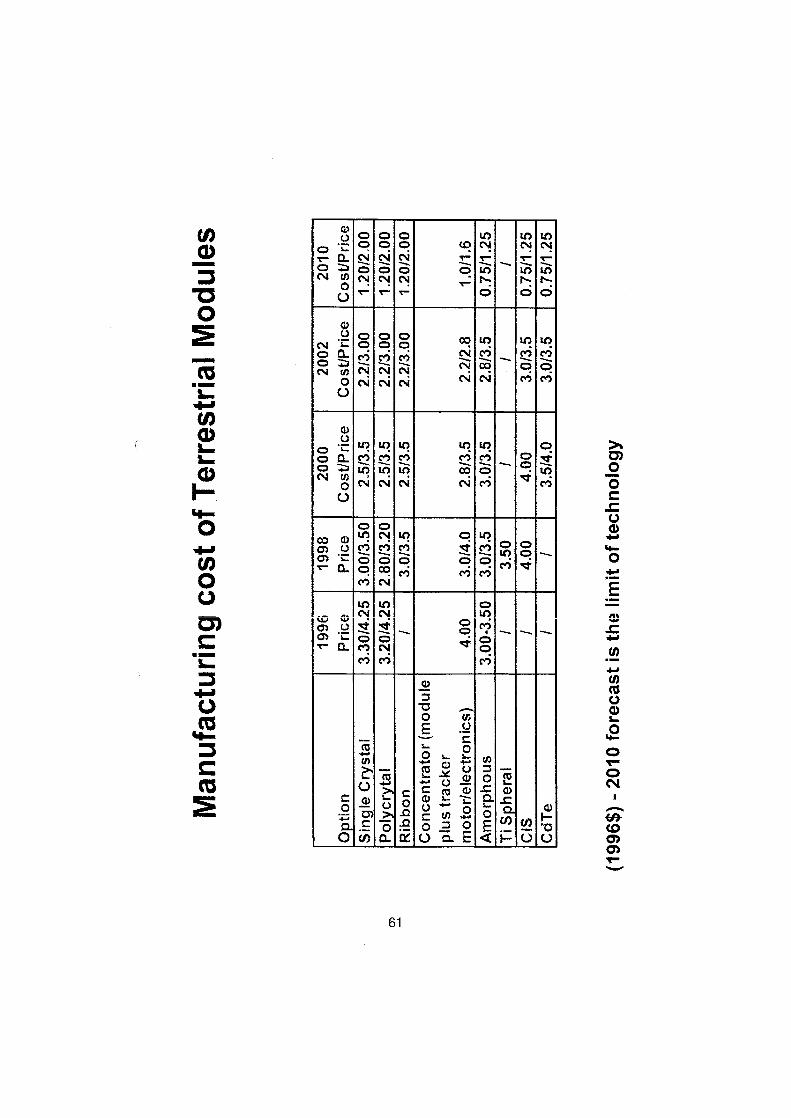
013
61
OO
tVd
O
NßVL22
tON
t
coo~
Ü O O O La t0 tn" ys G O C tp ['I N N
r a NNaoO
N tVoLn LOtn
O C,4 C,4 r ti r1.:U r r f O Q C?
Nc>CD
CDcz
CDCD Co LO In
O d,N tat) N N N
NNCc ' O
MCD
O t+,j lV N MU
'L u7 tn tn toML
Ga
Ö tr~MuO" ö
c~"?ay
N Ö N N N CV M MU
oa aT
CD'x~
(DN 41 O tl~
OC)"iM
Ö
M
O
MO
t(DMÖ
LO Oc' CL cD
Mc0t"VM M C "j M ~t
.. .inN N
Otf?w ys O
M N OM M M
O t!U
*+Ui 0 OL ,F sn
UC) O
O tU U O-0
Ü ~~. . O ~.O Q. Q)~ Z .~..
CioäeoELEQF=üp (1}

U r_
p Ü O O tti
tß> >+
O tA U _(ß > L UV
O q) Coa) :3 Cj N N
16-+
C c
N c
C C N QO
Ü N "~ tQ Ü U .s=
70 -- i
C)
-0 cü Ü N (ß _r_ OQ) Cl
U)
CO
0
(Z
u) -0 4-
:3 O Q- Ö :3
a) j ÜQ Ur_ L- -0 16t r-
:a)
_O*r
U3 C(I) 2 .9 trmß Q 2E m0 40--
62
>~ V_RS
(ß
a)~
O U 'ß CLi tß
°-~U
U
°
N
>'
öcnN
tß
a)
i%i V N> .~LQ.~O
~_ P -(D
N
tn_O -+-.
Ö
(ll(/?
NÜ
cß M
N N
.~
O tß cß
V Nc3) "c: CL
63
W
ö ö Ö Ö 0 0 Ö Ö Ö ÖMO Q ir) to 00 V_ r V' O CO Mcj W tn tn d' r ~- r ON N
0 0 o Q Q o Q o o QN O Q O Q Q O O O O QO c~ tn tn CO e r e 0 c0 MO 00 to tnN N
0 0 o O Q o 0 0 o OT Q 0 0 o Q O o Q o 0N u~ O 00 zr - tT O C.0 O
O I~ tn tn t1' c- r r 00N N
Q O O O O Q O O O OO Q - Ö ~ 0O 000 Lf) ~ M N' V 00O cö tci M - "- tnN N
C» Ö Ö LO 4 Ö 0 Ö Ö 0 tonN M CO M e r- d' O 0 0)Q d' M M N
e- N
O O O O O O O O O OC) CD (Z
-CD
LO C0 C)O >- O n e e 0 O
¢1 to N M M rT
2~"CD 0 C) CD CD C:) 00O o0 tn O N Q N CflCA N M tnT
o to o c) o 0 0 o to_ 90C3~
o .~~ i rr
_v ` ö ~ i~ ö ü~ tn
M N N NT
0 o Q Q (D tn Q o tr)an Qm ~ o~r °ti coo ö QvCA N ~ N ~ ~ rT
Ö Q Ö Ö Ö Ö CDc> (DN N O i~ 00 LO O V O
T N r N r O
+~+ CL Hd Y = Z U)CL ö Y ~+ Ü ÜQ. E V V U
0 rp ß W W +~ OtA = Q F- 3 3 3 > O F-
O CAr OONrCDN O OOON rD) OOi 00ta0OO rO N nON
O ON N
CoN CO 01J O OON 00O MÜ MO OOO Oi N MO OU MO NON NMO
v(V
LW Cu
00
O
64
LC!)
U
<ll
vQ
NvÜ
U
70
°cnoo °~,(0C>CM
ce) (Y) Nr r
® OM
o0NONNN
CDCDCD
r-('%J
LO(N
UDCDCO0
00t»O~
CONNNN©O
CDp
Nm~rooo©
N
O O
ö0 ti a cD
1l, U ' U_d
.UN ~ ~ tß
0
öäQE o
65
O d'~- rr 0007 ON r .̀ rN O r
Ö eCN- ~ N0 0O
N r N
0C 0 Ln Ö MN 00 n' N M
00 0 CD OO
OOr M Lii
a
öL O
o ~ v
r 72LU ~ ~
ßL 0

~o tßi
tA
_
4-.
>
O4-0
CR.. (maß
CL +N O-,-~ CL }, ~~
r ß
0 NV~
O U (II
r-- O(U
c:
p tU CY)
-O
+-'V +J p cu
Q
0-
0ca=
i
0 ~.J.- imm
- U .4-.
cu
C
O CU .~
..>%
O
-_vs~.4..,
.
a~ .
Q
U
06
O tUO
L ~
a~ a~ L ag
~ ~ U_
CL
O
tß pU ~
U
Oca ~~` ~ .
Ocvcn :0 ö
X O
U
Ö s
N NO - c~ tü
+.1 .-.. tL.
4-1
66
U+i
.
tn ~ U -OO c_
U tU O ~ Ü
O U ~
p U .-
~ N
4- -IZ
V V}
>~
~
.~.NO n
..~
cn 1-
0
L
. ;..rO
0 Q N
CL
cisV 0 U
~ ö
~ ö v0 (13 ö c70
0 C ~+CL CL
r-_
.Q?
Q10
0 s2, Y .QO
N U ~- X
0
0U ~-C-- _j O O
Q) -> E -0
~ (ß
Q i_ Q1 cn -0 c (D
Ocn
.i 0, 1 O (lö (D
r_0tß d3
E 0
t~ U L Q
67
Eti s-N N O O 1-11
v c:
Ü
CON r_ _E
Q~ tß ~ t~ßQ tU (!~
Ncß N
Uj _c:N (~ ~
c:v 0 0
_NU
~ö
H
U) 0U'}

68
ca cv v cts ß M oö ..~..~ a) OB- E
NmNrf11VN
L-
e)(lö
' s= %m.
+-0t/)M
tti ~
zr- -0
c:tß
> CISN Ct)
O (~
Ü cn~ 4.- OO .,._.
O
O N
~.~ Üc: +
L-.
-2 _(D cß U
t3i tu p p ~ Ns Utß (n `'._
N j {U
0= N
.v3 .0U O
U U N _tß Ü ``- _Cß
C Ü ° ~ M 4 v -N-cn COp U)ein
1- tß ui '0- :~ ~~ UO Q) . N O ~ .N :2- N
Q>0 OU Q M ctS U "U RS Q. (1) O Q O Üc6
cÖ .~ U .~ O O O
°sU E
°.o v > U
.> cn >, -Cl. ~
C 3: C 7C3 C Ö c: >%
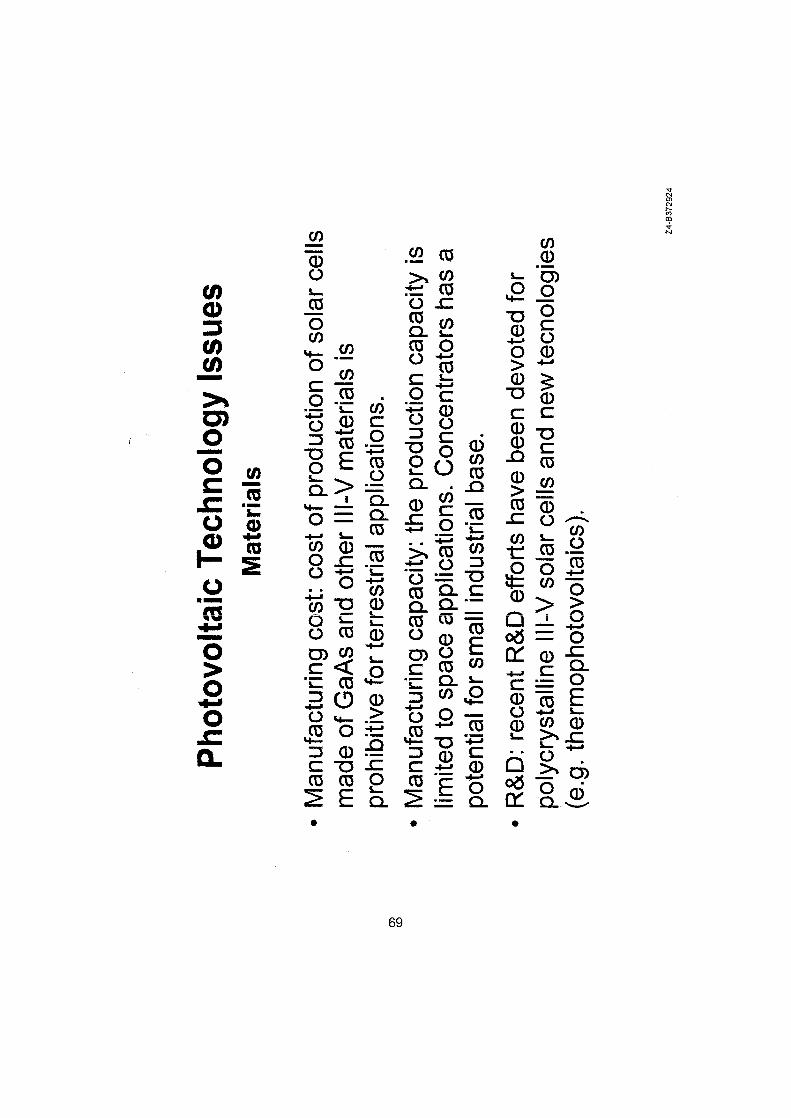
tß
U~
_OO
Q ~
~ Ü
Q4- cn
'-
Ü
4vi r- L-
ei�öcß
O c:
U) rcß °
O.~.+
:3 C.7 ~
`~p
OZ ö :t- M
(Z (1)
cß cß O cü(D CE O 06 0
.
69
4-J a)ö r ä
4 °~Uö OQUO a~~
CL >
U a~ Q -cß +~- 0 .s- UU)L
0 75r~:v « (D 0-_ Q _ -
Q c L cß cij : Ä~iU _(1) U N oö = O

70
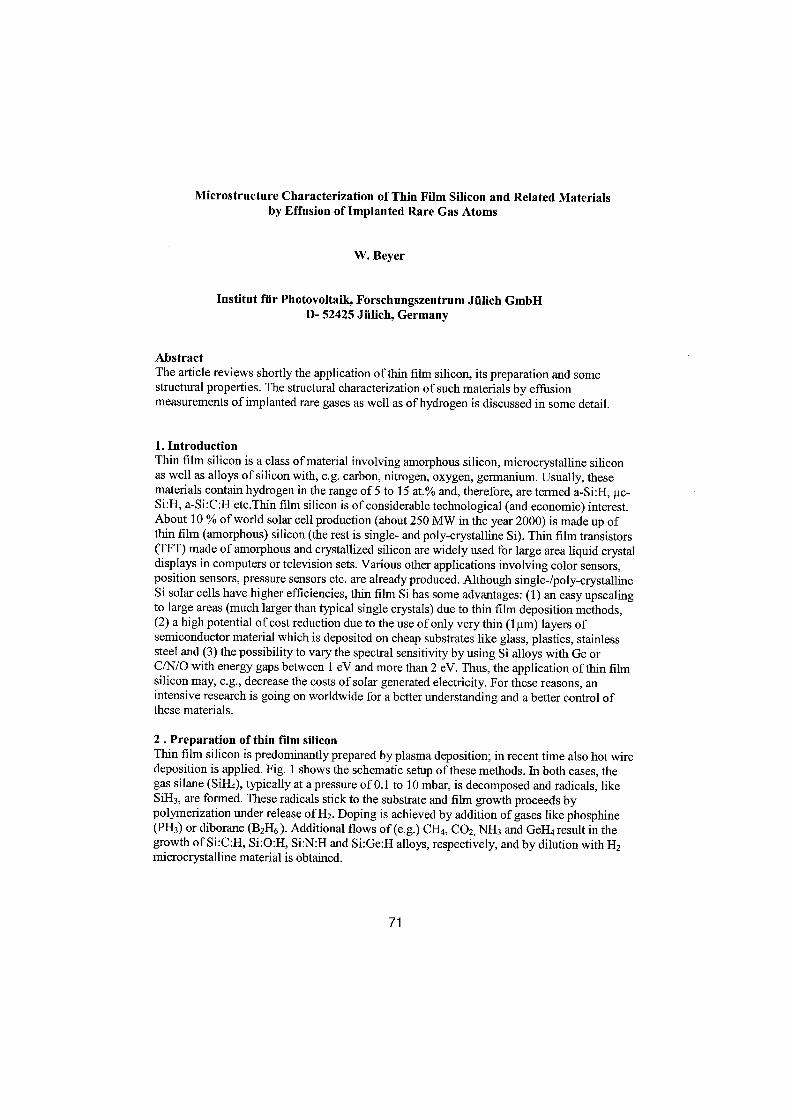
Microstructure Characterization of Thin Film Silicon and Related Materialsby Effusion of Implanted Rare Gas Atoms
W. Beyer
Institut für Photovoltaik, Forschungszentrum Jülich GmbHD- 52425 Jülich, Germany
AbstractThe article reviews shortly the application ofthin film silicon, its preparation and somestructural properties . The structural characterization ofsuch materials by effusionmeasurements ofimplanted rare gases as well as ofhydrogen is discussed in some detail.
1 . IntroductionThin film silicon is a class ofmaterial involving amorphous silicon, microcrystalline siliconas well as alloys ofsilicon with, e.g. carbon, nitrogen, oxygen, germanium. Usually, thesematerials contain hydrogen in the range of 5 to 15 at.% and, therefore, are tenned a-Si:H, gc-Si:H, a-Si:C:H etc.Thin film silicon is of considerable technological (and economic) interest.About 10 % ofworld solar cell production (about 250 MW in the year 2000) is made up ofthin film (amorphous) silicon (the rest is single- and poly-crystalline Si) . Thin film transistors(TFT) made of amorphous and crystallized silicon are widely used for large area liquid crystaldisplays in computers or television sets . Various other applications involving color sensors,position sensors, pressure sensors etc . are already produced . Although single-/poly-crystallineSi solar cells have higher efficiencies, thin film Si has some advantages : (1) an easy upscalingto large areas (much larger than typical single crystals) due to thin film deposition methods,(2) a high potential ofcost reduction due to the use of only very thin (1bum) layers ofsemiconductor material which is deposited an cheap substrates like glass, plastics, stainlesssteel and (3) the possibility to vary the spectral sensitivity by using Si alloys with Ge orC/N/O with energy gaps between 1 eV and more than 2 eV. Thus, the application ofthin filmsilicon may, e.g ., decrease the costs ofsolar generated electricity. For these reasons, anintensive research is going an worldwide for a better understanding and a better control ofthese materials.
2 . Preparation of thin film siliconThin film silicon is predominantly prepared by plasma deposition ; in recent time also hot wiredeposition is applied . Fig . 1 Shows the schematic setup of these methods . In both cases, thegas silane (SiH4), typically at a pressure of0.1 to 10 mbar, is decomposed and radicals, likeSiH3 , are fonned. These radicals stick to the Substrate and film growth proceeds bypolymerization under release ofHz . Doping is achieved by addition ofgases like phosphine(PH3 ) or diborane (B2H6) . Additional flows of (e.g.) CH4, COZ, NH3 and GeH4 result in thegrowth ofSi:C:H, Si :O:H, Si:N:H and Si:Ge:H alloys, respectively, and by dilution with HZmicrocrystalline material is obtained.
71

Plasma -Deposition
HotWire Deposition
Si H4-
PlasmaSubstrate
II
High Frequency
Fig. 1 . Setup (schematic) for plasma and hot wire deposition
3 . Material problems in thin film silicon technologyIn particular for low cost solar cell production, low Substrate temperatures (compatible withthe use e.g. ofplastic substrates) and high deposition rates (up to 10 Ä/s or more) are required.Moreover, the use of a-Si alloys is expected to lead to higher solar cell efficiencies as a largerfraction ofthe solar spectrum may be utilized . hl all these cases, material quality is presentlylimited by defects (mostly Si dangling bonds) related to microstructure. Films do not growhomogeneously but contain empty spaces (voids), as shown schematically in Fig. 2 .
isolated
in terconnectedVoids
Fig . 2 . Types of voids in thin film silicon
72
Si H4-
Substrate
r3"Hot Wire
Voids lead to electronic defects mostly because hydrogen desorbs from void surfaces (duringfilm deposition or thereafter) leaving behind dangling bonds or strained bonds .
4 . Microstructure detection in thin film siliconFor microstructure detection, various methods have been applied, like :-
high resolution TEM-
small angle X-ray scattering-
IRabsorption-
oxygen (waer) penetration-
hydrogen effusion-
effusion ofrare gases .
Aiming for methods to detect microstructure effects rapidly, we discuss in the following thelatter two methods.
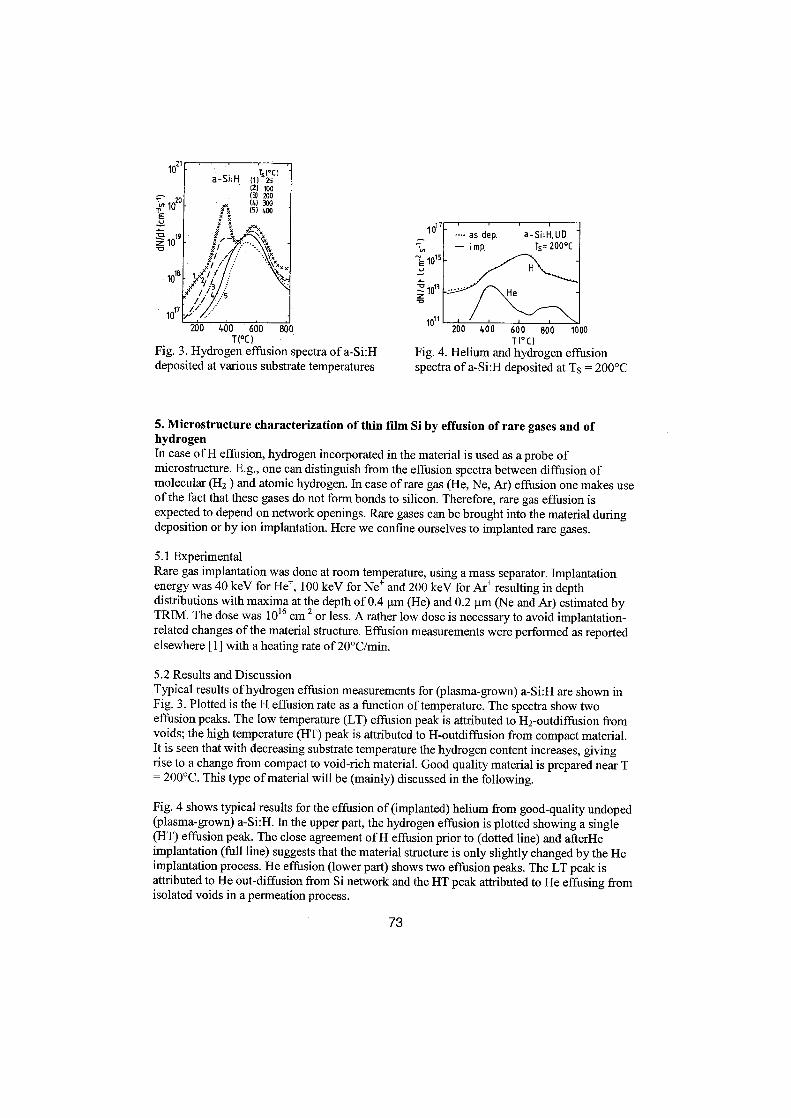
200 400 600 800T(°C)
Fig . 3 . Hydrogen effusion spectra ofa-Si:Hdeposited at various substrate temperatures
107
E 1015
1073v1077 ' ~
\I200 400 600 800 1000
T(°C)Fig . 4. Helium and hydrogen effusionspectra of a-Si:H deposited at Ts = 200°C
5 . Microstructure characterization of thin film Si by effusion of rare gases and ofhydrogenIn case of H effusion, hydrogen incorporated in the material is used as a probe ofmicrostructure. E.g., one can distinguish from the effusion spectra between diffusion ofmolecular (H2 ) and atomic hydrogen. In case ofrare gas (He, Ne, Ar) effusion one makes useofthe fact that these gases do not form bonds to silicon . Therefore, rare gas effusion isexpected to depend an network openings . Rare gases can be brought into the material duringdeposition or by ion implantation. Here we confine ourselves to implanted rare gases .
5 .1 ExperimentalRare gas implantation was done at room temperature, using a mass separator . Implantationenergy was 40 keV for He+ , 100 keV for Ne+ and 200 keV for Ar' resulting in depthdistributions with maxima at the depth of0.4 gm (He) and 0.2 gm (Ne and Ar) estimated byTRIM. The dose was 1016 CM-2 or less . A rather low dose is necessary to avoid implantation-related changes ofthe material structure . Effusion measurements were performed as reportedelsewhere [1] with a heating rate of20°C/min.
5.2 Results and DiscussionTypical results of hydrogen effusion measurements for (plasma-grown) a-Si:H are shown inFig. 3 . Plotted is the H effusion rate as a function oftemperature. The spectra Show twoeffusion peaks . The low temperature (LT) effusion peak is attributed to HZ-outdiffusion fromvoids ; the high temperature (HT) peak is attributed to H-outdiffusion from compact material.lt is seen that with decreasing substrate temperature the hydrogen content increases, givingrise to a change from compact to void-rich material . Good quality material is prepared near T= 200°C . This type of material will be (mainly) discussed in the following.
Fig . 4 shows typical results for the effusion of (implanted) helium from good-quality undoped(plasma-grown) a-Si:H . In the upper part, the hydrogen effusion is plotted showing a single(HT) effusion peak . The close agreement of H effusion prior to (dotted line) and afterHeimplantation (full line) suggests that the material structure is only slightly changed by the Heimplantation process . He effusion (lower part) shows two effusion peaks . The LT peak isattributed to He out-diffusion from Si network and the HT peak attributed to He effusing fromisolated voids in a permeation process .
73
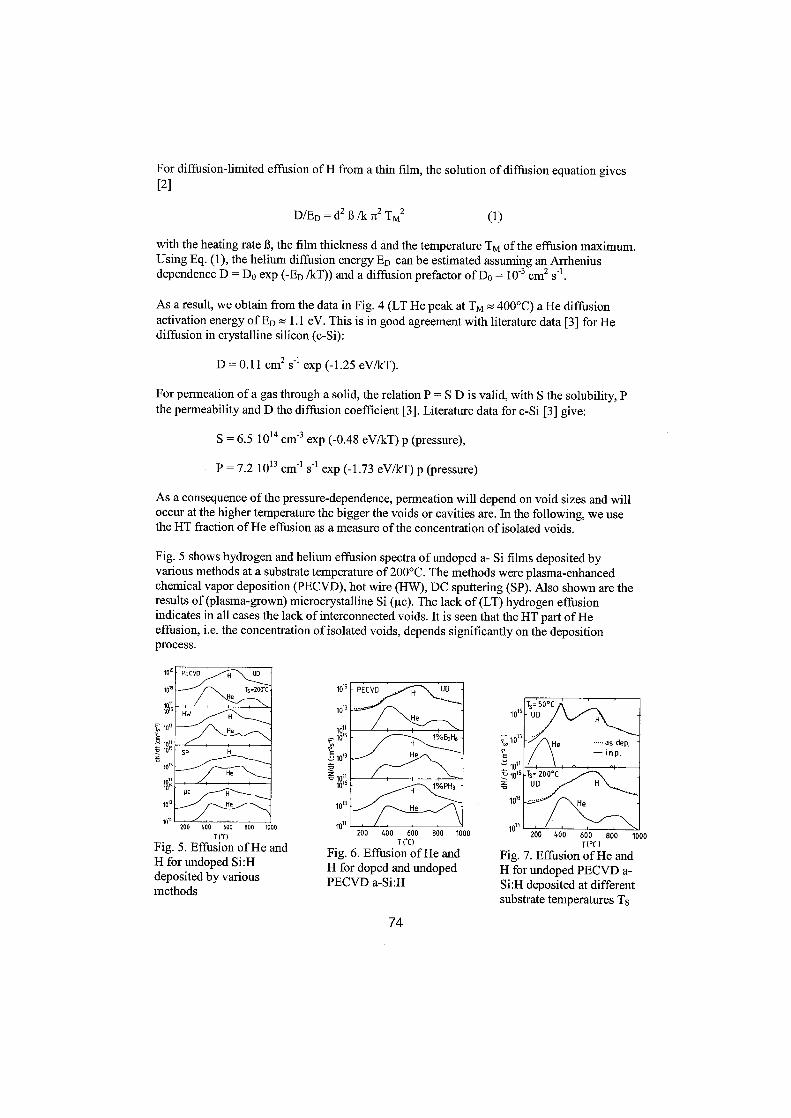
For diffusion-limited effusion of Hfrom a thin film, the solution ofdiffusion equation gives[2]
with the heating rate ß, the film thickness d and the temperature TM of the effusion maximum.Using Eq . (1), the helium diffusion energy ED can be estimated assuming an Arrheniusdependence D = Do exp (-ED /kT)) and a diffusion prefactor of Do = 10 -3 cm2 S-1 .
As a result, we obtain from the data in Fig. 4 (LTHe peak at TM ~e 400°C) aHe diffusionactivation energy ofED gz~ 1 .1 eV . This is in good agreement with literature data [3] for Hediffusion in crystalline silicon (c-Si) :
For permeation of a gas through a solid, the relation P= S D is valid, with S the solubility, Pthe permeability andD the diffusion coefficient [3] . Literature data for c-Si [3] give :
1015
1013
10111015
10"E
1013
1011101s
10"
H for undoped Si:Hdeposited by variousmethods
D/ED = d2 ß/k 7E2 TM2
(1)
D = 0.11 cm2 s' exp (-1 .25 eV/kT) .
S = 6.5 1014 CM -3 exp (-0.48 eV/kT) p (pressure),
P = 7.2 10 13 cm - ' sl exp (-1 .73 eV/kT) p (pressure)
As a consequence ofthe pressure-dependence, permeation will depend an void sizes and willoccur at the higher temperature the bigger the voids or cavities are. In the following, we usethe HT fraction ofHe effusion as ameasure of the concentration of isolated voids.
Fig. 5 Shows hydrogen and helium effusion spectra ofundoped a- Si films deposited byvarious methods at a substrate temperature of200°C. The methods were plasma-enhancedchemical vapor deposition (PECVD), hot wire (HW), DC sputtering (SP) . Also shown are theresults of (plasma-grown) microcrystalline Si (gc) . The lack of (LT) hydrogen effusionindicates in all cases the lack ofinterconnected voids. lt is Seen that the HT part ofHeeffusion, i.e. the concentration of isolated voids, depends significantly an the depositionprocess.
1011200 400 600 600 1000
T('O
Fig. 5. Effusion ofHe and
10 15
10111015U
=1013
- 1 011015
10,1
-~1 82H6 -H
He
200 400 600T CC)
Fig. 6. Effusion ofHe andH for doped and undopedPECVD a-Si :H
74
800 1000
10 15
1013
1d 1 ' . /
, "
\ I200 400 600 800 1000
T( °C)
Fig. 7. Effusion ofHe andH for undoped PECVD a-Si:H deposited at differentsubstrate temperatures Ts
-PECVD H - uo
T5 =200-CHe
Mim
SP H
P, HHe
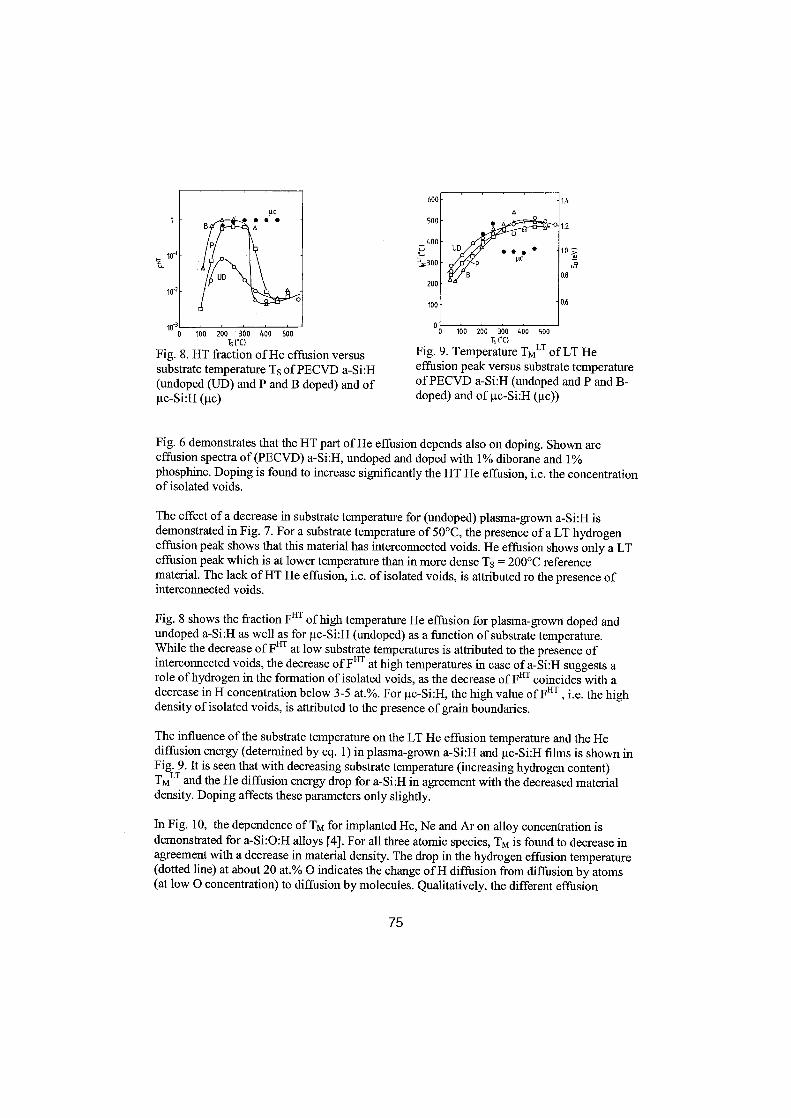
100 200 300 400 500-rs Co
Fig. B . HT fraction ofHe effusion versussubstrate temperature Ts ofPECVD a-Si:H(undoped (UD) and P and B doped) and ofgc-Si:H (gc)
75
0.8
0.6
Ts (*0Fig . 9 . Temperature TMLT ofLT Heeffusion peak versus substrate temperatureof PECVD a-Si:H (undoped and P and B-doped) and of gc-Si:H (gc))
Fig. 6 demonstrates that the HT part ofHe effusion depends also an doping. Shown areeffusion spectra of (PECVD) a-Si:H, undoped and doped with 1% diborane and 1%phosphine . Doping is found to increase significantly the HT He effusion, i .e. the concentrationofisolated voids.
The effect ofa decrease in substrate temperature for (undoped) plasma-grown a-Si :H isdemonstrated in Fig . 7 . For a substrate temperature of 50°C, the presence of a LT hydrogeneffusion peak Shows that this material has interconnected voids. He effusion Shows only a LTeffusion peak which is at lower temperature than in more dense Ts = 200°C referencematerial. The lack of HT He effusion, i .e. ofisolated voids, is attributed ro the presence ofinterconnected voids .
Fig . 8 Shows the fraction FHT ofhigh temperature He effusion for plasma-grown doped andundoped a-Si:H as well as for gc-Si:H (undoped) as a function of Substrate temperature .While the decrease of FHT at low substrate temperatures is attributed to the presence ofinterconnected voids, the decrease ofFHT at high temperatures in case ofa-Si:H suggests arole ofhydrogen in the formation of isolated voids, as the decrease of FHT coincides with adecrease in H concentration below 3-5 at.% . For gc-Si:H, the high value ofFHT , i .e . the highdensity ofisolated voids, is attributed to the presence of grain boundaries .
The influence ofthe substrate temperature an the LT He effusion temperature and the Hediffusion energy (determined by eq. 1) in plasma-grown a-Si:H and gc-Si:H films is shown inFig . 9 . lt is Seen that with decreasing substrate temperature (increasing hydrogen content)TMLT and the He diffusion energy drop for a-Si:H in agreement with the decreased materialdensity. Doping affects these parameters only slightly.
In Fig. 10, the dependence ofTm for implanted He, Ne and Ar an alloy concentration isdemonstrated for a-Si:O:H alloys [4] . For all three atomic species, Tm is found to decrease inagreement with a decrease in material density . The drop in the hydrogen effusion temperature(dotted line) at about 20 at.% O indicates the change of H diffusion from diffusion by atoms(at low O concentration) to diffusion by molecules . Qualitatively, the different effusion
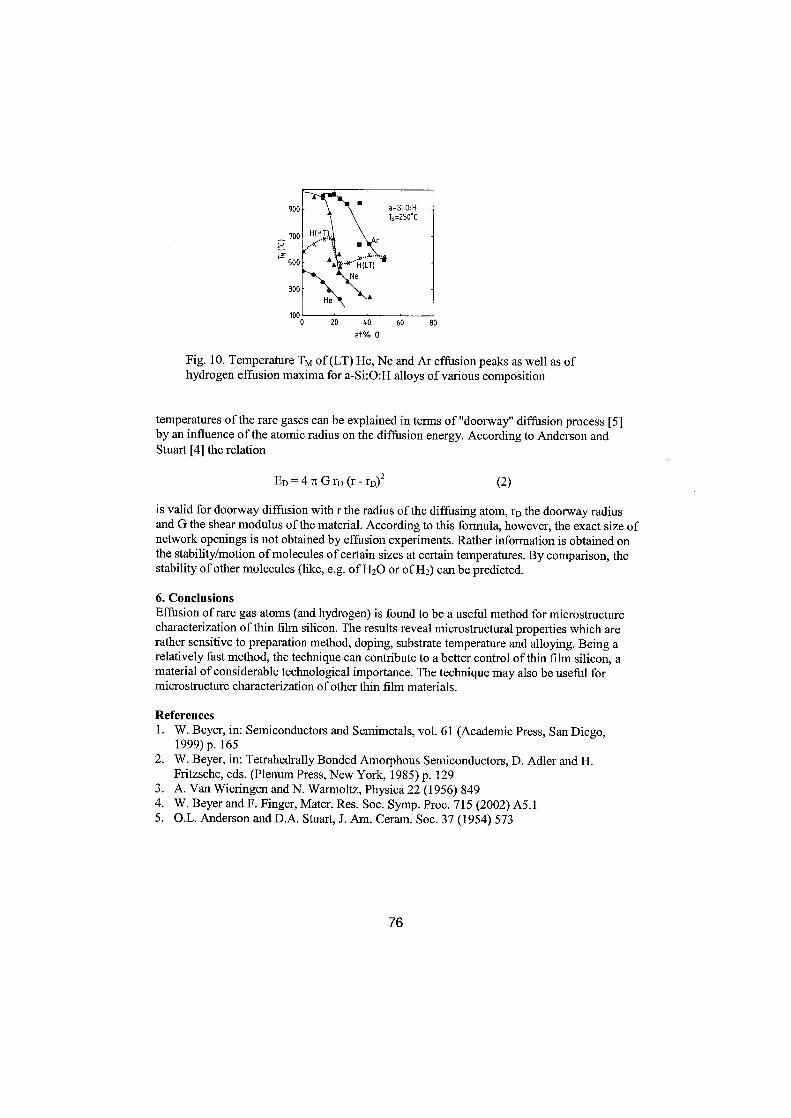
900
700
500
300
1000 20 40 60 80
atI 0
Fig . 10 . Temperature TM of(LT) He, Ne and Ar effusion peaks as well as ofhydrogen effusion maxima for a-Si:O:H alloys of various composition
temperatures ofthe rare gases can be explained in tenns of "doorway" diffusion process [5]by an influence of the atomic radius an the diffusion energy. According to Anderson andStuart [4] the relation
ED = 4 7c G rD (r - rD) 2(2)
is valid for doorway diffusion with r the radius of the diffusing atom, rD the doorway radiusand G the shear modulus ofthe material. According to this formula, however, the exact size ofnetwork openings is not obtained by effusion experiments. Rather infonnation is obtained anthe stability/motion ofmolecules of certain sizes at certain temperatures . By comparison, thestability ofother molecules (like, e .g . ofH2O or ofH2) can be predicted .
6 . ConelusionsEffusion ofrare gas atoms (and hydrogen) is found to be a useful method for microstructurecharacterization ofthin film silicon. The results reveal microstructural properties which arerather sensitive to preparation method, doping, substrate temperature and alloying. Being arelatively fast method, the technique can contribute to a better control ofthin film silicon, amaterial of considerable technological importance . The technique may also be useful formicrostructure characterization ofother thin film materials .
References1 .
W. Beyer, in : Semiconductors and Semimetals, vol . 61 (Academic Press, San Diego,1999) p . 165
2 . W . Beyer, in : Tetrahedrally Bonded Amorphous Semiconductors, D . Adler and H .Fritzsche, eds. (Plenum Press, New York, 1985) p . 129
3 . A . Van Wieringen and N . Wannoltz, Physica 22 (1956) 8494 .
W. Beyer and F . Finger, Mater . Res . Soc . Symp . Proc. 71 5 (2002) A5.15 .
O.L. Anderson and D.A . Stuart, J . Am. Ceram . Soc . 37 (1954) 573
76
Research Activity in the Solar Cell LaboratoryInstitute of Graduate Studies and Research
Alexandria University
Moataz SolimanMaterials Science Department
Institute of Graduate Studies and ResearchAlexandria University
163 Horrya Avenue, PO Box 832Alexandria, Egypt
Email:[email protected]
This Laboratory is the best-equipped laboratory all over the country fordoing research in the field of solar Cells. The laboratory had beensupported by:
A-UNESCOB-Joint project between Alexandria University andEindhoven Universityto transfer the Technology ofSolar Cells .
We have an interest in solar energy because:
1- We have areas in Egypt with the highest solar insolation all over theworld,
2- We have many scattered areas that are far from the utility grid, andthe solar energy will be the proper source in order to reclaim theseareas and eventually redistribute the Egyptian population (95% ofthepopulation occupies only 5% ofthe land),
3- We have now a great concem about our air quality and the effect ofconventional energy sources, so we should increase the use ofrenewable energy sources.
77
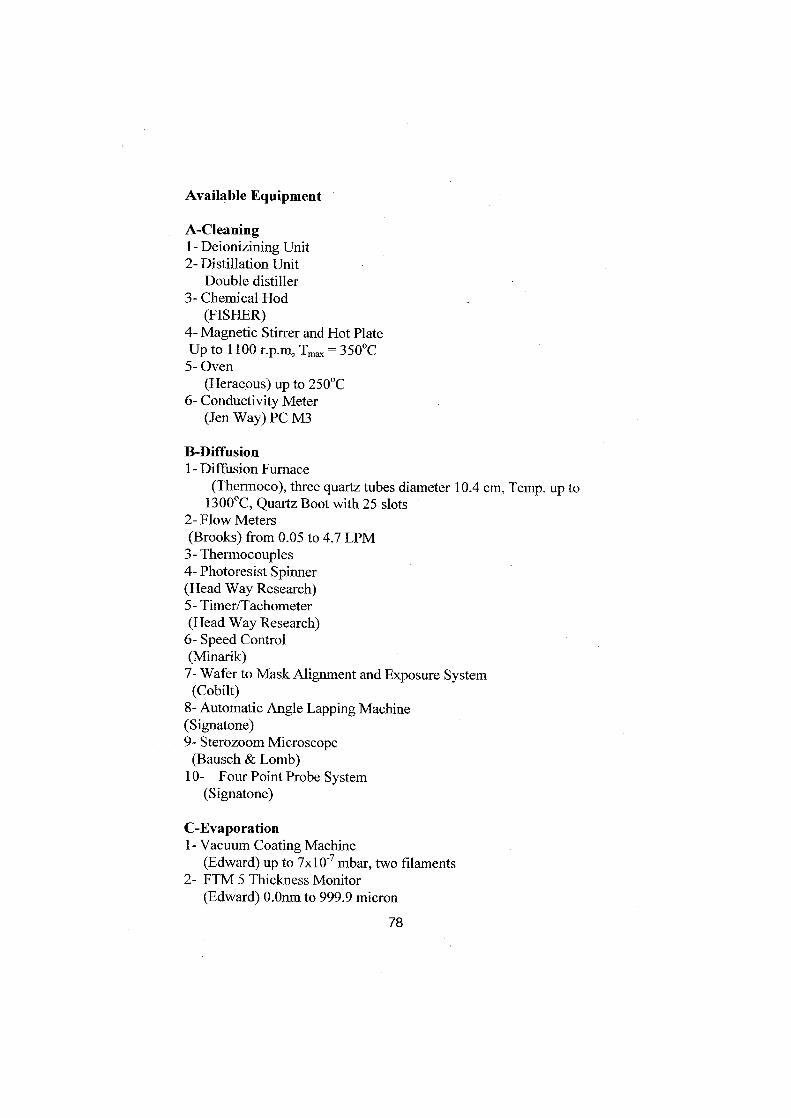
Availahle Equipment
A-Cleaning1- Deionizining Unit2- Distillation Unit
Double distiller3- Chemical Hod
(FISHER)4- Magnetic Stirrer and HotPlateUp to 1100 r.p.m, Tm�, = 350°C5- Oven
(Heraeous) up to 250°C6- Conductivity Meter
(Jen Way) PC M3
B-Diffusion1- Diffusion Furnace
(Thermoco), three quartz tubes diameter 10.4 cm, Temp. up to1300°C, Quartz Boot with 25 slots
2- Flow Meters(Brooks) from 0.05 to 4.7 UM3- Thermocouples4- Photoresist Spinner(Head Way Research)5- Timer/Tachometer(Head WayResearch)6- Speed Control(Minarik)7- Wafer to Mask Alignment and Exposure System(Cobilt)
8- Automatic Angle Lapping Machine(Signatone)9- Sterozoom Microscope(Bausch & Lomb)
10-
FourPoint Probe System(Signatone)
C-Evaporation1- Vacuum Coating Machine
(Edward) up to 7x10⁻⁷ mbar, two filaments2- FTM 5 Thickness Monitor
(Edward) O.Onm to 999.9 micron78

3- Mechanical MasksFour masks for the front metallization
C-Gell Testing1- XYT RecorderZSKT (Rohd & Schwarz)2- Power Supplies(Delta Elektronika)
3- Standard Solar Cell(Solarex) AMI &AMO4- Tungsten Halogen lamps
l000W5- Lux Meter(Traceable),three ranges6- Light Meters(Spectra-Physics) 404 micro watts to 5watts7- Electrometer
(Keithly) 6028- Optical Filters
(Balzers) 20 Filters
D-EneapsulationHome Made Panel Assembly Unit
The staffc_lc~i_n_g the resca_rrch in tlhe la_borra_tcorv is eight _m__e_m__bers Thegroup leader is Dr. Prof. Mahmoud Shabana.
The current research areas are:
1- *Fabrication and characterization ofp-n junction silicon solar teils bydiffusion process using spin an sources,
Thickening ofgrid fingers using electrochemical deposition
2- Fabrication and characterization of MIS solar celis,Effects of oxidation time and temperature an the cell performance
3- *Studying the effects of illumination, heating and radiation an theMIS solar cells,
Effects ofthese parameters an the cell performance
79

4- Modeling ofMIS/IL solar cells,Effects offabrication parameters an the cell performa nce
5- Preparation ofmetal oxide using spraying technique,Effects ofsolution parameters and substrate temperature
6- *Fabrication of CdS/CdTe/ZnTe/C hetrojunction solar cells usingelectrochemical deposition technique,
Effects ofsolutions parameters, temperature, addition of copper, and heattreatment an the cell performance
7- *Preparation of selective coating for flat plate collectorEffect of preparation parameters ofelectrochemical deposition an theselectivity of flat plate collector
8- *Fabrication of dye sensitized nano structured solar cellsPreparation of nano structured Zn0 using electrochemical deposition,
and effect of particle size of Ti0Zon cell performance.
We are looking for joint projects to keep an doing research in thefield ofPhotovoltaic energy
Areas for joint projects :
1 _ Recearch nrniectc wit_h_i__n_ the abevp rACAarrh tnnicS fe d studi_ecsystem performance, andpreparing educational kits for students,
2- Workshops and training courses,3- Exchange ofvisiting staff members.
Photovoltaics Applications and Research in Egypt
Said H. EL-Hefnawi
Photovoltaic Cells Department, Electronics Research Institute,NRC Building, Tahrir Street, Dokki, Cairo, Egypt,
Tel: 202-3310510, Fax: 202-3351631,Email: shefnawi(a,hotmail .com
ABSTRACTEgypt is one of the countries, which has favorable solar energy conditions and good
potential for solar energy utilization . The majority ofEgypt's population is living in only 6% ofthe land, with the remaining 94% of the land as desert. A national program to developrenewable energy systems was started in 1957 in National Research Center ofEgypt. Since thenmany academic institutions have been involved in academic research an different aspects ofsolar cell technology.
The interest in renewable energy sources started with a promotion for replacing thedepleting conunercial sources but now the interest has taken a more important dimension thatrenewable energy sources are clean sources with no harmful effect an the environment.
This paper discusses the different photovoltaic activities and projects in Egypt withemphasis an community field projects utilizing PV for different applications . There are fourmain field studies addressing integrated approach to rural conununity development . Lessonslearned and recommendations from the field experiences are summarized .
This paper also introduces the recent aetivities, including internal and external projects,of Photovoltaic Cells Department (Electronics Research Institute) in the fields ofmonocrystalline silicon solar cells preparation, thin films, and applications .
INTRODUCTIONDespite the internal migration of rural people to urban areas, around 4 billion people
still live in rural areas of developing countries and most of them with little or no access toelectricity . Only, in few crses, electric power is produced by stand-alone generator sets . Sociallife in the evenings is usually extended for a couple of hours by a kerosene lamp . What iscommon to all, however, is that sunrise and sunset still mark the beginning and end of everyday. lt is widely accepted that electricity still spurs the social and economic development ofrural areas. Availability of electric power is decisive for the supply of good drinking water, theconservation offood, the storage ofmedical supplies, radio, TV, telecommunication, etc .
lt is also obvious that along the anticipated path for development, many developingcountries will increase their energy consumption, a large portion of which will be covered byconventional sources like oil, gas and coal . This will undoubtedly contribute to an inerease inthe world's carbon-dioxide (COZ) production . Solar technology has the advantage of being onethe very few C02-free energy converting technologies .
lt was after the so-called energy crises of the Seventies that the interest and focus anrenewable energy sources of energy. Particularly, solar energy had jumped upward almostovernight and that interest kept increasing over the years . Solar energy is divided into two maincategories : solar-thermal and photovoltaic . While solar-thermal is self-explanatory, PV is aspecial technical term unconunonly recognized by the layman partieularly in developingcountries. PV is simply a technology that converts light into electricity, irrespective of thesource of light. However, there are many PV materials and devices, and their design,fabrication, and performance vary a great deal from one PV material to another and from onecell design to another .
81

Photovoltaic have been shown to offer many advantages :-
PV systems do not need fuels; in remote areas of developing countries in particular,diesel or kerosene fuel supplies are unreliable and expensive.PV systems are modular; therefore, an array which is composed of several modules canbe tailored to size to meet a particular load .
-
PV systems are highly reliable as compared to those ofdiesel generators .-
PV systems are easy to maintain compared to alternative technologies .-
PV modules have long lifetime with little degradation in performance over 20 years.-
PV systems are environmentally benign causing no pollution and no contribution toglobal warming.
-
PV systems have proven recently to be economically viable for small-scale applicationsas compared with diesel systems or other small power supplies .
-
PV systems can improve the quality of life, for instance, lighting in a rural school,refrigeration of vaccines at a rural clinic or powering a radio transceiver or a TV in aremote location .
Applications of photovoltaic cover a wide range covering almost every aspect of ruralactivities . Examples are :
-
Rural electrification,-
Waterpumping and treatment systems,-
Health care systems,- Communications,-
Transport aids like road signs and hazard signals,-
Security systems,-
Corrosion protection systems,-
Miscellaneous like consumer devices, feeding systems an fish farms, aeration systemsin stagnant lakes, earthquake monitoring systems, fountains and emergency power fordisaster relief,
-
Income generating activities like battery charging, TV and video pay stations, villageindustry power and refrigeration services .
Egypt is one of the countries, which has favorable solar energy conditions and goodpotential for solar energy utilization. The amount of solar energy incidence per square metervaries between 5 and 8 kWh per day with duration of3000-4000 hours per year. The majority ofEgypt's population (60 million people in 1999) is living in only 6% of the land, with theremaining 94% of the land as desert. A national program to develop renewable energy systemswas started in 1957 in National Research Center of Egypt. Since then many academicinstitutions have been involved in academic research an different aspects of solar celltechnology. Few institutions have been involved in field applications of PV systems forcommunity development . The potential for practical use of PV power was first tested in thefield of Basaisa Village [1] in (Al-Sharkiya Governorate) in Sept . 1977 . A solar module (18-watt peak) was used to power a 12-inch black and white communal TV set which was installedin the common hall �Mandara" ofBasaisa.
The interest in renewable energy sources started with a promotion for replacing thedepleting commercial sources but now the interest has taken a more important dimension thatrenewable energy sources are clean sources with no harmful effect an the environment . Thetheme of the first World Renewable Energy Congress held at Reading, U.K ., Sept . 1990 wastaken as Energy and Environment into the 1990s. Less than two months after, the secondInternational Symposium an Renewable Energy was held in Cairo (Oct. 1-4, 1990). About 150research papers from 30 countries were presented during 24 sessions during the symposium.The general message was clean energy for better environment .
PHOTOVOLTAICS AND COMMUNITY DEVELOPMENTThe relationship between energy and community development is a dynamic one, in
which the amount, type and quality ofeconomic growth are mutually dependent variables an thequantity, kind and price of energy available' Tere is a growing consensus that successful
82
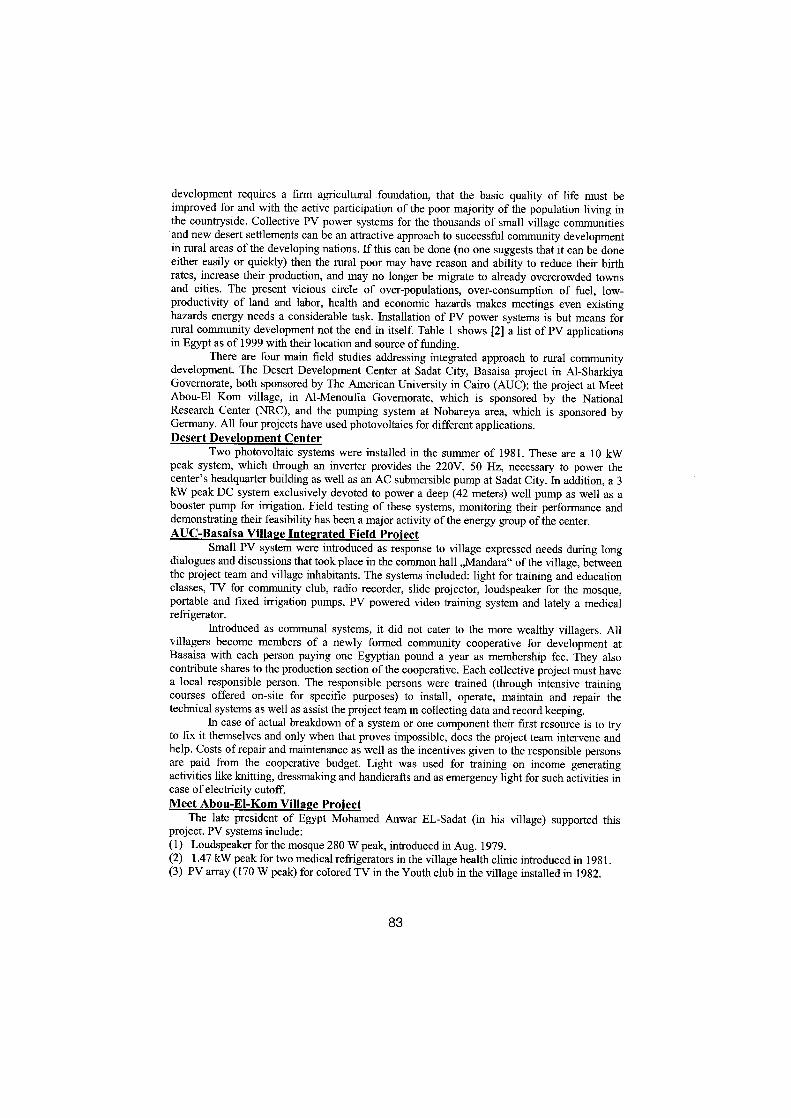
development requires a firm agricultural foundation, that the basic quality of life must beimproved for and with the active participation of the poor majority of the population living inthe countryside . Collective PV power systems for the thousands of Small village conununitiesand new desert settlements can be an attractive approach to successful community developmentin rural areas ofthe developing nations . If this can be done (no one suggests that it can be doneeither easily or quickly) then the rural poor may have reason and ability to reduce their birthrates, increase their production, and may no longer be migrate to already overcrowded townsand cities . The present vicious circle of over-populations, over-consumption of fuel, low-productivity of Land and Labor, health and economie hazards makes meetings even existinghazards energy needs a considerable task . Installation of PV power systems is but means forrural community development not the end in itself. Table 1 Shows [2] a list of PV applicationsin Egypt as of 1999 with their location and source of funding.
There are four main field studies addressing integrated approach to rural communitydevelopment. The Desert Development Center at Sadat City, Basaisa project in Al-SharkiyaGovernorate, both sponsored by The American University in Cairo (AUC), the project at MeetAbou-El Korn village, in Al-Menoufia Governorate, which is sponsored by the NationalResearch Center (NRC), and the pumping system at Nobareya area, which is sponsored byGermany. All four projects have used photovoltaics for different applications.Desert Develoument Center
Two photovoltaic systems were installed in the summer of 1981 . These are a 10 kWpeak System, which through an inverter provides the 220V, 50 Hz, necessary to power thecenter's headquarter building as well as an AC submersible pump at Sadat City . In addition, a 3kW peak DC System exclusively devoted to power a deep (42 meters) well pump as well as abooster pump for irrigation. Field testing of these Systems, monitoring their performance anddemonstrating their feasibility has been a major activity ofthe energy group ofthe center .AUC-Basaisa VillaEe Integrated Field Proiect
Small PV System were introduced as response to village expressed needs during longdialogues and discussions that took place in the common hall �Mandara" of the village, betweenthe project team and village inhabitants . The Systems included : light for training and educationclasses, TV for community club, radio recorder, slide projector, loudspeaker for the mosque,portable and fieed irrigation pumps, PV powered video training system and lately a medicalrefrigerator.
Introduced as comrnunal Systems, it did not cater to the more wealthy villagers. Allvillagers become members of a newly formed community cooperative for development atBasaisa with each person paying one Egyptian pound a year as membership fee . They alsocontribute shares to the production section ofthe cooperative . Each collective project must havea local responsible person. The responsible persons were trained (through intensive trainingcourses offered on-site for specific purposes) to install, operate, maintain and repair thetechnical systems as well as assist the project team in collecting data and record keeping.
In case of actual breakdown of a system or one component their first resource is to tryto fix it themselves and only when that proves impossible, does the project team intervene andhelp . Costs of repair and maintenance as well as the incentives given to the responsible personsare paid from the cooperative budget. Light was used for training an income generatingactivities like knitting, dressmaking and handicrafts and as emergency light for such activities incase ofelectricity cutoff.Meet Abou-El-Kom Villaee Prolect
The Tate president of Egypt Mohamed Anwar EL-Sadat (in his village) supported thisproject . PV Systems include :(1) Loudspeaker for the mosque 280 Wpeak, introduced in Aug. 1979 .(2)
1.47 kWpeak for two medical refrigerators in the village health clinic introduced in 1981 .(3) PV array (170 W peak) for colored TV in the Youth club in the village installed in 1982.
83
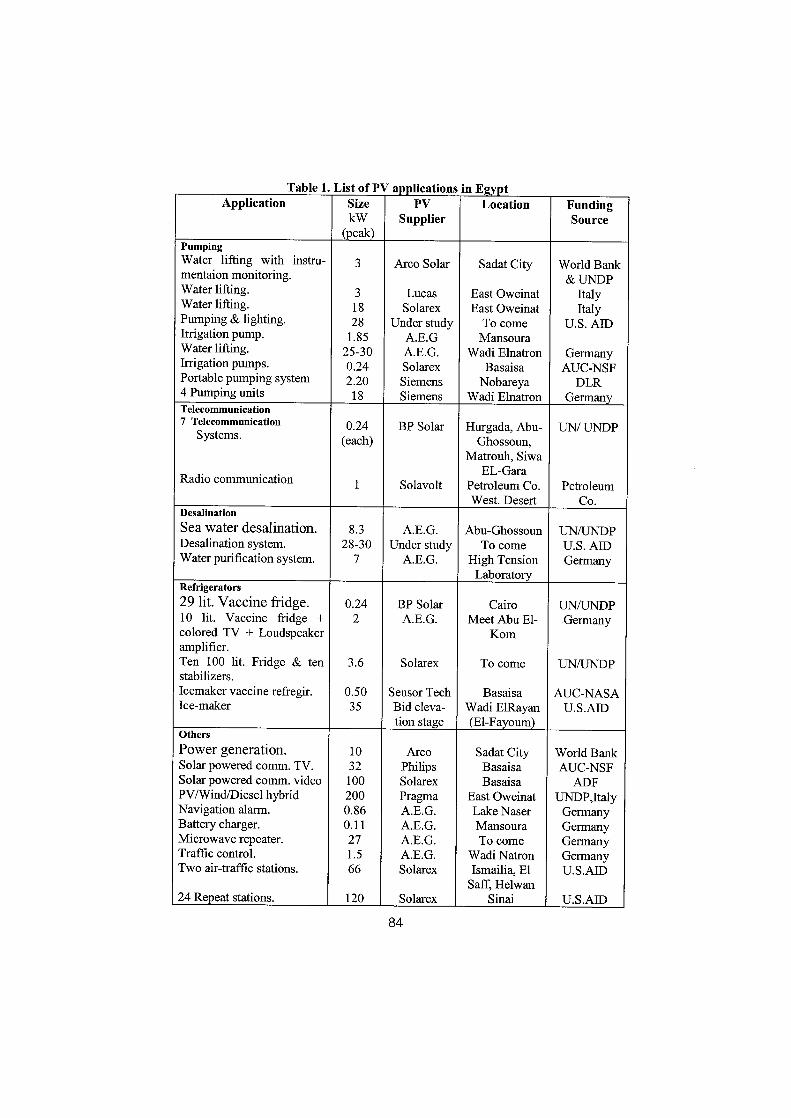
Table 1 . List of PV a
lications in E
t
84
Application Size PV Location FundingkW Supplier Source
(peak)PumpingWater lifting with instru- 3 Arco Solar Sadat City World Bankmentaion monitoring . & UNDPWater lifting . 3 Lucas East Oweinat ItalyWater lifting . 18 Solarex East Oweinat ItalyPumping & lighting . 28 Under study To come U.S . AIDIrrigation pump . 1.85 A.E.G MansouraWater lifting. 25-30 A.E.G. Wadi Elnatron GermanyIrrigation pumps. 0.24 Solarex Basaisa AUC-NSFPortable pumping system 2.20 Siemens Nobareya DLR4 Pumping units 18 Siemens Wadi Elnatron GermanyTelecommunication7 Telecommunication 0.24 BP Solar Hurgada, Abu- UN/ UNDPSystems . (each) Ghossoun,
Matrouh, Siwa
Radio communication EL-Gara1 Solavolt Petroleum Co. Petroleum
West . Desert Co .DesalinationSea water desalination . 8.3 A.E.G. Abu-Ghossoun UN/UNDPDesalination system . 28-30 Under study To come U.S . AIDWater purification system . 7 A.E.G. High Tension Germany
LaboratoryRefrigerators29 lit . Vaccine fridge . 0.24 BP Solar Cairo UN/UNDP10 lit . Vaccine fridge + 2 A.E.G . Meet Abu El- Germanycolored TV + Loudspeaker Komampffier.Ten 100 lit . Fridge & ten 3 .6 Solarex To come UN/UNDPstabilizers .Icemaker vaccine refregir. 0.50 Sensor Tech Basaisa AUC-NASAIce-maker 35 Bid eleva- Wadi EIRayan U.S.AID
tion stage (El-Fayoum)OthersPower generation. 10 Arco Sadat City World BankSolar powered comm. TV . 32 Philips Basaisa AUC-NSFSolar powered comm. video 100 Solarex Basaisa ADFPV/Wind/Diesel hybrid 200 Pragma East Oweinat UNDP,ItalyNavigation alarm . 0.86 A.E.G . Lake Naser GermanyBattery charger. 0.11 A.E.G . Mansoura GermanyMierowave repeater . 27 A.E.G . To come GennanyTraffic control . 1 .5 A.E.G . Wadi Natron GermanyTwo air-traffic stations. 66 Solarex Ismailia, El U.S.AID
Saff, Helwan24 Re eat stations. 120 Solarex Sinai U.S.AID
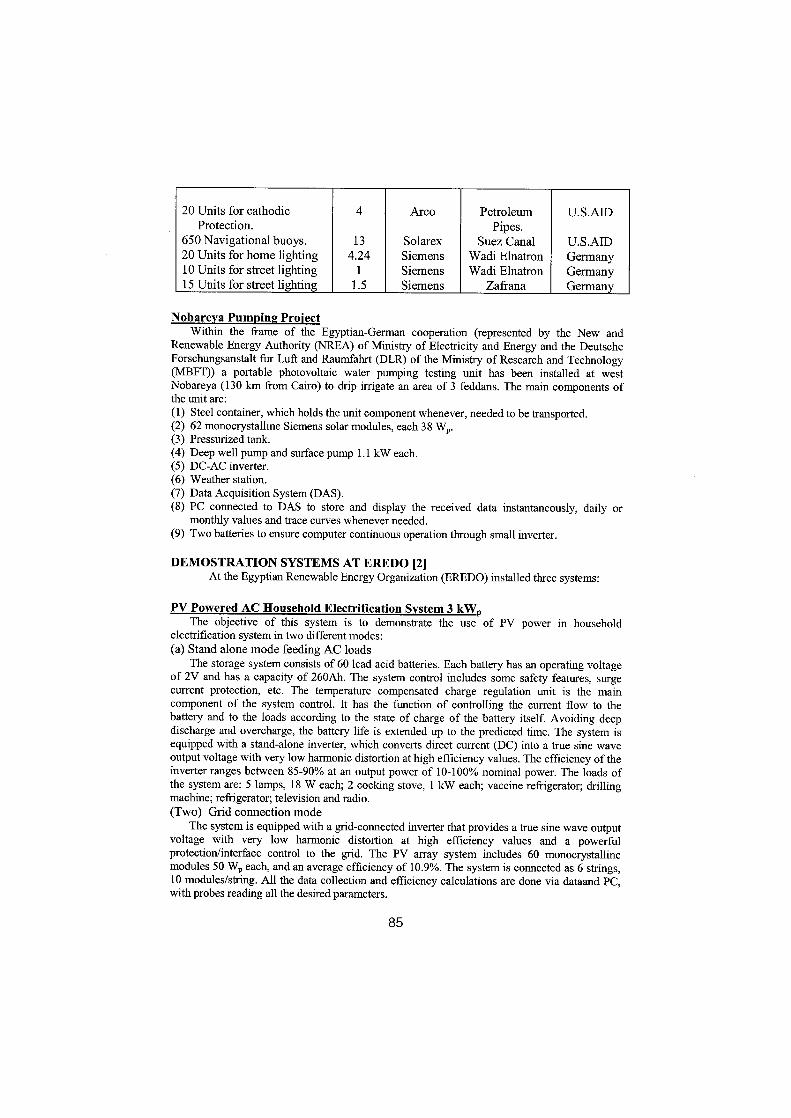
Nobareya Pumping ProieetWithin the frame of the Egyptian-German cooperation (represented by the New and
Renewable Energy Authority (NREA) of Ministry of Electricity and Energy and the DeutscheForschungsanstalt für Luft and Raumfahrt (DLR) of the Ministry of Research and Technology(MBFT)) a portable photovoltaic water pumping testing unit has been installed at westNobareya (130 km from Cairo) to drip irrigate an area of 3 feddans. The main components ofthe unit are:(1) Steel container, which holds the unit component whenever, needed to be transported .(2) 62 monocrystalline Siemens solar modules, each 38 Wp.(3) Pressurized tank.(4) Deep well pump and surface pump 1.1 kW each.(5) DC-AC inverter.(6) Weather station .(7) Data Acquisition System (DAS).(8) PC connected to DAS to store and display the received data instantaneously, daily or
monthly values and trace curves whenever needed .(9) Two batteries to ensure computer continuous operation through small inverter .
DEMOSTRATION SYSTEMS AT EREDO [2]At the Egyptian Renewable Energy Organization (EREDO) installed three systems:
PV PoweredAC Household Eleetritication System 3 kWpThe objective of this system is to demonstrate the use of PV power in household
electrification system in two different modes:(a) Stand alone mode feeding AC loads
The storage system consists of60 lead acid batteries . Each battery has an operating voltageof 2V and has a capacity of 260Ah. The System control includes some safety features, surgecurrent protection, etc . The temperature compensated charge regulation unit is the maincomponent of the system control . It has the function of controlling the current flow to thebattery and to the loads according to the state of charge of the battery itself Avoiding deepdischarge and overcharge, the battery life is extended up to the predicted time . The system isequipped with a stand-alone inverter, which converts direct current (DC) into a true sine waveoutput voltage with very low harmonic distortion at high efficiency values. The efficiency oftheinverter ranges between 85-90% at an output power of 10-100% nominal power. The loads ofthe System are: 5 lamps, 18 W each; 2 cocking stove, 1 kW each; vaccine refrigerator; drillingmachine; refrigerator; television and radio .(Two) Grid connection mode
The system is equipped with a grid-connected inverter that provides a true sine wave outputvoltage with very low harmonic distortion at high efficiency values and a powerfulprotection/interface control to the grid . The PV array system includes 60 monocrystallinemodules 50 Wp each, and an average efficiency of 10.9%. The system is connected as 6 strings,10 modules/string . All the data collection and efficiency calculations are dope via dataand PC,with probes reading all the desired parameters.
85
20 Units for cathodic 4 Arco Petroleum U.S.AIDProtection. Pipes.
650 Navigational buoys. 13 Solarex Suez Canal U.S .AID20 Units for home lighting 4.24 Siemens Wadi Elnatron Germany10 Units for street lighting 1 Siemens Wadi Elnatron Germany15 Units for street lightin 1 .5 Siemens Zafrana Gennan
PV Dowered DC household electrilication system 500 WrThis system demonstrates the use of PV power in household electrification system
working at stand-alone conditions and a system operating voltage of 24V. The system includes12 monocrystalline PV modules; 45 Wv each and an average efficiency of 10.9%. The PVsystem is electrically connected as 6 strings, 2 modules/string . For any household system, astorage system is needed to supply power to the loads at night . 12 lead acid batteries are used .Each battery has an operating voltage of 2V and has the capacity of 25Ah. The system controlincludes some safety features, surge current protection, etc . The temperature compensatedcharge regulation unit is the main component of the system control . The system feeds thefollowing DC loads: refrigerator 50 litetrs ; 4 fluorescent lamps 11W each ; 4 fluorescent lamps18Weach ; 4 fluorescent lamps 36Weach and 2 rheostats .
PV Dumping System 1500 WPThe objective of this system is to monitor the performance of submersible pumps using
a closed loop hydraulic system . The system feeds a submersible electric water pump with an ACmotor, which pumps the water to a In? storage tank. The tank is equipped with all the metersneeded to measure the flow and pressure. It also contains a control valve that takes its controlsignal from the pump inverter/controller. The pump is able to pump 26m3/day . The pumpinverter/controller provides AC power to the pump and constantly supervises the system bymeasuring the array current, array voltage and the intemal temperature . It has built-in controlprocedures in case of any fault detection . The PV array of the system includes 35 polycrystallinemodules, 42Wp each and an average efficiency of 10%.
LESSONS LEARNEDANDRECOMMENDATIONSOne)
Energy development strategies, programs, and projects directed towards meeting theneeds of the poor majority are bound to fail, if no effort is made at the same time an thedevelopment of the economic, social, and technological capabilities of the rural people, aswell as the infrastructure at community level .
Two)
Photovoltaic should be promoted as an energy generator to do productive work forincreasing income, for effective training and for better and healthier environment.
Three) Public participation an all phases ofPV field projects, as well as appropriate training ofend-users at the local level, have been stressed by all investigators and project directors tobe important for the success ofany project .
Four)
Small-scale PV power systems appear to have the most flexibility and reliability formeeting a large variety of small scale, decentralized, electrical energy needs of ruralcommunities in Egypt as well as in other developing countries. There is a significant marketpotential for PV systems in village applications in Egypt.
Five)
lt is found necessary to develop micro-organizations at the village level ; a sort ofruralenergy cooperative to :-
manage the new technologies introduced and sustain the on-going productive andservice activities based an them,
-
integrate the different activities for a positive and comprehensive local development,-
generate funds needed to install, operate, maintain, repair, and replace if necessary thecommunity energy systems.
Six)
We have to pay more attention to the training and education ofthe local technical staff.Human resources are important for projects and programs implementation and forsustainable development .
BARRIERS AND CONSTRAINTSWith all the above advantages (see Introduction) one would have expected PV
applications to spread everywhere in the world. This did not happen. Why is that?There were and still are barriers to the diffusion ofthis interesting technology .
86
Until recently, price has been the main barrier to the widespread use of PV . In 1970, forexample, this was over $100/W and in 1975 it went down to $30[W. Since then, improvementsin manufacturing technology and increased scale of production have reduced prices to theirpresent 20001evels of $3/W for the modules.
The above price was not attained without improvements in other aspects of PVtechnologies . Improvements in conversion efficiencies, for example, had gone far from theinitial l% reported in 1940 . In the late fifties, crystalline silicon cells were developed with highenough conversion efficiencies to enable their use for power generation. Development inconversion efficiencies was due to the active space program in the USA, which resulted in thelaunching of the first powered satellite, Vanguard I, in 1958 . The Output of PV modules forterrestrial applications matured around 1983 with the introduction of automated productionfacilities . The Output then jumped 4 folds over 1991 . The Output kept increasing till it reachedover 50 MW in 1990 .
Over the past decade, the price of PV modules and systems has been steadily falling inreal terms. Module prices for mono- and poly-crystalline silicon are currently around $4/Wp forlarge orders exclusive of delivery cost and taxes. The use ofcheaper silicon and fully automatedmanufacturing plants may produce further reduction of PV module prices to $2-3/Wp . With thinfilm technology, further power prices are attainable . However, crystalline silicon cells willcontinue to be competitive with thin film processes for several years because thin film systemsare not yet suitable for power generation which is still a dominant feature of crystalline siliconsystems.
An interesting research, conducted in Europe and the USA, an possible ways toincorporate social costs in decisions an energy systems concluded, taking into account theresults an COZ, that the differences ofcosts not included in the price of conventional energy andphotovoltaic averages 10 cents/kWh for new power stations . Compared to power stationswithout smoke gas de-sulfurization, PV has an advantage of 12 cents/kWh. The Overall rangefor this difference in the cost not included in the market prices of electricity runs from 4 to 19cents/kWh. In fact comparing costs of Operation and maintenance plus fuel gave the PV option asignificant lead .
PV ACTIVITIES OF ELECTRONICS RESEARCH INSTITUTEIn the following we introduce the recent activities, including internal and external
projects, of Photovoltaic Cells Department (Electronics Research Institute) in the fields ofmonocrystalline silicon solar cells preparation, thin films, and applications :
1986-1988
: Internal Project No . 4/2/2/1986, NRC : �Study ofPhotovoltaic Cellsin EgyptianCircumstances and its Applications"
1988-1993
: Internal Project No . 4/2/6/1988, NRC :�An Efficient Combined Solar-Wind Energy System"
1988-1989
: Internal Project No. 7/17/1988, NRC :�Silicon and other PhotovoltaicSolar Cells: Study and Applications"
1989
:�Technology of New Materials used in Energy and Information Field",Academy of Scientific Research and Technology, Ministry of ScientificResearch, Egypt.
1992-1997
: Internal Project, ERI : �New Antireflection Coating Material for SolarCells"
1996-1998
: External Projeet, Academy of Scientific Research and Technology�Study and Selection of the Available Technology for Mass Productionof Solar Cell Modules"
1996-1998
: Internal Project, ERI : �Design and Implementation ofan OptimumSolar Pumping System"
1998-2000
: External Project, Academy of Scientific Research and Technology�Researches in the Technology ofManufacturing ElectronieComponents"
87
1. Aref Yousef Eliwa, �Solar Cell Fabrication by Spray Pyroysis", M.Sc. Thesis, Faculty ofEngineering, Am Shams University, 1993 .
2. Mohamed Bayoumy A. Zahran, �Micocomputer Control of Photovoltaic Diesel GeneratorHybrid Power System", M.Sc . Thesis, Faculty ofEngineering, Cairo University, 1993 .
3. Yousry Abdel-Gawad El-Sayed Atia, �Integration ofthe Photovoltaic System with the GridControlled by Microcomputer", M.Sc. Thesis, Faculty of Engineering, Cairo University,1995 .
4. Ninet Mohamed Ahmed, �Simulation and Implementaion of CdS/CdTe Heteojunctions",M.Sc . Thesis, Faculty ofengineering, Am Shams University, 1996 .
5. Mohamed Bayoumy A. Zahran, �Microcontroller Based Control of Optimal Cost andReliable Remote Area PV-Diesel generator Hybrid Systems", Ph.D . Thesis, Faculty ofEngineering, Cairo University, 1998 .
6. Aref Yousef Eliwa, �Realization and Characterization of Indium Tin Oxide/Silicon SolarCells by Spray Pyrolysis Technique", Ph.D . Thesis, Faculty of Engineering, Ain ShamsUniversity, 2000 .
7. Yousry Abdel-Gawad El-Sayed Atia, �Enhanced Efficiency Pumping System Operating withPhotovoltaic Source", Ph.D . Thesis, Faculty ofEngineering, Cairo University, 2000 .
REFERENCES1 .
Salah Arafa, Science Department, The American University in Cairo, Egypt.2. New & Renewable Energy Authority (NREA), Ministry of Electricity & Energy, Cairo,
Egypt.
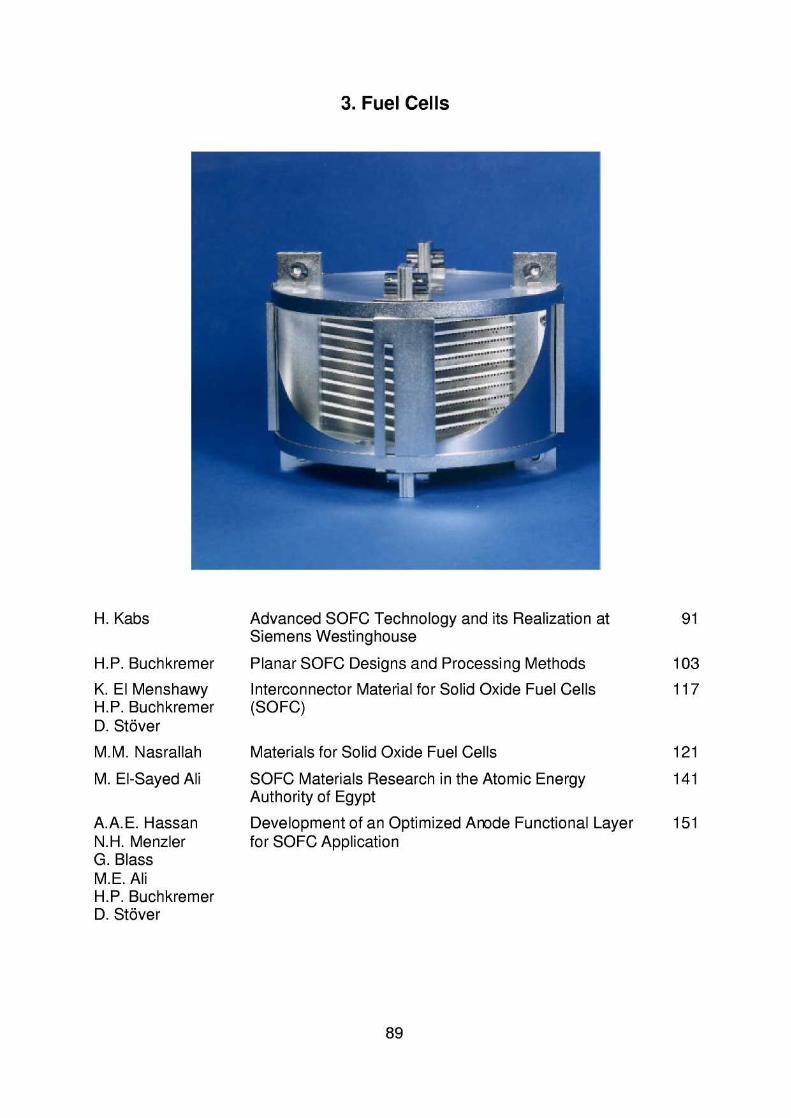
3 . Fuel Cells
H . Kabs Advanced SOFC Technology and its Realization at 91Siemens Westinghouse
H .P . Buchkremer Planar SOFC Designs and Processing Methods 103K. EI Menshawy Interconnector Material for Solid Oxide Fuel Cells 117H .P . Buchkremer (SOFC)D . Stöver
M .M . Nasrallah Materials for Solid Oxide Fuel Cells 121
M . EI-Sayed Ali SOFC Materials Research in the Atomic Energy 141Authority of Egypt
A.A.E . Hassan Development of an Optimized Anode Functional Layer 151N.H . Menzler for SOFC ApplicationG . BlassM .E . AliH .P . BuchkremerD . Stöver
Advanced SOFC Technology and its Realization atSiemens Westinghouse
Hermann Kabs
Siemens AG
Egyptian - German Workshop anMaterials and Processes for Advanced Technology:
Materials for Energy Systems
Cairo 7 . - 9. April 2002
91

Introduction
Fuel cells are essentially simple electrochemical converters, which convert the chemicalenergy ofthe fuels directly in electric energy . They play an important role in the debate an theenergy supply ofthe future for mainly:-
high electrical efficiency-
lowemissions and-
distributed generation, that means, energy generation nearby the place ofconsumption.
There are several types of fuel cells in discussion for a wide range ofapplications and powerfrom portable to stationary . Siemens main activities are at present in PEFC for submarinesand SOFC for stationary application. By contrast with the other types of fuel cells, SOFCdevelopers invented two basically different cell types, each still featuring several variations : aplanar and a tubular cell .After acquiring Westinghouse, Siemens decided to focus SOFC activities an the tubulardesign, which have been developed for many years at Westinghouse .
Design of cells, Eenerator and svstems
The single cell in the Siemens-Westinghouse (SWPC) design is partly depicted in Fig. 1 : it isa tube with one closed end ofat present 1 .8 m length and 2.2 cm diameter. The supportingstructure is formed by the cathode (air electrode), onto which interconnector, electrolyte andanode (fuel electrode) are deposited by different methods . It is an all-ceramic device . Ingeneral, the materials used are the conventional ones, the processes are at the moment mostlythose, which are well proven in the development . On the basis ofthe today's technology asingle cell generates somewhat more than 100 W direct current power at atmosphericpressure .Twenty-four ofthose tubes are connected in parallel and series to form a bundle (see Fig. 2),the equivalent to a stack in a planar configuration . These bundles are electrically connected inseries, 4 to form a row. They are part of the generator, that is shown in Fig. 3 .
Fig. 1 : SOFC tubular design of Siemens Westinghouse Power Corporation
92
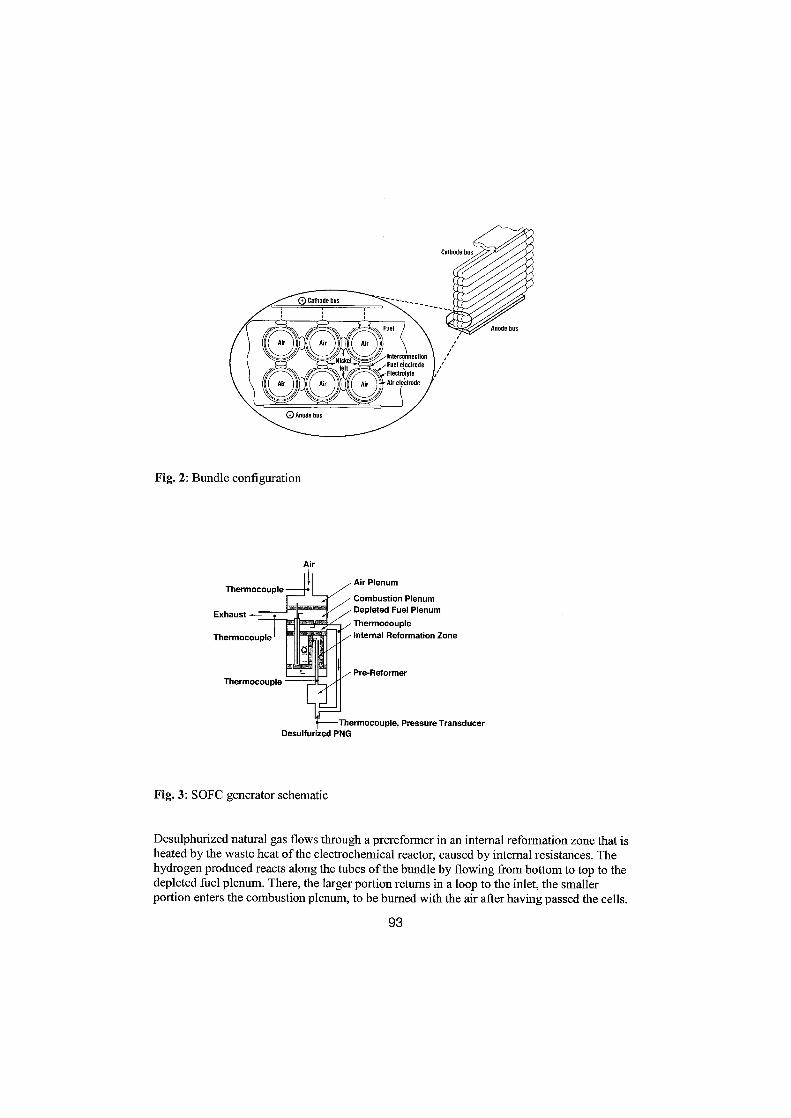
Fig . 2 : Bundle configuration
Air
Fig . 3 : SOFC generator schematic
Air Plenum
Combustion PlenumDepleted Fuel Plenum
ThermocoupleInternal Reformation Zone
Pre-Reformer
Thermocouple, Pressure TransducerDesulfurized PNG
Desulphurized natural gas flows through a prereformer in an intemal reformation zone that isheated by the waste heat ofthe electrochemical reactor, caused by intemal resistances . Thehydrogen produced reacts along the tubes ofthe bundle by flowing from bottom to top to thedepleted fuel plenum . There, the larger portion retums in a loop to the inlet, the smallerportion enters the combustion plenum, to be bumed with the air alter having passed the cells .
93
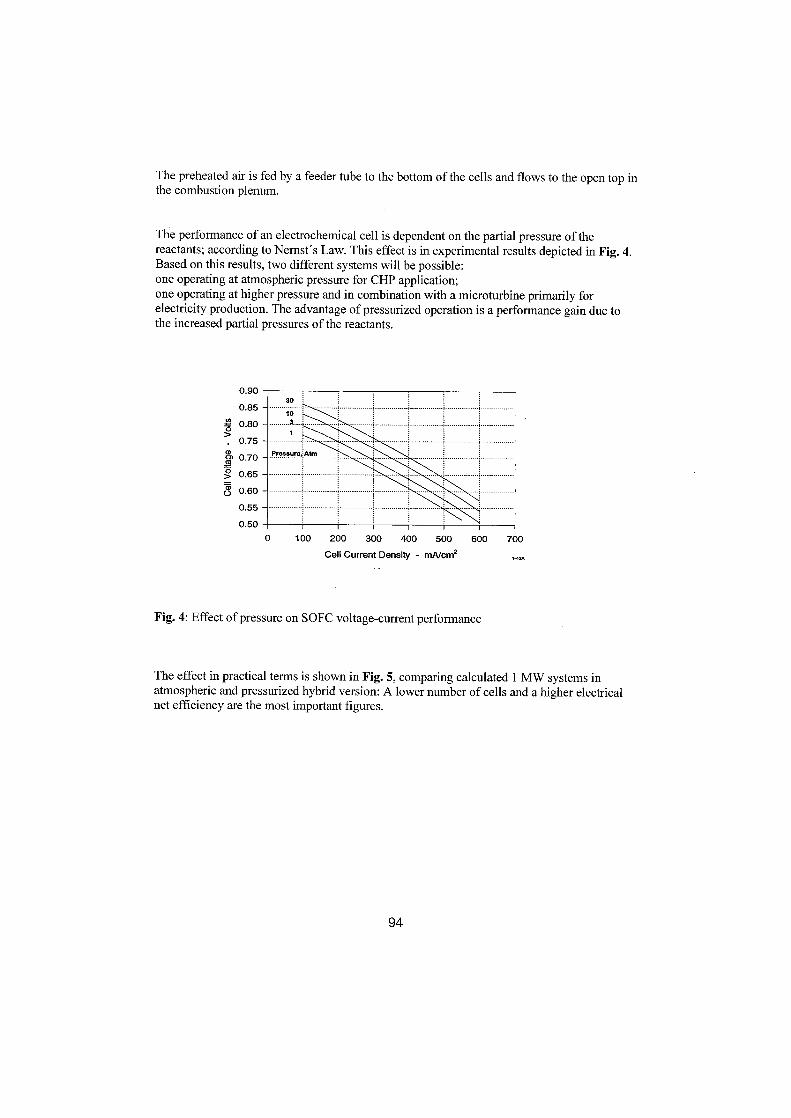
The preheated air is fed by a feeder tube to the bottom of the cells and flows to the open top inthe combnaion plenum .
The performance of an electrochemical cell is dependent an the partial pressure of thereactants ; according to Nernst's Law. This effect is in experimental results depicted in Fig. 4 .Based an this results, two different systems will be possible :one operating at atmospheric pressure for CHP application;one operating at higher pressure and in combination with a microturbine primarily forelectricity production . The advantage of pressurized operation is a performance gain due tothe increased partial pressures of the reactants .
O
Ö
dU
0.90
0 .85
0 .80
0 .75
0 .70
0 .65
0 .60
0 .55
0 .50
. .. .. . ... . .. .. .. . .. .. . . . .; .. . . . .. .. .. .. . ..
Pressure,;At.
---------------- ----------
----------- ----
0 100 200 300 400 500 600 700
Cell Current Density - mA/cm2
1-
Fig. 4 : Effect ofpressure an SOFC voltage-current performance
The effect in practical terms is shown in Fig . 5, comparing calculated 1 MW systems inatmospheric and pressurized hybrid version: A lower number ofcells and a higher electricalnet efficiency are the most important figures .
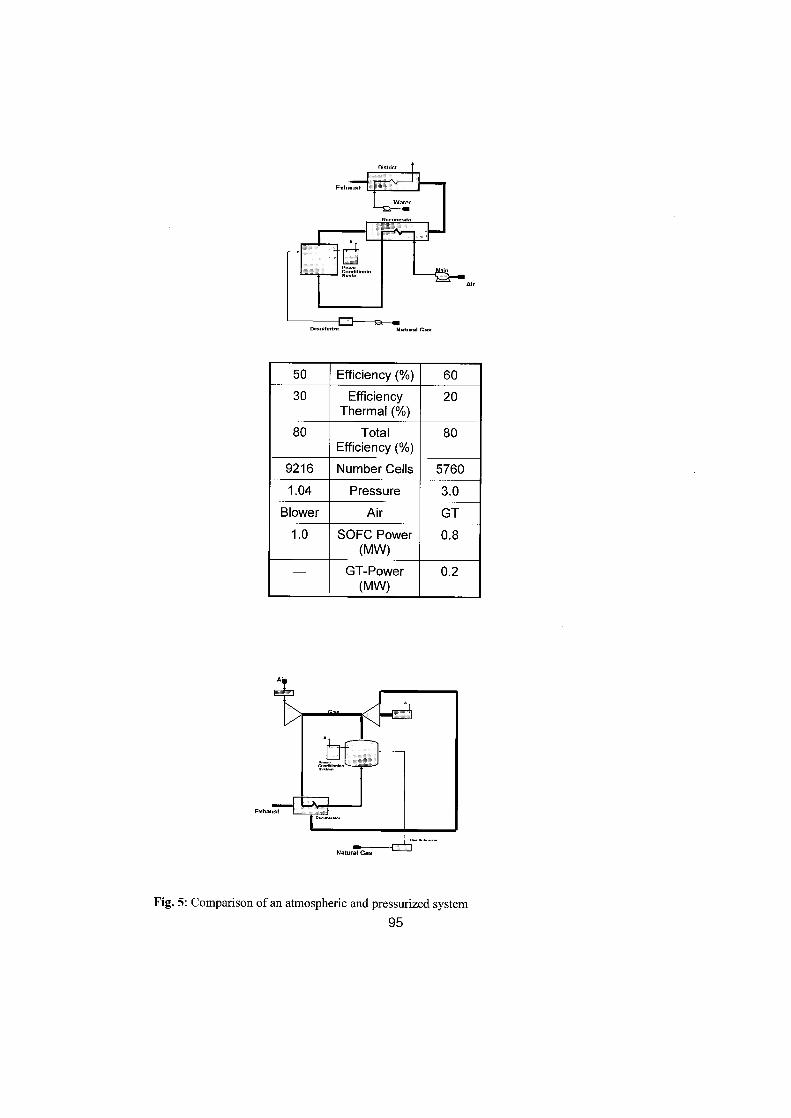
Natura1 as
o ..mrw .no
Nam.a i ra~
Fig . 5 : Comparison of an atmospherie and pressurized system95
50 Efficiency (%) 6030 Efficiency
Thermal (%)20
80 TotalEfficiency (%)
80
9216 Number Cells 57601 .04 Pressure 3.0
Blower Air GT1 .0 SOFC Power
(MW)0.8
- GT-Power(MW)
0.2
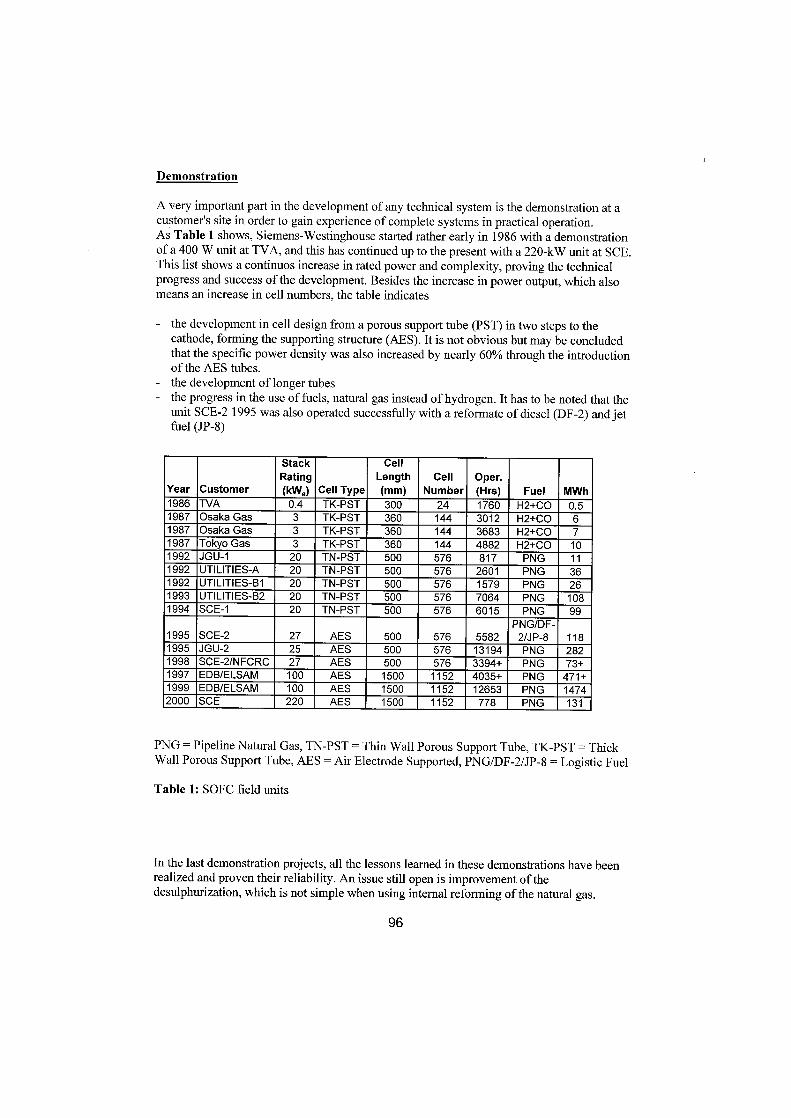
Demonstration
A very important part in the development ofany technical System is the demonstration at acustomer's site in order to gain experience of complete systems in practical operation.As Table 1 Shows, Siemens-Westinghouse started rather early in 1986 with a demonstrationof a 400 W unit at TVA, and this has continuod up to the present with a 220-kW unit at SCE .This list Shows a continuos increase in rated power and complexity, proving the technicalprogress and success of the development . Besides the increase in power output, which alsomeans an increase in cell numbers, the table indicates
the development in cell design from a porous support tube (PST) in two steps to thecathode, forming the supporting structure (AES) . It is not obvious but may be concludedthat the specific power density was also increased by nearly 60% through the introductionofthe AES tubes .the development of longer tubesthe progress in the use of fuels, natural gas instead ofhydrogen. It has to be noted that theunit SCE-2 1995 was also operated successfully with a reformate ofdiesel (DF-2) and jetfuel (JP-8)
PNG = Pipeline Natural Gas, TN-PST = Thin Wall Porous Support Tube, TK-PST = ThickWall Porous Support Tube, AES = Air Electrode Supported, PNG/DF-2/JP-8 = Logistic Fuel
Table 1 : SOFC field units
In the last demonstration projects, all the lessons leamed in these demonstrations have beenrealized and proven their reliability . An issue still open is improvement of thedesulphurization, which is not simple when using intemal reforming of the natural gas .
96
Year Customer
StackRating(kW.) Cell Type
CellLength(mm)
CellNumber
Oper .(Hrs) Fuel MM
1986 TVA 0.4 TK-PST 300 24 1760 H2+CO 0.51987 Osaka Gas 3 TK-PST 360 144 3012 H2+CO 61987 Osaka Gas 3 TK-PST 360 144 3683 H2+CO 71987 Tokyo Gas 3 TK-PST 360 144 4882 H2+CO 101992 JGU-1 20 TN-PST 500 576 817 PNG 111992 UTILITIES-A 20 TN-PST 500 576 2601 PNG 361992 UTILITIES-B1 20 TN-PST 500 576 1579 PNG 261993 UTILITIES-B2 20 TN-PST 500 576 7064 PNG 1081994 SCE-1 20 TN-PST 500 576 6015 PNG 99
1995 SCE-2 27 AES 500 576 5582PNG/DF-2/JP-8 118
1995 JGU-2 25 AES 500 576 13194 PNG 2821998 SCE-2/NFCRC 27 AES 500 576 3394+ PNG 73+1997 EDB/ELSAM 100 AES 1500 152 4035+ PNG 471+1999 EDB/ELSAM 100 AES 1500 1152 12653 PNG 14742000 SCE 220 AES 1500 1152 778 PNG 131

Customer requirements and Results
To gain customer acceptance and to have a chance of achieving market success, it is aprecondition that the product fulfills customer requirements .In the power generation business, these are :
1) High efficiency2) Long-term stability
For fuel cells as electrochemical devices this is a critical issue but very important in powergeneration .At present, the requirement is at least 40,000 hrs of operation with, for example, a 10reduction in power output, due to degradation . It is evident that this is only valid for thedemonstration phase ; the commercial product must exceed that .
3) Temperature cycling stability4) Unattended operation5) Part load at high efficiency6) Low emissions
In the laboratory tests and demonstrations the following results were achieved with respect tothese requirements :
1) The 100-kW demonstration unit (CHP 100) for the Dutch/Danish utility consortium(EDB/ELSAM), which was moved to RWE in Germany after the successful completionofthe test, operated at 46% net electrical efficiency for nearly 20,000 hrs (see Fig. 6) .
Fig. 6 : Operating history 100 kW unit build 2
4000 5000 6000 700 8000 90Ub Y0000 tt000 11000 7300071ME(HOUn hom 04-Match-1999)
97
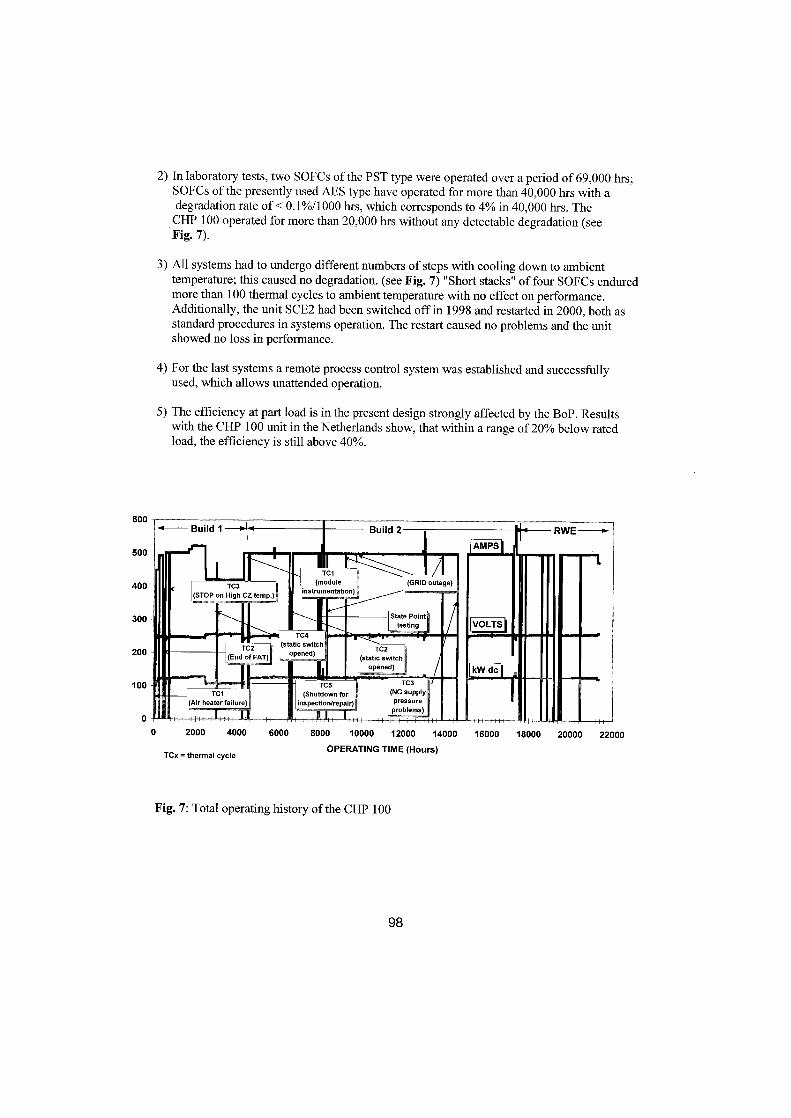
2) In laboratory tests, two SOFCs of the PST type were operated over a period of 69,000 hrs ;SOFCs ofthe presently used AES type have operated for more than 40,000 hrs with adegradation rate of < 0.1%/1000 hrs, which corresponds to 4% in 40,000 hrs . TheCHP 100 operated for more than 20,000 hrs without any detectable degradation (seeFig . 7) .
3) All systems had to undergo different numbers of steps with cooling down to ambienttemperature ; this caused no degradation. (see Fig. 7) "Short stacks" offour SOFCs enduredmore than 100 thermal cycles to ambient temperature with no effect an performance .Additionally, the unit SCE2 had been switched offin 1998 and restarted in 2000, both asstandard procedures in systems operation . The restart caused no problems and the unitshowed no loss in performance .
4) For the last systems a remote process control system was established and successfullyused, which allows unattended operation.
5) The efficiency at part load is in the present design strongly affected by the BoP. Resultswith the CHP 100 unit in the Netherlands show, that within a range of20% below ratedload, the efficiency is still above 40%.
2000 4000 6000 8000 10000 12000 14000 16000 18000 20000 22000
TCx = thermal cycleOPERATING TIME (Hours)
Fig . 7 : Total operating history ofthe CHP 100
98
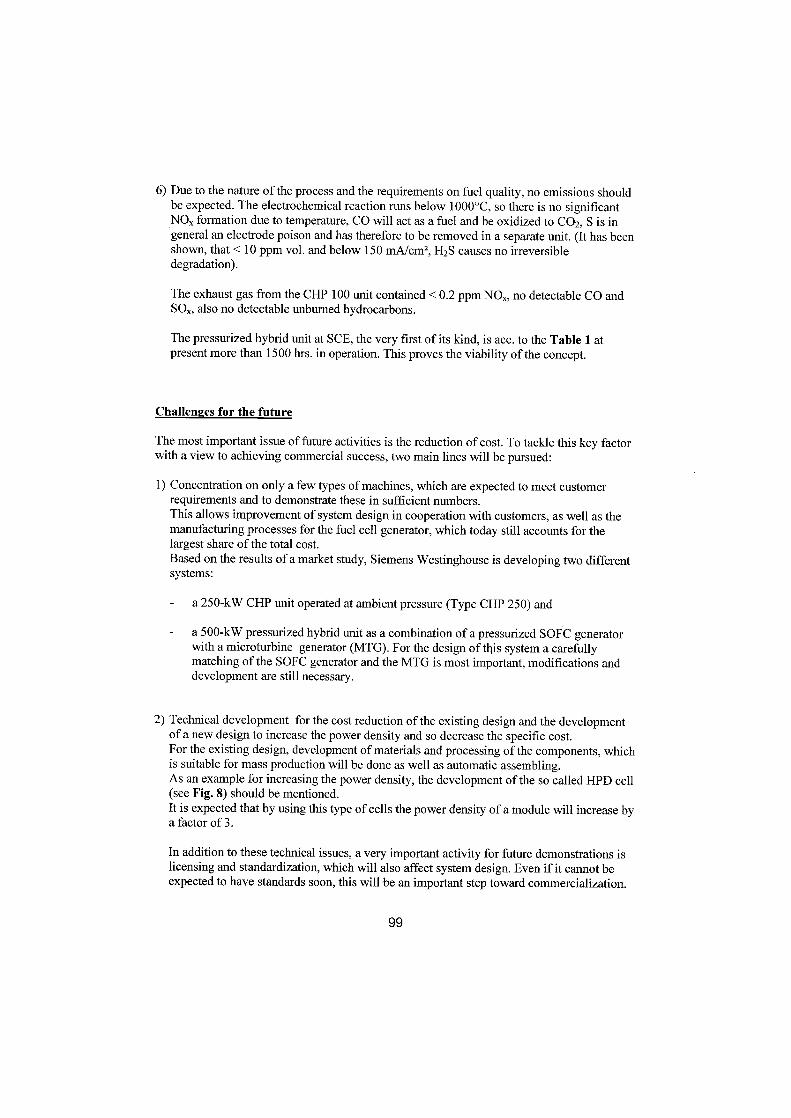
6) Due to the nature of the process and the requirements an fuel quality, no emissions shouldbe expected. The electrochemical reaction runs below 1000°C, so there is no significantNOx formation due to temperature, CO will act as a fuel and be oxidized to C02, S is ingeneral an electrode poison and has therefore to be removed in a separate unit. (It has beenshown, that < 10 ppm vol . and below 150 mA/cm2 , H2S causes no irreversibledegradation) .
The exhaust gas from the CHP 100 unit contained < 0.2 ppm NOx, no detectable CO andSOx , also no detectable unbumed hydrocarbons .
The pressurized hybrid unit at SCE, the very ferst of its kind, is acc . to the Table 1 atpresent more than 1500 hrs . in operation. This proves the viability ofthe concept .
Challenges for the future
The most important issue of future activities is the reduction of cost . To tackle this key factorwith a view to achieving commercial success, two main lines will be pursued :
1) Concentration an only a few types of machines, which are expected to meet customerrequirements and to demonstrate these in sufficient numbers.This allows improvement of system design in cooperation with customers, as well as themanufacturing processes for the fuel cell generator, which today still accounts for thelargest share ofthe total cost .Based an the results ofa market study, Siemens Westinghouse is developing two differentsystems :
a 250-kW CHP unit operated at ambient pressure (Type CHP 250) and
a 500-kW pressurized hybrid unit as a combination of a pressurized SOFC generatorwith a microturbine generator (MTG) . For the design of tltis system a carefullymatching ofthe SOFC generator and the MTG is most important, modifications anddevelopment are still necessary .
2) Technical development for the cost reduction ofthe existing design and the developmentofa new design to increase the power density and so decrease the specific cost.For the existing design, development ofmaterials and processing ofthe components, whichis suitable for mass production will be done as well as automatic assembling .As an example for increasing the power density, the development ofthe so called HPD cell(see Fig . 8) should be mentioned .It is expected that by using this type ofcells the power density ofa module will increase bya factor of3 .
In addition to these technical issues, a very important activity for future demonstrations islicensing and standardization, which will also affect system design. Even if it cannot beexpected to have standards soon, this will be an important step toward commercialization .
99
Summary
Acknowledgement
Fig. 8 : High power density SOFC
The results reported indicate that the technical goals will most probably be achieved .Commercial tubular SOFC modules could be expected to have operating lives of between fiveand ten years . The efficiency ofpressurized systems in combination with microturbines isexpected to reach 57% or even higher, as an analysis shows for systems with capacities ofafew MW.
The most challenging issue for the future is the reduction ofcost to a level, at which theenergy cost will be competitive with those of convential systems . To meet that target, there isa well defined strategy, which should make it possible to introduce precommercial systemsinto the market in 2004 and Commercial systems in 2007/8 .
The development of tubular SOFC technology is supported by the United States DepartmentofEnergy under a cooperative development agreement, technical development is co-fundedby the German Ministry ofEconomic Affairs . Other support is provided by our partners in thedemonstration.The support of the collegues of SWPC SFC is highly appreciated .
100
Literature
Proceedings of the Fuel Cell Seminar 2000Field Test ofthe EDB/ELSAM 100kWe SOFC in the NetherlandsH. Verbeek, EnergieNed, Amhem, The Netherlands, L . Laekedahl,ELSAMPROJEKT, Fredericia, DENMARK
Krumbeck, Kloidt, Landes, Schamm, Schiffer:"Einsatz von Hochtemperatur-Brennstoffzellen (SOFC) mit Braunkohlegas"10 . DVV-Kolloquium 26.09.1996, Zürich
Hassmann, K.SOFC Power Plants, The Siemens Westinghouse Approach Fuel Cells 2001, 1, Nr. 1
Hassmann, K. ; Heidug, W.K . ; Veyo, S .Die festkeramische Hochtemperatur-Brennstoffzelle, BWK 51 (1999), Nr . 11/12

102

1 . Introduction
Planar SOFC Designs and Processing Methods
Hans Peter BuchkremerResearch Centre Jülich
Institute for Materials and Processes in Energy SystemsInstitute 1 Materials Synthesis and Processing
52425 JülichGermany
As direct converters of chemical to electrical energy and because of their high efficiency,fuel cells are of special significance in the energy sector. Particularly in the case of high-temperature solid oxide fuel cells (SOFCs), not only electrical energy but also heat isproduced at a high temperature level (800 to 1000°C) . This heat can be used in a varietyof ways and plays a not inconsiderable part in determining the design of the fuel cellsystem, i .e . ultimately the overall efficiency of the total energy chain has to be optimizedunder the boundary conditions of the most economic and emission-free operating mode . Ingeneral it can be said of all fuel cells that the system design is determined by theapplication in question and the boundary conditions or requirements .
The basic principles of energy conversion plants with planar fuel cells will be brieflydescribed and their special features explained . The development process is currently atsuch an early stage that no design nor processing method has become standard . Everyvariant has specific advantages and may therefore be particularly suitable for certainmarkets . The general opinion is that the product will find increasing acceptance in the nextfive to ten years and that a significance market penetration will only take place after 2010.
2 . Planar Cell Design and Processing
SOFC designs are largely differentiated according to the cell geometry, i .e . tubular andplanar. The tubular cell geometry is the oldest SOFC design .
Figure 1 gives an overview of important companies and institutions that have developed orstill are developing planar and/or tubular SOFC concepts . In recent years, smallcompanies have become increasingly involved in this process, which are, however, notincluded in this overview .
103
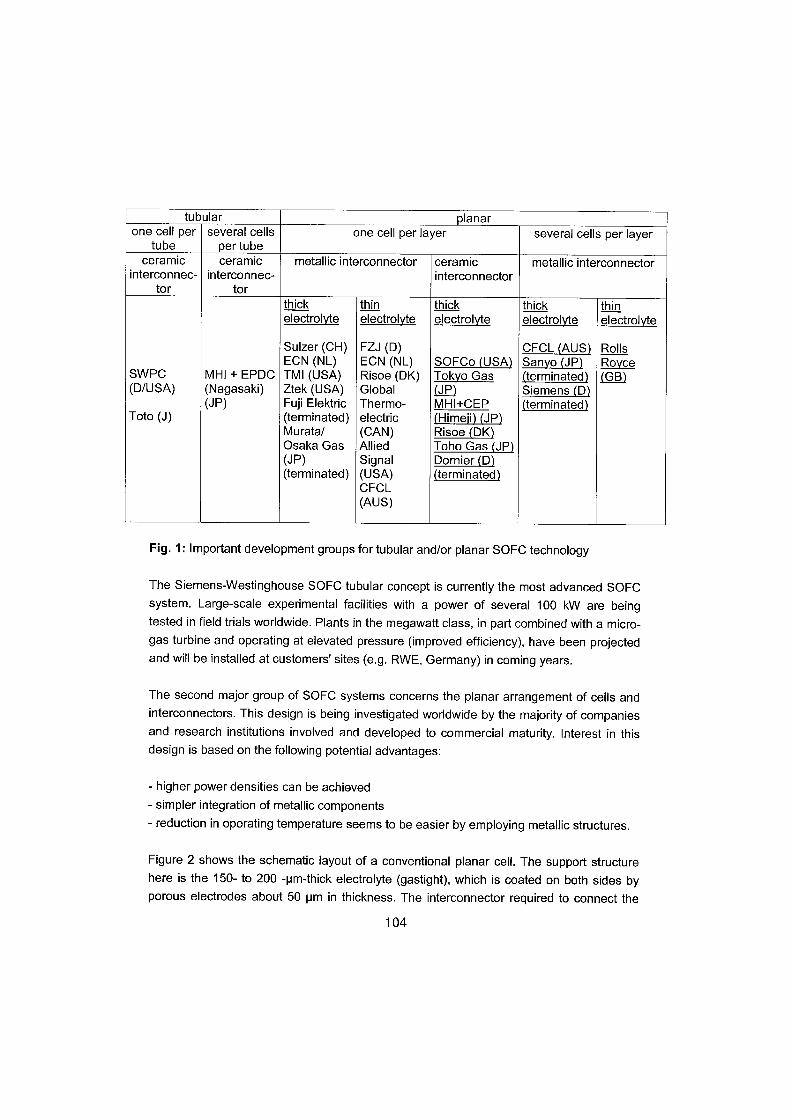
Fig. 1 : Important development groups for tubular and/or planar SOFC technology
The Siemens-Westinghouse SOFC tubular concept is currently the most advanced SOFCsystem . Large-scale experimental facilities with a power of several 100 kW are beingtested in field trials worldwide. Plants in the megawatt class, in part combined with a micro-gas turbine and operating at elevated pressure (improved efficiency), have been projectedand will be installed at customers' sites (e .g . RWE, Germany) in coming years.
The second major group of SOFC systems concerns the planar arrangement of cells andinterconnectors . This design is being investigated worldwide by the majority of companiesand research institutions involved and developed to commercial maturity. Interest in thisdesign is based an the following potential advantages :
- higher power densities can be achieved- simpler integration of metallic components- reduction in operating temperature seems to be easier by employing metallic structures .
Figure 2 shows the schematic layout of a conventional planar cell . The support structurehere is the 150- to 200 -pm-thick electrolyte (gastight), which is coated an both sides byporous electrodes about 50 pm in thickness. The interconnector required to connect the
104
tubular lanarone cell per
tubeseveral cellsper tube
one cell per layer several cells per layer
ceramic ceramic metallic interconnector ceramic metallic interconnectorinterconnec- interconnec- interconnector
tor torthick thin thick thick thinelectrol e electrol e electrolyte electrol e electrol tue
Sulzer (CH) FZJ (D) CFCL (AUS) RollsECN (NL) ECN (NL) SOFCo (USA) Sanyo (JP) Royce
SWPC MHI + EPDC TMI (USA) Risoe (DK) Tokyo Gas (terminated) GAB)(D/USA) (Nagasaki) Ztek (USA) Global (JP) Siemens (D)
(JP) Fuji Elektric Thermo- MHI+CEP (terminated)Toto (J) (terminated) electric (Himeii) (JP)
Murata/ (CAN) Risoe (DK)Osaka Gas Allied Toho Gas (JP)(J P) Signal Dornier (D)(terminated) (USA) (terminated)
CFCL(AUS)
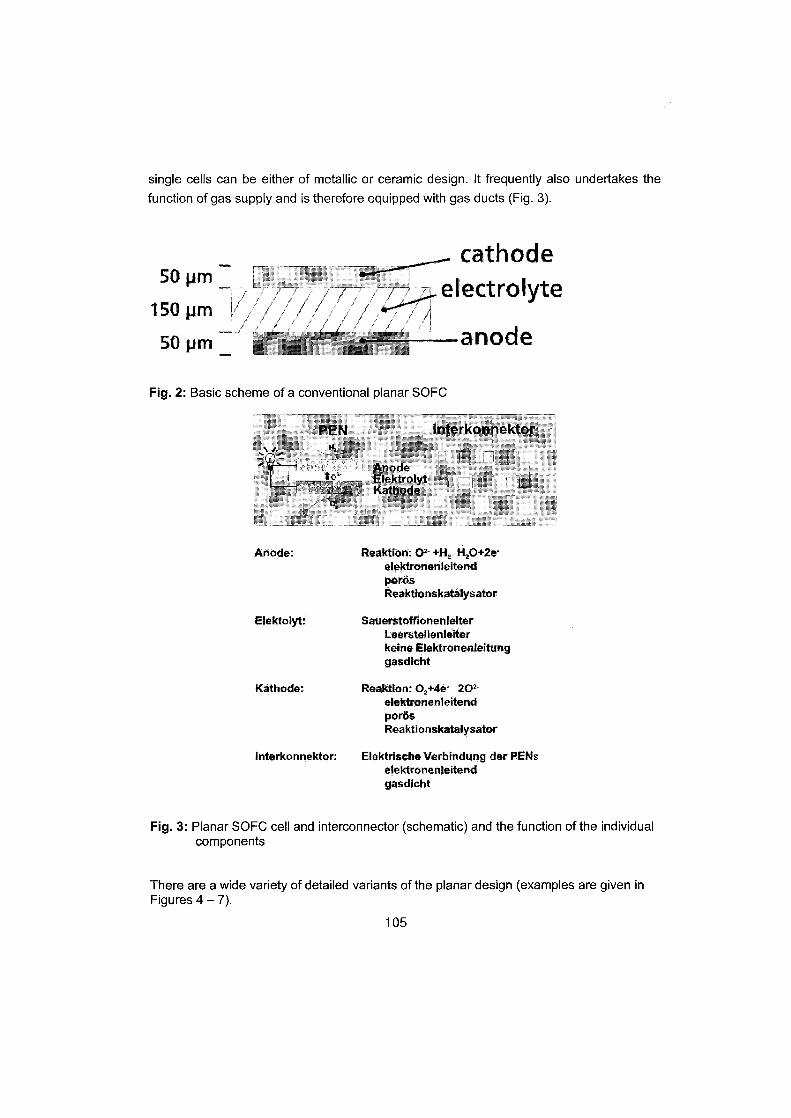
single cells can be either of metallic or ceramic design . l t frequently also undertakes the
function of gas supply and is therefore equipped with gas ducts (Fig . 3) .
Fig. 2 : Basic scheme of a conventional planar SOFC
öde,
Kathode:
Reaktion : 0,4.4e -
202-elektronenleitendporösReaktionskatalysator
onnektor :
lnterkonnektor
Reaktion : 0'-+HZ H2O+2e-elektronenteitendporösReaktionskatalysator
SauerstoffionenleiterLeerstellenleiterkeine Etektronenteitunggasdicht
Elektrische Verbindung der PE selektronenleitendgasdicht
Fig. 3: Planar SOFC cell and interconnector (schematic) and the function of the individualcomponents
There are a wide variety of detailed variants of the planar design (examples are given inFigures 4 - 7) .
105
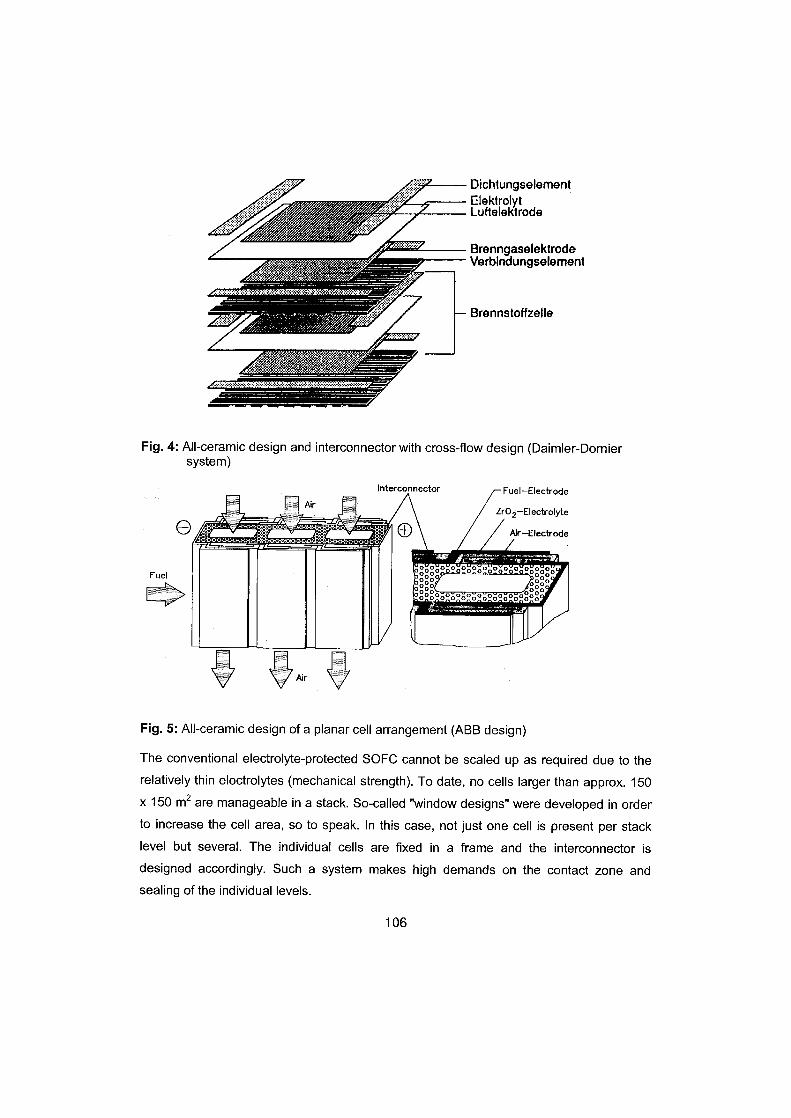
Interconnector
106
ElektrolytLuftelektrode
BrenngaselektrodeVerbindungselement
Fig . 4 : All-ceramic design and interconnector with cross-flow design (Daimler-Dorniersystem)
Fig . 5 : All-ceramic design of a planar cell arrangement (ABB design)
Fuel-Electrode
Zr02Electrolyte
Air-Electrode
The conventional electrolyte-protected SOFC cannot be scaled up as required due to therelatively thin electrolytes (mechanical strength) . To date, no cells larger than approx. 150x 150 m2 are manageable in a stack . So-called "window designs" were developed in orderto increase the cell area, so to speak . In this case, not just one cell is present per stacklevel but several . The individual cells are fixed in a frame and the interconnector isdesigned accordingly . Such a system makes high demands an the contact zone andsealing of the individual levels .
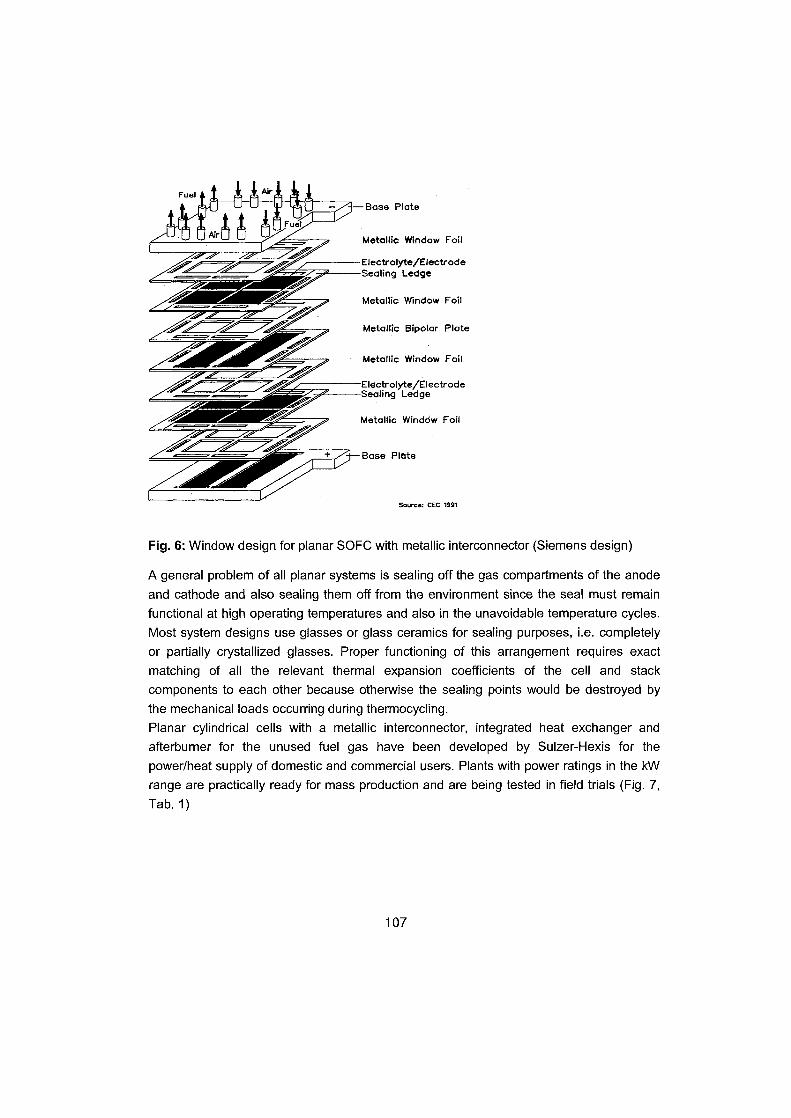
Metallic Window Foil
Electrolyte/ElectrodeSealing Ledge
Electrolyte/ElectrodeSealing Ledge
Fig . 6 . Window design for planar SOFC with metallic interconnector (Siemens design)
A general problem of all planar systems is sealing off the gas compartments of the anodeand cathode and also sealing them off from the environment since the seal must remainfunctional at high operating temperatures and also in the unavoidable temperature cycles .Most system designs use glasses or glass ceramics for sealing purposes, i .e . completelyor partially crystallized glasses . Proper functioning of this arrangement requires exactmatching of all the relevant thermal expansion coefficients of the cell and stackcomponents to each other because otherwise the sealing points would be destroyed bythe mechanical loads occurring during thermocycling .Planar cylindrical cells with a metallic interconnector, integrated heat exchanger andafterburner for the unused fuel gas have been developed by Sulzer-Hexis for thepower/heat supply of domestic and commercial users . Plants with power ratings in the kWrange are practically ready for mass production and are being tested in field trials (Fig . 7,Tab . 1)
107
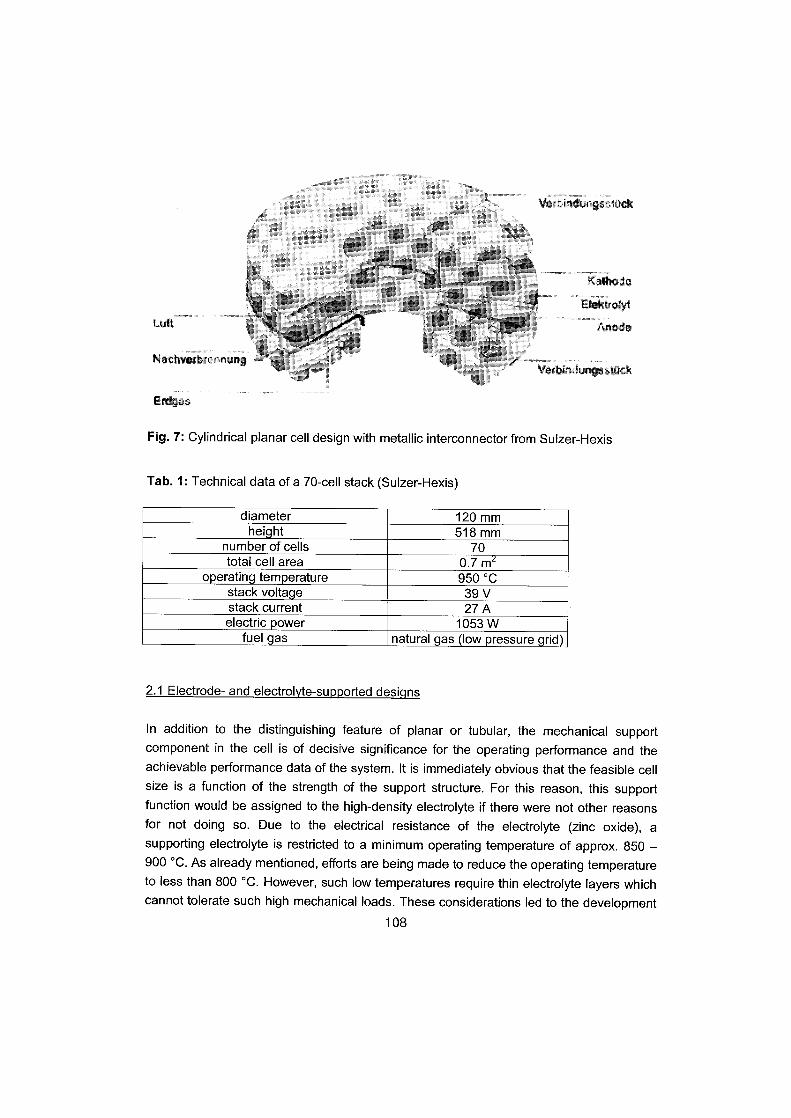
L~ üt
C ..,,e�r, ;t rr,
Fig . 7 : Cylindrical planar cell design with metallic interconnector from Sulzer-Hexis
Tab . 1 : Technical data of a 70-cell stack (Sulzer-Hexis)
2.1 Electrode- and electrolyte-supported desiqns
In addition to the distinguishing feature of planar or tubular, the mechanical supportcomponent in the cell is of decisive significance for the operating performance and theachievable performance data of the system . It is immediately obvious that the feasible cellsize is a function of the strength of the support structure . For this reason, this supportfunction would be assigned to the high-density electrolyte if there were not other reasonsfor not doing so . Due to the electrical resistance of the electrolyte (zinc oxide), asupporting electrolyte is restricted to a minimum operating temperature of approx . 850 -900 °C . As already mentioned, efforts are being made to reduce the operating temperatureto less than 800 °C. However, such low temperatures require thin eiectrolyte layers whichcannot tolerate such high mechanical loads . These considerations led to the development
108
diameter 120 mmhei ht 518 mm
number of cells 70total cell area 0.7 m
o eratin tem erature 950 °Cstack volta e 39 Vstack current 27Aelectric ower 1053 W
fuel gas natural
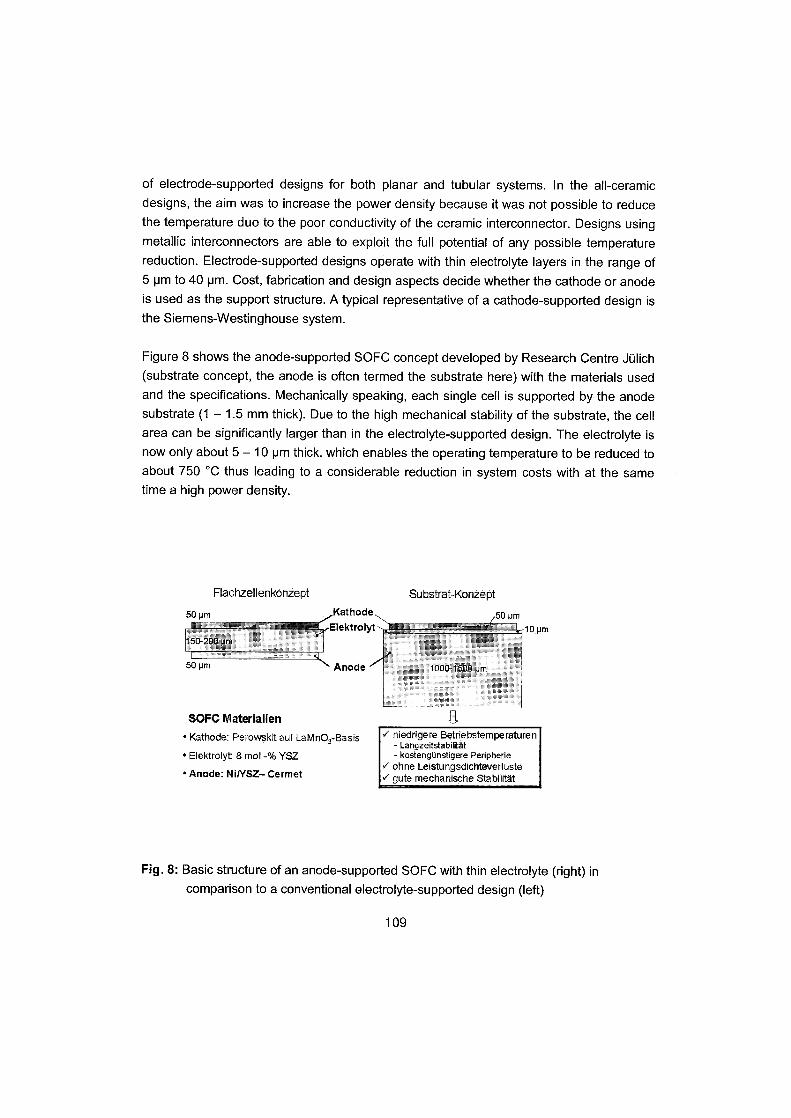
of electrode-supported designs for both planar and tubular systems . In the all-ceramicdesigns, the aim was to increase the Power density because it was not possible to reducethe temperature due to the poor conductivity of the ceramic interconnector . Designs usingmetallic interconnectors are able to exploit the full potential of any possible temperaturereduction . Electrode-supported designs operate with thin electrolyte layers in the range of5 um to 40 Nm. Cost, fabrication and design aspects decide whether the cathode or anodeis used as the support structure . A typical representative of a cathode-supported design isthe Siemens-Westinghouse system .
Figure 8 shows the anode-supported SOFC concept developed by Research Centre Jülich(substrate concept, the anode is often termed the substrate here) with the materials usedand the specifications . Mechanically speaking, each single cell is supported by the anodesubstrate (1 - 1 .5 mm thick) . Due to the high mechanical stability of the substrate, the cellarea can be significantly larger than in the electrolyte-supported design . The electrolyte isnow only about 5 - 10 pm thick, which enables the operating temperature to be reduced toabout 750 °C thus leading to a considerable reduction in system costs with at the sametime a high Power density.
50 prn
150-200 Fim
50 Nm
Flachzellenkonzept
Substrat-Konzept�Kathode,Elektrolyt-
Anode
SOFC Materialien*Kathode: Perowskitauf LaMn03-Basis" Elektrolyt ß mol:% YSZ
*Anode : NUYSZ-Cermet
,50 um10 um
niedrigere Betriebstemperaturen- Langzeitstabil kät- kostengünstigere Peripherie
+~ ohne Leistungsdichteveriuste~' gute mechanische Stabilität
Fig . 8 : Basic structure of an anode-supported SOFC with thin electrolyte (right) incomparison to a conventional electrolyte-supported design (left)
109
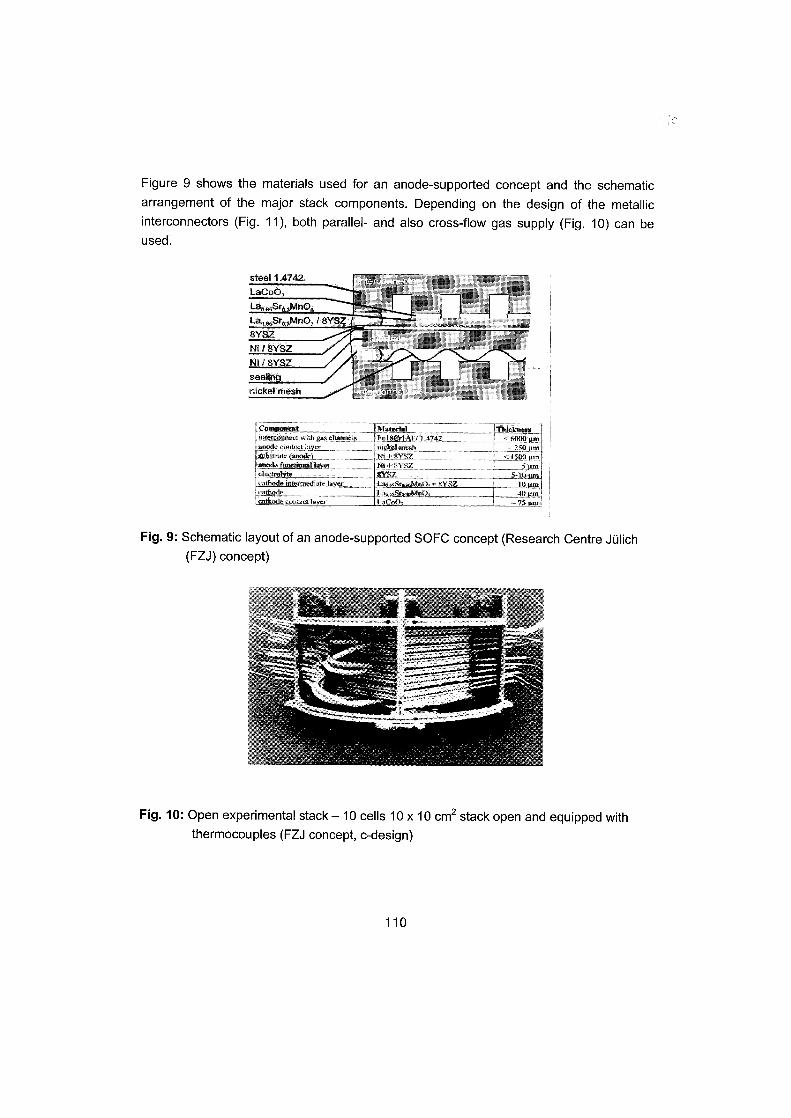
Figure 9 shows the materials used for an anode-supported concept and the schematicarrangement of the major stack components. Depending an the design of the metallicinterconnectors (Fig . 11), both parallel- and also cross-flow gas supply (Fig . 10) can beused .
ei 1 .4742LaCoC,
rs:S~aPno,18vSZ
8YSZNI 18YSZNi / SYSZsea1in
el mesh
Fig . 9 : Schematic layout of an anode-supported SOFC concept (Research Centre Jülich(FZJ) concept)
Fig . 10 : Open experimental stack - 10 cells 10 x 10 cm2 stack open and equipped withthermocouples (FZJ concept, c-design)
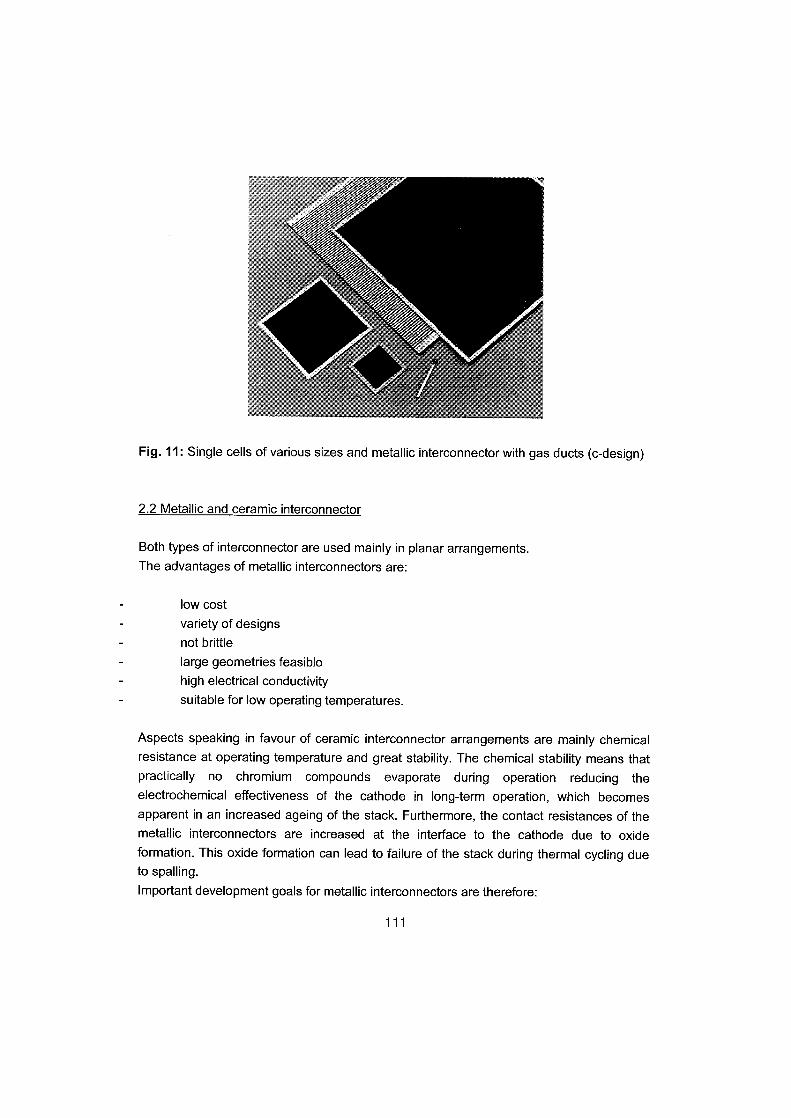
2.2 Metallic and ceramic interconnector
Fig . 11 : Single cells of various sizes and metallic interconnector with gas ducts (c-design)
Both types of interconnector are used mainly in planar arrangements .The advantages of metallic interconnectors are :
low costvariety of designsnot brittlelarge geometries feasiblehigh electrical conductivitysuitable for low operating temperatures .
Aspects speaking in favour of ceramic interconnector arrangements are mainly chemicalresistance at operating temperature and great stability . The chemical stability means thatpractically no chromium compounds evaporate during operation reducing theelectrochemical effectiveness of the cathode in long-term operation, which becomesapparent in an increased ageing of the stack . Furthermore, the contact resistances of themetallic interconnectors are increased at the interface to the cathode due to oxideformation . This oxide formation can lead to failure of the stack during thermal cycling dueto spalling .Important development goals for metallic interconnectors are therefore :

slow growth of oxide layers an the surfaceavoidance of insulating surface layers (e.g . no A1203 formers)thermal expansion behaviour adapted to the cellsavoidance of chromium evaporation .
These requirements can currently only be realized by the additional application of thinfunctional layers . By way of summary, it can be said that metallic interconnectors have thepotential for stable, long-term stack operation at low temperatures . However, this still hasto be demonstrated in practical application . This proof has already been demonstrated forceramic interconnectors, but the latter are not suitable for temperatures significantly below900 °C (electronic conductivity) .
2.3 External and internal gas distribution
The type of gas distribution (manifolding) to supply the cell plays a decisive role in thechoice of design . One speaks of external gas distribution in a stack if the cells are suppliedexternally from a gas diffusor . Gas collection is performed in a corresponding manner (Fig .12,13) .
Fig. 12 : 10-cell SOFC stack with external manifolding and cross flow (schematic diagram)

Fig . 13 : Modular design (8 stacks of 40 cells each, all-ceramic, 2 kW) with externalmanifolding and cross flow (source : Dornier)
Fig . 14 : Interconnectors for an anode-supported SOFC stack with internal gas distributionfor 10 x 10 CMZ cells and parallel flow arrangement (FZJ design)
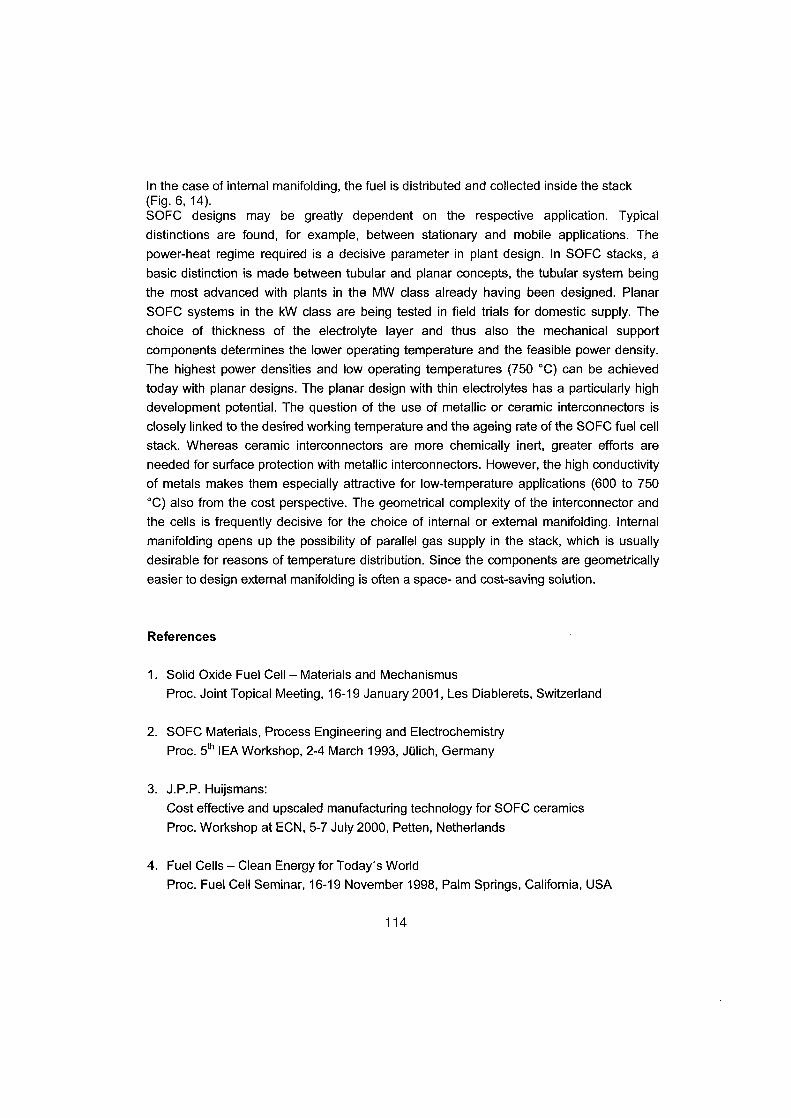
In the case of internal manifolding, the fuel is distributed and collected inside the stack(Fig . 6, 14) .SOFC designs may be greatly dependent an the respective application . Typicaldistinctions are found, for example, between stationary and mobile applications . Thepower-heat regime required is a decisive parameter in plant design . In SOFC stacks, abasic distinction is made between tubular and planar concepts, the tubular system beingthe most advanced with plants in the MW class already having been designed . PlanarSOFC systems in the kW class are being tested in field trials for domestic supply . Thechoice of thickness of the electrolyte layer and thus also the mechanical supportcomponents determines the lower operating temperature and the feasible power density .The highest power densities and low operating temperatures (750 °C) can be achievedtoday with planar designs . The planar design with thin electrolytes has a particularly highdevelopment potential . The question of the use of metallic or ceramic interconnectors isclosely linked to the desired working temperature and the ageing rate of the SOFC fuel cellstack . Whereas ceramic interconnectors are more chemically inert, greater efforts areneeded for surface protection with metallic interconnectors . However, the high conductivityof metals makes them especially attractive for low-temperature applications (600 to 750°C) also from the cost perspective . The geometrical complexity of the interconnector andthe cells is frequently decisive for the choice of internal or external manifolding . Internalmanifolding opens up the possibility of parallel gas supply in the stack, which is usuallydesirable for reasons of temperature distribution . Since the components are geometricafyeasier to design external manifolding is often a space- and cost-saving solution .
References
1 . Solid Oxide Fuel Cell - Materials and MechanismusProc. Joint Topical Meeting, 16-19 January 2001, Les Diablerets, Switzerland
2. SOFC Materials, Process Engineering and ElectrochemistryProc. 5 th IEA Workshop, 2-4 March 1993, Jülich, Germany
3. J.P .P . Huijsmans :Cost effective and upscaled manufacturing technology for SOFC ceramicsProc . Workshop at ECN, 5-7 July 2000, Petten, Netherlands
4 . Fuel Cells - Clean Energy for Today"s WorldProc . Fuel Cell Seminar, 16-19 November 1998, Palm Springs, California, USA

5 . First European Solid Oxide Fuel Cell Forum, 3-7 October 1994, Lucerne, Switzerland
6. Abschlußbericht CERAPOWER PHASE 3, BMBF Project No . 413-4003-0329696,Friedrichshafen, 1997
7 . U . G . BosselFACTS & FIGURESFinal Report an SOFC Data . IEA - Programme of R, D&D an Advanced Fuel Cells .Annex II : Modelling & Evaluation of Advanced SOFC.Swiss Federal Office of Energy, Operating Agent Task II, Bern, April 1992

Abstract
K EL Menshawy' , H.P. Buchkremer2 , D. Stoever2
Among the various solid oxide fuel cell (SOFC) designs now under consideration,planar concepts are favoured for large scale systems. In this configuration the ceramicelectroactive cell elements consisting of anode, electrolyte and cathode are arranged betweenthe interconnector plates. In this design the interconnector plates act as an electricalconnection between the various cells, a mechanical support for the ceramic plates, provide thegas-proof separation of the gaseous fuel and oxidant and distribute them in counter flowdirections . These functions together with the operating temperature of the fuel cell play a keyrole in the selection of interconnector material . Formation of Cr 203 scale and mixed spineloxide after long-term operation of the SOFC is of prime concern regarding perfonnancedegradation . Developers of planar configuration SOFC system have suggested and evaluatedsome stainless steel alloys which may satisfy the requirements ofthe metallic interconnector.Some trends are considered to improve the performance of these alloys and efforts are madeto obtain improved knowledge and better understanding of the connector properties afterlong-term operation of the SOFC . This presentation deals with the function and requirementsofthe metallic interconnector as well as the developed alloys and possible modifications .
Introduction
INTERCONNECTOR MATERIALFOR SOLID OXIDE FUEL CELLS (SOFC)
l. Atomic Energy Authority, Cairo, Egypt2. IWV-1, Research Centre Juelich, Juelich, Germany
In the planar configuration solid oxide fuel cell the electroactive cell elements arearranged between two interconnector plates. So the interconnector plates in this design act as,
"
electrical connection between the various cells ."
mechanical support for the ceramic plates ."
gas proofseparation between fuel (HZ or natural gas) and oxidant (02 or air),and distribute them in counter flow directions .
Under operating conditions, the interconnector material is subjected to;"
high operating temperatures (800 - 950 °C) ."
oxidizing (cathode side) and reducing ( anode side) environments."
thermal stresses .
Material Requirements
Taking into consideration the above mentioned functions and operating conditions,the interconnector material should have;
"
microstructural and mechanical stability at the operatingtemperatures
"
chemical compatibility with the contacting cell elements ."
high electrical conductivity .

resistance against oxidizing and reducing environments .thermal expansion characteristics comparable to those ofthe other cellcomponents .
Evolution of Interconnector Materials
These requirements can be easily fulfilled to a great extent by a number of ceramicmaterials than by Commercially available metals and alloys. LaCr03 - based ceramcs dopedwith Sr, Ca er Mg may be chosen as interconnector material for high temperature SOFCs (z1000 °C) because of their sufficient electrical conductivity and high temperature stability [1] .This ceramic interconnector is mainly used with the all ceramic high temperature SOFC andis difficult to fabricate by conventional routes . The use of metallic interconnector rather thanthe LaCr03 -based ceramic material offers the following advantages
"
high electrical conductivity"
high ductility"
better workability"
high heat conductivity
From the view point of oxidation resistance both A1203 and Cr203-forming alloysare candidate materials for SOFC interconnetor applications [2] . However, Cr 203- formingmaterials are more suitable since the A1203 layer formed at the operating temperatures of theSOFC (--950 °C) is an insulating material . Commercially available Cr203 - forming alloys (Fe-, Ni -, and Co - base) are suitable for this purpose, but their main drawback is their muchhigher thermal expansion coefficient compared to those of the other cell components .
It is important to mention here that pure Cr has suitable thermal expansioncoefficient but it has poor mechanical properties (poor ductility and toughness) which limit itsapplication as structural material . Some Cr203 - forming ODS alloys have been developedwhich have better mechanical properties than pure Cr; (Cr - 5 Fe - 1 Y203 , Ni - 20 Cr- 0.5Y203, Fe - 20 Cr-4 .5A1 /ly203). Much attention has been paid to the alloy Cr - 5Fe- ly203.This alloy showed;
"
high temperature tensile properties"
high temperature creep strength"
low thermal expansion coeffcient
One ofthe main factors which should be considered in using Cr203 - forming alloysfor SOFC interconnector applications is the evaporation of volatile Cr- bearing species [2]specially at the cathode side . In dry air Cr03 is formed, while in wet air CrOxihydroxide[CrO 2(OH)2] is formed . These volatile Cr- bearing species can deteriorate thefunction of the SOFC in two ways;
(One) during operation of the SOFC these species can be reduced to solid Cr203 andthis leads to inhibition ofthe 02 reduction reaction required for cell operation.
(Two) the volatile species react with LaMn03- base cathode forming spinel oxide ofthe form MnCr204
To reduce the evaporation process LaCr03 _ based coating layer can be applied over theinterconnector surface (the partial pressure of Cr- bearing species over LaCr03 - basedcoating is much lower than over Cr203 scale) .
Current Status of the Interconnector Material
Efforts are being made to decrease the operating temperature of the SOFC (fromaround 1000 °C to about 800 °C) and at the same time keeping the power density and
durability at the same level as at high operating temperature . Of course, the lower theoperating temperature, the less severe are the requirements ofoxidation resistance .
Commercially available high Cr ferritic steels do not possess the required physical,mechanical and chemical properties required for the interconnector material [3] . To fulfilthese requirements, the steel composition should be carefully selected ;
"
theCr content should be above 22% [4] with some minor additions ofMn, Si or Al
"
decreased growth rate of Cr203 scale and good adherence can beobtained by minor additions of REE (La, Y, Hf).
"
enhanced electrical conductivity of the Cr203 scale formed can beachieved by suitable minor additions of alloying elements which lead todoping of chromia. In this regard, some information are available [5] inthe range of SOFC operating conditions (800 - 1000 °C and at nearatmospherec oxygen pressure) ;
(One) the presence of 0.5 wt % Y203 or La203 in Cr203 increased theelectrical conductivity about 5 - 10 times (Fig . 1,2)
(Two) the presence ofNi0 (up to 1%) significantly increased the electricalconductivity of Cr203 , (about 2 orders of magnitude) (Fig.3)
"
addition of elements that keep the thermal expansion coefficient verynear to that ofthe other cell components ; Mo, Wand Co decrease thethermal expansion coefficient of a - Fe [6-8] . In the case of Fe - Cr ferriticsteels Mo andWhave the saure effect but these is no available data an theeffect ofCo
Aseries of Fe-Cr based ferritic alloys have been developed taking into considerationthe basic requirements of the interconnector material. These alloys are nowbeing evaluated.Some results are available;
"X - ray diffraction pattems showed formation of Cr203 and (Mn,Cr)304 spinel oxide both under oxidizing and reducing environmentsafter 1000 hr operatinn at 800 °C. Ofcourse, the amounts ofoxides arehigher under oxidizing conditions ." Oxides ofminor alloying element additions were also detected.
A working programme has been initiated by the authors to obtain improvedknowledge and to have better understanding of the possible changes in the electricalconductivity of Cr203 and the spinel oxide formed an these alloys as a result of the presenceof some possible dopants arising from the contact with other cell components or from thesteel itself. In the framework of this programme Cr203 samples containing 2 and 5 moleTi02 and CuO were prepared . Also, different manganese oxides ; (Mn203, Mn304 and MnO)were added to chromia in certain amounts to realize nearly the saure chromium atomicfraction (about 65 .4) in the mixed oxide with different Mn-valency . The electricalconductivity of Cr203 containing Ti02 , Cu0, or different Mn-Oxides was measured inoxidizing and reducing atmospheres (simulating the operating conditions ofthe SOFC at thecathode and anode sides) in the 500 - 900 °C temperature range.
Preliminary results indicate that under oxidizing conditions (Fig. 4a) and above 750°Cthe presence of 5 mol % Ti02 in chromia increased its electrical conductivity while additionof 2 mol % Ti02 does not lead to significant changes. Below this temperature limit both Ti02additions decreased the electrical conductivity. Under reducing conditions the conductivitylevel ofCr203 is considerably shifted towards higher values (Fig. 4b), however, addition of5 mol % TiO2 showed a positive effect over the investigated temperature range. Chromiadoped with 2 mol %Ti02 exhibited much lower conductivity values .
Additions of Cu0 increased the electrical conductivity of Cr203 under oxidizingconditions . Figure 5 a Shows that Cr203 - 2 mol % Cu0 has 5 - fold greater conductivityvalues compared to pure Cr203 . The effect is smaller for Cr203 - 5 mol % Cu0. In thereducing atomsphere (Fig . 5b) the conductivity ofCr203 is shifted to higher values while thatof Cr203 - Cu0 system remained practically around its values under oxidizing conditionsgiving rise to negative effect of Cu0.
Different manganese oxides added to chromia decreased its electrical conductivity inoxidizing atmosphere (Fig . 6a) . The magnitude of this decrease was nearly the Same for thedifferent Mn-oxides and becomes more significant as the temperature is decreased. Theelectrical conductivity of pure Cr203 and Cr203 - Mn203 System is shifted to higher valuesunder reducing conditions (Fig . 6b), however, lower conductivity values were observed forCr203 - Mn203 compared to pure Cr 203 . The conductivity values of Cr203 - Mn304 andCr203 - MnO systems remained nearly at the same level as in oxidizing atmosphere . Thisimplies negative effect of Mn304 and MnO in the reducing atmosphere . More work is neededfor acceptable interpretation of these results . Also, the behavior of temary systems based anCr203 must be investigated .
References
[1] L. A. Chick, T. R. Armstrong, D. E. McCready, G. W. Coffey, G. D. Manupin and J. L.Bates, Proceed. of the 3rd Inter . Symp . an Solid Oxide Fuel Cells (The Electrochem.Soc. Pennington , NJ , 1993) p. 374.
[2] W.J. Quadakkers, H. Greiner andW. Cöck, Proceed. of the First European Solid OxideFuel Cells Forum, Luceme, Switzerland (1994) p. 525.
[3] T. Malkow,W. J. Quadakkers, L. Singheiser, H. Nickel, Report ForschungszentrumJülich, Jul - 3539, ISSN 0944 -2952, October 1998 .
[4]W. J. Quadakkers, T. Malkow, J. Pirön - Abellan, U. Flesch, V. Shemet andL.Singheiser, Proceed. of the Fourth European Solid Oxide Fuel Cells Forum, Lucern, 10 -14 July 2000, p. 827
[5] H. Nagai, T. Fujikawa andK. Shoji, Trans. Jap. Inst . Metals, 24 . No . 8 (1983) p. 581 .[6] Y. S. Touloukian, R. K. Kirby andR.E . Taylor, Thermal Expansion: Metallic Elements
and Alloys, Purdue University Thermophysical Properties Research Center, thermophysi-cal Properties ofMatter, 12, New York, IFI / Plenum (1975) .
[7] A. Goldsmith, T. E. Waterman, H.h . Hirschorn, Handbook ofThermophysical Propertiesof Solid Materials 2. Alloys NewYork, NY : MacMillan (1961) .
[8] K. Abiko and Y. Kato, Phys . Stat. Sol. (a) 167 (1998) p . 449.
MATERIALSFOR SWV OUDE HLTEL CELLS
MAGDI M NASRALLAHProfessor ofMaterials Engineering
Department ofMetallurgyFaculiy ofEngineering
Cairo Üniversity
By
Presented at
The "Egyptian-German Workshop"
On
Mäterials andProcessesfor Advanced Technology
April 2002

Experimental
Procedere
Hddition
of H20 and HND3
Hddition
of E
.G .
and Gigcine
Standing
at -80 oC
122

d
LL
123
U
U
b
Orn
a3
O
aU
..rHabo01
aOMU
t,D
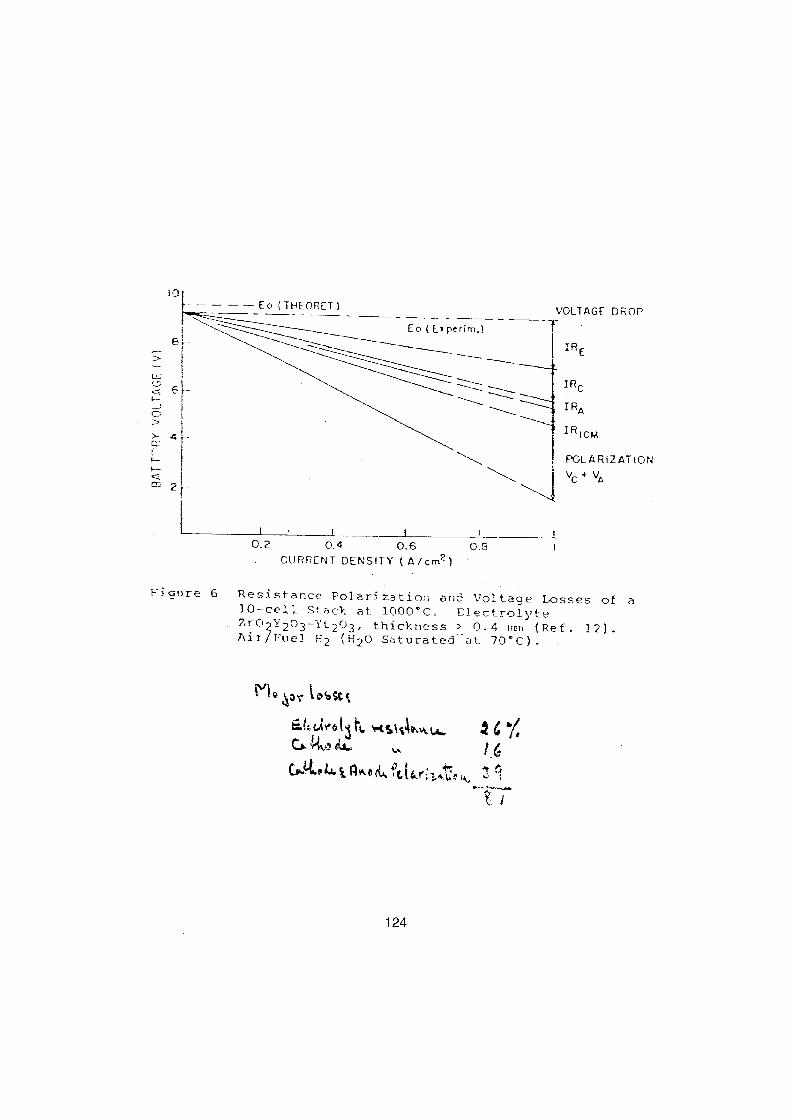
mo~or 1Most~
124
ENJeel 3 t,. Kt%~ ~.>., u-
e 4 `lc,mo
i
t
1
~-
t0.2 0.4 0.6 0 .~
ICURRENT DENSITY (A/,-m 2 )
Fi~_vre 6 Resistance Folarzzation an? Voltage Losses of a10-ce'', St.ac-k at 1000°(, , Flectr~l ~F oZr0
Y2p3 - 1't203,
thickness _>
0 .4
ranJ (Re f .
12) .Air%Fuel H2 (H20 Saturated at 70 ° C) .
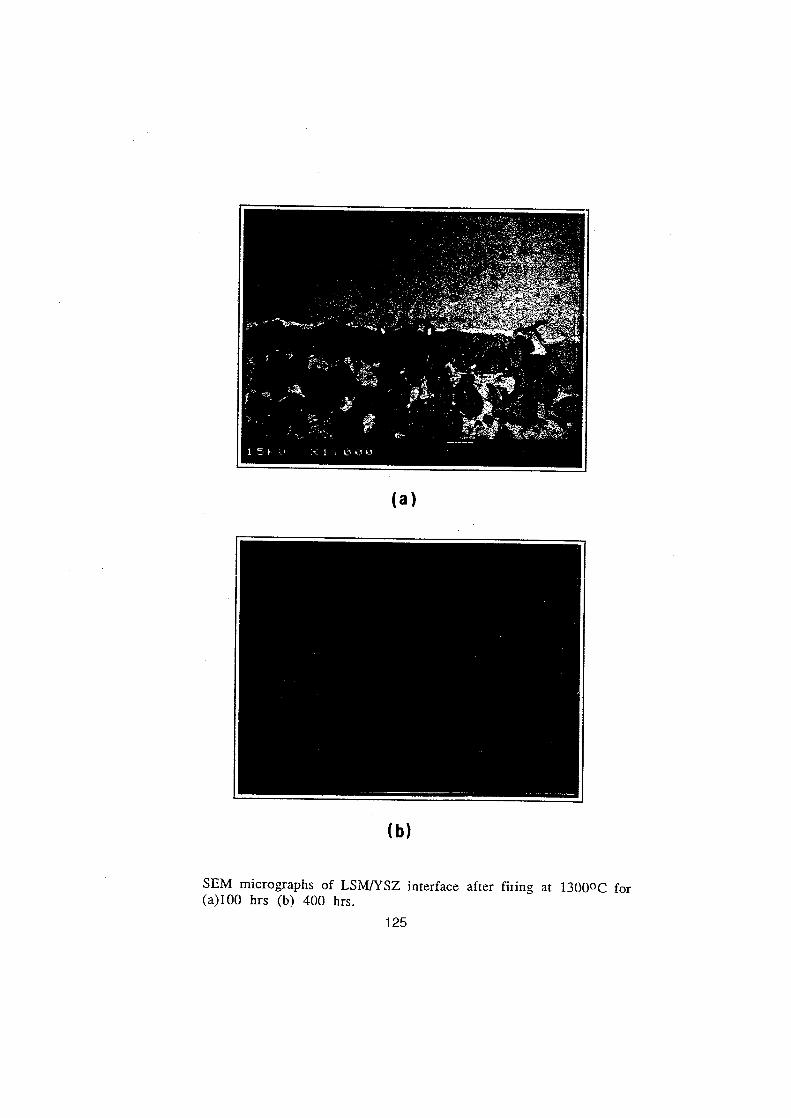
SEM
micrographs of LSM/YSZ interface after fiiing at 13000C for
(a)100
hrs
.(b)
400 hrs
.125

wo/S ) ÄI!ATlonpuoo
126

tl}J
W 15
La,_, r.Co_2Feg"3
0 .0 0 .Z 0 .4 0 .6 0 .8
Sr Content (x)

Ö
60
50 -i
40-
30 -i
20-
10-10-
000
o LSCFIYSZ
10Time (hrs)
Time deuendence of interface resistamee of LSCFIYSZ at 800°C
128
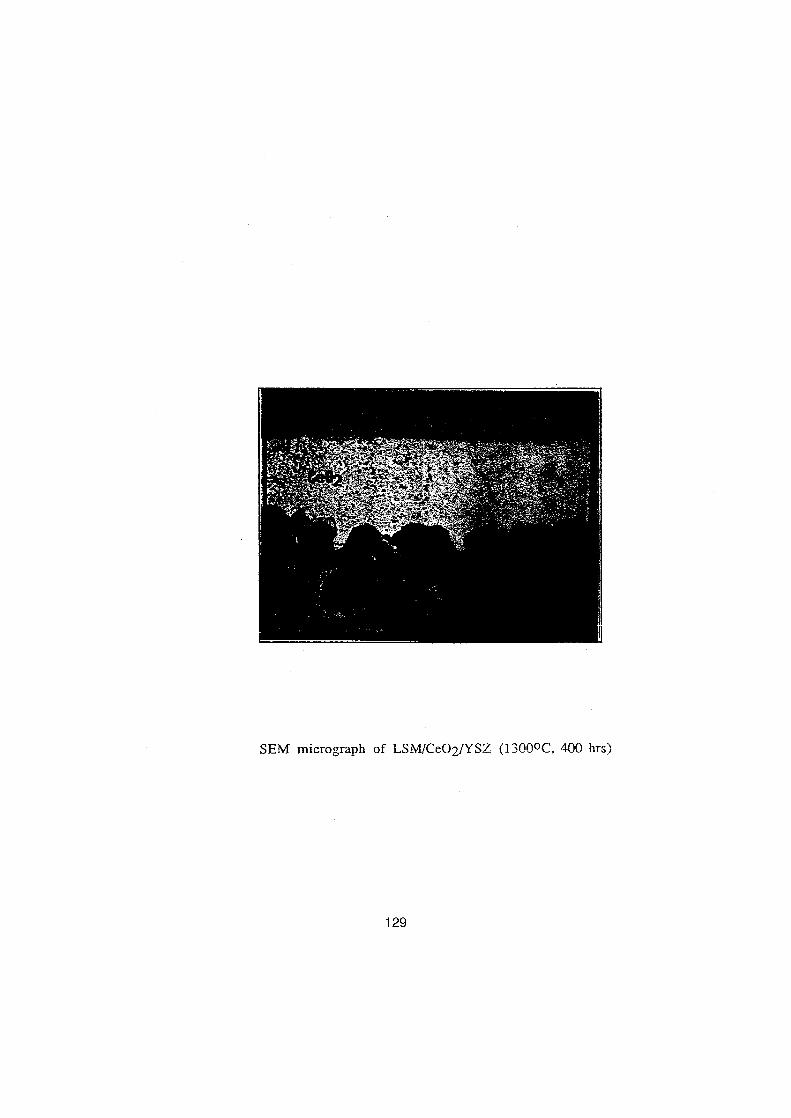
SEM micrograph of LSM,/Ce02,1YSZ (1-13001)(-', 400 hrs"
129
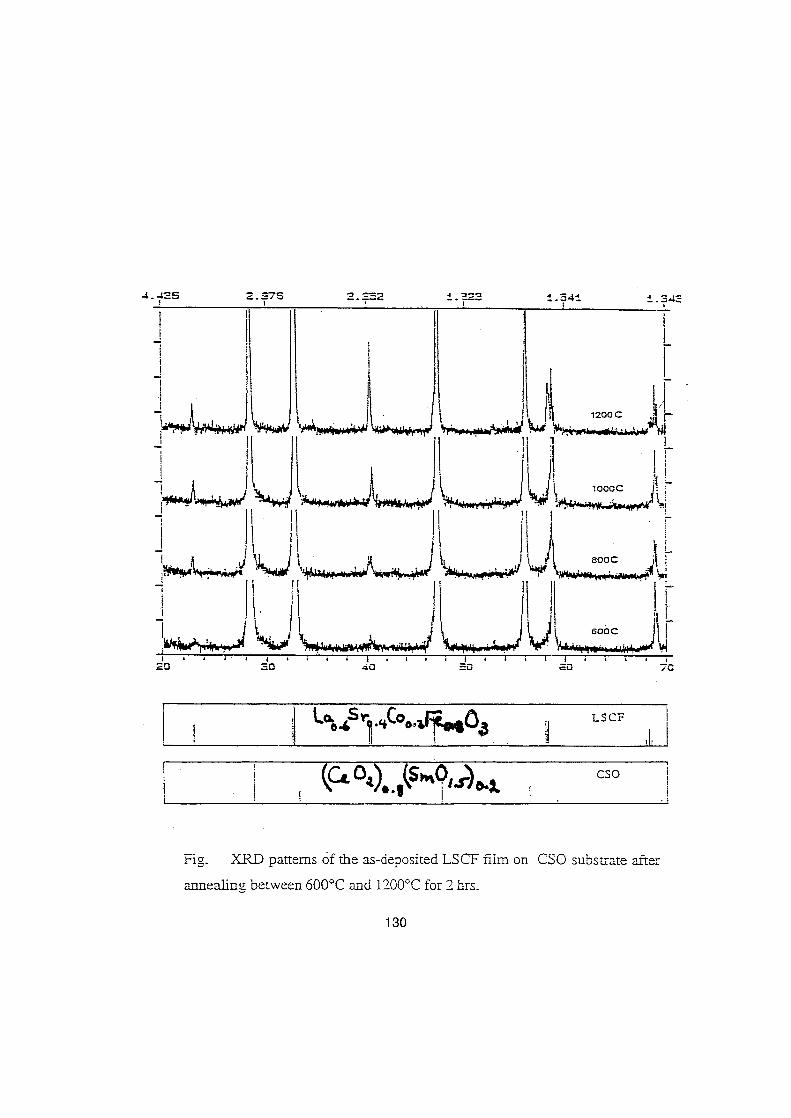
IEttt
l
14wi~
-~-
11J4
~,- ~i~~~IIIIII.c ~~
1
j
c4
.D
.zü
.ü
cü
i
i . 3232
130
. .~d. "_ .3-s_
,ZOa1Cj
i
1
1 1
LSCF
L
I
Fig .
XRD patterns of the as-deposited LSCF film an CSO Substrate alterannealinQ berween 600°C and 1?00°C for ? hrs .

Fig. 6 Cross-section SEM micrograph of the CSO film an I_SCF substrate
after five spin-coatings and fast firing at 600°C for I min.
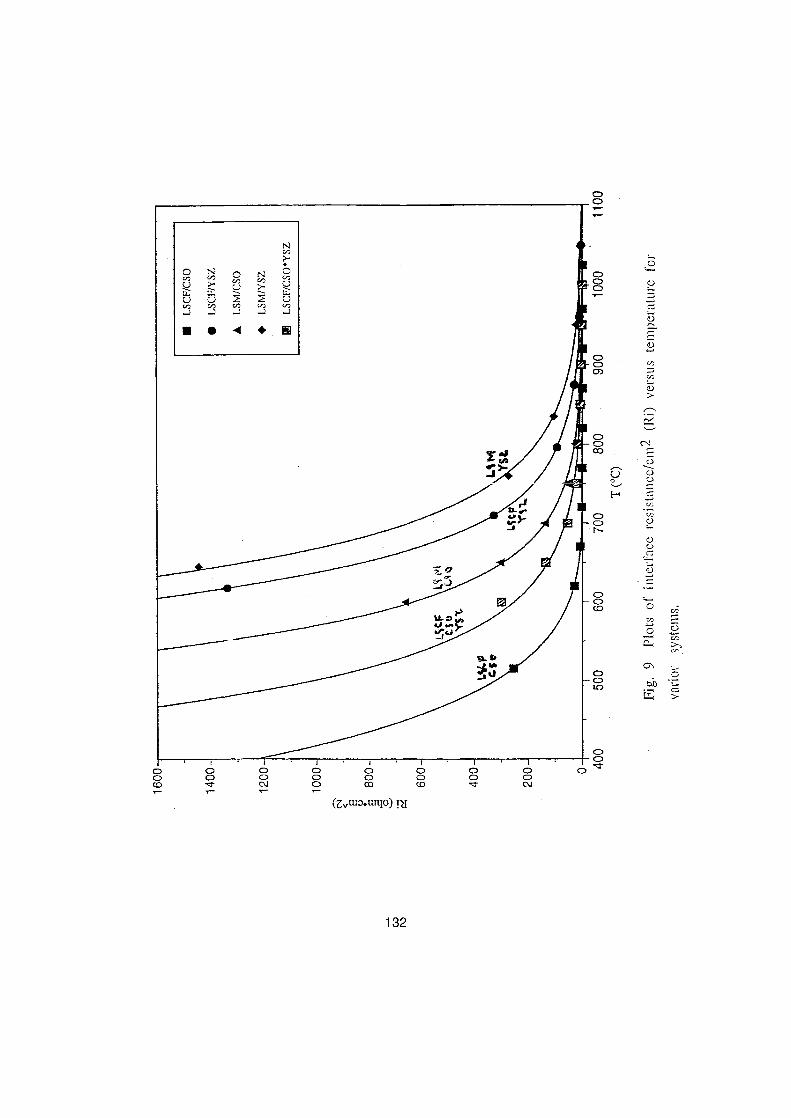
(ZV-3--4o)rD
1132
c~
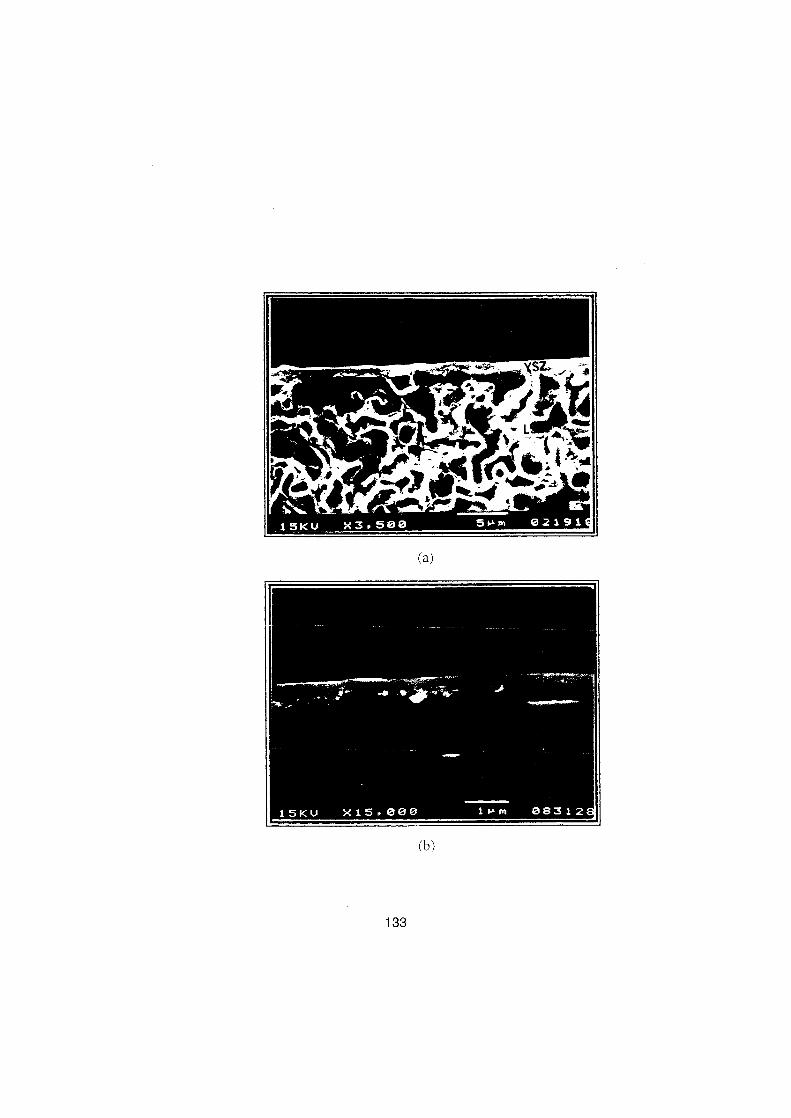
133

INTERCONNECT
CHALLENGE-s
" Stability within Entire Po, Range" Dense Micro Crack Free" No InteractionsHigh Conductivity
" Matching TEC+ Sinterable in AH- at Temp. not E ceeding 1200°C
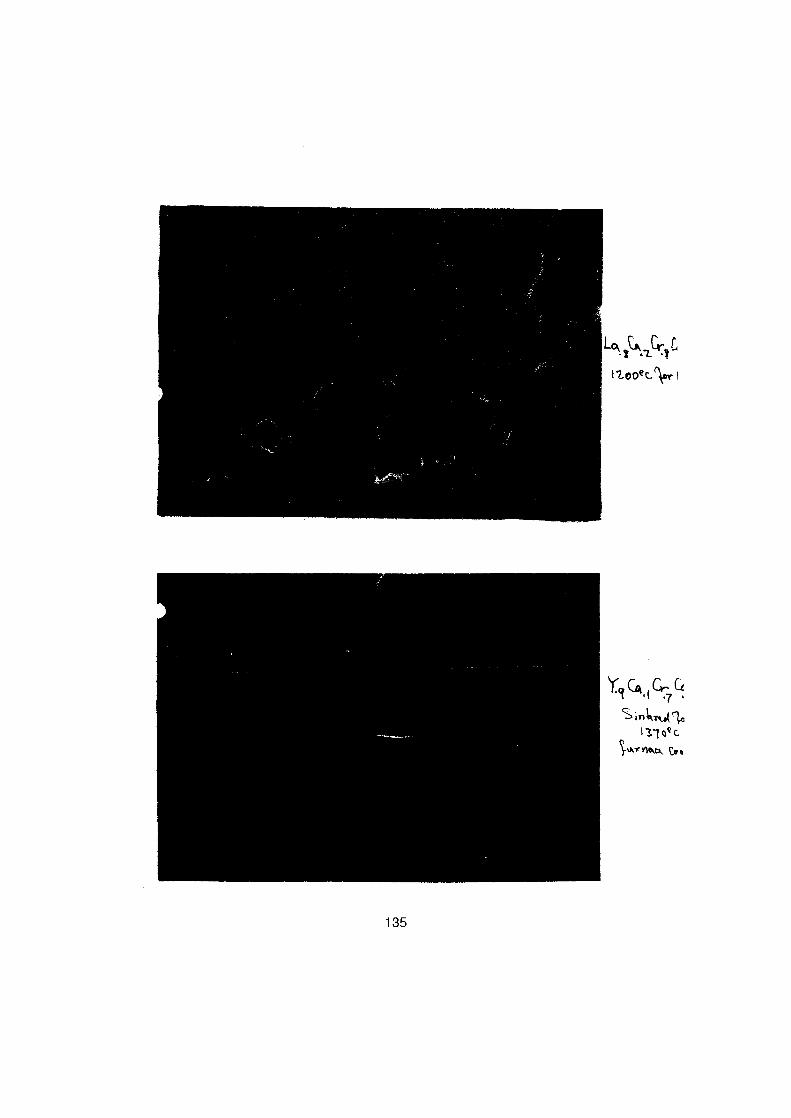
135
LqgG ZCr
.tr
~2d0ec~ ~
Y1 GA,,C7 c~
S~n13 -7 oQ c
~urn%ck Go
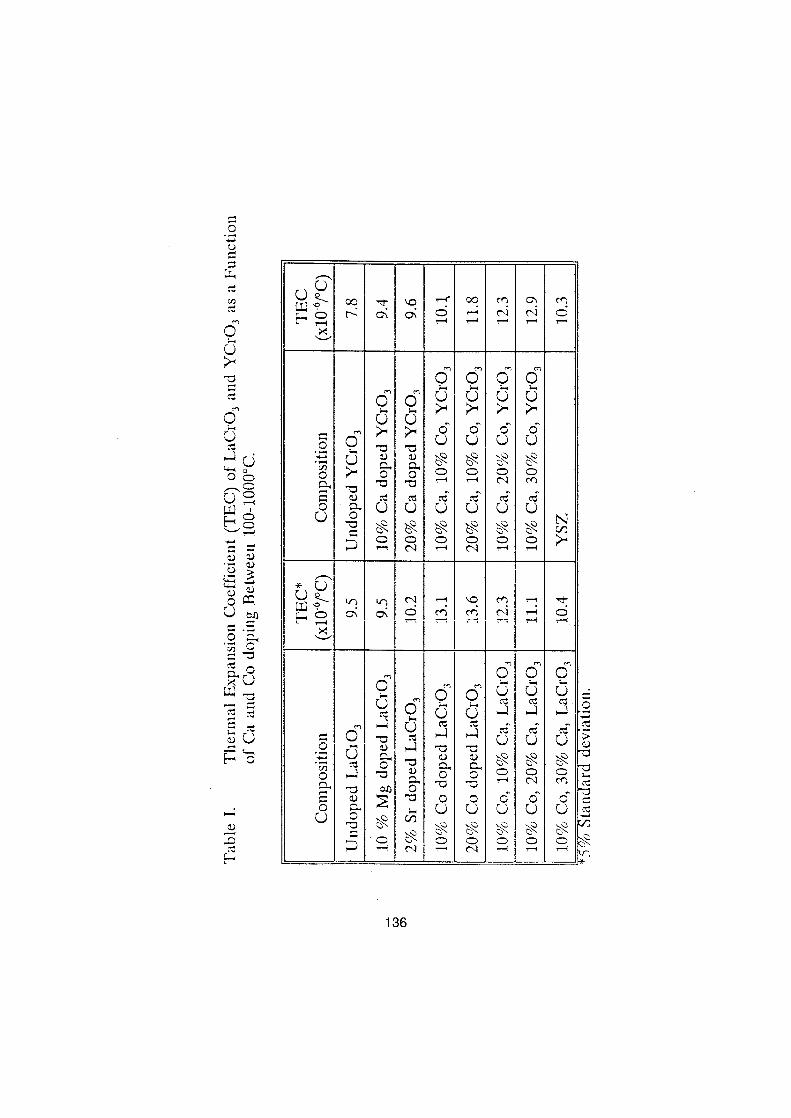
0Urrrwrcn
OU
mO
öCD
Uo
F' o
3OU o0
oxUW -a
r
r ö
136
ö
UGO 00 M G1 M0 r,1 r~ CD
X
m m m m
OÜ
OÜ
U~
U U Ü
m~ ~O Ü Ü Ü Ü
o o o CD CD o 0M
ö ~- Ü Ü Ü Ü Ü ÜU oo N o N o O }+
ov>Q~
NO
~M
~M
MN O
IXI
m m mm O O O
m Ö p U Ü Ü
zt ~ o0 0C-1 rn
0 0 ö ö äo U U U U UU o 0
o 0 0 0 0 0
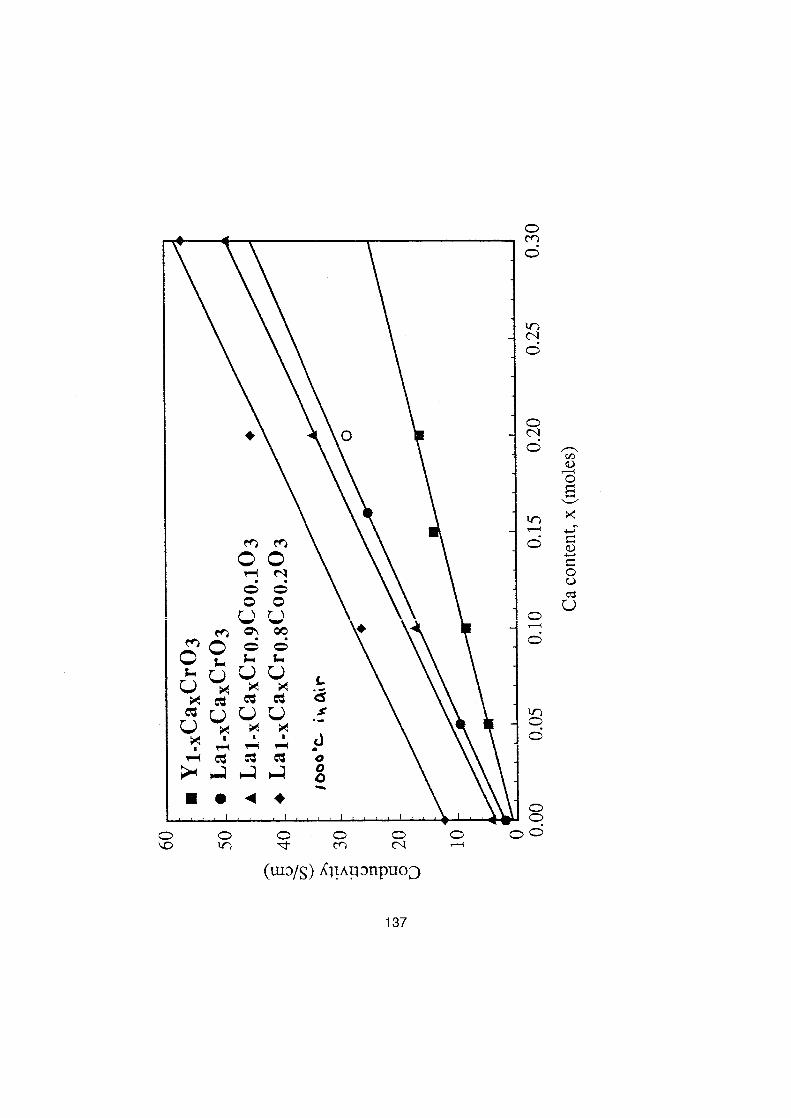
137
O
O
O
O
O
O
CD CDd' M N
(w3/S) iolntlz)npuoD
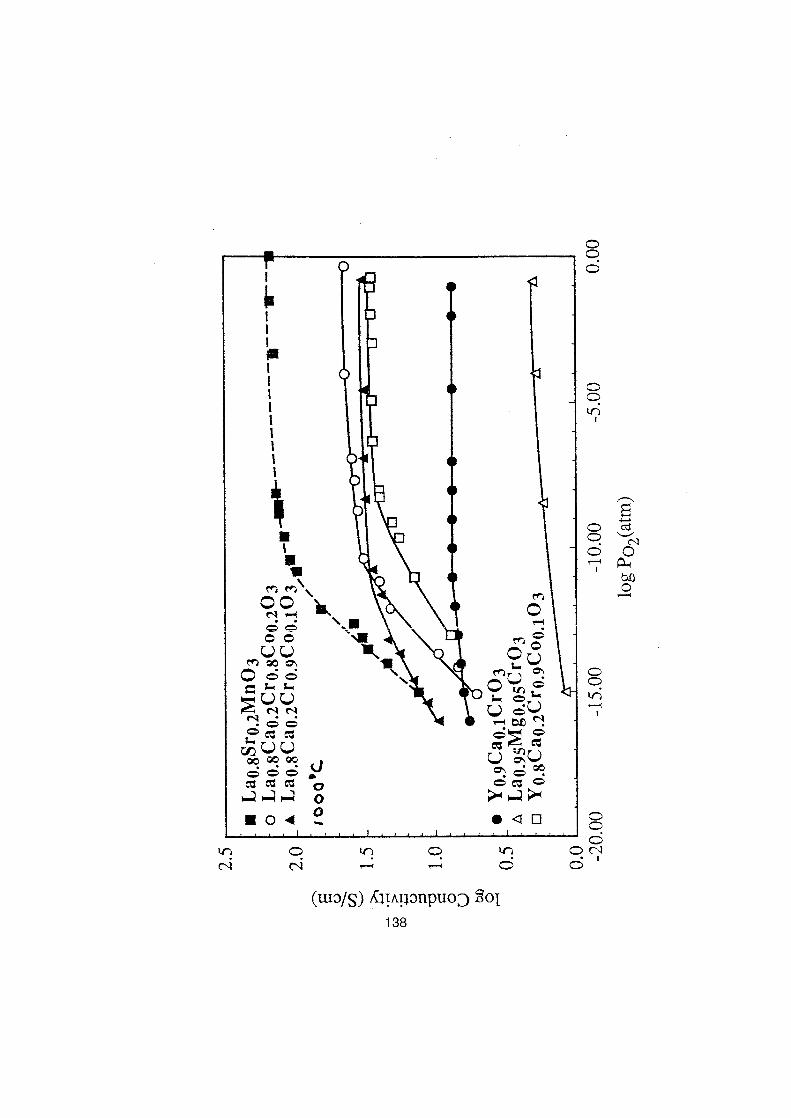
0 0Ö Ö
Mu00Q~O Oir Tr
N NN O Ö~VV000ctt c~ c~aaaso-4
cl
0
M
M O
VV® ~ O
VN
p~O
CG CCV öVor
ö
(ui3IS) folnt13npuoD 2oj138
OOö
OO
OOO
O0O
O O ONN N
'-+ O Ö
N
b1JO

INTERCONIÜECT
CFL LLE
ES
" Stability within Entire Po? Range" Dense Micrö Crack Eree" No InteractionsHigh Conductivity
" ldatching EC+ Sinterable in Air at Temp. not Exceeding 12 00°C
CONCLUSIONS
" Interfaciai Polarization Eliminated by DevelopingMixed Conductors .
" Novel Cathode Compositions Prepared with TailoredPhysical and Chemical Characteristics.
" Buffer Layer Introduced to Prevent Interactions andMinimize Losses .
" Interconnect Compositions Developed wich SuperiörProperties and Allow Co-sintering of Cell componentsin Air at 1200° C.
" Developed Materials Enabled SOFC Operation at800°C
" A lyovel Liquid Mix Technique was Developed forSyntheses of Cell Components.
" Thin, compact, Defect-Free Films where DevelopedUsing a Ivovel Spin Coating Technique .
" Production of Fuel Cell Bundles Proposed by usingMulti Chännel MatrixIFiller Extrusion Technique .
140
S®FC Materials Research
in the Atomic Energy Authority ot Egypt
M.FI-,3,-iyad Ali
Poel cell activities in the Materials Division, Nticlear Research Center,
Aloinic Energy Autitority of Egypt, wi11 Boe reviewed. Inne researchactivities Liave been. camed out by" the cer2nics roup in the Met:illurgyDept., wherc 'die male:als or ll;e c,rdmic solid oxidc fdci ccll SQFC wcrethe subject of research and development . The rcs~arch focc .zsed an pl<snarSOFC, in which the an-)de iias been uscd as « stippt-b-he stalei?ized
zirconia thin layer. The research includes- pgwder preparation a.ndlo-niiiig method in Order to be able to prcpörc SC1r'C ai1ode dic
required spccificatiors, coated with a very thin aW das ti~h4 electrolytelayer.

Solid Oxide Fuel Cell Research and development
in the AEA of Egypt
The research focused an the preparation of
Ni/YSZ supporting anode where two methods of preparation are
currently used:
1- Poreformer technique
2- Coat Mix technique
The results obtained showed comparable pore
structure with the required porosity for the supporting anode.
In order to integrate a local material that could be extracted from
an Egyptian mineral, a side project has been started to extract
142
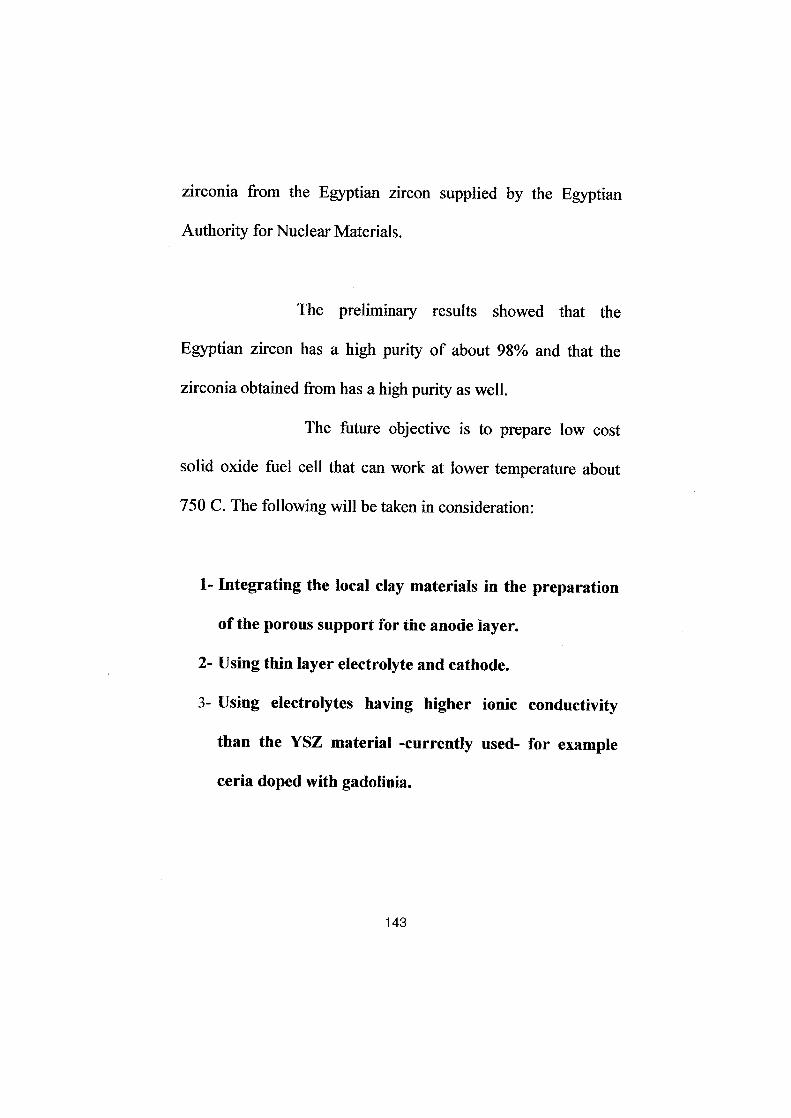
zirconia from the Egyptian zircon supplied by the Egyptian
Authority for Nuclear Materials .
The preliminary results showed that the
Egyptian zircon has a high purity of about 98% and that the
zirconia obtained from has a high purity as well .
The future objective is to prepare low cost
solid oxide fuel cell that can work at lower temperature about
750 C. The following will be taken in consideration :
1- Integrating the local clay materials in the preparation
of the porous support for the anode layer.
2- Using thin layer electrolyte and cathode.
3- Using electrolytes having higher ionic conductivity
than the YSZ material -currently used- for example
ceria doped with gadolinia.
143
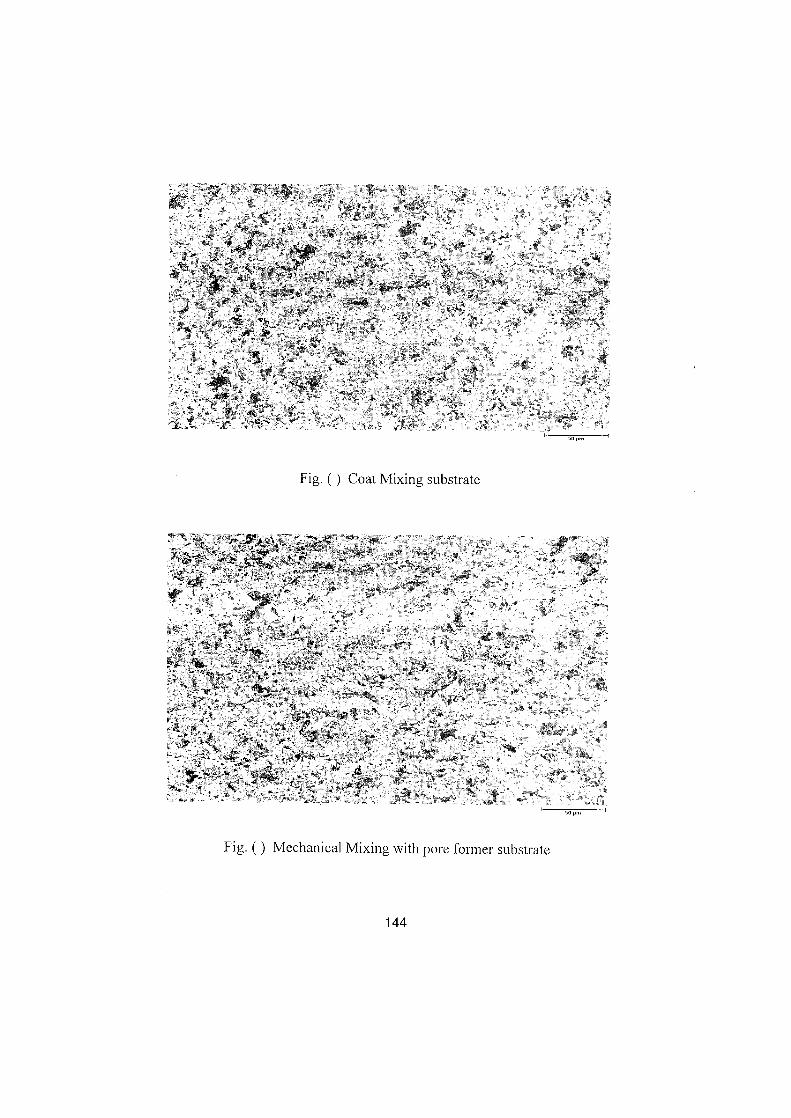
Fig. ( ) Coat Mixing substrate
Fig. ( ) Mechanical Mixing with pore former substrate
144
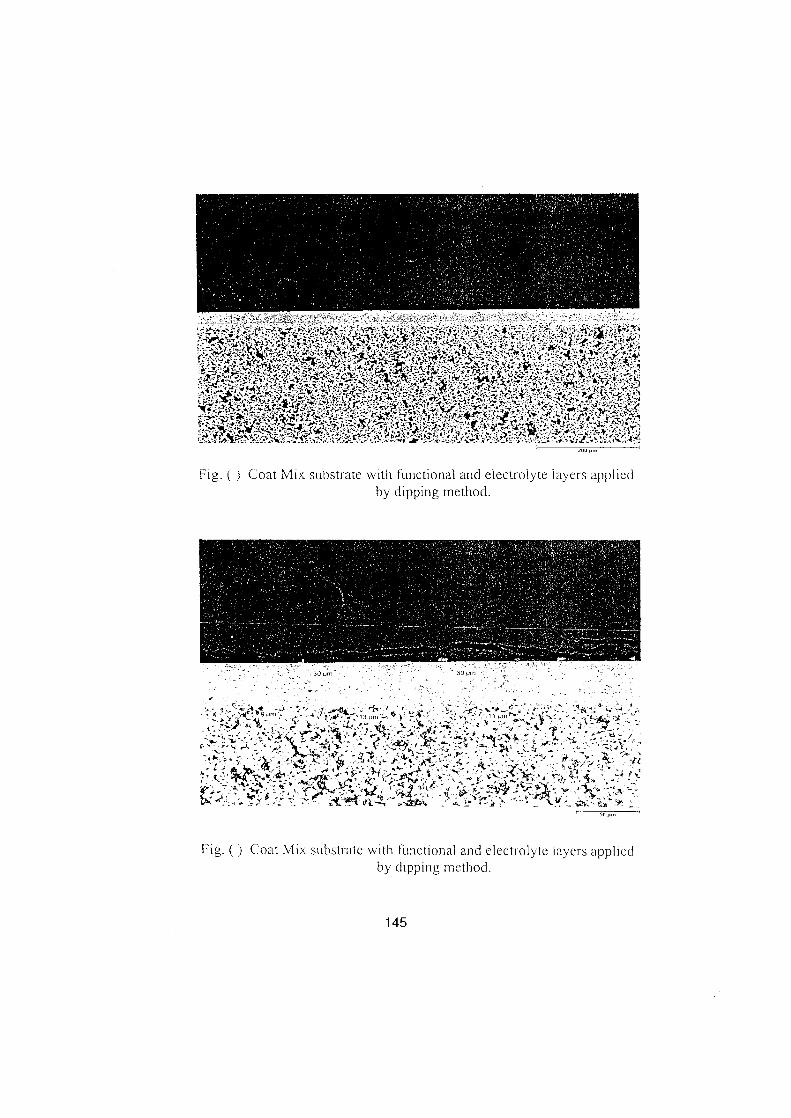
145
Coat Mix substrate with functional and electrolyte layers appliedby dipping method .
f- ig . (j Coat Mix substrate with functional and electrolyte layers appliedby dipping method .
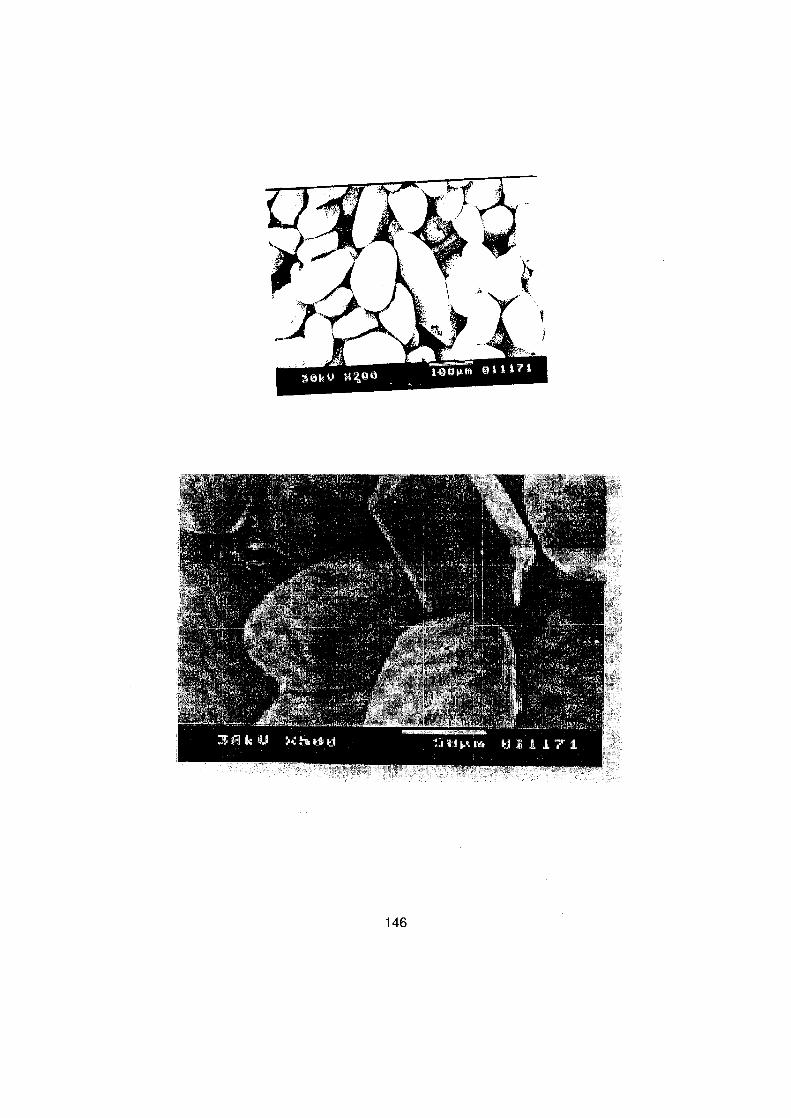
146
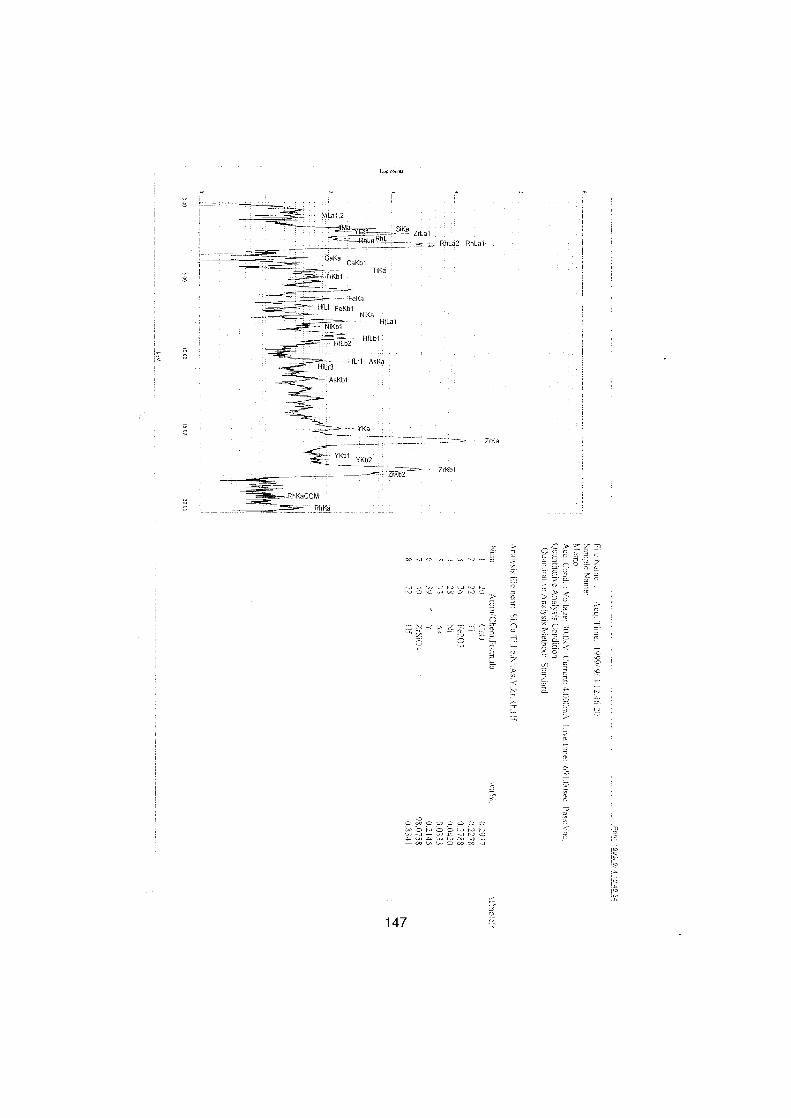
L,-.e
147
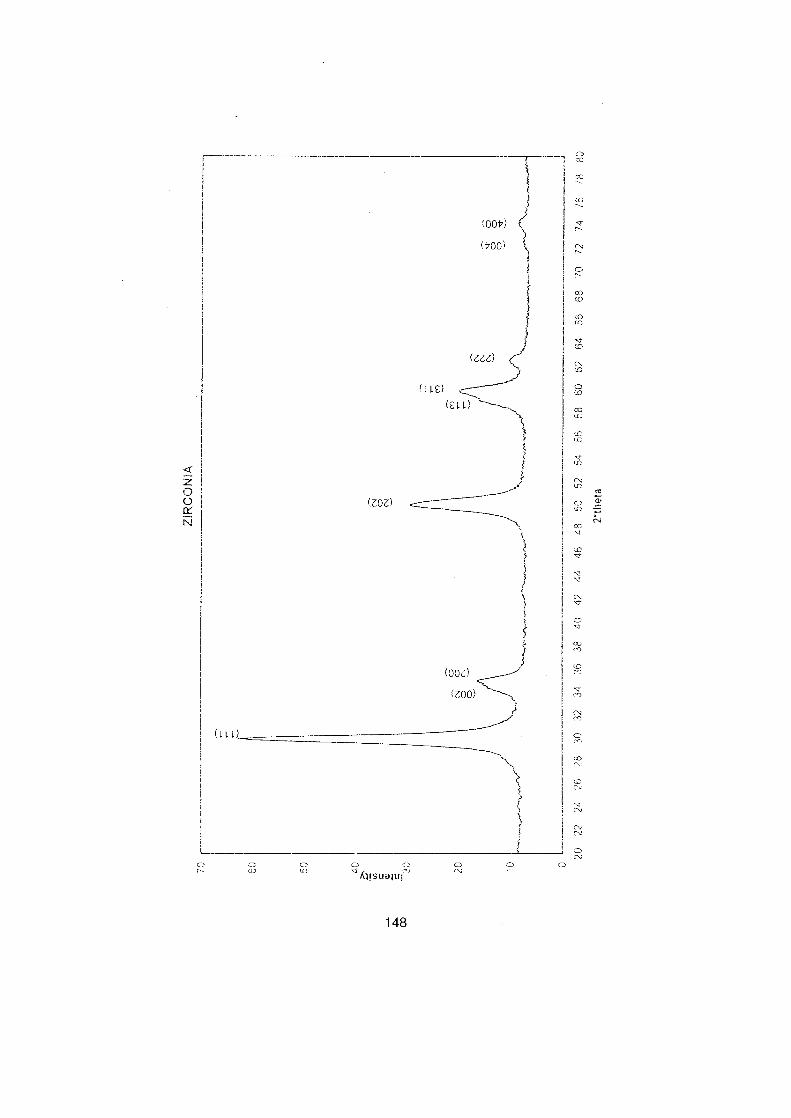
dz
O
148
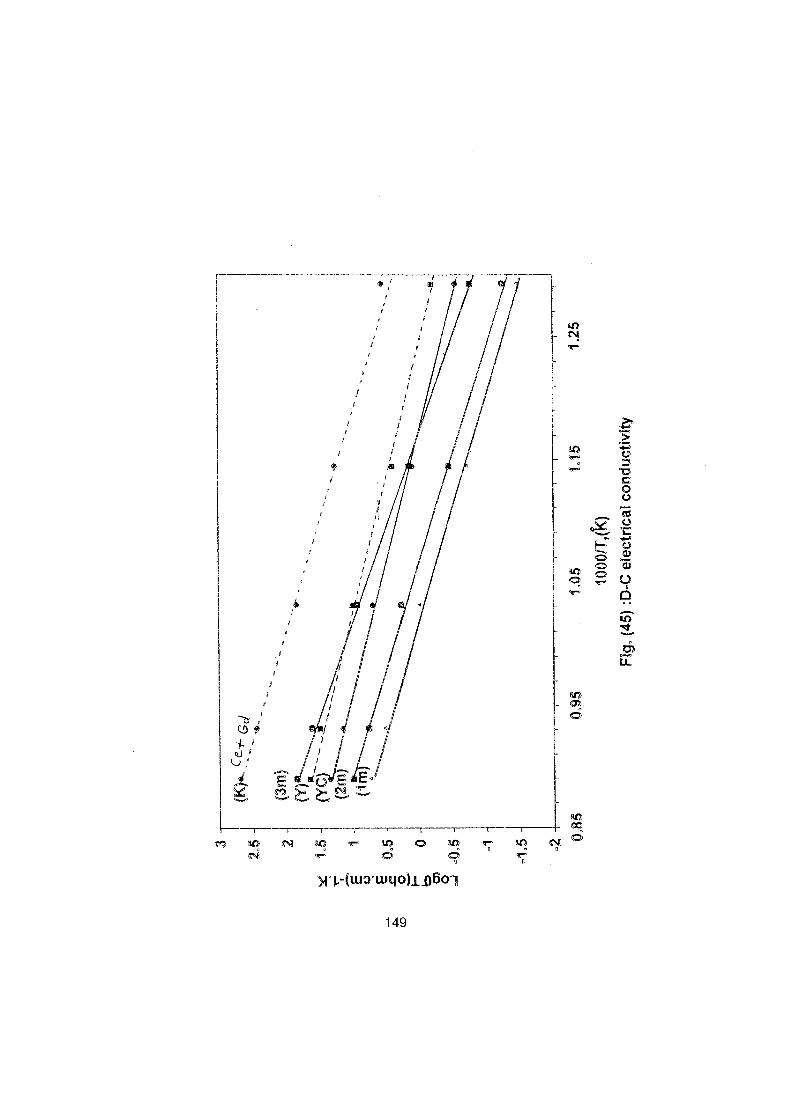
149
25CDW
LOgf~
en
iz

150
Development of an optimized anode functional layer
for SOFC applicationA.A.E . Hassan*, N.H. Menzler, G. Blass, M.E . Ali*, H.P. Buchkremer,D.Stöver
* Metallurgy department, NRC, AEA, Egypt.
Abstract :
The development of optimized functional layers between the electrolyte and the electrodes ofsolid oxide fuel cells (SOFC) is of great interest . In this paper the effect of the anodefunctional layer with different thicknesses (2,5,8,16 gm) and different Ni content(40,45,50,55 vol.% Ni) an the performance of solid oxide fuel cell was investigated . Theperformances of cells with different anode substrates (S-mix and T-mix) were tested . Theexperiments Show that, the performances ofthe cells with anode functional layer thicknessesof 2,5,8 gm and 16 gm are approximately the saure . The cell with Ni content of 40 vol.% inthe anode functional layer Shows significantly better performance than the cells with higherNi contents . The cell of (T-mix) substrate Shows better performance than the cell of (S-mix)substrate especially at lower operating temperatures (750,800°C) .
I. Introduction :
The main function ofthe Solid Oxide Fuel Cell (SOFC) anode is to provide the reaction sitesfor the electrochemical oxidation of the gas fuel . Thus, the anode material must be stable inthe reducing environment and have sufficient electronic conductivity and catalytic activity forthe fuel / gas reaction at the operating conditions . A porous cermet, made of Ni and Yttriastabilized zirconia (YSZ) is generally used as anode material . The network ofNi particles hasa large catalytic activity and is responsible for transporting electrons from the electrodereaction site to the current collector. Open porosity is required for the electrode to supply fuelas well as removal of the reaction products . The addition of YSZ is necessary to support theNi particles, to inhibit grain coarsening at the usual operating temperature and to give thecennet a thermal expansion coefficient acceptably close to that of the other cell components('). The presence ofYSZ in the anode is considered to be inactive for the electrode reaction (') .An alternative approach is that the YSZ component, extends the active area of the electrodereaction into the bulk of the electrode (2). Although sinterability of Ni is reduced with anincreasing YSZ content, also increasing YSZ content raises IR resistance of SOFC . Theparticle size and ratio of Ni / YSZ are critical to the perfonnance ofthe Ni/YSZ cermet anode(3,4) . Deposition of a thin anode interlayer an the anode substrate wich finer particles reducesthe He-leak rate of the electrolyte and improves the cell performance (s) . Another way toprevent the degradation of the anode could be by fonning a graded multilayer anode, whose
151
diverse layers differ in their microstructure, to fulfill the locally different requirements forSOFC anodes . The First layer, which is adjacent to the electrolyte, consists of fine Ni and8YSZ particles to provide a great electrochemical active surface as triple phase boundary(TPB). The thermal expansion coefficient (TEC) of this layer should be close to that of theelectrolyte . The second layer, which is in contact with the electrical interconnector, shouldhave a high electronic conductivity and high porosity for fast gas diffusion . A third transitionlayer is laying in between of these two layers . This transition layer has an intermediatecomposition and intermediate particle size compared to the other layers . Therefore the Nicontent and the Ni particle size increase from the First to the second layer (6) . It was found thatthe IR resistance is sensitive to the contact area of Ni wich the electrolyte . Polarizationresistance is strongly affected by the Ni/YSZ ratio . So the double layer anode which consistsof interfacial layer, using Ni rich cermet is effective in reducing IR resistance. Theoptimization ofthe anode interfacial layerneeds much work(7) .
In the present study the effect of anode functional layer thickness, and the effect ofdifferent Ni content in the anode functional layer an cell performance was investigated .
11 : Experimental Procedure:
1 . Cell preparation:
Two types of supported anode substrate with standard
different porosity, prepared by Coat Mix process, were used . Two batehes of binders wereused in preparation process and are denoted as (S-mix. and T-mix.) . An anode funetionallayer with different thicknesses of 2, 5, 8, and 16 gm were the ferst group of specimens, and a5 ~im anode functional layer with different Ni contents of 40, 45, 50, and 55vol.% were thesecond group of specimens. The anode functional layers were deposited an one side of S-mixsubstrate by modified slip casting process (s ) . The deposited anode funetional layers wereealcined at 1000°C for an hour .
A thin layer of 5 gm thickness was applied an the calcined anode functional layer aselectrolyte, using the modified slip casting process . The deposited layers were sintered at1400°C for 5 hours. The He-leak test of the electrolyte layer was conducted at a differentpressure of
100 mbar using He-Leak testing unit (Qualytest, Balzers) .Two cathode layers with a total thickness of about 60gm were applied an the surface
of the sintered electrolyte layer by the wet powder spraying (WPS) process (9) . The firstcathode layer contains 40 wt.% YSZ and 60 wt.% LSM with fine particle size distribution
(dso=0 .3gm). The second layer contains a coarser particle size of LSM (dso=0 .5-0 .7 gm). Thecathode layers were calcined at 1100°C for 3 hour . The microstructures were investigatedusing a scanning electron microscope (LEO, 1530 gemini, Germany) . The samples were
152
composition (40 vol. % Ni) and

coated with a thin platinum film using sputtering device (BALZERS union, SCD 040,Germany).
2. Cell performance measurements :
The performance of a single cell was investigated using humidified hydrogen as fuel gas anddry air as oxidant . The Gell was heated up in a fumace with programmable temperaturecontroller to the operating temperature . The heating rate was 1K/min . . The anode was reducedusing H2/H 20 (88/12) gas mixture for several hours. The current-voltage measurements weremeasured using a HP6050A electronic . Potential and temperature data are collected using aPC-controled Fluke NetDAQ system .
111. Results and discussion :
1. Effect of the anode functional lauer thickness an the He-leak rate of the
electrolyte layer:
The relationship between the anode functional layer thickness and the He-leak rate is shownin Fig. 1 . The He-leak rate decreases with increasing the thickness of the anode functionallayer from 2x10⁻⁵ to 3x10 -6 mbar 1/sec.cm2 for an anode functional layer thickness 8-10gm.The leak-rate increases slightly to 4x10⁻⁶ mbar 1/sec.cm2 as the thickness of the anodefunctional layer increases to 16 gm . This means that the tightness of the electrolyte layer isimproved by increasing the thickness ofthe anode functional layer with an optimum thicknessof about 10 pm. The decrease of the leak rate may be due to the improved surface roughnessofthe anode functional layer.
2. Effect of the anode functional layer thickness an the cell performance:Figures 2-5 Show the 1-V characteristic of a single cell at different operating temperatureswith different anode functional layer thicknesses .Table 1 summarizes the measured current densities of different cells with differentthicknesses ofanode functional layer, at a working voltage of one cell (0 .7 V) and at differentoperating temperature. From table 1 it couldbe concluded that there was no noticeable changein the current density with increasing of the anode functional layer thickness from 2gm to16gm. The data variations are in the range of a standard deviation.
3. Effect of the nickel content in the anode functional lauer an the cell
performance:
The performance of cells at different nickel contents in the anode functional layer is shown inFigs. 6-9. Increasing nickel content in the anode functional layer decreases the Gell
153
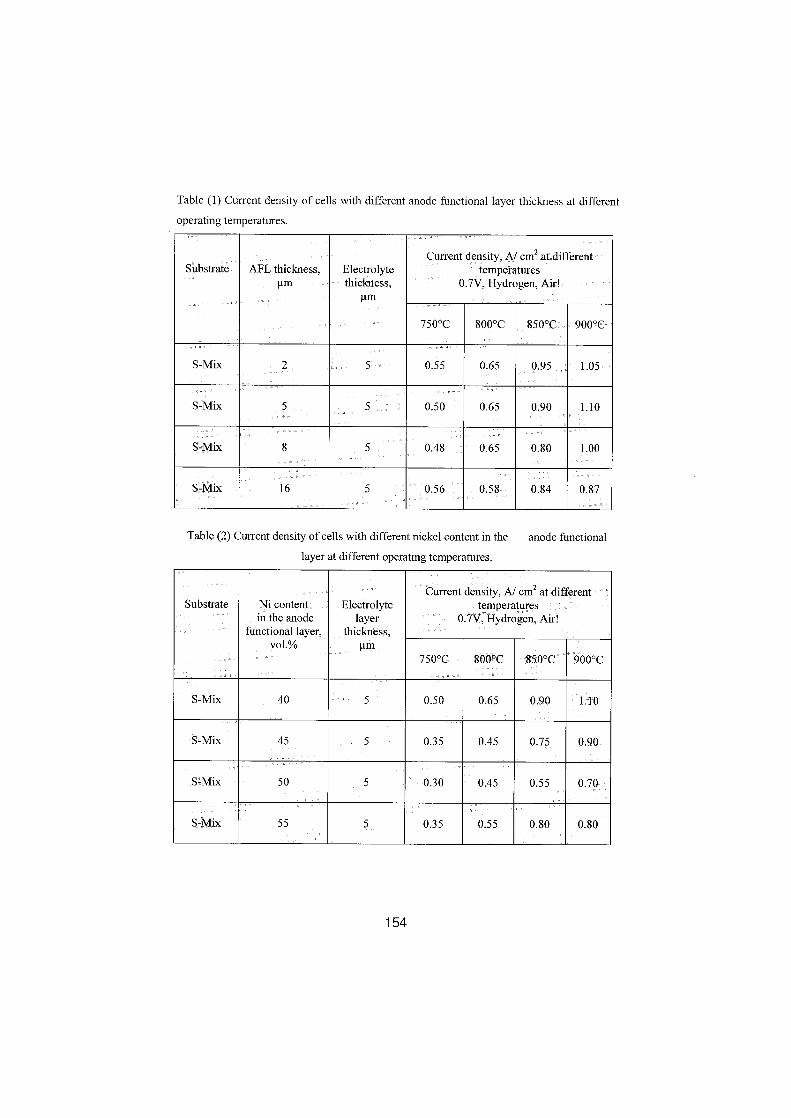
Table (1) Current densiry of cells with different anode functional layer thickness at differentoperating temperatures.
Table (2) Current density of cells with different nickel content in the
anode functionallayer at different operating temperatures .
154
Substrate AFL thickness,pm
Electrolytethickness,
Current density, A/ cm2 at differenttemperatures
0.7V, Hydrogen, Air!
7500C 8000C 850°C - 900°C-
S-Mix 2 5 0'.55 0.65 0.95 1 .05 -
S-Mix 5 5 0;50- 065 0.90 1.10
S-Mix 8 5 0.48 0.65 0.80 1 .00
S-Mix 16 5 0.56 0.58 0.84 0.87-
Current densiry, A/ cm2 at differentSubstrate Ni content Electrolyte temperatures
in the anode layer 0.7V, Hydrogen, Air!functionallayer, thickness, -
vol.% gm750°C 800°C 850°C 900°C -
S-Mix 40 5 0.50 0.65 0.90 - 1.10
S-Mix 45 5 0.35 0.45 0.75 0.90
S-Mix 50 5 0.30 0.45 0.55 0.70-
S-Mix 55 5 0;35 0.55 0.80' 0.80
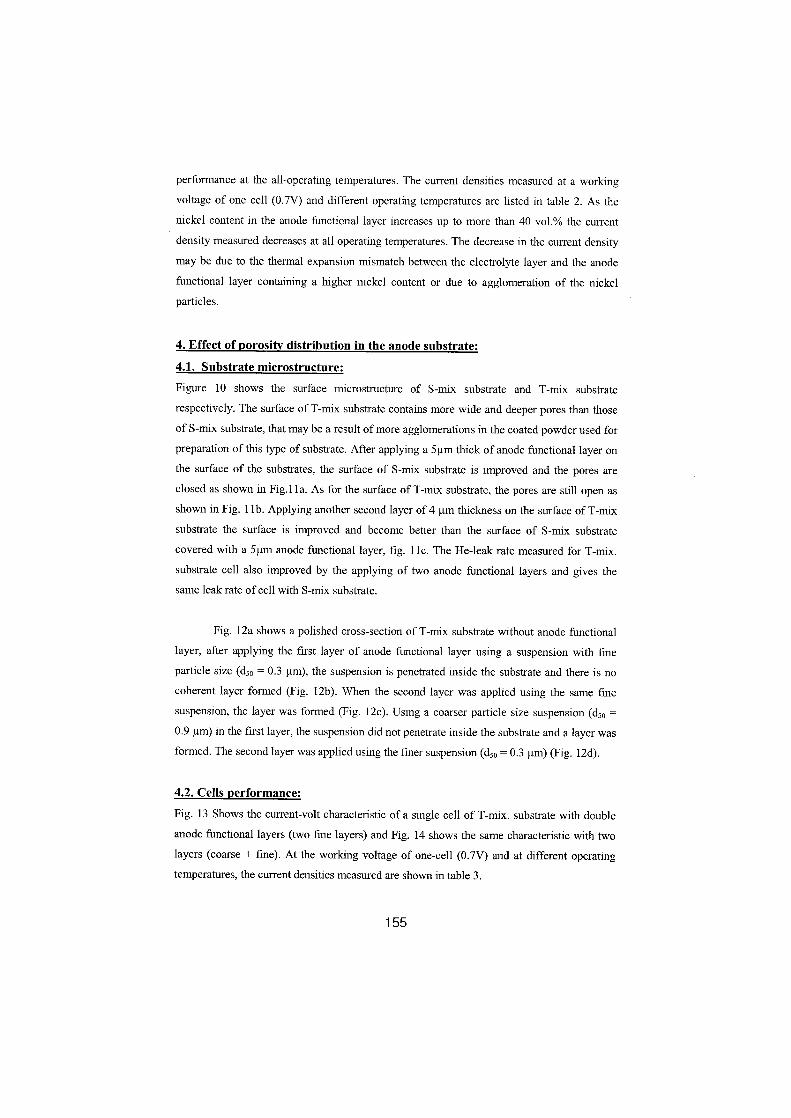
performance at the all-operating temperatures . The current densities measured at a workingvoltage of one cell (0 .7V) and different operating temperatures are listed in table 2. As thenickel content in the anode functional layer increases up to more than 40 vol.% the currentdensity measured decreases at all operating temperatures . The decrease in the current densitymay be due to the thermal expansion mismatch between the electrolyte layer and the anodefunctional layer containing a higher nickel content or due to agglomeration of the nickelparticles.
4. Effect of porosity distribution in the anode substrate:
4.1 . Substrate microstructure :
Figure 10 shows the surface microstructure of S-mix substrate and T-mix substraterespectively . The surface ofT-mix substrate contains more wide and deeper pores than thoseof S-mix substrate, that may be a result ofmore agglomerations in the coated powder used forpreparation ofthis type of Substrate. After applying a 5pm thick ofanode functional layer anthe surface of the substrates, the surface of S-mix substrate is improved and the pores areclosed as shown in Fig. 1la. As for the surface of T-mix substrate, the pores are still open asshown in Fig. 1 lb . Applying another second layer of4 pur thickness an the surface of T-mixsubstrate the surface is improved and become better than the surface of S-mix substratecovered with a 5pm anode functional layer, fig . 11c. The He-leak rate measured for T-mix.substrate cell also improved by the applying of two anode functional layers and gives thesame leakrate of cell with S-mix substrate .
Fig. 12a shows a polished cross-section of T-mix substrate without anode functionallayer, after applying the first layer of anode functional layer using a suspension with fineparticle size (d5o = 0.3 gm), the suspension is penetrated inside the Substrate and there is nocoherent layer formed (Fig . 12b) . When the second layer was applied using the Same finesuspension, the layer was formed (Fig. 12c) . Using a coarser particle size suspension (d5o =0.9 bum) in the first layer, the Suspension did not penetrate inside the Substrate and a layer wasformed . The second layer was applied using the finer suspension (d5o = 0.3 pur) (Fig. 12d) .
4.2 . Cells performance:
Fig. 13 Shows the current-volt characteristic of a single cell of T-mix. Substrate with doubleanode functional layers (two fine layers) and Fig. 14 shows the saure characteristic with twolayers (coarse + fine) . At the working voltage of one-cell (0.7V) and at different operatingtemperatures, the current densities measured are shown in table 3.
155
From table 3, the Current density obtained from the cell with T-mix substrate and double fineanode functional layers is slightly better than the Current density measured by the other twocells . At an operating temperature of 800°C which is state-of-the-art in planer SOFC systemthe improvement is about 30% whereas at 900°C the Current density is approximately thesame.
Table (3) Current density of cells with different substrate and anode functional layers atdifferent operating temperatures .
V. Conelusion "
"
In the leak test the He-leak rate of the electrolyte layer decreases by increasing thethickness of the anode functional layer , it is lower than 5x10⁻⁶ mbar 1/sec.cm2 at 8gmthickness . No change in the He-leak rate of the electrolyte is deteeted layer by increasingof the anode functional layer thickness to 16 gm.
"
Atthe working voltage ofone Gell (0 .7V) and at all operating temperatures (750, 800, 850and 950°C), the cells with anode functional layer thicknesses of 2, 5 and 8gm giveapproximately the Same Current densities. Whereas the cell with an anode functional layerthickness of 16gm has a lower Current density at 800°C.
"
Increasing Ni content in the anode functional layer to be more than 40 vol.% reduces theperformance of cell by reducing the Current density measured at all operatingtemperatures .
"
The cell with T-mix substrate and double fine anode functional layers has slightly betterperformance than the cell with S-mix substrate especially at 800°C .
156
Substrate AFL thickness ;,jim
Electrolytethickness, gm
Current density, A/ cm2 at differenttemperature
0.7V, Hydrogen, Air! -
7500C 8000C 8500C 900°C
S-Mix 5 5 0.50 0.65 0.90 1 .10
T=Mix 5+4-(fine) 5 0.69 0.85 1 .05- - 1 .15
T-Mix (3 .5+3 .5)(coarse +fine)
5 0.53 0.77 0.93 1 .07
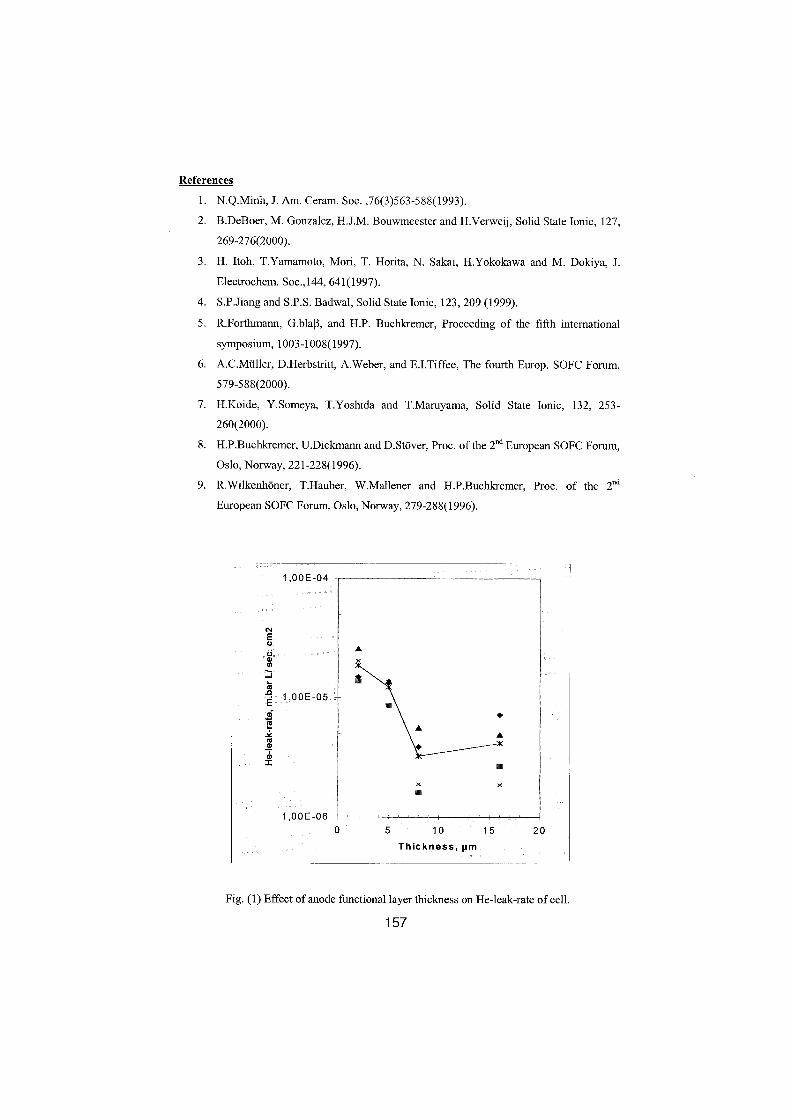
References
1.
N.Q.Minh, J. Am. Ceram. Soc.,76(3)563-588(1993) .z .
B.DeBoer, M. Gonzalez, H.J.M . Bouwmeester and H.Verweij, Solid State Ionic, 127,
269-276(2000).
3 . H. Itoh, T.Yamamoto, Mori, T. Horita, N. Sakai, H.Yokokawa and M. Dokiya, J.
Electrochem . Soc.,144, 641(1997).
4.
ST.Jiang and S.P .S . Badwal, Solid State Ionic; 123, 209 (1999) .
5 . R.Forthmann, G.blaß, and H.P . Buchkremer, Proceeding of the fifth international
symposium, 1003-1008(1997) .6 .
A.C.Müller, D.Herbstritt, A.Weber, and E.I .Tiffee, The fourth Europ. SOFC Forum,
579-588(2000) .
7 . H.Koide, Y.Someya, T.Yoshida and T.Maruyama, Solid State Ionic, 132, 253-260(2000).
B .
H.P.Buchkremer, U.Diekmann andD.Stöver, Proc . of the 2"a European SOFC Forum,Oslo, Norway, 221-228(1996).
9. R.Wilkenhöner, T.Hauber, W.Mallener and H.P.Buchkremer, Proc . of the 2na
European SOFC Forum, Oslo, Norway, 279-288(1996).
Fig. (1) Effect ofanode functional layer thickness an He-leak-rate of cell.
157
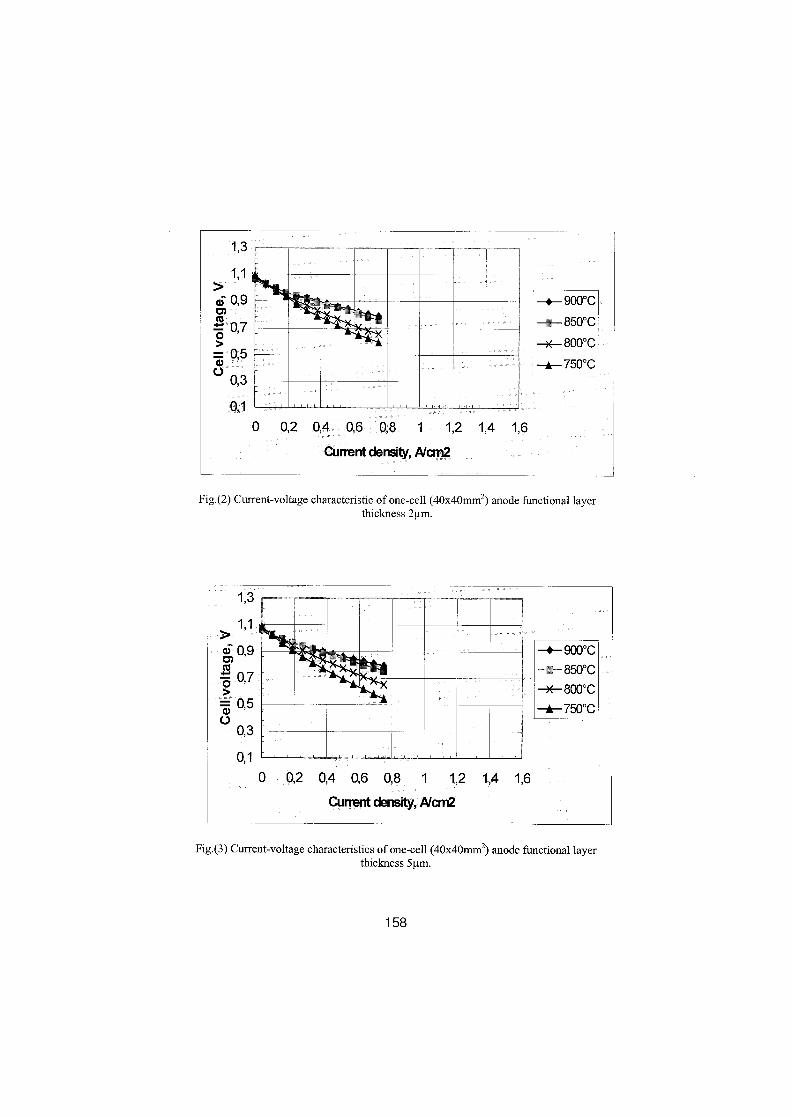
Fig.(2) Current-voltage characteristic ofone-cell (40x40mm2) anode functional layerthickness 2gm.
0 0,2 0,4 0,6 0,8 1 1,2 1,4 1,6Currentderisity, Alan2
0,3
0,10 0;2 0,4 0,6 0,8 1 1,2 1,4 1,6
(1urrent density, Alard
Fig.(3) Current-voltage characteristics of one-cell (40x40mm2) anode functional layerthickness 5gm.
158
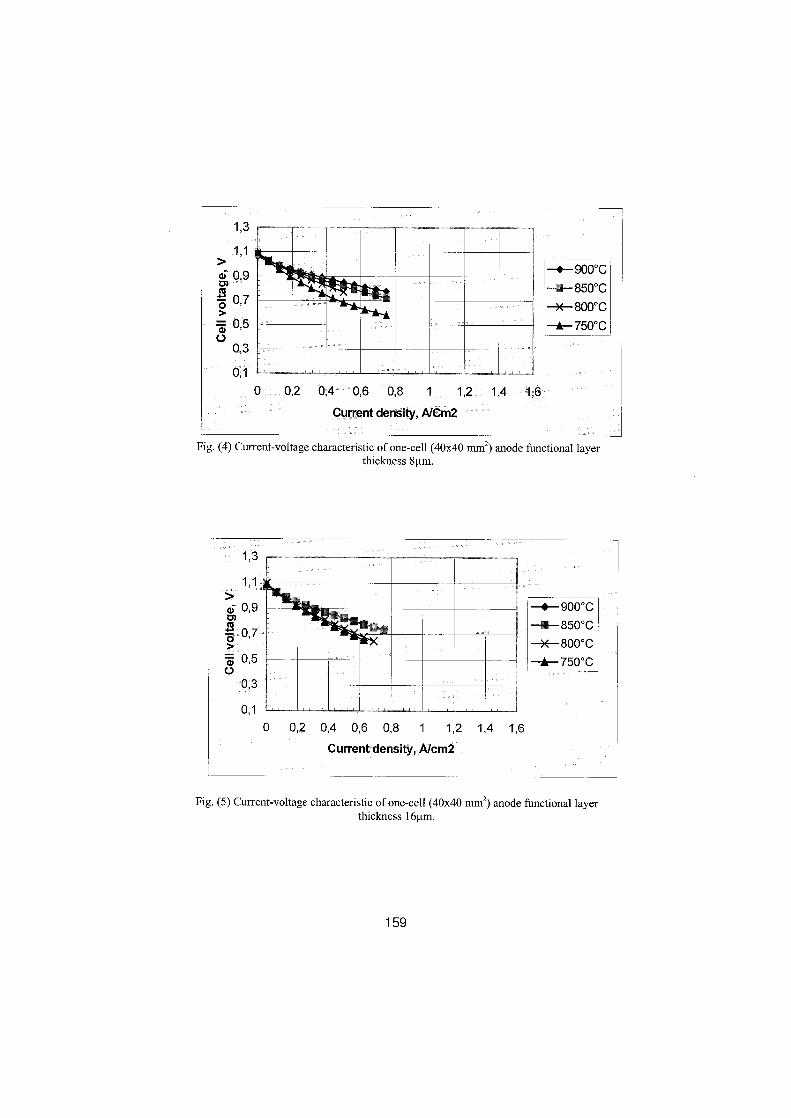
Fig. (4) Current-voltage characteristic of one-cell (40x40 mm2) anode functional layerthiclamess 8gm.
Currentdensity, Alcm2
Fig. (5) Current-voltage characteristic of one-cell (40x40 mm2) anode functional layerthickness 16gm .
159
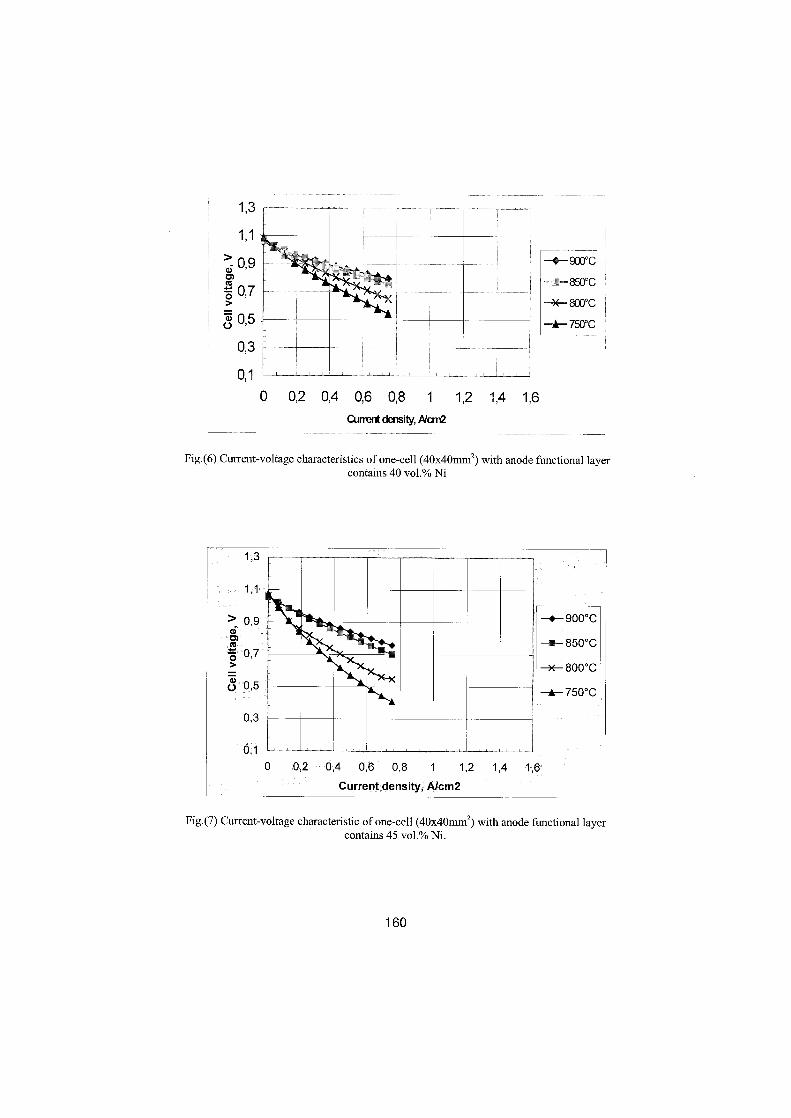
Fig.(6) Current-voltage characteristics of one-cell (40x40mmZ) with anode functional layercontains 40 vol.% Ni
0,2 0,4 0,6 0,8 1 1,2 1 ;4 1-,6Current density, Alcm2
Fig.(7) Current-voltage characteristic of one-cell (40x40mm2) with anode functional layercontains 45 vol.% Ni .
160
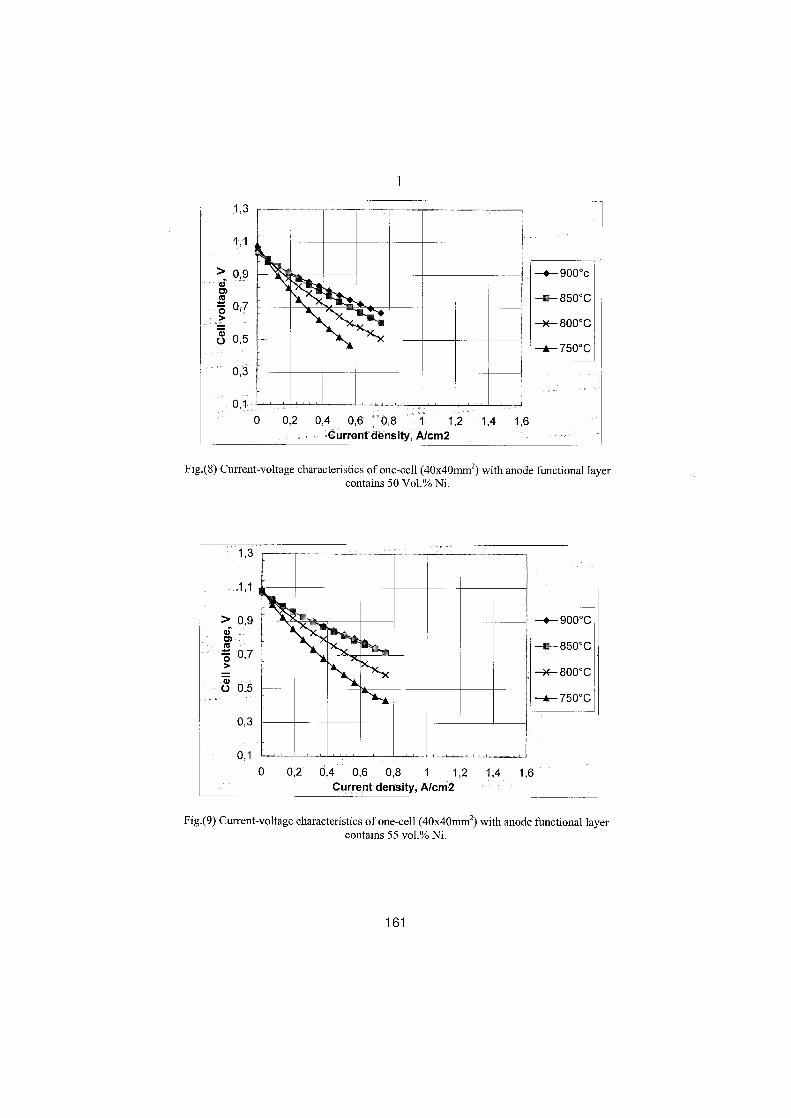
Fig.(8) Current-voltage characteristics ofone-cell (40x40mm2) with anode functional layercontains 50 Vol.% Ni .
0 0,2 0,4 0,6' 0,8 1 1,2 1,4 1,6Current density, A/cm2
0 0,2 0,4 0,6 0,8 1 1,2 1,4Current density, A/cm2
1',6
Fig.(9) Current-voltage characteristics of one-cell (40x40nun2) with anode functional layercontains 55 vol% Ni .
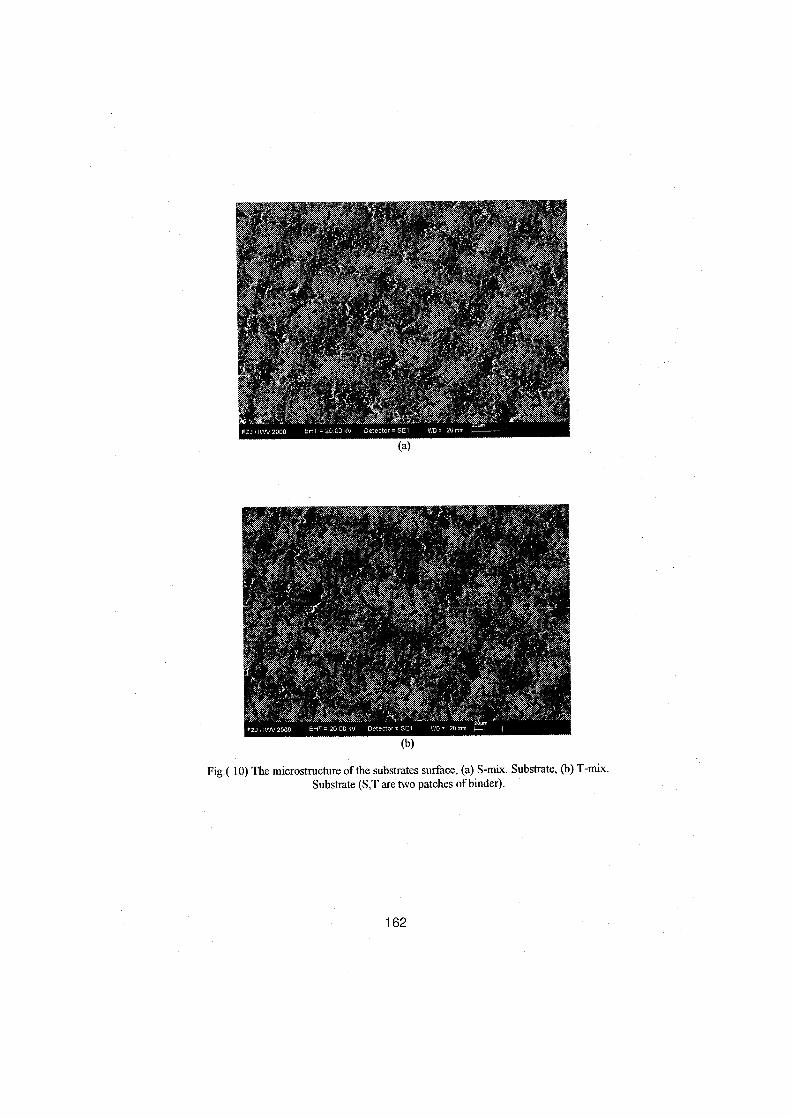
Fig.( 10) The microstructure ofthe substrates surface, (a) S-mix. Substrate, (b) T-mix.Substrate (S,T are two patches ofbinder) .
162
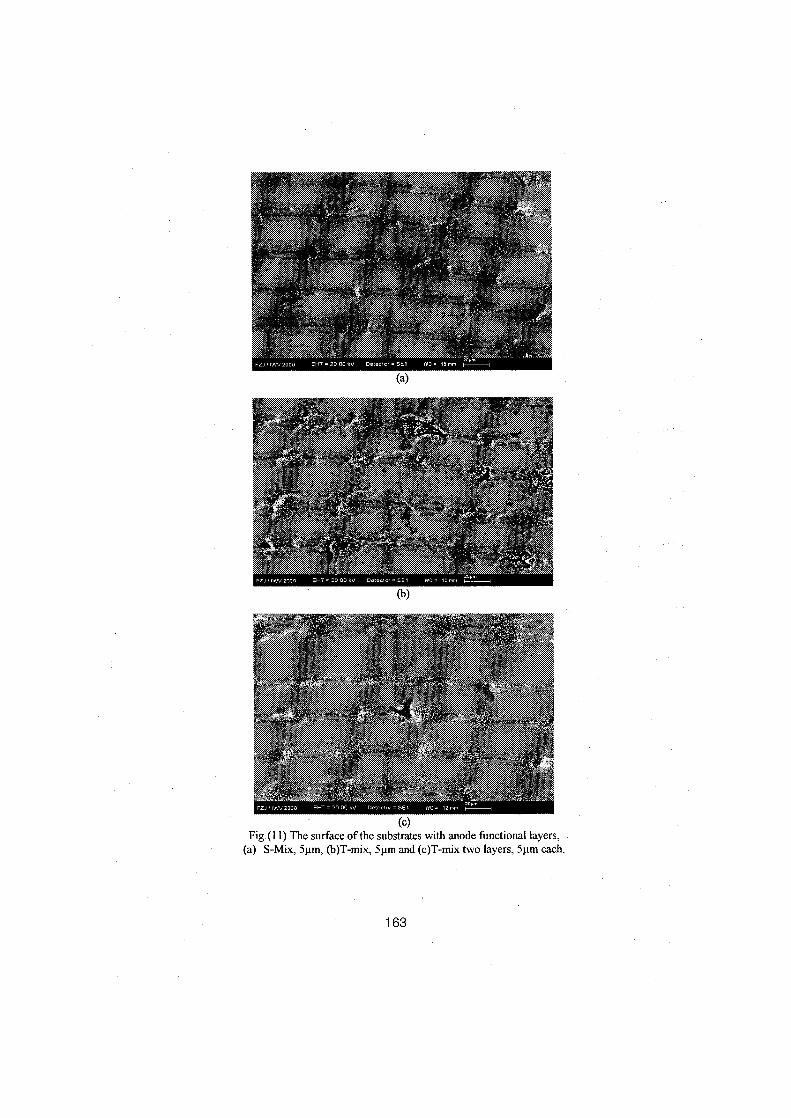
Fig.(11)
The surface ofthe substrates with anode functional layers,
(a)
S-Mix, 5gm, (b)T-mix, 5ktm and (c)T-mix two layers, 5gm each
.
163
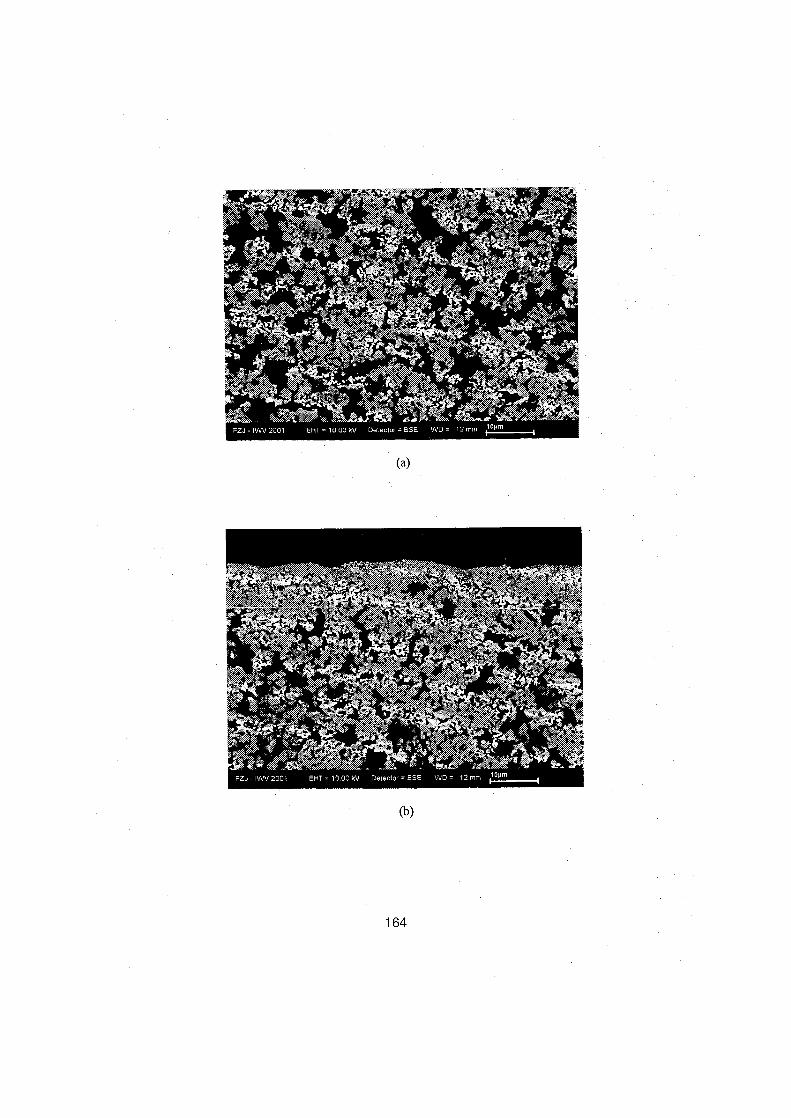
164
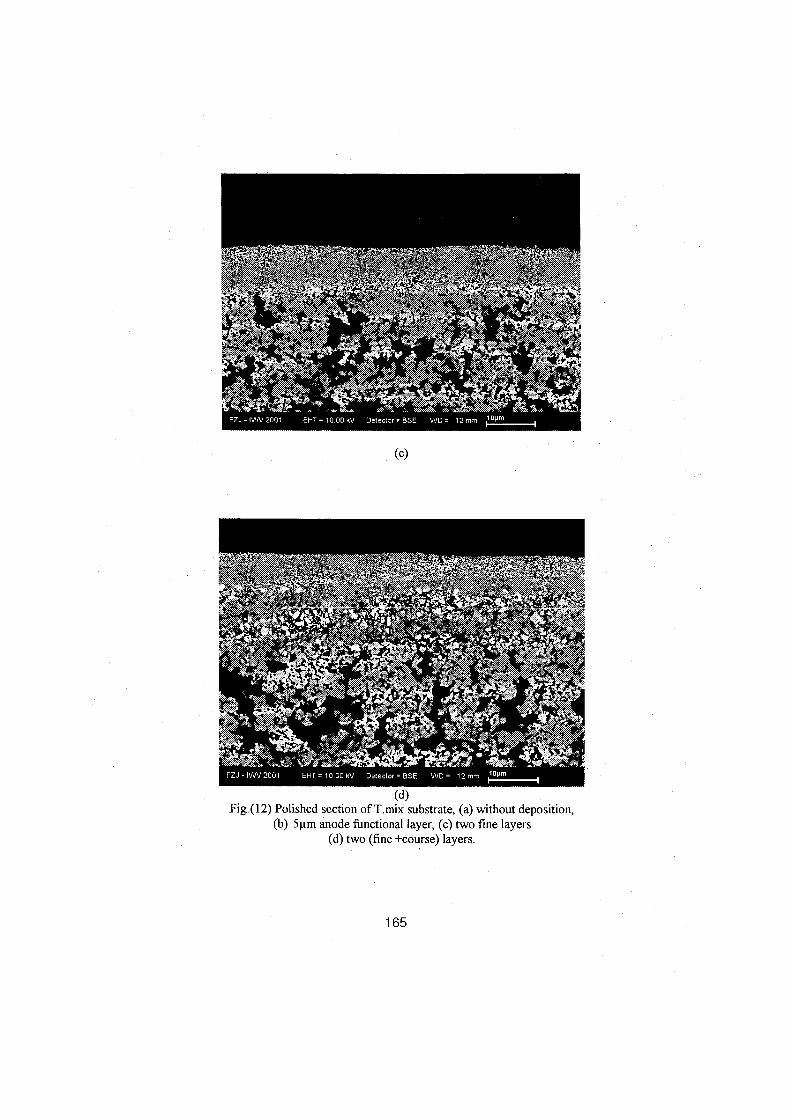
(d)Fig.(12) Polished section ofEmix substrate, (a) without deposition,
(b) 5pm anode functional layer, (c) two fine layers(d) two (fine +course) layers.
165
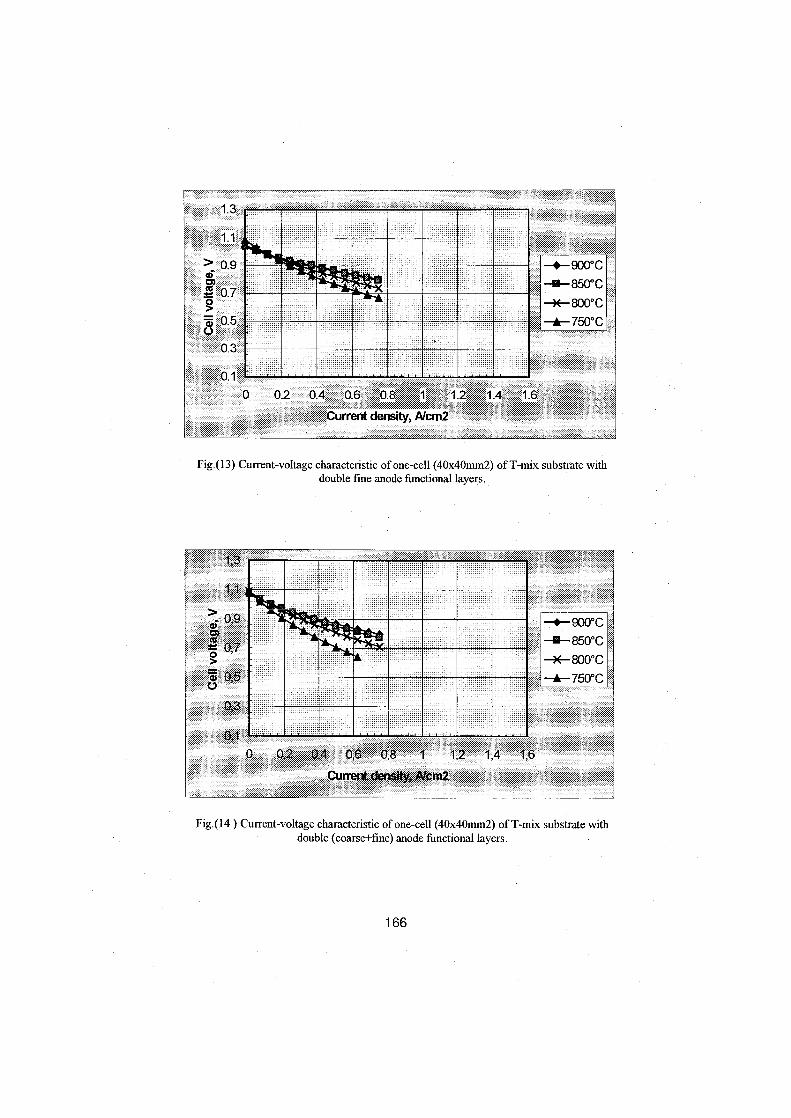
166
Fig.(13) Current-voltage characteristic ofone-cell (40x40nun2) ofT-mix substrate withdouble fine anode functional layers .
Fig.(14 ) Current-voltage characteristic ofone-cell (40x40mm2) ofT-mix substmte withdouble (coarse+fine) anode functional layers .
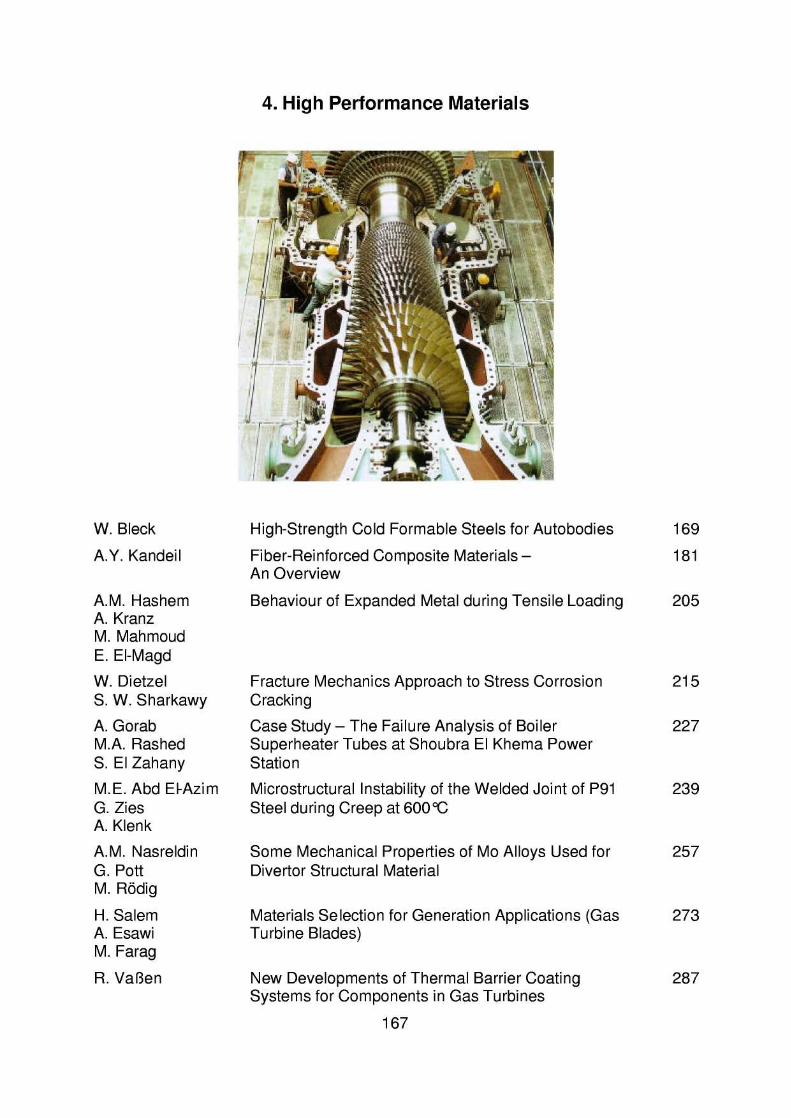
4 . High Performance Materials
167
W. Bleck High-Strength Cold Formable Steels for Autobodies 169
A.Y. Kandeil Fiber-Reinforced Composite Materials- 181An Overview
A.M . Hashem Behaviour of Expanded Metal during Tensile Loading 205A. KranzM . MahmoudE. EI-MagdW. Dietzel Fracture Mechanics Approach to Stress Corrosion 215S. W. Sharkawy CrackingA. Gorab Case Study - The Failure Analysis of Boiler 227M .A . Rashed Superheater Tubes at Shoubra EI Khema PowerS. EI Zahany StationM .E . Abd EkAzim Microstructural Instability of the Welded Joint of P91 239G . Zies Steel during Creep at 600°CA. Klenk
A.M . Nasreldin Some Mechanical Properties of Mo Alloys Used for 257G . Pott Divertor Structural MaterialM . Rödig
H . Salem Materials Selection for Generation Applications (Gas 273A. Esawi Turbine Blades)M . Farag
R . Vaßen New Developments of Thermal Barrier Coating 287Systems for Components in Gas Turbines

High-strength cold formable steels for autobodies
Wolfgang Bleck
Department of Ferrous MetallurgyAachen University ofTecluiology
Intzestraße 1, D-52072 Aachen, Germany
Abstract
Low alloyed multi phase steels are subject to extensive research efforts espe-cially with regard to automotive applications due to their attractive combinationsof mechanical properties . In this paper the microstructural characteristics differ-entiating multi phase steels from conventional cold formable steels are high-lighted. The processing of dual phase steels and TRIP steels is described in de-tail and various alloying concepts are reviewed .
Introduction
For a great variety of applications the enhancement of strength remains one ofthe most important targets of material development. Economical and ecologicalconsiderations have even reinforced this tendency, as elevated strength levelsare a prerequisite for light weight construction in the automotive industry whichhas gained increasing importance during the last years. To maintain or evenstrengthen the competitive position of steel for car body applications in spite ofthe distinctly higher specific weight in comparison wich aluminum, magnesium,and plastic new material concepts have been developed and the maximumstrength level of cold formable steels has been widely extended .
The conventional mechanisms to increase the strength in steel such as solid so-lution hardening or precipitation hardening are all based an an increase of thedislocation density or an increase of the different types of interactions wich thedislocations . Unfortunately, in these cases the higher strength is accompanied bya noticeably inferior formability (Fi ure 1) .
169
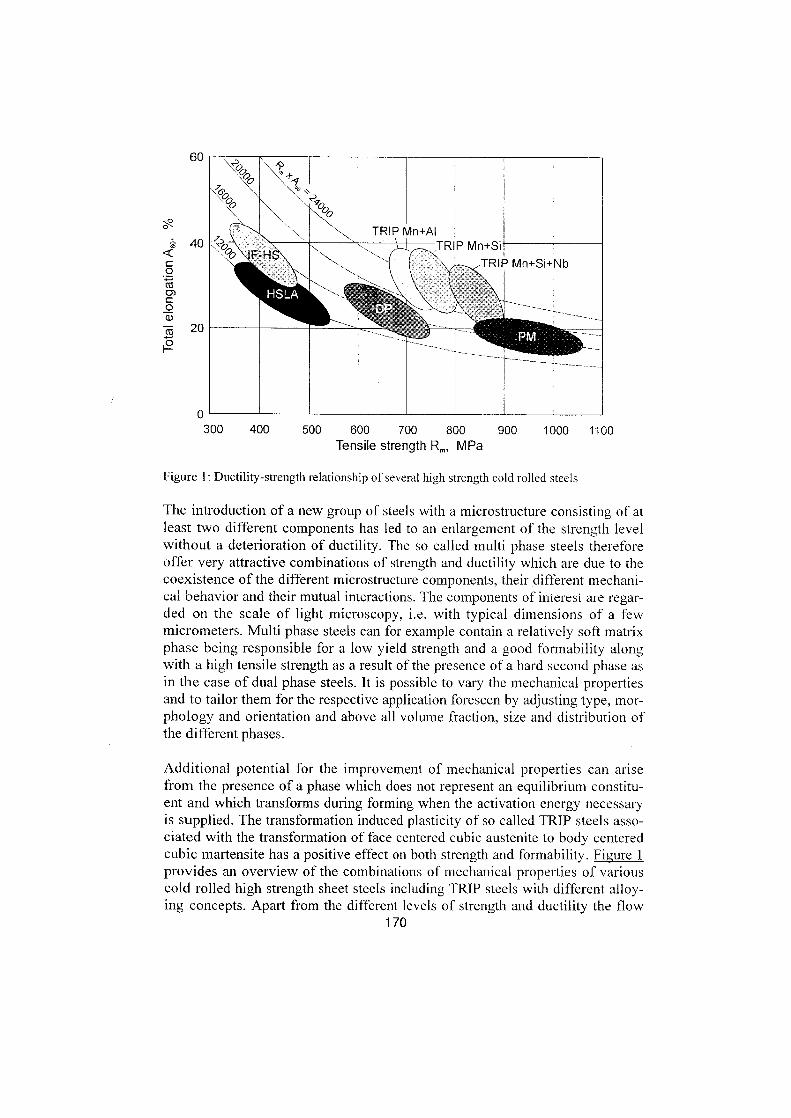
öQc0
c0
H
60
40
20
0300 400 500 600 700 800 900 1000 1100
Tensile strength Rm, MPa
Figure 1 : Ductility-strength relationship ofseveral high strength cold rolled steels
The introduetion of a new group of steels with a microstructure consisting of atleast two different components has led to an enlargement of the strength levelwithout a deterioration of ductility . The so called multi phase steels thereforeoffer very attractive combinations of strength and ductility which are due to thecoexistence of the different microstructure components, their different mechani-cal behavior and their mutual interactions . The components of interest are regar-ded an the scale of light microscopy, i.e . with typical dimensions of a fewmicrometers. Multi phase steels can for example contain a relatively soft matrixphase being responsible for a low yield strength and a good formability alongwith a high tensile strength as a result of the presence of a hard second phase asin the case of dual phase steels . It is possible to vary the mechanical propertiesand to tailor them for the respective application foreseen by adjusting type, mor-phology and orientation and above all volume fraction, size and distribution ofthe different phases .
Additional potential for the improvement of mechanical properties can arisefrom the presence of a phase which does not represent an equilibrium constitu-ent and which transforms during forming when the activation energy necessaryis supplied . The transformation induced plasticity of so called TRIP steels asso-ciated with the transformation of face centered cubic austenite to body centeredcubic martensite has a positive effect an both strength and formability. Fi u~ re 1provides an overview of the combinations of mechanical properties of variousGold rolled high strength sheet steels including TRIP steels with different alloy-ing concepts . Apart from the different levels of strength and ductility the flow
170
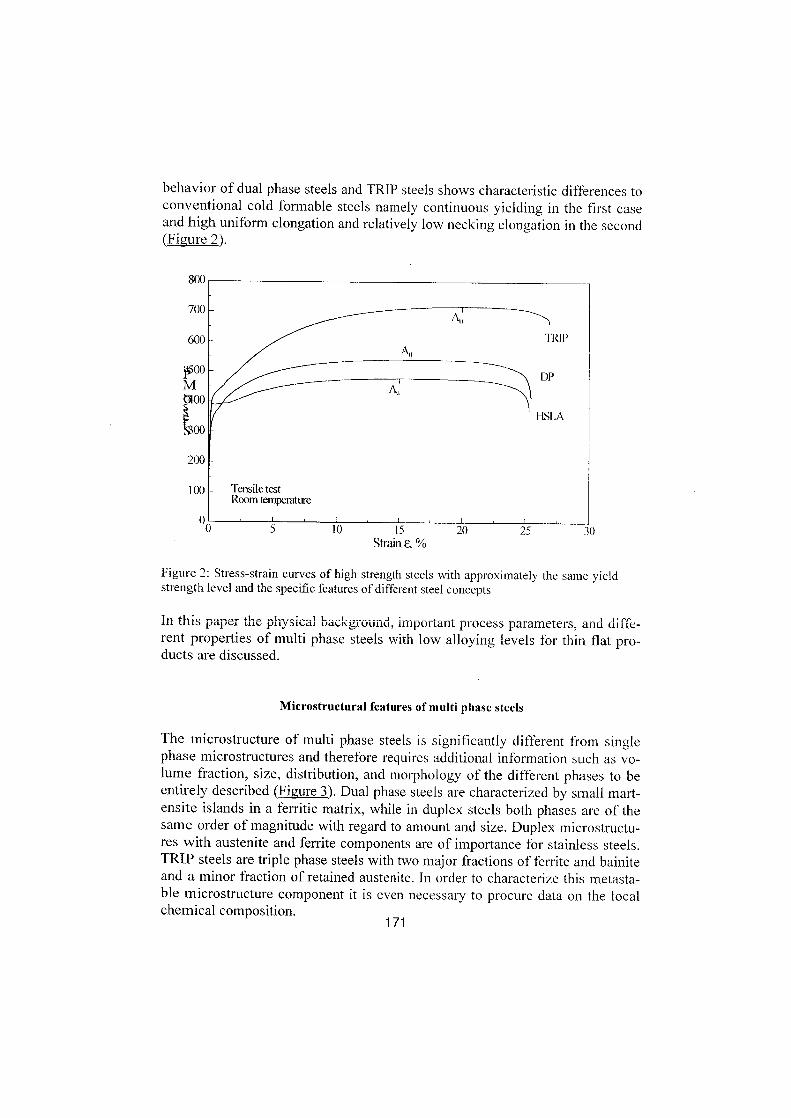
behavior of dual phase steels and TRIP steels shows characteristic differences toconventional cold formable steels namely continuous yielding in the ferst Gaseand high uniform elongation and relatively low necking elongation in the second(Fi ug re 2).
Figure 2 : Stress-strain curves of high strength steels with approximately the saure yieldstrength level and the specific features of different steel concepts
in +II :r pap�r th,. ~t~. . ..: .., .,
,_ .-.. .
a :--ui Laug irci ti,c
uaun~iouilu, ioiiänt process paranieters, an' diffe-rent properties of multi phase steels with low alloying levels for thin flat pro-ducts are discussed .
Microstructural features of multi phase steels
The microstructure of multi phase steels is significantly different from singlephase microstructures and therefore requires additional Information such as vo-lume fraction, size, distribution, and morphology of the different phases to beentirely described (Fi ure 3) . Dual phase steels are characterized by small mart-ensite islands in a ferritic matrix, while in duplex steels both phases are of thesame order of magnitude with regard to amount and size . Duplex microstructu-res with austenite and ferrite components are of importance for stainless steels .TRIP steels are triple phase steels with two major fractions of ferrite and bainiteand a minor fraction of retained austenite. In order to characterize this metasta-ble microstructure component it is even necessary to procure data an the localchemical composition.
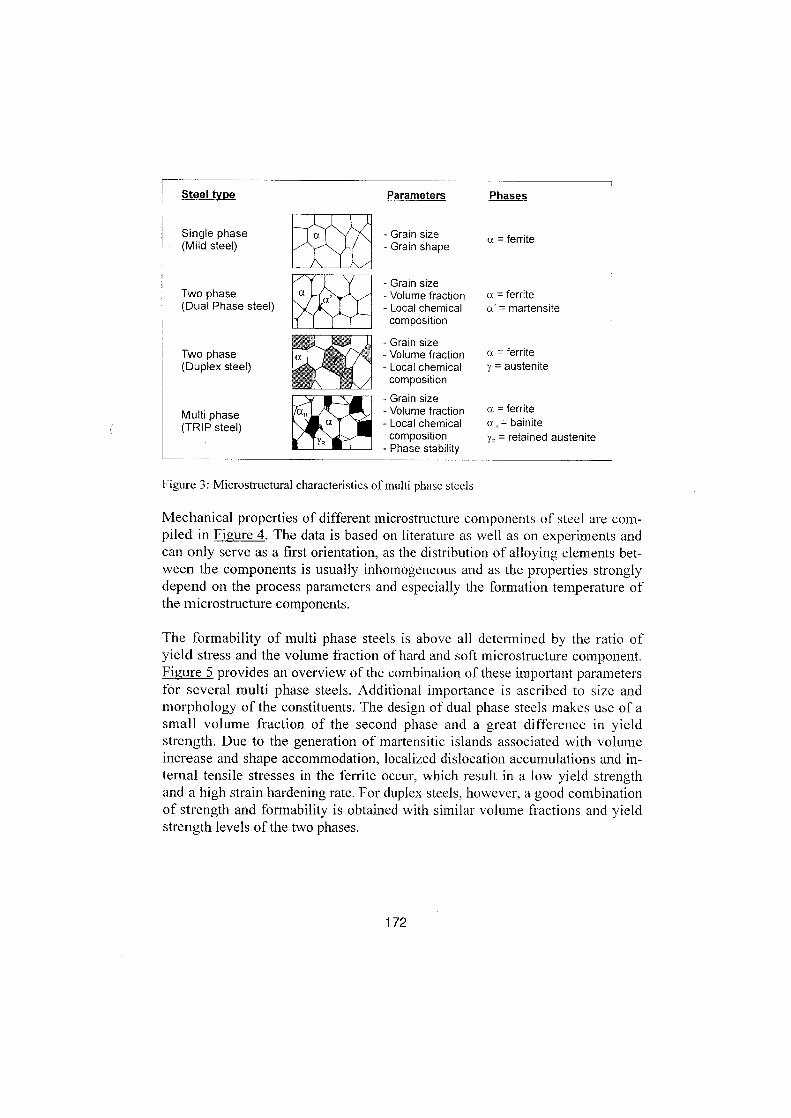
Steel type
Single phase(Mild steel)
Two Phase(Dual Phase steel)
Two Phase(Duplex steel)
Multi phase(TRIP steel)
Figure 3 : Microstructural characteristics ofmulti phase steels
172
Mechanical properties of different microstructure components of steel are com-piled in Fi ure 4. The data is based an literature as well as an experiments andcan only serve as a first orientation, as the distribution of alloying elements bet-ween the components is usually inhomogeneous and as the properties stronglydepend an the process parameters and especially the formation temperature ofthe microstructure components .
The formability of multi phase steels is above all determined by the ratio ofyield stress and the volume fraction of hard and soff microstructure component.Figure 5 provides an overview of the combination of these important parametersfor several multi phase steels . Additional importance is ascribed to size andmorphology of the constituents . The design of dual phase steels makes use of asmall volume fraction of the second phase and a great difference in yieldstrength . Due to the generation of martensitic islands associated with volumeincrease and shape accommodation, localized dislocation accumulations and in-ternal tensile stresses in the ferrite occur, which result in a low yield strengthand a high strain hardening rate . For duplex steels, however, a good combinationof strength and formability is obtained with similar volume fractions and yieldstrength levels of the two phases .
Parameters Phases
- Grain size a = ferrite- Grain shape
- Grain size- Volume fraction a = ferrite- Local chemical a' = martensitecomposition
- Grain size- Volume fraction a = ferrite- Local chemical Y = austenitecomposition
- Grain size- Volume fraction a = ferrite- Local chemical a,; = bainitecomposition yR = retained austenite
- Phase stability
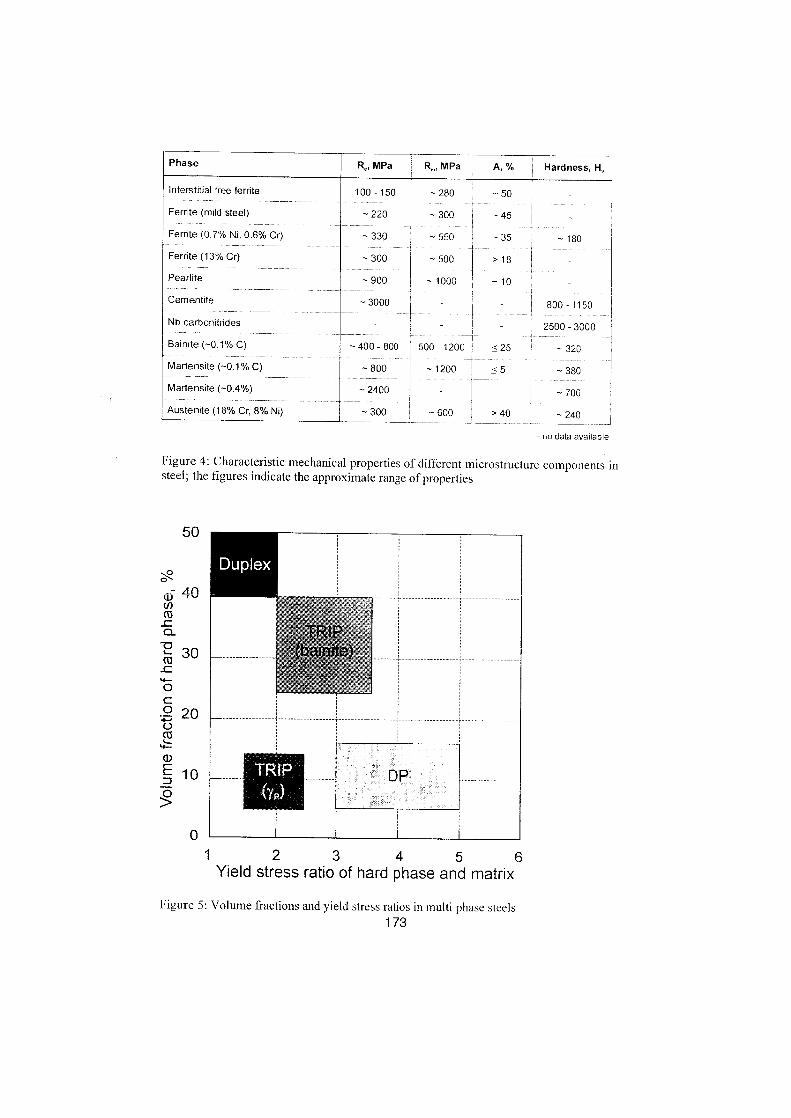
Figure 4 : Characteristic mechanical properties of different microstructure components insteel ; the figures indicate the approximate range of properties
Martensite (-0.1 %C)
Martensite (-0.4%)
40
50
30
OC
2 20UCßv--
1 2 3 4 5 6Yield stress ratio of hard phase and matrix
Figure 5 : Volume fractions and yield stress ratios in multi phase steels173

G
. . .---------- .- .,'
'
Hot rolling
.- .-Casted Strip
---------
---- . . . . . . . . . .. . . . . . . . . .------- .-",
Heat treatment
Processing of multi phase steels
Various process routes for dual phase steels and TRIP steels are either already inuse or are subject to discussion depending an the product. Fi u~ re 6 summarizesthe different routes and demonstrates that hot rolled, Gold rolled and galvanizedend products can be produced for all of them . Other concepts of multi phasesteels such as complex phase steels are not discussed in this paper.
Special attention has to be paid to the cooling strategy when producing hot rol-led multi phase steels . After austenitization and the different steps of rolling inroughing and finishing mill the microstructure and the mechanical properties arefinally adjusted in the cooling section consisting of runout table and coiler . Avariation of the cooling intensity and the cooling temperature allows to changethe transformation behavior and to vary the strength level in a wide range.
p -~-- ------------ --
Cold rolling I--- .
174
HDG : Hot Dip Galvanizing Line
CAL . Continuous Annealing Line
Figure 6: Process routes for hot and cold rolled multi phase steels
COid fG!;E sh7a
The temperature-time-schedule for the production of hot rolled dual phase andTRIP steels is presented schematically in Figure 7.
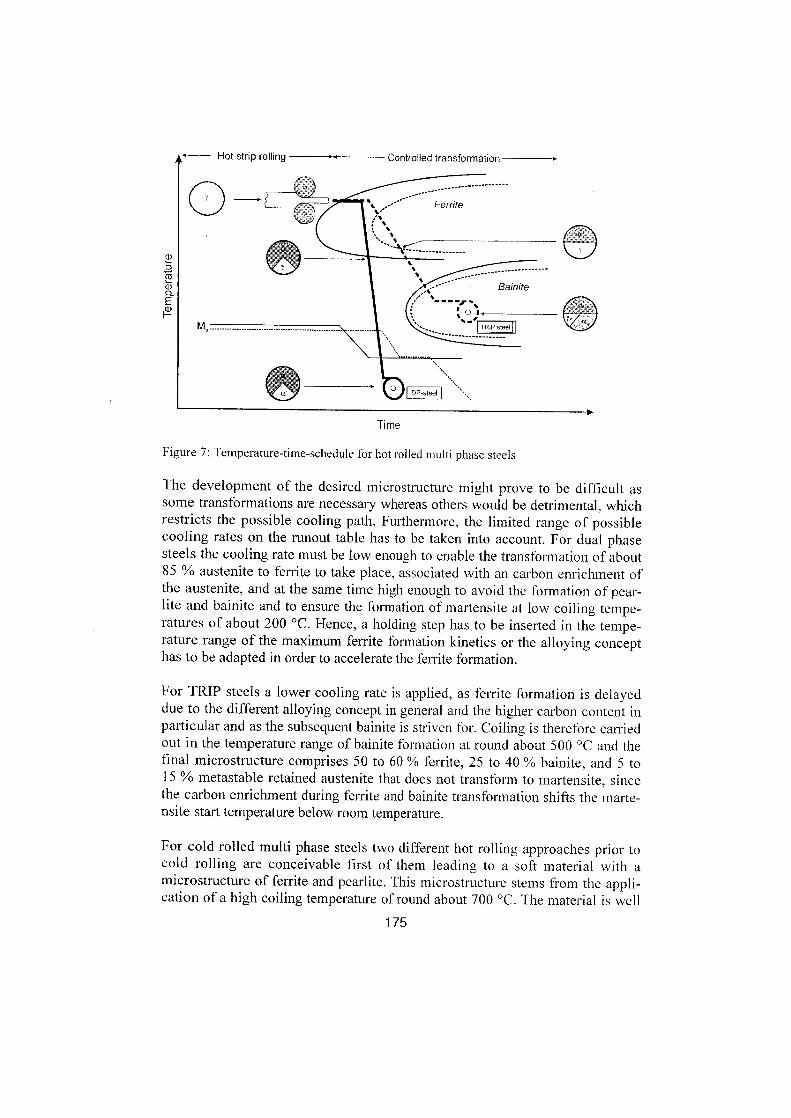
Not strip rolling
Controlled transformation
Ms.__.____ ..... . ._.___... . ._..__ ...
Time
_ TRIP steei
Figure 7 : Temperature-time-schedule for hot rolled multi phase steels
The development of the desired microstructure might prove to be difficult assome transformations are necessary whereas others would be detrimental, whichrestricts the possible cooling path . Furthermore, the limited range of possiblecooling rates an the runout table has to be taken into account. For dual phasesteels the cooling rate must be low enough to enable the transformation of about85 % austenite to ferrite to take place, associated with an carbon enrichment ofthe austenite, and at the saure time high enough to avoid the formation of pear-lite and bainite and to ensure the formation of martensite at low coiling tempe-ratures of about 200 °C . Hence, a holding step has to be inserted in the tempe-rature range of the maximum ferrite formation kinetics or the alloying concepthas to be adapted in order to accelerate the ferrite formation .
For TRIP steels a lower cooling rate is applied, as ferrite formation is delayeddue to the different alloying concept in general and the higher carbon content inparticular and as the subsequent bainite is striven for. Coiling is therefore carriedout in the temperature range ofbainite formation at round about 500 °C and thefinal microstructure comprises 50 to 60 % ferrite, 25 to 40 % bainite, and 5 to15 % metastable retained austenite that does not transform to martensite, sincethe carbon enrichment during ferrite and bainite transformation shifts the marte-nsite start temperature below room temperature.
For Gold rolled multi phase steels two different hot rolling approaches prior tocold rolling are conceivable first of them leading to a soft material with amicrostructure of ferrite and pearlite . This microstructure stems from the appli-cation of a high coiling temperature of round about 700 °C . The material is well
175
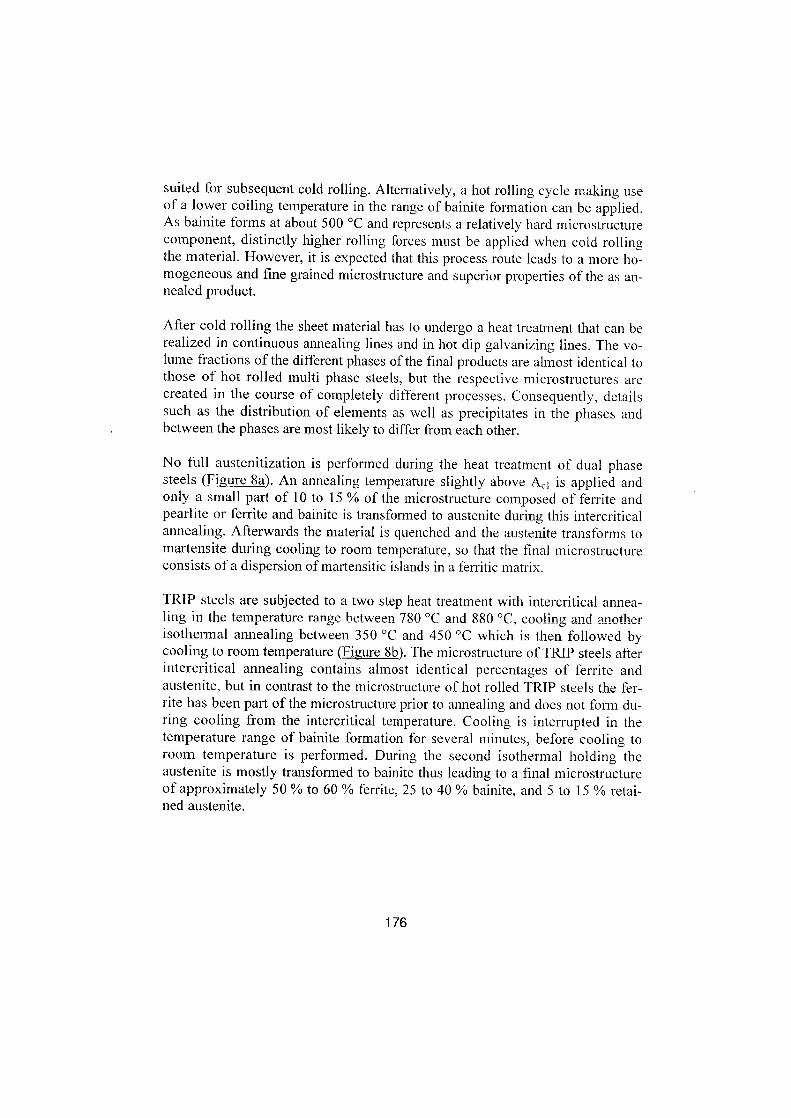
suited for subsequent Gold rolling. Alternatively, a hot rolling cycle making useof a lower cooling temperature in the range of bainite formation can be applied.As bainite forms at about 500 °C and represents a relatively hard microstructurecomponent, distinetly higher rolling forces must be applied when cold rollingthe material . However, it is expected that this process route leads to a more ho-mogeneous and fine grained microstructure and superior properties of the as an-nealed product.
After Gold rolling the sheet material has to undergo a heat treatment that can berealized in continuous annealing lines and in hot dip galvanizing lines . The vo-lume fractions of the different phases ofthe final products are almost identical tothose of hot rolled multi Phase steels, but the respective microstructures arecreated in the course of completely different processes . Consequently, detailssuch as the distribution of elements as well as precipitates in the phases andbetween the phases are most likely to differ from each other.
No füll austenitization is performed during the heat treatment of dual Phasesteels (Fi ure 8a). An annealing temperature slightly above A� is applied andonly a small part of 10 to 15 % of the microstructure composed of ferrite andpearlite or ferrite and bainite is transformed to austenite during this intercriticalannealing . Afterwards the material is quenched and the austenite transforms tomartensite during cooling to room temperature, so that the final microstructureconsists of a dispersion ofmartensitic islands in a ferritic matrix .
TRIP steels are subjected to a two step heat treatment with intercritical annea-llng in the tetYtneratU_re range between_ 780 'C a_n_r_l 880 °Ccnnli_nv_
anrl annthPro d
isothermal annealing between 350 °C and 450 °C which is then followed bycooling to room temperature (Fi ug reSb). The microstructure of TRIP steels afterintercritical annealing contains almost identical percentages of ferrite andaustenite, but in contrast to the microstructure of hot rolled TRIP steels the fer-rite has been part of the microstructure prior to annealing and does not form du-ring cooling from the intercritical temperature. Cooling is interrupted in thetemperature range of bainite formation for several minutes, before cooling toroom temperature is performed . During the second isothermal holding theaustenite is mostly transformed to bainite thus leading to a final microstructureof approximately 50 % to 60 % ferrite, 25 to 40 % bainite, and 5 to 15 % retai-ned austenite .
176
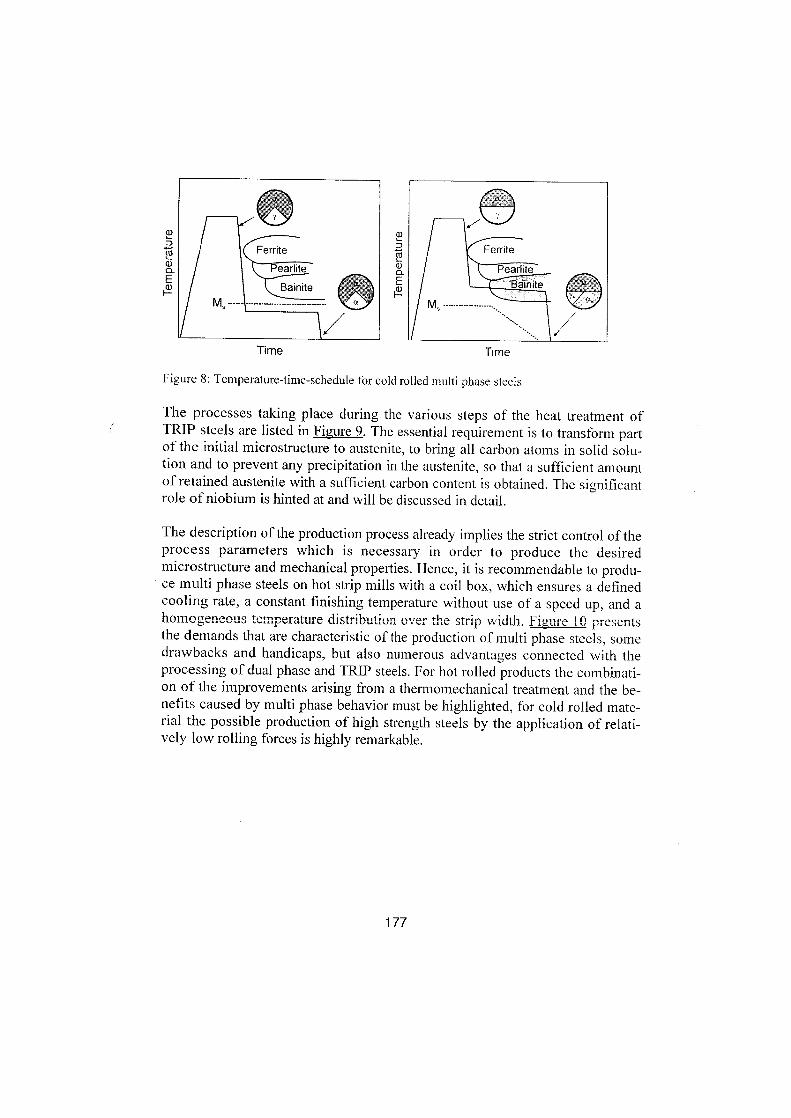
Figure 8 : Temperature-time-schedule for cold rolled multi phase steels
The processes taking place during the various steps of the heat treatment ofTRIP steels are listed in Fi ure 9. The essential requirement is to transform partof the initial microstructure to austenite, to bring all carbon atoms in solid solu-tion and to prevent any precipitation in the austenite, so that a sufficient amountof retained austenite with a sufficient carbon content is obtained . The significantrole of niobium is hinted at and will be discussed in detail .
The description of the production process already implies the strict control oftheprocess parameters which is necessary in order to produce the desiredmicrostructure and mechanical properties . Hence, it is recommendable to produ-ce multi phase steels an hot strip mills with a coil box, which ensures a definedcooling rate, a constant finishing temperature without use of a speed up, and a}homo eneous tem�eratme distributton ov'er the strip
r',
10
-r
~y 'riuua . i T üre i
piesen'sthe demands that are characteristic of the production of multi phase steels, somedrawbacks and handicaps, but also numerous advantages connected with theprocessing of dual phase and TRIP steels . For hot rolled products the combinati-on of the improvements arising from a thermomechanical treatment and the be-nefits caused by multi phase behavior must be highlighted, for Gold rolled mate-rial the possible production of high strength steels by the application of relati-vely low rolling forces is highly remarkable .
177
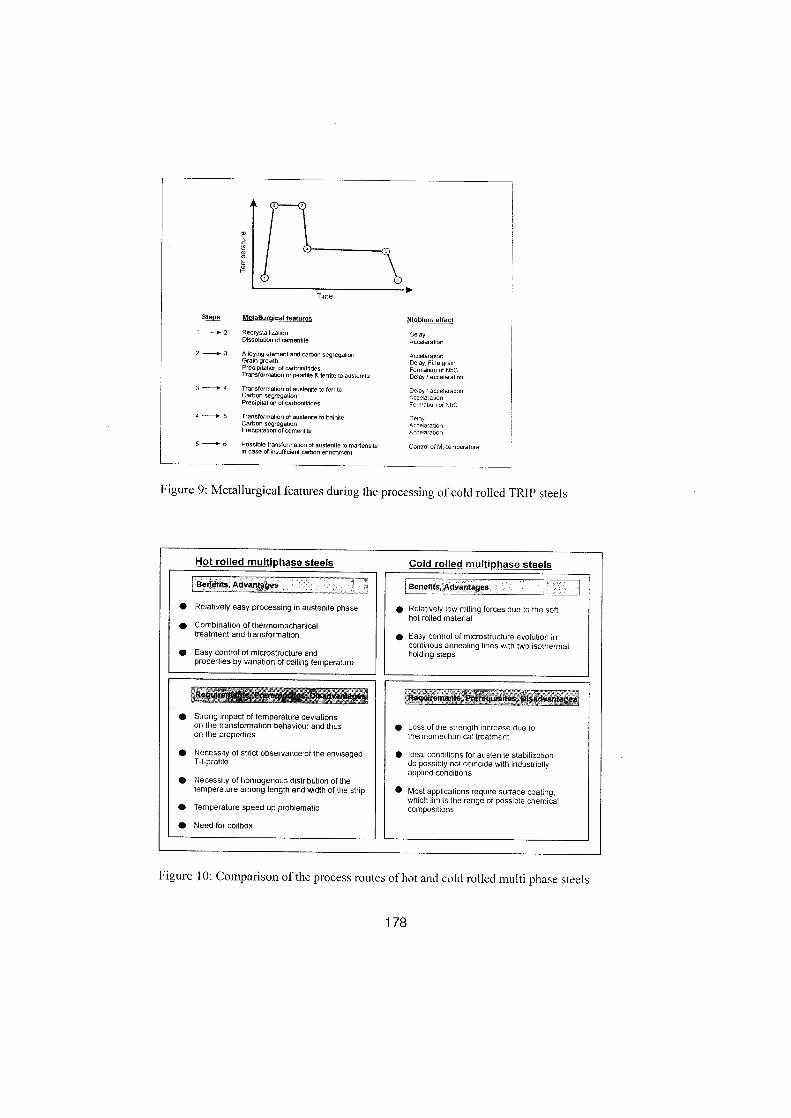
Figure 9 : Metallurgical features during the processing of cold rolled TRIP steels
Figure 10 : Comparison of the process routes of hot and cold rolled multi phase steels
178
Hot rolled multiahase steels Cold rolled multiphase steels
~_-_ _ . _
Benehts,.Advantages,.._ genehts.
--,Ativantages- -
" Relatively easy processing in austenite phase 0 Relatively low rolling forces due to the soffhot rolled material
Combination of thermomechanicaltreatment and transformation 9 Easy Control of microstructure evolution in
continous annealing lines with two isothermalEasy Control of microstructure and holding stepsproperties by vadation of coiling temperature
Hequirements, Preroquisnes,. pttiadvantayos, Req~7rarnents, PYOreyu ,ltes . Uisasvantagex .
Strong impact of temperature deviationsan the transformation behaviour and thus 0 Loss of the strength increase due toan the properties thermomechanical treatment
Necessity of stritt observance-of the envisaged 0 Ideal conditions for austenite stabilizationT-t-profile do possibly not coincide with industrially
applied conditionsNecessity of homogenous distribution of thetemperature among length and width of the strip " Most applications require surface coating,
which limits the range of possible chemicai" Temperature speed up problematic compositions
" Need for coilbox
Time
St_ BDS Metallurgical features Niobium effect
1 -~2 Recrystallization DelayDissolution of cemenfte Accearation
2-s3 Alloying elementand carbon segregation .4ccelarationGrain growlh Delay. Fine grainPrecipitation of earbonitndes Formation of NbCTransformation of pearfte %finite to austenite Delay 1 accelaration
Transformation of austenite to finite Delay 1 accelerationCarbon segregation Accelar.UonPrecipitation of carbonitrides Formation of NbC
4- 5 Transformation of austenite to bainite DemyCarbon segregation AccetaraaonPrecipitabon of-mantitt, Accelarat,on
Possible transformation of austenite to madensite Controlof M, temperaturein case of imufficient carbon enrichment

Future aspeets
The new developed high-strength steels combine good formability and a veryhigh strength level, by this enabling the automotive user to design light-weightcar bodies . These steels have been developed to cope with the challenge of lo-wer density metals like alumium and magnesium . The full exploitation of steeldesign can be obtained when these new steels are combined with new formingand joining techniques like hydroforminjg, laser welding and mechanical joi-ning . The can be favorably used in tailored blanks, which are laser-weldedblanks made from different sheets in order to otimize strength and thickness lo-cally within an automotive component. It will be of great importance for the fu-ture prospects to develop computational tools to predict the material behaviourduring forming, joining but also during performance in the car body.

180
FIBER - REINFORCEDCOMPOSITE MATERIALS
- AN OVERVIEW -
A. Y. KANDEIL
Professor, College of Engineering and TechnologyArab Academy for Science and Technology
OUTLINE:
INTRODUCTION
FABRICATION METHODS
FLOW AND FRACTURE BEHAVIOR
FORMING LIMITS
CONTROLVOID FORMATION
CONCLUDING REMARKS

U0afw
w MAR M200+MIMAR M-200+Mi, RENE 80, 8-1900
UDIMET 700
USE TEMPOVERPAST 50 YEARS FOR RIGATEMP APPLICATIONS
TEMP AND STRESS DISTRIBUTION INA TURBINE BLADE
182
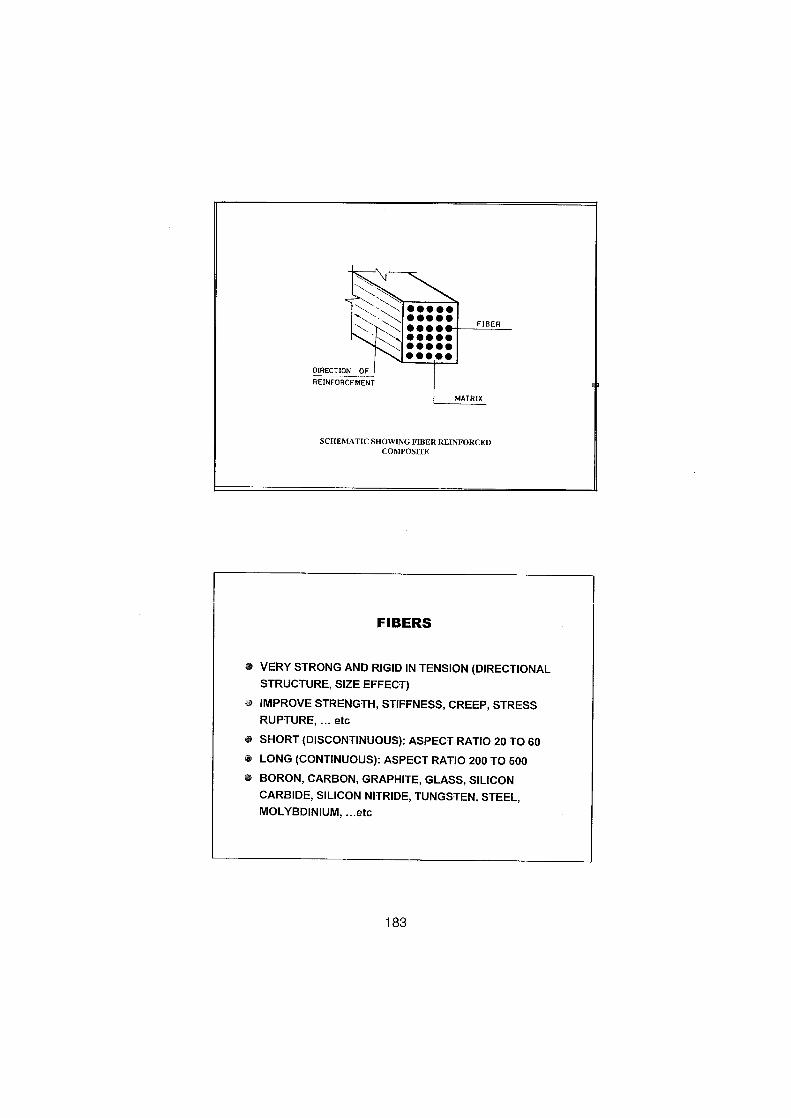
SCHEMATIC SHOWING FIBERREINFORCEDCOMFOSITE
VERY STRONG AND RIGID IN TENSION (DIRECTIONALSTRUCTURE, SIZE EFFECT)
IMPROVE STRENGTH, STIFFNESS, CREEP, STRESSRUPTURE, . . . etc
SHORT (DISCONTINUOUS) : ASPECT RATIO 20 TO 60LONG (CONTINUOUS) : ASPECT RATIO 200 TO 500BORON, CARBON, GRAPHITE, GLASS, SILICONCARBIDE, SILICON NITRIDE, TUNGSTEN, STEEL,MOLYBDINIUM, . . .etc
FIBERS
183
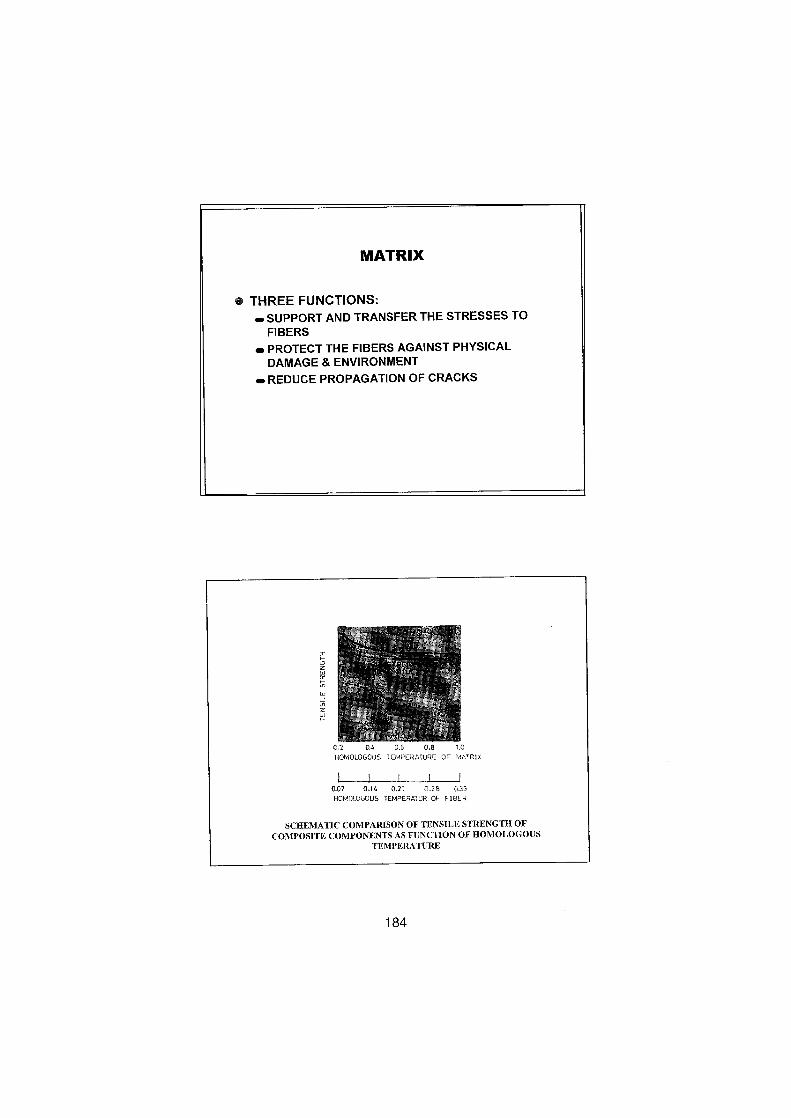
MATRIX
THREE FUNCTIONS :mSUPPORT AND TRANSFER THE STRESSES TOFIBERS
m PROTECT THE FIBERS AGAINST PHYSICALDAMAGE & ENVIRONMENT
mREDUCE PROPAGATION OF CRACKS
UZW
Z41
0 ., 0.4 0., 0.8NOM-3LOGGUS 7EMPERATURE OF MATRix
j
1
I
1
fOAJ 0_14 0.21 11 .7a 0.35HOMOLOGOUS TEMPERATUR OF FIBER
SCHEMATIC COMPARISON OF TENSILE STRENGTH OFCOMPOSFiE COMPONENTS AS FUNCTION OF HOMOLOGOUS
TEMPERATURE
184
APPLICATIONS OF ADVANCED FIBERREINFORCED COMPOSITES
ADVANCED ENGINES FOR SUPERSONIC AIRCRAFTS
TURBINES FOR HIGH-SPEED GROUNDTRANSPORTATION
ELECTRIC POWER GENERATION, HEAT EXCHANGERTUBES
SPACE APPLICATIONS SUCH AS REENTRY SKINSTRUCTURES, ROCKET GUIDE VANES, ADVANCEDROCKET ENGINES, . . .etc
HIGH TEMPERATURE STABILITY
TENSILE AND IMPACT PROPERTIES
OXIDATION RESISTANCE
CREEP RUPTURE STRENGTH
THERMAL FATIGUE RESISTANCE
DENSITY
MATRIAL REQUIREMENTS FORADVANCED COMPOSITES
185
DISSOLUTIION OF FIBER IN MATRIX
CHEMICAL REACTION BETWEEN FIBER AND MATRIX
RECRYSTALLIZATION OF FIBERS
GRAIN BOUNDARY EMBRITTLEMENT OF FIBERSDUE TO MATRIX DIFFUSION
INTERNAL STRESSES RESULTING FROM THERMAL
EXPANSION MISMATCH BETWEEN FIBERS ANDMATRIX
FORMS OF INTERACTIONS BETWEENFIBER AND MATRIX
APPROACHES TO MINIMIZE COMPATIBILITYPROBLEMS
HIGH SPEED PROCESSING
LOWTEMPERATURE PROCESSING
DEVELOPMENT OF LOW REACTIVITY MATRICES
APPLICATION OF DIFFUSION BARRIER (COATING)
DESIGN TO MINIMIZE EFFECT OF REDUCED
STRENGTH
186
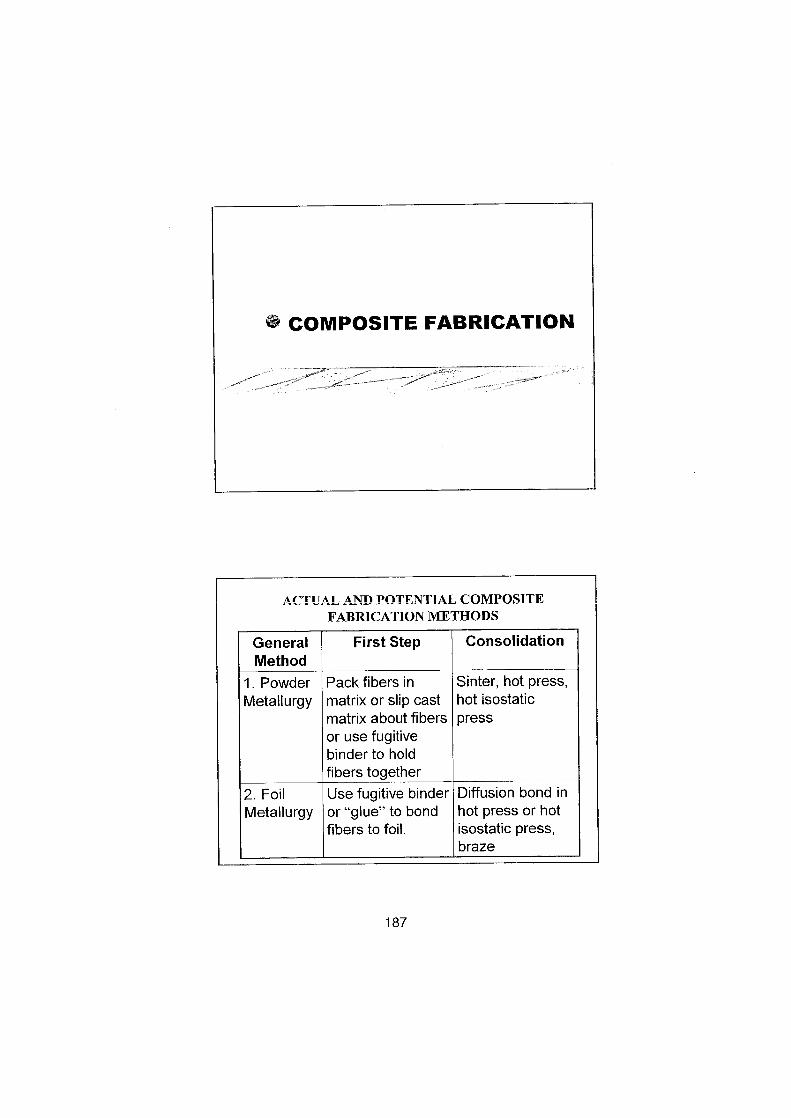
187
ACTiTAT.ND POTENT_I_AT. COMPOSITEFABRICATION METRODS
General First Step ConsolidationMethod
1 . Powder Pack fibers in Sinter, hot press,Metallurgy matrix or slip cast hot isostatic
matrix about fibers pressor use fugitivebinder to holdfibers together
2. Foil Use fugitive binder Diffusion bond inMetallurgy or "glue" to bond hot press or hot
fibers to foil . isostatic press,braze
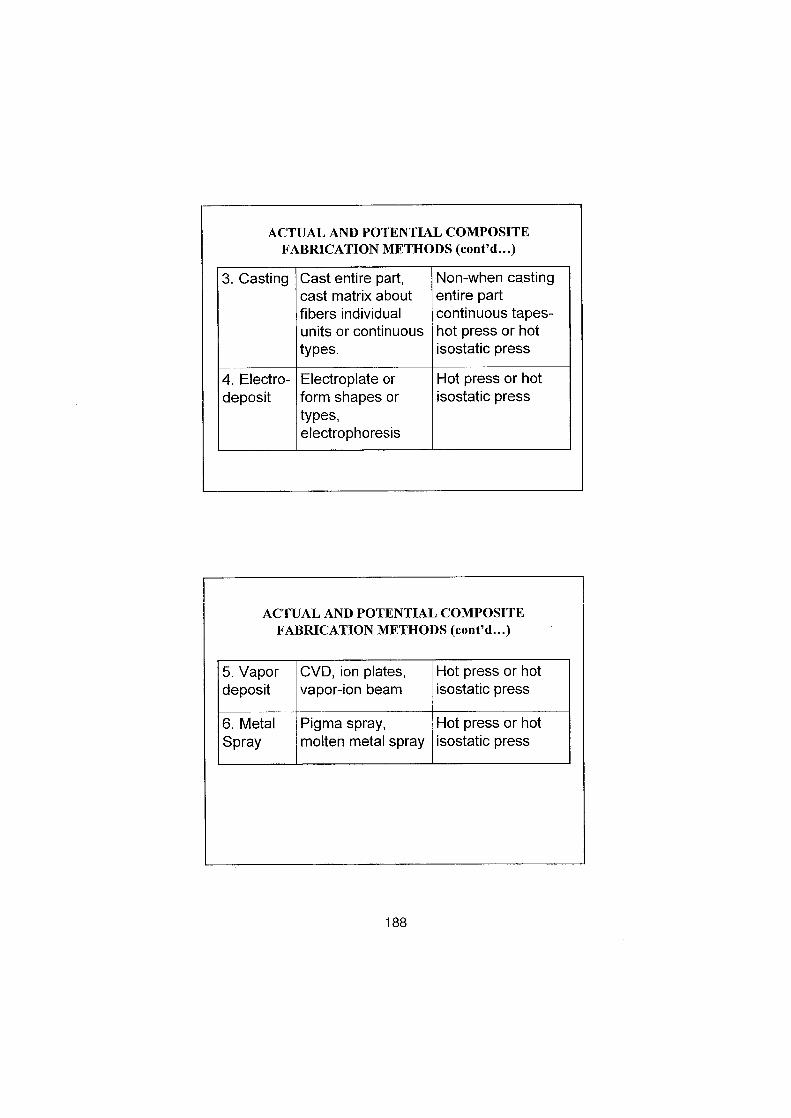
188
ACTUAL AND POTENTIAL COMPOSITEFABRICATION METHODS (cont'd . . .)
3 . Casting Cast entire part, Non-when castingcast matrix about entire parifibers individual continuous tapes-units or continuous hot press or hottypes. isostatic press
4. Electro- Electroplate or Hot press or hotdeposit form shapes or isostatic press
types,electrophoresis
ACTUAL AND POTENTIAL COMPOSITEFABRICATION METHODS (cont'd . . .)
5. Vapordeposit
CVD, ion plates,vapor-ion beam
Hot press or hotisostatic press
6. MetalSpray
Pigma spray,molten metal spray
Hot press or hotisostatic press

FIBBES
METAL;2sf; PGWOER
iSLURRY
i
U TUBE
SLIP,.LAST
ENCASEewrr~F.~
ISOSTATICALLY HOT PRESS
SINTER
COMPOSITE BILLET FABRICATION BY SLIPCASTINGSINTERING-HIPING
APPLY ALUMINUM
CUT TO
LAY UP
VACUUMFOIL
SXAPE
DESIREO
INCAPSULATEFILES
189
TO VACUUM
Ykf R~HEXT TO
APPLY PRESSURE
COOL . RENOYE .
FARBKATION
ANO »MD FOR
ANO CLEAN PART
TEMPERATURE
CONSOLIOATION CYCLE
DIFFUSION BONDINGPROCESSOF MAKING FIBERREINFORCED METALMATRIX COMPOSITES
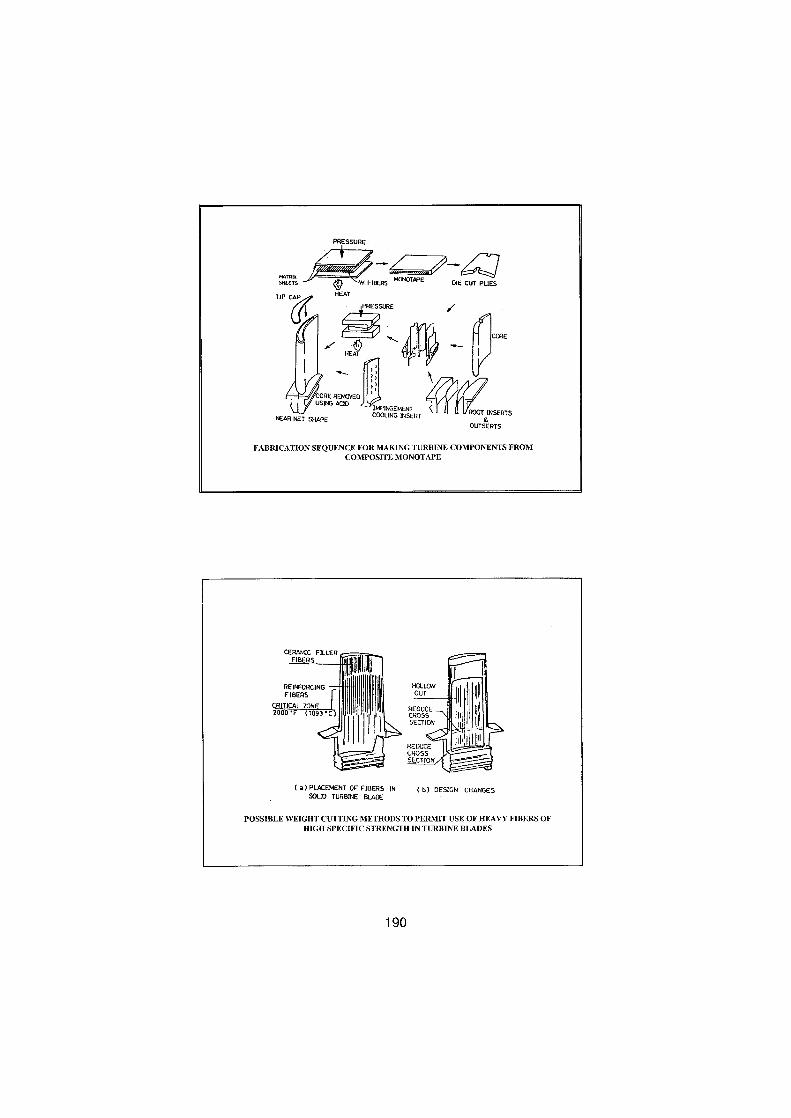
_FIkSNEETS
PRESSURE
COMPOSITE MONOTAPEFABRICATIONSEQUENCE FORMAKINGTURBINE COMPONENTS FROM
( A) PLACEMENT OF FIBERS INSOLID TURBINE BLADE
POSSIBLE WEIGHT CUTTINGMETHODS TO PERMIT USE OF HEAVY FIBERS OFHIGH SPECIFIC STRENGTH IN TURBINE BLADES
190
( b) DESIGN CNANGES
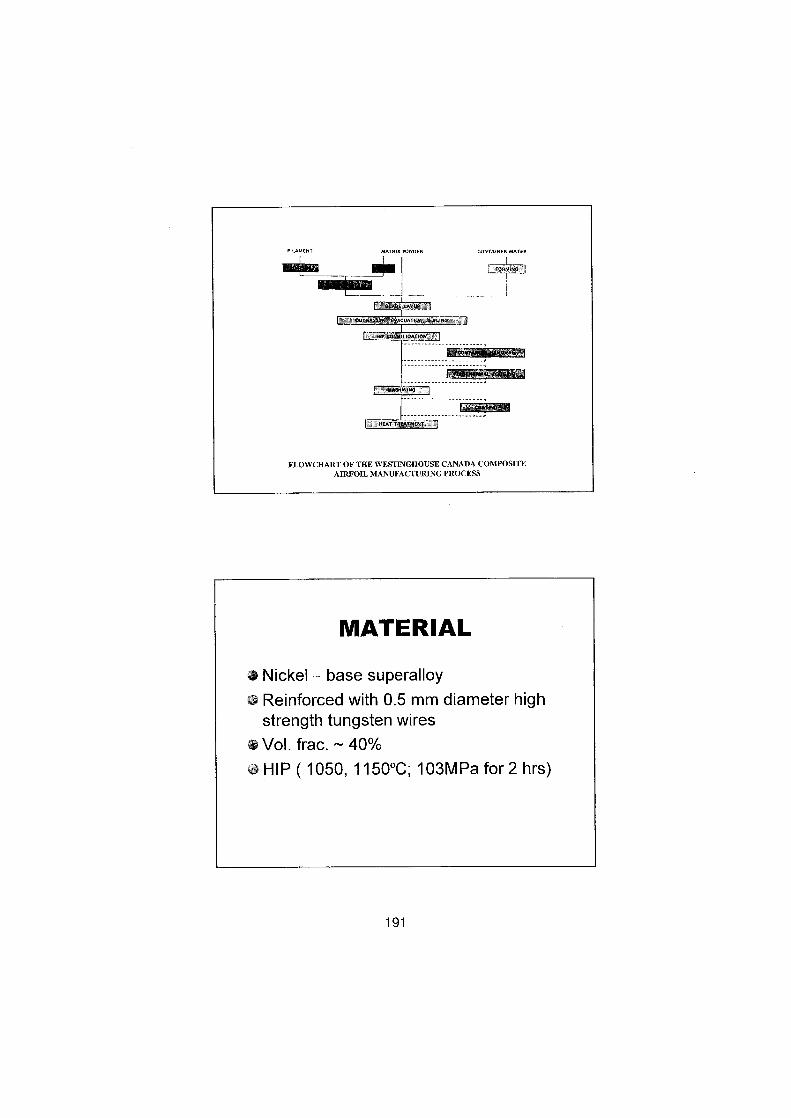
FLOWCRART OFTHEWESTINGROUSE CANADA COMPOSITEAIRFOIL MANUFACTURINGPROCESS
MATERIALNickel - base superalloyReinforced with 0 .5 mm diameter highstrength tungsten wiresVol. frac . - 40%HIP ( 1050, 1150DC ; 103MPa for 2 hrs)
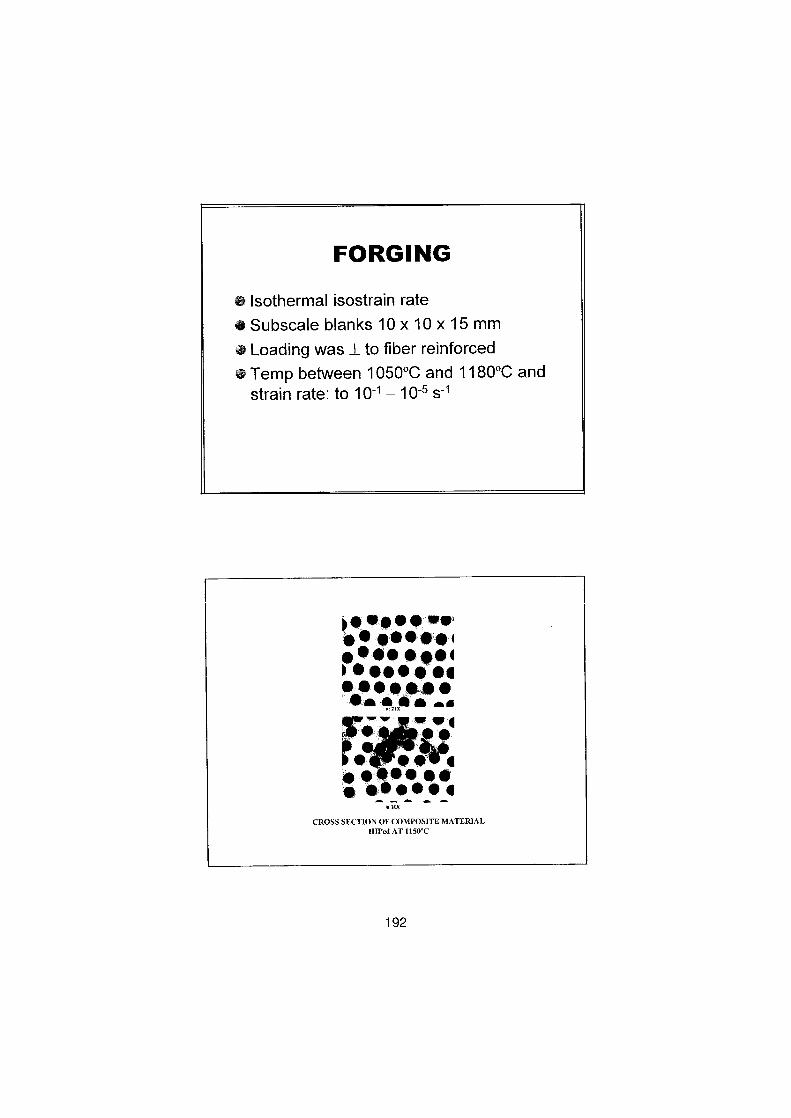
FORGING
Isothermal isostrain rateSubscale blanks 10 x 10 x 15 mmLoading was 1 to fiber reinforcedTemp between 1050°C and 1180°C andstrain rate : to 10 - ' -10-5 s- '
(0*Wo 0
4696!
CROSS SECTION OF COMPOSITEMATERIALIllPed AT 1150°C
192
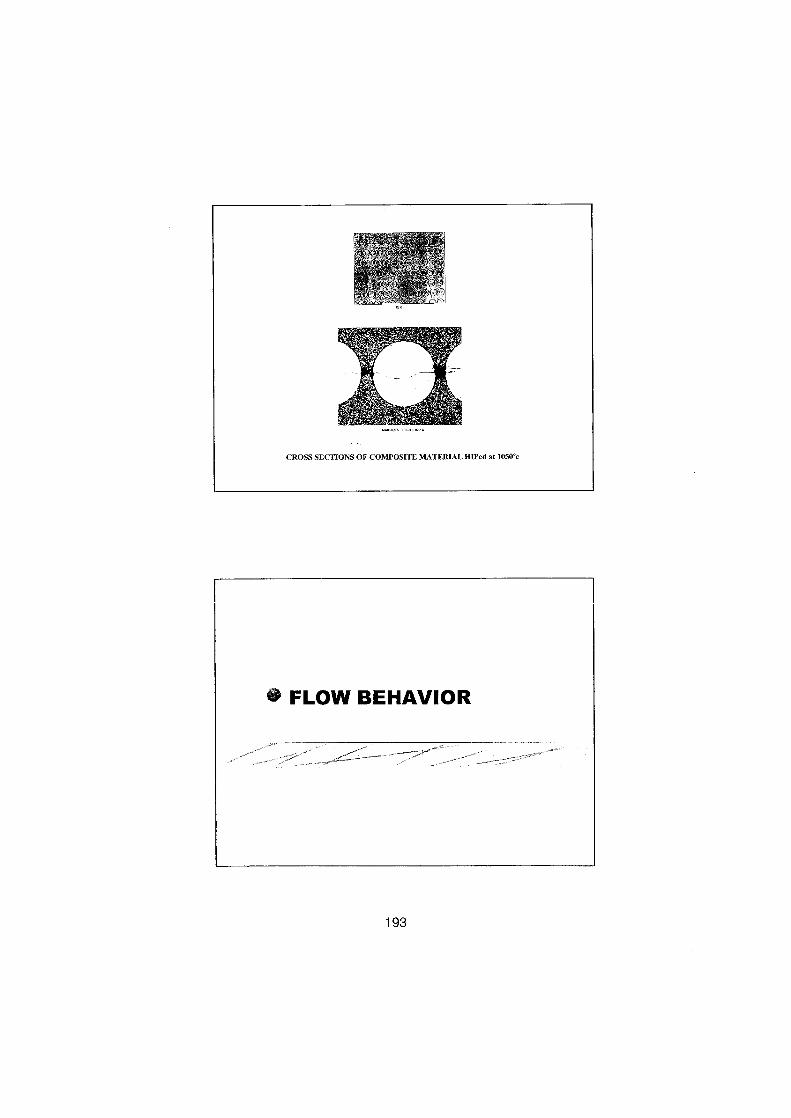
FLOW BEHAVIOR
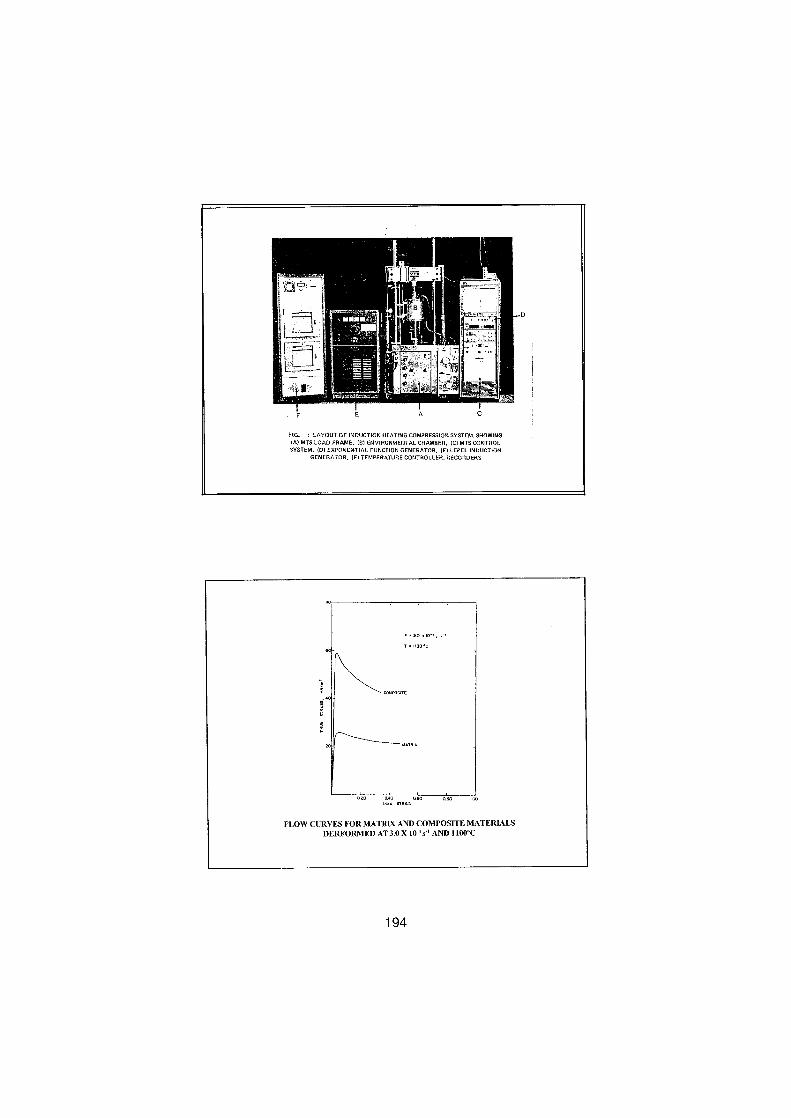
FIG .
: LAYOUT OF INDUCTION HEATING COMPRESSION SYSTEM, SHOWING(A)MTSLOADFRAME, (8)ENVIRONMENTALCHAMBER, (CIMTSCONTROLSYSTEM, (D) EXPONENTIAL FUNCTION GENERATOR, (E) LEPEL INDUCTION
GENERATOR, (F) TEMPERATURE CONTROLLER, RECORDERS
covvosrtE
o.zo o.ao nsa oso
FLOW CURVES FOR MATRIX AND COMPOSITE MATERIALSDERFORMEDAT 3 .0 X 10-'s'1 AND 1100°C
194

sw
w
COMPOSI7E
SO a0'"9.s z no-°
EFFECTOF STRAINRATE ONTHE FLOW CURVE OFCOMPOSITEMATERIAL AT 1100°C
TRANSVERSE SECTION OF FORGEDCOMPOSITE SHOWINGEXTENSIVECAVITIES DEVELOPED NORMAL TOTIIE LOADINGDIRECTION AT THE
FIBER MATRIX INTERFACE.
SOLID ARROWS INDICATE THE DIRECTION OF FIBERMOVEMENTS
195

X-RAY SCALA FORHAFNIUM ATTHE
X-RAY IMAGE FOR HAFNIUMLOCATION OFTIIE HORIZONTAL
SHOWINGCONCENTRATION INTRACE
THE CRACK
196
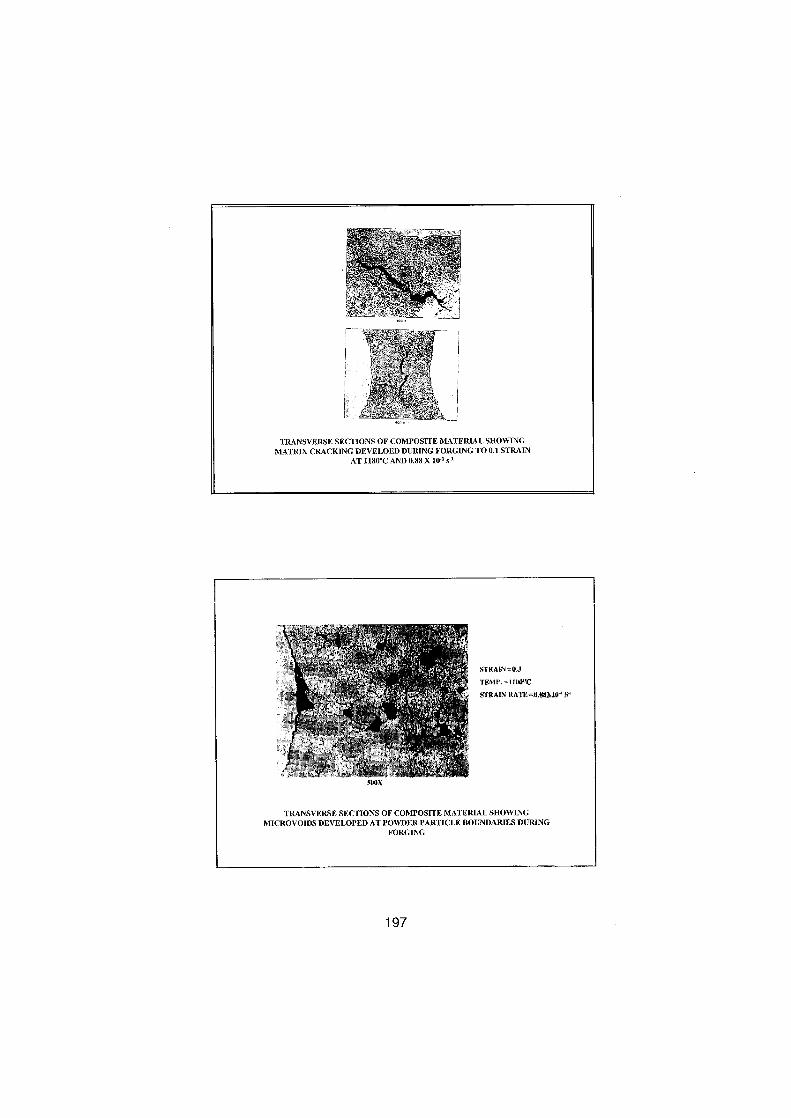
TRANSVERSE SECTIONS OF COMPOSITEMATERIAL SHOWINGMATRIX CRACKING DEVELOEDDURING FORGING TO0.1 STRAIN
AT 11800C AND 0.88 X 10-' s -1
SIRAIN=0 .3
'fH;MF°.=11tIWL;
S!'RAFN RA'PY
TRANSVERSE SECTIONS OF COMPOSITE MATERIAL SHOWINGMICROVOIDS DEVELOPED AT POWDERPARTICLE BOUNDARIES DURING
FORGING
197
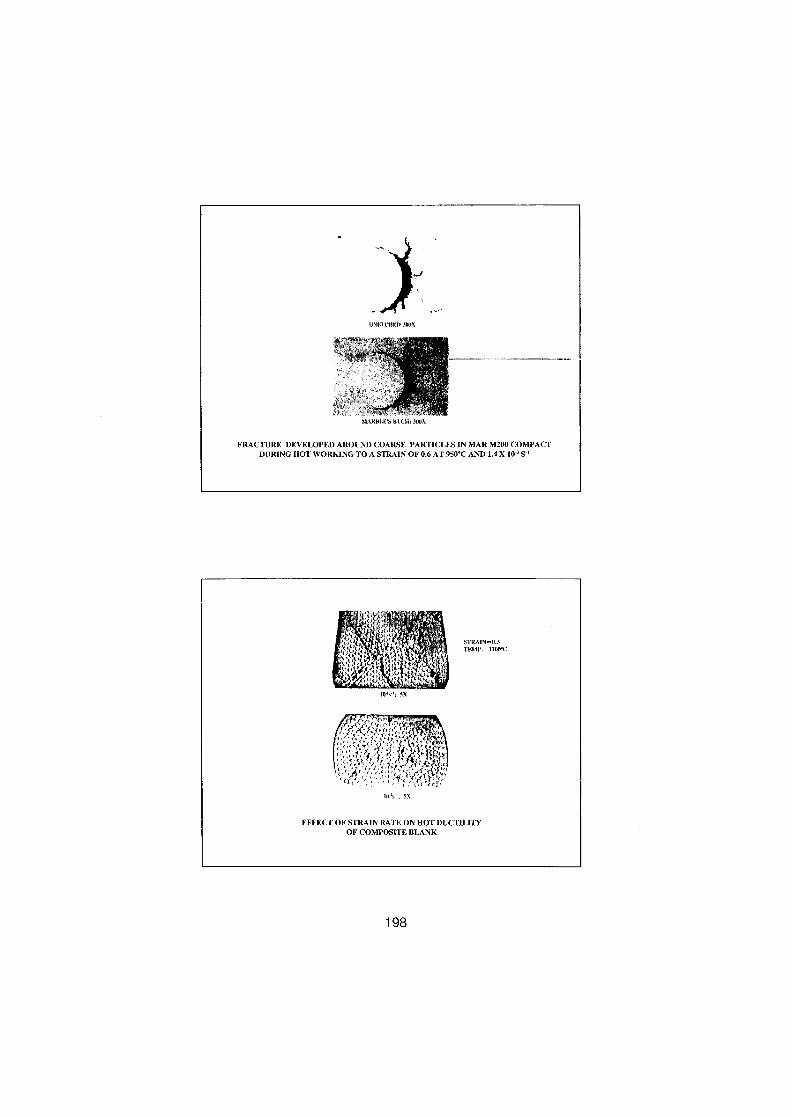
FRACTURE
DEVELOPEDAROUND COARSE PARTICLES IN MAR M200 COMPACT
DURING
HOT WORKING TOA STRAIN OF0
.6
AT 950°C AND 1
.4
X 10'S-'
SX
EFFECT
OFSTRAIN RATE ONHOT DUCTILITY
OF
COMPOSTTE BLANK
198
srearv=a..'1'FMI' .=MINI°C
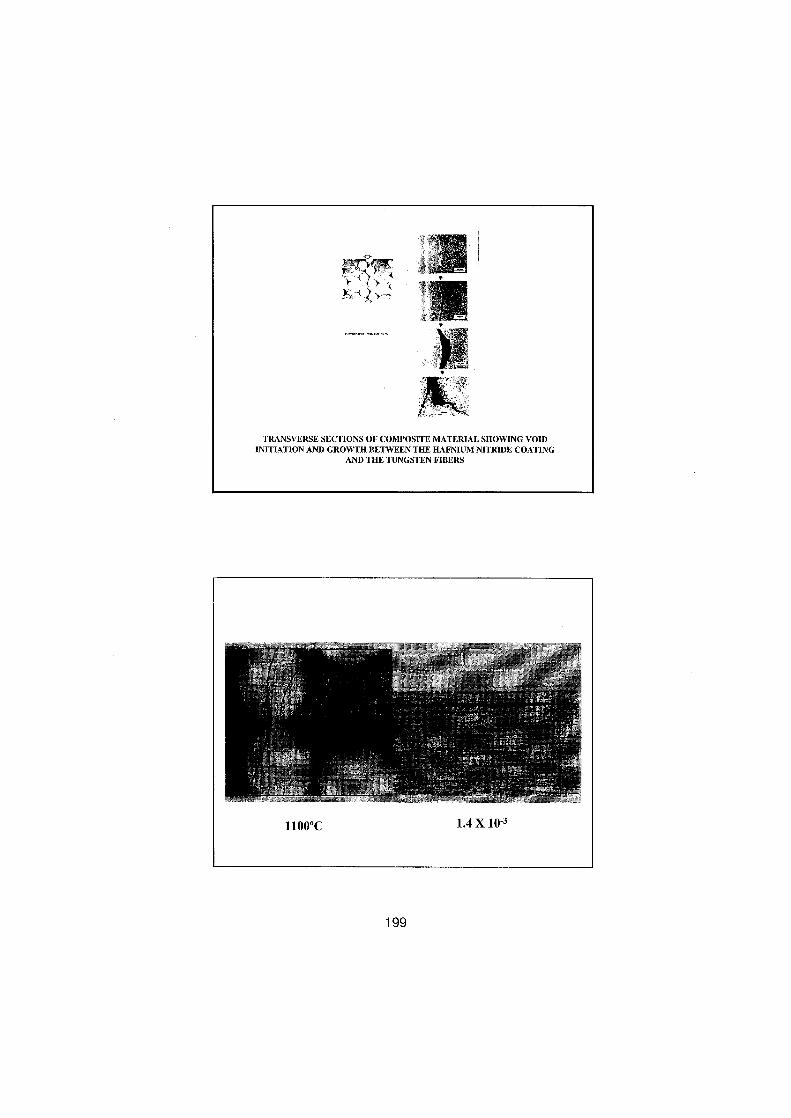
TRANSVERSE SECTIONS OF COMPOSITE MATERIALSHOWING VOIDINITIATION AND GROWTH BETWEEN THE HAFNIUM NITRIDE COATING
AND THE TUNGSTEN FIBERS
199
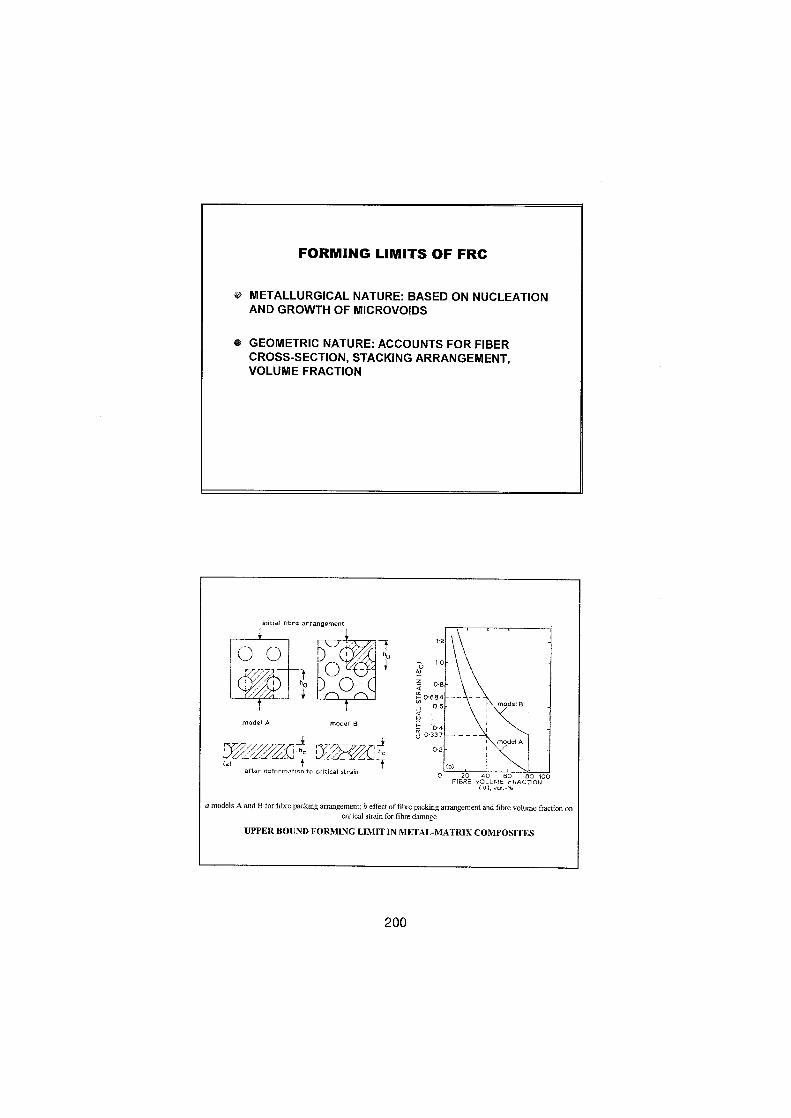
FORMING LIMITS OF FRC
METALLURGICAL NATURE: BASED ON NUCLEATIONAND GROWTH OF MICROVOIDS
GEOMETRIC NATURE: ACCOUNTS FOR FIBERCROSS-SECTION, STACKING ARRANGEMENT,VOLUME FRACTION
initial lib..arrangemant
fal
modal A
modal 8
attgr d0.-t- to critical st-i.
, 200
a models A andB for fibre packing arrangement; b effect of fibre packing arrangement and fibre volume fraction ancritical strain for fibre damage
UPPER BOUND FORMING LIMITIN METAL-MATRIX COMPOSITES

CONTROL OF VOID FORMATION
SELECT FINE MESH POWDER
IMPROVE BOND AT FIBER/MATRIX INTERFACE
FORGE AT HIGH TEMPERATURES AND SLOWSTRAIN RATE
INCREASE ASPECT RATIO (Wo/H0)
ADD EXTRA MATRIX MATERIAL TO EXERT BACKPRESSURE ON COMPOSITE (CRITICAL AREAS)
FORGE BELOW CRITICAL STRAIN
CONCLUSIONS
FLOW STRESSES FORTHE COMPOSITES AREALWAYS SUBSTANTIALLY HIGHER TRAN THOSEOBSERVED FOR THE NON-REINFORCED MATRIXMATERIAL FOR THE SAME FORGING CONDITIONS .
FORMING LIMIT DIAGRAMS WERE DEVELOPED TODEFINE REGIONS OF TEMPERATURE AND STRAINRATE WHERE EARLYVOID FORMATION MAYBEAVOIDED
DUCTILITY OF THE COMPOSITE MATERIAL ISGOVERNED BY THAT OF THE MATRIX . INCREASES ATHIGHER TEMPERATURES ANDIOR SLOWER STRAINRATE .
201
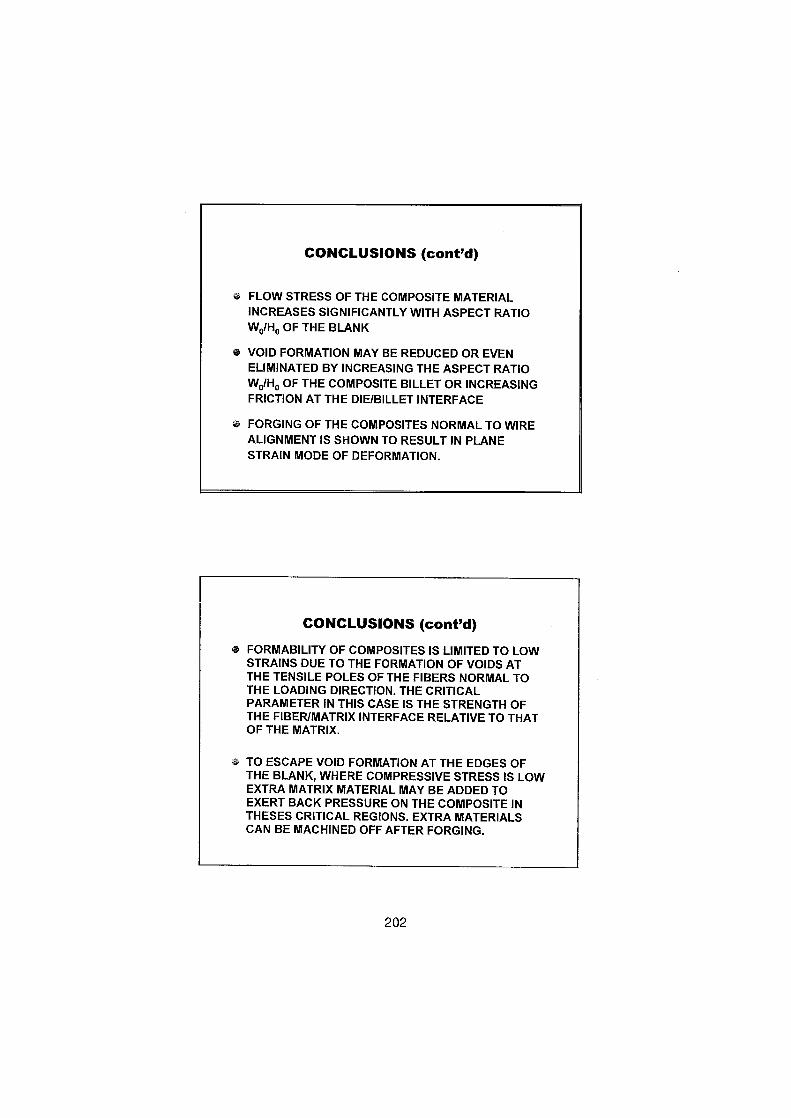
CONCLUSIONS (cont'd)
FLOW STRESS OF THE COMPOSITE MATERIALINCREASES SIGNIFICANTLY WITH ASPECT RATIOWO/HO OF THE BLANK
0 VOID FORMATION MAY BE REDUCED OR EVENELIMINATED BY INCREASING THE ASPECT RATIOWo/Ho OF THE COMPOSITE BILLET OR INCREASINGFRICTION AT THE DIE/BILLET INTERFACE
FORGING OF THE COMPOSITES NORMAL TO WIREALIGNMENT IS SHOWN TO RESULT IN PLANESTRAIN MODE OF DEFORMATION .
CONCLUSIONS (cont'd)
ia FORMABILITY OF COMPOSITES IS LIMITED TO LOWSTRAINS DUE TO THE FORMATION OF VOIDS ATTHE TENSILE POLES OF THE FIBERS NORMAL TOTHE LOADING DIRECTION . THE CRITICALPARAMETER IN THIS CASE IS THE STRENGTH OFTHE FIBER/MATRIX INTERFACE RELATIVE TO TRATOF THE MATRIX.
TO ESCAPE VOID FORMATION AT THE EDGES OFTHE BLANK, WHERE COMPRESSIVE STRESS IS LOWEXTRA MATRIX MATERIAL MAY BE ADDED TOEXERT BACK PRESSURE ON THE COMPOSITE INTHESES CRITICAL REGIONS . EXTRA MATERIALSCAN BE MACHINED OFF AFTER FORGING.
202
CONCLUSIONS (cont'd)
A CRITICAL STRAIN EXISTS IN THE COMPOSITES ATWHICH THE FIBERS COME INTO CONTACT WITHEACH OTHER.BEYOND THE CRITICAL STRAIN, EXTENSIVEDAMAGE MAY OCCUR.
THIS CRITICAL STRAIN IS A FUNCTION OF THEVOLUME FRACTION, STACKING ARRANGEMENTAND CROSS-SECTION OF THE FIBERS . INTHEPRESENT COMPOSITE MATERIAL, THE CRITICALSTRAIN WAS SHOWN TO BE 0.34 AND FORMING OFTHE COMPOSITES SHOULD BE LIMITED TO STRAINSBELOW THIS VALUE.
INVOLVED COMPANIES AND RESEARCHCENTERS
W-WIRES : GENERAL ELECTRIC (USA)
FILAMENT COATING (HFN): WESTINGHOUSECANADA
POWDER TAPE: PRIVATE CO.
COMPOSITETAPE: WESTINGHOUSE CANADA
HOT ISOSTATIC PRESSING : WESTINGHOUSECANADA
ISOTHERMAL FORGING: NRC
203

204
Behaviour of Expanded Metal DuringTensile Loading
Experiments and Modeling
A.M. Hashem r, A. Kranz, NI. Mahmoud2 and E. E1-Magd3
1
Prof. Dr-, Production Eng. And Design Dept., Faculty ofEngineering, Minia University,61 111 Minia, Eg~, t,E-mai: fatah hasliem2vahoo.conr
2
Research Assistant, and3
Prof Dr . Eng.Lehr-und Forschungsgebiet Werkstoffkunde, RWTH Aachen, Augustinerbach 4-22,D-52062 Aachen, Germany,E-mail : elmagd@a lfw.nvth-aachen .de
AbstractThe mechanical properties of the expanded metals behaviour is one of the important
problems in the field of new cooling System in modern steam turbine which allows higher Servicetemperatures and higher thermal efficiency . The effect of expanded metals geometry (i .e . two typesof mesh ; and different value of orientation angle) an the tensile behaviour has been investigated atroom temperature . The two shapes of mesh were used, fine mesh (20 element/cm2) and coarsemesh (9 element/cm2) . The influence ofthe orientation angle, changed from 0° to 180° in step of15°, an the tensile behaviour was studied .
The experimental results Show that the expanded metal is anisotropic materials depend anthe loading directional . Tensile parameters such as yield load, load at 2% strain to fracture,ultimate load, stiffness and strain to fracture are determined for different orientation angle and twotypes of expanded metal. The finite element methods (FEM) has been used as a comparison studyivr üe.experLTientai results.
KeywordsExpanded metal, fine and coarse mesh, tensile behaviour, FEM, stiffness .
1. IntroductionExpanded metal is one of the most versatile products an the mechanical applications -ne
various types of expanded metal can be manufactured using the raw materials, including stainlesssteel, aluminum, carbon steel, titanium and copper . Expanded metal ean be found virtuallyeverywhere such as filters, grating, truck tool,
fireplace, air condition, etc . and now using in thefield ofcooling system ofthe modern turbine .The influence of the expanded metals and the orientation of flhe meshes an macroscopic
mechanical behaviour is one of the important problems in the field of new cooling system inmodern steam turbine to improve the thermal efficiency . The relationship between the orientationangles and the deformation an mechanical properties of materials, however, is not obvious .Furthermore, the distribution morphology of expanded metals in most engineering materials isirregular . Heat transfer and friction factor correlations for artificially roughened ducts withexpanded metal mesh as roughness element was studied by Saini [1] . lt has been that a considerableenhancement of heat transfer can be obtained as a result ofproviding expanded metal mesh artificialroughness an the absorber plate .
Takuda et .a l [2] were applied the prediction offorming limit in bore expanding. Namely,
205
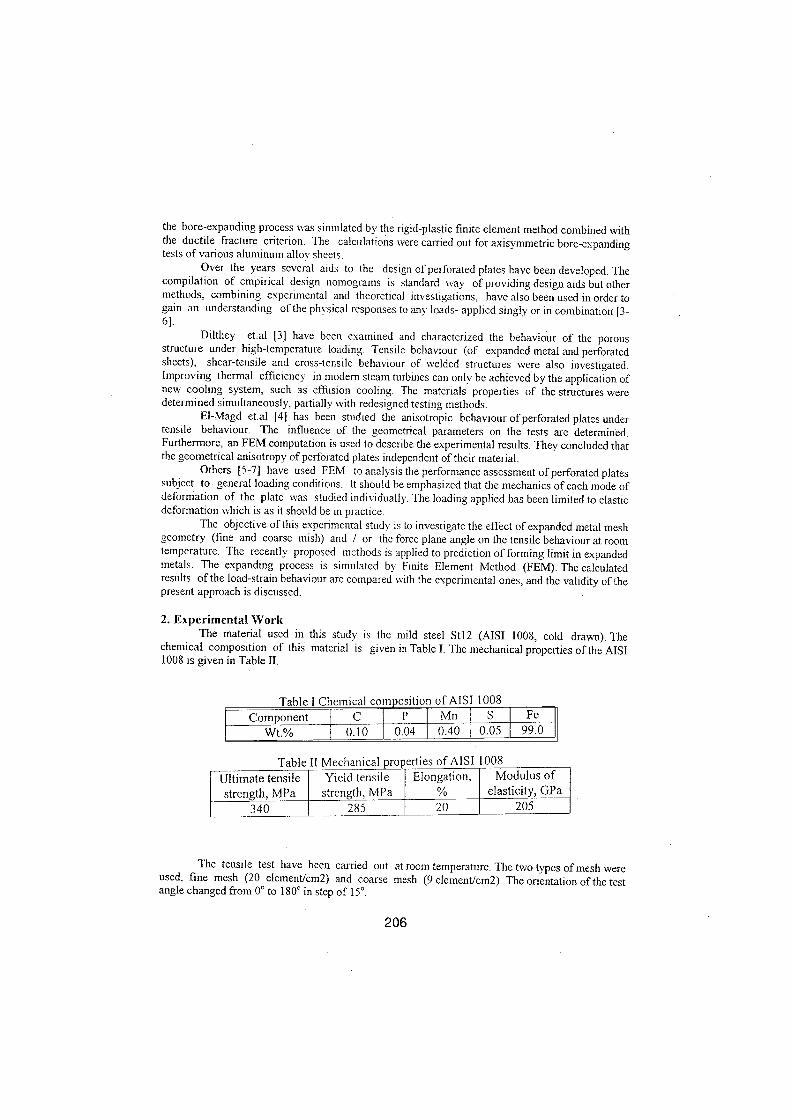
the bore-expanding process was simulated by the rigid-plastic finite element method combined withthe ductile fracture criterion . The calculations viere carried out for axisymmetrie bore-expandingtests of various aluminum allov sheets .
Over the years several aids to the
design ofperforated plates have been developed . Thecompilation of empirical design nomograms is standard way ofproviding design aids but othermethods, combining experimental and theoretical investigations, have also been used in order togain an understanding of the physical responses to any loads- applied singly or in combination [3-6] .
Dilthey
et.al [3] have been examined and characterized the behaviour of the porousstructure under high-temperature loading . Tensile behaviour (of expanded metal and perforatedsheets), shear-tensile and cross-tensile behaviour of welded structures viere also investigated .Improving thermal efliciency in modern steam turbines can onl_v be achieved by the application ofnew cooling system, such as effusion cooling. The materials properties of the structures vieredetermined simultaneously, partially with redesigned testing methods.
El-Magd et .a l [4] has been studied the anisotropic behaviour ofperforated plates undertensile behaviour . The influence of the geometrical parameters an the tests are determined .Furthermore, an FEM computation is used to describe the experimental results . They concluded thatthe geometrical anisotropy of perforated plates independent of their material .
Others [5-7] have used FEM to analysis the performance assessment ofperforated platessubject to general loading conditions . It should be emphasized that the mechanics of each mode ofdeformation of the plate was studied individually . The loading applied has been limited to elasticdeformation which is as it should be in practice.
The objective of this experimental study is to investigate the effect of expanded metal meshgeometry (fine and coarse mish) and / or the force plane angle an the tensile behaviour at roomtemperature. The recently proposed methods is applied to prediction of forming limit in expandedmetals . The expanding process is simulated by Finite Element Method (FEM). The calculatedresults of the load-strain behaviour are compared with the experimental ones, and the validity ofthepresent approach is discussed .
2. Experimental WorkThe material used in this study is the mild steel Stl2 (AISI 1008, cold drawn) . The
chemical composition of this material is given in Table I . 'ne mechanical properties ofthe AISI1008 is given in Table II .
Table I CI~emical composition ofAISI 1008Component C P Mn S FeWt.%
0.10 0.04 0.40 0.05 99.0
Table II Mechanical properties of AISI 1008
'ne tensile test have been carried out at room temperature . 'ne two types ofmesh viereused, fine mesh (20 element/cm2) and coarse mesh (9 element/cm2) . ne orientation ofthe testangle changed from 0° to 180° in step of 15° .
206
Ultimate tensilestrength, MPa
Yield tensilestrength, MPa
Elongation,%
Modulus ofelasticity, GPa
340 285 20 205
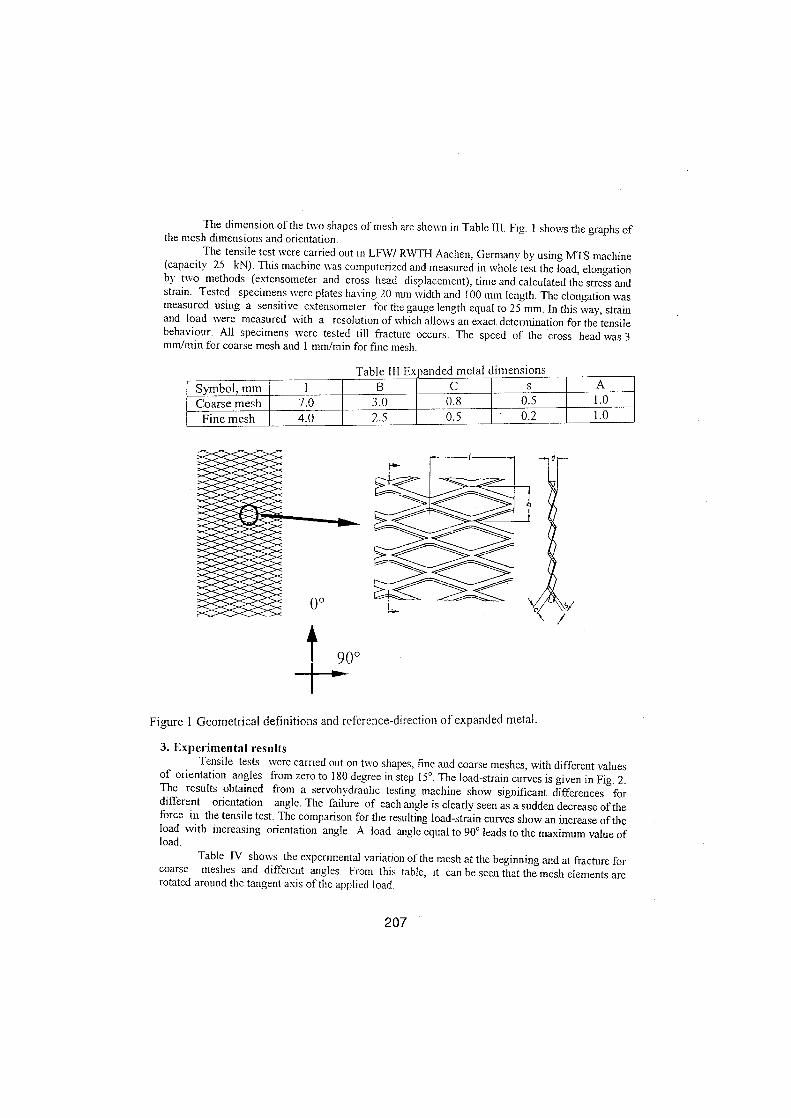
The dimension ofthe two shapes of mesh are shown in Table III . Fig. 1 shows the graphs ofthe mesh dimensions and orientation .
The tensile test viere carried out in LFW/ RW"I"H Aachen, Germany by using MTSmachine(capacity 25 kN). This machine was computerized and measured in whole test the load, elongationby two methods (extensometer and cross head displacement), time and calculated the stress andstrain . Tested specimens viere plates having 20 mm width and 100 mm length . The elongation wasmeasured using a sensitive extensometer for the gauge length equal to 25 mm . In this way, strainand load viere measured with a resolution ofwhich allows an exact determination forthe tensilebehaviour . All specimens viere tested till fracture occurs . 'ne Speed of the cross head was 3mm/min for coarse mesh and 1 mm/min for fine mesh .
Table III Expanded meta1
unensions
Figure 1 Geometrical definitions and reference-direction of expanded metal.
207
3. Experimental resultsTensile tests
viere carried out an two shapes, fine and coarse meshes, with different valuesof orientation angles from zero to 180 degree in step 15 ° . 'ne load-strain curves is given in Fig . 2.The results obtained from a servohvdraulic testing machine Show signifrcant differentes fordifferent
orientation
angle. The failure of each angle is clearly seen as a sudden decrease oftheforte in the tensile test. The comparison for the resulting load-strain curves Show an increase oftheload with increasing orientation angle . A load angle equal to 90° leads to the maximum value ofload .
Table IV shows the experimental variation ofthe mesh at the beginning and at fracture forcoarse meshes and different angles . From this table, it can be seen that the mesh elements arerotated around the tangent axis ofthe applied load .
Symbol, mm 1 B C s ACoarse mesh 7.0 3 .0 0.8 0.5 1 .0Fine mesh 4.0 2 .5 0.5 02 1.0
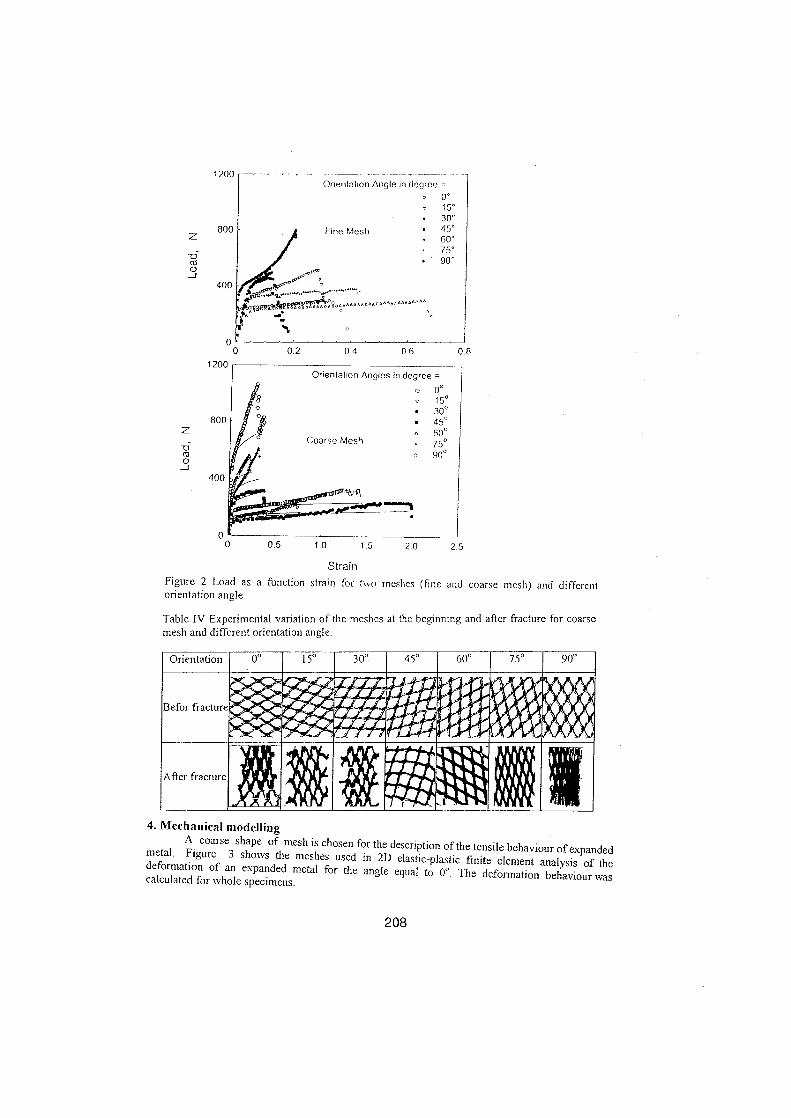
Z
ca0J
Z
ctS0J
Orientation Angle in degree =0.15°30 °45°60 °75°90`
StrainFigure 2 Load as a function strain for two meshes (fine and coarse mesh) and differentorientation angle
Table IV Experimental variation of the meshes at the beginning and after fracture for coarsemesh and different orientation angle .
Orientation
Befor fracture
After fracture
0°
m
45° I 60° 75 ° 90 °
Vi
4 . Mechanical modellingA coarse shape of mesh is chosen for the description of the tensile behaviour of expandedmetal . Figure 3 shows the meshes used in 2D elastic-plastic finite element analysis of thedeformation of an expanded metal for the angle equal to 0° . The deformation behaviour wascalculated for whole specimens .
208
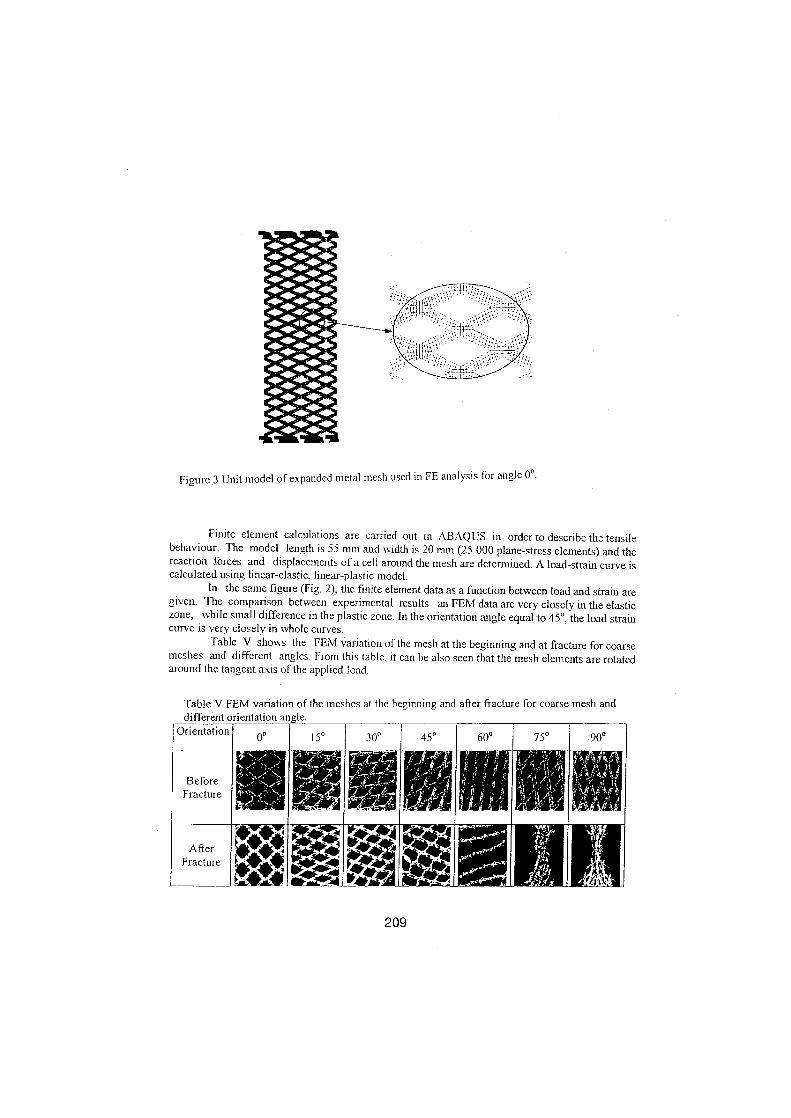
Figure 3 Unit model ofexpanded metal mesh used in FE analysis for angle 0° .
Finite element calculations are carried out in ABAQUS in order to describe the tensilebehaviour . The model length is 55 mm and width is 20 mm (25 000 plane-stress elements) and thereaction forces and displacements of a cell around the mesh are determined . A load-strain curve iscalculated using linear-elastic, linear-plastic model.
In the Same figure (Fig . 2), the finite element data as a function between load and strain aregiven. The comparison between experimental results an FEM data are very closely in the elasticzone, while small difference in the plastic zone . In the orientation angle equal to 45 °, the load straincurve is very closely in whole curves .
Table V shows the FEM variation ofthe mesh at the beginning and at fracture for coarsemeshes and different angles . From this table, it can be also seen that the mesh elements are rotatedaround the tangent axis ofthe applied load .
Table V FEM variation of the meslies at the beginning and alter fracture for coarse mesh anddifferent orientation angle .
209
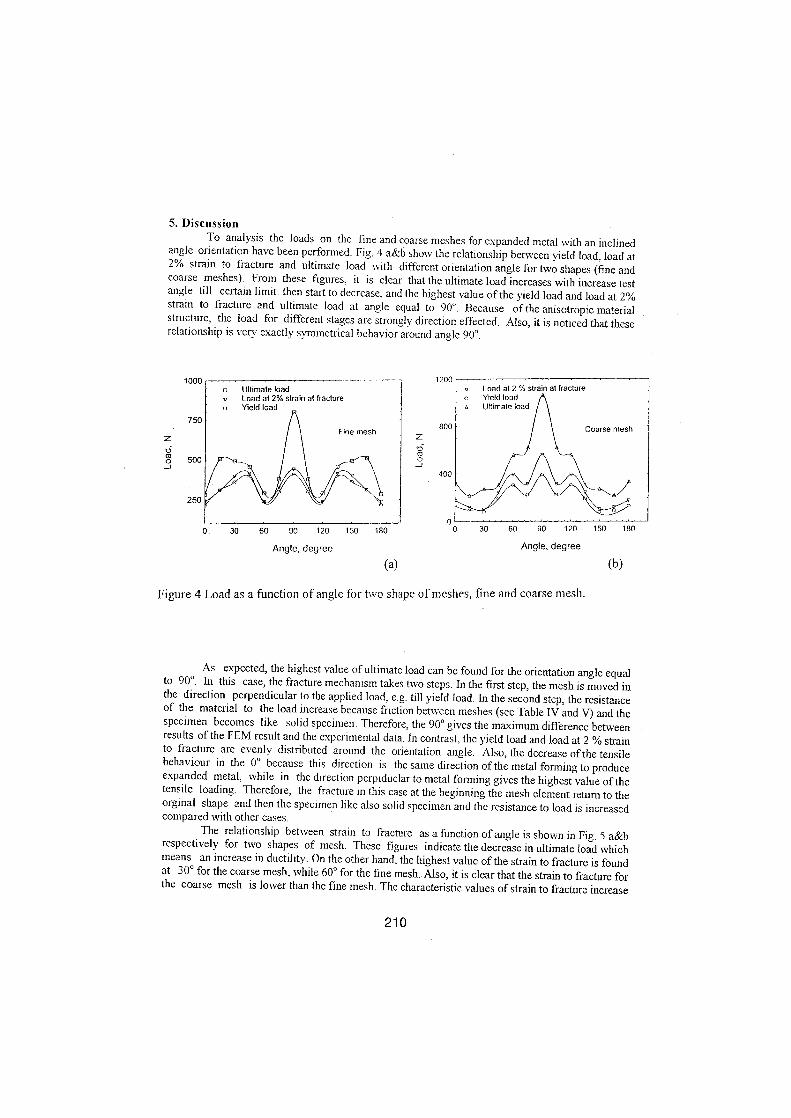
ZßmJ
5. DiscussionTo analysis the loads an the Eine and coarse meshes for expanded metal with an inclined
angle orientation have been performed_ Fig . 4 a&b show the relationship between yield load, load at2% strain to fracture and ultimate load with different orientation angle for two shapes (fine andcoarse meshes) . From these figures, it is clear that the ultimate load increases with increase testangle till certain limit then start to decrease, and the highest value ofthe yield load and load at 2%strain to fracture and ultimate load at angle equal to 90° . Because of the anisotropic materialstnlcture, the load for different stages are strongly direction effected . Also, it is noticed that theserelationship is ven exactly symmetrical behavior around angle 90 ° .
1000
750
500
250
30 60 90 120 150 180
Angle, degree
21 0
ZßmJ
1200
800
400
o
Load al 2 % strain at fractureo
Yield loadUltimate load
30 60 90 120 150
Angle, degree
Figure 4 Load as a function of angle for two shape ofmeshes, fine and coarse mesh .
180
As expected, the highest vatue of ultimate load can be found for the orientation angle equalto 90° . In this case, the fracture mechanism takes hvo steps . In the ferst step, the mesh is moved inthe direction perpendicular to the applied load, e.g . till yield load . In the second step, the resistanceof the material to the load increase because friction between meshes (sec Table IV and V) and thespecimen becomes like solid specimen . Therefore, the 90 ° gives the maximum difference betweenresults of the FEM result and the experimental data . In contrast, the yield load and load at 2 % strainto fracture are evenly distributed around the orientation angle . Also, the decrease ofthe tensilebehaviour in the 0° because this direction is the same direction ofthe metal forming to produceexpanded metal, while in the direction perpiduclar to metal forming gives the highest value ofthetensile loading . Therefore, the fracture in this case at the beginning the mesh element return to theorginal shape and then the specimen like also solid specimen and the resistance to load is increasedcompared with other Gases .
The relationship between strain to fracture as a function of angle is shown in Fig . 5 a&brespectively for two shapes of mesh . These figures indicate the decrease in ultimate load whichmeans
an increase in ductility . On the other hand, the highest value ofthe strain to fracture is foundat 30° for the coarse mesh, while 60° for the fine mesh. Also, it is clear that the strain to fracture forthe coarse mesh is lower than the fine mesh . The characteristic values of strain to fracture increase
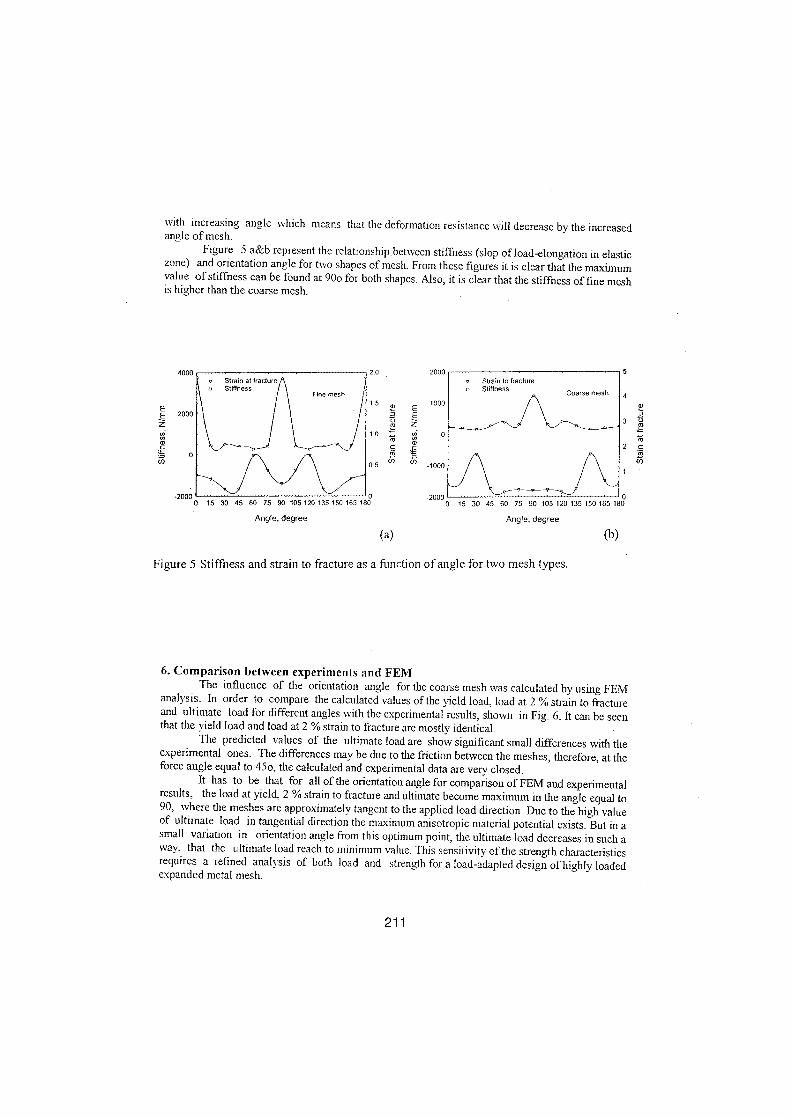
EEZm
with increasing angle which means that the deformation resistance will decrease by the increasedangle ofmesh .
Figure 5 a&b represent the relationship between stiffness (slop ofload-elongation in elasticzone) and orientation angle for two shapes of mesh. From these figures it is elear that the maximumvalue ofstiffness can be found at 90o for both shapes . Also, it is clear that the stiffness of fine meshis higher than the coarse mesh .
4000
2000
0
2 0
2000
15
1000°' E
EZ
C Ct0 ~_
0.5
Co
0
_1000
-2000
00 15 30 45 60 75 90 105120135150165180 0 15 30 45 60 75 90 105120135150165180
5
-2000
0
Angle, degree
Angle, degree
Figure 5 Stiffness and strain to fracture as a function of angle for two mesh types.
6. Comparison between experiments and FEMThe influence of the orientation angle for the coarse mesh was calculated by using FEM
analysis . In order to compare the calculated values of the yield load, load at 2 %strain to fractureand ultimate load for different anges with the experimental results, shown in Fig. 6 . It can be Seenthat the vield load and load at 2 % strain to fracture are mostly identical .
he predicted values of the ultimate load are Show significant small differences wich theexperimental ones . The differences may be due to the friction between the meshes, therefore, at theforce angle equal to 45o, the calculated and experimental data are very closed .
It has to be that for all of the orientation angle for comparison ofFEM and experimentalresults, the load at yield, 2 %strain to fracture and ultimate become maximum in the angle equal to90, rohere the meshes are approximately tangent to the applied load direction . Due to the high valueof ultimate load in tangential direction the maximum anisotropic material potential exists . But in aSmall variation in orientation angle from this optimum point, the ultimate load decreases in such away, that the ultimate load reach to minimum value . This sensitivity ofthe strength characteristicsrequires a refined analysis of both load and strength for a load-adapted design of highly loadedexpanded metal mesh .
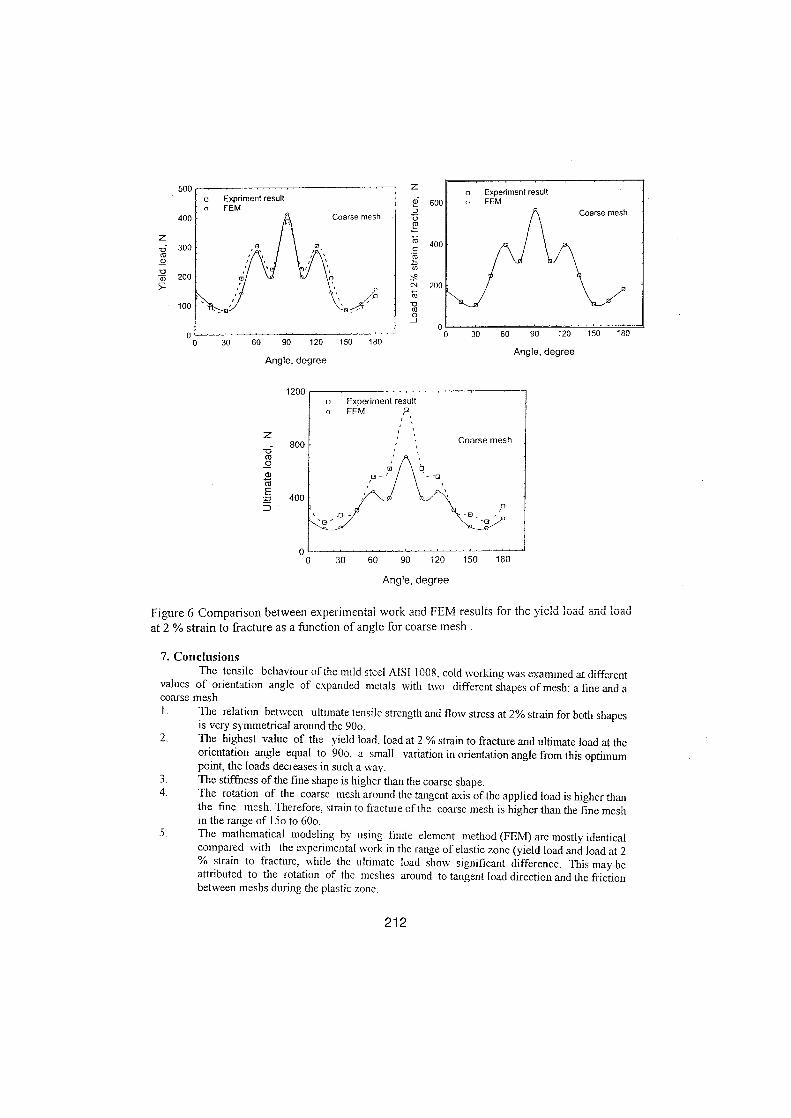
Z
N_ov
r
Z
1200
800cv0
E
a
. Experiment resultn FEM P
30 60 90 120 150 180
Angle, degree
Figure 6 Comparison between experimental work and FEM resüits for the yield !Oad and loadat 2 % strain to fracture as a function ofangle for coarse mesh .
7. ConclusionsThe tensile behaviour of the mild steel AISI 1008 . cold working was examined at different
values of orientation angle of expanded metals with two different shapes of mesh : a fine and acoarse mesh .l .
'ne relation between ultimate tensile strength and flow stress at 2% strain for both shapesis very symmetrical around the 90o.
2.
The highest value of the yield load, load at 2 %strain to fracture and ultimate load at theorientation angle equal to 90o. a small variation in orientation angle from this optimumpoint, the loads decreases in such a way.
3 .
The stiffness ofthe fine shape is higher than the coarse shape.4 .
The rotation of the coarse mesh around the tangent axis ofthe applied load is higher thanthe fine mesh . Therefore, strain to fracture ofthe coarse mesh is higher than the fine meshin the range of l5o to 60o.The mathematical modeling by using finite element method (FEM) are mostly identicalcompared with the experimental work in the range of elastic zone (yield load and load at 2
strain to fracture, while the ultimate load Show significant difference. 'his may beattributed to the rotation of the meshes around to tangent load direction and the frictionbetween meshs during the plastic zone .
21 2
Üm
c 400NrnöN 200mm0J
o
Experiment resultn FEM
Coarse mesh
00 30 60 90 120 150 180
Angle, degree
Coarse mesh
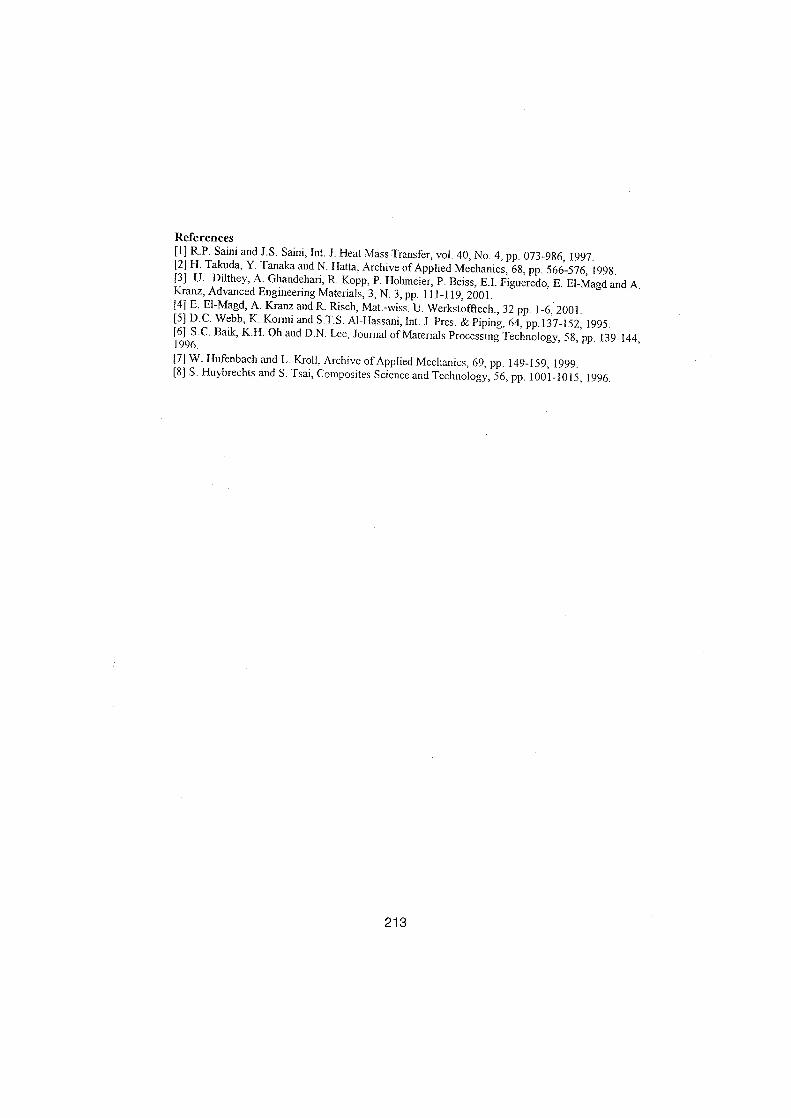
References[1] R.P . Saini and J.S . Saini, Int . J . Heat Mass Transfer, vol . 40, No. 4, pp . 073-986, 1997 .[2] H. Takuda, Y. Tanaka andN. Hatta. Archive ofApplied Mechanics, 68, pp . 566-576, 1998 .[3] U. Dilthey, A. Ghandehari, R. Kopp, P. Hohmeier, P . Beiss, E.1 . Figueredo, E. EI-Magd andA.Kranz, Advanced Engineering Materials; 3, N. 3, pp . 111-119, 2001 .[4] E. EI-Magd, A. Kranz andR. Risch, Mat.-wiss . U. Werkstofftech., 32 pp . 1-6, 2001 .[5] D.C . Webb, K. Kormi and S.T.S . Al-Hassani, Int . J . Pres . & Piping, 64, pp. 137-152, 1995 .[6] S .C . Baik, K.H. Oh and D.N . Lee; Joumal ofMaterials Processing Technology, 58, pp . 139-144,1996 .[7] W. Hufenbach and L. Kroll, Archive of Applied Mechanics, 69, pp . 149-159, 1999 .[8] S. Huybrechts and S . Tsai, Composites Science and Technology, 56, pp . 1001-1015, 1996 .

214
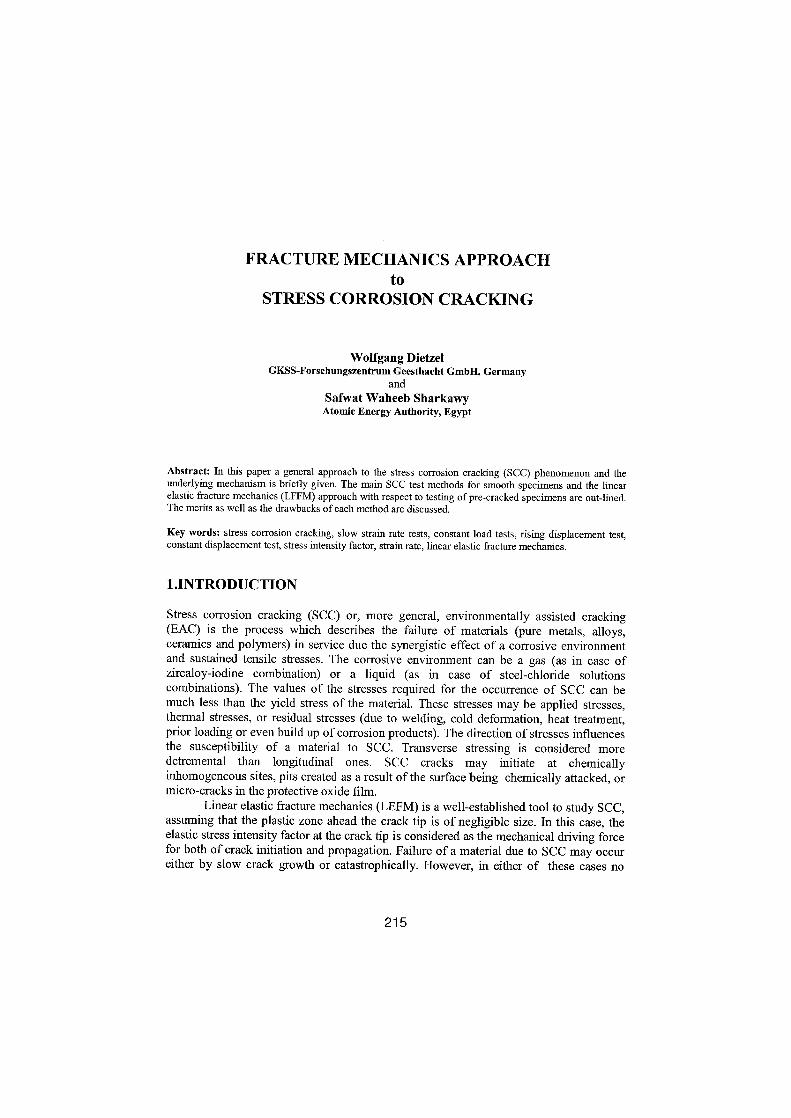
1 .INTRODUCTION
FRACTURE MECHANICS APPROACHto
STRESS CORROSION CRACKING
Wolfgang DietzelGKSS-Forschungszentrum Geesthacht GmbH, Germany
andSafwat Waheeb SharkawyAtomic Energy Authority, Egypt
Abstract : In this paper a general approach to the stress corrosion cracking (SCC) phenomenon and theunderlying mechanism is briefly given. The main SCC test methods for smooth specimens and the linearelastic fracture mechanics (LFFM) approach with respect to testing of pre-cracked specimens are out-lined.The merits as well as the drawbacks ofeach method are discussed.
Key words: stress corrosion cracking, slow strain rate tests, constant load tests, rising displacement test,constant displacement test, stress intensity factor, strain rate, linear elastic fracture mechanics.
Stress corrosion cracking (SCC) or, more general, environmentally assisted cracking(EAC) is the process which describes the failure of materials (pure metals, alloys,ceramics and polymers) in service due the synergistic effect of a corrosive environmentand sustained tensile stresses . The corrosive environment can be a gas (as in case ofzircaloy-iodine combination) or a liquid (as in case of steel-Chloride solutionscombinations). The values of the stresses required for the occurrence of SCC can bemuch less than the yield stress of the material . These stresses may be applied stresses,thermal stresses, or residual stresses (due to welding, cold deformation, heat treatment,prior loading or even build up ofcorrosivn products). The direction of stresses influencesthe susceptibility of a material to SCC. Transverse stressing is considered moredetremental than longitudinal ones . SCC cracks may initiate at chemicallyinhomogeneous sites, pits created as a result of the surface being chemically attacked, ormicro-cracks in the protective oxide film.
Linear elastic fracture mechanics (LFFM) is a well-established tool to study SCC,assuming that the plastic zone ahead the Crack tip is of negligible size. In this case, theelastic stress intensity factor at the crack tip is considered as the mechanical driving forcefor both of Crack initiation and propagation . Failure of a material due to SCC may occureither by slow crack growth or catastrophically . However, in either of these cases no
21 5
indications for failure may be noted before its occurrence . Materials which failed by SCCare often characterised by an only small reduction in the fracture area. This feature can beused as a measure when comparing the susceptibility ofdifferent materials to SCC .
The fracture mode of materials which failed by SCC is usually described as brittlefailure. When cracks follow the grain boundaries they lead to intergranular stresscorrosion cracking (IGSCC) . In this case, the grain boundaries are anodic with respect tothe grains and are hence more susceptible to corrosion. This effect can be due toprecipitates, depletion, adsorption, or enrichment of elements . Generally, the cracks arebranched and propagate in a direction nearly perpendicular to that of stress . However, insome cases non-branched cracks are observed along branched ones. Cracking throughspecific crystallographic planes within the grains leads to transgranular stress corrosioncracking (TGSCC), which is characterised by cleavage and river patterns . Both of thosecracking types can occur an the same fracture surface of a material which failed by SCC.The cracking type can in some materials be changed by altering the materials'metallurgical conditions, while in others this change can be achieved by altering theenvironmental conditions .
It is worth to mention that SCC is a time dependent phenomenon and is controlledby material composition, microstructure as well as the electrochemical conditions at thecrack tip . The electrochemical conditions include temperature, potential, pH andconcentration ofspecies inside the crack .
The SCC problem deserves great concern as it is considered a serious corrosionproblem causing loss of lives (as in case of failure ofboilers, aeroplanes, bridges etc .) andaffecting the international economy (as in case of failure ofpetro-chemical plants or offshore platforms) . Despite the tedious efforts which were made in the last decade to find ageneral analytical approach that can predict which combinations of a material and anenvironment result in SCC, yet it is not available . Therefore, at the present time allguidance for avoiding SCC during service has to be based either an past experience or anlaboratory tests .
2 . SCC-MECHANISM
The active path and the stress-sorption are the most widely accepted SCC-mechanisms.These two mechansm can to a large extent explain the SCC mechanism . Nevertheless,no single mechanism is capable to answer the many questions regarding thisphenomenon.
2 .1 The Anodic Dissolution (Active Path Dissolution, APD)
In this mechanism crack nucleation occurs through some steps . Namely, passivation(denoted by P in Fig . 1) of the tested specimen surface, localised attack (denoted by A inFig.1) and penetration of the passive film where micro-notches are created . Thedissolution and transport rates at the crack tip must be higher than those at its sides inorder to be retained (Fig.l) . The sustained tensile stresses brake the re-passivated film atthe crack tip even if it is fonned . The crack sides are in a passive state while the crack tipis in an active one. Anodic segregated elements are considered as active sites for crack
21 6

initiation and further active path dissolution by establishing a galvanic cell. Thismechanism is, usually, typical for low and medium strength materials .
Fig. 1 - Illustration ofthe active pathdissolution (APD) mechanism .
2.2 The Stress Sorption Mechanism
3. SCC TESTING of SMOOTH SPECIMENS3.1 . Constant Load Test
ah = PD (1 + Ep) / 2t (1-Ep)PD(1+2Ep+ . . . .)/2t
where :P
is the applied pressureEp is the plastic circumferential strain after applying the pressure
21 7
In this mechanism SCC occurs as a result of a weakening of the cohesive bonds ofsurface-metal atoms by adsorption of damaging species in the corrosive environment.This is accompanied by a reduction of the surface energy (stacking fault energy decrease)of the material which supports eracking under the applied tensile stresses .
In this classical test a smooth tensile specimen is placed in the corrosive environment andis stressed by a tensile dead load . The stress of the tested specimen is simply calculatedby dividing the applied load by the specimen's cross-section area . In case of testingtubular specimens an intemal constant pressure replaces the tensile dead load . In this casethe hoop stress, 6h, is calculated as :
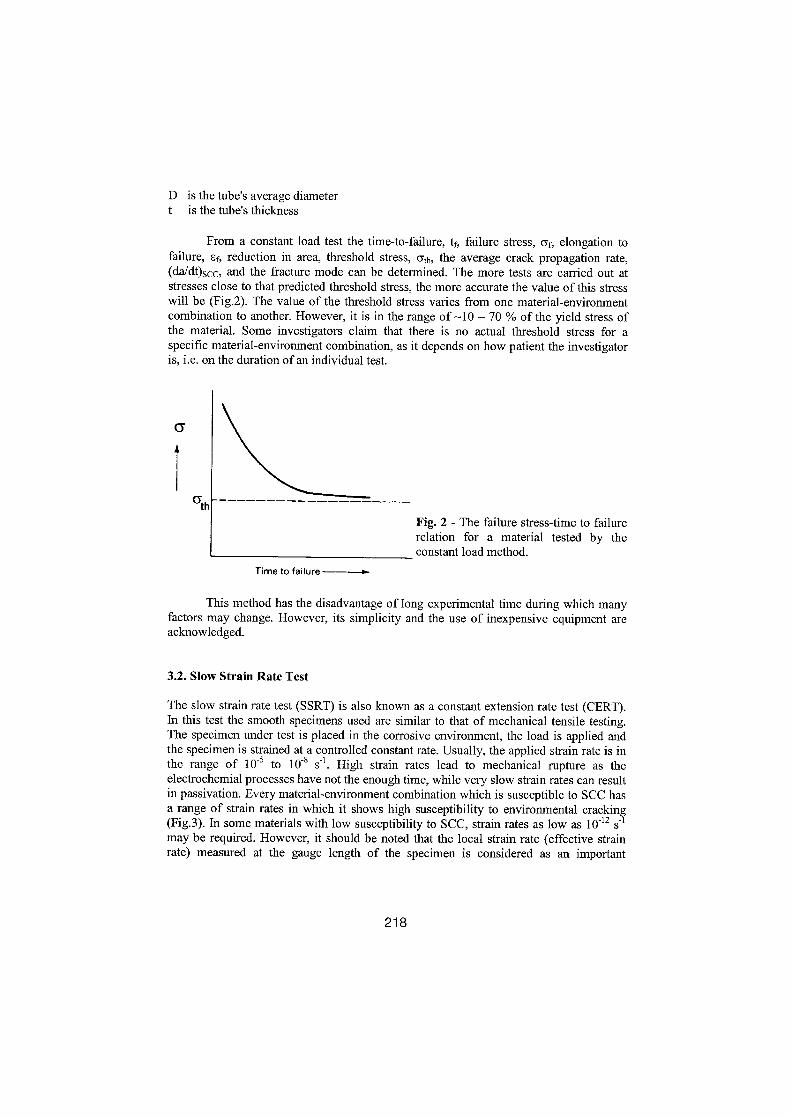
D
is the tube's average diametert
is the tube's thickness
From a constant load test the time-to-failure, tf, failure stress, ßf, elongation tofailure, sf, reduction in area, threshold stress, ßth, the average crack propagation rate,(da/dt)scc, and the fracture mode can be determined . The more tests are carried out atstresses close to that predicted threshold stress, the more accurate the value of this stresswill be (Fig.2) . The value of the threshold stress varies from one material-environmentcombination to another. However, it is in the range of -10 - 70 % of the yield stress ofthe material . Some investigators claim that there is no actual threshold stress for aspecific material-environment combination, as it depends an how patient the investigatoris, i .e . an the duration of an individual test .
6th
Time to failure
This method has the disadvantage of long experimental time during which manyfactors may change . However, its simplicity and the use of inexpensive equipment areacknowledged .
3 .2 . Slow Strain Rate Test
The slow strain rate test (SSRT) is also known as a constant extension rate test (CERT) .In this test the smooth specimens used are similar to that of mechanical tensile testing .The specimen under test is placed in the corrosive environment, the load is applied andthe specimen is strained at a controlled constant rate . Usually, the applied strain rate is inthe range of 10-5 to 10-8 s-l . High strain rates lead to mechanical rupture as theelectrochemial processes have not the enough time, while very slow strain rates can resultin passivation. Every material-environment combination which is susceptible to SCC hasa range of strain rates in which it shows high susceptibility to environmental cracking(Fig.3) . In some materials with low susceptibility to SCC, strain rates as low as 10-12 S-1
may be required . However, it should be noted that the local strain rate (effective strainrate) measured at the gauge length of the specimen is considered as an important
21 8
Fig . 2 - The failure stress-time to failurerelation for a material tested by theconstant load method.
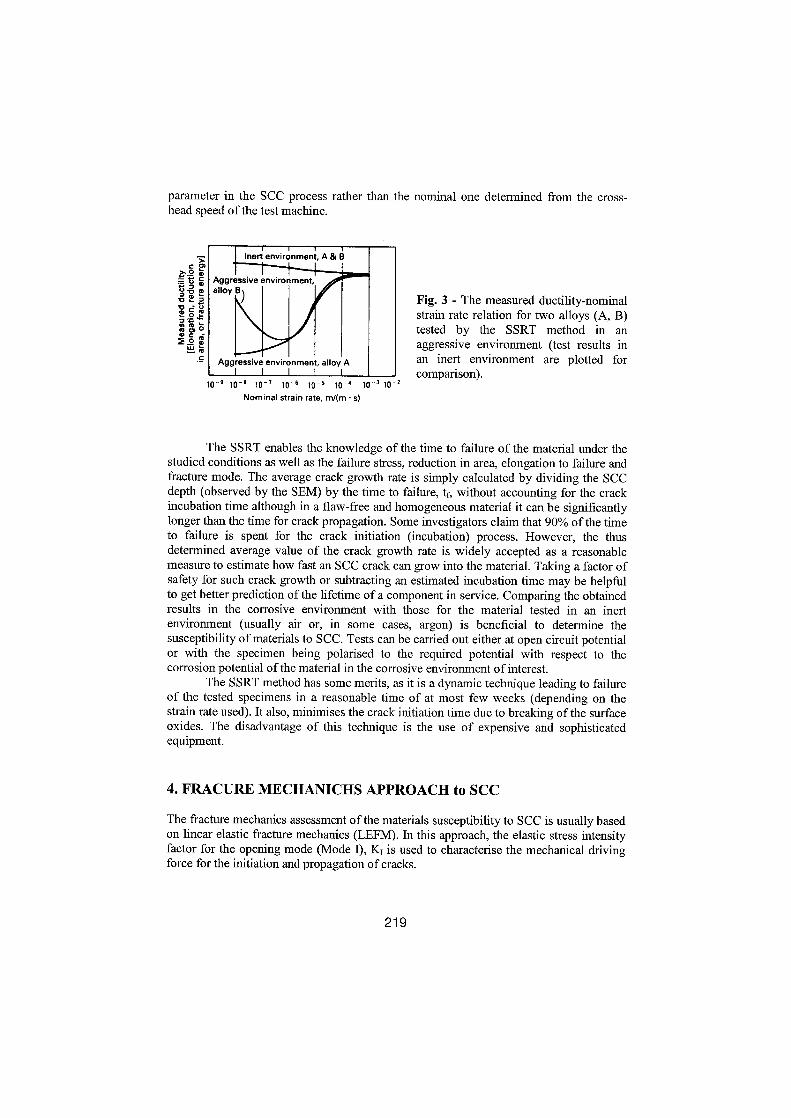
parameter in the SCC process rather than the nominal one determined from the cross-head speed ofthe test machine.
.C
Inert environment, A & B
Aggressive environment,alloy B
Aggressive environment, alloy A1
I
I
I
I
lo- ' to - ° l0 - 1 io - 6 10 -5 lo - ' to - io-=Nominal strain rate, m/(m - s)
The SSRT enables the knowledge of the time to failure of the material under thestudied conditions as well as the failure stress, reduction in area, elongation to failure andfracture mode . The average crack growth rate is simply calculated by dividing the SCCdepth (observed by the SEM) by the time to failure, tf, without accounting for the crackincubation time although in a flaw-free and homogeneous material it can be significantlylonger than the time for Crack propagation. Some investigators claim that 90% of the timeto failure is spent for the crack initiation (incubation) process . However, the thusdetermined average value of the crack growth rate is widely accepted as a reasonablemeasure to estimate how fast an SCC Crack can grow into the material . Taking a factor ofsafety for such crack growth or subtracting an estimated incubation time may be helpfulto get better prediction ofthe lifetime of a component in service . Comparing the obtainedresults in the corrosioe environment with those for the material tested in an inertenvironment (usually air or, in some cases, argon) is beneficial to determine thesusceptibility of materials to SCC . Tests can be carried out either at open circuit potentialor with the specimen being polarised to the required potential with respect to thecorrosion potential ofthe material in the corrosioe environment of interest.
The SSRT method has some merits, as it is a dynamic technique leading to failureof the tested specimens in a reasonable time of at most few weeks (depending an thestrain rate used) . lt also, minimises the Crack initiation time due to breaking of the surfaceoxides . The disadvantage of this technique is the use of expensive and sophisticatedequipment.
4 . FRACURE MECHANICHS APPROACH to SCC
21 9
Fig. 3 - The measured ductility-nominalstrain rate relation for two alloys (A, B)tested by the SSRT method in anaggressive environment (test results inan inert environment are plotted forcomparison) .
The fracture mechanics assessment ofthe materials susceptibility to SCC is usually basedan linear elastic fracture mechanics (LEFM) . In this approach, the elastic stress intensityfactor for the opening mode (Mode I), KI is used to characterise the mechanical drivingforce for the initiation and propagation of Cracks .
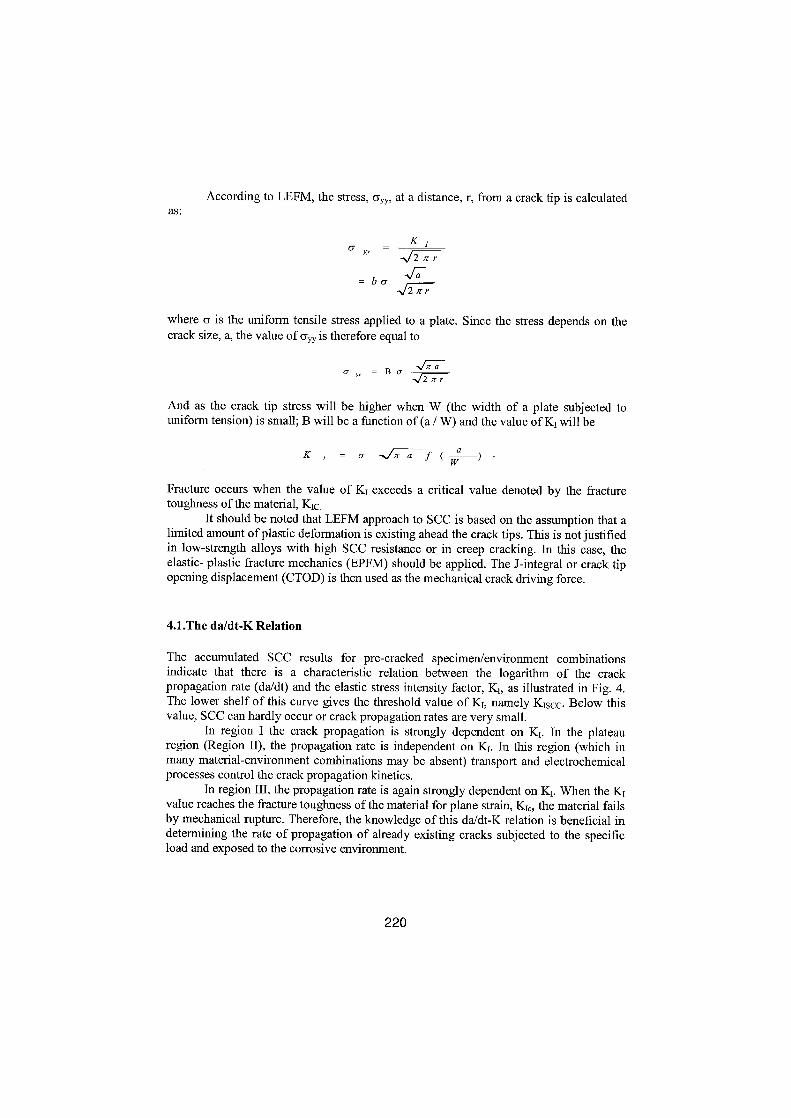
as :According to LEFM, the stress, 6xy, at a distance, r, from a crack tip is calculated
4.1.The da/dt-K Relation
K I6 YY =
,F2z Y
220
,72 ~r r
where 6 is the uniform tensile stress applied to a plate . Since the stress depends an thecrack size, a, the value of6ri is therefore equal to
And as the crack tip stress will be higher when W (the width of a plate subjected touniform tension) is small; B will be a function of (a / W) and the value ofKI will be
Fracture occurs when the value of KI exceeds a critical value denoted by the fracturetoughness ofthe material, KIc.
It should be noted that LEFM approach to SCC is based an the assumption that alimited amount ofplastic defonnation is existing ahead the crack tips. This is notjustifiedin low-strength alloys with high SCC resistance or in creep cracking. In this case, theelastic- plastic fracture mechanics (EPFM) should be applied . The J-integral or crack tipopening displacement (CTOD) is then used as the mechanical crack driving force .
The accumulated SCC results for pre-cracked specimen/environment combinationsindicate that there is a characteristic relation between the logarithm of the crackpropagation rate (da/dt) and the elastic stress intensity factor, KI, as illustrated in Fig . 4 .The lower shelf of this curve gives the threshold value of Kt , namely Kiscc . Below thisvalue, SCC can hardly occur or crack propagation rates are very small .
In region I the crack propagation is strongly dependent an KI . In the plateauregion (Region 11), the propagation rate is independent an KI . In this region (which inmany material-environment combinations may be absent) transport and electrochemicalprocesses control the crack propagation kinetics .
In region III, the propagation rate is again strongly dependent an KI . When the KIvalue reaches the fracture toughness ofthe material for plane strain, KI, the material failsby mechanical rupture . Therefore, the knowledge of this da/dt-K relation is beneficial indetermining the rate of propagation of already existing cracks subjected to the specificload and exposed to the corrosive environment .
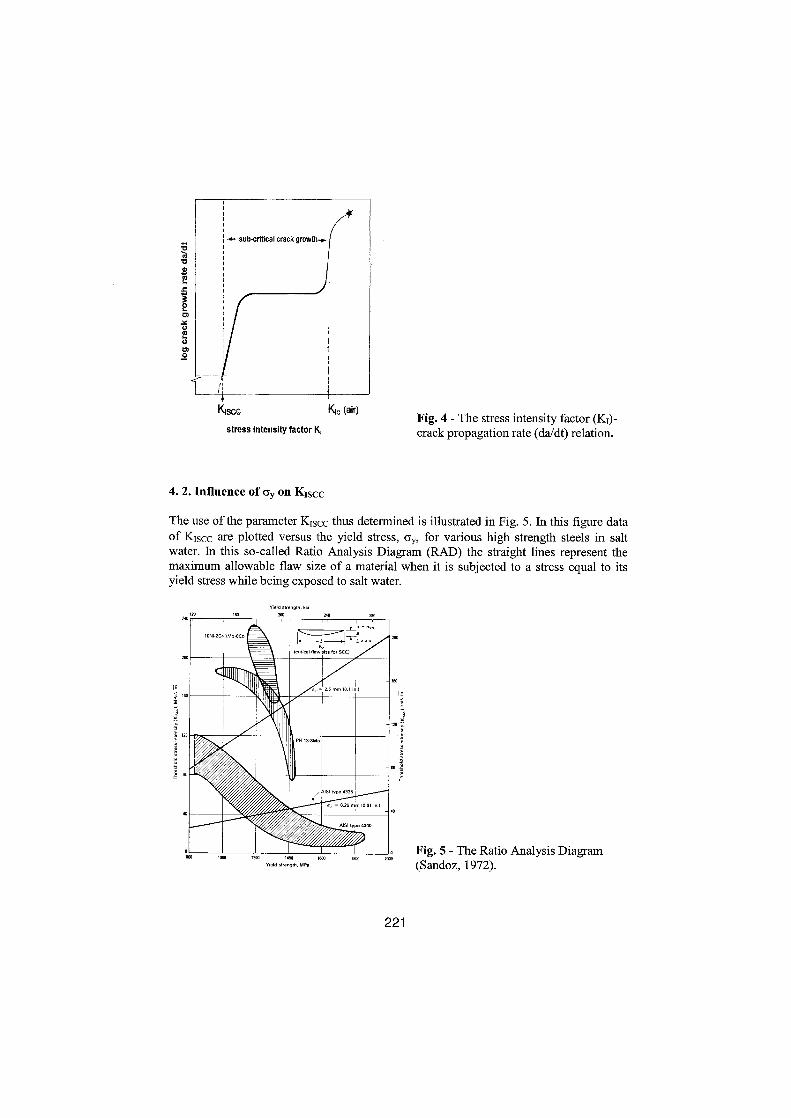
änm
0
YVNVQlO
i
I
Iii~- sub-critical crack growth-i.
KIscc
stress intensity factor K,
4 . 2 . Influence of6y an Kiscc
The use of the parameter KIscc thus determined is illustrated in Fig . 5 . In this figure dataof KIscc are plotted versus the yield stress, ßy, for various high strength steels in saltwater. In this so-called Ratio Analysis Diagram (RAD) the straight lines represent themaximum allowable flaw size of a material when it is subjected to a stress equal to itsyield stress while being exposed to salt water.
Yield sbeng~h, ksi
221
Fig . 4 - The stress intensity factor (KI)-crack propagation rate (da/dt) relation.
Fig . 5 - The Ratio Analysis Diagram(Sandoz, 1972) .
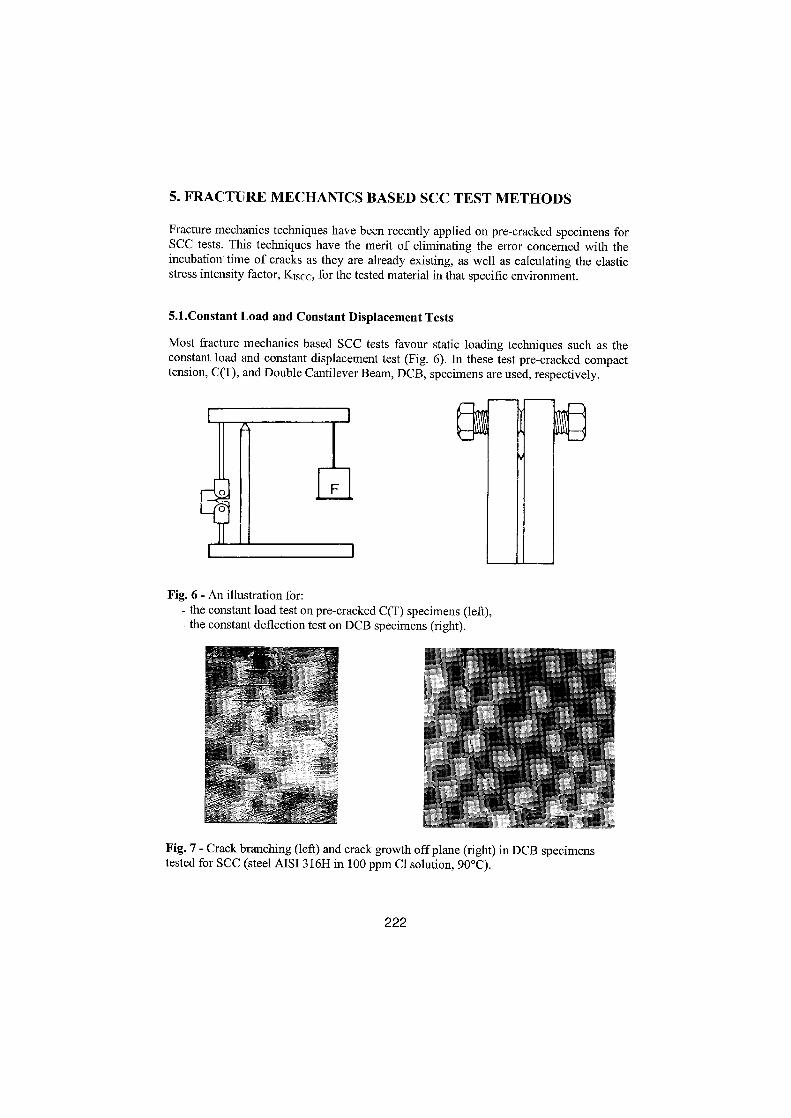
5. FRACTURE MECHANICS BASED SCC TEST METHODS
Fracture mechanics techniques have been recently applied an pre-cracked specimens forSCC tests . This techniques have the merit of eliminating the error concemed with theincubation time of cracks as they are already existing, as well as calculating the elasticstress intensity factor, KIscc, for the tested material in that specific environment .
5 .1.Constant Load and Constant Displacement Tests
Most fracture mechanics based SCC tests favour static loading techniques such as theconstant load and constant displacement test (Fig. 6) . In these test pre-cracked compacttension, C(T), and Double Cantilever Beam, DCB, specimens are used, respectively.
222
Fig . 6 - An illustration for :- the constant load test an pre-cracked C(T) specimens (left),- the constant deflection test an DCB specimens (right) .
rM
Fig . 7 - Crack branching (left) and crack growth offplane (right) in DCB specimenstested for SCC (steel AISI 316H in 100 ppm Cl solution, 90°C) .

These tests are easy to carry out and require minimum laboratory equipment (Fig. 6) .Despite the simplicity of these tests, a time as long as one year or more is required todetermine the threshold values . Crack branching and offplane growth represent anotherdisadvantage to these tests (Fig . 7).
5.2 . Rising Displacement Tests
In-order to overcome the disadvantage of long test duration of the static tests, the risingdisplacement technique was adopted as a dynamic test method . In this test compacttension, C(T), specimens containing a sharp fatigue pre-crack are used (Fig. 8) .
where :WaBK IRp0 .2
is the specimen widthis the crack overall lengthis the specimen thicknessis the material toughnessis the yield strength of the material .
Fig . 8 - Proportional dimensions of the C(T) specimens used in rising displacement tests .
The specimens should fulfil the following requirements :
K2
,a, B, (W-a) ? 2.5
Rpo,2
223
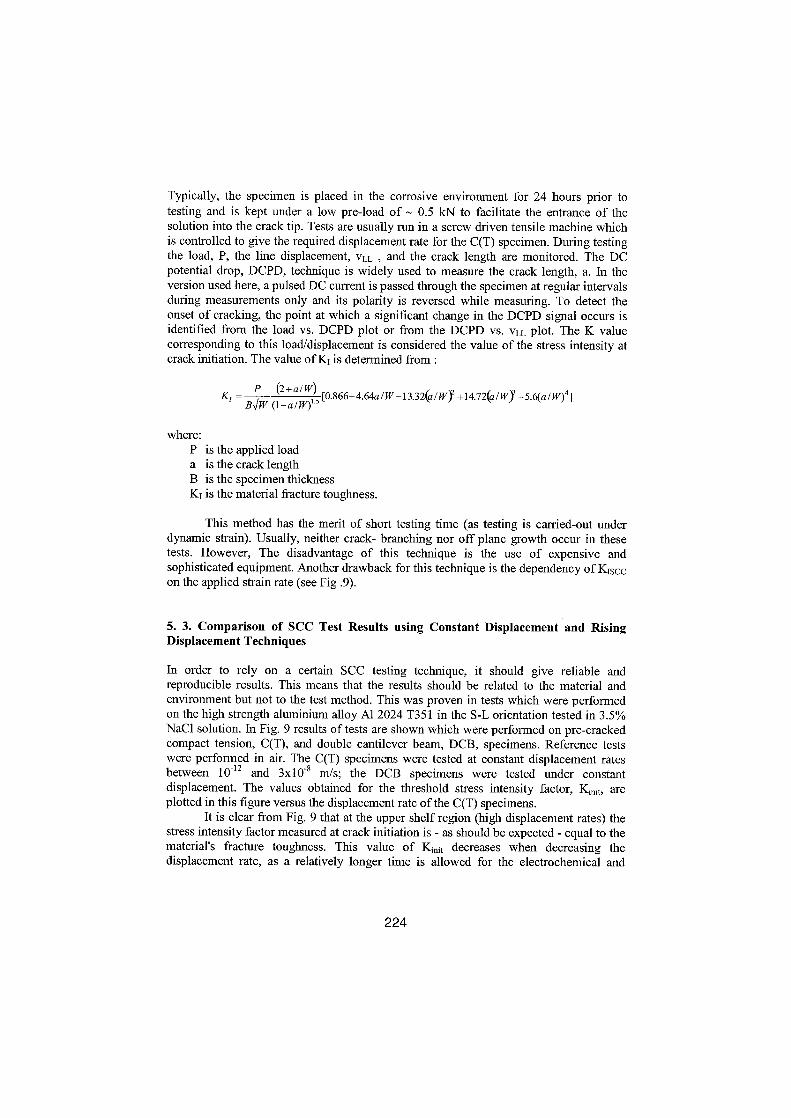
Typically, the specimen is placed in the corrosive environment for 24 hours prior totesting and is kept under a low pre-load of - 0.5 kN to facilitate the entrance of thesolution into the Crack tip . Tests are usually run in a screw driven tensile machine whichis controlled to give the required displacement rate for the C(T) specimen . During testingthe load, P, the line displacement, vLL , and the Crack length are monitored . The DCpotential drop, DCPD, technique is widely used to measure the Crack length, a. In theversion used here, a pulsed DC current is passed through the specimen at regular intervalsduring measurements only and its polarity is reversed while measuring . To detect theonset of cracking, the point at which a significant change in the DCPD signal occurs isidentified from the load vs . DCPD plot or from the DCPD vs . vLL plot . The K valuecorresponding to this load/displacement is considered the value of the stress intensity atcrack initiation . The value ofKI is determined from
K,- P (2+alW)5[0.866+4.64a/W-13.32(a/WY+14.72(a1WY-5.6(aIW)4]
B~ (1-a/W)
where :P is the applied loada is the crack lengthB is the specimen thicknessK I is the material fracture toughness .
This method has the merit of short testing time (as testing is carried-out underdynamic strain) . Usually, neither crack- branching nor off plane growth occur in thesetests . However, The disadvantage of this technique is the use of expensive andsophisticated equipment . Another drawback for this technique is the dependency of Kisccan the applied strain rate (see Fig .9) .
5 . 3 . Comparison of SCC Test Results using Constant Displacement and RisingDisplacement Techniques
In order to rely an a certain SCC testing technique, it should give reliable andreproducible results . This means that the results should be related to the material andenvironment but not to the test method . This was proven in tests which were performedan the high strength aluminium alloy Al 2024 T351 in the S-L orientation tested in 3 .5%NaCI solution . In Fig. 9 results of tests are shown which were performed an pre-crackedcompact tension, C(T), and double cantilever beam, DCB, specimens . Reference testswere performed in air . The C(T) specimens were tested at constant displacement ratesbetween 10-12 and 3x10-$ m/s ; the DCB specimens were tested under constantdisplacement . The values obtained for the threshold stress intensity factor, Ki,,it, areplotted in this figure versus the displacement rate of the C(T) specimens .
lt is clear from Fig. 9 that at the upper shelf region (high displacement rates) thestress intensity factor measured at Crack initiation is - as should be expected - equal to thematerial's fracture toughness . This value of Ki �i t decreases when decreasing thedisplacement rate, as a relatively longer time is allowed for the electrochemical and
224
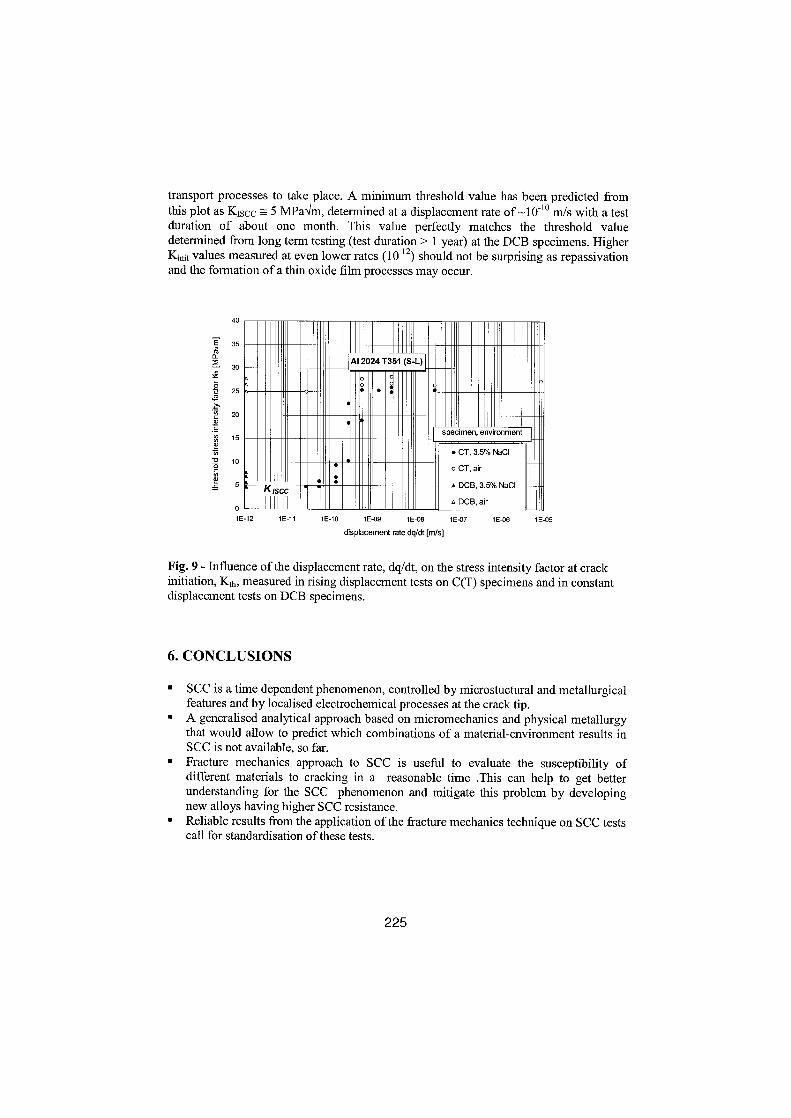
transport processes to take place . A minimum threshold value has been predicted fromthis plot as Ktscc = 5 MPa~m, determined at a displacement rate of-10-1° m/s with a testduration of about one month . This value perfectly matches the threshold valuedetennined from long term testing (test duration > 1 year) at the DCB specimens . HigherKi �i t values measured at even lower rates (10 -12) should not be surprising as repassivationand the formation of a thin oxide film processes may occur .
40
35
30
25
20
15
10
6. CONCLUSIONS
0l E-12
IE-11
lE-10
1E-09
IE-08
lE-07
lE-06
1 E-05
displacement rate dq/dt[m/s]
Fig. 9 - Influence of the displacement rate, dq/dt, an the stress intensity factor at crackinitiation, Kth, measured in rising displacement tests an C(T) specimens and in constantdisplacement tests an DCB specimens.
SCC is a time dependent phenomenon, controlled by microstuctural and metallurgicalfeatures and by localised electrochemical processes at the Crack tip.A generalised analytical approach based an micromechanics and physical metallurgythat would allow to predict which combinations of a material-environment results inSCC is not available, so far.Fracture mechanics approach to SCC is useful to evaluate the susceptibility ofdifferent materials to cracking in a reasonable time This can help to get betterunderstanding for the SCC phenomenon and mitigate this problem by developingnew alloys having higher SCC resistance .Reliable results from the application ofthe fracture mechanics technique an SCC testscall for standardisation ofthese tests .
225
11111111~111111111111111111111111111111111111111111111111111111111°'
.. ..[~~i1'1111111111111111111
11111111r1111111~11111111111111~IIIIIIIIillüll~lll11111
X111111 1111111111111unm~nnnu~~ui
11111111'1111111
~- - - ~ - IIIIIIIII~I~11~111111u11111 X1111111
__._..___ __
r1111111111~11111111111~. : . . .
. .C:, . 111
7. BIBLIOGRAPHY
1) D.O.Sprowls, Tests for Stress Corrosion Cracking, in : ASM Handbook, Vol. 8, ASMInternational, Metal Park, OH., 1995, pp . 495-536 .
2) W.Dietzel and K.-H.Schwalbe, Standardization of Fracture Mechanics Based SCCTesting, Proc . ofthe lOth European Conf. an Fracture - ECF 10, K.-H.Schwalbe andC: Berger (Eds.), Engineering Materials Advisory Service (EMAS) Ltd., 1994, pp.53-66 .
3) W.Dietzel, Stress Corrosion Cracking in Metals, in : Encyclopedia of Materials :Science and Technology, K.H.J.Buschow, R.W.Cahn, M.C.Flemings, B.Ilschner,E.J.Kramer and S.Mhajan (Eds .), Elsevier Science Ltd ., Amsterdam, 2001 .
4) W.Dietzel, Characterization of Susceptibility of Metallic Materials toEnvironmentally Assisted Cracking - Final Report, GKSS 99/13/24, 1994 .
5) W.Dietzel, Standardization of Rising Load/Rising Displacement SCC Testing, in :Environmentally Assisted Cracking : Predictive Methods for Risk Assessment andEvaluation of Materials, Equipment and Structures, ASTM STP 1401, R.D.Kane(Ed.), American Society for Testing and Materials, West Conshohocken, PA.,2000,pp.317-326 .
6) G.H.Koch, Stress Corrosion Cracking and Hydrogen Embrittlement, in : ASMHandbook, Fatigue and Fracture, Vol . 19, ASM International, Metal Park, OH., 1996,pp.483-506 .
7) K.-H.Schwalbe and D.Hellmann, Application of the Electrical Potential Method toCrack Length Measurements Using Johnson's Formula, J . Testing and Evaluation,ASTM, Philadelphia, PA., 1981, pp.218-220 .
8) M.Horstmann, J.K.Gregory, K.-H.Schwalbe, The AC Potential Drop Method,Materials Testing, 35, 1993, pp.212-217 .
9) W.Dietzel and K.-H. Schwalbe, Application ofthe Rising Displacement Test to SCCInvestigations, in : Slow Strain Rate Testing for the Evaluation of EnvironmentallyInduced Cracking:Research and Engineering Applications, ASTM STP 1210,R.D.Kane (Ed .), American Society for Testing and Materials, Philadelphia, PA.,1993, pp . 134-148 .
10) B.E.Wilde, Stress Corrosion Cracking, in : ASM Handbook, Failure Analysis andPrevention, Vol.l l, ASM Intrnational, Metal Park, OH., 1995, pp.203-224.
11) G.Sandoz, High Strength Steels, Stress Corrosion Cracking in High Strength Steelsand in Titanium Alloys, B.F.Brown (Ed.), Naval Research Laboratory, Washington,DC, 1972, pp.79-145 .
Case StudyThe Failure Analysis of Boiler Superheater Trabes
at Shoubra El Khema Power Station
Dr . Ahmed Gorab. Chem . Mohamad Abdel Rashedand Eng. Seham EI Zahany
Abstract :The failed tube is elbow shape made of stainless steel (SA 213 Tp . 304H) subjected toloss of materials, severe corrosion, layer of outer scales, cracks and microcracks . Thedesign temperature and pressure are 587 °C, 207 Kglcm2 physical , chemical andmetallographic inspection are carried out as foliows:- Chemical analysis of tube alloy and scale deposit measured by Energy DisprovesX-ray Analysis (EDX) attached to the Scanning electron microscope .-
Measuring of Vicker's hardness number at different points of failed tube and a newone.-
Metallographic examination of failed tube and a new tube .-
Coliection of chemical analysis data of boiler steam during one year.-
Collection of combustion änalysis data and fuel oil analysis during one year-
It was concluded that the failure of tube is referred to occurrence of sensitizationphenomenon with appearance of intergranular corrosion of austenitic stainless steelswhich caused from the accumulation of chromium carbides at the grain boundaries andcreate stresses at them . The alloy becomes brittle and can not resist the designedinner pressure, which causes the failure . The sensitization phenomenon affects theaustenitic stainless sties rohen heated in the temperature range of about 550 °C-850°C .it was recommended to replace all 3"' super heater tubes by another alloy with lowcarbon content 0.03 % or alloy contains additional elements such as titanium andcolumbium to be more tolerance to heat . Fuel oil treatment by chemical additives,combustion adjustment, and operation instruction during operation and outages shouldbe followed and property controlled .
227
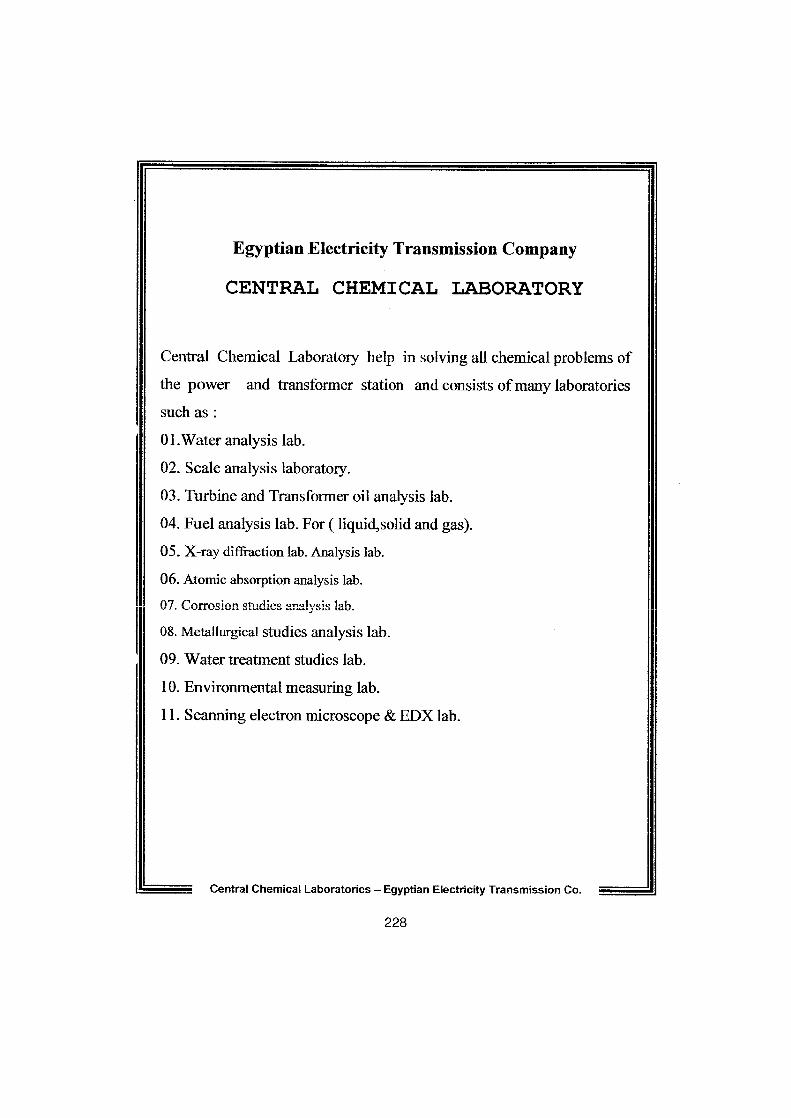
Egyptian Electricity Transmission Company
CENTRAL CHEMICAL LABORATORY
Central Chemical Laboratory help in solving all chemical problems ofthe power and transformer station and consists of many laboratoriessuch as01 .Water analysis lab.02. Scale analysis laboratory .03. Turbine and Transformer oil analysis lab.04. Fuel analysis lab. For ( liquid,solid and gas) .05 . X-ray diffraction lab. Analysis lab.
06. Atomic absorption analysis lab.
07 (nr-os:~n sfi~d~es ?..".alcci3 1.-ab.
08 . Metallurgical studies analysis lab.09. Water treatment studies lab.10 . Environmental measuring lab.11 . Scanning electron microscope & EDX lab.
Central Chemical Laboratories - Egyptian Electricity Transmission Co.
228
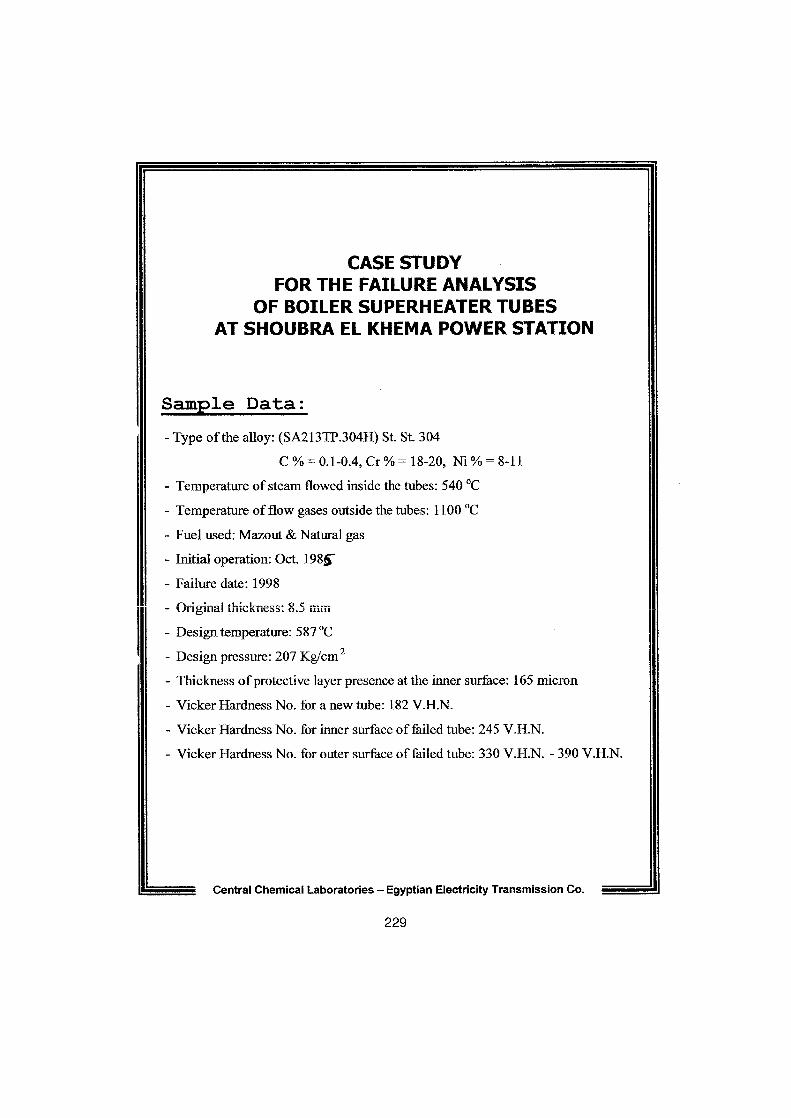
CASE STUDYFOR THE FAILURE ANALYSIS
OF BOILER SUPERHEATER TUBESAT SHOUBRA EL KHEMA POWER STATION
Sample Data :- Type ofthe alloy : (SA213TP.304H) St . St . 304
C % = 0.1-0 .4, Cr% = 18-20, Ni % = 8-11
- Temperature ofsteam flowed inside the tubes: 540°C- Temperature offlow gases outside the tubes: 1100 °C
- Fuel used: Mazout & Natural gas- Initial operation : Oct. 198j-- Failure date : 1998
- Vil~'ll1Ai 11llG1S11GJ5 : o.J uuu
- Design Tmerature: 587 °C- Design pressure : 207 Kg/cm z
- Thickness ofprotective layer presence at the inner surface: 165 micron
- Vicker Hardness No. for anew tobe : 182 V.H.N.
- Vicker Hardness No. for inner surface offailed tube: 245 V.H.N.- Vicker Hardness No. for outer surface offailed tube : 330 V.H.N. - 390 V.H.N.
Central Chemical Laboratories - Egyptian Electricity Transmission Co.
229
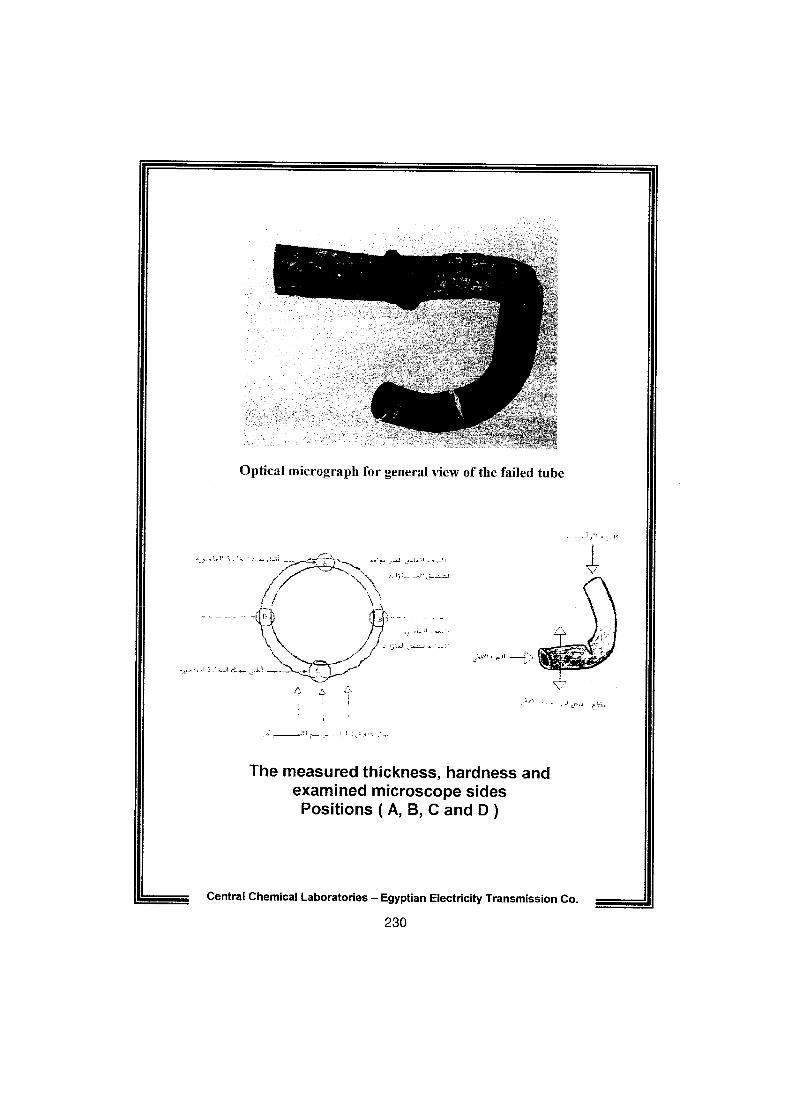
Optiical
micrograph for general view of the failed tube
The
measured thickness, hardness and
examined
microscope sides
Positions
(A, B, C and D )
Central
Chemical Laboratories - Egyptian Electricity Transmission Co
.
230
ain struchi 3 New Tube
Magnification : 200x
Austenitir Stainless Steel
Central Chemical Laboratories - Egyptian Ebclricity Transmission Co .
231
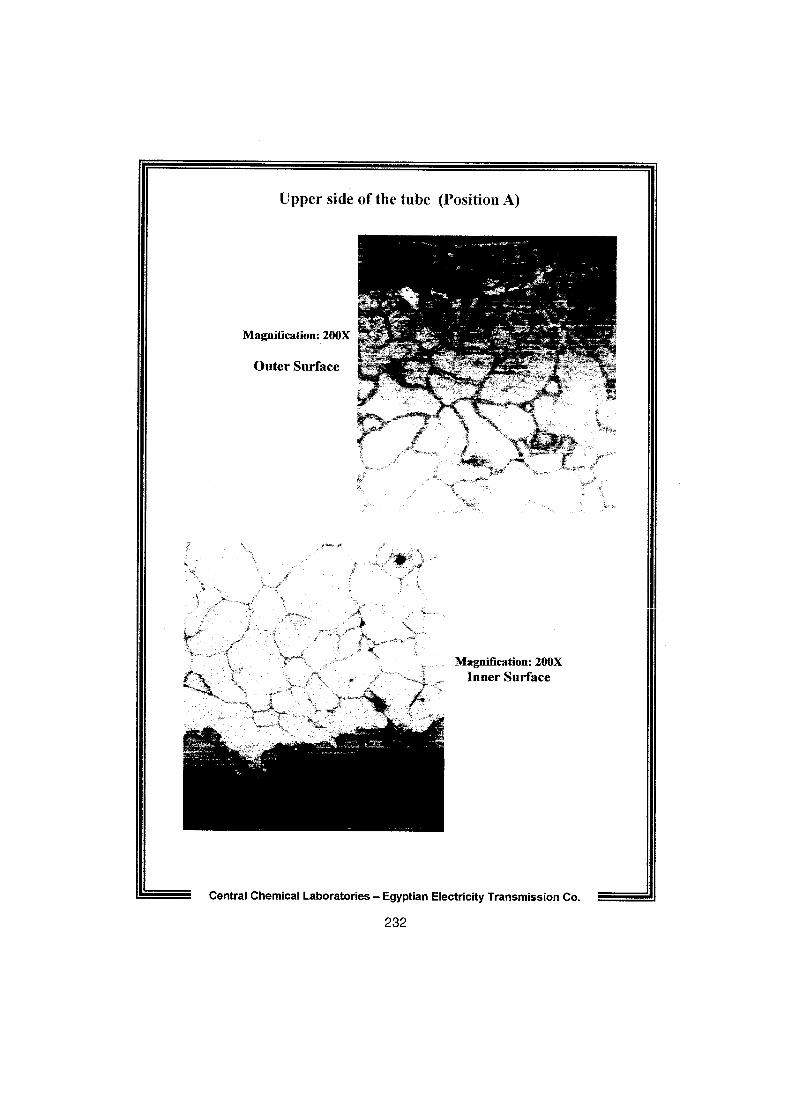
Upper siele of the tube (Position A)
Magnification : 200X
Outer Surface
Magnification : 200XInner Surface
Central Chemical Laboratories - Egyptian Electricity Transmission Co.
232
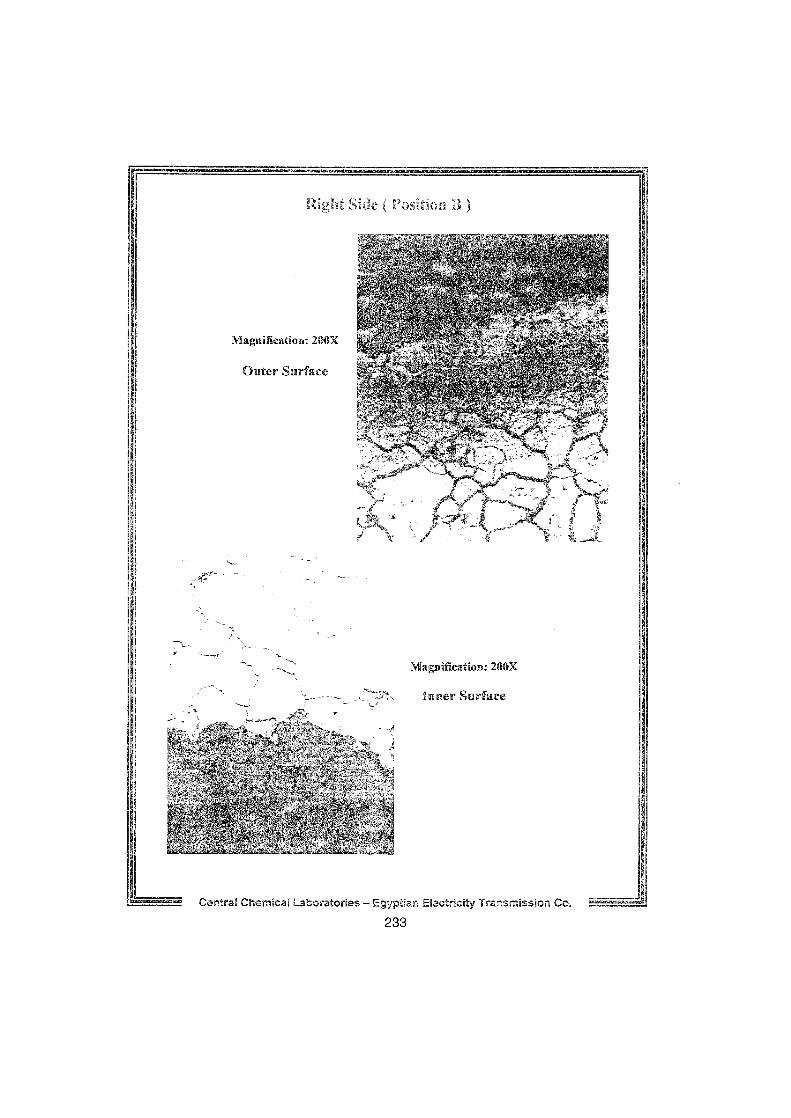
Magnifieation : 200X
Inner Surface
Central Chemical Laboratories - Egyptian Electricd,tly Transmission Co .
233
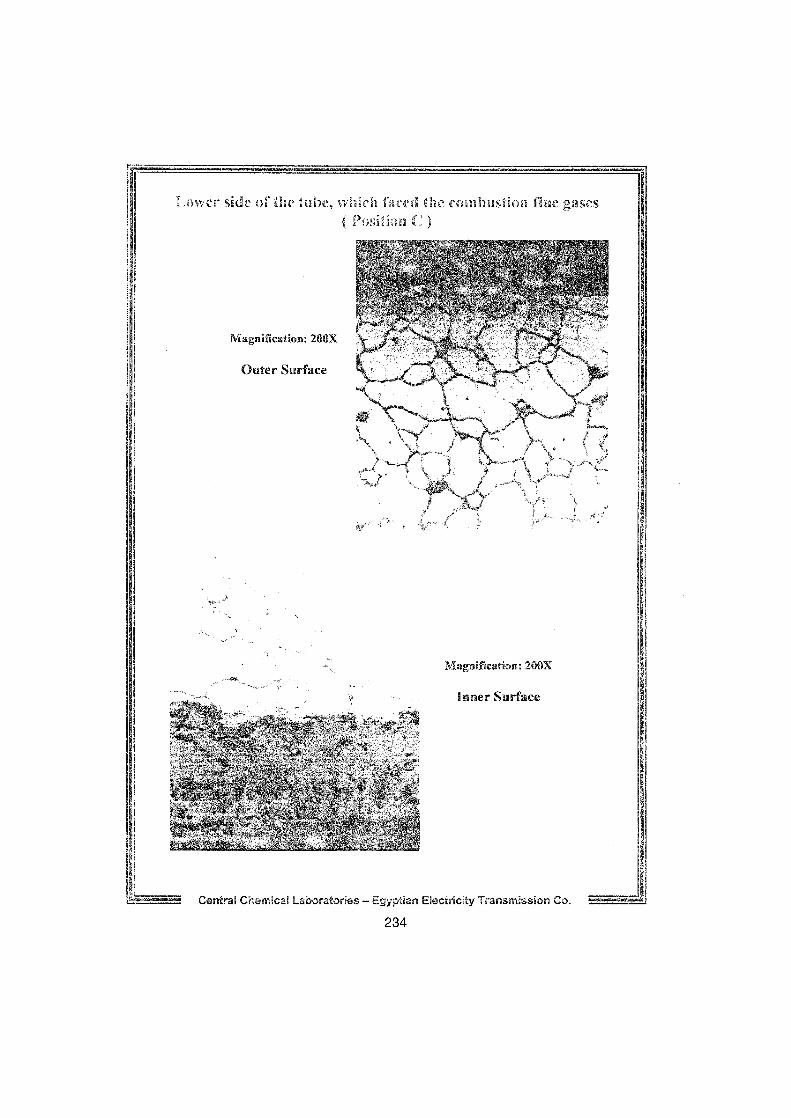
War Ade of thi, tube, which
glie
0il flige gases( poChn (1 )
Magnifteation. 200X
Outer Surface
Magnilrieation : 200X
Inner Surface
Centrai Chemica~ Laboratories - Egyptian Ele&tricity Transmission Co.
234
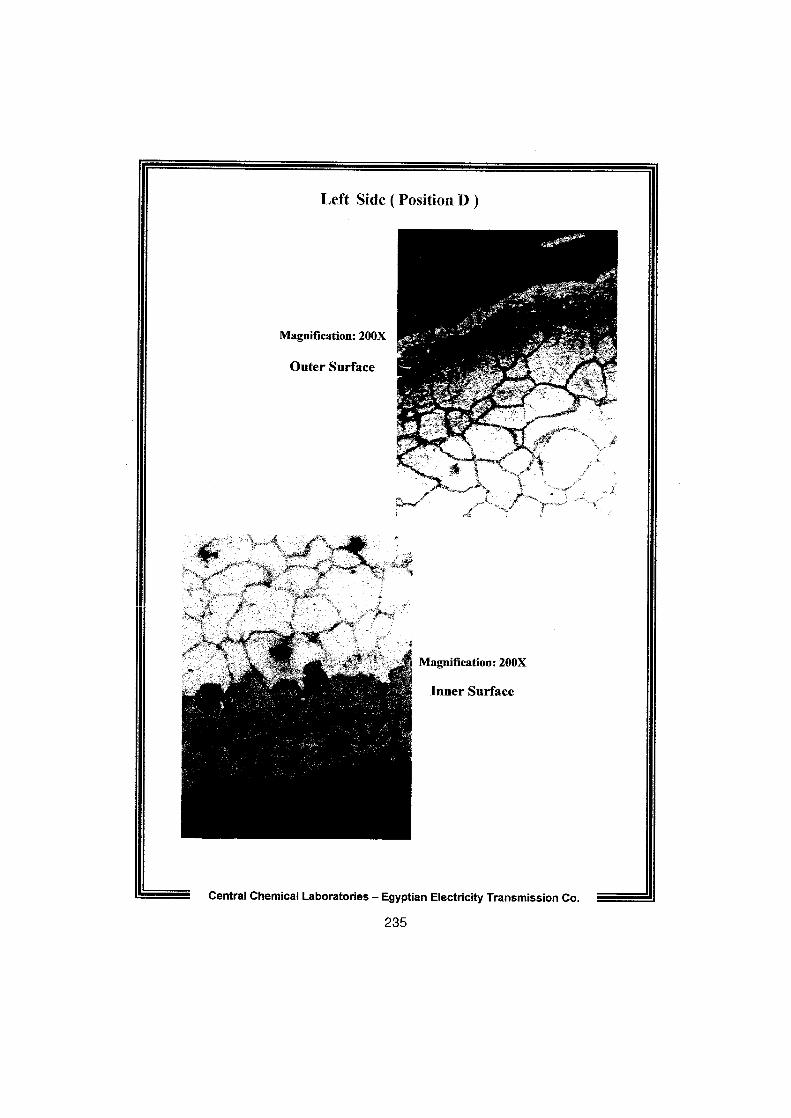
Left Side (Position D )
Magnification : 200X
Outer Surface
Magnification: 200X
Inner Surface
Central Chemical Laboratories - Egyptian Electricity Transmission Co .
235
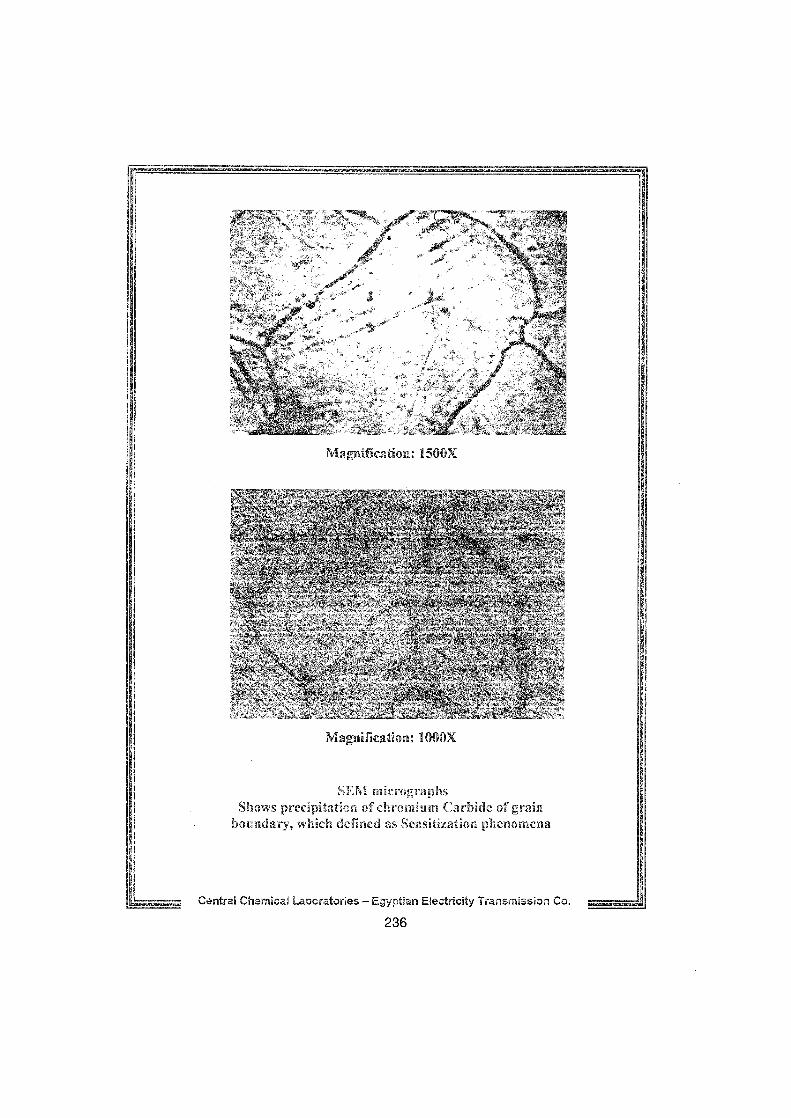
Ma
i cations 1560x
SENII m-crr;ga -aphsShows pdecipitatiam of chromiu
Car ide o grainbourkdai-Y, which dcineel as Scasifzation p enornena
Carttra Chenica3 Laborataries - Egypt236
n Electricity TransEnaission Car .
"
SENSITIZATION
- It is a type of intergranular corrosion which occurred at austeniticstainless steel .
- Intergranular corrosion is preferential dissolution of the grain-boundary phases or the zones immediately adjacent to them becausegrain boundary zone is more active chemically than grain itsel£
- Austenetic stainless steel become sensitized or suseeptible tointergranular corrosion when heated in the temperature range ofabout 550 °C to 850 °C.
- At
this range of temperature chromium depleted from the grainboundary and areas adjacent to it to combined with carbon andprecipitated an grain boundary .
The extent of sensitization effect is a function of both time andtemperature also the composition of the alloy "specially thepercentage of carbon and of carbide forming elements" also,sensitizing is damaging in a given instance depends an therequirements of the specific application and the environment andstresses to which it is exposed , the prior thermal and mechanicalworking history ofthe alloy.
Central Chemical Laboratories - Egyptian Electricity Transmission Co .
237

The Remedy :
- One method ofreducing the susceptibility ofaustenitic stainless steel
to intergranular corrosion is to use solution heat treatment, usually byheating to 1066 °C to 1121 °C and immediately water quenching . By
this procedure chromium carbide is dissolved and retained in soild
solution provided that cooling ofthe steel from the solution.
- We can avoid sensitization by using stainless steels that contain less
than 0.03 % Carbon (extra-low carbon grades), or by using stainless
steels grades which contain sufficient titanium and columbium or
columbium plus tantalum as stabilizing elements .
Central Chemical Laboratories - Egyptian Electricity Transmission Co.
238
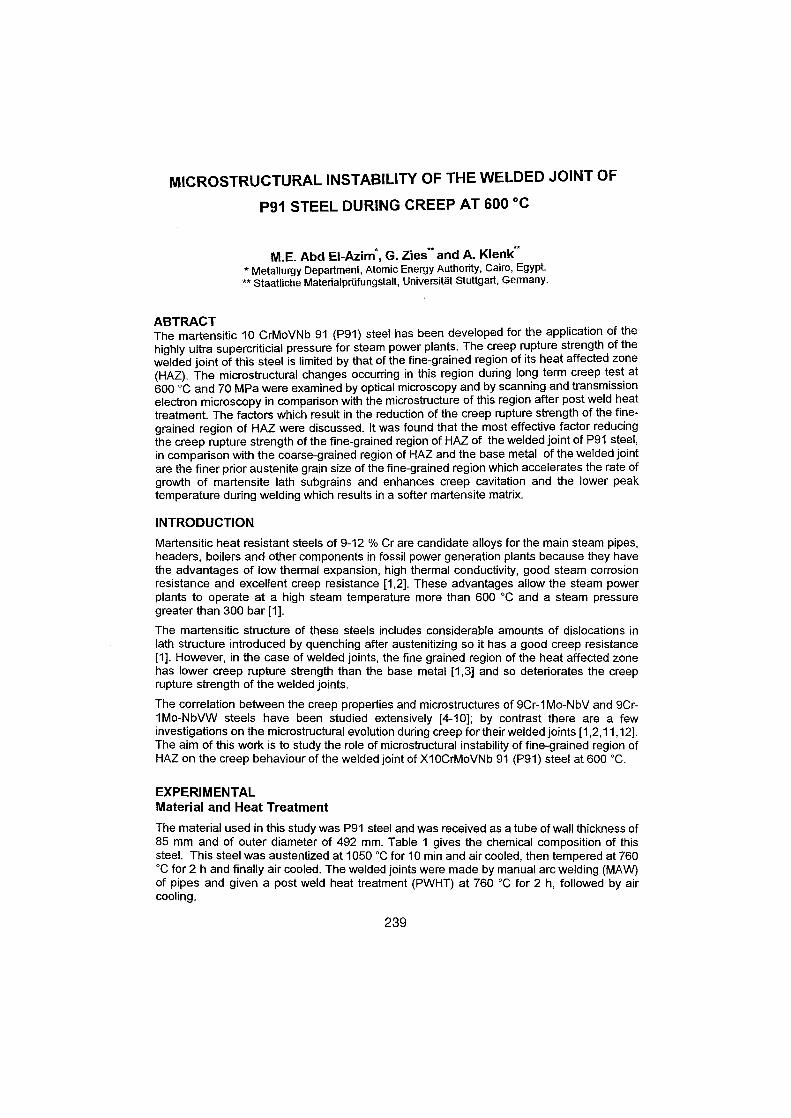
MICROSTRUCTURAL INSTABILITY OF THE WELDED JOINT OF
P91 STEEL DURING CREEP AT 600 °C
M.E. Abd EI-Azim', G. Zieseand A. Klenk**"` Metallurgy Department, Atomic Energy Authority, Cairo, Egypt."" Staatliche Matehalprüfungstatt, Universität Stuttgart, Germany.
ABTRACTThe martensitic 10 CrMoVNb 91 (1391) steel has been developed for the application of the
highly ultra supercriticial pressure for steam Power plants . The creep rupture strength of thewelded joint of this steel is limited by that of the fine-grained region of its heat affected zone(HAZ). The microstructural changes occurring in this region during Jong term creep test at600 °C and 70 MPa were examined by optical microscopy and by scanning and transmissionelectron microscopy in comparison with the microstructure of this region after post weld heattreatment. The factors which result in the reduction of the creep rupture strength of the fine-grained region of HAZ were discussed. It was found that the most effective factor reducingthe creep rupture strength of the fine-grained region of HAZ of the welded joint of P91 steel,in comparison with the coarse-grained region of HAZ and the base metal of the welded jointare the finer prior austenite grain size of the fine-grained region which accelerates the rate ofgrowth of martensite lath subgrains and enhances creep cavitation and the lower peaktemperature during welding which results in a softer martensite matrix .
INTRODUCTION
Martensitic heat resistant steels of 9-12 % Cr are candidate alloys for the main steam pipes,headers, boilers and other components in fossil Power generation plants because they havethe advantages of low thermal expansion, high thermal conductivity, good steam corrosionresistance and excellent creep resistance [1,2]. These advantages allow the steam Powerplants to operate at a high steam temperature more than 600 °C and a steam pressuregreater than 300 bar [1] .
The martensitic structure of there steels includes considerable amounts of dislocations inlath structure introduced by quenching after austenitizing so it has a good creep resistance[1] . However, in the Gase of welded joints, the fine grained region of the heat affected zonehas lwer creep rupture strength than the base metal [1,3] and so detehorates the creeprupture strength of the welded joints .
The correlation between the creep properties and microstructures of 9Cr-1Mo-NbV and 9Cr-1Mo-NbVW steels have been studied extensively [4-10] ; by contrast there are a fewinvestigations an the microstructural evolution during creep fortheirweldedjoints [1,2,11,12] .The aim of this work is to study the rote of microstructural instability of fine-grained region ofHAZ an the creep behaviour of the welded joint of X10CrMoVNb 91 (1291) steel at 600 °C .
EXPERIMENTALMaterial and Heat Treatment
The material used in this study was P91 steel and was received as atube ofwall thickness of85 mm and of outer diameter of 492 mm. Table 1 gives the chemical composition of thissteel . This steel was austentized at 1050 °C for 10 min and air cooled, then tempered at 760°C for 2 h and finally air cooled . The welded joints were made by manual arc welding (MAW)of pipes and given a post weld heat treatment (PWHT) at 760 °C for 2 h, followed by aircooling .
239
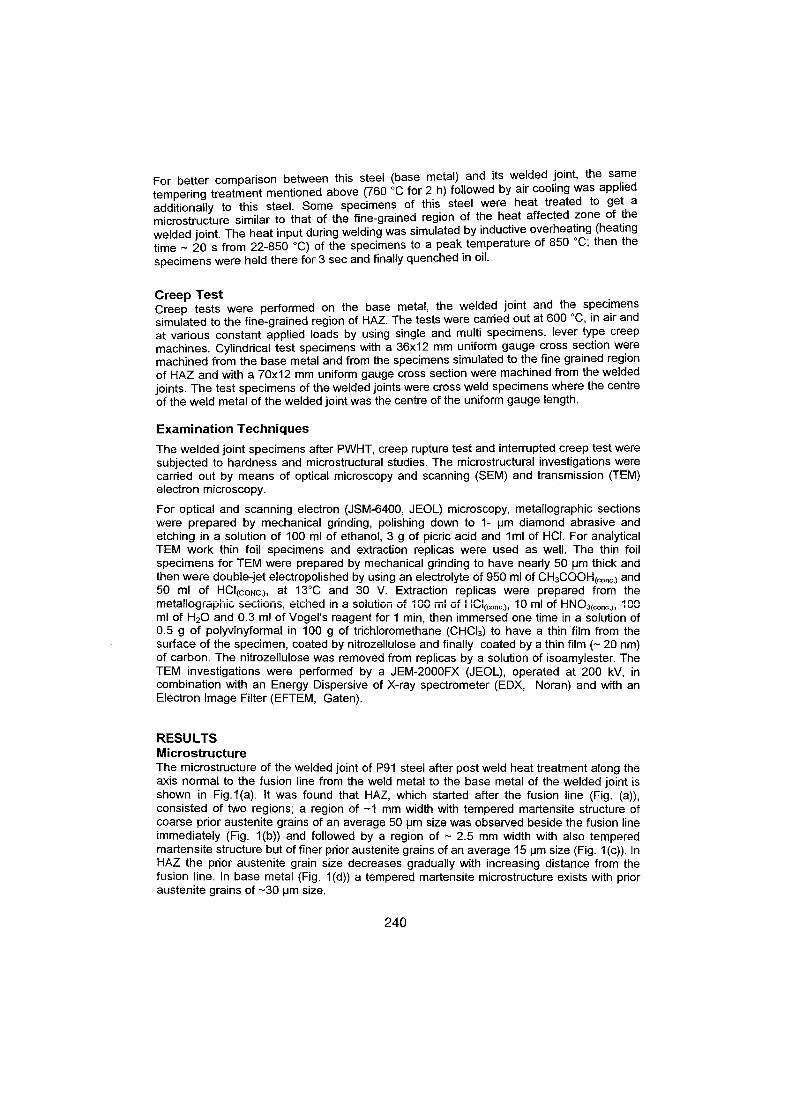
For better comparison between this steel (base metal) and its welded joint, the saure
tempering treatment mentioned above (760 °C for 2 h) followed by air cooling was applied
additionally to this steel . Some specimens of this steel were heat treated to get a
microstructure similar to that of the fine-grained region of the heat affected zone of the
welded joint. The hegt input during welding was simulated by inductive overheating (heating
time - 20 s from 22-850 °C) of the specimens to a peak temperature of 850 °C ; then the
specimens were held there for 3 sec and finally quenched in oil .
Creep TestCreep tests were performed an the base metal, the welded joint and the specimenssimulated to the fine-grained region of HAZ. The tests were carried out at 600 °C, in air andat various constant applied loads by using single and multi specimens, lever type creepmachines . Cylindrical test specimens with a 36x12 mm uniform gauge cross section weremachined from the base metal and from the specimens simulated to the fine grained regionof HAZ and with a 70x12 mm uniform gauge cross section were machined from the weldedjoints. The test specimens of the welded joints were cross weld specimens where the centreof the weld metal of the welded joint was the centre of the uniform gauge length .
Examination Techniques
The welded joint specimens after PWHT, creep rupture test and interrupted creep test weresubjected to hardness and microstructural studies. The microstructural investigations werecarried out by means of optical microscopy and scanning (SEM) and transmission (TEM)electron microscopy .
For optical and scanning electron (JSM-6400, JEOL) microscopy, metallographic sectionswere prepared by mechanical grinding, polishing down to 1- pm diamond abrasive andetching in a solution of 100 ml of ethanol, 3 g of picric acid and 1ml of HCI. For analyticalTEM work thin foil specimens and extraction replicas were used as well . The thin foilspecimens for TEM were prepared by mechanical grinding to have nearly 50 pm thick andthen were double-jet electropolished by using an electrolyte of 950 ml of CH3000H(con �.) and50 ml of HCI(CONC.), at 13°C and 30 V. Extraction replicas were prepared from themetäiioyra hic sections, etcied in ä sülütion of 100 iiii of
iv iiii 3f HNO
i v̂̂v(conc.),
3(conc .),ml of H20 and 0.3 ml of Vogel's reagent for 1 min, then immersed one time in a solution of0.5 g of polyvlnyformal in 100 g of thchloromethane (CHCI3) to have a thin film from thesurface of the specimen, coated by nitrozellulose and finally coated by a thin film (- 20 nm)of carbon . The nitrozellulose was removed from replicas by a solution of isoamylester. TheTEM investigations were performed by a JEM-2000FX (JEOL), operated at 200 kV, incombination with an Energy Dispersive of X-ray spectrometer (EDX, Noran) and with anElectron Image Filter (EFTEM, Gaten).
RESULTSMicrostructureThe microstructure of the welded joint of P91 steel after post weld heat treatment along theaxis normal to the fusion line from the weld metal to the base metal of the welded joint isshown in Fig.1(a). It was found that HAZ, which started after the fusion line (Fig . (a)),consisted of two regions; a region of -1 mm width with tempered martensite structure ofcoarse phor austenite grains of an average 50 pm size was observed beside the fusion lineimmediately (Fig . 1(b)) and followed by a region of - 2.5 mm width with also temperedmartensite structure but of finer prior austenite grains of an average 15 pm size (Fig . 1(c)) . InHAZ the prior austenite grain size decreases gradually with increasing distance from thefusion line . In base metal (Fig . 1(d)) a tempered martensite microstructure exists with prioraustenite grains of -30 pm size .
240
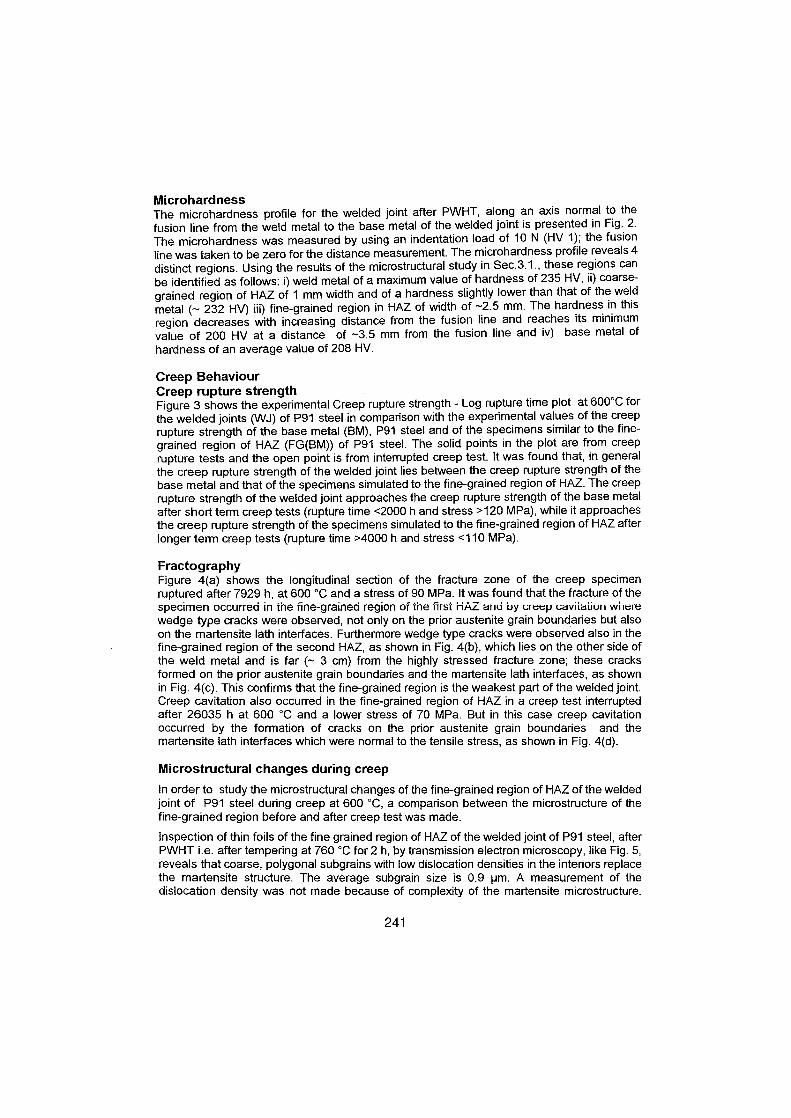
MicrohardnessThe microhardness profile for the welded joint after PWHT, along an axis normal to thefusion line from the weld metal to the Base metal of the welded joint is presented in Fig. 2.The microhardness was measured by using an indentation load of 10 N (HV 1) ; the fusionline wastaken to be zero for the distance measurement. The microhardness profile reveals 4distinct regions. Using the results of the microstructural study in Sec.3 .1 ., these regions canbe identified as follows: i) weld metal of a maximum value of hardness of 235 HV, ii) coarse-grained region of HAZ of 1 mm width and of a hardness slightly lower than that of the weld
metal (- 232 HV) iii) fine-grained region in HAZ of width of -2.5 mm. The hardness in thisregion decreases with increasing distance from the fusion line and reaches its Minimumvalue of 200 HV at a distance of -3.5 mm from the fusion line and iv) base metal ofhardness of an average value of 208 HV .
Creep BehaviourCreep rupture strengthFigure 3 shows the experimental Creep rupture strength - Log rupture time plot at 600°C forthe welded joints (WJ) of P91 steel in comparison with the experimental values of the creeprupture strength of the base metal (BM), P91 steel and of the specimens similar to the fine-grained region of HAZ (FG(BM)) of P91 steel . The solid points in the plot are from creeprupture tests and the open point is from interrupted creep test. It was found that, in generalthe creep rupture strength of the welded joint lies between the creep rupture strength of thebase metal and that of the specimens simulated to the fine-grained region of HAZ. The creeprupture strength of the welded joint approaches the creep rupture strength of the base metalafter short term creep tests (rupture time <2000 h and stress >120 MPa), while it approachesthe creep rupture strength of the specimens simulated to the fine-grained region of HAZ afterlonger term creep tests (rupture time >4000 h and stress <110 MPa) .
FractographyFigure 4(a) shows the longitudinal section of the fracture zone of the creep specimenruptured after 7929 h, at 600 °C and a stress of 90 MPa. It was found that the fracture of thespecimen occurred in the fine-grained region of ine first HAZ änd by creep cavitation wherewedge type cracks were observed, not only an the prior austenite grain boundaries but alsoan the martensite lath interfaces . Furthermore wedge type cracks were observed also in thefine-grained region of the second HAZ, as shown in Fig. 4(b), which lies an the other side ofthe weld metal and is far (- 3 cm) from the highly stressed fracture zone ; these cracksformed an the prior austenite grain boundaries and the martensite lath interfaces, as shownin Fig . 4(c) . This confirms that the fine-grained region is the weakest part of the welded joint.Creep cavitation also occurred in the fine-grained region of HAZ in a creep test interruptedafter 26035 h at 600 °C and a lower stress of 70 MPa. But in this case creep cavitationoccurred by the formation of cracks an the prior austenite grain boundaries and themartensite lath interfaces which were normal to the tensile stress, as shown in Fig. 4(d) .
Microstructural changes during creep
In order to study the Microstructural changes of the fine-grained region of HAZ of the weldedjoint of P91 steel during creep at 600 °C, a comparison between the microstructure of thefine-grained region before and alter creep test was made .Inspection of thin foils of the fine grained region of HAZ of the welded joint of P91 steel, afterPWHT i.e . after tempering at 760 °C for 2 h, by transmission electron microscopy, like Fig. 5,reveals that coarse, polygonal subgrains with low dislocation densities in the interiors replacethe martensite structure. The average subgrain size is 0.9 pm . A measurement of thedislocation density was not made because of complexity of the martensite microstructure.
241
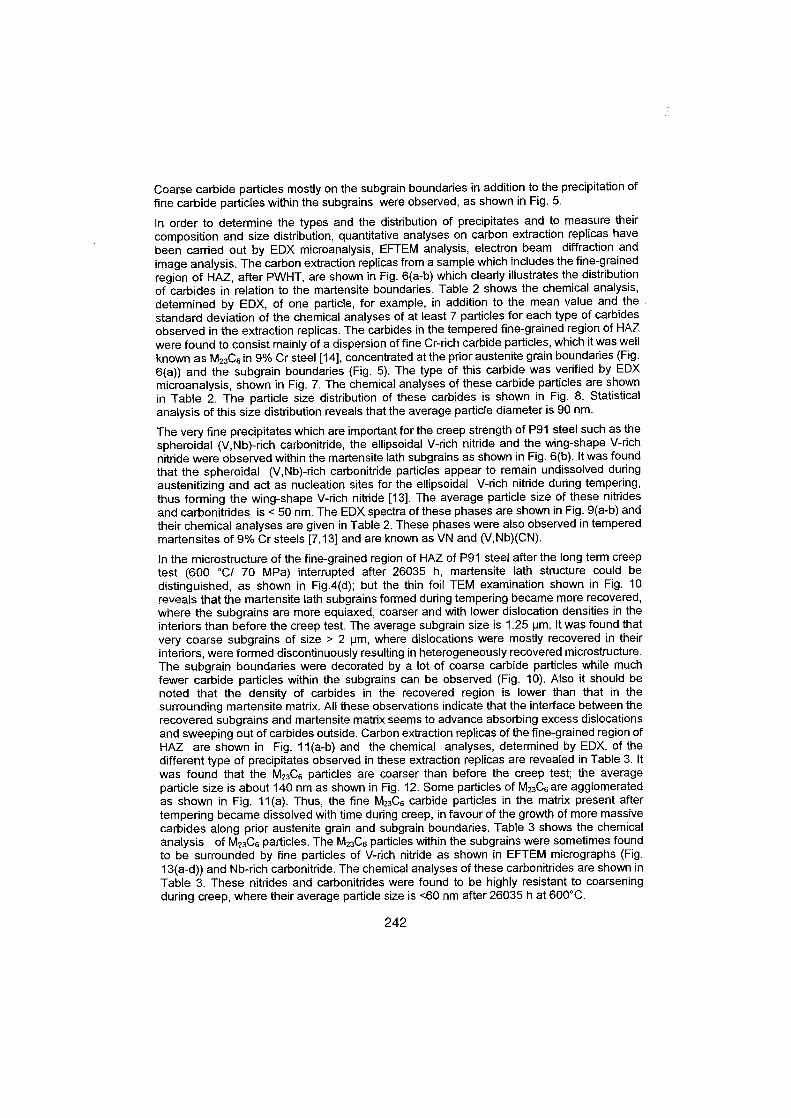
Coarse carbide particles mostly an the subgrain boundaries in addition to the precipitation offine carbide particles within the subgrains were observed, as shown in Fig. 5.
In order to determine the types and the distribution of precipitates and to measure theircomposition and size distribution, quantitative analyses an carbon extraction replicas havebeen carried out by EDX microanalysis, EFTEM analysis, electron beam diffraction andimage analysis . The carbon extraction replicas from a sample which includes the fine-grainedregion of HAZ, after PWHT, are shown in Fig. 6(a-b) which clearly illustrates the distributionof carbides in relation to the martensite boundaries . Table 2 shows the chemical analysis,determined by EDX, of one particle, for example, in addition to the mean value and thestandard deviation of the chemical analyses of at least 7 particles for each type of carbidesobserved in the extraction replicas . The carbides in the tempered fine-grained region of HAZwere found to consist mainly of a dispersion of fine Cr-rich carbide particles, which it was weilknown as M23C6 in 9% Cr steel [14], concentrated at the prior austenite grain boundaries (Fig .6(a)) and the subgrain boundaries (Fig . 5) . The type of this carbide was verified by EDXmicroanalysis, shown in Fig. 7. The chemical analyses of these carbide particles are shownin Table 2. The particle size distribution of these carbides is shown in Fig. B. Statisticalanalysis of this size distribution reveals that the average particle diameter is 90 nm .
The very fine precipitates which are important for the creep strength of P91 steel such as thespheroidal (V,Nb)-rich carbonitride, the ellipsoidal V-rich nitride and the wing-shape V-richnitride were observed within the martensite lath subgrains as shown in Fig. 6(b) . It was foundthat the spheroidal (V,Nb)-rich carbonitride particles appear to remain undissolved duringaustenitizing and act as nucleation sites for the ellipsoidal V-rich nitride during tempering,thus forming the wing-shape V-rich nitride [13] . The average particle size of these nitridesand carbonitrides is < 50 nm . The EDXspectra of these phases are shown in Fig . 9(a-b) andtheir chemical analyses are given in Table 2. These phases were also observed in temperedmartensites of 9% Cr steels [7,13] and are known as VN and (V,Nb)(CN) .
In the microstructure of the fine-grained region of HAZ of P91 steel after the long term creeptest (600 °C/ 70 MPa) interrupted after 26035 h, martensite lath structure could bedistinguished, as shown in Fig.4(d) ; but the thin foil TEM examination shown in Fig. 10reveals that the martensite lath subgrains formed during tempering became more recovered,where the subgrains are more equiaxed, coarser and with lower dislocation densities in theinteriors than before the creep test. The average subgrain size is 1 .25 Nm . lt was found thatvery coarse subgrains of size > 2 Nm, where dislocations were mostly recovered in theirinterors, were formed discontinuously resulting in heterogeneously recovered microstructure .The subgrain boundaries were decorated by a lot of coarse carbide particles while muchfewer carbide particles within the subgrains can be observed (Fig . 10). Also it should benoted that the density of carbides in the recovered region is lower than that in thesurrounding martensite matrix . All these observations indicate that the interface between therecovered subgrains and martensite matrix seems to advance absorbing excess dislocationsand sweeping out of carbides outside. Carbon extraction replicas of the fine-grained region ofHAZ are shown in Fig. 11 (a-b) and the chemical analyses, determined by EDX, of thedifferent type of precipitates observed in these extraction replicas are revealed in Table 3. Itwas found that the M23C6 particles are coarser than before the creep test; the averageparticle size is about 140 nm as shown in Fig. 12 . Some particles of M23C6 are agglomeratedas shown in Fig . 11(a). Thus, the fine M23C6 carbide particles in the matrix present aftertempering became dissolved with time during creep, in favour of the growth of more massivecarbides along prior austenite grain and subgrain boundaries. Table 3 shows the chemicalanalysis
of M23C6 particles . The M23C6 particles within the subgrains were sometimes foundto be surrounded by fine particles of V-rich nitride as shown in EFTEM micrographs (Fig .13(a-d)) and Nb-rich carbonitride . The chemical analyses of these carbonitrides are shown inTable 3. These nitrides and carbonitrides were found to be highly resistant to coarseningduring creep, where their average particle size is <60 nm after 26035 h at 600°C.
242
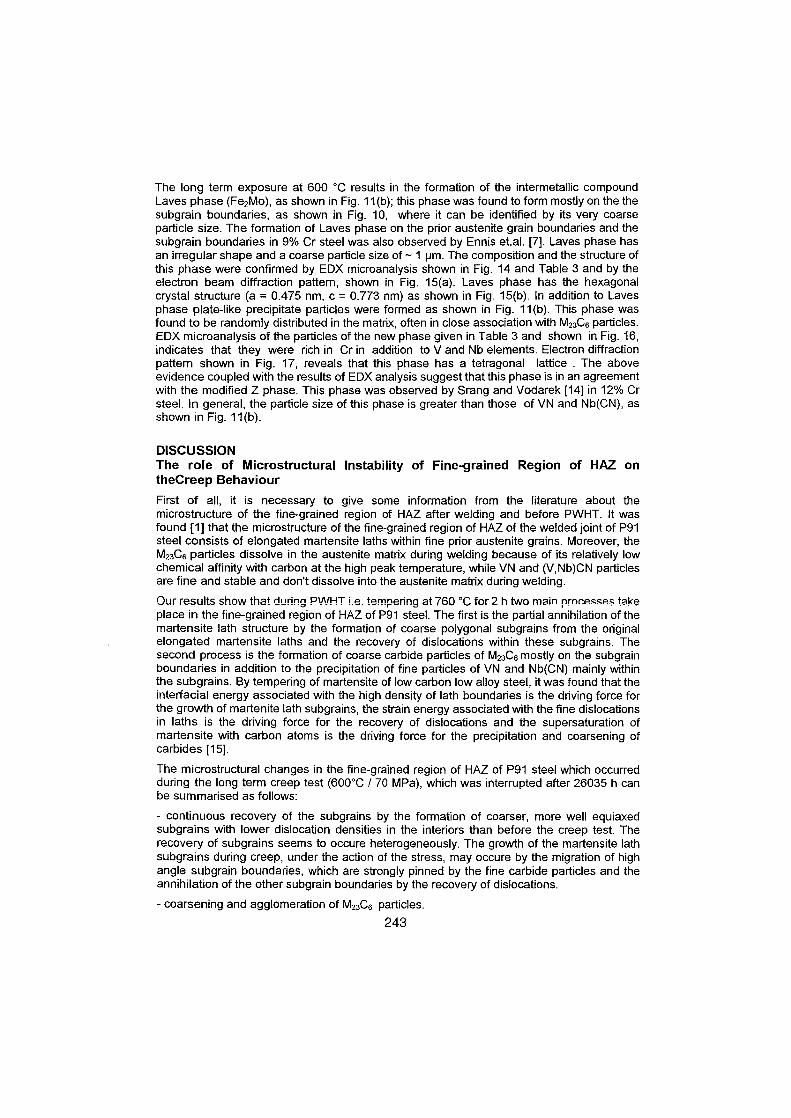
The long term exposure at 600 °C results in the formation of the intermetallic compoundLaves phase (Fe2Mo), as shown in Fig . 11(b); this phase was found to form mostly an the thesubgrain boundaries, as shown in Fig . 10, where it can be identified by its very coarseparticle size . The formation of Laves phase an the prior austenite grain boundaries and thesubgrain boundaries in 9% Cr steel was also observed by Ennis et.al . [7] . Laves phase hasan irregular shape and a coarse particle size of - 1 Nm . The composition and the structure ofthis phase were confirmed by EDX microanalysis shown in Fig . 14 and Table 3 and by theelectron beam diffraction pattern, shown in Fig. 15(a) . Laves phase has the hexagonalcrystal structure (a = 0.475 nm, c = 0.773 nm) as shown in Fig. 15(b). In addition to Lavesphase plate-like precipitate particles were formed as shown in Fig. 11(b) . This phase wasfound to be randomly distributed in the matrix, often in close association with M23C6 particles.EDX microanalysis of the particles of the new phase given in Table 3 and shown in Fig. 16,indicates that they were rich in Cr in addition to V and Nb elements. Electron diffractionpattern shown in Fig. 17, reveals that this phase has a tetragonal lattice . The aboveevidence coupled with the results of EDX analysis suggest that this phase is in an agreementwith the modified Z phase. This phase was observed by Srang and Vodarek [14] in 12% Crsteel . In general, the particle size of this phase is greater than those of VN and Nb(CN), asshown in Fig. 11(b).
DISCUSSIONThe rolle of Microstructural Instability of Fine-grained Region of HAZ antheCreep Behaviour
First of all, it is necessary to give some information from the litersture about themicrostructure of the fine-grained region of HAZ after welding and before PWHT . It wasfound [1] that the microstructure of the fine-grained region of HAZ of the welded joint of P91steel consists of elongated martensite laths within fine prior austenite grains . Moreover, theM23C6 particles dissolve in the austenite matrix during welding because of its relatively lowchemical affinity with carbon at the high peak temperature, while VN and (V,Nb)CN particlesare fine and stable and don't dissolve into the austenite matrix during welding.Oiur ,res ilts Show that dtirinn PWHT i.e. temnerinn at 790 °r fnr 7_ h two ma_in nrOrreSSeS ta_keplace in the fine-grained region of HAZ of P91 steel . The first is the partial annihilation of themartensite lath structure by the formation of coarse polygonal subgrains from the originalelongated martensite laths and the recovery of dislocations within these subgrains. Thesecond process is the formation of coarse carbide particles of M23C6 mostly an the subgrainboundaries in addition to the precipitation of fine particles of VN and Nb(CN) mainly withinthe subgrains. By tempering of martensite of low carbon low alloy steel, it wasfound that theinterfacial energy associated with the high density of lath boundaries is the driving force forthe growth of martenite lath subgrains, the strain energy associated with the fine dislocationsin laths is the driving force for the recovery of dislocations and the supersaturation ofmartensite with carbon atoms is the driving force for the precipitation and coarsening ofcarbides [15] .
The microstructural changes in the fine-grained region of HAZ of P91 steel which occurredduring the Jong term creep test (600°C / 70 MPs), which was interrupted after 26035 h canbe summarised as follows:
- continuous recovery of the subgrains by the formation of coarser, more well equiaxedsubgrains with lower dislocation densities in the interiors than before the creep test. Therecovery of subgrains seems to occure heterogeneously. The growth of the martensite lathsubgrains during creep, under the action of the stress, may occure by the migration of highangle subgrain boundaries, which are strongly pinned by the fine carbide particles and theannihilation of the other subgrain boundaries by the recovery of dislocations .
- coarsening and agglomeration of M23C6 particles .243

- stability of the fine V-rich nitride and Nb-rich carbonitride particles and additionalprecipitation of very fine particles of these nitrides and carbonitrides an the M23C6 particles.
- formation of coarse particles of Laves phase an the prior austenite grain boundaries andthe subgrain boundaries .
- precipitation of Z phase, which is rich in Cr, V and Nb, often at the vicinity of
M23C6particles.
The lower creep resistance of the welded joint in comparison with the Base metal for P91steel after log term creep test at 600 °C is due to the low creep resistance of the fine-grainedregion of its HAZ. This could be confirmed by the followings . Creep cavities have formed anthe prior austenite grain and subgrain boundaries only in this region as mentioned previouslyin the section of fracfography. The specimens similar to the fine grained region of HAZ havethe lowest creep resistance in comparison with the base metal and the welded joint (see Fig.3) . The low creep resistance of the fine grained region of HAZ is due the followings :
1) softening during creep results mainly from the growth of the martensite lath subgrains andalso from the recovery of dislocations within these subgrains. l t was found that the creepstrength of 9 % Cr steels is inversely proportional to the subgrain size and also to thedislocation density in the subgrain interior [9] .
2) disappearance of fine MZ3C6 carbide particles at the martensite lath subgrain boundaries,because of the coarsening and agglomeration of these particles during creep, results in anincrease in the rate of growth of the subgrains i.e. an increase in the rate of softening .Furthermore, the coarsening and agglomeration of the intragranular M23C6 particles results inan increase in interparticle spacing and a decrease in particle strengthening.
3) the precipitation of the fine particles of V-rich nitride and Nb-rich carbonitride in associationwith the coarser M23C6 particles prevents their contribution to particle strengthening.
4) the formation of the intermetallic compound Laves phase, Fe2Mo consumes much Mofrom the matrix, decreases its contribution to the solid solution strengthening and so resultsin a reduction in the creep rupture strength of the matrix. l t was found that Mo additionimproves the creep properties of 9% Cr steels through solid solution strengthening [16,17].Furthermore, the presence of this brittle phase an the prior austenite grain boundaries andthe subgrain boundaries accelerates creep cavitation .5) the formation of Z phase of Cr(V,Nb)N reduces the creep strength by the consumption ofprecipitation strengthening elements such as V, Nb and Cr from the matrix . The reduction instrength is due to that Cr(V,Nb)N particles are coarser than VN and Nb(CN) particles. l t wasfound that the precipitation of fine spherical particles of Nb(CN) and ellipsoidal particles ofVN were shown to be effective obstacles against dislocation glide resulting in an increase increep rupture strength in high nitrogen (0.055 wt.%) 10XCrMoNbV steel [13] . Also P91 steelhas the same high nitrogen content (see Table 1) .
The last five factors mentioned above, generally play the same role, but with different rates,in reducing the creep resistance of the fine-and the coarse-grained regions of HAZ, the basemetal and the weld metal of the welded joint of P91 steel . l t was observed that the maindifferences between these regions of the welded joint are the prior austenite grain size andthe peak temperature during welding. The rote of these two factors is going to be discussedin the next sections .
The Role of Prior Austenite Grain Size an the Creep Behaviour
lt was observed that at low stresses and Jong term creep tests, the recovery of martensitelaths in 9 % Cr steel occurred heterogeneously, where a significantly recovered region wasobserved at the vicinity of prior austenite grain boundaries, while the microstructure withinthe grains is still fine [8] . Heterogeneous recovery of martensite laths was also observed in
244
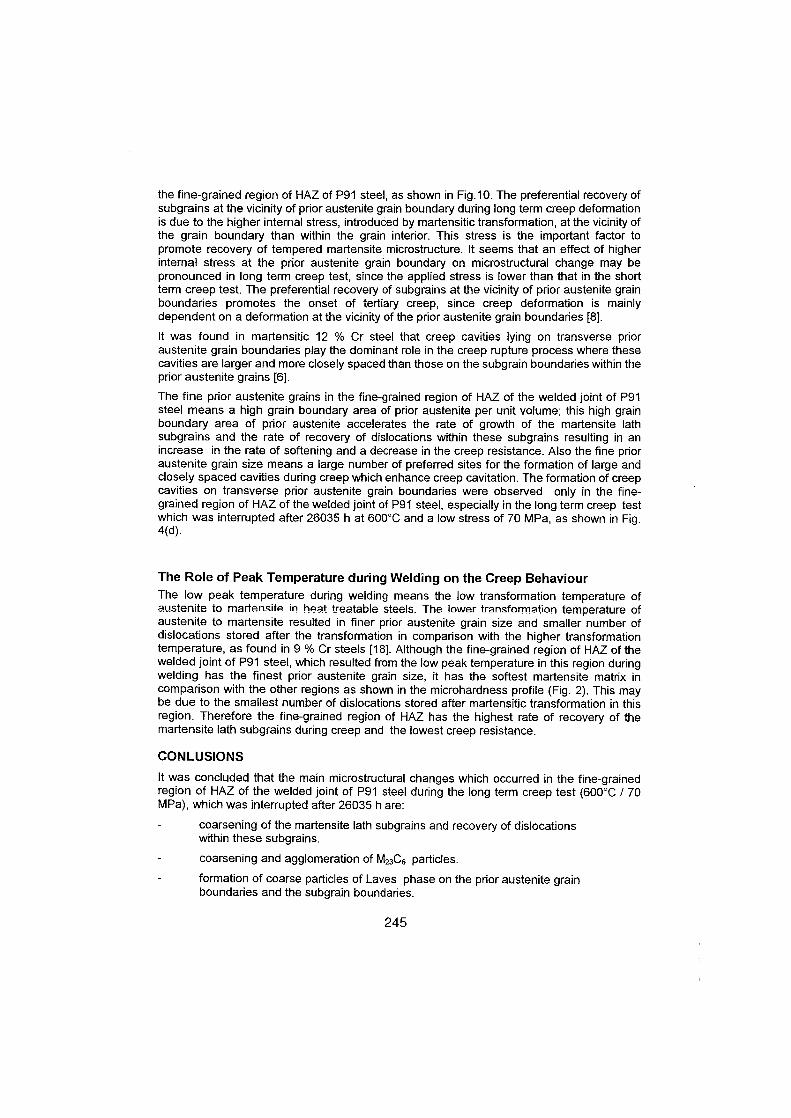
the fine-grained region of HAZ of P91 steel, as shown in Fig.10. The preferential recovery ofsubgrains at the vicinity of prior austenite grain boundary during long term creep deformationis due to the higher internal stress, introduced by martensitic transformation, at the vicinity ofthe grain boundary than within the grain interior. This stress is the important factor topromote recovery of tempered martensite microstructure . l t seems that an effect of higherintemal stress at the prior austenite grain boundary an microstructural change may bepronounced in long term creep test, since the applied stress is lower than that in the shortterm creep test . The preferential recovery of subgrains at the vicinity of prior austenite grainboundaries promotes the onset of tertiary creep, since creep deformation is mainlydependent an a deformation at the vicinity of the prior austenite grain boundaries [8] .
lt was found in martensitic 12 % Cr steel that creep cavities lying an transverse prioraustenite grain boundaries play the dominant role in the creep rupture process where thesecavities are larger and more closely spaced than those an the subgrain boundaries within theprior austenite grains [6] .
The fine prior austenite grains in the fine-grained region of HAZ of the welded joint of P91steel means a high grain boundary area of prior austenite per unit volume ; this high grainboundary area of prior austenite accelerates the rate of growth of the martensite lathsubgrains and the rate of recovery of dislocations within these subgrains resulting in anincrease in the rate of softening and a decrease in the creep resistance. Also the fine prioraustenite grain size means a large number of preferred sites for the formation of large andclosely spaced cavities during creep which enhance creep cavitation . Theformation of creepcavities an transverse prior austenite grain boundaries were observed only in the fine-grained region of HAZ of the welded joint of P91 steel, especially in the Jong term creep testwhich was interrupted after 26035 h at 600°C and a low stress of 70 MPa, as shown in Fig.4(d) .
The Role of Peak Temperature during Welding an the Creep BehaviourThe low peak temperature during welding means the low transformation temperature ofaustenite to martensite in hext treatable $teel._ The lower tra_nsforma_tion temperature ofaustenite to martensite resulted in finer prior austenite grain size and smaller number ofdislocations stored after the transformation in comparison with the higher transformationtemperature, as found in 9 % Cr steels [18] . Although the fine-grained region of HAZ of thewelded joint of P91 steel, which resulted from the low peak temperature in this region duringwelding has the finest prior austenite grain size, it has the softest martensite matrix incomparison with the other regions as shown in the microhardness profile (Fig . 2) . This maybe due to the smallest number of dislocations stored after martensitic transformation in thisregion . Therefore the fine-grained region of HAZ has the highest rate of recovery of themartensite lath subgrains during creep and the lowest creep resistance .
CONLUSIONS
lt was concluded that the main microstructural changes which occurred in the fine-grainedregion of HAZ of the welded joint of P91 steel during the Jong term creep test (600°C / 70MPa), which was interrupted after 26035 h are:
coarsening of the martensite lath subgrains and recovery of dislocationswithin these subgrains.
coarsening and agglomeration of M23C6 particles.
formation of coarse particles of Laves phase an the prior austenite grainboundaries and the subgrain boundaries .
245
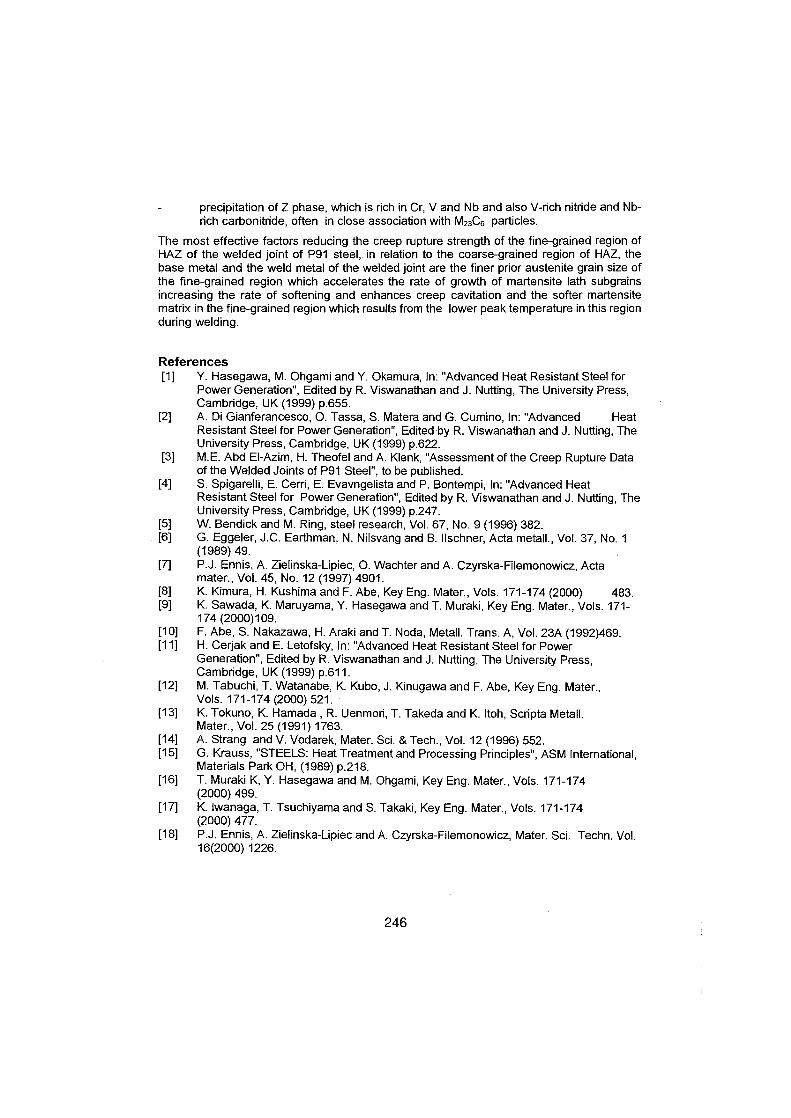
precipitation of Z phase, which is rich in Cr, V and Nb and also V-rich nitride and Nb-rich carbonitride, often in close association with M23C6 particles .
The most effective factors reducing the creep rupture strength of the fine-grained region ofHAZ of the welded joint of P91 steel, in relation to the coarse-grained region of HAZ, thebase metal and the weld metal of the welded joint are the finer prior austenite grain size ofthe fine-grained region which accelerates the rate of growth of martensite lath subgrainsincreasing the rate of softening and enhances creep cavitation and the softer martensitematrix in the fine-grained region which results from the lower peak temperature in this regionduring welding.
References[1]
Y. Hasegawa, M . Ohgami and Y. Okamura, In : "Advanced Heat Resistant Steel forPower Generation", Edited by R. Viswanathan and J . Nutting, The University Press,Cambridge, UK (1999) p.655 .
[2]
A. Di Gianferancesco, O. Tassa, S. Matera and G. Cumino, In : "Advanced
HeatResistant Steel for Power Generation", Edited by R. Viswanathan and J. Nutting, TheUniversity Press, Cambridge, UK (1999) p.622 .
[3]
M.E. Abd EI-Azim, H. Theofel andA. Klenk, "Assessment of the Creep Rupture Dataof the Welded Joints of P91 Steel", to be published.
[4]
S. Spigarelli, E. Cerri, E. Evavngelista and P. Bontempi, In : "Advanced HeatResistant Steel for Power Generation", Edited by R. Viswanathan and J. Nutting, TheUniversity Press, Cambridge, UK (1999) p.247.
[5]
W. Bendick and M . Ring, steel research, Vol. 67, No. 9 (1996) 382.[6]
G. Eggeler, J.C . Earthman, N . Nilsvang and B. Ilschner, Acta metall ., Vol. 37, No. 1(1989) 49.
[7]
P.J . Ennis, A. Zielinska-Lipiec, O. Wachter andA. Czyrska-Filemonowicz, Actamater., Vol. 45, No. 12 (1997) 4901 .
[8]
K. Kimura, H. Kushima and F. Abe, Key Eng. Mater., Vols . 171-174 (2000)
483.[9]
K. Sawada, K. Maruyama, Y. Hasegawa andT. Muraki, Key Eng. Mater., Vols . 171-174 (2000)109.
[10]
F. Abe, S. Nakazawa, H. Araki and T. Noda, Metall . Trans. A, Vol. 23A (1992)469.[11]
H. Cerjak and E. Letofsky, In : "Advanced Heat Resistant Steel for PowerGeneration", Edited by R. Viswanathan and J. Nutting, The University Press,Cambridge, UK (1999) p.611 .
[12]
M. Tabuchi, T. Watanabe, K. Kubo, J. Kinugawa and F. Abe, Key Eng. Mater.,Vols. 171-174 (2000) 521 .
[13]
K. Tokuno, K. Hamada, R. Uenmori, T. Takeda and K. Itoh, Scripta Metall .Mater., Vol. 25 (1991) 1763 .
[14]
A. Strang and V. Vodarek, Mater. Sci. & Tech ., Vol. 12 (1996) 552.[15]
G. Krauss, "STEELS: Heat Treatment and Processing Principles", ASM International,Materials Park OH, (1989) p.218 .
[16]
T. Muraki K, Y. Hasegawa and M. Ohgami, Key Eng . Mater., Vols . 171-174(2000) 499.
[17]
K. Iwanaga, T. Tsuchiyama and S. Takaki, Key Eng. Mater., Vols . 171-174(2000) 477.
[18]
P.J . Ennis, A. Zielinska-Lipiec and A. Czyrska-Filemonowicz, Mater. Sci. Techn. Vol.16(2000) 1226 .
246
Table 1 : Chemical analysis of P91 steel .
Table 2 : Chemical analyses by EDX of different types of particles observed in the extraction replicas
of the fine-grained region of HAZ of P91steel after PWHT.
Table 3 : Chemical analyses by EDX of different types of particles observed in the extraction replicas
of the fine-grained region of HAZ of P91steel after Iong term interrupted creep test at 600 °C .
-OP : one particle, MV : mean value and SD : standard deviation .
247
Atomic
Element
Cr-rich carbide( MZ3C6)
V-rich nitride
(VN)
(V,Nb)-rich
carbonit .
((V,Nb)CN)
one
particle
mean
value
standard
deviation
one
particle
mean
value
standard
deviation
one particle
Cr 64.30 61 .53 1 .94 15.24 14.63 2.28 9.20
Fe 28.30 28.36 1 .07 3.17 4.84 2.38 6.99
V 1 .20 1 .98 2.00 75.20 71 .23 4.70 47.40
Nb 1 .30 1 .67 0.68 6.39 8.97 3.41 36.40
Mo 4.90 6.47 0.91 0.00 0.33 0.61 0.00
- .Atomic %
ElementCr-rich carbide
(MZ3C6)
V-rich nitride
(VN)
Nb-rich
carbo .
(Nb(CN)
Z phase
(Cr(V,Nb)N)
Laves phase
(Fe2Mo)
OP* MV* SD* OP MV SD OP OP MV SD OP MV SD
Cr 69.7 68.6 1 .97 15.2 13.0 2.23 1 .2 36 .6 38.5 3 .01 7 .3 8 .1 0 .53
Fe 22.4 22.3 2.33 4.6 3 .6 0 .95 1 .9 3 .2 4 .3 0.77 49 .6 48.8 0 .51
V 0.9 1 .1 0 .87 74.5 73.7 0.96 9.6 33.4 38.8 5 .11 0 .3 0 .5 0.60
Nb 0.8 1 .0 0 .42 5.2 8 .8 3 .11 85 .3 26.0 18.0 5.44 5 .2 5 .0 1 .07
Mo 6.1 7 .0 0.95 0 .5 0 .9 0.46 2.0 0 .8 0 .4 0.26 37.7 37.6 11 .82
Element, wt .
C Si Mn Cr Mo V Nb Ni P S N
0.104 0.27 0.46 8.17 0.90 0.194 0.064 0.16 0.014 0.003 0.055
Fig. 1 : Microstructures of the welded joint of P91 steel after PWHT : (a) weld metal + HAZ, (b)coarse-grained region of HAZ, (c) fine-grained region of HAZ, (d) base metal.
NCR
260 -i
240
220-
200 -
180 -
160 f-2 -1 0 1 2 3 4 5 6
Distance from the fusion line, mm
Fig. 2: Microhardness profile ofthe welded joint of P91 steel after PWHT .
248
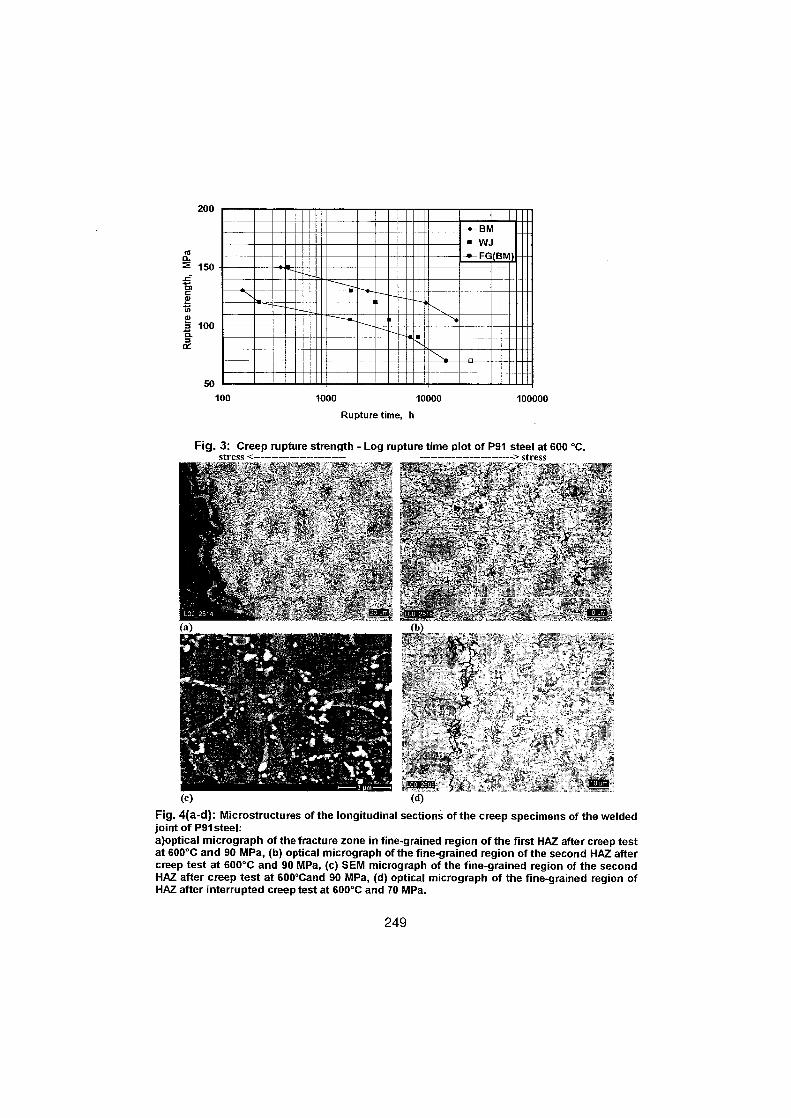
100
1000
10000
100000Rupture time, h
Fig . 3 : Creep rupture strength - Log rupture time plot of P91 steel at 600 °C .strecc <---------------------__-
---_--------_----------- > dress
Fig . 4(a-d) : Microstructures of the longitudinal sections of the creep specimens of the weldedjoint of P91steel :a)optical micrograph of the fracture zone in fine-grained region of the first HAZ alter creep testat 600°C and 90 MPa, (b) optical micrograph of the fine-grained region of the second HAZ altercreep test at 600°C and 90 MPa, (c) SEM micrograph of the fine-grained region of the secondHAZ alter creep test at 600°Cand 90 MPa, (d) optical micrograph of the fine-grained region ofHAZ alter interrupted creep test at 600°C and 70 MPa.
249
200
-BM" wJ
Ra - -FG(BM150
wrnmN
100d7
50
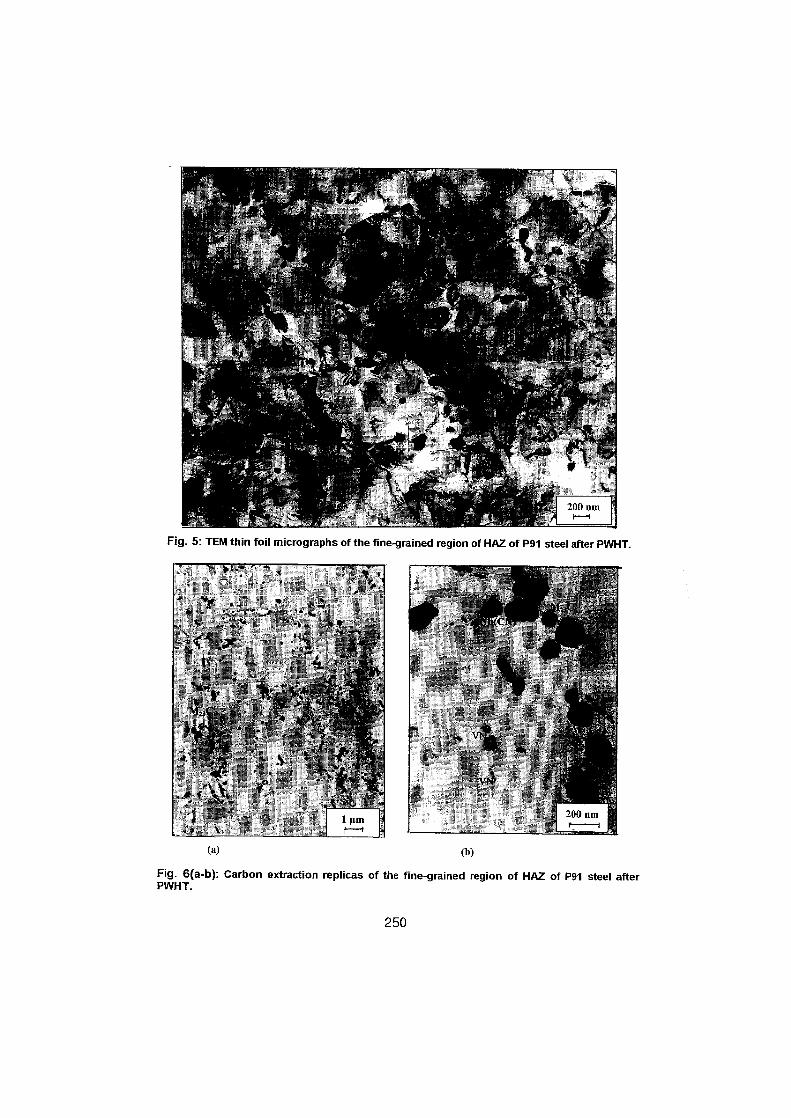
Fig. 5 : TEM thin foil micrographs ofthe fine-grained region of HAZ of P91 steel after PWHT.
Fig. 6(a-b) : Carbon extraction replicas of the Eine-grained region of HAZ of P91 steel alterPWHT.
250
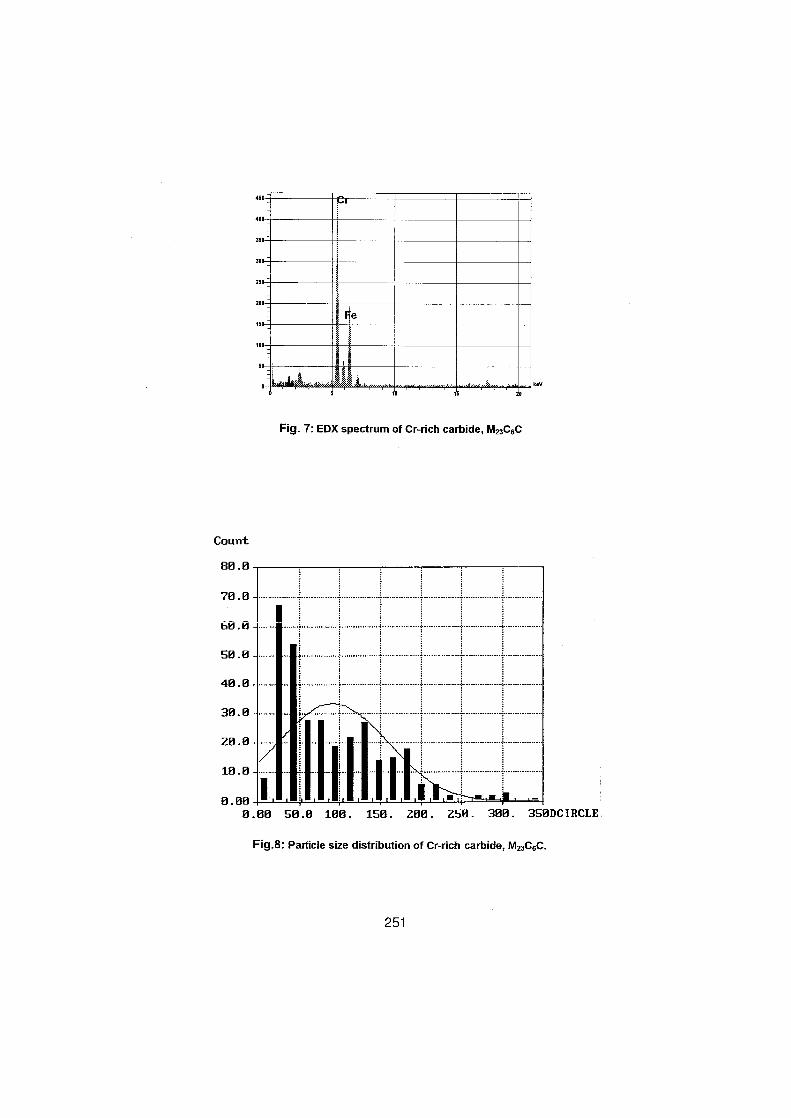
Count
80 .9
70 .0-
60 .0-
90 .0-
40 .0 ~
30 .0-
20 .0-
10 .0-
.... ... .. . .. ... ....
. . .. ... ...
. .. . ... . . ... .. ... . .
... . . .. . .. . ... . . ..
.. . .. . .. ..
... .. . ...... .. ... . .. .. .
A
Fig. 7: EDXspectrum of Cr-rieh carbide, M23C6C
. .... .... .. .. . ... ... . . ... .. .. ... .. . .. ... . . ... ... .. ... .. . ...
. .... . .. . ... ... .. .. . . ... .. ... .. . ... .. ..i~ . .... ... .. . ... . . ..
0 .00 -J"m,NYM, M40.00 50 .0 100 . 150 . 200 . 259 . 300 . 3501aCIRCLE.
Fig.8 : Partiele size distribution of Cr-rieh carbide, M23C6C .
251
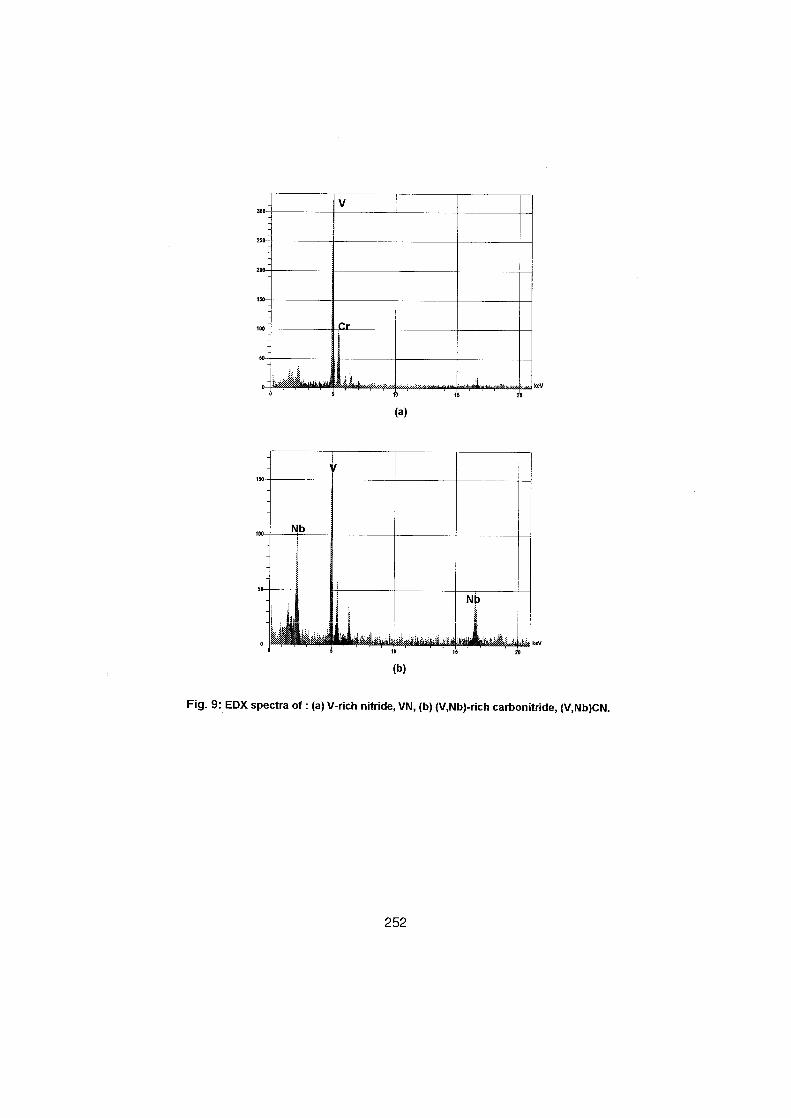
eY
kev
Fig . 9 : EDX spectra of : (a) V-rich nitride, VN, (b) (V,Nb)-rich carbonitride, (V,Nb)CN.
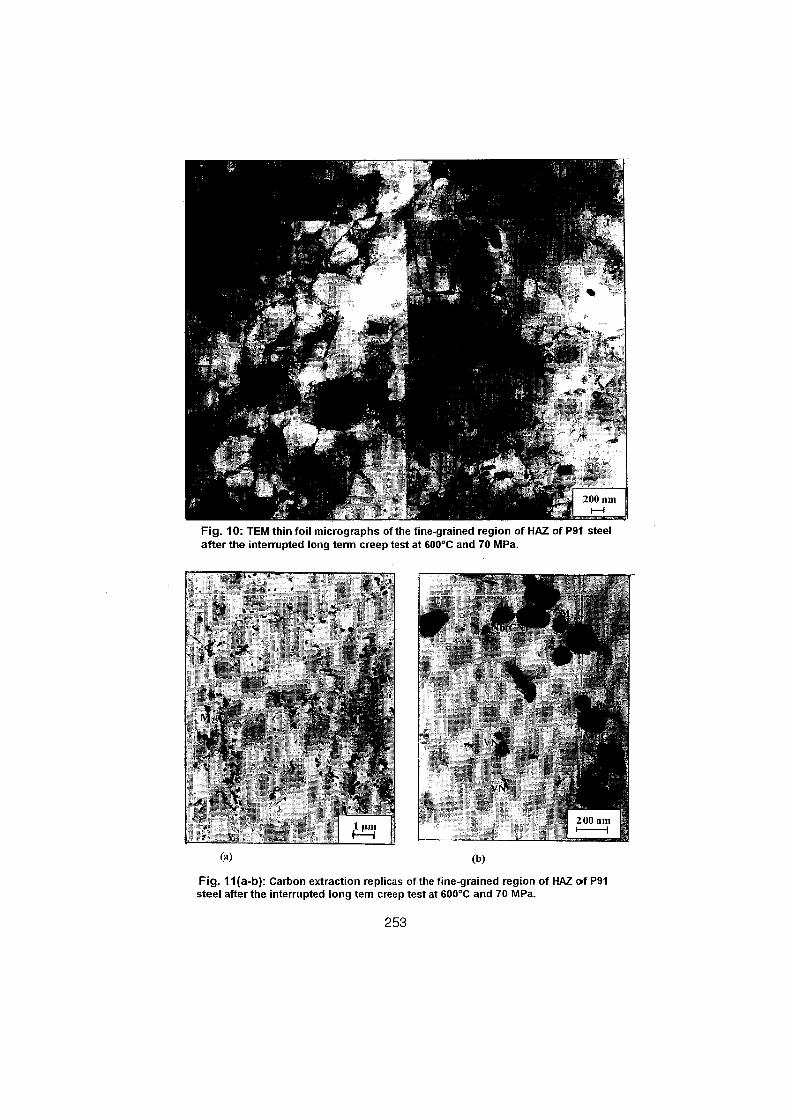
Fig . 10 : TEM thin foil micrographs of the fine-grained region of HAZ of P91 steelafter the interrupted long term creep test at 600°C and 70 MPa .
Fig . 11 (a-b) : Carbon extraction replicas of the fine-grained region of HAZ of P91steel after the interrupted long tem creep test at 600°C and 70 MPa .
253
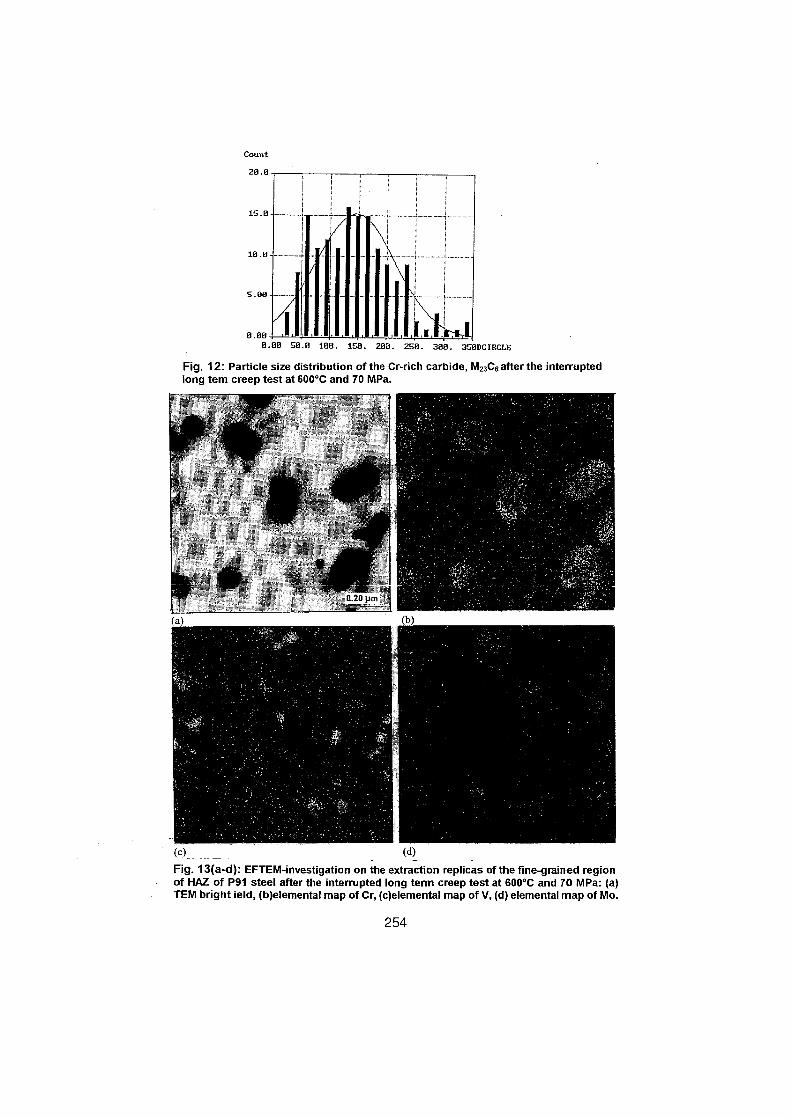
Count
20 .0
15 .0
10 .0
S .00
9.00
11,~ 111 1 1 1 1 1 1 1 3,3.3,MN8.80 50 .0 180 . 159 . 200 . 250 . 300 . 350DCIRCLE
Fig. 12 : Particle size distribution of the Cr-rich carbide, M23C6 alter the interruptedlong tem creep test at 600°C and 70 MPa.
Fig . 13(a-d) : EFTEM-investigation an the extraction replicas of the fine-grained regionof HAZ of P91 steel after the interrupted long term creep test at 600°C and 70 MPa : (a)TEM bright ield, (b)elemental map of Cr, (c)elemental map of V, (d) elemental map of Mo .
254
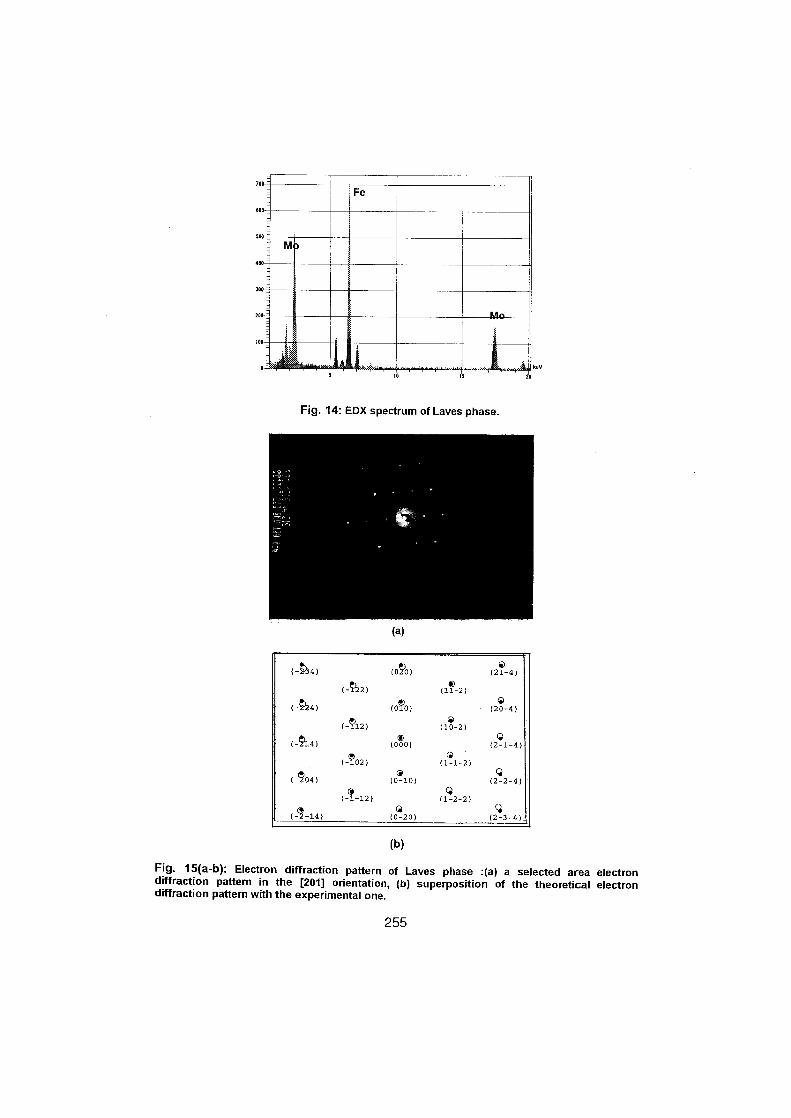
Fig . 14: EDX spectrum of Laves phase .
~,
0(-894)
(A0)
(21-4)
(-122)
(llO-2)~,
0(-224)
(A)
(20-4)~,
O(-T12)
(10-2)
(000)
(2-1-4)O '
(102)
(1-1-2)~,
Q(-204)
(0-o10)
(2-2-4)
( -14)
(0-20)
(2Q-3-4),~
255
Fig . 15(a-b) : Electron diffraction pattern of Laves phase :(a) a selected area electrondiffraction pattern in the [201] orientation, (b) superposition of the theoretical electrondiffraction pattern with the experimental one.
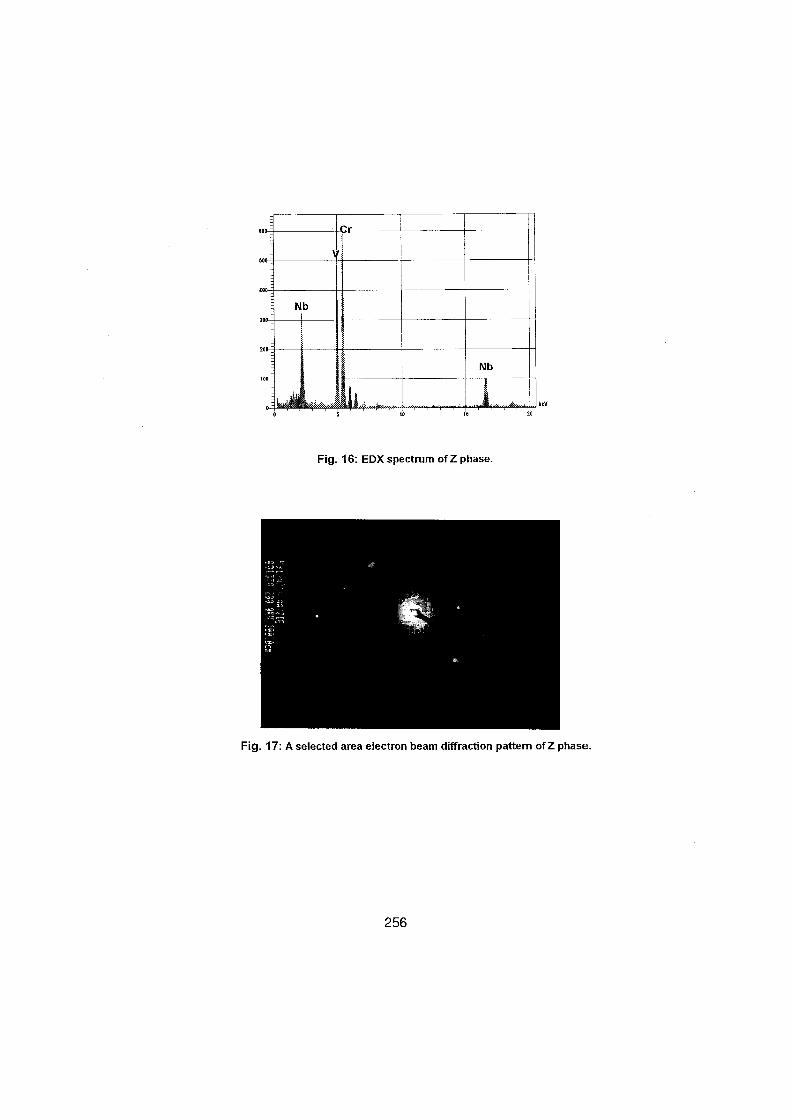
Fig . 16 : EDX spectrum of Z phase .
kW
Fig . 17 : A selected area electron beam diffraction pattern of Z phase .
256
SOME MECHANICAL PROPERTIES OF MO ALLOYS USEDFORDIVERTOR STRUCTURAL MATERIAL
A.M. . Nasreldin," G. Pott,"M. Rödig"
AbstraetMo - alloys are candidate structural materials to be used with divertor plates in futurefusion reactors. During operation of a fusion reactor these materials will be subjected toirradiation hardening and subsequent embrittlement is expected . Therefore it is necessaryto study the influence of fast neutrons (irradiation in a research rector )on the mechanicalproperties . Five different materials had been irradiated at 75, 400 and 750 °C up to anneutron fluence of 1 dpa . Neutron induced embrittlement was manifested e.g . by a shift inthe Impact transition curves to higher temperature ranges an da decrease in the upper shelfenergy . This effect is less with increasing irradiation temperatures . Mo/ Re alloys displacedthe highest and.TZM the lowest impact properties in the pre - and post irradiationcondition . The poor impact toughness of UM ca be a result of the large drain size andserration of interstitials to the grain boundaries . SEM fractography was used to correlatethe Impact properties with fracture surface morphology . For the characterisation of thematerial additional tests had been carried out :Tensile tests up to 800 °C dynamic fracture toughness up to 450 °C and metallographicexamination
1 . IntroduetionOne ofthe main design concepts under development for divertor target-plates ( Fig. 1 ) to beused in fusion reactors (e.g. ITER ) is based an high Z material, e.g . W, Mo, Mo/Re alloysand TZM. The divertor is a critical component of a fusion device and structure materialsmust be able to resist intensive neutron and heat fluxes. The heat flux can turn an a veryhigh and localised heat load in case of disruptions or deposition of energy from runawayelectrons . Thermal calculation for the ITER concept Shows, that temperatures of 400 °C -700 °C could be reached. During operation of a fusion reactor with those materialshardening and subsequent embrittlement are expected by high energy neutron flux .Therefore it is necessary to study the influence of these conditions by fracture mechanicexamination an by Simulation of these conditions in irradiation experiments in a fissionreactor .Several materials ( Fig.2 ) had been selected and tested for getting some mechanicalproperties for unirradiated and irradiated material . The materials are :
Mo
mechanical propertiesMo (Z6)
second supplierUM
mechanical propertiesMo-5Re
fracture mechanic propertiesMo-41Re
fracture mechanic and mechanical properties
1)A .E.A . . Cairo Metallurgy Department R.C . Inchass2) Forchungszentrum Jülich (FZJ) BD.HZ
257

Mechanical PropertiesFor measuring the embrittlement of the material, different methods and samples ( fig 3 )had been selected . ;
tensile strength ( samples 4,5 mm Q) and 50 mm long)ductile to brittle transition temperature (DBTT) by 3 point bending tests .(samples 2x2 mm2 and 50mm long) .Impact strength, (notched samples 6x6 mm2 and 44 mm long, DVMKsample) .
The irradiation of the samples Fig . :4 had been carried out in the HFR (Petten) researchreactor at different temperatures and neutron fluences . The nominal conditions had been :
Irradiation facility
NEMESIS Nr. 1-6 .Sample carrier
- 30mm 0, 400 mm longTemperature
75, 400 and750 °C .Neutron fluence
equiv . 0,2 and 2,0 dpaIrradiation time
25 and 120 fpd.
The characteristic structure of the tested UM material is shown in Fig . 5 (micrographs) .For al other Materials the structure was similar.The tensile strength was measured at different temperatures . The highest values had beenrecorded from Mo-Re and TZM samples . (Fig . : 6)The values of the impact strength measurements are plotted in Fig . :7 and B . For theunirradiated material Mo-41Re (DSR) an impact strength of about 280 J CM-2
( 50 °c ), forMo 140 J cm2
( 200 °c ) was recorded and for Mo-41Re and UM the upper shelf was notreached up to the Maximum testing temperature', this means higher embrittlement attemperatures below 400 °C . During neutron irradiation the embrittlement is increasing at anirradiation temperature of 75 °C . But with increasing irradiation temperatures an annealingeffect was detected .Similar results had been measured by 3 point bending tests . (Fig. :9) . Mo and Mo-Re hadthe lowest transition temperature for unirradiated test samples. The difference ofductile/brittle transition temperature (ADBTT) is increasing with increasing neutron fluence .But at elevated irradiation temperature an annealing effect was observed. For Mo-41Re thiseffect stars at 400 °c or even below . The recrystallised material (REC) was more sensitive toneutron embrittlement than the deformed and stress relieved (DSR) Material . Moreinformation are given in Fig. : 10 .
Fracture Mechanics InvestigationsHigh heat rate loading in divertors may cause unstable crack propagation leading to aspontaneous failure of the components. Cracks may be also created during the productionprocess or develop during the operation of the component . For the assessment of crackedcomponents, the knowledge of dynamic and static fracture mechanics data (K ic, Kld for Moand Mo alloys are reacquired .For fracture toughness according to ASTM E-399 the samples shall be pre-cracked byfatigue . This pre-cracking is achieved by a stepwise inerease of the upper load in the fatiguecycles . But this method failed due to their brittleness . Two alternative methods were tried. :
258

1 . The upper load of the fatigue cycle was increased continuously until a first crackpropagation could be monitored by a DC potential drop method DCPD.
2 . Fracture toughness was measured for different saw Cuts with widths between 0,1 and 0,5mm. This method is often used for ceramic materials . Below a certain threshold, themeasured fracture toughness is expected to be independent an the notch root radius . Thecorresponding stress intensity factor is assumed to be the real fracturetoughness.(Fig . :11)
The influence of crack tip (saw cut vs . fatigue rack)can be Seen in Fig. :12 . In fracturemechanics tests with TZM it should be sufficient to use fine machined notches instead offatigue pre-cracks. For Mo-SRe it is preferable to use fatigue cracks instead of machinednotches . But for the narrowest saw cut of 0,1 nun ( ß = 0,5 mm, ~6 = 0,25 mm ~) the valueofthe pre-cracked samples is nearly reached .Dynamic fracture toughness had been measured by impact bending tests . The samplepreparation by pre-cracking failed for both materials . From the experience of the staticfracture mechanics tests which allow fine saw Cuts of 0,1 mm instead of pre crackedsamples . lt was assumed that the Same holds for dynamic fracture toughness Kid test .Therefore part ofthe samples were cut with a thin diamond wire of 0,08 mm thickness . Thedepth of those slots was 2-3 mm. The other samples were produced with ISO-V-notcheswhich were sharpened by a razor blade in addition . The results are plotted in Fig . :13,14 .Two surprising facts are found from the results :
The gained values of Kld for samples with a saw cut are about 30% higher thanthose for the samples with ISO-V notches .The calculated values of dynamic fracture toughness are 3 to 4 times as high asthe values ofthe static fracture toughness .
The first fact may be explained by a different kind of stress state under static and dynamicloading conditions . The conservative situation which in the static tests is reached for a sawcut of 0,1 mm width, may no longer be given under dynamic loading conditions .The second fact surprises, because Kld was expected to be lower than Klo . This discrepancymay partly be explained from different planes of crack propagation for both types ofsamples relatively to grain orientation . The measured values for static fracture toughness fitquite well with results found in other research centres for the same material . For UMdynamic fracture toughness values of 55 MPa m"z were reported in literature. The reasonfor the high values of Kld compared to Klo is not yet understood. For understanding thisdiscrepancies, a second Set of Samples with different crack plane orientation should beinvestigated .
The microstructure of some of the samples is documented in Fig . :15,16 . The crackpropagation and the crack surface Shows no abnormal micro structure .
259

Referenees[1] Deschka, Linke, Nickel "Thermomechanisches Verhalten von Divertormodule unter
fusions-relevanten Bedingugen", JÜL IWE 2933 (1986)
[2] P.Krautwasser et al . "Influence of fast neutron fluence an the DBTT ofW andW.alloys," International Plansee Seminar 1985
[3] ASTM-E399,Annual book ofASTM Standards, Philadelphia 1994
[4] K.Krompholz, P.Tipping, G.Ullrich : "Results from investigations with an instrumentedimpact machine an Mo-Alloys" Zeitschrift für Werkstofftechnik Nr . 15 (1984)
[5] M.Rödig,G.Pott, . . ."Fracture mechanics investigations ofUM and MO-5Re ",International Plansee Seminar (14th ) May 1997
[6] G.Pott,H.Derz "Irradiation Induced Properties of Divertor Structural Materials (Mo andMo Alloys) Jahrestagung Kerntechnik 1996 Proceedings
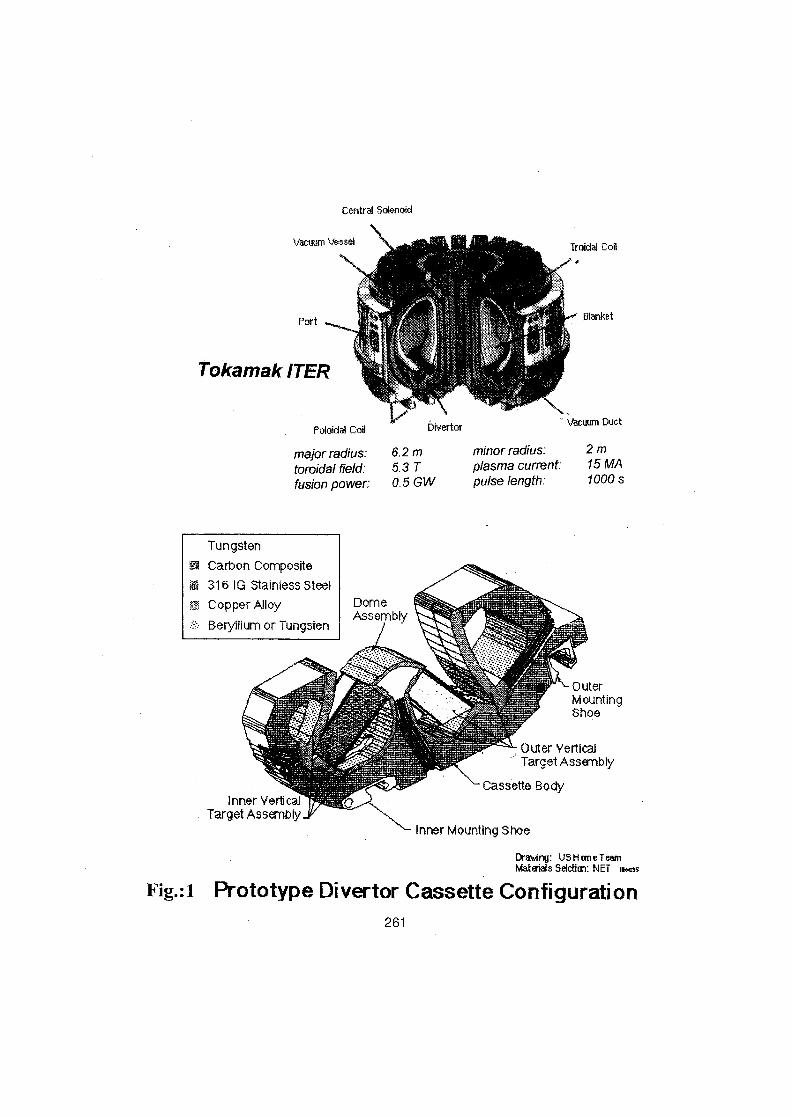
I nner Verti calTarget Assembly
Tungsten
Garbon Gomposite316 IG Stainiess Steel
`° Gopper Alloy
:: Beryiiium or Tungsten
centnl Solenoid
major radius :
6.2 mtoroidal Field:
5.3 Tfusion power
0.5 GW
261
minor radius:
2mplasma current:
15 MApulse length :
1000 s
- 0 uter VerticalTarget Assembly
Drawing: USHomeTeamMateriels Seletion : NET
n. ,9
Fig.-.i
Prototype Divertor Cassette Configuratiofl
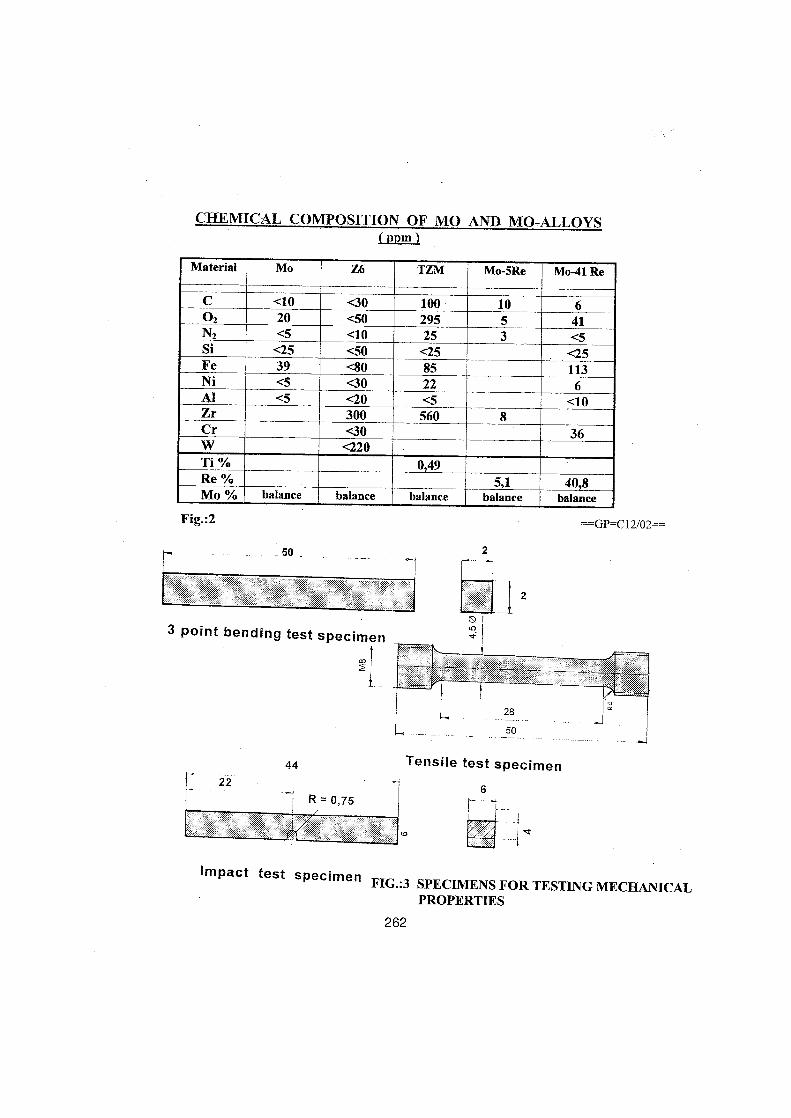
CHEMICAL COMPOSITION OF MO AND MO-ALLOYSflem )
Fig . :2
50
3 point bending test specimen
44
R = 0,75
262
Tensite test specimen
2
=GP=C12/02==
Impact test specimen FIG.:3 SPECIMENS FOR TESTING MECHANICALPROPERTIES
Material Mo Z6 TZM Mo-5Re Mo-41 Re
C <10 <30 100 10 602 20 <50 295 5 41NZ <5 <10 25 3 <5Si <25 <50 25 _ <25Fe 39 <80 85 113Ni <5 <30 22 6A1 <5 <20 <5 <10Zr 300 560 8Cr <30 36W <220Ti % 0,49Re % 5,1 40,8Mo °/u Balance Balance Balance Balance Balance

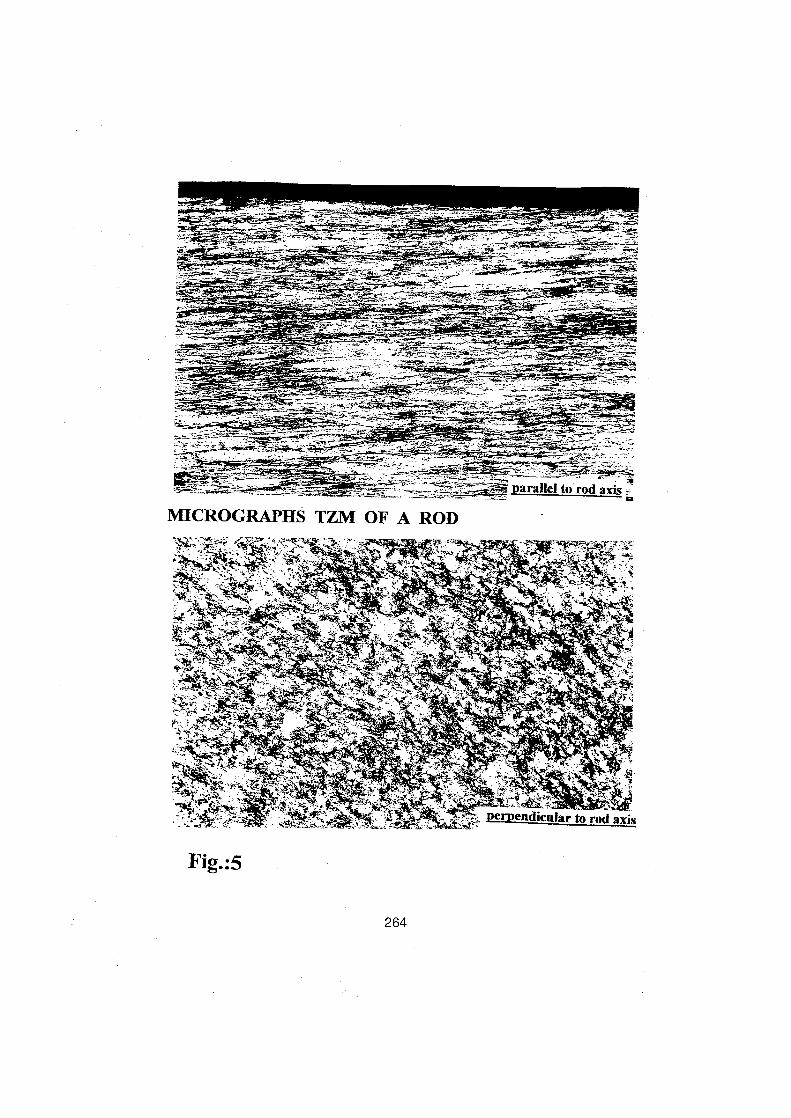
MICROGRAPHS TZM OF A ROD
Fig. :5
264
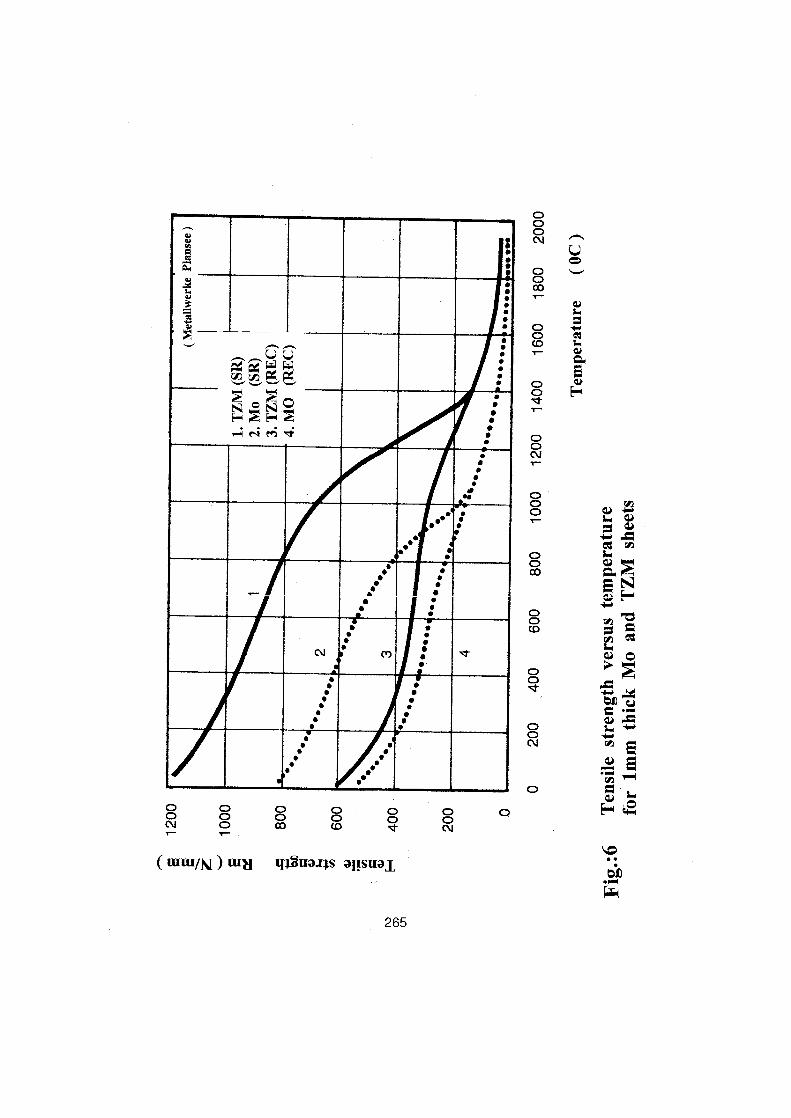
NC) C) CD 0 (DÖ CD
((0 N
( MUI/N ) mm
gouaj;s apsual,
265
000N
00T
OONT
OOOr
00
N
O
O
W
r
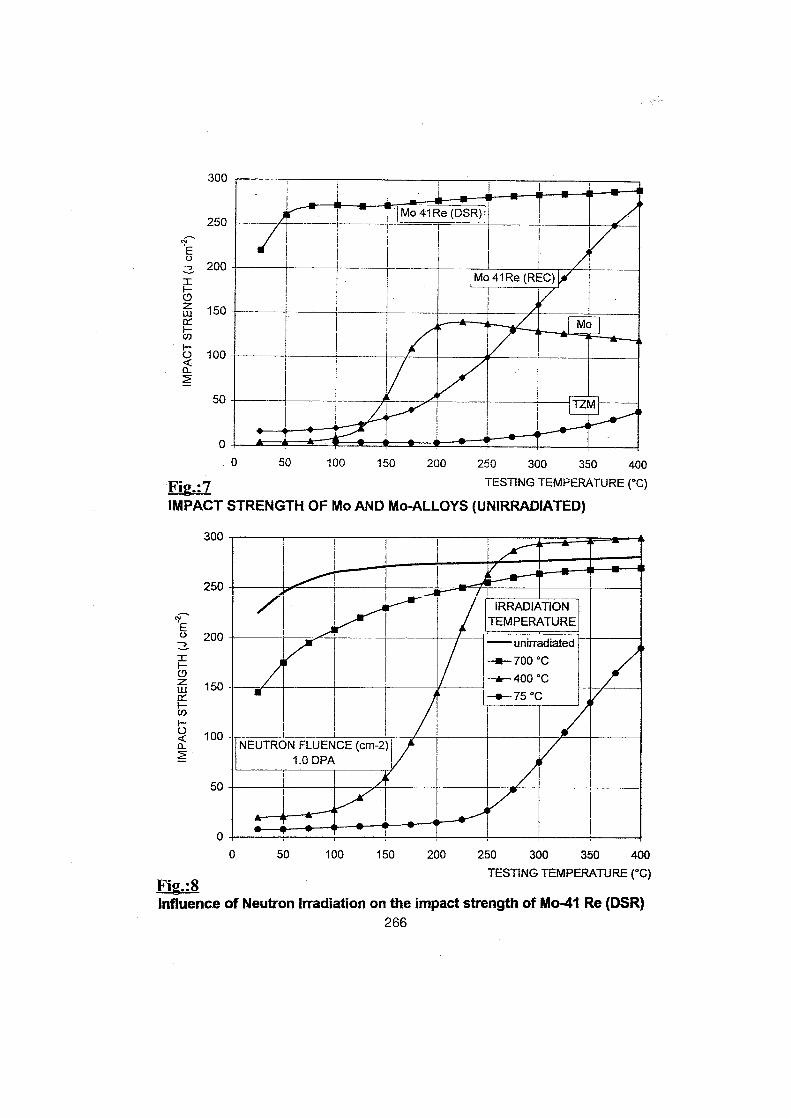
N.EU
f-Zw
UQa
N.Ev3
zw
UQa
Fig :7
TESTINGTEMPERATURE (°C)
IMPACT STRENGTH OF Mo AND Mo-ALLOYS (UNIRRADIATED)
300
250
200
100 -
50
0
0 50 100 150 200 250 300 350 400
0 50 100 150 200 250 300 350 400TESTING TEMPERATURE (°C)
Flg.:8Influence of Neutron Irradiation an the impact strength of Mo-41 Re (DSR)
266
IRRADIATIONTEMPERATURE
I
I
~
I
-unirradiated700
~- 400
r
I ~II
75
NEUTRON FLUENCE (cm-2)1 .0 DPA
i
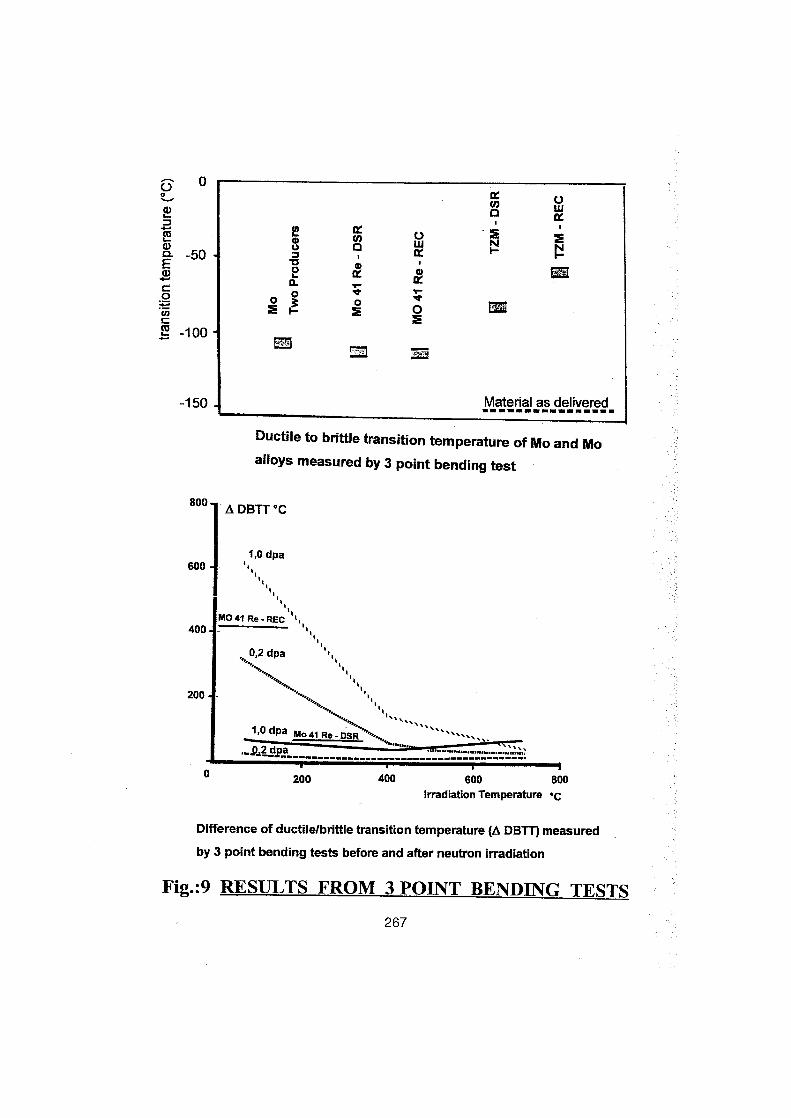
800 '1 - ,& DBTT Oc
600-1
400-
200
_._ .----- W._ ._.
Ductile to brittie transition temperature of Mo and Moalloys measured by 3 point bending test
1,0 dpa11 1 .
1 1
MO 41 Re - REC4t11110,2
dpa 1 1
1
,.. i 11,0 dpa MO 41Re -DSR """""'""
--ZZdPa___________. :__-::________ ..0
200 400 600 800irradiation Temperature -C
Difference of ductile/brittie transition temperature (0 DBTT) measured
by 3 point bending tests before and alter neutron irradiation
Fig. :9 RESULTS FROM 3 POINT BENDING TESTS267
U0
a) v7 VW
1 fr
a) v pUW H i
IV_-50a) ö °'o` 1mc0
ao ;
v ät-
oWCIA
c-100
-150 Material as delivered
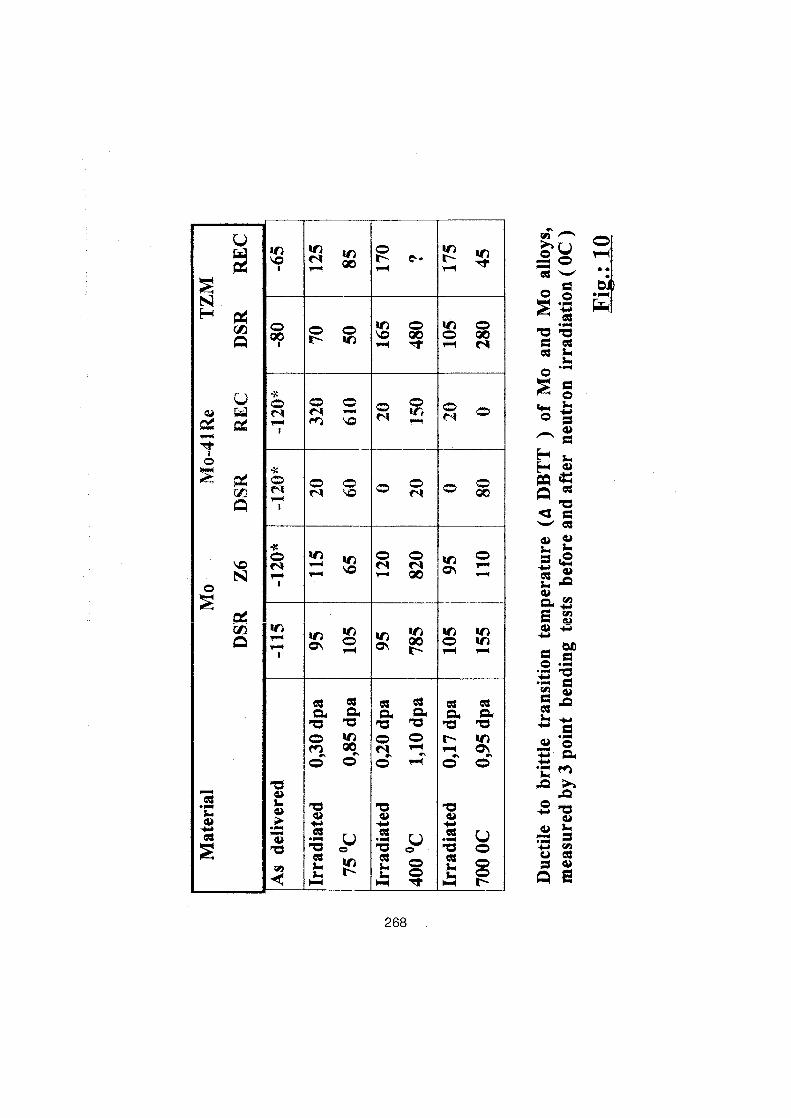
268
ö0
b
0
O
ö
F0 i=
.m, =
.aO
A
U
Nh
U O ~ N ® tN..~ G~tip
't!oö o ® o G
00A
N N ~ ~ NONO 0~1
C
O
"c 'ö b 'ä c äM 00 No c 0 " o O
1r
w
ß'c V 'ö V Ts ö
S= °
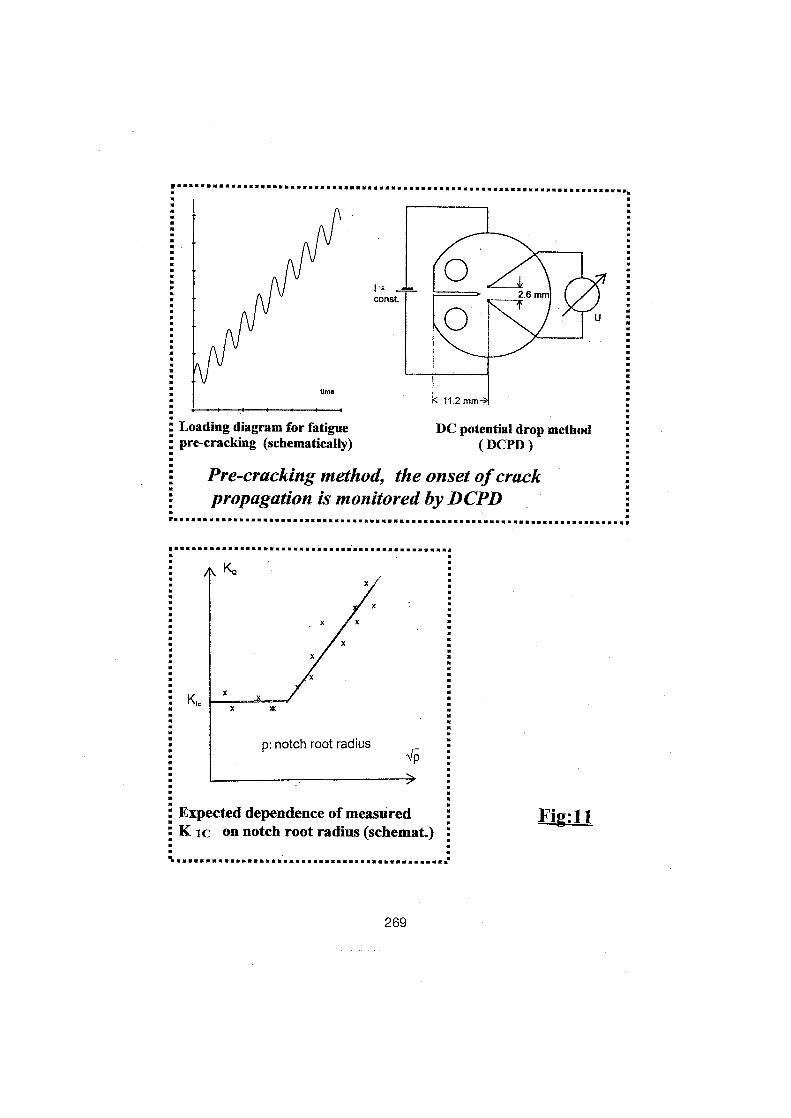
. . . . . . . . . . .. .. .. . . .. . .. . . .. .. .. . .. . . . . . . . . . . . . . . . . . . .. . . .. . .. . . . . . . . .. . . . .
Loading diagram for fatigue
DC potential drop methodpre-cracking (schematically)
(DCPD )
.. . . . .. . . . .. .. .. . . . . . . . . . .. . . . . . . . .. .. .. .. .. . . .. .. .. .. .. . . .. . .. .. .. . . ... . . . . . :. . . .. .. . .. . . . .. . . . . . . .. . : .. .. :. . . . . . . . . . . . .. . ..
T K°
time
Pre-cracking method, the onset ofcrackpropagation is monitored by DCPD
p: notch root radius
269
r
Expected dependence of measured
F,1,11K ic an notch root radius (schemat.)
ti . . . . . . . .. .. . .. . . . . .. . . .. . . . . . . . . .. .. . . . . . . . .. :
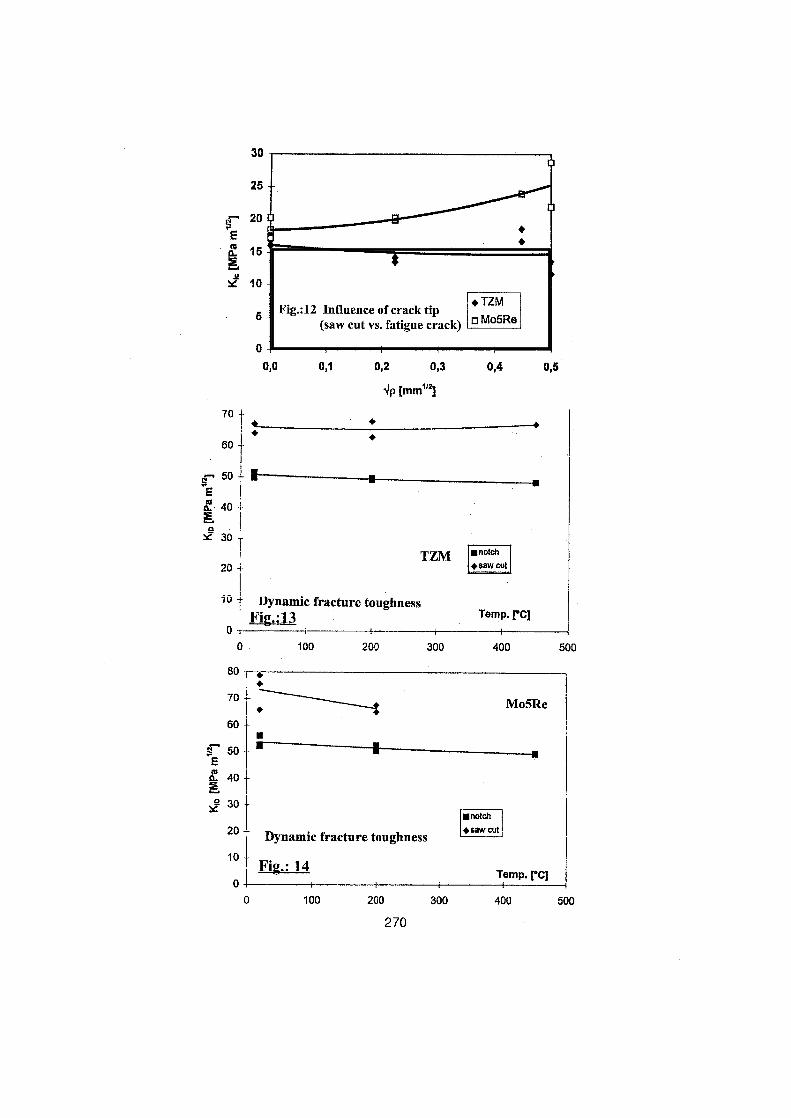
e 50Eä 40
cY 30
20 4
c
30
25
20
T
5
0
Fig.:12 Influence of crack tip(saw cut vs. fatigue crack)
"UMo Mo5Re
0,0 0,1
~p [Mm1121
0,2 0,3 0,4 0,5
270
TZM anotch"saw eot
10 t Dynamic fracture'
toughness.13
0Fig
T t i ----,-
0 100 200 300
80
Temp. j°C]~-
400 500
-i--f"
70 " Mo5Re60 -{
E 50
Ra 40
SL 300notch
20 ` Dynamic fracture toughness " saw Cut
101 Fig.: 141 Temp. [°aj0 100 200 300 400 500
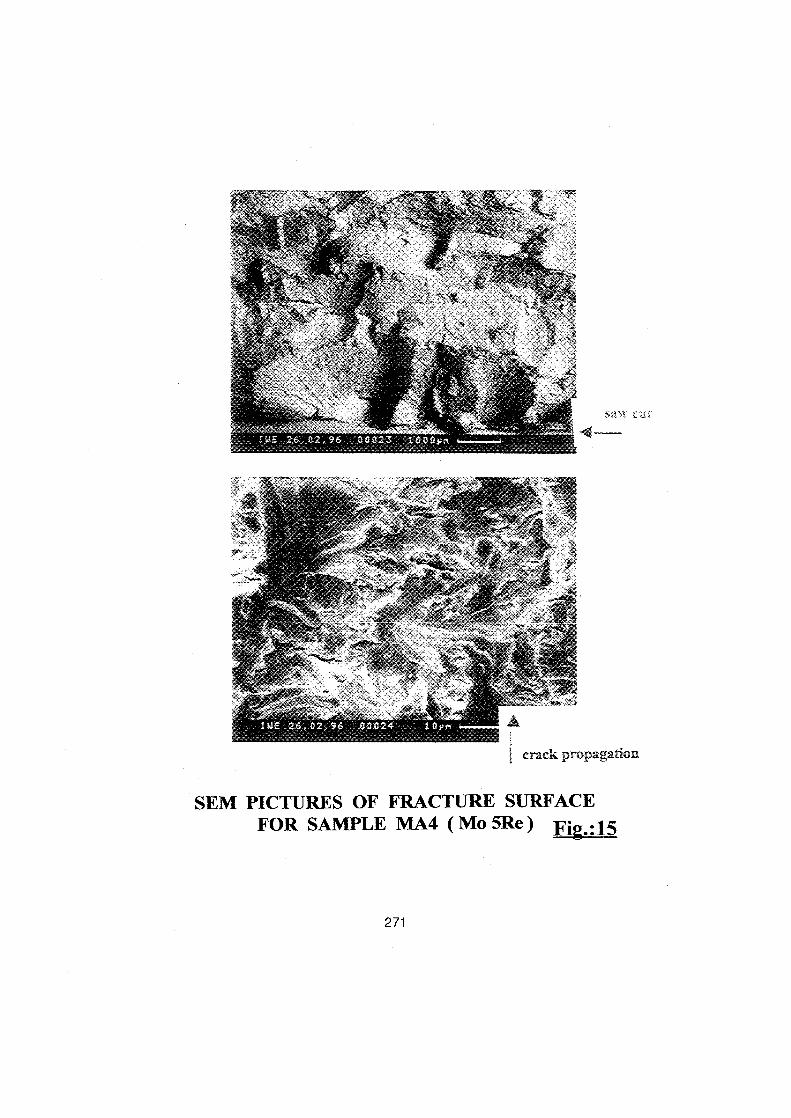
SEM PICTURES OF FRACTURE SURFACEFOR SAMPLE MA4 (Mo 5Re) Fig.:15
271
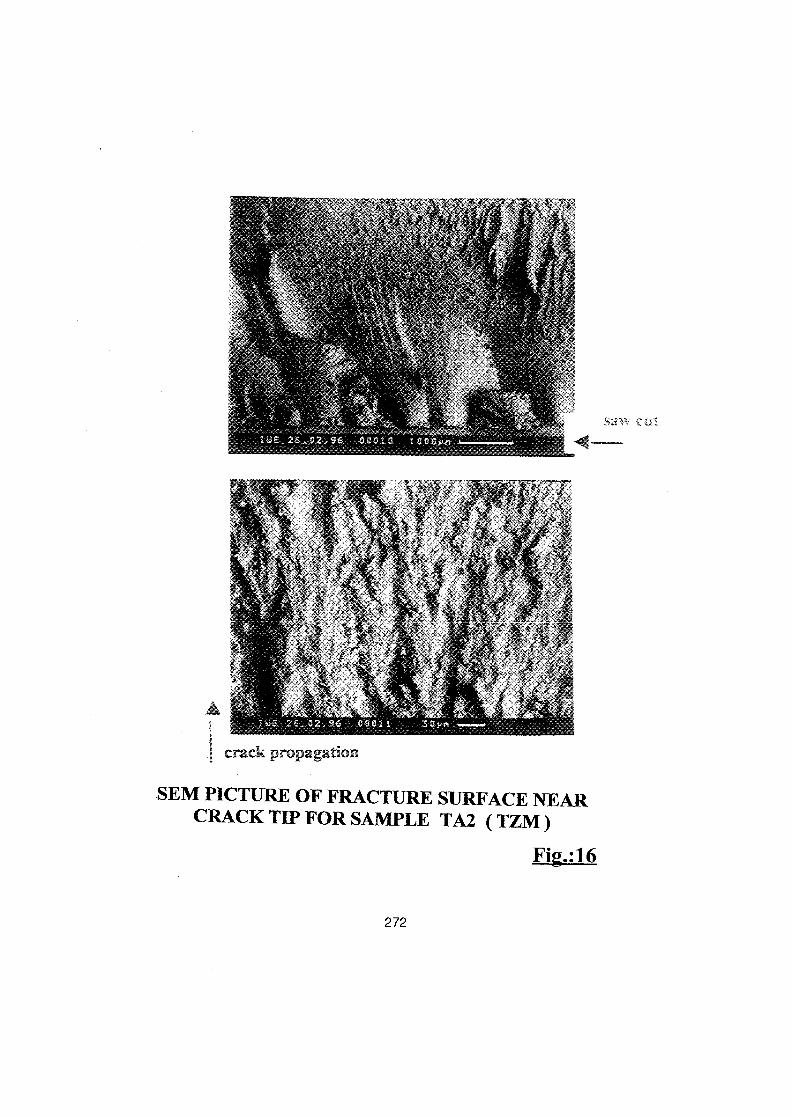
Crack r aga on
SEM PICTURE OF FRACTURE SURFALE NEARCRACK TIP FOR SAMPLE TA2 (TZM )
272
Fig. :16
Materials Selection for Power Generation Applications(Gas Turbine Blades)
Drs. Hanadi Salem, Amal Esawi, and Mahmoud FaragMechanical Engineering DepartmentTheAmerican University in Cairo
Abstract
The relatively high fuel efliciency and lower initial installed cost of Avanced combustionturbines have made them an increasingly important source of power generation . Of all theturbine parts, the blades are subjected to the most severe conditions and although goodresistance to creep deformation and rupture has often been the prime requirement, achievementof creep strength alone does not present the major problem. The greatest difficulty is avoidanceof undee deterioration in other material properties as creep resistance is improved . Toughness,oxidation and hot corrosion resistance, as well as processability usually suffer when alloyingelements are added to improve creep strength .
Nickel-based superalloys have been the Standard materials for turbine blades since the 50s fortheir good resistance to corrosion, mechanical and thermal fatigue, mechanical and thermalshock, creep, and erosion . Most superalloys have a maximum service temperature <1000°C inload-bearing applications . However, the introduction of directional solidifrcation (DS) andsingle crystal (SX) technologies as well as intemal cooling of the blades and thermal barriercoatings (TBC) allowed for peak operating temperatures of 1100 °C in some turbines withservice lives around 10,000 hours. Advanced gas turbine systems (AGTS) are expected to haveturbine inlet temperatures (TIT) ranging between 1200-1400°C, which is much higher than thepermissible level for superalloys . Currently, there are several materials systems underdevelopment, which could lead to higher operating temperatures and lighter weights of gasturbines for AGTS . Among these are intermetallic, monolithie ceramic, metal matrix andceramic matrix composite materials. Accordingly, in the current work, selection and Substitutionanalysis for the standard materials used for turbine blades as well as the new trend materialscurrently under investigation was conducted. It was perceived that monolithie ceramic SiC andSiC/SiC composites have the best potential for extensive use in turbine blade applications.
Keywords : Advanced gas turbine systems, turbine blades, design considerations, standard andnew trend materials, material selection and Substitution .

1. Introduetion
The relatively high fuel efficiency and lower initial installed cost of advanced combustionturbines have made them an increasingly important source ofpower generation . Relatively highoperating temperatures in the various stages ofthe turbine are among the main reasons for theirsuperior thermal efficiency. Of all the turbine parts, the blades are subjected to the most severeconditions and the development of better materials for their manufacture has always been achallenge to the materials engineer. During the last 50 years, the turbine inlet temperatures havedoubled as a result of developments in turbine blade materials and design .
A turbine blade material must satisfy several criteria in order to perform well in the severeenvironment in which it operates . Although good resistance to creep deformation and rupturehas often been the prime requirement, achievement of creep strength alone does not present themajor problem. The greatest difficulty is avoidance ofundue deterioration in other properties ofthe material as creep resistance is improved. Toughness, oxidation and hot corrosion resistance,as well as processability usually suffer when alloying elements are added to improve creepstrength. With the introduction of better blade materials, coatings to resist oxidation and hotcorrosion, and blade cooling, modern combustion turbines operate at temperatures in the rangeofover 1100 °C with service lives of 10,000 hours.
With the increasing trend to tie the power generated to the demand an energy and with thehigher fraction of power generated from the less predictable renewable energy sources, fossilfuel fired power plants are facing increasingly larger load fluctuation, with the resultingcomponent and materials problems. One of the most vulnerable sections ofgas turbine blades isthe trailing edge where the blade is thin .
This paper starts with a discussion of the design considerations in selecting materials for powergeneration applications, with special emphasis an turbine blades . After a review of the currentmaterials, the new challenges facing components and materials are discussed . Finally, possibletrends in gas turbine materials are explored .
2. Design Considerations
Plastie instability at elevated temperature, deformation mechanisms and strain assoeiated withcreep, stress and temperature dependence, facture at elevated temperature, and environmentaleffects are among the issues that are usually considered when designing a component or amaterial for high temperature applications [1] .
Creep: The main functional requirement of turbine blade materials is creep behavior, whichcovers creep resistance, stress rupture strength, and stress rupture ductility . While excessivecreep strain can cause rubbing with stationary parts, stress rupture ductility is important inavoiding failure when the material cannot accommodate even the allowable small amount ofcreep deformation . Also creep rupture stress for the expected blade life should be more than thestresses encountered in service so as to avoid blade failure. Unfortunately, creep resistance isoften obtained only with some sacrifice of ductility so that only a compromise is usuallypossible .
Thermal Stability : Stability of the microstructure and properties can be one of the moredifficult requirements to guarantee. Grain growth, coarsening of phases and spheroidisation areamong the changes that can cause deterioration of properties after long exposure to hightemperature . Here again, structural stability is often obtained only with some sacrifice ofductility. Overaging of gamma prime precipitates in Ni-base superalloys is one of the serious
274
problems encountered due to elevated temperatures service conditions, which causes strengthdeterioration of the material . In addition, changes in the microstructure of superalloys at theoperating temperature cause component embrittlement by the formation of brittle phases andcontinuous carbide phase formation along the grain boundaries .
Environmental Effects: High temperature oxidation: Occurs when a Ni-oxide layer is formedan the surface of Ni-superalloys temperatures greater than 538°C. This oxide layer tends tocrack and spall when the blades are subjected to vibration and thermal cycling(startup/shutdown) during the engine operation . Sulphidation : Occurs when sulfur contained inthe fuel reacts wich oxygen and attacks the base metal. This issue becomes critical whensulphidation takes place at the blade root region, along the leading or trailing edges or under theblade shroud . Hot Corrosion : Occurs when combined oxidation-sulphidation attacks the bladehottest sections. Standby-Corrosion: Occurs during the turbine shut down as a result of airmoisture and corrosive residuals staying long enough in contact with the blades and vanessurfaces . This significantly affects the blades' fatigue strength, and hence reduces their servicelives .
Resistance to oxidation and high temperature corrosion are also important functionalrequirements for turbine blade materials. Sacrifice of corrosion and oxidation resistance isusually part of the compromise necessary to achieve high creep strength. An added difficulty isthat the presence of gases such as oxygen, hydrogen, nitrogen, chlorine, and carbon dioxide canreduce creep-rupture strength and ductility. Oxygen diffuses along grain boundaries causingembrittlement . Sulfur can also penetrate grain boundaries leading to rapid crack propagation athigh temperatures . The addition ofgrain-boundary modifiers, such as boron, or coating reducesthese effects [1] .
Erosion is another environmental effect, which is better resisted by harder materials. Erosionresistance of turbine blades can be improved by applying hard facing coatings . Erosion resultsfrom particles ranging between 5-10 gm suspended in the hot gases. It also occurs as a result ofeither spalling of the thermal barrier coating layer (inefficient bonding, low reliability,exceeding service life), or the oxidized layer formed an the blade surface as a result of thermalcycling and components' vibration . This is a typical problem encountered by the first stageblades and vanes subjected to highest turbine inlet temperatures .
Thermal Fatigue: Transient thermal gradients within a component can induce plastic strains,and the cyclic strain resulting from repeatedly applied gradients can cause component failuredue to thermal fatigue . The effects of start-up and cool-down often can account for morereduction in life expectancy than creep. Thermal fatigue cracks initiate along the surface andprogress inwards either inter-granularly or trans-granularly . One way to reduce thermal fatigueis to reduce section size.
Thermo-mechanical Fatigue: Results from the combined effect of fluctuating loads andtemperatures . In the leading edge of gas turbine blades the maximum mechanical strain andlowest cycle temperature coincide, which is the condition for out-of-phase thermo-mechanicalfatigue [2] . This problem is important in the Gase of coated blades, where Young's modulus,thermal expansion, and inelastic deformation behavior of the coatings are highly dependentupon the temperature and are often different from the respective properties ofthe substrate.
Thermal shocks : Conditions that lead to rapid changes in operating temperature can lead toappreciable differences between the temperature of the outer surface regions and that of theinner core of the blade. This results in strains, which if locally greater than the ductility ofthematerial, the blade will crack in that region. Thermal shock resistance of the blade material
275

deteriorates as its thermal conductivity and ductility decrease and as its thermal expansioncoefficient and elastic modulus increase.
Toughness: Toughness is important since blades must withstand impact loading from foreignsolids that may get into the System . In many cases, creep resistance and thermal stability areobtained at the expense ofductility so that only a compromise is usually possible .
Weight : Weight becomes an important element in materials selection in aerospace applications .Weight also contributes to the Stresses acting an the blade as a result of the centrifugal forces .This factor can be taken into account by comparing materials an the basis of specific strength(strength/specific gravity) .
Processability : This material property depends an the intended means of shaping the blade. Hotworking, casting, and powder metallurgy are the main processing methods. Wrought alloysshould exhibit sufficient ductility at the working temperature, while cast alloys should be freefrom porosity and Segregation. The presence ofcomplex intemal cooling channels represents anadditional challenge to the production engineer .
Cost: The major installed cost elements of a turbine blade include material, processing, coating,and inspection . Length of Service and repair costs should be included when making selectiondecisions an the basis oflife-cycle cost .
Superalloys
3. Current Blade Materials
Nickel-based superalloys have been the Standard materials for turbine blades since the 50s.Superalloys, generally, have good resistance to corrosion, to mechanical and thermal fatigue, tomechanical and thermal shock, to creep and to erosion at high temperatures . Most superalloyshave a maximum service temperature of 1000°C in load-bearing applications .
Properties of superalloys have continually improved over the years by adding various alloyingelements and by strengthening techniques . The turbine blades of the Whittle gas turbine (c .1940) were made of a simple Ni-Cr alloy . This material presented some limitations in terms ofhigh temperature strength and oxidation resistance . Efforts to improve the high temperaturestrength focused an increasing the content and controlling the distribution of the intermetallic y'(Ni3 Al, Ti, Ta, Nb); solid-solution hardening by including cobalt, molybdenum and tungsten;and introducing carbide formers, tantalum, niobium and hafnium [3] . Oxidation resistance wasimproved by adding more ehromium (e .g . IN-738 and IN-939) which forms an oxide later ofCr 203 that protects the blade from attack by oxygen .
Superalloys are very hard materials that cannot be machined easily. Since the 50s, blades wereproduced by investment casting and special cast alloys were developed specifically for thatprocess. The development of powder techniques in the 60s (the driving force being theincorporation of cooling channels in the blades) also led to the development of special powderalloys (e.g . Nimonic alloys 90, 100 and 105) from which blades were made . In the 1970s, morealloys (e .g. MA 6000E alloy) became available as a result of developments in mechanicalalloying . This is achieved using a high energy milling process in which powddes (both metallicand non-metallic) are repeatedly fractured to expose clean surfaces and then subsequentlywelded together.
Many alloys have been used as blade materials and Table (1) gives some examples :
276
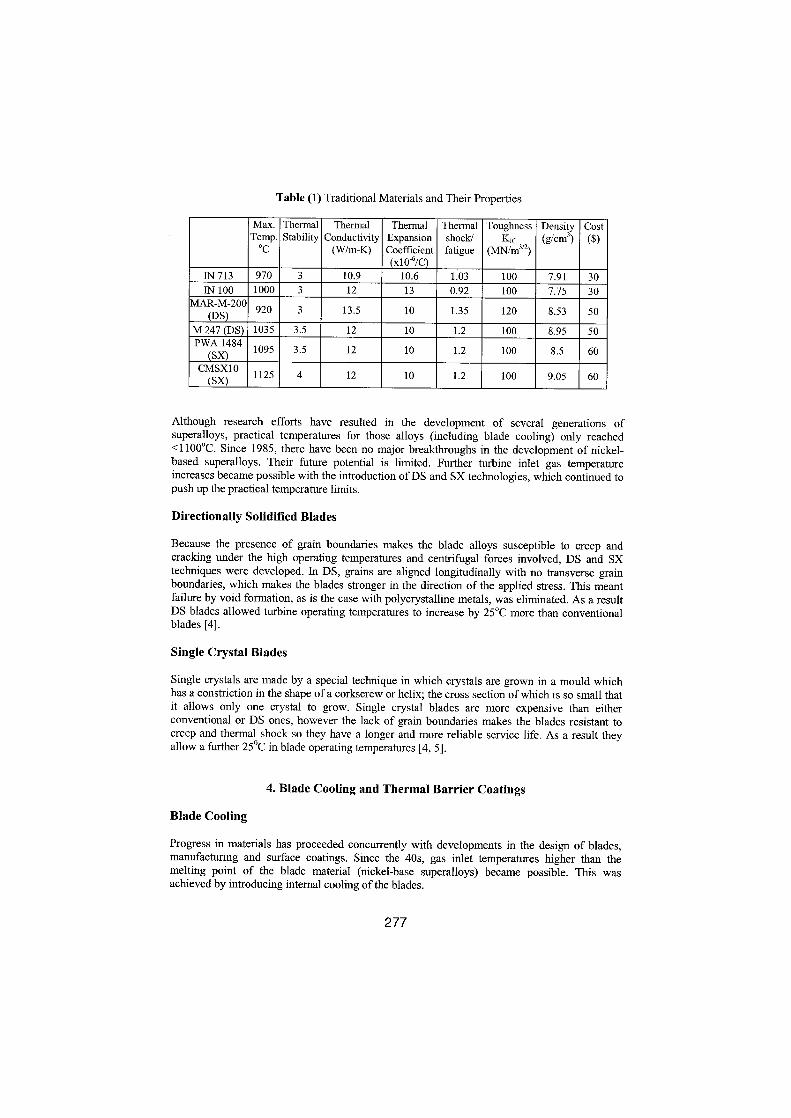
Although research efforts have resulted in the development of several generations ofsuperalloys, practical temperatures for those alloys (including blade cooling) only reached<1100°C. Since 1985, there have been no major breakthroughs in the development of nickel-based superalloys . Their future potential is limited . Further turbine inlet gas temperatureincreases became possible with the introduction ofDS andSX technologies, which continued topush up the practical temperature limits .
Directionally Solidified Blades
Because the presence of grain boundaries makes the blade alloys susceptible to creep andcracking under the high operating temperatures and centrifugal forces involved, DS and SXtechniques were developed. In DS, grains are aligned longitudinally with no transverse grainboundaries, which makes the blades stronger in the direction of the applied stress . This meantfailure by void formation, as is the case with polycrystalline metals, was eliminated . As a resultDS blades allowed turbine operating temperatures to inerease by 25°C more than conventionalblades [4] .
Single Crystal Blades
Table (1) Traditional Materials and Their Properties
Single crystals are made by a special technique in which crystals are grown in a mould whichhas a constriction in the shape of a corkscrew or helix; the Cross section ofwhich is so small thatit allows only one crystal to grow . Single crystal blades are more expensive than eitherconventional er DS ones, however the lack of grain boundaries makes the blades resistant tocreep and thermal shock so they have a longer and more reliable service life. As a result theyallow a further 25 °C in blade operating temperatures [4, 5] .
Blade Cooling
4. Blade Cooling and Thermal Barrier Coatings
Progress in materials has proceeded concurrently with developments in the design of blades,manufacturing and surface coatings . Since the 40s, gas inlet temperatures higher than themelting point of the blade material (nickel-base superalloys) became possible . This wasachieved by introducing intemal cooling ofthe blades .
277
Max. Thennal Thermal Thermal Thermal Toughness Density CostTemp . Stability Conductivity Expansion shock/ Kic (g/cm3) ($)°C (W/m-K) Coefficient fatigue (MN/m3/2)
x10-6/C)IN 713 970 3 10.9 10 .6 1 .03 100 7.91 30IN 100 1000 3 12 13 0.92 100 7.75 30
MAR-M-200DS 920 3 13 .5 10 1.35 120 8.53 50
M 247 (DS) 1035 3.5 12 10 1.2 100 8.95 50PWA 1484
SX 1095 3.5 12 10 1.2 100 8.5 60CMSX10(SX) 1125 4 12 10 1.2 100 9.05 60
At its introduction, internal cooling (passing cold air through cooling channels along the fülllength of the blade) allowed the inlet temperature to be increased by 100°C without changingthe alloy composition [4,10,11] . Later film cooling, in which air is passed over the surfacethrough little holes giving a cool boundary layer between blade and gases, was introduced.Developments in blade cooling have become quite sophisticated over the years and haveallowed more increases in inlet temperature . However, ducting cold air through the bladesreduces the thermal efficiency by taking too much of the heat away from the combustionchamber. Accordingly, by these impeding limits to the intenal cooling of turbine bladesemphasis has switched back to materials development [11,12] .
Thermal Barrier Coatings
Thermal barrier coatings (TBC) used extensively in aircraft turbines allow for another 100°Cincrease in operating temperatures . Currently the peak metal temperatures of over 1,100°C areexperienced in some turbines with service lives around 10,000 hours.
Important steps are being taken to optimize coatings for superalloys single crystal turbine bladesfor AGTS . Turbine inlet temperatures in advanced turbines could exceed 1,400°C, whichrequires components capable of withstanding high temperatures and pressures with improvedcoating durability greater than 30,000 hours. Currently used TBCs are susceptible to phasedegradation, creep at temperatures over 1,200°C, which result in degraded compliance andinsulation efficiency [12] . TBCs currently in use are based an Yttria stabilized zirconia (YSZ)with durability less than 10,000 hours. Surface deposits, such as glassy dust and Sulfate salts canpenetrate the porous TBCs and damage their strain-tolerant microstructure, resulting inpremature chipping or flaking . A team at the University of Pittsburgh has studied two TBCsystems [13] . The ferst of which is a bond coat composed of platinum aluminide (PtAI), and thesecond has a nickel-cobalt-chromium-aluminum-yttrium bond coat prepared by argon-plasma-spraying . In rapid cyclic heating from 1,100°C to 30°C six times per hour, the spalling timerecorded for the PtAI system was about 500 hours, while a 700 hours of spalling time wasrecorded for the NiCoCrAIY. Further coatings research is aimed at improving the stability ofthebond coatings and reliability ofTBCs . Those produced by plasma spraying are not suitable forrotating parts; conversely, TBCs made by electron beam physical vapor deposition (EB-PVD)have been successfully applied to rotating components . TBC systems with a 1,300°C withcapability for a minimum of 5,000 hours are to be achieved by December 2002 . Other coatingsare also developed for increasing the resistance against particle erosion through blade tip hard-facing . In this process, hard particles about 100-150 ltm are brazed onto the blade tip along thechord ofthe very thin profile [14] .
The following section will deal with the recent advances in materials and processing that couldbe suitable candidates for AGTS and that are capable of withstanding operating temperatures >1100°C. Advanced materials for AGTS can be classified into three categories : (1) TBC forcurrently used Ni-superalloys, (2) monolithic ceramic and intermetallic blades, and (3) Fiberreinforced composites, such as metal matrix composites (MMC), and ceramic matrixcomposites (CMC).
5. Recent Trends in Turbine Blade Materials
The demand for the development of AGTS running an varieties of fuels, such as clean naturalgas as well as fuels such as coal led several agencies to concentrate their efforts an thedevelopment of the materials necessary to withstand the expected high operating temperaturesand the harsh corrosive effect of the hot gases . Among these recent R&D programs sponsoredby The Department of Energy (DOE): Framatome and CEA, The Foundation For InnovativeSystems (FIS), Advanced Technology Program (ATP), Version 21, Advanced Turbine
278
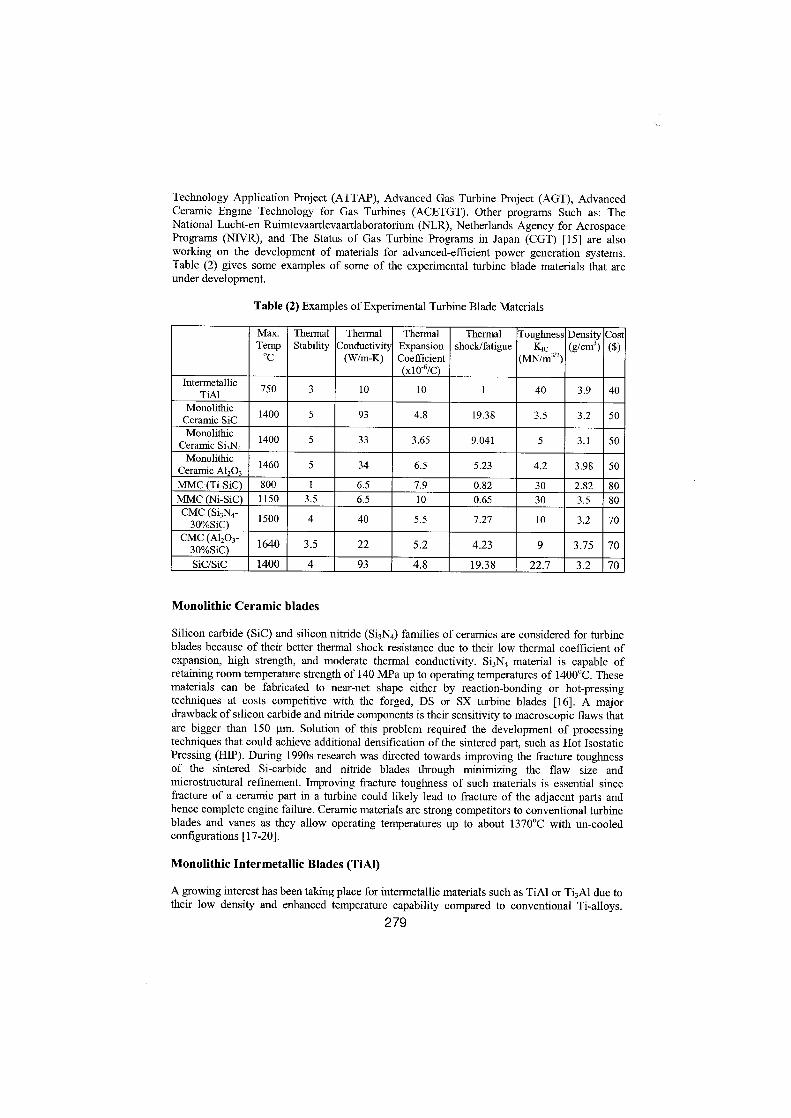
Technology Application Project (ATTAP), Advanced Gas Turbine Project (AGT), AdvancedCeramic Engine Technology for Gas Turbines (ACETGT) . Other programs Such as : TheNational Lucht-en Ruimtevaartlevaartlaboratorium (NLR), Netherlands Agency for AerospacePrograms (NIVR), and The Status of Gas Turbine Programs in Japan (CGT) [15] are alsoworking an the development of materials for advanced-efficient power generation systems.Table (2) gives some examples of some of the experimental turbine blade materials that areunder development.
Table (2) Examples ofExperimental Turbine Blade Materials
Monolithic Ceramic blades
Silicon carbide (SiC) and silicon nitride (Si3N4) families of ceramcs are considered for turbineblades because of their better thermal shock resistance due to their low thermal coefficient ofexpansion, high strength, and moderate thermal conductivity. Si3N4 material is capable ofretaining room temperature strength of 140 MPa up to operating temperatures of 1400°C. Thesematerials can be fabricated to near-net shape either by reaction-bonding or hot-pressingtechniques at costs competitive with the forged, DS or SX turbine blades [16] . A majordrawback of silicon carbide and nitride components is their sensitivity to macroscopic flaws thatare bigger than 150 Etm. Solution of this problem required the development of processingtechniques that could achieve additional densification of the sintered part, such as Hot IsostaticPressing (HIP). During 1990s research was directed towards improving the fracture toughnessof the sintered Si-carbide and nitride blades through minimizing the flaw size andmicrostructural refinement. Improving fracture toughness of such materials is essential sincefracture of a ceramic part in a turbine could likely lead to fracture of the adjacent parts andhence complete engine failure . Ceramic materials are strong competitors to conventional turbineblades and vanes as they allow operating temperatures up to about 1370°C with un-cooledconfigurations [17-20].
Monolithic Intermetallic Blades (TiAI)
A growing interest has been taking place for intermetallic materials such as TiAl or Ti3A1 due totheir low density and enhanced temperature capability compared to conventional Ti-alloys .
279
Max. Thermal Thermal Thermal Thermal Toughness Density CostTemp Stability Conductivity Expansion shock/fatigue Kic (g/cm3) ($)
°C (W/m-K) Coefficient (MN/m312)(x10 -6/C
Intermetallic 750 3 10 10 1 40 3 .9 40TiAIMonolithicCeramic SiC 1400 5 93 4 .8 19.38 3 .5 3 .2 50Monolithic
Ceranric Si3N4 1400 5 33 3 .65 9.041 5 3 .1 50Monolithic
Ceramic A1 203 1460 5 34 6 .5 5 .23 4 .2 3 .98 50
MMC Ti-SiC 800 1 6.5 7.9 0.82 30 2 .82 80MMC(Ni-SiC 1150 3 .5 6.5 10 0.65 30 3 .5 80CMC (Si3N4- 1500 4 40 5 .5 7 .27 10 3 .2 7030%SiCCMC (A1203 - 1640 3.5 22 5.2 4.23 9 3 .75 7030%SiC)
SiC/SiC 1400 4 93 4.8 19 .38 22.7 3.2 70
TiAl parts are usually manufactured by investment casting . Their specific strength is superior toNi-base superalloys . In USA, TiAI-blades and vanes have been successfully tested in engines,however, more testing is still necessary before commercializing. Ort the other hand, Ti 3A1,which is normally processed by forging, has limited interest due to its high density andcomplicated processing [21] .
Metal Matrix Composites (MMC)
High strength Ti-based MMCs are the most suitable candidate for turbine blades . They offer apotential for weight reduction up to 50% relative to conventional Ti-alloys. High modulus-continuous fibers of SiC about 0.1 mm in diameter are used for the reinforcement of the Ti-matrix [10] . The SiC fibers are coated with carbon layer in order to prevent extensive reactionsbetween the faber and the matrix during the final processing step . Fibers are coated with the Ti-matrix using plasma or PVD. HIP is used for the final consolidation.
Another type of MMCs belongs to a class called eutecties, in which a spontaneously alignedreinforced structure is formed when directionally solidified . Examples of these composites areNi-MMCs with TaC reinforcing fibers, Co-MMCs with TaC reinforcing fibers, Ni 3A1-MMCwith Ni3Nb reinforcing plates, Co-MMCs with Cr,C3 reinforcing fibers, and Nb-MMCs withNb2C reinforcing fibers . The high melting point fibers and the atomic bonding between thefibers and the matrix greatly improve the creep properties and strength of the composite alloy[22] . As a result, DS eutectics can increase the inlet temperature by 100°C above DS nickelalloys . Improvements in composite alloy design can allow even higher temperature increases.[4]
Ceramic Matrix Composites (CMC)
The low density and high temperature strength of ceramics made them attractive materials forgas turbines . As was discussed earlier, the low service fracture toughness ofmonolithic ceramiccomponents is their major draw back for engine-applications. However, fiber reinforced CMCscould offer a solution for this problem. Accordingly, lots of R&D efforts are currentlyconducted through the various agencies in order to improve the properties of CMC by fiberreinforcement. SiC, and A1 203 are examples of reinforcing fibers in a matrix of either SiC,A1 203 or a mixture of both [22] . One of the disadvantages of non-oxide fiber-reinforcedceramics is their potential for chemical reaction between the fibers and the matrix at operatingtemperatures >1000°C for several hundred hours. In addition, the oxide fiber-reinforcedcomposites could suffer from their creep property deterioration with time [23] . The NASA'sGlenn Research Center in Cleveland investigated the ceramic composites in rocket engineturbines to increase safety and reduce cost . A turbine bladed disk (blisk), made out of carbonfiber reinforced SiC matrix can withstand temperatures about 1,100°C. The increased turbineefficiency allows for heavier payloads . Moreover, since the composite blisk is only about 1/4 theweight ofthe metal disc, the weight saved can be used to increase the weight of the payload foraerospace applications [22] .
6. Materials Selection for Gas Turbine Blades
Generally, the material selection process starts with an analysis of the material performancerequirements, which includes :
"
Functional requirements ."
Resistance to service environment."
Processability requirements ." Cost.
280

In the case of gas turbine blades, functional requirements include resistance to creep andrupture, toughness, thermal stability, density, and resistance to thermal shock and fatigue . Whilethese properties are readily available for established materials under various service conditions,they are not easy to find for new and experimental materials, which makes selection andsubstitution decisions difficult. In the present analysis, material properties are graded an a five-point scale ofexcellent (5), very good (4), good (3), fair (2), and poor (1) .
Resistance to service environment includes oxidation, corrosion, and abrasion. This factor willnot be included in the present analysis as appropriate coatings can now be used to protect Mostmaterials. The method ofprocessing a given material is influenced by whether it is available aswrought, Gast, or powder and by whether cooling channels are needed . To simple the presentanalysis, processability will be included as part of the cost . Therefore, the cost in this case isconsidered as the installed cost, which includes material, processing, coating, and inspection . Amore accurate comparison of the cost would take into account the length of service and repaircosts, which is the life-cycle cost . In this analysis, materials are compared an the basis of anestimate of the installed cost and a five-point scale is used tot comparison, with the leastexpensive being 5 and the most expensive being 1, sec Tables (1) und (2) .
To compare materials, the weighted properties procedure outlined in [24] was followed. Thefrst step was to use the digital logic method in estimating the relative importance (weightingfactors) of the different material properties for a given application . This was done for the twofollowing applications :
"
Engines for missile and aerospace applications with the Main requirements of highmaximum power, reliability, and lightweight. Relatively shorter lifetime can betolerated .
"
Engines for auxiliary power units with the Main requirements of long life, tolerance tochangeable loading, and reliability . Engine weight is not an issue .
Table (3) gives the weighting factors that were obtained using the digital logic method .
Comparison AmongTraditional Materials :
According to the weighted properties procedure the ferst step in comparing materials is tonormalize the properties so that the best value for a given property gets 100 and other values arerelated to it . Table (4) gives the normalized properties of the traditional materials in Table (1) .The performance index (y) for the different traditional materials is then calculated as the totalsum of (normalized property * its weighting factor) . Table (5) gives the performance indexvalues for the applications in missile and aerospace and auxiliary power generation. Theperformance index values of Table (5) Show that MAR-M-200 (DS) has the highest value withCMSX10 (SX) beeng a close second .
281
Property Maximumtem erature
Thermalstabilit
Thermalfati e/shock
Toughness Density Cost
Relative importancein missile and 0 .24 0 .08 0 .16 0 .18 0 .26 0.08
aeros ace en inesRelative importance
in engines for 0 .14 0 .26 0 .20 0 .16 0 .06 0 .18auxiliary power units

Table (4) Normalized Properties ofTraditional Materials
Table (5) Performance Index ofTraditional Materials
Selection from Traditional and Experimental Materials:
The process of selection is repeated for the combined list ofmaterials in Tables (1) and (2) andthe resulting performance index values are given in Table (5). The performance index values ofTable (6) Show that the monolithic ceramic SiC and SiC/SiC composite perform equally welland have the highest values for applications in missile and aerospace applications . In auxiliarypower generation applications, however, the monolithic ceramic SiC has a clear advantage overother materials.
Table (6) Performance Index ofTraditional and Experimental Materials
282
max. temp . thermal stability thermal shock toughness density CostIN 713 86.22 75 76.17 83 .3 97 .98 100IN 100 88.89 75 68.39 83 .3 100 100
MAR-M-200 (DS 81.78 75 100 100 90.86 60M247 DS 92 87 .5 88.89 83 .3 86 .59 60
PWA 1484 SX 97 .3 87 .5 88.89 83 .3 91 .18 50CMSX10 (SX) 100 100 88.89 83 .3 85 .64 50
Performance Index in AuxiliaryPower Generation
Perfonnance Index in Missileand Aeros aceA lications
IN 713 84.02 87.36IN 100 82.96 87 .27
MAR-M-200 (DS 86.45 89 .05M247 DS 82.74 85 .62
PWA 1484 (SX 82.00 87 .29CMSX10 (SX) 85.25 87 .49
Performance Index for AuxiliaryPower Generation
Performance Index for Missileand Aeros aceA lications
IN 713 52.57 53.03IN 100 58.82 53.60
MAR-M-200 DS) 53.83 51 .63M247 DS 54.49 50.54
PWA 1484 SX 53 .31 51.10CMSX10 SX 56.03 51 .76
Intermetallic EAI 46.64 49.27Monolithic Ceramic SiC 75.03 75 .00Monolithic Ceramic Si3N4 64.75 67 .50Monolithic Ceramic A1203 59 .9 59.37
MMC(Ti-SiC 30 .22 50.07MMC i-SiC 44.75 53.49
CMC Si3N4-30%SiC 56.00 64.47CMC A120 3-30%SiC 50.44 59.36CMC (SiC/SiC) 69 .30 74 .91

7. Conclusions
The present analysis gives a methodical way ofselecting a material for a given application . Theresults of the analysis depend an the weighting factors allocated to each property and an theaccuracy of the values allocated to each material property. Allocating the weighting factorsinvolves subjective judgment, even when the digital logic method is used . In the present case,sensitivity analysis has shown that the final results are not affected by small changes inweighting factors .
The major challenge to the accuracy of the present analysis comes from lack of accurateinformation about material properties, especially for thermal stability and thermal shock/fatigue.Another difficulty comes from the fact that the properties of experimental materials areunavailable and depend to a large extent an the method of preparation and quality of the rawmaterials involved in making them .
Finding the cost of making a turbine blade out of a specific material was also a challenge. Suchcost depends an the number of blades produced, method of production, size of the blade,whether a thermal barrier coating is needed, and whether intemal cooling channels are used .
In spite of the above difficulties and inaccuracies, it is felt that the present analysis gives anindication of the directions that those involved in developing new materials can pursue . Basedan the present analysis, it is perceived that monolithic ceramic SiC and SiC/SiC compositeshave the best potential for extensive use in turbine blade applications.

Referenees
[1] David A. Woodford, Design for high-temperature applications, pp 573-588, ASMHandbook, volume 20, Materials Selection and Design, volume chair: George E. Dieter, ASMInternational, Materials Park, OH, 1997 .
[2] SamY. Zamrik, Thenno-mechanical fatigue life prediction model for advanced gas turbinematerials.
[3] Tracey, V A and Cutler C P, "High temperature alloys from powders", Powder Metallurgy,1981, No. 1, 32-40.
[4] AshbyMF and Jones D RH, Engineering Materials 1 - An Introduction to their Propertiesand Applications, Second edition, Butterworth Heinemann, 1996 .
[5] Kalpakjian, S and Schmid, S R, Manufacturing Engineering and Technology, fourth edition,Prentice Hall, 2001 .
[6] Metallurgical Analysis Case Studies Liburdi Engineering - Technology,Metallurgical Analysis, Update Volume 1, Issue 2 December, 1996www.liburdi .com/web panes/tcs metalanlvcs.shtml
[7] H. J. Kolkman and G. A. Kool, National Lucht- en Ruimtevaartlaboratorium NationalAerospace Laboratory NLRNLR-TP-98013, Non Destructive Investigation ofthe Condition ofGas Turbine Bladeswww.nlr.nL/public/facilities/gasturbine/98013-tp.pdf
[8] Couturier, Rand Escaravage, C, "High temperature alloys for the HTGR Gas Turbine:Required properties and development needs",http://www .iaea.or.at/inis/aws/htgr/fulltext/g_pe s 12 pdf
[9] NLR Research Facilities, Structures andMaterialswww.nlr .nl/uublic/facilities/Aasturbine/wolfwol.html
[10] Recent Developments in Turbine Blade Internal Coolingichmt.me.metu.edu.tr/abstracts/Turbine-2000/abstracts/49 pdf
[11] Thermal Barrier Coatings, Chapter 1http ://wwwipm virginia edu/process/PVD/Pubs/thesis5/cha tn erl pdf
[12] Thermal Barrier Coatings, Chapter 2chiip ://www ipm virginia edu/process/PVD/Pubs/thesis5/cha tp erl pdf
[13] Ramesh Subramanian, StephenM. Sabol, John Goedjen and Maria Arana SiemensAdvanced ThermalBarrier Coating Systemsfor theATSEnginewww.netl doe go/publications/proceedings/99/99ats/4-6 pdf
[14] M. Morinaga andT. Takahashi, A Prediction ofDegradation Time oftheMicrostructure ofMCrAlYcrigpi denken orjp/eng/PR/Ngnpo/2000E/00seika2l pdf
[15] NGT Program structure, Next Generation Turbine Programwww.fetc.doe.goy/publications/brochures/pdfs/scng/ng-t pdf-
284

[16] Advanced Engineering Materialshttp://www.wiley-vch.de/vch/journals/2266/2266 media pdf
[17] D. W. Richerson, "Mechanical Engineering", September 1997, p. 80 .
[18] J. R. Price, Ceramic Stationary Gas Turbine, Research sponsored by theU.S . DOEwww.netl.doe .eov/iiublications/nroceedings/97/97ats/ats pdf
[19] US Department ofEnergy's, AdvancedIndustriel Gas Turbineswww.eren.doe . ov/der/pdfs/conf 01/smith waslo.pddf
[20] D. W. Freitag andD. W. Richerson, "Opportunities for Advanced Ceramics to Meet theNeeds ofthe Industries ofthe Future", U.S . Advanced Ceramics Association and Oak RidgeNational Laboratory .www.ms.oml .goy/vprograms/energveff/cfcc/iof/frontm a pdf
[21] Nix Research Group, Materials Science & Engineering, Stanford Universityfile :///D /Advanced Materials for Power Generation/intermetallic .html
[22] Advanced space transportation summaryhtip ://www.msfc.nasa.nov/NEWSROOM/background/facts/Ceramic matrix pdf
[23] B. Miller, "Hybrid SiliconISilicon Carbide Microstructures andSilicon Bond StrengthTestsfor theMITMicroengine", S. M. Thesis, Dept . ofAeronautics and Astronautics, MIT,Cambridge, MA,2000 .
[24] MahmoudM. Farag, Materials Selectionfor Engineering Design, Prentice Hall, London,1997 .
[25] High-Temperature high-strength Nickel-base alloys, Nickel Development Institute, UK,report no . 393, 1995 .
[26] http://www.h i hg
teMpmetals .com/
[27] CES software, Granta Design Limited, Trumpington Mews, 40b High Street, Trumpington,Cambridge CB22 SL, UK .

286

NEW DEVELOPMENTS OF THERMAL BARRIER COATING SYSTEMS FORCOMPONENTS IN GAS TURBINES
Robert VaßenInstitut für Werkstoffe und Verfahren der Energietechnik (1W1)Forschungszentrum Jülich GmbH, 52425 Jülich, Germany
ABSTRACTRecent developments in the field of new thermal barrier coatings for gas turbineapplications will be reviewed . In the first part, a selection of suitable ceramiccandidate materials will be presented . These materials include oxides withpyrochlore, perovskite, garnet and also other structures . A comparison anddiscussion of the physical properties, especially thermal conductivity, thermalexpansion and thermal stability, will be given .In the second part, the performance of coatings from these materials will bedescribed . Of special interest is the sintering behaviour and the results of thermalcycling tests . At present, the amount of published work an these application orientedissues is rather limited . Hence, our own work will be in the foreground in this section .In the last part, new TBC concepts will be discussod . The concepts includenanophase materials and layered or graded structures . Results of our own conceptwith a two-layer TBC structure consisting of YSZ and pyrochlore materials will begiven . At elevated surface temperatures beyond 1300 °C this concept leads toimproved thermal cycling life times of at least a factor of 2 compared to the standardYSZ based system .
INTRODUCTIONMany different international research groups are recently developing thermal barriercoatings . This can be illustrated by the large number of review articles which exist anthis topic . Some recent articles are listed in the references [1, 2, 3, 4, 5] . The numberof articles is certainly also promoted by the high complexity of the subject . A TBCsystem includes in most cases the substrate, the so-called bond coat and finally theinsulative - in most cases ceramic - top coat . All these components react with eachother or the environment to a more or less extent and/or they undergo detrimentalchanges due to thermo-mechanical treatments during operation . The present paperwill be focused an recent developments to improve the ceramic part of the TBCsystem .The use of thermal barrier coating systems in gas turbines or diesel engines lead toimproved performance . The insulative layer can provide a reduction of thetemperature of the metallic substrate which results in an improved componentdurability. Alternatively, an increase of efficiency can be achieved by allowing anincrease of the turbine inlet temperatures [6] .There are two major directions of development in the area of TBCs. First, it is tried toimprove the insulative capability of the coatings by the reduction of the thermalconductivity . This can either be achieved by looking for new materials with a lowthermal conductivity or by a modification of the microstructure of the coating . Detailsan both directions of development will be given in the present paper . A secondimportant area of research is related to the improvement of the temperature capabilityof the TBC . The state-of-the-art coating for TBCs is nowadays 7 - 8 wt . % yttriastabilised zirconia (YSZ) . This material has been identified during the last 2 and a halfdecades of extensive work an TBCs as a favourite material for this application, e.g . inthe fundamental early work of Stecura [7] . However, the maximum surface
287
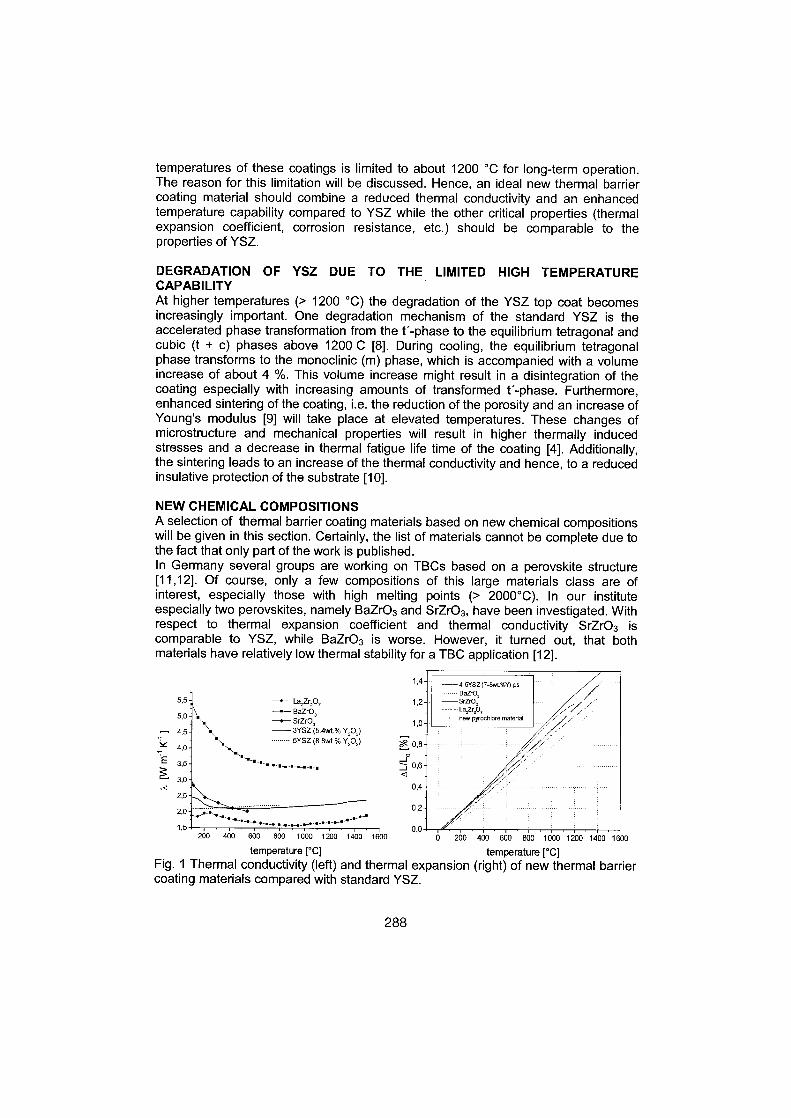
temperatures of those coatings is limited to about 1200 °C for long-term operation .The reason for this limitation will be discussed . Hence, an ideal new thermal barriercoating material should combine a reduced thermal conductivity and an enhancedtemperature capability compared to YSZ while the other critical properties (thermalexpansion coefficient, corrosion resistance, etc .) should be comparable to theproperties of YSZ .
DEGRADATION OF YSZ DUE TO THE LIMITED HIGH TEMPERATURECAPABILITYAt higher temperatures (> 1200 °C) the degradation of the YSZ top coat becomesincreasingly important . One degradation mechanism of the standard YSZ is theaccelerated phase transformation from the t"-phase to the equilibrium tetragonal andcubic (t + c) phases above 1200 C [8] . During cooling, the equilibrium tetragonalphase transforms to the monoclinic (m) phase, which is accompanied with a volumeincrease of about 4 %. This volume increase might result in a disintegration of thecoating especially with increasing amounts of transformed t"-phase . Furthermore,enhanced sintering of the coating, i .e . the reduction of the porosity and an increase ofYoung's modulus [9] will take place at elevated temperatures . These changes ofmicrostructure and mechanical properties will result in higher thermally inducedstresses and a decrease in thermal fatigue life time of the coating [4] . Additionally,the sintering leads to an increase of the thermal conductivity and hence, to a reducedinsulative protection of the substrate [10] .
NEW CHEMICAL COMPOSITIONSA selection of thermal barrier coating materials based an new chemical compositionswill be given in this section . Certainly, the list of materials cannot be complete due tothe fact that only part of the work is published .In Germany several groups are working an TBCs based an a perovskite structure[11,12] . Of course, only a few compositions of this large materials class are ofinterest, especially those with high melting points (> 2000°C) . In our instituteespecially two perovskites, namely BaZr03 and SrZr03, have been investigated . Withrespect to thermal expansion coefficient and thermal conductivity SrZr03 iscomparable to YSZ, while BaZr03 is worse . However, it turned out, that bothmaterials have relatively low thermal stability for a TBC application [12] .
0
temperature [°C]
temperature [°C]Fig . 1 Thermal conductivity (left) and thermal expansion (right) of new thermal barriercoating materials compared with standard YSZ .
200 400 600 800 1000 1200 1400 1600
288
5,5 -"-La~Zr20,
5,0 -"- BaZr03-SrZr0 3
4,5 -3YSZ (5.4wt.% Y,03)---- - 5YSZ (8.8M.% Yz03)
4,0
3,5
3,0
2,5
2,0
1,5
Another very interesting candidates for new TBCs are materials with pyrochlorestructure [13, 12] . Especially materials based an lanthanum zirconate, La2Zr207 ,Show favourable properties for this type of application, e.g . low thermal conductivityand high thermal expansion coefficients (Fig . 1) . These materials can be furtherimproved by doping with rare earth elements . The thermal stability has beendemonstrated in annealing experiments up to 1400°C [14] . Thermal cycling tests ofplasma-sprayed coatings revealed promising results even without optimisation of thecoating .Padture and Clemens measured thermal conductivity in garnets with respect to anapplication as thermal barrier coating [15] . They found high temperature valuesbetween 2.4 and 3 .1 W/m/K for the investigated compositions . Garnets with a thermalconductivity clearly below that of YSZ (about 2.0-2.7 W/m/K for stabilised zirconia[15]) have not been found .
NANOSTRUCTURED MATERIALSRecently, nanostructured materials materials have been suggested as candidates forthermal barrier coatings [16] . An interesting property of these materials is thepossible reduction of thermal conductivity due to phonon scattering at grainboundaries. An about 30 % decrease was predicted in nanocrystalline 7 wt.% YSZ of100 nm grain size in a theoretical work by Klemens and Gell [17] . However,experimental results show that a grain size of 30 nm and below is necessary to get asignificant reduction in YSZ [18] . These results might be qualitatively understood bythe high amount of oxygen vacancies in YSZ, which are effectively scatteringphonons and hence, reducing thermal conductivity . A further reduction, e.g . by ahigh density of grain boundaries, seems to be difficult and only possible at very smallgrain sizes . A further problem is grain growth in nanocrystalline structures . Above900 °C a stabilisation of the structure is required, e.g . by the use of compositestructures like YSZ / AI203 or by using multilayer nanostructured ceramic TBCs [19] .Whether this concept is successful has to be demonstrated in the future .
MULTILAYERS AND GRADED COATINGSStresses in ceramic coatings an metals can effectively be reduced by the use of agraded interlayer between the metallic substrate and the ceramic layer [20] . Thisapproach was also applied to thermal barrier coatings applying a graded coatingbetween bond coat and top coat . However, due to the higher surface area of agraded bond coat compared to a step wise compositional change fast oxidation ofthe bond coat was observed [21 ] .Very promising are approaches which use graded or multilayer structures within theceramic top coat . One possibility is the use of a two layer top coat, in which theceramic layer in contact with the hot gases is especially resistant against corrosive orerosive attack [22] . Alternatively, it is possible to use newly developed ceramicmaterials with improved high temperature capability. Often these materials have alower coefficient of thermal expansion (TEC) or a reduced mechanical strength andfracture toughness, which might lead to early failure in thermal cycling tests . Using astandard YSZ layer with a high TEC and good mechanical properties will reducecrack growth in the most critical region close to the bond coat. These so calleddouble layer systems have been produced by APS using 8 wt.% YSZ and La2Zr202 inour institute . In Fig . 2 a micrograph of such a coating after thermal cycling in one ofour gas burner test facilities is shown . l t could be shown that the performance ofthese systems at high surface temperatures (>1330°C) is by at least a factor of twobetter than the one of conventional single layer YSZ systems .
289
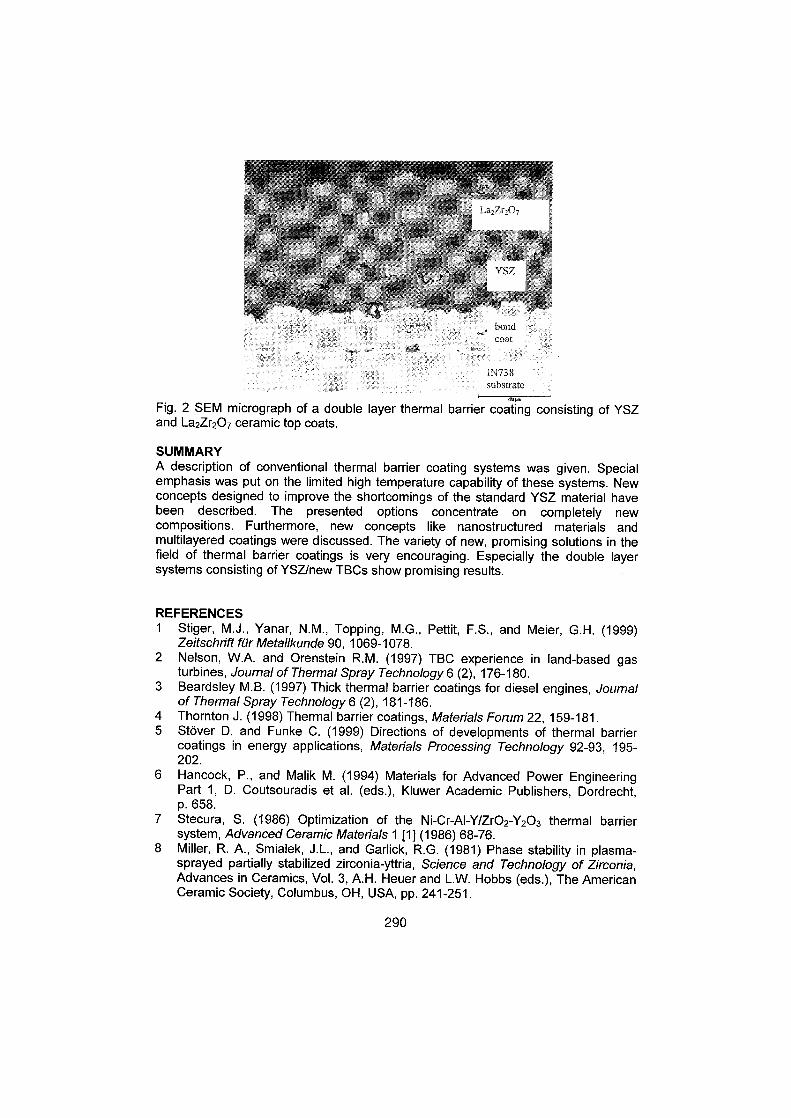
Fig . 2 SEM micrograph of a double layer thermal barrier coating consisting of YSZand La2Zr207 ceramic top coats .
SUMMARYA description of conventional thermal barrier coating systems was given . Specialemphasis was put an the limited high temperature capability of these systems . Newconcepts designed to improve the shortcomings of the standard YSZ material havebeen described . The presented options concentrate an completely newcompositions . Furthermore, new concepts like nanostructured materials andmultilayered coatings were discussed . The variety of new, promising solutions in thefield of thermal barrier coatings is very encouraging . Especially the double layersystems consisting of YSZ/new TBCs show promising results .
REFERENCES1
Stiger, M .J ., Yanar, N .M ., Topping, M.G., Pettit, F.S ., and Meier, G .H . (1999)Zeitschrift für Metallkunde 90, 1069-1078 .
2 Nelson, W.A . and Orenstein R.M. (1997) TBC experience in land-based gasturbines, Joumal of Thermal Spray Technology 6 (2), 176-180 .
3
Beardsley M.B . (1997) Thick thermal barrier coatings for diesel engines, Joumalof Thermal Spray Technology 6 (2), 181-186 .
4
Thornton J . (1998) Thermal barrier coatings, Materials Forum 22, 159-181 .5
Stöver D. and Funke C . (1999) Directions of developments of thermal barriercoatings in energy applications, Materials Processing Technology 92-93, 195-202 .
6
Hancock, P., and Malik M. (1994) Materials for Advanced Power EngineeringPart 1, D . Coutsouradis et al . (eds .), Kluwer Academic Publishers, Dordrecht,p . 658 .
7 Stecura, S . (1986) Optimization of the Ni-Cr-AI-Y/Zr02-Y203 thermal barriersystem, Advanced Ceramic Materials 1 [1] (1986) 68-76 .
8
Miller, R . A ., Smialek, J .L ., and Garlick, R.G . (1981) Phase stability in plasma-sprayed partially stabilized zirconia-yttria, Science and Technology of Zirconia,Advances in Ceramics, Vol . 3, A.H . Heuer and L.W . Hobbs (eds.), The AmericanCeramic Society, Columbus, OH, USA, pp . 241-251 .
290
lN738substrate
9
Funke, C ., Siebert, B., Vaßen, R., and Stöver, D . (1998) Properties of Zr02 -7 wt . % Y203 thermal barrier coatings in relation to plasma spraying conditions inThermal Spray : A United Forum for Scientific and Technological Advances,Proceedings of the United Thermal Spray Conference (15.-19 . September 1997,Indianapolis, Indiana), C.C . Berndt (ed .), ASM International, Materials Park, OH,pp. 277-284 .
10 Dinwiddie, R.B ., Beecher, S.C ., Porter, W.D., and Nagaraj, B.A . (1996) TheEffect of Thermal Aging an the Thermal Conductivity of Plasma Sprayed and EB-PVD Thermal Barrier Coatings (1996) The American Society of MechanicalEngineers, ASME-96-GT-282, New York, USA, 1-8 .
11 MaTech-Programm "Wärmedämmschichten für Oberflächentemperaturen > 1300
12 Vassen, R., Cao, X., Tietz, F.,Basu, D .,Stöver, D . Zirconates as New Materialsfor Thermal Barrier Coatings, J. of the American Ceramic Society, 83, 8 (2000)2023-28 .
13 Vaßen, R., Cao, X., Tietz, F ., Kerkhoff, G., and Stöver, D . (1999) La2Zr207 - anew candidate for thermal barrier coatings, Proc. of the United Thermal SprayConference, 17.-19 .3.99, Düsseldorf, Hrsg . E . Lugscheider, P.A. Kammer, Verlagfür Schweißen und Verwandte Verfahren, Düsseldorf, 1999, p . 830-834 .
14 Cao, X.Q ., Vassen, R., Schwartz, S., Jungen, W., Tietz, F ., and Stöver, D.Therma stability of lanthanum zirconate plasma-sprayed coatings, J . of theAmerican Ceramic Society, 84, 9 (2001) 2086-90-
15 Padture, N.P ., and Klemens, P .G . (1997) Low thermal conductivity in garnets, J.of the American Ceramic Society 80 [4] 1018-20 .
16 see e.g . Melissa Stewart's (Renssellaer Polytechnic Institute in Try, NY)webpage entitled "Using nanostructured materials in thermal barrier coatings foraircraft gas turbines engines" :http://www.eng.rpi.edu/dept/materials/courses/nano/stewart/indey .htm l
17 Klemens, P.G., and Gell, M . (1998) Thermal conductivity of thermal barriercoatings, Materials Science and Engineering A245 143-149 .
18 Soyez, G . ; Eastman, J.A . ; Thompson, L.J . ; Bai, G .-R . ; Baldo, P .M . ; McCormick,A.W . DiMelfi, R.J . ; Elmustafa, A.A . ; Tambwe, M .F . ; Stone, D.S ., Grain-size-dependent thermal conductivity of nanocrystalline yttria-stabilized zirconia filmsgrown by metal-organic chemical vapour deposition, Applied Physics Letters 77,8 (2000) 1155-7 . 20 .
19 Courtright, EL., Johnson, R.N., and Bakker, W.T . (1999) Multilayernanostructured ceramic thermal barrier coatings, United States Patent 5998003,date of patent : 7.12 .1999 .
20 Teixeira, V., Andritschky, M., Stöver, D . (1999) Modelling of thermal residualstresses in graded ceramic coatings Materials Science Forum Vols . 308-311 930-935 .
21 Alaya, M., Oberacker, R., and Diegle, E . (1995) Aspekte zum thermozyklischenund oxidativen Verhalten von plasmagespritzten Duplex- undzusammensetzungsgradierten Zr02 - Wärmedämmssystemen,Fortschrittsberichte der deutschen keramischen Gesellschaft 10 30-40 .
22 Bornstein, N .S ., and Zatorski, R.F. (1999) Method of applying an overcoat to athermal barrier coating and coated article European Patent EP 0937 787 A1, dateof publication : 25.8.1999 .
291

292
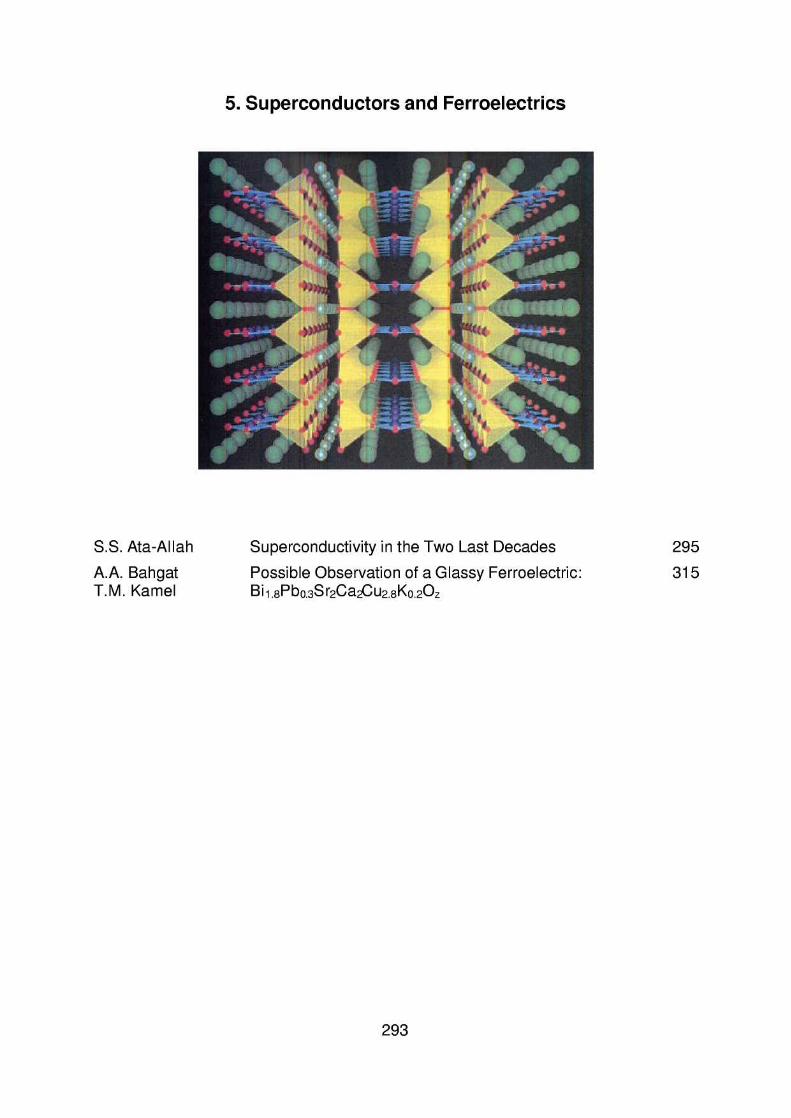
5 . Supereonduetors and Ferroeleetries
S.S . Ata-Allah Superconductivity in the Two Last Decades 295
A.A . Bahgat Possible Observation of a Glassy Ferroelectric : 315T.M . Kamel Bil .sPbo.3Sr2Ca2Cu2.sKo .20Z
ABSTRACT
Superconductivity in the two last decades
S. S. ATA-ALLAHReactor& Neutron Physics Department
Nuclear Research Center, Atomic Energy Authority -Cairo Egypt
Before 1986, the highest T, was 23.2K (-249.8 OC/-417 .6 °F) in niobium-germanium
compounds. Temperatures this low were achieved by use of liquid helium, an expensive,inefficient coolant . Ultralow-temperature operation places a severe constraint an the overallefficiency of a superconducting machine. This, large-scale operation of such machines was notconsidered practical . But in 1986 discoveries at several universities and research centers beganto radically alter this situation . Ceramic metal-oxides compounds containing rare earth elementswere found to be superconductine at temperatures high enough to permit using liquid nitrogenas a coolant . Because liquid nitrogen, at 77K (-196 oC/-321 °F), cools 20 times more effectivelythan liquid helium and in 10 times less expensive, a host of potential applications suddenlybegan to hold the promise of economic feasibility . In 1987 the composition of one of thesesuperconducting compounds, with T, of 94K (-179 oC/-290 OF), was revealed to be YBa2Cu307(yttrium-barium-copper-oxide). It has since been shown that rare-earth elements, such asyttrium, are not an essential constituent, for in 1998 a thallium-barium-calcium copper oxidewas discovered with a T, of 125K (-148 OC/-234 OF) . Between 1986 and 1995 most advances inthe field of superconductivity related to the discovery of new superconduetor "systems" andcompounds. In recent years, except for the discovery of additional elements that willsuperconduct under extreme high pressure, supereonductor news has been mainly about novelway to employ the new ceramie superconductors, innovative fabrieating techniques and typicalsuperconductors.
I. INTRODUCTION
Superconductivity, phenomenon displayed by certain conductors that demonstrate no resistanceto the flow of an electric current. Superconductors also exhibit strong diamagnetism ; that is,they are repelled by magnetic fields . Superconductivity is manifested only below a certaincritical temperature T, and a critical magnetic field H� which vary with the material used . Thephenomenon was better understood only after strong diamagnetism was detected in asuperconductor by KarlW. Meissner and R. Ochsenfeld of Germany in 1933 . The basic physicsof superconductivity, however, was not realized until 1957, when the American physicists JohnBardeen, Leon N. Cooper, and John R. Schrieffer advanced the now celebrated BCS theory,which describes superconductivity as a quantum phenomenon in which the conductoon electrons
295

move in pairs and thus Show no electrical resistance . In 1962 the British physicist Brian D.Josephson examined the quantum nature of superconductivity and proposed the existence ofoscillations in the electric current flowing through two superconductors separated by a thininsulating layer in a magnetic or electric field. The effect, known as the Josephson Effect,subsequently was confirmed by experiments . Using the quantum effects of superconductivity,devices have been developed that measure electric current, voltage, and magnetic field with
unprecedented sensitivity .
The recent discovery of magnesium diboride as a superconductor with transition temperature near40 K has prompted some discussion of whether this new material might have an impact an thefuture viability ofsuperconducting digital technology. So, this paper will have two pairs;
Part I: gives an overview Josephson junction (JJ) technology .
Part 11 : deals with one class of HTCS class (123) system to shed more lights an thesuperconducting mechanism in this important class .
PART I
lt is convinced that superconducting Josephsonjunction (JJ) technology will have a small butimportant niche in high-performance digital signal and data processing applications for civilian,commercial, and military terrestrial, as well as space deployment. However, beforesuperconductive digital technology can indeed become viable, three conditions must be met:
1- There must be a market-driven demand to employ superconductive digital technology toperform particular functions that cannot be performed by conventional (that is, semiconductor)electronics technology
11- A manufacturable Josephsonjunction device and circuit fabrication technology must existwith a suitable broad-based infrastructure
111- Appropriate energy-efficient, reliable, and low-cost cryogenic refrigeration systems suitableto cooling the JJ digital technology in question must be available to produce complete packagesthat, at the system level, are totally transparent to the cryogenic aspects of this technology .There has been considerable effort over the pastthirty years to develop a viable, reproducible,controllable, and manufacturable Josephsonjunction technology for use as the active element indigital circuits and systems.
296
1- Niobium and Niobium Nitride JJ Technology .
For the LTS materials, Nb and NbN, there are practical junction technologies that appear to bemanufacturable, stable, and controllable . Much progress has been achieved during the past twentyyears to mature and stabilize LTS device and chip level design and fabrication technologies . Atthe present time, the primary limitation an building chips with greater than 10,000 junctions/cm2appears to be the need for infrastructure, such as clean rooms and lithography equipment, allrequiring funds and some manpower resources, which could be done if financial resources weremade available. A recent article by Brock, Rowell, and Track (IEEE SPECTRUM, December2000, p. 40)
3- HTS (that is, cuprates) JJ Technology .
This problem has been addressed fairly extensively, worldwide, during the early part ofthe 1990swith very modest success and is currently being addressed primarily by the SuperconductivityResearch Laboratory (SRL) of the International Superconductivity Technology Consortium(ISTEC) in Tokyo and by OXXEL GmbH, in Bremen, Germany. According to results publishedto date, JJ junctions have been made an YBCO, but they are NOT controllable, predictable, orreproducible, and the variations ("spreads") in device parameters across a chip are too large forany useful level of integration . Some of the reasons that have been offered to explain thedifficulty in obtaining reproducible, controllable, and manufacturable HTS JJs with small spreadsof parameters an chip include (but are not limited to) issues such as edge-profiling, anisotropy ofYBCO, oxygen diffusion at the interfaces between electrodes and the barrier region, very shortcoherence lengths (of the order of 10 Ä, one lattice spacing), and suitable barrier materials withusable values ofR� and J.. IfHTS JJs Gould be manufactured and ifthey operated satisfactorily attemperatures near 77 K, they could be cooled by the "least complicated" and smallest input-powersystems among the 77 K, 35 K, and 4K cryocoolers . Recently, there have been speculation andsimulations that have suggested that YBCO-like JJ digital circuits might have to be operated inthe temperature region near 35 K to minimize thermal upsets of JJ digital devices and thus torealize acceptable bit error rates (BER) for digital processing applications. If indeed HTS JJdigital circuits have to be operated at temperatures near 35 K, the impaet an the system would bemore complex refrigeration systems and increased electrical input power compared with thatrequired for Operation at temperatures near 77 K.
297
3- Medium Temperature Superconductors (MTS) such as MgBZ.
The recently discovered materials with T, near 40 K seem to have properties that are moreamenable to junction technology than do the higher temperature cuprate materials. The materials,
of which magnesium diboride (MgBZ) was the initially reported one, appear to be s-wave-like,
have only slightly anisotropic conduction processes, and have coherence lengths near 50 Ä
(corresponding to about 10 atomic layers) . Since they do not have oxygen as a constituent,
diffusion of atoms near the surface or near interfaces between MTS materials and barriers in
multilayer structures may not be a problem for these MTS systems. The growth of thin films of
MgBZ with T, near 39 Kand with critical cmrent densities greater than 104 A/cm2 was reported at
the special MgB2 session an 12 March 2001 at the American Physical Society meeting held in
Seattle . Also the fabrication of "good" MgB2 films was attainable . Nevertheless, since the
properties of MgB2 outlined above resemble many of the desirable properties of the LTS
materials (niobium and niobium nitride), one can anticipate that acceptable Ms might be
fabricated using this material . lf this were to happen, digital circuits operating near 25 K should
be practical. (Note that the operatons of 77 digital circuits are stable only if they are operated attemperatures less than 2/3 of the transition temperature .) Cryogenic refrigeration systems required
for operation at temperatures near 25 Kare much less complex and less energy-
A good way to get a feel for comparisons of the refrigeration requirements to cool
superconductive digital circuits to temperatures near 4 K, 30 K, or 77 K is to prepare a plot of the
coefficient of Performance (COP) of cryocoolers [that is, input Power at ambient (rejection)temperature divided by the heat removed (in watts) at the cryogenic operating temperature] as a
function of operating temperature for various values of percent of Camot efficiency realized by
the given cryocooler (Fig. 1) .
SUMMARY
The above information has been presented to review the status of LTS, MTS, and HTS digitaltechnologies and, in addition, cryogenic refrigeration technology.
Atypical electronic instrument (such as a desktop computer or work station) typically consumes
of the order of one to several hundred watts of input Power, certainly not kilowatts of input
Power! The present generation of 1-watt cryocoolers operating near 4 or 10 K usually requires
several kilowatts of input Power, and this, l maintain, is not and would not be acceptable for mostelectronic applications.
298
Therefore the attraction of MTS and HTS digital circuits is the belief that cooling of digitalcircuits fabricated from these materials to temperatures near 30 K can be done with less thanseveral hundred watts of input electrical power, even with current-day technology, which mightbe acceptable to the customer . This is why the work an HTS and MTS digital circuit technologyis so important.
PART Il
In this part the effect of rare-earth ion size effect an resistively, susceptibility, andsuperconductivity ofRBa2Cu3_.Znx07_Y(R= Yb, Er, Y, Dy, Gd, Eu, Sm, and Nd)General Remarks
1-
Substitution with rare - earth elements an the Y site and with transition or sp elementsan the Cu site of the high- T, superconductor (HTSC) YBa2Cu307_y is an importantmethod for understanding the mechanism of superconductivity at high temperatures .
2-
Of special interest for clarifying the effect of impurities an the superconductivity andvarious characteristics of the HTSC is the substitution for copper by metals such as Ti,V, Cr, Mn, Fe, Co, Ni, Zn, Ga, and Al.(1-43)
3- The importance of the two copper sites in YBa2Cu307_Y, Cu (1) in the Cu-0 chains andCu (2) in the Cu02planes, for the superconductivity has been reported where;
i)
Most groups found that nominally trivalent elements [like Ga (1-3,7-19), Fe(1-5,8,10,21-27), Co(1-4,8,10,14-16,18,21-27, and Al(3,4,8,10)] substitute an Cu(1) sites and cause a moderate reduction in T, ,
ii) While nominally divalent dopants [like Zn (6,8,10,18,20-22and28) and Ni(1-4,8,10,11,14 and 19)] primarily occupy the Cu (2) sites and suppress T,drastically .
With considerable interest in the drastic suppression of TGnumerous studies an the substitutionfor Cu in YBa2Cu307_y, with nonmagnetic Zn having definite valence state 2+ and filled 3dlevels have been carried out. Some consistent results were obtained :(1) The solution limits is 9-10 %,(4-11,16,17,18,20,29)
(2) The orthorhombic structure is retained,(1-49)
(3) The oxygen content is little affected by 10% Zn doping (7-y-6 .9) (4,11-15,17), and(4) The rate of T� reduction is 8-15 K/%, the largest known to date .(1,8,19)For Pr-substituted 123 compounds [on the R sites], R, xPrXBa2Cu307_Y (R=Lu, Yb, Tm, Er, Ho,Y, Dy, Gd, Eu, Sm, and Nd, and 0<x51), it was established that (44-46);
299
1-
The superconducting transition temperature T, decreases monotonically with increasing
Pr concentration x, and,
2- At a constant Pr concentration, T, decreases approximately linearly with increasingradius ofthe R ions .
3- The magnetic ordering temperature TN of Pr ions was observed to decrease monotonically
with increasing Rconcentration (1 -x); and at a constant x, T'v is R ion size dependent.
These results were interpreted qualitatively in terms ofthe hybridization between the local states
ofthe Pr ion and the valence-band states of the Cu02 planes .Also, in the Ga-doped [on Cu (1) sites] for RBa2Cu3_,Ga,0 7_Y systems (where R=Yb, Er, Y, Dy,Gd, Eu, and Nd, at x=0.0, 0.05, 0.1, 0.15, 0.2, and 0.3), it is also found the normal state
resistivity p� , and the superconducting T, are dependent upon the rare- earth ion size . It was
suggested that a decrease in the density of states N (EF) or localization of carriers due to Gasubstitution are the possible mechanisms for suppression ofsuperconductivity (47,48) .
Since most groups observed that Zn substitutes [on the Cu (2) sites] in 123 systems it was veryinteresting to study the effect of Zn doping an the properties of different rare-earth 123
compounds. In this work a detailed investigation of the structural properties, resistivityp, dc
susceptibility X' and superconductivity of the Zn-substituted RBa2Cu3_,Znx07_Y systems (R=Yb,
Er, Y, Dy, Gd, Eu, Sm . and Nd) with 0<x<0.3 .
EXPERIMENT
RBa2Cu3_,Znx01.,, (R=Yb, Er, Y, Dy, Gd, Eu, Sm, and Nd) with 0:_x50.3 samples were preparedby solid-state reaction method, were :
1-Powders of R203 , BaC0 3 , Cu0, and Zn0 with a purity
99.99% were mixed in agatemortar, and ealcined at 915 °Cfor 24 h.
2- The resultant powders were reground and refired to improve the homogeneity .3-After a final careful grinding these powders were pressed with 4 kbar into 5x 30x1 _mm 3
rectangular bars.
4-These bars were sintered in oxygen flow at 925-930 °C (except R =Yb at 920 °C) for 72h followed by additional annealing at 680°C for 10 h and 400 °Cfor 10 h.
5-Finally these bars were fumace cooled in oxygen flow to room temperature over about10 h.
X-ray Powder diffraction (XRPD) studies at room temperature using CoKa radiation (Ä _1 .788970 A) were carried out for al 1 samples.
300

The normal-state resistivity und superconducting transition temperature Tc were measured by
standard four-probe technique Magnetization was measured using a quantum design
magnetometer at both zero-field cooling (ZFC) and Field cooling (FC) in a magnetic field of50e.
RESULTSAND DISCUSSION
XRPD patterns indicate that :
1- The compounds with 0<_x<_0.3 and R= Er, Y, Dy, Gd, Eu, Sm and Nd have a single-
phase orthorhombic perovskite like YBa2Cu307_y structure.
2-
While the samples with R = Yb and at x-0.1 have weak extra peaks corresponding to afew percent of foreign phase.
3- Detailed x-ray powder diffraction measurements Show that the structure remains
orthorhombie throughout the substitution range (OSx<_0.3).[ Table 1]
4-
5-
TAKLE 1. The lattice parameters a, b, und c of RBa,,Cu 3 -,Zn,0 7_,, (R=Y6, Er, Y, Dy, Gd, Eu, Sm, und Nd) et vatious Zuconcentration z . The Isst numbem of euch a, b, und c were estimated .
The lattice parameters a, b, and c are very close to those of undoped RBa2Cu3 0 7 _y
(R=Yb, Er, Y, Dy, Gd, Eu, Sm, und Nd).
The orthorhombicity (a-b)l(a+b) seems to be independent ofthe Zn concentration x inthe range 0-x-0.3 . This indicates that the oxygen vacancy order or the linear chainstructures of the Cu(1)-0 sites remains intact. Therefore it may be inferred that Zn
301
Rare earthLattice
parameters (Ä) 0 0 .01 0.02Zn Content z
0 .04 0.06 0 .08 0 .1 0.15
Yb a 3 .8766 3.8687 3 .8749 3 .8807 3 .8821 3.8787b 3 .8014 3.8009 3 .8032 3 .8084 3 .8054 3.8094c 11 .6460 11.6558 11 .6509 11 .6557 11 .6536 11 .6598
Er a 3 .8776 3.8787 3 .8758 3 .8757 3 .8799 3 .8763 3 .8767 3.8793b 3 .8094 3.8085 3 .8055 3 .8084 3 .8093 3 .8070 3 .8075 3.8084c 11 .6549 11 .6592 11 .6466 11 .6525 11 .6495 11 .6501 11 .6498 11 .6586
Y 3 .8860 3.8860 3 .8877 3 .8858 3.8860 3 .8861 3 .8859 3.8873b 3 .8176 3.8178 3.8198 3 .8172 3.8169 3 .8172 3 .8179 3.8182c 11 .6688 11 .6645 11 .6651 11 .6635 11 .6635 11 .6658 11 .6673 11 .6664
Dy a 3.8945 3.8891 3.8953 3 .8868 3.8865 3 .8848 3.8869 3.8867b 3.8362 3 .8258 3.8290 3 .8212 3.8227 3 .8215 3.8218 3 .8290c 11.6840 11 .6731 11 .6724 11 .6742 11 .6773 11 .6798 11.6756 11 .6994
Gd a 3.8979 3 .9056 3.9076 3 .9091 3.9076 3 .9073 3.9095 3 .90926 3.8384 3 .8422 3.8472 3 .8438 3.8452 3 .8467 3.8443 3 .8469c 11 .7026 11 .7028 11 .7156 11 .7168 11 .7218 11 .7219 11.7218 11 .7275
Eu a 3.8975 3 .8922 3.8983 3 .8990 3.8996 3 .9017 3.8962 3 .8999b 3.8395 3 .8345 3.8394 3 .8394 3.8401 3 .8427 3.8386 3 .8400c 11 .7090 11 .7137 11 .7179 11.7159 11 .7165 11 .7168 11.7174 11 .7186
Sm a 3.9028 3 .9046 3.9060 3 .9059 3.9066 3 .9034 3.9089 3 .9134b 3.8487 3 .8494 3 .848 3.8507 3 .8498 3 .8482 3.8534 3 .8558c 11 .7325 11 .7367 11 .7361 11 .7334 11 .7356 11 .7373 11.7372 11 .7354
Nd a 3 .9183 3 .9125 3 .9146 3.9166 3 .9105 3 .9147 3.9158 3 .91746 3 .8608 3 .8633 3 .8604 3.8624 3 .8602 3 .8566 3.8586 3 .8589c 11 .7725 11 .7741 11 .7735 11.7786 11 .7704 11.7884 11.7796 11 .7725
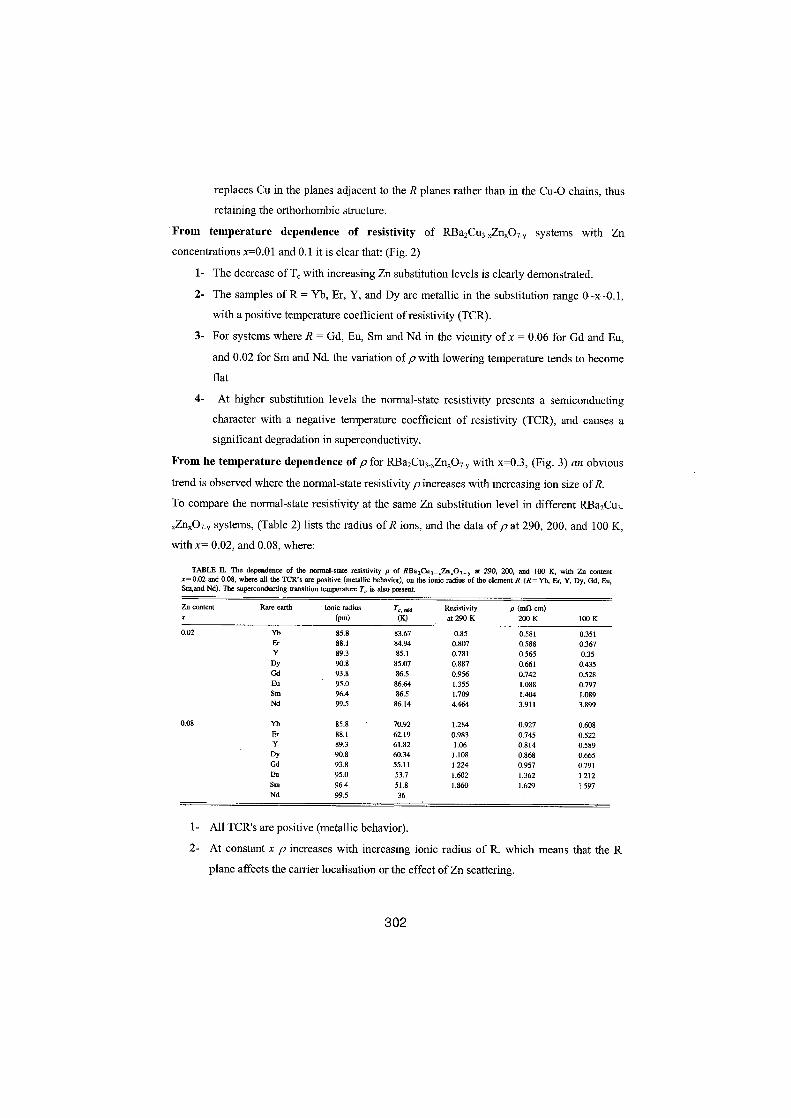
replaces Cu in the planes adjacent to the R planes rather than in the Cu-O chains, thusretaining the orthorhombic structure.
From temperature dependence of resistivity of RBa2Cu3-,Znx07 - y systems with Znconcentrations x=0.01 and 0.1 it is clear that : (Fig . 2)
1- The decrease of Te with increasing Zn substitution levels is clearly demonstrated.
2- The Samples ofR = Yb, Er, Y, and Dy are metallic in the Substitution range 0-x-0.1,with a positive temperature coefficient of resistivity (TCR).
3- For Systems where R = Gd, Eu, Sm andNd in the vicinity of x = 0.06 for Gd and Eu,and 0.02 for Sm and Nd, the variation of p with lowering temperature tends to becomeflat
4-
At higher substitution levels the normal-state resistivity presents a semiconductingcharacter with a negative temperature coefficient of resistivity (TCR), and causes asignificant degradation in superconductivity .
From he temperature dependence of pfor RBa2Cu3,Znx07- y with x=0.3, (Fig . 3) an obvioustrend is observed where the normal-state resistivity pincreases with increasing ion size ofR.To compare the normal-state resistivity at the same Zn substitution level in different RBa2Cu3 -.Znx07-y Systems, (Table 2) lists the radius ofR ions, and the data of p at 290, 200, and 100 K,with x= 0.02, and 0.08, where:
TABLE IL The dependence of the normal-state resistivity p of RBa 2Cu 3 -,Zn,07 -y at 290, 200, and 100 K, wich Zn contentx=0.02 and 0.08, where all the TCR's are positive (metallic behavior), an the ionic radius of the element R (R=Yb, Er, Y, Dy, Gd, Eu,Sm,and Nd) . The superconducdng transition tempemmre T, is also present.
1-
All TCR's are positive (metallic behavior) .
2-
At constant x pincreases with increasing ionic radius of R, which means that the Rplane affects the carrier localisation or the effect ofZn scattering .
302
Zn contentx
Rare earth Ionic radius(pm)
T~.~(K)
Resistivityat 290 K
p (.!l cm)200 K 100 K
0 .02 Yb 85.8 83 .67 0.85 0.581 0 .351Er 88.1 84 .94 0 .807 0.588 0.367Y 89.3 85.1 0 .781 0.565 0 .35Dy 90.8 85 .07 0 .887 0.661 0.435Gd 93 .8 86.5 0 .956 0.742 0.528Eu 95.0 86 .64 1 .355 1 .088 0.797Sm 96.4 86.5 1.709 1 .404 1 .089Nd 99.5 86 .14 4.464 3.911 3.899
0 .08 Yb 85 .8 70.92 1.284 0 .927 0.608Er 88 .1 62.19 0.983 0 .745 0.522Y 89 .3 61 .82 1 .06 0 .814 0.589Dy 90 .8 60.34 1 .108 0 .868 0.665Gd 93 .8 55.11 1 .224 0.957 0 .791Eu 95 .0 53.7 1 .602 1 .362 1 .212Sm 96 .4 51 .8 1 .860 .1 .629 1 .597Nd 99 .5 36
3-
For x=0.3 and R=Dy, Gd, Eu, Sm, and Nd, and for x = 0.2, R = Sm and Nd, thesamples were not superconducting down to 4.2K, and showed only a semiconductorlike character.
4-
At low temperatures the results can be interpreted in terms of Mott variable range
hopping law (VRH), and follow a universal behavior, p(T)=,p, exp(T/To)- '14 (49) .
Near room temperature p can be fitted by an exponential function of 1/T, p(T) =p3 exp (E3/kT),indicating that at high temperatures (-290 K) contribution to conductivity comes from nearest-neighbor hopping (NNH) (50) .
The supereonducting transition width AT, , which is taken as the difference between T, mid andT, zero (the temperature at which the resistivity drops to zero),where :
1-
Increases with increasing Zn concentration for each R, and also with increasing ionicradius ofthe rare-earth element when the Zn concentration is kept constant.
2-
Thevalues ofthe critical concentrationX�required to suppress T, to zero are estimatedto be around 0.21, 0.19, 0.17, and 0.11 for R=Gd, Eu, Sm, and Nd, respectively .
3- The rate of charge of resistivity with x remarkably increases at the criticalconcentration X� indicating that semiconductor like behavior accompanies thedestruction ofthe superconductingphase.
4-
These results indicate that variations of the Zn concentration influence the electronicstates ofthe materials: the density of states, or the mobility of the charge carriers .
The de susceptibility per mol X as a function of temperature for DyBa2Cu3.,Znx07_y samples(as an example for all systems discussed above) with x=0, 0.02, 0.04, 0.06, 0.08, and 0.1, atboth zero-field cooling (ZFC) and field cooling (FC) (Figs . 5 and 6) Shows:
1-
The transition temperatures Teetag evaluated are well consistent with Tamid deduced fromresistivity measurements .
2-
Doping with Zn not only suppresses T� but also reduces the fractions of diamagneticshielding, indicating the reduction in the fraction of supereonducting materials or phaseseparation in samples wich higher Zn content in spite of the fact that XRDmeasurements showed Single-phase structures in these samples.
3-
The dc susceptibility per mol ,X versus temperature of RBa2CUZ.gZno.107_y at ZFC forR=Yb, Er, Dy, EU, Sm, and Nd, demonstrates that at a constant Zn concentration x=0.1either Tc.mag or the fraction of magnetic shielding of the RBa2Cuz .9 Zn o.107_Y samples ischanged by varying the rare-earth elementR.
4- The samples with larger R ion radius have lower T, and a small fraction ofsupereonducting phase.
A plot of T,.mid and To mag versus ionic radius of the rare- earth elements R in RBa2Cu3_,Znx07 _Y
(R=Yb, Er, Y, Dy, Gd, Eu, Sm, and Nd) (Fig . 7) Shows.
303
1- A closely linear relationship between T, and the radius of R ions at low concentrations ofZn can be observed .
2- .With rising Zn substitution (x>0 .06), the suppression of T, is apparently enhanced byincreasing the ionic radius ofthe rare-earth elements R.
The effect of ion size an T, for Zn-doped systems shown are similar to the observations in Pr-doped R,_,Pr,Ba2Cu307_y (R=Lu, Yb, Tm, Er, Ho, Y, Dy, Gd, Eu, Sm, and Nd(44-46) and in Ga-substituted RBa2Cu3_,Ga,07_Y (R=Yb, Er, Y, Dy, Ga, Eu, and Nd) systems (47,48) . However, Prsubstitutes an R sites and the concentration ofR is changed by introducing Pr, whereas Ga andZn is replaced an the Cu(1) and Cu(2) sites, respectively, and the copper content is reduced byGa- and Zn doping . For a specific RBCO system with different Pr-, Ga, er Zn doping, the ratesof T, suppression dT Idx and the critical impurity concentration X� are different, implyingdifferent mechanisms for the degradation ofsuperconductivity by various impurities .Suppression of superconductivity by Zn doping has been intensively discussed. Severalsuspected mechanisms for T, suppression can be ruled out here :
(1)
There is no correlation between T, and orthorhombic to tetragonal (0-T) transition,since orthorhombic structure is retained in 10% Zn-replaced RBCO systems.
(2)
Because the oxygen stoichiometry remains nearly unchanged in 10% Zn-doped (11-13) and 16% Zn-doped GdBCO systems (42), the reduction of T, is not caused byoxygen deficiency.
(3)
Due to the nonmagnetic nature ofZn ions the reduction of T, by the magnetic momentof the dopant observed in Pr-doped systems is unlikely. It is estimated that a moment-carrier exchange Jeff= 20 meV, which is more than an order ofmagnitude too Small toaccount for the suppression of T, in Zn-doped YBCO via Abrikosov-Gorkov pairbreaking . They suggested an alternative explanation of pair breaking by strengpotential scattering from the Zn impurity sites that require d-wave pairing(29)
The results of T, depression due to Zn substitution can possibly be ascribed to :
1- The effect of disorder or a reduction in the carrier concentration. The magneticpenetration depth ?,(T) measurements carried out an Zn-doped YBCO films (51) and anmagnetically aligned powders Show that Zn doping has a particularly streng increase in
9~(0), implying that disorder results in decreasing superconducting density of states .
2-
The Substitution of Zn 2+ (having a closed shell 3d") for Cu possibly reduces the Cu3d-hole or slightly changes the state of hybridization between Cu 3d and O 2p, thusdecreasing the density of states at Fenni energy N(EF). Since Zn ions are in the samevalence state as Cu 2 +, Zn will not alter the charge balance within the Cu02 plane, butwould severely disorder and disturb the alignment of Cu(3d,2-,2) and O(2pd orbitals,
304

which would result in carrier localization in the Cu02 planes . The localization effectarising from Zn substitution can then account for the metal-semiconductor transitionand thus the destruction of superconductivity .
The ion size effect was established for Pr-doped (on Y sites) systems, and also found for Ga-doped [on the Cu(1) sites in Cu-O chains] systems.In the prevent work we find that this R ionic size effect also exists in Zn-doped [on the Cu(2)sites in
Cu-02 planes] RBa2Cu3_,Znx07_Y systems. Although the mechanism of the rare-earth ionsize effect an T, and p by Zn doping is not well understood yet, we propose a possibleinterpretation in terms ofMott's spin- bipolaron model (31-48) .
Mott (31,52) supposes that in the copper oxidep-type superconductors the carriers (0 2p holes)form bipolarons (bosons) above and below T, . The spin an an oxygen hole is locked antiparallto one ofthe Cu 3d9 spins. Two ofthese polarons form a bipolaron (boson) ofzero moment witha binding energy of -0 .3 eV . The motion ofbipolarons is diffusive, activated by spin flip . In thesuperconducting state the holes form a degenerate gas of bosons, interacting but not stronglyoverlapping as do the BCS pairs. At T_> T, the Bose gas becomes nondegenerate (above T, thecurrent is carried by a nondegenerate gas ofbosons). The bosons are in an impurity band, so thatboson states up to a limiting energy E, are Anderson localized. On account of the strongrepulsion between the bosons, Mott proposes that not more than one boson can be in a givenstate, even above the mobility edge . The energy up to which states are singly occupied,behaving like a Ferrni energy, is named EB (or pseudo- Fermi-energy EF). IfER lies in the rangeof localized states, the material cannot be a superconductor, and the bosons can- not move . Onlyif EBlies above E, will a superconductor form. If states are still localized, the conduction shouldbe due to variable range hopping. This model was used to interpret experimental observationsan copper oxide superconductors: the constant value ofspecific heat over temperature, C�IT, thesmall entropy at superconducting transition (much smaller than Nkln2), the linear dependence ofresistivity an temperature (above T� oocT), the Hall effect, the thermopower, the observedFermi surface, and so on .
For Zn-doped YBCO, Mott supposes that the effect of zinc, which produces disorder in theplanes, is to prevent pairing and to render the polarons immobile (Anderson localization). Thepresence of zinc will result in an increase in the mobility edge E� moving it up eventually toEB, destroying the superconductivity .
In this case for an insulating compound RBa2Cu 3_xZnx0,y� where x is large enough to suppressT, to zero, the pseudo-Fermi-energy EB is lower than E, A transition of the Anderson type ofmetallic behavior should occur when EB crosses the mobility edge as the content of zinc isreduced. As x<xci the bosons above the mobility edge produce the superconductivity . The rareearth ion size effect an T, of RBa2Cu3_,Znx0-/_Y observed in this work could then be ascribed to
305

the ion size effect an E, and/or Es at constant x. This means that for the same amount of zincreplacing copper, the range of localized states is affected by the R plane. An increase in theionic size of R will move the mobility edge E, upwards and/or will lower EB in RBa2Cu3_,Zn x07_y systems.
Conelusion
Systematically studies for the effect of Zn doping an the resistivityp, de susceptibility,-, andsuperconducting T, ofRBa2Cu3_,Zn,07y systems (R=Yb, Er, Y, Dy, Gd, Eu, Sm, and Nd, and0<x<_0 .3), found that :
1-
Znatoms substitute more likely an the Cu(2) sites,2- Zn doping in these systems causes a rapid nearly linear deerease in T, as Zn content
increases, and
3- The reduction of T, for RBa 2Cu 3_,Znx02,, depends an the ionic radius of the rare-earthelement R . The suppression of supereonductivity by zinc and the rare-earth. Ion size effectan T, in these systems is interpreted in terms ofa Mott spin bipolaron model.
REFERENCES
1- G. Xiae, M. Z. Cieplak, A. Garvrin, F. H. Streitz A. Bakhshai andC. L. Chien, Phys . Rev.Lett . 60, 1446, (1988) ; G. Xiao et al ., Nature 332, 238 (1988) ; Phys . Rev. B35, 8782 (1987) .
2- Y. Maeno, T. Tomita, M. Kyogoku, S. Awaji, Y. Aoki, K.Hoshino, A. Minami, and T.FuJita, Nature 328, 512 (1987) .
3- Youwen Xu,R. L. Sabatini, A. R. Moodenbaugh, and M. Suenaga, Phys . Rev. B 39,7084(1988) 38, Y. Xu et al, ibid. 39, 6667(1989) ; Physica C 169, 205 (1990)
4- J. M. Tarascon, P. Barboux, P. F. Miceli, L. H- Greene, G. W. Hull, M. Eibschutz, and S. A.
Sunshine, Phys . Rev. B 37, 7458(1988) ; J . M. Tarascon et al ., ibid . 36, 8393 (1987) ; P.F. Miceli etal .,ibid . 37,5932(1988)
5- M. Mehbod, W. Biberacher . A. G. M. Jansen, P. Wyder, R. Dellour, and P. H. Duvigneaud,Phys . Rev. B 38 . 11 813 (1988) ; M.Mehbod et al ., ibid . 36, 8819 (1987))6- Maeda, A. Koizumi, N. Bamba, E. Takayama-Muromachi, F. Izumi, H. Asano, K. Shimizu,
H. Moriwaku, H. Maruyama, Y. Kuroda, and H. Yamazaki, Physica C 157,483 (1989) .7- W. Shafer, T. Penney, B. L. Olson, R. L. Greene, andR. H. Koch, Phys . Rev. B 39,2914
(1989)) .
8- J. Kistenmacher, Phys . Rev. B 38, 8862 (1988)
306
9- H. Alloul, T. Ohno,H. Casalta, J. F. Marucco, P. Mendels, J. Arabski, G. Collin, andM.Mehbod, Physica C, 419(1990)171 ; (P . Mendels, H. Alloul, J. F. Marucco, J. Arabski, andG. Collin, ibid . 171, 429 (1990(
10-R . Dupree,A. Gencten, and D. McK.Paul, Physica C 193, 81 (1992) ; A. Gencten, R. Dupree,and D. McK.Paul, ibid . 216, 491 (199) .
11-R Liang, T. Nakamura,H. Kawaji, M. Itoh, and T. Nakamura, Physica C 170, 307 (1990)12- S. Jee, D. Nichols, A. Kebede, S. Rahman, J. E. Crow, A. M. Ponte Goncalves, T.
Mihalisin, G. H. Meyer, l. Perez, R. E. Salomon, P. Schlottmann, S. H. Bloom, M. V.Kuric, Y. S. Yao, andR. P. Guertin, J. Supercond. 1, 63 (1988)
13- C. L.-Gledel, J.-F. Marucco, B. Touzelin, R. Gabilly, A.P . Philippot, andH. Alloul, PhysicaC 172, 304 (1990)
14-Y . Shimakawa, Y. Kubo, K. Utsumi,Y. Takeda, andM. Takano, Jpn. J . Appl . Phys . 27,L107l(1988)
15- T.Kajitani, K. Kusaba,M. Kikuchi, Y. Syono, and M. Hirabay shi, Jpn. J . Appl . Phys . 27,L354(1988)
16- E Takayama-Muromachi, Y. Uchida, and K. Kato, Jpn. J. Appl . Phys . 26, L2087 (1987)17- K. Westerholt, H. J. Wüller, H. Bach, and P. Stauche, Phys . Rev. B 39, 1168(1989)18- B. Roughani, L. C. Sengupta, J. L. Aubel, S. Sundaram, andW. C. H. Joiner, PhysicaC
171, 77 (1990)
19- B. Jayaram, S. K. Agarwal, C. V. Narasimha Rao, and A. V. Narlikar, Phys. Rev. B 38,2903(1988)
20- G. Balakrishnan, L. W. J. Caves, R. Dupree, D. McK. Paul, and T. Smith, Physica C 161, 9(1989)
21- Y. Yang, A. R. Moodenbaugh, Y. L. Wang, Y. W. Xu, S. M. Heald, D. 0. Welch, M.Suenaga, D. A. Fischer, and J. E. Pen nerhahn, Phys . Rev. B 42, 2231 (1990)
22-H.Yamagata, K. Indana, andM. Matsumura, PhysicaC 185-189,1101(1991)
23- L. G-Munoz, X. Obradors, S. H. Kilcoyne, and R. Cywinski, Physica C 185-189,1085(1991)
24- Roth et al ., Physica C 162-164, 518 (1989)25-A . Lanckbeen, C. Legros, J. F. Marucco, and R. Deltour, Physica
C 221, 53 (1994)
26-Pan Wei and Zheng Qing Qi, Physica C 183, 32 (1991)27-R. S. Howland et al ., Phys . Rev. B 39, 9017 (1989)28- Zhang, K. W. Yip, andC. K. Ong, PhysicaC234, 99 (1994)
307
29-R. E. Walstedt,R. F. Bell, L. F. Schneemeyer, J. V. Waszczak,W. W. Warren, Jr ., R.Dupree, and A. Gencten, Phys . Rev. B48, 10 646 (1993)
30- I.W. Loram, K. A. Mirza, andP. F. Freeman, PhysicaC 171, 243 (1990)31-N.F . Mott, Physica C 196, 369 (1992)32- Y. Nakazawa, J. Takeya, andM. Ishikawa, Physica C 174, 155 (1991)
33-J . T. Kim, T. R. Lemberger, S. R. Foltyn, andX. D. Wu, Phys . Rev. B 49,15 970 (1994)34- T. R. Chien, Z. Z. Wang, andN. P. Ong, Phys . Rev. Lett . 67,2088 (1991)35- V. Radhakrishnan et al ., Phys . Rev. B40, 6850 (1989)36- M. Aifronte et al ., Solid State Commun. 70, 951 (1989)37- A. I . Akimenko, G. Goll,H.v . Löhneysen, and V. A. Gudimenko, Physica C 213, 399
(1993)
38- H. Harashina et al ., Physica C 212, 142 (1993)39- P. Stropel, C. Paulsen, and J. L. Tholence, Solid State Connnun.
65,585(1988) .
40- S.A. Hodges et al ., Physica C 218, 272 (1993)41-A. Porch et al ., PhysicaC214, 350 (1993)
42-H. Shimizu, T. Kiyama, and J. Arai, Physica C 196, 329 (1992)43- S. S. Ata-Allah, Yunhui Xu, and Ch. Heiden, PhysicaC221, 39 (1994)44- Yunhui Xu and Weiyan Guan, Phys . Rev. B 45, 3176 (1992) ; Solid State Commun . 8, 105
(1991) ; Physica C 183, 105 (1991) ; Appl . Phys . LeU. 59, 2183 (1991); Phys. Lett . A163,104(1992) PhysicaC 199, 430 (1992)
45-W Y. Guan, Y. C. Chen, J. Y. T. Wei, Y. H. Xu, and M. K. Wu, PhysicaC 209,19 (1993)46-W. Y. Guan, Y. H. Xu, S. R. Sheen, Y. C. Chen, J. Y. T. Wei, H. F. Lai, M. K. Wu, and J.
C. Ho, Phys . Rev. B 49,15 993 (1994(47- Yunhui . Xu and Weiyan Guan, PhysicaC 212, 119 (1993)
48- Yunhui Xu, Weiyan Guan, Y. F. Chen, S. R. Sheen, andM. K. Wu, Phys . Rev. B 50,1223(1994)
49-NT. Mott, J. Non-Cryst. Solids 1, 1 (1968) ; N. F. Mott andE. A. Davis, ElectronicProcesses in Noncrystalline Materials, 2nd ed . (Clarendon, Oxford, 1979)
50- B.I. Shklovskii andA. L. Efros, Electronic Properties ofDoped Semiconductors, SpringerSeries in Solid-State Sciences Vol. 45 (Springer-Verlag, Berlin, 1984), pp . 26-30 and 76 .
51-E . R. Ulm, J. T. Kim, T. R. Lemberger, S . R. Foltyn, andX. Wu, Phys . Rev. B 51, 9193(1995)
52-N. F. Mott, Adv. Phys . 39, 55 (1990), Philos . Mag. Lett. 62, 37 (1990); 63, 319 (1991) ,64,211(1991), 64, 411(1991).
308
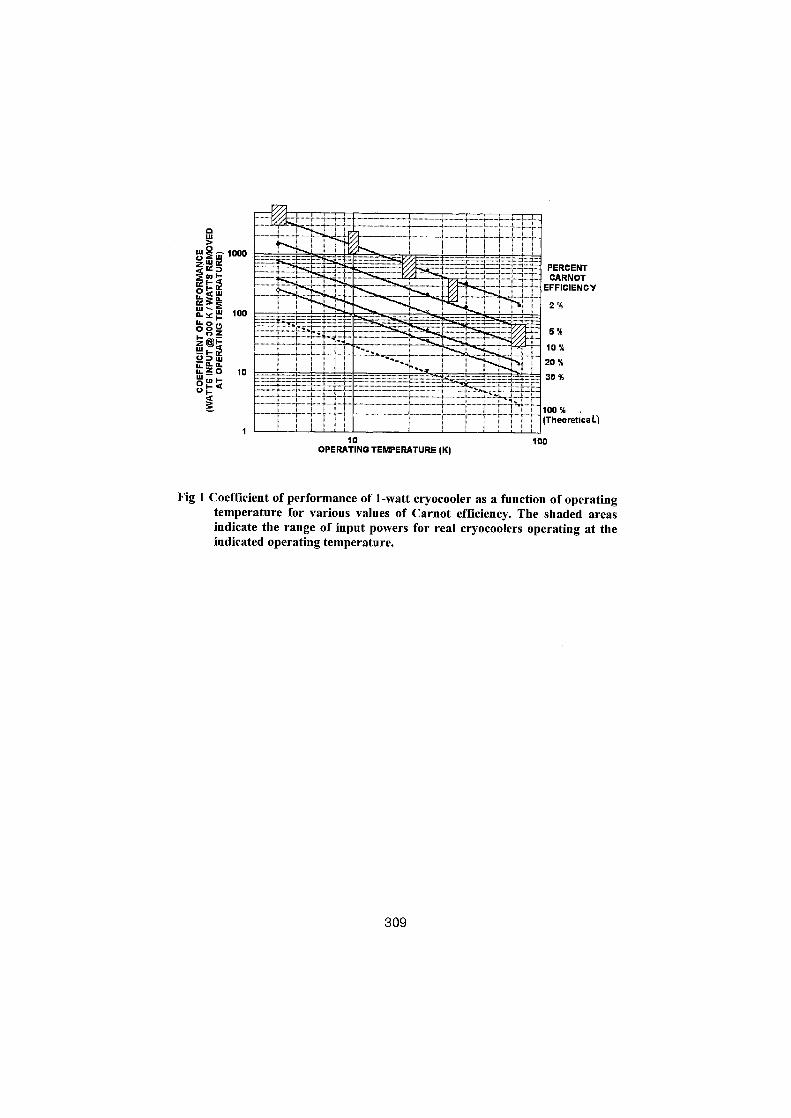
0w73 w 1000 .
zceD
a* äas' 3w~aYFLL o OOc2 2w_ @955wa?O0
100
10 _._ . . . . ......_.
10
100OPERATING TEMPERATURE (K)
Fig 1 Coefficient of performance of 1-watt cryocooler as a function of operatingtemperature for various values of Carnot efficiency. The shaded areasindicate the range of input powers for real cryocoolers operating at theindicated operating temperature.
PERCENTCARNOT
EFFICIENCY
2%
5%
10%
20%30%
100%(TheoreticaL)
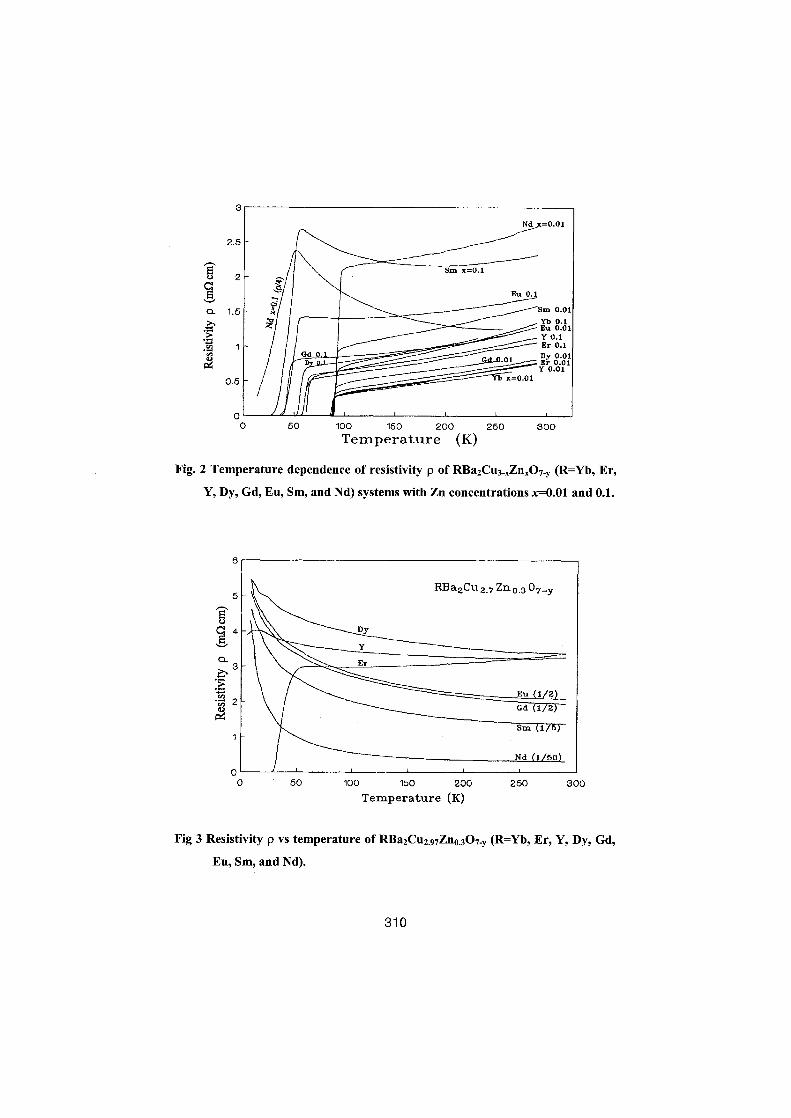
Fig. 2 Temperature dependence of resistivity p of RBa2Cu 3_XZn.0 7_3, (R=Yb, Er,
Y, Dy, Gd, Eu, Sm, and Nd) systems with Zn concentrations X0.01 and 0.1 .
Temperature (K)
Eu, Sm, andNd).
Fig 3 Resistivity p vs Tmperature of RBa2Cu2 ,y7Zna .307_y (R=Yb, Er, Y, Dy, Gd,
31 0

Ion radius (pm)
Fig 4 The transition width 4 T� vs the ionic radius of rare-earth element R at
various Zn content x for RBa2Cu z,97Zn o .307_y (R=Yb, Er, Y, Dy, Gd, Eu,
Sm, and Nd).
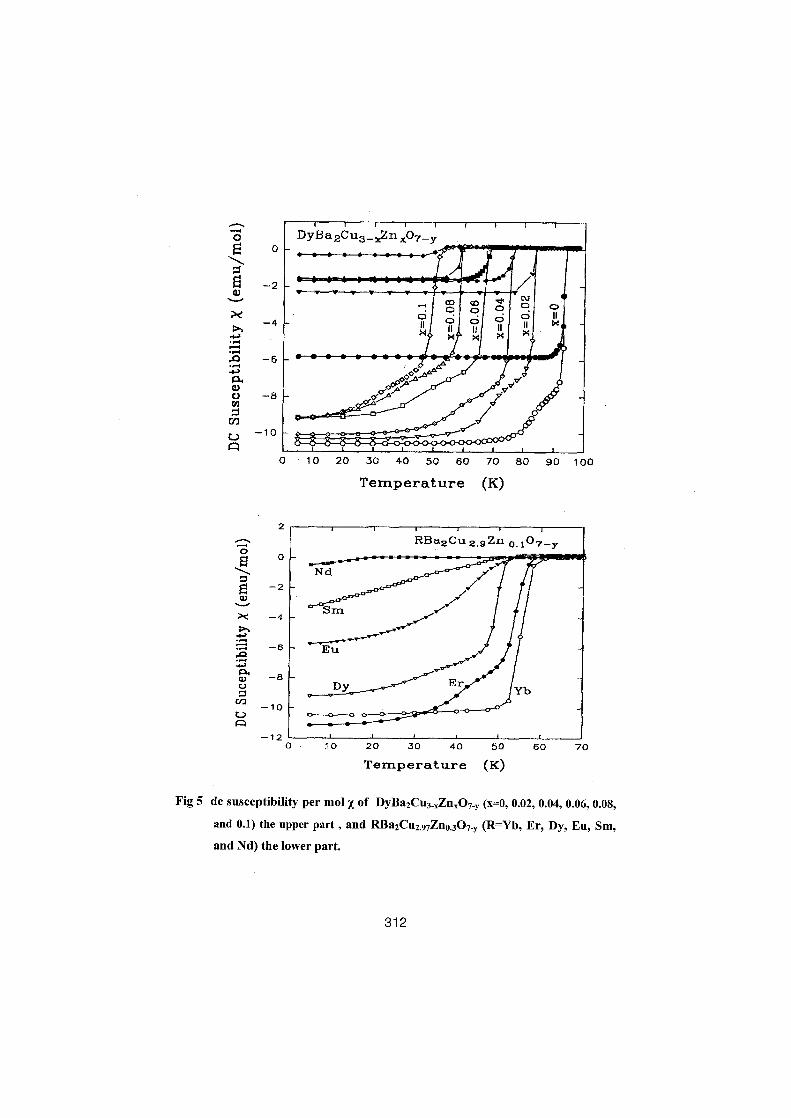
0
Q
ö
Temperature (K)
Temperature (K)
Fig 5 de suseeptibility per mol x of DyBa2Cu3_XZHX07 _Y (x=0, 0.02, 0.04, 0.06, 0.08,
and 0.1) the upper part , and RBa2CUZ,y7Zn 0. 307 _ y (R=Yb, Er, Dy, Eu, Sm,
and Nd) the lower part .
31 2
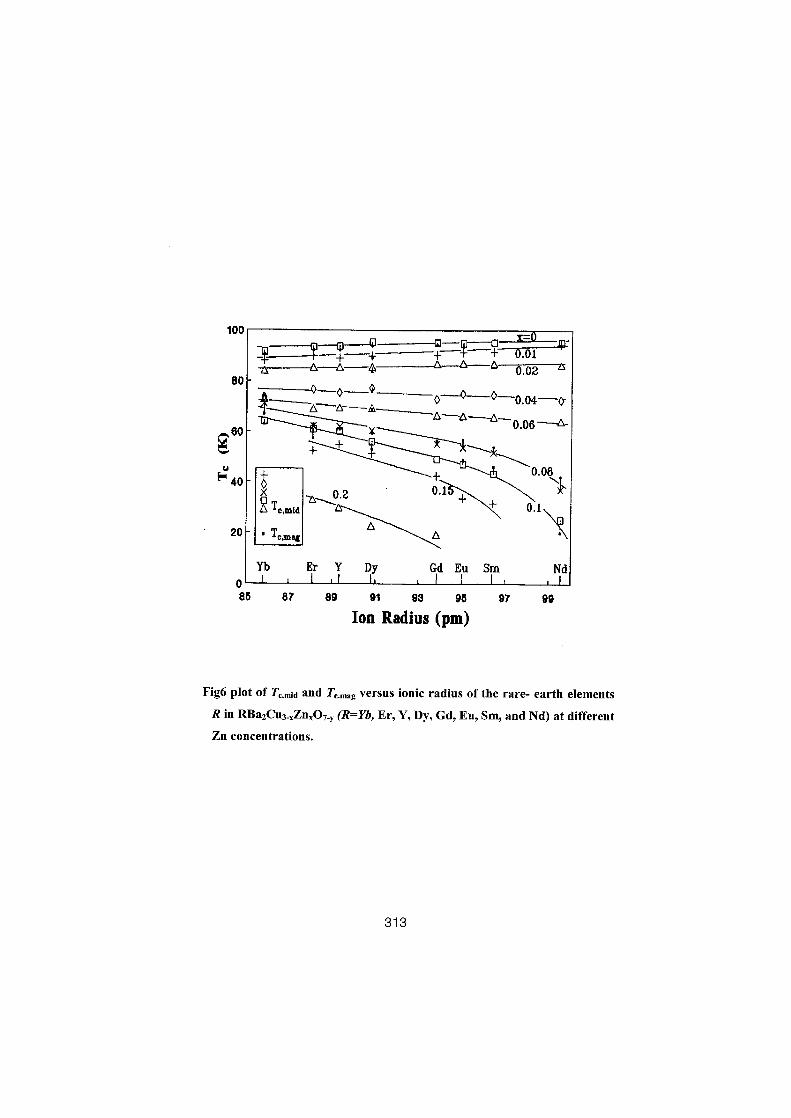
Fig6 plot of T,.m;d and T, ..ag versus ionic radius of the rare- earth elementsR in RBa2Cu3_XZn �07_y(R=Yb, Er, Y, Dy, Gd, Eu, Sm, and Nd) at differentZn concentrations.
31 3

314
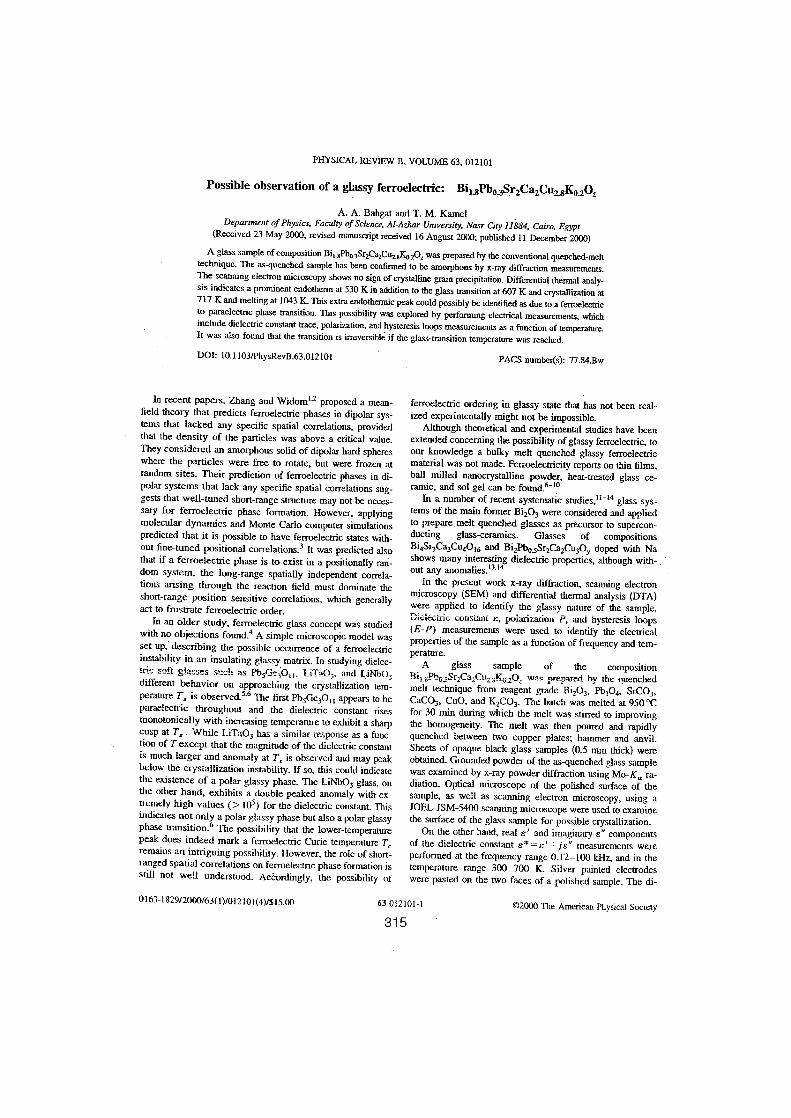
PHYSICAL REVIEW B, VOLUME 63, 012101
Possible observation of a glassy ferroelectric:
Bil gPbo3Sr2Ca2CUZ8Ka.20z
A. A. Bahgat and T. M. KamelDepartment of Physics, Faculty of Science, AI-Azhar University Nasr City 11884, Cairo, Egypt
(Received 23 May 2000; revised manuscript received 16 August 2000 ; published 11 December 2000)A glass sample of composition Bit_xPbo.3Sr2Ca2CuZSKo_ 20, was prepared by the conventional quenched-melttechnique. The as-quenched Sample has been confimred to be amorphous by x-ray diffraction measurements.The Scanning electron microscopy Shows no sign of crystalline grain precipitation. Differential thermal analy-sis indicates a prominent endotherm at 530 K in addition to the glass transition at 607 K and crystallization at717 K und melting at 1043 K This extra endothennic peak could possibly he identified as due toa ferroelectricto paraelectric phase transition. This possibility was explored by perfonning eleetrical measurements, whichinclude dielectric constant trace, polarization, and hysteresis loops measurements as a function of temperature.It was also found that the transition is irreversible if the glass-uamition temperature was reached.
DOI: 10 .1103/PhysRevB.63 .012101
PACS number(s) : 77 .84.Bw
In recent papers, Zhang and Widomt2 proposed a mean-field theory that predicts ferroelectric phases in dipolar Sys-tems that lacked any specific spatial correlations, providedthat the density of the parfcles was above a critical value.They considered an amorphous solid ofdipolar hard sphereswhere the particles were free to rotate, but were frozen atrandorn sites. Their prediction of ferroelectric phases in di-polar Systems that lack any specific spatial correlations sug-gests that well-tuned short-range structure may not be neces-sary for ferroelectric phase fonnation. However, applyingmolecular dynamics und Monte Carlo Computer simulationspredicted that it is possible to have ferroelectric states with-out fine-tuned positional correlationS3 It was predicted alsothat if a ferroelectric phase is to exist in a positionally ran-dom System, the Jong-range spatially independent correla-tions arising through the reaction field must dominate theshort-range position sensitive correlations, which generallyact to frustrate ferroelectric order.
In an older study, ferroelectric glass concept was studiedwich no objections found. 4 A simple rnicroscopic model wasSet up, describing the possible occurrence of a ferroelectricinstability in an insulating glassy matrix. In studying dielec-t ic soft glasses s "_ch as Pb5Ge30 t l , LiTa03 , and LiNb03different behavior an approaching the crystallization tem-perature Tx is observed .5-6 Tlte first Pb5Ge 30 1t appears to beparaelectric throughout and the dietectric constant risesmonotonically wich increasing temperature to exhibit a sharpcusp at Ts . While LiTa03 has a sintilar response as a func-tion of Texcept that the magnitude of the dielectric constantis much ]arger und anomaly at T, is observed and may peakbelow the crystallization instability. If so, this could indicatethe existence of a polar glassy phase. The LiNb0 3 glass, anthe other hand, exhibits a double peaked anomaly with ex-tremely high values (> 105 ) for the dielectric constant. Thisindicates not only apolarglassy phase bot also apolar glassyPhase transition. 6 The possibility that the lower-temperaturepeak does indeed mark a ferroelectric Curie temperature T,remains an intriguing possibility . However, the role of short-ranged spatial correlations an ferroelectric phase Formation isstill not well understood . Accordingly, the possibility of
0163-1 82912000/63(1)1012101(4)/$15 .00 63012101-1
31 5
ferroelectric ordering in glassy state that has not been real-ized experimentally might not be impossible .
Although theoretical and experimental studies have beenextended conceming the possibility of glassy ferroelectric, toour knowledge a bulky melt quenched glassy ferroelectricmaterial was not made. Ferroelectricity reports an thin films,ball milled nanocrystalline powder, heat-treated glass ce-ramic, and sol gel can be found.6-10
In a number of recent systematic studies, tt-t4 glass Sys-tems of the main former Bi z03 were considered and appliedto prepare melt quenched glasses as precursor to supercon-ducting glass-ceramics . Glasses of compositionsBi4Sr3Ca3Cu 40 t6 and Bi2Pbo_5Sr2Ca2CU30Y doped wich NaShows many interesting dielectric properties, although wich- _ "out any anomalies. t3,t4
In the present work x-ray diffraction, scanning electronmiemscopy (SEM) and differential thermal analysis (DTA)were applied to identify the glassy nature of the sample.Dielectnc constant E, poiarization P, and hysteresis loops(E-P) measurements were used to identify the electricalproperties of the sample as a function of frequency and tem-perature.A glass sample of the composition
Btt . aPb o~Sr2C22Cu2.sK ü.20, wa_c prepared hy the quenchedmelt technique from reagent grade B'203, Pb304, SFC03,CaC03 , Cu0, and K2C03. The batch was melted at 950'Cfor 30 min during which the melt was stirred to improvingthe homogeneity. The melt was then poured and rapidlyquenched between two copper plates; hammer and anvil.Sheets of opaque black glass samples (0.5 mm thick) wereobtained_ Grounded powder of the as-quenched glass samplewas examined by x-ray powder diffraction using Mo-K, ra-diation. Optieal microscope of die polished surface of thesample, as well as Scanning electron microscopy, using aJOEL-JSM-5400 Scanning nticroscope were used to examinethe surface of the glass sample for possible crystallization .
On the other hand, real E' and imaginary E" componentsof the dielectric constant E*=e'+jE" measurements - wereperformed at the frequency range 0.12-100 kHz, and in thetemperature range 300-700 K. Silver painted electrodeswere pasted an the two faces of a polished Sample. The di-
©2000 The American Physical Society
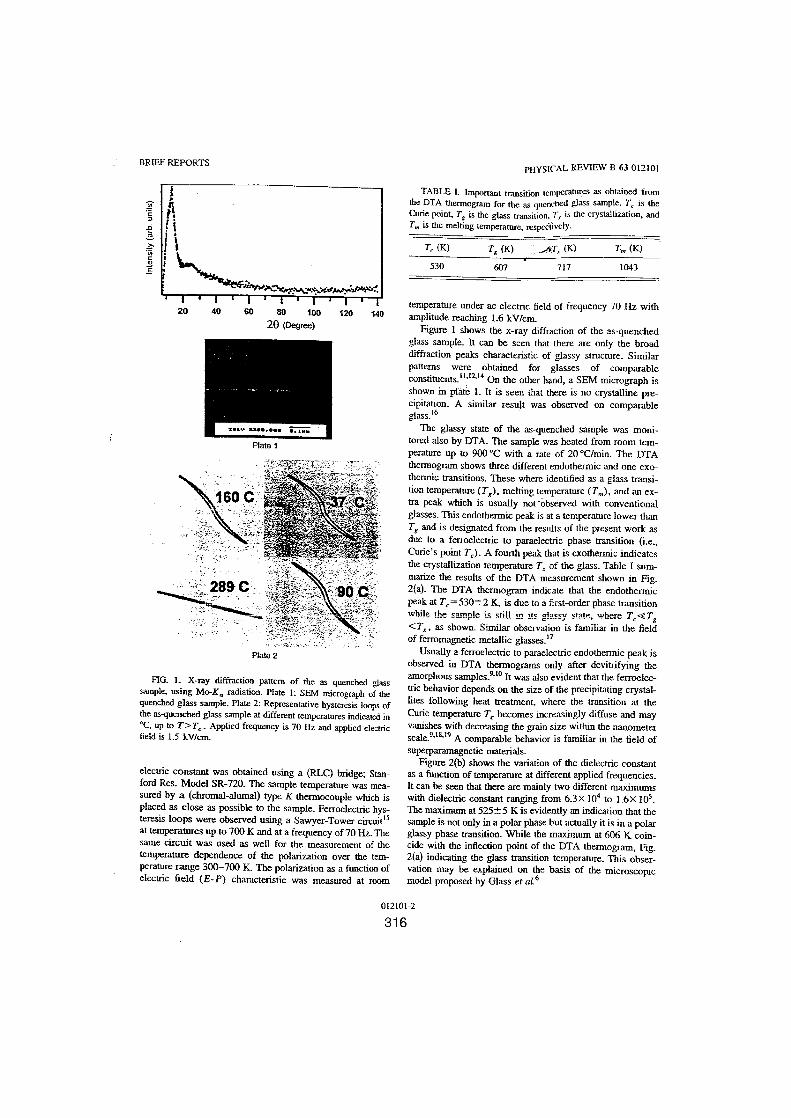
BRIEF REPORTS
20 (Degree)
!p. .... . . .. ".-Plate 1
Plate 2
FIG . 1- X-ray diffraction pattem of the as quenched glasssample, using Mo-K. radiation . Plate l : SEM micrograph of thequenched glass sample. Plate 2: Representative hysteresis loops ofthe as-quenched glass sample at different temperatures indicated in°C, up to T>T, . Applied frequency is 70 1Iz and applied electricfield is 1 .5 kV/cm
electric constant was obtained using a (RLC) bridge ; Stan-ford Res. Model SR-720 . The Sample temperature was mea-sured by a (chromal-alumal) type K thermocouple which isplaced as close as possible to the Sample . Ferroelectric hys-teresis loops were observed using a Sawyer-Tower circuittsat temperatures up to 700 K and at a frequency of70 Hz. Thesame circuit was used as well for the measurement of thetemperature dependence of the polarization over the tem-perature range 300-700 K. The polarization as a function ofelectric field (E-P) characteristic was measured at room
012101-2
31 6
PHYSICAL REVIEW B 63 012101
TABLE 1 . Important transition iemperatures as obtained fromthe DTA thennogram for the as quenched glass sample . T, is theCurie point, Tg is the Blass transition . 7?, is the crystallization, andT� is the melting temperature, respeciively.
T, (K)
Ta (K)
_T,- (K)
Tm (K)530 607 717 1043
temperature under ac electric field of frequency 70 Hz withamplitude reaching 1 .6 kV/cm.
Figure 1 Shows the x-ray diffraction of the as-quenchedglass sample. It can be Seen that there are only the broaddiffraction peaks characteristic of glassy structure . Similarpatterns were obtained for Blasses of comparableconstituents.tt.t2. t 4 Ort the other hand, a SEM micrograph isshown in Diate 1 . lt is seen that there is no crystalline pre-cipitation . A sinrilar result was observed an comparableglass. tb
The glassy state of the as-quenched sample was moni-tored also by DTA. The Sample was heated from room tem-perature up to 900'C wich a rate of 20 °C/min. The DTAthennogram Shows there different endothermic and one exo-thermic transitions. These where identified as a glass transi-tion temperature (T.), melting temperature (T.), and an ex-tra peak which is usually not -observed wich conventionalBlasses. This endothermic peak is at a temperature lower thanT8 and is designated from the results of die present work asdue to a ferroelectric to paraelectric phase transition (i.e .,Curie's point T,) . A fourth peak that is exothermic indicatesdie crystallization temperature T of the Blass. Table I sum-marize the results of the DTA measurement shown in Fig.2(a) . The DTA thermogamm indicate that the endothernticpeak at Tc=530 -12 K, is due to a first-order phase transitionwhere the, S=mple is ¢fL -n its ola_ss,- state, where TCT<T� as shown. Similar observation is familiar in the fieldof ferromagnetic metallic glasses . t7
Usually a ferroelectric to paraelectric endothermic peak isobserved in DTA thermograms only after devitrifying theamorphous samples9-t° It was also evident that the ferroelec-tric behavior depends an the size of the precipitating crystal-Etes following heat treatment, where the transition at theCurie temperature T, becomes increasingly diffuse and mayvanishes wich decreasing the grain size within the nanometerscale."ts,t9 A comparable behavior is familiar in the field ofsuperparamagnetic materials .
Figure 2(b) Shows the variation of the dielectric constantas a function of temperature at different applied frequencies .It can be Seen that there are mainly two different maximumswith dielectrie constant ranging from 6.3X 10⁴ to i .6X 105 .The maximum at 525i- 5 K is evidently an indication that thesample is not only in a polar phasebut actually it is in a polarglassy phase transition . While the maximum at 606 K coin-cide with the inflection point of the DTA thennogram, Fig.2(a) indicating the Blass transition temperature. This obser-vation may be explained an the basis of the rnicroscopicmodel proposed by Glass et a1.6
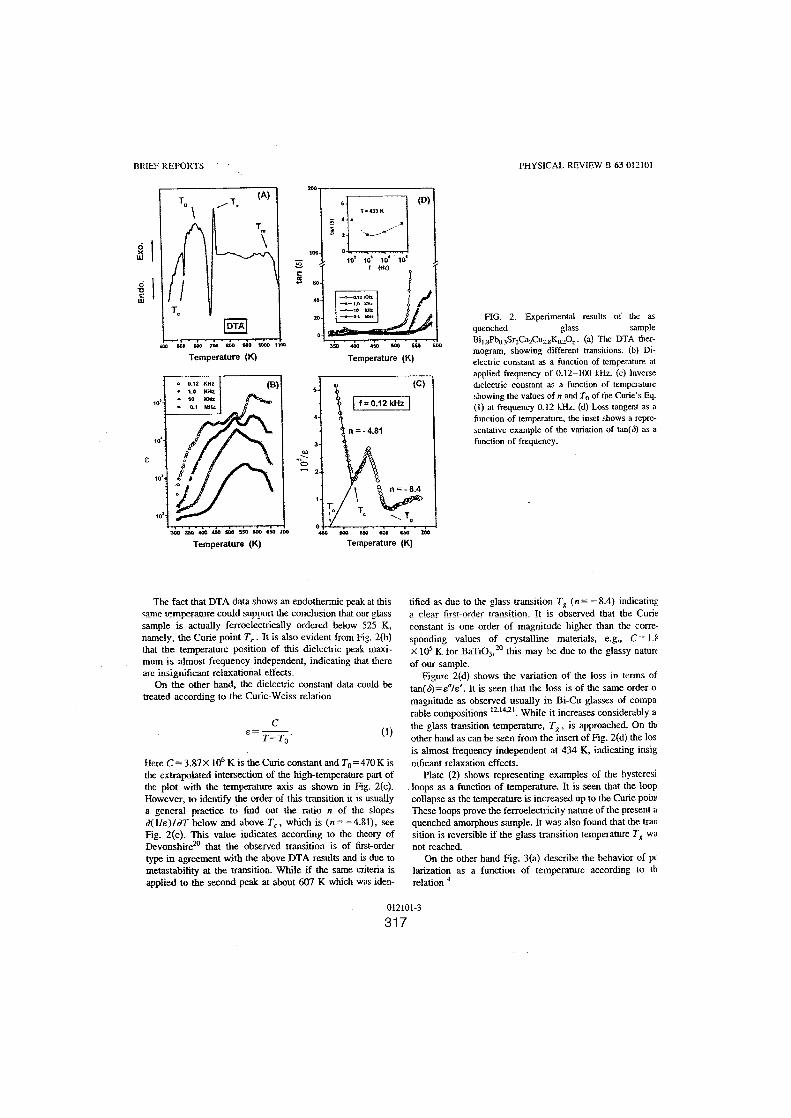
BRIEF REPORTS
0w
O
W
s
DTA
wo mo sm rm am «o töoo timTemperature (K)
Temperature (K)Zoo sm 4m uo roo sw am ew ioo
Ce°
The fact thatDTAdata Shows an endothermic peak at thisSame temperature Gould suoport the conclusion that our Blasssample is actually ferroelectrically ordered below 525 K,namely, the Curie point T, It is also evident from Fig. 2(b)that the temperature position of this dielectric peak maxi-mum is almost frequency independent, indicating that thereare insignificant relaxational effects-
On the other hand, the dielectric constant data Gould betreated according to the Curie-Weiss relation
Here C=3.87x 10⁶ K is the Curie constant and To=470K isthe extrapolated intersection of the high-temperature part ofthe plot with the temperature axis as shown in Fig. 2(c).However, to identify the order of this transition it is usuallya general practice to find out the ratio n of the slopesd(Ile)laT below and above T., which is (n=-4.81), SeeFig. 2(c) . This value indicates according to the theory ofDevonshire2u that the observed transition is of firnt-ordertype in agreement wich die above DTA results and is due tometastability at the transition . While if the same criteria isapplied to the second peak at about 607 K which was iden-
012101-3
31 7
PHYSICAL REVIEW B 63 012 101
FIG. 2. Experimental results of the asquenched glass SampleBi, .8Pbu .3Sr_Ca_Cu,. sYu20, . (a) The DTA ther-mogram, showing different transitions. (b) Di-electric constant as a function of temperature atapplied frequency of 0.12-100 kHz. (c) Inversedielectric constant as a function of temperatureshowing the values of n and To of the Curie's Eq .(1) at frequency 0.12 kHz. (d) Loss tangent as afunction of temperature, the inset Shows a repre-sentative example of the variation of tan(b) as afunction of frequency.
i7--To
.
tified as due to the Blass transition Tg (n=-8.4) indicatinga elear firnt-order trransition, It is observed that the Curieconstant is one order of magnitude higher than the corre-sponding values of crystalline materials, e.g., C- LFX 105 K for BäTi03, 20 this may be due to the glassy natureof our Sample.
Figure 2(d) Shows the variation of the Ions in tetms oftan(b)=lt is Seen that the loss is of the saure order o;magnitude as observed usually in Bi-Cu Blasses of comparable compositions 12 .1421. While it increases considerably a~the Blass transition temperature, TR , is approached . On th4other hand as can be Seen from the innert of Fig. 2(d) the losis almost frequency independent at 434 K, indicating insignificant relaxation effects-
Plate (2) Shows representing examples of the hysteresiloops as a function of temperature. lt is seen that the loopcollapse as the temperature is increasedup to the Curie poinThese loops prove the ferroelectricity nature ofthe presentaquenched amorphous sample . It was also found that the tragsition is reversible if the glass transition temperature Tg wanot reached-
On the other hand Fig. 3(a) describe the behavior of pclarization as a function of temperature according to threlation
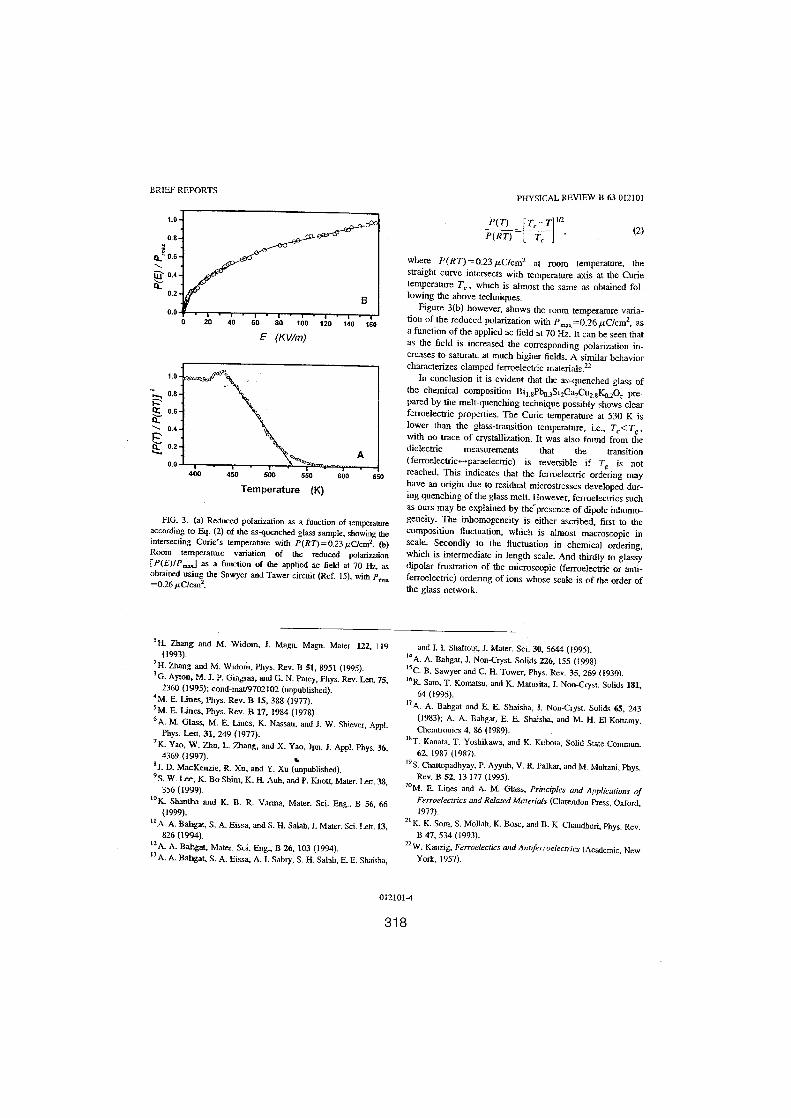
BRIEF REPORTS
t
20 40 60
E (KVlm)
Temperature (K)
- r-160
FIG. 3 . (a) Reduced polarization as a function of temperatureaccording to Eq. (2) of the as-quenched glass sample, showing theintersecting Curie's temperature wich P(RT)=0.23 /uC/cm2 . (b)Room tempeature variation of the reduced polatization[P(E)IP_] as a function of the applied ac field at 70 Hz, asobtained using the Sawyer and Tawer circuit (Ref. 15), wich P_=0.26 fcC/cm 2.
'H. Zhang and M. Widom, J . Magn. Magn . Mater. 122, 119(1993) .
2H. Zhang and M . Widom, Phys . Rev- B 51, 8951 (1995) .3G. Ar-On, M . J. P . Girogras, and G . N. Patey, Phys. Rev. Lett. 75,
2360 (1995) ; cond-mat/9702102 (unpublished) .4M. E. Lines, Phys. Rev. B 15, 388 (1977).6M. E. Lines, Phys. Rev. B 17, 1984 (1978)-6A. M . Glass, M. E. Lines, K. Nassau, and J. W . Shiever, Apgl.
Phys. Lett. 31, 249 (1977) .7K. Yao, W. Zhu, L. Zhang, and X. Yao, Jpn . J. Appl . Phys. 36,4369 (1997) .
s J . D. MacKenzie, R. Xu, and Y . Xu (unpublished).9 S. W. Lee, K. BoShim, K. H. Auh, and P. Knott, Mater. Len . 38,
356 (1999) .t "K. Shantha and IC B . R. Varma, Mater. Sei . Eng ., B 56, 66
(1999) .t t A. A. Bahgat, S . A. Eissa, and S . H. Salah, J . Mater. Sci . Lett.13,
826 (1994).t2 A_ A. Bahgat, Mater. Sci. Eng., B 26,103 (1994) .t3 A. A. Bahgat, S. A. Eissa, A.1 . Sabry, S . H . Salah, E. E. Shaisha,
012101-4
31 8
PHYSICAL REVIEW B 63 012101
I'(T) _ T,-T lrz
(2)
P(RT) -[
Tr ,
'
where P(RT)=0.23gC/cm2 at room temperature, thestraight curve intersects with temperature axis at the Curietemperature T_ which is almost the Same as obtained fol-lowing the above techniques .
Figure 3(b) however, shows the room temperature varia-tion of the reduced polarization wich Pmu=0.26 /zC/cm 2, asa function of the applied ac field at 70 Hz . It can be seen thatas the field is increased the corresponding polarization in-creases to saturate at much higher fields . A similar behaviorcharacterizes clamped ferroelectric materials .22
In conclusion it is evident that the as-quenched glass ofthe chemical composition Bit .8Pb0_3Sr2Ca=Cu2 _S Ka_Z0- pre-pared by the meit-quenching technique possibly shows clearferroelectrie properties. The Curie temperature at 530 K islower than the Blass-transition temperature, i .e ., T<<T8 ,with no trace of crystallization . It was also found from thedielectric measurements that the transition(ferroelectric-paraelectric) is reversible if TR is notreached. This indicates that the ferroelectric ordering mayhave an origin due to residual microstresses developed dur-ing quenching of the glass melt . However, ferroelectrics suchas ours may be explained by the presence of dipole inhomo-geneity . The inhomogeneity is either ascribed, first to thecomposition fluctuation, which is almost macroscopic inscale. Secondly to the fluctuation in chemical ordering,which is intermediate in length scale . And thirdly to glassydipolar frustration of the microscopic (ferroelectric or anti-ferroelectric) ordering of ions whose scale is of the order ofthe Blass network.
and 1. I . Shaltout, J. Mater. Sei . 30, 5644 (1995)."A. A . Bahgat, J . Non-Cryst. Solids 226,155 (1998) .tSC . B . Sawyer and C. H. Tower, Phys . Rev_ 35, 269 (1930).t6R . Sato, T. Komatsu, and K. Matusita, J. Non-Cryst . Solids 181,
64 (1995) ."A. A. Bahgat and E. E. Shaisha, J . Non-Cryst. Solids 65, 243
(1983) ; A. A . Bahgat, E . E. Shaisha, and M . H . EI-Kottamy,Chemtronics 4. 86 (1989) .
is T_ Kanata, T . Yoshikawa, and K. Kubota, Solid State Commun.62, 1987 (19871.
i9S. Chattopadhyay, P. Ayyub, V . R. Palkar, and M . Multani, Phys.Rev. B 52, 13 177 (1995) .
20M. E . Lines and A. M. Glass, Principles and Applications ofFerroetectrics and Relared Materials (Clarendon Press, Oxford,1977).
2t K . K. Som, S. Mollah, K. Bose, and B. K . Chaudhuri, Phys. Rev.B 47, 534 (1993).
22W.Kanzig, Ferroelectics and Anriferroelectries (Aeademic, New
York, 1957).
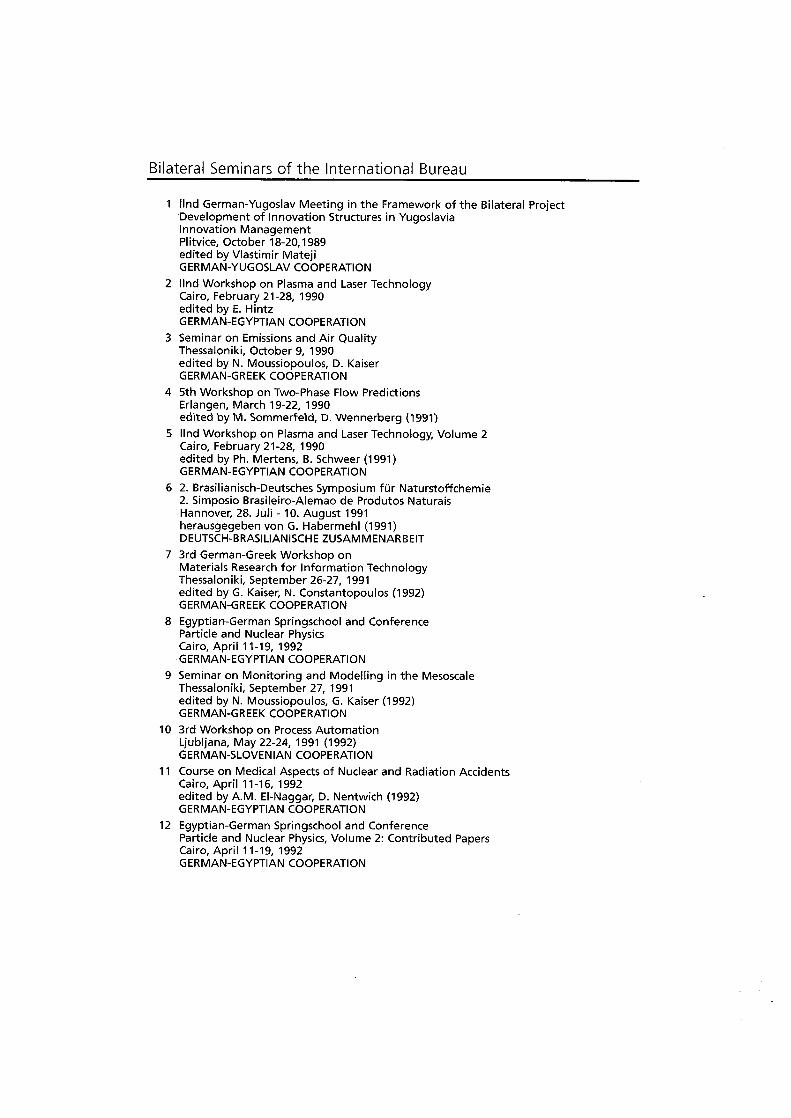
Bilateral Seminars of the International Bureau
1
Ilnd German-Yugoslav Meeting in the Framework of the Bilateral ProjectDevelopment of Innovation Structures in YugoslaviaInnovation ManagementPlitvice, October 18-20,1989edited by Vlastimir MatejiGERMAN-YUGOSLAV COOPERATION
2 Ilnd Workshop an Plasma and Laser TechnologyCairo, February 21-28, 1990edited by E . HintzGERMAN-EGYPTIAN COOPERATION
3 Seminar an Emissions and Air QualityThessaloniki, October 9, 1990edited by N . Moussiopoulos, D . KaiserGERMAN-GREEK COOPERATION
4 5th Workshop an Two-Phase Flow PredictionsErlangen, March 19-22, 1990edited by M. Sommerfeld, D. Wennerberg (1991)
5 Ilnd Workshop an Plasma and Laser Technology, Volume 2Cairo, February 21-28, 1990edited by Ph . Mertens, B . Schweer (1991)GERMAN-EGYPTIAN COOPERATION
6 z . Brasilianisch-Deutsches Symposium für Naturstoffchemie2 . Simposio Brasileiro-Alemao de Produtos NaturaisHannover, 28 . Juli - 10 . August 1991herausgegeben von G . Habermehl (1991)DEUTSCH-BRASILIANISCHE ZUSAMMENARBEIT
7 3rd German-Greek Workshop anMaterials Research for Information TechnologyThessaloniki, September 26-27, 1991edited by G . Kaiser, N . Constantopoulos (1992)GERMAN-GREEK COOPERATION
8 Egyptian-German Springschool and ConferenceParticle and Nuclear PhysicsCairo, April 11-19, 1992GERMAN-EGYPTIAN COOPERATION
9 Seminar an Monitoring and Modelling in the MesoscaleThessaloniki, September 27, 1991edited by N . Moussiopoulos, G . Kaiser (1992)GERMAN-GREEK COOPERATION
10 3rd Workshop an Process AutomationLjubljana, May 22-24, 1991 (1992)GERMAN-SLOVENIAN COOPERATION
11
Course an Medical Aspects of Nuclear and Radiation AccidentsCairo, April 11-16, 1992edited by A.M . EI-Naggar, D . Nentwich (1992)GERMAN-EGYPTIAN COOPERATION
12 Egyptian-German Springschool and ConferenceParticle and Nuclear Physics, Volume 2 : Contributed PapersCairo, April 11-19, 1992GERMAN-EGYPTIAN COOPERATION

Bilateral Seminars of the International Bureau
13 Indo-German Workshop anHigh Pressure Technology-EngineeringPune, January 3-4, 1992edited by R.V. Chaudhari, H . Hofmann (1993)GERMAN-INDIAN COOPERATION
14 6th Workshop an Two-Phase Flow PredictionsErlangen, March 30 - April 2,1992edited by M. Sommerfeld (1993)
15 3rd Workshop an Plasma and Laser PhysicsIsmailia, October 3-7,1993edited by Ph . Mertens (1994)GERMAN-EGYPTIAN COOPERATION
16 Utilization of the Low Active Waste IncineratorFacility (LAWI) for Research and Development WorkCairo, December 11-12, 1993 (1994)GERMAN-EGYPTIAN COOPERAMON
17 8th SIMCER International Symposium an CeramicsBiomaterials - Special Meeting of the Project EUREKA 294Rimini, November 10-12, 1992edited by I . Stamenkovi, J . Krawczynski (1994)GERMAN COOPERATION with the University "Sv. Kiril i Metodij", Skopje
18 Conceptual Approaches to the Support of IndustrialResearch and Development in SloveniaLjubljana, November 10, 1993edited by M. Komac, J . Krawczynski (1994)GERMAN-SLOVENIAN COOPERATION
19 German-Egyptian Seminar an Environmental ResearchCairo, March 21-23, 1994edited by H .F. Aly, D . Nentwich (1994)GERMAN-EGYPTIAN COOPERATION
20 Ist Slovene-German Seminar an Joint Projects in Materials Science and TechnolgyPortoro, Oct. 2-4, 1994edited by D. Kolar, D . Suvorov (1995)GERMAN-SLOVENIAN COOPERATION
21 Conceptual approaches for an industry-related promotion of researchand development in CroatiaWorkshop Proceedings, Zagreb June 28-29, 1994edited by S . Lange, J.Svarc (1995)GERMAN-CROATIAN COOPERATION
22 German-Egyptian Seminar an Science Policy and ManagementCairo, April 8-9, 1995edited by A. A. EI Sayed, D . Nentwich (1995)GERMAN-EGYPTIAN COOPERATION
23 Indo-German Workshop anAntiinflammatory Drugs from Natural SourcesJammu Tawi, 10-11th April 1995edited by H.T.P. Ammon, R.5 . Kapil (1995)GERMAN-INDIAN COOPERA7I0N
24 German - West Sumatra Seminar anR & D Management and its Role for Industrial DevelopmentBukittinggi, West Sumatra, Indonesia, November 28-30, 1994edited by D . Nentwich (1996)GERMAN-INDONESIAN COOPERATION
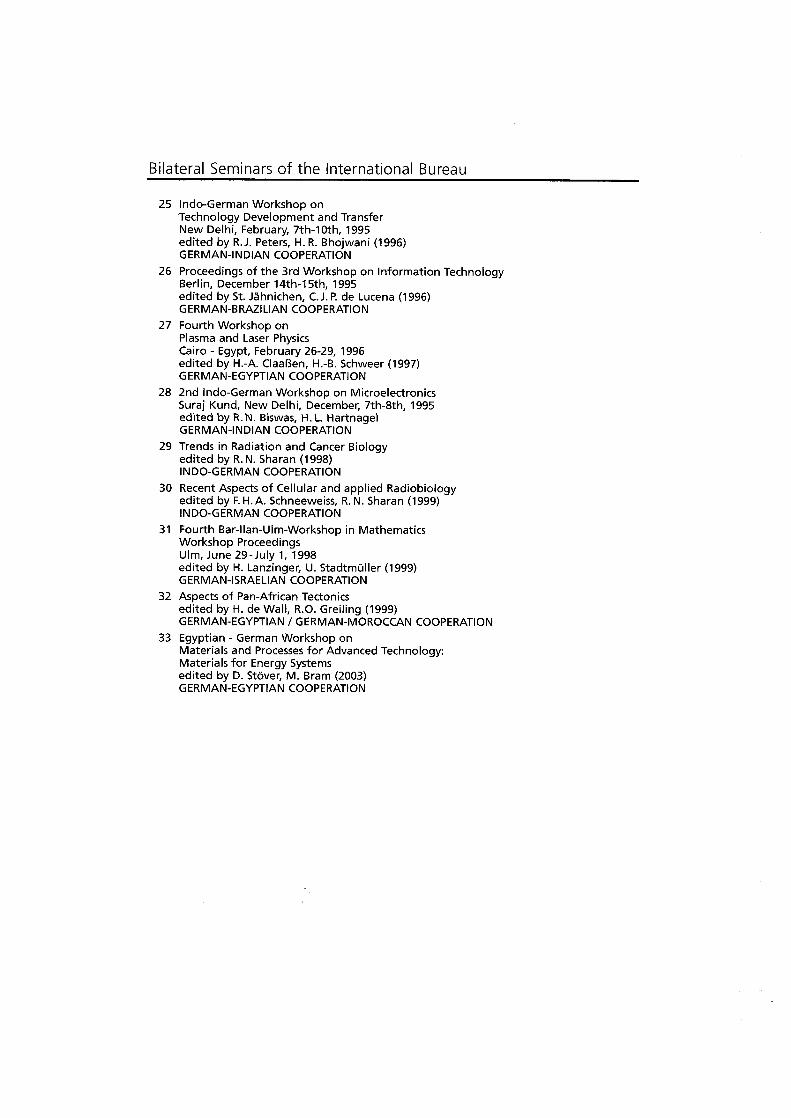
Bilateral Seminars of the International Bureau
25 Indo-German Workshop anTechnology Development and TransferNew Delhi, February, 7th-10th, 1995edited by R. J . Peters, H . R . Bhojwani (1996)GERMAN-INDIAN COOPERATION
26 Proceedings of the 3rd Workshop an Information TechnologyBerlin, December 14th-15th, 1995edited by St . Jähnichen, C . J . P de Lucena (1996)GERMAN-BRAZILIAN COOPERATION
27 Fourth Workshop anPlasma and Laser PhysicsCairo - Egypt, February 26-29, 1996edited by H.-A. Claaßen, H.-B . Schweer (1997)GERMAN-EGYPTIAN COOPERATION
28 2nd Indo-German Workshop an MicroelectronicsSuraj Kund, New Delhi, December, 7th-8th, 1995edited by R . N . Biswas, H . L. HartnagelGERMAN-INDIAN COOPERATION
29 Trends in Radiation and Cancer Biologyedited by R . N . Sharan (1998)INDO-GERMAN COOPERATION
30 Recent Aspects of Cellular and applied Radiobiologyedited by F. H . A . Schneeweiss, R . N . Sharan (1999)INDO-GERMAN COOPERATION
31 Fourth Bar-Ilan-Ulm-Workshop in MathematicsWorkshop ProceedingsUlm, June 29-July 1, 1998edited by H . Lanzinger, U . Stadtmüller (1999)GERMAN-ISRAELIAN COOPERATION
32 Aspects of Pan-African Tectonicsedited by H . de Wall, R.O . Greiling (1999)GERMAN-EGYPTIAN / GERMAN-MOROCCAN COOPERATION
33 Egyptian - German Workshop anMaterials and Processes for Advanced Technology :Materials for Energy Systemsedited by D . Stöver, M . Bram (2003)GERMAN-EGYPTIAN COOPERATION


previously published in this series
Joint German-Indonesian Seminar anR&D Activities using the MPR-30Jakarta, August 19-21,1985GERMAN-INDONESIAN COOPERATIONISBN 3-89336-011-5
Joint German-Indonesian Seminar anPublic Acceptance, Waste-Management,and Nuclear SafetyJakarta, October 7-9,1986GERMAN-INDONESIAN COOPERATIONISBN 3-89336-012-3
Vlllth German-Yugoslav Meeting anMaterials Science and DevelopmentCeramics and Metalsedited by Drago Kolar, Marija Kosec andJohanna KrawczynskiBrdo pri Kranju, May 18-21,1987GERMAN-YUGOSLAV COOPERATIONISBN 3-89336-001-8
Proceedings of the Fourth Workshop anTwo-Phase Flow Predictionsedited by M. Sommerfeld and H . ZeiselErlangen, October 21-23,1987GERMAN-YUGOSLAV COOPERATIONISBN 3-89336-002-6
Und Workshop an Process AutomationDarmstadt, November 2-6, 1987GERMAN-YUGOSLAV COOPERATIONISBN 3-89336-003-4
Ist German-Yugoslav Meeting in theFramework of the Bilateral ProjectDevelopment of Innovation Structures inYugoslaviaedited by G. Bräunling and V. MatejiInnovation Consultancy CentersPlitvice, September 5-7,1988GERMAN-YUGOSLAV COOPERATIONISBN 3-89336-024-7
Proceedings of the 8th Winter School anProteinases and their Inhibitors :Recent Developmentsedited by E . Auerswald, H . Fritz andV. TurkTiers, March 8-12, 1980GERMAN-YUGOSLAV COOPERATIONISBN 3-89336-020-4
Second German-Greek Workshop anMaterials Research for InformationTechnologyedited by G . Kaiser and H . WenzelJülich, May 22-23,1989GERMAN-GREEK COOPERATIONISBN 3-89336-018-2
Seminar Fertigungsplanung und -steuerungzusammengestellt vonBurghild Wienecke-Toutaoui,Rolf AlbrechtSplit, 7 . und B . Juni 1989GERMAN-YUGOSLAV COOPERATIONISBN 3-89336-025-5
IXth German-Yugoslav Meeting anMaterials Science and DevelopmentEmerging Materials by AdvancedProcessingedited by Wolfgang A. Kaysser,Jutta Weber-BockHirsau/Stuttgart, April 16-19, 1989GERMAN-YUGOSLAV COOPERATIONISBN 3-89336-026-3

Forschungszentrum Jülich(r~ der Helmholf~ Gr_mein~ch~lf