Artificial Neural Networks for the Diagnosis and Prediction of Desert Dust Transport Episodes
20
K. Gopalakrishnan et al. (Eds.): Soft Comput. in Green & Renew. Ener. Sys., STUDFUZZ 269, pp. 285–304. springerlink.com © Springer-Verlag Berlin Heidelberg 2011 Artificial Neural Networks for the Diagnosis and Prediction of Desert Dust Transport Episodes Silas Michaelides 1 , Filippos Tymvios 1 , Dimitris Paronis 2 , and Adrianos Retalis 3 1 Meteorological Service, Nicosia, Cyprus {smichaelides,ftymvios}@ms.moa.gov.cy 2 Institute for Space Applications & Remote Sensing, National Observatory of Athens, Greece [email protected] 3 Institute for Environmental Research & Sustainable Development, National Observatory of Athens, Greece [email protected] Abstract. Artificial Neural Networks (ANN) are widely used as diagnostic and predictive tools in atmospheric sciences. This Chapter presents how such practical applications of ANN can be employed in the study of various aspects of a quite complex atmospheric phenomenon as the atmospheric pollution by particulate matter, due to dust transport episodes. It is also discussed how ANN can be uti- lized in assembling a useful predictive tool for such events. The diagnosis and prediction of dust episodes is very important for human welfare: indeed, some severe health issues are related to the presence of particulate matter in the atmos- phere. Also, several human operations are affected by widespread dust presence: indeed, transportation and the increasing use of renewable energy systems utiliz- ing solar radiation are profoundly affected. 1 Introduction The occurrence of high level concentrations of dust originating from deserts is quite common even at locations quite distant from the source region. The mechan- isms for lifting the particulates within the source region, the conditions leading to their suspension in the atmospheric air, their transportation to great distances and the eventual deposition (either dry or wet) on the ground comprise a highly com- plex phenomenon, enticing mankind as it affects several activities (e.g., safety of air-transportation, efficiency of solar energy systems, etc), as well as human health (e.g., population prone to respiratory disorders, eye inflammations, etc). Increased levels of fine dust particles in the air are also linked to other health hazards such as heart disease and lung cancer. In this respect, Lave and Seskin [1973] have made a pioneering work in illustrating the association between mortality rates and air pollution.
Transcript of Artificial Neural Networks for the Diagnosis and Prediction of Desert Dust Transport Episodes

K. Gopalakrishnan et al. (Eds.): Soft Comput. in Green & Renew. Ener. Sys., STUDFUZZ 269, pp. 285–304. springerlink.com © Springer-Verlag Berlin Heidelberg 2011
Artificial Neural Networks for the Diagnosis and Prediction of Desert Dust Transport Episodes
Silas Michaelides1, Filippos Tymvios1, Dimitris Paronis2, and Adrianos Retalis3
1 Meteorological Service, Nicosia, Cyprus {smichaelides,ftymvios}@ms.moa.gov.cy
2 Institute for Space Applications & Remote Sensing, National Observatory of Athens, Greece [email protected]
3 Institute for Environmental Research & Sustainable Development, National Observatory of Athens, Greece [email protected]
Abstract. Artificial Neural Networks (ANN) are widely used as diagnostic and predictive tools in atmospheric sciences. This Chapter presents how such practical applications of ANN can be employed in the study of various aspects of a quite complex atmospheric phenomenon as the atmospheric pollution by particulate matter, due to dust transport episodes. It is also discussed how ANN can be uti-lized in assembling a useful predictive tool for such events. The diagnosis and prediction of dust episodes is very important for human welfare: indeed, some severe health issues are related to the presence of particulate matter in the atmos-phere. Also, several human operations are affected by widespread dust presence: indeed, transportation and the increasing use of renewable energy systems utiliz-ing solar radiation are profoundly affected.
1 Introduction
The occurrence of high level concentrations of dust originating from deserts is quite common even at locations quite distant from the source region. The mechan-isms for lifting the particulates within the source region, the conditions leading to their suspension in the atmospheric air, their transportation to great distances and the eventual deposition (either dry or wet) on the ground comprise a highly com-plex phenomenon, enticing mankind as it affects several activities (e.g., safety of air-transportation, efficiency of solar energy systems, etc), as well as human health (e.g., population prone to respiratory disorders, eye inflammations, etc). Increased levels of fine dust particles in the air are also linked to other health hazards such as heart disease and lung cancer. In this respect, Lave and Seskin [1973] have made a pioneering work in illustrating the association between mortality rates and air pollution.

286 S. Michaelides et al.
An area which currently receives increasing attention regarding the presence of particulate matter in the atmosphere is that of renewable energy systems that util-ize solar radiation (e.g., photovoltaic systems for the generation of electricity). In this respect, the presence of suspended atmospheric dust reduces the intensity of solar radiation reaching the system; also the degradation of systems’ performance either by dry or wet deposition of dust and the subsequent need for cleaning is considered as a quite serious problem.
Areas adjacent to extensive deserts but even further away from them are occa-sionally affected by dust transportation and deposition. The occasional transport of particles from the Sahara desert is particularly important for countries in the southeast Mediterranean region, where this Chapter will be focused (see Michae-lides et al. 1999).
This phenomenon has been the subject of numerous studies and an extensive li-terature on this issue exists. In the following, a brief outline of the four general types of studies that were carried out for the investigation of the long-range trans-portation of desert dust is presented, together with selected literature which can form a starting point for the interested reader.
In the early studies, the large scale atmospheric mechanisms leading to long-range transportation of dust were identified [e.g., Prospero et al. 1970, Tullet 1978, File 1986]. Desert dust has also received considerable attention because it provides a quite strong aerosol signature in satellite retrievals and several space platforms and sensors have been used [e.g., Fraser 1976, Herman et al. 1997, King et al. 1999, Kaufman et al. 1997, Dulac et al. 1992, Tanré et al. 1997, Chu et al. 2002, Retalis and Michaelides 2009]. Remote sensing (other than satellite) of dust suspended in the atmosphere has also been explored [e.g., Torres et al. 2002, Balis et al. 2004]. Forecasting dust transportation using dynamic atmospheric modeling has also been an area of research that has also operational application [e.g., Nick-ovic et al. 1996, 2001, Lachanas et al. 1998, Gregoryan and Sofiev 1997].
In this Chapter, a novel approach will be presented, namely the application of Artificial Neural Networks (ANN) for diagnosing and predicting atmospheric pol-lutant levels over the island of Cyprus, in the eastern Mediterranean, due to the transportation of dust from the adjacent deserts. The rather isolated island of Cy-prus (located at a considerable distance from the dust source regions) is ideal for such a study. In this endeavor, employment of synoptic circulation types, satellite data and surface measurements will be made. For the implementation of neural methodologies, Matlab’s Neural Network Toolbox was employed [Beale et al. 2010]; Matlab was also used for the development of the regression models, as ex-plained below.
A brief outline is given in Section 2 of the atmospheric conditions leading to dust transportation, thus introducing the reader in the meteorological conditions associated with the phenomenon. This is followed by Section 3 where a presenta-tion is made of the surface measurements of PM10 (particles that are less than 10 μm in aerodynamic diameter), as integrated in this study. The methodology for using ANN in the classification of synoptic patterns and the identification of those of them favoring dust transportation is discussed in Section 4. The exploitation of satellite technology in estimating dust load in the atmosphere is presented in

Artificial Neural Networks for the Diagnosis and Prediction 287
Section 5; more specifically, the Atmospheric Optical Depth determined by the MODIS (Moderate Resolution Imaging Spectrometer) sensor onboard the Aqua - Terra satellites is considered. Section 6 discusses the application of multiple regres-sion in combination with the synoptic classification for the prediction of dust episodes. A neural network prediction methodology is put forward in Section 7. An integrated approach for the prediction of dust episodes that makes use of either the multiple regression or the neural approaches is considered in Section 8.
2 Weather Conditions Leading to Dust Transportation
It is considered useful to start by giving a brief overview of the atmospheric circu-lation conditions leading to dust episodes; this sets the scene for the discussion that follows but also provides a justification for the approach adopted with regard to the data selection.
It has long been revealed that the type of synoptic-scale atmospheric circulation which favors wet or dry dust deposits over the eastern Mediterranean is a souther-ly to south-westerly flow throughout the entire troposphere, extending from the northern Sahara desert well into this area. Generally, the phenomenon starts with the development of a North African low pressure system which generates a dust storm. This low pressure is initiated by an upper-level trough which occurs on the polar front jet, when it overlies a heat low. Alternatively, it is initiated by the pres-ence of a low level frontal system southeast of the Atlas Mountains. For more de-tails on the synoptic and dynamical aspects for the formation of these low pressure systems, the reader is referred to Prezerakos [1990] and Prezerakos et al. [1990]. The above atmospheric circulations are more frequent in late winter and spring [see Kubilay et al. 2000]. Indeed, this is the time of the year when dust events are most frequent over the eastern Mediterranean [Dayan et al. 1991].
The rising dust generated by the dust storm forms a cloud stirring up to a few tens or hundreds of meters; under favorable atmospheric conditions, the lighter grains can be lifted at greater heights, of the order of a few kilometers [see Preze-rakos et al. 2010]. When the dust cloud is subsequently embedded in a south-westerly tropospheric flow, it can drift over large distances. Hence, hazy weather conditions are often reported at great distances from the source area, sometimes lasting for several days. Under dry conditions, the drifting dust cloud gradually sediments due to gravity and falls as a dust deposit on the Earth’s surface. Under conditions of increased humidity, dust particles mix with rain-droplets and fall on the ground as colored precipitation.
3 Surface Measurements of Dust Deposition
For the needs of this research, PM10 measurements from the Background Repre-sentative Station at Ayia Marina Xyliatou in Cyprus were considered. This moni-toring station is located between the villages of Ayia Marina and Xyliatos (35 02’ 17’’ N, 33 03’ 28’’ E). This station is operated by the Cyprus’ Ministry of Labour and Social Insurance and it is located in an area which has relatively low local

288 S. Michaelides et al.
pollution sources, thus it is considered as an EMEP (i.e., within the protocol of the European Monitoring and Evaluation Program) Background Representative Sta-tion; for this reason, a large proportion of the PM10 measured can be ascribed to external sources (e.g., dust transportation). The measurements cover the three year period 2003-2005.
A dust transport episode is considered as a day when the average PM10 mea-surement exceeds the threshold of 50mg/m3. In the three-year period mentioned above, 85 such dust deposition events were recorded (out of a total of 1096 days). Figure 1 displays the monthly distribution of these episodes during the three year period 2003-2005. It is evident from this figure that there is a seasonal preference for dust events to occur. Indeed, experience supports the finding that Spring and Autumn are the two seasonal periods favoring dust episodes, whereas Summer appear to be suppressing these events. Dust episodes are rather rare in Winter.
Fig. 1 Number of dust events per month in the three year period 2003-2005
4 Classification of synoptic patterns with Artificial Neural Networks
The systematic use of synoptic weather charts dates back to the beginnings of modern meteorological practices. Synoptic weather stations, scattered all over the world, supply meteorological services with observations of specific parameters at regular and fixed times. Upper-air observing stations report, generally, geodynam-ic height, speed and direction of wind, as well as temperature and humidity. Con-ventionally, for the analysis of the prevailing synoptic situation, charts of the geo-potential height at selected levels are used. These charts depict the geopotential height at which a given pressure value is found and are usually called isobaric charts (hPa is the pressure unit used); quite commonly, the 500hPa level is ana-lyzed. This level possesses several characteristics that make it distinct from others:

Artificial Neural Networks for the Diagnosis and Prediction 289
it is well above the friction layer and therefore is not much affected by factors related with the Earth’s surface, at least in the short term; it represents the middle troposphere, that is the layer in which most of the weather phenomena take place; it is the level at which roughly half of the mass of the entire atmosphere is found below and half is found above; at this level, on average, divergence of the atmos-pheric air is negligible, in mid-latitudes.
Meteorologists can identify on such isobaric charts discrete geometric patterns that characterize a synoptic situation of the atmosphere. There is a strong associa-tion between large scale atmospheric circulation patterns and regional meteorolog-ical phenomena that are observed at the Earth’s surface. As a consequence, synop-tic upper air charts at certain levels provide a valuable tool for the operational weather forecaster to predict qualitatively occurrences of certain weather pheno-mena over particular areas [see Tymvios et al. 2010]. One such typical example is the close association between the atmospheric circulation and the onset and main-tenance of desert dust transport episodes, which is elaborated in this Chapter.
There are several techniques for weather type classification, developed for dif-ferent regions and for different purposes. Many of them are based on automatic, objective and consistent methodologies. However, none of the proposed methods in the literature is accepted as universal and applicable for all problems. Each me-thod has its strong and weak points. The method to be selected and its parameters are usually defined by the application itself.
An initial effort for categorization of synoptic situations was made by Lamb [1950], while in literature there exists an abundance of methods of classification [see Hewitson and Crane 1996]. In order to take advantage of these semi-empirical methods and to simplify the statistical processing, stochastic downscal-ing methods are often applied to the actual weather patterns in order to generate clusters of synoptic cases with similar characteristics. Weather type classifications are simple, discrete characterizations of the current atmospheric conditions and they are commonly used in atmospheric sciences. For a review of various classifi-cations, including their applications, the reader is referred to Key and Crane [1986], El-Kadi and Smithoson [1992], Hewitson and Crane [1996] and Cannon and Whitfield [2002].
Recently, a wide ongoing European effort in evaluating different classification methods within the framework of COST Action 733, which is entitled “Harmoni-zation of weather type classifications in Europe” [http://www.cost733.org/] was completed [Philipp et al. 2010]. The main objective of this Action is to “achieve a general numerical method for assessing, comparing and classifying typical weath-er situations in European regions, scalable to any European sub-region with time scales between 12 h and 3 days and spatial scales of ca. 200 to 2000 km. The technique described below was partly developed and expanded within this framework.
The effort in this Section is to present a relatively new methodology for the classification of synoptic situations with the use of ANN. More specifically, Ko-honen’s Self-Organised Features maps (Kohonen 1990, 1997) were used for the classification of distribution of isobaric height on charts of the 500hPa. As a result

290 S. Michaelides et al.
of this classification, synoptic prototypes can be formulated which will be related to dust events.
While ANN proved to be valuable tools for forecasting purposes, Kohonen’s Self Organizing Maps (SOM) technique is a relatively new method for climate research [Main 1997]. Maheras et al. [2000] used a combination of an ANN clas-sifier and semi-empirical methods for the classification of weather types in Greece, while Cavazos [1999] utilized a mixed architecture of a SOM network in line with a feed-forward ANN (FF-ANN) to study extreme precipitation events in Mexico and Texas. The same methodology was successfully applied for winter-time precipitation in the Balkans [Cavazos 2000]. For a research on forecasting the risk of extreme rainfall events, a neural classification was recently imple-mented [Tymvios et al. 2010]. A neural classification was also used in an attempt to identify possible climatic trends in atmospheric patterns [Tymvios et al. 2010].
The method exploited in the present work for the classification of synoptic patterns is the Kohonen’ Self Organizing Maps architecture which is a neural networks method with unsupervised learning (Kohonen, 1990). A detailed description of the method and procedures used is provided below [see also Michaelides et al. 2007].
4.1 Kohonen’s Self Organizing Maps
ANN are constructions of artificial neurons (algorithms that mimic the properties of biological neurons); they are commonly used to solve artificial intelligence problems, to simulate and predict the evolution of complex physical systems, to discover hidden structures inside data groups and they are ideal for the classifica-tion of individuals into groups of similar properties. All of these are achieved according to the network’s architecture and parameter tuning. Details of the classi-fication method are discussed in Tymvios et al. [2010] and Michaelides et al. [2010], hence, a short description is sufficient here.
As mentioned above, the neural network architecture used in this research is the Kohonen’ Self Organizing Maps (SOM) [Kohonen 1990]. These networks provide a way of representing multidimensional data in much lower dimensional spaces, usually one or two dimensions. An advantage of the SOM networks over other neural network classification techniques is that the Kohonen technique creates a network that stores information in such a way that any topological rela-tionships within the training set are maintained; for example, even if the Kohonen network associates weather patterns with dust events inaccurately, the error ob-tained will not be of great amplitude, since the result will be a class with similar characteristics. The process of reducing the dimensionality of height vectors is essential in order to investigate productively the relationship among weather pat-terns and heavy rainfall. For a recent review of the advantages in using SOM as a tool in synoptic climatology, the reader is referred to Sheridan and Lee [2011].
The geographical area studied is bounded by latitude circles 20°N and 60°N and meridians 20°W and 40°E; it covers Europe, North Africa and the Middle East. The data that were exploited comprise the 500hPa field at 1200 UTC (Uni-versal Time Coordinated) for each day, from 1 January 1980 to 31 December 2005
Artificial Neural Networks for the Diagnosis and Prediction 291
(26 years), retrieved from the online data base of NCEP (National Centers for En-vironmental Prediction, USA). The grid distance is 2.5°x2.5°, thus the area in study is covered by 7x25=425 grid points.
The Kohonen SOM algorithm in its unsupervised mode was chosen for build-ing the neural network models, because neither the number of output classes (syn-optic classes) nor the desired output are known a priori. This is a typical example where unsupervised learning is more appropriate, since the domain expert (in this case a professional meteorologist) will be given the chance to see the results and decide which model gives the best results. The expert’s guidance can help to decide the number of output classes that better represent the system (Pattichis et al. 1995).
In unsupervised learning, there are no target values, as in the case of other me-thods of ANN. Given a training set, Χ(k), k=1, 2, … , p, the objective is to discover significant features or regularities in the training data (input data). In our case, the input data were 9497 vectors (i.e., the number of consecutive days in the 26 years 1980-2005). The neural network attempts to map the input feature vectors onto an array of neurons (usually one or two-dimensional), thereby compresses informa-tion while preserving the most important topological and metric relationships of the primary data items on the display. By doing so, the input feature vectors can be clustered into c-clusters, where c is less or equal to the number of neurons used [Charalambous et al. 2001]. Input vectors are presented sequentially in time with-out specifying the desired output [see Schnorrenberg et al. 1996, Michaelides et al. 2001]. The two-dimensional rectangular grid architecture of Kohonen’s SOM was adopted in the present research.
The input vector X is connected with each unit of the network through weights wj, where j = 1, 2,…, M; M equals to 425 grid points, for the area in study. The training procedure utilizes competitive learning. When a training example is fed to the network, its Euclidean distance to all weight vectors is computed. The neuron whose weight vector is closest to the input vector X (in terms of Euclidean dis-tance) is the winner. This neuron is represented with I and is the winner neuron to input X if ||wI - X|| = mini ||wi - X||, i = 1, …, M.
Note that ||wI - X|| = [(wi1 - x1)2 + (wi2 - x2)
2 + … + (wiN - xN)2] ½ is the Eucli-dean distance between weight vector wi and input vector X [see Charalambous et al. 2001]. N refers to the number of output classes.
The weight vectors of the winner neuron, as well as its neighborhood neurons, are updated in such a way that they become closer to the input pattern. Learning follows the following rule:
w , , , , (1)
where, the neighborhood set N(I,R) of neuron I with radius R consists of neurons 1, I±1,…, I±R, assuming these neurons exist, with maximum value being around the winner I, in order for a larger number of neighborhood units to share the expe-rience of learning with the winner unit, and it becomes zero as the distance

292 S. Michaelides et al.
between the neighborhood units and I increases. The coefficient α in the above relationship is called the learning factor and decreases to zero as the learning progresses. For simplicity, R is considered to have the shape of a geometric area, such as a rectangle or hexagon.
The radius of the neighborhood around the winner unit is relatively large to start with, in order to include all neurons. As the learning process continues, the neighborhood is consecutively shrunk down to the point where only the winner unit is updated [Patterson, 1995].
As more input vectors are represented to the network, the size of the neighbor-hood decreases until it includes only the winning unit or the winning unit and some of its neighbors. Initially, the values of the weights are selected at random. The method which was used for the SOM to work, can be described as follows:
1. The initial value of the weights is set to small random numbers, as well as the learning rate and the neighborhood. Steps 2 to 4 are repeated until the weights of the network are stabilized. 2. One vector X is chosen from the dataset as an input to the network. 3. The table for unit I with weight vector closest to X is determined by calculating ||wI – X|| = mini ||wi – X||. 4. The weight vector in (t + 1) iteration is updated according to: wi(t + 1) = wi(t) + a(t)(X – wi(t)), for units that belong in set N(I,R) wi(t + 1) = wi(t) , for units that do not belong in set N(I,R). 5. The neighborhood and the learning rate of the parameters are decreased [Chara-lambous et al. 2001].
When all vectors in the training set were presented once at the input, the procedure is repeated many times with the vectors presented in order each time. This part of the algorithm at the end organizes the weights of the one-dimensional map, such that topologically close nodes become sensitive to input that is physically similar. Nodes are ordered in a natural manner, reflecting the different classes of the train-ing set [Michaelides et al. 2001].
The number of outputs is not a priori determined, but an “optimum” can be adopted by experimentation, in relation to the specific application under study. For several applications, it appears that the optimum number of outputs is around 30, as this exhibits the level of discretization required for the synoptic scale phenome-na examined [see Tymvios et al. 2010]. Although several experiments were car-ried out with varying output nodes, for the association of weather type patterns and dust transportation over the eastern Mediterranean 35 classes were considered.
4.2 Synoptic Pattern Classification
One of the major inherent problems in an endeavor to classify synoptic patterns is the a priori determination of the number of different classes that one can expect from such a classification, as mentioned above. In other words, the number of

Artificial Neural Networks for the Diagnosis and Prediction 293
distinctive synoptic patterns over any particular geographical region is by no means fixed. Traditionally, such a synoptic classification was performed by a qua-litative inspection of synoptic maps. Professional meteorologists examined a series of plotted synoptic maps and picked out geometric similarities [e.g., Prezerakos et al. 1991]. Nevertheless, it seems that in an attempt to perform a classification with an unknown number of classes, experimentation with various possibilities is a practical procedure, which can lead to some useful considerations. For this reason, it was decided to run a number of experiments and build classification models with different numbers of output nodes (i.e., classes). For the present analysis 35 output nodes are presented, as mentioned above.
The ability of ANN to group synoptic patterns into seasonally dependent clus-ters was noted by Michaelides et al. [2007]. This seasonal discretization of classes should be an essential attribute of a classification technique.
Fig. 2 Number of days per class, for the 35 classes in the synoptic classification, during 2003-2005
Figure 2 shows the frequency of appearance of the synoptic patterns in the 35 classification for the three-year period 2003-2005. Apparently, class 35 is most frequently encountered, followed by classes 1 and 25. Figure 3 is a graphical re-presentation of the assignment of a class to each day in the three year period. It is clear that there is a seasonal “quasi-cyclic” behavior. Certain classes occur, almost exclusively, during summer or winter; during the (Mediterranean) transitional pe-riods of spring and autumn, both the summertime and wintertime patterns can oc-cur. This graphical representation is proposed as a practical visual tool to identify the level of seasonal discretization pursued in adopting a synoptic classification technique.

294 S. Michaelides et al.
4.3 Synoptic Classes and Dust Deposition Events
Figure 4 shows how the 85 dust transport events are distributed among the 35 classes in the synoptic classification adopted above. There appears to be a certain preference of classes associated with these events: most prone to dust events is class 1, followed by class 31; representative synoptic situations for these two classes are shown in Fig. 4. Figure 5(a) refers to 1200 UTC 1 February 2003, and 5(b) at 1200 UTC 10 May 2004: in the former, a central Mediterranean upper trough extends well into the north African desert; in the later, the trough axis ex-tends southwards from the Iberian peninsula. In both cases, typical patterns are identified favoring dust raising and its transfer eastwards with the resulting south-westerly airflow over the eastern Mediterranean.
Fig. 3 Daily distribution of 35 classes in the three-year period 2003-2005
Fig. 4 Distribution of dust deposition events per class, for the 35 classes in the synoptic classification, during 2003-2005

Artificial Neural Networks for the Diagnosis and Prediction 295
(a) (b) Fig. 5 Representative synoptic situations corresponding to: (a) class 1; (b) class 31. Isolines are drawn for every 60 geopotential meters
5 Dust Load from Satellite Measurements
Satellite remote sensing has been widely used for monitoring and assessment of air pollution. Several sensors have been employed for the retrieval of air pollution products and especially for the estimation of aerosol content. Researchers have been mainly devoted to extract the aerosol content in the total atmospheric col-umn, since there often it is difficult to distinguish the sources of emissions (anth-ropogenic, natural).
Satellite products are characterized by both their extended spatial coverage and the possibility for real-time air-pollution monitoring against PM ground-based measurements. Several methods to estimate surface PM concentration levels, from aerosol related products have been published in the literature. The majority of these are focused on the derivation of statistical/empirical models for the estimation of PM2.5 (and secondarily of PM10) from satellite derived AOD (Atmospheric Optical Depth, a measure of aerosol loading in the total at-mospheric column).
These methods have been applied to different sites of the world and are based on aerosol products from various sensors such as MODIS [Gupta and Christo-pher 2008, Li et al. 2009], MISR [Liu et al. 2007], SeaWiFS [Vidot et al. 2007], GOES-12 [Liu et al. 2009]. The PM-AOD correlation coefficients reported in the literature vary from low (<0.5) to high values (0.96). This correlation has been found to depend on various factors such as the temporal averaging periods (hourly versus 24-hr), season, aerosol type, satellite AOD retrieval accuracy, meteorological conditions, boundary layer height, station type/location [Hoff and Christopher 2009]. Among the existing satellite aerosol products, MODIS instruments onboard Terra (EOS a.m.) and Aqua (EOS p.m.) satellites have the

296 S. Michaelides et al.
Fig. 6 Spatial distribution of the monthly averaged values of AOD for 2003-2005
advantage to provide images twice a day on a global scale. Thus, the majority of the research efforts are referred to MODIS aerosol products, which already span a period of a decade.
In the study presented here, Terra and Aqua MODIS level-2 (Collection C005, V5.2) daily aerosol products at a spatial resolution of 10×10km were acquired from NASA's Level 1 and Atmosphere Archive and Distribution System (LAADS). The Collection 005 dark-target aerosol product is based on a true in-version that uses three pieces of information: apparent reflectance at 470 nm, 660 nm and 2130 nm to derive AOD and fraction of AOD attributed to non-dust aero-sol at 470nm, 670nm and 550nm (interpolated) and the surface reflectance at 2130 nm [Levy et al. 2007, Remer et al. 2009]. For the present work, the AOD values used refer to the dark-target AOD values (at 550nm) extracted from the Scientific Data Set entitled ‘Optical_Depth_Land_And_Ocean’ and covering the period Jan-uary 2003-December 2005.
There is a strong seasonal variability of AOD that reflects the seasonality in dust load over dust prone areas, like the eastern Mediterranean. Figure 6 shows the spatial distribution of the AOD values for January, April, July and October, aver-aged in the 2003-2005 period. As expected, spring exhibits larger values com-pared to other seasons. Also, Fig. 7 shows some statistical characteristics of AOD, spatially averaged over the area of Fig. 6. The seasonal dependence is also appar-ent, with April being the most prominent.
AOD
January April
July October

Artificial Neural Networks for the Diagnosis and Prediction 297
Fig. 7 Monthly average, minimum and maximum values of the spatially averaged AOD during 2003-2005
6 Multiple Regression Models
Surface and satellite measurements were considered in establishing linear regres-sion relationships between PM10 concentrations and satellite estimates of AOD; in this respect, measurements at different times preceding the time for which the prediction of PM10 concentration is sought (all calculations hereafter refer to the EMEP station) were taken into account. It became evident that PM10 measure-ments and satellite AOD estimates spanning a few days before the actual event yield better results. This is not surprising because the phenomenon that is under consideration is the transfer of dust from remote areas over an island, which has little local widespread sources. Therefore, it is reasonable to assume that the build-up of the concentration of dust particles at ground level is a gradually intensifying process, whereby increasing amounts of dust are noted as the dust plumes move away from the desert source regions.
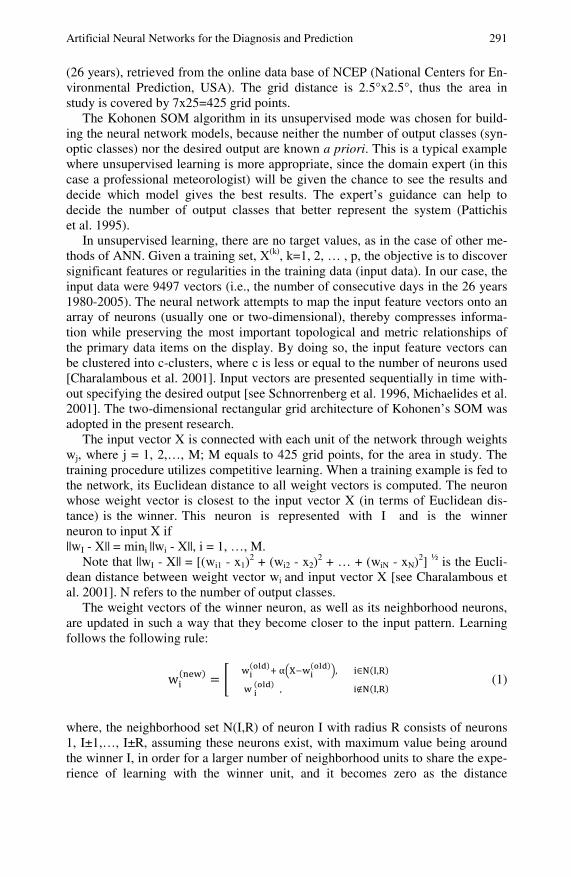
One of the aims of the research that was carried out was to demonstrate that the neural methodology described above for the classification of synoptic types can be combined with a statistical approach in order to provide estimates of the expected concentration of particulate matter PM10 at ground level. For this purpose, mul-tiple regression models were built, making use of PM10 surface measurements and satellite AOD from MODIS and several multiple regression models were tested; in all of these, the dependent variable was the concentration of PM10 dust particles at ground level. Regarding the independent variables, several combina-tions were tested. Here, the following combination is presented (see Table 1). The dependent variable is the predicted value of PM10 level on DAY0 (i.e., to-day); the set of independent variables consist of previous measurements of par-ticles on the ground and satellite estimates: two PM10 measurements for DAY0-1 (i.e., yesterday) and DAY0-2 (i.e., the day before yesterday) and satellite AOD for DAY0-1 and DAY0-2, retrieved from Aqua-Terra satellites. In the data set for the three year period that was used in this study (years 2003, 2004 and 2005, 1096
298 S. Michaelides et al.
days), there were 127 days with missing or unreliable data; those were excluded from further processing. As the two satellites are not available at all times, an av-erage of the two measurements from these satellites was used when both satellites were available, whereas one value is used when one of the satellites is available. Finally, in order to take into consideration the classification of the synoptic patterns, different regression models were built for each of the 35 classes.
Table 1 Independent (Input) and Dependent (Output) variables for the regression (neural) prediction models
Independent (Input) variables Dependent (Output) variable
PM10 for DAY0-2
PM10 for DAY0 PM10 for DAY0-1
AOD for DAY0-2
AOD for DAY0-1
7 A Neural Network Approach for the Prediction of Dust Deposition
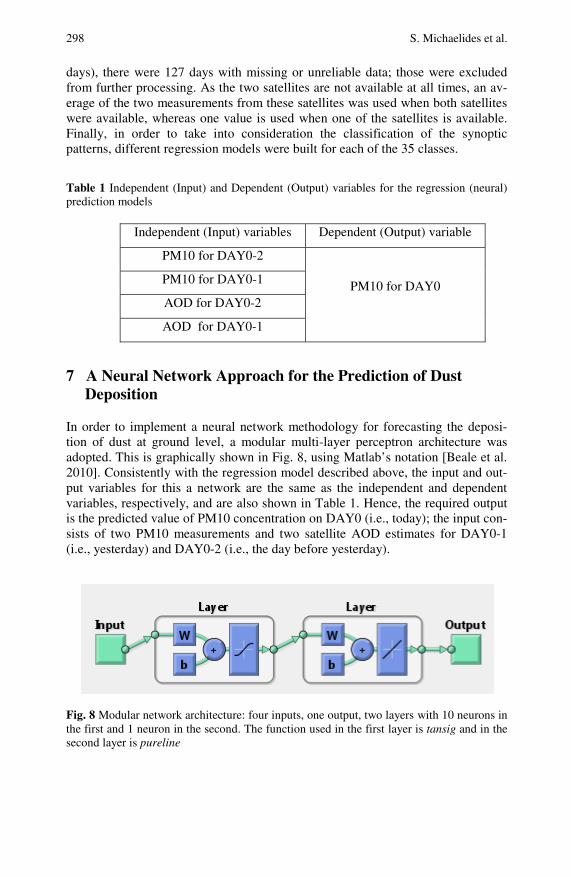
In order to implement a neural network methodology for forecasting the deposi-tion of dust at ground level, a modular multi-layer perceptron architecture was adopted. This is graphically shown in Fig. 8, using Matlab’s notation [Beale et al. 2010]. Consistently with the regression model described above, the input and out-put variables for this a network are the same as the independent and dependent variables, respectively, and are also shown in Table 1. Hence, the required output is the predicted value of PM10 concentration on DAY0 (i.e., today); the input con-sists of two PM10 measurements and two satellite AOD estimates for DAY0-1 (i.e., yesterday) and DAY0-2 (i.e., the day before yesterday).
Fig. 8 Modular network architecture: four inputs, one output, two layers with 10 neurons in the first and 1 neuron in the second. The function used in the first layer is tansig and in the second layer is pureline

Artificial Neural Networks for the Diagnosis and Prediction 299
As an example of this application, results for the EMEP Background Repre-sentative station presented above are given in the following. As mentioned above, out of the 1096 days that were employed in this research, there were some days with missing or unreliable data; those were excluded from further processing. For the training of the network, 646 data sets were used which were randomly fed to the system and the Levenberg-Marquardt methodology was adopted [see Fletcher 1971]. For the verification of the system that was built, the remaining 323 data sets were used.
Fig. 9 Measured versus predicted values of PM10 concentration for the verification data set (323 days)
Fig. 10 Measured versus predicted daily average values of PM10 concentration for the verification data set. A linear fit for this relationship is also shown

300 S. Michaelides et al.
Figure 9 is a comparative presentation of the measured and predicted values of PM10 for the 323 days in the verification set. The same measured and predicted values are plotted in Fig. 10 together with a linear relationship between the two. Overall, the neural network model seems to underestimate the PM10 concentra-tions, especially when extreme concentrations are recorded; however, apart from these outliers, the performance of the neural network predictions is acceptable.
8 Dust Transport Event Prediction Tool
All of the above described approaches have been embedded in a user friendly pre-diction tool, the interface of which is shown in Fig. 11. Input consists of PM10 measurements and AOD from satellite estimates for the two previous days and the synoptic class. The user has an option to perform the concentration prediction by using either the neural network or the multiple regression methodology. The out-put is the predicted PM10 concentration for today; also the probabilities of ex-ceeding the thresholds of 50, 80 and 100 mg/m3 are calculated.
Fig. 11 The interface of the prediction tool
9 Concluding Remarks
The main aim of the research that was presented above was to demonstrate that the use of Artificial Neural Networks can be applied efficiently in the prediction of a highly complex atmospheric phenomenon, namely the dust transportation and its deposition at a distance from the source regions. The data that were used were basically the type of the prevailing synoptic conditions, measurements of dust

Artificial Neural Networks for the Diagnosis and Prediction 301
deposition at ground level (PM10) and Atmospheric Optical Depth (AOD) deter-mined from satellite information (MODIS).
A classification of synoptic types as they are portrayed by the 500 hPa isobaric analyses was performed, in order to treat the well known association between dust transportation and prevailing weather conditions in the middle troposphere. As dust transportation eventually leads to deposition at some distance from the source, the measurements of dust particles provide such an indication, especially where this can be ascribed to a large extent to external sources; hence, such mea-surements can be used to track dust transportation episodes, although the respec-tive data must be treated with care. Satellite remote sensing of the atmospheric dust load can provide a valuable source of information, especially as regards the spatial and temporal evolution of the transportation of dust.
Although the results of this pilot study are site specific, they indicate that dust transportation can be investigated by using ANN, both for diagnostic and prognos-tic purposes. As the ANN methodologies are generally highly data demanding, the techniques developed in this research can be updated and, hopefully, improved as more data become available.
An efficient methodology for predicting dust events can have several applica-tions. In the Section 1, several human activities were outlined that can be profited from accurate dust transport predictions. A rather more recent area of application of such predictions is in the planning and running of renewable energy systems based on solar energy exploitation (e.g., photovoltaic systems etc).
Acknowledgements
The methodology that was presented above formed part of the AERAS research project that was partly funded by the Cyprus Research Promotion Foundation. The PM10 data were kindly provided by the Ministry of Labour and Social Security of Cyprus. The data for the synoptic analyses were provided by the National Centers for Environmental prediction, U.S.A. The MODIS data were retrieved from NASA's Atmosphere Archive and Distribu-tion System.
References
Balis, D.S., Amiridis, V., Nickovic, S., Papayannis, A., Zerefos, C.: Optical properties of Saharan dust layers as detected by a Raman lidar at Thessaloniki, Greece. Geophysical Research Letters 31, L13104 (2004), doi:10.1029/2004GL019881
Beale, M.H., Hagan, M.T., Demuth, H.B.: Neural Network ToolboxTM User’s Guide. The MathWorks, Inc. (2010), http://www.mathworks.com/help/pdf_doc/nnet/nnet.pdf
Cannon, J.A., Whitfield, P.H.: Synoptic map-pattern classification using recursive partition-ing and principal component analysis. Monthly Weather Review 130, 1187–1206 (2002)
Cavazos, T.: Large-scale circulation anomalies conducive to extreme precipitation events and derivation of daily rainfall in Northeastern Mexico and Southeastern Texas. Journal of Climate 12, 1506–1523 (1999)

302 S. Michaelides et al.
Cavazos, T.: Using self-organizing maps to investigate extreme climate events: An applica-tion to wintertime precipitation in the Balkans. Journal of Climate 13, 1718–1732 (2000)
Charalambous, C., Charitou, A., Kaourou, F.: Comparative analysis of neural network models: Application in bankruptcy prediction. Annals of Operations Research 99, 403–425 (2001)
Chu, D.A., Kaufman, Y.J., Ichoku, C., Remer, L., Tanré, D., Holben, B.N.: Validation of MODIS aerosol optical depth retrieval over land. Geophysical Research Letters 29(12) (2002), doi:10.1029/2001GL013205.
Dayan, U., Heffter, J., Miller, J., Gutman, G.: Dust intrusion events into the Mediterranean basin. Journal of Applied Meteorology 30, 1185–1199 (1991)
Dulac, F., Tanré, D., Bergametti, G., Buat-Menard, P., Desbois, M., Sutton, D.: Assessment of the african airborne dust mass over the western Mediterranean sea using Meteosat data. Journal of Geophysical Research 97, 2489–2506 (1992)
El-Kadi, A.K.A., Smithoson, P.A.: Atmospheric classifications and synoptic climatology. Progress in Physical Geography 16, 432–455 (1992)
File, R.F.: Dust deposit in England on 9 November 1984. Weather 41, 191–195 (1986) Fletcher, R.: A Modified Marquardt Subroutine for Nonlinear Least Squares. Rpt. AERE-R
6799, Harwell (1971) Fraser, R.S.: Satellite measurement of mass of Sahara dust in the atmosphere. Applied
Optics 15, 2471–2479 (1976) Grigoryan, S.A., Sofiev, M.A.: Numerical modeling of dust elevation during storm epi-
sodes and its long-range atmospheric transport. In: Proceedings of the 1st LAS/WMO International Symposium on Sand and Dust Storms, WMO Programme on Weather Prediction Research Report Series Project no. 10, WMO Technical Document no. 864, Damascus, Syria, pp. 88–98 (November 1997)
Gupta, P., Christopher, S.A.: Seven year particulate matter air quality assessment from surface and satellite measurements. Atmospheric Chemistry and Physics 8, 3311–3324 (2008)
Herman, J.R., Bhartia, P.K., Torres, O., Hsu, N.C., Seftor, C.J., Celarier, E.: Global distri-bution of UV-absorbing aerosols from Nimbus-7/TOMS data. Journal of Geophysical Research 102, 16911–16922 (1997)
Hewitson, B.C., Crane, R.G.: Climate downscaling: Techniques and application. Climate Research 7, 85–95 (1996)
Hoff, R.M., Christopher, S.A.: Critical Review - Remote sensing of particulate pollution from space: have we reached the promised land? Journal of the Air & Waste Manage-ment Association 59, 645–675 (2009)
Kaufman, Y.J., Tanré, D., Remer, L.A., Vermote, E.F., Chu, D.A., Holben, B.N.: Opera-tional remote sensing of tropospheric aerosol over the land from EOS-MODIS. Journal of Geophysical Research 102, 17051–17061 (1997)
Key, J., Crane, R.J.: A Comparison of Synoptic classification schemes based on “objective” procedures. Journal of Climatology 6, 375–388 (1986)
King, M.D., Kaufman, Y.J., Tanré, D., Nakajima, T.: Remote sensing of tropospheric aerosols from space: Past, present and future. Bulletin of the American Meteorological Society 80, 2229–2259 (1999)
Kohonen, T.: The Self-Organizing Map. Proceedings IEEE 78, 1464–1480 (1990) Kohonen, T.: Self-Organizing Maps, 2nd edn. Series in Information Sciences, vol. 30.
Springer, Heidelberg (1997)

Artificial Neural Networks for the Diagnosis and Prediction 303
Kubilay, N., Nickovic, S., Moulin, C., Dulac, F.: An illustration of the transport and deposi-tion of mineral dust onto the eastern Mediterranean. Atmospheric Environment 34, 1293–1303 (2000)
Lachanas, A., Evripidou, P., Michaelides, S.: Regional weather prediction on small network of workstations. In: Proceedings 24th EUROMICRO Conference, Vasteras, Sweden, pp. 1053–1060 (1998)
Lamb, H.H.: Types and spells of weather around the year in the British Isles: Annual trends, seasonal structure of the year, singularities. Quarterly Journal of the Royral Me-teorological Society 76, 393–429 (1950)
Lave, L.B., Seskin, E.P.: An Analysis of the Association Between U.S. Mortality and Air Pollution. Journal of the American Statistical Association 68, 284–290 (1973)
Levy, R.C., Remer, L.A., Mattoo, S., Vermote, E.F., Kaufman, Y.J.: Second-generation operational algorithm: Retrieval of aerosol properties over land from inversion of Mod-erate Resolution Imaging Spectroradiometer spectral reflectance. Journal of Geophysi-cal Research 112, D13211 (2007), doi:10.1029/2006JD007811
Li, H., Faruque, F., Williams, W., Al-Hamdan, M., Luvall, J., Crosson, W., Rickman, D., Limaye, A.: Optimal temporal scale for the correlation of AOD and ground measure-ments of PM2.5 in a real-time air quality estimation system. Atmospheric Environ-ment 43, 4303–4310 (2009)
Liu, Y., Koutrakis, P., Kahn, R.: Estimating fine particulate matter component concentra-tions and size distribution using satellite-retrieved fractional aerosol optical depth: Part 1 – method development. Journal of the Air & Waste Management Association 57, 1351–1359 (2007)
Liu, Y., Paciorek, C.J., Koutrakis, P.: Estimating regional spatial and temporal variability of PM2.5 concentrations using satellite data, meteorology, and land use information. Envi-ronmental Health Perspectives 117, 886–892 (2009)
Maheras, P., Patrikas, I., Karakostas, T., Anagnostopoulou, C.: Automatic classification of circulation types in Greece: methodology, description, frequency, variability and trend analysis. Theoretical and Applied Climatology 67, 205–223 (2000)
Main, J.P.L.: Seasonality of circulation in Southern Africa using the Kohonen self organiz-ing map M.S. thesis, Department of Environmental and Geographical Sciences, Univer-sity of Cape Town, South Africa, p. 84 (1997)
Michaelides, S., Evripidou, P., Kallos, G.: Monitoring and predicting Saharan desert dust events in the eastern Mediterranean. Weather 54, 359–365 (1999)
Michaelides, S.C., Pattichis, C.S., Kleovoulou, G.: Classification of rainfall variability by using artificial neural networks. International Journal of Climatology 21, 1401–1414 (2001)
Michaelides, S.C., Liassidou, F., Schizas, C.N.: Synoptic classification and establishment of analogues with artificial neural networks. Journal of Pure and Applied Geophys-ics 164, 1347–1364 (2007)
Michaelides, S., Tymvios, F., Charalambous, D.: Investigation of trends in synoptic pat-terns over Europe with artificial neural networks. Advances in Geosciences 23, 107–112 (2010)
Nickovic, S., Dobricic, S.: A model for long-range transport of desert dust. Monthly Weather Review 124, 2537–2544 (1996)
Nickovic, S., Kallos, G., Papadopoulos, A., Kakaliagou, O.: A model for prediction of desert dust cycle in the atmosphere. Journal of Geophysical Research 106, 18113–18130 (2001)

304 S. Michaelides et al.
Patterson, D.W.: Artificial Neural Networks, Theory and Applications. Prentice-Hall, Englewood Cliffs (1995)
Pattichis, C.S., Schizas, C.N., Middleton, T.M.: Neural Network Models in EMG Diagno-sis. IEEE Transactions on Biomedical Engineering 42(5), 486–495 (1995)
Philipp, A., Bartholy, J., Beck, C., Erpicum, M., Esteban, P., Fettweis, X., Huth, R., James, P., Sylvie, J., Kreienkamp, F., Krennert, T., Lykoudis, S., Michalides, S.C., Pianko-Kluczynska, K., Post, P., Alvarez, D.R., Schiemann, R., Spekat, A., Tymvios, F.S.: Cost733cat – A database of weather and circulation type classifications. Physics and Chemistry of the Earth 35, 360–373 (2010)
Prezerakos, N.G.: Synoptic flow patterns leading to the generation of north-west African depressions. International Journal of Climatology 10, 33–48 (1990)
Prezerakos, N.G., Michaelides, S.C., Vlassi, A.S.: Atmospheric synoptic conditions asso-ciated with the initiation of north-west African depressions. International Journal of Climatology 10, 711–729 (1990)
Prezerakos, N., Michaelides, S.C., Vlassi, A.S.: Atmospheric synoptic conditionsassociated with the initiation of north-west African depressions. Internatinal Journal of Climatolo-gy 10, 711–729 (1991)
Prezerakos, N.G., Paliatsos, A.G., Koukouletsos, K.V.: Diagnosis of the Relationship be-tween Dust Storms over the Sahara Desert and Dust Deposit or Coloured Rain in the South Balkans. In: Advances in Meteorology 2010 (2010), Article ID 760546, 14 pag-es, doi:10.1155/2010/760546
Prospero, J.M., Bonatti, E., Schubert, C., Carlson, T.N.: Dust in the Caribbean atmosphere traced to an African dust storm. Earth and Planetary Science Letters 9, 287–293 (1970)
Remer, L., Tanré, D., Kaufman, Y.J., Levy, R.C., Mattoo, S.: Algorithm for Remote Sens-ing of Tropospheric Aerosol from MODIS for Collection 005: Revision 2 (2009), http://modis-atmos.gsfc.nasa.gov/_docs/ATBD_MOD04_C005_rev2.pdf
Retalis, A., Michaelides, S.C.: Synergetic use of TERRA/MODIS imagery and meteorolog-ical data for studying aerosol dust events in Cyprus. International Journal of Environ-ment and Pollution 36, 139–150 (2009)
Schnorrenberg, F., Pattichis, C.S., Kyriacou, K., Vassiliou, M., Schizas, C.N.: Computer-aided classification of breast cancer nuclei. Technology and Health Care 4, 147–161 (1996)
Sheridan, S.C., Lee, C.C.: The self-organizing map in synoptic climatological research. Progress in Physical Geography 35, 109–119 (2011)
Tanré, D., Kaufman, Y.J., Herman, M., Mattoo, S.: Remote sensing of aerosol over oceans from EOS-MODIS. Journal of Geophysical Research 102, 16971–16988 (1997)
Torres, O., Bhartia, K., Herman, J.R., Sinyuk, A., Ginoux, P., Holbren, B.: A long-term record of aerosol optical depth from TOMS observations and comparison to AERO-NET. Journal of Atmospheric Sciences 59, 398–413 (2002)
Tullet, M.T.: A dust fall on 6 March 1977. Weather 33, 48–52 (1978) Tymvios, F., Savvidou, K., Michaelides, S.C.: Association of geopotential height patterns
with heavy rainfall events in Cyprus. Advances in Geosciences 23, 73–78 (2010) Vidot, J., Santer, R., Ramon, D.: Atmospheric particulate matter (PM) estimation from
SeaWiFS imagery. Remote Sensing of the Environment 111, 1–10 (2007)