Aandhi the Indian Dust-storm
12
f • • • ••. ~ MQll#I1t/, (1980), 31,~3, 431-442 ', . .. , Reprinted from Mausam, Vol. 31, No.3, July 1980, P 431 - 442. 551.515.3 (545 : 547) t I 'Andhi', the convective duststorm of northwest India I P. V. JOSEPH, D. K. RAIPAL AND S. N. DEKA Regional Meteorological Centre,' New Delhi (Received 9 April 1979) ABSTRACf. The convective duststorm occurring over Northwest India during the pre-monsoon season is called 'Andhi', In this paper a study is made on Andhi of Delhi using available meteoro- logical records of recent years. From records of horizontal visibility and surface wind speed variations associated with them, Andhi has been classified into 4 types. Radar PPI photographs studied shows that the distance between the cumulonimbus cloud or squall line as seen in the radar and the ground level position of the duststorm (or gust-front) can be as large as 30 kilometres, The paper also gives a review of the existing knowledge on the phenomenon of convective duststorm (Andhi, and Haboob). 1. Introduction 1.1. During the months of April, May and June, duststorms occur frequently in Punjab, Haryana, North Rajasthan and adjoining west Uttar Pradesh. When dust raised by strong wind reduces horizontal visiblity to less than 1000 metres we call the phenomenon a duststorm. There are three classes of duststorms according to their intensities light, moderate and severe duststorms, as per the classification adopted by India Meteorological Department. (detals are given in Table 1). TABLE 1 Classification of duststorm according to intensity Intensity of dust- Wind storm force (on Beaufort scale) Visibility LIGHT 4 to 6 Less than 1000 metres upto 500 metres. 6 to 8 Less than 500 metres upto 200 metres. 9 or more Less than 200 metres. MODERATE SEVERE " . 1.2. There are two types of duststorms-the 'pressure gradient' type and the 'convective' type. In the convective type of duststorm, dust is raised by the down-draft of a thunder storm cloud (cumulonimbus) or a squall line. 'Andhi' is the local (Indian) name for the convective type of duststorm, a name possibly given because of the darkness created by the dust-wall as it passes over a station. Most of the duststorms that occur at Delhi are of the 'Andhi' type. The frequency of duststorms at Delhi (Safdarjung) is 1 in April and 3 each in May and June as given in "Climato- logical Tables of Observatories in India 1931 to 1960"; for the whole year the average number of duststorms is 8. 1.3. We have only very little knowledge about 'Andhi' except about its climatology. The earliest study available on Andhi is that by. Hankin (1921) who gave a visual- description of Andhi dust-wall and the associated cumulonimbus cloud. Srinivasiah and Sur (1938) have given climatological information regarding occurrence of duststorms at Agra. According to Bhalotra (1954) there is no difference in the atmospheric humidity content between a day of duststorm and a day of thunderstorm. 1.4. Convective type of duststorms also occur in the region extending west-wards of the Indian Andhi belt across Pakistan and Arabia to the arid regions of Africa like Sudan, Chad etc. In Africa and Arabia the phenomenon is called Haboob because of the strong wind associated with it. On Haboobs some elementary descriptive accounts are available in the literature (Sutton 1925, Lawson 1971) etc. The average speed of advance of the Khartoum Haboob is 32 m.p.h. With the arrival of a Haboob there is invariably a fall in temperature and rise in relative humi- dity. In a severe case the temperature drop may oe as great at 15 0 C. Idso et al. (1972) report that in the arid regions of· southwestern United (431)
-
Upload
independent -
Category
Documents
-
view
1 -
download
0
Transcript of Aandhi the Indian Dust-storm

f • • • ••. ~
MQll#I1t/, (1980), 31,~3, 431-442
',...,
Reprinted from Mausam, Vol. 31, No.3, July 1980, P 431 - 442.551.515.3 (545 : 547)
t I
'Andhi', the convective duststorm of northwest IndiaI
P. V. JOSEPH, D. K. RAIPAL AND S. N. DEKA
Regional Meteorological Centre,' New Delhi
(Received 9 April 1979)
ABSTRACf. The convective duststorm occurring over Northwest India during the pre-monsoonseason is called 'Andhi', In this paper a study is made on Andhi of Delhi using available meteoro-logical records of recent years. From records of horizontal visibility and surface wind speed variationsassociated with them, Andhi has been classified into 4 types. Radar PPI photographs studied showsthat the distance between the cumulonimbus cloud or squall line as seen in the radar and the groundlevel position of the duststorm (or gust-front) can be as large as 30 kilometres, The paper also givesa review of the existing knowledge on the phenomenon of convective duststorm (Andhi, and Haboob).
1. Introduction
1.1. During the months of April, May andJune, duststorms occur frequently in Punjab,Haryana, North Rajasthan and adjoining westUttar Pradesh. When dust raised by strong windreduces horizontal visiblity to less than 1000metres we call the phenomenon a duststorm.There are three classes of duststorms accordingto their intensities light, moderate and severeduststorms, as per the classification adopted byIndia Meteorological Department. (detals aregiven in Table 1).
TABLE 1Classification of duststorm according to intensity
Intensity of dust- Windstorm force
(onBeaufortscale)
Visibility
LIGHT 4 to 6 Less than 1000 metresupto 500 metres.
6 to 8 Less than 500 metresupto 200 metres.
9 or more Less than 200 metres.
MODERATE
SEVERE" .
1.2. There are two types of duststorms-the'pressure gradient' type and the 'convective' type.In the convective type of duststorm, dust israised by the down-draft of a thunder stormcloud (cumulonimbus) or a squall line. 'Andhi'is the local (Indian) name for the convective typeof duststorm, a name possibly given because ofthe darkness created by the dust-wall as it passes
over a station. Most of the duststorms that occurat Delhi are of the 'Andhi' type. The frequencyof duststorms at Delhi (Safdarjung) is 1 in Apriland 3 each in May and June as given in "Climato-logical Tables of Observatories in India 1931 to1960"; for the whole year the average numberof duststorms is 8.
1.3. We have only very little knowledge about'Andhi' except about its climatology. The earlieststudy available on Andhi is that by. Hankin(1921) who gave a visual- description of Andhidust-wall and the associated cumulonimbuscloud. Srinivasiah and Sur (1938) have givenclimatological information regarding occurrenceof duststorms at Agra. According to Bhalotra(1954) there is no difference in the atmospherichumidity content between a day of duststorm anda day of thunderstorm.
1.4. Convective type of duststorms also occurin the region extending west-wards of the IndianAndhi belt across Pakistan and Arabia to thearid regions of Africa like Sudan, Chad etc. InAfrica and Arabia the phenomenon is calledHaboob because of the strong wind associatedwith it. On Haboobs some elementary descriptiveaccounts are available in the literature (Sutton1925, Lawson 1971) etc. The average speed ofadvance of the Khartoum Haboob is 32 m.p.h.With the arrival of a Haboob there is invariablya fall in temperature and rise in relative humi-dity. In a severe case the temperature drop mayoe as great at 150 C. Idso et al. (1972) reportthat in the arid regions of· southwestern United
(431)

432 P. V. JOSEPH et al.
States duststorms of a very similar nature occur,although much less frequently than in Sudan (2or 3 per year at Phoenix as compared to about 24at Khartoum). Minimum visibility in an Ameri-can duststorm average about 0.25 miles and itusually takes about 1 hour for visibility to returnto 6 km. However, this return to 6 km has beenas short as 12 minutes and as long as 3 hours.Dustwalls are found to reach upwards to 8000feet as reported by aircraft.
1.5. Idso et al. (1972) has also presented adescriptive account with photographs of the dust-wall of the severe duststorm of 16 July 1971;tbey called it an 'American Haboob', Relativehumidity jumped from 33 per cent to 74 per centwith the passage of the duststorm's gust-front andthe temperature dropped over 130 C. The aver-age time required for these humidity and tem-perative changes was 7 minutes. Photographs ofthe duststorm showed that the boundry of thedust-wall was having the shape assumed by acurrent of dense fluid under cutting a less densefluid (density currents as they are called) alsocharacteristic of the Haboobs of Sudan as report-ed by Lawson (1971). A comparison betweenLaboratory and atmospheric density currents canbe-found in Simpson (1969).
1.6. WMO technical report No. 78- (1966)gives a brief note on duststorms as seen in radardisplays. The echoes appear ,very similar on thePPI, to thunderstorm echoes. On the RID theprecipitation aloft with none of it reaching theground can clearly be seen. The echoes aremostly cellular in structure, the height of the cellsoften reaching 12 krn ; the average height is about8 kilometres. Squall line type of duststorms withlength over 300 km and width between 8 and24 km have also been observed.2. Meteorological instruments used in this study
2.1. A skopograph (transmissometer) for thec0!ltinuous recording of horizontal visibility at aheight of about 2.8 metres above ground is loca-ted near the threshold of runway 28 at Delhi air-port. The distance between the projector andreceiver of the skopograph (base-line) is 150metres. Surface wind measurements are obtainedfrom two anemographs, one an electrical cup-generator anemograph with its sens.ors locatedvery close to the skopograph site, which has openground (without wind obstructions) -all aroundand the other a Dines' pressure tube anemographlocated on the roof of a building close to the AirTraffic Control building. The sensors of the elec-trical anemograph are at a height of about6 metres above ground. The Dines' P.T. anemo-graph is surrounded by building and its wind
, sensors are located at a height of about 16 metresabove ground level. The distance of the Dines'P.T. anemograph from the skopograph site is400 to 450 metres. Approximately midwaybetween the skopograph site and the Dines' P.T.anemograph is the surface observatory where
self-recording raingauge, thermograph and hygro-graph are installed (the latter two are installedin Stevenson screens at a height of 4 feet aboveground). Raingauge, thermograph, hygrographand a Dines' P.T. anemograph are also locatedat Safdarjung airport which is about 10 km east-northeast of Delhi airport. Data -from all theseinstruments are used in this study. - ,
2.2. A weather radar working on 3 cm wavelength was located close to Safdarjung airportduring the period covered by this study (it hassince been shifted and installed at Delhi airport).It has a useful range of 300 km in PPI and withRHI. Beam width is 10 conical.3. Classification of Andhi using visibiUty and wind
records
.3:1. Raipal and Joseph (1978) made a preli-mmary study of the visibility variations in 40Andhis which occurred at Delhi (Palam) air-port during the period June 1972 to June 1977for which complete records were available. Fromthe nature of variation of visibility and windspeed it was found that 4 types of Andhi occur.Type 1 and 2 are associated with well definedsqualls with the wind speed shooting to themaximum at the beginning itself and they havesimilar features. In all there were 20 such cases,14 under type 1 and 6 under type 2. Type 1cases have occurred during day time particularlyafternoon and evening (The 14 cases of type jduststorms have occurred during the period 12011ST to 2102 1ST. Out of these 11 'cases occurred during the period 1500 1ST to 2000 1ST)Type 2 cases occurred during night and mornin,hours (2107 1ST to 1054 1ST). In type 3 thdowndraft winds from the associated cumuknimbus or squall line have lasted 1 to 2 hours ~
_ in type 1 and 2, but they did not have a sharsquall to begin with. In type 3 there were 1cases. Type 4 is associated with individual shaigusts of wind from convective clouds lasting ffa few minutes, where the visibility reductionalso short-lived. .
3.2. A few detailed case studies of Andhistypes 1, 2 and 3 (which accounted for 85 pcent of the Andhis) using data from all avaable surface Meteorological instruments at Delairport and the weather radar are presentedthis paper.4. Type-! Andhi
4.1. Andhi of 13 May 19734.1.1. Fig. 1 gives the records of visibility a)
sl~rface.wind speed at Delhi airport associalWIth this duststorm. The prevailing visibility lfore -the duststorm was about 3 kin whichcharacteristic of the season, With the onsetthe duststorm there was a sudden fall of visibiJwhich began at 1515 1ST and in 2 to 3 minuthe lowest visibility in this duststorm of 1metres was reached. This may be called ph;A. The visibility remained below 200 metres .

F' . .;., I
;: .; ~;-. ANDID OF NORTHWEST INDIA 433
J<m:3
1·51
()'8
0·6 A>-~gO,4Ui:>
().2
c
B
KIIlJ.i"Rr---,----,10 0
, Fig. I. Visibility and_=_wind;:sjJeed variationsg in type-I Andhi of 13 May 1973
;I,I
\4001ST 1600
'-..,.L.....L-~...& 10" C1800 I ST"001 ST \600
Fig. 2', Temperature and humidity variations in the. type-I Andhi of 13 May 1973
about 8 minutes (i.e., till 1525 1ST) which maybe called phase B. Thereafter there was rapidimprovement of visibility (phase C) followed byslow improvement of visibility (phase D). Visi-bility remained below 1,000 metres in this severeduststorm for about 28 minutes which is theduration of the dustorm, Visibility improved to3 Ian by 1650 1ST.
4.1.2. Wind records show that the duststormwas associated with a squall of speed 84 km.p.h.at the site of the skopograph (recorded by theelectrical anemograph) and a speed of 74 km. p.h.,recorded by the Dines' P. T. Anemograph ..The squall was from the direction west. In thesquaU the 'maximum wind speed was reachedwithin 1 to 2 minutes after the beginning' of thewind increase. Ff9~ the records of visibility and
wind variations it is seen that the time of thesudden decrease of visibility and the time of thesudden increase in wind. speed were very nearlythe same (If there is a lag of a few, minutes,one from the other, it is however 110tpossible toknow it precisely from the records, as time re-solution Tn the chart is low). One feature ofinterest is that in the phase of rapid improve-ment of visibility, surface wind associated withthe duststorrn was still very strong.
4.1.3. Safdarjung airport also had a duststormthat day. The squall and duststorm set in: atSafdarjung airport at about 1525 1ST. The squallhad. a sharp wind maximum. of 66 km at thebeginning itself as at Delhi airport and it- wasfrom west-south-west direction. The squall andduststorm, therefore, covered the distance fromDelhi airport to Safdarjung airport in 10 minutesand _so the speed of movement. of the _duststormwas about 60 km. p.h. .
4.1.4. At Delhi airport there was a: tempera-ture drop of 6°C due to this duststorm (from41 Co to 35°C) and a rise in relative humiditythrough 16 per cent (from 12 per cent to 28 percent). These changes may be seen in Fig. 2. Themajor portion of the temperature fall took placein the first 2 minutes whereas the major portionof the humidity increase took place more slowlyin about 8 minutes from the beginning of theduststorm. The changes in Safdarjung airportwere similar. , , i~, . .
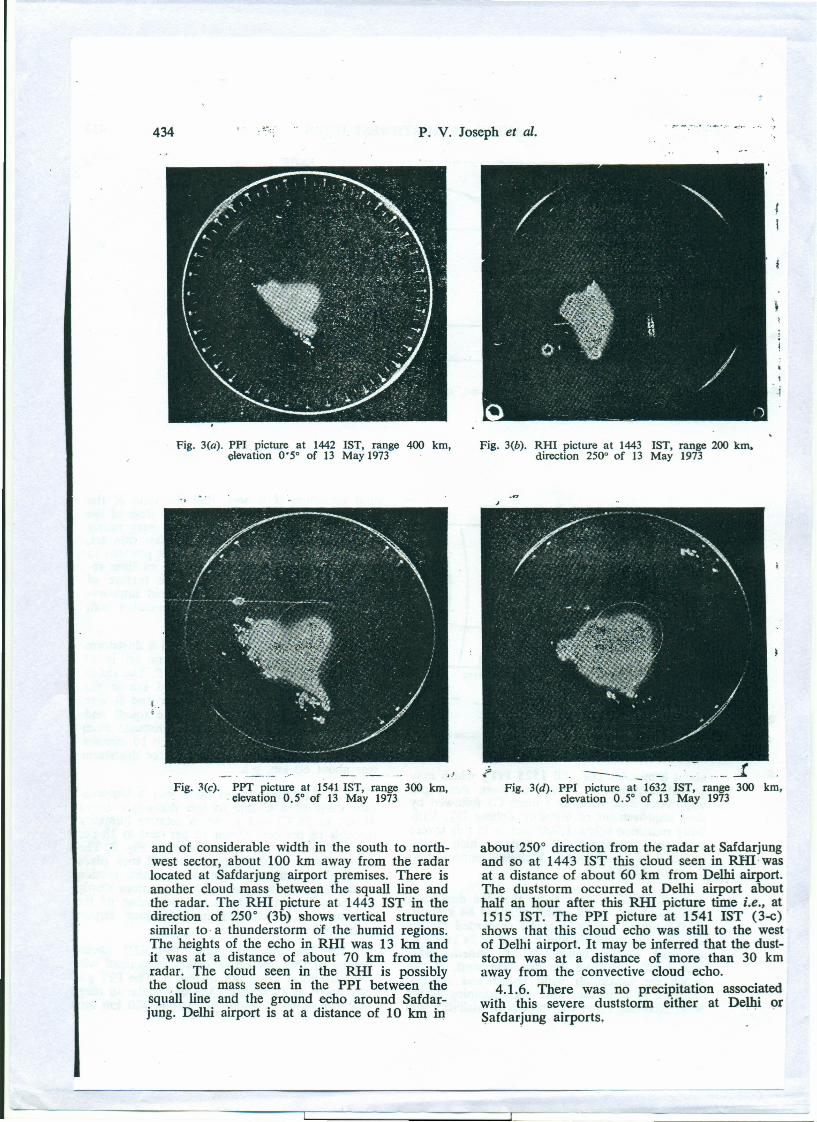
4.1.5. The available radar PPljRlll photo-graphs of the convective' clouds associated withthis duststorm are given in Fig. 3. The PPI pic-ture taken at 1442 1ST (3a) with radar in range400 km shows a squall [ine about 300 km lonl
. . .. ~..,.: - - -.
434 P. V. Joseph et al.
Fig. 3(a). PPI picture at 1442 1ST, range 400 km,elevation 0'50 of 13 May 1973
I.
Fig. 3(c). PPT picture at 1541 1ST, range 300 km,. elevation 0.50 of 13 May 1973
and of considerable width in the south to north-west sector, about 100 km away from the radarlocated at Safdarjung airport premises. There isanother cloud mass between the squall line andthe radar. The RHI picture at 1443 1ST in thedirection of 2500 (3b) shows vertical structuresimilar to a thunderstorm of the humid regions.The heights of the echo in RHI was 13 km andit was at a distance of about 70 km from theradar. The cloud seen in the RHI is possiblythe cloud mass seen in the PPI between thesquall line and the ground echo around Safdar-jung. Delhi airport is at a distance of 10 km in
.j
Fig. 3(b). RHI picture at 1443 1ST, range 200 km,direction 2500 of 13 May 1973
'--. -Fig. 3(d). PPI picture at 1632 JST, range 300 km,
elevation 0.50 of 13 May 1973
about 2500 direction from the radar at Safdarjungand so at 1443 1ST this cloud seen in RID· wasat a distance of about 60 km from Delhi airport.The duststorm occurred at Delhi airport abouthalf an hour after this RHI picture time i.e., at1515 1ST. The PPI picture at 1541 1ST (3-c)shows that this cloud echo was still to the westof Delhi airport. It may be inferred that the dust-storm was at a distance of more than 30 kmaway from the convective cloud echo.
4.1.6. There was no precipitation associatedwith this severe duststorm either at Delhi OfSafdarjung airports.

ANDHI OF NORTHWEST INDIAi
km
3-0
1-5
rooe
>0·6~..JiiiO·4 C., ins
0·2
435
• 0·'16001ST 1700 1800 1ST
Fig. 4. Visibility:andlwind speedjvariations in type-I Andhi of 20 May 1976
----.IiJ ----.----100
30
L-...L.-L-l..---l 0 %l'OOIH
L-...L.--l-~~ 101900lST 150015 T 17001S00lST 1700
•i
Fig. 5. Temperature & humidity variations in typ-elAndhi of 20. May 1976 .
4.2. Andhi of 20 May 19764.2.1. Fig. 4 gives visibility and wind varia-
tions in this duststorm as recorded at Delhi 'air-port. It is a typical record of a type-l duststormin which phase B is absent. It is a moderateduststorm. Visibility fall began at 1617 1ST andin one to two minutes the visibility reached thelowest value of 280 metres. Soon thereaftervisibility began improving at first rapidly andthereafter more slowly. Visibility was below 1000metres (duration of duststorm) for 14 minutes.Wind records show that the duststorm was asso-ciated with a sharp squall of speed 73 Ian. p. h.at the Dines' P.T~ Anemograph and a speed of80 Ian. p. h. at the site of the skopograph. Thesquall was from north-north-east direction.
4.2.2.' This duststorm was associated withabout 0.3 rom of rainfall at Delhi airport whichoccurred for a few minutes from 1635 1ST (i.e,
~.
18 minutes after the beginning of the duststorm),The variation of visibility marked R in the figuremay be due to this rainfall. The rainfall has notsignificantly affected the rate of improvement ofvisibility. Safdarjung airport recorded 2.2 mmrainfall between 1630 and 1645 1ST. The dust-storm had hit Safdarjung airport at 1613 1ST.
4.2.3. The temperature and humidity varia-tions in this duststorm may be seen from Fig. 5.There was considerable fall in temperature (fallof 13°C at Delhi airport from 38°C to 25°C)and also considerable rise in relative humidity(from 31 to 70 per cent). The fall in tempera-ture associated with phase A of the duststorm isonly 6.5°C at Delhi airport which is comparableto the fall in temperature in the case of theduststorm of 13 May 1973. The change in humi-dity is gradual here also as in the case of theduststorm of 13 May 1973 .
4.2.4. Fig. 6 (a, b, c, d) show the PPI pic-tures of the convective cloud associated with thisduststorm. At 1411 1ST there was a cloud massto the northwest of the radar at a distance of150 Ian. It became a squall lirie and reached alocation 90 Ian from the radar by 1512 1ST. Thesquall line further elongated and was about 30 to40 Ian away from Safdarjung and Delhi air-ports at 1612 1ST as may be seen from Fig. 6(c).At 1643 the echo was overhead Safdarjung andDelhi airports. The duststorm occurred at Delhiairport at 1617 1ST. The radar echo at the timeof the duststorm may be considered to be about30 Ian. away from the duststorm.
4.3. Andhi of 11 May 19764.3.1. Fig. 7 shows the visibility and wind
variations associated with this duststorm at Delhiairport. Visibility began falling at 2~0~ 1ST ~~in about two mmutes reached the mmnnum VISI-bility of 380 metres. Phases AI C and D are seen

436 P. V. JOSEPH et al.
:~ig-.6(a). PPI picture at 1411 1ST, range 400 krn,elevation 0.50 of 20 May 1976. Radius ofinner range ring~loo km
.. '
.,'
.}:ig, 6(c). PPI picture at 1612 1ST, range 400 km, elevation. . "0'50 of 20 May 1976: Radius ofrang&-1oo km
'in this duststorm also as in the case of the dust-.i.. storm of 13 May 1973, but during phase B there
is big fluctuation in the visibility. This moderateduststorm lasted 13 minutes. The associatedwirid variation is of the sharp squall type, with.Dines' P.T.·Aneznograph recording a maximum
'. _~wind -speed ~oJ 77. km, p.h. _and the electrical.. .anetnographirecording a speed of 91 km.· p.h.
.The squall was from north-northwest direction.
Fig. 6(b). PPI picture at 1512 1ST, range 400 knelevation 0.50 of 20 Mav 1976.- Radius·inner range ring-loo km .
Fig. 6(d). PPI picture at 1643 IST, range 400 km, elevati0'50 of 20 May 1976. Radius of range-1oo I
4.3.2. There was no rainfall associated withis duststorm at Delhi' airport but Safdarjinairport recorded 0.8 mm of rainfall during tperiod 2130 to 2145 1ST. The duststorm had 1Safdarjung almost at the same time as De:airport.
4.4. General characteristics 0/ type 1 Andl4.4.1. Examining the available 14 cases it
found that visibility falls rapidly - (in 1 to

ANDHI OF NORTHWEST INDIA
>-t:0'4.-.J
!!!~ 0·2 I--~---'----------"""'I:>
.' .437
I<m/HRr---:r--r-., 100
•
,.1
.: \
Fig. 7. Visibility and wind speed variations in type-l Andbi of 11 May 1976
t!. l---~-+--I--"----~0'8
1 0,('
J~ _
A
•
1;5
I ~----~------~~----~~--,0.8
0.&>-•...20.1.~>0.1 f----------~------.:.-~
a ,I t:....J'--...JL-.ll--L-JI--L-L---'---'--..1-..1.-..1--L--L..-L..-L.-L....::J
OOOOIST 0100 0200 OJOOIST
80
oUJUJ0..'enoz~
.&0
20
--...--'----' 00000 0100 02000300JST
-Fig. 8. Visibility and wind speed variations type-2 Andhi of 21 May 1976
minutes) from about 3 km, the general prevail-ing visibility during the duststorm season (April,May and J une) to as low a value as 100 metresin association with the squall of an advancingthunderstorm cloud. The squall is such that thewind speed suddenly rises to the maximum valueat the beginning itself and the wind speed there-after gradu,Wly falls off during the next one totwo hours. -A few minutes after the initial fallof visibility to the lowest value the visibilitybegins to improve at first rapidly and thereaftermore slowly. In the phase of rapid improvementof visibility surface wind associated with the con-vective cloud is still strong and gusting.
4.4.2. Some details regarding the 14 cases oftype 1 duststorm are given in Table 2. In generalit is seen that there is an inverse relation bet-ween squall' speed and the minimum visibilityreached. There is another inverse relationshipbetween the minimum visibility and the durationof the duststorm (period during which visibilityis less than 1,000 metres). Grouping the dust-
storms of type 1 according to their intensity, theaverages of minimum visibility, squall speed andduration of the duststorms have been worked outfor the 3 intensity classes and given in table 3.
5. Type-2 Andhi
5.1. This type is similar to type 1 except thatthe improvement in visibility is markedly slow.The associated wind speed variations (squall) isof the same type as in type 1 Andhi. Recordsfor six Andhis of this type are available andthese duststorms have occurred during the period2107 to 1054 1ST (night and morning hours).Two cases are described in the following para-graphs.
5.2. Andhi of 22 May 1976
5.2.1. Fig. 8 gives the records of visibility andsurface wind speed variations (recorded by Dines'P.T. Anemograph) associated with this duststormat Delhi airport. Visibility began falling rapidly'at 0041 1ST. The minimum visibility recorded
J
•

438 P. V. JOSEPH et al.TABLE 2
Meteorological data in respect of the 14 cases of type 1 Andhi
(As recorded at Delhi airport)
Date RemarksTime of Duration Lowest .Maximumbeginning of dust- visibility wind speedof dust- storm in the in thestorm minutes 'dust- associated1ST storm squall reo
metres corded byanemographr----A-----,
Elec- Dinestrieal P.T.
S.No.
Type ofdust-storm
.Temperature Humidity-change due change dueto the to theduststorm duststorm(in deg. C) (in per cent)
,----"-----, ~From To From To
Rainfallassocia-ted.withthe dust-storm(inmm).

,-. -
ANDlll OF ~ORTHWEST INDIA 439
•
Fig. 9(a). PPI picture at 2311 1ST. range 400 krn,elevation 0.50 of 21 May 1976. Radiueof range ring-« 100 km
J
•Fig. 9(c). PPI picture at 0111 IST, range 400 krn,
elevation 0.50 of 22 May 1976. Radius ofrange riui-l00 km
was 230 metres. Visibility remained below 1000metres (i.e., duration of the duststorm) for 80minutes and the improvement beyond 1000metres was very slow. All the four phases A,B,e and D of the A ndhi as seen in the type 1 caseof 13 May 1973 are seen here also, but eachphase is found to take more time than. in type 1.The wind record in this type 2 case was exactlysimilar to that of the Andhi of 13 May 1973 ;the maximum squall speed is also the same inboth the cases.
Fig. 9(b). PPI picture at 0011 1ST, range 400 km.elevation 0.50 of 22 May 1976. Radius ofrange ring-l00 km
Fig. 9(d). PPI picture at 0211 1ST, range 400 km,elevation 0.5° of 22 May 1976. Radius ofrange ring-l 00 km
5.2.2. There was no precipitation associatedwith this Andhi both at Delhi and Safdarjungair-ports. During tbe dustorm temperature fell from34°e to 31°e and humidity rose from 34 to
.37 per cent. .5.2.3. Fig. 9 (a, b, c, d) gives PPl pictures
taken in the Safdarjung radar kept in range of400 km. At 2311 1ST of 21 May 1976 scatteredechoes are seen roughly in the form of a diffusedline at a distance of about 160 km in the south-west to west sector. At 0011 1ST of 22 May 1976

P. V. JOSEPH et al.
O~ L-L-~~~-L~~-J~L-~~220'0 IST 2300 IST -.
Fig. 10. Visibility & wind speed variations in type-2 Andhi of1 June 1975
440
3,~,
1·5
I>- 06- t:,~ 0-6cO
"!!! '04>
(' O~t---------~----I
"
"
t5
I0-8
0·2 ~---------I
o1&.1&aIn.,Vl
0",z-~
...~
~"~'. ('
oUJUJc,
'"oz!it
1900
Fig. 11. Visibility and wind speed variations in type-3 Andhi of 20 April 1975
Fig. ,12(0). PPI picture at 1712 1ST, range 400 km,elevation O·5° of 20 Aoril 1975. Radius ofrange ring-loo.km .
Fig. 12(b).PPI picture at 1810 1ST, range 400 km,elevation O·5° of 20 April 1975. Radiusof range ring-1oo km

: - (' ._-.. '
ANDHI OF NORTHWEST INDIA 441
,t·
·Pig. •.....12(c).. PPl.pioture 'at 1911 1ST, .range 400·km, .elevation 0'5° of 20 ApriU975. Radius ofrange ring-s-l Of) k m' .
·r . ',
t
a well defined squall 'line' had formed about90. krn. away.. The. squall line moved .eastwardsand was almost overhead Delhi airport byOl lI .ISl'.The ..duststorm occurred at Delhi air-port at '0041. 1ST. It may therefore .be inferredthat the squall line was about 40 km away fromDelhi airport when the duststorm hit· Delhi air-port. Fig. 9 (d) shows that the echo has comple-tely dissipated by then.
5.3. Andhi of 1 June 19755.3.1. Fig. 10 gives the records of visibility,
and wind variations (recorded by the electricalanemograph) . associated with this duststormwhich began 'at 2207 1ST of 1 June 1975. This.is also si~pilarto a type 1 duststorm except thateach of HIe' phases B, C and D is slower thanthat of type 1; phase A is, however similar totype 1 as it has occurred in about 2 minutes.The minimum visibility recorded in this dust-storm was 520 metres. The duststorm lasted 33minutes. The maximum squall speed as recordedby the electrical anemograph was 67 km. p.h.
5.3.2. There was no precipitation associatedwith this duststorm both at Delhi and Safdarjungairports. During the duststorm temperature drop-ped from 30.5°C to 28.5°C and humidity fellfrom 38 per cent to 36 per cent.
6. Type-3 Andhi
6.1. In this type of duststorm the surface windvariations associated with the downdraft of thethunderstorm cloud are not of the sharp squalltype, although the strong wind associated with-the squall lasts 1 to 2 hours. The wind variations
Fig. 12(d). PPI picture at 2013 1ST, range 400 km,elevation O· 5° of 20. April 1975. Radius'of rang ring~l00 km ..
.'
are irregular. The wind maximum' is reached10 to 20 minutes (or even later than that) after.thedowridraft wind has set in at the station.Correspondingly the visibility variations are alsoirregular. A typical example of this type is des-'cribed in the following paragraphs.
6.2. Andhi of 20 April 19756.2.1. Fig. 11 gives the records of visibility
and surface wind (recorded by Dines' P.T.Anemograph) associated with this duststorm.Surface wind speed increase began at 1900 1ST'and the maximum wind speed of 62 km. p.h.: (inDines' P.T. Anemograph) was reached by1925 1ST. The corresponding visibility variationswere irregular although a rather sudden fall ofvisibility began at 1905 1ST. The 'peak showingthe i minimum visibility was at 1925 1ST coin-ciding with the peak iri wind speed. '..
6.2.2. There was no precipitation' associatedwith this duststorm at Delhi airport; Safdarjungairport recorded trace rainfall. During the dust-storm temperature fell from 35.5°C to 32.2°Cand humidity rose from 17 per cent to 24 percent.
6.2.3. Fig. 12 (a, b, c, d) 'gives the PPI pic-tures taken in the Safdarjung radar kept in range400 km. At 1712 1ST a squall line is seen 10Qkmto the west (near the inner most range ring).The squall line is the one that caused the Andhiat Delhi airport. Another area with scatteredcloud echoes is 'Seen between 200 and 300 kmaway to the southwest. Fig. 12(b & c) show thatthe squall line moved northeastwards dissipatingas it approached Delhi airport. At 1911 1ST

442 P. V. JOSEPH et al.Fig. 12(c) the Cb cloud echo is seen about 30 km initial improvement is fast. During this period ofto the north of Delhi airport. Fig. 12(b) gives rapid improvement in visibility strong down-draftsthe position at 1810 1ST. The duststorm hit Delhi can be expected which could pose problems forairport at 1905 1ST very close to the picture aircraft operations if these down-drafts are nottime of Fig. 12(c). By 2013 1ST Fig. 12(d) the properly, understood and suitable proceduressquall line had completely dissipated and in the drawn to cope with them.PPI scope the other cloud cluster which hasbecome a squall line by then is seen at a dis-tance of 100 km.7. Conclusion
7.1. The study presented in this paper usingavailable meteorological records has given someuseful information regarding the downdrafts andthe visibility variations in Andhi occurring atDelhi airport. From the nature of variations ofvisibility and surface wind it was found that 4types of Andhi occur. A rough picture of thedistance between the cumulonimbus or squall lineand the ground level position of the gust-frontor the dust-wall has also been obtained.
7.2. More studies are needed particularly onthe structure of the Andhi dust-wall and its speedof movement, development and decay. The verti-cal structure of the A ndhi atmosphere has alsoto be studied. These studies are needed to under-stand the mechanism of the formation of theA ndhi dust-wall and its maintenance and propa-gation.
7.3. The study of air motions in and aroundthe Andhi dust-wall is also important in relationto aircraft operations. Soon after an Andhi hashit a station visibility begins to improve. and the
References
Bhalotra, Y. P. R., 1954, Will it be a dusrstorrn or thunder-storm, Indian J. Met. Geophys., 5, p. 290.
Hankin, E. H., 1921, On dust raising winds and descendingcurrents, Indian met. memoirs, 22, part VI.
Idso, S. B., R. S. Ingram and Pitchard, 1.M., 1972, An Arnerican Haboob, Bull. Amer. Met. Soc.,53, pp.930-935.
Lawson, T. L., 1971, Haboob structure at Khartoum,Weather,26, pp. 105-112.
Raipal, D. K. and Joseph, P. V., 1978, Visibility variations in- convective duststorrns at Delhi airport-Paper pre-
sented at the eighth Conference of Forecasting Officers\ held at Pune in January 1978 (Submitted for publica-
lion in Vayumandal).
Simpson, J. E., 1969, A comparison between laboratoryand atmospheric density currents, Quart. Jour R. met.Soc.,95, pp. 758-765.
Srinivasiah, B. N. and Sur, N. K., 1939, A study of dust-storms of Agra, Indian met. Memoir, 27, part I.·
Sutton, L. J., 1925, Haboobs, Quart. J. R. met. Soc., 51,pp. 25-30.
World Meteorological Organisation, 1966, Use of groundbased radar in meteorology, Technical Note 78,pp.42-4': .
.....;, .