RGE Sleptsova Ukraine's perfect storm
10
EMERGING EUROPE AND CIS 1 Page | 1 www.roubini.com NEW YORK - 95 Morton Street, 6th Floor, New York, NY 10014 | TEL: 212 645 0010 | FAX: 212 645 0023 | [email protected] | [email protected] LONDON - 120 Holborn, 5th Floor, London EC1N 2TD | TEL: +44 (0) 207 092 8850 | FAX: +44 (0) 207 242 4783 | [email protected] © Roubini Global Economics 2013 - All Rights Reserved. No duplication or redistribution of this document is permitted without written consent. December 16, 2013 Ukraine’s Perfect Storm: Stay Clear While Political Crisis Persists By Evghenia Sleptsova Ukraine’s last-minute U-turn, bowing to Russian pressure and suspending preparations for an Association Agreement with the EU, was an attempt to achieve short-term economic stability at the cost of medium-term development. However, the strategy misfired and triggered a political crisis, with over 500,000 protesters taking to the streets, demanding the President step down. Bottom line: We believe the risk of a currency crisis and default has increased significantly: 40%, versus our earlier estimate of 25%. Previously, we thought Ukraine could “muddle through” and avoid a debt restructuring in the next 12 months. However, the government’s efforts to avoid a default at all costs (given the upcoming 2015 presidential election), the stand-off with Russia and lack of agreement with the IMF, and the civil unrest, increase the odds of at least a partial debt restructuring, which is unlikely to be orderly. We see a 70%+ chance of Ukraine proceeding with closer integration with Russia in the short term, eschewing the European path. Within this, there is a 50/50 chance of the political crisis escalating and causing a disorderly devaluation and partial debt restructuring, or an uneasy calm facilitating a “muddle through.” We see a 30% chance of Ukraine signing the EU Association Agreement and reaching an IMF deal, in which event the external debt burden will gradually stabilize toward 2017. Market implications: Avoid Ukrainian assets as long as political risk persists. Although we do not expect Ukraine to default on its debts, external debt spreads may widen further in the near term as reserves deplete. Thereafter, signs of the civil unrest subsiding will provide opportunities to enter external debt. Avoid UAH, which is poised for a 15% step devaluation; moreover, the risk of a disorderly and larger (30%) devaluation persists. Figure 1: Key Scenarios for Ukraine’s Political and Financial Impasse Source: RGE Scenario 1A Scenario 1B Scenario 2 Closer integration with Russia, exacerbating political crisis (35%) Closer integration with Russia; political crisis overcome (35%) Association Agreement with EU signed (30%) No Russia-related current account shock No current account shock Russia-related current account shock, of up to 2% of GDP Political crisis escalates Protests subside into uneasy calm on broad support for EU integration, deteriorating in 2015 election Political crisis overcome Run on FX deposits and disorderly devaluation of 30% No run on FX deposits, no devaluation Managed 10-15% devaluation Russian bailout is insufficient to compensate for sharp devaluation Bailout from Russia sufficient to avoid debt restructuring IMF bailout External debt spikes to 115% of GDP in 2014, increasing risk of coercive debt restructuring Interest rates stay high on persisting imbalances and ongoing political uncertainty, ext. debt reaches 89% by 2017 Interest rates decline (8% on average over 2014- 17); debt initially rises to 86% of GDP, but stabilizes at 76% by 2017
-
Upload
independent -
Category
Documents
-
view
4 -
download
0
Transcript of RGE Sleptsova Ukraine's perfect storm

EMERGING EUROPE AND CIS
1
Page | 1
www.roubini.com
NEW YORK - 95 Morton Street, 6th Floor, New York, NY 10014 | TEL: 212 645 0010 | FAX: 212 645 0023 | [email protected] | [email protected] LONDON - 120 Holborn, 5th Floor, London EC1N 2TD | TEL: +44 (0) 207 092 8850 | FAX: +44 (0) 207 242 4783 | [email protected] © Roubini Global Economics 2013 - All Rights Reserved. No duplication or redistribution of this document is permitted without written consent.
December 16, 2013
Ukraine’s Perfect Storm: Stay Clear While Political
Crisis Persists By Evghenia Sleptsova
Ukraine’s last-minute U-turn, bowing to Russian pressure and suspending preparations for an
Association Agreement with the EU, was an attempt to achieve short-term economic stability at the
cost of medium-term development. However, the strategy misfired and triggered a political crisis,
with over 500,000 protesters taking to the streets, demanding the President step down.
Bottom line: We believe the risk of a currency crisis and default has increased significantly: 40%,
versus our earlier estimate of 25%. Previously, we thought Ukraine could “muddle through” and
avoid a debt restructuring in the next 12 months. However, the government’s efforts to avoid a
default at all costs (given the upcoming 2015 presidential election), the stand-off with Russia and lack
of agreement with the IMF, and the civil unrest, increase the odds of at least a partial debt
restructuring, which is unlikely to be orderly.
We see a 70%+ chance of Ukraine proceeding with closer integration with Russia in the short term,
eschewing the European path. Within this, there is a 50/50 chance of the political crisis escalating and
causing a disorderly devaluation and partial debt restructuring, or an uneasy calm facilitating a
“muddle through.” We see a 30% chance of Ukraine signing the EU Association Agreement and
reaching an IMF deal, in which event the external debt burden will gradually stabilize toward 2017.
Market implications: Avoid Ukrainian assets as long as political risk persists. Although we do not
expect Ukraine to default on its debts, external debt spreads may widen further in the near term as
reserves deplete. Thereafter, signs of the civil unrest subsiding will provide opportunities to enter
external debt. Avoid UAH, which is poised for a 15% step devaluation; moreover, the risk of a
disorderly and larger (30%) devaluation persists.
Figure 1: Key Scenarios for Ukraine’s Political and Financial Impasse
Source: RGE
Scenario 1A Scenario 1B Scenario 2
Closer integration with Russia, exacerbating
political crisis (35%)
Closer integration with Russia; political crisis
overcome (35%)Association Agreement with EU signed (30%)
No Russia-related current account shock No current account shock Russia-related current account shock, of up to
2% of GDP
Political crisis escalates Protests subside into uneasy calm on broad
support for EU integration, deteriorating in
2015 election
Political crisis overcome
Run on FX deposits and disorderly devaluation
of 30%
No run on FX deposits, no devaluation Managed 10-15% devaluation
Russian bailout is insufficient to compensate
for sharp devaluation
Bailout from Russia sufficient to avoid debt
restructuring
IMF bailout
External debt spikes to 115% of GDP in 2014,
increasing risk of coercive debt restructuring
Interest rates stay high on persisting imbalances
and ongoing political uncertainty, ext. debt
reaches 89% by 2017
Interest rates decline (8% on average over 2014-
17); debt initially rises to 86% of GDP, but
stabilizes at 76% by 2017
EMERGING EUROPE AND CIS
2
Page | 2
www.roubini.com
NEW YORK - 95 Morton Street, 6th Floor, New York, NY 10014 | TEL: 212 645 0010 | FAX: 212 645 0023 | [email protected] | [email protected] LONDON - 120 Holborn, 5th Floor, London EC1N 2TD | TEL: +44 (0) 207 092 8850 | FAX: +44 (0) 207 242 4783 | [email protected] © Roubini Global Economics 2013 - All Rights Reserved. No duplication or redistribution of this document is permitted without written consent.
After years of failing to resolve either its macroeconomic or geopolitical challenges, Ukraine seems to have
reached a day of reckoning. Having made a last-minute U-turn away from the EU, bowing to Russia’s political and
economic pressure, the government is still trying to maintain the status quo in its relations with Russia and the EU.
But this strategy has instead left Ukraine between a rock and hard place. The magnitude of the public protests
does not let Ukraine proceed easily with closer integration with Russia, and the latter will resist offering significant
financial assistance or cheaper gas without first securing Ukraine’s commitment to closer cooperation.
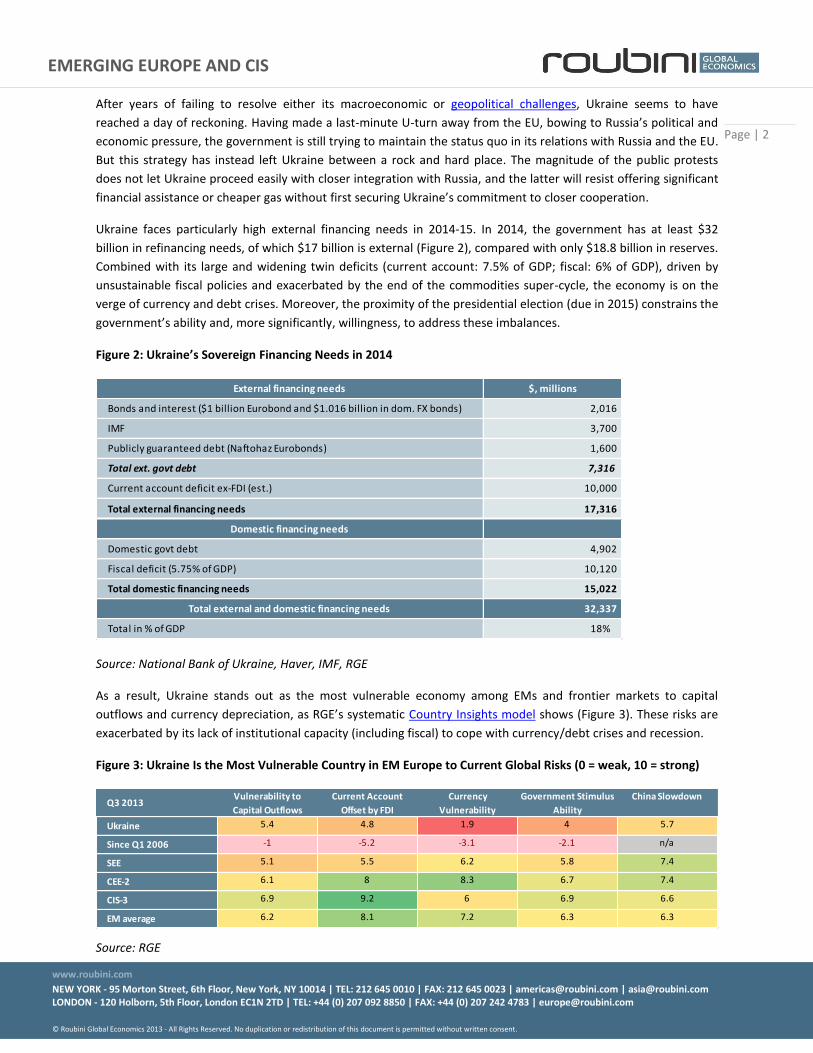
Ukraine faces particularly high external financing needs in 2014-15. In 2014, the government has at least $32
billion in refinancing needs, of which $17 billion is external (Figure 2), compared with only $18.8 billion in reserves.
Combined with its large and widening twin deficits (current account: 7.5% of GDP; fiscal: 6% of GDP), driven by
unsustainable fiscal policies and exacerbated by the end of the commodities super-cycle, the economy is on the
verge of currency and debt crises. Moreover, the proximity of the presidential election (due in 2015) constrains the
government’s ability and, more significantly, willingness, to address these imbalances.
Figure 2: Ukraine’s Sovereign Financing Needs in 2014
Source: National Bank of Ukraine, Haver, IMF, RGE
As a result, Ukraine stands out as the most vulnerable economy among EMs and frontier markets to capital
outflows and currency depreciation, as RGE’s systematic Country Insights model shows (Figure 3). These risks are
exacerbated by its lack of institutional capacity (including fiscal) to cope with currency/debt crises and recession.
Figure 3: Ukraine Is the Most Vulnerable Country in EM Europe to Current Global Risks (0 = weak, 10 = strong)
Source: RGE
External financing needs $, millions
Bonds and interest ($1 billion Eurobond and $1.016 billion in dom. FX bonds) 2,016
IMF 3,700
Publicly guaranteed debt (Naftohaz Eurobonds) 1,600
Total ext. govt debt 7,316
Current account deficit ex-FDI (est.) 10,000
Total external financing needs 17,316
Domestic financing needs
Domestic govt debt 4,902
Fiscal deficit (5.75% of GDP) 10,120
Total domestic financing needs 15,022
Total external and domestic financing needs 32,337
Total in % of GDP 18%
Q3 2013 Vulnerability to
Capital Outflows
Current Account
Offset by FDI
Currency
Vulnerability
Government Stimulus
Ability
China Slowdown
Ukraine 5.4 4.8 1.9 4 5.7
Since Q1 2006 -1 -5.2 -3.1 -2.1 n/a
SEE 5.1 5.5 6.2 5.8 7.4
CEE-2 6.1 8 8.3 6.7 7.4
CIS-3 6.9 9.2 6 6.9 6.6
EM average 6.2 8.1 7.2 6.3 6.3
EMERGING EUROPE AND CIS
3
Page | 3
www.roubini.com
NEW YORK - 95 Morton Street, 6th Floor, New York, NY 10014 | TEL: 212 645 0010 | FAX: 212 645 0023 | [email protected] | [email protected] LONDON - 120 Holborn, 5th Floor, London EC1N 2TD | TEL: +44 (0) 207 092 8850 | FAX: +44 (0) 207 242 4783 | [email protected] © Roubini Global Economics 2013 - All Rights Reserved. No duplication or redistribution of this document is permitted without written consent.
Currency Peg Strains Already Overstretched External Balances
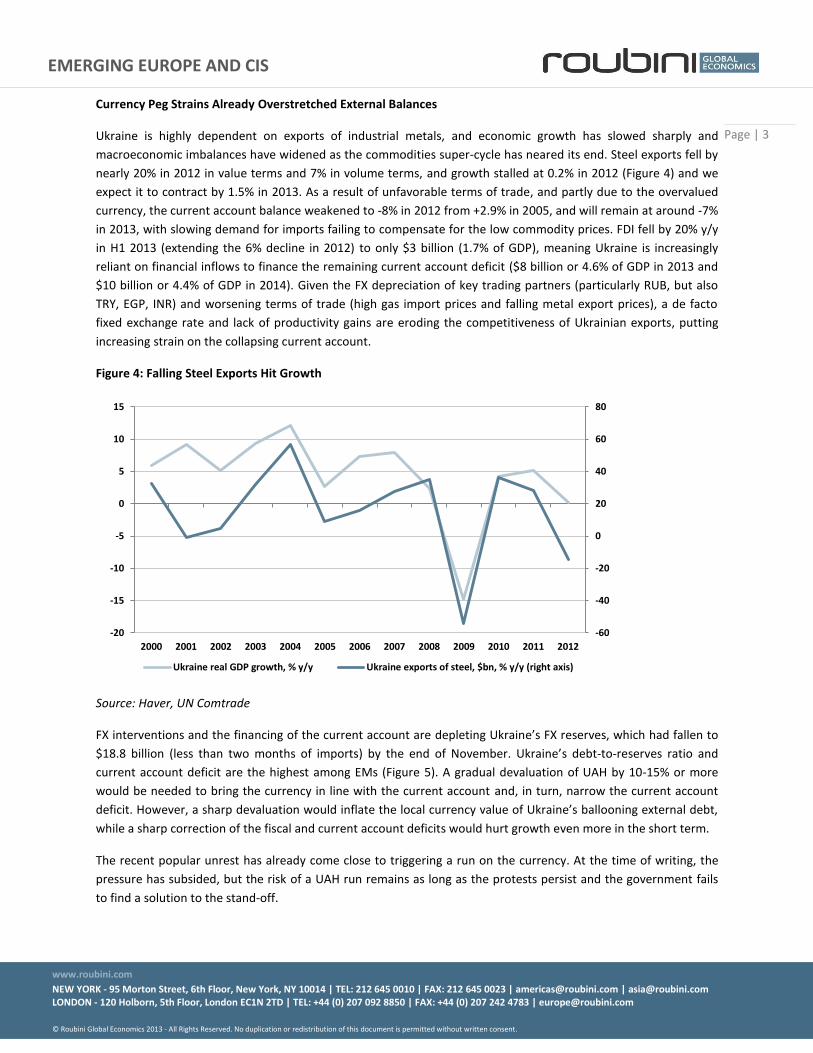
Ukraine is highly dependent on exports of industrial metals, and economic growth has slowed sharply and
macroeconomic imbalances have widened as the commodities super-cycle has neared its end. Steel exports fell by
nearly 20% in 2012 in value terms and 7% in volume terms, and growth stalled at 0.2% in 2012 (Figure 4) and we
expect it to contract by 1.5% in 2013. As a result of unfavorable terms of trade, and partly due to the overvalued
currency, the current account balance weakened to -8% in 2012 from +2.9% in 2005, and will remain at around -7%
in 2013, with slowing demand for imports failing to compensate for the low commodity prices. FDI fell by 20% y/y
in H1 2013 (extending the 6% decline in 2012) to only $3 billion (1.7% of GDP), meaning Ukraine is increasingly
reliant on financial inflows to finance the remaining current account deficit ($8 billion or 4.6% of GDP in 2013 and
$10 billion or 4.4% of GDP in 2014). Given the FX depreciation of key trading partners (particularly RUB, but also
TRY, EGP, INR) and worsening terms of trade (high gas import prices and falling metal export prices), a de facto
fixed exchange rate and lack of productivity gains are eroding the competitiveness of Ukrainian exports, putting
increasing strain on the collapsing current account.
Figure 4: Falling Steel Exports Hit Growth
Source: Haver, UN Comtrade
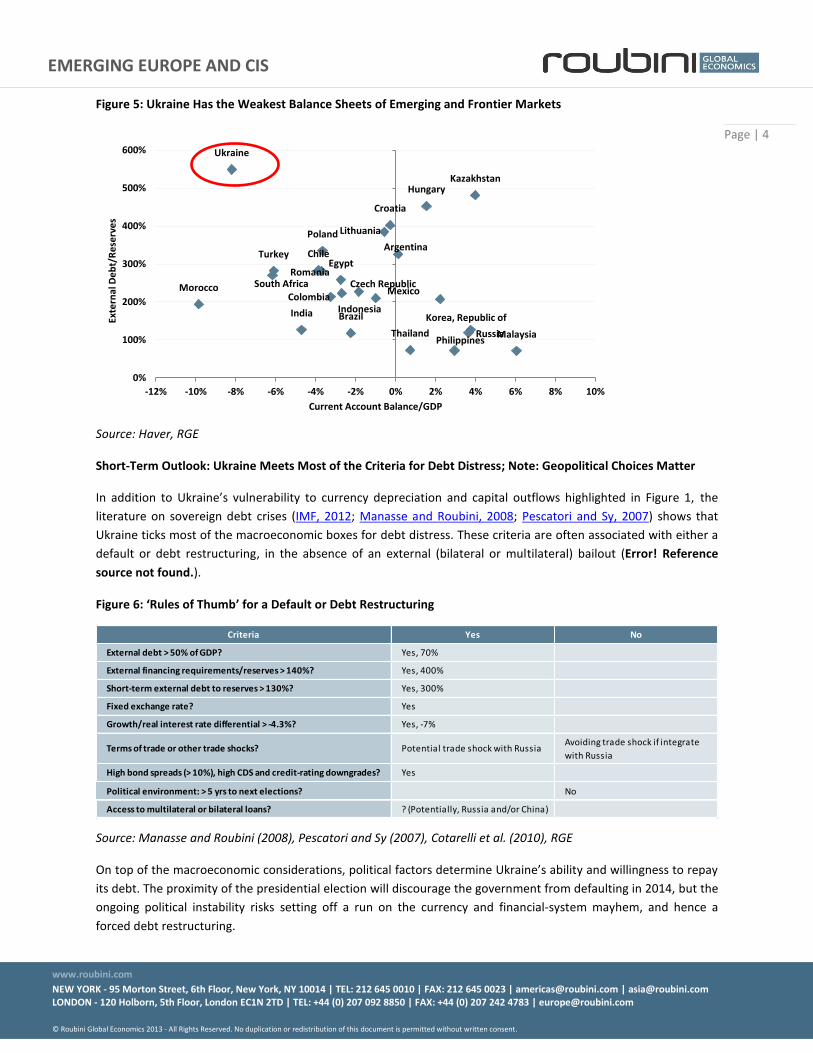
FX interventions and the financing of the current account are depleting Ukraine’s FX reserves, which had fallen to
$18.8 billion (less than two months of imports) by the end of November. Ukraine’s debt-to-reserves ratio and
current account deficit are the highest among EMs (Figure 5). A gradual devaluation of UAH by 10-15% or more
would be needed to bring the currency in line with the current account and, in turn, narrow the current account
deficit. However, a sharp devaluation would inflate the local currency value of Ukraine’s ballooning external debt,
while a sharp correction of the fiscal and current account deficits would hurt growth even more in the short term.
The recent popular unrest has already come close to triggering a run on the currency. At the time of writing, the
pressure has subsided, but the risk of a UAH run remains as long as the protests persist and the government fails
to find a solution to the stand-off.
-60
-40
-20
0
20
40
60
80
-20
-15
-10
-5
0
5
10
15
2000 2001 2002 2003 2004 2005 2006 2007 2008 2009 2010 2011 2012
Ukraine real GDP growth, % y/y Ukraine exports of steel, $bn, % y/y (right axis)
EMERGING EUROPE AND CIS
4
Page | 4
www.roubini.com
NEW YORK - 95 Morton Street, 6th Floor, New York, NY 10014 | TEL: 212 645 0010 | FAX: 212 645 0023 | [email protected] | [email protected] LONDON - 120 Holborn, 5th Floor, London EC1N 2TD | TEL: +44 (0) 207 092 8850 | FAX: +44 (0) 207 242 4783 | [email protected] © Roubini Global Economics 2013 - All Rights Reserved. No duplication or redistribution of this document is permitted without written consent.
Figure 5: Ukraine Has the Weakest Balance Sheets of Emerging and Frontier Markets
Source: Haver, RGE
Short-Term Outlook: Ukraine Meets Most of the Criteria for Debt Distress; Note: Geopolitical Choices Matter
In addition to Ukraine’s vulnerability to currency depreciation and capital outflows highlighted in Figure 1, the
literature on sovereign debt crises (IMF, 2012; Manasse and Roubini, 2008; Pescatori and Sy, 2007) shows that
Ukraine ticks most of the macroeconomic boxes for debt distress. These criteria are often associated with either a
default or debt restructuring, in the absence of an external (bilateral or multilateral) bailout (Error! Reference
source not found.).
Figure 6: ‘Rules of Thumb’ for a Default or Debt Restructuring
Source: Manasse and Roubini (2008), Pescatori and Sy (2007), Cotarelli et al. (2010), RGE
On top of the macroeconomic considerations, political factors determine Ukraine’s ability and willingness to repay
its debt. The proximity of the presidential election will discourage the government from defaulting in 2014, but the
ongoing political instability risks setting off a run on the currency and financial-system mayhem, and hence a
forced debt restructuring.
Argentina
Brazil
Chile
Colombia
Croatia
Czech Republic
Egypt
Hungary
India Indonesia
Kazakhstan
Korea, Republic of
Lithuania
Malaysia
Mexico Morocco
Philippines
Poland
Romania
Russia
South Africa
Thailand
Turkey
Ukraine
0%
100%
200%
300%
400%
500%
600%
-12% -10% -8% -6% -4% -2% 0% 2% 4% 6% 8% 10%
Exte
rnal
De
bt/
Re
serv
es
Current Account Balance/GDP
Criteria Yes No
External debt > 50% of GDP? Yes, 70%
External financing requirements/reserves > 140%? Yes, 400%
Short-term external debt to reserves > 130%? Yes, 300%
Fixed exchange rate? Yes
Growth/real interest rate differential > -4.3%? Yes, -7%
Terms of trade or other trade shocks? Potential trade shock with RussiaAvoiding trade shock if integrate
with Russia
High bond spreads (> 10%), high CDS and credit-rating downgrades? Yes
Political environment: > 5 yrs to next elections? No
Access to multilateral or bilateral loans? ? (Potentially, Russia and/or China)
EMERGING EUROPE AND CIS
5
Page | 5
www.roubini.com
NEW YORK - 95 Morton Street, 6th Floor, New York, NY 10014 | TEL: 212 645 0010 | FAX: 212 645 0023 | [email protected] | [email protected] LONDON - 120 Holborn, 5th Floor, London EC1N 2TD | TEL: +44 (0) 207 092 8850 | FAX: +44 (0) 207 242 4783 | [email protected] © Roubini Global Economics 2013 - All Rights Reserved. No duplication or redistribution of this document is permitted without written consent.
Ukraine’s geopolitical choices have implications for both the restoration of public order and for external debt
refinancing options. The EU option comes with medium-term gains, but short-term losses from the inevitable
Russian trade and economic retaliation. The Ukrainian government was hoping that the EU would also help it strike
a more favorable deal with the IMF, avoiding or moderating the most politically sensitive condition—phasing out
gas-price subsidies for households. Despite the EU’s attempts (with no formal mandate), the IMF did not change its
conditions, which, according to Ukrainian Prime Minister Nikolay Azarov, was one of the reasons why Ukraine
suspended talks with the EU and chose the “pragmatic short-term option” of reconciliation with Russia.
However, by suspending EU negotiations, the government miscalculated the scale of the public response. After
massive protests broke out across the country, reignited by the use of force, the government found itself cornered.
The option of realigning with Russia may now turn out to be politically more costly than the consequences of
signing up to the Association Agreement or an IMF deal, yet the short-term costs of a trade war with Russia still
appear prohibitively high. Despite mounting pressure from the streets, at the time of writing the authorities
appeared to be continuing to bargain with both Russia and the EU, sending delegations to Brussels and Moscow.
Short-Term Scenarios: Refinancing Options and Debt Sustainability
Although the situation is highly unpredictable, we see the following key scenarios unfolding over the next months.
These have implications for Ukraine’s longer-term debt sustainability, which we assess using the IMF External Debt
Sustainability framework. In all of these scenarios, the risks of a currency crisis and default remain very high in the
short term, should the political uncertainty persist.
Although closer integration with Russia is our base case for the short term (next one-to-two years), in the longer
term overwhelming public support for EU integration will make this option unsustainable. We believe that this or
the next government will eventually return to the European path.
Scenario 1: Reconciliation With Russia, Despite Popular Protests (70% Probability)
Apart from being a major trade partner (accounting for 25% of Ukraine’s merchandise exports), Russia is Ukraine’s
major creditor: Ukraine’s Naftogaz is consistently late on its payments to Russia’s Gazprom for gas imports ($2
billion debt is outstanding for August-November); and Russian banks account for 12% of Ukrainian banking-sector
assets. Ukraine has little room for maneuver, given its debt-burdened economy, lack of market access (and
unwillingness to accept the IMF’s conditions) and the risk of a trade shock from Russia.
By bowing to Russian pressure, the government is trying to extract as many concessions as possible (loans, cheaper
gas), while ceding as little sovereignty as it can. The public protests make a formal Ukrainian commitment to
Russia’s Customs Union unlikely, at least prior to the 2015 election. But the government is likely to commit to
some form of closer integration with Russia, trying to defuse the protests by continuing negotiations with the EU
and the opposition, and potentially reshuffling the cabinet.
Scenario 1A (35%): This sub-scenario would see a return to the use of force and/or an outright commitment to
Russia’s Customs Union. This would cause political instability to rise and could trigger a run on foreign currency
deposits and a disorderly currency devaluation, and might force the government or quasi-sovereign corporates
into debt restructuring.
In the case of a disorderly 30% UAH depreciation and a spike in long-term interest rates to at least 16% (staying
elevated at 10% thereafter) and no current account shock, the external debt burden would hit 115% of GDP in
2013-14, increasing the risk of a coercive debt restructuring (Figure 7, 1A).

EMERGING EUROPE AND CIS
6
Page | 6
www.roubini.com
NEW YORK - 95 Morton Street, 6th Floor, New York, NY 10014 | TEL: 212 645 0010 | FAX: 212 645 0023 | [email protected] | [email protected] LONDON - 120 Holborn, 5th Floor, London EC1N 2TD | TEL: +44 (0) 207 092 8850 | FAX: +44 (0) 207 242 4783 | [email protected] © Roubini Global Economics 2013 - All Rights Reserved. No duplication or redistribution of this document is permitted without written consent.
Scenario 1B (35%): A “muddle through” sub-scenario is equally possible: The government would reach an
agreement with Russia on a deal that is short of the Customs Union; the opposition would be weak; the legal case
for the dissolution of the government would be missing; and the protests might fade in cold weather. Political risk
would subside until the election, giving room for spread compression. However, integration with Russia would
remove incentives for structural and institutional reforms (as opposed to EU integration), imbalances would
persist, borrowing costs would remain high (at around 9%) and external debt would ultimately be unsustainable,
but might avoid an immediate adjustment, reaching 89% by 2017 (Figure 7, Scenario 1B).
Figure 7: Debt-Sustainability Scenarios (external debt as % of GDP)
Source: IMF External Debt Sustainability Analysis, RGE
Scenario 2: Ukraine Signs Association Agreement With EU (30% Probability)
Although it is not our short-term baseline, and recent news from Brussels makes it unlikely. Ukraine might still sign
the Association Agreement, with the EU-Ukraine summit in March 2014 likely to be the next opportunity.
Having realized the fiasco of its negotiation tactics in the run up to the EU Eastern Partnership Summit in Vilnius on
November 28-29, the EU initially tried to change its approach by offering Ukraine more “carrots” (i.e., financial
support for the implementation of the Association Agreement and more support in Ukraine’s negotiations with the
IMF), while potentially downplaying the “sticks” (the demand that Ukraine should free former prime minister Yulia
Tymoshenko from jail). However, EU officials were unable to increase funding very much.
Moreover, oligarchs are a major political force in Ukraine (as we have discussed), and many of them would still
favor European integration over the Russian-led Customs Union for pragmatic reasons (i.e., ensuring their property
rights and access to broader global markets). For now, Ukraine’s President, Viktor Yanukovych, has neutralized the
initial signs that these oligarchs might side with the opposition, but the risk remains. In 2004, most oligarchs
supported the then-President Leonid Kuchma and his successor Yanukovych but, when protests reached 1 million
people, several oligarchs switched sides, changing the course of the revolution. Should political risks escalate this
time, a split among Ukraine’s business elites could see the country return to the negotiating table with the EU.
77
89
67
119
130
85
76
40
50
60
70
80
90
100
110
120
130
140
2007 2008 2009 2010 2011 2012 2013 2014 2015 2016 2017
Gro
ss E
xte
rnal
De
bt
as %
of
GD
P
Rapprochement with Russia, muddle-through (35% probability)
Rapprochement with Russia, sharp deval. (35% probability)
AA signed, CAB shock (30% probability)
Historical
EMERGING EUROPE AND CIS
7
Page | 7
www.roubini.com
NEW YORK - 95 Morton Street, 6th Floor, New York, NY 10014 | TEL: 212 645 0010 | FAX: 212 645 0023 | [email protected] | [email protected] LONDON - 120 Holborn, 5th Floor, London EC1N 2TD | TEL: +44 (0) 207 092 8850 | FAX: +44 (0) 207 242 4783 | [email protected] © Roubini Global Economics 2013 - All Rights Reserved. No duplication or redistribution of this document is permitted without written consent.
In this scenario, we assume that Ukraine would face a current account shock in 2014 from falling trade with Russia,
of around 2% of GDP, and undergo a managed UAH depreciation of 10% under an IMF program. Growth would
initially stagnate at 1% in 2014, but would then recover to 2.5% in 2015. At the same time, Ukraine would benefit
from declining interest rates on long-term external debt (on average 8% in 2014-17) and higher FDI (up from 1.7%
in 2013 to 3% in 2014 and 5% from 2015 onward), which would reduce its debt-service burden and current
account financing needs. In this event, external debt would initially spike to around 84% of GDP in 2014, but would
then be on a consistent declining trajectory, stabilizing at 76% by 2017 (Figure 7, Scenario 2).
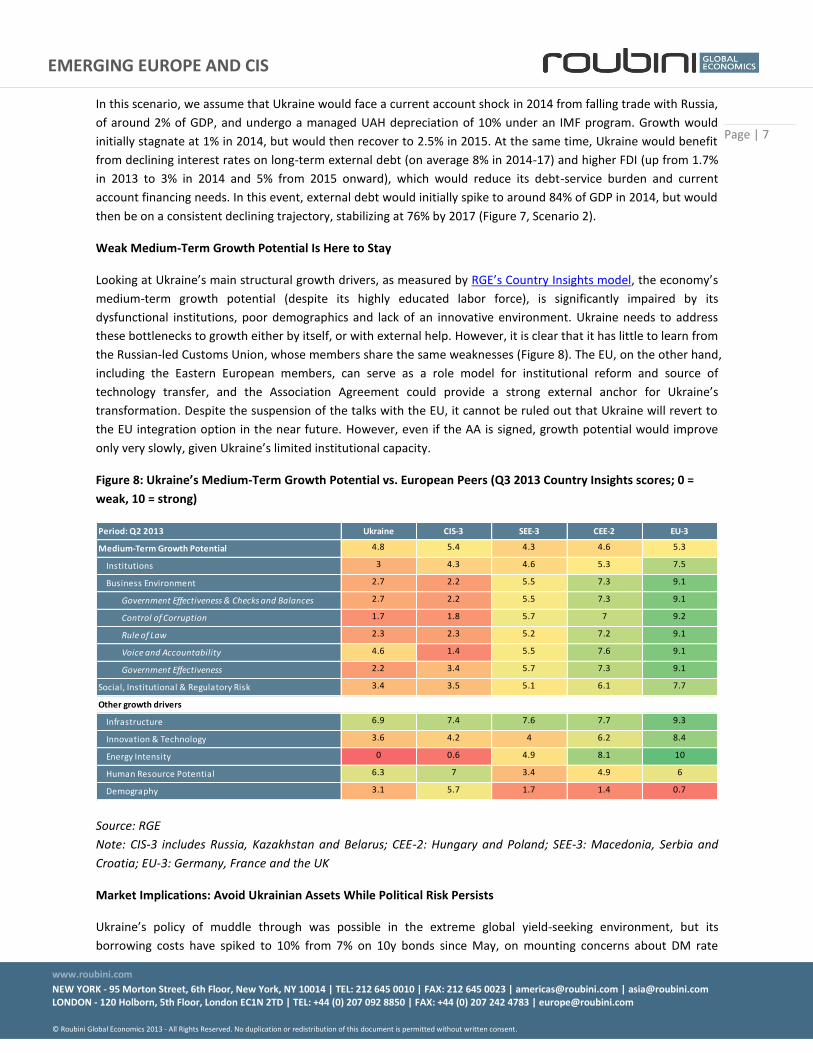
Weak Medium-Term Growth Potential Is Here to Stay
Looking at Ukraine’s main structural growth drivers, as measured by RGE’s Country Insights model, the economy’s
medium-term growth potential (despite its highly educated labor force), is significantly impaired by its
dysfunctional institutions, poor demographics and lack of an innovative environment. Ukraine needs to address
these bottlenecks to growth either by itself, or with external help. However, it is clear that it has little to learn from
the Russian-led Customs Union, whose members share the same weaknesses (Figure 8). The EU, on the other hand,
including the Eastern European members, can serve as a role model for institutional reform and source of
technology transfer, and the Association Agreement could provide a strong external anchor for Ukraine’s
transformation. Despite the suspension of the talks with the EU, it cannot be ruled out that Ukraine will revert to
the EU integration option in the near future. However, even if the AA is signed, growth potential would improve
only very slowly, given Ukraine’s limited institutional capacity.
Figure 8: Ukraine’s Medium-Term Growth Potential vs. European Peers (Q3 2013 Country Insights scores; 0 =
weak, 10 = strong)
Source: RGE
Note: CIS-3 includes Russia, Kazakhstan and Belarus; CEE-2: Hungary and Poland; SEE-3: Macedonia, Serbia and
Croatia; EU-3: Germany, France and the UK
Market Implications: Avoid Ukrainian Assets While Political Risk Persists
Ukraine’s policy of muddle through was possible in the extreme global yield-seeking environment, but its
borrowing costs have spiked to 10% from 7% on 10y bonds since May, on mounting concerns about DM rate
Period: Q2 2013 Ukraine CIS-3 SEE-3 CEE-2 EU-3
Medium-Term Growth Potential 4.8 5.4 4.3 4.6 5.3
Institutions 3 4.3 4.6 5.3 7.5
Business Environment 2.7 2.2 5.5 7.3 9.1
Government Effectiveness & Checks and Balances 2.7 2.2 5.5 7.3 9.1
Control of Corruption 1.7 1.8 5.7 7 9.2
Rule of Law 2.3 2.3 5.2 7.2 9.1
Voice and Accountability 4.6 1.4 5.5 7.6 9.1
Government Effectiveness 2.2 3.4 5.7 7.3 9.1
Social, Institutional & Regulatory Risk 3.4 3.5 5.1 6.1 7.7
Other growth drivers
Infrastructure 6.9 7.4 7.6 7.7 9.3
Innovation & Technology 3.6 4.2 4 6.2 8.4
Energy Intensity 0 0.6 4.9 8.1 10
Human Resource Potential 6.3 7 3.4 4.9 6
Demography 3.1 5.7 1.7 1.4 0.7

EMERGING EUROPE AND CIS
8
Page | 8
www.roubini.com
NEW YORK - 95 Morton Street, 6th Floor, New York, NY 10014 | TEL: 212 645 0010 | FAX: 212 645 0023 | [email protected] | [email protected] LONDON - 120 Holborn, 5th Floor, London EC1N 2TD | TEL: +44 (0) 207 092 8850 | FAX: +44 (0) 207 242 4783 | [email protected] © Roubini Global Economics 2013 - All Rights Reserved. No duplication or redistribution of this document is permitted without written consent.
normalization. As a result, issuance came to a halt as investors first focused on deficit-country risks in general and
then Ukraine’s idiosyncratic risks. Even ignoring the rise in political risk, Ukraine’s fundamentals look weaker than
even those of three other high-yield credits—Venezuela, Argentina and Belarus— and have worsened the most in
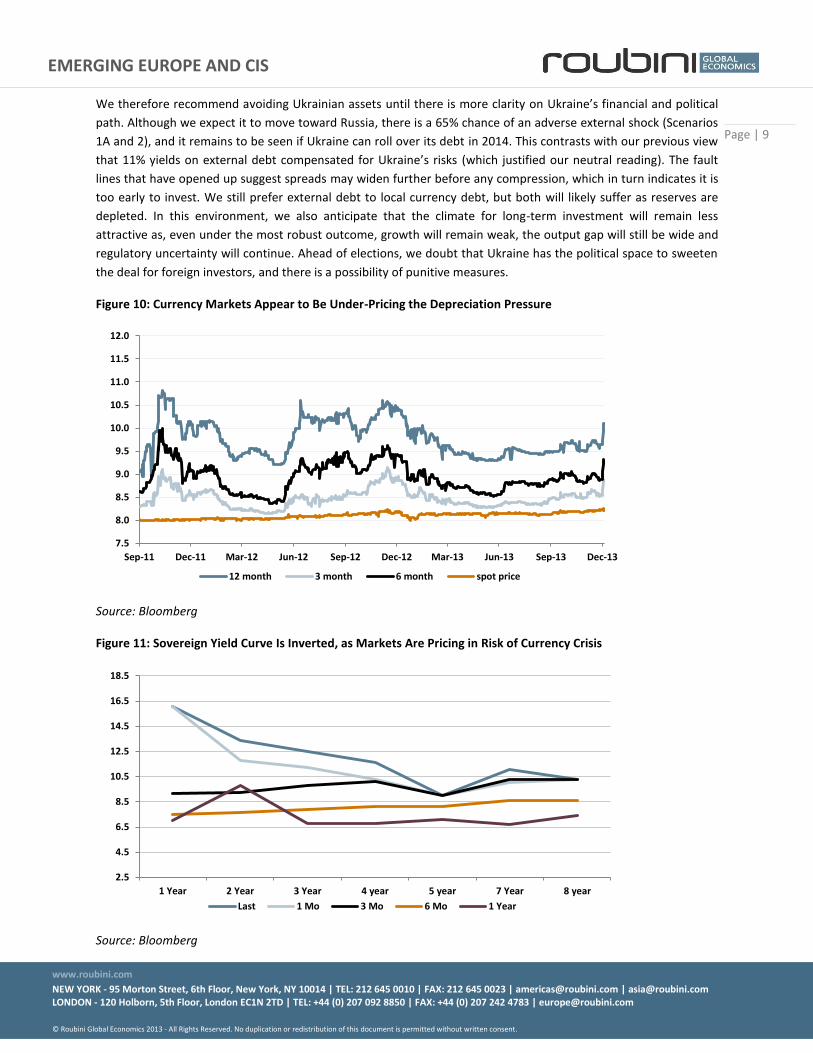
that group since 2005 (Figure 9). Despite Ukraine’s downgrades from all three major agencies (Figure 12), the
significant spike in spreads and CDS (260 and 600, respectively) and the steeply inverted yield curve (Figure 11),
markets do not appear to have fully priced in risks in the CDS space (partly due to limited liquidity), as Ukraine still
fares better than the same three high-yield economies. External debt spreads are more in line with fundamentals
(except vis-à-vis those of Venezuela), but we believe they do not fully price in the current political risk.
Figure 9: Ukraine’s Fundamentals Weakest Among EMs, Justifying Higher CDS
Source: RGE
As we have already highlighted, Ukrainian currency non-deliverable forwards (NDFs) have somewhat spiked on the
back of civil unrest, and are now pricing in a devaluation of 8% in three months, and 22% in 12 months, which is
largely in line with our base case of 15% over-valuation. But the risk of a disorderly devaluation (by 30% or more,
which we estimate is around 40%) still appears to be under-priced, as reflected in the much lower level of NDFs
than in late 2012. Household complacency about the continuous pressure on the hryvnia (largely due to 20%
interest rates on UAH deposits), as well as the high costs of hedging FX risk for corporates, are significant support
factors for the Ukrainian currency. However, a reversal in retail-depositor sentiment could increase the demand
for cash FX and trigger a disorderly devaluation in a matter of days. In this event, the government would still be
incentivized not to default, given the upcoming election; but the combination of a stand-off with Russia and lack of
agreement with the IMF, magnified by civil unrest, might prompt a partial default.
UKR VEN ARG BLR UKR VEN ARG BEL
Sovereign Risk Index 5.2 5.3 6.6 5.4 -1.5 -1.3 1.1 -0.1
Vulnerability to
Capital Outflows
4.8 5 5.4 5.8 -1.8 -1.8 -0.2 0.3
Medium-Term
Growth Potential
4.6 4.5 4.7 5.1 0.1 0.5 0.3 1.3
Current Account
Balance
2 7.8 5.7 4.7 -8 -2.2 -2.2 0.9
Fiscal Policy (deficit
and debt)
7.3 3.9 7.6 10 -0.3 -6.1 3.4 -
Inflation 1.8 0 0.2 0 - - -7 -
Total Indebtedness 8.5 9 8.9 8.9 -0.9 -0.9 4.2 -0.8
Banking Sector
Vulnerability
5.9 6.7 8.3 7.3 -1.7 -1.6 2.6 0.1
Banking Sector 5.7 6.5 8.8 6.6 - -3.3 2.4 0.8
Current Account
Balance
2 7.8 5.7 4.7 -8 -2.2 -2.2 0.9
Macrofinancial
Adjustment Capacity
3 2.2 5.5 6.8 -4.4 0.3 1.9 0.4
Total Indebtedness 8.5 9 8.9 8.9 -0.9 -0.9 4.2 -0.8
Current Account
Offset by FDI
4.6 10 9.7 5.7 -5.4 - -0.3 -0.3
CDS 1098 1270 1870 n/a
EMBIG Spread 1013 1200 780 861
Score, Q3 2013 (0 = weak, 10 = strong) Change from 2005
Period: Q3 2013 to
Q3 2005
EMERGING EUROPE AND CIS
9
Page | 9
www.roubini.com
NEW YORK - 95 Morton Street, 6th Floor, New York, NY 10014 | TEL: 212 645 0010 | FAX: 212 645 0023 | [email protected] | [email protected] LONDON - 120 Holborn, 5th Floor, London EC1N 2TD | TEL: +44 (0) 207 092 8850 | FAX: +44 (0) 207 242 4783 | [email protected] © Roubini Global Economics 2013 - All Rights Reserved. No duplication or redistribution of this document is permitted without written consent.
We therefore recommend avoiding Ukrainian assets until there is more clarity on Ukraine’s financial and political
path. Although we expect it to move toward Russia, there is a 65% chance of an adverse external shock (Scenarios
1A and 2), and it remains to be seen if Ukraine can roll over its debt in 2014. This contrasts with our previous view
that 11% yields on external debt compensated for Ukraine’s risks (which justified our neutral reading). The fault
lines that have opened up suggest spreads may widen further before any compression, which in turn indicates it is
too early to invest. We still prefer external debt to local currency debt, but both will likely suffer as reserves are
depleted. In this environment, we also anticipate that the climate for long-term investment will remain less
attractive as, even under the most robust outcome, growth will remain weak, the output gap will still be wide and
regulatory uncertainty will continue. Ahead of elections, we doubt that Ukraine has the political space to sweeten
the deal for foreign investors, and there is a possibility of punitive measures.
Figure 10: Currency Markets Appear to Be Under-Pricing the Depreciation Pressure
Source: Bloomberg
Figure 11: Sovereign Yield Curve Is Inverted, as Markets Are Pricing in Risk of Currency Crisis
Source: Bloomberg
7.5
8.0
8.5
9.0
9.5
10.0
10.5
11.0
11.5
12.0
Sep-11 Dec-11 Mar-12 Jun-12 Sep-12 Dec-12 Mar-13 Jun-13 Sep-13 Dec-13
12 month 3 month 6 month spot price
2.5
4.5
6.5
8.5
10.5
12.5
14.5
16.5
18.5
1 Year 2 Year 3 Year 4 year 5 year 7 Year 8 year
Last 1 Mo 3 Mo 6 Mo 1 Year

EMERGING EUROPE AND CIS
10
Page | 10
www.roubini.com
NEW YORK - 95 Morton Street, 6th Floor, New York, NY 10014 | TEL: 212 645 0010 | FAX: 212 645 0023 | [email protected] | [email protected] LONDON - 120 Holborn, 5th Floor, London EC1N 2TD | TEL: +44 (0) 207 092 8850 | FAX: +44 (0) 207 242 4783 | [email protected] © Roubini Global Economics 2013 - All Rights Reserved. No duplication or redistribution of this document is permitted without written consent.
Figure 12: Among the Lowest, Credit Rating Is Broadly in Line With Fundamentals (0 = weak, 10 = strong)
Source: Moody’s, RGE
Rachel Ziemba, Director of Global Emerging Markets, contributed to this piece.
Contact the author
The above content is offered for the exclusive use of RGE's clients. No forwarding, reprinting, republication or any other redistribution of this content is permissible
without expressed consent of Roubini Global Economics, LLC. All rights reserved. If you have received access to this content in error, RGE reserves the right to enforce
its copyright and pursue other redress. RGE is not a certified investment advisory service and aims to create an intellectual framework for informed financial
decisions by its clients. This content is for informational purposes only and does not constitute, and may not be relied on as, investment advice or a recommendation
of any investment or trading strategy. This information is intended for sophisticated professional investors who will exercise their own judgment and will
independently evaluate factors bearing on the suitability of any investment or trading strategy. Information and views, including any changes or updates, may be
made available first to certain RGE clients and others at RGE's discretion. Roubini Global Economics, LLC is not an investment adviser.
For questions about reprints or permission to excerpt or redistribute RGE content, or for a PDF version, clients should contact their RGE account representative.
ARG BLR
BRA
BGR
CHL
CHN
COL
DOM
ECU
GAB
GHA
HUN IDN
KAZ
MYS
MEX
NGA
PAK
PER
PHL
POL
ROU
RUS
SEN
ZAF
LKA
TUR
UKR
VEN VNM
2.0
3.0
4.0
5.0
6.0
7.0
8.0
9.0
5.0 5.5 6.0 6.5 7.0 7.5
Ave
rage
of
thre
e c
red
it r
atin
gs
Country Insights Investment Attractiveness Index, September 2013