Impersonal null-subjects in Icelandic and elsewhere* - Lund ...
Upload
khangminh22Category
view
0download
0
ACPD12, 7949–7984, 2012
Observations andsimulations of an
Icelandic dust storm
A.-M. Blechschmidt et al.
Title Page
Abstract Introduction
Conclusions References
Tables Figures
J I
J I
Back Close
Full Screen / Esc
Printer-friendly Version
Interactive Discussion
Discussion
Paper
|D
iscussionP
aper|
Discussion
Paper
|D
iscussionP
aper|
Atmos. Chem. Phys. Discuss., 12, 7949–7984, 2012www.atmos-chem-phys-discuss.net/12/7949/2012/doi:10.5194/acpd-12-7949-2012© Author(s) 2012. CC Attribution 3.0 License.
AtmosphericChemistry
and PhysicsDiscussions
This discussion paper is/has been under review for the journal Atmospheric Chemistryand Physics (ACP). Please refer to the corresponding final paper in ACP if available.
Aircraft-based observations andhigh-resolution simulations of anIcelandic dust stormA.-M. Blechschmidt1,*, J. E. Kristjansson1, H. Olafsson2,3, J. F. Burkhart4, andØ. Hodnebrog1
1Department of Geosciences, University of Oslo, Oslo, Norway2Department of Physics, University of Iceland, Reykjavik, Iceland3Geophysical Institute, University of Bergen, Bergen, Norway4Norwegian Institue for Air Research (NILU), Kjeller, Norway*now at: NCAS-Weather, University of Lancaster, Lancaster, UK
Received: 18 January 2012 – Accepted: 6 March 2012 – Published: 21 March 2012
Correspondence to: A.-M. Blechschmidt ([email protected])
Published by Copernicus Publications on behalf of the European Geosciences Union.
7949
ACPD12, 7949–7984, 2012
Observations andsimulations of an
Icelandic dust storm
A.-M. Blechschmidt et al.
Title Page
Abstract Introduction
Conclusions References
Tables Figures
J I
J I
Back Close
Full Screen / Esc
Printer-friendly Version
Interactive Discussion
Discussion
Paper
|D
iscussionP
aper|
Discussion
Paper
|D
iscussionP
aper|
Abstract
The first aircraft-based observations of an Icelandic dust storm are presented. Themeasurements were carried out over the ocean near Iceland’s south coast in February2007. This dust event occurred in conjunction with an easterly barrier jet of more than30 m s−1. The aircraft measurements show high particle mass mixing ratios in an area5
of low wind speeds in the wake of Iceland near the coast, decreasing abruptly towardsthe jet. Simulations from the Weather Research and Forecasting Model coupled withChemistry (WRF/Chem) indicate that the measured high mass mixing ratios and ob-served low visibility inside the wake are due to dust transported from Icelandic sandfields towards the ocean. This is confirmed by meteorological station data. Primary10
dust sources are glacial outwash terrains located near the Myrdalsjokull glacier. Seasalt aerosols produced by the impact of strong winds on the ocean surface started todominate as the aircraft flew away from Iceland into the jet. The present results supportrecent studies which suggest that Icelandic deserts should be considered as importantdust sources in global and regional climate models.15
1 Introduction
Iceland has over 20 000 km2 of sandy deserts (Arnalds et al., 2001). The sand origi-nates to a large extent from volcanic fly ash and glacial outwash. In particular, volcaniceruptions can cause glacial melting and flooding which leaves behind large amountsof sandy material. Water erosion is the dominant erosion type in southwest Iceland20
(Arnalds, 2000).Due to its location inside the North Atlantic storm track, Iceland is frequently affected
by synoptic scale cyclones. Together with the effect of Iceland’s orography on the air-flow, this favors the development of high wind speeds in the vicinity of the sandy areas.The latter can, under dry, snow-free conditions lead to sand storms. Wind erosion in25
Iceland is very effective in transporting soil material (Ingolfsson, 2008). Maps showing
7950

ACPD12, 7949–7984, 2012
Observations andsimulations of an
Icelandic dust storm
A.-M. Blechschmidt et al.
Title Page
Abstract Introduction
Conclusions References
Tables Figures
J I
J I
Back Close
Full Screen / Esc
Printer-friendly Version
Interactive Discussion
Discussion
Paper
|D
iscussionP
aper|
Discussion
Paper
|D
iscussionP
aper|
sandy areas, major plume areas and deposition areas in Iceland are given by Arnalds(2010).
Iceland experiences considerable amounts of precipitation throughout the year (Cro-chet et al., 2007; Rognvaldsson et al., 2007). However, it is a substantial global dustsource with deposition rates comparable to or higher than those found for other areas5
that are usually considered to contribute to major global dust emissions (Arnalds, 2010;Prospero et al., 2012).
Icelandic dust plumes can be transported over large distances and may affect airquality of the British Isles, continental Europe and the higher latitudes (Ovadnevaiteet al., 2009; Prospero et al., 2008, 2012). Recently, Thorsteinsson et al. (2011) found10
that dust storms were important contributors to an exceedance of health limit PM10concentrations measured near Reykjavık during 2007 and 2008. Prospero et al. (2012)investigated measurements from an aerosol sampling site on Heimaey island locatednear Iceland’s south coast between 1997 and 2004. The records revealed that dustwas present year-round at concentrations of a few micrograms per cubic meter, but15
with occasional peaks of up to 1400 µg m−3. Using a combination of satellite imagesand a Lagrangian trajectory model, Prospero et al. (2012) attributed all of their dustmeasurements to dust storms in southern Iceland.
In addition to studies on Icelandic dust storms, ash transport from Icelandic volcaniceruptions has also been investigated (e.g. Schumann et al., 2011).20
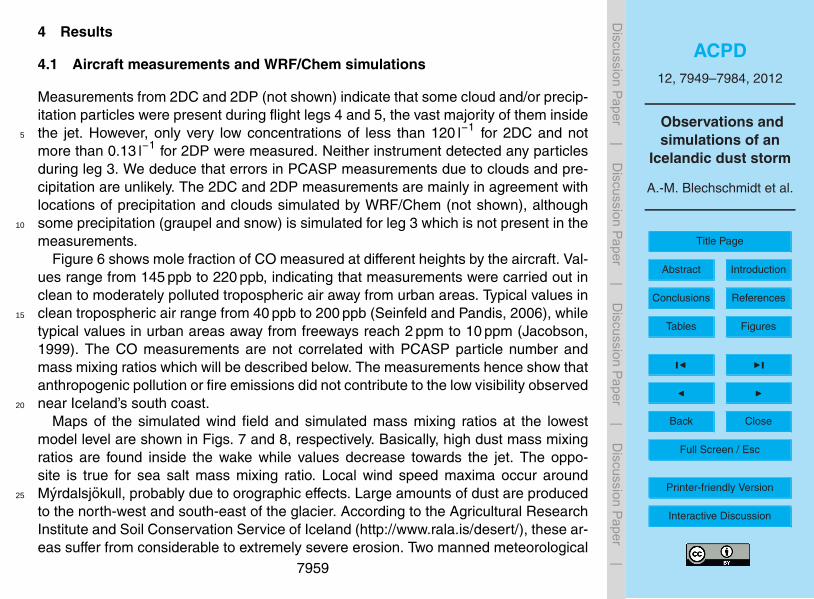
We hereby present, to our knowledge, the first aircraft-based study of an Icelandicdust storm. The measurements were carried out during flight B269 of the GFDex(Greenland Flow Distortion experiment; Renfrew et al., 2008) on 22 February 2007,with the Facility for Airborne Atmospheric Measurements (FAAM) BAE 146 aircraft. Thedust storm occurred during a South Iceland low-level barrier jet event (see Fig. 1 for a25
map of the wind field). The jet with near-surface winds of about 30 m s−1 was causedby orographic distortion of a northeasterly flow of 10–15 m s−1, which was caused bya combination of a low pressure area to the south of Iceland and high pressure overGreenland. The flow distortion is particularly pronounced due to a combination of large
7951

ACPD12, 7949–7984, 2012
Observations andsimulations of an
Icelandic dust storm
A.-M. Blechschmidt et al.
Title Page
Abstract Introduction
Conclusions References
Tables Figures
J I
J I
Back Close
Full Screen / Esc
Printer-friendly Version
Interactive Discussion
Discussion
Paper
|D
iscussionP
aper|
Discussion
Paper
|D
iscussionP
aper|
static stability (N), weak to moderate winds (U) and high mountains over southeasternIceland (h), as indicated by high values of the inverse Froude number Nh/U (Olafssonet al.). Wind speed maxima occurred downstream of the glaciers Myrdalsjokull andVatnajokull (see Fig. 2 for the location of these glaciers). A detailed description of theformation, meteorological conditions and characteristics of the wake and jet is given by5
Olafsson et al..Figure 2 shows the aircraft track. While the flight started at unlimited visibility at
Keflavık, researchers aboard the aircraft were caught by surprise as they flew into verylow visibility inside the wake (see Fig. 3a). The visibility decreased sharply towardsthe coast. The sea-surface inside the wake was almost completely calm and wind10
speeds reached only a few m s−1. The view changed completely inside the jet (seeFig. 3b) where strong winds around 30 m s−1 roughened the sea surface producingintense sea-spray. The wake and barrier jet region were investigated at three differentheights: 1900 m (leg 3), 700 m (leg 4) and 400 m (leg 5). In the present paper, onlymeasurements from these flight legs, covering the jet and the wake, are discussed.15
However, as can be seen on further pictures taken aboard the aircraft (not shown), thelow visibility was most pronounced at the lower elevation legs (leg 4 and leg 5).
Two manned meteorological stations located to the south of the glacier Myrdalsjokulland at Heimaey (see black stars in Fig. 8 for the location of these stations) reportedwidespread dust on the flight day, accompanied by visibilities well below 10 km in the20
absence of fog or precipitation.The primary objective of flight B269 was to investigate meteorological conditions
inside the jet and in the accompanying region of low wind speeds inside Iceland’swake. The dust storm itself was not foreseen by the researchers on the aircraft. Hence,the aircraft was not equipped for measurements of a sand storm. That is why only25
limited information on aerosols is available. Nonetheless, important measurements ofparticle mass mixing ratio and particle concentration were carried out. The WeatherResearch and Forecasting model coupled with Chemistry (WRF/Chem) is used in thepresent study to better characterise the type of particles sampled by the aircraft. Aircraft
7952

ACPD12, 7949–7984, 2012
Observations andsimulations of an
Icelandic dust storm
A.-M. Blechschmidt et al.
Title Page
Abstract Introduction
Conclusions References
Tables Figures
J I
J I
Back Close
Full Screen / Esc
Printer-friendly Version
Interactive Discussion
Discussion
Paper
|D
iscussionP
aper|
Discussion
Paper
|D
iscussionP
aper|
measurements indicate that anthropogenic and fire emissions did not contribute to thelow visibility observed near Iceland. The WRF/Chem simulations focus on dust andsea salt aerosols which is in agreement with the observations described above. TheLagrangian transport model FLEXPART is used here to identify primary source regionsof air masses measured aboard the FAAM flight.5
Aircraft data and model configurations will be described in Sects. 2 and 3, respec-tively. Simulations and measurements are then compared and discussed in Sect. 4,followed by a brief section on satellite lidar observations (Sect. 5). Finally, summaryand conclusions are given in Sect. 6.
2 Aircraft data10
A suite of instruments were carried on the FAAM aircraft. Only some of them which arerelated to particles are described here. For a complete list of core instrumentation seeRenfrew et al. (2008) and http://www.faam.ac.uk/. The aircraft data were provided bythe British Atmospheric Data Centre (BADC) through their web site at http://badc.nerc.ac.uk/home/index.html.15
The Passive Cavity Aerosol Spectrometer Probe (PCASP) is an optical particlecounter which counts and sizes aerosols in 15 channels between 0.1 µm and 3.0 µmdiameter. The instrument measures the intensity of light backscattered by particles thatpass a laser beam. Particles are dried as they are focused into the laser beam. How-ever, large measurement errors can occur in cases of particularly moist aerosols, if20
measurements are carried out inside a cloud or if water droplets shatter on the inletprobe (Taylor et al., 2000).
The two-dimensional cloud particle imaging probe (2DC) and precipitation parti-cle imaging probe (2DP) measure cloud and precipitation drop size distributions, re-spectively. Both instruments produce two-dimensional shadow images of particles25
which pass a laser beam (http://www.eol.ucar.edu/raf/Bulletins/B24/2dProbes.html).
7953

ACPD12, 7949–7984, 2012
Observations andsimulations of an
Icelandic dust storm
A.-M. Blechschmidt et al.
Title Page
Abstract Introduction
Conclusions References
Tables Figures
J I
J I
Back Close
Full Screen / Esc
Printer-friendly Version
Interactive Discussion
Discussion
Paper
|D
iscussionP
aper|
Discussion
Paper
|D
iscussionP
aper|
The 2DC probe covers diameters from 25 µm to 800 µm, while 2DP covers larger di-ameters between 200 µm and 6400 µm.
3 Model configurations
3.1 WRF/Chem
The Weather Research and Forecasting (WRF) model is a mesoscale numerical5
weather prediction and atmospheric simulation system which was developed at theNational Center for Atmospheric Research (NCAR) (Skamarock et al., 2008). InWRF/Chem (Grell et al., 2005) an atmospheric chemistry module is fully coupled onlinewith the WRF model.
In the present study we make use of WRF/Chem version 3.1. Our set up includes10
the Lin et al. (1983) cloud microphysics scheme, and both wet scavenging and cloudchemistry are switched on. The Carbon Bond Mechanism extended version (CBM-Z;Zaveri and Peters, 1999) is used for gas-phase chemistry. The Model for SimulatingAerosol Interactions and Chemistry (MOSAIC; Zaveri et al., 2008) is chosen for simu-lating aerosols within eight sectional aerosol bins between 0.04 µm and 10 µm diame-15
ter. The vegetation type is defined according to the 24-category land use data from theUS Geological Survey (USGS, http://www.usgs.gov/). As will be described in Sect. 4,aircraft measurements of CO concentrations show no signs of anthropogenic pollutionor fire emissions, indicating that these pollution types did not contribute to the low vis-ibility observed near Iceland. To simplify our simulations, we hence ran WRF/Chem20
without anthropogenic emissions and without fire emissions with the intention to inves-tigate dust and sea salt aerosols (which are produced online by the model) only. Forthe same reason, idealised vertical profiles as they come with the WRF/Chem soft-ware were used as initial and boundary conditions for chemical species. According toPeckham et al. (2010) idealised vertical profiles used in WRF/Chem are based upon25
7954

ACPD12, 7949–7984, 2012
Observations andsimulations of an
Icelandic dust storm
A.-M. Blechschmidt et al.
Title Page
Abstract Introduction
Conclusions References
Tables Figures
J I
J I
Back Close
Full Screen / Esc
Printer-friendly Version
Interactive Discussion
Discussion
Paper
|D
iscussionP
aper|
Discussion
Paper
|D
iscussionP
aper|
results from the NALROM chemistry model. However, the Guenther scheme for bio-genic emissions (Guenther et al., 1994) is switched on in our simulations.
WRF/Chem is run with two one-way nested grids to achieve high resolution over theflight domain. NCEP Final Analysis (FNL from GFS) 6-hourly data with 1◦ resolutionis used for initialising meteorological conditions and as boundary conditions for the5
outermost domain. The NCEP data was provided by the CISL Research Data Archivethrough their web site at http://dss.ucar.edu/. The model is started on 22 February 2007at 00:00 UTC.
Figure 4 shows the model domains. The first grid (G1) has a horizontal grid spacingof 20 km, the second grid (G2) 5 km and the third grid (G3) a grid spacing of 1 km. The10
present paper focuses on G3, which is centred on flight legs 3 to 5 to allow comparisonwith the aircraft measurements.
The original dust routine used in WRF/Chem together with MOSAIC has previouslyonly been applied to regions with very different vegetation characteristics from that ofIceland (e.g. Zhao et al., 1999; Gustafson et al., 2011). The dust routine was changed15
here, to make WRF/Chem capable of simulating Icelandic dust storms. Furthermore,changes to the sea salt parameterisation were applied. These changes will be de-scribed in Sects. 3.1.1 and 3.1.2. In the following, model runs performed with the origi-nal dust and sea salt parameterisation are termed OPR, while runs using the modifiedparameterisation are termed MPR. Most of the results below are based on results from20
MPR, but some results from OPR are also shown for comparison.
3.1.1 Dust
The original dust parameterisation used together with MOSAIC is based on a wind ero-sion module by Shaw et al. (2008). This module calculates the total mass of wind-blowndust based on vegetation type, soil moisture and wind speed. The size distribution of25
dust is then retrieved by estimating the dust fraction in different size-bins based onglobal datasets of soil texture classes.
7955

ACPD12, 7949–7984, 2012
Observations andsimulations of an
Icelandic dust storm
A.-M. Blechschmidt et al.
Title Page
Abstract Introduction
Conclusions References
Tables Figures
J I
J I
Back Close
Full Screen / Esc
Printer-friendly Version
Interactive Discussion
Discussion
Paper
|D
iscussionP
aper|
Discussion
Paper
|D
iscussionP
aper|
In OPR dust is only emitted from grid points with grassland, shrubland or savannaas vegetation type. These grid points have a vegetation mask α (which defines theerodable fraction of a grid point) that varies between 0.055 and 0.085.
In MPR, dust is only emitted from grid points with vegetation type equal to barrenor sparsely vegetated, wooded tundra, mixed tundra and bare ground tundra. To our5
knowledge, only very broad recommendations exist on how to choose the α values forthese vegetation types. For example Nickovic et al. (2001) used an α value of 1.0 fordeserts and 0.5 for semi-deserts. We therefore compared several test runs with theaircraft measurements in order to find more accurate values for Icelandic vegetationtypes. The best agreement with the particle measurements from the aircraft is found10
using α = 0.5 for barren or sparsely vegetated, α = 0.3 for wooded tundra, α = 0.4 formixed tundra and α = 0.5 for bare ground tundra. These α values, which were chosenfor MPR, can be used as a reference for future numerical modelling studies on Icelandicdust storms.
Apart from the dust and sea salt parameterisation, WRF/Chem was set up in exactly15
the same way for MPR and OPR. However, some rather minor deviations in simulatedmeteorological parameters such as temperature and wind direction occur between thetwo simulations. This is due to the fact that some of the parameter choices in the phys-ical parameterisations of WRF/Chem are closely linked to the atmospheric chemistrymodule (Peckham et al., 2010).20
Only the snow cover and ice cover included in the vegetation map from USGS arecurrently considered in OPR and MPR. Hence, deviations of the actual snow and icecover for Iceland on 22 February 2007 from USGS 24 category data may cause errorsin simulated dust production. A lot of clouds were present on the flight day, whichprecluded satellite-based derivations of detailed information on snow and ice cover for25
that specific day. Nonetheless, satellite images from 24 February (not shown) and 25February (see Fig. 5) revealed that large parts of South and West Iceland were indeedsnow and ice free and that these areas are reasonably represented by the USGS dataset. However, there is a significant underestimation of the snow and ice cover for G1
7956

ACPD12, 7949–7984, 2012
Observations andsimulations of an
Icelandic dust storm
A.-M. Blechschmidt et al.
Title Page
Abstract Introduction
Conclusions References
Tables Figures
J I
J I
Back Close
Full Screen / Esc
Printer-friendly Version
Interactive Discussion
Discussion
Paper
|D
iscussionP
aper|
Discussion
Paper
|D
iscussionP
aper|
and G2. Regarding G3, the satellite images indicate that snow and ice present to thenorth of Myrdalsjokull is not included in our simulations while there is an overestimationof snow and ice to the southeast of this glacier. Since the highest wind speeds occurdownstream of the glacier (see Fig. 7) it is assumed here that deviations from the actualsnow and ice cover for G3 do not affect the dust simulations significantly. Nonetheless,5
it can not be ruled out that deviations from the actual snow cover in G1 and G2 mayinfluence the dust simulations for G3 presented here.
3.1.2 Sea salt
In OPR sea salt is parameterised according to Gong and Barrie (1997). That studymakes use of Eq. (6) from Monahan et al. (1986) to express the rate of sea salt droplet10
generation at the sea surface. The equation shows a monotonic increase with de-creasing particle size for diameters smaller than 0.2 µm. In contrast to this, measure-ments and laboratory experiments (e.g. O’Dowd and Smith, 1993; Nilsson et al., 2001;Martensson et al., 2003) have shown that there is a major contribution of particlesin the submicrometer range with a maximum around 0.1 µm diameter and decreasing15
values towards smaller sizes.We therefore changed the sea salt parameterisation in MPR to that of Gong (2003)
who introduced a modified version of the equation by Monahan et al. (1986) to reducesea salt number flux density below 0.1 µm and additionally increase the flux at 0.1 µm.In MPR a θ value of 11 is used for Gong’s equation. According to Nilsson et al. (2007)20
this results in the best agreement between the simulated sea salt flux and sea saltmeasurements carried out at Mace Head (Ireland) between May and September 2002for diameters between 0.01 µm and 0.1 µm. Note that the measurements by Nilsson etal. (2007) were carried out at average water temperatures of 12 ◦C. This implies thatsome errors for the simulated sea salt flux may occur due to somewhat lower water25
temperatures at simulation time. Laboratory simulations by Martensson et al. (2003)have shown that when water temperatures increase, sea salt number concentrationsdecrease for diameters smaller than 0.07 µm and increase for diameters larger than
7957

ACPD12, 7949–7984, 2012
Observations andsimulations of an
Icelandic dust storm
A.-M. Blechschmidt et al.
Title Page
Abstract Introduction
Conclusions References
Tables Figures
J I
J I
Back Close
Full Screen / Esc
Printer-friendly Version
Interactive Discussion
Discussion
Paper
|D
iscussionP
aper|
Discussion
Paper
|D
iscussionP
aper|
0.35 µm. Inspection of satellite images available at http://www.remss.com shows thatthe ocean had a sea surface temperature of about 8 ◦C on the flight day.
3.2 Flexpart
The Lagrangian Particle Dispersion Model (LPDM) FLEXPART has been used to ex-amine source regions for numerous aircraft, station, and ship-based studies (Stohl et5
al., 2005; Stohl, 2006; Warneke et al., 2009; Gilman et al., 2010; Hirdman et al., 2010).The model provides source information for a measurement point by examining clustersof so-called tracer particles transported in the atmosphere. Mean winds from the Eu-ropean Centre for Medium-Range Weather Forecasts (ECMWF, 2002) model outputare included in the simulations along with parameterisations to account for turbulence10
and convective transport. These processes, which are not included in standard trajec-tory models, are important for a realistic simulation of the transport of trace substances(Stohl, 2002).
FLEXPART was run backward in time from the aircraft measurement location usingoperational analyses from ECMWF with 0.5×0.5◦ resolution for FAAM flight B269.15
To provide releases along the flight track, 50 000 particles were released with anyhorizontal movement of the aircraft of 0.19◦ latitude or longitude, and a vertical changein pressure coordinates of 10 hPa.
The model simulation was run with a generic aerosol tracer. The aerosol tracer wasremoved by wet and dry deposition processes (Stohl et al., 2005). In addition, air20
parcels were removed from the simulation after a life-time of 20 days. Anthropogenicemissions were initialised from the updated EDGAR 3.2 emissions inventory for theyear 2000 (Olivier et al., 2001).
We present the results showing a footprint “Potential Emission Sensitivity” (PES)which represents the sensitivity of the measured air mass to global emissions backward25
in time for the lowest 100 m above the surface. Since most emissions occur at thesurface, the footprint PES is of particular importance (Jonson, 2010).
7958
ACPD12, 7949–7984, 2012
Observations andsimulations of an
Icelandic dust storm
A.-M. Blechschmidt et al.
Title Page
Abstract Introduction
Conclusions References
Tables Figures
J I
J I
Back Close
Full Screen / Esc
Printer-friendly Version
Interactive Discussion
Discussion
Paper
|D
iscussionP
aper|
Discussion
Paper
|D
iscussionP
aper|
4 Results
4.1 Aircraft measurements and WRF/Chem simulations
Measurements from 2DC and 2DP (not shown) indicate that some cloud and/or precip-itation particles were present during flight legs 4 and 5, the vast majority of them insidethe jet. However, only very low concentrations of less than 120 l−1 for 2DC and not5
more than 0.13 l−1 for 2DP were measured. Neither instrument detected any particlesduring leg 3. We deduce that errors in PCASP measurements due to clouds and pre-cipitation are unlikely. The 2DC and 2DP measurements are mainly in agreement withlocations of precipitation and clouds simulated by WRF/Chem (not shown), althoughsome precipitation (graupel and snow) is simulated for leg 3 which is not present in the10
measurements.Figure 6 shows mole fraction of CO measured at different heights by the aircraft. Val-
ues range from 145 ppb to 220 ppb, indicating that measurements were carried out inclean to moderately polluted tropospheric air away from urban areas. Typical values inclean tropospheric air range from 40 ppb to 200 ppb (Seinfeld and Pandis, 2006), while15
typical values in urban areas away from freeways reach 2 ppm to 10 ppm (Jacobson,1999). The CO measurements are not correlated with PCASP particle number andmass mixing ratios which will be described below. The measurements hence show thatanthropogenic pollution or fire emissions did not contribute to the low visibility observednear Iceland’s south coast.20
Maps of the simulated wind field and simulated mass mixing ratios at the lowestmodel level are shown in Figs. 7 and 8, respectively. Basically, high dust mass mixingratios are found inside the wake while values decrease towards the jet. The oppo-site is true for sea salt mass mixing ratio. Local wind speed maxima occur aroundMyrdalsjokull, probably due to orographic effects. Large amounts of dust are produced25
to the north-west and south-east of the glacier. According to the Agricultural ResearchInstitute and Soil Conservation Service of Iceland (http://www.rala.is/desert/), these ar-eas suffer from considerable to extremely severe erosion. Two manned meteorological
7959

ACPD12, 7949–7984, 2012
Observations andsimulations of an
Icelandic dust storm
A.-M. Blechschmidt et al.
Title Page
Abstract Introduction
Conclusions References
Tables Figures
J I
J I
Back Close
Full Screen / Esc
Printer-friendly Version
Interactive Discussion
Discussion
Paper
|D
iscussionP
aper|
Discussion
Paper
|D
iscussionP
aper|
stations, one at the island Heimaey and the other located to the south of glacierMyrdalsjokull (black stars in Fig. 8 show the location of these stations), reported poorvisibility and dust on the flight day, confirming the simulations. Overall, the location ofthe wind speed maxima around Myrdalsjokull relative to dust maxima indicates thatorographic effects may have contributed to the formation of the dust storm. This is in5
agreement with Olafsson (2005) who pointed out that local orographic effects may beimportant for dust storms in Iceland.
Measurements and simulations of wind speed and wind direction at all flight legsare shown in Fig. 9. These two meteorological parameters are crucial for simulatingdust and sea salt aerosols. Wind speed determines the amount of dust and sea salt10
which is brought up into the air, while wind direction constitutes the location to whichaerosols are transported. Apart from some differences in wind speed at 1900 m, thereis a very good agreement between the aircraft and the model. The strong increase inwind speed from the wake towards the jet measured at 400 m and 700 m height is verywell captured by the model.15
Corresponding results for temperature and specific humidity are shown in Fig. 10.Overall the model agrees well with the aircraft. Both, observations and simulationsshow that temperature decreases with height. However, the static stability appears tobe weaker between 400 m and 700 m in the measurements than in the simulationswhile the opposite is the case between 700 m and 1900 m height.20
Particle mass mixing ratios and particle number concentrations are given in Fig. 11.The measurements show two maxima at 400 m height, one around 20.35◦ W longitude(inside the wake) and one near 19.5◦ W longitude (inside the jet). The former one coin-cides with a sharp change in wind speed and wind direction (see Fig. 9). Convergenceof air masses may be an explanation for the formation of this peak. The results shown25
in Fig. 8 (note that the location of the two measured mass mixing ratio peaks is givenby the black triangles) indicate that the latter peak is caused by dust transported fromsand fields located to the south-east of the Myrdalsjokull glacier towards the ocean,while the former one can be associated with dust sources to the west of this glacier.
7960

ACPD12, 7949–7984, 2012
Observations andsimulations of an
Icelandic dust storm
A.-M. Blechschmidt et al.
Title Page
Abstract Introduction
Conclusions References
Tables Figures
J I
J I
Back Close
Full Screen / Esc
Printer-friendly Version
Interactive Discussion
Discussion
Paper
|D
iscussionP
aper|
Discussion
Paper
|D
iscussionP
aper|
Figure 11 shows that the measured particle mass mixing ratios and particle numberconcentrations generally decrease as the aircraft flies away from Iceland towards thejet.
Simulations for the sum of all aerosol types represented by the model (red line inFig. 11) catch the shape of measured mass mixing ratios and particle concentrations5
well. However, the location of the western peak is simulated further north-westwardsthan the corresponding measured peak. There is also some disagreement concerningthe magnitude of the values with a tendency for WRF/Chem to overestimate dust insidethe wake and to underestimate sea salt inside the jet.
Comparing simulations at 400 m height for dust and sea salt with the sum of all10
aerosol types represented by the model indicates that the high particle mixing ratiosand particle number concentrations measured inside the wake and in the north-westernpart of the jet west of 19.5◦ W are due to dust. Sea salt aerosols become the dominatingaerosol type as the aircraft flies away from Iceland towards the jet. This is in agreementwith airmass source regions identified by Flexpart which will be described in Sect. 4.2.15
Total scattering coefficients measured by a nephelometer at 750 nm, 550 nm and450 nm wavelength on board the FAAM aircraft show the same features as the particlemass mixing ratios, i.e. an overall decrease from the wake towards the jet and a twopeak pattern, and are therefore not shown here. At 700 nm wavelength and at 400 mheight, values of up to 8×10⁻⁴ m−1 were reached at the location of the two maxima in20
particle mass mixing ratio.Measured mass mixing ratio and particle number concentration do not change sig-
nificantly from 400 m to 700 m height. However, the two peaks measured at 700 m arepoorly simulated by the model. This could be due to less vertical mixing and morestable conditions between 400 m and 700 m height in the simulations than in the ob-25
servations (see discussion of Fig. 10, above).At 1900 m, the particle mass mixing ratio is close to zero and only values of about
20 µg kg−1 are found inside the jet. This is well represented by the model. In con-trast to this, particle number concentration is poorly simulated at this height, with the
7961

ACPD12, 7949–7984, 2012
Observations andsimulations of an
Icelandic dust storm
A.-M. Blechschmidt et al.
Title Page
Abstract Introduction
Conclusions References
Tables Figures
J I
J I
Back Close
Full Screen / Esc
Printer-friendly Version
Interactive Discussion
Discussion
Paper
|D
iscussionP
aper|
Discussion
Paper
|D
iscussionP
aper|
measurements showing a peak at 18.9◦ W longitude inside the jet, while simulationsshow a peak inside the wake region.
Further inspection of the model results shows, that the simulated peak in particlenumber concentration is due to sulfate and organic carbon which dominate at thisflight level. This is in contrast to simulations of particle number concentrations at lower5
heights and in contrast to particle mass mixing ratio at all flight levels (including thehighest one), which are all strongly dominated by dust and sea salt aerosols. Simulatedsulfate and organic carbon seem to originate from volcano emissions used to initialisethe model and from biogenic emissions (calculated online and possibly also includedin the initial conditions), respectively. As described earlier in this section, some precip-10
itation (graupel and snow) is simulated for leg 3 which is not present in the 2DC and2DP measurements. Therefore, unrealistic washout may contribute to the simulateddecrease in particle concentration towards the jet. However, this decrease can alsobe partly explained by the increasing distance to land sources of sulfate and organiccarbon towards the jet.15
The peak at 18.9◦ W longitude in particle number concentration measured by PCASPis not present in the corresponding mass mixing ratio measurements. This indicatesthat the peak is caused by particles which are lighter and therefore smaller than sea saltand dust aerosols. It could be due to volcanic emissions or sulfate produced from DMSnot included in the model set up. A contribution from anthropogenic sources or wildfires20
is very unlikely since the CO measurements described above are typical for a clean tomoderately polluted atmospheric background profile carried out away from urban areasand do not show a peak at this location. The fact that simulations of particle numberagree much better with PCASP for the lower flight legs than for the one at 1900 m heightindicates that upper airmass properties differ from the airmass properties at lower flight25
legs.OPR significantly underestimates the magnitude of particle mass mixing ratios
and particle number concentrations (see Fig. 12). However, the main features of themeasurements, i.e. a decrease in particle mass mixing ratio and particle number
7962

ACPD12, 7949–7984, 2012
Observations andsimulations of an
Icelandic dust storm
A.-M. Blechschmidt et al.
Title Page
Abstract Introduction
Conclusions References
Tables Figures
J I
J I
Back Close
Full Screen / Esc
Printer-friendly Version
Interactive Discussion
Discussion
Paper
|D
iscussionP
aper|
Discussion
Paper
|D
iscussionP
aper|
concentration from the wake towards the jet, are catched. The two peak pattern mea-sured by the aircraft at 400 m and 700 m height is not present in OPR.
Overall, changes applied to the dust and sea salt parameterisation in MPR havesubstantially improved the simulations of dust and sea salt aerosols near Iceland. How-ever, uncertainties remain in MPR associated with the snow cover (especially for G15
and G2), assumptions made in dust and sea salt parameterisations and contributionsfrom emission sources neglected by our model set up.
4.2 Flexpart simulations
Figure 13 shows PES for the aerosol tracer for flight legs 5 and 3. Results for flightleg 4 are very similar to flight leg 5 and are therefore not shown here. Simulations10
were started on 22 February at 11:57 UTC and 10:53 UTC for leg 5 and 3, respectively.These are times when the aircraft was located inside the wake. The plume centroidlocations, derived from a statistical cluster analysis (see Stohl et al., 2005 and Stohlet al., 2002), for up to 6 days backward in time are represented by black circles. Thecentroids can be regarded as a trajectory back from the measurement location, if a15
plume does not split significantly.At 400 m height (Fig. 13a), PES shows the highest values in the northeasterly flow
over South Iceland. There is high sensitivity over Icelandic dust emission source re-gions. Centroid locations suggest that the airmasses investigated by the aircraft orig-inated from Scandinavia two to five days ahead of the flight day, but were then trans-20
ported over the Norwegian Sea towards Iceland.For flight leg 3 (Fig. 13b), centroids take a clockwise track backward in time from
Iceland towards Greenland. The PES in the cyclonic flow to the south of Iceland ishigher compared to Flexpart simulations for flight leg 5.
Note that Flexpart simulations were also carried out for times when the aircraft was25
located inside the jet (not shown). These simulations indicate that the air was of muchmore maritime origin for measurements carried out inside the jet, which is in agreement
7963

ACPD12, 7949–7984, 2012
Observations andsimulations of an
Icelandic dust storm
A.-M. Blechschmidt et al.
Title Page
Abstract Introduction
Conclusions References
Tables Figures
J I
J I
Back Close
Full Screen / Esc
Printer-friendly Version
Interactive Discussion
Discussion
Paper
|D
iscussionP
aper|
Discussion
Paper
|D
iscussionP
aper|
with the WRF/Chem results (see Sect. 4.1). Apart from this, the results basically showthe same as for times when the aircraft was located inside the wake.
Overall, Flexpart simulations suggest significantly different air mass histories for the1900 m flight leg and the lower elevation legs. In agreement with the conclusion drawnin Sect. 4.1, this could explain why WRF/Chem performs much better in simulating5
particles at lower flight legs than at flight leg 3. Particles detected at lower flight legsare most likely purely Icelandic dust and sea salt aerosols, while other (most likelynatural) emission sources may have contributed to the particle concentration measuredat 1900 m height.
5 CALIPSO observations10
Although simulations presented here focus on the flight day, wind data from theQuikSCAT satellite (not shown) reveal that comparable wind speed conditions (i.e.wind speeds of more than 20 m s−1 and a barrier jet and wake pattern) were alreadypresent on 20 February and lasted until approximately 23 February. This implies thatthe dust storm may already have developed some time before the flight was carried15
out. In fact, the meteorological station at Heimaey also reported dust for the morning of21 February. There is further evidence from the Cloud Aerosol Lidar with OrthogonalPolarization (CALIOP) on board the Cloud-Aerosol Lidar Infrared Pathfinder SatelliteObservation (CALIPSO) satellite that dust and marine aerosols were present on 21February near Iceland’s south coast. However, CALIPSO also detected a lot of dust20
and polluted dust over the north-western Icelandic land surface. The latter seems to bevery unlikely, since other satellite images (e.g. Fig. 5) show that this part of Iceland wascovered by snow. Hence, we do not present CALIPSO results here, due to concernsabout the reliability of the data. Information on uncertainties associated with CALIPSOversion 3.01 products (which were investigated here) is given by Kacenelenbogen et25
al. (2011).
7964

ACPD12, 7949–7984, 2012
Observations andsimulations of an
Icelandic dust storm
A.-M. Blechschmidt et al.
Title Page
Abstract Introduction
Conclusions References
Tables Figures
J I
J I
Back Close
Full Screen / Esc
Printer-friendly Version
Interactive Discussion
Discussion
Paper
|D
iscussionP
aper|
Discussion
Paper
|D
iscussionP
aper|
6 Summary and conclusions
A dust storm near Iceland which occurred in a barrier jet event during GFDex has beeninvestigated based on aircraft observations and the mesoscale model WRF/Chem. Theresults document the transport of dust from Icelandic sand fields towards the ocean,thereby reducing visibility near Iceland’s south coast significantly.5
Changes have been applied to the dust and sea-salt parameterisations to makeWRF/Chem capable of simulating Icelandic dust storms. A good agreement betweenmeasurements and simulations has been achieved. However, some disagreement be-tween measurements and simulations remains concerning the magnitude of the val-ues, with a tendency for WRF/Chem to overestimate dust and to underestimate sea10
salt. The simulations could be improved by including the most up to date informationon snow cover in the dust parameterisation and by further optimisation of the dust andsea salt parameterisations. Inclusion of data from a global chemical transport modelfor initial and boundary conditions and other emission sources not taken into accountin our model set up could further improve the simulations, especially for the upper flight15
leg at 1900 m height.The location of local wind speed maxima relative to dust maxima indicates that oro-
graphic effects may have contributed to the formation of the dust storm. Results pre-sented here highlight the usefulness of a high resolution model for simulating Icelandicdust storms, which is in agreement with Olafsson (2005). Local wind speed maxima20
associated with orography will most likely not be adequately represented by global cli-mate models. Assuming that orographic effects contribute to the majority of Icelandicdust storms, these effects should be parameterised in global climate models. Moreover,Icelandic dust storms in a warmer climate should be investigated in future studies. Ice-landic glaciers have been retreating in recent decades. Since this trend is expected to25
continue with global warming, Icelandic dust activity may increase in the future (Pros-pero et al., 2008; Prospero et al., 2012).
7965

ACPD12, 7949–7984, 2012
Observations andsimulations of an
Icelandic dust storm
A.-M. Blechschmidt et al.
Title Page
Abstract Introduction
Conclusions References
Tables Figures
J I
J I
Back Close
Full Screen / Esc
Printer-friendly Version
Interactive Discussion
Discussion
Paper
|D
iscussionP
aper|
Discussion
Paper
|D
iscussionP
aper|
Iceland is an important global source of dust with deposition rates comparable to orhigher than those found for other areas that are usually considered to contribute to ma-jor global dust emissions (Arnalds, 2010; Prospero et al., 2012). In agreement with theresults of the present study, Ovadnevaite et al. (2009) showed that dust outbreaks fromIceland can increase levels of absorbing material and light scattering over the North5
Atlantic. Ovadnevaite et al. (2009) concluded that dust from Icelandic sand fields maybe a significant regional source of aerosols over the North Atlantic and hence shouldbe considered in regional and global climate models. Future studies are required todetermine the impacts of an inadequate representation of Icelandic dust sources inclimate simulations.10
To our knowledge, apart from the record by Prospero et al. (2012), no comprehen-sive data set describing the frequency of Icelandic dust storms exists. Although in-situdata have been used together with visible satellite imagery from passive remote sen-sors (e.g. Ovadnevaite et al., 2009; Arnalds, 2010; Prospero et al., 2012) to verify thetransport of dust from Iceland towards the ocean, this method is only successful for15
dust storms which are not hidden by clouds. Active remote sensors like CALIOP onboard CALIPSO can look through clouds to some extent, but their poor spatial cov-erage would prohibit the derivation of a meaningful climatology. This means that acombined approach, using numerical models, satellites and measurements is requiredto derive statistics about Icelandic dust storms.20
Overall, the modelling approach presented here constitutes a promising basis toinvestigate important questions on Icelandic dust storms addressed in this section.
Acknowledgements. This work was funded by the Norwegian Research Council through thePOLARCAT project, project no. 175916. The corresponding author is currently funded by theNatural Environment Research Council (NERC) through its National Centre for Atmospheric25
Science (NCAS). Thanks to the British Atmospheric Data Centre (BADC), which is part ofNCAS, for providing the GFDex data on their web page. We also thank the people behind theCISL Research Data Archive for providing NCEP data on their web site. Thanks to the EuropeanCentre for Medium-Range Weather Forecasts (ECMWF) and the Norwegian Meteorological In-stitute for providing access to ECMWF data. CALIPSO data were obtained from the NASA (Na-30
7966

ACPD12, 7949–7984, 2012
Observations andsimulations of an
Icelandic dust storm
A.-M. Blechschmidt et al.
Title Page
Abstract Introduction
Conclusions References
Tables Figures
J I
J I
Back Close
Full Screen / Esc
Printer-friendly Version
Interactive Discussion
Discussion
Paper
|D
iscussionP
aper|
Discussion
Paper
|D
iscussionP
aper|
tional Aeronautics and Space Administration) Langley Research Center Atmospheric ScienceData Center. MODIS images were received from the NASA/GSFC Rapid Response system(http://lance.nasa.gov/imagery/rapid-response/). SST images from www.remss.com are pro-duced by Remote Sensing Systems and sponsored by National Oceanographic PartnershipProgram (NOPP), the NASA Earth Science Physical Oceanography Program, and the NASA5
MEaSUREs DISCOVER Project. QuikSCAT data were obtained from the Physical Oceanog-raphy Distributed Active Archive Center (PO.DAAC) at the NASA Jet Propulsion Laboratory,Pasadena, California (http://podaac.jpl.nasa.gov).
References
Arnalds, O.: The Icelandic ‘rofabard’ soil erosion features, Earth Surf. Process. Landforms, 25,10
17–28, 2000. 7950Arnalds O.: Dust sources and deposition of aeolian materials in Iceland, Icel. Agric. Sci., 23,
3–21, 2010. 7951, 7966Arnalds, O., Gisladottir, F. O., and Sigurjonsson, H.: Sandy deserts of Iceland: an overview, J.
Arid Environ., 47, 359–371, 2001. 795015
Crochet, P., Johannesson, T., Jonsson, T., Sigurdsson, O., Bjornsson, H., Palsson, F., andBarstad, I.: Estimating the spatial distribution of precipitation in Iceland using a linear modelof orographic precipitation, J. Hydrometeorol., 8, 1285–1306, 2007. 7951
ECMWF: IFS Documentation, edited by: White, P. W., ECMWF, Reading, UK, 2002. 7958Gilman, J. B., Burkhart, J. F., Lerner, B. M., Williams, E. J., Kuster, W. C., Goldan, P. D., Murphy,20
P. C., Warneke, C., Fowler, C., Montzka, S. A., Miller, B. R., Miller, L., Oltmans, S. J., Ryerson,T. B., Cooper, O. R., Stohl, A., and de Gouw, J. A.: Ozone variability and halogen oxidationwithin the Arctic and sub-Arctic springtime boundary layer, Atmos. Chem. Phys., 10, 10223–10236, doi:10.5194/acp-10-10223-2010, 2010. 7958
Gong, S. L.: A parameterization of sea-salt aerosol source function for sub- and super-micron25
particles, Global Biogeochem. Cy., 17, 1097, doi:10.1029/2003GB002079, 2003. 7957Gong, S. L. and Barrie, L. A.: Modeling sea-salt aerosols in the atmosphere – 1. Model devel-
opment, J. Geophys. Res., 102, 3805–3818, doi:10.1029/96JD02953, 1997. 7957
7967

ACPD12, 7949–7984, 2012
Observations andsimulations of an
Icelandic dust storm
A.-M. Blechschmidt et al.
Title Page
Abstract Introduction
Conclusions References
Tables Figures
J I
J I
Back Close
Full Screen / Esc
Printer-friendly Version
Interactive Discussion
Discussion
Paper
|D
iscussionP
aper|
Discussion
Paper
|D
iscussionP
aper|
Grell, G. A., Peckham, S. E., Schmitz, R., McKeen, S. A., Frost, G., Skamarock, W. C., and Eder,B.: Fully coupled ’online’ chemistry within the WRF model, Atmos. Environ., 39, 6957–6976,doi:10.1016/j.atmosenv.2005.04.027, 2005. 7954
Guenther, A., Zimmerman, P., and Wildermuth, M.: Natural volatile organic compound emissionrate estimates for US woodland landscapes, Atmos. Environ., 28, 1197–1210, 1994. 79555
Gustafson Jr., W. I., Qian, Y., and Fast, J. D.: Downscaling Aerosols and the Impact of NeglectedSubgrid Processes on Direct Aerosol Radiative Forcing for a Representative Global ClimateModel Grid Spacing, J. Geophys. Res., 116, D13303, doi:10.1029/2010JD015480, 2011.7955
Hirdman, D., Burkhart, J. F., Sodemann, H., Eckhardt, S., Jefferson, A., Quinn, P. K., Sharma,10
S., Strom, J., and Stohl, A.: Long-term trends of black carbon and sulphate aerosol in theArctic: changes in atmospheric transport and source region emissions, Atmos. Chem. Phys.,10, 9351–9368, doi:10.5194/acp-10-9351-2010, 2010. 7958
Ingolfsson, O.: The dynamic climate of Iceland, http://www3.hi.is/oi/climate in iceland.htm (lastaccess: 16 January 2012), 2008. 795015
Jacobson, M. Z.: Fundamentals of atmospheric modelling, Cambridge University Press, 1999.7959
Jonson, J. E., Stohl, A., Fiore, A. M., Hess, P., Szopa, S., Wild, O., Zeng, G., Dentener, F. J.,Lupu, A., Schultz, M. G., Duncan, B. N., Sudo, K., Wind, P., Schulz, M., Marmer, E., Cuvelier,C., Keating, T., Zuber, A., Valdebenito, A., Dorokhov, V., De Backer, H., Davies, J., Chen, G.20
H., Johnson, B., Tarasick, D. W., Stubi, R., Newchurch, M.J., von der Gathen, P., Steinbrecht,W., and Claude, H.: A multi-model analysis of vertical ozone profiles, Atmos. Chem. Phys.,10, 5759–5783, doi:10.5194/acp-10-5759-2010, 2010. 7958
Kacenelenbogen, M., Vaughan, M. A., Redemann, J., Hoff, R. M., Rogers, R. R., Ferrare, R.A., Russell, P. B., Hostetler, C. A., Hair, J. W., and Holben, B. N.: An accuracy assess-25
ment of the CALIOP/CALIPSO version 2/version 3 daytime aerosol extinction product basedon a detailed multi-sensor, multi-platform case study, Atmos. Chem. Phys., 11, 3981–4000,doi:10.5194/acp-11-3981-2011, 2011. 7964
Lin, Y.-L., Farley, R. D., and Orville, H. D.: Bulk parameterization of the snow field in a cloudmodel, J. Climate Appl. Meteor., 22, 1065–1092, 1983. 795430
Martensson, E. M., Nilsson, E. D., de Leeuw, G., Cohen, L. H., and Hansson, H.-C.: Laboratorysimulations and parameterization of the primary marine aerosol production, J. Geophys.Res., 108, 4297, doi:10.1029/2002JD002263, 2003. 7957
7968

ACPD12, 7949–7984, 2012
Observations andsimulations of an
Icelandic dust storm
A.-M. Blechschmidt et al.
Title Page
Abstract Introduction
Conclusions References
Tables Figures
J I
J I
Back Close
Full Screen / Esc
Printer-friendly Version
Interactive Discussion
Discussion
Paper
|D
iscussionP
aper|
Discussion
Paper
|D
iscussionP
aper|
Monahan, E. C., Spiel, D. E., and Davidson, K. L.: A model of marine aerosol generation viawhitecaps and wave disruption, in Oceanic Whitecaps, edited by: Monahan, E. C. and Mac-Niochaill, G., 167193 pp., D. Reidel, Norwell, Mass., 1986. 7957
Nickovic, S., Kallos, G., Papadopoulos, A., and Kakaliagou, O.: A model for prediction of desertdust cycle in the atmosphere, J. Geophys. Res., 106, 18113–18129, 2001. 79565
Nilsson, E. D., Rannik, U., Swietlicki, E., Leek, C., Aalto, P. P., Zhou, J., and Norman, M.: Turbu-lent aerosol fluxes over the Arctic Ocean 2. Wind-driven sources from the sea, J. Geophys.Res., 106, 32139–32154, doi:10.1029/2000JD900747, 2001. 7957
Nilsson, E. D., Martensson, E. M., Van Ekeren, J. S., de Leeuw, G., Moerman, M., and O’Dowd,C.: Primary marine aerosol emissions: size resolved eddy covariance measurements with10
estimates of the sea salt and organic carbon fractions, Atmos. Chem. Phys. Discuss., 7,13345–13400, doi:10.5194/acpd-7-13345-2007, 2007. 7957
O’Dowd, C. D. and Smith, M. H.: Physiochemical properties of aerosols over the northeastAtlantic: Evidence for wind-related submicron sea-salt aerosol production, J. Geophys. Res.,98, 1137–1149, doi:10.1029/92JD02302, 1993. 795715
Olafsson, H.: Multi-scale orographic forcing of the atmosphere leading to an erosion event,Proceedings of the 28th International Conference on Alpine Meteorology (ICAM) and theAnnual Scientific Meeting of the Mesoscale Alpine Programme (MAP), Zadar, Croatia, 2005.7960, 7965
Olafsson, H., Petersen, G. N., Renfrew, I., Kristjansson, J. E., and Moore, G. W.: The South-20
Iceland wake,in preparation, 2012. 7952Olivier, J. G. J. and Berdowski, J. J. M.: Global emissions sources and sinks, The Climate Sys-
tem, edited by: Berdowski, J., Guicherit, R., and Heij, B. J., A. A. Balkema Publishers/Swetsand Zeitlinger Publishers, Lisse, The Netherlands, 33–78, 2001. 7958
Ovadnevaite, J., Ceburnisa, D., Plauskaite-Sukieneb, K., Modinic, R., Dupuya, R., Rimselyteb,25
I., Ramonetd, M., Kvietkusb, K., Ristovskic, Z., Berresheima, H., and O’Dowd, C. D.: Volcanicsulphate and arctic dust plumes over the North Atlantic Ocean, Atmos. Environ., 43, 4968–4974, doi:10.1016/j.atmosenv.2009.07.007, 2009. 7951, 7966
Peckham, S. E., Grell, G. A., McKeen, S. A., Fast, J. D., Gustafson, W. I., Ghan, S. J., Zaveri,R., Easter, R. C., Barnard, J., Chapman, E., Wiedinmyer, C., Schmitz, R., Salzmann, M.,30
and Freitas, S. R.: WRF/Chem Version 3.2 User’s Guide, National Center for AtmosphericResearch (NCAR), 2010. 7954, 7956
7969

ACPD12, 7949–7984, 2012
Observations andsimulations of an
Icelandic dust storm
A.-M. Blechschmidt et al.
Title Page
Abstract Introduction
Conclusions References
Tables Figures
J I
J I
Back Close
Full Screen / Esc
Printer-friendly Version
Interactive Discussion
Discussion
Paper
|D
iscussionP
aper|
Discussion
Paper
|D
iscussionP
aper|
Prospero, J. M., Arnalds, O., Olafsson, H., Bullard, J. E., and Hodgkins, R.: Iceland dust stormslinked to glacial outwash deposits and to sub-glacial flood (Jokulhlaup) events, AGU FallMeeting 2008, San Francisco, USA, A13E-08, 2008. 7951, 7965
Prospero, J. M., Bullard, J. E., and Hodgkins, R.: High-Latitude Dust Over the North Atlantic:Inputs from Icelandic Proglacial Dust Storms, Science, 335, 1078–1082, 2012. 7951, 7965,5
7966Renfrew, I. A., Moore, G. W. K., Kristjansson, J. E., Olafsson, H., Gray, S. L., Petersen, G. N.,
Bovis, K., Brown, P., Fore, I., Haine, T. W. N., Hay, C., Irvine, E. A., Oghuishi, T., Outten, S.D., Pickart, R., Shapiro, M. A., Sproson, D., Swinbank, R., Wooley, A., and Zhang, S.: TheGreenland Flow Distortion experiment, B. Am. Meteorol. Soc., 88, 1307–1324, 2008. 7951,10
7953Rognvaldsson, O., Jonsdottir, J. F., and Olafsson, H.: Numerical simulations of precipitation in
the complex terrain of Iceland-comparison with glaciological and hydrological data, Meteorol.Z., 16, 71–85, 2007. 7951
Schumann, U., Weinzierl, B., Reitebuch, O., Schlager, H., Minikin, A., Forster, C., Baumann, R.,15
Sailer, T., Graf, K., Mannstein, H., Voigt, C., Rahm, S., Simmet, R., Scheibe, M., Lichtenstern,M., Stock, P., Ruba, H., Schauble, D., Tafferner, A., Rautenhaus, M., Gerz, T., Ziereis, H.,Krautstrunk, M., Mallaun, C., Gayet, J.-F., Lieke, K., Kandler, K., Ebert, M., Weinbruch, S.,Stohl, A., Gasteiger, J., Groß, S., Freudenthaler, V., Wiegner, M., Ansmann, A., Tesche, M.,Olafsson, H., and Sturm, K.: Airborne observations of the Eyjafjalla volcano ash cloud over20
Europe during air space closure in April and May 2010, Atmos. Chem. Phys., 11, 2245–2279,doi:10.5194/acp-11-2245-2011, 2011. 7951
Seinfeld, J. H. and Pandis, S. P.: Atmospheric Chemistry and Physics - From Air Pollution toClimate Change (2nd Edition), John Wiley and Sons, 2006. 7959
Shaw, J. S., Allwine, K. J., Fritz, B. G., Rutz, F. C., Rishel, J. P., and Chapman, E. G.: An25
evaluation of the wind erosion module in DUSTRAN, Atmos. Environ., 42, 1907–1921,doi:10.1016/j.atmosenv.2007.11.022, 2008. 7955
Skamarock, W. C., Klemp, J. B., Dudhia, J., Gill, D. O., Barker, D. M., Duda, M., Huang, X.-Y.,Wang, W., and Powers, J. G.: A Description of the Advaced Research WRF Version 3, NCARTechnical note NCAR/TN-475+STR, 2008. 795430
Stohl, A.:, On the pathways and timescales of intercontinental air pollution transport, J. Geo-phys. Res., 107, 4684, doi:10.1029/2001JD001396, 2002. 7958
7970

ACPD12, 7949–7984, 2012
Observations andsimulations of an
Icelandic dust storm
A.-M. Blechschmidt et al.
Title Page
Abstract Introduction
Conclusions References
Tables Figures
J I
J I
Back Close
Full Screen / Esc
Printer-friendly Version
Interactive Discussion
Discussion
Paper
|D
iscussionP
aper|
Discussion
Paper
|D
iscussionP
aper|
Stohl, A.: Characteristics of atmospheric transport into the Arctic troposphere, J. Geophys.Res., 111, D11306, doi:10.1029/2005JD006888, 2006. 7958
Stohl, A., Eckhardt, S., Forster, C., James, P., Spichtinger, N., and Seibert, P.: A replacementfor simple back trajectory calculations in the interpretation of atmospheric trace substancemeasurements, Atmos. Environ., 36, 4635–4648, 2002. 79635
Stohl, A., Forster, C., Frank, A., Seibert, P., and Wotawa, G.: Technical note: The Lagrangianparticle dispersion model FLEXPART version 6.2, Atmos. Chem. Phys., 5, 2461–2474,doi:10.5194/acp-5-2461-2005, 2005. 7958, 7963
Taylor, J. P., Glew, M. D., Coakley, J. A., Tahnk, W. R., Platnick, S., Hobbs, P. V., and Ferek, R.J.: Effects of Aerosols on the Radiative Properties of Clouds, J. Atmos. Sci., 57, 2656–2670,10
2000. 7953Thorsteinsson, T., Gısladottir, G., Bullard, J., and McTainsh, G.: Dust storm contributions
to airborne particulate matter in Reykjavık, Iceland, Atmos. Environ., 45, 5924–5933,doi:10.1016/j.atmosenv.2011.05.023, 2011. 7951
Warneke, C., Bahreini, R., Brioude, J., Brock, C. A., de Gouw, J. A., Fahey, D. W., Froyd, K. D.,15
Holloway, J. S., Middlebrook, A., Miller, L., Montzka, S., Murphy, D. M., Peischl, J., Ryerson,T. B., Schwarz, J. P., Spackman, J. R., and Veres, P.: Biomass burning in Siberia and Kaza-khstan as an important source for haze over the Alaskan Arctic in April 2008, Geophys. Res.Lett., 36, L02813, doi:10.1029/2008GL036194, 2009. 7958
Zaveri, R. A. and Peters, L. K.: A new lumped structure photochemical mechanism for large-20
scale applications, J. Geophys. Res., 104, 30387–30415, doi:10.1029/1999JD900876, 1999.7954
Zaveri, R. A., Easter, R. C., Fast, J. D., and Peters, L. K.: Model for Simulat-ing Aerosol Interactions and Chemistry (MOSAIC), J. Geophys. Res., 113, D13204,doi:10.1029/2007JD008792, 2008. 795425
Zhao, C., Liu, X., Leung, L. R., Johnson, B., McFarlane, S. A., Gustafson Jr., W. I., Fast, J. D.,and Easter, R.: The spatial distribution of mineral dust and its shortwave radiative forcing overNorth Africa: modeling sensitivities to dust emissions and aerosol size treatments, Atmos.Chem. Phys., 10, 8821–8838, doi:10.5194/acp-10-8821-2010, 2010. 7955
7971
ACPD12, 7949–7984, 2012
Observations andsimulations of an
Icelandic dust storm
A.-M. Blechschmidt et al.
Title Page
Abstract Introduction
Conclusions References
Tables Figures
J I
J I
Back Close
Full Screen / Esc
Printer-friendly Version
Interactive Discussion
Discussion
Paper
|D
iscussionP
aper|
Discussion
Paper
|D
iscussionP
aper|
Fig. 1. Wind speed [m s−1] (colored shadings) and wind direction (black arrows) from theWRF/Chem simulation at the lowest model level for G1 on 22 February, 12:00 UTC (seeSect. 3.1 for a description of the model configuration).
7972

ACPD12, 7949–7984, 2012
Observations andsimulations of an
Icelandic dust storm
A.-M. Blechschmidt et al.
Title Page
Abstract Introduction
Conclusions References
Tables Figures
J I
J I
Back Close
Full Screen / Esc
Printer-friendly Version
Interactive Discussion
Discussion
Paper
|D
iscussionP
aper|
Discussion
Paper
|D
iscussionP
aper|
� �
��� �
�
�
�
��
�
Fig. 2. Aircraft track (dotted line) for flight B269 of the GFDex campaign. The red numberscorrespond to different flight legs: (1) take-off, (2) ascending, (3) at 1900 m, (4) at 700 m, (5)at 400 m, (6) ascending, (7–9) at 7600 m. The location of the wake, barrier jet, Myrdalsjokullglacier and Vatnajokull glacier are indicated by WK, BJ, M and V respectively. The glaciers arealso shown by land contours.
7973

ACPD12, 7949–7984, 2012
Observations andsimulations of an
Icelandic dust storm
A.-M. Blechschmidt et al.
Title Page
Abstract Introduction
Conclusions References
Tables Figures
J I
J I
Back Close
Full Screen / Esc
Printer-friendly Version
Interactive Discussion
Discussion
Paper
|D
iscussionP
aper|
Discussion
Paper
|D
iscussionP
aper|
Fig. 3. Photos taken aboard the aircraft showing (a) dust in the wake and (b) the rough sea-surface in the jet.
7974

ACPD12, 7949–7984, 2012
Observations andsimulations of an
Icelandic dust storm
A.-M. Blechschmidt et al.
Title Page
Abstract Introduction
Conclusions References
Tables Figures
J I
J I
Back Close
Full Screen / Esc
Printer-friendly Version
Interactive Discussion
Discussion
Paper
|D
iscussionP
aper|
Discussion
Paper
|D
iscussionP
aper|
Fig. 4. The WRF/Chem model domains. The grey box shows G1, the blue box G2 and the redbox G3. The dotted line corresponds to the aircraft track.
7975

ACPD12, 7949–7984, 2012
Observations andsimulations of an
Icelandic dust storm
A.-M. Blechschmidt et al.
Title Page
Abstract Introduction
Conclusions References
Tables Figures
J I
J I
Back Close
Full Screen / Esc
Printer-friendly Version
Interactive Discussion
Discussion
Paper
|D
iscussionP
aper|
Discussion
Paper
|D
iscussionP
aper|
Fig. 5. MODIS Terra true-color satellite image from 25 February 2007 at 13:20 UTC (im-age courtesy of the NASA/GSFC Rapid Response system, http://lance.nasa.gov/imagery/rapid-response/).
7976

ACPD12, 7949–7984, 2012
Observations andsimulations of an
Icelandic dust storm
A.-M. Blechschmidt et al.
Title Page
Abstract Introduction
Conclusions References
Tables Figures
J I
J I
Back Close
Full Screen / Esc
Printer-friendly Version
Interactive Discussion
Discussion
Paper
|D
iscussionP
aper|
Discussion
Paper
|D
iscussionP
aper|
Fig. 6. Aircraft measurements of mole fraction of CO [ppb] for (a) 400 m height, (b) 700 m heightand (c) 1900 m height.
7977

ACPD12, 7949–7984, 2012
Observations andsimulations of an
Icelandic dust storm
A.-M. Blechschmidt et al.
Title Page
Abstract Introduction
Conclusions References
Tables Figures
J I
J I
Back Close
Full Screen / Esc
Printer-friendly Version
Interactive Discussion
Discussion
Paper
|D
iscussionP
aper|
Discussion
Paper
|D
iscussionP
aper|
Fig. 7. Simulated wind speed [m s−1] (colored shadings) and wind direction (black arrows) atthe lowest model level for G3 on 22 February, 12:00 UTC. The dotted line corresponds to leg 5(400 m height) of the aircraft track. The thin black contours represent land contours.
7978

ACPD12, 7949–7984, 2012
Observations andsimulations of an
Icelandic dust storm
A.-M. Blechschmidt et al.
Title Page
Abstract Introduction
Conclusions References
Tables Figures
J I
J I
Back Close
Full Screen / Esc
Printer-friendly Version
Interactive Discussion
Discussion
Paper
|D
iscussionP
aper|
Discussion
Paper
|D
iscussionP
aper|
Fig. 8. As in Fig. 7 but for dust mass mixing ratio [µg kg−1] (colored shadings) and sea salt massmixing ratio [µg kg−1] (thick black contours) for particle diameters between 0.04 µm and 10 µm.Locations of the two mass mixing ratio peaks measured at 400 m (see Fig. 11) are indicated byblack triangles. The black stars show locations of two manned weather stations which reporteddust on the flight day.
7979

ACPD12, 7949–7984, 2012
Observations andsimulations of an
Icelandic dust storm
A.-M. Blechschmidt et al.
Title Page
Abstract Introduction
Conclusions References
Tables Figures
J I
J I
Back Close
Full Screen / Esc
Printer-friendly Version
Interactive Discussion
Discussion
Paper
|D
iscussionP
aper|
Discussion
Paper
|D
iscussionP
aper|
Fig. 9. Aircraft measurements (black lines) and G3 simulations from the run MPR (red triangles)at (a) 400 m height, (b) 700 m height and (c) 1900 m height. Wind speed [m s−1] is shown bypanels on the left and wind direction [degrees] by panels on the right.
7980

ACPD12, 7949–7984, 2012
Observations andsimulations of an
Icelandic dust storm
A.-M. Blechschmidt et al.
Title Page
Abstract Introduction
Conclusions References
Tables Figures
J I
J I
Back Close
Full Screen / Esc
Printer-friendly Version
Interactive Discussion
Discussion
Paper
|D
iscussionP
aper|
Discussion
Paper
|D
iscussionP
aper|
Fig. 10. As in Fig. 9 but for temperature [K] (panels on the left) and specific humidity [kg kg−1](panels on the right).
7981

ACPD12, 7949–7984, 2012
Observations andsimulations of an
Icelandic dust storm
A.-M. Blechschmidt et al.
Title Page
Abstract Introduction
Conclusions References
Tables Figures
J I
J I
Back Close
Full Screen / Esc
Printer-friendly Version
Interactive Discussion
Discussion
Paper
|D
iscussionP
aper|
Discussion
Paper
|D
iscussionP
aper|
Fig. 11. As in Fig. 9 but for particle mass mixing ratio [µg kg−1] (panels on the left) and par-ticle number concentration [cm−3] (panels on the right). The black dots correspond to aircraftmeasurements from PCASP. The red line shows the sum of all simulated aerosol types (i.e.dust, sea salt, black carbon, organic carbon, ammonium, nitrate and sulfate). Grey trianglesshow simulated dust and blue triangles simulated sea salt. Model results are only shown fordiameters between 0.1 µm and 3.0 µm to allow comparison to the PCASP measurements.
7982

ACPD12, 7949–7984, 2012
Observations andsimulations of an
Icelandic dust storm
A.-M. Blechschmidt et al.
Title Page
Abstract Introduction
Conclusions References
Tables Figures
J I
J I
Back Close
Full Screen / Esc
Printer-friendly Version
Interactive Discussion
Discussion
Paper
|D
iscussionP
aper|
Discussion
Paper
|D
iscussionP
aper|
Fig. 12. As in Fig. 11 but for model results from the run OPR.
7983

ACPD12, 7949–7984, 2012
Observations andsimulations of an
Icelandic dust storm
A.-M. Blechschmidt et al.
Title Page
Abstract Introduction
Conclusions References
Tables Figures
J I
J I
Back Close
Full Screen / Esc
Printer-friendly Version
Interactive Discussion
Discussion
Paper
|D
iscussionP
aper|
Discussion
Paper
|D
iscussionP
aper|
55°W 45°W 35°W 25°W 15°W 5°W 5°E 15°E 25°E 35°E
45°N
55°N
65°N
75°N
35°N
1
2
3 4
5
1e-06
5.1e-06
2.6e-05
0.00013
0.00067
0.0034
0.017
0.089
0.45
2.3
sensit iv ity(ns kg-1)
1950
2100
2250
2400
2550
2700
2850
3000
alt itude(m )
(a)
55°W 45°W 35°W 25°W 15°W 5°W 5°E 15°E 25°E 35°E
45°N
55°N
65°N
75°N
35°N
1
2345
6
1e-06
5.1e-06
2.6e-05
0.00013
0.00067
0.0034
0.017
0.089
0.45
2.3
sensit iv ity(ns kg-1)
1950
2100
2250
2400
2550
2700
2850
3000
alt itude(m )
(b)
Fig. 13. Flexpart aerosol tracer footprint PES [ns kg−1] (colored shadings) for (a) flight leg 5(400 m height) and (b) flight leg 3 (1900 m height). Black circles represent plume centroid lo-cations for a specific day back in time (see yellow numbers inside green boxes to the right ofthe circles for the corresponding day back in time). The circles are filled with a grey shadingthat represents the mean plume altitude [m]. The blue crosses near Iceland mark the aircraftmeasurement location.
7984
Copyright © 2022 FDOKUMEN


![Íslenskur orðaforði íslenskra grunnskólanema sem eiga annað móðurmál en íslensku [Icelandic vocabulary among Icelandic second language learners]](https://static.fdokumen.com/doc/165x107/6344d24938eecfb33a064409/islenskur-ordafordi-islenskra-grunnskolanema-sem-eiga-annad-modurmal-en.jpg)